Annual Benefits Report FY 09
150
To care for him who shall have borne the battle and for his widow, and his orphan - Abraham Lincoln Department of Veterans Affairs Veterans Benefits Administration AnnuAl Benefits RepoRt Fiscal Year 2009 Making a difference
-
Upload
khangminh22 -
Category
Documents
-
view
5 -
download
0
Transcript of Annual Benefits Report FY 09

To care for himwho shall have borne
the battle and for his widow, and
his orphan
- Abraham Lincoln
Department of Veterans AffairsVeterans Benefits Administration
AnnuAlBenefitsRepoRt
Fiscal Year
2009
Making a difference

our mission is to provide benefits and services to Veterans and their families in a responsive,
timely, and compassionate manner in recognition of their
service to the nation.
purpose of this ReportThe purpose of the Annual Benefits Report (ABR)
is to clearly summarize the benefit programs delivered by VBA.
This report is intended to accomplish the following:
a. Present a clear, complete, data-driven picture of the extent to which Veterans and their dependents use these benefits;
b. Provide insights into the nature of the benefits programs;
c. Portray the economic impact of VBA programs on Veterans, their families, the Federal government, and the Nation.
Annual Benefits Report FY 2009
Images on the cover:Site - U.S. Army photo by Spc. Richard Del Vecchio U.S. Marine Corps photo by Sgt. Freddy G. Cantu

Veterans Benefits Administration Making a difference i
Table of Contents
ContributorsCompensation and Pension Service
Education Service
Insurance Service
Loan Guaranty Service
Vocational Rehabilitation and Employment Service
Table of Contents1 Mission, Vision, and Core Values
1 Mission, Vision, and Core Values
2 Purpose and Overview2 PurposeofVBA’sAnnualBenefitsReport
3 Compensation and Pension3 CurrentBenefits5 Quick Reference Guide6 Data7 Disability Compensation19 Dependency and Indemnity Compensation21 Disability Pension23 Death Pension25 Fiduciary Program
26 Education26 CurrentBenefits26 Education Programs29 Quick Reference Guide31 Data35 Additional Education Opportunities36 BeneficiaryCharacteristics
37 Insurance37 CurrentBenefits38 Quick Reference Guide40 Data
51 Loan Guaranty 51 Program Objectives51 CurrentBenefits52 Specially Adapted Housing Program (SAH) 53 Quick Reference Guide54 Data

Annual Benefits Report FY 2009ii
Table of Contents
61 Vocational Rehabilitation and Employment62 Vocational Rehabilitation and Employment Program
Enhancements63 Quick Reference Guide64 Data
69 Appendices A1 VBARegionalOfficeMailingAddressesB1 Contact VA by PhoneC1 GlossaryD1 Internet ReferencesE1 SummaryofFiscalYear2009Benefits
IndexF1 Index to Tables and Charts

Veterans Benefits Administration Making a difference 1
Mission, Vision, and Core Values
VETERANS BENEFITS ADMINISTRATION
Mission, Vision, and Core ValuesWe are the Veterans Benefits Administration, one of the three Administrations forming the U.S. Department of Veterans Affairs (VA). We offer a wide range of benefits to our Nation’s Veterans, servicemembers, and their families.
Mission, Vision, and Core Values
Mission Statement
The mission of the Veterans Benefits Administration (VBA), in partnership with the Veterans Health Administration and the National Cemetery Administration, is to provide benefits and services to Veterans and their families in a responsive, timely, and compassionate manner in recognition of their service to the Nation.
Vision Statement
Our vision is that the Veterans whom we serve will feel that our Nation has kept its commitment to them; employees will feel that they are both recognized for their contribution and are part of something larger than themselves; and taxpayers will feel that we’ve met the responsibilities they’ve entrusted to us. Courage, honesty, trust,
respect, open communication, and accountability will be reflected in our day-to-day behavior.
Core Values
� Veterans have earned our respect and are our reason for being, our common purpose. All our efforts are directed toward meeting their needs.
� We are committed to communicating with our Veterans and employees in a timely, thorough, accurate, understandable, and respectful manner.
� We listen to the concerns and views of Veterans and our employees to bring about improvement in benefitsandservices,andthe climate in which they are provided.
� We value understandable business processes that consistently produce positive results.
� We foster an environment that promotes personal and corporate initiative, risk‑taking, and teamwork.
� We are open to change and flexibleinourattitudes.
� Respect, integrity, trust, and fairness are hallmarks of all our interactions.
� We value a culture where everyone is involved, accountable, respected, and appreciated.
� We will perform at the highest level of competence, always, and take pride in accomplishment.
� We are a “can do” organization.

Annual Benefits Report FY 20092
Purpose and Overview
Purpose and OverviewPurpose of VBA’s Annual Benefits Report
The Annual Benefits Report (ABR) clearly summarizes the benefit programs delivered by VBA, identifies the current level of program participation by eligible persons, and profiles the beneficiaries.
The report is intended to accomplish the following: � Present a clear, complete, data-driven picture of the extent to which Veterans and their dependents use these benefits;
� Provide insights into the nature of the benefit programs; � Portray the expenditures associated with VBA programs.
A complete discussion of VBA’s performance in administering these programs is contained in the Department’s Fiscal Year 2009 Performance and Accountability Report, dated November 2009. The document can be accessed through this electronic link: http://www.va.gov/budget/report/. Program goals and objectives are detailed in VA’s annual performance plans. The VA Strategic Plan 2006-2011 can be found on the Department’s website: www.va.gov/op3.
Veterans Benefits Overview
The Veterans Benefits Administration is one of three administrations comprising the Department of Veterans Affairs. VBA is responsible for administering and delivering an array of federally authorized benefits and services to eligible Veterans and their dependents and survivors.
With annual expenditures over $47 billion, VBA programs have a sweeping impact not only on the Veteran community, but also on the whole of American society. These are programs that touch millions of lives in fundamental ways. Benefits and services administered by VBA fall under five business lines:
COMPENSATION AND PENSIONEDUCATIONINSURANCELOAN GUARANTYVOCATIONAL REHABILITATION AND EMPLOYMENT
Veterans’ benefits represent an integral part of American history. Knowledge of benefits history is important for all those who are interested in a comprehensive understanding of what VBA does and why.
A more general discussion of VA and Veterans’ benefits from a historical perspective can be found in VA Pamphlet 80-97-2, VA History in Brief, September 1997. This pamphlet is on the VA Home Page: http://www1.va.gov/opa/ feature/history/index.asp.
For the latest copy of the pamphlet entitled Benefits for Veterans and Dependents, go to: http://www1.va.gov/opa/vadocs/current_benefits.asp.

Veterans Benefits Administration Making a difference 3
Compensation and Pension
Compensation and PensionCurrent Benefits
Compensation Based Upon Service-Connected Disability or Death
The compensation program provides monthly benefits to Veterans in recognition of the effects of disabilities, diseases, or injuries incurred or aggravated during active military service. The program also provides monthly payments to surviving spouses, dependent children, and dependent parents in recognition of the economic loss caused by a Veteran’s death during military service or, subsequent to discharge from military service, as a result of a service-connected disability.
To be eligible for disability compensation, the Veteran must have served under conditions other than dishonorable, and the disability must not be the result of misconduct by the Veteran. Disability compensation varies according to the degree of disability and the number of dependents, and is paid monthly. The rate of compensation is graduated according to the combined degree of the Veteran’s disabilities, from 10 percent to 100 percent disabling, in increments of 10 percent. Disabilities that are due to service but not disabling are given a 0 percent rating, and are not compensable unless a veteran is suffering from two or more separate permanent service-connected disabilities rated at 0 percent that interfere with normal employability. In those cases, compensation at the 10 percent can be awarded, but not in combination with any other rating. Additional benefits are payable to Veterans with severe disabilities such as anatomical loss or loss of use of a hand or foot, blindness, or deafness. VA benefits are not subject to federal or state income tax.
Dependency and Indemnity Compensation (DIC) is payable to the survivors of servicemembers who died while on active duty, or Veterans who died from service-connected disabilities. VA may also pay DIC to survivors of Veterans continuously rated totally disabled due to service-connected disabilities for ten or more years immediately preceding the Veteran’s death or five years from the date of the Veteran’s discharge from service. DIC may also be paid to the survivors of former Prisoners of War who died after September 30, 1999, and who were continuously rated totally disabled due to a service-connected disability for a period of no less than one year immediately preceding death. A higher rate of DIC is payable if the Veteran was rated totally disabled for eight years immediately preceding death and the Veteran and surviving spouse were married for that same eight-year period. Surviving spouses and dependent children are potentially eligible for DIC benefits. Parents of Veterans or
A Note on the Data:
The2009AnnualBenefitsReport combines data fromtheVeteransBenefitsAdministration’s legacy BenefitsDeliveryNetwork(BDN)andthecorporatedatabase(VETSNET).Asofthe end of Fiscal Year 2009, nearly 170,000 Veterans were paidcompensationbenefitsviaBDN,whilenearly2.9million were paid through VETSNET.Themostnoticeableeffect of reporting data from VETSNETisinthenumberofdisabilities for which Veterans are service‑connected. The BDNstoredthesixdisabilitieswith the highest evaluations, whereas the corporate database stores all disabilities for each Veteran. The tables containing information on the most prevalent disabilities by body system are the most affected by this change. Disabilities that are evaluated in higher numbers, but with lower evaluations now appear in some of the top three disabilities by body system lists in the charts on pages 14 through 18.

Annual Benefits Report FY 20094
Compensation and Pension
servicemembers who die as the result of a service-connected disease or injury are also potentially eligible for DIC benefits. Parents’ DIC is a needs-based program for financially dependent parents.
Pension Based Upon Non Service-Connected Disability or Death
Pension programs are designed to provide eligible Veterans and their survivors a level of income that raises their standard of living and sense of dignity. Wartime Veterans who are permanently and totally disabled, or who are age 65 or above and who meet minimum service requirements, may be eligible for a disability pension. Entitlement to disability pension is subject to income and net worth limitations. Additional amounts may be paid to a Veteran who has dependents or who is so disabled as to require the aid and attendance of another person, or is housebound. Benefits are also paid under two protected or “grandfathered” prior pension programs. The rates of protected pension are fixed at the amounts in effect when the programs were closed to new claims.
Surviving spouses and dependent children of wartime Veterans may be eligible for death pension benefits, subject to income and net worth limitations. As with disability pension, death pension is paid under the current pension program as well as under the two “grandfathered” prior programs.

5Veterans Benefits Administration Making a difference
Compensation and Pension
Quick Reference Guide
Beneficiaries Who Began Receiving Benefits (Compensation, Pension, DIC) During Fiscal Year 2009: 286,265
Compensation – Disability 205,066
Compensation – Death 17,628
Pension – Disability 35,847
Pension – Death 27,724
Veterans Receiving Service-Connected Disability Benefits at the End of Fiscal Year 2009 by Period of Service
World War II 244,659
KoreanConflict 153,743
Vietnam Era 1,051,294
Gulf War Era 998,751
Peacetime 621,205
Most Prevalent Service-Connected Disabilities for Veterans Receiving Compensation at the End of Fiscal Year 2009
Tinnitus 639,029
Hearing loss 570,966
Scars, general 395,032
Post traumatic stress disorder 386,882
Diabetes mellitus 307,619
Traumatic arthritis 272,369
Hypertensive vascular disease 267,375
Impairment of the knee, general 263,257
Lumbosacral or cervical strain 236,485
Limitation of motion of the knee 210,762
Number of Veterans and Survivors Receiving Compensation and Pension Benefits at the End of Fiscal Year 2009 is 3,919,114
3,069,652 Veterans received service‑connected disabilitybenefits
341,114 Survivors received service‑connected deathbenefits
314,245 Veterans received non service‑connected disabilitybenefits
194,103 Survivors received non service‑connected deathbenefits

6 Annual Benefits Report FY 2009
Compensation and Pension
Data
Summary of Beneficiaries Who Began Receiving Compensation and Pension Benefits During Fiscal Year 2009
Benefit Program Number of PeopleEstimated Total
Annual Amounts Estimated Average
Annual Amounts
Compensation – Disability 205,066 $1,594,162,260 $7,774
Compensation – Death1 17,628 $251,838,800 $14,227
Pension – Disability 35,847 $406,530,197 $11,340
Pension – Death2 27,724 $220,147,175 $7,941
Total 286,265 $2,472,678,432 $8,637 1Includes surviving spouses, children (not dependents on surviving spouse awards), and parents.2Includes surviving spouses and children (not dependents on surviving spouse awards).
Summary of Active Compensation and Pension Benefit Accounts at the End of Fiscal Year 2009
Benefit Program Number of PeopleEstimated Total
Annual Amounts Estimated Average
Annual Amounts
Compensation – Disability 3,069,652 $34,102,951,214 $11,110
Compensation – Death1 341,114 $4,954,933,190 $14,526
Pension – Disability 314,245 $3,065,236,745 $9,754
Pension – Death 194,103 $970,377,491 $4,999
Total 3,919,114 $43,093,498,640 $10,9961Dependency and Indemnity Compensation and Death Compensation.

7Veterans Benefits Administration Making a difference
Compensation and Pension
Disability Compensation
Veterans Who Began Receiving Disability Compensation by Combined Degree DuringFiscal Year 2009
Combined Degree
Number of Veterans
Estimated Total Annual Amounts
Estimated Average Annual Amounts
0% 624 $713,064 $1,143
10% 58,949 $87,167,934 $1,479
20% 34,069 $100,933,548 $2,963
30% 27,495 $133,634,448 $4,860
40% 21,311 $150,476,106 $7,061
50% 15,239 $150,538,632 $9,879
60% 14,873 $188,189,292 $12,653
70% 10,729 $172,638,348 $16,091
80% 7,199 $135,818,772 $18,866
90% 3,475 $74,281,596 $21,376
100% 11,103 $399,770,520 $36,006
Total 205, 066 $1,594,162,260 $7,774
Combined Degree of Service-Connected Disabilities for Veterans Who Began Receiving Compensation by Fiscal Year
Combined Degree 2005 2006 2007 2008 2009
0% 504 505 521 551 624
10% 46,264 47,667 52,949 53,374 58,949
20% 31,347 30,989 33,702 33,024 34,069
30% 22,898 23,264 25,851 26,368 27,495
40% 17,311 18,234 20,748 20,539 21,311
50% 11,880 11,745 14,004 14,513 15,239
60% 9,736 10,229 13,009 13,849 14,873
70% 6,863 6,879 9,316 10,031 10,729
80% 3,733 3,847 5,580 6,233 7,199
90% 1,671 1,718 2,384 2,927 3,475
100% 8,145 7,728 9,653 9,909 11,103
Total 160,352 162,805 187,717 191,318 205, 066

8 Annual Benefits Report FY 2009
Compensation and Pension
Most Prevalent Service-Connected Disabilities for Veterans Who Began Receiving Compensation During Fiscal Year 2009
Disability Number of Veterans Percent of Total
Tinnitus 77,486 9.5%
Hearing loss 54,450 6.6%
Post traumatic stress disorder 33,129 4.0%
Lumbosacral or Cervical Strain 30,086 3.7%
Tendon inflammation 29,079 3.6%
Limitation of flexion, knee 27,578 3.4%
Degenerative Arthritis of the Spine 25,682 3.1%
Diabetes mellitus 23,508 2.9%
Scars, general 20,089 2.5%
Traumatic arthritis 18,334 2.2%
Total – Most Prevalent Disabilities 339,421 41.5%
Total – All Disabilities 818,954 100.0%
Service-Connected Disability Benefits by Combined Percent of Disability for Veterans Receiving Compensation at the End of Fiscal Year 2009
Combined Degree
Number of Veterans
Estimated Total Annual Amounts
Estimated Average Annual Amounts
0% 12,857 $12,542,364 $976
10% 785,540 $1,168,066,254 $1,487
20% 445,833 $1,317,403,230 $2,955
30% 362,525 $1,820,773,200 $5,022
40% 302,686 $2,198,221,896 $7,262
50% 196,561 $2,010,469,674 $10,228
60% 231,341 $3,687,150,138 $15,938
70% 211,819 $5,032,881,726 $23,760
80% 155,767 $4,133,833,168 $26,539
90% 86,119 $2,526,097,271 $29,333
100% 278,604 $10,195,512,294 $36,595
Total 3,069,652 $34,102,951,214 $11,110

9Veterans Benefits Administration Making a difference
Compensation and Pension
Service-Connected Disabilities by Body System for Veterans Who Began ReceivingCompensation by Fiscal Year
Body System 2005 2006 2007 2008 2009
Percent Change
2008-2009*
Musculoskeletal System 194,331 206,588 270,949 286,625 302,798 5.3%
Impairment of Auditory Acuity 88,366 92,407 112,421 118,935 135,701 12.4%
Skin 41,161 41,882 78,068 80,737 81,335 0.7%
Neurological Conditions 33,602 34,222 53,142 58,003 65,932 12.0%
Mental Disorders 33,308 32,838 42,936 49,315 53,226 7.3%
Respiratory System 21,903 22,582 33,456 38,165 41,769 8.6%
Digestive System 21,281 20,932 32,621 34,344 34,590 0.7%
Cardiovascular System 26,577 23,762 31,142 30,630 30,150 -1.6%
Genitourinary System 14,670 14,828 22,214 24,539 26,493 7.4%
Endocrine System 26,274 25,457 24,328 24,700 25,962 4.9%
Eye 5,529 5,562 8,152 8,862 9,272 4.4%
Gynecological Conditions 2,670 2,951 3,920 3,917 3,842 -2.0%
Dental and Oral Conditions 1,868 1,823 3,236 3,649 3,786 3.6%
Hemic and Lymphatic Systems 1,814 1,545 2,018 2,136 2,387 10.5%
Infectious Diseases, Immune Disorders, and Nutritional Deficiencies 2,705 2,476 1,756 1,680 1,711 1.8%
Total 516,059 529,855 720,359 766,237 818,954 6.4%*Note: The percent change from 2008 to 2009 is used because of the database changes discussed on page 3.
Annual Benefits Report FY 200910
Compensation and Pension
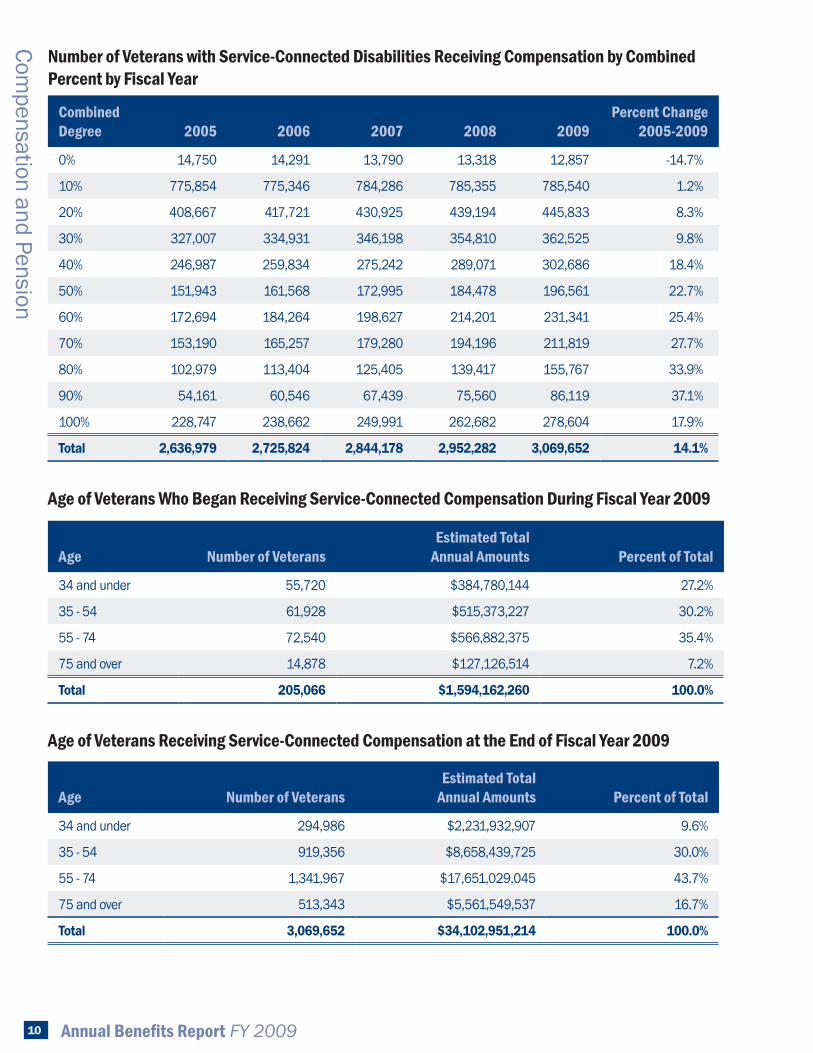
Number of Veterans with Service-Connected Disabilities Receiving Compensation by Combined Percent by Fiscal Year
Combined Degree 2005 2006 2007 2008 2009
Percent Change 2005-2009
0% 14,750 14,291 13,790 13,318 12,857 -14.7%
10% 775,854 775,346 784,286 785,355 785,540 1.2%
20% 408,667 417,721 430,925 439,194 445,833 8.3%
30% 327,007 334,931 346,198 354,810 362,525 9.8%
40% 246,987 259,834 275,242 289,071 302,686 18.4%
50% 151,943 161,568 172,995 184,478 196,561 22.7%
60% 172,694 184,264 198,627 214,201 231,341 25.4%
70% 153,190 165,257 179,280 194,196 211,819 27.7%
80% 102,979 113,404 125,405 139,417 155,767 33.9%
90% 54,161 60,546 67,439 75,560 86,119 37.1%
100% 228,747 238,662 249,991 262,682 278,604 17.9%
Total 2,636,979 2,725,824 2,844,178 2,952,282 3,069,652 14.1%
Age of Veterans Who Began Receiving Service-Connected Compensation During Fiscal Year 2009
Age Number of VeteransEstimated Total
Annual Amounts Percent of Total
34 and under 55,720 $384,780,144 27.2%
35 - 54 61,928 $515,373,227 30.2%
55 - 74 72,540 $566,882,375 35.4%
75 and over 14,878 $127,126,514 7.2%
Total 205,066 $1,594,162,260 100.0%
Age of Veterans Receiving Service-Connected Compensation at the End of Fiscal Year 2009
Age Number of VeteransEstimated Total
Annual Amounts Percent of Total
34 and under 294,986 $2,231,932,907 9.6%
35 - 54 919,356 $8,658,439,725 30.0%
55 - 74 1,341,967 $17,651,029,045 43.7%
75 and over 513,343 $5,561,549,537 16.7%
Total 3,069,652 $34,102,951,214 100.0%

Veterans Benefits Administration Making a difference 11
Compensation and Pension
Individual Service-Connected Disabilities by Evaluation for Veterans Receiving Compensation at the End of Fiscal Year 2009
Evaluation Number of Disabilities
0% 3,795,838
10% 4,455,446
20% 1,073,279
30% 753,208
40% 256,257
50% 264,220
60% 163,801
70% 138,767
80% 12,583
90% 3,779
100% 259,661
Total 11,176,8391
Note: Veterans in receipt of individual unemployability benefits are counted by their combined evaluation, not as 100% disabled. 1Note: Total includes 2 unknowns
Frequency of Individual Service-Connected Disabilities by Body System for Veterans Receiving Compensation at the End of Fiscal Year 2009
Body System
Number of Disabilities
TotalPercent of Total
Musculoskeletal System 4,140,015 37.0%
Impairment of Auditory Acuity 1,350,484 12.1%
Skin 1,216,801 10.9%
Neurological Conditions and Convulsive Disorders 939,363 8.4%
Mental Disorders 718,368 6.4%
Digestive System 614,734 5.5%
Cardiovascular System 604,052 5.4%
Respiratory System 503,572 4.5%
Genitourinary System 379,961 3.4%
Endocrine System 344,402 3.1%
Eye 167,997 1.5%
Gynecological System 65,072 0.6%
Dental and Oral Conditions 50,556 0.5%
Infectious Diseases, Immune Disorders and Nutritional Deficiencies 47,539 0.4%
Hemic and Lymphatic Systems 33,921 0.3%
Total All Conditions 11,176,8391 100.0%1Note: Total includes 2 unknowns
The following tables organize information according to the number of service‑connected disabilities and their separate evaluations. A “zero percent” service‑connected disability rating means a disability exists and is related to the Veteran’s service, but is not so disabling that it entitles the Veteran to compensation payments.

12 Annual Benefits Report FY 2009
Compensation and Pension
Service-Connected Disabilities by Body System for Veterans Receiving Compensation by Fiscal Year
Body System 2005 2006 2007 2008 2009Percent Change
FY 2008-FY 20091
Musculoskeletal System 3,002,239 3,173,080 3,691,871 3,888,519 4,140,015 6.5%
Impairment of Auditory Acuity 822,413 908,676 1,124,454 1,223,590 1,350,484 10.4%
Skin 799,131 818,377 1,091,036 1,163,815 1,216,801 4.6%
Neurological Conditions 521,970 573,812 782,573 851,270 939,363 10.3%
Mental Disorders 520,497 551,056 629,475 661,015 718,368 8.7%
Digestive System 457,934 464,479 572,625 596,229 614,734 3.1%
Cardiovascular System 471,455 490,435 578,278 586,001 604,052 3.1%
Respiratory System 347,190 360,943 440,470 471,128 503,572 6.9%
Genitourinary System 214,036 231,307 306,055 315,051 379,961 20.6%
Endocrine System 247,324 276,094 324,490 350,401 344,402 -1.7%
Eye 121,443 125,770 155,032 161,460 167,997 4.0%
Gynecological Conditions 46,880 49,646 58,774 61,810 65,072 5.3%
Dental and Oral Conditions 32,211 33,327 43,982 47,506 50,556 6.4%
Infectious Diseases, Immune Disorders, and Nutritional Deficiencies 45,076 44,369 50,147 48,462 47,539 -1.9%
Hemic and Lymphatic Systems 25,988 26,980 31,319 32,139 33,921 5.5%
Total 7,675,787 8,128,351 9,880,581 10,458,396 11,176,8392 6.9%1Note: The percent change from 2008 to 2009 is used because of the database changes discussed on page 3.2Note: FY 09 Total includes 2 unknowns
The tables on the following pages identify the total number of service-connected disabilities grouped by body system. The percentages reflect the proportional amount that each rating represents for that body system.
Total conditions on the following pages similarly reflecttheproportionalamountforeachratinggroup of all body systems, e.g. 39.6 percent of the total service‑connected disabilities are rated at 10 percent.

Veterans Benefits Administration Making a difference 13
Compensation and Pension
Total Service-Connected Disabilities for Veterans Receiving Compensation at the End of Fiscal Year 2009 by Percent and Body System
Rating Musculoskeletal System Auditory Skin Neurological Conditions
0% 1,120,038 27.1% 507,603 37.6% 856,795 70.4% 146,318 15.6%10% 2,097,993 50.7% 726,136 53.8% 308,300 25.3% 500,399 53.3%20% 523,425 12.6% 34,123 2.5% 5,741 0.5% 128,092 13.6%30% 168,128 4.1% 26,738 2.0% 34,500 2.8% 80,534 8.6%40% 130,135 3.1% 18,772 1.4% 2,006 0.2% 38,451 4.1%50% 19,911 0.5% 11,844 0.9% 3,473 0.3% 18,671 2.0%60% 49,478 1.2% 6,380 0.5% 5,199 0.4% 10,083 1.1%70% 4,112 0.1% 4,047 0.3% 23 0.0% 3,479 0.4%80% 1,448 0.0% 4,035 0.3% 516 0.0% 3,564 0.4%90% 985 0.0% 1,555 0.1% 4 0.0% 471 0.1%100% 24,355 0.6% 9,249 0.7% 238 0.0% 9,301 1.0%Total 4,140,015 37.0% 1,350,484 12.1% 1,216,801 10.9% 939,363 8.4%
Rating Mental Disorders Cardiovascular Digestive System Respiratory System
0% 21,266 3.0% 135,216 22.4% 367,356 59.8% 244,241 48.5%10% 110,765 15.4% 260,047 43.1% 166,761 27.1% 117,241 23.3%20% 440 0.1% 52,253 8.7% 25,882 4.2% 5,469 1.1%30% 188,663 26.3% 79,608 13.2% 31,512 5.1% 57,360 11.4%40% 285 0.0% 16,125 2.7% 6,793 1.1% 1,098 0.2%50% 142,252 19.8% 1,243 0.2% 1,006 0.2% 49,868 9.9%60% 179 0.0% 38,328 6.3% 6,368 1.0% 14,025 2.8%70% 124,739 17.4% 157 0.0% 170 0.0% 106 0.0%80% 30 0.0% 67 0.0% 266 0.0% 157 0.0%90% 3 0.0% 15 0.0% 1 0.0% 2 0.0%100% 129,746 18.1% 20,992 3.5% 8,619 1.4% 14,004 2.8%Total 718,368 6.4% 604,052 5.4% 614,734 5.5% 503,572 4.5%
Rating Genitourinary System Endocrine System Eye Gynecological System
0% 215,316 56.7% 8,753 2.5% 69,769 41.5% 26,019 40.0%10% 38,194 10.1% 56,680 16.5% 42,703 25.4% 8,461 13.0%20% 27,627 7.3% 253,140 73.5% 9,562 5.7% 142 0.2%30% 25,849 6.8% 2,831 0.8% 29,764 17.7% 16,030 24.6%40% 17,948 4.7% 16,265 4.7% 6,321 3.8% 515 0.8%50% 32 0.0% 43 0.0% 2,231 1.3% 13,375 20.6%60% 25,728 6.8% 3,991 1.2% 1,420 0.8% 138 0.2%70% 7 0.0% 13 0.0% 1,653 1.0% 3 0.0%80% 2,208 0.6% 16 0.0% 174 0.1% 41 0.1%90% 0 0.0% 8 0.0% 733 0.4% 0 0.0%100% 27,052 7.1% 2,662 0.8% 3,667 2.2% 348 0.5%
Total 379,961 3.4% 344,402 3.1% 167,997 1.5% 65,072 0.6%

Annual Benefits Report FY 200914
Compensation and Pension
Total Service-Connected Disabilities for Veterans Receiving Compensation at the End of Fiscal Year 2009 by Percent and Body System (continued)
Rating
Infectious Diseases, Immune Disorders,
Nutritional DeficienciesDental and Oral
ConditionsHemic and Lymphatic
Systems Total All Conditions
0% 36,762 77.3% 27,692 54.8% 12,694 37.4% 3,795,838 34.0%
10% 3,913 8.2% 15,384 30.4% 2,452 7.2% 4,455,446 39.9%
20% 918 1.9% 4,491 8.9% 1,973 5.8% 1,073,279 9.6%
30% 1,555 3.3% 2,056 4.1% 8,079 23.8% 753,208 6.7%
40% 655 1.4% 648 1.3% 240 0.7% 256,257 2.3%
50% 42 0.1% 216 0.4% 13 0.0% 264,220 2.4%
60% 2,109 4.4% 11 0.0% 364 1.1% 163,801 1.5%
70% 8 0.0% 2 0.0% 248 0.7% 138,767 1.2%
80% 54 0.1% 2 0.0% 5 0.0% 12,583 0.1%
90% 1 0.0% 0 0.0% 1 0.0% 3,779 0.0%
100% 1,522 3.2% 54 0.1% 7,852 23.1% 259,661 2.3%
Total 47,539 0.4% 50,556 0.5% 33,921 0.3% 11,176,839 100%
Most Prevalent Service-Connected Disabilities
Body System DisabilityTotal
NumberBody System
Total (%)
Musculoskeletal System
Traumatic arthritis 272,369 6.6%
Impairment of the knee, general 263,257 6.4%
Lumbosacral or Cervical Strain 236,485 5.7%
Endocrine System
Diabetes mellitus 307,619 89.3%
Hypothyroidism 21,830 6.3%
Hyperthyroidism 6,346 1.8%
Impairment of Auditory Acuity
Tinnitus 639,029 47.3%
Hearing loss 604,097 44.8%
Otitis media, chronic (ear infection) 21,067 1.8%
Genitourinary System
Penile deformity (loss of erectile power) 110,393 29.1%
Malignant growths of genitourinary system 57,456 15.1%
Prostate gland injuries 41,906 11.0%
Skin
Scars, general 395,032 32.5%
Scars, superficial (tender) 187,952 15.4%
Eczema 170,140 14.0%

Veterans Benefits Administration Making a difference 15
Compensation and Pension
Most Prevalent Service-Connected Disabilities
Body System DisabilityTotal
NumberBody System
Total (%)
Eye
Vision in 1 eye 20/100, 20/70 or 20/50; 20/40 in other 16,294 9.7%
Conjunctivitis, chronic 13,577 8.1%
Unhealed eye injury 11,680 7.0%
Neurological
Paralysis of the sciatic nerve 192,177 20.5%
Migraine 149,397 15.9%
Paralysis of the median nerve 135,882 14.5%
Gynecological System
Removal of uterus 13,181 20.3%
Removal of uterus and both ovaries 12,317 18.9%
Benign growths of gynecological system or breast 6,701 10.3%
Mental Disorders
Post traumatic stress disorder 386,882 53.9%
Major depressive disorder 76,070 10.6%
Generalized anxiety disorder 53,831 7.5%
Infectious Diseases, Immune Disorders, and Nutritional Deficiencies
Malaria 31,388 66.0%
Chronic fatigue syndrome 4,124 8.7%
HIV-Related Illness 3,331 7.0%
Cardiovascular System
Hypertensive vascular disease 267,375 44.3%
Residuals of cold injury 74,268 12.3%
Arteriosclerotic heart disease (coronary artery disease) 71,721 11.9%
Dental and Oral Conditions
Limited motion of the jaw 28,995 57.4%
Malunion of lower jaw 8,603 17.0%
Jaw condition - general 3,940 7.8%
Digestive System
Hemorrhoids 172,015 28.0%
Hiatal hernia 127,587 20.8%
Inguinal hernia 61,340 10.0%
Hemic and Lymphatic Systems
Anemia 7,402 21.8%
Splenectomy (removal of spleen) 7,123 21.0%
Non-Hodgkin's lymphoma 5,860 17.3%
Respiratory System
Allergic rhinitis 75,118 14.9%
Bronchial asthma 73,689 14.6%
Sleep Apnea Syndromes (Obstructive, Central, Mixed) 57,679 11.5%
(continued)

Annual Benefits Report FY 200916
Compensation and Pension
Most Prevalent Disabilities for Veterans Receiving Compensation at the End of Fiscal Year 2009
Body System DisabilityNumber of
Veterans
All Conditions FY 2009
(Percent of Total)
Impairment of Auditory Acuity Tinnitus 639,029 5.7%
Impairment of Auditory Acuity Hearing loss 570,966 5.1%
Skin Scars, general 395,032 3.5%
Mental Disorders Post traumatic stress disorder 386,882 3.5%
Endocrine System Diabetes mellitus 307,619 2.8%
Musculoskeletal System Traumatic arthritis 272,369 2.4%
Cardiovascular System Hypertensive vascular disease 267,375 2.4%
Musculoskeletal System Impairment of the knee, general 263,257 2.4%
Musculoskeletal System Lumbosacral or Cervical Strain 236,485 2.1%
Musculoskeletal System Limitation of flexion, knee 210,762 1.9%
Veterans Receiving Service-Connected Disability Benefits at the End of Fiscal Year 2009
Period of Service
Number of Veterans
Estimated Total Annual Amounts
Estimated Average Annual Amounts
World War II 244,659 $2,526,454,200 $10,326
Korean Conflict 153,743 $1,638,451,776 $10,657
Vietnam Era 1,051,294 $15,312,522,930 $14,565
Gulf War 998,751 $8,998,141,394 $9,009
Peacetime Era 621,205 $5,627,380,914 $9,059
Total 3,069,652 $34,102,951,214 $11,110

Veterans Benefits Administration Making a difference 17
Compensation and Pension
Most Prevalent Disabilities by Period of Service at the End of Fiscal Year 2009
Period of Service Disability Number of Disabilities Percent of Total
World War II
Hearing loss 55,815 10.0%
Tinnitus 39,705 7.1%
Residuals of cold injury 32,646 5.9%
Scars, general 22,820 4.1%
Post traumatic stress disorder 22,500 4.0%
Generalizedanxietydisorder 18,142 3.3%
Traumatic arthritis 12,868 2.3%
Scars,superficial(tender) 12,554 2.3%
Flatfoot, acquired 9,817 1.8%
Scars, head, face or neck 8,712 1.6%
KoreanConflict
Hearing loss 45,605 12.7%
Tinnitus 37,322 10.4%
Residuals of cold injury 22,617 6.3%
Scars, general 14,290 4.0%
Post traumatic stress disorder 12,360 3.4%
Scars,superficial(tender) 7,646 2.1%
Traumatic arthritis 6,599 1.8%
Scars, head, face or neck 5,593 1.6%
Duodenal ulcer 5,442 1.5%
Impairment of the knee, general 4,734 1.3%
Vietnam Era
Diabetes mellitus 263,891 7.4%
Post traumatic stress disorder 247,486 6.9%
Hearing loss 232,583 6.5%
Tinnitus 214,342 6.0%
Scars, general 146,099 4.1%
Paralysis of the sciatic nerve 125,475 3.5%
Penile deformity (loss of erectile power) 80,262 2.2%
Hypertensive vascular disease 78,959 2.2%
Impairment of the knee, general 61,757 1.7%
Paralysis of the median nerve 60,461 1.7%

18 Annual Benefits Report FY 2009
Compensation and Pension
Most Prevalent Disabilities by Period of Service at the End of Fiscal Year 2009
Period of Service Disability Number of Disabilities Percent of Total
Gulf War
Tinnitus 255,420 5.3%
Lumbosacral or Cervical Strain 172,198 3.6%
Tendoninflammation 155,335 3.2%
Limitationofflexion,knee 152,327 3.2%
Scars, general 147,769 3.1%
Traumatic arthritis 144,456 3.0%
Hearing loss 138,723 2.9%
Limitation of motion of the ankle 131,981 2.7%
Hypertensive vascular disease 129,098 2.7%
Degenerative Arthritis of the Spine 121,763 2.5%
Peacetime Periods
Hearing loss 98,240 5.3%
Tinnitus 92,240 5.0%
Impairment of the knee, general 77,298 4.2%
Scars, general 64,054 3.5%
Traumatic arthritis 55,945 3.0%
Hypertensive vascular disease 52,857 2.8%
Limitation of motion of the ankle 39,433 2.1%
Hemorrhoids 37,678 2.0%
Condition of The Skeletal System 36,635 2.0%
Degenerative arthritis 33,932 1.8%
Service-Connected Disabilities at the End of Fiscal Year 2009 by Period of Service
Period of Service World War II
Korean Conflict
Vietnam Era
Gulf War
Peacetime Periods
TotalNumberofDisabilities 557,128 360,291 3,569,406 4,835,206 1,854,808
AverageNumberofDisabilitiesperVeteran 2.3 2.3 3.4 4.8 3.0
Veterans Receiving Compensation 244,659 153,743 1,051,294 998,751 621,205
Total Veteran Population 2,024,314 2,175,549 7,028,704 5,149,904 5,891,841
Most Prevalent Disabilities by Period of Service at the End of Fiscal Year 2009 (continued)

Veterans Benefits Administration Making a difference 19
Compensation and Pension
Dependency and Indemnity CompensationDependency and Indemnity Compensation (DIC) is payable to survivors of servicemembers who died while on active duty, or of Veterans who died from service‑connected disability.
This section provides information about surviving spouses, children, and parents who received DIC during Fiscal Year 2009.
Beneficiaries Who Began Receiving DIC by Fiscal Year
Type of Benefit 2005 2006 2007 2008 2009
Surviving Spouses 17,480 15,993 17,140 16,968 16,125
Surviving Children 1,396 1,248 1,124 1,238 1,103
Surviving Parents 286 220 226 251 400
Total 19,162 17,461 18,490 18,457 17,628
Beneficiaries Receiving DIC by Relationship at the End of Fiscal Year 2009
Relationship Beneficiaries Number Percent
Surviving Spouse 324,452 95.1%
Child 10,015 2.9%
Parent 6,647 2.0%
Total 341,114 100.0%
Age of Surviving Spouses Who Began Receiving DIC Benefits During Fiscal Year 2009
Age Number of BeneficiariesEstimated Total
Annual Amounts Percent of Total
35 and under 434 $8,665,724 2.7%
36 ‑ 55 2,413 $39,222,259 15.0%
56 ‑ 75 8,860 $129,842,465 54.9%
Over 75 4,418 $66,853,114 27.4%
Total 16,125 $244,583,562 100.0%
Age of Children Who Began Receiving DIC Benefits During Fiscal Year 2009
Children’s Age Number of BeneficiariesEstimated Total
Annual Amounts
Under Age 18 170 $919,354
Age 18 and over in School 666 $2,304,594
Age 18 and over – Helpless 267 $1,787,467
Total 1,103 $5,011,415Note: Includes 173 consolidated awards that account for more than one child.

Annual Benefits Report FY 200920
Compensation and Pension
Beneficiaries Receiving Service-Connected Death Benefits by Period of Service at the End of Fiscal Year 2009
Period of ServiceNumber of
BeneficiariesEstimated Average
Annual AmountsEstimated Total
Annual Amounts
Spanish American War 4 $11,166 $44,664
Mexican Border 1 $13,848 $13,848
World War I 592 $12,834 $7,597,624
World War II 92,116 $14,670 $1,351,340,088
Korean Conflict 36,240 $15,095 $547,059,425
Vietnam Era 157,390 $14,389 $2,264,638,502
Gulf War 20,517 $14,249 $292,348,432
Peacetime Periods 34,254 $14,360 $491,890,607
Total 341,114 $14,526 $4,954,933,190
Surviving Spouses Receiving DIC by Age at the End of Fiscal Year 2009
Age Number of Beneficiaries Estimated Average Annual AmountsEstimated Total
Annual Amounts
35 and Under 4,004 $18,137 $72,619,278
36 - 55 31,621 $15,270 $482,861,502
56 - 75 138,774 $14,661 $2,034,613,236
Over 75 150,053 $15,115 $2,268,001,710
Total 324,452 $14,973 $4,858,095,726
Children Receiving DIC by Age at the End of Fiscal Year 2009
Age Number of Beneficiaries Estimated Average Annual AmountsEstimated Total
Annual Amounts
Under Age 18* 1,255 $5,507 $6,911,210
Age 18 and over – in School 390 $3,608 $1,407,974
Age 18 and over – Helpless 7,626 $7,549 $57,566,082
Total 9,271 $7,107 $65,885,266*Note: Includes 1,945 consolidated awards that account for more than one child.

Veterans Benefits Administration Making a difference 21
Compensation and Pension
Disability PensionDisability pension is payable to certain wartime Veterans who are permanently and totally disabled, or age 65 and older. Disabilities for pension claims are evaluated in the same manner as disabilities for compensation claims (using the VA Schedule for Rating Disabilities in Title 38, U.S. Code of Federal Regulations, Part 4).
The category called “Other Pension Programs” consists of two older pension programs—“Old Law” and“Section306.”WhileVAstillpaysbenefitsunderthese programs, it does not accept new applications forthem.Ifabeneficiaryeverlosesentitlementtothese older pension programs due to changes in circumstances(forexample,achangeinincome),thebeneficiarymustestablishentitlementtopensionunder the rules of the current program.
Veterans Who Began Receiving Disability Pension by Program During Fiscal Year 2009
Type of PensionNumber of
VeteransEstimated Average
Annual AmountsEstimated Total
Annual Amounts
PL 95‑588 NewLawPension 35,844 $11,341 $406,520,288
Other Pension Programs 3 $3,303 $9,909
Total 35,847 $11,340 $406,530,197
Note: The “Other Pension” category groups the two older pension programs, Protected Pension or Old Law and Section 306 Pension, into one category. Additionally, this category references entitlement restored.
Veterans Receiving Disability Pension at the End of Fiscal Year 2009
Type of PensionNumber of
VeteransEstimated Average
Annual AmountsEstimated Total
Annual Amounts
Protected (Old Law) Pension 58 $1,032 $59,828
Section 306 Pension 4,983 $1,639 $8,165,196
PL 95‑588 NewLawPension 309,204 $9,887 $3,057,011,721
Total 314,245 $9,754 $3,065,236,745

Annual Benefits Report FY 200922
Compensation and Pension
Disability Pension by Period of Service at the End of Fiscal Year 2009
Period of Service
Other Pension - Number of Beneficiaries
New Law Pension - Number of Beneficiaries
Total Period of Service
Estimated Total Annual Amounts
Paid
World War II 2,774 81,281 84,055 $849,423,707
Korean Conflict 1,672 57,407 59,079 $436,846,661
Vietnam Era 595 162,310 162,905 $1,685,031,985
Gulf War 0 8,206 8,206 $94,044,392
Total 5,041 309,204 314,245 $3,065,236,745
Note: The “Other Pension” category groups the two older pension programs, Protected Pension or Old Law and Section 306 Pension, into one category.
Veterans Who Began Receiving Disability Pension Benefits During Fiscal Year 2009 by Age
AgeOther
PensionNew Law Pension
Combined Programs
Estimated Total Annual Amounts
PaidPercent of Total
35 and under 0 238 238 $2,729,206 0.6%
36 - 55 0 4,175 4,175 $45,010,043 11.7%
56 - 75 0 12,709 12,709 $116,266,559 35.5%
Over 75 3 18,722 18,725 $242,524,389 52.2%
Total 3 35,844 35,847 $406,530,197 100.0%
Note: The “Other Pension” category groups the two older pension programs, Protected Pension or Old Law and Section 306 Pension, into one category. Additionally, this category references entitlement restored.
Veterans Receiving Disability Pension at the End of Fiscal Year 2009 by Age
Age Number of VeteransEstimated Total
Annual Amounts Paid
Under 45 5,844 $67,320,514
45 - 54 22,335 $247,191,126
55 - 69 140,574 $1,446,547,625
70 - 84 89,761 $704,809,787
85 and over 55,731 $599,367,693
Total 314,245 $3,065,236,745

Veterans Benefits Administration Making a difference 23
Compensation and Pension
Death Pension
The death pension program provides income support to surviving spouses and dependent children of wartimeVeteranswhoareexperiencingfinancialhardship. Laws establish income limits and regulate
the rates of payment. Death pension is paid under the current pension program as well as under the two “grandfathered” prior programs.
Beneficiaries Who Began Receiving Death Pension During Fiscal Year 2009 by Program
Type of PensionNumber of
BeneficiariesEstimated Average
Annual AmountsEstimated Total
Annual Amounts
PL95-588–NewLawPension 27,697 $7,948 $220,126,091
Other Pension Programs 27 $781 $21,084
Total 27,724 $7,941 $220,147,175
Beneficiaries Receiving Death Pension by Program at the End of Fiscal Year 2009
Type of Pension Number of BeneficiariesEstimated Total
Annual Amounts
Protected (Old Law) Pension 182 $132,739
Section 306 Pension 27,500 $29,100,151
PL95-588NewLawPension 166,421 $941,144,601
Total 194,103 $970,377,491Note: The “Other Pension” category groups the two older pension programs, Protected Pension or Old Law and Section 306 Pension, into one category. Additionally, this category references entitlement restored.
Spouses Who Began Receiving Death Pension Benefits During Fiscal Year 2009 by Age
AgeOther
Pension*New Law Pension
Combined Programs
Estimated Total Annual Amounts
Percent of Total
35 and under 0 45 45 $345,552 0.2%
36 ‑ 55 0 1,497 1,497 $10,364,589 5.4%
56 ‑ 75 1 4,078 4,079 $23,146,295 14.8%
Over 75 6 21,852 21,858 $185,804,592 79.5%
Total 7 27,472 27,479 $219,661,028 100.0%Note: The “Other Pension” category groups the two older pension programs, Protected Pension or Old Law and Section 306 Pension, into one category. Additionally, this category references entitlement restored.

Annual Benefits Report FY 200924
Compensation and Pension
Surviving Spouses Receiving Death Pension at the End of Fiscal Year 2009 by Age
Age Other Pension* New Law Pension All Pension ProgramsEstimated Total
Annual Amounts Paid
35 and Under 3 195 198 $1,463,395
36 ‑ 55 59 11,571 11,630 $85,315,147
56 ‑ 75 1,793 41,523 43,316 $222,200,315
Over 75 17,043 108,781 125,824 $647,129,481
Total 18,898 162,070 180,968 $956,108,338Note: The “Other Pension” category groups the two older pension programs, Protected Pension or Old Law and Section 306 Pension, into one category. Additionally, this category references entitlement restored.
Death Pension by Period of Service at the End of Fiscal Year 2009
Period of ServiceOther Pension -
Number of BeneficiariesNew Law Pension -
Number of BeneficiariesTotal Period
of Service
Estimated Total Annual Amounts
Paid
Wars of 1800s* 111 93 204 $798,547
World War I 2,963 3,224 6,187 $17,850,729
World War II 21,569 116,758 138,327 $678,616,376
KoreanConflict 2,569 24,826 27,395 $124,830,075
Vietnam Era 470 20,995 21,465 $144,624,942
Gulf War 0 525 525 $3,656,821
Total 27,682 166,421 194,103 $970,377,491Note: The “Other Pension” category groups the two older pension programs Protected Pension or Old Law and Section 306 Pension into one category.*“Warsofthe1800s”includetheCivilWar,MexicanBorderEra,andSpanish-AmericanWar.

Veterans Benefits Administration Making a difference 25
Compensation and Pension
Fiduciary Program
VA’sFiduciaryprogramisresponsibleforprotectingthebenefitsofincompetentVAbeneficiariesandensuringthattheirwelfareandneedsare met. Program responsibilities include selecting and monitoring a qualifiedfiduciaryfortheneedsandsituationofthebeneficiary.ThissectionprovidesinformationaboutfiduciarieswithVAbeneficiaries.
Number of Beneficiaries by Payee Type
Payee Type Number of Beneficiaries
Veteran 67,158
Surviving Spouse 15,365
Adult Disabled Child 18,805
Minor Child 2,781
Dependent Parent 111
Total 104,220
Source: FBS
Relationship of FiduciaryRelationship NumberLegal Custodian 73,989
Spouse 14,860
Court‑appointed Fiduciary 10,040
Institutional 2,644
Supervised Direct Payment 2,681
Supt. of Indian Reservation 6
Total 104,220Source: Coin DOOR 7009
PublicLaw108-454,TheVeteransBenefitsImprovementActof2004,requiresspecificinformationbeprovidedinthisreport.VAFiduciarypersonnel conducted 669 misuse investigations that totaled 3,703 hoursandresultedin56caseswherethefiduciarywaschangedbytheSecretarybecauseofafindingthatbenefitshadbeenmisused.In compliance with this law, additional information will be provided as soon as it is available via an update to the web based version of this report.

Annual Benefits Report FY 200926
Education
EducationCurrent Benefits
There are seven active education programs: � All-Volunteer Force Educational Assistance Program (Montgomery GI BiII-Active Duty),
� Post-9/11 Veteran’s Educational Assistance Program (Post-9/11 GI Bill),
� Educational Assistance for Members of the Selected Reserve (Montgomery GI BiII-Selected Reserve),
� Survivors’ and Dependents’ Educational As sistance (Dependents’ Educational Assistance - DEA),
� Post-Vietnam Era Veterans’ Educational Assistance Program (VEAP),
� Reserve Educational Assistance Program (REAP), and the � National Call to Service Program (NCS).
Education Programs
All-Volunteer Force Educational Assistance Program (Montgomery GI Bill - Active Duty)
Montgomery GI BiII-Active Duty (MGIB-AD) is a contributory program. The servicemember’s pay is automatically reduced by $100 per month for the first 12 months of active duty unless the servicemember declines to participate at the time of enlistment. Requirements and features of MGIB-AD are as follows:
� First entered active duty on or after June 30, 1985; � Must fulfill one’s basic service obligation unless released for an acceptable reason;
� Must have completed the requirements of a secondary school diploma, or its equivalent, before applying for benefits;
� Must receive a honorable discharge; � Maximum entitlement is 36 months.
VA Education programs provide Veterans, servicemem bers, reservists, and certain family members of Veterans with educational resources to supplement opportunities missed because of military service. These programs are also meant to help the armed forces both recruit and retain members. For members of the Armed Forces, VA educational benefitsassistinthereadjustment to civil ian life. On a broader scale, educational benefitsaremeanttoenhancetheNation’scompetitivenessthrough the development of a more highly educated and more productive workforce.

Veterans Benefits Administration Making a difference 27
EducationPost-9/11 Veterans Educational Assistance Program (Post-9/11 GI Bill)
The Post-9/11 GI Bill is the most comprehensive educationbenefitpackagesincetheoriginalGIBillwas signed into law in 1944. This new education benefitbecameeffectiveonAugust1,2009.Requirements and features of the Post‑9/11 GI Bill are:
� A minimum of 90 days of active duty service after September 10, 2001, or a service‑connected discharge after 30 days of service.
� Honorable discharge from Armed Forces; orRelease from the Armed Forces with service
characterized as honorable and placed on the retired list, temporary disability retired list, or transferred to the Fleet Reserve or the Fleet Marine Corps Reserve; or
Release from armed forces with service characterized as honorable for further service in a reserve component; or
Discharge or release from Armed Forces for amedicalconditionwhichexistedpriortoservice (EPTS), or
Hardship (HDSP), orA condition which interfered with duty
(CIWD); orContinue on active duty.
� Basicbenefitsincludetuitionandfees,monthlyhousing allowance, and a books and supplies stipend.
� Generally receive 36 months of full‑time educationbenefits.
� Generally,15yearstousebenefits. � Eligibletotransfereducationalbenefittodependent if individual meets Department of Defense eligibility criteria.
Educational Assistance for members of the Selected Reserve (Montgomery GI Bill - Selected Reserve)
Montgomery GI Bill‑Selected Reserve (MGIB‑SR) is thefirstGIBilltoprovideeducationalassistance
to members of the Selected Reserve (including NationalGuardmembers).DoDfundsthisprogramand is responsible for determining eligibility. VBA administers the program.Requirements and features of MGIB‑SR include:
� Mustagreetoasix-yearSelectedReserveobligation after June 30, 1985;
� Must have completed the requirements of a second ary school diploma, or its equivalent, beforeapplyingforbenefits;
� Must remain a member in good standing in the Selected Reserve;
� Maximumentitlementis36months.
Survivors’ and Dependents’ Educational Assistance (DEA)
DEA is a VA educational assistance program designed for individuals that have never served in the armed forces. Features and requirements of DEA are as follows:
� Eligibility is based on the Veteran’s service‑connected death, total service‑connected disability, or MIA / POW / Hostage status;
� Maximumentitlementis45months; � Children generally have eight years in which to usebenefits;
� Withsomeexceptions,childrenmustbebetween ages 18 and 26;
� Spouses generally have 10 years in which to usebenefitsand20yearsiftheVeterandiesonactive duty or if Veteran receives a permanent and total rating within 3 years of release from active duty;
� A spouse loses entitlement if they remarry before age 57 but may have entitlement restored if the remarriage terminates by death or divorce;
� Effective December 22, 2006, the program wasexpandedtogranteligibilitytospousesand children of servicemembers who are hospitalized or receiving outpatient care for a permanent and total disability while still on active duty.

28 Annual Benefits Report FY 2009
Education
Post-Vietnam Era Veteran’s Educational Assistance Program (VEAP)
VEAPwasthefirstGIBillprogramthatrequiredacontribution by the servicemember. Requirements and features of VEAP are as follows:
� First entered active duty after December 31, 1976 and before July 1, 1985;
� Contributed to VEAP while on active duty and before April 1, 1987;
� Maximumcontributionof$2,700by the servicemember;
� Maximumentitlementis36months; � Government matches contribution $2 for $1; � Benefitmustbeusedwithin10yearsofthelast discharge from the service;
� Unused contributions may be refunded; � Additional “kickers” or contributions from the Department of Defense (DoD) under certain circumstances; and
� Current full‑time VEAP rate is based on the monthly contributions plus any DoD “kicker” adjustment.
Reserve Educational Assistance Program (REAP)
REAP provides educational assistance to members oftheNationalGuardandReserveswhoserveonactive duty in support of a contingency operation under federal authority on or after September 11, 2001. Requirements and features of REAP are as follows:
� DoD determines eligibility to REAP; � Members who served on active duty beginning on or after September 11, 2001;
� Must have served on active duty in support of a contingency operation under federal authority for a minimum of 90 consecutive days;
� Maximumfull-timeentitlementis36months; � BenefitrateisaportionoftheMGIB-AD3-yearenlist ment rate.
National Call to Service (NCS)
TheNationalCalltoServiceprogramisavailabletocertain individuals who, after October 1, 2003:
� Incur an eight‑year military service obligation (MSO). This MSO will consist of:Initial entry training (to include skill training)followedbyfifteenmonthsofactive duty;
Continuation of duty without a break in service of either an additional period of active duty as determined by the Secretary of Defense, or a period of 24 months in an active status in the Selected Reserve.
After completion of this period of service, and also, without a break in service, the remaining period of obligated service will be served as follows:
� On active duty in the Armed Forces; � In the Selected Reserve; � In the Individual Ready Reserve; � In Americorps, or another domestic national service program jointly designated by the Secretary of Defense and the head of such a program;
� In any combination of the above.
There are four incentives available for individuals enlisting under this program:
� Cash bonus of $5,000; � Repayment of a qualifying student loan not to exceed$18,000;
� Educational allowance equal to the 3‑year monthly Chapter 30 rate for 12 months; or
� Educationalallowanceequaltofiftypercentofthe less than 3‑year monthly Chapter 30 rate for 36 months.

29Veterans Benefits Administration Making a difference
EducationQuick Reference GuideBeneficiaries by Program by Fiscal Year
Program 2005 2006 2007 2008 2009
MGIB-AD 336,347 332,184 343,751 354,284 341,969
Post 9/11 0 0 0 0 34,393
MGIB-SR 87,161 66,105 60,298 62,390 63,469
REAP 0 23,747 41,388 44,014 42,881
DEA 74,267 75,460 77,339 80,191 81,327
VEAP 723 627 568 560 448
Total 498,498 498,123 523,344 541,439 564,487
Source: Education Service SAS Reports.
New Education Beneficiaries by Program During Fiscal Year 2009
Program Number of Beneficiaries Percent of Total
MGIB-AD1 54,066 42.8%
Post 9/11 34,393 27.2%
MGIB-SR2 15,922 12.6%
REAP 10,609 8.4%
DEA 11,289 8.9%VEAP 47 0.0%
Total 126,326 100%1MGIB-AD ncludes Peacetime Veterans and servicemembers.2Based on service in the Selected Reserve.
Source: Education Service SAS Reports and Benefits Delivery System Reports.
New Education Beneficiaries by Training Type and Program During Fiscal Year 2009
Education ProgramCollege,
Non-Degree Graduate Under-GraduateVocational/
TechnicalProgram
TotalsPercent of
All Programs
MGIB-AD 1 2,521 2,520 45,129 3,896 54,066 42.8%
POST-9/112 0 0 0 0 34,393 27.2%
MGIB-SR 3 431 406 14,609 476 15,922 12.6%
REAP 287 271 9,734 317 10,609 8.4%
DEA 630 307 9,483 869 11,289 8.9 %
VEAP 5 8 32 2 47 0.0%
Type Training Totals 3,874 3,512 78,987 5,560 126,326 100%
Percent of Program Totals 3.1% 2.8% 62.5% 4.4%
1MGIB-AD Includes Peacetime Veterans and servicemembers.2Training type data for Post-9/11 Beneficiaries is not currently available.3Based on service in the Selected Reserve.
Source: Education Service SAS Reports and Benefits Delivery System Reports.

Annual Benefits Report FY 200930
Education
Training Available Under Education Benefit Programs
Available Training MGIB-AD Post-9/11 MGIB-SR DEA VEAP REAP
College or University Degree X X X X X X
Business, Technical or Vocational Programs X X1 X X X
Independent Study or Distance Learning X X X X X
Correspondence Courses X X X2 X X
Flight Training X X X3 X X
Reimbursement of Licensing & Certification Exams X X X X X X
Accelerated Payments for High Tech Classes X X X
Reimbursement for National Admissions & Credit Exams X X X X X
On the Job Training & Apprenticeship Programs X X X X X
Tuition Assistance Top Up Program X
Entrepreneurship Courses X X X X
Remedial, Deficiency, & Refresher Training (in some cases) X X X X X
H.S. Diploma or GED X X1IHL Only.2Spouses only.3Only at Institutions of Higher Learning for credit towards a college degree.

Veterans Benefits Administration Making a difference 31
EducationData
Beneficiaries Who Began Receiving Education Benefits During Fiscal Year 2009
ProgramNew
BeneficiariesPercent of
Total Total Beneficiaries Total Payments
MGIB-AD1 54,066 42.8% 341,969 $2,564,808,160.00
MGIB-SR2 15,922 12.6% 63,469 $157,921,175.18
Post-9/11 34,393 27.2% 34,393 $63,543,141.00
REAP 10,609 8.4% 42,881 $198,225,330.00
DEA 11,289 8.9% 81,327 $597,938,032.00
VEAP 47 0.0% 448 $566,166.00
Total3 126,326 100.0% 564,487 $3,583,479,874.00 1MGIB-AD Includes Peacetime Veterans and servicemembers.2Based on service in the Selected Reserve.3Cost difference is based on the inclusion of the Education Assistance Test Program dollars (Section 901).Source: Education Service SAS Reports, Benefits Delivery System Reports, and HINES Finance Center Reports.

Annual Benefits Report FY 200932
Education
Beneficiaries Who Began Receiving Education Benefits by Fiscal Year
Program 2005 2006 2007 2008 2009
MGIB‑AD1 68,414 62,184 68,246 82,004 54,066
Post‑9/11 0 0 0 0 34,393
MGIB‑SR2 19,589 11,056 13,424 13,833 15,922
REAP 0 23,746 9,214 10,079 10,609
DEA 11,047 5,569 11,129 12,999 11,289
VEAP 155 93 96 86 47
Total 99,205 102,648 102,109 119,001 126,3261MGIB-ADIncludesNCS,PeacetimeVeteransandservicemembers.2Based on service in the Selected Reserve.Source: Education Service SAS reports.
Beneficiaries Who Received Education Benefits by Fiscal Year
Program 2005 2006 2007 2008 2009
MGIB‑AD1 336,347 332,184 343,751 354,284 341,969
Post‑9/11 0 0 0 0 34,393
MGIB‑SR2 87,161 66,105 60,298 62,390 63,469
REAP 0 23,747 41,388 44,014 42,881
DEA 74,267 75,460 77,339 80,191 81,327
VEAP 723 627 568 560 448
Total 498,498 498,123 523,344 541,439 564,487 1MGIB-ADIncludesNCS,PeacetimeVeteransandservicemembers.2Based on service in the Selected Reserve.Source: Education Service SAS reports.

33Veterans Benefits Administration Making a difference
EducationBeneficiaries Who Began Receiving Education Benefits by Type of Training and Program During Fiscal Year 2009
Education Program
College
Vocational/ Technical
Program Totals
Percent of All
ProgramsNon-Degree GraduateUnder
Graduate
MGIB-AD1 2,521 2,520 45,129 3,896 54,066 42.8%
Post-9/112 0 0 0 0 34,393 27.2%
MGIB-SR3 431 406 14,609 476 15,922 12.6%
REAP 287 271 9,734 317 10,609 8.4%
DEA 630 307 9,483 869 11,289 8.9%
VEAP 5 8 32 2 47 0.0%
Type Training Totals 3,874 3,512 78,987 5,560 126,326 100.0%
Percent of Program Totals 3.1% 2.8% 62.5% 4.4%
1MGIB-AD Includes Peactime Veterans and servicemembers.2Training type data for Post-9/11 Beneficiaries is not currently available.3Based on service in the Selected Reserve.Source: Education Service SAS Reports, Benefits Delivery System Reports, and HINES Finance.
Beneficiaries Who Began Receiving Education Benefits By Training Time and Program During Fiscal Year 2009
Education Program
Training TimeProgram
Totals
Percent of All
Programs< One-Half Time Half Time Three Quarter Time Full Time
MGIB-AD1 2,519 7,160 7,728 36,659 54,066 42.8%
Post-9/112 0 0 0 0 34,393 27.2%
MGIB-SR 532 1,463 1,903 12,024 15,922 12.6%
REAP 354 975 1,268 8,012 10,609 8.4%
DEA3 438 1,091 1,273 8,487 11,289 8.9%
VEAP 5 14 5 23 47 0.0%
Training Time Totals 3,848 10,703 12,177 65,205 126,326 100.0%
Percent of Program Totals 3.0% 8.5% 9.6% 51.6%
1MGIB-AD includes peacetime Veterans and servicemembers.2Training time data for Post-9/11 Beneficiaries is not currently available.3DEA less than one-half time includes cooperative and correspondence training.Source: Education Service SAS reports.

34 Annual Benefits Report FY 2009
Education
Beneficiaries Whose Benefits Terminated by Fiscal Year
Program 2005 2006 2007 2008 2009
MGIB‑AD 25,169 25,058 25,100 21,284 24,871
Post‑9/11 0 0 0 0 0
MGIB‑SR 3,073 3,051 2,836 2,533 2,581
REAP 0 0 0 0 0
DEA 811 408 973 992 747
VEAP 94 50 37 45 34
Total 29,147 28,567 28,946 24,854 28,233 Note: Data on REAP not available; (Post‑9/11 is a new educational assistance program).
Beneficiaries Whose Benefits Terminated by Reason During Fiscal Year 2009
ProgramEntitlement
ExhaustedDelimiting
DateTotal
TerminationsPercent of Total
Terminations
MGIB‑AD 19,943 4,928 24,871 88.1%
Post‑9/11 0 0 0 0.0%
MGIB‑SR 2,013 568 2,581 9.1%
REAP 0 0 0 0.0%
DEA 545 202 747 2.6%
VEAP 26 8 34 0.1%
Total 22,527 5,706 28,233 100%
Percent of Total Terminations 79.8% 20.2% 100%
Note: Data on REAP not available; (Post‑9/11 is a new educational assistance program).

35Veterans Benefits Administration Making a difference
EducationAdditional Education Opportunities
U.S. Army began a pilot program in July 2006, allowing qualifying Chapter 30 MGIB‑AD eligible members to transfer up to 18 months of entitlement to their spouses. There were 591 eligible participants and 195 beneficiariesinthisprograminfiscalyear2009,totalingover$1.63millioninpayments.
Fouradditionalwayshavebeencreatedforbeneficiariestoutilizetheirbenefits.BeneficiariesmayuseTuitionAssistanceTop-Up(TATU),repaymentforlicensingandcertificationtests,acceleratedpayments,andtransferabilityofMGIB-ADbenefits.MGIB-SRandREAPbeneficiariesalsoparticipateinthelicensingandcertificationprogram.
The TATU program permits VA to issue a payment to an individual for all or any portion of the difference between the military service’s tuition assistance (TA) amount and the total cost of tuition and related expenses,uptoanindividual’snormalmonthlybenefit.Anindividualmustreceivemilitarytuitionassistancefor the course to be eligible for TATU payments. There was a 15 percent decrease in the number of unique traineesinfiscalyear2009comparedtofiscalyear2008.
Accelerated payments may be made for certain high cost, high tech programs for enrollment on or after October 1, 2002. To qualify, an individual must be enrolled in a high tech program and must certify that he/sheintendstoseekemploymentinahightechindustryasdefinedbyVA.Thebeneficiaryreceivesalump-sumpaymentupto60percentoftuitionandfeesifthemonthlyamountexceedsanamountequalto200percent of the monthly rate otherwise payable. Total payments under this program decreased by 38.3 percent infiscalyear2009comparedtofiscalyear2008,whichincludesthosebeneficiariesreceivingacceleratedpayments under the MGIB‑SR and REAP.
Unique Beneficiaries and Payments by Fiscal Year
2006 2007 2008 2009
Tuition Assistance Top‑Up 13,245 $19,710 15,311 $24,710 14,223 $23,413 12,086 $21,423
License and CertificationTests 2,971 $1,414 3,822 $1,961 3,846 $1,9732 3,329 $1,748
Accelerated Payment1 — $6,116 — $4,878 — $3,531 — $2,524
Total 16,216 $27,240 19,133 $31,549 18,069 $28,917 15,415 $25,695Note: Dollar ($) amounts are in millions1Unabletodeterminenumberofbeneficiariesrecievingacceleratedpayments.2Corrected data.Source: Education Service SAS reports.

36 Annual Benefits Report FY 2009
Education
Beneficiary Characteristics
TheNationalStudentClearinghouse(Clearinghouse)completedananalysisthatgenerateddegreecompletioncharacteristicsof5,000beneficiaries.ThesampleconsistsofbeneficiarieswhousedtheMGIB‑AD, MGIB‑SR, and REAP programs.
ResultsshowedthatofthosebeneficiarieswhowerefoundwithintheClearinghousedatabase,29.3percentcompletedadegreeorcertificate.Further,statisticsshowedthatofthosethatcompletedadegreeorcertificate:
� 58.5 percent completed a bachelors degree � 25.9 percent completed a associate’s degree � 5.6percentcompletedacertificate
InthisassessmentthefivemostprevalentdegreeswereinCriminalJustice,BusinessAdministration,PoliticalScience,Management,andNursing.

“Drafted men reporting for service.” Drafted men reporting for service. Camp Travis,
San Antonio, Texas. 1917-1918. San Antonio Chamber of Commerce.
(War Dept.) WAR & CONFLICT BOOK #: 443
NARA - US National Archives & Records Administration
Veterans Benefits Administration Making a difference 37
Insurance
InsuranceThe various life insurance programs can be grouped into three categories; Matured Life Insurance Programs, Disabled Veterans Life Insurance Programs, and Uniformed Services and Post‑Vietnam Life Insurance Programs.
The life insurance programs provide servicemembers and their families with universally available life insurance (available to all servicemembers and their families without underwriting), as well as traumatic injury protection insurance for servicemembers. They also provide for the conversion to a renewable term insurance policy after a servicemember’s separation from service. In addition, the programs provide life insurance to Veterans who have lost their ability to purchase commercial insurance at standard (healthy) rates due to lost or impaired insurability resulting from military service.
Current Benefits
Matured Life Insurance Programs
These programs were established to provide the same or better life insurancebenefitsthanwereavailabletoprivatecitizenswhentheseprograms were established. The matured life insurance programs are closed to the issuance of new coverage, but continue to have activepolicies.TheseincludetheNationalServiceLifeInsurance(NSLI),UnitedStatesGovernmentLifeInsurance(USGLI),Veterans’Special Life Insurance (VSLI) and Veterans’ Reopened Insurance (VRI) programs.
Disabled Veterans Insurance Programs
These programs were established to provide insurance coverage and services to Veterans who lose their ability to purchase commercial insurance at standard (healthy) rates because of their service‑connected disabilities. These life insurance programs continue to issue coverage. These include the Service‑Disabled Veteran’s Insurance (S‑DVI) and the Veterans’ Mortgage Life Insurance (VMLI) programs.
Uniformed Services and Post-Vietnam Veterans
These programs were established to provide insurance coverage and services to active duty and reserve members of the uniformed services that are commonly provided by large scale civilian employers. These include Servicemembers’ Group Life Insurance (SGLI), Family Servicemembers’ Group Life Insurance (FSGLI), Servicemembers’ Group Life Insurance Traumatic Injury Protection (TSGLI) and Veterans’ Group Life Insurance (VGLI).
America entered World War I in April 1917. The War Risk Insurance Act was amended on June 12, 1917, to cover merchant marine personnel. The Act was again amended on October 6, 1917, authorizing, for the firsttime,issuanceofgovernment life insurance to members of the armed forces.
Over 4 million policies were issued during World War I. With each succeeding war, the government, through VA, continued to provide coverage to military members while on active duty and after separation.

38 Annual Benefits Report FY 2009
Insurance
Quick Reference Guide
Lives Insured
This table displays the number of lives insured and the face amount for both the administered and supervised insurance programs.
Benefits Paid
The table below displays the amount of death awardspaidtobeneficiariesofboththeadministered and supervised insurance programs. It also displays the amount of dividends, loans, matured endowments, cash surrenders, and disability claims paid on administered policies.
Lives Insured by Fiscal Year
Lives Insured 2005 2006 2007 2008 2009
Face Amount ($ in billions) $1,155 $1,114 $1,086 $1,088 $1,106
Veterans (Administered Programs) 1,434,806 1,346,836 1,261,559 1,176,794 1,096,335
Veterans (VMLI) 2,514 2,438 2,368 2,309 2,273
Veterans (VGLI) 417,500 428,019 430,636 431,281 429,271
Servicemembers (SGLI) 2,482,500 2,391,500 2,353,500 2,356,500 2,402,500
Spouses and Children (FSGLI) 3,064,000 3,099,000 3,075,000 3,104,000 3,168,000
Total Lives Insured 7,401,320 7,267,793 7,123,063 7,070,884 7,098,379 Source:FiscalYear2009Stateofresidencyreport;FiscalYear2009PolicyExhibit.
Benefits Paid by Fiscal Year
Benefits 2005 2006 2007 2008 2009
Death Awards $1,928,795,079 $2,229,259,919 $2,484,514,176 $2,231,417,257 $2,322,113,344
Dividends $461,928,451 $421,581,323 $374,770,000 $338,082,018 $310,050,719
Loans Made $54,625,000 $61,029,000 $54,840,000 $49,128,000 $55,764,000
Matured Endowments $14,976,000 $16,612,895 $19,570,000 $23,152,871 $26,674,173
Cash Surrenders $53,002,000 $54,622,116 $54,246,000 $50,822,227 $48,214,456
Disability Claims $18,075,000 $16,483,000 $15,025,000 $13,677,664 $12,154,054
Total $2,531,401,530 $2,799,588,253 $3,002,965,176 $2,706,280,037 $2,774,970,746 Source:FiscalYear2009PolicyExhibit;FiscalYear2009StatementofOperationsandChangesinNetPosition;FiscalYear2009Statementof Cash Flows.

39Veterans Benefits Administration Making a difference
InsuranceDeath Awards
The tables below display the number and amount ofdeathawardspaidtobeneficiariesofboththeadministered and supervised insurance programs.
Death Awards (Number) by Fical Year
2005 2006 2007 2008 2009
Administered 103,083 99,883 97,869* 98,107 94,429
Supervised 6,161 6,383 6,810 5,978 8,634
Total 109,244 106,266 104,679 104,085 103,063 Source: Fiscal Year 2009 Policy Exhibit.VMLIDatabase; Veterans and Reservists Group Insurance System – OSGLI Monthly Report.*Corrected Data.
Death Awards (Amount) by Fiscal Year
2005 2006 2007 2008 2009
Administered $1,071,868,773 $1,069,085,161 $1,085,229,000 $1,102,596,782 $1,082,988,898
Supervised $856,926,306 $1,160,174,758 $1,399,285,176 $1,128,820,475 $1,239,124,445
Total $1,928,795,079 $2,229,259,919 $2,484,514,176 $2,231,417,257 $2,322,113,343 Source:VMLIDatabase;VeteransandReservistsGroupInsuranceSystem–OSGLIMonthlyReportStatementofFinancingandNetPosition
Number of Operations Processed on Administered Policies by Fiscal Year
2005 2006 2007 2008 2009
Loans 24,445 25,493 25,804 26,002 28,109
Cash Surrenders 12,525 12,914 12,276 10,980 10,371
Calls Answered 688,442 679,558 667,890 672,060 647,450
Correspondence Received 154,790 148,675 140,463 94,045 110,564
Change of Address 53,103 55,986 41,924 55,791 46,744
Online Loan Applications 849 1,166 1,199 1,560 1,939*
Total 934,154 923,792 889,556 860,438 843,238 Source: Distribution of Operational Resources Report. *The number of “Online Loan Applications” is included in the total for “Loans”. The number of “Online Loan Applications” has been subtracted from the total to accurately represent the number of operations processed on administered policies.

40 Annual Benefits Report FY 2009
Insurance
Data
Programs That No Longer Issue Coverage
Matured Insurance Programs Years Maximum Coverage
United States Government Life Insurance (USGLI) 1919 - 1940 $10,000
National Service Life Insurance (NSLI) 1940 - 1951 $10,0001
Veterans’ Special Life Insurance (VSLI) 1951 - 1956 $10,0001
Veterans’ Reopened Insurance (VRI) 1965 - 1966 $10,0001
1Since 1972, dividends can be used to increase coverage by purchasing paid-up additions to the basic insurance.Note: VGLI provides continuation of SGLI coverage after separation from service.
Programs That Issue Coverage
Active Life Insurance Programs Year Maximum Coverage
Uniformed Services and Post-Vietnam Veterans’ Life Insurance
Servicemembers’ Group Life Insurance (SGLI) 1965 - present $400,000
Servicemembers’ Group Life Insurance (FSGLI) – Spouse’s Coverage 2001 - present $100,000
Servicemembers’ Group Life Insurance (FSGLI) – Children’s Coverage 2001 - present $10,000
Servicemembers’ Group Life Insurance Traumatic Injury Protection (TSGLI) 2005 - present $100,000
Veterans’ Group Life Insurance (VGLI) 1974 - present $400,000
Disabled Veterans’ Life Insurance
Service-Disabled Veterans’ Insurance (SDVI) 1951 - present $10,0001
Veterans’ Mortgage Life Insurance (VMLI) 1971 - present $90,000 1An additional $20,000 of supplemental coverage is available to totally disabled Veterans.

41Veterans Benefits Administration Making a difference
InsuranceThe following table compares VA life insurance programs with commercial life insurance companies. The comparison is based on the total face value of active life insurance in effect.
2009 Rankings by Total Life Insurance In-Force
Rank Company Total Life Insurance
1 Metropolitan Life $4,035,257,000,000
2 Prudential of America Group $2,699,314,000,000
3 Aegon USA Group $1,618,480,000,000
4 INGUSALifeGroup $1,539,522,000,000
5 Swiss Reinsurance Group $1,507,205,000,000
6 RGA Group $1,483,486,000,000
7 AIG Life Group $1,350,000,000,000
8 VA Life Insurance Programs $1,324,703,000,000
9 Lincoln Financial Group $1,173,400,000,000
10 NorthwesternMutualGroup $1,125,219,000,000
11 NewYorkLifeGroup $1,015,057,000,000
12 Hartford Life Group $987,022,000,000
13 Protective Life Corp $909,965,000,000
14 Genworth Financial Group $835,004,000,000
15 Great‑West Life Group $805,664,000,000 Source: Best’s Review, September 2009.

42 Annual Benefits Report FY 2009
Insurance
Coverage Established During Fiscal Year 2009
The table that follows identifies the number of new policies issued during Fiscal Year 2009, the total face value of the policies, and the average face value of the policies. In the case of SGLI and FSGLI, which is group insurance, the military services maintain the records on each insured servicemember.
New Life Insurance Coverage Issued During Fiscal Year 2009
InsuranceNumber of People
InsuredTotal Coverage
Amount Average Face ValueMaximum Face
Value
VMLI1 274 $22,618,192 $82,548 $90,000
SDVI2,3 14,550 $184,062,250 $12,650 $10,000
VGLI4 17,023 $5,293,020,000 $310,933 $400,000
FSGLI – Child5 214,750 $2,147,500,000 $10,000 $10,000
FSGLI – Spouse6 185,996 $18,356,676,420 $98,694 $100,000
SGLI5 226,400 $84,875,662,102 $374,892 $400,000
Total 658,993 $110,879,538,964 $168,2561Source: VMLI Database – Fiscal Year 2009 Reserve File Data.2Source:SDVI–FiscalYear2009PolicyExhibit.StateofResidence.3Source: Additional Coverage, up to $20,000, is available for totally disabledpolicyholders.NewSupplementalSDVIpolicies(3,126)were issued.4Source: VGLI ‑ Veterans and Reservists Group Insurance System – OSGLI Monthly Report. VGLI data is for the Fiscal Year 2009.
5Source: SGLI / FSGLI Estimates based upon accessions to Active Duty and Reserve forces in Fiscal Year 2009. Data on accessions from Defense Manpower Data Center. Effective September 1, 2006, the maximumcoverageforVGLIandSGLIincreasedto$400,000.6Source: DEERS and Military Pay Records.

43Veterans Benefits Administration Making a difference
InsuranceNew Life Insurance Coverage Issued by Fiscal Year
2005 2006 2007 2008 2009
Number of People Insured 648,720 703,815 706,184 713,625 658,993
Total Coverage Amounts $129,060,812,226 $146,032,139,398 $144,756,899,292 $144,600,111,323 $110,879,538,964
Average Face Values $198,947 $207,487 $204,985 $202,628 $168,256
Source: VMLI Database – VMLI Quarterly Report.Source: SDVI – Fiscal Year 2009 Policy Exhibit.Source: Additional Coverage, up to $20,000, is available for totally disabled policyholders. New supplemental SDVI policies (3,126) were issued.Source: DEERS and Military Pay Records.
Source: Veterans and Reservists Group Insurance System – OSGLI Monthly Report. VGLI data is for Fiscal Year 2009. Estimates based upon accessions to Active Duty and Reserve forces in Fiscal Year 2009. Data on accessions from Defense Manpower Data Center. Effective September 1, 2005, the maximum coverage for VGLI and SGLI increased to $400,000.
Policy Lapses During Fiscal Year 2009
Policy Lapses Number1 Face Value1 Average Face Value
NSLI 5,184 $31,041,432 $5,988
VSLI 480 $3,743,250 $7,798
VRI 158 $833,250 $5,274
SDVI 1,197 $12,733,500 $10,638
Total 7,019 $48,351,432 $6,8891Source: Insurance Fiscal Year 2009 Policy Exhibit.

44 Annual Benefits Report FY 2009
Insurance
Lump-Sum Payments Made to Policy Holders During Fiscal Year 2009
Payments Number1 Amount2 Average Payment
Matured Endowment1, 2
USGLI 108 $585,003 $5,417
NSLI 1,724 $22,546,353 $13,078
VSLI 121 $1,358,390 $11,226
VRI 11 $74,535 $6,776
SDVI 230 $2,109,892 $9,173
Total 2,194 $26,674,173 $12,158
Cash Surrender1, 2
USGLI 49 $120,850 $2,466
NSLI 5,395 $37,058,729 $6,869
VSLI 831 $4,944,761 $5,950
VRI 295 $1,665,514 $5,646
SDVI 698 $4,424,602 $6,339
Total 7,268 $48,214,456 $6,634
Dividends3, 4
USGLI 4,671 $699,870 $150
NSLI 834,026 $235,231,674 $282
VSLI 175,715 $66,308,879 $377
VRI 35,264 $7,810,296 $221
Total 1,049,676 $310,050,719 $295
Loans5, 6, 7
USGLI 59 $8,000 $136
NSLI 13,699 $30,615,000 $2,235
VSLI 3,751 $10,125,000 $2,699
VRI 1,046 $1,524,000 $1,457
SDVI 9,554 $13,492,000 $1,412
Total 28,109 $55,764,000 $1,9841Source Number: Fiscal Year 2009 Policy Exhibit.2Source Amount: Fiscal Year 2009 Statement of Operations and changes in Net Position.3Source Number: Fiscal Year 2009 Policy Exhibit – Cover Sheet.
4Source Amount: Fiscal Year 2009 Statement of Program Cost and Financing.5Source Number: Fiscal Year 2009 Statement of Cash Flows.6Source Number: Program numbers from an estimate based on SQC in Fiscal Year 2009 and percent of total.

Veterans Benefits Administration Making a difference 45
InsuranceLife Insurance Dividend Payments by Fiscal Years
Dividend Payments 2005 2006 2007 2008 2009
Number 1,470,481 1,361,906 1,255,732 1,150,671 1,049,676
Total Amounts $461,928,451 $421,581,323 $374,591,446 $338,082,018 $310,050,719
Average Payments $314 $310 $298 $294 $295 Sources: (same as table on the previous page); Fiscal Year 2005-2009 Annual Benefits Report.
Lump-Sum Payments Made to Beneficiaries During Fiscal Year 2009
Death Claims Number1 Amount2 Average Payment
USGLI 791 $2,463,604 $3,115
NSLI 76,248 $877,942,856 $11,514
VSLI 6,579 $86,023,609 $13,075
VRI 3,726 $35,193,352 $9,445
SDVI 6,953 $71,715,299 $10,314
VMLI 132 $9,650,179 $73,107
SGLI3 2,212 $835,549,261 $377,735
FSGLI3 - Spouse 850 $82,795,000 $97,406
FSGL3 - Child 1,118 $11,187,233 $10,006
TSGLI3 2,455 $106,950,000 $43,564
VGLI3 $1,999 $202,642,951 $101,372 1Source: Fiscal Year 2009 Policy Exhibit. VMLI Database.2Source: Fiscal Year 2009 Statement of Program Costs and Financing.3Source: VGLI/SGLI/FSGLI/TSGLI – SGLI/VGLI/TSGLI Monthly ReportsFiscal Year 2009 includes Regular, Accelerated & Conversion Pool.

46 Annual Benefits Report FY 2009
Insurance
Deathclaimsarepaidtothebeneficiaryuponthedeath of the insured person. In the case of FSGLI, the death claim is paid to the servicemember. All other death claims are paid to the Veteran’s or servicemember’sdesignatedbeneficiary.
The table below provides a distribution of the lump‑sum death claim payments by life insurance program.
Insurance Monthly Installment Award Payments to Policyholders at the End of Fiscal Year 2009
Payment Type Number Monthly Average
Total Disability Income Provision
USGLI 18 $12,636 $702
NSLI 7,355 $8,761,014 $1,191
VSLI 2,018 $2,728,710 $1,352
VRI 411 $311,244 $757
Total 9,802 $11,813,604 $1,205
Matured Endowments
USGLI 0 $0 $0
NSLI 549 $557,820 $1,016
VSLI 434 $561,978 $1,295
VRI 26 $17,892 $688
SDVI 11 $8,652 $787
Total 1,020 $1,146,342 $1,124
Cash Surrenders
USGLI 0 $0 $0
NSLI 49 $69,426 $1,417
VSLI 1 $7,218 $7,218
VRI 2 $528 $264
SDVI 0 $0 $0
Total 52 $77,172 $1,484
Total and Permanent Disability USGLI 22 $6,768 $308
Total 22 $6,768 $308 Source:InsuranceTBCVAL-C(SettlementOptionBenefits).Lifeincome–forNSLI,VSLIare150%oftheLifetimeGuaranteedAmountplusthe Guaranteed Certain Only amount.
Number of Death Claims Paid by Fiscal Year
Death Claims 2005 2006 2007 2008 2009
Number 109,244 106,266 104,679 104,085 103,063
Total Amounts $1,928,795,079 $2,229,259,919 $2,467,975,806 $2,231,417,257 $2,322,113,344
Average Payments $17,656 $20,978 $23,577 $21,438 $22,531 Source: (same as table on previous page).
Monthly Payments to Policyholders at the End of Fiscal Year 2009
Although most Veterans choose to receive payments in a single “lump sum,” a monthly payment option is available for Cash Surrenders and Matured Endowments.Inthetwodisabilitybenefitprovisionsof policies – Total and Permanent Disability Provision
and Total Disability Income Provision – no lump‑sum optionexists;paymentsaremademonthly.Thetable below provides data on monthly payments to Veterans.

47Veterans Benefits Administration Making a difference
InsuranceMonthly Payments to Beneficiaries at the End of Fiscal Year 2009
A monthly payment option is also available in some programs for death claim payments.
The following table provides data on monthly paymentstobeneficiaries.
Insurance Monthly Installment Award Payments to Beneficiaries at the End of Fiscal Year 2009
Death Awards Payment Type Number Monthly Average
USGLI 1,534 $401,100 $261
NSLI 25,781 $15,753,630 $611
VSLI 576 $396,894 $689
VRI 189 $102,684 $543
SDVI 219 $100,464 $459
Total 28,299 $16,754,772 $592Source:InsuranceTBCVAL-C(SettlementOptionBenefits).LifeIncome–forNSLI,VSLIare150%oftheLifetimeGuaranteedAmount and the Guaranteed Certain Only amount.
Total Insurance Policies In-Force at the End of Fiscal Year 2009
Insurance Number of Policies Total Face Value Average Face Value Maximum Face Value
USGLI 4,671 $13,817,726 $2,958 $10,000
NSLI 834,026 $9,789,562,181 $11,738 $10,000
VSLI 175,715 $2,286,696,899 $13,014 $10,000
VRI 35,264 $348,941,316 $9,895 $10,000
SDVI 202,110 $2,053,528,077 $10,160 $10,000*
VMLI 2,273 $166,353,257 $73,187 $90,000
SGLI 2,402,500 $903,945,200,000 $376,252 $400,000
FSGLI ‑ Child 2,064,000 $20,640,000,000 $10,000 $10,000
FSGLI ‑ Spouse 1,104,000 $108,958,100,000 $98,694 $100,000
VGLI 429,271 $57,759,770,000 $134,553 $400,000
Total 7,253,830 $1,105,961,969,456 $152,466 Sources:InsuranceFiscalYear2009PolicyExhibitCoverSheet.*Additional$20,000availablefortotallydisabledpolicyholders.
Life Insurance Policies In Force by Fiscal Year
2005 2006 2007 2008 2009
NumberofPolicies 7,612,195 7,463,956 7,305,140 7,239,344 7,253,830
Total Face Values $1,155,492,749,414 $1,341,158,083,857 $1,311,358,700,050 $1,313,773,303,072 $1,336,911,969,456
Average Face Values $151,795 $179,685 $179,512 $181,477 $184,304 Sources:InsuranceFiscalYear2009PolicyExhibitCoverSheet.

Annual Benefits Report FY 200948
Insurance
Demographic Characteristics of Policyholders by Age
Because certain programs were active only during past wartime periods, their age distributions parallel the aging of all other Veterans of those periods.
The programs in which policies can still be obtained (SDVI, VMLI, SGLI, VGLI) have policyholders across a wide distribution of ages. The following table includes only spouses in the FSGLI data.
Age Distribution for Insurance ProgramsAge Avg
AgePolicy < 20 20-29 30-39 40-49 50-59 60-69 70-79 80-89 89 > TotalUSGLI1 0 0 0 0 0 0 0 2,121 2,483 4,604 90.9
% of Total 0% 0% 0% 0% 0% 0% 0% 46% 54% 100%
NSLI1 0 0 0 0 0 0 121,960 523,508 81,081 726,549 83.5
% of Total 0% 0% 0% 0% 0% 0% 17% 72% 11% 100%
VSLI1 0 0 0 0 0 11 131,553 27,819 294 159,677 77.5
% of Total 0% 0% 0% 0% 0% 0% 83% 17% 0% 100%
VRI1 0 0 0 0 0 2 4,271 22,376 3,955 30,604 84.4
% of Total 0% 0% 0% 0% 0% 0% 13% 74% 13% 100%
SDVI1 1 1,686 4,946 13,942 39,324 84,077 25,475 5,214 236 174,901 60.5
% of Total 0% 1% 3% 8% 22% 47% 16% 3% 0% 100%
VMLI2 0 16 91 373 632 1,027 134 0 0 2,273 57.2
% of Total 0% 1% 4% 16% 28% 45% 6% 0% 0% 100%
SGLI3 160,483 1,226,995 618,201 326,198 68,438 2,049 136 0 0 2,402,500 29.9
% of Total 7% 50% 26% 14% 3% 0% 0% 0% 0% 100%
FSGLI–Spouse3 22,092 440,366 384,858 204,468 47,397 4,819 0 0 0 1,104,000 33.9
% of Total 2% 40% 35% 19% 4% 0% 0% 0% 0% 100%
FSGLI–Children3 1,993,101 70,899 0 0 0 0 0 0 0 2,064,000 8.6
% of Total 97% 3% 0% 0% 0% 0% 0% 0% 0% 100%
VGLI4 83 29,934 80,069 137,782 103,482 67,116 10,495 305 5 429,271 47.5
% of Total 0% 7% 19% 32% 24% 16% 2% 0% 0% 100%
Totals 2,175,760 1,769,896 1,088,165 682,763 259,273 159,102 294,024 581,343 88,053 7,098,379
% by Age Group 31% 25% 15% 10% 4% 2% 4% 8% 1% 100% 1Source: Insurance TBC VAL‑C Fiscal Year 2009 Attained Age Report.2Source: VMLI Reserve Valuation June Data Adjusted for Fiscal Year
2009.3Source: OSGLI June Data – Adjusted for Fiscal Year 2009.
4Source: VGLI Insurance System.Note: All data are as of September 30, 2009.

49Veterans Benefits Administration Making a difference
InsuranceSGLI Coverage by Branch and Component of Service
Branch
Total Number Eligible
for SGLI
Number with
SGLI
Percent with
SGLI
Percent of Total with
SGLI
Total Number Eligible
for FSGLI
Number with
FSGLI
Percent with
FSGLI
Percent of Total
with FSGLI
Active Duty
Army 585,429 581,638 99.4% 25.3% 313,009 279,978 89.4% 25.4%
Navy 354,115 349,242 98.6% 15.2% 214,312 194,276 90.7% 17.6%
Air Force 341,929 337,015 98.6% 14.7% 214,758 200,709 93.5% 18.2%
Marine Corps 216,109 215,275 99.6% 9.4% 120,063 115,553 96.2% 10.5%
Coast Guard 41,821 40,575 97.0% 1.8% 5,374 448 8.3% 0.0%
NOAA 278 244 87.8% 0.0% 29 2 7.5% 0.0%
Public Health Service 6,230 6,011 96.5% 0.3% 618 33 5.4% 0.0%
Total 1,545,911 1,530,000 99.0% 66.6% 868,163 790,999 91.1% 71.6%
Reserve/NationalGuard
Army 566,636 531,735 93.8% 23.2% 322,270 185,200 57.5% 16.8%
Navy 58,377 48,732 83.5% 2.1% 55,948 25,426 45.4% 2.3%
Air Force 161,035 151,484 94.1% 6.6% 139,818 92,701 66.3% 8.4%
Marine Corps 27,932 26,044 93.2% 1.1% 365 11 3.1% 0.0%
Coast Guard 8,713 8,005 91.9% 0.3% 11,458 9,662 84.3% 0.9%
Total 822,693 766,000 93.1% 33.4% 529,858 313,000 59.1% 28.4%
Grand Total 2,368,604 2,296,000 96.9% 100% 1,398,020 1,104,000 79.0% 100.0%Note: All data are as of September 30, 2009.Note: The data at the bottom of the table shows the reserve components for the branches.

50 Annual Benefits Report FY 2009
Insurance
SGLI coverage of up to $400,000 is available in increments of $50,000. Minimum allowable coverage is $50,000. For FSGLI, the maximum coverage for spouses is $100,000, or the amount of the servicemember’s SGLI, whichever is less. The table below shows the number of SGLI policyholders and insured FSGLI spouses.
The total percentage by coverage level for both categories of duty status is shown. For ease of presentation, the maximum coverage level is shown by itself, while all the lesser coverage levels are shown in a combined number.
SGLI by Coverage Level – Active Duty and Reserve Duty
SGLI Coverage
Number with Coverage Percent with Coverage
$50,000-$350,000 $400,000
$50,000-$350,000 $400,000
SGLI Coverage Level
Active 98,620 1,431,380 6.45% 93.55%
Reserve 109,206 656,794 14.26% 85.74%
Total 207,826 2,088,174 9.05% 90.95%Source: Payroll databases of each branch of service – September 2009 SGLI Monthly Premium Reports; DEERS and Payroll databases.
FSGLI by Coverage Level – Active Duty and Reserve Duty
FSGLI Coverage
Number with Coverage Percent with Coverage
$10,000-$90,000 $100,000
$10,000-$90,000 $100,000
FSGLI Coverage Level
Active 12,595 778,405 1.59% 98.41%
Reserve 12,706 300,294 4.06% 95.94%
Total 25,301 1,078,699 2.29% 97.71%Source: Payroll databases of each branch of service – September 2009 SGLI Monthly Premium Reports; DEERS and Payroll databases.
SGLI and FSGLI Coverage
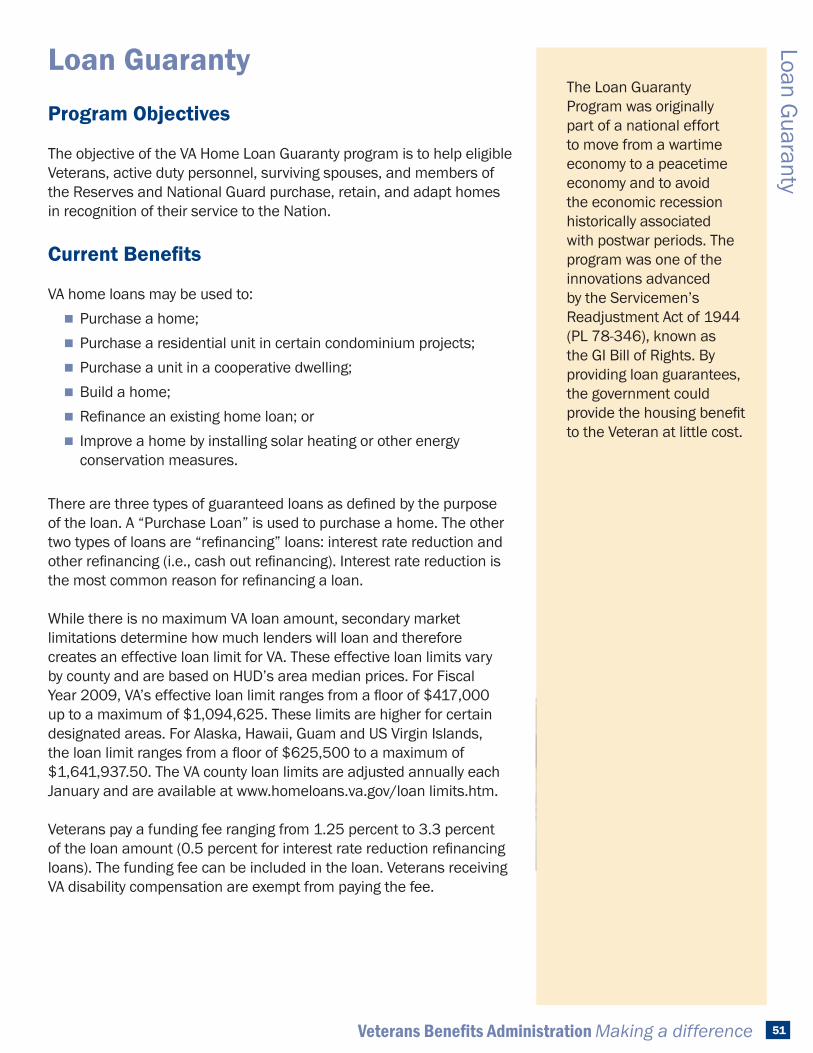
“New Home”U.S. Army 1st Lt. Steven Brewer, center, stands
with his wife Michelle, daughter Lorelei, left, and son Cavan, in front of their new home in
Eastover, N.C., July 8th 2009.U.S. Army photo by Pfc. Victor J. Ayala
www.defenseimagery.mil
Veterans Benefits Administration Making a difference 51
Loan GuarantyLoan Guaranty
Program Objectives
The objective of the VA Home Loan Guaranty program is to help eligible Veterans, active duty personnel, surviving spouses, and members of theReservesandNationalGuardpurchase,retain,andadapthomesinrecognitionoftheirservicetotheNation.
Current Benefits
VA home loans may be used to: � Purchase a home; � Purchase a residential unit in certain condominium projects; � Purchase a unit in a cooperative dwelling; � Build a home; � Refinanceanexistinghomeloan;or � Improve a home by installing solar heating or other energy conservation measures.
Therearethreetypesofguaranteedloansasdefinedbythepurposeof the loan. A “Purchase Loan” is used to purchase a home. The other twotypesofloansare“refinancing”loans:interestratereductionandotherrefinancing(i.e.,cashoutrefinancing).Interestratereductionisthemostcommonreasonforrefinancingaloan.
WhilethereisnomaximumVAloanamount,secondarymarketlimitations determine how much lenders will loan and therefore creates an effective loan limit for VA. These effective loan limits vary by county and are based on HUD’s area median prices. For Fiscal Year2009,VA’seffectiveloanlimitrangesfromafloorof$417,000uptoamaximumof$1,094,625.Theselimitsarehigherforcertaindesignated areas. For Alaska, Hawaii, Guam and US Virgin Islands, theloanlimitrangesfromafloorof$625,500toamaximumof$1,641,937.50. The VA county loan limits are adjusted annually each January and are available at www.homeloans.va.gov/loan limits.htm.
Veterans pay a funding fee ranging from 1.25 percent to 3.3 percent oftheloanamount(0.5percentforinterestratereductionrefinancingloans). The funding fee can be included in the loan. Veterans receiving VAdisabilitycompensationareexemptfrompayingthefee.
The Loan Guaranty Program was originally part of a national effort to move from a wartime economy to a peacetime economy and to avoid the economic recession historically associated with postwar periods. The program was one of the innovations advanced by the Servicemen’s Readjustment Act of 1944 (PL 78‑346), known as the GI Bill of Rights. By providing loan guarantees, the government could providethehousingbenefitto the Veteran at little cost.

Annual Benefits Report FY 200952
Loan Guaranty
Specially Adapted Housing Program (SAH)
The Veterans Housing Opportunity and Benefits Act of 2008 (PL 110‑289), enacted on July 30, 2008:
� Increased the maximum grant amounts; � Authorized cost indexing on an annual basis on October 1 of each year (beginning in calendar year 2009);
� Established eligibilty for housing assistance for individuals with severe burn injuries;
� Authorized assistance for individuals residing outside the United States who may now, at the Secretary’s discretion, use adaptive housing benefits; and
� Extended authorization to provide housing assistance to individuals temporarily residing in a home owned by a family member.
These benefits can be used for, but are not limited to: � Wider doorways and hallways to accommodate wheelchairs; � Ramps or platform lifts instead of steps; and � Wheelchair accessible bathrooms.
Native American Direct Loan (NADL) Program
Loan Guaranty also administers the Native American Veterans Direct Loan Program. This program helps Native American Veterans finance the purchase of homes on Federal Trust territory. Loan Guaranty provides program information and materials to all interested parties and to VA personnel.
VA has entered into memoranda of understanding (MOUs) with 83 participating Native American tribes. During Fiscal Year 2009, VA closed 99 loans under this program. Since its inception, VA has made nearly 725 loans to Native American Veterans under this program.
Severely disabled Veterans and servicemembers, primarily those who are wheelchair bound or who have lost the use of both arms at or above the elbow, may be entitled to obtain housing grants under a Paraplegic Housing (PH) grant.
Adaptive Housing (AH) grants are also available to disabled individuals who have blindness in both eyes, or have anatomical loss or loss of use of both hands. These distinctive programs help eligible individuals with grants to buy, build, or modify homes specifically adapted for their use. In addition to no time limitation or deadline for applying for either grant benefit, multiple grant uses are available as authorized under Title 38, United States Code (U.S.C.) section 2101(a) or section 2101(b). Legislation enacted in 2008 (e.g., Public Law 110-289) further expanded the use of SAH grants.

53Veterans Benefits Administration Making a difference
Loan GuarantyQuick Reference Guide
This quick reference guide highlights information most requested from the Loan Guaranty Service (LGY) Program concerning data from Fiscal Year (FY) 2009 only.
The table below shows overall activity for the past fiveyears.ThevolumeofloansincreasedgreatlyinFiscal Year 2009 largely due to the drop in interest rates. In Fiscal Year 2009, interest rate reduction refinanceloanswere38percentofthetotalloanvolume.
VA Home Loans Guaranteed by Fiscal Year
Fiscal Year 2005 2006 2007 2008 2009
NumberofLoans 165,854 142,708 133,313 179,670 325,690
Total Loan Amount $24,901,280,923 $24,635,468,167 $24,889,988,061 $36,089,811,392 $68,200,786,687
Average Loan Amount $150,140 $172,629 $186,703 $200,867 $209,404
Total Guaranty Amount $6,808,452,010 $6,486,196,646 $6,438,362,016 $9,236,280,575 $17,492,203,150
Average Guaranty Amount $41,051 $45,451 $48,295 $51,407 $53,708
This chart is repeated on page 56.
Fiscal Year 2009 Loan Guaranty Program Highlights
Loans guaranteed 325,690
Interest rate reduction loans 122,251
Total loan amount $68,200,786,687
Average amount per loan $209,404

54 Annual Benefits Report FY 2009
Loan Guaranty
Data
This table below summarizes eligibility criteria for the Loan Guaranty program. All Veterans must have been discharged or released from active duty under other than dishonorable conditions.
If the Veteran served less than the minimum required time period, he or she could be eligible if discharged because of a service‑connected disability.
Summary of Home Loan Guaranty Entitlements and Other Eligibility Criteria
Period of Service or Entitlement Service Dates Length of Service or Other Criteria
World War II 9/16/40 ‑ 7/25/47 90 days
Post‑World War II 7/26/47 ‑ 6/26/50 181 continuous days
KoreanConflict6/27/50 ‑ 1/31/55 90 days
Post-KoreanConflict 2/1/55 ‑ 8/4/64 181 continuous days
Vietnam Era 8/5/64 ‑ 5/7/75 90 days*
SpecificEntitlementforPost-VietnamEra 5/8/75 ‑ 9/7/80 181 continuous days
Enlisted 9/8/80 ‑ 8/1/90 2 years
Officers10/17/81 ‑
8/1/90 2 years
Gulf War 8/2/90 ‑ present 2 years or period called to active duty. (not less than 90 days)
Active Duty Personnel
On active duty, after having served continuously for at least 181 days (90 days for Gulf War Era duty) unless discharged or separated from a previous qualifying period of active duty service.
Reservists 6 years
Unmarried Surviving Spouse N/AMarried to an eligible Veteran who died as a result of service or service‑connected conditions.
Spouse of MIA / POW N/AActive duty member who is missing in action (MIA) or who is a prisoner of war (POW).
Restored Entitlement
Veteranswhopreviouslyusedthehomeloanbenefit,buthadentitlement restored because the loan was paid in full and property disposed of.
*For Veterans who served within Vietnam, the beginning date is 2/28/1961.
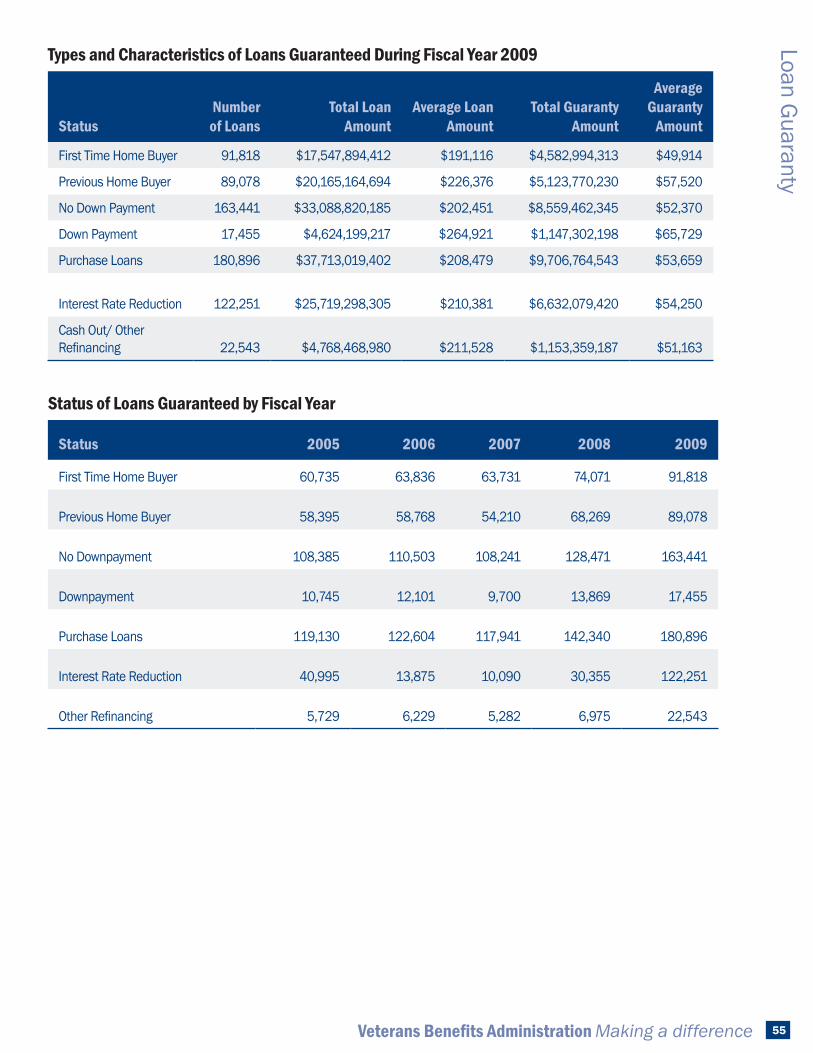
Veterans Benefits Administration Making a difference 55
Loan GuarantyTypes and Characteristics of Loans Guaranteed During Fiscal Year 2009
StatusNumber
of LoansTotal Loan
Amount Average Loan
AmountTotal Guaranty
Amount
Average Guaranty
Amount
First Time Home Buyer 91,818 $17,547,894,412 $191,116 $4,582,994,313 $49,914
Previous Home Buyer 89,078 $20,165,164,694 $226,376 $5,123,770,230 $57,520
No Down Payment 163,441 $33,088,820,185 $202,451 $8,559,462,345 $52,370
Down Payment 17,455 $4,624,199,217 $264,921 $1,147,302,198 $65,729
Purchase Loans 180,896 $37,713,019,402 $208,479 $9,706,764,543 $53,659
Interest Rate Reduction 122,251 $25,719,298,305 $210,381 $6,632,079,420 $54,250
Cash Out/ Other Refinancing 22,543 $4,768,468,980 $211,528 $1,153,359,187 $51,163
Status of Loans Guaranteed by Fiscal Year
Status 2005 2006 2007 2008 2009
First Time Home Buyer 60,735 63,836 63,731 74,071 91,818
Previous Home Buyer 58,395 58,768 54,210 68,269 89,078
No Downpayment 108,385 110,503 108,241 128,471 163,441
Downpayment 10,745 12,101 9,700 13,869 17,455
Purchase Loans 119,130 122,604 117,941 142,340 180,896
Interest Rate Reduction 40,995 13,875 10,090 30,355 122,251
Other Refinancing 5,729 6,229 5,282 6,975 22,543

56 Annual Benefits Report FY 2009
Loan Guaranty
VA Home Loans Guaranteed by Fiscal Year
Fiscal Year 2005 2006 2007 2008 2009
Number of Loans 165,854 142,708 133,313 179,670 325,690
Total Loan Amount $24,901,280,923 $24,635,468,167 $24,889,988,061 $36,089,811,392 $68,200,786,687
Average Loan Amount $150,140 $172,629 $186,703 $200,867 $209,404
Total Guaranty Amount $6,808,452,010 $6,486,196,646 $6,438,362,016 $9,236,280,575 $17,492,203,150
Average Guaranty Amount $41,051 $45,451 $48,295 $51,407 $53,708
This chart is referenced in the Quick Reference Section.
Specially Adapted Housing Grants and Direct Loans During Fiscal Year 2009
ProgramSpecially Adapted
Housing Grants*Special Adaptation
Housing GrantsDirect Loans to
Native Americans Total
Number of Grants / Loans 1,189 81 99 1,369
Amount of Grants / Loans $51,547,099 $749,724 $15,725,000 $68,021,823
Average Amount of Grants / Loans $43,353 $9,256 $158,840 $211,449
*The goal of the Specially Adapted Housing (SAH) Program is to provide a barrier-free, wheelchair accessible living environment which affords the Veteran a level of independent living he or she may not normally enjoy. Includes subsequent use of grants as authorized by PL 109-233.

57Veterans Benefits Administration Making a difference
Loan GuarantyLoans Guaranteed During Fiscal Year 2009 by Period of Service / Entitlement
Data regarding loans guaranteed during Fiscal Year 2009 by Veterans’ period of service and by other entitlement criteria are presented below.
Thetableonthenextpagepresentsthedataonafive-yearbasis.
Loans Guaranteed by Period of Service Entitlement During Fiscal Year 2009
Period of Service
Entitlement Number Percent
Total Loan
Amount
Average Loan
Amount
Total Guaranty
Amount
Average Guaranty
Amount
World War II 380 0.12% $57,964,571 $152,538 $16,002,369 $42,111
Post‑World War II 113 0.04% $17,572,813 $155,512 $4,848,803 $42,910
KoreanConflict 591 0.18% $84,157,512 $142,398 $23,727,695 $40,148
Post‑Korean Conflict 2,360 0.73% $372,019,792 $157,636 $101,610,472 $43,055
Vietnam Era 13,482 4.14% $2,280,554,566 $169,156 $611,371,124 $45,347
Post‑Vietnam Era 22,601 6.94% $4,229,835,923 $187,153 $1,110,865,061 $49,151
Gulf War 105,942 32.53% $21,617,287,376 $204,048 $5,567,486,408 $52,552
Restored Entitlement 92,950 28.54% $20,921,653,997 $225,085 $5,300,725,637 $57,028
Service Personnel 81,834 25.13% $17,548,965,827 $214,446 $4,477,292,779 $54,712
Reservists 4,575 1.41% $930,042,309 $203,288 $240,035,616 $52,467
Un‑Remarried Survivors 854 0.26% $138,914,720 $162,664 $37,766,853 $44,223
Spouses of POWs 8 0.00% $1,817,281 $227,160 $470,333 $58,792
Total 325,690 100.00% $68,200,786,687 $209,404 $17,492,203,150 $53,708

58 Annual Benefits Report FY 2009
Loan Guaranty
Entitlement Loans Guaranteed by Fiscal Year
Entitlement 2005 2006 2007 2008 2009
World War II 547 363 154 192 380
Post‑World War II 62 49 20 39 113
KoreanConflict 496 361 225 291 591
Post-KoreanConflict 1,435 972 781 1,039 2,360
Vietnam Era 9,712 6,960 5,329 6,756 13,482
Post‑Vietnam Era 14,719 10,670 9,538 12,665 22,601
Gulf War 42,373 36,874 40,425 57,985 105,942
Restored Entitlement 44,995 34,081 29,736 44,757 92,950
Service Personnel 47,343 49,730 44,997 53,067 81,834
Reservists 3,708 2,305 1,746 2,422 4,575
Un‑Remarried Survivors 459 339 358 453 854
Spouses of POWS 5 4 4 4 8
Total 165,854 142,708 133,313 179,670 325,690
Home Loans Guaranteed Based on Gender and Age During Fiscal Year 2009
Gender or Age Number Percent
Total Loan
Amount
Average Loan
AmountTotal
Guaranty Amount
Average Guaranty
Amount
Gender Male 288,401 89% $17,492,203,500 $53,693 $60,383,985,613 $209,375
Female 37,289 11% 2,007,187,561 $53,828 $7,816,801,074 $209,628
Age
18 ‑ 25 24,751 7.60% $4,071,179,064 $164,485 $1,087,438,955 $43,935
26 ‑ 35 102,833 31.60% $21,313,897,355 $207,267 $5,461,670,388 $53,112
36 ‑ 45 93,871 28.80% $21,746,291,569 $231,661 $5,501,989,915 $58,612
46 ‑ 55 54,365 16.70% $11,901,554,650 $218,919 $3,035,567,850 $55,837
56 ‑ 65 36,120 11.10% $6,840,456,040 $189,381 $1,783,113,464 $49,366
66 ‑ 75 10,525 3.20% $1,812,415,339 $172,201 $482,304,308 $45,825
76 ‑ 80 2,104 0.60% $337,607,497 $160,460 $91,782,034 $43,623
Over 80 1,121 0.30% $177,385,173 $158,238 $48,336,236 $43,119
Total 325,690 100.00% $68,200,786,687 $209,404 $17,492,203,150 $53,708

59Veterans Benefits Administration Making a difference
Loan GuarantyPurchase Loans Guaranteed Based on Annual Income During Fiscal Year 2009
Income Number Total Loan
AmountAverage
LoanTotal Guaranty
Amount Average Guaranty
Amount
Less than $25,000 1,926 $175,678,820 $91,214 $60,938,548 $31,640
$25,000 to $34,999 8,861 $1,025,082,571 $115,685 $315,463,825 $35,601
$35,000 to $44,999 22,681 $3,122,314,917 $137,662 $877,895,062 $38,706
$45,000 to $54,999 29,703 $4,809,140,256 $161,908 $1,271,168,926 $42,799
$55,000 to $64,999 27,068 $5,013,705,614 $185,226 $1,289,882,307 $47,653
$65,000 to $74,999 21,870 $4,499,934,594 $205,758 $1,143,224,710 $52,274
$75,000 and over 68,789 $19,067,620,510 $277,190 $4,748,191,165 $69,025
Total 180,896 $37,713,019,402 $208,479 $9,706,764,543 $31,640
Average Income Median Income Median Loan
$73,609 $65,052 $186,922
Number of Loans Guaranteed by Age by Fiscal Year
Age 2005 2006 2007 2008 2009
18 - 25 13,248 17,081 16,821 19,025 24,751
26 - 35 55,110 50,142 47,578 61,014 102,833
36 - 45 48,985 39,483 36,145 50,469 93,871
46 - 55 26,018 19,409 17,684 26,308 54,365
56 - 65 16,346 12,462 11,410 17,248 36,120
66 - 75 4,575 3,194 2,931 4,315 10,525
76 - 80* 941 597 476 816 2,104
Over 80 631 340 268 475 1,121
Total 165,854 142,708 133,313 179,670 325,690*Data collection for these age groups began Fiscal Year 2003.

Annual Benefits Report FY 200960
Loan Guaranty
Percent of Loans Guaranteed by Age by Fiscal Year
Age 2005 2006 2007 2008 2009
18 ‑ 25 8.0% 12.0% 12.6% 10.6% 7.6%
26 ‑ 35 33.2% 35.1% 35.7% 34.0% 31.7%
36 ‑ 45 29.5% 27.7% 27.1% 28.1% 28.8%
46 ‑ 55 15.7% 13.6% 13.3% 14.6% 16.7%
56 ‑ 65 9.9% 8.7% 8.6% 9.6% 11.1%
66 ‑ 75 2.8% 2.2% 2.2% 2.4% 3.2%
76 ‑ 80 0.6% 0.4% 0.4% 0.5% 0.6%
Over 80 0.4% 0.2% 0.2% 0.3% 0.3%
Loans Guaranteed During Fiscal Year 2009 by Race
Providing race information on the application for a VA guaranteed loan is voluntary. The race demographics and distribution of new loan guaranties presented below show the distribution among the 88 percent who provided race information for Fiscal Year 2009.
For the previous four Fiscal Years, the percentages are:2005, 95%; 2006, 95%;2007, 92%; and2008, 90%.
Loans Guaranteed by Race During Fiscal Year 2009
Race Number PercentTotal Loan
AmountAverage
Loan Total Guaranty
Amount Average
Guaranty
White 216,743 75.90% $44,891,090,620 $207,117 $11,526,070,727 $53,179
Black/African American 38,699 13.50% $8,369,554,292 $216,273 $2,134,081,494 $55,146
Hispanic 23,310 8.20% $4,756,044,132 $204,034 $1,222,817,929 $52,459
Asian/PacificIslander/NativeHawaiian 5,348 1.90% $1,392,259,641 $260,333 $348,547,192 $65,173
American Indian/ AlaskanNative 1,527 0.50% $313,125,125 $205,059 $80,588,945 $52,776
Loans Guaranteed by Race by Fiscal Year
Race 2005 2006 2007 2008 2009
White 117,515 100,631 89,308 119,996 216,743
Black/African American 25,900 21,750 20,227 25,351 38,699
Hispanic 11,308 10,007 9,816 12,780 23,310
Asian/PacificIslander/NativeHawaiian 2,713 2,416 2,058 2,901 5,348
AmericanIndian/AlaskanNative 1,218 982 719 935 1,527

Veterans Benefits Administration Making a difference 61
Vocational Rehabilitation and Employm
ent (VR&E)
Vocational Rehabilitation and Employment (VR&E)The VR&E Program provides a wide range of vocational and employment services to Veterans, active‑duty servicemembers and eligible dependents. These services are designed to help servicemembers and Veterans choose a career path and assist them in achieving their employment goals. Assistance includes interest and aptitudetesting,occupationalexploration,careercounseling,training,and job placement assistance.
In the VR&E VetSuccess program, Veterans are provided services leading toward employment and independence. VR&E provides each Veteran with a case manager who advises and assists the Veteran throughout the program to ensure his/her success in achieving career and independent living goals. The full range of services is described below:
� Step 1. Applicationforbenefits,andassessmentforprogram eligibility.
� Step 2. Evaluation to assess needs and determine services to which a Veteran may be entitled under a plan of rehabilitation.
� Step 3. Provision of rehabilitation services for either employment (services and assistance that lead to the Veteran becoming job‑ready), or achievement of a measure of increased ability to live more independently in the community.
� Step 4. Rehabilitation. Veterans obtain and maintain suitable employmentorachievemaximumindependenceindailyliving.
Mission
The mission of the Vocational Rehabilitation and Employment (VR&E)VetSuccess program is to provide comprehensive services and assistance necessary to enable Veterans with service‑connected disabilities and employment handicaps to obtain stable and suitable employment. When the severity of disability prohibits suitable employment, VR&E assists those Veterans to achieve maximumindependenceindaily living.

Annual Benefits Report FY 200962
Vocational Rehabilitation and Employm
ent (VR&E)
Vocational Rehabilitation and Employment Program Enhancements
VR&E re‑branded its public face as VetSuccess to improve program visibility and recognition. VetSuccess is the partnership between Veterans,VR&E,employers,andtheAmericanpublicinfulfillingasolemndebtforserviceandsacrifice.VetSuccesshelpsVeteranssucceed in meaningful careers. We help Veterans complete training and college programs, provide guidance in gaining meaningful employment, and live as independently as possible in their homes and communities.
VR&Econtinuedtodevelopandexpandmethodstoassistservicemembers and Veterans in obtaining and maintaining suitableemployment.Expandingoutreachandearlyinterventionforservicemembers and Veterans increased program applicants by 13 percent in Fiscal Year2009.
VR&EexpandedthefunctionalityofourVeteranfacingemploymentwebsite, VetSuccess.gov. VetSuccess.gov is a virtual employment resource center for Veteran job seekers and for employers listing vacancies who wish to hire Veterans. Veterans can now browse multiple job banks for job listings, post resumes, and apply for jobs online. Veterans may also apply for the VR&E program and other VA benefitsthroughthissite.
VR&E began several efforts this year to help improve our ability to support Veterans.
� A business process re‑engineering analysis of the VR&E Quality Assurance program has resulted in streamlined processes and a development of new IT system to support these improvements to be deployed in Fiscal Year 2010.
� The Congressionally mandated Study of Measures to Assist and Encourage Veterans in Completing Vocational Rehabilitation will identify new ways to help Veterans complete VetSuccess programs.
� VR&E Work Measurement Study will measure current work processes and recommend new measurement standards and workload ratiosto ensure an appropriate counselor‑to‑Veteran ratio during the counseling process.
� Revision of the M28 VR&E Procedure Manual will provide an improved and consolidated online reference to VR&E employees.
Definitionsforthefollowingterms may be helpful in reviewing the tables:
� Applicants: Veterans who have applied for Vocational Rehabilitation and Employment services.
� Eligible: Veterans who have been deemed eligible based upon a qualifying service‑connected disability or memo rating.
� Entitled to Services: Veterans determined to have an employment or serious employment handicap based upon their disabling condition.
� Participants: Veterans who are currently participating in a program of services in one of the following case statuses; extendedevaluation,independent living, job ready status, rehabilitation to employment.
� Rehabilitated: Veterans who have successfully found and maintained suitable employment or have successfully completed the independent living program.

Veterans Benefits Administration Making a difference 63
Vocational Rehabilitation and Employm
ent (VR&E)
Quick Reference Guide
Number of Veterans Receiving Vocational Rehabilitation and Employment (VR&E) Benefits at the End of Fiscal Year 2009 is 110,750.
Veterans participating in the VR&E program whom are male 89,136
Veterans participating in the VR&E program whom are female 21,614
Disabled Veterans who were successfully rehabilitated 11,022
Veterans with serious employment handicaps whom were rehabilitated 6,153

Annual Benefits Report FY 200964
Vocational Rehabilitation and Employm
ent (VR&E)
Data
Vocational Rehabilitation and Employment Activities During Fiscal Year 2009
Total
Applicants 77,998
Eligible 74,617
Completed Evaluation 44,089
Entitled to Services 38,802
New Plans of Service 28,997
Participants 110,750
Rehabilitated 11,022Sources: VR&E Program Management Reports – Snapshot of VR&E Participants at the end of Fiscal Year 2009 and COINTAR Reports.
Vocational Rehabilitation and Employment Activities by Age During Fiscal Year 2009
< 17 or Unk. 17 - 21 22 - 29 30 - 39 40 - 44 45 - 49 50 - 54 55 - 59
60 and above Total
Applicants 7 657 16,147 18,166 10,898 10,429 7,724 5,922 8,048 77,998
Participants 1 161 16,958 29,674 16,029 18,420 12,732 7,526 9,249 110,750
Rehabilitated -- 2 922 2,692 1,506 2,020 1,205 1,285 1,390 11,022Source: VR&E Program Management Reports – Snapshot of VR&E Participants at the end of Fiscal Year 2009.
In Fiscal Year 2009, 77,998 Veterans applied for Vocational Rehabilitation and Employment services.Of those who applied:
� 95.7% were found to be eligible and
� 89.7% were found entitled.
Definitions for the following VR&E terms are found in the glossary:
� Applicants (page C1); � Eligible (page C2); � Entitled to Services (page C2);
� Participants (page C4); and � Rehabilitated (page C5).

Veterans Benefits Administration Making a difference 65
Vocational Rehabilitation and Employm
ent (VR&E)
Vocational Rehabilitation and Employment Activities by Prior Education Level at the End of Fiscal Year 2009
Below High
School High SchoolPost High
SchoolFour Year
Degree
Graduate Degree
Training Total
Applicants 1,524 35,496 29,405 9,017 2,342 77,9981
Participants 1,487 52,266 44,224 9,179 3,572 110,7502
Rehabilitated 205 4,971 4,196 1,141 509 11,0221Plus 214 unknowns2Plus 22 unknownsSource: VR&E Program Management Reports – Snapshot of VR&E Participants at the end of Fiscal Year 2009.
Vocational Rehabilitation and Employment Activities by Branch of Service at the End of Fiscal Year 2009
Air Force ArmyCoast Guard
Marine Corps Navy Misc. Unk. Total
Applicants 10,425 41,655 710 10,415 14,324 88 381 77,998
Participants 17,100 57,593 1,149 13,586 21,149 64 109 110,750
Rehabilitated 2,036 5,485 110 1,241 2,144 3 3 11,022Source: VR&E Program Management Reports – Snapshot of VR&E Participants at the end of Fiscal Year 2009.
Vocational Rehabilitation and Employment Activities by Period of Service at the End of Fiscal Year 2009
World War II
Post World War
II EraKorean
Conflict
Post - Korean
ConflictVietnam
Era
Post - Vietnam
Era Gulf War Total
Applicants 200 27 171 503 7,780 11,798 57,510 77,9981
Participants 127 19 139 394 7,984 14,268 87,818 110,7502
Rehabilitated 98 14 77 94 1,591 1,421 7,727 11,0221Plus 214 unknowns2Plus 1 unknownSource: VR&E Program Management Reports – Snapshot of VR&E Participants at the end of Fiscal Year 2009.
Vocational Rehabilitation and Employment Activities by Length of Service Fiscal Year 2009
≤3 months
3 - 6 months
6 months
- 2 years
2 - 4 years
4 - 10 years
10 - 15 years
15 - 20 years
20 - 30 years
> 30 years
In service Totals
Applications 447 1,008 11,245 22,482 21,462 4,648 2,579 10,432 226 3,469 77,998Participants 603 1,492 14,960 29,985 30,812 7,468 4,651 19,003 319 1,457 110,750Rehabilitated 73 126 1,366 2,856 2,700 887 654 2,294 35 31 11,022
Source: VR&E Program Management Reports – Snapshot of VR&E Participants at the end of Fiscal Year 2009.In Service: The VR&E program provides service to active military personnel, such as those on medical hold or those in the pre‑discharge phase.

Annual Benefits Report FY 200966
Vocational Rehabilitation and Employm
ent (VR&E)
Vocational Rehabilitation and Employment Activities by Combined Service‑Connected Disability Rating at the End of Fiscal Year 2009
0% 10% 20% 30% 40% 50% 60% 70% 80% 90% 100%Memo Rating
Cases Not
Rated Total
Applicants 1,499 7,988 9,831 11,549 10,493 7,445 7,987 5,999 4,257 1,921 4,403 2,027 2,599 77,998
Participants 190 4,589 13,542 16,912 17,166 12,502 13,835 10,626 8,200 4,062 7,649 1,476 1 110,750
Source: VR&E Program Management Reports – Snapshot of VR&E Participants at the end of Fiscal Year 2009.
Of those Veterans participating in a plan of services, most follow the employment track and receive services that may include career counseling, employment planning, training or education, medical or dental care, and other supportive services.
Some of the Veterans participating in VR&E have a serious employment handicap, which means there is significant impairment of a Veteran’s ability to prepare for, pursue, or retain employment consistent with the Veteran’s abilities, aptitudes, and interests.
Veterans with Serious Employment Handicaps at the End of Fiscal Year 2009
Case Status Total VeteransTotal Veterans with Serious
Employment Handicaps
Entitled to Services 38,802 26,151
Participants 110,750 64,917
Rehabilitated 11,022 6,153Source: VR&E Program Management Reports – Snapshot of VR&E Participants at the end of Fiscal Year 2009.

Veterans Benefits Administration Making a difference 67
Vocational Rehabilitation and Employm
ent (VR&E)
Employment assistance services may include: job market exploration, job-seeking skills, resume preparation, interview skills, and other assistance. The table presented next reflects those Veterans participating in Vocational Rehabilitation and Employment by training program during Fiscal Year 2009.
Veterans Participating in a Vocational Training Program During Fiscal Year 2009
Program Total
Undergraduate School 50,655
Vocational/Technical 2,993
Graduate School 2,755
College, Non Degree 1,572
Extended Eval/Independent Living 788
Paid On-Job Training 208
Non Pay Work Experience in Government 253
Non-Pay On-Job Training 119
Apprenticeship 108
Improvement of Rehab Potential 43
High School 8
Farm Co-op 14
Total 59,516Source: VR&E Program Management Reports – Snapshot of VR&E Participants at the end of Fiscal Year 2009.

Annual Benefits Report FY 200968
Vocational Rehabilitation and Employm
ent (VR&E)
Upon completion of the individualized evaluation process, Veterans enter a rehabilitation program to become job-ready in their selected vocational choice or to achieve the maximum ability to live independently in the community. The length of time that Veterans remain in a rehabilitation program varies according to the Veteran’s individual circumstances. The average time spent in the program is approximately two and one-half years.
The following table shows annual earnings pre- and post- VR&E program participation for those Veterans who were successfully rehabilitated.
Veterans Successfully Rehabilitated Pre and Post Annual Earnings by Occupational Category at the End of Fiscal Year 2009
TotalAverage Annual Wages Prior to
VR&E Program EntranceAverage Annual Wages at
Rehabilitation
Professional, Technical, and Managerial 6,232 $7,522 $36,598
Clerical 561 $5,238 $27,849
Service 409 $5,758 $27,850
Miscellaneous 300 $6,100 $31,385
Machine Trades 253 $7,309 $30,712
Structural (Building Trades) 195 $9,632 $33,250
Sales 164 $5,023 $28,657
Benchwork 47 $5,114 $27,653
Processing (Butcher, Meat Processor, etc.) 20 $5,897 $35,064
Agricultural, Fishery and Forestry 32 $6,533 $21,217
Total 8,831 $5,641 $32,359Note: Excludes Independent Living Veterans (2,809).Source: VR&E Program Management Reports – Snapshot of VR&E Participants at the end of Fiscal Year 2009.

Veterans Benefits Administration Making a difference
Appendices
AppendicesVBARegionalOfficeMailingAddresses ................................. A1Contact VA by Telephone ........................................................B1Glossary ...................................................................................C1Websites ..................................................................................D1Select Veteran Data for All VBA Programs by State ..............E1


Veterans Benefits Administration Making a difference A1
AppendicesVBA Regional Office Mailing Addresses
ALABAMAVA Regional Office345 Perry Hill RoadMontgomery, AL 36109-3798
CONNECTICUTVA Regional Office 555 Willard Avenue, Building 2E, Room 5137P. O. Box 310909Newington, CT 06103-0909
ALASKAVA Regional Office2925 Debarr RoadAnchorage, AK 99508-2989
DELAWAREVA Regional Office1601 Kirkwood HighwayWilmington, DE 19805-4988
ARIZONAVA Regional Office3333 North Central AvenuePhoenix, AZ 85012-2405
DISTRICT OF COLUMBIAVA Regional Office1722 Eye St, NWWashington, DC 20421-1111
ARKANSASVA Regional Office2200 FT Roots Drive, Bldg 65North Little Rock, AR 72114-1756
FLORIDAVA Regional OfficeP. O. Box 1437St. Petersburg, FL 33731-1437
CALIFORNIAVA Regional OfficeFederal Building11000 Wilshire Blvd.Los Angeles, CA 90024-3602
VA Regional OfficeOakland Federal Building1301 Clay Street - Suite 1300NOakland, CA 94612-5209
VA Regional Office 8810 Rio San Diego DriveSan Diego, CA 92108-1508
GEORGIAVA Regional Office1700 Clairmont RoadDecatur, GA 30033-4032
HAWAIIVA Regional OfficeP. O. Box 29020459 Petterson Road, E WHonolulu, HI 96819-1522
IDAHOVA Regional Office805 W. Franklin StreetBoise, ID 83702-5560
COLORADOVA Regional Office155 Van Gordon StreetLakewood, CO 80228-1709
ILLINOISVA Regional Office2122 W. Taylor StreetChicago, IL 60612-4281

Annual Benefits Report FY 2009A2
Appendices
INDIANAVA Regional Office575 North Pennsylvania StreetIndianapolis, IN 46204-1526
MINNESOTAVA Regional Office One Federal Drive, Fort SnellingSt. Paul, MN 55111-4050
IOWAVA Regional Office 210 Walnut Street, Room 1063Des Moines, IA 50309-9825
MISSISSIPPIVA Regional Office1600 East Woodrow Wilson AvenueJackson, MS 39216-5102
KANSASVA Regional Office5500 E. Kellogg DriveWichita, KS 67218-1698
MISSOURIVA Regional Office 400 South 18th StreetSt. Louis, MO 63103-2676
KENTUCKYVA Regional Office321 West Main Street, Suite 390Louisville, KY 40202-6200
MONTANARegional OfficeWilliam Street, Hwy 12 WestFort Harrison, MT 59636-9999
LOUISIANAVA Regional Office1250 Poydras Street, Suite 200New Orleans, LA 70113-1871
NEBRASKAVA Regional Office5631 S. 48th StreetLincoln, NE 68516-4198
MAINEVA Regional Office1 VA Center - Building 248, Room 205Augusta, ME 04330-6795
NEVADAVA Regional Office5460 Reno Corporate DriveReno, NV 89511-2250
MARYLANDVA Regional OfficeFederal Building31 Hopkins Plaza, Room 233Baltimore, MD 21201-0001
NEW HAMPSHIREVA Regional Office Norris Cotton Federal Bldg.275 Chestnut StreetManchester, NH 03101-2489
MASSACHUSETTSVA Regional Office John F. Kennedy BuildingGovernment Center 1600Boston, MA 02203-0393
NEW JERSEYVA Regional Office20 Washington PlaceNewark, NJ 07102-3174
MICHIGANVA Regional Office Patrick V. McNamara Federal Bldg.477 Michigan Avenue, Room 1400Detroit, MI 48226-2591
NEW MEXICOVA Regional Office Dennis Chavez Federal Bldg.500 Gold Avenue, SWAlbuquerque, NM 87102-3118

A3Veterans Benefits Administration Making a difference
Appendices
NEW YORKVA Regional Office130 S. Elmwood AvenueBuffalo, NY 14202-2478
VA Regional Office245 W. Houston StreetNew York, NY 10014-4805
PENNSYLVANIAVA Regional Office andInsurance Center5000 Wissahickon AvenuePhiladelphia, PA 19101-8079
VA Regional Office 1000 Liberty AvenuePittsburgh, PA 15222-4004
NORTH CAROLINAVA Regional OfficeFederal Building251 North Main StreetWinston-Salem, NC 27155-1000
PHILIPPINESU.S. Department of Veterans AffairsFPO AP 96515-1110Manila, PI 1000
NORTH DAKOTAVA Regional Office2101 Elm StreetFargo, ND 58102-2417
PUERTO RICOVA Regional OfficeP. O. Box 364867San Juan, PR 00936-4867
OHIOVA Regional Office Federal Building1240 East Ninth StreetCleveland, OH 44199-2001
RHODE ISLANDVA Regional Office380 Westminster MallProvidence, RI 02903-3246
OKLAHOMAVA Regional OfficeFederal Building125 South Main StreetMuskogee, OK 74401-7025
SOUTH CAROLINAVA Regional Office1801 Assembly StreetColumbia, SC 29201-2495
OREGONVA Regional OfficeEdith Green/Wendell Wyatt Federal Building1220 Southwest 3rd AvenuePortland, OR 97204-2825
SOUTH DAKOTAVA Regional Office2501 W 2nd StreetSioux Falls, SD 57117-5046

A4 Annual Benefits Report FY 2009
Appendices
TENNESSEEVARegionalOffice110NinthAvenue,SouthNashville,TN37203-3817
VIRGINIAVARegionalOffice210 Franklin Road, SWRoanoke, VA 24011‑2204
TEXASVARegionalOffice6900 Almeda RoadHouston, TX 77030‑4200
VARegionalOfficeOne Veterans Plaza701 Clay AvenueWaco, TX 76799‑0001
WASHINGTONVARegionalOfficeFederal Building915 Second AvenueSeattle, WA 98174‑1060
WESTVIRGINIAVARegionalOffice640 4th AvenueHuntington, WV 25701‑1340
UTAHVARegionalOffice550 Foothill DriveSalt Lake City, UT 84113‑1106
WISCONSINVARegionalOffice5400W.NationalAvenueMilwaukee, WI 53214‑3416
VERMONTVARegionalOffice215N.MainStreetWhite River Junction, VT 05009‑0001
WYOMING2360 E. Pershing Blvd.Cheyenne, WY 82001‑5356
TheDenverRegionalOfficeservesthestateofWyoming.Thelocaladdressprovidedisforthebenefitsoffice.

B1Veterans Benefits Administration Making a difference
Appendices
Contact VA by Phone
Compensation and Pension, Loan Guaranty, Vocational Rehabilitation and
Employment, and General Benefits Information 1‑800‑827‑1000*
Beneficiaries in receipt of Pension Benefits 1‑877‑294‑6380*
Education 1‑888‑GI BILL 1*(1‑888‑442‑4551)
Life Insurance 1‑800‑669‑8477*
Burial Headstones and Markers 1‑800‑697‑6947*
Health Care 1‑877‑222‑8387*
CHAMPVA 1‑800‑733‑8387*
Telecommunication Device for the DEAF (TDD) 1‑800‑829‑4833*
Annual Benefits Report (Office of Performance Analysis & Integrity) 202‑461‑9040
*Indicates toll‑free numbers


C1Veterans Benefits Administration Making a difference
Appendices
Glossary
AID AND ATTENDANCE – An additional monetary allowance payable to individuals who are:
� In a nursing home or � In need of daily care to help with feeding, dressing, attending to the wants of nature, protecting oneself from hazards of the daily environment, or keeping clean.
APPLICANTS (VR&E) – Veterans who have applied for Vocational Rehabilitation and Employment services.
BENEFITS DELIVERY AT DISCHARGE (BDD) – Program to assist active duty personnel in filing for VA benefits prior to their separation or retirement from active duty. VBA provides information about VA benefits and assistance in filing benefit claims.
BODY SYSTEMS – Title 38, Code of Federal Regulations, Part 4, classifies the various areas of the body into fifteen (15) different systems as follows:
� Musculoskeletal System � Skin � Auditory � Mental Disorders � Digestive System � Neurological Conditions and Convulsive Disorders
� Cardiovascular System � Respiratory System � Endocrine System � Genitourinary System � Eye Infectious Diseases, Immune Disorders, Nutritional Deficiencies
� Gynecological Conditions � Dental and Oral Conditions � Hemic and Lymphatic Systems
BUYER STATUS – A first-time homeowner or previous homeowner.
CASH SURRENDER – A policyholder, upon request, receives the cash value that accrued in his/her life insurance policy, and in return surrenders all rights, title, and interest to his/her basic and/or paid‑up additional insurance coverage amounts.
CHAPTER 31 BENEFITS – Vocational Rehabilitation and Employment (VR&E) program providesbenefitsandservicestoVeteranswhoseservice‑connected disabilities limit or prohibit employment options.
CODE OF FEDERAL REGULATIONS (CFR) – VA rules and regulations are contained in Title 38 Code of Federal Regulations (38 CFR). The Secretary of Veterans Affairs is empowered to prescribe all rules and regulations, consistent with existinglaw,necessaryorappropriatetocarryoutthe laws administered by the Department (Section 501, Title 38 USC).
COMBINED DEGREE – The combined degree ofdisabilityisexpressedasapercentage(from0 to 100 in increments of 10) and represents the overall disabling effect of a Veteran’s service‑connected disabilities.
COMPENSABLE ZEROS – Disabilities that are independently evaluated at zero percent disabling but produce an employment handicap to warrant a 10 % combined disability evaluation. This evaluation entitles the Veteran to receive disability compensation payments.
COMPUTER SYSTEMS – VBA derives statistical data about Veterans from multiple sources and from various computer systems: e.g. VBA DataWarehouse,VBA’sBenefitsDeliveryNetwork(BDN),theBeneficiaryIdentificationand Records Locator System (BIRLS); and the Board of Veterans’ Appeals Control and Locator System (VACOLS).
DEPENDENTS’ EDUCATIONAL ASSISTANCE(DEA) – Refers to Dependents’ Educational Assistance Program (Chapter 35 of the Title 38, U.S. Code). See Survivors’ and Dependents’ Educational Assistance.

C2 Annual Benefits Report FY 2009
Appendices
DEPENDENCY AND INDEMNITY COMPENSATION(DIC) – A monetary death benefit payable to eligible survivors (surviving spouses, children, and/or dependent parents of servicemembers who die in service) as a result of a service‑connected death.
DEPENDENTS – Qualifying dependents for VA benefit purposes are a Veteran’s spouse and child (natural child, adopted child, or stepchild). A Veteran’s mother or father may also be considered a dependent generally if there is financial need.
DIAGNOSTIC CODES – VBA uses four digit numeric codes to signify specific medical conditions. These numeric codes are in 38 CFR, Part 4.
DIRECT LOAN – A home loan made by the Department of Veterans Affairs directly to Veterans. This is distinct from guaranteed loans, which are made by private lenders and guaranteed by VA.
DISABILITY COMPENSATION – A monetary benefit paid to Veterans for service‑connected disability.
DISABILITY PENSION – A monetary benefit paid to wartime Veterans who are age 65 or older, or permanently and totally disabled as the result of a non‑service‑connected disability. In either case, the Veteran’s annual income must not exceed the limit set by statute in order to qualify for this benefit.
DIVIDEND – A payment to policyholders in participating life insurance programs. It is an allocation of program surplus funds representing the return of premiums not needed to pay claims andexpenses,andadistributionofearningsfrominvestment. Dividends are issued annually on the policy anniversary date.
DMDC – The Defense Manpower Data Center maintains the largest archive of personnel, manpower,trainingandfinancialdataintheDepartment of Defense (DoD).
NO DOWNPAYMENT OPTION – The VA home loan guaranty program allows the Veteran to enter the home buying market with the option of providing no downpayment. This option is intended to help the Veteran afford the purchase of a suitable home.
EDUCATIONAL ASSISTANCE –Amonetarybenefitto eligible Veterans, dependents, reservists, and servicemembers while they are in an approved training program.
ELIGIBLE – Veterans who have been deemed eligible based upon a qualifying service‑connected disability or memo rating.
ELIGIBILITY –VAbenefitsrequirethattheVeteran be discharged from active military service under “other than dishonorable” conditions. In addition to this general requirement, there are specificstatutoryandregulatoryrequirementsforeachofthefivebenefitprograms;someof these requirements are described in the sections of this report dealing with the respective benefitprograms.
ENTITLED TO SERVICES (VR&E) – Veterans determined to have a disability that presents an employment or serious employment handicap, and for whom it has been determined that vocational rehabilitation should be successful.

C3Veterans Benefits Administration Making a difference
AppendicesENTITLEMENT (EDU) – The number of months the student is eligible for VA education benefits. This number is usually expressed in months and days the student will be eligible for full-time benefits. Entitlement may vary depending on the education program the individual qualifies under. In no event will entitlement exceed 48 months under any combination of education programs.
ENTITLEMENT (C&P) – Once basic eligibility requirements have been met, decisions on entitlement for C&P benefits are based on statutory and regulatory requirements and the evidence of record that documents these requirements have been met.
EVALUATION FOR ENTITLEMENT TO A PROGRAM OF REHABILITATION SERVICES – The process used to determine whether the Veteran’s disabilities cause an employment handicap.
FACE VALUE – The dollar amount of life insurance money that would be paid upon the death of the Veteran or at the maturity of the policy, subject to adjustments for indebtedness, dividends, premium overpayments, or “paid-up additions.”
FIRST-TIME HOMEOWNER – A Veteran using his home loan entitlement to purchase a home for the first time.
FISCAL YEAR – Any yearly accounting or budgetary period without regard to its relationship to the calendar year.
FISCAL YEAR 2008 – Began October 1, 2006, and ended September 30, 2008. The Department of Veterans Affairs operates under this schedule for accounting and budgetary purposes.
FORECAST OF PROGRAM LIABILITIES – Future liabilities represent payments that the government is obligated to deliver in future years. This is much like the obligation of a life insurance company to pay the face amount of a standard policytobeneficiariesatthetimeoftheinsuredperson’s death.
FUNDING FEE – A fee, required by law, charged to Veterans who obtain a VA guaranteed home loan.
FSGLI – Family Servicemembers’ Group Life Insurance was established in 2001 to provide servicemembers, who have Servicemembers’ Group Life Insurance (SGLI) coverage, the opportunity to have life insurance coverage on their spouses and dependent children.
GUARANTEED LOAN – A loan that is federally backed by the VA home loan provision.
HOUSEBOUND – An additional monetary allowance payable to those individuals who are substantiallyconfinedtotheirhomeorimmediatepremises as a result of a permanent disability.
INDIVIDUAL UNEMPLOYABILITY – Veterans unable to secure and follow a substantially gainful occupation by reason of service‑connected disability will be rated totally disabled, provided that the Veteran has a single disability rated 60% or more or a combined evaluation of at least 70%, with one disability ratable at 40% or higher.
KICKERS (EDU) – Amounts contributed by DoD to an education fund on behalf of participants to encourage enlistment or retention in the Armed Forces. (The military services may use different termssuchas“ArmyCollegeFund”or“NavyCollege Fund”, etc.) These amounts are added to anyothereducationbenefitstowhichthepersonmay be entitled. Kickers are applicable only to MGIB‑AD, MGIB‑SR, VEAP and REAP.
LOAN (INS) – An amount borrowed against the cash value of a permanent plan life insurance policy.

C4 Annual Benefits Report FY 2009
Appendices
LOAN DEFAULTED-GUARANTY CLAIM PAID – Loan Guaranty term used when the borrower defaults on the loan and VA pays the loan guaranty claim.
LOAN GUARANTY PROGRAM – The benefit program whereby VA guarantees a portion of a loan to lenders to facilitate Veterans obtaining a home.
MATURED ENDOWMENT – The face amount of life insurance less any indebtedness that is paid to the insured at maturity of the policy, based on the plan of life insurance. The proceeds may be paid as a lump sum or the insured may request installment payments.
MGIB-AD – The Montgomery GI Bill-Active Duty Educational Assistance Program (Chapter 30 of Title 38, U.S. Code) which provides educational assistance to persons who served on active duty in the Armed Forces.
MGIB-SR – The Montgomery GI Bill-Selected Reserve Educational Assistance Program (Chapter 1606 of Title 10, U.S. Code) which provides educational assistance to members of the Selected Reserve or the Ready Reserve of any of the reserve components of the Armed Forces.
NOT ELIGIBILE (VR&E) – Veterans who have been determined ineligible for VR&E benefits for reasons such as a lack of a qualifying service-connected disability rating.
NOT ENTITLED (VR&E) – Veterans who have been determined not entitled to VR&E services due to a lack of an employment handicap or a serious employment handicap.
NSLI – National Service Life Insurance was established in 1940 to meet the insurance needs of World War II Veterans. The program closed in 1951.
ORIGINAL DISABILITY CLAIM –AVeteran’sfirstclaimfordisabilitybenefits,eithercompensationor pension or both. Any subsequent claim is categorized as a reopened or supplemental claim.
OUTREACH (VR&E) – Various initiatives within the Program to improve communication and tocoordinateandmaximizeemploymentopportunities with other government agencies, local businesses and VSOs on behalf of service‑connected disabled Veterans.
PAID-UP ADDITIONS – Policyholders with participating policies can use their annual dividends to purchase additional life insurance. Established in 1972, this is the only way most policyholders may increase their life insurance coverage amount.
PARTICIPANTS (VR&E) – Veterans who are currently receiving subsistence allowance in one ofthefollowingVR&Ecasestatuses:extendedevaluation, independent living, job ready or rehabilitation to employment.
PEACETIME VETERANS – Veterans who served duringaperiodoftimenotstatutorilydefinedasaperiod of war.
PRISONERS OF WAR (POWs) – Veterans who wereforciblydetained(confined)byanenemy,foreign government, or hostile force while serving in the active military, naval or air service.
PREVIOUS HOMEOWNER – A person who has had a previous ownership interest in a home.
PROTECTED PENSION – The pension program, both disability and death, replaced by Section 306 Pension, which in turn was replaced by the current pension program under the provisions of PL 95‑588. Veterans and survivors receiving either Protected Pension or Section 306 Pension maycontinuetoreceivethebenefitsaslongas they continue to meet the basic entitlement requirements of the respective programs.
PURCHASE LOAN – A loan made solely for the purpose for purchasing a home.

C5Veterans Benefits Administration Making a difference
AppendicesRANGE OF DISABILITIES – A disability is evaluated according to the VA Schedule for Rating Disabilities in Title 38, CFR, and Part 4. Extent of disability is expressed as a percentage from 0% (for conditions that exist but are not disabling to a compensable degree) to 100%, in increments of 10%. Most disabilities, however, do not have every 10% increment from 0 to 100.
RATING SCHEDULE – Title 38, CFR Part 4.
REAP – The Reserve Educational Assistance Program (Chapter 1607 of Title 10, U.S. Code) which provides educational assistance to members of the Guard and Reserves who serve on active duty in support of a contingency operation under federal authority on or after September 11, 2001.
REGIONAL OFFICE (RO) – A VA field office composed of divisions which carry out the functions of VBA. Fifty-seven such offices exist throughout the United States, the District of Columbia, Puerto Rico, and the Philippines.
REHABILITATED (VR&E) – Veterans who have successfully found and maintained suitable employment or have successfully completed the independent living program.
RESERVIST – A member of a reserve component of one of the Armed Forces who has potential entitlement to certain VA benefits by reason of his or her reserve status, including educational assistance under Title 10 of the United States Code, Chapter 1606.
RESTORED ENTITLEMENT (LGY) – Previously used entitlement may be restored when a property secured by a VA loan is sold and the loan is paid in full or when an eligible Veteran transferee agrees to assume the outstanding balance on a VA loan and substitute his/her entitlement for the same amount originally used on the loan.
SDVI – Service‑Disabled Veterans Insurance was established in 1951 to meet the insurance needs of Veterans with service‑connected disabilities. SDVI is open to Veterans who received other than dishonorable discharge separated from the service on or after April 25, 1951, and who received a service‑connected disability rating of 0% or greater within the last two years.
SECONDARY MARKET –Thefinancialmarketwhere mortgages are bought and sold.
SERVICE-CONNECTED – A disease or injury determined to have occurred in or to have been aggravated by military service.
SERIOUS EMPLOYMENT HANDICAP – A significantimpairment,causedinwholeorinpartby a service‑connected disability, in the Veteran’s ability to prepare for, obtain, or retain employment consistent with his or her abilities, aptitudes, and interests.
SERVICEMEMBER – An individual who is currently serving on active duty. This individual is also referred to as a “service person.”
SGLI – Servicemembers Group Life Insurance was established in 1965 to meet the insurance needs of servicemembers.
SPECIALLY ADAPTED HOUSING GRANT – A one‑time grant to a seriously disabled Veteran to assist in adapting his or her home to accommodate limitations caused by the disability.
SUBSISTENCE ALLOWANCE (VR&E) – A monthly livingallowancepaidtoaqualifiedVeteraninaprogram of vocational rehabilitation. The allowance is generally paid to those Veterans who are enrolled in education or training programs. The amount is based on training time and number of dependents.

C6 Annual Benefits Report FY 2009
Appendices
SURVIVORS’ AND DEPENDENTS’ EDUCATIONAL ASSISTANCE (DEA) – Under Chapter 35 of Title 38, U.S. Code, a monetary educational benefit payable to eligible dependents and survivors of Veterans.
TITLE 38 CODE OF FEDERAL REGULATIONS – Regulations that pertain to Veterans’ benefits.
TOTAL DISABILITY INCOME (INS) – An option available with some insurance policies that provides for monthly payments to policyholders who, prior to their 65th birthday, have incurred a mental or physical disability which prevents them from performing substantially gainful employment.
TOTAL AND PERMANENT DISABILITY – Total ratings are authorized for any disability or combination of disabilities for which the Schedule of Rating Disabilities prescribes a 100% evaluation or, where less than 100%, the requirements for Individual Unemployability are met. Permanence of total disability is considered to exist when the impairment is reasonably certain to continue throughout the life of the disabled Veteran and generally requires no future medical exams.
TSGLI – The Traumatic Injury Protection Program provides automatic traumatic injury coverage to all servicemembers covered under the Servicemembers’ Group Life Insurance (SGLI) program. Every member who has SGLI also has TSGLI effective December 1, 2005. This coverage applies to active duty members, reservists, funeral honors duty and one-day muster duty. This benefit is also provided retroactively for members who incur certain severe losses as a result of a traumatic injury between October 7, 2001, and December 1, 2005, if the loss was the direct result of injuries incurred in Operations Enduring Freedom or Iraqi Freedom.
USGLI – United States Government Life Insurance was established in 1919 to meet the insurance needs of World War I Veterans. This program closed in 1951.
VEAP – The Veterans Educational Assistance Program (Chapter 32 of Title 38, U.S. Code) is a contributory educational assistance program for Post‑Vietnam Era Veterans.
VETERAN – A person who served in the active military, naval, or air service, and who was discharged or released under conditions other than dishonorable.
VGLI – Veterans Group Life Insurance was established in 1974 to meet the insurance needs of Veterans after separation from service.
VMLI – Veterans Mortgage Life Insurance was established in 1971 to provide mortgage protection life insurance to severely disabled Veterans who have received grants for the purchase of specially adapted housing.
VR&E – The Vocational Rehabilitation and Employment (VR&E) Program is available to help service‑disabled Veterans become employable and live independently.
VRI – Veterans’ Reopened Insurance was established in 1965 to provide insurance protection for certain classes of disabled Veterans fromWorldWarIIandtheKoreanConflict.Theprogram closed in 1966.
VSLI – Veterans Special Life Insurance was established in 1951 to meet the insurance needs ofVeteranswhoservedduringtheKoreanConflictand post‑Korean era. The program closed in 1956.
ZERO (0) PERCENT DISABILITY – A zero percent disabilityratingmeansthatadisabilityexistsand is related to the Veteran’s service but is not so disabling that it entitles the Veteran to compensation payments. Also called a non‑compensable disability.

D1Veterans Benefits Administration Making a difference
AppendicesInternet References
VA WEBSITES
Department of Veterans Affairs Home Page ................... http://www.va.gov
Health Care ...................................http://www.va.gov/vbs/health/index.htm
National Cemetery Administration ............................http://www.cem.va.gov
Office of Congressional Affairs ................http://www.va.gov/oca/index.htm
Public Affairs & Special Events .............. http://www.va.gov/opa/index.htm
About VA ..........................................................http://www.va.gov/about_va/
Links to VA organizations .................................................. http://www.va.gov/
Online Applications .................................http://www.va.gov/onlineapps.htm
Online Forms ...................................................... http://www.va.gov/vaforms/
Facility Locator ..................................................................... http://www.va.gov
Contact Information ............................................................https://iris.va.gov/
Veteran Data & Information .............................. http://www.va.gov/vetdata/
VBA WEBSITES
Veterans Benefits Administration Home Page ........http://www.vba.va.gov
Compensation & Pension .......... http://www.vba.va.gov/bln/21/index.htm
Education ................................................................... http://www.gibill.va.gov/
Life Insurance ...................................................http://www.insurance.va.gov/
Loan Guaranty ................................................. http://www.homeloans.va.gov
Vocational Rehabilitation & Employment .............................http://www.vba.va.gov/bln/vre/index.htm


Veterans Benefits Administration Making a difference E1
AppendicesSummary of Fiscal Year 2009 Benefits
Compensation and Pension Estimated Veteran Population 23,066,965Disability Compensation Recipients 3,069,652 Estimated Monthly Disability Compensation Costs $2,841,912,601Estimated Annual Disability Compensation Costs $34,102,951,214Disability Compensation by Age 34 and under 294,986 Disability Compensation by Age 35-54 919,356 Disability Compensation by Age 55-74 1,341,967 Disability Compensation by Age 75-84 323,830 Disability Compensation by Age 85 and over 189,513 Disability Pension Recipients 314,245Estimated Monthly Disability Pension Costs $255,436,395Estimated Annual Disability Pension Costs $3,065,236,745Disability Pension by Age under 45 5,844 Disability Pension by Age 45-54 22,335 Disability Pension by Age 55-69 140,574 Disability Pension by Age 70-84 89,761 Disability Pension by Age 85 and over 55,731
Education MGIB-AD Trainees 341,969MGIB-SR Trainees 63,469DEA Trainees 81,327VEAP Trainees 448REAP Trainees 42,881Post 9/11 Trainees 34,393
Insurance Life Insurance Payments $1,732,497,998Total Face Value of Insurance $14,658,899,456Total Number of Policies 1,254,059
Loan Guaranty Number of Loans 325,690 Total Loan Amount $68,200,786,687
Vocational Rehabilitation and Employment Number of Applicants 78,127Number of Plans Developed 28,997Number of Entitlement Decisions 38,802Number of Veterans Rehabilitated through Independent Living 2,477Number of Veterans Rehabilitated by Obtaining Suitable Employment 7,868
VR&E Note: The number of Veterans Rehabilitated through Independent Living and by Obtaining Suitable Employment are calculated through a different data filter than that producing the National ABR totals, which yields a different summary result.Education Note: State statistics are not available for the Post-9/11 GI Bill

Annual Benefits Report FY 2009E2
Appendices
Alabama
Compensation and Pension Estimated Veteran Population 409,997 Disability Compensation Recipients 68,468 Estimated Monthly Disability Compensation Costs $64,203,784Estimated Annual Disability Compensation Costs $770,445,408Disability Compensation by Age 34 and under 5,034 Disability Compensation by Age 35-54 22,183 Disability Compensation by Age 55-74 32,062 Disability Compensation by Age 75-84 6,403 Disability Compensation by Age 85 and over 2,786 Disability Pension Recipients 9,314Estimated Monthly Disability Pension Costs $8,446,972Estimated Annual Disability Pension Costs $101,363,659Disability Pension by Age under 45 137 Disability Pension by Age 45-54 533 Disability Pension by Age 55-69 3,187 Disability Pension by Age 70-84 3,382 Disability Pension by Age 85 and over 2,075
Education MGIB-AD Trainees 6,718MGIB-SR Trainees 1,728DEA Trainees 2,703VEAP Trainees 8REAP Trainees 1,269
Insurance Life Insurance Payments $24,488,948Total Face Value of Insurance $207,204,299Total Number of Policies 17,800
Loan Guaranty Number of Loans 7,784 Total Loan Amount $1,464,587,779
Vocational Rehabilitation and Employment Number of Applicants 2,360Number of Plans Developed 1,111Number of Entitlement Decisions 1,293Number of Veterans Rehabilitated through Independent Living 272Number of Veterans Rehabilitated by Obtaining Suitable Employment 304

Veterans Benefits Administration Making a difference E3
AppendicesAlaska
Compensation and Pension Estimated Veteran Population 76,468 Disability Compensation Recipients 13,446 Estimated Monthly Disability Compensation Costs $11,020,345Estimated Annual Disability Compensation Costs $132,244,134Disability Compensation by Age 34 and under 1,271 Disability Compensation by Age 35-54 6,173 Disability Compensation by Age 55-74 5,266 Disability Compensation by Age 75-84 551 Disability Compensation by Age 85 and over 185 Disability Pension Recipients 291Estimated Monthly Disability Pension Costs $232,085Estimated Annual Disability Pension Costs $2,785,020Disability Pension by Age under 45 4 Disability Pension by Age 45-54 28 Disability Pension by Age 55-69 212 Disability Pension by Age 70-84 32 Disability Pension by Age 85 and over 15
Education MGIB-AD Trainees 776MGIB-SR Trainees 154DEA Trainees 166VEAP Trainees 2REAP Trainees 60
Insurance Life Insurance Payments $2,512,930Total Face Value of Insurance $21,262,242Total Number of Policies 1,633
Loan Guaranty Number of Loans 3,071 Total Loan Amount $813,574,679
Vocational Rehabilitation and Employment Number of Applicants 321Number of Plans Developed 128Number of Entitlement Decisions 154Number of Veterans Rehabilitated through Independent Living 3Number of Veterans Rehabilitated by Obtaining Suitable Employment 52

Annual Benefits Report FY 2009E4
Appendices
Arizona
Compensation and Pension Estimated Veteran Population 561,387 Disability Compensation Recipients 70,893 Estimated Monthly Disability Compensation Costs $67,485,930Estimated Annual Disability Compensation Costs $809,831,160Disability Compensation by Age 34 and under 7,700 Disability Compensation by Age 35-54 20,438 Disability Compensation by Age 55-74 31,038 Disability Compensation by Age 75-84 7,664 Disability Compensation by Age 85 and over 4,053 Disability Pension Recipients 5,052Estimated Monthly Disability Pension Costs $3,739,095Estimated Annual Disability Pension Costs $44,869,144Disability Pension by Age under 45 83 Disability Pension by Age 45-54 388 Disability Pension by Age 55-69 2,446 Disability Pension by Age 70-84 1,416 Disability Pension by Age 85 and over 719
Education MGIB-AD Trainees 26,822MGIB-SR Trainees 2,005DEA Trainees 3,137VEAP Trainees 11REAP Trainees 2,011
Insurance Life Insurance Payments $38,350,478Total Face Value of Insurance $324,488,572Total Number of Policies 28,015
Loan Guaranty Number of Loans 11,890 Total Loan Amount $2,404,975,831
Vocational Rehabilitation and Employment Number of Applicants 2,283Number of Plans Developed 812Number of Entitlement Decisions 1,135Number of Veterans Rehabilitated through Independent Living 125Number of Veterans Rehabilitated by Obtaining Suitable Employment 283

Veterans Benefits Administration Making a difference E5
AppendicesArkansas
Compensation and Pension Estimated Veteran Population 257,625 Disability Compensation Recipients 38,275 Estimated Monthly Disability Compensation Costs $45,418,723Estimated Annual Disability Compensation Costs $545,024,676Disability Compensation by Age 34 and under 3,612 Disability Compensation by Age 35-54 11,353 Disability Compensation by Age 55-74 17,678 Disability Compensation by Age 75-84 3,700 Disability Compensation by Age 85 and over 1,932 Disability Pension Recipients 4,928Estimated Monthly Disability Pension Costs $3,571,077Estimated Annual Disability Pension Costs $42,852,926Disability Pension by Age under 45 133 Disability Pension by Age 45-54 383 Disability Pension by Age 55-69 2,191 Disability Pension by Age 70-84 1,367 Disability Pension by Age 85 and over 854
Education MGIB-AD Trainees 2,061MGIB-SR Trainees 988DEA Trainees 1,575VEAP Trainees 3REAP Trainees 886
Insurance Life Insurance Payments $15,210,873Total Face Value of Insurance $128,701,251Total Number of Policies 11,392
Loan Guaranty Number of Loans 3,427 Total Loan Amount $539,304,822
Vocational Rehabilitation and Employment Number of Applicants 991Number of Plans Developed 410Number of Entitlement Decisions 598Number of Veterans Rehabilitated through Independent Living 15Number of Veterans Rehabilitated by Obtaining Suitable Employment 65

Annual Benefits Report FY 2009E6
Appendices
California
Compensation and Pension Estimated Veteran Population 2,025,934 Disability Compensation Recipients 251,937 Estimated Monthly Disability Compensation Costs $224,164,351Estimated Annual Disability Compensation Costs $2,689,972,210Disability Compensation by Age 34 and under 31,031 Disability Compensation by Age 35-54 68,170 Disability Compensation by Age 55-74 105,794 Disability Compensation by Age 75-84 28,994 Disability Compensation by Age 85 and over 17,948 Disability Pension Recipients 24,436Estimated Monthly Disability Pension Costs $20,471,677Estimated Annual Disability Pension Costs $245,660,120Disability Pension by Age under 45 553 Disability Pension by Age 45-54 2,019 Disability Pension by Age 55-69 12,048 Disability Pension by Age 70-84 5,939 Disability Pension by Age 85 and over 3,877
Education MGIB-AD Trainees 34,942MGIB-SR Trainees 2,987DEA Trainees 7,017VEAP Trainees 48REAP Trainees 1,903
Insurance Life Insurance Payments $172,735,191Total Face Value of Insurance $1,461,535,770Total Number of Policies 120,293
Loan Guaranty Number of Loans 21,606 Total Loan Amount $6,045,349,239
Vocational Rehabilitation and Employment Number of Applicants 6,837Number of Plans Developed 2,120Number of Entitlement Decisions 3,240Number of Veterans Rehabilitated through Independent Living 266Number of Veterans Rehabilitated by Obtaining Suitable Employment 440

Veterans Benefits Administration Making a difference E7
AppendicesColorado
Compensation and Pension Estimated Veteran Population 424,228Disability Compensation Recipients 62,380 Estimated Monthly Disability Compensation Costs $55,712,353Estimated Annual Disability Compensation Costs $668,548,236Disability Compensation by Age 34 and under 6,988 Disability Compensation by Age 35-54 21,829 Disability Compensation by Age 55-74 25,167 Disability Compensation by Age 75-84 5,601 Disability Compensation by Age 85 and over 2,795 Disability Pension Recipients 3,507Estimated Monthly Disability Pension Costs $2,803,912Estimated Annual Disability Pension Costs $33,646,947Disability Pension by Age under 45 59 Disability Pension by Age 45-54 302 Disability Pension by Age 55-69 1,696 Disability Pension by Age 70-84 882 Disability Pension by Age 85 and over 568
Education MGIB-AD Trainees 10,389MGIB-SR Trainees 914DEA Trainees 1,569VEAP Trainees 10REAP Trainees 732
Insurance Life Insurance Payments $28,547,802Total Face Value of Insurance $241,546,808Total Number of Policies 20,260
Loan Guaranty Number of Loans 12,610 Total Loan Amount $2,912,154,176
Vocational Rehabilitation and Employment Number of Applicants 1,941Number of Plans Developed 662Number of Entitlement Decisions 920Number of Veterans Rehabilitated through Independent Living 22Number of Veterans Rehabilitated by Obtaining Suitable Employment 304
*VR&E total includes Wyoming.

Annual Benefits Report FY 2009E8
Appendices
Connecticut
Compensation and Pension Estimated Veteran Population 237,696Disability Compensation Recipients 20,479 Estimated Monthly Disability Compensation Costs $16,801,320Estimated Annual Disability Compensation Costs $201,615,840Disability Compensation by Age 34 and under 2,235 Disability Compensation by Age 35-54 4,785 Disability Compensation by Age 55-74 8,352 Disability Compensation by Age 75-84 2,629 Disability Compensation by Age 85 and over 2,478 Disability Pension Recipients 1,900Estimated Monthly Disability Pension Costs $1,188,457Estimated Annual Disability Pension Costs $14,261,490Disability Pension by Age under 45 27 Disability Pension by Age 45-54 83 Disability Pension by Age 55-69 703 Disability Pension by Age 70-84 547 Disability Pension by Age 85 and over 540
Education MGIB-AD Trainees 1,771MGIB-SR Trainees 490DEA Trainees 357VEAP Trainees 4REAP Trainees 375
Insurance Life Insurance Payments $26,751,535Total Face Value of Insurance $226,348,348Total Number of Policies 19,544
Loan Guaranty Number of Loans 1,150 Total Loan Amount $276,082,995
Vocational Rehabilitation and Employment Number of Applicants 660Number of Plans Developed 318Number of Entitlement Decisions 411Number of Veterans Rehabilitated through Independent Living 70Number of Veterans Rehabilitated by Obtaining Suitable Employment 60

Veterans Benefits Administration Making a difference E9
AppendicesDelaware
Compensation and Pension Estimated Veteran Population 79,166 Disability Compensation Recipients 9,247 Estimated Monthly Disability Compensation Costs $7,944,983Estimated Annual Disability Compensation Costs $95,339,796Disability Compensation by Age 34 and under 681 Disability Compensation by Age 35-54 3,066 Disability Compensation by Age 55-74 4,020 Disability Compensation by Age 75-84 1,000 Disability Compensation by Age 85 and over 480 Disability Pension Recipients 541Estimated Monthly Disability Pension Costs $380,387Estimated Annual Disability Pension Costs $4,564,642Disability Pension by Age under 45 11 Disability Pension by Age 45-54 32 Disability Pension by Age 55-69 248 Disability Pension by Age 70-84 154 Disability Pension by Age 85 and over 96
Education MGIB-AD Trainees 599MGIB-SR Trainees 169DEA Trainees 244VEAP Trainees 1REAP Trainees 132
Insurance Life Insurance Payments $5,506,982Total Face Value of Insurance $46,595,320Total Number of Policies 4,337
Loan Guaranty Number of Loans 1,196 Total Loan Amount $301,613,449
Vocational Rehabilitation and Employment Number of Applicants 175Number of Plans Developed 70Number of Entitlement Decisions 97Number of Veterans Rehabilitated through Independent Living 1Number of Veterans Rehabilitated by Obtaining Suitable Employment 47
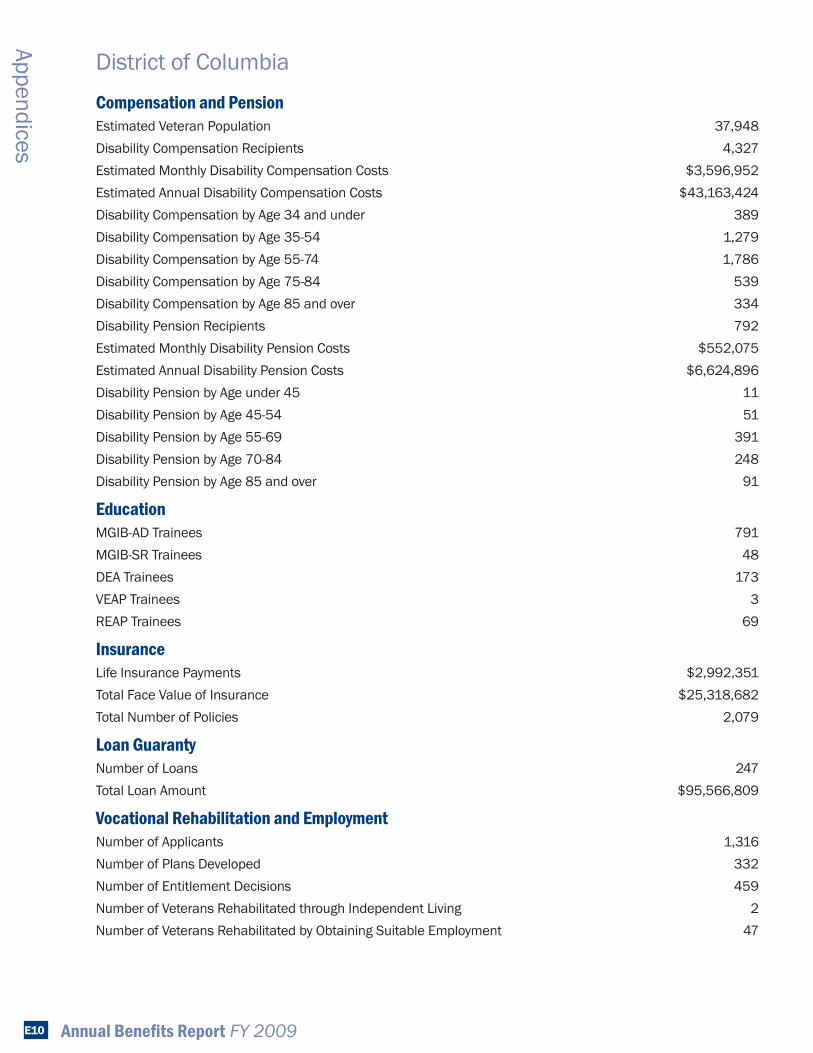
Annual Benefits Report FY 2009E10
Appendices
District of Columbia
Compensation and Pension Estimated Veteran Population 37,948 Disability Compensation Recipients 4,327 Estimated Monthly Disability Compensation Costs $3,596,952Estimated Annual Disability Compensation Costs $43,163,424Disability Compensation by Age 34 and under 389 Disability Compensation by Age 35-54 1,279 Disability Compensation by Age 55-74 1,786 Disability Compensation by Age 75-84 539 Disability Compensation by Age 85 and over 334 Disability Pension Recipients 792Estimated Monthly Disability Pension Costs $552,075Estimated Annual Disability Pension Costs $6,624,896Disability Pension by Age under 45 11 Disability Pension by Age 45-54 51 Disability Pension by Age 55-69 391 Disability Pension by Age 70-84 248 Disability Pension by Age 85 and over 91
Education MGIB-AD Trainees 791MGIB-SR Trainees 48DEA Trainees 173VEAP Trainees 3REAP Trainees 69
Insurance Life Insurance Payments $2,992,351Total Face Value of Insurance $25,318,682Total Number of Policies 2,079
Loan Guaranty Number of Loans 247 Total Loan Amount $95,566,809
Vocational Rehabilitation and Employment Number of Applicants 1,316Number of Plans Developed 332Number of Entitlement Decisions 459Number of Veterans Rehabilitated through Independent Living 2Number of Veterans Rehabilitated by Obtaining Suitable Employment 47

Veterans Benefits Administration Making a difference E11
AppendicesFlorida
Compensation and Pension Estimated Veteran Population 1,683,899 Disability Compensation Recipients 240,102 Estimated Monthly Disability Compensation Costs $215,930,178Estimated Annual Disability Compensation Costs $2,591,162,130Disability Compensation by Age 34 and under 18,231 Disability Compensation by Age 35-54 71,767 Disability Compensation by Age 55-74 102,109 Disability Compensation by Age 75-84 30,112 Disability Compensation by Age 85 and over 17,883 Disability Pension Recipients 21,970Estimated Monthly Disability Pension Costs $18,759,131Estimated Annual Disability Pension Costs $225,109,567Disability Pension by Age under 45 390 Disability Pension by Age 45-54 1,469 Disability Pension by Age 55-69 9,772 Disability Pension by Age 70-84 6,073 Disability Pension by Age 85 and over 4,266
Education MGIB-AD Trainees 26,167MGIB-SR Trainees 2,678DEA Trainees 5,788VEAP Trainees 28REAP Trainees 1,733
Insurance Life Insurance Payments $154,544,457Total Face Value of Insurance $1,307,621,512Total Number of Policies 111,114
Loan Guaranty Number of Loans 19,679 Total Loan Amount $3,915,497,897
Vocational Rehabilitation and Employment Number of Applicants 5,053Number of Plans Developed 1,953Number of Entitlement Decisions 2,187Number of Veterans Rehabilitated through Independent Living 113Number of Veterans Rehabilitated by Obtaining Suitable Employment 418

Annual Benefits Report FY 2009E12
Appendices
Georgia
Compensation and Pension Estimated Veteran Population 772,832 Disability Compensation Recipients 112,075 Estimated Monthly Disability Compensation Costs $99,865,146Estimated Annual Disability Compensation Costs $1,198,381,746Disability Compensation by Age 34 and under 10,276 Disability Compensation by Age 35-54 44,534 Disability Compensation by Age 55-74 45,954 Disability Compensation by Age 75-84 7,895 Disability Compensation by Age 85 and over 3,416 Disability Pension Recipients 11,049Estimated Monthly Disability Pension Costs $9,129,803Estimated Annual Disability Pension Costs $109,557,640Disability Pension by Age under 45 256 Disability Pension by Age 45-54 845 Disability Pension by Age 55-69 5,177 Disability Pension by Age 70-84 2,905 Disability Pension by Age 85 and over 1,866
Education MGIB-AD Trainees 11,909MGIB-SR Trainees 2,128DEA Trainees 3,192VEAP Trainees 13REAP Trainees 994
Insurance Life Insurance Payments $41,209,736Total Face Value of Insurance $348,681,139Total Number of Policies 30,203
Loan Guaranty Number of Loans 15,915 Total Loan Amount $2,941,783,596
Vocational Rehabilitation and Employment Number of Applicants 3,568Number of Plans Developed 817Number of Entitlement Decisions 1,219Number of Veterans Rehabilitated through Independent Living 108Number of Veterans Rehabilitated by Obtaining Suitable Employment 309

Veterans Benefits Administration Making a difference E13
AppendicesHawaii
Compensation and Pension Estimated Veteran Population 117,254 Disability Compensation Recipients 16,755 Estimated Monthly Disability Compensation Costs $15,396,488Estimated Annual Disability Compensation Costs $184,757,850Disability Compensation by Age 34 and under 1,437 Disability Compensation by Age 35-54 5,190 Disability Compensation by Age 55-74 7,156 Disability Compensation by Age 75-84 1,936 Disability Compensation by Age 85 and over 1,036 Disability Pension Recipients 680Estimated Monthly Disability Pension Costs $524,297Estimated Annual Disability Pension Costs $6,291,562Disability Pension by Age under 45 13 Disability Pension by Age 45-54 58 Disability Pension by Age 55-69 438 Disability Pension by Age 70-84 124 Disability Pension by Age 85 and over 47
Education MGIB-AD Trainees 1,591MGIB-SR Trainees 377DEA Trainees 374VEAP Trainees 3REAP Trainees 176
Insurance Life Insurance Payments $15,597,368Total Face Value of Insurance $131,971,433Total Number of Policies 9,454
Loan Guaranty Number of Loans 2,242 Total Loan Amount $963,770,629
Vocational Rehabilitation and Employment Number of Applicants 586Number of Plans Developed 176Number of Entitlement Decisions 209Number of Veterans Rehabilitated through Independent Living 16Number of Veterans Rehabilitated by Obtaining Suitable Employment 110

Annual Benefits Report FY 2009E14
Appendices
Idaho
Compensation and Pension Estimated Veteran Population 137,099Disability Compensation Recipients 19,041 Estimated Monthly Disability Compensation Costs $17,022,338Estimated Annual Disability Compensation Costs $204,268,056Disability Compensation by Age 34 and under 2,052 Disability Compensation by Age 35-54 5,747 Disability Compensation by Age 55-74 8,297 Disability Compensation by Age 75-84 1,890 Disability Compensation by Age 85 and over 1,055 Disability Pension Recipients 1,388Estimated Monthly Disability Pension Costs $1,085,722Estimated Annual Disability Pension Costs $13,028,661Disability Pension by Age under 45 24 Disability Pension by Age 45-54 94 Disability Pension by Age 55-69 610 Disability Pension by Age 70-84 401 Disability Pension by Age 85 and over 259
Education MGIB-AD Trainees 1,491MGIB-SR Trainees 545DEA Trainees 376VEAP Trainees 2REAP Trainees 337
Insurance Life Insurance Payments $7,799,900Total Face Value of Insurance $65,996,007Total Number of Policies 5,847
Loan Guaranty Number of Loans 2,705 Total Loan Amount $498,038,642
Vocational Rehabilitation and Employment Number of Applicants 356Number of Plans Developed 136Number of Entitlement Decisions 200Number of Veterans Rehabilitated through Independent Living 2Number of Veterans Rehabilitated by Obtaining Suitable Employment 60

Veterans Benefits Administration Making a difference E15
AppendicesIllinois
Compensation and Pension Estimated Veteran Population 802,834 Disability Compensation Recipients 70,873 Estimated Monthly Disability Compensation Costs $60,348,547Estimated Annual Disability Compensation Costs $724,182,558Disability Compensation by Age 34 and under 8,892 Disability Compensation by Age 35-54 20,046 Disability Compensation by Age 55-74 30,493 Disability Compensation by Age 75-84 6,473 Disability Compensation by Age 85 and over 4,969 Disability Pension Recipients 9,077Estimated Monthly Disability Pension Costs $7,209,881Estimated Annual Disability Pension Costs $86,518,568Disability Pension by Age under 45 151 Disability Pension by Age 45-54 615 Disability Pension by Age 55-69 4,661 Disability Pension by Age 70-84 2,341 Disability Pension by Age 85 and over 1,309
Education MGIB-AD Trainees 15,659MGIB-SR Trainees 2,491DEA Trainees 2,025VEAP Trainees 19REAP Trainees 1,770
Insurance Life Insurance Payments $70,730,845Total Face Value of Insurance $598,463,229Total Number of Policies 47,809
Loan Guaranty Number of Loans 6,607 Total Loan Amount $1,234,091,668
Vocational Rehabilitation and Employment Number of Applicants 1,468Number of Plans Developed 528Number of Entitlement Decisions 775Number of Veterans Rehabilitated through Independent Living 12Number of Veterans Rehabilitated by Obtaining Suitable Employment 111

Annual Benefits Report FY 2009E16
Appendices
Indiana
Compensation and Pension Estimated Veteran Population 500,806 Disability Compensation Recipients 57,069 Estimated Monthly Disability Compensation Costs $44,919,401Estimated Annual Disability Compensation Costs $539,032,812Disability Compensation by Age 34 and under 5,225 Disability Compensation by Age 35-54 16,457 Disability Compensation by Age 55-74 26,291 Disability Compensation by Age 75-84 5,620 Disability Compensation by Age 85 and over 3,476 Disability Pension Recipients 4,821Estimated Monthly Disability Pension Costs $4,080,229Estimated Annual Disability Pension Costs $48,962,748Disability Pension by Age under 45 97 Disability Pension by Age 45-54 355 Disability Pension by Age 55-69 2,201 Disability Pension by Age 70-84 1,302 Disability Pension by Age 85 and over 866
Education MGIB-AD Trainees 4,001MGIB-SR Trainees 1,757DEA Trainees 1,085VEAP Trainees 8REAP Trainees 958
Insurance Life Insurance Payments $26,223,706Total Face Value of Insurance $221,882,320Total Number of Policies 18,876
Loan Guaranty Number of Loans 4,974 Total Loan Amount $731,005,725
Vocational Rehabilitation and Employment Number of Applicants 1,575Number of Plans Developed 757Number of Entitlement Decisions 1,005Number of Veterans Rehabilitated through Independent Living 78Number of Veterans Rehabilitated by Obtaining Suitable Employment 106

Veterans Benefits Administration Making a difference E17
AppendicesIowa
Compensation and Pension Estimated Veteran Population 240,317 Disability Compensation Recipients 26,454 Estimated Monthly Disability Compensation Costs $21,940,519Estimated Annual Disability Compensation Costs $263,286,228Disability Compensation by Age 34 and under 2,539 Disability Compensation by Age 35-54 6,804 Disability Compensation by Age 55-74 11,530 Disability Compensation by Age 75-84 3,477 Disability Compensation by Age 85 and over 2,104 Disability Pension Recipients 3,538Estimated Monthly Disability Pension Costs $2,941,882Estimated Annual Disability Pension Costs $35,302,580Disability Pension by Age under 45 45 Disability Pension by Age 45-54 266 Disability Pension by Age 55-69 1,388 Disability Pension by Age 70-84 1,118 Disability Pension by Age 85 and over 721
Education MGIB-AD Trainees 5,694MGIB-SR Trainees 1,568DEA Trainees 719VEAP Trainees 4REAP Trainees 1,028
Insurance Life Insurance Payments $21,447,727Total Face Value of Insurance $181,472,110Total Number of Policies 14,098
Loan Guaranty Number of Loans 1,879 Total Loan Amount $295,061,952
Vocational Rehabilitation and Employment Number of Applicants 652Number of Plans Developed 394Number of Entitlement Decisions 491Number of Veterans Rehabilitated through Independent Living 43Number of Veterans Rehabilitated by Obtaining Suitable Employment 40

Annual Benefits Report FY 2009E18
Appendices
Kansas
Compensation and Pension Estimated Veteran Population 229,145Disability Compensation Recipients 28,028 Estimated Monthly Disability Compensation Costs $23,208,320Estimated Annual Disability Compensation Costs $278,499,840Disability Compensation by Age 34 and under 2,724 Disability Compensation by Age 35-54 8,684 Disability Compensation by Age 55-74 11,986 Disability Compensation by Age 75-84 2,809 Disability Compensation by Age 85 and over 1,825 Disability Pension Recipients 2,762Estimated Monthly Disability Pension Costs $2,149,474Estimated Annual Disability Pension Costs $25,793,684Disability Pension by Age under 45 58 Disability Pension by Age 45-54 207 Disability Pension by Age 55-69 1,315 Disability Pension by Age 70-84 706 Disability Pension by Age 85 and over 476
Education MGIB-AD Trainees 2,953MGIB-SR Trainees 771DEA Trainees 654VEAP Trainees 4REAP Trainees 565
Insurance Life Insurance Payments $16,575,579Total Face Value of Insurance $140,248,215Total Number of Policies 11,682
Loan Guaranty Number of Loans 3,726 Total Loan Amount $625,678,636
Vocational Rehabilitation and Employment Number of Applicants 436Number of Plans Developed 174Number of Entitlement Decisions 233Number of Veterans Rehabilitated through Independent Living 0Number of Veterans Rehabilitated by Obtaining Suitable Employment 76

Veterans Benefits Administration Making a difference E19
AppendicesKentucky
Compensation and Pension Estimated Veteran Population 339,942 Disability Compensation Recipients 49,199 Estimated Monthly Disability Compensation Costs $52,498,019Estimated Annual Disability Compensation Costs $629,976,228Disability Compensation by Age 34 and under 4,323 Disability Compensation by Age 35-54 14,968 Disability Compensation by Age 55-74 22,566 Disability Compensation by Age 75-84 4,746 Disability Compensation by Age 85 and over 2,596 Disability Pension Recipients 5,882Estimated Monthly Disability Pension Costs $4,513,035Estimated Annual Disability Pension Costs $54,156,419Disability Pension by Age under 45 98 Disability Pension by Age 45-54 440 Disability Pension by Age 55-69 2,778 Disability Pension by Age 70-84 1,685 Disability Pension by Age 85 and over 881
Education MGIB-AD Trainees 3,075MGIB-SR Trainees 1,050DEA Trainees 1,588VEAP Trainees 6REAP Trainees 669
Insurance Life Insurance Payments $18,123,080Total Face Value of Insurance $153,341,826Total Number of Policies 13,277
Loan Guaranty Number of Loans 4,260 Total Loan Amount $697,957,434
Vocational Rehabilitation and Employment Number of Applicants 1,261Number of Plans Developed 578Number of Entitlement Decisions 695Number of Veterans Rehabilitated through Independent Living 57Number of Veterans Rehabilitated by Obtaining Suitable Employment 150

Annual Benefits Report FY 2009E20
Appendices
Louisiana
Compensation and Pension Estimated Veteran Population 312,087 Disability Compensation Recipients 41,159 Estimated Monthly Disability Compensation Costs $42,188,815Estimated Annual Disability Compensation Costs $506,265,780Disability Compensation by Age 34 and under 4,277 Disability Compensation by Age 35-54 11,770 Disability Compensation by Age 55-74 18,901 Disability Compensation by Age 75-84 4,180 Disability Compensation by Age 85 and over 2,031 Disability Pension Recipients 7,902Estimated Monthly Disability Pension Costs $6,285,634Estimated Annual Disability Pension Costs $75,427,608Disability Pension by Age under 45 153 Disability Pension by Age 45-54 525 Disability Pension by Age 55-69 3,434 Disability Pension by Age 70-84 2,380 Disability Pension by Age 85 and over 1,410
Education MGIB-AD Trainees 3,101MGIB-SR Trainees 1,360DEA Trainees 1,471VEAP Trainees 4REAP Trainees 716
Insurance Life Insurance Payments $19,799,067Total Face Value of Insurance $167,522,581Total Number of Policies 14,076
Loan Guaranty Number of Loans 3,673 Total Loan Amount $681,242,764
Vocational Rehabilitation and Employment Number of Applicants 1,084Number of Plans Developed 371Number of Entitlement Decisions 529Number of Veterans Rehabilitated through Independent Living 15Number of Veterans Rehabilitated by Obtaining Suitable Employment 107

Veterans Benefits Administration Making a difference E21
AppendicesMaine
Compensation and Pension Estimated Veteran Population 140,552Disability Compensation Recipients 22,346 Estimated Monthly Disability Compensation Costs $25,881,707Estimated Annual Disability Compensation Costs $310,580,484Disability Compensation by Age 34 and under 1,747 Disability Compensation by Age 35-54 6,202 Disability Compensation by Age 55-74 10,474 Disability Compensation by Age 75-84 2,574 Disability Compensation by Age 85 and over 1,349 Disability Pension Recipients 2,275Estimated Monthly Disability Pension Costs $1,659,137Estimated Annual Disability Pension Costs $19,909,646Disability Pension by Age under 45 65 Disability Pension by Age 45-54 173 Disability Pension by Age 55-69 1,102 Disability Pension by Age 70-84 648 Disability Pension by Age 85 and over 287
Education MGIB-AD Trainees 811MGIB-SR Trainees 274DEA Trainees 679VEAP Trainees 2REAP Trainees 154
Insurance Life Insurance Payments $9,700,974Total Face Value of Insurance $82,081,253Total Number of Policies 7,567
Loan Guaranty Number of Loans 992 Total Loan Amount $179,805,296
Vocational Rehabilitation and Employment Number of Applicants 450Number of Plans Developed 203Number of Entitlement Decisions 306Number of Veterans Rehabilitated through Independent Living 20Number of Veterans Rehabilitated by Obtaining Suitable Employment 66

Annual Benefits Report FY 2009E22
Appendices
Maryland
Compensation and Pension Estimated Veteran Population 476,202 Disability Compensation Recipients 56,221 Estimated Monthly Disability Compensation Costs $45,801,252Estimated Annual Disability Compensation Costs $549,615,018Disability Compensation by Age 34 and under 5,680 Disability Compensation by Age 35-54 21,833 Disability Compensation by Age 55-74 21,648 Disability Compensation by Age 75-84 4,296 Disability Compensation by Age 85 and over 2,764 Disability Pension Recipients 3,339Estimated Monthly Disability Pension Costs $2,643,385Estimated Annual Disability Pension Costs $31,720,618Disability Pension by Age under 45 58 Disability Pension by Age 45-54 264 Disability Pension by Age 55-69 1,599 Disability Pension by Age 70-84 948 Disability Pension by Age 85 and over 470
Education MGIB-AD Trainees 7,854MGIB-SR Trainees 649DEA Trainees 979VEAP Trainees 13REAP Trainees 590
Insurance Life Insurance Payments $35,498,262Total Face Value of Insurance $300,355,591Total Number of Policies 24,152
Loan Guaranty Number of Loans 8,716 Total Loan Amount $2,700,495,536
Vocational Rehabilitation and Employment Number of Applicants 828Number of Plans Developed 371Number of Entitlement Decisions 463Number of Veterans Rehabilitated through Independent Living 14Number of Veterans Rehabilitated by Obtaining Suitable Employment 121

Veterans Benefits Administration Making a difference E23
AppendicesMassachusetts
Compensation and Pension Estimated Veteran Population 409,184 Disability Compensation Recipients 52,460 Estimated Monthly Disability Compensation Costs $46,255,472Estimated Annual Disability Compensation Costs $555,065,664Disability Compensation by Age 34 and under 3,841 Disability Compensation by Age 35-54 9,933 Disability Compensation by Age 55-74 21,741 Disability Compensation by Age 75-84 9,974 Disability Compensation by Age 85 and over 6,971 Disability Pension Recipients 4,039Estimated Monthly Disability Pension Costs $3,073,691Estimated Annual Disability Pension Costs $36,884,297Disability Pension by Age under 45 54 Disability Pension by Age 45-54 294 Disability Pension by Age 55-69 1,746 Disability Pension by Age 70-84 1,159 Disability Pension by Age 85 and over 786
Education MGIB-AD Trainees 3,331
MGIB-SR Trainees 872DEA Trainees 1,046VEAP Trainees 10REAP Trainees 750
Insurance Life Insurance Payments $44,690,689Total Face Value of Insurance $378,133,957Total Number of Policies 35,233
Loan Guaranty Number of Loans 1,971 Total Loan Amount $507,135,704
Vocational Rehabilitation and Employment Number of Applicants 711Number of Plans Developed 230Number of Entitlement Decisions 338Number of Veterans Rehabilitated through Independent Living 3Number of Veterans Rehabilitated by Obtaining Suitable Employment 47

Annual Benefits Report FY 2009E24
Appendices
Michigan
Compensation and Pension Estimated Veteran Population 723,368 Disability Compensation Recipients 70,754 Estimated Monthly Disability Compensation Costs $64,027,364Estimated Annual Disability Compensation Costs $768,328,368Disability Compensation by Age 34 and under 5,405 Disability Compensation by Age 35-54 17,635 Disability Compensation by Age 55-74 34,083 Disability Compensation by Age 75-84 7,757 Disability Compensation by Age 85 and over 5,874 Disability Pension Recipients 9,733Estimated Monthly Disability Pension Costs $8,923,163Estimated Annual Disability Pension Costs $107,077,961Disability Pension by Age under 45 232 Disability Pension by Age 45-54 786 Disability Pension by Age 55-69 4,823 Disability Pension by Age 70-84 2,268 Disability Pension by Age 85 and over 1,624
Education MGIB-AD Trainees 5,254MGIB-SR Trainees 1,461DEA Trainees 1,715VEAP Trainees 16REAP Trainees 898
Insurance Life Insurance Payments $47,353,993Total Face Value of Insurance $400,668,526Total Number of Policies 36,181
Loan Guaranty Number of Loans 3,391 Total Loan Amount $515,625,058
Vocational Rehabilitation and Employment Number of Applicants 1,859Number of Plans Developed 940Number of Entitlement Decisions 1,171Number of Veterans Rehabilitated through Independent Living 185Number of Veterans Rehabilitated by Obtaining Suitable Employment 77

Veterans Benefits Administration Making a difference E25
AppendicesMinnesota
Compensation and Pension Estimated Veteran Population 390,576Disability Compensation Recipients 62,596 Estimated Monthly Disability Compensation Costs $50,894,996Estimated Annual Disability Compensation Costs $610,739,952Disability Compensation by Age 34 and under 5,303 Disability Compensation by Age 35-54 12,498 Disability Compensation by Age 55-74 29,440 Disability Compensation by Age 75-84 9,989 Disability Compensation by Age 85 and over 5,366 Disability Pension Recipients 4,298Estimated Monthly Disability Pension Costs $3,208,023Estimated Annual Disability Pension Costs $38,496,279Disability Pension by Age under 45 76 Disability Pension by Age 45-54 331 Disability Pension by Age 55-69 1,656 Disability Pension by Age 70-84 1,316 Disability Pension by Age 85 and over 919
Education MGIB-AD Trainees 5,185
MGIB-SR Trainees 1,895DEA Trainees 1,442VEAP Trainees 10REAP Trainees 1,259
Insurance Life Insurance Payments $36,948,674Total Face Value of Insurance $312,627,717Total Number of Policies 28,531
Loan Guaranty Number of Loans 3,250 Total Loan Amount $639,093,033
Vocational Rehabilitation and Employment Number of Applicants 1,123Number of Plans Developed 442Number of Entitlement Decisions 621Number of Veterans Rehabilitated through Independent Living 14Number of Veterans Rehabilitated by Obtaining Suitable Employment 122

Annual Benefits Report FY 2009E26
Appendices
Mississippi
Compensation and Pension Estimated Veteran Population 209,242 Disability Compensation Recipients 29,463 Estimated Monthly Disability Compensation Costs $27,790,194Estimated Annual Disability Compensation Costs $333,482,322Disability Compensation by Age 34 and under 2,172 Disability Compensation by Age 35-54 9,130 Disability Compensation by Age 55-74 13,404 Disability Compensation by Age 75-84 3,168 Disability Compensation by Age 85 and over 1,589 Disability Pension Recipients 4,905Estimated Monthly Disability Pension Costs $3,542,018Estimated Annual Disability Pension Costs $42,504,221Disability Pension by Age under 45 71 Disability Pension by Age 45-54 269 Disability Pension by Age 55-69 1,805 Disability Pension by Age 70-84 1,619 Disability Pension by Age 85 and over 1,141
Education MGIB-AD Trainees 1,605MGIB-SR Trainees 1,247DEA Trainees 787VEAP Trainees 3REAP Trainees 657
Insurance Life Insurance Payments $11,952,098Total Face Value of Insurance $101,128,315Total Number of Policies 8,746
Loan Guaranty Number of Loans 2,257 Total Loan Amount $392,784,834
Vocational Rehabilitation and Employment Number of Applicants 641Number of Plans Developed 247Number of Entitlement Decisions 271Number of Veterans Rehabilitated through Independent Living 28Number of Veterans Rehabilitated by Obtaining Suitable Employment 41

Veterans Benefits Administration Making a difference E27
AppendicesMissouri
Compensation and Pension Estimated Veteran Population 514,724 Disability Compensation Recipients 63,171 Estimated Monthly Disability Compensation Costs $56,892,187Estimated Annual Disability Compensation Costs $682,706,244Disability Compensation by Age 34 and under 5,238 Disability Compensation by Age 35-54 17,198 Disability Compensation by Age 55-74 29,407 Disability Compensation by Age 75-84 7,252 Disability Compensation by Age 85 and over 4,076 Disability Pension Recipients 8,204Estimated Monthly Disability Pension Costs $7,173,451Estimated Annual Disability Pension Costs $86,081,411Disability Pension by Age under 45 106 Disability Pension by Age 45-54 562 Disability Pension by Age 55-69 3,489 Disability Pension by Age 70-84 2,466 Disability Pension by Age 85 and over 1,581
Education MGIB-AD Trainees 8,909MGIB-SR Trainees 1,797DEA Trainees 1,460VEAP Trainees 12REAP Trainees 1,784
Insurance Life Insurance Payments $33,034,989Total Face Value of Insurance $279,513,506Total Number of Policies 24,023
Loan Guaranty Number of Loans 6,548 Total Loan Amount $1,084,984,538
Vocational Rehabilitation and Employment Number of Applicants 1,436Number of Plans Developed 520Number of Entitlement Decisions 713Number of Veterans Rehabilitated through Independent Living 44Number of Veterans Rehabilitated by Obtaining Suitable Employment 160

Annual Benefits Report FY 2009E28
Appendices
Montana
Compensation and Pension Estimated Veteran Population 102,986 Disability Compensation Recipients 17,026 Estimated Monthly Disability Compensation Costs $15,940,665Estimated Annual Disability Compensation Costs $191,287,980Disability Compensation by Age 34 and under 2,025 Disability Compensation by Age 35-54 4,723 Disability Compensation by Age 55-74 7,792 Disability Compensation by Age 75-84 1,620 Disability Compensation by Age 85 and over 866 Disability Pension Recipients 1,609Estimated Monthly Disability Pension Costs $1,260,085Estimated Annual Disability Pension Costs $15,121,022Disability Pension by Age under 45 24 Disability Pension by Age 45-54 125 Disability Pension by Age 55-69 760 Disability Pension by Age 70-84 431 Disability Pension by Age 85 and over 269
Education MGIB-AD Trainees 979MGIB-SR Trainees 338DEA Trainees 312VEAP Trainees 2REAP Trainees 164
Insurance Life Insurance Payments $7,132,068Total Face Value of Insurance $60,345,390Total Number of Policies 5,121
Loan Guaranty Number of Loans 1,682 Total Loan Amount $320,242,935
Vocational Rehabilitation and Employment Number of Applicants 526Number of Plans Developed 307Number of Entitlement Decisions 357Number of Veterans Rehabilitated through Independent Living 9Number of Veterans Rehabilitated by Obtaining Suitable Employment 66

Veterans Benefits Administration Making a difference E29
AppendicesNebraska
Compensation and Pension Estimated Veteran Population 147,928Disability Compensation Recipients 32,407 Estimated Monthly Disability Compensation Costs $26,215,407Estimated Annual Disability Compensation Costs $314,584,884Disability Compensation by Age 34 and under 2,678 Disability Compensation by Age 35-54 7,990 Disability Compensation by Age 55-74 13,950 Disability Compensation by Age 75-84 5,495 Disability Compensation by Age 85 and over 2,294 Disability Pension Recipients 1,693Estimated Monthly Disability Pension Costs $1,423,840Estimated Annual Disability Pension Costs $17,086,077Disability Pension by Age under 45 33 Disability Pension by Age 45-54 126 Disability Pension by Age 55-69 772 Disability Pension by Age 70-84 480 Disability Pension by Age 85 and over 282
Education MGIB-AD Trainees 3,145MGIB-SR Trainees 799DEA Trainees 806VEAP Trainees 4REAP Trainees 662
Insurance Life Insurance Payments $13,156,293Total Face Value of Insurance $111,317,169Total Number of Policies 9,070
Loan Guaranty Number of Loans 3,001 Total Loan Amount $508,465,588
Vocational Rehabilitation and Employment Number of Applicants 533Number of Plans Developed 305Number of Entitlement Decisions 414Number of Veterans Rehabilitated through Independent Living 36Number of Veterans Rehabilitated by Obtaining Suitable Employment 66

Annual Benefits Report FY 2009E30
Appendices
Nevada
Compensation and Pension Estimated Veteran Population 245,064 Disability Compensation Recipients 29,992 Estimated Monthly Disability Compensation Costs $27,034,328Estimated Annual Disability Compensation Costs $324,411,936Disability Compensation by Age 34 and under 2,882 Disability Compensation by Age 35-54 9,092 Disability Compensation by Age 55-74 13,804 Disability Compensation by Age 75-84 2,953 Disability Compensation by Age 85 and over 1,261 Disability Pension Recipients 2,955Estimated Monthly Disability Pension Costs $2,281,526Estimated Annual Disability Pension Costs $27,378,306Disability Pension by Age under 45 49 Disability Pension by Age 45-54 219 Disability Pension by Age 55-69 1,516 Disability Pension by Age 70-84 825 Disability Pension by Age 85 and over 346
Education MGIB-AD Trainees 2,647MGIB-SR Trainees 353DEA Trainees 550VEAP Trainees 2REAP Trainees 176
Insurance Life Insurance Payments $11,827,352Total Face Value of Insurance $100,072,823Total Number of Policies 9,105
Loan Guaranty Number of Loans 5,830 Total Loan Amount $1,271,690,115
Vocational Rehabilitation and Employment Number of Applicants 634Number of Plans Developed 244Number of Entitlement Decisions 390Number of Veterans Rehabilitated through Independent Living 9Number of Veterans Rehabilitated by Obtaining Suitable Employment 92

Veterans Benefits Administration Making a difference E31
AppendicesNew Hampshire
Compensation and Pension Estimated Veteran Population 129,629 Disability Compensation Recipients 15,247 Estimated Monthly Disability Compensation Costs $13,064,241Estimated Annual Disability Compensation Costs $156,770,892Disability Compensation by Age 34 and under 1,237 Disability Compensation by Age 35-54 4,212 Disability Compensation by Age 55-74 6,897 Disability Compensation by Age 75-84 1,897 Disability Compensation by Age 85 and over 1,004 Disability Pension Recipients 910Estimated Monthly Disability Pension Costs $772,335Estimated Annual Disability Pension Costs $9,268,024Disability Pension by Age under 45 7 Disability Pension by Age 45-54 46 Disability Pension by Age 55-69 337 Disability Pension by Age 70-84 286 Disability Pension by Age 85 and over 234
Education MGIB-AD Trainees 706MGIB-SR Trainees 231DEA Trainees 263VEAP Trainees 2REAP Trainees 124
Insurance Life Insurance Payments $9,184,044Total Face Value of Insurance $77,707,434Total Number of Policies 6,912
Loan Guaranty Number of Loans 1,134 Total Loan Amount $264,007,845
Vocational Rehabilitation and Employment Number of Applicants 301Number of Plans Developed 127Number of Entitlement Decisions 152Number of Veterans Rehabilitated through Independent Living 2Number of Veterans Rehabilitated by Obtaining Suitable Employment 31

Annual Benefits Report FY 2009E32
Appendices
New Jersey
Compensation and Pension Estimated Veteran Population 463,720 Disability Compensation Recipients 48,502 Estimated Monthly Disability Compensation Costs $44,274,545Estimated Annual Disability Compensation Costs $531,294,544Disability Compensation by Age 34 and under 3,841 Disability Compensation by Age 35-54 9,714 Disability Compensation by Age 55-74 21,037 Disability Compensation by Age 75-84 7,752 Disability Compensation by Age 85 and over 6,158 Disability Pension Recipients 3,067Estimated Monthly Disability Pension Costs $2,562,626Estimated Annual Disability Pension Costs $30,751,516Disability Pension by Age under 45 37 Disability Pension by Age 45-54 173 Disability Pension by Age 55-69 1,195 Disability Pension by Age 70-84 939 Disability Pension by Age 85 and over 723
Education MGIB-AD Trainees 3,473MGIB-SR Trainees 754DEA Trainees 833VEAP Trainees 8REAP Trainees 443
Insurance Life Insurance Payments $57,949,443Total Face Value of Insurance $490,318,059Total Number of Policies 41,922
Loan Guaranty Number of Loans 2,338 Total Loan Amount $606,472,607
Vocational Rehabilitation and Employment Number of Applicants 876Number of Plans Developed 358Number of Entitlement Decisions 414Number of Veterans Rehabilitated through Independent Living 67Number of Veterans Rehabilitated by Obtaining Suitable Employment 82

Veterans Benefits Administration Making a difference E33
AppendicesNew Mexico
Compensation and Pension Estimated Veteran Population 176,566 Disability Compensation Recipients 29,536 Estimated Monthly Disability Compensation Costs $36,083,965Estimated Annual Disability Compensation Costs $433,007,580Disability Compensation by Age 34 and under 2,239 Disability Compensation by Age 35-54 7,997 Disability Compensation by Age 55-74 14,545 Disability Compensation by Age 75-84 3,124 Disability Compensation by Age 85 and over 1,631 Disability Pension Recipients 2,649Estimated Monthly Disability Pension Costs $2,013,275Estimated Annual Disability Pension Costs $24,159,306Disability Pension by Age under 45 71 Disability Pension by Age 45-54 208 Disability Pension by Age 55-69 1,278 Disability Pension by Age 70-84 730 Disability Pension by Age 85 and over 362
Education MGIB-AD Trainees 2,623MGIB-SR Trainees 415DEA Trainees 1,304VEAP Trainees 4REAP Trainees 205
Insurance Life Insurance Payments $13,657,627Total Face Value of Insurance $115,559,025Total Number of Policies 9,978
Loan Guaranty Number of Loans 3,865 Total Loan Amount $752,118,616
Vocational Rehabilitation and Employment Number of Applicants 724Number of Plans Developed 228Number of Entitlement Decisions 371Number of Veterans Rehabilitated through Independent Living 53Number of Veterans Rehabilitated by Obtaining Suitable Employment 103

Annual Benefits Report FY 2009E34
Appendices
New York
Compensation and Pension Estimated Veteran Population 988,217 Disability Compensation Recipients 106,012 Estimated Monthly Disability Compensation Costs $93,393,252Estimated Annual Disability Compensation Costs $1,120,719,024Disability Compensation by Age 34 and under 10,194 Disability Compensation by Age 35-54 23,450 Disability Compensation by Age 55-74 46,870 Disability Compensation by Age 75-84 14,086 Disability Compensation by Age 85 and over 11,412 Disability Pension Recipients 13,952Estimated Monthly Disability Pension Costs $10,161,051Estimated Annual Disability Pension Costs $121,932,615Disability Pension by Age under 45 240 Disability Pension by Age 45-54 993 Disability Pension by Age 55-69 5,994 Disability Pension by Age 70-84 4,043 Disability Pension by Age 85 and over 2,682
Education MGIB-AD Trainees 8,795MGIB-SR Trainees 1,695DEA Trainees 2,319VEAP Trainees 22REAP Trainees 1,136
Insurance Life Insurance Payments $108,538,762Total Face Value of Insurance $918,361,119Total Number of Policies 78,322
Loan Guaranty Number of Loans 3,477 Total Loan Amount $633,264,936
Vocational Rehabilitation and Employment Number of Applicants 2,478Number of Plans Developed 1,158Number of Entitlement Decisions 1,488Number of Veterans Rehabilitated through Independent Living 225Number of Veterans Rehabilitated by Obtaining Suitable Employment 93

Veterans Benefits Administration Making a difference E35
AppendicesNorth Carolina
Compensation and Pension Estimated Veteran Population 770,080 Disability Compensation Recipients 122,226 Estimated Monthly Disability Compensation Costs $121,069,631Estimated Annual Disability Compensation Costs $1,452,835,572Disability Compensation by Age 34 and under 11,610 Disability Compensation by Age 35-54 43,093 Disability Compensation by Age 55-74 53,132 Disability Compensation by Age 75-84 10,075 Disability Compensation by Age 85 and over 4,316 Disability Pension Recipients 9,422Estimated Monthly Disability Pension Costs $6,648,389Estimated Annual Disability Pension Costs $79,780,665Disability Pension by Age under 45 143 Disability Pension by Age 45-54 609 Disability Pension by Age 55-69 3,793 Disability Pension by Age 70-84 2,904 Disability Pension by Age 85 and over 1,973
Education MGIB-AD Trainees 9,785MGIB-SR Trainees 1,327DEA Trainees 3,861VEAP Trainees 12REAP Trainees 745
Insurance Life Insurance Payments $48,781,560Total Face Value of Insurance $412,747,361Total Number of Policies 34,623
Loan Guaranty Number of Loans 20,548 Total Loan Amount $3,714,371,723
Vocational Rehabilitation and Employment Number of Applicants 2,975Number of Plans Developed 576Number of Entitlement Decisions 875Number of Veterans Rehabilitated through Independent Living 21Number of Veterans Rehabilitated by Obtaining Suitable Employment 214

Annual Benefits Report FY 2009E36
Appendices
North Dakota
Compensation and Pension Estimated Veteran Population 57,074 Disability Compensation Recipients 9,444 Estimated Monthly Disability Compensation Costs $7,502,137Estimated Annual Disability Compensation Costs $90,025,644Disability Compensation by Age 34 and under 1,066 Disability Compensation by Age 35-54 2,638 Disability Compensation by Age 55-74 4,075 Disability Compensation by Age 75-84 1,087 Disability Compensation by Age 85 and over 578 Disability Pension Recipients 892Estimated Monthly Disability Pension Costs $611,477Estimated Annual Disability Pension Costs $7,337,719Disability Pension by Age under 45 10 Disability Pension by Age 45-54 52 Disability Pension by Age 55-69 340 Disability Pension by Age 70-84 307 Disability Pension by Age 85 and over 183
Education MGIB-AD Trainees 679MGIB-SR Trainees 526DEA Trainees 250VEAP Trainees 2REAP Trainees 321
Insurance Life Insurance Payments $4,383,890Total Face Value of Insurance $37,092,688Total Number of Policies 3,288
Loan Guaranty Number of Loans 930 Total Loan Amount $147,753,119
Vocational Rehabilitation and Employment Number of Applicants 226Number of Plans Developed 153Number of Entitlement Decisions 219Number of Veterans Rehabilitated through Independent Living 19Number of Veterans Rehabilitated by Obtaining Suitable Employment 53

Veterans Benefits Administration Making a difference E37
AppendicesOhio
Compensation and Pension Estimated Veteran Population 913,296 Disability Compensation Recipients 92,465 Estimated Monthly Disability Compensation Costs $75,750,213Estimated Annual Disability Compensation Costs $909,002,556Disability Compensation by Age 34 and under 8,488 Disability Compensation by Age 35-54 26,102 Disability Compensation by Age 55-74 41,484 Disability Compensation by Age 75-84 9,556 Disability Compensation by Age 85 and over 6,835 Disability Pension Recipients 15,614Estimated Monthly Disability Pension Costs $13,611,998Estimated Annual Disability Pension Costs $163,343,980Disability Pension by Age under 45 408 Disability Pension by Age 45-54 1,403 Disability Pension by Age 55-69 8,260 Disability Pension by Age 70-84 3,324 Disability Pension by Age 85 and over 2,219
Education MGIB-AD Trainees 7,250MGIB-SR Trainees 2,673DEA Trainees 1,781VEAP Trainees 18REAP Trainees 1,592
Insurance Life Insurance Payments $61,876,130Total Face Value of Insurance $523,542,287Total Number of Policies 46,305
Loan Guaranty Number of Loans 8,248 Total Loan Amount $1,315,314,391
Vocational Rehabilitation and Employment Number of Applicants 2,055Number of Plans Developed 813Number of Entitlement Decisions 1,008Number of Veterans Rehabilitated through Independent Living 61Number of Veterans Rehabilitated by Obtaining Suitable Employment 86

Annual Benefits Report FY 2009E38
Appendices
Oklahoma
Compensation and Pension Estimated Veteran Population 329,601 Disability Compensation Recipients 63,741 Estimated Monthly Disability Compensation Costs $74,193,812Estimated Annual Disability Compensation Costs $890,325,744Disability Compensation by Age 34 and under 5,732 Disability Compensation by Age 35-54 16,779 Disability Compensation by Age 55-74 30,923 Disability Compensation by Age 75-84 7,130 Disability Compensation by Age 85 and over 3,177 Disability Pension Recipients 6,522Estimated Monthly Disability Pension Costs $6,214,902Estimated Annual Disability Pension Costs $74,578,827Disability Pension by Age under 45 111 Disability Pension by Age 45-54 480 Disability Pension by Age 55-69 3,218 Disability Pension by Age 70-84 1,783 Disability Pension by Age 85 and over 930
Education MGIB-AD Trainees 4,765MGIB-SR Trainees 1,251DEA Trainees 2,160VEAP Trainees 6REAP Trainees 1,024
Insurance Life Insurance Payments $20,759,348Total Face Value of Insurance $175,647,645Total Number of Policies 15,668
Loan Guaranty Number of Loans 5,878 Total Loan Amount $939,632,879
Vocational Rehabilitation and Employment Number of Applicants 1,559Number of Plans Developed 581Number of Entitlement Decisions 723Number of Veterans Rehabilitated through Independent Living 21Number of Veterans Rehabilitated by Obtaining Suitable Employment 217

Veterans Benefits Administration Making a difference E39
AppendicesOregon
Compensation and Pension Estimated Veteran Population 340,020 Disability Compensation Recipients 46,688 Estimated Monthly Disability Compensation Costs $51,063,086Estimated Annual Disability Compensation Costs $612,757,026Disability Compensation by Age 34 and under 4,979 Disability Compensation by Age 35-54 12,054 Disability Compensation by Age 55-74 22,125 Disability Compensation by Age 75-84 4,601 Disability Compensation by Age 85 and over 2,929 Disability Pension Recipients 5,530Estimated Monthly Disability Pension Costs $4,708,674Estimated Annual Disability Pension Costs $56,504,086Disability Pension by Age under 45 104 Disability Pension by Age 45-54 491 Disability Pension by Age 55-69 3,010 Disability Pension by Age 70-84 1,220 Disability Pension by Age 85 and over 705
Education MGIB-AD Trainees 3,623MGIB-SR Trainees 664DEA Trainees 1,241VEAP Trainees 7REAP Trainees 335
Insurance Life Insurance Payments $22,568,647Total Face Value of Insurance $190,956,368Total Number of Policies 16,492
Loan Guaranty Number of Loans 4,172 Total Loan Amount $929,550,345
Vocational Rehabilitation and Employment Number of Applicants 1,866Number of Plans Developed 658Number of Entitlement Decisions 1,142Number of Veterans Rehabilitated through Independent Living 12Number of Veterans Rehabilitated by Obtaining Suitable Employment 234

Annual Benefits Report FY 2009E40
Appendices
Pennsylvania
Compensation and Pension Estimated Veteran Population 995,135 Disability Compensation Recipients 94,917 Estimated Monthly Disability Compensation Costs $84,371,686Estimated Annual Disability Compensation Costs $1,012,460,236Disability Compensation by Age 34 and under 8,152 Disability Compensation by Age 35-54 23,051 Disability Compensation by Age 55-74 42,656 Disability Compensation by Age 75-84 11,815 Disability Compensation by Age 85 and over 9,243 Disability Pension Recipients 14,255Estimated Monthly Disability Pension Costs $12,690,653Estimated Annual Disability Pension Costs $152,287,830Disability Pension by Age under 45 247 Disability Pension by Age 45-54 881 Disability Pension by Age 55-69 5,845 Disability Pension by Age 70-84 4,030 Disability Pension by Age 85 and over 3,252
Education MGIB-AD Trainees 7,660MGIB-SR Trainees 2,009DEA Trainees 2,025VEAP Trainees 18REAP Trainees 1,299
Insurance Life Insurance Payments $88,161,335Total Face Value of Insurance $745,944,959Total Number of Policies 67,675
Loan Guaranty Number of Loans 6,283 Total Loan Amount $1,199,940,385
Vocational Rehabilitation and Employment Number of Applicants 1,895Number of Plans Developed 749Number of Entitlement Decisions 1,030Number of Veterans Rehabilitated through Independent Living 28Number of Veterans Rehabilitated by Obtaining Suitable Employment 279

Veterans Benefits Administration Making a difference E41
AppendicesRhode Island
Compensation and Pension Estimated Veteran Population 73,957 Disability Compensation Recipients 9,802 Estimated Monthly Disability Compensation Costs $9,123,982Estimated Annual Disability Compensation Costs $109,487,784Disability Compensation by Age 34 and under 667 Disability Compensation by Age 35-54 2,262 Disability Compensation by Age 55-74 4,228 Disability Compensation by Age 75-84 1,433 Disability Compensation by Age 85 and over 1,212 Disability Pension Recipients 962Estimated Monthly Disability Pension Costs $836,908Estimated Annual Disability Pension Costs $10,042,900Disability Pension by Age under 45 11 Disability Pension by Age 45-54 59 Disability Pension by Age 55-69 395 Disability Pension by Age 70-84 271 Disability Pension by Age 85 and over 226
Education MGIB-AD Trainees 555MGIB-SR Trainees 203DEA Trainees 226VEAP Trainees 2REAP Trainees 189
Insurance Life Insurance Payments $6,933,485Total Face Value of Insurance $58,665,151Total Number of Policies 5,644
Loan Guaranty Number of Loans 492 Total Loan Amount $117,135,205
Vocational Rehabilitation and Employment Number of Applicants 268Number of Plans Developed 94Number of Entitlement Decisions 116Number of Veterans Rehabilitated through Independent Living 17Number of Veterans Rehabilitated by Obtaining Suitable Employment 12

Annual Benefits Report FY 2009E42
Appendices
South Carolina
Compensation and Pension Estimated Veteran Population 408,747 Disability Compensation Recipients 62,829 Estimated Monthly Disability Compensation Costs $63,910,998Estimated Annual Disability Compensation Costs $766,931,976Disability Compensation by Age 34 and under 5,670 Disability Compensation by Age 35-54 20,910 Disability Compensation by Age 55-74 28,649 Disability Compensation by Age 75-84 5,453 Disability Compensation by Age 85 and over 2,147 Disability Pension Recipients 6,710Estimated Monthly Disability Pension Costs $5,598,049Estimated Annual Disability Pension Costs $67,176,592Disability Pension by Age under 45 99 Disability Pension by Age 45-54 371 Disability Pension by Age 55-69 2,743 Disability Pension by Age 70-84 2,066 Disability Pension by Age 85 and over 1,431
Education MGIB-AD Trainees 3,966MGIB-SR Trainees 1,343DEA Trainees 1,867VEAP Trainees 7REAP Trainees 689
Insurance Life Insurance Payments $26,895,190Total Face Value of Insurance $227,563,833Total Number of Policies 19,822
Loan Guaranty Number of Loans 7,639 Total Loan Amount $1,421,020,167
Vocational Rehabilitation and Employment Number of Applicants 1,918Number of Plans Developed 728Number of Entitlement Decisions 1,048Number of Veterans Rehabilitated through Independent Living 33Number of Veterans Rehabilitated by Obtaining Suitable Employment 233

Veterans Benefits Administration Making a difference E43
AppendicesSouth Dakota
Compensation and Pension Estimated Veteran Population 72,704 Disability Compensation Recipients 11,937 Estimated Monthly Disability Compensation Costs $10,897,553Estimated Annual Disability Compensation Costs $130,770,636Disability Compensation by Age 34 and under 1,362 Disability Compensation by Age 35-54 3,564 Disability Compensation by Age 55-74 5,277 Disability Compensation by Age 75-84 1,146 Disability Compensation by Age 85 and over 588 Disability Pension Recipients 1,514Estimated Monthly Disability Pension Costs $1,112,107Estimated Annual Disability Pension Costs $13,345,285Disability Pension by Age under 45 25 Disability Pension by Age 45-54 77 Disability Pension by Age 55-69 589 Disability Pension by Age 70-84 543 Disability Pension by Age 85 and over 280
Education MGIB-AD Trainees 783MGIB-SR Trainees 634DEA Trainees 266VEAP Trainees 2REAP Trainees 307
Insurance Life Insurance Payments $5,825,945Total Face Value of Insurance $49,294,108Total Number of Policies 4,221
Loan Guaranty Number of Loans 1,248 Total Loan Amount $219,064,544
Vocational Rehabilitation and Employment Number of Applicants 312Number of Plans Developed 230Number of Entitlement Decisions 249Number of Veterans Rehabilitated through Independent Living 23Number of Veterans Rehabilitated by Obtaining Suitable Employment 74

Annual Benefits Report FY 2009E44
Appendices
Tennessee
Compensation and Pension Estimated Veteran Population 501,907 Disability Compensation Recipients 71,396 Estimated Monthly Disability Compensation Costs $66,771,434Estimated Annual Disability Compensation Costs $801,257,202Disability Compensation by Age 34 and under 6,163 Disability Compensation by Age 35-54 23,618 Disability Compensation by Age 55-74 32,726 Disability Compensation by Age 75-84 5,934 Disability Compensation by Age 85 and over 2,955 Disability Pension Recipients 8,781Estimated Monthly Disability Pension Costs $6,780,448Estimated Annual Disability Pension Costs $81,365,373Disability Pension by Age under 45 122 Disability Pension by Age 45-54 618 Disability Pension by Age 55-69 4,033 Disability Pension by Age 70-84 2,469 Disability Pension by Age 85 and over 1,539
Education MGIB-AD Trainees 4,987MGIB-SR Trainees 1,368DEA Trainees 1,680VEAP Trainees 8REAP Trainees 714
Insurance Life Insurance Payments $27,296,767Total Face Value of Insurance $230,961,631Total Number of Policies 19,682
Loan Guaranty Number of Loans 8,752 Total Loan Amount $1,506,041,649
Vocational Rehabilitation and Employment Number of Applicants 1,714Number of Plans Developed 663Number of Entitlement Decisions 801Number of Veterans Rehabilitated through Independent Living 22Number of Veterans Rehabilitated by Obtaining Suitable Employment 217

Veterans Benefits Administration Making a difference E45
AppendicesTexas
Compensation and Pension Estimated Veteran Population 1,701,675 Disability Compensation Recipients 272,109 Estimated Monthly Disability Compensation Costs $268,466,867Estimated Annual Disability Compensation Costs $3,221,602,400Disability Compensation by Age 34 and under 30,990 Disability Compensation by Age 35-54 86,651 Disability Compensation by Age 55-74 117,682 Disability Compensation by Age 75-84 25,121 Disability Compensation by Age 85 and over 11,665 Disability Pension Recipients 25,210Estimated Monthly Disability Pension Costs $20,813,649Estimated Annual Disability Pension Costs $249,763,787Disability Pension by Age under 45 611 Disability Pension by Age 45-54 2,029 Disability Pension by Age 55-69 12,024 Disability Pension by Age 70-84 6,583 Disability Pension by Age 85 and over 3,963
Education MGIB-AD Trainees 27,894MGIB-SR Trainees 3,101DEA Trainees 7,392VEAP Trainees 28REAP Trainees 1,987
Insurance Life Insurance Payments $104,331,628Total Face Value of Insurance $882,763,988Total Number of Policies 75,287
Loan Guaranty Number of Loans 32,415 Total Loan Amount $5,588,794,145
Vocational Rehabilitation and Employment Number of Applicants 8,778Number of Plans Developed 3,624Number of Entitlement Decisions 4,780Number of Veterans Rehabilitated through Independent Living 216Number of Veterans Rehabilitated by Obtaining Suitable Employment 1,141
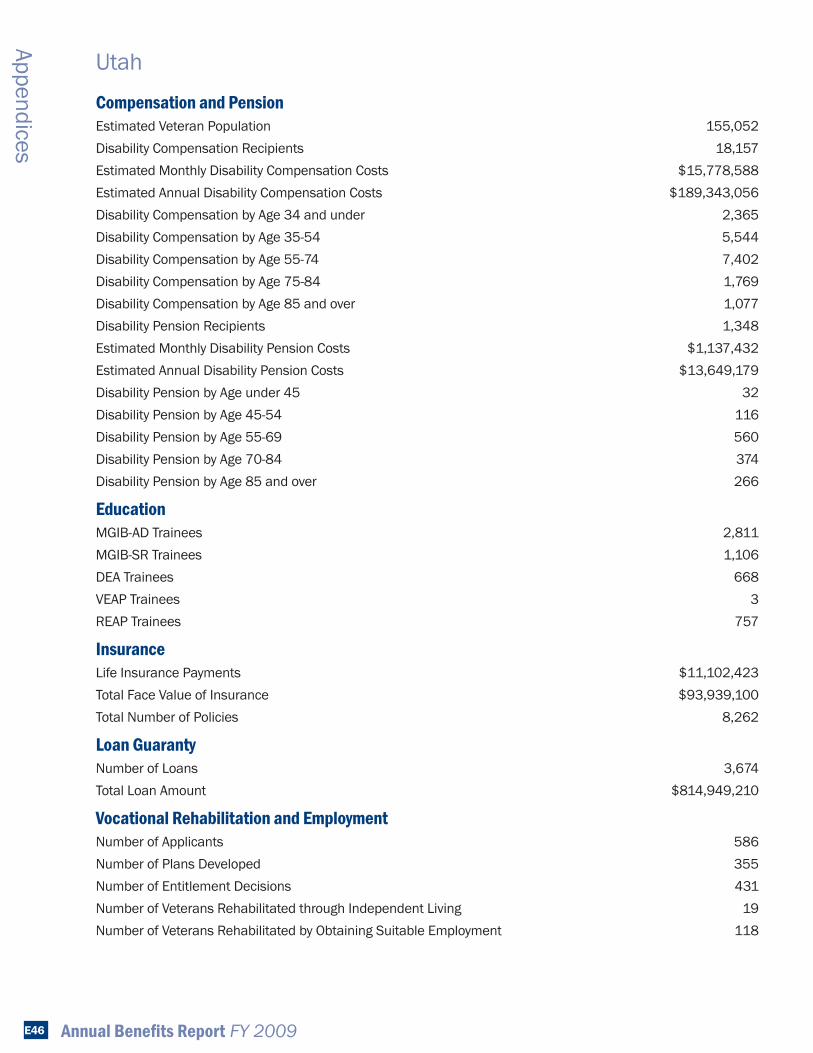
Annual Benefits Report FY 2009E46
Appendices
Utah
Compensation and Pension Estimated Veteran Population 155,052 Disability Compensation Recipients 18,157 Estimated Monthly Disability Compensation Costs $15,778,588Estimated Annual Disability Compensation Costs $189,343,056Disability Compensation by Age 34 and under 2,365 Disability Compensation by Age 35-54 5,544 Disability Compensation by Age 55-74 7,402 Disability Compensation by Age 75-84 1,769 Disability Compensation by Age 85 and over 1,077 Disability Pension Recipients 1,348Estimated Monthly Disability Pension Costs $1,137,432Estimated Annual Disability Pension Costs $13,649,179Disability Pension by Age under 45 32 Disability Pension by Age 45-54 116 Disability Pension by Age 55-69 560 Disability Pension by Age 70-84 374 Disability Pension by Age 85 and over 266
Education MGIB-AD Trainees 2,811MGIB-SR Trainees 1,106DEA Trainees 668VEAP Trainees 3REAP Trainees 757
Insurance Life Insurance Payments $11,102,423Total Face Value of Insurance $93,939,100Total Number of Policies 8,262
Loan Guaranty Number of Loans 3,674 Total Loan Amount $814,949,210
Vocational Rehabilitation and Employment Number of Applicants 586Number of Plans Developed 355Number of Entitlement Decisions 431Number of Veterans Rehabilitated through Independent Living 19Number of Veterans Rehabilitated by Obtaining Suitable Employment 118

Veterans Benefits Administration Making a difference E47
AppendicesVermont
Compensation and Pension Estimated Veteran Population 53,222 Disability Compensation Recipients 6,127 Estimated Monthly Disability Compensation Costs $5,968,526Estimated Annual Disability Compensation Costs $71,622,312Disability Compensation by Age 34 and under 450 Disability Compensation by Age 35-54 1,672 Disability Compensation by Age 55-74 2,844 Disability Compensation by Age 75-84 704 Disability Compensation by Age 85 and over 457 Disability Pension Recipients 469Estimated Monthly Disability Pension Costs $307,484Estimated Annual Disability Pension Costs $3,689,806Disability Pension by Age under 45 6 Disability Pension by Age 45-54 28 Disability Pension by Age 55-69 235 Disability Pension by Age 70-84 129 Disability Pension by Age 85 and over 71
Education MGIB-AD Trainees 435MGIB-SR Trainees 120DEA Trainees 121VEAP Trainees 1REAP Trainees 91
Insurance Life Insurance Payments $3,889,504Total Face Value of Insurance $32,909,619Total Number of Policies 2,881
Loan Guaranty Number of Loans 278 Total Loan Amount $57,014,825
Vocational Rehabilitation and Employment Number of Applicants 147Number of Plans Developed 88Number of Entitlement Decisions 107Number of Veterans Rehabilitated through Independent Living 3Number of Veterans Rehabilitated by Obtaining Suitable Employment 2

Annual Benefits Report FY 2009E48
Appendices
Virginia
Compensation and Pension Estimated Veteran Population 819,490 Disability Compensation Recipients 124,397 Estimated Monthly Disability Compensation Costs $102,659,853Estimated Annual Disability Compensation Costs $1,231,918,236Disability Compensation by Age 34 and under 11,378 Disability Compensation by Age 35‑54 52,485 Disability Compensation by Age 55‑74 47,878 Disability Compensation by Age 75‑84 8,628 Disability Compensation by Age 85 and over 4,028 Disability Pension Recipients 5,709Estimated Monthly Disability Pension Costs $4,150,286Estimated Annual Disability Pension Costs $49,803,437Disability Pension by Age under 45 102 Disability Pension by Age 45‑54 405 Disability Pension by Age 55‑69 2,535 Disability Pension by Age 70‑84 1,674 Disability Pension by Age 85 and over 993
Education MGIB‑AD Trainees 15,030MGIB‑SR Trainees 1,358DEA Trainees 2,880VEAP Trainees 16REAP Trainees 1,257
Insurance Life Insurance Payments $50,400,675Total Face Value of Insurance $426,446,918TotalNumberofPolicies 34,491
Loan Guaranty NumberofLoans 26,545 Total Loan Amount $7,488,097,749
Vocational Rehabilitation and Employment NumberofApplicants 2,712NumberofPlansDeveloped 611NumberofEntitlementDecisions 881NumberofVeteransRehabilitatedthroughIndependentLiving 4NumberofVeteransRehabilitatedbyObtainingSuitableEmployment 180

Veterans Benefits Administration Making a difference E49
AppendicesWashington
Compensation and Pension Estimated Veteran Population 637,019 Disability Compensation Recipients 95,325 Estimated Monthly Disability Compensation Costs $86,288,059Estimated Annual Disability Compensation Costs $1,035,456,703Disability Compensation by Age 34 and under 10,288 Disability Compensation by Age 35-54 33,079 Disability Compensation by Age 55-74 40,257 Disability Compensation by Age 75-84 7,607 Disability Compensation by Age 85 and over 4,094 Disability Pension Recipients 5,193Estimated Monthly Disability Pension Costs $4,229,514Estimated Annual Disability Pension Costs $50,754,171Disability Pension by Age under 45 139 Disability Pension by Age 45-54 464 Disability Pension by Age 55-69 2,723 Disability Pension by Age 70-84 1,162 Disability Pension by Age 85 and over 705
Education MGIB-AD Trainees 7,969MGIB-SR Trainees 769DEA Trainees 2,192VEAP Trainees 13REAP Trainees 549
Insurance Life Insurance Payments $37,759,342Total Face Value of Insurance $319,486,891Total Number of Policies 27,701
Loan Guaranty Number of Loans 14,899 Total Loan Amount $3,706,693,678
Vocational Rehabilitation and Employment Number of Applicants 2,426Number of Plans Developed 755Number of Entitlement Decisions 1,066Number of Veterans Rehabilitated through Independent Living 28Number of Veterans Rehabilitated by Obtaining Suitable Employment 251

Annual Benefits Report FY 2009E50
Appendices
West Virginia
Compensation and Pension Estimated Veteran Population 170,783 Disability Compensation Recipients 25,496 Estimated Monthly Disability Compensation Costs $30,405,356Estimated Annual Disability Compensation Costs $364,864,272Disability Compensation by Age 34 and under 2,173 Disability Compensation by Age 35‑54 6,435 Disability Compensation by Age 55‑74 13,114 Disability Compensation by Age 75‑84 2,421 Disability Compensation by Age 85 and over 1,353 Disability Pension Recipients 3,715Estimated Monthly Disability Pension Costs $2,917,325Estimated Annual Disability Pension Costs $35,007,895Disability Pension by Age under 45 63 Disability Pension by Age 45‑54 274 Disability Pension by Age 55‑69 1,955 Disability Pension by Age 70‑84 1,021 Disability Pension by Age 85 and over 402
Education MGIB‑AD Trainees 6,040MGIB‑SR Trainees 896DEA Trainees 724VEAP Trainees 2REAP Trainees 1,178
Insurance Life Insurance Payments $10,282,164Total Face Value of Insurance $86,998,782TotalNumberofPolicies 7,701
Loan Guaranty NumberofLoans 1,152 Total Loan Amount $217,348,972
Vocational Rehabilitation and Employment NumberofApplicants 593NumberofPlansDeveloped 280NumberofEntitlementDecisions 340NumberofVeteransRehabilitatedthroughIndependentLiving 8NumberofVeteransRehabilitatedbyObtainingSuitableEmployment 64

Veterans Benefits Administration Making a difference E51
AppendicesWisconsin
Compensation and Pension Estimated Veteran Population 427,527 Disability Compensation Recipients 52,013 Estimated Monthly Disability Compensation Costs $47,186,713Estimated Annual Disability Compensation Costs $566,240,556Disability Compensation by Age 34 and under 5,890 Disability Compensation by Age 35-54 13,962 Disability Compensation by Age 55-74 22,990 Disability Compensation by Age 75-84 5,763 Disability Compensation by Age 85 and over 3,408 Disability Pension Recipients 5,555Estimated Monthly Disability Pension Costs $4,676,883Estimated Annual Disability Pension Costs $56,122,601Disability Pension by Age under 45 110 Disability Pension by Age 45-54 454 Disability Pension by Age 55-69 2,429 Disability Pension by Age 70-84 1,463 Disability Pension by Age 85 and over 1,099
Education MGIB-AD Trainees 4,156MGIB-SR Trainees 1,547DEA Trainees 1,281VEAP Trainees 8REAP Trainees 1,089
Insurance Life Insurance Payments $38,124,665Total Face Value of Insurance $322,577,933Total Number of Policies 27,884
Loan Guaranty Number of Loans 3,387 Total Loan Amount $591,054,217
Vocational Rehabilitation and Employment Number of Applicants 1,303Number of Plans Developed 296Number of Entitlement Decisions 353Number of Veterans Rehabilitated through Independent Living 7Number of Veterans Rehabilitated by Obtaining Suitable Employment 153

Annual Benefits Report FY 2009E52
Appendices
Wyoming
Compensation and Pension Estimated Veteran Population 56,079 Disability Compensation Recipients 7,544 Estimated Monthly Disability Compensation Costs $6,340,408Estimated Annual Disability Compensation Costs $76,084,896Disability Compensation by Age 34 and under 851 Disability Compensation by Age 35‑54 2,337 Disability Compensation by Age 55‑74 3,369 Disability Compensation by Age 75‑84 630 Disability Compensation by Age 85 and over 357 Disability Pension Recipients 523Estimated Monthly Disability Pension Costs $404,814Estimated Annual Disability Pension Costs $4,857,765Disability Pension by Age under 45 15 Disability Pension by Age 45‑54 42 Disability Pension by Age 55‑69 277 Disability Pension by Age 70‑84 115 Disability Pension by Age 85 and over 74
Education MGIB‑AD Trainees 686MGIB‑SR Trainees 212DEA Trainees 118VEAP Trainees 1REAP Trainees 100
Insurance Life Insurance Payments $3,147,991Total Face Value of Insurance $26,635,574TotalNumberofPolicies 2,181
Loan Guaranty NumberofLoans 1,208 Total Loan Amount $251,492,139
Vocational Rehabilitation and Employment NumberofApplicants 85
NumberofPlansDeveloped 51NumberofEntitlementDecisions 78
NumberofVeteransRehabilitatedThroughIndependentLiving 6NumberofVeteransRehabilitatedByObtainingSuitableEmployment 10

Veterans Benefits Administration Making a difference E53
Appendices
Puerto RicoCompensation and Pension Estimated Veteran Population 116,029Disability Compensation Recipients 21,622 Estimated Monthly Disability Compensation Costs $27,148,617Estimated Annual Disability Compensation Costs $325,783,404Disability Compensation by Age 34 and under 1,413 Disability Compensation by Age 35-54 6,205 Disability Compensation by Age 55-74 10,166 Disability Compensation by Age 75-84 2,972 Disability Compensation by Age 85 and over 866 Disability Pension Recipients 11,440Estimated Monthly Disability Pension Costs $7,790,075Estimated Annual Disability Pension Costs $93,480,897Disability Pension by Age under 45 41 Disability Pension by Age 45-54 161 Disability Pension by Age 55-69 2,042 Disability Pension by Age 70-84 6,734 Disability Pension by Age 85 and over 2,462
Education MGIB-AD Trainees 822MGIB-SR Trainees 1,107DEA Trainees 1,565VEAP Trainees 3REAP Trainees 927
Insurance Life Insurance Payments $4,369,547Total Face Value of Insurance $36,971,329Total Number of Policies 3,770
Loan Guaranty Number of Loans 680 Total Loan Amount $118,957,621
Vocational Rehabilitation and Employment Number of Applicants 602Number of Plans Developed 130Number of Entitlement Decisions 192Number of Veterans Rehabilitated through Independent Living 0Number of Veterans Rehabilitated by Obtaining Suitable Employment 66

Annual Benefits Report FY 2009E54
Appendices
Philippines
Compensation and Pension Disability Compensation Recipients 4,838 Estimated Monthly Disability Compensation Costs $6,585,331Estimated Annual Disability Compensation Costs $79,023,966Disability Compensation by Age 34 and under 98 Disability Compensation by Age 35‑54 716 Disability Compensation by Age 55‑74 1,731 Disability Compensation by Age 75‑84 549 Disability Compensation by Age 85 and over 1,744 Disability Pension Recipients 644Estimated Monthly Disability Pension Costs $788,574Estimated Annual Disability Pension Costs $9,462,886Disability Pension by Age under 45 4 Disability Pension by Age 45‑54 25 Disability Pension by Age 55‑69 297 Disability Pension by Age 70‑84 151 Disability Pension by Age 85 and over 167
Education MGIB‑AD Trainees 311MGIB‑SR Trainees 0DEA Trainees 6VEAP Trainees 0REAP Trainees 1
Insurance Life Insurance Payments $619,133Total Face Value of Insurance $5,238,567TotalNumberofPolicies 495
Vocational Rehabilitation and Employment NumberofApplicants 64NumberofPlansDeveloped 35NumberofEntitlementDecisions 44NumberofVeteransRehabilitatedthroughIndependentLiving 0NumberofVeteransRehabilitatedbyObtainingSuitableEmployment 8

Veterans Benefits Administration Making a difference E55
AppendicesOther Foreign
Compensation and Pension Estimated Veteran Population 102,945Disability Compensation Recipients 20,639 Estimated Monthly Disability Compensation Costs $17,213,670Estimated Annual Disability Compensation Costs $206,564,034Disability Compensation by Age 34 and under 1,802 Disability Compensation by Age 35-54 9,349 Disability Compensation by Age 55-74 7,721 Disability Compensation by Age 75-84 1,280 Disability Compensation by Age 85 and over 487 Disability Pension Recipients 779Estimated Monthly Disability Pension Costs $644,324Estimated Annual Disability Pension Costs $7,731,887Disability Pension by Age under 45 15 Disability Pension by Age 45-54 34 Disability Pension by Age 55-69 303 Disability Pension by Age 70-84 278 Disability Pension by Age 85 and over 149
Education MGIB-AD Trainees 15,935 MGIB-SR Trainees 4,267 DEA Trainees 315 VEAP Trainees 1 REAP Trainees 2,345
Insurance Life Insurance Payments $3,450,902Total Face Value of Insurance $29,198,542Total Number of Policies 2,132
Loan Guaranty Number of Loans 169 Total Loan Amount $43,034,361

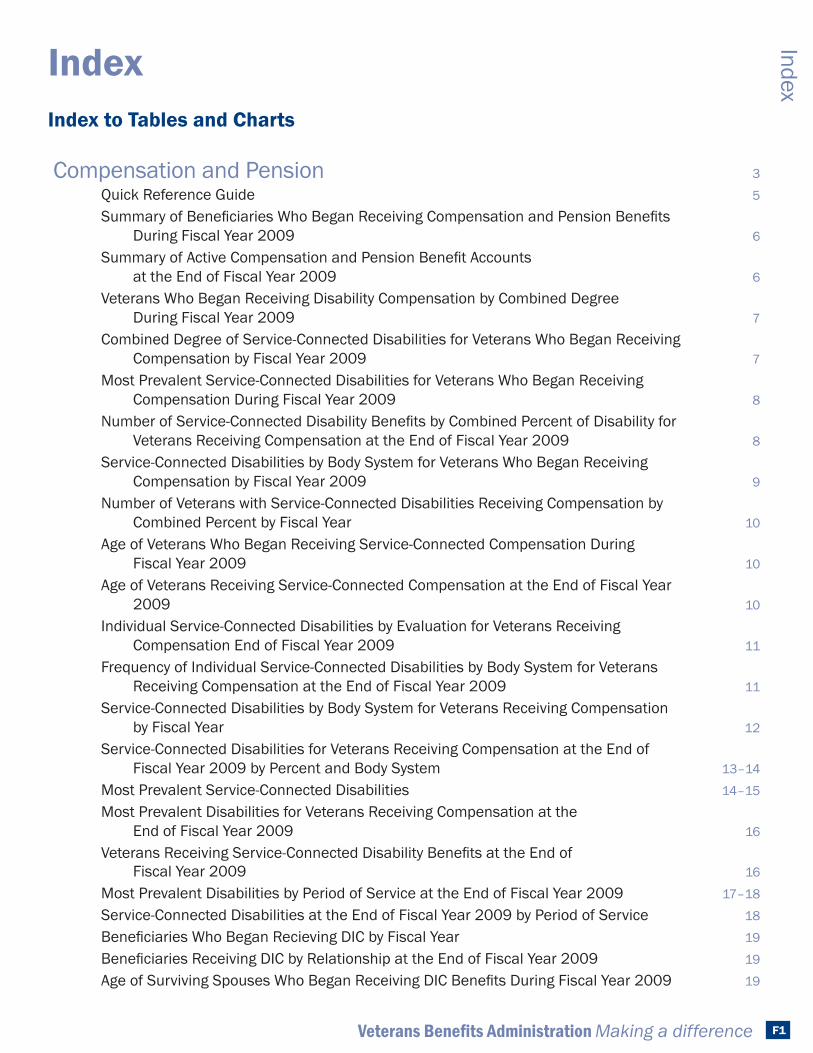
Veterans Benefits Administration Making a difference F1
Index
IndexIndex to Tables and Charts
Compensation and Pension 3
Quick Reference Guide 5SummaryofBeneficiariesWhoBeganReceivingCompensationandPensionBenefits
During Fiscal Year 2009 6SummaryofActiveCompensationandPensionBenefitAccounts
at the End of Fiscal Year 2009 6Veterans Who Began Receiving Disability Compensation by Combined Degree
During Fiscal Year 2009 7Combined Degree of Service‑Connected Disabilities for Veterans Who Began Receiving
Compensation by Fiscal Year 2009 7
Most Prevalent Service‑Connected Disabilities for Veterans Who Began Receiving Compensation During Fiscal Year 2009 8
NumberofService-ConnectedDisabilityBenefitsbyCombinedPercentofDisabilityforVeterans Receiving Compensation at the End of Fiscal Year 2009 8
Service‑Connected Disabilities by Body System for Veterans Who Began Receiving Compensation by Fiscal Year 2009 9
NumberofVeteranswithService-ConnectedDisabilitiesReceivingCompensationbyCombined Percent by Fiscal Year 10
Age of Veterans Who Began Receiving Service‑Connected Compensation During Fiscal Year 2009 10
Age of Veterans Receiving Service‑Connected Compensation at the End of Fiscal Year 2009 10
Individual Service‑Connected Disabilities by Evaluation for Veterans Receiving Compensation End of Fiscal Year 2009 11
Frequency of Individual Service‑Connected Disabilities by Body System for Veterans Receiving Compensation at the End of Fiscal Year 2009 11
Service‑Connected Disabilities by Body System for Veterans Receiving Compensation by Fiscal Year 12
Service‑Connected Disabilities for Veterans Receiving Compensation at the End of Fiscal Year 2009 by Percent and Body System 13–14
Most Prevalent Service‑Connected Disabilities 14–15
Most Prevalent Disabilities for Veterans Receiving Compensation at the End of Fiscal Year 2009 16
VeteransReceivingService-ConnectedDisabilityBenefitsattheEndof Fiscal Year 2009 16
Most Prevalent Disabilities by Period of Service at the End of Fiscal Year 2009 17–18
Service‑Connected Disabilities at the End of Fiscal Year 2009 by Period of Service 18
BeneficiariesWhoBeganRecievingDICbyFiscalYear 19
BeneficiariesReceivingDICbyRelationshipattheEndofFiscalYear2009 19
AgeofSurvivingSpousesWhoBeganReceivingDICBenefitsDuringFiscalYear2009 19

Annual Benefits Report FY 2009F2
Index AgeofChildrenWhoBeganReceivingDICBenefitsDuringFiscalYear2009 19
BeneficiariesReceivingService-ConnectedDeathBenefitsbyPeriodofServiceattheEnd of Fiscal Year 2009 20
Surviving Spouses Receiving DIC by Age at the End of Fiscal Year 2009 20
Children Receiving DIC by Age at the End of Fiscal Year 2009 20
Veterans Who Began Receiving Disability Pension by Program During Fiscal Year 2009 21
Veterans Receiving Disability Pension at the End of Fiscal Year 2009 21
Disability Pension by Period of Service at the End of Fiscal Year 2009 22
NumberofVeteransWhoBeganReceivingDisabilityPensionBenefitsDuringFiscalYear 2009 by Age 22
Veterans Receiving Disability Pension at the End of Fiscal Year 2009 by Age 22
BeneficiariesWhoBeganReceivingDeathPensionDuringFiscalYear2009byProgram 23
BeneficiariesReceivingDeathPensionbyProgramattheEndofFiscalYear2009 23
SpousesWhoBeganReceivingDeathPensionBenefitsDuringFiscalYear2009byAge 23
Surviving Spouses Receiving Death Pension at the End of Fiscal Year 2009 by Age 24
Death Pension by Period of Service at the End of Fiscal Year 2009 24
NumberofBeneficiariesbyPayeeType 25
Relationship of Fiduciary 25
Education 26
Quick Reference Guide 29
BeneficiariesbyProgrambyFiscalYear 29
NewEducationBeneficiariesbyProgramDuringFiscalYear2009 29
NewEducationBeneficiariesbyTrainingTypeandProgramDuringFiscalYear2009 29
TrainingAvailableUnderEducationBenefitPrograms 30
BeneficiariesWhoBeganReceivingEducationBenefitsDuringFiscalYear2009 31
BeneficiariesWhoBeganReceivingEducationBenefitsbyFiscalYear 32
BeneficiariesWhoReceivedEducationBenefitsbyFiscalYear 32
BeneficiariesWhoBeganReceivingEducationBenefitsbyTypeofTrainingandProgram During Fiscal Year 2009 33
BeneficiariesWhoBeganReceivingEducationBenefitsbyTrainingTimeandProgram During Fiscal Year 2009 33
BeneficiariesWhoseBenefitsTerminatedbyFiscalYear 34
BeneficiariesWhoseBenefitsTerminatedbyReasonDuringFiscalYear2009 34
UniqueBeneficiariesandPaymentsbyFiscalYear 35
Insurance 37
Quick Reference Guide 38
Lives Insured by Fiscal Year 38
BenefitsPaidbyFiscalYear 38
DeathAwards(Number)byFiscalYear 39
Death Awards (Amount) by Fiscal Year 39
Compensation and Pension (continued)

Veterans Benefits Administration Making a difference F3
IndexNumberofOperationsProcessedonAdministeredPoliciesbyFiscalYear 39
ProgramsThatNoLongerIssueCoverage 40
Programs That Issue Coverage 40
2009 Rankings by Total Life Insurance In‑Force 41
NewLifeInsuranceCoverageIssuedDuringFiscalYear2009 42
NewLifeInsuranceCoverageIssuedbyFiscalYear 43
Policy Lapses During Fiscal Year 2009 43
Lump‑Sum Payments Made to Policy Holders During Fiscal Year 2009 44
Life Insurance Dividend Payments by Fiscal Year 45
Lump-SumPaymentsMadetoBeneficiariesDuringFiscalYear2009 45
NumberofDeathClaimsPaidbyFiveFiscalYears 46
Insurance Monthly Installment Award Payments to Policyholders at the End of Fiscal Year 2009 46
InsuranceMonthlyInstallmentAwardPaymentstoBeneficiariesattheEndFiscal Year 2009 47
Total Insurance Policies In‑Force at the End of Fiscal Year 2009 47
Life Insurance Policies In Force by Fiscal Year 47
Age Distribution for Insurance Programs 48
SGLI Coverage by Branch and Component of Service 49
SGLI Coverage by Coverage Level – Active Duty and Reserve Duty 50
FSGLI Spousal Coverage by Coverage Level – Active Duty and Reserve Duty 50
Loan Guaranty 51
Quick Reference Guide 53
VA Home Loans Guaranteed by Fiscal Year 53, 56
Summary of Home Loan Guaranty Entitlements and Other Eligibility Criteria 54
Types and Characteristics of Loans Guaranteed During Fiscal Year 2009 55
Status of Loans Guaranteed by Fiscal Year 55
VA Home Loans Guaranteed by Fiscal Year 56
Specially Adapted Housing Grants and Direct Loans During Fiscal Year 2009 56
Loans Guaranteed by Period of Service Entitlement During Fiscal Year 2009 57
Entitlement Loans Guaranteed by Fiscal Year 58
Home Loans Guaranteed Based on Gender and Age During Fiscal Year 2009 58
Purchase Loans Guaranteed Based on Annual Income During Fiscal Year 2009 59
NumberofLoansGuaranteedbyAgebyFiscalYear 59
Percent of Loans Guaranteed by Age by Fiscal Year 60

Annual Benefits Report FY 2009F4
Index
Loans Guaranteed by Race During Fiscal Year 2009 60
Loans Guaranteed by Race by Fiscal Year 60
Vocational Rehabilitation and Employment 61
Quick Reference Guide 63
Vocational Rehabilitation and Employment Activities During Fiscal Year 2009 64
Vocational Rehabilitation and Employment Activities by Age During Fiscal Year 2009 64
Vocational Rehabilitation and Employment Activities by Prior Education Level at the End of Fiscal Year 2009 65
Vocational Rehabilitation and Employment Activities by Branch of Service at the End of Fiscal Year 2009 65
Vocational Rehabilitation and Employment Activities by Period of Service at the End of Fiscal Year 2009 65
Vocational Rehabilitation and Employment Activities by Length of Service at the End of Fiscal Year 2009 65
Vocational Rehabilitation and Employment Activities by Combined Service‑Connected Disability Rating at the End of Fiscal Year 2009 66
Veterans with Serious Employment Handicaps at the End of Fiscal Year 2009 66
Veterans Participating in a Vocational Training Program During Fiscal Year 2009 67
Veterans Successfully Rehabilitated Pre and Post Annual Earnings by Occupational Category at the End of Fiscal Year 2009 68


internet Homepage http://www.vba.va.gov
Department of Veterans Affairs
Veterans Benefits Administration
810 Vermont Avenue N.W.Washington, D.C. 20420