Central Flyway Databook 2020 - U.S. Fish and Wildlife Service
98
CENTRAL FLYWAY HARVEST AND POPULATION SURVEY DATA BOOK 2020 compiled by: James A. Dubovsky CENTRAL FLYWAY REPRESENTATIVE U.S. FISH AND WILDLIFE SERVICE DIVISION OF MIGRATORY BIRD MANAGEMENT 134 Union Blvd., Suite 540 Lakewood, CO 80228 (303) 275-2386 Suggested Citation: Dubovsky, J. A., compiler. 2020. Central Flyway harvest and population survey data book 2020. U.S. Fish and Wildlife Service, Lakewood CO.
-
Upload
khangminh22 -
Category
Documents
-
view
1 -
download
0
Transcript of Central Flyway Databook 2020 - U.S. Fish and Wildlife Service

CENTRAL FLYWAY HARVEST AND POPULATION
SURVEY DATA BOOK
2020
compiled by:
James A. Dubovsky
CENTRAL FLYWAY REPRESENTATIVE U.S. FISH AND WILDLIFE SERVICE
DIVISION OF MIGRATORY BIRD MANAGEMENT 134 Union Blvd., Suite 540
Lakewood, CO 80228 (303) 275-2386
Suggested Citation: Dubovsky, J. A., compiler. 2020. Central Flyway harvest and population survey data book 2020. U.S. Fish and Wildlife Service, Lakewood CO.


CENTRAL FLYWAY 1948-2020
73 YEARS OF MIGRATORY BIRD CONSERVATION


Important Note to Users:
From 1961-2001, estimates of waterfowl harvest, waterfowl hunter participation, and waterfowl hunter success in the United States were derived from a combination of several sources: 1) sales of migratory bird conservation stamps (Duck Stamps), 2) a Mail Questionnaire Survey of individuals who purchased ducks stamps for hunting purposes, and 3) the Waterfowl Parts Collection Survey (PCS). This survey, which was based on duck stamp sales was discontinued after the 2001 hunting season.
Beginning in 1999, new survey methods were implemented that obtained estimates of waterfowl harvest, hunter participation, and hunter success from: 1) States' lists of migratory bird hunters identified through the Harvest Information Program (HIP), 2) a questionnaire (HIP Survey) sent to a sample of those hunters, and 3) the Waterfowl PCS. The basic difference is that during 1961 - 2001 waterfowl hunter activity and harvest estimates were derived from a Mail Questionnaire Survey (MQS) of duck stamp purchasers, whereas from 1999 to the present those estimates were derived from HIP surveys of people identified as migratory bird hunters by the States. Both survey systems relied on the Waterfowl PCS for species composition data.
During 1989-2002, migratory game bird harvest and population survey information in the Central Flyway was presented in annually updated Data Books. Because of the recently implemented changes in survey design, historical harvest estimates will not be directly comparable to current estimates. Therefore, previous harvest survey information derived from the MQS are considered as final and compiled in the Central Flyway Waterfowl Hunting and Harvest Survey Information, 1961-2001.
For 1999 and subsequent years, waterfowl hunting and harvest estimates that are derived from HIP, along with the usual population survey information, will be compiled in annual updates of the Central Flyway Harvest and Population Survey Data Book. In the future, the annual Data Book will be expanded to also present annual hunter activity and harvest estimates for other migratory game bird species that are now derived from HIP surveys.
The 2019 estimates of migratory bird harvest and hunter activity for Canada were not available at the time of this printing. Canada is undertaking a revision of their harvest estimation methods, which should be completed sometime in 2021. Instead of footnoting all the tables to indicate that the estimates were not available, the lines for 2019 estimates for Canada have simply been left blank, and will be filled in for the 2021 Central Flyway Databook. This will result in less effort (e.g., adding and then deleting footnotes) in this publication and subsequent updates.

TABLE OF CONTENTS
U.S. DUCK STAMP AND CANADIAN PERMIT SALES: Migratory Game Bird Permit Sales in Canada .......................................................... 2 Federal Sandhill Crane Permits Issued in the Central Flyway and Minnesota ......... 3 Tundra Swan Hunting Permits .................................................................................. 4
WATERFOWL AND CRANE HUNTER ACTIVITY AND SUCCESS: Active Duck Hunters, Total Duck Hunter Days, Average Duck Hunter Days,
and Average Seasonal Duck Bag Per Hunter .................................................... 6 Active Goose Hunters, Total Goose Hunter Days, Average Goose Hunter Days,
and Average Seasonal Goose Bag Per Hunter .................................................. 7 Active Mid-continent Sandhill Crane Hunters............................................................ 8
Active Tundra Swan Hunters .................................................................................... 9 Average Seasonal Tundra Swan Bag Per Active Swan Hunter ............................. 10
DUCK HARVESTS IN THE UNITED STATES: Mallard, Gadwall, and American Wigeon ................................................................ 12 Northern Pintail, Northern Shoveler, and Wood Duck ............................................ 13 American Black Duck, Mottled Duck, and Mexican Duck X Mallard ....................... 14
Black-bellied Whistling Duck and Fulvous Tree Duck ............................................. 15 Blue-winged Teal (Special, Regular, All Seasons) ................................................. 16 Green-winged Teal (Special, Regular, All Seasons) .............................................. 17 Redhead, Canvasback and Ring-necked Duck ..................................................... 18 Greater Scaup, Lesser Scaup, and Combined ....................................................... 19 Common Goldeneye, Ruddy Duck, and Hooded Merganser .................................. 20
Total Ducks ............................................................................................................ 21
AGE RATIOS IN THE U.S. HARVEST: Mallard All, Female, and Male Age Ratios .............................................................. 23 Northern Pintail, Gadwall, American Wigeon, Wood Duck, Redhead,
Greater and Lesser Scaup Age Ratios .............................................................. 24 Blue-winged Teal and Green-winged Teal Age Ratios .......................................... 25
SEX RATIOS IN THE U.S. HARVEST: Mallard Adult and Immature Sex Ratios.................................................................. 27
DUCK HARVESTS IN CANADA: Mallard .................................................................................................................... 29 Northern Pintail ....................................................................................................... 30 Total Ducks ............................................................................................................ 31
DUCK HARVESTS IN NORTH AMERICA: Mallard .................................................................................................................... 33
GOOSE HARVESTS IN THE U.S. AND CANADA: Snow/Blue Geese, Ross’s Geese and All Light Geese .......................................... 35 White-fronted Geese, Canada Geese-Regular and All Season ............................. 36
Total Geese ............................................................................................................. 37 CFAN, Large and Unknown Canada Geese in the Central Flyway ........................ 38
GOOSE AGE RATIOS IN THE U.S. HARVEST: Canada Goose, White-fronted Goose, Snow Goose and Ross’s
Goose Age Ratios ............................................................................................. 40
i

WEBLESS HARVEST AND HUNTER ACTIVITY IN THE UNITED STATES: CMU Mourning Dove Harvest, Active Hunters, Total Days Afield, and Average
Seasonal Dove Bag Per Hunter ........................................................................ 42 CMU White-winged Dove Harvest, Active Hunters, Total Days Afield, and Average
Four Corners (Interior) Population Band-tailed Pigeon Harvest, Active Hunters,
CMR American Woodcock Harvest, Active Hunters, Total Days Afield, and
Seasonal Dove Bag Per Hunter ........................................................................ 43
Total Days Afield, and Average Seasonal Pigeon Bag Per Hunter .................. 44
Average Seasonal Woodcock Bag Per Hunter................................................. 45
WATERFOWL POPULATION SURVEY INFORMATION: Central Flyway Mid-winter Goose Survey, 2020 ..................................................... 47 White-fronted Goose Population Status, Objectives and Regulatory Thresholds . 48 Canada Goose Population Status, Objectives and Regulatory Thresholds ........... 49 Light Goose Population Status, Objectives and Regulatory Thresholds ............... 50 Central Flyway Mid-winter Waterfowl Survey - 2020 ............................................. 51 Central Flyway Mid-winter Waterfowl Surveys - 2020-2029 ................................... 52 Central Flyway Mid-winter Waterfowl Surveys - 2010-19 ....................................... 53 Central Flyway Mid-winter Waterfowl Surveys - 2000-09 ....................................... 54 Central Flyway Mid-winter Waterfowl Surveys - 1990-99 ....................................... 55 Central Flyway Mid-winter Waterfowl Survey Comparisons - 1948-2020............... 56 Breeding Population Estimates for 10 Duck Species .............................................. 57
TUNDRA SWAN POPULATION SURVEYS AND HARVESTS: Mid-winter Survey for the Eastern Population ........................................................ 59 Harvest Estimates for the Eastern and Western Populations ................................. 60
SANDHILL CRANE POPULATION SURVEYS AND HARVESTS: Spring Surveys for the Mid-continent Population .................................................... 62 Harvest Estimates for the Mid-continent Population - U.S. .................................... 63 Harvest Estimates for the Mid-continent Population - N.A. ................................... .64 Population Surveys for RMP Cranes ...................................................................... 65 Harvest Estimates for RMP Cranes ........................................................................ 66
CENTRAL FLYWAY FRAMEWORKS: Frameworks for Central Flyway Regular Canada Goose Seasons, 2015-2020 .... 68 Frameworks for Central Flyway Light Goose Hunting, 2015-2020 ......................... 69 Frameworks for U.S. Light Goose Hunting, 1961-2020 .......................................... 70 Frameworks for Central Flyway Duck Hunting, 2015-2020 .................................... 71 Frameworks for Sandhill Crane Hunting, 2015-2020 .............................................. 72
ADAPTIVE HARVEST MANAGEMENT: AHM Decision Matrices, 1995-2000 ....................................................................... 74 AHM Decision Matrices, 2001-2006 ....................................................................... 75 AHM Decision Matrices, 2007-2012 ....................................................................... 76 AHM Decision Matrices, 2013-2018 ....................................................................... 77 AHM Decision Matrices, 2019-2021 ....................................................................... 78
HISTORICAL MEMBERSHIP AND AWARD LISTS: Central Flyway Council ........................................................................................... 80 Central Flyway Waterfowl Technical Committee ................................................... 81 Central Flyway Webless Game Bird Technical Committee ................................... 82 Central Management Unit Dove Technical Committee .......................................... 83 Central Flyway Nongame Bird Technical Committee ............................................ 84
ii

85 8687 8889 90
Central Flyway Meeting Locations .......................................................................... Gay Simpson & Joe Gabig Awards Recipients .......................................................
Central Flyway Consultants .................................................................................... Service Regulations Committee .............................................................................
USFWS Flyway Representatives ............................................................................ USFWS Regional Migratory Bird Chiefs .................................................................
iii

Central Flyway Databook 202012/22/2020
CANADIAN MIGRATORY BIRD PERMIT SALES
MID-CONTINENTSANDHILL CRANEHUNTING PERMITS
TUNDRA SWANHUNTING PERMITS
1
Central Flyway Databook 202012/22/2020
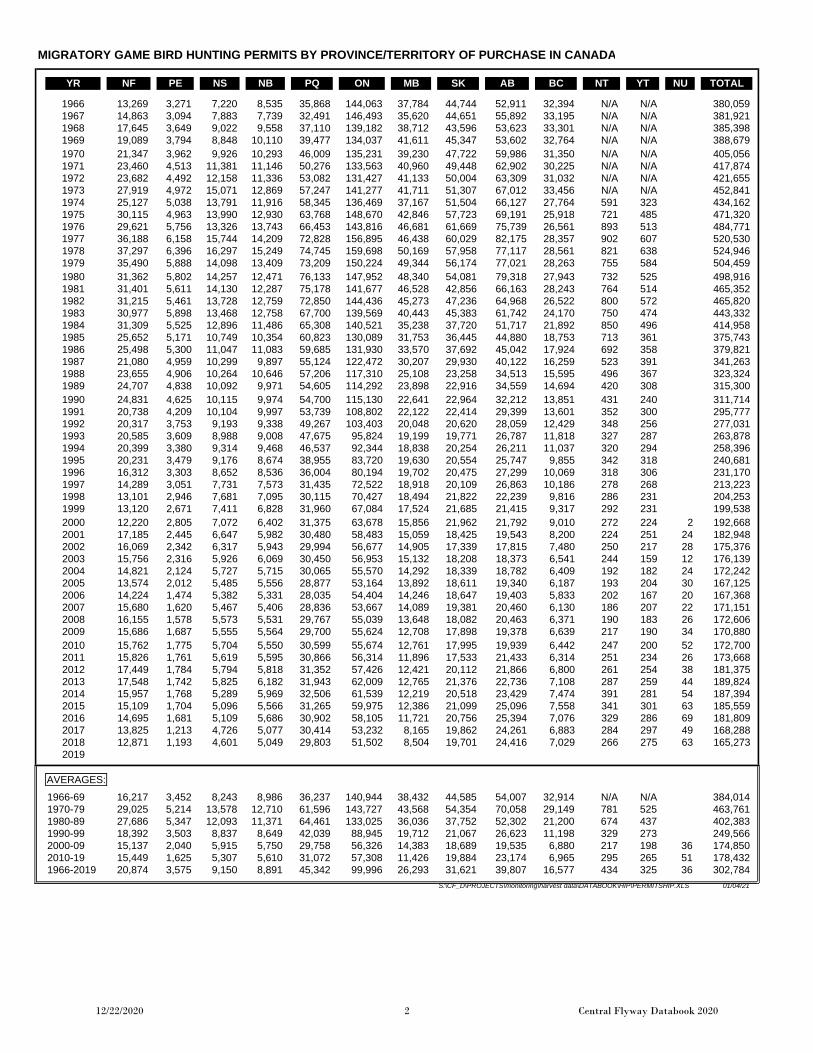
MIGRATORY GAME BIRD HUNTING PERMITS BY PROVINCE/TERRITORY OF PURCHASE IN CANADA
YR NF PE NS NB PQ ON MB SK AB BC NT YT NU TOTAL
1966 13,269 3,271 7,220 8,535 35,868 144,063 37,784 44,744 52,911 32,394 N/A N/A 380,059 1967 14,863 3,094 7,883 7,739 32,491 146,493 35,620 44,651 55,892 33,195 N/A N/A 381,921 1968 17,645 3,649 9,022 9,558 37,110 139,182 38,712 43,596 53,623 33,301 N/A N/A 385,398 1969 19,089 3,794 8,848 10,110 39,477 134,037 41,611 45,347 53,602 32,764 N/A N/A 388,679 1970 21,347 3,962 9,926 10,293 46,009 135,231 39,230 47,722 59,986 31,350 N/A N/A 405,056 1971 23,460 4,513 11,381 11,146 50,276 133,563 40,960 49,448 62,902 30,225 N/A N/A 417,874 1972 23,682 4,492 12,158 11,336 53,082 131,427 41,133 50,004 63,309 31,032 N/A N/A 421,655 1973 27,919 4,972 15,071 12,869 57,247 141,277 41,711 51,307 67,012 33,456 N/A N/A 452,841 1974 25,127 5,038 13,791 11,916 58,345 136,469 37,167 51,504 66,127 27,764 591 323 434,162 1975 30,115 4,963 13,990 12,930 63,768 148,670 42,846 57,723 69,191 25,918 721 485 471,320 1976 29,621 5,756 13,326 13,743 66,453 143,816 46,681 61,669 75,739 26,561 893 513 484,771 1977 36,188 6,158 15,744 14,209 72,828 156,895 46,438 60,029 82,175 28,357 902 607 520,530 1978 37,297 6,396 16,297 15,249 74,745 159,698 50,169 57,958 77,117 28,561 821 638 524,946 1979 35,490 5,888 14,098 13,409 73,209 150,224 49,344 56,174 77,021 28,263 755 584 504,459 1980 31,362 5,802 14,257 12,471 76,133 147,952 48,340 54,081 79,318 27,943 732 525 498,916 1981 31,401 5,611 14,130 12,287 75,178 141,677 46,528 42,856 66,163 28,243 764 514 465,352 1982 31,215 5,461 13,728 12,759 72,850 144,436 45,273 47,236 64,968 26,522 800 572 465,820 1983 30,977 5,898 13,468 12,758 67,700 139,569 40,443 45,383 61,742 24,170 750 474 443,332 1984 31,309 5,525 12,896 11,486 65,308 140,521 35,238 37,720 51,717 21,892 850 496 414,958 1985 25,652 5,171 10,749 10,354 60,823 130,089 31,753 36,445 44,880 18,753 713 361 375,743 1986 25,498 5,300 11,047 11,083 59,685 131,930 33,570 37,692 45,042 17,924 692 358 379,821 1987 21,080 4,959 10,299 9,897 55,124 122,472 30,207 29,930 40,122 16,259 523 391 341,263 1988 23,655 4,906 10,264 10,646 57,206 117,310 25,108 23,258 34,513 15,595 496 367 323,324 1989 24,707 4,838 10,092 9,971 54,605 114,292 23,898 22,916 34,559 14,694 420 308 315,300 1990 24,831 4,625 10,115 9,974 54,700 115,130 22,641 22,964 32,212 13,851 431 240 311,714 1991 20,738 4,209 10,104 9,997 53,739 108,802 22,122 22,414 29,399 13,601 352 300 295,777 1992 20,317 3,753 9,193 9,338 49,267 103,403 20,048 20,620 28,059 12,429 348 256 277,031 1993 20,585 3,609 8,988 9,008 47,675 95,824 19,199 19,771 26,787 11,818 327 287 263,878 1994 20,399 3,380 9,314 9,468 46,537 92,344 18,838 20,254 26,211 11,037 320 294 258,396 1995 20,231 3,479 9,176 8,674 38,955 83,720 19,630 20,554 25,747 9,855 342 318 240,681 1996 16,312 3,303 8,652 8,536 36,004 80,194 19,702 20,475 27,299 10,069 318 306 231,170 1997 14,289 3,051 7,731 7,573 31,435 72,522 18,918 20,109 26,863 10,186 278 268 213,223 1998 13,101 2,946 7,681 7,095 30,115 70,427 18,494 21,822 22,239 9,816 286 231 204,253 1999 13,120 2,671 7,411 6,828 31,960 67,084 17,524 21,685 21,415 9,317 292 231 199,538 2000 12,220 2,805 7,072 6,402 31,375 63,678 15,856 21,962 21,792 9,010 272 224 2 192,668 2001 17,185 2,445 6,647 5,982 30,480 58,483 15,059 18,425 19,543 8,200 224 251 24 182,948 2002 16,069 2,342 6,317 5,943 29,994 56,677 14,905 17,339 17,815 7,480 250 217 28 175,376 2003 15,756 2,316 5,926 6,069 30,450 56,953 15,132 18,208 18,373 6,541 244 159 12 176,139 2004 14,821 2,124 5,727 5,715 30,065 55,570 14,292 18,339 18,782 6,409 192 182 24 172,242 2005 13,574 2,012 5,485 5,556 28,877 53,164 13,892 18,611 19,340 6,187 193 204 30 167,125 2006 14,224 1,474 5,382 5,331 28,035 54,404 14,246 18,647 19,403 5,833 202 167 20 167,368 2007 15,680 1,620 5,467 5,406 28,836 53,667 14,089 19,381 20,460 6,130 186 207 22 171,151 2008 16,155 1,578 5,573 5,531 29,767 55,039 13,648 18,082 20,463 6,371 190 183 26 172,606 2009 15,686 1,687 5,555 5,564 29,700 55,624 12,708 17,898 19,378 6,639 217 190 34 170,880 2010 15,762 1,775 5,704 5,550 30,599 55,674 12,761 17,995 19,939 6,442 247 200 52 172,700 2011 15,826 1,761 5,619 5,595 30,866 56,314 11,896 17,533 21,433 6,314 251 234 26 173,668 2012 17,449 1,784 5,794 5,818 31,352 57,426 12,421 20,112 21,866 6,800 261 254 38 181,375 2013 17,548 1,742 5,825 6,182 31,943 62,009 12,765 21,376 22,736 7,108 287 259 44 189,824 2014 15,957 1,768 5,289 5,969 32,506 61,539 12,219 20,518 23,429 7,474 391 281 54 187,394 2015 15,109 1,704 5,096 5,566 31,265 59,975 12,386 21,099 25,096 7,558 341 301 63 185,559 2016 14,695 1,681 5,109 5,686 30,902 58,105 11,721 20,756 25,394 7,076 329 286 69 181,809 2017 13,825 1,213 4,726 5,077 30,414 53,232 8,165 19,862 24,261 6,883 284 297 49 168,288 2018 12,871 1,193 4,601 5,049 29,803 51,502 8,504 19,701 24,416 7,029 266 275 63 165,273 2019
AVERAGES:
1966-69 16,217 3,452 8,243 8,986 36,237 140,944 38,432 44,585 54,007 32,914 N/A N/A 384,014 1970-79 29,025 5,214 13,578 12,710 61,596 143,727 43,568 54,354 70,058 29,149 781 525 463,761 1980-89 27,686 5,347 12,093 11,371 64,461 133,025 36,036 37,752 52,302 21,200 674 437 402,383 1990-99 18,392 3,503 8,837 8,649 42,039 88,945 19,712 21,067 26,623 11,198 329 273 249,566 2000-09 15,137 2,040 5,915 5,750 29,758 56,326 14,383 18,689 19,535 6,880 217 198 36 174,850 2010-19 15,449 1,625 5,307 5,610 31,072 57,308 11,426 19,884 23,174 6,965 295 265 51 178,432 1966-2019 20,874 3,575 9,150 8,891 45,342 99,996 26,293 31,621 39,807 16,577 434 325 36 302,784
S:\CF_D\PROJECTS\monitoring\harvest data\DATABOOK\HIP\PERMITSHIP.XLS 01/04/21
2

Central Flyway Databook 202012/22/2020
FEDERAL MID-CONTINENT SANDHILL CRANE PERMITS ISSUED IN THE CENTRAL FLYWAY AND MINNESOTA
YR CO KS MT NM ND OK SD TX WY CF TOTAL MN
1975 401 158 1,225 4,172 171 198 5,482 56 11,863 1976 341 117 1,195 4,137 265 200 5,060 37 11,352 1977 374 82 1,452 6,294 519 134 4,897 48 13,800 1978 343 209 956 5,798 620 98 5,198 52 13,274 1979 528 159 1,288 4,949 470 63 5,098 43 12,598
1980 437 118 1,082 5,754 510 240 5,239 33 13,413 1981 397 53 1,022 5,796 466 197 5,297 30 13,258 1982 528 147 962 4,714 750 579 4,650 40 12,370 1983 575 175 706 8,033 909 528 7,317 63 18,306 1984 538 113 721 7,436 1,187 544 6,838 43 17,420 1985 555 143 710 6,802 1,102 656 7,417 59 17,444 1986 617 99 595 8,926 1,073 705 7,258 25 19,298 1987 610 128 502 8,778 1,213 517 6,289 30 18,067 1988 512 162 480 6,214 1,472 437 7,053 38 16,368 1989 434 172 430 6,128 1,717 524 8,066 25 17,496
1990 389 143 533 7,268 1,725 646 11,994 22 22,720 1991 501 238 602 3,353 1,618 668 11,142 25 18,147 1992 498 303 582 3,760 1,397 721 9,848 18 17,127 1993 411 575 336 541 4,572 1,277 708 10,407 37 18,864 1994 427 567 320 547 4,790 1,561 636 10,515 49 19,412 1995 571 711 351 564 5,242 1,323 650 10,755 42 20,209 1996 612 837 369 499 5,570 1,391 677 11,334 41 21,330 1997 572 997 325 454 4,934 1,393 757 37,365 2 46 46,845 1998 4,937 2 1,088 270 449 6,082 1,385 951 32,523 2 49 47,734 1999 4,847 2 1,235 279 516 6,050 1,438 810 33,380 2 52 48,607
2000 5,169 2 1,084 283 493 7,451 1,333 721 44,719 2 58 61,311 2001 5,869 2 1,374 253 509 8,078 1,315 680 49,410 2 72 67,560 2002 5,644 2 1,279 303 496 8,245 3 1,186 619 37,558 2 54 55,384
2003 1 5,854 2 1,206 273 471 6,030 3 1,000 563 43,199 2 50 58,646 2004 1 5,784 2 1,180 3 308 548 5,788 3 780 3 307 52,161 2 61 66,917 2005 1 5,766 2 805 3 281 494 7,441 3 698 3 490 51,511 2 68 67,554 2006 1 4,792 2 826 3 265 512 4 7,410 3 615 3 445 5 70,968 2 78 85,911 2007 1 4,931 2 598 3 238 480 4 7,442 3 731 3 390 5 101,382 2 58 116,250 2008 1 5,772 2 655 3 272 677 4 6,501 3 736 3 398 5 122,553 2 73 137,637 2009 1 4,038 2 540 3 139 862 4 7,774 3 1,029 3 693 5 11,332 5 62 26,469
2010 1 4,280 2 508 3 283 701 4 8,375 3 1,055 3 410 5 12,560 5 86 28,258 1,954 2011 1 783 2 801 3 311 575 4 8,024 3 1,104 3 356 5 13,905 5 86 25,945 1,342 2012 1 801 2 571 3 186 859 4 8,519 3 451 3 343 5 14,083 5 102 25,915 1,032 2013 1 856 2 735 3 288 404 4 9,085 3 2,278 3 421 5 18,369 5 106 32,542 1,086 2014 1 848 2 787 3 356 368 4 4,692 3 660 3 390 5 20,105 5 433 28,639 1,216 2015 1 787 2 1,040 3 404 365 4 4,543 3 510 3 --- 6 22,033 5 454 30,136 1,199 2016 1 841 2 1,055 3 376 416 4 3,956 3 559 3 171 5 23,962 5 569 31,905 1,139 2017 1 913 2 1,075 3 604 534 4 4,006 3 714 3 224 5 26,312 5 646 35,028 1,125 2018 1 954 2 1,218 3 676 2,413 4 4,102 3 642 3 237 5 29,668 5 392 40,302 1,091 2019 1 1,019 2 1,456 3 1,013 2 2,818 4 3,839 3 --- 7 242 5 32,841 5 714 43,942 1,073
AVERAGES:
1975-79 397 145 1,223 5,070 409 139 5,147 47 12,577 1980-89 520 131 721 6,858 1,040 493 6,542 39 16,344 1990-99 1,377 859 293 529 5,162 1,451 722 17,926 38 28,100 2000-09 5,362 955 262 554 7,216 942 531 58,479 63 74,364 2010-2019 1,208 925 450 945 5,914 886 310 21,384 359 32,261 1,226 1975-2019 1,926 919 268 747 6,152 1,008 476 23,757 116 34,968
1 Preliminary S:\CF_D\projects\speciesandpopulations\sandhillcranes\Status Reports\Shcranerep.xls K.L. Kruse 5-Jan-21 2 Harvest Information Program (HIP) or a point-of-sale electronic record (without cost) used to identify crane hunters in lieu of a special sandhill crane hunting permit
3 States began charging a fee for crane hunting permits which reduces the number of permits issued to hunters that only occasionally come into contact with sandhill cranes.
4 NM uses a combination of electronic and paper permits. 5 SD uses a special question in their HIP questionnaire to identify sandhill crane hunters; TX hunters can only obtain crane permits in selected locations. 6 All hunters put in stratum "did not hunt" or "no" in state HIP sample frame, so no estimate is available. 7 Hunters name and address data not supplied, so no estimate is available.
3

Central Flyway Databook 202012/22/2020
1965
1970
1975
1980
1985
1990
1995
2000
2005
2010
2015
995
TUNDRA SWAN HUNTING PERMITS ISSUED FOR THE EASTERN AND WESTERN POPULATIONS
EASTERN POPULATION MT ND SD NC VA DE TOTAL
WESTERN POPULATION UT NV MT AK TOTALYR TOTAL
1962 1,000 1,000 1,000 1963 1,000 1,000 1,000 1964 1,000 1,000 1,000
995 995 1966 1,000 1,000 1,000 1967 1,000 1,000 1,000 1968 1,000 1,000 1,000 1969 2,500 500 3,000 3,000
2,500 500 500 3,500 3,500 1971 2,495 500 500 3,495 3,495 1972 2,500 500 500 3,500 3,500 1973 2,500 500 500 3,500 3,500 1974 2,500 500 500 3,500 3,500
2,500 500 500 3,500 3,500 1976 2,500 500 500 3,500 3,500 1977 2,488 500 500 3,488 3,488 1978 2,500 500 500 3,500 3,500 1979 2,500 500 500 3,500 3,500
2,500 500 500 3,500 3,500 1981 2,500 500 500 3,500 3,500 1982 2,500 500 500 3,500 3,500 1983 109 109 2,500 650 500 3,650 3,759 1984 108 1,000 1,108 2,500 650 500 3,650 4,758
120 6,000 6,120 2,488 650 500 3,638 9,758 1986 170 6,000 6,170 2,500 608 500 3,608 9,778 1987 171 5,968 6,139 2,499 594 500 3,593 9,732 1988 99 400 5,995 600 7,094 2,500 260 500 112 3,372 10,466 1989 167 1,000 5,444 600 7,211 2,500 324 500 130 3,454 10,665
173 1,000 500 5,989 600 8,262 2,500 297 500 81 3,378 11,640 1991 204 2,000 1,000 6,000 600 9,804 2,500 258 500 84 3,342 13,146 1992 217 2,000 1,502 5,961 600 10,280 2,500 100 500 89 3,189 13,469 1993 212 2,000 1,500 6,000 400 10,112 2,500 205 500 170 3,375 13,487 1994 232 2,000 1,500 6,000 600 10,332 2,500 206 500 216 3,422 13,754
291 2,000 1,500 6,000 600 10,391 2,750 383 500 210 3,843 14,234 1996 372 2,000 1,235 5,000 600 9,207 2,750 376 500 193 3,819 13,026 1997 364 2,000 1,077 5,000 600 9,041 2,750 381 500 201 3,832 12,873 1998 429 2,000 1,216 5,000 600 9,245 2,750 492 500 192 3,934 13,179 1999 432 2,000 863 5,000 600 8,895 2,750 518 500 227 3,995 12,890
434 2,000 850 5,000 600 8,884 2,000 493 500 164 3,157 12,041 2001 398 2,000 983 5,000 600 8,981 2,000 308 500 255 3,063 12,044 2002 393 2,000 1,060 5,000 600 9,053 1,998 264 500 252 3,014 12,067 2003 423 2,200 1,002 5,000 600 9,225 2,000 298 500 215 3,013 12,238 2004 320 2,200 820 5,000 600 8,940 2,000 330 500 175 3,005 11,945
348 2,200 811 5,000 600 8,959 1,997 370 500 176 3,043 12,002 2006 340 2,200 811 5,000 600 8,951 1,994 605 500 168 3,267 12,218 2007 323 2,200 1,064 5,000 600 9,187 2,000 650 500 162 3,312 12,499 2008 307 2,200 958 5,000 600 9,065 2,000 535 500 182 3,217 12,282 2009 327 2,200 1,242 5,000 600 9,369 2,000 472 500 174 3,146 12,515
369 2,200 1,234 5,000 600 9,403 2,000 469 500 212 3,181 12,584 2011 320 2,200 1,156 5,000 600 9,276 2,000 527 500 228 3,255 12,531 2012 338 2,200 1,266 5,000 600 9,404 2,000 650 500 165 3,315 12,719 2013 354 2,200 1,259 5,000 600 9,413 2,000 488 500 189 3,177 12,590 2014 401 2,200 1,216 5,000 600 9,417 2,000 234 500 159 2,893 12,310
432 2,200 1,299 5,000 600 9,531 2,000 105 500 127 2,732 12,263 2016 410 2,200 1,083 5,000 600 9,293 2,000 404 500 114 3,018 12,311 2017 338 2,700 1,068 6,250 750 11,106 2,000 579 500 111 3,190 14,296 2018 354 2,700 1,189 6,250 750 11,243 2,000 650 500 109 3,259 14,502 2019 500 2,700 1,185 6,115 801 84 11,385 2,750 650 500 137 4,037 15,422
S:\CF_D\PROJECTS\monitoring\harvest data\DATABOOK\HIP\PERMITSHIP.XLS 01/04/21
4

Central Flyway Databook 202012/22/2020
WATERFOWL AND CRANE HUNTERACTIVITY AND SUCCESS
5

Central Flyway Databook 202012/22/2020
ESTIMATES OF ACTIVE DUCK HUNTERS BY STATE OF HARVEST (Harvest Information Program) 1
YR CO
1999 14,000
2000 14,000 2001 17,533 2002 12,733
2003 2 13,400 2004 2 13,600 2005 2 12,300 2006 2 12,416 2007 2 11,882 2008 2 13,750 2009 2 13,257
2010 2 9,094 2011 2 12,151 2012 2 11,081 2013 2 11,894 2014 2 12,977 2015 2 11,009 2016 2 10,323 2017 2 11,655 2018 2 11,881 2019 2 11,159
KS
16,900
14,900 16,344 15,426 15,100 19,200 11,600 12,663 13,021 16,531 14,259
13,053 13,534 12,739 16,847 17,684 19,582 14,000 17,857 18,065 13,843
MT
12,300
11,300 11,044 14,742 14,200 14,400 12,100 12,941 11,258 12,553 11,532
10,157 11,647 13,553 10,647 17,522 16,922 12,279 12,437 14,645 12,912
NE
20,200
19,200 18,392 16,976 18,500 16,800 15,600 15,992 14,752 14,517 12,900
13,394 14,656 13,626 12,977 12,021 12,065 12,344 10,686 11,723 12,064
NM
2,200
3,100 5,054 4,385 3,900 3,300 2,900 2,424 2,820 2,552 1,784
2,617 2,945 3,328 2,131 5,363 2,078 4,169 3,011 3,284 3,687
ND
39,200
32,200 36,414 34,385 37,100 36,900 36,300 29,691 32,192 26,185 30,604
24,760 32,005 31,380 32,071 37,275 34,649 33,495 29,428 33,750 30,520
OK
13,800
13,500 10,781 14,691 13,800 15,300 16,100 14,236 19,437 14,194 11,692
13,595 13,692 13,892 18,768 17,287 16,235 19,411 15,794 20,039 20,894
SD
24,000
18,400 22,411 19,158 18,200 18,800 15,500 15,333 14,459 14,205 16,638
16,521 16,080 14,797 13,890 15,614 13,432 10,634 12,689 15,554 13,975
TX
86,300
115,600 139,853 103,372
61,100 84,900 91,500 84,228 80,213 72,720 67,382
66,982 74,700 74,727 46,423 86,253 61,208 79,902 86,200 74,279 68,966
WY
4,600
4,300 4,248 4,413 4,300 3,400 3,600 3,960 4,587 3,630 4,148
3,326 4,018 3,412 4,724 3,464 3,192 3,106 4,097 3,692 2,718
AVERAGE: 1999-2019 12,481 15,388 12,909 14,733 3,192 32,881 15,578 16,204 81,892 3,854
% CHANGE FROM: Prev. Year -6% Average -11%
-23% -10%
-12% 0%
3% -18%
12% 16%
-10% -7%
4% 34%
-10% -14%
-7% -16%
-26% -29%
1 Estimates for NM, CO, WY, and MT are statewide. 2 Preliminary
ESTIMATES OF TOTAL DUCK HUNTER DAYS AFIELD BY STATE OF HARVEST (Harvest Information Program) 1
YR CO
1999 79,500
2000 81,000 2001 114,178 2002 67,767
2003 2 86,000 2004 2 85,300 2005 2 66,700 2006 2 64,993 2007 2 66,072 2008 2 72,852 2009 2 79,367
2010 2 51,168 2011 2 64,567 2012 2 57,407 2013 2 77,094 2014 2 67,516 2015 2 67,860 2016 2 60,635 2017 2 60,228 2018 2 59,158 2019 2 55,013
KS
126,800
107,400 100,989 102,744 107,600 124,000
87,700 85,416 82,149
106,154 92,081
79,064 96,138 90,851
105,344 101,802
98,266 87,293 66,103 74,854 65,984
MT
(70,500)
(72,500) (72,935) (79,809) (70,600) (71,500) (64,300) (60,018) (57,960) (56,644) (50,491)
(49,734) (60,584) (69,767) (63,643) (79,788) (87,122) (68,161) (57,483) (72,446) (48,371)
NE
152,200
129,400 145,880 136,112 135,000 129,100 110,900 111,456 121,493 104,014
94,087
98,535 124,751
93,088 101,187
81,859 87,798 81,311 84,930 78,980 87,340
NM
14,100
24,600 29,882 24,252 30,900 25,600 16,700 15,611 18,665 14,836 17,027
15,860 16,669 16,978 13,511 28,728
9,696 10,993 17,662 24,167 16,790
ND
224,000
166,300 188,020 179,029 197,700 194,200 186,700 149,988 157,619 119,806 165,853
115,550 162,591 160,182 161,165 177,482 179,141 159,547 143,533 160,407 135,109
OK
107,500
91,800 67,697
107,583 103,500 130,300 107,700 110,707 154,609
98,139 87,395
89,935 107,778 112,166 127,799 123,559 103,738 123,721
82,606 98,280
106,225
SD
151,100
105,500 150,044 123,655 119,400 110,200
86,200 92,213 84,346 79,959 84,731
71,455 85,907 85,317 83,699 68,758 78,058 48,131 52,825 61,786 74,902
TX
508,900
704,900 720,993 539,665 379,200 497,000 488,500 424,851 418,536 331,573 410,219
355,088 480,070 513,823 360,610 465,903 309,547 385,806 391,751 358,203 332,568
WY
30,100
23,900 26,570 25,951 23,000 31,300 19,700 22,485 23,876 18,768 22,253
18,676 19,611 20,800 26,643 18,368 15,877 13,071 21,760 15,555 11,142
CEN FLYWAY
1,394,200
1,434,800 1,544,253 1,306,759 1,182,300 1,327,000 1,170,800 1,077,721 1,127,364
946,103 1,053,013
895,331 1,158,083 1,150,612 1,057,052 1,133,975
949,981 970,508 921,398 931,390 885,073
ATL FLYWAY
1,145,900
1,164,900 1,187,400 1,162,300 1,106,900
938,600 1,067,300 1,046,183 1,076,255 1,001,258 1,104,107
1,072,404 1,091,364 1,104,174 1,036,149
924,229 950,910
1,006,644 912,253 977,418 841,937
MISS FLYWAY
4,361,600
4,222,700 4,265,100 4,004,600 4,033,400 3,857,200 3,075,500 3,364,288 3,479,080 3,410,043 3,455,486
3,404,160 3,637,170 3,505,200 3,107,196 2,981,858 2,702,691 2,647,195 2,544,565 2,452,753 2,348,153
PAC 3
FLYWAY
1,451,900
1,251,200 1,188,200 1,163,600 1,118,500 1,203,500 1,165,600 1,300,253 1,295,713 1,328,957 1,159,302
1,218,952 1,187,091 1,283,602
996,539 931,605 892,644 933,040
1,068,673 1,129,913
939,995
U.S.
8,353,600
8,073,600 8,184,953 7,637,259 7,441,100 7,326,300 6,479,200 6,788,445 6,978,412 6,686,361 6,771,907
6,590,847 7,073,708 7,043,588 6,196,936 5,971,667 5,496,226 5,557,387 5,446,889 5,491,474 5,015,158
AVERAGE: 1999-2019 70,685 94,702 109,020 19,201 165,901 106,797 90,390 446,557 21,400 1,124,653 1,043,742 3,374,283 1,152,799 6,695,477
% CHANGE FROM: Prev. Year -7% Average -22%
-12% -30%
-33% 11% -20%
-31% -13%
-16% -19%
8% -1%
21% -17%
-7% -26%
-28% -48%
-5% -21%
-14% -19%
-4% -30%
-17% -18%
-9% -25%
1 Estimates for NM, CO, WY, and MT are statewide. MT is summarized in the Pacific Flyway's total and WY, CO, and NM are summarized in the Central Flyway's total.
2 Preliminary 3 Pacific Flyway total includes Alaska
AVERAGE SEASONAL DUCK HUNTER DAYS AFIELD BY STATE OF HARVEST (Harvest Information Program) 1
YR CO KS MT NE NM ND OK SD TX WY
1999 5.68 7.50 5.73 7.53 6.41 5.71 7.79 6.30 5.90 6.54
2000 5.79 7.21 6.42 6.74 7.94 5.16 6.80 5.73 6.10 5.56 2001 6.51 6.18 6.60 7.93 5.91 5.16 6.28 6.70 5.16 6.25 2002 5.32 6.66 5.41 8.02 5.53 5.21 7.32 6.45 5.22 5.88
2003 2 6.42 7.13 4.97 7.30 7.92 5.33 7.50 6.56 6.21 5.35 2004 2 6.27 6.46 4.97 7.68 7.76 5.26 8.52 5.86 5.85 9.21 2005 2 5.42 7.56 5.31 7.11 5.76 5.14 6.69 5.56 5.34 5.47 2006 2 5.23 6.75 4.64 6.97 6.44 5.05 7.78 6.01 5.04 5.68 2007 2 5.56 6.31 5.15 8.24 6.62 4.90 7.95 5.83 5.22 5.20 2008 2 5.30 6.42 4.51 7.16 5.81 4.58 6.91 5.63 4.56 5.17 2009 2 5.99 6.46 4.38 7.29 9.54 5.42 7.47 5.09 6.09 5.37
2010 2 5.63 6.06 4.90 7.36 6.06 4.67 6.62 4.33 5.30 5.62 2011 2 5.31 7.10 5.20 8.51 5.66 5.08 7.87 5.34 6.43 4.88 2012 2 5.18 7.13 5.15 6.83 5.10 5.10 8.07 5.77 6.88 6.10 2013 2 6.48 6.25 5.98 7.80 6.34 5.03 6.81 6.03 7.77 5.64 2014 2 5.20 5.76 4.55 6.81 5.36 4.76 7.15 4.40 5.40 5.30 2015 2 6.16 5.02 5.15 7.28 4.67 5.17 6.39 5.81 5.06 4.97 2016 2 5.87 6.24 5.55 6.59 2.64 4.76 6.37 4.53 4.83 4.21 2017 2 5.17 3.70 4.62 7.95 5.87 4.88 5.23 4.16 4.54 5.31 2018 2 4.98 4.14 4.95 6.74 7.36 4.75 4.90 3.97 4.82 4.21 2019 2 4.93 4.77 3.75 7.24 4.55 4.43 5.08 5.36 4.82 4.10
1 Estimates for NM, CO, WY, and MT are statewide. 2 Preliminary
AVERAGE SEASONAL DUCK BAG PER HUNTER BY STATE OF HARVEST (Harvest Information Program) 1
YR CO KS MT NE NM ND OK SD TX WY
1999 6.5 13.9 10.0 9.4 11.8 13.7 20.0 12.6 15.9 10.4
2000 8.4 15.2 12.4 11.4 19.6 13.3 17.2 11.9 15.3 10.1 2001 7.8 11.1 11.2 11.8 12.2 13.5 15.3 13.1 12.1 10.1 2002 7.8 13.9 8.6 13.1 11.4 15.0 15.8 13.1 9.5 9.9
2003 2 10.3 15.5 9.4 12.5 15.6 13.4 16.3 14.0 13.4 9.2 2004 2 9.0 14.2 8.4 9.9 10.6 14.7 22.8 11.4 10.7 12.6 2005 2 8.1 13.7 9.6 10.6 11.4 14.3 17.8 11.6 13.7 9.9 2006 2 8.7 12.8 8.7 10.6 19.3 12.8 21.2 12.6 12.4 11.4 2007 2 9.5 12.7 10.6 14.1 14.7 11.6 23.6 12.7 13.4 10.9 2008 2 8.1 13.9 9.5 14.3 13.3 11.0 17.7 11.9 10.5 9.2 2009 2 9.1 13.6 9.1 12.2 18.9 15.5 22.5 13.5 14.5 10.7
2010 2 8.6 14.3 10.6 11.5 13.4 13.0 18.0 11.3 14.7 10.8 2011 2 8.7 15.0 8.7 15.2 10.7 14.4 22.2 14.1 18.6 9.1 2012 2 7.9 13.7 8.9 11.4 9.0 14.6 24.6 14.9 20.0 12.2 2013 2 10.5 15.8 12.6 14.7 19.0 14.6 19.8 14.5 22.6 11.2 2014 2 8.1 12.9 10.2 12.6 8.7 14.6 18.3 11.2 14.1 10.9 2015 2 10.2 12.1 10.9 13.8 11.7 14.7 16.1 13.5 12.0 9.7 2016 2 8.4 12.8 12.1 11.3 3.9 13.1 13.3 11.7 14.6 8.5 2017 2 8.0 8.7 8.6 12.9 14.1 14.5 12.5 10.2 14.0 10.1 2018 2 7.4 9.7 11.6 10.6 11.5 14.0 10.9 9.8 12.9 9.0 2019 2 6.8 11.3 8.1 12.4 12.1 13.3 13.2 13.5 11.4 9.1
1 Estimates for NM, CO, WY, and MT are statewide. 2 Preliminary File S:\CF_D\projects\monitoring\harvest data\DATABOOK\HIP\HUNTERSHIP.xls 01/04/21
6

ESTIMATES OF ACTIVE GOOSE HUNTERS BY STATE OF HARVEST (Harvest Information Program) 1
YR CO
1999 15,300
2000 18,400 2001 16,790 2002 16,276
2003 2 15,900 2004 2 14,700 2005 2 14,600 2006 2 12,993 2007 2 14,642 2008 2 16,009 2009 2 15,203
2010 2 10,651 2011 2 11,962 2012 2 13,912 2013 2 14,277 2014 2 14,568 2015 2 12,240 2016 2 15,209 2017 2 14,044 2018 2 12,539 2019 2 13,305
KS
14,400
17,300 15,715 15,248 16,100 15,500 12,000 12,038 14,294 14,692 12,213
10,700 12,900 11,207 15,543 13,716 14,099 15,079 12,328 13,652
9,648
MT
10,700
12,300 10,623 13,848 14,000 12,800
9,700 11,194 11,932 10,206 12,056
10,689 8,949
14,097 6,608
12,533 12,221
8,118 9,681 9,538
10,604
NE
19,400
19,500 18,056 15,290 18,300 15,100 15,400 13,673 12,460 14,522 11,828
13,778 12,126 14,340 13,370 13,186 10,783 13,113 12,970 11,087 11,803
NM
1,700
2,700 3,393 3,367 2,500 2,300 2,000 1,816 1,711 1,488
961
1,722 2,490 2,863 2,027 2,974 1,328 1,816 1,563 3,178 3,215
ND
30,600
26,000 26,500 23,626 27,600 24,700 26,500 23,982 23,123 21,322 20,707
21,609 24,507 25,165 24,815 26,690 28,167 24,953 26,724 23,284 22,134
OK
12,000
7,300 7,818 7,335 8,500
10,000 9,900 9,007
10,843 7,315 7,616
6,526 7,460 7,715 9,886 9,402 7,932 7,685 7,880 8,995
12,059
SD
24,700
21,600 26,283 22,398 20,100 19,200 15,400 17,527 14,010 15,760 14,558
14,174 11,974 14,726 14,280 12,101
9,871 12,823 15,230 14,294 11,366
TX
67,900
67,000 76,647 66,583 47,000 47,400 58,800 56,512 63,638 49,354 36,708
45,974 42,256 31,251 30,347 47,485 29,303 45,732 48,202 43,644 39,238
WY
3,300
4,600 3,720 4,034 4,300 3,600 4,000 3,903 3,927 3,692 3,618
3,845 3,685 3,768 4,629 3,729 3,209 3,870 4,207 3,741 3,257
AVERAGE: 1999-2019 14,453 13,732 11,066 14,290 2,244 24,891 8,723 16,304 49,570 3,840
% CHANGE FROM: Prev. Year 6% Average -8%
-29% -30%
11% -4%
6% -17%
1% 43%
-5% -11%
34% 38%
-20% -30%
-10% -21%
-13% -15%
1 Estimates for NM, CO, WY, and MT are statewide. 2 Preliminary
ESTIMATES OF TOTAL GOOSE HUNTER DAYS AFIELD BY STATE OF HARVEST (Harvest Information Program) 1
YR CO
1999 93,700
2000 111,800 2001 104,290 2002 91,827
2003 2 111,400 2004 2 92,200 2005 2 84,300 2006 2 76,791 2007 2 84,178 2008 2 105,484 2009 2 84,847
2010 2 60,298 2011 2 67,759 2012 2 84,907 2013 2 89,643 2014 2 73,885 2015 2 58,070 2016 2 85,686 2017 2 74,581 2018 2 70,136 2019 2 71,530
KS
93,300
112,200 89,663 79,771
116,200 98,000 84,800 60,994 79,723 83,525 78,955
56,936 75,795 73,084 88,386 80,287 58,244 95,005 57,878 48,522 39,713
MT
(60,300)
(80,800) (59,640) (66,526) (65,200) (61,900) (42,500) (48,671) (51,146) (39,564) (48,432)
(42,167) (40,155) (70,698) (30,910) (56,009) (61,868) (36,324) (50,331) (40,434) (42,485)
NE
144,100
152,000 148,189 128,990 137,500 117,500 129,200
99,211 106,751 114,958
95,594
116,776 112,846 104,267
95,928 107,979
90,318 96,896
108,377 98,046 89,967
NM
6,500
16,400 14,621 19,605 13,300 11,400
8,300 5,778 6,625 5,612 4,703
5,630 15,117 13,749
8,435 9,518 4,549 6,116 6,212 9,538
13,650
ND
160,700
123,500 131,727 118,447 128,900 123,100 132,900 110,170
99,258 94,457 98,155
90,410 109,313 113,170 117,463 123,097 129,667 125,165 118,155 104,422
88,384
OK
54,200
37,000 30,499 36,672 44,100 44,500 42,900 49,321 49,448 41,584 33,183
29,129 29,642 37,363 49,399 50,175 40,397 50,373 27,000 26,000 43,867
SD
165,800
126,400 172,841 148,618 146,700 122,600
93,300 106,573
82,987 86,638 82,845
69,216 66,827 82,889 92,625 55,769 61,049 57,608 77,686 69,066 46,956
TX
232,300
285,500 217,387 192,924 149,700 140,600 183,500 193,737 197,414 170,690 108,890
152,364 192,755
83,923 90,508
155,536 93,334
143,514 141,092 166,610 111,755
WY
16,600
26,400 22,274 22,180 24,600 24,800 20,900 20,099 20,324 20,327 16,979
20,027 17,913 19,203 27,570 17,446 15,910 16,809 23,177 14,775 15,614
CEN FLYWAY
967,200
991,200 931,491 839,034 872,400 774,700 780,100 722,675 726,709 723,277 604,153
600,785 687,965 612,554 659,957 673,692 551,538 677,172 634,158 607,115 521,436
ATL FLYWAY
516,300
519,800 855,800 852,900 830,800 672,100 796,300 691,505 801,635 797,235 804,520
688,930 656,953 695,494 651,718 611,930 601,000 736,220 595,313 513,548 480,090
MISS FLYWAY
2,248,800
2,229,200 2,157,800 2,415,900 2,360,700 2,086,900 1,928,500 1,950,358 1,807,690 1,733,803 1,773,921
1,579,897 1,667,331 1,520,908 1,497,469 1,419,846 1,628,168 1,734,737 1,590,027 1,334,291 1,291,056
PAC 3
FLYWAY
768,200
716,300 651,900 625,000 656,200 668,300 638,400 642,559 595,597 597,100 607,189
583,750 561,512 629,048 492,294 581,571 473,003 473,171 566,480 575,798 503,169
U.S.
4,500,500
4,456,500 4,596,991 4,732,834 4,720,100 4,202,000 4,143,300 4,007,097 3,931,631 3,851,415 3,789,783
3,453,361 3,573,761 3,458,004 3,301,438 3,287,039 3,253,709 3,621,300 3,385,978 3,030,752 2,795,751
AVERAGE: 1999-2019 84,634 78,618 114,066 9,779 116,217 40,322 95,952 162,097 20,187 721,872 684,290 1,807,491 600,311 3,813,964
% CHANGE FROM: Prev. Year 2% Average -15%
-18% -49%
5% -8% -21%
43% 40%
-15% -24%
69% 9%
-32% -51%
-33% -31%
6% -23%
-14% -28%
-7% -30%
-3% -29%
-13% -16%
-8% -27%
1 Estimates for NM, CO, WY, and MT are statewide. MT is summarized in the Pacific Flyway's total and WY, CO, and NM are summarized in the Central Flyway's total.
2 Preliminary 3 Pacific Flyway total includes Alaska
AVERAGE SEASONAL GOOSE HUNTER DAYS AFIELD BY STATE OF HARVEST (Harvest Information Program) 1
YR CO KS MT NE NM ND OK SD TX WY
1999 6.12 6.48 5.64 7.43 3.82 5.25 4.52 6.71 3.42 5.03
2000 6.08 6.49 6.57 7.79 6.07 4.75 5.07 5.85 4.26 5.74 2001 6.21 5.71 5.61 8.21 4.31 4.97 3.90 6.58 2.84 5.99 2002 5.64 5.23 4.80 8.44 5.82 5.01 5.00 6.64 2.90 5.50
2003 2 7.01 7.22 4.66 7.51 5.32 4.67 5.19 7.30 3.19 5.72 2004 2 6.27 6.32 4.84 7.78 4.96 4.98 4.45 6.39 2.97 6.89 2005 2 5.77 7.07 4.38 8.39 4.15 5.02 4.33 6.06 3.12 5.23 2006 2 5.91 5.07 4.35 7.26 3.18 4.59 5.48 6.08 3.43 5.15 2007 2 5.75 5.58 4.29 8.57 3.87 4.29 4.56 5.92 3.10 5.18 2008 2 6.59 5.69 3.88 7.92 3.77 4.43 5.68 5.50 3.46 5.51 2009 2 5.58 6.46 4.02 8.08 4.89 4.74 4.36 5.69 2.97 4.69
2010 2 5.66 5.32 3.94 8.48 3.27 4.18 4.46 4.88 3.31 5.21 2011 2 5.66 5.88 4.49 9.31 6.07 4.46 3.97 5.58 4.56 4.86 2012 2 6.10 6.52 5.02 7.27 4.80 4.50 4.84 5.63 2.69 5.10 2013 2 6.28 5.69 4.68 7.17 4.16 4.73 5.00 6.49 2.98 5.96 2014 2 5.07 5.85 4.47 8.19 3.20 4.61 5.34 4.61 3.28 4.68 2015 2 4.74 4.13 5.06 8.38 3.43 4.60 5.09 6.18 3.19 4.96 2016 2 5.63 6.30 4.47 7.39 3.37 5.02 6.56 4.49 3.14 4.34 2017 2 5.31 4.69 5.20 8.36 3.97 4.43 3.43 5.10 2.93 5.51 2018 2 5.59 3.55 4.23 8.84 3.00 4.48 2.89 4.83 3.82 3.95 2019 2 5.38 4.12 5.52 7.62 4.25 3.99 3.64 4.10 2.85 4.79
1 Estimates for NM, CO, WY, and MT are statewide. 2 Preliminary
AVERAGE SEASONAL GOOSE BAG PER HUNTER BY STATE OF HARVEST (Harvest Information Program) 1
YR CO KS MT NE NM ND OK SD TX WY
Central Flyway Databook 202012/22/2020
1999 4.7 5.9 3.2 5.3 4.9 5.7 3.6 6.8 8.1 3.7
2000 5.7 6.9 6.9 6.4 4.6 5.4 8.4 6.1 9.5 6.3 2001 4.2 5.6 4.5 5.6 6.2 6.1 3.1 7.2 6.4 4.0 2002 4.9 7.6 3.7 4.6 3.3 5.5 4.9 7.0 5.9 4.0
2003 2 7.6 9.9 4.8 6.3 4.0 5.4 4.9 9.2 6.4 5.8 2004 2 5.2 6.7 3.6 4.8 3.9 5.6 5.0 6.8 5.2 6.3 2005 2 6.0 9.1 4.0 7.4 3.8 5.8 4.3 6.7 7.8 5.0 2006 2 6.8 7.5 4.6 5.1 2.6 6.4 6.1 9.1 5.3 5.9 2007 2 5.4 5.9 4.8 5.7 6.3 6.0 5.7 7.1 5.7 3.3 2008 2 6.1 8.2 4.0 6.4 3.2 6.3 5.5 7.7 5.5 7.5 2009 2 6.2 9.4 3.8 7.0 6.0 6.6 4.3 8.1 5.4 5.8
2010 2 6.6 7.1 3.8 7.8 3.2 6.0 4.9 6.8 5.5 6.4 2011 2 4.6 7.1 4.9 6.4 5.8 6.0 4.3 8.9 5.6 4.3 2012 2 7.1 8.3 5.7 7.9 3.9 7.3 6.5 9.6 6.7 7.8 2013 2 7.4 9.8 6.6 10.0 3.1 8.0 10.1 10.8 4.9 6.1 2014 2 7.7 15.9 5.5 8.7 3.9 7.1 6.5 7.5 7.2 5.5 2015 2 6.6 7.7 6.0 8.4 1.7 5.8 5.3 7.4 3.2 5.7 2016 2 7.6 8.5 5.2 9.8 1.2 7.2 6.4 6.8 4.3 6.5 2017 2 9.1 9.3 5.6 11.0 1.3 8.2 7.7 8.2 4.8 8.5 2018 2 6.2 4.8 5.6 9.0 3.2 6.0 4.4 5.2 3.4 5.4 2019 2 5.2 7.3 6.1 9.0 1.6 7.2 5.4 6.7 4.4 7.0
1 Estimates for NM, CO, WY, and MT are statewide. 2 Preliminary File S:\CF_D\projects\monitoring\harvest data\DATABOOK\HIP\HUNTERSHIP.xls 01/04/21
7

Central Flyway Databook 202012/22/2020
ESTIMATED ACTIVE MID-CONTINENT SANDHILL CRANE HUNTERS¹ IN THE CENTRAL FLYWAY AND MINNESOTA
YR CO KS MT NM ND OK SD TX WY CF TOTAL MN
1975 226 69 806 2,896 80 117 2,733 22 6,949 1976 203 68 752 1,328 148 80 2,497 16 5,092 1977 189 40 921 4,126 339 77 2,329 27 8,048 1978 190 86 836 3,776 334 50 2,390 21 7,683 1979 275 61 745 3,225 307 29 2,356 13 7,011
1980 216 50 625 3,387 275 160 2,439 12 7,164 1981 216 23 598 3,315 269 103 2,543 14 7,081 1982 138 56 386 2,429 342 260 1,553 8 5,172 1983 211 64 253 3,551 384 225 2,435 20 7,143 1984 206 51 301 3,189 467 208 2,380 19 6,821 1985 187 37 216 2,383 372 168 2,613 12 5,988 1986 106 17 178 3,095 299 149 1,991 5 5,840 1987 113 29 133 2,529 358 120 1,942 5 5,229 1988 117 48 171 1,779 531 78 2,497 11 5,232 1989 74 52 152 2,018 492 153 2,805 6 5,752
1990 101 33 180 2,614 395 172 4,130 6 7,631 1991 153 69 220 1,674 370 139 3,231 3 5,859 1992 96 95 182 1,776 330 153 2,655 7 5,294 1993 87 294 97 218 2,223 357 140 3,602 5 7,023 1994 93 293 79 211 2,497 456 151 3,350 11 7,141 1995 154 393 118 211 2,408 331 143 3,707 6 7,471 1996 91 382 82 166 2,744 355 169 3,356 9 7,354 1997 67 452 68 124 2,386 264 178 4,515 10 8,064 1998 96 480 43 155 2,785 345 237 4,022 10 8,173 1999 133 533 60 204 2,444 375 173 2,699 8 6,629
2000 192 430 64 160 2,481 223 209 3,180 11 6,950 2001 202 555 72 173 2,934 391 145 3,554 13 8,039 2002 175 517 85 166 2,407 237 144 4,037 15 7,783
2003 2 236 495 60 244 2,271 64 114 4,821 10 8,315 2004 2 315 539 93 252 2,491 265 79 5,121 16 9,171 2005 2 280 274 90 233 3,370 259 165 5,383 24 10,078 2006 2 144 445 71 245 3,272 243 144 5,531 25 10,120 2007 2 158 255 82 241 3,145 166 57 5,685 19 9,808 2008 2 191 283 84 239 2,815 255 64 6,338 24 10,293 2009 2 159 213 50 286 3,546 371 63 3,179 67 7,934
2010 2 302 182 93 192 3,474 332 52 4,187 29 8,843 964 2011 2 138 449 95 206 3,733 418 44 2,712 41 7,836 643 2012 2 139 214 59 270 3,332 160 54 2,972 39 7,239 410 2013 2 118 235 94 276 3,326 638 91 5,473 35 10,286 485 2014 2 89 151 88 252 1,743 231 56 5,145 70 7,825 401 2015 2 126 334 115 263 1,430 158 --- 3 3,241 78 5,745 424 2016 2 144 332 113 310 1,504 219 39 6,746 96 9,503 471 2017 2 221 710 98 360 1,562 246 71 7,066 305 10,639 397 2018 2 178 457 175 416 1,626 258 73 8,807 94 12,084 383 2019 2 174 554 152 549 1,124 --- 4 41 10,072 138 12,804 333
AVERAGES:
1975-79 217 65 812 3,070 242 71 2,461 20 6,957 1980-89 158 43 301 2,768 379 162 2,320 11 6,142 1990-99 107 404 74 187 2,355 358 166 3,527 8 7,064 2000-09 205 401 75 224 2,873 247 118 4,683 22 8,849 2010-19 163 362 108 309 2,285 296 58 5,642 93 9,280 491 1975-2019 165 387 74 317 2,626 312 121 3,867 32 7,736
¹ Those permittees reporting hunting cranes 1 or more times 11/09/20
² Preliminary 3 All hunters put in stratum "did not hunt" or "no" in state HIP sample frame, so no estimate is available. 4 Hunter name and address data not supplied, so no estimate is available.
8

Central Flyway Databook 202012/22/2020
1965
1970
1975
1980
1985
1990
1995
2000
2005
2010
2015
NUMBER OF ACTIVE TUNDRA SWAN HUNTERS FOR THE EASTERN AND WESTERN POPULATIONS (STATE OF HARVEST)
YR TOTAL EASTERN POPULATION
MT ND SD NC VA DE TOTAL WESTERN POPULATION
UT NV MT AK TOTAL
1964 940 940 940 915 915 915
1966 950 950 950 1967 910 910 910 1968 930 930 930 1969 2,225 2,225 2,225
2,200 275 2,475 2,475 1971 2,146 415 245 2,806 2,806 1972 2,100 400 265 2,765 2,765 1973 2,175 375 230 2,780 2,780 1974 2,200 385 350 2,935 2,935
2,175 390 350 2,915 2,915 1976 2,150 410 380 2,940 2,940 1977 2,264 380 2,644 2,644 1978 2,150 370 350 2,870 2,870 1979 2,150 390 390 2,930 2,930
2,100 395 400 2,895 2,895 1981 2,225 445 330 3,000 3,000 1982 2,200 400 340 2,940 2,940 1983 70 70 2,125 507 375 3,007 3,077 1984 58 867 925 2,150 494 305 2,949 3,874
60 5,080 5,140 2,021 436 275 2,732 7,872 1986 51 4,888 4,939 2,075 480 270 2,825 7,764 1987 106 5,014 5,120 1,924 404 395 2,723 7,843 1988 60 301 4,729 519 5,609 1,875 195 355 71 2,496 8,105 1989 117 865 4,446 517 5,945 1,925 262 400 81 2,668 8,613
121 816 485 4,859 499 6,780 2,050 232 370 46 2,698 9,478 1991 131 1,565 850 4,849 488 7,883 1,950 181 185 53 2,369 10,251 1992 139 1,648 1,352 4,675 516 8,330 1,875 71 365 58 2,369 10,699 1993 119 1,603 1,350 4,802 334 8,208 2,025 135 380 83 2,623 10,831 1994 145 1,616 1,260 4,790 489 8,300 2,100 161 405 119 2,785 11,085
175 1,638 900 4,776 495 7,984 2,172 287 340 118 2,917 10,901 1996 219 1,549 840 3,773 476 6,857 2,392 331 415 81 3,219 10,076 1997 262 1,671 872 3,892 503 7,200 2,392 328 395 125 3,240 10,440 1998 308 1,559 851 3,762 481 6,961 2,420 418 415 108 3,361 10,322 1999 282 1,675 690 3,836 445 6,928 2,338 435 390 148 3,311 10,239
260 1,566 606 4,047 513 6,992 1,680 360 301 59 2,400 9,392 2001 233 1,553 827 3,997 510 7,120 1,560 240 340 151 2,291 9,411 2002 200 1,550 693 3,951 485 6,879 1,658 182 305 151 2,296 9,175 2003 199 1,436 587 4,257 520 6,999 1,740 221 250 131 2,342 9,341 2004 230 1,564 579 3,958 526 6,857 1,600 221 400 91 2,312 9,169
240 1,715 539 4,180 527 7,201 1,618 270 380 83 2,351 9,552 2006 211 1,650 543 4,074 520 6,998 1,775 442 325 82 2,624 9,622 2007 213 1,672 700 4,126 509 7,220 1,800 501 400 70 2,771 9,991 2008 193 1,738 653 4,244 523 7,351 1,760 369 385 109 2,623 9,975 2009 193 1,804 752 4,322 492 7,563 1,780 283 405 92 2,560 10,123
207 1,694 665 4,246 500 7,312 1,720 356 360 129 2,565 9,877 2011 192 1,760 740 4,200 454 7,346 1,740 401 390 128 2,659 10,004 2012 213 1,650 680 4,179 452 7,174 1,820 501 370 114 2,805 9,979 2013 202 1,671 722 4,308 442 7,345 1,540 268 375 110 2,293 9,637 2014 265 1,692 739 4,069 417 7,182 1,740 280 345 80 2,445 9,626
276 1,672 802 4,309 545 7,604 1,740 60 360 101 2,261 9,865 2016 262 1,561 582 3,744 444 6,593 1,620 295 360 58 2,333 8,926 2017 128 1,755 625 5,309 522 8,339 1,740 405 200 43 2,388 10,727 2018 223 1,863 619 5,265 532 8,502 1,720 475 305 51 2,551 11,053 2019 201 1,755 685 5,124 565 70 8,400 2,338 442 247 73 3,100 11,500
S:\CF_D\projects\monitoring\harvest data\DATABOOK\HIP\TUNDRASWAN.xlsx 01/04/21
9

Central Flyway Databook 202012/22/2020
1965
1970
1975
1980
1985
1990
1995
2000
2005
2010
2015
AVERAGE SEASONAL TUNDRA SWAN BAG (RETRIEVED & UNRETRIEVED) PER ACTIVE HUNTER
EASTERN POPULATION MT ND SD NC VA DE TOTAL
WESTERN POPULATION UT NV MT AK TOTAL YR TOTAL
1964 0.45 0.45 0.45 0.43 0.43 0.43
1966 0.60 0.60 0.60 1967 0.37 0.37 0.37 1968 0.67 0.67 0.67 1969 0.74 0.79 0.79
0.57 0.65 0.67 0.67 1971 0.60 0.29 0.37 0.53 0.53 1972 0.55 0.35 0.57 0.52 0.52 1973 0.66 0.32 0.49 0.60 0.60 1974 0.72 0.56 0.90 0.72 0.72
0.71 0.57 0.87 0.71 0.71 1976 0.58 0.55 0.40 0.55 0.55 1977 0.83 0.25 0.84 0.84 1978 0.70 0.25 0.47 0.61 0.61 1979 0.71 0.66 0.86 0.73 0.73
0.64 0.30 0.68 0.60 0.60 1981 0.87 0.79 0.59 0.82 0.82 1982 0.69 0.46 0.44 0.63 0.63 1983 0.49 0.49 0.66 0.38 0.63 0.61 0.61 1984 0.39 0.39 0.39 0.60 0.51 0.74 0.60 0.55
0.32 0.55 0.55 0.37 0.36 0.72 0.40 0.50 1986 0.80 0.53 0.53 0.51 0.53 0.80 0.54 0.53 1987 0.26 0.60 0.62 0.33 0.26 0.77 0.38 0.53 1988 0.45 0.72 0.58 0.24 0.55 0.51 0.42 0.79 0.23 0.53 0.55 1989 0.39 0.68 0.53 0.29 0.53 0.44 0.32 0.85 0.27 0.48 0.52
0.51 0.70 0.84 0.64 0.29 0.63 0.50 0.31 0.80 0.35 0.52 0.60 1991 0.41 0.52 0.61 0.65 0.45 0.61 0.48 0.35 0.46 0.15 0.46 0.57 1992 0.27 0.59 0.71 0.62 0.40 0.61 0.26 0.44 0.62 0.29 0.32 0.54 1993 0.18 0.49 0.51 0.62 0.41 0.56 0.19 0.43 0.84 0.36 0.30 0.50 1994 0.44 0.48 0.47 0.82 0.41 0.67 0.42 0.60 0.86 0.35 0.49 0.63
0.34 0.55 0.22 0.67 0.45 0.57 0.19 0.32 0.57 0.49 0.26 0.49 1996 0.30 0.48 0.30 0.61 0.42 0.52 0.48 0.41 0.78 0.65 0.51 0.52 1997 0.44 0.56 0.51 0.64 0.45 0.59 0.38 0.45 0.90 0.52 0.45 0.55 1998 0.29 0.43 0.29 0.65 0.52 0.53 0.59 0.50 0.78 0.48 0.60 0.55 1999 0.34 0.57 0.36 0.61 0.30 0.55 0.46 0.53 0.61 0.65 0.49 0.53
0.50 0.44 0.30 0.67 0.36 0.56 0.39 0.25 0.82 2.00 0.46 0.53 2001 0.42 0.40 0.46 0.63 0.30 0.53 0.20 0.27 0.94 0.77 0.35 0.48 2002 0.28 0.48 0.32 0.63 0.38 0.54 0.34 0.28 0.60 0.36 0.37 0.49 2003 0.29 0.18 0.07 0.58 0.35 0.43 0.50 0.37 0.53 0.63 0.50 0.45 2004 0.48 0.50 0.25 0.46 0.32 0.44 0.45 0.40 0.67 0.60 0.49 0.45
0.42 0.49 0.29 0.62 0.41 0.54 0.54 0.39 0.83 0.55 0.57 0.55 2006 0.30 0.40 0.33 0.59 0.33 0.50 0.53 0.36 0.53 0.88 0.51 0.50 2007 0.30 0.44 0.23 0.57 0.39 0.49 0.50 0.45 0.82 0.93 0.54 0.50 2008 0.29 0.56 0.42 0.61 0.49 0.56 0.42 0.37 0.55 0.62 0.44 0.53 2009 0.36 0.56 0.45 0.54 0.36 0.52 0.50 0.21 0.80 0.88 0.53 0.52
0.22 0.47 0.33 0.62 0.49 0.54 0.46 0.35 0.63 0.54 0.47 0.52 2011 0.34 0.44 0.39 0.61 0.33 0.52 0.43 0.39 0.69 0.76 0.48 0.51 2012 0.38 0.40 0.26 0.62 0.39 0.52 0.52 0.44 0.83 0.48 0.55 0.52 2013 0.34 0.49 0.44 0.60 0.38 0.54 0.26 0.11 0.68 0.58 0.32 0.49 2014 0.35 0.50 0.38 0.61 0.41 0.54 0.48 0.09 0.51 0.60 0.44 0.51
0.40 0.39 0.30 0.62 0.32 0.51 0.57 0.17 0.80 0.72 0.60 0.53 2016 0.34 0.40 0.16 0.56 0.30 0.46 0.55 0.45 0.66 0.66 0.55 0.48 2017 0.41 0.49 0.39 0.62 0.47 0.56 0.52 0.34 0.60 0.65 0.50 0.55 2018 0.27 0.50 0.31 0.54 0.38 0.50 0.60 0.52 0.41 0.78 0.56 0.51 2019 0.36 0.42 0.34 0.59 0.36 0.69 0.51 0.56 0.55 0.63 0.92 0.57 0.53
S:\CF_D\projects\monitoring\harvest data\DATABOOK\HIP\TUNDRASWAN.XLSX 01/05/21
10

Central Flyway Databook 202012/22/2020
DUCK HARVESTS IN THE
UNITED STATES
11

Central Flyway Databook 202012/22/2020
ESTIMATED REGULAR SEASON MALLARD HARVESTS (Harvest Information Program)
YR CO KS
1999 38,337 114,167
2000 49,420 102,846 2001 80,906 97,739 2002 43,032 93,112
2003 1 59,600 95,711
2004 1 47,854 133,582
2005 1 31,089 84,193
2006 1 44,782 55,780
2007 1 39,393 61,041
2008 1 48,486 98,160
2009 1 42,670 80,574
2010 1 28,241 76,639
2011 1 27,372 85,163
2012 1 35,161 78,157
2013 1 34,122 94,432
2014 1 54,497 114,417
2015 1 40,510 112,358
2016 1 47,573 95,986
2017 1 44,130 65,323
2018 1 39,051 72,553
2019 1 38,079 67,012
MT
29,678
29,211 27,151 22,263 38,200 32,575 26,871 18,231 19,229 27,156 25,348
26,288 17,263 18,761 26,289 20,303 26,732 13,302 16,087 33,860 17,554
NE
91,025
118,548 133,947 112,577 127,992
95,874 89,415 86,754 91,047 90,391 84,027
75,236 104,793
94,630 82,415 75,602 72,381 78,575 62,861 50,582 54,848
NM
7,851
21,894 22,872 20,701 25,148 15,646
8,126 12,421
9,276 11,394 13,241
13,642 15,455 15,222 11,563 14,123 12,300
6,845 15,710 11,256 16,397
ND
254,256
182,521 242,147 226,961 231,335 223,924 233,142 162,300 171,224 139,219 169,224
105,146 187,683 187,963 178,721 213,079 189,295 163,808 171,745 157,338 104,946
OK
114,589
116,379 92,830
121,494 110,031 186,755 125,375 126,446 219,572
97,524 104,072
90,298 101,595 118,526 134,470 148,826 118,530 131,487
79,361 118,270 113,463
SD
145,196
110,607 154,993 117,085 124,593
93,993 81,701 72,734 83,640 76,643
108,581
83,910 100,254
99,769 81,098 81,560 63,712 48,402 44,934 50,841 60,185
TX
182,755
283,116 300,903 232,687 130,070 117,021 171,208 111,196
86,931 70,234 74,524
89,514 113,557
92,801 68,282 73,761 65,403
118,700 96,236
103,378 47,491
WY
17,675
21,447 24,870 23,736 19,430 22,210 17,025 19,308 25,345 17,581 19,214
14,300 20,075 22,154 28,693 17,306 13,226 11,177 14,589 13,915
8,790
CEN FLYWAY
995,529
1,035,989 1,178,358 1,013,648
962,110 969,434 868,145 709,952 806,698 676,788 721,475
603,214 773,210 763,144 740,085 813,474 714,447 715,855 610,976 651,044 528,765
ATL FLYWAY
444,068
522,968 472,682 538,846 427,301 422,004 444,305 399,651 429,917 503,480 419,279
394,429 315,897 324,713 328,029 294,063 250,114 313,511 286,376 277,119 222,255
MISS FLYWAY
3,136,859
3,272,671 2,796,047 2,374,276 2,482,378 2,199,931 2,049,383 2,286,251 2,514,119 2,281,761 2,075,916
2,228,872 2,240,248 1,882,553 1,836,788 1,992,450 1,695,598 1,826,117 1,643,472 1,407,353 1,454,937
PAC 2
FLYWAY
1,318,473
1,237,479 1,031,568
906,787 1,058,281
940,160 1,105,095 1,272,165 1,127,524 1,092,094
917,944
939,498 1,079,618
964,088 732,483 803,447 773,155 863,500 884,735
1,038,273 690,115
U.S.
5,894,929
6,069,107 5,478,655 4,833,557 4,930,070 4,531,529 4,466,928 4,668,019 4,878,258 4,554,123 4,134,614
4,166,013 4,408,973 3,934,498 3,637,385 3,903,434 3,433,314 3,718,983 3,425,559 3,373,789 2,896,072
AVERAGE: 1999-2019 43,538 89,474 24,398 89,215 14,337 185,523 122,376 89,735 125,227 18,670 802,492 382,429 2,175,142 989,356 4,349,419
% CHANGE FROM: Prev. Year -2% -8% Average -13% -25%
-48% -28%
8% -39%
46% 14%
-33% -43%
-4% -7%
18% -33%
-54% -62%
-37% -53%
-19% -34%
-20% -42%
3% -33%
-34% -30%
-14% -33%
1 Preliminary FILE: S:\CF_D\projects\DATABOOK\MONITORING\HARVEST DATA\HIP\DABHARVHIP.XLS 01/04/21 2 Pacific Flyway total includes Alaska
ESTIMATED REGULAR SEASON GADWALL HARVESTS (Harvest Information Program)
YR CO
1999 7,081
2000 8,540 2001 8,062 2002 5,121 2003 1 10,360 2004 1 8,574 2005 1 10,388 2006 1 9,602 2007 1 7,914 2008 1 10,409 2009 1 9,482
2010 1 4,137
2011 1 4,136 2012 1 7,192 2013 1 14,874 2014 1 6,183 2015 1 9,713 2016 1 8,395 2017 1 12,443 2018 1 5,912 2019 1 10,407
KS
27,189
29,363 19,154 36,572 41,063 41,374 21,629 30,594 27,687 34,080 27,589
30,940 29,553 32,473 34,188 13,648 31,068 13,981 19,380 14,722 17,826
MT
1,663
2,570 1,682 2,137 1,860 1,786 1,198 1,582 2,069 2,451 3,466
1,766 4,384 1,960 3,721 2,739 1,273 1,282 1,676 4,283 4,072
NE
16,045
23,452 13,535 21,212 20,928 12,848 9,495
12,459 10,820 14,915 13,059
9,262 16,134 8,893
15,257 5,254 8,699 8,446
14,425 5,850 7,803
NM ND
2,535 106,500
7,003 94,423 6,584 82,880 4,732 98,282 7,480 96,155 4,364 125,440 5,157 95,382 3,892 63,324 2,978 57,159 3,177 46,058 4,626 93,530
3,782 55,061 3,768 65,673 1,307 60,668 4,176 65,052 2,547 85,704
850 70,999 1,069 70,781 3,283 58,766 3,457 75,234 3,985 70,395
OK
62,244
44,235 25,834 40,718 40,657 69,687 57,475 68,983 87,577 54,380 68,047
56,302 71,914 84,037 96,304 61,881 47,943 39,748 39,612 42,655 54,908
SD TX
41,960 290,029
24,162 373,472 29,023 302,957 36,700 163,686 37,432 163,195 35,867 178,924 28,511 269,041 34,033 236,409 25,697 169,311 24,876 147,137 31,363 207,963
21,671 182,980 20,910 337,206 29,082 310,375 19,511 199,328 15,535 227,865 20,293 137,215 9,539 195,296
19,639 160,607 24,185 147,034 22,303 144,861
WY
1,306
2,193 2,073 2,482 3,600 4,194 1,686 2,498 2,614 1,941 2,091
1,735 2,305
972 3,137
679 912
1,042 3,973 2,207 2,666
CEN FLYWAY
556,552
609,413 491,784 411,642 422,730 483,058 499,962 463,376 393,826 339,424 461,216
367,636 555,983 536,959 455,548 422,035 328,965 349,579 333,804 325,539 339,226
ATL FLYWAY
62,212
67,496 33,785 39,803 38,479 24,269 34,337 33,252 38,950 36,313 33,448
53,420 68,561 49,318 79,891 90,036 58,906 92,160 64,618 62,214 42,126
MISS FLYWAY
1,069,106
1,267,013 845,701 661,701 851,315 654,488 635,321 803,393 842,192 906,308 713,277
1,098,694 1,473,197 1,240,234 1,009,467
947,364 559,520 662,282 623,532 421,296 537,060
PAC 2
FLYWAY
133,826
132,510 122,398 118,960 154,056 202,161 194,332 244,379 199,854 182,226 193,833
215,534 213,633 194,222 129,649 123,360 155,898 149,415 198,234 138,329 129,688
U.S.
1,821,696
2,076,432 1,493,668 1,232,106 1,466,580 1,363,976 1,363,952 1,544,400 1,474,822 1,464,271 1,401,774
1,735,284 2,311,374 2,020,733 1,674,555 1,582,795 1,103,289 1,253,436 1,220,188
947,378 1,048,100
AVERAGE: 1999-2019 8,520 27,337 2,363 12,800 3,845 77,975 57,864 26,300 216,423 2,205 435,631 52,552 848,689 167,928 1,504,800
% CHANGE FROM: Prev. Year 76% Average 22%
21% -35%
-5% 72%
33% -39%
15% -6% 4% -10%
29% -5%
-8% -1% -15% -33%
21% 21%
4% -22%
-32% -20%
27% -37%
-6% -23%
11% -30%
1 Preliminary FILE: S:\CF_D\projects\DATABOOK\MONITORING\HARVEST DATA\HIP\DABHARVHIP.XLS 01/04/21 2 Pacific Flyway total includes Alaska
ESTIMATED REGULAR SEASON AMERICAN WIGEON HARVESTS (Harvest Information Program)
YR CO
1999 4,070
2000 4,620 2001 9,052 2002 9,067 2003 1 8,697 2004 1 9,038 2005 1 6,340 2006 1 7,020 2007 1 5,069 2008 1 9,314 2009 1 5,438
2010 1 2,968
2011 1 4,623 2012 1 4,994 2013 1 7,656 2014 1 4,170 2015 1 8,291 2016 1 3,576 2017 1 7,524 2018 1 9,957 2019 1 4,967
KS
7,075
12,520 6,265
13,032 15,513 13,371 7,332 7,944 6,638
17,760 11,511
8,415 8,262 7,959 9,460 4,975 9,803 3,760 7,185 4,880 5,600
MT
3,741
1,456 1,842 1,861 1,156 2,491 2,111 2,248 2,587 2,255 2,491
1,079 1,507 4,340 4,682 1,934 1,114 2,083 1,089 2,008 2,443
NE
7,714
13,143 6,378
14,967 13,328 11,272 9,043
10,706 9,377
11,450 8,935
11,542 10,703 7,782 8,737 3,697 5,155 7,088 7,543 4,230 4,284
NM
2,077
5,013 6,353 3,509 6,147 3,879 3,748 2,932 3,207 3,141 3,824
6,432 2,612 2,614 4,898 2,315 2,994 2,112
11,138 6,673 6,137
ND
22,536
22,025 24,450 30,998 23,742 44,458 22,286 16,704 12,476 13,690 21,181
11,575 12,294 13,903 13,792 20,186 14,221 21,056 19,982 22,961 19,559
OK
14,452
10,811 7,289
14,171 11,322 23,171 16,307 21,394 15,504 17,279 19,257
14,585 16,736 33,032 32,175 17,112 11,556 11,908 10,618 13,043 19,198
SD TX
11,400 126,778
8,680 136,975 12,227 128,029 14,653 85,108 15,374 52,028 17,593 97,800 7,478 126,495
11,382 115,868 6,298 93,396 9,971 68,468
10,530 98,046
5,551 68,123 8,020 98,896 7,642 119,114 7,035 86,675 5,031 75,310 4,845 42,203 5,676 67,690 6,038 76,775 6,532 42,434 8,513 44,962
WY
1,828
1,868 3,036 3,441 3,699 3,241 2,230 2,363 3,100 2,337 4,082
2,221 2,062 1,555 3,045 1,163 1,327 1,294 4,315 2,207 1,714
CEN FLYWAY
201,671
217,111 204,921 190,807 151,006 226,314 203,370 198,561 157,652 155,665 185,295
132,491 165,715 202,935 178,155 135,893 101,509 126,243 152,207 114,925 117,377
ATL FLYWAY
49,592
38,970 37,637 32,466 39,505 19,374 20,686 39,999 25,536 29,563 33,514
39,782 44,367 23,837 34,734 39,094 29,869 55,342 26,442 51,136 19,483
MISS FLYWAY
170,804
217,539 172,897 144,517 120,737 149,793 121,240 163,839 148,774 160,218 96,709
129,962 135,571 137,133 95,602 84,575 63,988 91,897
108,267 65,348 69,814
PAC 2
FLYWAY
399,611
301,307 323,570 297,414 283,489 354,438 356,128 451,819 486,885 527,669 396,248
411,513 408,483 409,474 327,186 349,751 395,943 346,085 403,919 423,202 327,185
U.S.
821,678
774,927 739,025 665,204 594,737 749,919 701,424 854,218 818,847 873,115 711,766
713,748 754,136 773,379 635,677 609,313 591,309 619,567 690,835 654,611 533,859
AVERAGE: 1999-2019 6,498 9,012 2,215 8,908 4,369 20,194 16,710 9,070 88,151 2,482 167,611 34,806 126,154 380,063 708,633
% CHANGE FROM: Prev. Year -50% Average -24%
15% -38%
22% 10%
1% -52%
-8% 40%
-15% -3%
47% 15%
30% 6% -6% -49%
-22% -31%
2% -30%
-62% -44%
7% -45%
-23% -14%
-18% -25%
1 Preliminary FILE: S:\CF_D\projects\DATABOOK\MONITORING\HARVEST DATA\HIP\DABHARVHIP.XLS 2 Pacific Flyway total includes Alaska
12

Central Flyway Databook 202012/22/2020
ESTIMATED REGULAR SEASON NORTHERN PINTAIL HARVESTS (Harvest Information Program)
YR CO
1999 895
2000 2,310 2001 1,839 2002 1,738 2003 1 2,174 2004 1 1,275 2005 1 764 2006 1 726 2007 1 1,778 2008 1 1,781 2009 1 2,649
2010 1 630
2011 1 2,311 2012 1 1,299 2013 1 3,281 2014 1 1,294 2015 1 2,132 2016 1 777 2017 1 723 2018 1 467 2019 1 828
KS
5,410
7,453 7,339 4,624 4,157 3,280 3,666 2,704 2,591 6,872 5,664
5,437 5,243 6,367
12,115 4,847 6,033 5,169 4,160 3,335 3,453
MT
998
857 641 758 653 705 685 333 345 588
1,083
883 959
2,380 1,200 1,772
318 321 168 937 181
NE
5,245
7,474 6,845 4,224 2,974 3,030 3,052 1,477 4,328 4,218 3,093
2,992 9,585 1,806 3,652 2,530 2,148 2,111 3,970 2,970 2,907
NM ND
1,091 26,716
3,022 18,645 2,426 21,272
631 17,181 2,063 17,806
711 21,004 1,113 20,670 1,706 10,596
973 11,585 876 7,657 968 18,840
2,509 11,250 1,927 28,635 2,076 21,126 2,248 24,136 2,161 25,263 2,225 23,918 1,176 20,461 3,048 16,525
402 19,656 1,511 14,561
OK
6,259
5,626 3,752 2,078 1,132 5,706 5,614 2,331 5,447 4,982 6,599
11,153 16,736 7,448 9,320 7,433 6,403
11,740 8,440 3,701 5,952
SD
12,984
8,211 12,474 9,312 6,149 4,763 5,141 4,781 5,794 3,626 8,492
12,917 14,752 11,463 10,087 7,326 5,210 2,601 4,068 3,972 8,513
TX
69,435
81,975 79,077 19,590 18,383 22,330 37,834 41,426 54,840 41,198 42,868
68,821 106,893 101,855 64,374 54,595 36,016 64,127 60,949 27,765 34,424
WY
871
325 386 566 148 477 381 270 547 431 747
417 546 583 277 388 166 288 411 184 127
CEN FLYWAY
129,904
135,898 136,051 60,702 55,639 63,281 78,920 66,350 88,228 72,229 91,003
117,009 187,587 156,403 130,690 107,609 84,569
108,771 102,462 63,389 72,457
ATL FLYWAY
25,101
20,050 20,619 17,220 18,134 10,254 17,339 20,282 19,076 21,298 15,056
23,522 17,831 12,609 21,367 17,685 17,501 25,407 16,280 17,539 8,963
MISS FLYWAY
153,304
153,036 125,148 99,759
119,005 90,542
107,276 104,286 162,416 158,218 106,727
196,185 212,499 156,593 155,104 115,368 95,746
101,514 134,643 68,949 74,589
PAC 2
FLYWAY
230,405
203,033 159,798 130,183 144,020 147,040 208,495 239,423 259,447 284,676 285,976
367,952 391,533 357,842 231,175 230,528 249,372 231,775 203,492 270,082 161,711
U.S.
538,714
512,017 441,616 307,864 336,798 311,117 412,030 430,341 529,167 536,421 498,762
704,668 809,450 683,447 538,336 471,190 447,188 467,467 456,877 419,959 317,720
AVERAGE: 1999-2019 1,508 5,234 798 3,840 1,660 18,929 6,564 7,745 53,751 406 100,436 18,244 128,138 237,522 484,340
% CHANGE FROM: Prev. Year 77% Average -45%
4% -34%
-81% -77%
-2% -24%
276% -26% -9% -23%
61% -9%
114% 10%
24% -36%
-31% -69%
14% -28%
-49% -51%
8% -42%
-40% -32%
-24% -34%
1 Preliminary FILE: S:\CF_D\projects\DATABOOK\MONITORING\HARVEST DATA\HIP\DABHARVHIP.XLS 01/04/21 2 Pacific Flyway total includes Alaska
ESTIMATES OF REGULAR SEASON NORTHERN SHOVELER HARVESTS (Harvest Information Program)
YR CO
1999 1,791
2000 2,030 2001 1,414 2002 2,067 2003 1 4,732 2004 1 2,781 2005 1 3,972 2006 1 3,389 2007 1 5,780 2008 1 3,561 2009 1 2,371
2010 1 1,889
2011 1 730 2012 1 3,396 2013 1 11,155 2014 1 1,150 2015 1 3,790 2016 1 311 2017 1 723 2018 1 467 2019 1 1,064
KS
4,578
1,789 3,401 3,783 4,258 5,298 4,277 6,254 4,210 2,400 7,674
9,321 8,262 2,706
12,945 4,592 4,524 3,290 7,468 4,474 8,213
MT
914
771 240 551 754 188 399 749
1,035 392
2,058
785 2,192 1,120 3,721 2,417 1,114 1,923
84 2,008 1,357
NE
6,017
3,221 4,356 4,499 5,618 2,424 3,617 5,353 7,053 4,068 4,124
5,842 9,904 3,057 6,259 1,751 1,503 2,262 2,779 3,420 5,202
NM ND
1,303 22,899
1,548 11,339 2,426 17,957 1,538 19,464 1,934 19,290 1,972 22,404 1,150 20,208 2,985 16,080 1,718 19,987 1,278 12,066
566 39,909
1,237 21,743 642 28,012 846 27,626
1,847 30,227 2,392 29,866
364 23,702 1,283 26,290 2,228 19,645 1,930 29,485 1,511 29,381
OK
5,462
3,530 1,394 3,873 4,838 7,781 8,688 6,720
10,476 7,632 7,573
8,472 9,545
10,363 17,086 6,568 6,247 6,373 4,628 2,644 9,791
SD
14,250
5,630 16,302 9,449 9,759 9,331 8,974 7,285
10,455 4,834
11,888
11,957 8,736
10,189 15,795 8,032
13,529 5,203 7,945 8,473
15,919
TX
63,389
71,761 85,581 41,357 36,593 51,444 86,368 55,443 80,465 28,839 62,213
78,354 106,360 95,065 74,490 85,570 29,719 59,755 64,585 34,750 56,905
WY
697
569 145
1,045 493 858 163 135 61
144 299
555 364 583
0 194 332 144 411 307 444
CEN FLYWAY
121,300
102,188 133,216 87,626 88,269
104,481 137,816 104,393 141,240 65,214
138,675
140,155 174,747 154,951 173,525 142,532 84,824
106,834 110,496 87,958
129,787
ATL FLYWAY
17,350
17,950 21,468 14,688 12,748 9,865
18,672 12,496 15,045 11,415 19,202
29,651 32,087 33,027 27,862 39,505 22,748 30,290 26,307 20,642 10,103
MISS FLYWAY
201,054
196,306 235,899 126,468 206,977 158,905 195,236 225,100 289,071 251,531 283,039
475,080 375,091 390,664 355,369 294,147 155,091 193,823 237,114 127,149 141,852
PAC 2
FLYWAY
192,837
131,756 148,577 140,152 157,744 206,157 189,925 301,358 369,431 259,185 202,584
289,755 334,732 373,731 265,103 228,570 281,339 172,988 211,559 198,581 168,802
U.S.
532,541
448,200 539,160 368,934 465,738 479,408 541,649 643,347 814,787 587,345 643,500
934,641 916,657 952,373 821,859 704,754 544,002 503,935 585,476 434,330 450,544
AVERAGE: 1999-2019 2,789 5,415 1,180 4,397 1,557 23,218 7,128 10,187 64,238 378 120,487 21,101 243,570 229,756 614,913
% CHANGE FROM: Prev. Year 128% Average -62%
84% 52%
-32% 15%
52% 18%
-22% 0% -3% 27%
270% 37%
88% 56%
64% -11%
45% 17%
48% 8%
-51% -52%
12% -42%
-15% -27%
4% -27%
1 Preliminary FILE: S:\CF_D\projects\DATABOOK\MONITORING\HARVEST DATA\HIP\DABHARVHIP.XLS 01/04/21 2 Pacific Flyway total includes Alaska
ESTIMATED REGULAR SEASON WOOD DUCK HARVESTS (Harvest Information Program)
YR CO
1999 1,628
2000 1,750 2001 1,980 2002 1,362 2003 1 1,790 2004 1 2,781 2005 1 1,222 2006 1 1,130 2007 1 1,067 2008 1 2,876 2009 1 1,952
2010 1 1,079
2011 1 2,555 2012 1 400 2013 1 1,312 2014 1 2,013 2015 1 2,369 2016 1 777 2017 1 1,736 2018 1 1,089 2019 1 828
KS
4,439
2,683 3,938 3,153 3,751 3,027 1,589 2,874 1,133 3,600 3,106
3,366 2,224 1,114 2,655 1,403 1,508 1,645 1,512 1,464 2,053
MT
1,330
600 1,362
827 553 658 628 583
1,380 588
1,083
785 1,096
0 720 322
1,273 801 503 535
1,357
NE
11,725
6,958 2,334 3,489 3,084 3,273 4,748 1,846 5,530 5,122 3,093
6,412 4,792
973 2,608 2,822 4,189 3,167 2,779 3,060 2,524
NM
422
1,622 1,271 1,065
559 453 482 746 630 511 330
459 599 231 642 772 809 241 469
1,206 504
ND
2,726
1,963 1,105 2,043 2,226 2,217 1,963 2,368 1,528 1,276 2,341
1,406 1,556 2,347 2,988 2,715 1,616 2,260 2,782 2,522 3,619
OK
7,965
3,640 1,394 3,118 7,823 7,954
10,426 4,251
12,571 5,936 4,868
3,539 3,792
972 3,107 9,334 6,715 3,689 4,492 4,054 6,911
SD
6,334
5,630 3,582 4,930 6,149 3,791 4,020 3,984 4,031 4,230 2,831
2,776 6,302 5,731 4,778 4,060 3,017 3,547 1,907 3,531 4,597
TX
87,574
93,761 95,166 64,430 49,600 50,031 42,038 30,836 47,178 30,997 27,919
36,502 23,458 20,088 14,484 19,553 18,450 68,985 94,097 52,562 46,929
WY
348
81 578 305 247 95
272 945 486 180 249
347 182 194
0 339 166 539 274 245 349
CEN FLYWAY
124,491
118,688 112,710 84,722 75,782 74,280 67,388 49,563 75,534 55,316 47,772
56,671 46,556 32,050 33,294 43,333 40,112 85,651
110,551 70,268 69,671
ATL FLYWAY
391,514
378,122 399,985 347,202 336,934 264,438 321,780 330,722 334,952 363,920 356,270
448,363 416,006 444,727 325,518 401,405 314,935 386,755 453,217 370,534 363,556
MISS FLYWAY
924,461
761,300 597,152 660,754 711,420 697,338 663,704 601,793 593,133 628,122 622,578
900,995 905,281 764,894 760,820 593,688 546,108 576,800 602,061 396,092 479,607
PAC 2
FLYWAY
52,247
54,547 54,200 34,503 40,962 35,711 55,545 58,845 53,088 60,319 45,659
49,688 41,627 37,648 26,184 29,317 25,957 23,855 44,938 31,118 24,691
U.S.
1,492,713
1,312,657 1,164,047 1,127,181 1,165,098 1,071,767 1,108,417 1,040,923 1,056,707 1,107,677 1,072,279
1,455,717 1,409,470 1,279,319 1,145,816 1,067,743
927,112 1,073,061 1,210,767
868,012 937,525
AVERAGE: 1999-2019 1,605 2,487 809 4,025 668 2,170 5,550 4,274 48,316 306 70,210 369,088 666,100 41,936 1,147,334
% CHANGE FROM: Prev. Year -24% Average -48%
40% -17%
154% 68%
-18% -37%
-58% -25%
43% 67%
70% 25%
30% 8%
-11% -3%
42% 14%
-1% -1%
-2% -1%
21% -28%
-21% -41%
8% -18%
1 Preliminary FILE: S:\CF_D\projects\DATABOOK\MONITORING\HARVEST DATA\HIP\DABHARVHIP.XLS 2 Pacific Flyway total includes Alaska
13

Central Flyway Databook 202012/22/2020
ESTIMATED REGULAR SEASON AMERICAN BLACK DUCK HARVESTS (Harvest Information Program)
YR CO
1999 0
2000 0 2001 0 2002 0 2003 1 0 2004 1 0 2005 1 0 2006 1 0 2007 1 0 2008 1 0 2009 1 0
2010 1 0
2011 1 0 2012 1 0 2013 1 0 2014 1 0 2015 1 0 2016 1 0 2017 1 0 2018 1 0 2019 1 0
KS
0
0 0 0 0 0 0 0 0 0 0
0 0 0 0 0 0 0 0 0 0
MT
0
0 0 0 0 0 0 0 0 0 0
0 0 0 0 0 0 0 0 0 0
NE
0
0 0 0 0 0 0 0 0 0 0
0 0 0 0 0 0 0 0 0 0
NM
0
0 0 0 0 0 0 0 0 0 0
0 0 0 0 0 0 0 0 0 0
ND
0
0 0
240 0 0
115 0 0
116 0
0 156
0 0 0 0 0 0 0 0
OK
0
0 0 0 0 0 0 0 0 0 0
107 0 0 0 0 0 0 0 0 0
SD
0
0 0 0
134 0 0 0 0 0 0
0 0 0
133 0 0 0 0 0
85
TX
0
0 0
218 0 0 0 0 0
196 220
233 0 0 0 0 0 0 0
349 0
WY
0
0 0 0 0 0 0 0 0 0 0
0 0 0 0 0 0 0 0 0 0
CEN FLYWAY
0
0 0
458 134
0 115
0 0
312 220
340 156
0 133
0 0 0 0
349 85
ATL FLYWAY
101,997
116,096 95,889
125,469 95,108 74,920 93,406 93,356 98,705 90,196 81,287
92,204 66,203 73,871 75,104 56,511 45,986 60,875 85,758 71,781 59,316
MISS FLYWAY
57,682
58,371 31,816 47,796 33,150 35,692 36,365 35,840 38,692 29,641 30,373
27,073 21,992 20,688 24,951 15,885 16,254 25,956 17,855 16,032 20,357
PAC 2
FLYWAY
0
0 0 0 0 0 0 0 0 0 0
0 0 0 0 0 0 0 0 0 0
U.S.
159,679
174,467 127,705 173,723 128,392 110,612 129,886 129,196 137,397 120,149 111,880
119,617 88,351 94,559
100,188 72,396 62,240 86,831
103,613 88,162 79,758
AVERAGE: 1999-2019 0 0 0 0 0 30 5 17 58 0 110 83,526 30,593 0 114,229
% CHANGE FROM: Prev. Year Average -100% -100% 407%
-100% -100%
-76% -22%
-17% -29%
27% -33%
-10% -30%
1 Preliminary FILE: S:\CF_D\projects\DATABOOK\MONITORING\HARVEST DATA\HIP\DABHARVHIP.XLS 2 Pacific Flyway total includes Alaska
ESTIMATED REGULAR SEASON MOTTLED DUCK HARVESTS (Harvest Information Program)
YR CO
1999 0
2000 0 2001 0 2002 0 2003 1 0 2004 1 0 2005 1 0 2006 1 0 2007 1 0 2008 1 0 2009 1 0
2010 1 0
2011 1 0 2012 1 0 2013 1 0 2014 1 0 2015 1 0 2016 1 0 2017 1 0 2018 1 0 2019 1 0
KS
0
0 0 0 0 0 0 0 0 0 0
0 0 0 0 0 0 0 0 0 0
MT
0
0 0 0 0 0 0 0 0 0 0
0 0 0 0 0 0 0 0 0 0
NE
0
0 0 0 0 0 0 0 0 0 0
0 0 0 0 0 0 0 0 0 0
NM
0
0 0 0 0 0 0 0 0 0 0
0 0 0 0 0
81 0 0 0 0
ND
0
0 0 0 0 0 0 0 0 0 0
0 0 0 0 0 0 0 0 0 0
OK
0
0 0 0 0 0 0 0 0 0 0
0 0 0 0 0 0 0 0 0 0
SD
0
0 0 0 0 0 0 0 0 0 0
0 0 0 0 0 0 0 0 0 0
TX
7,607
12,047 14,378 7,401
10,752 14,133 14,904 9,967 8,861
12,163 10,992
10,463 13,062 12,732 3,219 5,034 6,187 4,372 4,919 1,921 4,215
WY
0
0 0 0 0 0 0 0 0 0 0
0 0 0 0 0 0 0 0 0 0
CEN FLYWAY
7,607
12,047 14,378 7,401
10,752 14,133 14,904 9,967 8,861
12,163 10,992
10,463 13,062 12,732 3,219 5,034 6,268 4,372 4,919 1,921 4,215
ATL FLYWAY
5,648
9,074 15,111 13,041 10,361 15,292 10,641 13,800 12,862 14,990 19,135
14,591 13,821 7,939
10,133 7,569 9,611 8,476 7,595
11,160 8,738
MISS FLYWAY
34,349
27,897 32,010 23,469 42,013 34,835 26,333 42,706 51,634 67,785 51,860
55,060 40,557 40,733 36,375 29,300 13,702 10,899 9,149
11,259 9,583
PAC 2
FLYWAY
0
0 0 0 0 0 0 0 0 0 0
0 0 0 0 0 0 0 0 0 0
U.S.
47,604
49,018 61,499 43,911 63,126 64,260 51,878 66,473 73,357 94,938 81,987
80,114 67,440 61,404 49,727 41,903 29,581 23,747 21,663 24,340 22,536
AVERAGE: 1999-2019 0 0 0 0 4 0 0 0 9,016 0 9,020 11,409 32,929 0 53,357
% CHANGE FROM: Prev. Year Average -100%
119% -53%
119% -53%
-22% -23%
-15% -71%
-7% -58%
1 Preliminary FILE: S:\CF_D\projects\DATABOOK\MONITORING\HARVEST DATA\HIP\DABHARVHIP.XLS 2 Pacific Flyway total includes Alaska
ESTIMATED REGULAR SEASON MEXICAN DUCK X MALLARD HYBRID HARVESTS (Harvest Information Program)
YR CO
1999 0
2000 0 2001 0 2002 0 2003 1 0 2004 1 0 2005 1 0 2006 1 0 2007 1 0 2008 1 0 2009 1 139
2010 1 0
2011 1 0 2012 1 0 2013 1 0 2014 1 0 2015 1 0 2016 1 0 2017 1 0 2018 1 0 2019 1 0
KS
0
0 0 0 0 0 0 0 0 0 0
0 0 0 0 0 0 0 0 0 0
MT
0
0 0 0 0 0 0 0 0 0 0
0 0 0 0 0 0 0 0 0 0
NE
0
0 0 0 0 0 0 0 0 0 0
0 0 0 0 0 0 0 0 0 0
NM
211
1,474 809
2,721 2,450 1,390
297 693 286
1,096 566
389 557 231 562 232 40 27
117 884 504
ND
0
0 0 0 0 0 0 0 0 0 0
0 0 0 0 0 0 0 0 0 0
OK
0
0 0 0 0 0 0 0 0 0 0
0 0 0 0 0 0 0 0 0 0
SD
0
0 0 0 0 0 0 0 0 0 0
0 0 0 0 0 0 0 0 0 0
TX
4,876
6,286 6,504 1,088 3,469
283 764
0 718
0 660
930 267
0 0
581 110
0 0 0
141
WY
0
0 0 0 0 0 0 0 0 0 0
0 0 0 0 0 0 0 0 0 0
CEN FLYWAY
5,087
7,760 7,313 3,809 5,919 1,673 1,061
693 1,004 1,096 1,365
1,319 824 231 562 813 150 27
117 884 645
ATL FLYWAY
0
0 0 0 0 0 0 0 0 0 0
0 0 0 0 0 0 0 0 0 0
MISS FLYWAY
0
0 0 0 0 0 0 0 0 0 0
0 0 0 0 0 0 0 0 0 0
PAC 2
FLYWAY
485
1,852 752
1,375 895 279 878 400 853 918 472
877 261 558
1,187 722 85
454 233 557 386
U.S.
5,572
9,612 8,065 5,184 6,814 1,952 1,939 1,093 1,857 2,014 1,837
2,196 1,085
789 1,749 1,535
235 481 350
1,441 1,031
AVERAGE: 1999-2019 7 0 0 0 740 0 0 0 1,270 0 2,017 0 0 689 2,706
% CHANGE FROM: Prev. Year Average -100%
-43% -32% -89%
-27% -68%
-31% -44%
-28% -62%
1 Preliminary FILE: S:\CF_D\projects\DATABOOK\MONITORING\HARVEST DATA\HIP\DABHARVHIP.XLS 2 Pacific Flyway total includes Alaska
14
01/04/21
01/04/21

Central Flyway Databook 202012/22/2020
ESTIMATED REGULAR SEASON BLACK-BELLIED WHISTLING DUCK HARVESTS (Harvest Information Program)
YR CO
1999 0
2000 0 2001 0 2002 0 2003 1 0 2004 1 0 2005 1 0 2006 1 0 2007 1 0 2008 1 0 2009 1 0
2010 1 0
2011 1 0 2012 1 0 2013 1 0 2014 1 0 2015 1 0 2016 1 0 2017 1 0 2018 1 0 2019 1 0
KS
0
0 0 0 0 0 0 0 0 0 0
0 0 0 0 0 0 0 0 0 0
MT
0
0 0 0 0 0 0 0 0 0 0
0 0 0 0 0 0 0 0 0 0
NE
0
0 0 0 0 0 0 0 0 0 0
0 0 0 0 0 0 0 0 0 0
NM
0
0 0 0 0 0 0 0 0 0 0
0 0 0 0 0 0 0 0 0 0
ND
0
0 0 0 0 0 0 0 0 0 0
0 0 0 0 0 0 0 0 0 0
OK
0
0 0 0 0 0 0 0 0 0 0
0 0 0 0 0 0 0 0 0 0
SD
0
0 0 0 0 0 0 0 0 0 0
0 0 0 0 0 0 0 0 0 0
TX
1,170
2,881 4,793 5,442 7,284
11,872 3,057 2,492 8,142 1,373 1,759
6,975 1,066 1,415 2,529
968 2,872 2,429 3,422
524 1,546
WY
0
0 0 0 0 0 0 0 0 0 0
0 0 0 0 0 0 0 0 0 0
CEN FLYWAY
1,170
2,881 4,793 5,442 7,284
11,872 3,057 2,492 8,142 1,373 1,759
6,975 1,066 1,415 2,529
968 2,872 2,429 3,422
524 1,546
ATL FLYWAY
0
252 267
1,871 714
1,916 1,056 1,394 3,740 1,477 8,112
6,495 5,626 5,223 7,369 3,247 8,479 5,496 2,879 6,443 7,158
MISS FLYWAY
0
0 568
0 636
1,185 4,285 6,225 3,531 5,879
15,231
4,015 3,625
937 2,324
552 2,771 1,380 5,043 1,309 5,817
PAC 2
FLYWAY
0
370 0 0 0 0 0 0 0 0 0
58 0 0 0 0 0 0 0 0 0
U.S.
1,170
3,503 5,628 7,313 8,634
14,973 8,398
10,111 15,413 8,729
25,102
17,543 10,317 7,575
12,222 4,767
14,122 9,305
11,344 8,276
14,521
AVERAGE: 1999-2019 0 0 0 0 0 0 0 0 3,524 0 3,524 3,772 3,110 20 10,427
% CHANGE FROM: Prev. Year Average
195% -56%
195% -56%
11% 90%
344% 87% -100%
75% 39%
1 Preliminary FILE: S:\CF_D\projects\DATABOOK\MONITORING\HARVEST DATA\HIP\DABHARVHIP.XLS 01/04/21 2 Pacific Flyway total includes Alaska
ESTIMATED REGULAR SEASON FULVOUS TREE DUCK HARVESTS (Harvest Information Program)
YR CO
1999 0
2000 0 2001 0 2002 0 2003 1 0 2004 1 0 2005 1 0 2006 1 0 2007 1 0 2008 1 0 2009 1 0
2010 1 0
2011 1 0 2012 1 0 2013 1 0 2014 1 0 2015 1 0 2016 1 0 2017 1 0 2018 1 0 2019 1 0
KS
0
0 0 0 0 0 0 0 0 0 0
0 0 0 0 0 0 0 0 0 0
MT
0
0 0 0 0 0 0 0 0 0 0
0 0 0 0 0 0 0 0 0 0
NE
0
0 0 0 0 0 0 0 0 0 0
0 0 0 0 0 0 0 0 0 0
NM
0
0 0 0 0 0 0 0 0 0 0
0 0 0 0 0 0 0 0 0 0
ND
0
0 0 0 0 0 0 0 0 0 0
0 0 0 0 0 0 0 0 0 0
OK
0
0 0 0 0 0 0 0 0 0 0
0 0 0 0 0 0 0 0 0 0
SD
0
0 0 0 0 0 0 0 0 0 0
0 0 0 0 0 0 0 0 0 0
TX
0
0 0 0
520 283
0 0
718 0
660
465 267 566
0 581 663 324
0 524 141
WY
0
0 0 0 0 0 0 0 0 0 0
0 0 0 0 0 0 0 0 0 0
CEN FLYWAY
0
0 0 0
520 283
0 0
718 0
660
465 267 566
0 581 663 324
0 524 141
ATL FLYWAY
194
252 267 125
0 776 411 797 612 316
1,642
1,274 1,468 1,567 2,069
812 1,780 1,649
691 1,879
904
MISS FLYWAY
327
0 946 140
0 1,461
0 732
1,926 735
2,948
0 0
2,344 4,649
276 0 0
530 349
1,756
PAC 2
FLYWAY
0
0 0 0 0 0 0 0 0 0 0
0 0 0 0 0 0 0 0 0 0
U.S.
521
252 1,213
265 520
2,520 411
1,529 3,256 1,051 5,250
1,739 1,735 4,477 6,718 1,669 2,443 1,973 1,221 2,752 2,801
AVERAGE: 1999-2019 0 0 0 0 0 0 0 0 272 0 272 928 910 0 2,110
% CHANGE FROM: Prev. Year Average
-73% -48%
-73% -48%
-52% -3%
403% 93%
2% 33%
1 Preliminary FILE: S:\CF_D\projects\DATABOOK\MONITORING\HARVEST DATA\HIP\DABHARVHIP.XLS 01/04/21 2 Pacific Flyway total includes Alaska
15

Central Flyway Databook 202012/22/2020
ESTIMATED BLUE-WINGED TEAL HARVEST DURING SPECIAL SEPTEMBER SEASONS (Harvest Information Program)
YR CO KS
1999 2,360 28,022
2000 1,610 27,724 2001 1,132 10,741 2002 470 8,723
2003 1 3,581 21,393 2004 1 4,287 19,173 2005 1 3,896 10,387 2006 1 2,340 23,664 2007 1 6,047 25,582 2008 1 4,657 15,120 2009 1 2,092 15,165
2010 1 2,518 16,829 2011 1 5,718 22,562 2012 1 4,595 19,420 2013 1 4,156 28,213 2014 1 7,621 36,736 2015 1 1,895 28,504 2016 1 2,798 22,910 2017 1 1,447 13,329 2018 1 933 33,918 2019 1 473 18,666
MT NE
0
10,308 10,423 4,775
13,108 6,060 5,087
11,167 27,010 20,037 11,513
12,112 17,892 14,868 11,606 31,039 30,928 11,311 12,969 20,071 32,511
NM
1,690
3,244 1,617 1,065 1,891
517 260
2,079 3,321
256 755
565 2,141
769 2,891 4,013
566 0
234 2,251
824
ND OK
7,852
9,597 10,183 2,645
13,792 2,767 7,485
10,971 22,209 8,586 8,006
7,507 5,753
14,087 12,426 6,568
21,082 8,386 2,586 1,410 6,335
SD TX
130,094
196,688 218,060 62,035 99,894 63,033 89,044
133,622 144,405 59,247
130,142
113,926 159,406 195,222 119,781 162,623 141,744 196,916 169,161 180,388 104,396
WY CEN
FLYWAY
170,018
249,171 252,156 79,713
153,659 95,837
116,159 183,843 228,574 107,903 167,673
153,457 213,472 248,961 179,073 248,600 224,719 242,321 199,726 238,971 163,205
ATL 2
FLYWAY
24,787
21,376 19,600 13,123 10,920 6,688
15,357 17,845 21,982 5,370
17,409
27,003 41,521 25,071 20,368 19,807 33,374 17,581 11,503 18,516 25,301
MISS 2
FLYWAY
437,537
430,937 265,628 112,946 296,755 106,309 100,272 265,213 303,920 195,150 244,657
291,509 378,119 554,675 408,069 321,890 233,160 53,179
143,447 166,004 155,167
PAC 3
FLYWAY U.S.
632,342
701,484 537,384 205,782 461,334 208,834 231,788 466,901 554,476 308,423 429,739
471,969 633,112 828,707 607,510 590,297 491,253 313,081 354,676 423,491 343,673
AVERAGE: 1999-2019 3,077 21,275 14,990 1,474 9,059 136,658 186,534 19,738 260,216 466,488
% CHANGE FROM: Prev. Year -49% -45% Average -85% -12%
62% 117%
-63% -44%
349% -30%
-42% -24%
-32% -13%
37% 28%
-7% -40%
-19% -26%
1 Preliminary FILE: S:\CF_D\projects\Monitoring\harvest data\DATABOOK\HIP\TealharHIP.xls 2 Includes harvest from special Wood duck/teal seasons in FL, KY, and TN initiated in 1981, and from an additional 4 teal-only days beginning in 2014 3 Pacific Flyway total includes Alaska
ESTIMATED REGULAR SEASON BLUE-WINGED TEAL HARVESTS (Harvest Information Program)
YR CO KS
1999 4,559 6,936
2000 6,580 2,385 2001 2,758 1,074 2002 4,275 3,468
2003 1 3,837 4,258 2004 1 7,532 6,812 2005 1 5,499 1,588 2006 1 5,971 1,183 2007 1 8,803 1,296 2008 1 4,383 3,840 2009 1 1,255 3,654
2010 1 3,418 3,366 2011 1 3,649 4,131 2012 1 3,696 1,910 2013 1 7,327 20,414
2014 1,3 1,726 11,225 2015 1,3 1,422 11,312 2016 1,3 1,400 4,699 2017 1,3 1,447 3,025 2018 1,3 5,913 4,636 2019 1,3 2,129 1,774
MT NE
1,663 14,039
1,371 8,247 1,281 11,668
827 11,937 704 7,380 658 4,606
1,255 14,243 1,582 9,045 1,466 13,785
588 9,039 433 4,983
883 10,259 2,055 10,862 3,220 1,390 4,682 23,734 1,934 9,438
796 13,746 1,923 2,866
922 4,235 3,346 9,090 2,262 9,868
NM ND OK SD
1,091 23,808 682 22,167
3,612 23,006 1,545 13,254 1,155 33,981 429 24,577
788 42,413 473 21,226 473 37,097 206 16,844 33 25,205 518 14,289
445 34,758 1,470 14,770 906 18,199 275 11,838 687 26,097 1,047 9,951 255 12,414 3,604 12,992 118 21,404 757 17,323
142 25,205 107 14,839 556 53,846 1,569 28,501 77 30,695 324 14,010
723 58,271 666 25,219 540 36,831 1,383 19,242 41 70,676 937 27,514
107 38,067 1,174 17,422 352 39,711 136 8,644 724 37,051 0 8,827 642 45,925 0 20,771
TX
30,816
64,952 46,556 45,928 37,634 71,231 44,712 50,459 53,643 44,534 78,700
47,664 39,719 41,874 81,617 79,181 38,336 67,851 64,799
118,570 49,317
WY
1,480
1,300 241
2,221 1,036 1,716
816 1,080 1,337 1,258
697
1,735 1,031
0 1,845 1,600
580 1,150 1,438 1,900 1,269
CEN FLYWAY
107,241
126,252 123,720 133,556 109,469 132,600 119,556 100,538 118,112 92,907
129,324
107,618 145,919 97,196
224,498 163,100 165,360 136,659 124,709 190,057 133,957
ATL FLYWAY
57,089
56,819 52,762 48,212 34,952 66,356 61,790 52,745 67,670 67,139 97,070
92,345 92,915 83,497 55,295 42,811 55,610 45,676 56,210 52,126 57,136
MISS FLYWAY
298,936
279,651 362,642 326,812 303,138 259,179 213,807 248,663 322,800 322,787 487,937
341,939 326,528 377,421 534,839 326,915 273,156 202,419 295,936 233,988 227,921
PAC 2
FLYWAY
58,968
38,436 42,831 45,703 57,426 71,981 76,592 72,118 58,092 52,664 46,568
58,794 52,675 40,628 43,178 32,366 28,507 44,032 58,753 50,532 39,370
U.S.
522,234
501,158 581,955 554,283 504,985 530,116 471,745 474,064 566,674 535,497 760,899
600,696 618,037 598,742 857,810 565,192 522,633 428,786 535,608 526,703 458,384
AVERAGE: 1999-2019 4,170 4,904 1,612 9,736 641 34,984 824 17,344 57,052 1,225 132,493 61,725 312,734 50,963 557,914
% CHANGE FROM: Prev. Year -64% -62% Average -49% -64%
-32% 9% 40% 1%
-11% 24% 135% 0% 31% -100% 20%
-58% -14%
-33% 4%
-30% 1%
10% -7%
-3% -27%
-22% -23%
-13% -18%
1 Preliminary FILE: S:\CF_D\projects\Monitoring\harvest data\DATABOOK\HIP\TealharHIP.xls 2 Pacific Flyway total includes Alaska 3 Includes Bonus Blue-winged teal harvest during the first days of the regular season in MT, ND, SD, and WY
ESTIMATED ALL-SEASON BLUE-WINGED TEAL HARVESTS (Harvest Information Program)
YR CO KS
1999 6,919 34,958
2000 8,190 30,109 2001 3,890 11,815 2002 4,745 12,191
2003 1 7,418 25,651 2004 1 11,819 25,985 2005 1 9,395 11,975 2006 1 8,311 24,847 2007 1 14,850 26,878 2008 1 9,040 18,960 2009 1 3,347 18,819
2010 1 5,936 20,195 2011 1 9,367 26,693 2012 1 8,291 21,330 2013 1 11,483 48,627 2014 1 9,347 47,961 2015 1 3,317 39,816 2016 1 4,198 27,609 2017 1 2,894 16,354 2018 1 6,846 38,554 2019 1 2,602 20,440
MT NE
1,663 14,039
1,371 18,555 1,281 22,091
827 16,712 704 20,488 658 10,666
1,255 19,330 1,582 20,212 1,466 40,795
588 29,076 433 16,496
883 22,371 2,055 28,754 3,220 16,258 4,682 35,340 1,934 40,477
796 44,674 1,923 14,177
922 17,204 3,346 29,161 2,262 42,379
NM ND
2,781 23,808
6,856 23,006 2,772 33,981 1,853 42,413 2,364 37,097
550 25,205 705 34,758
2,985 18,199 4,008 26,097
511 12,414 873 21,404
707 25,205 2,697 53,846
846 30,695 3,614 58,271 4,553 36,831
607 70,676 107 38,067 586 39,711
2,975 37,051 1,466 45,925
OK
8,534
11,142 10,612 3,118
13,998 3,285 8,955
11,246 23,256 12,190 8,763
7,614 7,322
14,411 13,092 7,951
22,019 9,560 2,722 1,410 6,335
SD
22,167
13,254 24,577 21,226 16,844 14,289 14,770 11,838 9,951
12,992 17,323
14,839 28,501 14,010 25,219 19,242 27,514 17,422 8,644 8,827
20,771
TX
160,910
261,640 264,616 107,963 137,528 134,264 133,756 184,081 198,048 103,781 208,842
161,590 199,125 237,096 201,398 241,804 180,080 264,767 233,960 298,958 153,713
WY
1,480
1,300 241
2,221 1,036 1,716
816 1,080 1,337 1,258
697
1,735 1,031
0 1,845 1,600
580 1,150 1,438 1,900 1,269
CEN FLYWAY
277,259
375,423 375,876 213,269 263,128 228,437 235,715 284,381 346,686 200,810 296,997
261,075 359,391 346,157 403,571 411,700 390,079 378,980 324,435 429,028 297,162
ATL FLYWAY
81,876
78,195 72,362 61,335 45,872 73,044 77,147 70,590 89,652 72,509
114,479
119,348 134,436 108,568 75,663 62,618 88,984 63,257 67,713 70,642 82,437
MISS FLYWAY
736,473
710,588 628,270 439,758 599,893 365,488 314,079 513,876 626,720 517,937 732,594
633,448 704,647 932,096 942,908 648,805 506,316 255,598 439,383 399,992 383,088
PAC 2
FLYWAY
58,968
38,436 42,831 45,703 57,426 71,981 76,592 72,118 58,092 52,664 46,568
58,794 52,675 40,628 43,178 32,366 28,507 44,032 58,753 50,532 39,370
U.S.
1,154,576
1,202,642 1,119,339
760,065 966,319 738,950 703,533 940,965
1,121,150 843,920
1,190,638
1,072,665 1,251,149 1,427,449 1,465,320 1,155,489 1,013,886
741,867 890,284 950,194 802,057
AVERAGE: 1999-2019 7,248 26,179 1,612 24,726 2,115 34,984 9,883 17,344 193,710 1,225 319,027 81,463 572,950 50,963 1,024,403
% CHANGE FROM: Prev. Year -62% -47% Average -64% -22%
-32% 45% 40% 71%
-51% 24% -31% 31%
349% -36%
135% 20%
-49% -21%
-33% 4%
-31% -7%
17% 1%
-4% -33%
-22% -23%
-16% -22%
1 Preliminary FILE: S:\CF_D\projects\Monitoring\harvest data\DATABOOK\HIP\TealharHIP.xls 2 Pacific Flyway total includes Alaska
16
01/04/21
01/04/21
01/04/21

Central Flyway Databook 202012/22/2020
ESTIMATED GREEN-WINGED TEAL HARVEST DURING SPECIAL SEPTEMBER SEASONS (Harvest Information Program)
YR CO
1999 244
2000 770 2001 1,273 2002 470
2003 1 1,791 2004 1 695 2005 1 1,375 2006 1 1,130 2007 1 2,757 2008 1 1,370 2009 1 418
2010 1 90 2011 1 852 2012 1 1,199 2013 1 1,312 2014 1 1,007 2015 1 711 2016 1 933 2017 1 1,158 2018 1 467 2019 1 0
KS
3,052
4,621 1,790 3,783 9,024 2,901 2,200 4,733 4,534 7,200 2,375
1,812 1,748 4,298 2,323 2,806 3,620 3,172 4,821 3,091 2,240
MT NE
0
1,675 1,089 1,653 3,635 2,061 1,243 2,030 4,809
10,244 1,890
2,565 1,438 5,280 1,174 1,946 4,296 1,508 4,764 1,980 2,754
NM
282
958 1,386
670 1,032
194 148
1,013 401 146 283
212 86
384 402 386 202 80
117 241 366
ND OK
2,503
4,192 1,715 1,039 3,500
173 668
3,429 2,514 2,120 2,055
965 523
3,562 1,553
0 937 168 272
0 0
SD TX
6,436
20,428 20,882 8,924
12,660 5,088 8,025
17,443 14,369 7,259
13,190
3,255 13,328 23,483 4,598 2,710 3,646 4,372
16,681 6,636 1,686
WY CEN
FLYWAY
12,517
32,644 28,135 16,539 31,642 11,112 13,659 29,778 29,384 28,339 20,211
8,899 17,975 38,206 11,362 8,855
13,412 10,233 27,813 12,415 7,046
ATL 2
FLYWAY
8,925
7,684 7,649 2,080 3,186 2,331 2,420 4,901 1,344 3,867 3,174
2,257 2,530 4,838 1,431 1,906 1,263
409 777
2,522 527
MISS 2
FLYWAY
18,710
22,166 12,036 5,719
27,174 13,241 9,260
27,585 20,595 11,493 7,775
7,285 14,908 34,285 12,728 9,053 7,259 1,216 8,473 4,475 4,173
PAC 3
FLYWAY
0
0 0 0 0 0 0 0 0 0 0
0 0 0 0 0 0 0 0 0 0
U.S.
40,152
62,494 47,820 24,338 62,002 26,684 25,339 62,264 51,323 43,699 31,160
18,441 35,413 77,329 25,521 19,814 21,934 11,858 37,063 19,412 11,746
AVERAGE: 1999-2019 953 3,626 2,764 428 1,518 10,243 19,532 3,144 13,315 35,991
% CHANGE FROM: Prev. Year -100% Average -100%
-28% -38%
39% 0%
52% -14% -100%
-75% -84%
-43% -64%
-79% -83%
-7% -69%
-39% -67%
1 Preliminary FILE: S:\CF_D\projects\Monitoring\harvest data\DATABOOK\HIP\TealharHIP.xls 2 Includes harvest from special Wood duck/teal seasons in FL, KY, and TN initiated in 1981, and from an additional 4 teal-only days beginning in 2014 3 Pacific Flyway total includes Alaska
ESTIMATED REGULAR SEASON GREEN-WINGED TEAL HARVESTS (Harvest Information Program)
YR CO KS
1999 6,919 21,918
2000 9,450 27,872 2001 8,062 20,049 2002 9,207 31,423
2003 1 16,114 24,536 2004 1 9,038 29,012 2005 1 6,416 13,197 2006 1 7,665 11,156 2007 1 9,159 22,182 2008 1 9,176 22,560 2009 1 5,578 23,569
2010 1 4,137 15,276 2011 1 8,029 18,113 2012 1 9,789 9,232 2013 1 9,953 32,861 2014 1 6,326 22,067 2015 1 12,555 17,193 2016 1 8,395 16,566 2017 1 4,196 15,126 2018 1 3,889 18,219 2019 1 5,322 15,960
MT NE
2,743 29,776
1,028 19,973 1,442 18,669 2,826 31,496 1,106 22,140 2,021 20,726 1,654 16,165 1,748 18,551 2,328 26,448 2,157 33,144 4,225 16,153
785 13,964 959 25,719
2,100 10,283 2,281 26,863 4,028 13,233 1,273 20,081 2,083 17,042 1,843 15,881 5,621 18,271 1,357 20,118
NM
3,908
5,308 5,660 1,932 4,127 2,295 5,529
11,942 5,840 3,323 1,983
2,156 1,198 1,999 3,212 3,550 1,700 1,096 3,986 2,734 4,031
ND
19,992
23,224 13,399 33,642 26,116 31,389 21,594 18,199 18,077 16,938 20,623
15,036 19,453 36,293 26,320 30,929 29,520 28,194 30,437 41,835 23,350
OK
34,252
15,885 12,863 24,941 18,630 25,419 29,139 32,091 53,427 26,819 24,558
28,205 39,487 35,947 32,175 30,768 24,050 28,343 33,487 18,331 32,445
SD
24,067
24,983 22,477 26,019 24,063 17,982 14,396 19,919 14,234 12,992 12,568
12,277 17,186 19,105 15,928 16,683 19,470 15,609 21,990 16,417 13,620
TX
193,873
187,784 195,467 121,677 113,248 119,565 233,501 128,015 187,990 163,616 132,120
158,567 177,800 247,847 168,521 205,602 80,097
166,310 209,794 125,381 123,504
WY
1,567
2,437 3,374 3,136 3,649 4,766 1,741 2,768 1,823 1,834 2,539
2,291 1,698 1,749 2,399 1,891 1,493 2,408 4,041 1,471
920
CEN FLYWAY
339,015
317,944 301,462 286,299 253,729 262,213 343,332 252,054 341,508 292,559 243,916
252,694 309,642 374,344 320,513 335,077 207,432 286,046 340,781 252,169 240,627
ATL FLYWAY
232,627
183,099 141,445 156,480 133,969 112,638 118,252 149,711 155,693 145,041 132,460
146,225 109,572 119,845 111,682 113,397 88,079
115,525 100,470 101,270 58,366
MISS FLYWAY
889,529
669,335 576,040 530,750 671,389 484,778 504,590 632,043 771,587 841,356 747,458
1,045,499 986,994 898,176 835,629 902,610 522,158 626,389 709,152 448,210 431,117
PAC 2
FLYWAY
529,706
418,325 334,806 347,474 368,625 487,240 508,967 562,655 631,083 674,810 539,080
549,187 507,811 559,893 417,964 380,876 452,018 539,358 538,791 546,494 428,247
U.S.
1,990,877
1,588,703 1,353,753 1,321,003 1,427,712 1,346,869 1,475,141 1,596,463 1,899,871 1,953,766 1,662,914
1,993,605 1,914,019 1,952,258 1,685,788 1,731,960 1,269,687 1,567,318 1,689,194 1,348,143 1,158,357
AVERAGE: 1999-2019 8,065 20,385 2,172 20,700 3,691 24,979 28,632 18,190 163,823 2,381 293,017 129,802 701,180 491,591 1,615,591
% CHANGE FROM: Prev. Year 37% -12% Average -34% -22%
-76% 10% -38% -3%
47% 9%
-44% -7%
77% 13%
-17% -25%
-1% -25%
-37% -61%
-5% -18%
-42% -55%
-4% -39%
-22% -13%
-14% -28%
1 Preliminary FILE: S:\CF_D\projects\Monitoring\harvest data\DATABOOK\HIP\TealharHIP.xls 2 Pacific Flyway total includes Alaska
ESTIMATED ALL-SEASON GREEN-WINGED TEAL HARVESTS (Harvest Information Program)
YR CO KS
1999 7,163 24,970
2000 10,220 32,493 2001 9,335 21,839 2002 9,677 35,206
2003 1 17,905 33,560 2004 1 9,733 31,913 2005 1 7,791 15,397 2006 1 8,795 15,889 2007 1 11,916 26,716 2008 1 10,546 29,760 2009 1 5,996 25,944
2010 1 4,227 17,088 2011 1 8,881 19,861 2012 1 10,988 13,530 2013 1 11,265 35,184 2014 1 7,333 24,873 2015 1 13,266 20,813 2016 1 9,328 19,738 2017 1 5,354 19,947 2018 1 4,356 21,310 2019 1 5,322 18,200
MT NE
2,743 29,776
1,028 21,648 1,442 19,758 2,826 33,149 1,106 25,775 2,021 22,787 1,654 17,408 1,748 20,581 2,328 31,257 2,157 43,388 4,225 18,043
785 16,529 959 27,157
2,100 15,563 2,281 28,037 4,028 15,179 1,273 24,377 2,083 18,550 1,843 20,645 5,621 20,251 1,357 22,872
NM
4,190
6,266 7,046 2,602 5,159 2,489 5,677
12,955 6,241 3,469 2,266
2,368 1,284 2,383 3,614 3,936 1,902 1,176 4,103 2,975 4,397
ND
19,992
23,224 13,399 33,642 26,116 31,389 21,594 18,199 18,077 16,938 20,623
15,036 19,453 36,293 26,320 30,929 29,520 28,194 30,437 41,835 23,350
OK
36,755
20,077 14,578 25,980 22,130 25,592 29,807 35,520 55,941 28,939 26,613
29,170 40,010 39,509 33,728 30,768 24,987 28,511 33,759 18,331 32,445
SD
24,067
24,983 22,477 26,019 24,063 17,982 14,396 19,919 14,234 12,992 12,568
12,277 17,186 19,105 15,928 16,683 19,470 15,609 21,990 16,417 13,620
TX
200,309
208,212 216,349 130,601 125,908 124,653 241,526 145,458 202,359 170,875 145,310
161,822 191,128 271,330 173,119 208,312 83,743
170,682 226,475 132,017 125,190
WY
1,567
2,437 3,374 3,136 3,649 4,766 1,741 2,768 1,823 1,834 2,539
2,291 1,698 1,749 2,399 1,891 1,493 2,408 4,041 1,471
920
CEN FLYWAY
351,532
350,588 329,597 302,838 285,371 273,325 356,991 281,832 370,892 320,898 264,127
261,593 327,617 412,550 331,875 343,932 220,844 296,279 368,594 264,584 247,673
ATL FLYWAY
241,552
190,783 149,094 158,560 137,155 114,969 120,672 154,612 157,037 148,908 135,634
148,482 112,102 124,683 113,113 115,303 89,342
115,934 101,247 103,792 58,893
MISS FLYWAY
908,239
691,501 588,076 536,469 698,563 498,019 513,850 659,628 792,182 852,849 755,233
1,052,784 1,001,902
932,461 848,357 911,663 529,417 627,605 717,625 452,685 435,290
PAC 2
FLYWAY
529,706
418,325 334,806 347,474 368,625 487,240 508,967 562,655 631,083 674,810 539,080
549,187 507,811 559,893 417,964 380,876 452,018 539,358 538,791 546,494 428,247
U.S.
2,031,029
1,651,197 1,401,573 1,345,341 1,489,714 1,373,553 1,500,480 1,658,727 1,951,194 1,997,465 1,694,074
2,012,046 1,949,432 2,029,587 1,711,309 1,751,774 1,291,621 1,579,176 1,726,257 1,367,555 1,170,103
AVERAGE: 1999-2019 9,019 24,011 2,172 23,463 4,119 24,979 30,150 18,190 174,066 2,381 312,549 132,946 714,495 491,591 1,651,581
% CHANGE FROM: Prev. Year 22% -15% Average -41% -24%
-76% 13% -38% -3%
48% -28%
-44% -7%
77% 8%
-17% -25%
-5% -28%
-37% -61%
-6% -21%
-43% -56%
-4% -39%
-22% -13%
-14% -29%
1 Preliminary FILE: S:\CF_D\projects\Monitoring\harvest data\DATABOOK\HIP\TealharHIP.xls 2 Pacific Flyway total includes Alaska
17
01/04/21
01/04/21
01/04/21

Central Flyway Databook 202012/22/2020
ESTIMATED REGULAR SEASON REDHEAD HARVESTS (Harvest Information Program)
YR CO
1999 1,058
2000 840 2001 424 2002 611
2003 1 1,151 2004 1 463 2005 1 1,528 2006 1 2,017 2007 1 2,846 2008 1 2,191 2009 1 1,116
2010 1 450 2011 1 487 2012 1 1,398 2013 1 2,406 2014 1 1,726 2015 1 3,080 2016 1 622 2017 1 1,013 2018 1 1,556 2019 1 473
KS
3,468
2,832 2,864 2,838 1,217 2,018 3,788 4,226 1,619 6,784 2,923
4,013 2,542 2,706 7,468 4,975 4,675 2,115 2,836 2,603 4,200
MT
582
600 0
207 302 658 399
1,082 690 294
1,192
1,373 1,233 2,240 2,881 2,095
318 321 503 803 543
NE
2,314
2,448 2,022 1,837 2,203
970 3,391 3,784 2,404 1,205 2,578
2,137 3,355 1,667 3,130 2,043
859 1,357 2,250 1,080 4,131
NM ND
70 18,719
516 9,922 809 13,951 118 5,767 344 12,168 97 7,935
408 20,785 426 20,069 344 21,387 73 9,629
189 32,663
565 25,854 257 24,277 231 23,834 402 27,699 232 39,783
0 27,150 160 18,558 234 14,839 643 25,310 595 29,468
OK
2,731
3,530 2,037 2,551
926 2,248 2,005 2,469 3,562 2,438 3,029
5,148 6,930 6,315 7,545 7,951 3,279 2,180 1,361 1,058 3,648
SD TX
7,125 62,999
4,926 60,237 7,287 63,672
959 14,148 3,208 12,487 2,236 18,373 3,926 40,127 9,675 35,508 9,447 42,148 4,230 24,523 7,020 29,018
5,872 44,176 4,010 79,703 5,307 93,367 7,566 75,179 7,679 97,767 6,490 64,630 2,050 59,917 3,051 58,383 7,150 25,670
12,343 44,119
WY
871
894 145 523 395 95
326 68
365 72
249
208 182 291 185 242 83
180 274 184 254
CEN FLYWAY
99,937
86,745 93,211 29,559 34,401 35,093 76,683 79,324 84,812 51,439 79,977
89,796 122,976 137,356 134,461 164,493 110,564 87,460 84,744 66,057 99,774
ATL FLYWAY
3,814
7,457 7,308 2,324 5,570 5,196 9,291 1,984 7,235 7,359
12,129
24,127 9,893
19,394 35,902 27,319 26,169 19,741 23,809 25,917 19,136
MISS FLYWAY
61,723
48,608 52,722 27,564 34,542 35,334 62,051 69,500 63,027 43,108 59,860
109,003 155,227 99,179
121,598 122,872 86,213 60,324 57,348 60,193 52,298
PAC 2
FLYWAY
16,831
14,982 11,704 10,917 22,922 22,218 20,881 26,349 18,957 17,776 17,850
21,146 33,322 29,834 18,242 16,879 11,482 13,257 14,995 16,746 17,586
U.S.
182,305
157,792 164,945 70,364 97,435 97,841
168,906 177,157 174,031 119,682 169,816
244,072 321,418 285,763 310,203 331,563 234,428 180,782 180,896 168,913 188,794
AVERAGE: 1999-2019 1,307 3,462 872 2,246 320 20,465 3,473 5,788 49,817 290 88,041 14,337 70,585 18,804 191,767
% CHANGE FROM: Prev. Year -70% Average -64%
61% 21%
-32% -38%
283% 84%
-7% 16% 86% 44%
245% 5%
73% 72% 113% -11%
38% -12%
51% 13%
-26% 33%
-13% -26%
5% -6%
12% -2%
¹ Preliminary FILE: S:\CF_D\projects\Monitorning\harvest data\DATABOOK\HIP\DIVERHARVHIP.XLS 01/04/21 2 Pacific Flyway total includes Alaska
ESTIMATES OF REGULAR SEASON CANVASBACK HARVESTS (Harvest Information Program)
YR CO KS MT NE
1999 81 832 582 926
2000 140 149 171 0 2001 141 537 160 311
2002 1 0 0 0 0 2003 2 128 101 151 551 2004 2 0 252 0 0 2005 2 229 489 114 452 2006 2 0 338 166 831 2007 2 267 324 0 240
2008 2,3 822 480 98 452 2009 2 279 731 217 0
2010 2 180 388 589 570 2011 2 730 2,860 822 1,597 2012 1 300 637 980 973 2013 1 109 1,494 480 0 2014 1 288 1,148 967 389 2015 1 474 452 636 107 2016 1 155 705 160 452 2017 1 0 851 168 397 2018 1 778 569 268 90 2019 1 473 560 0 382
NM
106
74 0 0
43 65 37
160 229 37 71
35 214 77
161 309 121 107 117 161 229
ND
7,633
4,906 4,973
120 2,671 4,784 7,621 8,227 6,111 4,641 8,361
7,248 8,092 8,306 7,471 9,798
10,235 7,851 7,504 7,828
10,339
OK
1,366
1,544 214
0 823 346
1,470 274
1,467 1,908 1,947
1,716 4,315 2,429 3,107 2,247 1,249 1,845
681 705
1,152
SD TX
1,742 20,284
1,642 18,333 371 7,189
0 1,088 936 2,601 583 2,827 561 6,497
2,049 5,918 630 5,987
1,309 6,082 679 4,617
2,242 11,858 1,575 21,592
637 12,449 1,062 18,163 1,854 18,005 1,463 6,960 1,419 11,983 1,716 16,895 1,501 4,540 2,894 3,934
WY
87
0 96 0 0 0 0
68 0
36 348
0 243
0 0 0 0 0 0 0 0 0
127 0
CEN FLYWAY
33,639
26,959 13,992 1,208 8,005 8,857
17,470 18,031 15,255 15,865 17,250
24,826 42,040 26,788 32,047 35,005 21,697 24,677 28,329 16,440 20,090
ATL FLYWAY
5,566
16,474 1,578
0 4,738 9,772 4,433 1,228 6,988
68 7,389
22,989 5,349 3,903
13,111 5,630 1,909 4,507
10,693 20,733 1,579
MISS FLYWAY
40,510
49,183 11,578
574 9,821
10,824 32,786 45,640 56,432 1,234
27,831
72,703 68,358 52,081 76,103 43,558 30,696 45,348 40,087 30,592 29,990
PAC 2
FLYWAY
20,127
20,029 9,482 1,187
11,381 15,026 9,729
26,987 46,533 1,007
17,923
25,168 25,113 34,479 38,453 24,071 31,912 26,501 20,911 0 23,643 0 21,240 0
U.S.
99,842
112,645 36,630 2,969
33,945 44,479 64,418 91,886
125,208 18,174 70,393
145,686 140,860 117,251 159,714 108,264 86,214
101,033 100,020 91,408 72,899
AVERAGE: 1999-2019 265 662 320 415 112 6,891 1,467 1,279 9,895 48 21,356 7,078 36,949 21,472 86,854
% CHANGE FROM: Prev. Year -39% -2% -100% 324% Average 78% -15% -100% -8%
42% 104%
32% 50%
63% -21%
93% -13% 126% -60% 165%
22% -6%
-92% -78%
-2% -19%
-10% -1%
-20% -16%
1 Season was closed in the U.S. (except for AK) FILE: S:\CF_D\projects\Monitorning\harvest data\DATABOOK\HIP\DIVERHARVHIP.XLS 01/04/21 2 Preliminary 3 Season was closed in the U.S. (except for AK and the Central Flyway) 4 Pacific Flyway total includes Alaska
ESTIMATED REGULAR SEASON RING-NECKED DUCK HARVESTS (Harvest Information Program)
YR CO
1999 733
2000 980 2001 849 2002 752
2003 1 1,023 2004 1 463 2005 1 611 2006 1 2,017 2007 1 1,423 2008 1 685 2009 1 1,255
2010 1 540 2011 1 973 2012 1 1,199 2013 1 1,094 2014 1 863 2015 1 1,421 2016 1 155 2017 1 434 2018 1 622 2019 1 946
KS
4,717
1,341 2,685 5,044 4,765 4,793 2,688 8,113 4,048 7,680 6,212
4,660 6,197 3,661 4,149 2,679 2,262 2,702 4,727 1,789 2,893
MT
0
171 721 482 101 235 513 83
517 588 325
98 137 980 600
2,739 636 641 84
937 181
NE
2,006
1,675 2,334 3,030 2,533 1,333 2,487 2,030 1,202 1,055 1,031
712 2,396 1,251 1,304
487 1,826 1,961 1,323 2,430 1,912
NM ND
669 6,724
663 7,523 693 6,769 789 5,887 860 3,413 615 8,168 631 10,277 533 12,465 401 4,965 511 6,497 378 5,685
318 10,493 257 5,291
0 9,209 241 6,206 386 13,458 324 9,589 134 8,446 703 8,769 563 11,916 275 10,426
OK
12,176
8,273 3,323 8,786 7,617
11,413 14,168 15,360 12,361 12,084 8,979
11,046 18,436 16,840 13,314 8,816 6,090 7,715 9,120 7,579
19,390
SD
7,442
3,871 4,199 4,108 2,139 2,138 2,057 5,236 3,401 4,532 3,397
6,085 3,151 5,731 3,716 3,001 3,565 2,286 2,669 4,060 4,597
TX
58,708
84,332 57,853 44,187 39,715 37,311 42,802 40,803 47,417 33,351 41,329
33,015 49,315 40,459 36,325 50,723 29,719 42,266 45,766 58,325 36,531
WY
871
81 48
436 197 381 109 473 61
108 348
208 364
0 0
242 166 72 0 0
123 0 127 0
CEN FLYWAY
94,046
108,910 79,474 73,501 62,363 66,850 76,343 87,113 75,796 67,091 68,939
67,175 86,517 79,330 66,949 83,394 55,598 66,378 73,595 88,344 77,278
ATL FLYWAY
147,511
95,470 89,486 96,626
112,806 74,349
109,021 144,491 120,756 131,717 116,445
94,349 152,132 179,582 143,078 117,832 130,249 136,499 104,941 123,096 73,841
MISS FLYWAY
264,504
257,504 230,667 239,065 230,202 233,979 240,090 353,705 241,239 251,356 186,243
268,411 259,457 324,658 240,898 250,727 183,485 188,185 267,900 182,667 174,603
PAC 2
FLYWAY
47,040
34,267 38,507 35,960 36,326 58,350 49,729 71,264 65,642 50,427 38,024
61,147 46,242 67,874 46,647 46,106 44,287 50,721 53,457 0 61,248 0 48,366 0
U.S.
553,101
496,151 438,134 445,152 441,697 433,528 475,183 656,573 503,433 500,591 409,651
491,082 544,348 651,444 497,572 498,059 413,619 441,783 499,893 455,355 374,088
AVERAGE: 1999-2019 907 4,181 513 1,729 474 8,199 11,090 3,875 45,250 210 76,428 118,775 241,407 50,078 486,687
% CHANGE FROM: Prev. Year 52% Average 4%
62% -31%
-81% -65%
-21% 11%
-51% -13% -42% 27%
156% 75%
13% 19%
-37% -19% -40%
-13% 1%
-40% -38%
-4% -28%
-21% -3%
-18% -23%
¹ Preliminary FILE: S:\CF_D\projects\Monitorning\harvest data\DATABOOK\HIP\DIVERHARVHIP.XLS 01/04/21 2 Pacific Flyway total includes Alaska
18

Central Flyway Databook 202012/22/2020
ESTIMATED REGULAR SEASON GREATER SCAUP HARVESTS (Harvest Information Program)
YR CO
1999 0
2000 70 2001 0 2002 47
2003 1 0 2004 1 0 2005 1 0 2006 1 161 2007 1 89 2008 1 0 2009 1 0
2010 1 0 2011 1 0 2012 1 0 2013 1 0 2014 1 0 2015 1 0 2016 1 0 2017 1 0 2018 1 0 2019 1 0
KS
139
0 179 210
0 126
0 169
0 240 183
0 0 0
166 0 0 0
95 163
0
MT
0
86 0
69 0 0 0 0 0 0 0
98 0 0 0 0 0 0
84 0 0
NE
0
129 0
735 110
0 113 92 0 0 0
0 0 0
261 97 0 0 0
90 0
NM
0
0 116
0 43 0 0 0
115 0 0
0 0 0 0 0 0 0 0 0 0
ND
182
218 138 120
0 350 462 249
0 348 223
108 0
181 115
0 323 238 169 87 86
OK
569
110 0
189 103 346 134 137
1,676 106
0
322 523
0 888 346 625 168
0 353
0
SD
158
0 0
411 134 583 280
0 126
0 0
214 0
212 133 88
183 79
127 88
170
TX
1,755
1,833 1,369 1,959
867 2,261 1,529 1,869
958 1,962 1,099
930 2,932 1,415 1,839 3,098 2,210
648 1,283 1,572 3,794
WY
0
0 0 0 0 0 0 0 0 0 0
0 0 0 0 0 0 0 0 0 0
CEN FLYWAY
2,803
2,446 1,802 3,740 1,257 3,666 2,518 2,677 2,964 2,656 1,505
1,672 3,455 1,808 3,402 3,629 3,341 1,133 1,758 2,353 4,050
ATL FLYWAY
8,305
12,850 8,505
17,639 17,344 16,837 18,237 10,523 13,154 10,646 12,794
23,535 6,265
19,231 23,227 9,700 5,202
10,507 18,748 28,972 14,091
MISS FLYWAY
9,272
19,085 8,603
29,228 13,032 28,056 24,812 21,454 21,964 24,649 24,567
23,692 33,680 40,968 49,064 37,927 25,053 34,574 28,929 35,375 23,101
PAC 2
FLYWAY
19,358
19,384 15,736 19,989 16,122 22,958 12,447 13,125 32,752 11,514 16,273
20,916 16,024 35,894 6,533
10,838 6,655
18,648 18,534 15,801 11,131
U.S.
39,738
53,765 34,646 70,596 47,755 71,517 58,014 47,779 70,834 49,465 55,139
69,815 59,424 97,901 82,226 62,094 40,251 64,862 67,969 82,501 52,373
AVERAGE: 1999-2019 17 80 16 77 13 171 314 142 1,771 0 2,602 14,586 26,528 17,173 60,889
% CHANGE FROM: Prev. Year Average -100%
-100% -100% -100%
-100% -100% -100%
-1% -50%
-100% -100%
93% 20%
141% 114%
72% 56%
-51% -3%
-35% -13%
-30% -35%
-37% -14%
¹ Preliminary FILE: S:\CF_D\projects\Monitorning\harvest data\DATABOOK\HIP\DIVERHARVHIP.XLS 01/04/21 2 Pacific Flyway total includes Alaska
ESTIMATED REGULAR SEASON LESSER SCAUP HARVESTS (Harvest Information Program)
YR CO
1999 163
2000 770 2001 424 2002 1,550
2003 1 895 2004 1 811 2005 1 382 2006 1 484 2007 1 178 2008 1 0 2009 1 279
2010 1 720 2011 1 122 2012 1 300 2013 1 437 2014 1 431 2015 1 1,421 2016 1 311 2017 1 723 2018 1 467 2019 1 355
KS
277
149 895
1,997 913
1,766 244 845 648
1,200 731
1,424 1,271 1,751
996 1,148
151 587
1,229 732 933
MT
582
771 80
758 201 188 114 83
345 294 325
294 822
1,680 2,281
645 0
321 168 669 181
NE
1,389
773 933
3,489 2,644
848 339 831 561 301 344
142 639
1,112 1,174
0 215 302 132 270 382
NM ND
0 18,174
295 23,006 231 23,483 315 25,472 129 17,065
0 20,187 37 21,709
267 20,568 286 16,168 110 10,209 71 26,197
35 18,390 0 12,294
77 27,987 0 13,677
772 21,367 0 19,501
80 19,509 234 21,415 80 25,136
229 29,209
OK
455
882 429
4,062 1,647 1,383 2,406 2,057 2,514
848 433
858 1,700 4,210 3,994 3,284
781 1,006 1,089
881 1,536
SD
3,483
4,223 3,582 4,519 3,208 8,068 4,207 7,057 4,157 4,834 4,189
4,270 3,437 4,033 1,725 1,765 4,662 4,336 2,669 3,884 5,533
TX
12,873
52,380 41,764 44,840 17,863 33,071 24,840 18,688 15,806 11,182 11,212
13,718 23,191 69,601 22,071 42,979 14,915 13,279 44,910 12,398 26,977
WY
348
81 96
436 444 477 163 68 0
36 249
0 61 97
277 339 41 0
137 61 95
CEN FLYWAY
37,744
83,330 71,917 87,438 45,009 66,799 54,441 50,948 40,663 29,014 44,030
39,851 43,537
110,848 46,632 72,730 41,687 39,731 72,706 44,578 65,430
ATL FLYWAY
64,263
32,331 111,237 85,457 60,939 54,891 63,698 46,619 46,594 25,791 35,908
67,005 46,195
153,057 60,416 55,076 37,438 23,932 50,424 45,084 15,647
MISS FLYWAY
80,808
184,008 170,824 182,132 145,607 108,351 111,357 101,219 84,791 97,340
111,522
157,275 114,903 307,579 97,873
156,083 118,419 67,223
185,503 86,568 75,001
PAC 2
FLYWAY
29,261
31,353 30,221 32,866 39,032 52,347 29,471 34,723 52,006 27,414 30,608
23,776 22,791 62,797 41,363 38,036 28,553 32,858 22,226 0 27,576 0 24,395 0
U.S.
212,076
331,022 384,199 387,893 290,587 282,388 258,967 233,509 224,054 179,559 222,068
287,907 227,426 634,281 246,284 321,925 226,097 163,744 330,859 203,806 180,473
AVERAGE: 1999-2019 534 947 514 801 155 20,511 1,736 4,183 27,074 167 56,622 56,286 130,685 33,984 277,577
% CHANGE FROM: Prev. Year -24% Average -34%
27% -1%
-73% -65%
41% -52%
186% 16% 48% 42%
74% -12%
42% 32%
118% 0%
56% -43%
47% 16%
-65% -72%
-13% -43%
-12% -28%
-11% -35%
¹ Preliminary FILE: S:\CF_D\projects\Monitorning\harvest data\DATABOOK\HIP\DIVERHARVHIP.XLS 01/04/21 2 Pacific Flyway total includes Alaska
ESTIMATED REGULAR SEASON TOTAL (LESSER & GREATER) SCAUP HARVESTS (Harvest Information Program)
YR CO
1999 163
2000 840 2001 424 2002 1,597
2003 1 895 2004 1 811 2005 1 382 2006 1 645 2007 1 267 2008 1 0 2009 1 279
2010 1 720 2011 1 122 2012 1 300 2013 1 437 2014 1 431 2015 1 1,421 2016 1 311 2017 1 723 2018 1 467 2019 1 355
KS
416
149 1,074 2,207
913 1,892
244 1,014
648 1,440
914
1,424 1,271 1,751 1,162 1,148
151 587
1,324 895 933
MT
582
857 80
827 201 188 114 83
345 294 325
392 822
1,680 2,281
645 0
321 252 669 181
NE
1,389
902 933
4,224 2,754
848 452 923 561 301 344
142 639
1,112 1,435
97 215 302 132 360 382
NM ND
0 18,356
295 23,224 347 23,621 315 25,592 172 17,065
0 20,537 37 22,171
267 20,817 401 16,168 110 10,557 71 26,420
35 18,498 0 12,294
77 28,168 0 13,792
772 21,367 0 19,824
80 19,747 234 21,584 80 25,223
229 29,295
OK
1,024
992 429
4,251 1,750 1,729 2,540 2,194 4,190
954 433
1,180 2,223 4,210 4,882 3,630 1,406 1,174 1,089 1,234 1,536
SD
3,641
4,223 3,582 4,930 3,342 8,651 4,487 7,057 4,283 4,834 4,189
4,484 3,437 4,245 1,858 1,853 4,845 4,415 2,796 3,972 5,703
TX
14,628
54,213 43,133 46,799 18,730 35,332 26,369 20,557 16,764 13,144 12,311
14,648 26,123 71,016 23,910 46,077 17,125 13,927 46,193 13,970 30,771
WY
348
81 96
436 444 477 163 68 0
36 249
0 61 97
277 339 41 0
137 0 61 0 95 0
CEN FLYWAY
40,547
85,776 73,719 91,178 46,266 70,465 56,959 53,625 43,627 31,670 45,535
41,523 46,992
112,656 50,034 76,359 45,028 40,864 74,464 46,931 69,480
ATL FLYWAY
72,568
45,181 119,742 103,096 78,283 71,728 81,935 57,142 59,748 36,437 48,702
90,540 52,460
172,288 83,643 64,776 42,640 34,439 69,172 74,056 29,738
MISS FLYWAY
90,080
203,093 179,427 211,360 158,639 136,407 136,169 122,673 106,755 121,989 136,089
180,967 148,583 348,547 146,937 194,010 143,472 101,797 214,432 121,943 98,102
PAC 2
FLYWAY
48,619
50,737 45,957 52,855 55,154 75,305 41,918 47,848 84,758 38,928 46,881
44,692 38,815 98,691 47,896 48,874 35,208 51,506 40,760 0 43,377 0 35,526 0
U.S.
251,814
384,787 418,845 458,489 338,342 353,905 316,981 281,288 294,888 229,024 277,207
357,722 286,850 732,182 328,510 384,019 266,348 228,606 398,828 286,307 232,846
AVERAGE: 1999-2019 552 1,027 530 878 168 20,682 2,050 4,325 28,845 167 59,224 70,872 157,213 51,157 338,466
% CHANGE FROM: Prev. Year -24% Average -36%
4% -9%
-73% -66%
6% -57%
186% 16% 37% 42%
24% -25%
44% 32%
120% 7%
56% -43%
48% 17%
-60% -58%
-20% -38%
-18% -31%
-19% -31%
¹ Preliminary FILE: S:\CF_D\projects\Monitorning\harvest data\DATABOOK\HIP\DIVERHARVHIP.XLS 01/04/21 2 Pacific Flyway total includes Alaska
19

Central Flyway Databook 202012/22/2020
ESTIMATED REGULAR SEASON COMMON GOLDENEYE HARVESTS (Harvest Information Program)
YR CO
1999 163
2000 2,310 2001 990 2002 1,644
2003 1 3,581 2004 1 1,506 2005 1 535 2006 1 1,452 2007 1 445 2008 1 274 2009 1 279
2010 1 90 2011 1 1,217 2012 1 899 2013 1 656 2014 1 288 2015 1 948 2016 1 777 2017 1 289 2018 1 1,711 2019 1 473
KS
694
2,236 895 525 913
1,514 122 507 486 480
1,096
3,884 318 955 664 638 905 352
1,891 2,521 1,493
MT
166
685 881 207 503 376 399 583 690 392 433
294 1,096
280 480
2,578 318 481 587 937 724
NE
154
644 156 826
1,101 364 226 369
1,362 904 172
0 1,438
973 782 292 215 754 662 270 688
NM
211
74 0
315 129 226
0 586 115
0 24
35 214
0 0
77 81 0 0
884 92
ND
545
0 691 601 890 467 115 748 255
0 780
325 311
2,167 805 708 754 357 590
1,392 1,034
OK
0
0 214 472 721
1,902 535
1,097 1,467
742 1,082
1,180 654
1,781 222
1,383 1,562
335 136 353 192
SD
158
352 247 137
1,471 583 467 569 630 101 226
320 143 849 664 177 274 158 127 353 426
TX
780
1,048 1,369 1,306
694 283 382 934
1,916 1,373
0
2,325 2,133
849 230 387 994
1,619 1,925
524 1,124
WY
87
731 675
2,308 1,677
667 544 945 729 719
1,344
625 1,698 3,401 3,875
97 290 431 479 307 381
CEN FLYWAY
2,958
8,080 6,118 8,341
11,680 7,888 3,325 7,790 8,095 4,985 5,436
9,078 9,222
12,154 8,378 6,625 6,341 5,264 6,686 9,252 6,627
ATL FLYWAY
9,690
11,481 6,014
12,156 13,439 13,036 18,760 12,542 14,739 15,762 12,747
14,424 12,463 12,687 14,689 7,730 6,784
10,606 9,422 9,135
10,390
MISS FLYWAY
22,587
18,055 23,406 35,658 28,299 30,290 23,420 19,622 26,478 29,540 30,017
33,578 39,306 26,055 29,593 32,910 25,123 33,269 31,870 44,721 27,855
PAC 2
FLYWAY
15,413
19,102 13,081 32,778 41,931 25,143 25,941 36,466 29,099 26,776 36,141
20,636 30,741 25,908 29,316 30,307 19,990 23,364 26,966 27,373 30,789
U.S.
50,648
56,718 48,619 88,933 95,349 76,357 71,446 76,420 78,411 77,063 84,341
77,716 91,732 76,804 81,976 77,572 58,238 72,503 74,944 90,481 75,661
AVERAGE: 1999-2019 977 1,099 623 588 146 645 763 402 1,057 1,048 7,349 11,843 29,126 27,012 75,330
% CHANGE FROM: Prev. Year -72% Average -52%
-41% 36%
-23% 16%
155% 17%
-90% -37%
-26% 60%
-46% -75%
21% 6%
115% 6%
24% -64%
-28% -10%
14% -12%
-38% -4%
12% 14%
-16% 0%
¹ Preliminary FILE: S:\CF_D\projects\Monitorning\harvest data\DATABOOK\HIP\DIVERHARVHIP.XLS 2 Pacific Flyway total includes Alaska
ESTIMATED REGULAR SEASON RUDDY DUCK HARVESTS (Harvest Information Program)
YR CO
1999 163
2000 210 2001 71 2002 282
2003 1 0 2004 1 0 2005 1 153 2006 1 81 2007 1 0 2008 1 0 2009 1 279
2010 1 450 2011 1 487 2012 1 200 2013 1 219 2014 1 0 2015 1 237 2016 1 466 2017 1 0 2018 1 0 2019 1 0
KS
277
447 0 0
406 126 122
0 0 0 0
0 1,589
159 498 128 452 117 189 569 373
MT
0
0 0
69 0 0 0 0
172 0 0
392 0 0 0 0 0
160 0
402 181
NE
309
258 311 184 110 121
0 369 160 151
0
0 160
0 130
0 0 0 0 0
688
NM
0
0 0 0 0
129 0
426 0
37 0
0 86 0
241 463
0 27
117 0
183
ND
1,272
545 1,243
601 742 117 115 997
1,528 348
3,233
3,137 2,179 2,167 2,184 5,194 2,801 1,428 1,265 1,740 4,653
OK
228
221 214 94 0
173 267
0 629 106 108
0 0 0
444 519
0 0 0
176 0
SD
1,583
821 865 137 267 778 467 797 630
1,611 453
961 3,151 1,274
398 530 366 236 127 883
2,639
TX
3,316
3,405 1,369
653 173 565
1,146 2,180
718 196
2,638
3,488 2,399 1,415 3,219 3,291 2,099 2,267 1,711 1,222 1,827
WY
261
0 0 0
49 0
218 68 0
36 0
0 0
97 0 0 0 0
137 0
32
CEN FLYWAY
7,409
5,907 4,073 2,020 1,747 2,009 2,488 4,918 3,837 2,485 6,711
8,428 10,051 5,312 7,333
10,125 5,955 4,701 3,546 4,992
10,576
ATL FLYWAY
29,188
11,029 7,206 7,288 2,474 4,307
11,709 7,026 8,679
11,860 9,275
21,427 5,531
14,397 14,353 17,401 6,713 9,057
10,983 12,754 4,240
MISS FLYWAY
16,403
6,418 4,609 4,479
10,943 5,227 4,235
20,250 10,891 10,970 12,243
8,196 21,717 20,443 8,933
20,930 4,805
15,500 7,142 6,721
15,506
PAC 2
FLYWAY
11,607
2,863 5,452 2,879 5,632 6,428 5,742 7,415 6,130 4,880 6,536
17,048 9,449
10,734 15,666 12,615 8,254 5,820 4,933 6,804 8,237
U.S.
64,607
26,217 21,340 16,666 20,796 17,971 24,174 39,609 29,537 30,195 34,765
55,099 46,748 50,886 46,285 61,071 25,727 35,078 26,604 31,271 38,559
AVERAGE: 1999-2019 157 260 66 141 81 1,785 151 904 1,871 43 5,458 10,805 11,265 7,863 35,391
% CHANGE FROM: Prev. Year Average -100%
-34% 44%
-55% 176% 390% 125%
167% 161%
-100% -100%
199% 192%
50% -2% -25%
112% 94%
-67% -61%
131% 38%
21% 5%
23% 9%
¹ Preliminary FILE: S:\CF_D\projects\Monitorning\harvest data\DATABOOK\HIP\DIVERHARVHIP.XLS 2 Pacific Flyway total includes Alaska
ESTIMATED REGULAR SEASON HOODED MERGANSER HARVESTS (Harvest Information Program)
YR CO
1999 0
2000 140 2001 141 2002 188
2003 1 0 2004 1 116 2005 1 76 2006 1 161 2007 1 0 2008 1 0 2009 1 0
2010 1 90 2011 1 122 2012 1 0 2013 1 109 2014 1 144 2015 1 237 2016 1 155 2017 1 0 2018 1 0 2019 1 0
KS
694
447 716
1,261 913
1,388 367 338 810
1,440 914
777 1,589
796 332 765 452
1,175 1,796 2,115
280
MT
0
0 160
0 0
94 0 0 0
196 108
0 0 0
120 0 0
160 0 0 0
NE
154
129 778 459 330 485
0 92
641 452
1,375
0 639 139 391 97
322 0
265 180 76
NM
0
0 116 39 86 33 0
53 115
0 47
177 0 0
80 154 81 0 0 0 0
ND
727
436 276 601
1,039 817 693 249 255 580 557
865 622
1,444 3,103 1,535 2,370 1,071 1,602 1,218 1,206
OK
1,934
1,103 858
1,039 618 865
1,069 1,509 1,676 2,438 1,406
1,930 2,877 1,295 1,331 1,210
781 671 953
2,115 192
SD
317
352 247
0 802 194 654 114 630 302 226
107 716 849 531 265 274 79
445 1,059
426
TX
8,972
5,762 6,162 6,312 3,295 1,979 5,732 2,803 3,353 3,531 2,198
3,488 6,931 2,546 2,299 3,872 2,651 7,287 3,208 4,016
141
WY
0
81 0
87 49 95 0 0 0 0 0
0 61 0
92 0 0
36 0 0 0
CEN FLYWAY
12,798
8,450 9,454 9,986 7,132 6,066 8,591 5,319 7,480 8,939 6,831
7,434 13,557 7,069 8,388 8,042 7,168
10,634 8,269
10,703 2,321
ATL FLYWAY
29,269
35,960 28,108 31,791 29,181 25,692 34,037 37,182 38,135 38,212 42,000
36,148 34,991 39,200 41,411 30,378 28,393 38,323 33,061 31,516 31,522
MISS FLYWAY
46,577
44,927 43,506 58,936 51,706 47,469 30,454 37,241 38,686 38,037 41,645
45,988 53,766 45,886 45,416 54,723 37,751 50,167 47,789 33,738 46,569
PAC 2
FLYWAY
4,807
4,984 4,602 2,832 5,488 3,998 4,235 2,857 6,930 4,390 5,764
6,317 8,500 7,681 3,335 4,663 5,711 3,579 5,218 6,519 5,298
U.S.
93,451
94,321 85,670
103,545 93,507 83,225 77,317 82,599 91,231 89,578 96,240
95,887 110,814 99,836 98,550 97,806 79,023
102,703 94,337 82,476 85,710
AVERAGE: 1999-2019 80 922 40 334 47 1,013 1,327 409 4,121 24 8,316 34,024 44,808 5,129 92,277
% CHANGE FROM: Prev. Year Average -100%
-87% -70% -100%
-58% -77% -100%
-1% 19%
-91% -86%
-60% 4%
-96% -97% -100%
-78% -72%
0% -7%
38% 4%
-19% 3%
4% -7%
1 Preliminary FILE: S:\CF_D\projects\Monitorning\harvest data\DATABOOK\HIP\DIVERHARVHIP.XLS 2 Pacific Flyway total includes Alaska
20
01/04/21
01/04/21
01/04/21

Central Flyway Databook 202012/22/2020
ESTIMATED REGULAR SEASON ALL-DUCK HARVESTS (Harvest Information Program)
YR CO
1999 68,129
2000 91,070 2001 118,597 2002 82,306
2003 1 115,360
2004 1 93,159
2005 1 69,509
2006 1 86,981
2007 1 84,389
2008 1 95,054
2009 1 76,554
2010 1 49,649
2011 1 58,030
2012 1 71,421
2013 1 95,476
2014 1 82,537
2015 1 89,311
2016 1 73,845
2017 1 75,670
2018 1 72,346
2019 1 67,053
KS
203,226
195,555 168,267 202,093
203,184
249,126
145,413
133,701
135,523
208,056
176,862
168,422
178,112
150,901
235,335
188,655
204,053
153,083
137,833
137,540
135,423
MT
44,891
40,520 37,723 34,532
46,496
42,821
36,397
29,302
33,543
38,331
43,004
36,980
34,799
40,041
54,378
45,117
36,278
25,962
24,050
57,016
32,755
NE
189,301
207,716 206,289 215,972
214,457
158,780
158,368
155,512
175,518
177,621
143,998
139,070
203,036
135,346
177,479
117,926
131,446
126,986
119,766
102,243
116,042
NM
21,580
52,782 51,983 40,100
52,359
32,329
27,308
41,101
27,429
26,039
27,262
32,019
28,813
24,988
31,318
31,797
22,051
14,945
41,970
32,401
38,062
ND
538,499
427,300 491,201 514,598
496,800
541,901
519,400
378,697
373,002
288,299
473,000
322,361
460,646
459,347
466,744
545,033
509,275
437,297
426,370
470,711
406,945
OK
266,047
219,410 153,503 228,625
207,506
346,013
276,949
287,999
433,278
239,992
253,039
235,718
297,856
324,491
356,814
310,271
239,090
248,885
194,250
216,623
269,354
SD
302,900
218,399 294,307 251,699
254,400
215,299
179,199
193,503
182,900
169,500
225,200
187,464
226,143
220,341
201,087
175,388
180,717
124,870
129,465
152,260
187,875
TX
1,232,475
1,550,722 1,449,058
907,241
703,244
841,481
1,158,327
896,420
914,566
694,093
836,470
868,635
1,217,676
1,272,624
924,914
1,052,983
588,187
960,935
1,019,032
768,698
681,735
WY
28,471
32,412 36,390 41,288
35,705
39,654
25,945
31,193
36,955
26,857
32,705
25,198
32,025
33,328
46,224
24,673
18,988
18,797
30,889
23,172
17,327
CEN FLYWAY
2,895,519
3,035,886 3,007,318 2,518,454
2,329,511
2,560,563
2,596,815
2,234,409
2,397,103
1,963,842
2,288,094
2,065,516
2,737,136
2,732,828
2,589,769
2,574,380
2,019,396
2,185,605
2,199,295
2,033,010
1,952,571
ATL FLYWAY
1,828,974
1,791,877 1,694,218 1,760,084
1,608,124
1,407,669
1,590,959
1,597,831
1,658,559
1,733,259
1,657,916
1,823,345
1,627,165
1,841,004
1,600,571
1,527,084
1,300,285
1,573,788
1,545,308
1,568,956
1,206,513
MISS FLYWAY
7,599,866
7,610,590 6,410,705 5,681,073
6,171,916
5,353,316
5,150,356
5,929,967
6,366,702
6,280,226
5,843,914
7,329,953
7,580,310
6,918,156
6,447,738
6,122,384
4,570,152
4,902,754
5,179,044
3,796,435
4,003,927
PAC 2
FLYWAY
3,127,306
2,711,332 2,392,193 2,210,500
2,504,383
2,720,550
2,903,655
3,479,961
3,518,554
3,355,452
2,862,080
3,134,567
3,288,945
3,289,189
2,429,089
2,423,133
2,574,318
2,605,419
2,771,116
2,936,163
2,178,518
U.S.
15,451,665
15,149,685 13,504,434 12,170,111
12,613,934
12,042,098
12,241,785
13,242,168
13,940,918
13,332,779
12,652,004
14,353,381
15,233,556
14,781,177
13,067,167
12,646,981
10,464,151
11,267,566
11,694,763
10,334,564
9,341,529
AVERAGE: 1999-2019 81,736 176,684 38,806 160,613 33,268 454,639 266,939 203,472 978,072 30,390 2,424,620 1,616,357 5,964,261 2,829,353 12,834,591
% CHANGE FROM: Prev. Year -7% Average -18%
-2% -23%
-43% -16%
13% -28%
17% 14%
-14% -10%
24% 1%
23% -8%
-11% -30%
-25% -43%
-4% -19%
-23% -25%
5% -33%
-26% -23%
-10% -27%
1 Preliminary FILE: S:\CF_D\projects\monitoring\harvest data\DATABOOK\HIP\ALLDUCKTOTALHIP.XLS 2 Pacific Flyway total includes Alaska
21

Central Flyway Databook 202012/22/2020
AGE RATIOSIN THE U.S. HARVEST
22

Central Flyway Databook 202012/22/2020
MALLARD AGE RATIOS (IMMATURE/ADULT) IN THE ENTIRE SEASON HARVEST Derived from the Parts Collection Survey
YR CEN ATL MISS PAC
CO KS MT NE NM ND OK SD TX WY FLYWAY FLYWAY FLYWAY FLYWAY U.S.
1999 0.69 0.63 0.68 0.81 1.08 1.10 0.47 0.91 0.48 0.42 0.73 0.91 0.89 0.96 0.88
2000 0.55 0.41 0.44 0.66 0.62 0.86 0.24 0.81 0.47 0.47 0.54 0.92 0.68 1.02 0.74 2001 0.66 0.62 0.61 0.71 1.00 1.34 0.39 0.72 0.53 0.47 0.71 1.14 1.33 1.22 1.13 2002 0.48 0.51 0.60 0.71 0.89 0.92 0.33 1.04 0.33 0.42 0.60 0.96 0.90 1.17 0.87
2003 1 0.86 0.70 0.83 0.84 1.10 1.44 0.48 1.34 0.42 0.90 0.87 1.26 1.40 1.51 1.29 2004 1 0.70 0.57 0.60 0.55 1.22 1.21 0.56 1.17 0.53 0.59 0.74 1.37 1.03 1.43 1.06 2005 1 0.98 1.07 0.85 1.08 1.95 2.60 0.53 1.98 1.04 0.82 1.26 1.54 1.63 1.98 1.62 2006 1 0.73 0.75 0.96 1.04 0.84 2.36 0.63 1.63 0.69 0.86 1.05 1.35 1.44 1.82 1.45 2007 1 1.08 1.03 1.24 1.04 1.69 2.13 0.64 1.79 0.69 0.80 1.07 1.31 1.20 1.23 1.20
2008 1 0.55 0.65 0.75 0.67 1.21 1.33 0.27 1.20 0.41 0.54 0.70 1.22 1.06 1.19 1.04
2009 1 0.68 0.64 0.77 0.81 1.35 2.35 0.42 1.67 0.69 0.87 1.01 1.37 1.24 3.40 1.25
2010 1 0.86 1.26 1.02 1.34 1.49 2.44 0.64 2.50 0.87 1.30 1.29 1.30 1.59 1.63 1.53
2011 1 1.60 1.24 1.02 1.22 1.52 3.66 0.68 2.90 0.86 1.56 1.52 1.24 1.91 2.28 1.85
2012 1 0.92 0.74 1.15 0.99 1.31 3.20 0.39 2.37 0.66 1.09 1.17 1.38 1.68 1.35 1.46
2013 1 0.99 0.90 1.61 1.11 1.22 2.59 0.58 1.94 0.83 0.76 1.19 1.37 1.31 1.25 1.28
2014 1 1.10 1.10 1.30 1.50 1.90 3.20 0.70 2.30 1.00 0.80 1.43 1.33 1.66 1.25 1.50
2015 1 0.74 0.54 0.75 1.15 1.69 2.25 0.50 1.74 0.52 0.58 0.97 1.38 1.19 1.21 1.16
2016 1 0.65 0.59 0.57 0.77 1.12 1.66 0.41 1.75 0.51 0.68 0.78 1.24 1.09 1.25 1.07
2017 1 0.86 0.53 0.55 0.87 1.11 1.83 0.47 1.27 0.36 1.23 0.85 1.17 0.92 1.56 1.06
2018 1 0.66 0.63 1.12 0.86 0.66 2.22 0.42 1.65 0.58 0.76 0.90 1.12 1.07 0.94 1.00
2019 1 0.86 0.49 1.12 1.05 2.31 1.62 0.50 1.99 0.67 0.61 0.92 1.19 1.05 1.13 1.06
1 Preliminary
FEMALE MALLARD AGE RATIOS (IMMATURE/ADULT) IN THE ENTIRE SEASON HARVEST Derived from the Parts Collection Survey
YR CEN ATL MISS PAC
FLYWAY FLYWAY FLYWAY FLYWAY U.S.
1999 1.16 1.35 1.36 1.35 1.33
2000 0.92 1.31 1.14 1.66 1.22 2001 1.38 1.81 2.52 1.95 2.09 2002 1.09 1.47 1.61 1.87 1.53
2003 1 1.67 1.89 2.47 2.48 2.26
2004 1 1.60 2.11 2.11 2.36 2.07
2005 1 2.63 2.40 3.13 3.38 3.02
2006 1 1.93 1.93 2.80 2.97 2.61
2007 1 2.10 1.73 2.09 1.84 1.94
2008 1 1.16 1.84 2.08 1.96 1.76
2009 1 2.19 2.00 2.78 2.28 2.31
2010 1 2.57 2.00 3.35 2.75 2.67
2011 1 2.68 1.84 3.79 4.12 3.11
2012 1 2.17 1.85 3.28 2.35 2.41
2013 1 2.49 2.00 2.70 2.02 3.00
2014 1 2.73 1.99 3.33 1.99 2.51
2015 1 2.01 2.10 2.68 2.00 2.23
2016 1 1.71 2.30 2.42 1.95 2.11
2017 1 1.80 2.06 2.05 2.67 2.22
2018 1 2.19 1.82 2.40 1.63 1.99
2019 1 2.41 1.74 2.61 1.91 2.21
1 Preliminary
MALE MALLARD AGE RATIOS (IMMATURE/ADULT) IN THE REGULAR SEASON HARVEST Derived from the Parts Collection Survey
YR CEN ATL MISS PAC
FLYWAY FLYWAY FLYWAY FLYWAY U.S.
1999 1 0.61 0.74 0.70 0.83 0.72
2000 1 0.45 0.78 0.54 0.83 0.59
2001 1 0.57 0.90 1.02 1.00 0.88
2002 1 0.49 0.77 0.70 0.96 0.70
2003 1 0.72 1.04 1.11 1.23 1.03
2004 1 0.59 1.12 0.79 1.20 0.84
2005 1 1.01 1.25 1.28 1.62 1.29
2006 1 0.89 1.13 1.13 1.49 1.17
2007 1 0.89 1.13 0.99 1.04 1.01
2008 1 0.61 1.00 0.82 0.97 0.85
2009 1 0.82 1.12 0.93 1.16 1.01
2010 1 1.04 1.04 1.19 1.33 1.15
2011 1 1.27 1.01 1.45 1.81 1.39
2012 1 0.94 1.18 1.28 1.07 1.12
2013 1 0.95 1.12 0.98 1.03 2.09
2014 1 1.18 1.06 1.23 1.04 1.13
2015 1 0.80 1.12 0.87 1.00 0.93
2016 1 0.62 0.89 0.80 1.05 0.85
2017 1 0.68 0.90 0.67 1.29 0.92
2018 1 0.71 0.88 0.79 0.76 0.78
2019 1 0.72 0.97 0.78 0.92 0.87
1 Preliminary FILE S:\CF_D\projects\Monitoring\harvest data\DATABOOK\HIP\AGERATIOHIP.XLS 11/10/20
23

Central Flyway Databook 202012/22/2020
YR YR CEN ATL MISS PAC
FLYWAY FLYWAY FLYWAY FLYWAY CEN ATL MISS PAC
FLYWAY FLYWAY FLYWAY FLYWAY
YR YR CEN ATL MISS PAC
FLYWAY FLYWAY FLYWAY FLYWAY CEN ATL MISS PAC
FLYWAY FLYWAY FLYWAY FLYWAY
YR YR CEN ATL MISS PAC
FLYWAY FLYWAY FLYWAY FLYWAY CEN ATL MISS PAC
FLYWAY FLYWAY FLYWAY FLYWAY
NORTHERN PINTAIL AGE RATIOS (IMMATURE/ADULT) WOOD DUCK AGE RATIOS (IMMATURE/ADULT) IN THE IN THE ENTIRE SEASON HARVEST ENTIRE SEASON HARVEST Derived from the Parts Collection Survey Derived from the Parts Collection Survey
U.S. U.S.
1999 0.88 1.16 1.26 0.97 1.05 1999 1.05 1.04 1.38 1.24 1.25
2000 0.52 0.57 0.91 0.81 0.77 2000 0.63 1.22 0.99 2.18 1.04 2001 0.87 1.04 1.41 0.62 0.93 2001 1.31 1.20 2.05 1.29 1.60 2002 1.06 1.34 1.79 0.95 1.27 2002 1.03 1.15 1.67 1.25 1.43
2003 1 1.53 2.29 2.49 0.97 1.54 2003 1 1.07 1.59 1.66 1.57 1.58 2004 1 1.06 0.76 1.03 0.69 0.89 2004 1 1.36 1.28 1.53 2.39 1.47 2005 1 1.27 2.07 1.29 1.38 1.38 2005 1 1.01 1.27 1.32 2.41 1.32 2006 1 0.94 1.66 1.28 0.98 1.09 2006 1 1.08 0.99 1.61 2.06 1.37 2007 1 0.82 1.70 1.43 1.03 1.13 2007 1 1.64 0.97 1.28 1.12 1.18 2008 1 1.06 0.94 0.96 0.54 0.75 2008 1 1.63 1.21 1.77 1.23 1.53 2009 1 1.09 0.66 1.30 0.98 1.07 2009 1 1.01 1.31 2.05 2.08 1.71
2010 1 1.31 1.77 2.03 1.24 1.46 2010 1 1.42 1.20 1.78 1.43 1.54 2011 1 0.90 1.30 1.67 1.44 1.35 2011 1 1.09 0.90 1.22 1.69 1.12 2012 1 0.79 0.94 0.89 0.71 0.78 2012 1 0.97 1.09 1.25 1.36 1.19 2013 1 1.06 1.18 1.71 0.98 1.21 2013 1 1.11 1.45 1.45 1.23 1.43 2014 1 1.13 1.08 1.11 1.10 1.12 2014 1 1.13 1.33 2.04 1.96 1.69 2015 1 0.98 0.68 0.88 0.70 0.79 2015 1 2.34 1.32 1.74 2.18 1.61 2016 1 0.73 1.35 1.29 0.77 0.88 2016 1 0.87 1.37 1.29 1.70 1.29 2017 1 0.86 1.31 1.30 0.88 1.01 2017 1 1.63 1.36 1.19 2.71 1.32 2018 1 1.02 0.40 0.89 0.62 0.72 2018 1 1.33 1.38 1.34 1.99 1.37 2019 1 1.38 1.56 1.29 0.99 1.17 2019 1 1.74 1.41 1.45 1.53 1.46
1 Preliminary 1 Preliminary
GADWALL AGE RATIOS (IMMATURE/ADULT) IN THE REDHEAD AGE RATIOS (IMMATURE/ADULT) IN THE ENTIRE ENTIRE SEASON HARVEST SEASON HARVEST Derived from the Parts Collection Survey Derived from the Parts Collection Survey
U.S. U.S.
1999 1.27 1.98 1.25 0.92 1.25 1999 1.75 2.24 3.02 0.80 1.93
2000 0.56 0.79 0.71 0.92 0.68 2000 0.42 0.43 0.72 0.73 0.53 2001 1.00 0.82 1.32 0.78 1.14 2001 0.71 0.46 1.97 0.44 0.93 2002 0.80 0.52 0.68 1.01 0.74 2002 0.24 0.10 0.21 1.10 0.30
2003 1 1.62 0.86 1.23 1.41 1.34 2003 1 1.64 0.54 1.58 1.69 1.53
2004 1 0.92 0.73 0.93 0.96 0.93 2004 1 0.81 0.29 0.80 1.54 0.89
2005 1 1.17 1.30 1.81 1.78 1.52 2005 1 2.63 2.18 3.15 2.11 2.70
2006 1 0.94 1.35 1.39 1.13 1.19 2006 1 2.13 1.47 2.32 1.50 2.07
2007 1 1.29 1.35 1.37 0.79 1.25 2007 1 2.21 1.47 2.45 1.18 2.09
2008 1 0.70 0.79 0.74 0.79 0.74 2008 1 0.56 0.13 0.68 0.52 0.56
2009 1 1.16 1.00 1.32 1.03 1.22 2009 1 1.56 0.38 1.62 0.70 1.32
2010 1 1.68 1.82 1.72 1.34 1.66 2010 1 3.47 1.93 6.54 1.27 3.69 2011 1 1.38 2.61 1.82 1.46 1.68 2011 1 2.15 2.30 4.51 2.46 3.03 2012 1 0.95 1.13 1.21 0.84 1.10 2012 1 1.51 0.92 2.29 1.12 1.62 2013 1 1.25 1.48 1.25 1.13 1.25 2013 1 2.25 1.46 2.92 1.82 2.32 2014 1 1.29 1.68 1.32 1.32 1.33 2014 1 3.19 1.94 2.88 1.39 2.80 2015 1 1.26 1.09 1.03 1.00 1.09 2015 1 1.33 0.83 2.00 0.51 1.38 2016 1 0.94 1.28 1.02 0.97 1.01 2016 1 0.68 0.72 1.12 0.73 0.81 2017 1 1.00 0.81 0.79 1.54 0.94 2017 1 1.43 0.76 1.23 1.67 1.27 2018 1 1.10 0.92 1.10 1.05 1.08 2018 1 1.79 0.48 1.08 1.27 1.17 2019 1 1.25 0.71 1.05 1.45 1.14 2019 1 1.81 0.77 1.83 3.05 1.73
1 Preliminary 1 Preliminary
AMERICAN WIGEON AGE RATIOS (IMMATURE/ADULT) IN GREATER SCAUP AGE RATIOS (IMMATURE/ADULT) IN THE THE ENTIRE SEASON HARVEST ENTIRE SEASON HARVEST Derived from the Parts Collection Survey Derived from the Parts Collection Survey
U.S. U.S.
1999 0.70 1.08 0.99 0.88 0.88 1999 0.99 1.74 0.46 0.84
2000 0.44 0.50 0.59 0.94 0.66 2000 0.75 1.54 1.27 1.23 2001 0.76 1.02 1.17 1.02 0.99 2001 1.46 2.27 0.48 0.92 2002 0.88 0.92 1.31 1.67 1.30 2002 3.31 1.65 2.87 0.94 1.82
2003 1 1.34 0.90 1.31 1.11 1.21 2003 1 0.98 1.37 0.72 0.96
2004 1 0.80 0.75 1.30 1.23 1.09 2004 1 8.65 2.06 3.05 1.71 2.39
2005 1 0.80 0.84 1.85 2.05 1.48 2005 1 0.87 2.58 1.06 1.49
2006 1 0.83 1.95 2.62 1.38 1.40 2006 1 1.81 1.80 0.56 1.33
2007 1 0.82 1.22 1.65 1.31 1.26 2007 1 0.78 1.26 1.23 1.19
2008 1 0.94 0.67 0.91 1.09 1.02 2008 1 0.37 0.79 1.22 0.80
2009 1 0.71 0.66 1.37 1.29 1.10 2009 1 0.63 1.24 1.19 1.06
2010 1 1.11 1.79 1.69 1.34 1.41 2010 1 0.57 1.15 0.64 0.80 2011 1 0.76 1.43 1.97 1.76 1.48 2011 1 0.86 2.01 0.48 1.22 2012 1 0.73 0.99 1.38 1.21 1.08 2012 1 0.79 0.98 1.06 0.95 2013 1 0.84 1.03 1.27 1.52 1.24 2013 1 1.85 1.09 1.52 1.38 2014 1 0.95 0.68 1.70 1.58 1.35 2014 1 1.15 1.53 1.21 1.45 2015 1 1.14 0.93 2.37 1.27 1.31 2015 1 1.28 1.69 2.21 1.31 1.82 2016 1 0.67 0.50 1.71 0.95 0.93 2016 1 2.71 3.31 0.92 2.15 2017 1 0.89 1.09 1.54 1.22 1.19 2017 1 1.21 2.31 1.19 1.50 2018 1 0.97 0.60 1.97 1.16 1.12 2018 1 0.37 1.44 1.44 0.88 2019 1 1.15 1.07 1.46 1.21 1.24 2019 1 0.70 0.96 2.39 1.86 1.59
1 Preliminary 1 Preliminary
LESSER SCAUP AGE RATIOS (IMMATURE/ADULT) IN THE ENTIRE SEASON HARVEST Derived from the Parts Collection Survey
YR CEN ATL MISS PAC
FLYWAY FLYWAY FLYWAY FLYWAY U.S.
1999 0.88 0.26 0.62 1.02 0.57
2000 0.41 0.33 0.36 1.20 0.42 2001 1.04 0.67 0.60 1.65 0.75 2002 1.35 0.47 0.85 1.66 0.88
2003 1 0.95 0.77 1.33 1.58 1.16
2004 1 1.16 0.37 0.89 1.74 0.92
2005 1 0.54 0.50 0.57 2.11 0.63
2006 1 1.13 0.85 1.79 1.77 1.39
2007 1 1.08 0.77 1.05 1.36 1.05
2008 1 0.67 0.46 0.63 2.57 0.75
2009 1 0.82 0.52 0.53 1.37 0.66
2010 1 1.23 0.80 1.54 1.07 1.24
2011 1 1.29 1.18 1.55 1.29 1.39
2012 1 1.09 0.46 0.66 2.07 0.74
2013 1 2.22 0.58 1.15 1.41 1.14
2014 1 0.78 0.83 0.86 1.82 0.91
2015 1 0.83 0.88 0.88 1.47 0.93
2016 1 1.12 1.18 1.33 1.14 1.21
2017 1 1.01 0.91 1.06 1.81 1.06
2018 1 0.85 0.39 0.52 1.52 0.62
2019 1 0.89 0.90 1.18 2.71 1.16
FILE S:\CF_D\projects\Monitoring\harvest data\DATABOOK\HIP\AGERATIOHIP.XLS 1 Preliminary
24

Central Flyway Databook 202012/22/2020
BLUE-WINGED TEAL AGE RATIOS (IMMATURE/ADULT) IN THE ENTIRE SEASON HARVEST Derived from the Parts Collection Survey
YR CEN ATL MISS PAC
FLYWAY FLYWAY FLYWAY FLYWAY U.S.
1999 1.82 1.39 1.95 1.27 1.83
2000 1.76 0.74 1.39 0.96 1.42 2001 2.27 1.24 2.42 1.20 2.19 2002 1.90 0.80 1.96 1.13 1.74
2003 1 2.69 1.29 1.95 1.50 2.04 2004 1 1.57 0.88 1.34 0.87 1.29 2005 1 2.28 1.36 2.47 1.41 2.09 2006 1 2.10 1.39 1.75 1.07 1.74 2007 1 2.85 1.24 1.87 1.73 2.03 2008 1 1.59 0.86 0.92 0.83 1.03 2009 1 1.42 0.96 1.24 0.63 1.22
2010 1 1.57 0.97 1.71 0.94 1.52 2011 1 2.36 1.97 1.59 1.34 1.79 2012 1 1.85 1.25 1.29 1.14 1.39 2013 1 2.19 0.98 1.49 1.68 1.62 2014 1 1.46 0.85 1.16 1.19 1.24 2015 1 1.43 1.18 1.28 0.74 1.30 2016 1 0.95 0.93 1.26 0.83 1.04 2017 1 1.18 1.57 1.75 1.09 1.45 2018 1 1.59 0.94 1.76 1.28 1.57 2019 1 1.74 1.31 1.36 0.81 1.44
1 Preliminary and based on all-season harvest.
GREEN-WINGED TEAL AGE RATIOS (IMMATURE/ADULT) IN THE ENTIRE SEASON HARVEST Derived from the Parts Collection Survey
YR CEN ATL MISS PAC
FLYWAY FLYWAY FLYWAY FLYWAY U.S.
1999 1.33 2.37 1.63 1.04 1.47
2000 1.50 1.20 1.07 1.21 1.21 2001 1.79 1.16 1.98 1.03 1.56 2002 1.78 1.85 2.13 1.40 1.81
2003 1 2.10 1.83 1.91 1.14 1.71
2004 1 1.82 1.30 1.07 1.28 1.29
2005 1 1.37 1.67 1.96 1.74 1.72
2006 1 1.97 2.00 2.30 1.45 1.89
2007 1 1.83 1.90 1.98 1.22 1.66
2008 1 1.68 1.61 1.68 0.92 1.26
2009 1 1.59 1.62 1.23 1.05 1.25
2010 1 1.68 1.95 1.61 0.87 1.39
2011 1 1.81 1.97 2.00 1.28 1.75
2012 1 1.39 2.05 1.60 0.93 1.36
2013 1 1.71 1.77 1.80 1.35 1.66
2014 1 1.53 1.68 1.48 1.30 1.46
2015 1 1.53 1.66 1.63 1.27 1.48
2016 1 1.20 1.70 1.58 0.90 1.24
2017 1 1.59 1.52 1.50 1.09 1.38
2018 1 1.36 1.42 1.01 0.75 0.99
2019 1 1.81 1.78 1.30 1.10 1.34
1 Preliminary and based on all-season harvest. FILE S:\CF_D\projects\Monitoring\harvest data\DATABOOK\HIP\AGERATIOHIP.XLS 11/10/20
25

Central Flyway Databook 202012/22/2020
MALLARD SEX RATIOSIN THE U.S. HARVEST
26

Central Flyway Databook 202012/22/2020
MALLARD ADULT SEX RATIOS (MALE/FEMALE) IN THE REGULAR SEASON HARVEST Derived from the Parts Collection Survey
YR CEN ATL MISS PAC
FLYWAY FLYWAY FLYWAY FLYWAY U.S.
1999 3.57 2.70 2.77 2.90 2.91 2000 4.27 2.43 3.27 3.25 3.33 2001 4.76 2.82 3.79 3.25 3.79 2002 4.42 2.84 3.42 3.24 3.52
2003 1 4.98 2.83 3.65 3.40 3.75 2004 1 5.62 2.75 4.30 3.92 4.31 2005 1 5.31 3.00 4.17 3.79 4.12 2006 1 5.51 2.72 4.47 3.51 4.13 2007 1 5.96 2.40 4.13 3.22 3.93 2008 1 5.53 2.88 4.39 3.67 4.12 2009 1 6.44 2.64 5.08 3.38 4.39 2010 1 5.32 2.70 4.38 3.71 4.03 2011 1 4.91 2.78 4.16 3.95 3.95 2012 1 4.52 2.39 4.05 3.60 3.64 2013 1 5.43 2.63 4.24 3.55 3.97 2014 1 5.34 2.43 3.97 3.50 3.81 2015 1 5.94 2.86 4.84 3.91 4.62 2016 1 6.08 3.20 4.53 3.61 4.48 2017 1 5.49 3.19 4.54 4.09 4.44 2018 1 6.70 3.08 4.93 3.79 4.68 2019 1 7.28 2.57 5.73 3.71 5.04
1 Preliminary
MALLARD IMMATURE SEX RATIOS (MALE/FEMALE) IN THE REGULAR SEASON HARVES Derived from the Parts Collection Survey
YR CEN ATL MISS PAC
FLYWAY FLYWAY FLYWAY FLYWAY U.S.
1999 1.87 1.48 1.46 1.78 1.58 2000 2.10 1.40 1.54 1.60 1.60 2001 1.96 1.40 1.51 1.66 1.59 2002 1.98 1.49 1.46 1.64 1.57
2003 1 2.22 1.57 1.67 1.73 1.74 2004 1 2.14 1.48 1.64 2.03 1.77 2005 1 2.12 1.57 1.75 1.85 1.80 2006 1 2.53 1.59 1.80 1.76 1.85 2007 1 2.53 1.57 1.95 1.83 1.97 2008 1 2.92 1.57 1.73 1.82 2.01 2009 1 2.42 1.48 1.71 1.72 1.83 2010 1 2.14 1.41 1.55 1.80 1.73 2011 1 2.33 1.53 1.59 1.74 1.80 2012 1 1.97 1.52 1.58 1.64 1.68 2013 1 2.07 1.48 1.53 1.80 1.72 2014 1 2.30 1.30 1.43 1.84 1.72 2015 1 2.36 1.53 1.58 1.96 1.88 2016 1 2.22 1.24 1.50 1.95 1.76 2017 1 2.06 1.39 1.48 1.97 1.76 2018 1 2.16 1.49 1.62 1.78 1.78 2019 1 2.17 1.43 1.72 1.79 1.80
1 Preliminary FILE: S:\CF_D\projects\monitoring\harvest data\DATABOOK\HIP\SEXRATIOHIP.XLS 11/10/20
27

Central Flyway Databook 202012/22/2020
DUCK HARVESTSIN CANADA
28

Central Flyway Databook 202012/22/2020
ESTIMATES OF MALLARD HARVESTS IN CANADA
YR NF PE NS NB PQ ON MB SK AB BC NT YT NUN 2 TOTAL
1969¹ 215 217 738 571 26,117 194,954 253,620 336,342 403,587 109,084 N/A N/A 1,325,445
1970¹ 0 58 508 681 28,511 172,516 272,411 505,542 502,804 107,062 N/A N/A 1,590,093 1971¹ 0 326 475 602 34,776 178,310 184,727 465,149 451,912 93,375 N/A N/A 1,409,652 1972 285 131 975 642 60,829 250,848 210,706 480,045 567,097 116,215 N/A N/A 1,687,773 1973 71 306 787 1,090 59,294 243,853 148,687 352,289 541,772 103,525 N/A N/A 1,451,674 1974 333 231 625 1,156 66,175 253,090 145,168 490,951 690,092 107,971 N/A N/A 1,755,792 1975 774 405 972 583 57,791 296,173 159,143 567,985 521,935 122,725 1,698 797 1,730,981 1976 770 256 1,444 795 71,851 322,047 204,600 606,239 609,576 114,198 3,229 898 1,935,903 1977 836 196 2,371 700 81,803 268,893 165,258 391,986 510,395 131,035 3,073 584 1,557,130 1978 850 259 1,133 1,557 61,507 322,006 239,299 395,276 382,319 115,038 2,098 1,290 1,522,632 1979 555 465 744 1,570 70,597 266,117 245,016 419,509 485,014 117,176 1,182 1,673 1,609,618
1980 0 948 3,057 1,437 82,027 290,941 210,153 355,042 480,188 104,768 2,551 2,473 1,533,585 1981 2,947 1,461 2,537 2,491 91,950 279,541 175,215 231,117 392,274 114,672 1,703 1,033 1,296,941 1982 464 410 1,407 1,792 93,289 335,813 148,864 241,734 296,124 92,492 1,552 0 1,213,941 1983 1,069 937 4,046 2,558 87,352 297,944 160,522 284,403 364,000 121,758 2,417 603 1,327,609 1984 1,100 738 2,122 1,668 67,433 284,128 117,208 183,300 306,234 89,453 4,501 1,366 1,059,251 1985 797 1,149 3,312 3,268 97,274 293,349 87,173 157,833 180,046 81,965 4,153 757 911,076 1986 2,923 755 3,137 2,526 84,304 265,478 112,363 151,384 182,748 72,263 811 433 879,125 1987 1,022 728 3,693 3,142 116,452 315,101 136,678 154,961 211,929 75,591 1,120 192 1,020,609 1988 0 921 2,304 1,611 83,727 233,686 64,325 75,810 139,558 63,657 2,543 412 668,554 1989 1,319 930 4,324 2,232 79,327 262,933 70,133 75,680 188,562 57,357 437 773 744,007
1990 1,085 1,000 3,556 3,179 87,045 261,036 60,853 79,379 175,884 60,443 865 288 734,613 1991 949 1,106 3,712 4,582 84,483 229,026 60,933 70,050 122,105 51,458 94 641 629,139 1992 863 199 6,407 5,243 87,824 196,647 65,992 68,765 94,795 52,172 605 298 579,810 1993 1,025 1,178 5,029 3,755 100,032 202,647 42,969 50,351 83,094 45,181 1,178 560 536,999 1994 795 864 3,305 2,894 107,222 197,833 57,924 88,848 113,068 50,412 2,042 205 625,412 1995 532 751 4,822 5,131 83,307 176,680 74,206 104,296 111,048 40,782 1,509 278 603,342 1996 351 1,024 4,286 4,044 82,201 176,869 91,266 121,608 115,668 42,447 1,326 0 641,090 1997 1,461 417 8,047 5,371 77,594 178,169 107,379 133,017 151,164 55,513 437 126 718,695 1998 1,628 1,011 5,440 7,512 76,320 164,431 104,470 129,461 119,826 52,663 881 276 663,919 1999 1,188 667 6,305 4,866 69,568 131,901 82,639 182,714 105,126 48,002 0 220 633,196
2000 1,511 1,915 5,481 5,999 81,655 162,352 65,130 195,276 107,203 49,272 510 72 0 676,376 2001 601 1,192 5,721 7,047 79,896 166,629 92,115 107,413 94,699 35,575 643 229 0 591,760 2002 300 2,176 6,498 6,002 66,533 147,847 77,992 118,857 80,707 37,371 1,702 609 0 546,594 2003 696 804 4,711 6,511 58,873 138,099 66,403 126,397 73,088 35,384 410 110 0 511,486 2004 1,985 1,100 5,245 5,228 65,284 132,188 75,970 129,630 78,270 28,516 275 37 0 523,728 2005 754 1,681 4,544 4,732 72,231 115,284 87,315 144,393 78,798 33,586 688 0 0 544,006 2006 753 1,122 5,490 6,389 72,245 124,751 111,026 174,174 88,533 28,928 215 0 0 613,626 2007 1,837 1,289 5,711 7,030 65,187 119,403 68,121 163,912 82,133 30,167 897 265 0 545,952 2008 48 1,725 4,748 5,662 69,991 119,971 60,690 150,906 97,567 35,924 0 488 0 547,720 2009 80 651 4,079 3,377 65,216 106,537 61,460 135,546 62,778 32,736 0 67 0 472,527
2010 1,319 2,197 4,057 4,683 57,138 105,904 48,076 127,207 67,681 28,057 0 0 0 446,319 2011 670 3,434 5,296 5,501 62,037 105,529 59,170 143,258 91,670 32,990 334 0 0 509,889 2012 767 1,475 3,060 5,682 55,862 79,180 67,173 188,383 89,249 36,160 415 928 0 528,334 2013 0 758 7,500 9,689 47,579 107,319 42,549 193,591 106,935 29,986 923 0 0 546,829 2014 1,397 1,602 3,000 5,647 56,092 116,812 30,927 163,468 93,733 26,996 0 440 0 500,114 2015 650 1,779 7,082 6,647 54,653 114,114 56,624 179,718 88,206 28,664 0 0 0 538,137 2016 1,420 1,358 6,564 6,712 47,530 77,234 64,567 159,158 83,694 23,686 0 0 0 471,923 2017 334 1,292 4,829 5,456 50,497 83,591 36,119 133,725 89,114 25,962 658 0 0 431,577 2018 329 1,019 3,487 6,282 42,549 82,967 37,245 168,068 83,522 25,204 0 168 0 450,840 2019
AVERAGES:
1972-79 559 281 1,131 1,012 66,231 277,878 189,735 463,035 538,525 115,985 2,256 1,048 1,656,438 1980-89 1,164 898 2,994 2,273 88,314 285,891 128,263 191,126 274,166 87,398 2,179 804 1,065,470 1990-99 988 822 5,091 4,658 85,560 191,524 74,863 102,849 119,178 49,907 894 289 636,622 2000-2009 857 1,366 5,223 5,798 69,711 133,306 76,622 144,650 84,378 34,746 534 188 0 557,378 2010-2019 765 1,657 4,986 6,255 52,660 96,961 49,161 161,842 88,200 28,634 259 171 0 491,551 1972-2019 882 1,022 3,979 4,078 73,184 195,806 101,230 203,130 210,196 61,832 1,129 445 0 856,812
¹ Estimates for 1968-71 are useful only for distribution of harvest among provinces. They are not comparable FILE: S:\CF_D\projects\monitoring\harvest data\DATABOOK\HIP\ALLDUCKTOTALHIP.XLS 01/05/21
with estimates in subsequent years because different survey procedures were used. 2 Nunavut separated from the Northwest Territories on April 1, 1999.
29

Central Flyway Databook 202012/22/2020
ESTIMATES OF PINTAIL HARVESTS IN CANADA
YR NF PE NS NB PQ ON MB SK AB BC NT YT NUN 2 TOTAL
1969¹ 522 797 413 916 13,766 9,793 20,391 27,221 43,576 20,892 N/A N/A 138,287
1970¹ 379 1,123 872 1,566 18,831 12,960 30,729 48,583 66,169 30,063 N/A N/A 211,275 1971¹ 307 646 446 1,037 19,816 8,548 18,001 37,164 61,676 24,555 N/A N/A 172,196 1972 443 417 646 522 18,018 9,322 17,835 28,066 71,523 48,793 N/A N/A 195,585 1973 601 482 560 934 17,090 10,579 18,613 29,876 91,457 48,669 N/A N/A 218,861 1974 875 1,371 1,099 1,166 18,556 10,867 10,365 50,512 101,753 23,704 N/A N/A 220,268 1975 1,092 431 612 787 21,999 9,644 20,611 55,909 81,637 23,758 72 417 216,969 1976 1,507 651 911 1,772 27,578 17,112 17,545 34,693 59,532 38,626 385 277 200,589 1977 2,438 1,653 1,302 1,127 39,531 14,333 11,245 20,469 69,906 29,467 137 313 191,921 1978 824 829 730 1,571 21,298 13,077 21,072 14,051 38,039 22,830 698 216 135,235 1979 1,693 579 474 1,036 14,958 9,331 19,745 30,588 48,505 17,735 691 287 145,622
1980 905 510 757 1,385 16,722 13,248 12,872 16,868 44,003 21,392 0 108 128,770 1981 1,536 747 952 1,144 17,440 11,977 16,127 2,430 39,745 18,658 91 148 110,995 1982 0 1,531 1,011 1,480 20,791 10,946 13,290 12,598 29,130 14,021 0 0 104,798 1983 2,809 523 696 303 15,868 10,767 11,195 17,056 27,154 13,385 1,864 175 101,795 1984 1,702 1,047 718 908 9,253 10,133 13,131 12,343 34,016 19,661 168 337 103,417 1985 1,468 748 1,461 1,820 16,525 15,340 9,790 8,148 24,056 11,252 0 502 91,110 1986 632 565 847 1,842 13,163 9,061 6,988 9,077 8,632 8,885 0 296 59,988 1987 792 2,218 633 1,018 11,865 6,020 5,479 8,386 19,668 10,945 0 158 67,182 1988 1,959 1,466 489 655 12,115 8,016 13,815 5,326 14,644 10,872 0 0 69,357 1989 1,433 661 341 1,421 15,427 11,506 7,559 4,368 11,743 8,457 44 0 62,960
1990 4,062 510 647 1,711 19,645 8,208 5,262 9,998 13,480 7,792 281 41 71,637 1991 351 542 901 844 9,357 4,742 4,407 4,023 5,689 4,179 112 73 35,220 1992 0 910 79 464 6,221 4,861 5,236 2,126 6,914 6,393 136 77 33,417 1993 1,090 1,336 852 706 11,401 5,156 5,172 3,253 4,025 4,701 61 0 37,753 1994 934 765 1,163 1,136 11,307 4,649 4,866 7,302 7,518 4,738 0 64 44,442 1995 1,727 454 965 1,240 7,831 4,552 8,974 6,521 7,573 4,476 0 0 44,313 1996 1,246 478 897 1,234 5,043 4,011 10,323 14,477 9,621 5,367 0 0 52,697 1997 785 139 116 493 7,423 5,560 13,248 13,656 13,882 5,422 37 0 60,761 1998 1,026 0 653 757 7,735 6,361 14,347 11,099 11,119 6,462 19 276 59,854 1999 390 1,137 755 1,790 8,956 6,457 9,830 10,610 10,304 5,464 0 0 55,693
2000 470 509 499 581 6,480 5,397 6,849 16,168 13,603 5,825 50 0 0 56,431 2001 137 0 401 611 4,911 3,709 9,216 7,051 8,732 4,807 19 60 0 39,654 2002 1,153 78 543 702 5,527 9,910 13,879 13,055 7,640 4,551 0 0 0 57,038 2003 572 598 228 1,270 6,795 10,422 8,999 8,688 8,205 1,948 234 0 0 47,959 2004 30 317 129 702 6,394 5,208 12,624 23,803 8,380 2,363 0 0 0 59,950 2005 256 313 308 536 4,677 3,178 6,653 13,450 10,769 3,675 0 0 0 43,815 2006 176 939 90 382 5,067 4,861 8,579 11,853 12,527 2,004 39 0 0 46,517 2007 228 584 660 634 5,533 5,059 13,329 18,054 10,085 2,410 224 0 0 56,800 2008 427 252 393 427 4,867 5,745 7,911 15,076 12,833 2,989 0 0 0 50,920 2009 0 190 104 504 4,039 4,684 4,582 17,226 6,138 2,837 0 22 0 40,326
2010 321 943 824 609 6,266 6,480 4,862 13,530 6,728 2,228 0 0 0 42,791 2011 302 0 578 263 3,287 1,670 6,188 20,217 14,053 2,755 0 0 0 49,313 2012 0 435 62 0 2,216 2,364 2,519 15,474 14,307 4,464 0 0 0 41,841 2013 612 671 696 721 7,060 4,850 3,796 19,243 15,786 2,357 0 0 0 55,792 2014 88 0 532 109 2,729 3,350 3,903 30,717 20,996 3,603 0 440 0 66,467 2015 0 333 355 303 2,435 3,171 7,928 11,790 10,678 2,528 0 0 0 39,521 2016 430 0 287 162 2,780 2,861 7,469 11,869 7,920 2,492 0 0 0 36,270 2017 437 0 0 209 1,437 4,224 3,428 28,390 13,135 2,092 0 0 0 53,352 2018 349 0 442 302 2,482 2,993 2,648 15,714 9,429 1,986 0 168 0 36,513 2019
AVERAGES:
1972-79 1,184 802 792 1,114 22,379 11,783 17,129 33,021 70,294 31,698 397 302 190,631 1980-89 1,324 1,002 791 1,198 14,917 10,701 11,025 9,660 25,279 13,753 217 172 90,037 1990-99 1,161 627 703 1,038 9,492 5,456 8,167 8,307 9,013 5,499 65 53 49,579 2000-2009 345 378 336 635 5,429 5,817 9,262 14,442 9,891 3,341 57 8 0 49,941 2010-2019 282 265 420 298 3,410 3,551 4,749 18,549 12,559 2,723 0 68 0 46,873 1972-2019 858 614 604 857 10,811 7,361 9,879 16,068 23,770 10,724 122 101 0 81,755
¹ Estimates for 1968-71 are useful only for distribution of harvest among provinces. They are not FILE: S:\CF_D\projects\monitoring\harvest data\DATABOOK\HIP\ALLDUCKTOTALHIP.XLS 01/04/21
comparable with estimates in subsequent years because different survey procedures were used. 2 Nunavut separated from the Northwest Territories on April 1, 1999.
30

Central Flyway Databook 202012/22/2020
ESTIMATES OF ALL-DUCK HARVESTS IN CANADA
YR NF
1969¹ 71,772
1970¹ 76,387 1971¹ 59,232 1972 88,638 1973 70,434 1974 101,000 1975 102,344 1976 98,322 1977 132,957 1978 142,686 1979 121,861
1980 106,066 1981 113,877 1982 111,122 1983 119,512 1984 115,454 1985 110,041 1986 124,331 1987 74,331 1988 83,838 1989 92,687
1990 91,543 1991 55,430 1992 62,769 1993 66,613 1994 81,991 1995 67,360 1996 56,531 1997 57,710 1998 61,368 1999 51,465
2000 63,617 2001 50,207 2002 50,457 2003 41,648 2004 44,271 2005 42,897 2006 48,136 2007 63,557 2008 59,079 2009 47,660
2010 45,322 2011 46,878 2012 55,136 2013 53,286 2014 25,854 2015 30,969 2016 23,907 2017 33,873 2018 25,320 2019
PE
22,842
25,144 27,914 20,360 15,936 31,255 28,448 37,504 30,180 30,048 20,936
31,826 26,243 38,504 36,370 34,922 31,139 29,582 28,901 34,145 21,622
20,110 28,054 15,055 22,756 18,313 27,892 19,257 21,371 15,361 19,923
13,540 17,815 15,651 14,637 9,944
12,410 12,680 12,286 11,164 10,116
14,643 13,593 19,835 13,126 14,420 8,219 8,853 4,960 4,776
NS
56,103
70,159 78,223 77,385 80,655
102,301 117,968 118,038 134,485 109,547 88,401
124,761 113,582 87,941
117,295 95,739 92,473 99,882 78,359 85,406
120,726
104,040 76,588 95,708 95,149 91,725 93,198 79,991 74,204 82,094 86,556
69,188 58,476 62,118 55,789 47,771 44,881 44,650 57,350 51,031 40,471
41,556 41,666 41,236 45,969 24,818 35,833 29,864 28,049 31,550
NB
55,553
52,714 50,130 55,035 45,941 58,124 58,048 68,027 53,803 65,862 49,271
59,783 59,082 61,318 72,849 68,816 69,523 70,855 59,426 63,403 64,448
70,539 47,276 52,280 51,089 53,883 74,273 56,202 50,634 59,803 56,642
52,475 41,656 43,050 44,613 32,306 34,812 37,115 39,324 37,005 28,484
40,383 32,896 33,877 38,397 31,417 27,911 27,235 22,326 28,741
PQ
379,547
389,891 402,675 436,665 451,148 556,556 461,878 601,074 630,044 527,989 469,363
500,434 507,706 514,402 453,807 439,202 494,433 433,562 467,042 445,555 433,785
456,331 356,978 342,974 396,462 355,414 299,000 255,648 261,923 256,382 270,264
244,487 215,779 189,473 177,880 171,619 182,650 186,035 172,585 184,236 169,740
163,862 165,466 158,372 146,552 142,214 135,485 127,142 129,508 98,822
ON
748,796
728,404 609,481 853,308 735,487 803,378 950,370 978,182 913,830 942,980 844,916
912,988 849,216 859,526 888,678 832,646 871,818 821,763 759,035 663,940 682,797
684,440 620,344 541,553 582,033 517,677 512,933 460,414 461,371 425,275 385,576
367,334 364,497 351,889 313,729 289,676 273,663 303,980 273,692 279,513 252,949
264,369 268,673 242,972 268,754 280,685 314,335 224,240 230,362 229,442
MB
423,138
471,608 317,300 354,561 264,676 252,503 305,809 351,783 259,408 360,877 383,250
335,577 293,992 269,613 285,594 214,678 174,453 207,559 208,576 125,905 121,028
111,839 106,827 118,701 93,665
116,975 135,147 168,502 183,466 175,742 162,354
148,147 168,274 155,538 128,550 146,093 161,893 173,738 143,710 129,988 124,369
114,050 124,776 121,538 128,694 113,921 121,329 128,267 87,222 94,369
SK
478,762
684,287 605,568 617,262 481,425 704,767 802,629 807,735 509,728 527,398 582,384
443,919 273,357 324,541 380,169 258,466 210,541 226,165 200,833 104,509 104,122
115,659 102,879 92,556 76,729
130,479 149,321 190,133 204,210 205,544 233,178
242,275 153,504 173,087 185,458 195,060 225,849 243,086 242,542 222,761 187,239
206,663 268,148 266,797 306,159 293,970 276,219 276,503 220,926 259,443
AB
624,473
737,527 696,844 821,582 822,528
1,001,454 839,225 881,807 778,679 580,351 679,022
687,370 526,197 458,663 515,356 439,086 283,491 273,044 297,081 182,437 254,798
231,916 166,312 129,133 123,711 169,519 152,794 183,079 229,747 170,070 157,614
160,685 135,352 125,533 124,368 136,063 152,717 153,470 159,478 173,401 110,861
121,504 147,934 144,925 177,523 164,465 156,242 162,169 170,896 174,253
BC
229,398
237,532 195,189 266,630 248,879 205,291 235,448 231,421 259,488 210,763 204,606
185,832 186,699 163,191 193,600 174,322 145,849 125,037 126,703 115,666 102,900
96,165 80,404 82,283 72,835 78,692 62,223 72,241 81,179 87,429 70,934
73,411 55,594 58,735 51,992 43,430 52,577 41,051 44,312 53,351 46,557
45,173 49,614 54,242 43,657 50,513 44,718 40,161 37,228 41,408
NT
N/A
N/A N/A N/A N/A
2,994 3,509 6,573 5,656 5,857 4,075
5,885 3,622 1,552 6,749 6,280 8,307 3,627 2,504 2,967 1,205
2,142 737
1,230 1,780 2,043 2,156 1,988 1,667 1,985 1,431
1,055 1,021 3,344 1,815 1,927 2,063
525 1,571
334 2,659
834 835
2,130 1,384 3,757
791 1,144
658 372
YT
N/A
N/A N/A N/A N/A 896
3,396 3,319 2,417 2,825 3,018
2,969 1,328 1,060 3,173 2,580 2,172 1,415
902 1,052
773
453 1,100
828 1,339
901 1,393
597 392
1,102 307
460 408
1,131 548 184
2,294 167
1,855 976 156
0 582 928
2,362 881 969 535 875
1,344
NUN 2
114 0 0
710 0 0 0 0 0 0
0 0 0 0 0 0 0 0 0
TOTAL
3,090,384
3,473,653 3,042,556 3,591,426 3,217,109 3,820,519 3,909,072 4,183,785 3,710,675 3,507,183 3,451,103
3,397,410 2,954,901 2,891,433 3,073,152 2,682,191 2,494,240 2,416,822 2,303,693 1,908,823 2,000,891
1,985,177 1,642,929 1,535,070 1,584,161 1,617,612 1,577,690 1,544,583 1,627,874 1,542,155 1,496,244
1,436,788 1,262,583 1,230,006 1,141,737 1,118,344 1,188,706 1,244,633 1,212,262 1,202,839 1,021,261
1,058,359 1,161,061 1,141,988 1,225,863 1,146,915 1,153,020 1,050,020
966,883 989,840
AVERAGES:
1972-79 107,280 1980-89 105,126 1990-99 65,278 2000-2009 51,153 2010-2019 37,838 1972-2019 72,646
26,833 31,325 20,809 13,024 11,381 20,610
103,598 101,616 87,925 53,173 35,616 76,095
56,764 64,950 57,262 39,084 31,465 50,005
516,840 468,993 325,138 189,448 140,825 324,211
877,806 814,241 519,162 307,092 258,204 547,898
316,608 223,698 137,322 148,030 114,907 184,203
629,166 252,662 150,069 207,086 263,870 287,369
800,581 391,752 171,390 143,193 157,768 316,764
232,816 151,980 78,439 52,101 45,190
108,392
4,777 4,270 1,716 1,631 1,323 2,594
2,645 1,742
841 818 942
1,297
82 0
43
3,673,859 2,612,356 1,615,350 1,205,916 1,099,328 1,991,937
¹ Estimates for 1968-71 are useful only for distribution of harvest among provinces. They are not comparable S:\CF_D\projects\monitoring\harvest data\DATABOOK\HIP\ALLDUCKTOTALHIP.XLS 4-Jan-21
with estimates in subsequent years because different survey procedures were used. 2 Nunavut separated from the Northwest Territories on April 1, 1999.
31

Central Flyway Databook 202012/22/2020
DUCK HARVESTS INNORTH AMERICA
32

Central Flyway Databook 202012/22/2020
ESTIMATES OF ENTIRE SEASON MALLARD HARVESTS IN THE UNITED STATES (Harvest Information Program) AND CANADA
ATLANTIC
YR FLYWAY
1999 444,068
2000 523,046 2001 472,682 2002 538,846 2003 1 427,301 2004 1 422,091 2005 1 444,305 2006 1 399,651 2007 1 429,917 2008 1 503,480 2009 1 419,279
2010 1 394,429
2011 1 315,897 2012 1 325,487 2013 1 328,029 2014 1 294,063 2015 1 250,114 2016 1 313,511 2017 1 286,376 2018 1 277,119 2019 1 222,255
MISSISSIPPI
FLYWAY
3,137,726
3,272,671 2,796,047 2,374,276 2,483,361 2,199,931 2,049,383 2,286,643 2,514,119 2,282,128 2,075,916
2,228,872 2,240,248 1,882,553 1,836,788 1,992,886 1,695,598 1,826,117 1,643,472 1,407,353 1,454,937
UNITED STATES CENTRAL PACIFIC
FLYWAY FLYWAY
995,528 1,295,088
1,035,988 1,218,394 1,178,357 1003857 1,013,838 887,246
962,154 1,033,457 969,467 918,681 868,144 1,074,807 709,952 1,249,549 806,861 1,107,485 677,267 1,069,968 721,474 896,866
603,214 906,964 773,332 1,059,280 763,143 946,940 740,084 715,358 813,668 785,215 714,448 766,165 716,017 830,356 610,977 863,583 651,046 1,023,443 528,764 670,036
ALASKA
23,385
19,085 27,711 19,541 24,824 21,479 30,288 22,616 20,039 22,126 21,078
32,534 20,338 17,148 17,125 18,232 6,990
33,144 21,152 14,830 20,079
U.S.
TOTAL
5,895,795
6,069,184 5,478,655 4,833,747 4,931,097 4,531,649 4,466,927 4,668,411 4,878,421 4,554,969 4,134,613
4,166,013 4,409,095 3,935,271 3,637,384 3,904,064 3,433,315 3,719,145 3,425,560 3,373,791 2,896,071
EASTERN
CANADA2
214,495
258,913 261,086 229,356 209,694 211,030 199,226 210,750 200,457 202,145 179,940
175,298 182,467 146,026 172,845 184,550 184,925 140,818 145,999 136,633
MB/SK/AB
370,479
367,609 294,227 277,556 265,888 283,870 310,506 373,733 314,166 309,163 259,784
242,964 294,098 344,805 343,075 288,128 324,548 307,419 258,958 288,835
CANADA BRITISH
COLUMBIA NT, NU and YT
48,002 220
49,272 582 35,575 872 37,371 2,311 35,384 520 28,516 312 33,586 688 28,928 215 30,167 1,162 35,924 488 32,736 67
28,057 0 32,990 334 36,160 1,343 29,986 923 26,996 440 28,664 0 23,686 0 25,962 658 25,204 168
CANADA
TOTAL
633,196
676,376 591,760 546,594 511,486 523,728 544,006 613,626 545,952 547,720 472,527
446,319 509,889 528,334 546,829 500,114 538,137 471,923 431,577 450,840
NORTH AMERICAN
TOTAL
6,528,991
6,745,560 6,070,415 5,380,341 5,442,583 5,055,377 5,010,933 5,282,037 5,424,373 5,102,689 4,607,140
4,612,332 4,918,984 4,463,605 4,184,213 4,404,178 3,971,452 4,191,068 3,857,137 3,824,631
AVERAGE: 1999-2019 382,474 2,175,287 802,558 967,749 21,607 4,349,675 192,333 305,991 32,658 565 531,547 4,953,902
% CHANGE FROM: Prev. Year -20% Average -42%
3% -33%
-19% -35% -34% -31%
35% -7%
-14% -33%
-100% -100%
-100% -100%
-100% -100% -100% -100%
-100% -100%
-100% -100%
1 Preliminary S:\CF_D\projects\monitoring\harvest data\DATABOOK\HIP\ALLDUCKTOTALHIP.XLS
2 NF, PE, NS, NB, PQ, and ON
33

Central Flyway Databook 202012/22/2020
GOOSE HARVESTS INNORTH AMERICA
34

Central Flyway Databook 202012/22/2020
ESTIMATED REGULAR SEASON SNOW/BLUE GOOSE HARVESTS (Harvest Information Survey)
YR CO KS
1999 7,620 10,405
2000 6,990 8,164 2001 7,951 4,091 2002 9,778 14,751 2003 1 14,664 16,570 2004 1 7,988 14,439 2005 1 5,554 3,495 2006 1 8,742 11,446 2007 1 9,962 9,630 2008 1 3,038 8,991 2009 1 3,096 4,001
2010 1 2,081 3,296 2011 1 8,026 17,944 2012 1 1,568 9,607 2013 1,3 3,543 21,236 2014 1 917 26,690 2015 1 1,188 18,333 2016 1 12,482 12,684 2017 1 19,180 12,754 2018 1 1,754 11,548 2019 1 2,388 12,639
MT NE
63 22,114
0 2,745 106 5,240 291 11,347 453 4,778 113 771 54 3,815 0 888
83 856 0 1,199
494 3,040
0 0 0 6,964 0 788 0 19,021 0 350
151 1,290 258 11,134 141 2,960 437 214 220 1,002
NM ND
3,081 62,014
3,811 31,119 7,465 41,125 4,377 20,146 2,327 24,803 1,017 17,647 1,723 19,163 2,067 31,261 1,609 28,120
124 31,321 621 31,075
276 34,554 1,551 28,448
789 27,861 0 28,536
3,639 15,735 888 28,416 228 45,674 43 36,611 0 24,872
120 26,605
OK SD
4,697 13,959
7,843 2,500 4,434 16,489 2,834 23,234 1,406 27,920 2,529 28,802 7,273 21,125 7,554 25,317 4,501 10,581 2,416 25,420 1,767 17,517
7,542 17,535 1,881 11,846 3,464 33,348
17,432 16,714 6,620 12,081
501 7,009 1,492 13,221
590 32,227 2,291 9,466 3,441 15,377
TX
293,635
285,993 213,685 144,056 123,247 110,504 191,235 107,290 112,830 100,084 49,905
88,476 92,236 70,989 61,891
143,324 45,789 97,615
123,659 33,668 65,620
WY
0
114 0 0
325 0 0 0 0 0
66
0 248 330
0 0 0
62 218
0 295
CEN FLYWAY
417,588
349,279 300,586 230,814 216,493 183,810 253,437 194,565 178,172 172,593 111,582
153,760 169,144 148,744 168,373 209,356 103,565 194,850 228,383 84,250
127,707
ATL FLYWAY
54,711
72,257 77,802 39,295 36,105 31,548 36,102 33,256 50,742 58,752 29,426
18,293 37,592 41,251 30,482 21,684 20,983 25,560 16,611 6,965
17,091
MISS FLYWAY
302,278
160,752 226,716 110,766 186,862 168,358 219,699 140,300 140,802 145,962 65,625
82,934 122,573 61,448
133,355 86,602 69,657
120,440 134,344 54,342 49,180
PAC 2
FLYWAY
51,613
38,439 44,572 46,527 42,607 40,611 63,779 71,479 87,738 87,274 53,640
65,034 64,115 70,214 48,365 75,573 65,116 79,867
116,102 99,570 94,120
U.S. TOTAL
826,190
620,727 649,675 427,402 482,067 424,327 573,017 439,600 457,454 464,581 260,273
320,021 393,424 321,657 380,575 393,215 259,321 420,717 495,440 245,127 288,098
CANADA TOTAL
192,517
227,228 241,069 177,343 238,545 175,279 172,259 239,831 169,175 278,977 155,299
162,548 213,747 185,689 224,919 275,466 144,145 125,685 152,020 114,884
U.S. + CANADA
1,018,707
847,955 890,744 604,745 720,612 599,606 745,276 679,431 626,629 743,558 415,572
482,569 607,171 507,346 605,494 668,681 403,466 546,402 647,460 360,011
AVERAGE: 1999-2019 6,596 12,034 136 4,786 1,703 30,243 4,405 18,176 121,701 79 199,860 36,024 132,524 66,969 435,377 193,331 636,072
% CHANGE FROM: Prev. Year 36% 9% Average -64% 5%
-50% 368% 61% -79%
7% -93% -12%
50% 62% -22% -15%
95% -46% 274%
52% -36%
145% -53%
-9% -63%
-5% 41%
18% -34%
-100% -100%
-100% -100%
1 Preliminary 2 Pacific Flyway total includes Alaska 3 Includes Conservation Order harvest.
ESTIMATED REGULAR SEASON ROSS'S GOOSE HARVESTS (Harvest Information Survey)
YR CO
1999 1,499
2000 760 2001 1,817 2002 1,029
2003 1 2,122
2004 1 1,332
2005 1 444
2006 1 4,687
2007 1 1,566
2008 1 1,953 2009 1 310
2010 1 347 2011 1 819 2012 1 0 2013 1,3 1,492
2014 1 0
2015 1 0
2016 1 2,539
2017 1 3,607
2018 1 390
2019 1 149
KS MT
1,643 0
0 191 314 0
3,471 94
2,693 0
2,042 0
194 0
1,402 0
1,313 0
3,549 0
266 0
1,163 0
1,932 0
3,409 0
6,017 111
5,719 0
3,595 151
1,538 0
1,501 0
1,316 0
2,943 0
NE NM
3,797 1,761
732 1,755 629 10,451 331 1,908
735 1,138
193 2,288
544 1,000
381 910
143 724
239 247
2,134 113
0 221
398 258
263 1,052
2,875 0
350 1,747
0 0
1,204 137
455 0
0 464
0 0
ND
360
338 2,896
528
109
213
913
912
528
1,524
2,093
1,547
2,785
6,024
951
1,663
3,016
3,498
3,481
1,478
4,887
OK
361
941 1,162 1,417
703
1,167
2,273
3,110
1,637
966
530
794
1,410
742
3,486
2,452
501
895
0
509
1,966
SD TX
787 47,491
0 31,269 1,725 40,729
664 27,617
603 22,244
983 23,527
315 37,416
463 12,070
0 12,895
1,141 22,192
824 3,899
1,077 18,363
671 23,854
2,182 14,503
356 15,201
653 42,549
701 4,923
853 19,663
3,480 34,317
186 10,893
2,853 12,004
WY
0
0 0 0
0
0
0
0
43
0
0
90
83
0
0
0
0
0
0
0
148
CEN FLYWAY
57,699
35,986 59,723 37,059
30,347
31,745
43,099
23,935
18,849
31,811
10,169
23,602
32,210
28,175
30,489
55,133
12,887
30,327
46,841
15,236
24,950
ATL FLYWAY
0
0 0 0
0
0
0
82
1,500
170
145
0
0
0
0
53
0
0
254
0
0
MISS FLYWAY
9,343
6,542 18,780 8,496
17,332
4,625
3,970
10,102
8,836
12,383
1,950
4,608
4,821
7,163
6,258
16,694
3,142
14,531
25,147
3,812
9,783
PAC 2
FLYWAY
28,318
6,850 14,834 16,248
16,904
11,070
8,026
6,627
8,782
15,613
9,928
16,875
15,915
16,073
16,022
19,576
14,331
8,625
28,263
12,952
16,222
U.S. TOTAL
95,360
49,378 93,337 61,803
64,583
47,440
55,095
40,746
37,967
59,977
22,192
45,085
52,946
51,411
52,769
91,456
30,360
53,483
100,505
32,000
50,955
CANADA TOTAL
22,749
17,895 20,985 33,956
30,269
22,092
14,749
26,712
18,037
48,165
24,036
34,798
39,952
24,722
34,955
41,285
21,361
23,712
41,498
11,930
U.S. + CANADA
118,109
67,273 114,322 95,759
94,852
69,532
69,844
67,458
56,004
108,142
46,228
79,883
92,898
76,133
87,724
132,741
51,721
77,195
142,003
43,930
AVERAGE: 1999-2019 1,279 2,191 26 733 1,246 1,893 1,287 977 22,744 17 32,394 105 9,444 14,669 56,612 27,693 84,588
% CHANGE FROM: Prev. Year -62% Average -88%
124% 34% -100%
-100% -100% -100%
231% 158%
286% 53%
1434% 10% 192% -47% 754%
64% -23% -100%
157% 4%
25% 11%
59% -10%
-100% -100%
-100% -100%
1 Preliminary 2 Pacific Flyway total includes Alaska 3 Includes Conservation Order harvest.
ESTIMATED REGULAR SEASON LIGHT (SNOW, BLUE, AND ROSS'S) GOOSE HARVESTS (Harvest Information Survey)
YR CO KS
1999 9,119 12,048
2000 7,750 8,164 2001 9,768 4,405 2002 10,807 18,222
2003 1 16,786 19,263
2004 1 9,320 16,481
2005 1 5,998 3,689
2006 1 13,429 12,848
2007 1 11,528 10,943
2008 1 4,991 12,540
2009 1 3,406 4,267
2010 1 2,428 4,459
2011 1 8,845 19,876
2012 1 1,568 13,016 2013 1,3 4,662 16,281
2014 1,3 917 32,409
2015 1,3 1,188 21,928
2016 1,3 15,021 14,222
2017 1,3 22,787 14,255
2018 1,3 2,144 12,864
2019 1,3 2,537 15,582
MT NE
63 25,911
191 3,477 106 5,869 385 11,678
453 5,513
113 964
54 4,359
0 1,269
83 999
0 1,438
494 5,174
0 0
0 7,362
0 1,051
111 3,538
0 700
302 1,290
258 12,338
141 3,415
437 214
220 1,002
NM ND
4,842 62,374
5,566 31,457 17,916 44,021 6,285 20,674
3,465 24,912
3,305 17,860
2,723 20,076
2,977 32,173
2,333 28,648
371 32,845
734 33,168
497 36,101
1,809 31,233
1,841 33,885
0 29,487
5,386 17,398
888 31,432
365 49,172
43 40,092
464 26,350
120 31,492
OK SD
5,058 14,746
8,784 2,500 5,596 18,214 4,251 23,898
2,109 28,523
3,696 29,785
9,546 21,440
10,664 25,780
6,138 10,581
3,382 26,561
2,297 18,341
8,336 18,612
3,291 12,517
4,206 35,530
6,168 15,292
9,072 12,734
1,002 7,710
2,387 14,074
590 35,707
2,800 9,652
5,407 18,230
TX
341,126
317,262 254,414 171,673
145,491
134,031
228,651
119,360
125,725
122,276
53,804
106,839
116,090
85,492
66,234
185,873
50,712
117,278
157,976
44,561
77,624
WY
0
114 0 0
325
0
0
0
43
0
66
90
331
330
0
0
0
62
218
0
443
CEN FLYWAY
475,287
385,265 360,309 267,873
246,840
215,555
296,536
218,500
197,021
204,404
121,751
177,362
201,354
176,919
141,773
264,489
116,452
225,177
275,224
99,486
152,657
ATL FLYWAY
54,711
72,257 77,802 39,295
36,105
31,548
36,102
33,338
52,242
58,922
29,571
18,293
37,592
41,251
8,922
21,737
20,983
25,560
16,865
6,965
17,091
MISS FLYWAY
311,621
167,294 245,496 119,262
204,194
172,983
223,669
150,402
149,638
158,345
67,575
87,542
127,394
68,611
70,568
103,296
72,799
134,971
159,491
58,154
58,963
PAC 2
FLYWAY
79,931
45,289 59,405 62,775
59,511
51,680
71,805
78,107
96,521
102,887
63,568
81,909
80,030
86,287
64,387
95,149
79,447
88,492
144,365
112,522
110,342
U.S. TOTAL
921,549
670,105 743,012 489,205
546,650
471,766
628,112
480,346
495,422
524,558
282,465
365,106
446,370
373,068
285,650
484,671
289,681
474,200
595,945
277,127
339,053
CANADA TOTAL
215,266
245,123 262,054 211,299
268,814
197,371
187,008
266,543
187,212
327,142
179,335
197,346
253,699
210,411
259,874
316,751
165,506
149,397
193,518
126,814
U.S. + CANADA
1,136,815
915,228 1,005,066
700,504
815,464
669,137
815,120
746,889
682,634
851,700
461,800
562,452
700,069
583,479
693,218
801,422
455,187
623,597
789,463
403,941
AVERAGE: 1999-2019 7,857 13,703 162 4,646 2,949 32,136 4,990 19,068 143,928 96 229,535 35,102 138,679 81,639 484,955 221,024 720,659
% CHANGE FROM: Prev. Year 18% 21% Average -68% 14%
-50% 368% 35% -78%
-74% 20% -96% -2%
93% 89% 8% -4%
74% -46% 360%
53% -33%
145% -51%
1% -57%
-2% 35%
22% -30%
-100% -100%
-100% -100%
1 Preliminary 2 Pacific Flyway total includes Alaska 11/10/2020 3 Light Goose total does NOT include Conservation Order harvest
35

Central Flyway Databook 202012/22/2020
ESTIMATED HARVESTS OF WHITE-FRONTED GEESE (Harvest Information Survey)
YR CO KS
1999 0 5,476
2000 0 11,303 2001 227 4,721 2002 86 8,966
2003 1 1,158 9,735
2004 1 121 5,688
2005 1 0 970
2006 1 127 2,336
2007 1 142 13,788
2008 1 868 16,325 2009 1 0 12,267
2010 1 173 4,847 2011 1 164 19,877 2012 1 448 7,127 2013 1 559 15,927
2014 1 0 19,064
2015 1 0 15,817
2016 1 635 16,913
2017 1 492 4,752
2018 1 0 2,339
2019 1 0 5,194
MT
316
573 212 187
0
0
269
84
249
0
247
99
0
0
222
166
1,057
0
141
0
110
NE
223
549 629 663
2,205
1,543
1,998
888
1,142
479
434
0
1,791
526
664
0
322
903
911
855
668
NM
0
60 0
112
0
0
0
25
0
0
56
0
0
0
0
0
0
0
0
0
0
ND
899
2,481 1,854
264
435
1,914
183
1,172
528
1,524
1,932
5,157
2,188
3,765
1,585
1,407
3,248
1,440
2,920
3,078
4,344
OK
2,168
3,451 422
1,090
2,953
4,280
1,477
2,000
7,366
1,691
2,120
1,588
1,567
2,474
3,218
2,452
1,504
1,790
3,541
509
983
SD
983
2,166 1,150
830
1,607
1,545
946
309
1,076
326
1,237
615
671
4,363
1,422
653
701
2,772
4,085
3,341
2,378
TX
103,670
163,970 82,015 73,147
61,924
37,072
108,089
76,444
87,040
40,033
52,244
75,121
74,744
63,356
34,745
120,930
28,064
50,563
43,192
33,668
38,412
WY
0
0 0 0
0
0
0
0
0
0
0
0
0
0
0
0
0
62
0
0
0
CEN FLYWAY
113,735
184,553 91,230 85,345
80,017
52,163
113,932
83,385
111,331
61,246
70,537
87,600
101,002
82,059
58,342
144,672
50,713
75,078
60,034
43,790
52,089
ATL FLYWAY
0
0 0 0
0
0
87
0
0
0
2,510
0
788
0
124
94
0
0
726
37
152
MISS FLYWAY
108,649
103,913 110,802 107,151
110,611
86,266
92,956
142,493
176,444
138,097
71,451
105,249
70,836
83,245
122,469
110,410
108,720
196,416
181,084
110,739
153,583
PAC 2
FLYWAY
32,123
26,658 29,348 28,003
26,153
44,078
45,451
56,610
64,586
119,988
60,746
75,909
62,183
45,196
75,432
84,075
68,220
42,795
70,372
67,435
54,931
U.S. TOTAL
254,507
315,124 231,380 220,499
216,781
182,507
252,426
282,488
352,361
319,331
205,244
268,758
234,809
210,500
256,367
339,251
227,653
314,289
312,216
222,001
260,755
CANADA TOTAL
62,349
106,738 93,194 51,615
65,268
64,613
75,564
55,183
69,958
93,862
54,213
56,199
81,042
59,470
75,113
87,594
71,457
66,525
76,884
79,364
U.S. + CANADA
316,856
421,862 324,574 272,114
282,049
247,120
327,990
337,671
422,319
413,193
259,457
324,957
315,851
269,970
331,480
426,845
299,110
380,814
389,100
301,365
AVERAGE: 1999-2019 248 9,687 187 828 12 2,015 2,316 1,580 68,973 3 85,850 215 118,647 56,204 260,917 72,310 333,235
% CHANGE FROM: Prev. Year 122% Average -100% -46% -41%
-22% -19% -100%
41% 116%
93% -58%
-29% 51%
14% -44% -100%
19% -39%
311% -29%
39% 29%
-19% -2%
17% 0%
-100% -100%
-100% -100%
1 Preliminary File S:\CF_D\projects\Monitoring\harvest data\DATABOOK\HIP\gooseharvhip.xls 2 Pacific Flyway total includes Alaska
ESTIMATED REGULAR SEASON HARVESTS OF CANADA GEESE (Harvest Information Survey)
YR CO KS
1999 49,715 66,255
2000 86,921 98,005 2001 55,052 72,707 2002 62,101 80,982
2003 1 92,037 123,866
2004 1 60,401 80,118
2005 1 67,991 99,178
2006 1 64,235 59,566
2007 1 62,192 59,968
2008 1 85,716 87,067
2009 1 68,099 92,267
2010 1 49,062 66,494
2011 1 31,450 51,900
2012 1 83,356 72,204
2013 1 91,554 108,657
2014 1 101,543 166,812
2015 1 67,723 71,175
2016 1 93,085 96,863
2017 1 95,410 95,786
2018 1 68,618 50,579
2019 1 61,958 50,037
MT NE
19,028 64,775
34,764 113,441 19,221 83,833 30,314 56,322
37,264 104,141
27,277 62,272
17,887 97,578
25,399 56,688
23,876 61,794
16,154 83,358
25,925 76,421
18,162 103,477
21,785 68,644
46,313 97,777
28,436 111,033
46,516 113,903
40,469 89,315
24,509 115,248
36,339 138,904
37,632 99,129
46,372 104,059
NM ND
2,201 110,727
1,996 66,949 1,792 64,721 1,010 75,862
2,723 82,252
1,271 76,927
1,444 85,243
910 82,455
4,023 74,622
2,350 64,167
2,032 67,625
1,489 87,419
6,719 89,720
3,420 120,859
2,405 122,071
2,911 113,531
1,396 101,485
1,734 106,368
1,089 126,903
7,892 87,913
1,445 105,152
OK SD
35,773 109,271
47,966 90,803 13,458 126,736 26,606 91,574
35,398 109,067
41,230 74,363
27,345 57,822
41,736 97,985
47,496 60,042
31,887 68,441
26,848 62,445
20,442 53,527
26,329 53,423
40,580 76,360
75,625 78,947
49,281 51,592
34,599 44,392
41,181 54,376
54,889 63,545
35,890 40,835
58,493 41,216
TX
72,395
125,837 123,859 96,286
62,525
43,489
83,145
62,362
47,066
43,950
54,583
70,113
45,323
56,486
36,917
33,592
13,786
28,793
30,175
70,306
53,617
WY
9,194
25,499 13,486 15,471
23,083
20,421
18,217
21,163
11,834
22,529
17,052
20,434
14,571
28,198
26,665
15,791
15,086
24,401
34,851
19,135
18,908
CEN FLYWAY
539,335
692,179 574,866 536,530
672,355
487,770
555,852
512,500
452,913
505,618
493,297
490,619
409,864
625,552
682,310
695,472
479,426
586,558
677,891
517,929
541,257
ATL MISS FLYWAY FLYWAY
137,900 590,100
150,300 745,000 482,337 576,572 476,787 569,464
476,710 814,580
410,800 631,320
520,600 586,257
437,000 747,050
601,243 675,477
662,042 739,354
612,263 731,196
598,001 677,156
372,191 621,518
502,704 582,328
506,580 668,795
452,666 543,541
367,251 471,676
651,204 846,784
477,300 1,009,409
330,254 675,034
280,865 810,614
PAC 2
FLYWAY
314,554
338,847 267,207 243,793
321,130
298,764
314,006
305,365
287,861
316,303
297,884
274,598
279,651
304,148
253,604
286,154
247,582
250,559
267,034
297,374
269,259
U.S. TOTAL
1,581,889
1,926,326 1,900,982 1,826,575
2,284,776
1,828,654
1,976,714
2,001,915
2,017,493
2,223,317
2,134,639
2,040,374
1,683,224
2,014,732
2,111,290
1,977,833
1,565,935
2,335,105
2,431,634
1,820,591
1,901,995
CANADA TOTAL
565,242
612,056 637,016 645,664
671,654
626,801
712,042
678,011
703,857
735,005
711,213
691,162
730,316
740,882
726,082
757,547
776,462
764,088
834,299
721,308
U.S. + CANADA
2,147,131
2,538,382 2,537,998 2,472,239
2,956,430
2,455,455
2,688,756
2,679,926
2,721,350
2,958,322
2,845,852
2,731,536
2,413,540
2,755,614
2,837,372
2,735,380
2,342,397
3,099,193
3,265,933
2,541,899
AVERAGE: 1999-2019 71,344 83,357 29,697 90,577 2,488 91,094 38,717 71,751 59,743 19,809 558,576 452,714 681,582 287,413 1,980,285 702,035 2,686,235
% CHANGE FROM: Prev. Year -10% -1% Average -13% -40%
23% 5% 56% 15%
-82% 20% -42% 15%
63% 1% 51% -43%
-24% -10%
-1% -5%
5% -3%
-15% 20% -38% 19%
-9% -6%
4% -4%
-100% -100%
-100% -100%
1 Preliminary 2 Pacific Flyway total includes Alaska
ESTIMATED ALL-SEASON HARVESTS OF CANADA GEESE (Harvest Information Survey)
YR CO KS
1999 49,715 67,355
2000 86,921 98,905 2001 55,052 72,707 2002 62,101 80,982
2003 1 92,037 123,866
2004 1 60,401 80,218
2005 1 67,991 99,178
2006 1 64,235 59,566
2007 1 62,192 59,968
2008 1,3 85,716 87,067
2009 1,3 68,099 92,267
2010 1,4 49,062 66,494
2011 1,4 31,450 51,900
2012 1,4 83,356 72,204
2013 1,4 91,554 108,657
2014 1 101,543 166,812
2015 1 67,723 71,175
2016 1 93,085 96,863
2017 1 95,410 95,786
2018 1 68,618 50,579
2019 1 61,958 50,037
MT NE
19,028 64,775
34,764 113,441 19,221 83,833 30,314 56,322
37,264 104,141
27,277 62,672
17,887 100,078
25,399 56,988
23,876 63,794
16,154 85,274
25,925 79,026
18,162 107,108
21,785 68,644
46,313 97,777
28,436 111,033
46,516 113,903
40,469 89,315
24,509 115,248
36,339 138,904
37,632 99,129
46,372 104,059
NM ND
2,201 110,727
1,996 105,649 1,792 116,309 1,010 109,262
2,723 124,452
1,271 118,427
1,444 133,043
910 120,355
4,023 108,922
2,350 99,091
2,032 101,599
1,489 88,966
6,719 114,189
3,420 147,215
2,405 168,521
2,911 167,177
1,396 127,698
1,734 129,000
1,089 176,541
7,892 109,091
1,445 123,794
OK SD
35,773 146,071
49,566 123,303 16,048 163,926 27,906 131,274
36,698 154,867
41,630 96,663
29,545 78,822
42,436 129,985
48,696 87,342
35,027 94,513
28,084 98,716
21,831 77,830
27,113 93,210
40,827 100,670
75,625 135,490
49,281 77,062
39,613 64,719
45,060 70,156
56,660 85,181
35,890 61,810
58,493 54,214
TX
72,395
125,837 123,859 96,286
62,525
43,489
83,145
62,362
47,066
43,950
54,583
70,113
45,323
56,486
36,917
33,592
13,786
28,793
30,767
71,297
57,618
WY
9,194
25,499 13,486 15,471
23,083
20,421
18,217
21,163
11,834
22,529
17,052
20,434
14,571
28,198
26,665
15,791
15,086
24,401
34,851
19,135
18,908
CEN FLYWAY
577,235
765,879 666,234 610,930
761,655
552,470
629,352
583,400
517,713
571,671
567,383
521,489
474,904
676,466
785,303
774,588
530,980
628,849
751,528
561,071
576,898
ATL MISS FLYWAY FLYWAY
422,900 839,200
416,900 1,036,800 692,137 852,872 709,987 870,364
657,910 1,103,880
643,800 952,120
774,300 928,457
662,500 1,078,650
860,743 996,677
919,976 1,021,696
854,268 975,895
796,229 938,413
530,630 883,440
695,699 825,546
675,031 933,368
630,777 781,274
488,582 731,564
714,089 846,784
627,769 1,009,409
418,386 675,034
408,592 810,614
PAC 2
FLYWAY
338,654
358,547 267,207 243,793
332,130
305,464
323,406
321,165
301,061
331,497
308,125
279,138
296,080
312,343
262,363
292,695
258,053
265,098
277,223
311,228
274,392
U.S. TOTAL
2,177,989
2,578,126 2,478,450 2,435,075
2,855,576
2,453,854
2,655,514
2,645,715
2,676,193
2,844,840
2,705,671
2,535,269
2,185,054
2,510,054
2,656,065
2,479,334
2,009,179
2,454,820
2,665,929
1,965,719
2,070,496
CANADA TOTAL
565,242
612,056 637,016 645,664
671,654
626,801
712,042
678,011
703,857
735,005
711,213
691,162
730,316
740,882
726,082
757,547
776,462
764,088
834,299
721,308
U.S. + CANADA
2,743,231
3,190,182 3,115,466 3,080,739
3,527,230
3,080,655
3,367,556
3,323,726
3,380,050
3,579,845
3,416,884
3,226,431
2,915,370
3,250,936
3,382,147
3,236,881
2,785,641
3,218,908
3,500,228
2,687,027
AVERAGE: 1999-2019 71,344 83,457 29,697 91,213 2,488 123,811 40,086 101,230 60,009 19,809 623,143 647,676 909,146 298,079 2,478,044 702,035 3,200,457
% CHANGE FROM: Prev. Year -10% -1% Average -13% -40%
23% 5% 56% 14%
-82% 13% -42% 0%
63% -12% 46% -46%
-19% -4%
-1% -5%
3% -7%
-2% 20% -37% -11%
-12% -8%
5% -16%
-100% -100%
-100% -100%
1 Preliminary 2 Pacific Flyway total includes Alaska 3 ND total harvest includes harvest that occurred during the August Management Take season. 4 ND and SD total harvest includes harvest that occurred during the August Management Take season.
36
11/10/20

Central Flyway Databook 202012/22/2020
ESTIMATED TOTAL GOOSE HARVESTS (Harvest Information Survey)
YR CO KS
1999 65,204 85,700
2000 94,975 119,000 2001 65,350 87,499 2002 76,083 115,400
2003 1 114,998 159,700
2004 1 72,505 103,700
2005 1 80,322 108,300
2006 1 82,859 90,400
2007 1 74,431 84,699
2008 1 93,528 120,900
2009 1 77,076 115,201
2010 1 51,663 75,800
2011 1 40,459 91,653
2012 1 87,389 92,967
2013 1 97,148 151,837
2014 1 102,460 218,285
2015 1 68,911 108,920
2016 1 108,741 127,998
2017 1 118,689 114,793
2018 1 70,762 65,782
2019 1 64,495 70,813
MT NE
19,407 102,300
35,528 125,701 19,539 100,600 30,874 70,900
37,717 114,677
27,390 72,700
18,210 113,700
25,483 69,299
24,208 71,501
16,154 92,700
26,789 82,500
18,261 107,108
21,785 77,797
46,313 113,810
28,769 133,593
46,682 114,603
41,828 90,927
24,767 128,489
36,621 143,230
38,069 100,198
46,702 105,729
NM ND
7,043 174,000
7,803 139,700 19,708 162,184 8,866 130,200
6,585 149,799
4,661 138,201
5,167 153,302
3,912 153,700
6,517 138,100
2,721 133,460
2,878 136,699
1,986 130,224
8,528 147,610
5,261 184,865
2,405 199,593
8,297 190,101
2,284 162,378
2,099 179,612
1,132 219,553
8,356 138,519
1,565 159,630
OK SD
42,999 167,501
61,801 131,801 24,600 190,000 36,299 156,500
41,901 185,801
49,801 129,398
42,499 103,101
55,100 158,699
62,200 98,999
40,100 121,400
32,501 118,500
31,755 97,057
31,971 106,398
49,981 140,875
99,761 153,982
60,805 90,449
42,119 73,130
49,237 87,002
60,791 124,973
39,199 74,803
64,883 74,822
TX
553,099
639,100 489,300 393,354
299,399
248,100
457,300
298,400
361,056
272,400
196,499
252,073
236,157
208,387
148,754
340,395
92,562
196,634
231,935
149,526
173,654
WY
9,436
25,613 13,486 15,471
23,408
20,619
18,881
21,163
11,877
22,529
17,118
20,524
14,902
28,528
26,665
15,791 0
15,086 0
24,525 0
35,069 0
19,135 0
19,351 0
CEN FLYWAY
1,226,689
1,381,022 1,172,266 1,033,947
1,133,985
867,075
1,100,782
959,015
933,588
915,892
805,761
786,451
777,260
958,376
1,042,507
1,187,868
698,145
929,104
1,086,786
704,347
781,644
ATL MISS FLYWAY FLYWAY
495,912 1,275,870
513,974 1,385,591 789,170 1,292,293 782,786 1,186,643
737,340 1,528,350
682,330 1,235,600
841,105 1,275,300
714,287 1,444,901
935,285 1,330,901
1,006,048 1,342,900
922,200 1,163,401
832,595 1,131,204
580,417 1,081,670
764,500 1,020,719
705,637 1,195,450
660,316 995,224
515,631 913,083
739,649 1,178,171
645,360 1,349,984
425,388 843,927
425,835 1,023,160
PAC 2
FLYWAY
455,307
433,538 358,216 328,281
422,194
403,124
443,362
460,881
464,967
557,075
435,639
439,827
439,296
447,212
404,626
477,697
410,647
396,385
491,960
491,185
439,665
U.S. TOTAL
3,453,778
3,714,125 3,611,945 3,331,657
3,821,869
3,188,129
3,660,549
3,579,084
3,664,741
3,821,915
3,327,001
3,190,077
2,878,643
3,190,807
3,348,220
3,321,105
2,537,506
3,243,309
3,543,290
2,464,847
2,670,304
CANADA TOTAL
842,857
963,917 992,264 908,578
1,005,736
888,785
974,614
999,737
961,027
1,156,009
944,761
944,707
1,065,057
1,010,763
1,061,069
1,161,892
1,013,425
980,010
1,104,701
927,486
U.S. + CANADA
4,296,635
4,678,042 4,604,209 4,240,235
4,827,605
4,076,914
4,635,163
4,578,821
4,625,768
4,977,924
4,271,762
4,134,784
3,943,700
4,201,570
4,409,289
4,482,997
3,550,931
4,223,319
4,647,991
3,392,333
AVERAGES: 1999-2019 81,336 109,969 30,052 101,527 5,608 158,163 48,586 123,104 297,052 19,961 975,358 700,751 1,199,731 438,147 3,312,519 995,370 4,340,000
% CHANGE FROM: Prev. Year -9% 8% Average -21% -36%
23% 6% 55% 4%
-81% 15% -72% 1%
66% 0% 34% -39%
16% -42%
1% -3%
11% -20%
0% 21% -39% -15%
-10% 0%
8% -19%
-100% -100%
-100% -100%
1 Preliminary K.L. Kruse File S:\CF_D\projects\Monitoring\harvest data\DATABOOK\HIP\gooseharvhip.xls 2 Pacific Flyway total includes Alaska
37
11/10/20

ESTIMATED ALL-SEASON HARVESTS OF CFAN CANADA GEESE FOR CENTRAL FLYWAY (Harvest Information Survey)
CEN YR CO KS MT NE NM ND OK SD TX WY FLYWAY
1999 15,864 11,500 1,391 9,158 1,233 47,095 11,563 15,924 64,287 1,391 179,405 2000 19,603 19,153 1,910 14,272 484 31,232 12,862 6,832 99,144 2,732 208,224 2001 14,918 15,108 1,381 14,461 597 36,839 6,335 18,022 102,658 1,583 211,901 2002 14,839 15,329 2,239 5,964 224 18,738 9,266 16,928 76,133 1,521 161,180
2003 1 29,714 29,620 2,523 11,027 1,683 22,845 16,872 17,475 37,876 2,709 172,345 2004 1 19,972 11,668 1,754 9,642 170 21,262 19,842 7,587 27,804 1,388 121,089 2005 1 27,552 19,020 754 26,336 18,433 12,955 5,991 78,988 2,215 192,244 2006 1 19,131 12,380 1,003 7,615 74 15,761 17,774 10,806 39,563 1,287 125,394 2007 1 18,927 24,512 663 9,419 402 12,278 23,325 5,201 38,684 907 134,319 2008 1 12,586 32,650 554 10,300 186 12,889 8,938 5,214 25,238 2,453 111,008 2009 1 23,524 16,800 123 8,684 508 15,457 10,951 9,686 47,565 790 134,088 2010 1 22,364 12,213 197 14,523 110 17,535 4,962 4,307 58,428 2,509 137,149 2011 1 15,725 9,938 456 8,954 17,506 15,045 5,365 34,191 1,407 108,588 2012 1 31,370 25,411 348 12,616 526 20,331 20,537 8,415 45,036 6,843 171,435 2013 1 39,531 39,994 111 10,838 134 18,548 49,880 3,201 29,316 1,476 193,029 2014 1 40,113 65,295 0 21,729 582 25,420 31,628 2,449 20,155 902 208,273 2015 1 29,109 18,692 1,963 9,028 0 11,830 8,524 1,636 6,893 1,683 89,358 2016 1 27,079 15,760 903 11,735 183 15,842 21,486 2,132 9,129 2,409 106,658 2017 1 34,262 22,258 1,980 22,771 171 18,642 18,296 8,927 25,442 4,909 157,658 2018 1 32,555 15,641 2,297 14,528 2,321 10,343 15,272 1,299 57,433 1,990 153,679 2019 1 27,321 17,314 2,088 12,527 0 7,963 22,611 1,585 36,811 2,659 130,879
1 Preliminary
ESTIMATED ALL-SEASON HARVESTS OF LARGE CANADA GEESE FOR CENTRAL FLYWAY (Harvest Information Survey)
CEN YR CO KS MT NE NM ND OK SD TX WY FLYWAY
1999 32,103 52,570 15,109 54,500 968 57,700 22,765 128,967 2,896 7,440 375,018 2000 63,823 71,902 31,708 94,961 1,452 69,342 34,508 113,138 9,152 21,401 511,387 2001 29,836 52,248 15,717 65,180 1,194 69,855 8,657 141,110 9,485 11,147 404,430 2002 32,251 56,109 22,386 41,165 673 83,486 11,337 107,376 4,478 11,835 371,097
2003 1 53,447 88,653 29,953 82,333 792 92,034 11,248 129,960 19,840 16,906 525,166 2004 1 36,918 64,904 19,807 44,546 1,102 83,877 11,088 83,878 5,703 18,637 370,460 2005 1 38,884 75,111 8,351 70,835 1,444 92,345 11,705 68,260 3,118 16,003 386,056 2006 1 22,425 41,813 10,611 43,915 369 85,707 15,552 106,366 4,694 13,637 345,090 2007 1 36,858 30,422 6,715 50,091 1,689 83,965 22,507 76,399 3,224 9,500 321,369 2008 1 27,993 36,672 4,431 63,477 557 68,047 20,775 74,958 6,092 14,460 317,462 2009 1 43,025 73,332 2,839 64,697 1,524 69,234 15,014 78,929 5,458 12,310 366,361 2010 1 20,457 47,884 2,073 78,969 1,324 33,523 12,503 68,755 8,347 16,222 290,057 2011 1 13,268 34,784 2,053 55,910 4,652 71,219 11,754 79,798 10,337 11,342 295,117 2012 1 49,744 42,765 1,219 75,699 2,893 104,293 17,320 87,580 10,687 20,942 413,142 2013 1 43,446 67,601 1,000 90,463 2,204 139,827 20,918 130,155 2,172 19,288 517,073 2014 1 50,428 85,789 332 88,669 2,183 126,942 12,749 66,287 13,437 14,167 460,983 2015 1 27,030 44,215 38,053 76,417 1,015 105,429 22,063 56,074 6,893 13,029 390,218 2016 1 39,350 66,113 21,671 94,485 1,369 100,608 19,098 61,413 6,320 19,953 430,380 2017 1 32,623 54,270 30,400 108,619 897 141,502 26,559 70,656 3,550 27,161 496,237 2018 1 34,699 34,060 35,225 83,106 5,571 98,009 18,072 59,953 10,893 16,964 396,552 2019 1 34,488 32,031 43,954 91,031 1,445 114,382 33,916 46,447 19,206 15,954 432,854
1 Preliminary
ESTIMATED ALL-SEASON HARVESTS OF UNKNOWN CANADA GEESE FOR CENTRAL FLYWAY (Harvest Information Survey
CEN YR CO KS MT NE NM ND OK SD TX WY FLYWAY
1999 1,749 3,286 2,529 1,117 5,932 1,445 1,180 5,212 363 22,812
Central Flyway Databook 202012/22/2020
2000 3,495 7,850 1,146 4,208 60 5,074 2,196 3,333 17,541 1,366 46,269 2001 10,299 5,351 2,124 4,192 9,615 1,056 4,793 11,716 757 49,902 2002 15,011 9,544 5,690 9,194 112 7,038 7,304 6,970 15,674 2,116 78,653
2003 1 8,876 5,593 4,787 10,782 248 9,573 8,577 7,432 4,810 3,468 64,144 2004 1 3,510 3,646 5,716 8,485 13,289 10,699 5,198 9,981 397 60,921 2005 1 1,555 5,046 8,782 2,906 22,265 4,886 4,572 1,039 51,052 2006 1 22,679 5,373 13,785 5,458 468 18,887 9,109 12,813 18,105 6,240 112,916 2007 1 6,404 5,034 16,497 4,281 1,931 12,674 2,864 5,739 5,158 1,425 62,007 2008 1 45,136 17,745 11,169 11,498 1,608 18,155 5,314 14,340 12,619 5,616 143,201 2009 1 1,548 2,133 22,962 5,645 16,746 2,120 10,098 1,560 3,950 66,760 2010 1 6,241 6,397 15,892 13,615 55 37,907 4,366 4,768 3,339 1,703 94,284 2011 1 2,457 7,178 19,276 3,780 2,067 25,464 313 8,047 795 1,821 71,199 2012 1 2,241 4,029 44,746 9,462 22,591 2,969 4,675 763 412 91,888 2013 1 8,577 1,062 27,326 9,732 67 10,146 4,827 2,134 5,429 5,902 75,202 2014 1 11,002 15,728 46,183 3,505 146 14,815 4,904 8,327 0 722 105,331 2015 1 11,584 8,268 453 3,869 381 10,438 9,026 7,009 0 374 51,402 2016 1 26,656 14,991 1,935 9,027 183 12,550 4,476 6,610 13,343 2,039 91,810 2017 1 28,525 19,257 3,959 7,515 21 16,396 11,804 5,598 1,775 2,782 97,632 2018 1 1,365 877 109 1,495 0 739 2,545 557 2,971 181 10,839 2019 1 149 693 330 501 0 1,448 1,966 6,182 1,600 295 13,164
1 Preliminary 38

Central Flyway Databook 202012/22/2020
GOOSE AGE RATIOSIN THE U.S. HARVEST
39

Central Flyway Databook 202012/22/2020
YEAR YEAR CEN ATL MISS PAC
FLYWAY FLYWAY FLYWAY FLYWAY CEN ATL MISS PAC
FLYWAY FLYWAY FLYWAY FLYWAY
YEAR YEAR CEN ATL MISS PAC
FLYWAY FLYWAY FLYWAY FLYWAY CEN ATL MISS PAC
FLYWAY FLYWAY FLYWAY FLYWAY
CANADA GOOSE AGE RATIOS (IMM/ADULT) SNOW GOOSE (LESSER & GREATER) AGE RATIOS (IMM/ADULT) IN THE ENTIRE SEASON HARVEST IN THE ENTIRE SEASON HARVEST
Derived from the Parts Collection Survey Derived from the Parts Collection Survey
U.S. U.S.
1999 0.55 0.60 0.54 0.67 0.59 1999 1 0.47 0.02 0.57 0.69 0.48
2000 0.53 0.41 0.50 0.60 0.49 2000 1 0.34 1.77 0.41 0.39 0.44 2001 0.58 0.48 0.59 0.56 0.53 2001 0.53 1.48 0.72 0.31 0.66 2002 0.45 0.40 0.61 0.51 0.50 2002 0.32 0.27 0.27 0.42 0.31
2003 1 0.53 0.56 0.55 0.71 0.56 2003 1 0.46 1.14 0.78 0.87 0.66 2004 1 0.40 0.46 0.38 0.61 0.43 2004 1 0.19 1.02 0.22 0.51 0.26 2005 1 0.54 0.62 0.52 0.47 0.54 2005 1 0.45 0.73 0.42 1.39 0.64 2006 1 0.47 0.53 0.54 0.45 0.51 2006 1 0.50 0.54 0.70 0.70 0.60 2007 1 0.40 0.40 0.50 0.44 0.44 2007 1 0.24 0.56 0.34 0.64 0.45 2008 1 0.51 0.59 0.51 0.38 0.52 2008 1 0.56 1.48 0.27 0.18 0.62 2009 1 0.57 0.37 0.47 0.50 0.46 2009 1 0.16 0.26 0.29 0.67 0.35
2010 1 0.60 0.63 0.55 0.45 0.57 2010 1 0.46 0.45 0.40 0.59 0.48 2011 1 0.64 0.34 0.52 0.50 0.49 2011 1 0.41 0.77 0.63 0.85 0.67 2012 1 0.55 0.46 0.40 0.45 0.46 2012 1 0.39 0.42 0.27 0.73 0.45 2013 1 0.36 0.47 0.39 0.60 0.42 2013 1 0.28 0.53 0.85 0.36 0.51 2014 1 0.47 0.36 0.37 0.59 0.42 2014 1 0.50 1.03 0.43 0.50 0.62 2015 1 0.38 0.41 0.47 0.47 0.43 2015 1 0.29 0.79 0.27 0.78 0.51 2016 1 0.44 0.44 0.42 0.71 0.46 2016 1 0.57 0.55 0.38 0.76 0.58 2017 1 0.49 0.50 0.41 0.51 0.46 2017 1 0.61 1.42 0.90 0.81 0.77 2018 1 0.28 0.24 0.32 0.39 0.30 2018 1 0.07 0.05 0.19 0.39 0.26 2019 1 0.35 0.41 0.36 0.35 0.37 2019 1 0.48 0.59 0.36 0.89 0.70
¹Preliminary 10-Nov-20 ¹Preliminary 10-Nov-20
WHITE-FRONTED GOOSE AGE RATIOS (IMM/ADULT) ROSS'S GOOSE AGE RATIOS (IMM/ADULT) IN THE ENTIRE SEASON HARVEST IN THE ENTIRE SEASON HARVEST
Derived from the Parts Collection Survey Derived from the Parts Collection Survey
U.S. U.S.
1999 0.74 0.86 1.57 0.85 1999 2.64 1.04 2.23
2000 0.57 0.44 0.80 0.54 2000 1.08 0.50 0.98 2001 0.46 0.66 0.68 0.58 2001 1.96 0.72 1.92 2002 0.50 0.49 0.32 0.47 2002 0.98 0.69 0.95
2003 1 1.27 0.82 0.53 0.92 2003 1 2.22 1.25 1.93
2004 1 0.65 0.44 0.72 0.55 2004 1 0.34 0.24 0.35
2005 1 0.81 0.58 1.16 0.77 2005 1 1.55 0.91 1.60
2006 1 1.16 0.91 0.86 0.97 2006 1 1.37 0.90 1.79
2007 1 0.70 0.31 0.68 0.48 2007 1 0.91 0.22 0.64
2008 1 0.50 0.35 0.72 0.50 2008 1 1.57 2.07 0.39 1.26
2009 1 0.61 0.49 1.42 0.72 2009 1 0.70 0.10 0.54
2010 1 0.70 0.46 0.94 0.66 2010 1 0.93 0.19 0.60
2011 1 0.87 1.06 0.71 0.87 2011 1 1.22 0.31 0.74
2012 1 0.70 0.35 0.77 0.56 2012 1 0.89 0.15 0.56
2013 1 0.76 0.48 0.43 0.53 2013 1 1.06 0.36 0.79
2014 1 0.67 0.52 0.52 0.58 2014 1 0.85 0.32 0.86
2015 1 0.69 0.78 1.05 0.83 2015 1 0.61 0.69 0.68
2016 1 0.39 0.71 0.75 0.62 2016 1 1.07 0.88 0.77 0.96
2017 1 0.56 0.64 0.29 0.53 2017 1 0.79 1.48 0.86 0.96
2018 1 0.29 0.24 0.44 0.31 2018 1 0.11 0.29 0.16
2019 1 0.56 0.63 0.55 0.60 2019 1 0.97 1.25 0.71 0.92
¹Preliminary 10-Nov-20 ¹Preliminary *Years without an age ratio estimate had <50 tails in the sample *Years without an age ratio estimate had <50 tails in the sample
FILE S:\mbmo\cf_d\projects\Monitoring\Harvest data\databook\HIP\geeseageHIP.xls
40

Central Flyway Databook 2020
WEBLESS GAME BIRD
HARVESTS,
HUNTER ACTIVITY
AND
SUCCESS
IN THE
UNITED STATES
12/22/2020 41

Central Flyway Databook 202012/22/2020
ESTIMATED CMU MOURNING DOVE HARVEST (Harvest Information Program
YR AR CO IA2 KS MN MO MT NE NM ND OK SD TX WY CMU EMU WMU U.S.
2003 1 595,600 262,000 853,600 - 732,900 19,100 354,900 154,400 77,800 515,600 199,900 3,909,000 39,600 7,714,400 8,078,500 2,420,100 18,213,200 2004 1 740,600 299,900 689,400 107,000 775,900 20,900 365,900 302,800 57,500 555,300 184,100 5,664,600 43,700 9,807,600 7,712,000 2,470,600 19,990,200 2005 1 861,621 263,359 680,370 48,822 641,795 17,792 371,075 250,090 55,473 828,528 127,700 5,710,707 34,074 9,891,405 9,793,000 2,465,486 22,149,889 2006 1 621,500 270,300 711,800 50,000 709,500 14,800 249,700 226,900 56,400 704,400 103,300 5,138,700 29,500 8,886,800 8,155,400 2,202,900 19,272,400 2007 1 791,700 315,000 725,100 67,400 603,300 20,900 319,600 198,700 48,700 480,000 104,000 5,463,300 42,600 9,180,300 8,908,400 2,461,500 20,550,000 2008 1 422,041 288,438 443,742 83,454 467,833 18,381 238,647 138,069 26,386 361,204 152,099 4,849,583 30,080 7,519,957 7,671,758 2,210,705 17,402,421 2009 1 353,534 242,354 572,613 61,491 294,712 12,709 277,563 170,246 39,970 378,417 105,368 4,945,108 20,560 7,474,642 7,639,194 2,241,012 17,354,848
2010 1 446,350 171,979 511,197 98,943 426,005 17,421 276,411 128,022 54,166 268,700 64,330 4,699,316 32,099 7,194,939 7,473,535 2,561,966 17,230,440 2011 1 519,314 178,713 56,778 534,804 57,348 359,582 14,444 265,498 76,850 41,762 379,365 87,210 5,061,083 24,965 7,657,716 6,666,900 2,256,289 16,580,904 2012 1 494,190 204,327 - 244,779 65,442 296,600 2,622 223,413 160,144 78,875 349,693 65,495 4,150,771 25,253 6,361,603 6,279,871 1,849,379 14,490,853 2013 1 155,860 176,894 214,313 504,393 53,519 587,568 11,980 239,845 123,027 88,156 421,170 118,304 3,506,735 34,204 6,235,968 6,350,562 1,943,271 14,529,801 2014 1 347,942 173,116 129,961 485,304 54,805 374,154 8,518 172,897 115,164 47,639 417,925 106,758 5,199,449 21,058 7,654,691 4,889,812 1,264,964 13,809,468 2015 1 252,414 204,471 111,462 558,176 96,710 307,390 18,039 160,621 111,881 73,527 293,998 84,506 4,892,144 14,914 7,180,254 4,644,890 1,332,165 13,157,309 2016 1 258,221 141,248 128,109 427,608 96,718 321,634 16,040 131,979 47,877 76,924 400,365 112,415 5,155,315 20,114 7,334,567 4,606,029 1,561,436 13,502,032 2017 1 287,122 117,645 134,876 290,649 39,133 367,227 8,890 177,912 73,893 59,443 315,569 111,605 3,469,459 9,392 5,462,816 4,783,344 1,314,973 11,561,133 2018 1 170,574 121,489 107,842 337,648 55,273 309,406 9,831 189,087 126,909 65,247 181,323 69,398 2,990,357 14,764 4,749,149 4,167,631 1,457,697 10,374,478 2019 1 328,117 106,269 29,907 389,772 40,158 268,023 16,564 137,686 125,404 75,034 247,914 103,331 3,385,042 13,198 5,266,419 3,656,849 1,060,225 9,983,494
1 Preliminary 2 No estimates available for 2012.
ESTIMATES OF TOTAL CMU MOURNING DOVE HUNTER DAYS AFIELD BY STATE OF HARVEST (Harvest Information Program
2003 1 89,000 51,200 135,100 - 124,800 4,900 62,900 32,900 17,300 73,800 40,400 802,800 7,400 1,442,500 1,456,900 459,700 3,359,100 2004 1 114,000 54,800 119,300 61,100 128,800 11,300 71,400 42,000 13,000 94,000 36,700 1,089,200 8,700 1,844,300 1,373,400 476,200 3,693,800 2005 1 147,258 48,729 109,500 14,721 113,362 4,822 64,319 41,974 11,808 111,498 25,206 1,029,986 6,626 1,729,809 1,669,760 446,158 3,845,727 2006 1 77,500 45,700 116,400 24,200 129,800 3,900 43,000 33,900 10,800 108,300 24,700 986,200 6,500 1,610,900 1,336,000 458,800 3,405,800 2007 1 115,900 57,800 119,100 27,600 124,400 4,000 55,300 40,100 9,900 73,100 18,200 1,149,600 8,800 1,803,800 1,481,697 487,200 3,772,697 2008 1 76,601 60,422 78,530 34,873 93,370 3,670 48,787 26,224 9,184 57,753 27,468 974,121 5,931 1,496,935 1,269,462 426,220 3,192,617 2009 1 53,815 45,407 96,958 24,071 58,681 6,410 51,760 35,652 10,826 55,519 21,671 846,164 5,782 1,312,715 1,245,684 429,042 2,987,441
2010 1 63,302 38,375 93,894 55,334 75,178 4,662 49,692 20,992 11,830 51,337 14,150 876,512 7,067 1,362,326 1,167,111 494,752 3,024,189 2011 1 63,784 44,495 19,043 95,802 25,076 74,580 5,863 46,905 24,609 10,370 54,206 16,341 958,563 5,135 1,444,771 1,095,217 465,663 3,005,651 2012 1 57,614 43,751 - 49,077 21,616 51,415 495 39,031 37,959 17,363 49,166 14,687 720,168 6,332 1,108,672 1,015,640 413,674 2,537,986 2013 1 30,134 36,949 49,372 93,040 16,959 104,521 2,867 39,297 23,710 16,445 69,365 17,508 677,911 7,232 1,185,311 987,860 399,763 2,572,934 2014 1 47,940 27,812 27,133 70,747 20,160 62,196 2,860 26,708 24,084 11,883 56,873 17,483 934,258 3,450 1,333,587 791,292 261,799 2,386,678 2015 1 37,556 38,937 24,598 86,361 28,193 54,320 5,076 25,540 23,075 12,801 45,304 16,009 833,971 3,289 1,235,030 780,445 226,458 2,241,933 2016 1 36,233 29,719 25,271 77,169 18,028 65,140 3,462 24,534 12,823 15,825 58,509 17,146 956,788 3,733 1,344,379 789,569 295,873 2,429,820 2017 1 35,537 24,093 28,331 58,299 16,227 65,740 2,181 30,952 16,519 11,435 45,608 18,445 703,284 2,180 1,058,833 758,454 235,078 2,052,364 2018 1 24,515 20,247 23,516 44,273 16,889 48,276 3,501 33,725 28,222 11,815 29,216 11,529 553,168 3,192 852,084 634,838 259,770 1,746,691 2019 1 37,521 22,768 11,029 64,819 9,404 47,079 3,639 24,511 28,814 11,949 37,981 15,495 668,988 2,775 986,771 643,488 207,186 1,837,446
YR AR CO IA2 KS MN MO MT NE NM ND OK SD TX WY CMU EMU WMU U.S.
1 Preliminary 2 No estimates available for 2012.
ESTIMATES OF ACTIVE NUMBERS OF CMU MOURNING DOVE HUNTERS BY STATE OF HARVEST IN THE CENTRAL MANAGEMENT UNIT (Harvest Information Program
YR AR CO IA2 KS MN MO MT NE NM ND OK SD TX WY
2003 1 32,800 19,100 38,100 - 40,600 1,600 19,000 7,100 5,700 20,100 10,900 217,700 3,000 2004 1 37,900 19,400 35,800 13,700 41,600 2,600 19,100 9,900 4,500 27,100 10,000 287,700 3,200 2005 1 43,429 18,392 32,386 5,963 40,234 2,043 17,847 9,349 3,065 34,464 7,132 257,180 2,497 2006 1 31,300 19,800 35,400 8,000 44,700 1,800 15,000 7,100 4,000 36,100 8,100 258,900 2,300 2007 1 37,000 21,800 36,300 7,700 42,600 1,700 17,000 8,600 3,200 24,600 6,000 275,200 4,000 2008 1 23,320 23,201 26,756 11,326 34,271 2,078 13,572 6,286 2,741 19,327 7,262 271,268 2,519 2009 1 22,420 20,305 29,379 6,768 21,483 2,506 15,987 7,772 2,795 18,564 6,511 236,576 2,336
2010 1 23,907 15,876 28,207 9,970 29,282 1,633 15,758 5,851 3,834 19,500 4,976 244,595 2,671 2011 1 25,331 15,306 5,843 32,798 9,384 31,637 2,162 15,496 6,712 3,738 17,149 6,236 253,241 2,671 2012 1 21,418 16,997 - 12,163 6,764 23,836 198 13,198 9,020 4,941 15,669 4,546 207,185 2,727 2013 1 8,928 15,618 12,937 31,936 7,685 36,372 1,686 13,544 6,511 6,270 23,296 6,238 178,855 3,134 2014 1 19,875 14,396 9,156 26,247 6,873 24,090 1,413 9,744 7,613 3,907 19,104 6,378 276,800 1,545 2015 1 17,830 14,204 9,204 28,624 9,697 22,520 1,636 8,979 7,008 4,246 18,215 5,293 220,662 1,673 2016 1 16,260 13,055 9,725 28,625 6,457 25,208 1,860 9,659 4,444 5,322 23,771 5,582 278,678 1,743 2017 1 16,240 11,287 11,212 21,816 6,830 27,356 1,254 12,291 5,489 4,056 17,474 5,709 190,469 717 2018 1 12,378 9,998 8,968 22,877 7,084 25,968 1,233 11,625 9,891 3,905 13,554 4,940 199,108 1,371 2019 1 14,236 10,675 3,634 22,316 3,851 21,125 1,636 10,734 8,349 4,057 14,809 4,691 216,295 1,257
1 Preliminary 2 No estimates available for 2012.
AVERAGE SEASONAL CMU MOURNING DOVE BAG PER HUNTER BY STATE OF HARVEST IN THE CENTRAL MANAGEMENT UNIT (Harvest Information Program
YR AR CO IA2 KS MN MO MT NE NM ND OK SD TX WY
2003 1 18.2 13.7 22.4 18.1 11.7 18.7 21.9 13.6 25.7 18.3 18.0 13.1 2004 1 19.5 15.4 19.3 7.8 18.6 7.9 19.2 30.7 12.9 20.5 18.4 19.7 13.7 2005 1 19.8 14.3 21.0 8.2 16.0 8.7 20.8 26.7 18.1 24.0 17.9 22.2 13.6 2006 1 19.8 13.6 20.1 6.3 15.9 8.5 16.7 31.8 14.3 19.5 16.2 19.8 12.9 2007 1 21.4 14.5 20 8.7 14.2 12.3 18.8 23.1 15.4 19.5 17.2 19.9 10.6 2008 1 18.1 12.4 16.6 7.4 13.7 8.8 17.6 22.0 9.6 18.7 20.9 17.9 11.9 2009 1 15.8 11.9 19.5 9.1 13.7 5.1 17.4 21.9 14.3 20.4 16.2 20.9 8.8
2010 1 18.7 10.8 18.1 9.9 14.5 10.7 17.5 21.9 14.1 13.8 12.9 19.2 12.0 2011 1 20.5 11.7 9.7 16.3 6.1 11.4 6.7 17.1 11.4 11.2 22.1 14.0 20.0 9.3 2012 1 23.1 12.0 - 20.1 9.7 12.4 13.3 16.9 17.8 16.0 22.3 14.4 20.0 9.3 2013 1 17.5 11.3 16.6 15.8 7.0 16.2 7.1 17.7 18.9 14.1 18.1 19.0 19.6 10.9 2014 1 17.5 12.0 14.2 18.5 8.0 15.5 6.0 17.7 15.1 12.2 21.9 16.7 18.8 13.6 2015 1 14.2 14.4 12.1 19.5 10.0 13.6 11.0 17.9 16.0 17.3 16.1 16.0 22.2 8.9 2016 1 15.9 10.8 13.2 14.9 15.0 12.8 8.6 13.7 10.8 14.5 16.8 20.1 18.5 11.5 2017 1 17.7 10.4 12.0 13.3 5.7 13.4 7.1 14.5 13.5 14.7 18.1 19.6 18.2 13.1 2018 1 13.8 12.2 12.0 14.8 7.8 11.9 8.0 16.3 12.8 16.7 13.4 14.1 15.0 10.8 2019 1 23.0 10.0 8.2 17.5 10.4 12.7 10.1 12.8 15.0 18.5 16.7 22.0 15.7 10.5
1 Preliminary 2 No estimates available for 2012.
FILE: S:\CF_D\projects\Monitoring\harvestdata\DATABOOK\HIP\weblessHIP.XLS 11/10/20
42

Central Flyway Databook 202012/22/2020
ESTIMATED CENTRAL UNIT WHITE-WINGED DOVE HARVEST (Harvest Information Program)
YR CO KS NM OK TX CU EU WU U.S.
2003 1 0 954 40,353 4,652 778,155 824,115 12,867 159,887 996,869 2004 1 0 769 46,536 3,527 1,066,300 1,117,132 4,653 171,421 1,293,207 2005 1 2,873 1,689 52,094 7,993 1,095,132 1,159,780 12,385 174,014 1,346,179 2006 1 906 2,092 66,105 5,514 974,501 1,049,117 46,054 164,300 1,259,471 2007 1 3,293 8,778 64,014 17,081 1,522,099 1,615,265 53,180 196,326 1,864,771 2008 1 4,813 1,324 49,070 5,241 1,314,921 1,375,368 58,411 179,894 1,613,673 2009 1 4,809 4,137 64,527 5,518 1,243,489 1,322,480 85,705 192,735 1,600,920
2010 1 4,877 2,229 29,475 4,610 1,436,829 1,478,019 22,051 165,176 1,665,245 2011 1 4,109 5,780 34,758 4,261 1,551,987 1,600,896 46,500 198,333 1,845,729 2012 1 8,511 0 79,530 3,579 1,414,818 1,506,439 26,032 128,942 1,661,412 2013 1 2,268 2,572 33,823 5,341 1,299,710 1,343,714 30,648 152,180 1,526,541 2014 1 1,470 2,274 60,856 7,199 1,767,860 1,839,659 28,180 138,725 2,006,565 2015 1 955 301 62,316 5,888 1,963,071 2,032,531 9,544 120,001 2,162,076 2016 1 2,326 280 35,573 10,701 1,469,670 1,518,551 16,875 131,704 1,667,130 2017 1 1,755 289 22,360 13,293 1,252,803 1,290,451 25,171 109,412 1,425,035 2018 1 2,924 410 44,943 7,837 1,481,229 1,537,343 23,393 110,752 1,671,488 2019 1 1,004 1,873 44,972 5,675 1,574,562 1,628,087 27,580 92,380 1,748,047
1 Preliminary
ESTIMATES OF TOTAL CENTRAL UNIT WHITE-WINGED DOVE HUNTER DAYS AFIELD BY STATE OF HARVEST (Harvest Information Program)
YR CO KS NM OK TX CU EU WU U.S.
2003 1 - 1,823 15,018 1,034 357,028 374,903 15,497 101,501 491,901 2004 1 - 915 13,401 3,394 383,283 400,993 5,857 112,463 519,313 2005 1 3,079 1,419 20,998 5,830 432,998 464,324 9,471 94,405 568,200 2006 1 2,451 4,266 17,464 8,719 459,378 492,278 26,897 89,739 608,914 2007 1 19,712 6,170 26,351 11,232 519,507 582,972 39,189 102,147 724,308 2008 1 9,137 3,376 13,740 8,487 468,181 502,921 31,228 124,451 658,600 2009 1 6,588 3,885 20,388 4,756 425,005 460,622 38,983 105,780 605,385
2010 1 4,331 4,489 10,388 8,426 470,352 497,986 20,680 117,099 635,765 2011 1 3,701 4,444 16,839 6,776 458,529 490,289 31,459 98,949 620,697 2012 1 5,602 - 24,400 3,594 423,317 456,913 31,694 81,296 569,903 2013 1 2,789 4,277 13,089 11,385 359,966 391,506 27,038 95,867 514,411 2014 1 4,244 4,920 15,555 9,915 472,834 507,467 30,406 30,406 611,851 2015 1 3,635 5,805 13,182 5,523 511,578 539,723 16,871 59,615 616,209 2016 1 1,291 421 9,848 5,748 522,096 539,405 12,768 72,944 625,117 2017 1 3,504 2,115 7,949 9,274 407,384 430,226 25,438 63,823 519,487 2018 1 2,543 205 18,271 2,409 374,924 398,352 14,094 56,552 468,997 2019 1 2,475 3,709 13,850 7,919 426,523 454,475 14,805 45,782 515,062
1 Preliminary
ESTIMATES OF ACTIVE NUMBERS OF CENTRAL UNIT WHITE-WINGED DOVE HUNTERS BY STATE OF HARVEST IN THE CENTRAL MANAGEMENT UNIT (Harvest Information Program)
YR CO KS NM OK TX
2003 1 0 399 3,299 258 77,211 2004 1 0 366 3,383 710 106,369 2005 1 961 335 4,002 2,219 109,257 2006 1 1,135 562 3,639 1,895 105,319 2007 1 2,332 1,789 5,038 2,894 133,209 2008 1 3,286 1,306 3,174 2,104 134,888 2009 1 2,493 1,804 3,662 1,768 108,579
2010 1 1,998 1,124 3,011 2,526 129,213 2011 1 1,343 1,547 4,555 1,801 119,769 2012 1 2,363 4,803 870 108,125 2013 1 1,744 1,625 3,123 3,924 93,848 2014 1 1,861 1,304 4,264 1,851 130,377 2015 1 1,402 1,519 3,486 2,155 133,697 2016 1 415 140 2,748 2,496 137,537 2017 1 2,097 1,397 3,100 2,627 118,295 2018 1 772 189 6,209 1,247 130,514 2019 1 888 1,224 4,653 1,776 125,880
1 Preliminary
AVERAGE SEASONAL CENTRAL UNIT WHITE-WINGED DOVE BAG PER HUNTER BY STATE OF HARVEST IN
YR
2003 1
2004 1
2005 1
2006 1
2007 1
2008 1
2009 1
2010 1
2011 1
2012 1
2013 1
2014 1
2015 1
2016 1
2017 1
2018 1
2019 1
1 Preliminary
THE CENTRAL MANAGEMENT UNIT (Harvest Information Program)
CO KS NM OK TX
0.0 2.4 12.2 18.0 10.1 0.0 2.1 13.8 5.0 10.0 3.0 5.0 13.0 3.6 10.0 0.8 3.7 18.2 2.9 9.3 1.4 4.9 12.7 5.9 11.4 1.5 1.0 15.5 2.5 9.7 1.9 2.3 17.6 3.1 11.5
2.4 2.0 9.8 1.8 11.1 3.1 3.7 7.6 2.4 13.0 3.6 16.6 4.1 13.1 1.3 1.6 10.8 1.4 13.8 0.8 1.7 14.3 3.9 13.6 0.7 0.2 17.9 2.7 14.7 5.6 2.0 12.9 4.3 10.7 0.8 0.2 7.2 5.1 10.6 3.8 2.2 7.2 6.3 11.4 1.1 1.5 9.7 3.2 12.5
43

Central Flyway Databook 202012/22/2020
ESTIMATED FOUR CORNERS BAND-TAILED PIGEON HARVEST (Harvest Information Program)
YR Four Pacific
AZ CO NM UT U.S.Corners Coast
2003 1 1,400 900 400 100 2,800 14,400 17,200 2004 1 1,400 500 700 200 2,800 17,900 20,700 2005 1 2,200 100 300 100 2,700 13,500 16,200 2006 1 500 600 100 400 1,600 14,900 16,500 2007 1 1,000 900 2,800 200 4,900 12,700 17,600 2008 1 1,614 2,523 582 0 4,719 30,151 34,870 2009 1 2,339 1,396 1,270 0 5,005 22,638 27,643
2010 1 671 1,457 2,661 223 5,012 18,384 23,396 2011 1 952 298 466 93 1,809 11,933 13,742 2012 1 1,325 1,091 332 98 2,846 10,851 13,697 2013 1 879 40 190 509 1,618 6,808 8,327 2014 1 736 424 207 142 1,509 12,033 13,543 2015 1 464 171 100 17 752 7,347 8,098 2016 1 479 213 177 239 1,108 5,865 6,972 2017 1 82 30 163 0 276 6,033 6,308 2018 1 128 N/A 58 11 197 11,631 11,828 2019 1 487 16 52 43 599 9,685 10,284 1 Preliminary
ESTIMATES OF TOTAL FOUR CORNERS BAND-TAILED PIGEON HUNTER DAYS AFIELD BY STATE OF HARVEST (Harvest Information Program)
AZ CO NM UT Four
Corners Pacific Coast
U.S.
2003 1 3,700 2,100 1,400 600 7,800 18,200 26,000 2004 1 2,300 700 300 100 3,400 13,900 17,300 2005 1 1,600 300 400 200 2,500 11,000 13,500 2006 1 1,100 1,700 300 200 3,300 15,400 18,700 2007 1 5,000 3,800 3,600 400 12,800 13,500 26,300 2008 1 3,316 6,080 2,140 677 12,213 31,284 43,498 2009 1 4,146 6,127 2,343 593 13,209 24,384 37,593
2010 1 5,819 3,895 3,195 670 13,578 13,679 27,257 2011 1 944 652 851 340 2,787 12,769 15,556 2012 1 4,765 1,292 540 196 6,794 9,795 16,589 2013 1 840 539 376 254 2,009 6,201 8,209 2014 1 1,915 778 274 355 3,322 8,779 12,100 2015 1 1,727 628 493 133 2,981 6,187 9,168 2016 1 421 136 128 130 815 6,335 7,149 2017 1 140 56 296 32 524 6,125 6,649 2018 1 566 N/A 210 57 833 8,929 9,762 2019 1 1,760 62 191 73 2,086 10,677 12,764 1 Preliminary
YR
ESTIMATES OF ACTIVE NUMBERS OF FOUR CORNERS BAND-TAILED PIGEON HUNTERS BY STATE OF HARVEST IN THE FOUR CORNERS POPULATION (Harvest Information Program)
YR AZ CO NM UT
2003 1 1,500 400 400 300 2004 1 900 300 100 <50 2005 1 800 200 100 100 2006 1 600 900 100 200 2007 1 2,100 1,400 800 300 2008 1 1,288 2,324 550 315 2009 1 1,322 2,390 500 198
2010 1 1,770 1,068 931 335 2011 1 538 210 257 155 2012 1 1,087 285 146 131 2013 1 380 242 113 254 2014 1 982 297 150 71 2015 1 596 214 140 67 2016 1 129 58 56 22 2017 1 82 32 105 12 2018 1 149 N/A 94 19 2019 1 488 34 68 30
1 Preliminary
AVERAGE SEASONAL FOUR CORNERS BAND-TAILED PIGEON BAG PER HUNTER BY STATE OF HARVEST IN THE FOUR CORNERS POPULATION (Harvest Information Program)
YR AZ CO NM UT
2003 1 1.0 2.3 1.1 0.5 2004 1 1.5 1.6 4.9 3.8 2005 1 2.6 0.8 3.2 1.5 2006 1 0.9 0.7 0.4 2.5 2007 1 0.5 0.6 3.5 0.6 2008 1 1.3 1.1 1.1 0.0 2009 1 1.8 0.6 2.5 0.0
2010 1 0.4 1.4 2.9 0.7 2011 1 1.8 1.4 1.8 0.6 2012 1 1.2 3.8 2.3 0.8 2013 1 2.3 0.2 1.7 2.0 2014 1 0.8 1.4 1.4 2.0 2015 1 0.8 0.8 0.7 0.3 2016 1 3.7 3.7 3.1 11.0 2017 1 1.0 0.9 1.6 0.0 2018 1 0.9 N/A 0.6 0.6 2019 1 1.0 0.5 0.8 1.4
1 Preliminary FILE: S:\CF_D\projects\Monitoring\harvestdata\DATABOOK\HIP\weblessHIP.XLS
44
11/10/20

Central Flyway Databook 202012/22/2020
ESTIMATED CMR AMERICAN WOODCOCK HARVEST (Harvest Information Program)
YR AL AR IL IN IA KS KY LA MI MN MS MO NE OH OK TN TX WI CMR EMR U.S.
2003 1 4,200 600 2,200 1,800 900 200 2,600 10,400 121,500 29,900 400 2,100 100 2,500 2,800 1,000 0 30,300 213,500 89,200 302,700 2004 1 2,200 2,800 1,900 7,900 1,700 100 1,900 20,200 102,500 38,500 900 900 <50 4,600 200 400 800 47,300 234,800 135,400 370,200 2005 1 100 1,500 3,900 4,400 1,000 0 800 18,100 106,800 42,200 0 1,300 0 6,900 0 400 0 37,600 225,000 72,200 297,200 2006 1 300 2,900 2,200 2,400 1,500 100 300 19,000 116,200 38,700 600 400 100 4,100 ‹50 700 0 43,000 232,600 79,300 311,900 2007 1 700 10,500 3,800 1,200 100 <50 300 21,700 86,800 34,400 600 900 200 2,600 0 800 1,500 48,000 214,200 75,900 290,000 2008 1 2,292 3,100 4,252 832 1,597 1,983 1,504 13,309 78,900 19,871 382 2,623 0 2,307 21 615 4,675 35,999 174,262 104,701 278,963 2009 1 5,946 6,616 5,345 1,658 673 27 0 24,693 80,934 15,998 1,281 873 90 1,160 162 424 0 29,240 175,121 63,274 238,395
2010 1 599 248 878 3,023 1,660 0 6,790 32,989 93,229 34,835 1,373 3,031 61 1,715 3,108 5,071 2,249 42,282 233,140 99,798 332,938 2011 1 1,593 615 3,718 1,763 209 0 181 24,359 106,885 44,242 446 895 0 2,306 17 578 1,295 42,570 231,673 77,049 308,722 2012 1 3,505 4,165 1,898 580 0 1,345 213 20,009 74,051 30,958 218 894 1,282 1,470 592 1,548 9,935 40,361 193,024 86,433 279,457 2013 1 1,425 70 1,045 1,396 4,196 15 2,848 7,408 79,348 18,569 2,579 7,670 0 8,565 321 1,255 5,475 38,375 180,558 62,537 243,095 2014 1 769 195 286 660 142 8 62 9,364 53,528 23,925 760 600 1,433 279 74 52 46 49,313 141,496 58,589 200,085 2015 1 6,127 7,273 174 572 319 345 579 3,519 63,187 25,622 3,576 382 0 2,132 0 0 907 30,960 145,673 54,486 200,159 2016 1 92 2,980 1,633 897 2,886 0 2,410 1,860 64,863 25,936 12 3,408 574 3,248 0 0 12,142 35,077 157,973 44,352 202,325 2017 1 628 611 357 1,524 1,862 79 942 9,895 66,109 26,653 367 179 0 445 0 89 0 31,142 140,883 62,653 203,536 2018 1 226 10,090 0 162 0 80 253 10,593 59,632 22,500 447 156 0 588 86 306 0 25,498 130,615 49,580 180,195 2019 1 981 6,755 3,410 370 1,625 0 67 1,495 64,492 20,822 82 290 0 720 283 5,013 2,834 26,769 136,007 35,271 171,278
1 Preliminary
ESTIMATES OF TOTAL CMR AMERICAN WOODCOCK HUNTER DAYS AFIELD BY STATE OF HARVEST (Harvest Information Program)
YR AL AR IL IN IA KS KY LA MI MN MS MO NE OH OK TN TX WI CMR EMR U.S.
2003 1 14,300 4,600 12,200 6,000 4,200 600 2,000 7,400 159,000 48,700 3,400 8,000 900 10,300 15,400 1,200 6,000 65,600 369,800 152,300 522,100 2004 1 1,000 20,100 3,500 5,300 8,800 200 1,300 14,100 147,000 67,000 3,600 3,700 100 18,200 2,800 1,700 6,600 61,100 366,100 135,400 501,500 2005 1 200 9,200 5,300 7,400 2,200 0 2,900 16,700 151,200 60,200 0 5,000 300 15,800 0 500 6,300 73,100 356,300 164,200 520,500 2006 1 400 6,800 8,900 4,400 4,300 300 900 10,900 155,300 60,200 3,900 3,800 700 9,800 600 800 0 72,400 344,400 144,200 488,600 2007 1 700 9,300 7,600 3,300 4,600 3,100 3,400 17,200 138,900 62,800 1,800 900 13,800 9,300 0 400 2,100 79,100 358,500 145,000 503,500 2008 1 3,099 24,179 6,098 2,377 4,332 2,833 9,369 16,222 156,012 37,899 1,818 7,306 4,408 10,310 8,352 397 9,350 65,433 369,792 169,012 538,804 2009 1 6,539 8,077 6,208 3,984 1,781 31 29 20,772 146,177 38,267 3,722 1,179 72 7,249 81 1,025 0 77,118 322,310 177,982 500,292
2010 1 1,539 207 1,220 3,941 7,431 692 6,732 28,224 159,240 55,423 2,960 6,039 762 4,306 17,613 4,895 25,473 65,744 392,441 146,705 539,146 2011 1 7,473 1,025 8,824 4,139 1,560 29 181 18,430 143,986 76,937 531 1,123 0 10,243 170 5,446 1,413 69,039 350,548 155,961 506,509 2012 1 4,860 3,181 3,482 1,492 4,356 5,135 324 11,028 121,418 40,366 196 2,010 4,486 2,585 3,422 739 9,795 58,035 276,909 137,796 414,705 2013 1 1,518 349 3,442 1,581 8,308 1,082 1,917 2,540 123,682 74,665 2,552 8,490 644 8,569 206 1,303 5,187 60,041 306,076 136,680 442,757 2014 1 436 390 2,644 903 957 992 49 5,844 87,522 47,527 5,446 2,237 1,074 4,544 100 364 182 66,433 227,643 119,717 347,360 2015 1 5,072 4,832 1,257 1,106 2,509 2,762 2,607 12,277 124,717 47,607 2,271 644 0 7,547 1,831 0 593 66,554 284,184 115,494 399,677 2016 1 1,446 13,415 13,158 1,302 1,770 418 1,517 4,551 107,126 45,990 1,279 6,249 574 8,230 0 9,757 28,352 55,073 300,206 96,115 396,322 2017 1 2,184 4,747 317 2,852 2,434 73 829 14,472 122,793 45,667 2,422 1,331 96 4,995 0 2,632 12,107 52,420 272,373 115,355 387,728 2018 1 501 7,734 82 209 0 159 279 11,149 135,774 41,521 368 234 0 823 572 612 0 45,941 245,958 99,176 345,134 2019 1 348 14,351 11,338 1,059 4,467 0 227 6,041 86,066 29,259 326 752 0 2,357 433 11,307 1,329 46,955 216,618 101,163 317,781
1 Preliminary
ESTIMATES OF ACTIVE NUMBERS OF CMR AMERICAN WOODCOCK HUNTERS BY STATE OF HARVEST IN THE CENTRAL REGION (Harvest Information Program)
YR AL AR IL IN IA KS KY LA MI MN MS MO NE OH OK TN TX WI
2003 1 4,000 1,800 2,400 700 1,500 100 1,500 1,600 35,100 14,300 2,000 1,700 400 3,400 1,300 100 5,900 16,100 2004 1 600 3,600 1,200 1,100 1,800 <50 900 3,600 31,200 14,500 1,100 2,500 <50 2,600 500 200 6,200 15,700 2005 1 <50 3,800 2,100 2,100 800 0 1,000 5,500 28,000 12,000 0 1,200 300 4,700 0 200 6,200 15,600 2006 1 200 3,000 2,000 1,000 2,100 300 100 4,000 30,000 14,900 1,200 1,500 600 2,200 500 100 0 19,400 2007 1 100 2,600 3,100 1,800 1,100 600 800 4,800 28,400 15,300 600 200 500 2,600 0 100 600 17,300 2008 1 1,016 5,063 2,124 943 1,576 567 2,544 5,995 34,633 8,672 550 2,757 882 2,909 659 98 4,675 14,231 2009 1 2,084 3,012 1,846 1,095 856 9 7 4,319 26,411 9,729 1,046 179 36 1,641 17 247 0 19,425
2010 1 1,202 124 843 1,038 3,169 326 2,865 9,110 31,064 13,888 1,006 2,614 640 1,828 1,036 1,640 10,092 14,591 2011 1 2,463 205 2,874 1,101 1,036 14 45 6,572 28,422 17,028 137 186 0 3,119 26 1,582 236 15,226 2012 1 2,297 1,120 857 382 944 1,345 19 4,846 25,744 11,176 87 1,349 641 582 1,148 92 4,898 13,651 2013 1 1,012 139 1,593 718 1,832 363 961 2,540 30,038 10,909 1,163 2,925 644 2,979 38 1,206 4,851 14,520 2014 1 51 156 842 263 465 952 12 2,682 19,389 13,502 1,616 1,280 358 1,595 26 104 114 16,155 2015 1 992 1,221 956 409 1,366 1,381 734 2,797 25,997 13,488 580 127 0 1,892 1,831 0 140 14,653 2016 1 1,354 4,050 1,527 321 498 418 1,063 946 24,064 13,456 646 2,247 574 2,597 0 1,412 11,325 11,670 2017 1 1,751 1,545 119 1,054 1,011 20 133 3,516 24,131 11,895 1,563 861 16 1,928 0 1,286 12,107 11,700 2018 1 176 2,467 41 93 0 53 66 5,214 29,328 10,400 105 78 0 470 29 184 0 10,841 2019 1 63 6,994 2,280 495 609 0 84 1,304 19,128 8,742 109 129 0 1,105 83 1,629 266 9,535
1 Preliminary
AVERAGE SEASONAL CMR AMERICAN WOODCOCK BAG PER HUNTER BY STATE OF HARVEST IN THE CENTRAL REGION (Harvest Information Program)
2003 1 1.1 0.3 0.9 2.6 0.6 3.0 1.8 6.6 3.5 2.1 0.2 1.2 0.2 0.7 2.1 7.5 0.0 1.9 2004 1 3.5 0.8 1.6 7.1 1.0 2.6 2.2 5.6 3.3 2.7 0.8 0.4 1.8 1.8 0.4 1.7 0.1 3.0 2005 1 4.0 0.4 1.8 2.1 1.3 0.0 0.9 3.3 3.8 3.5 0.0 1.1 0.0 1.5 0.0 2.5 0.0 2.4 2006 1 2.0 1.0 1.1 2.4 0.7 0.2 2.6 4.8 3.9 2.6 0.5 0.3 0.1 1.8 ‹0.05 5.3 0.0 2.2 2007 1 7.0 4.0 1.2 0.7 0.1 <0.1 0.3 4.6 3.1 2.2 1.0 4.5 0.3 1.0 0.0 6.0 2.5 2.8 2008 1 2.3 0.6 2.0 0.9 1.0 3.5 0.6 2.2 2.3 2.3 0.7 1.0 0.0 0.8 0.0 6.3 1.0 2.5 2009 1 2.9 2.2 2.9 1.5 0.8 3.0 0.0 5.7 3.1 1.6 1.2 4.9 2.5 0.7 9.3 1.7 0.0 1.5
2010 1 0.5 2.0 1.0 2.9 0.5 0.0 2.4 3.6 3.0 2.5 2.6 1.2 0.1 0.9 3.0 4.3 0.5 2.9 2011 1 0.6 3.0 1.3 1.6 0.2 0.0 4.0 3.7 3.8 2.6 3.3 4.8 0.0 0.7 0.7 0.4 5.5 2.8 2012 1 1.5 3.7 2.2 1.5 0.0 1.0 11.5 4.1 2.9 2.8 2.5 0.7 2.0 2.5 0.5 16.8 2.0 3.0 2013 1 1.4 0.5 0.7 2.0 2.3 0.0 3.0 2.9 2.6 1.7 2.2 2.6 0.0 2.9 8.4 1.0 1.1 2.6 2014 1 15.0 1.3 0.3 2.5 0.3 0.0 5.0 3.5 2.8 1.8 0.5 0.5 4.0 0.2 2.8 0.5 0.4 3.1 2015 1 6.2 6.0 0.2 1.4 0.2 0.3 0.8 1.3 2.4 1.9 6.2 3.0 0.0 1.1 0.0 0.0 6.5 2.1 2016 1 0.1 0.7 1.1 2.8 5.8 0.0 2.3 1.9 2.7 1.9 0.0 1.5 1.0 1.3 0.0 0.0 1.1 3.0 2017 1 0.4 0.4 3.0 1.5 1.8 4.0 7.1 2.8 2.7 2.2 0.2 0.2 0.0 0.2 0.0 0.1 0.0 2.7 2018 1 1.3 4.1 0.0 1.8 0.0 1.5 3.8 2.0 2.0 2.2 4.3 2.0 0.0 1.3 3.0 1.7 0.0 2.4 2019 1 15.5 1.0 1.5 0.8 2.7 0.0 0.8 1.2 3.4 2.4 0.8 2.3 0.0 0.7 3.4 3.1 10.7 2.8
YR AL AR IL IN IA KS KY LA MI MN MS MO NE OH OK TN TX WI
1 Preliminary FILE: S:\CF_D\projects\Monitoring\harvestdata\DATABOOK\HIP\weblessHIP.XLS 11/10/20
45

Central Flyway Databook 202012/22/2020
WATERFOWL POPULATION SURVEYS
46

Central Flyway Databook 202012/22/2020
RE
SU
LT
S O
F 2
020
WIN
TE
R G
OO
SE
SU
RV
EY
S IN
TH
E C
EN
TR
AL
FL
YW
AY
¹ Ja
nuar
y 20
20 M
id-w
inte
r W
ater
fow
l Sur
vey C
AN
AD
A
GE
ES
E L
IGH
T G
EE
SE
Sta
te
Hi-L
ine
Wes
t Tie
r
CF
AN
3
Eas
t Tie
r
CF
AN
3 E
PP
W
P/G
P
RM
P
Unc
lass
. T
otal
W
-CF
M
-C
W-F
T
OT
AL
Mon
tana
16
5,47
0 15
,880
0
0 0
0 0
181,
350
0 0
0 18
1,35
0 N
o. D
akot
a 0
0 60
0 0
93,3
38
0 0
93,9
38
0 4
0 93
,942
S
o. D
akot
a 0
0 28
8 0
71,9
45
0 0
72,2
33
0 2,
753
0 74
,986
W
yom
ing
25,7
67
4,61
8 0
0 0
10,3
18
0 40
,703
0
0 0
40,7
03
Neb
rask
a 19
2 32
89
1 0
122,
277
0 0
123,
392
500
181,
086
208
305,
186
Col
orad
o 21
4,64
3 0
0 0
0 0
0 21
4,64
3 20
0,87
3 0
3 41
5,51
9 K
ansa
s 0
375
6,02
4 97
8 4,
280
0 13
8,09
7 14
9,75
4 0
973,
958
14,5
69
1,13
8,28
1 N
. Mex
ico
5,05
6 13
,599
0
0 0
0
592
19
,247
18
,100
0
0 37
,347
O
klah
oma
0 0
74,2
39
0 3,
587
0 0
77,8
26
0 69
,866
4,
306
151,
998
Tex
as
0 48
2,07
8 35
,180
0
0 0
0 51
7,25
8 12
3,91
3 28
8,02
7 94
,634
1,
023,
832
*In
TX
, CF
AN
bas
ed o
n cr
uise
sur
veys
. Tra
ditio
nal M
id D
ec. c
oast
al c
ruis
e co
unt c
ompl
eted
for
MC
Lig
ht/W
FG
gee
se.
Cen
tral
Fly
way
Goo
se P
opul
atio
n S
urve
y R
esul
ts²
CA
NA
DA
G
EE
SE
LIG
HT
GE
ES
E
Yea
r W
est T
ier
Eas
t Tie
r C
FA
N
CF
AN
Hi-L
ine
EP
P
WP
/GP
R
MP
U
ncla
ss.
Tot
al
W-C
F
M-C
W
-F
TO
TA
L
47
2020
41
1,12
8 51
6,58
2 11
7,22
2 97
8 29
5,42
7 10
,318
13
8,68
9 1,
490,
344
343,
386
1,51
5,69
4 11
3,72
0 3,
463,
144
2019
27
4,53
3 38
2,81
4 23
0,23
4 54
0 54
5,94
1 7,
653
107,
553
1,54
9,26
8 17
1,45
3 1,
037,
840
175,
285
2,93
3,84
6 20
18
505,
849
553,
027
383,
050
24,6
65
577,
168
14,9
66
376,
041
2,43
4,76
6 31
1,33
0 1,
497,
239
110,
572
4,35
3,90
7 20
17
286,
753
468,
094
222,
882
30
608,
739
13,6
59
119,
421
1,71
9,57
8 22
7,13
5 90
8,20
1 10
1,38
4 2,
956,
298
2016
28
0,19
4 45
2,91
3 17
2,29
7 1,
523
538,
160
9,17
2 96
,735
1,
550,
994
239,
480
1,18
2,39
9 10
7,82
8 3,
080,
701
2015
23
8,84
4 54
7,70
0 28
0,43
8 15
,200
45
5,84
6 13
,384
26
2,38
9 1,
813,
801
243,
253
1,04
8,90
2 69
,266
3,
175,
222
2014
28
1,32
4 37
9,21
4 18
8,06
8 90
0 56
8,81
8 37
,894
14
6,90
7 1,
603,
125
264,
836
959,
798
27,0
06
2,85
4,76
5 20
13
341,
302
256,
268
263,
271
2,37
5 76
8,81
8 23
,617
37
,831
1,
693,
482
225,
936
1,12
5,58
2 48
,187
3,
093,
187
2012
33
9,43
6 29
2,79
5 45
0,78
6 34
,343
55
5,35
5 9,
111
27,1
29
1,70
8,95
5 20
5,33
1 61
6,42
7 78
,812
2,
609,
525
2011
27
3,02
5 31
0,65
7 42
7,06
3 67
5 49
9,02
9 16
,418
13
,479
1,
540,
346
196,
013
1,05
8,85
3 12
8,17
1 2,
923,
383
2010
23
9,61
7 29
0,72
4 41
7,04
4 9,
500
462,
794
10,2
94
15,7
90
1,44
5,76
3 23
8,08
4 61
8,79
4 16
1,11
9 2,
463,
760
2009
22
2,07
1 22
1,59
0 30
9,90
9 20
,900
62
7,97
7 15
,798
70
,260
1,
488,
505
284,
446
775,
650
103,
172
2,65
1,77
3 20
08
269,
289
212,
421
402,
718
50
669,
524
9,18
8 21
,789
1,
584,
979
188,
515
627,
426
82,9
36
2,48
3,85
6 20
07
180,
215
190,
531
680,
301
43,7
00
445,
959
19,5
12
37,4
13
1,59
7,63
1 17
0,64
2 1,
076,
557
243,
081
3,08
7,91
1 20
06
247,
265
234,
737
499,
801
2,16
0 44
4,41
0 6,
883
13,4
35
1,44
8,69
1 14
0,58
7 80
8,50
8 30
4,09
3 2,
701,
879
2005
20
7,40
1 17
7,19
5 40
0,76
6 50
,000
41
5,13
1 15
,849
5,
175
1,27
1,51
7 14
2,97
4 87
7,91
7 14
7,78
3 2,
440,
191
2004
21
5,58
6 20
3,58
6 45
8,68
0 26
,000
62
2,10
0 13
,228
69
,595
1,
608,
775
135,
373
726,
999
79,3
89
2,55
0,53
6 20
03
205,
939
156,
661
611,
842
40,5
00
561,
049
5,11
9 24
,907
1,
606,
017
105,
900
826,
981
213,
343
2,75
2,24
1 20
02
217,
145
160,
873
504,
708
8,10
0 71
0,26
0 7,
396
16,8
73
1,62
5,35
5 99
,875
67
5,45
3 26
0,84
9 2,
661,
532
2001
25
7,92
9 16
4,08
4 14
9,09
0 90
0 67
7,72
9 13
,327
18
,329
1,
281,
388
105,
754
751,
928
141,
189
2,28
0,25
9 20
00
270,
730
199,
493
295,
540
13,0
50
599,
292
9,80
1 11
,860
1,
399,
766
137,
535
1,05
7,04
2 14
5,21
9 2,
739,
562
1999
11
9,46
0 40
3,19
7 54
8,20
6 45
,000
46
7,13
7 5,
298
52,5
54
1,64
0,85
2 23
6,36
5 1,
114,
384
200,
391
3,19
1,99
2 19
97-9
8 19
0,98
5 33
9,55
2 33
1,86
3 1,
200
482,
290
44,9
47
1,39
0,83
7 10
3,52
2 1,
058,
685
356,
531
2,90
9,57
5 19
96-9
7 14
8,52
7 40
6,83
8 26
2,86
4 0
453,
358
39,5
05
1,31
1,09
2 12
7,17
2 1,
208,
606
215,
254
2,86
2,12
4 19
95-9
6 16
7,52
4 41
4,82
9 26
3,99
6 20
,800
40
3,31
8 66
,445
1,
336,
912
93,0
54
835,
565
154,
519
2,42
0,05
0 19
94-9
5 17
3,75
2 48
1,95
1 24
4,98
8 27
,500
35
2,49
5 35
,520
1,
316,
206
80,1
27
1,20
3,36
0 19
4,84
5 2,
794,
538
1993
-94
164,
334
312,
855
224,
200
1,80
0 27
2,48
7 41
,916
1,
017,
592
84,8
74
1,01
5,16
9 18
8,87
8 2,
306,
513
1992
-93
117,
294
270,
495
235,
328
26,6
00
318,
029
60,6
22
1,02
8,36
8 45
,145
89
5,95
1 15
8,62
5 2,
128,
089
1991
-92
136,
950
558,
756
276,
329
0 30
5,86
1 47
,624
1,
325,
520
87,8
85
908,
373
85,8
81
2,40
7,65
9 19
90-9
1 11
6,64
3 51
2,16
2 30
5,11
7 13
,500
32
8,71
0 37
2,39
8 1,
648,
530
104,
624
799,
880
155,
211
2,70
8,24
5 19
89-9
0 10
1,84
0 37
5,28
3 13
6,09
1 11
,000
21
6,03
4 32
9,77
9 1,
170,
027
38,6
86
661,
302
90,8
30
1,96
0,84
5 19
88-8
9 99
,934
28
4,16
8 21
5,79
9 0
245,
891
375,
874
1,22
1,66
6 67
,637
59
8,13
2 10
3,07
3 1,
990,
508
1987
-88
65,5
12
147,
322
306,
735
0 27
2,05
0 22
4,47
0 1,
016,
089
46,2
17
735,
922
90,6
26
1,88
8,85
4 19
86-8
7 11
7,40
9 19
3,31
8 15
9,00
7 0
174,
355
382,
332
1,02
6,42
1 63
,545
90
0,43
7 19
4,53
0 2,
184,
933
1985
-86
68,7
92
180,
824
189,
360
0 36
,534
30
7,91
9 78
3,42
9 96
,591
83
7,61
1 92
,727
1,
810,
358
1984
-85
76,1
11
179,
120
197,
240
0 16
0,64
0 17
3,39
4 78
6,50
5 62
,905
98
0,22
0 15
5,70
5 1,
985,
335
1983
-84
39,7
79
143,
382
260,
650
0 91
,450
51
,775
58
7,03
6 43
,038
90
5,53
8 14
0,69
7 1,
676,
309
¹ M
id-D
ecem
ber
Goo
se S
urve
ys w
ere
disc
ontin
ued
afte
r D
ecem
ber,
199
7. S
:\CF
_D\P
roje
cts\
Mon
itorin
g\M
WS
\GO
OS
ES
UR
VE
Y\G
SE
SU
M20
10s.
XLS
3/
11/2
0
² Y
early
tota
ls fr
om 1
983-
84 to
199
7-98
ref
lect
Mid
-Dec
embe
r co
unts
(w
hen
avai
labl
e) fo
r T
GP
, EP
P, a
nd W
P/G
P C
anad
a ge
ese,
W-C
F a
nd M
-C li
ght g
eese
, and
W-F
gee
se; t
otal
s fo
r H
i-lin
e an
d S
GP
pop
ulat
ions
refle
ct M
id-w
inte
r S
urve
y da
ta.
Cou
nts
from
thes
e tim
e pe
riods
wer
e de
sign
ated
as
offic
ial c
ount
s by
res
pect
ive
Man
agem
ent P
lans
. 3 S
tart
ing
in 2
014,
SG
P a
nd T
GP
pop
ulat
ions
hav
e be
en c
ombi
ned
into
one
pop
ulat
ion:
Cen
tral
Fly
way
Arc
tic N
estin
g (C
FA
N)
Can
ada
Gee
se. F
or th
e M
WS
they
will
be
split
out
by
Wes
t Tie
r an
d E
ast T
ier
segm
ents
.

Central Flyway Databook 202012/22/2020
MID-CONTINENT GREATER WHITE-FRONTED GOOSE POPULATION STATUS, OBJECTIVES, AND REGULATORY THRESHOLDS
WINTER SURVEY ² FALL MISSISSIPPI CENTRAL
YEAR SURVEY ¹ FLYWAY FLYWAY MEXICO TOTAL 1969/70 50,600 22,070 18,800 91,470 1970/71 39,300 21,144 60,444 1971/72 45,800 32,142 77,942 1972/73 43,000 29,665 72,665 1973/74 43,200 49,463 92,663 1974/75 40,400 39,510 46,100 126,010 1975/76 53,400 54,800 108,200 1976/77 50,400 29,590 23,300 103,290 1977/78 53,100 140,605 43,900 237,605 1978/79 49,300 69,005 59,700 178,005 1979/80 59,000 107,127 56,500 222,627 1980/81 67,500 110,950 34,400 212,850 1981/82 65,600 155,850 49,200 270,650 1982/83 62,000 110,835 172,835 1983/84 70,300 140,697 210,997 1984/85 81,300 155,705 38,470 275,475 1985/86 78,600 92,700 171,300 1986/87 71,500 194,530 266,030 1987/88 76,700 90,626 28,325 195,651 1988/89 116,500 103,073 219,573 1989/90 103,300 90,830 194,130 1990/91 135,700 155,211 33,870 324,781 1991/92 172,900 85,881 258,781 1992/93 622,948 99,240 158,625 257,865 1993/94 676,344 154,340 188,878 23,375 366,593 1994/95 727,295 134,421 194,845 329,266 1995/96 1,129,378 145,075 154,519 299,594 1996/97 742,506 106,570 215,254 14,837 336,661 1997/98 622,206 195,593 356,531 552,124 1998/99 1,058,256 118,945 200,391 319,336 1999/00 963,090 92,274 145,219 37,334 274,827 2000/01 1,067,605 104,487 141,189 245,676
2001/02 3 712,309 119,987 260,849 380,836 2002/03 680,200 113,844 213,343 8,321 335,508 2003/04 528,200 161,159 79,389 240,548 2004/05 644,300 137,006 147,783 284,789 2005/06 522,812 158,475 304,093 13,604 476,172 2006/07 751,295 236,651 243,081 479,732 2007/08 764,259 244,766 82,936 327,702 2008/09 751,723 211,754 103,172 NS 314,926 2009/10 583,216 276,465 161,119 437,584 2010/11 709,836 246,362 128,171 374,533 2011/12 685,722 392,711 78,812 NS 471,523 2012/13 777,872 209,183 48,187 257,370 2013/144 NS 311,794 27,006 338,800 2014/15 1,005,591 385,982 69,266 NS 455,248 2015/16 977,090 481,796 107,828 589,624 2016/17 1,000,132 444,570 101,384 545,954 2017/18 771,609 696,368 110,572 NS 806,940 2018/19 774,097 601,851 175,285 777,136 2019/20 1,266,902 575,949 113,720 689,669
3-YEAR AVERAGES:
1984/85 - 86/87 77,133 147,645 38,470 263,248 1985/86 - 87/88 75,600 125,952 28,325 229,877 1986/87 - 88/89 88,233 129,410 28,325 245,968 1987/88 - 89/90 98,833 94,843 28,325 222,001 1988/89 - 90/91 118,500 116,371 33,870 268,741 1989/90 - 91/92 137,300 110,641 33,870 281,811 1990/91 - 92/93 135,947 133,239 33,870 303,056 1991/92 - 93/94 142,160 144,461 23,375 309,996 1992/93 - 94/95 675,529 129,334 180,783 23,375 333,491 1993/94 - 95/96 844,339 144,612 179,414 23,375 347,401 1994/95 - 96/97 866,393 128,689 188,206 14,837 331,732 1995/96 - 97/98 831,363 149,079 242,101 14,837 406,018 1996/97 - 98/99 807,656 140,369 257,392 14,837 412,598 1997/98 - 99/2000 881,184 135,604 234,047 37,334 382,096 1998/99 - 2000/01 1,029,650 105,235 162,266 37,334 279,946 1999/00 - 2001/02 914,335 105,583 182,419 37,334 300,446 2000/01 - 2002/03 820,038 112,773 205,127 8,321 320,673 2001/02 - 2003/04 640,236 131,663 184,527 8,321 318,964 2002/03 - 2004/05 617,567 137,336 146,838 8,321 286,948 2003/04 - 2005/06 565,104 152,213 177,088 13,604 333,836 2004/05 - 2006/07 639,469 177,377 231,652 13,604 413,564 2005/06 - 2007/08 679,455 213,297 210,037 13,604 427,869 2006/07 - 2008/09 755,759 231,057 143,063 13,604 374,120 2007/08 - 2009/10 699,733 244,328 115,742 13,604 360,071 2008/09 - 2010/11 681,592 244,860 130,821 13,604 375,681 2009/10 - 2011/12 659,591 305,179 122,701 13,604 427,880 2010/11 - 2012/13 724,477 282,752 85,057 13,604 367,809 2011/12 - 2013/144 723,135 304,563 51,335 13,604 355,898 2012/13 - 2014/155 891,732 302,320 48,153 13,604 350,473 2013/14 - 2015/165 991,341 393,191 68,033 13,604 461,224 2014/15 - 2016/17 994,271 437,449 92,826 13,604 530,275 2015/16 - 2017/18 916,277 540,911 106,595 13,604 647,506 2016/17 - 2018/19 848,613 580,930 129,080 13,604 710,010 2017/18 - 2019/20 937,536 624,723 133,192 13,604 757,915
POPULATION OBJECTIVES:
POPULATION THAT PROVIDES OPTIMUM HARVEST OPPORTUNITIES
REGULATORY THRESHOLDS:
WEST TIER 6 NO THRESHOLD REST OF CF
CLOSED 3-YR AVE <250,000 RESTRICTIVE 3-YR AVE <600,000 AND HARVEST RATE >6%
STANDARD 3-YR AVE >600,000 OR HARVEST RATE <6% 03/11/20
1 Since 1997, Mid-continent white-fronted geese have been considered one population, officially surveyed during Fall (September) in Saskatchewan and Alberta.
2 Surveys in Mexico have been conducted at 3-year intervals since 1981-82. For estimation of 3-year averages after 1980/81-1982/83 we used the most recent Mexico count. Mexico data entries include white-fronts counted in the Interior Highlands (traditional areas) and East Coast Surveys. In 2003, no survey conducted on East Coast. Mexico surveys have not been conducted since 2005.
Column entries reflect official December surveys (when available) from 1969/70 to 1997/98. Subsequent entries reflect January surveys.
3 In TX, traditional Mid Dec. cruise count not completed, WFG geese based on transect in Ja 4 Survey was not completed in Fall 2013 due to the US Federal Gov't Shutdown. Used previous 3 yr average. 5 Three-year average only contains 2 years since the 2013 survey was not completed. 6 Except the West Tier of Texas.
48

Central Flyway Databook 202012/22/2020
-
CENTRAL FLYWAY CANADA GOOSE POPULATION STATUS, OBJECTIVES, AND REGULATORY THRESHOLDS
WESTERN
PRAIRIE/ EASTERN PRAIRIE
YR HI LINE ² GR. PLAINS¹ C. FLYWAY¹ M. FLYWAY¹ TOTAL
1969/70 44,200 106,600 106,600 1970/71 40,500 126,300 126,300 1971/72 31,400 157,400 157,400 1972/73 35,600 181,400 181,400 1973/74 24,500 205,800 205,800 1974/75 41,200 197,100 197,100 1975/76 55,600 204,400 204,400 1976/77 80,900 254,200 254,200 1977/78 80,000 270,200 270,200 1978/79 43,500 207,200 207,200 1979/80 86,900 171,800 171,800 1980/81 107,800 150,900 150,900 1981/82 78,000 160,200 145,300 145,300 1982/83 79,000 202,100 210,400 210,400 1983/84 39,800 91,400 162,700 162,700 1984/85 76,400 160,600 167,600 167,600 1985/86 68,800 36,500 169,000 169,000 1986/87 117,400 174,400 182,700 182,700 1987/88 65,500 272,100 228,400 228,400 1988/89 99,900 245,900 184,500 184,500 1989/90 101,800 216,000 324,900 324,900 1990/91 116,600 328,700 218,400 218,400 1991/92 136,800 305,900 (51,000) 189,352 189,400 1992/93 117,294 318,029 26,600 146,369 172,969 1993/94 164,334 272,487 1,800 116,218 118,018 1994/95 173,752 352,495 27,500 233,773 261,273 1995/96 167,524 403,318 20,800 255,700 276,500 1996/97 148,527 453,358 0 67,255 67,255
1997/98 190,985 482,290 1,200 119,564 120,764 1998/99 119,460 467,137 45,000 NA 45,000
2000 270,730 599,292 13,050 NA 13,050 2001 257,929 677,729 900 NA 900 2002 217,145 710,260 8,100 NA 8,100 2003 205,939 561,049 40,500 NA 40,500 2004 215,586 622,100 26,000 NA 26,000 2005 207,401 415,131 50,000 NA 50,000 2006 247,265 444,410 2,160 NA 2,160 2007 180,215 445,959 43,700 NA 43,700 2008 269,289 669,524 50 NA 50 2009 222,071 627,977 20,900 NA 20,900 2010 239,617 462,794 9,500 NA 9,500 2011 273,025 499,029 675 NA 675 2012 339,436 555,355 34,343 NA 34,343 2013 341,302 768,818 2,375 NA 2,375 2014 188,068 379,214 281,324 568,818 900 NA 900 2015 280,438 547,700 238,844 455,846 15,200 NA 15,200 2016 172,297 452,913 280,194 538,160 1,523 NA 1,523 2017 222,882 468,094 286,753 608,739 30 NA 30 2018 383,050 553,027 505,849 577,168 24,665 NA 24,665 2019 230,234 382,814 274,533 545,941 540 NA 540 2020 117,222 516,582 411,128 295,427 978 NA 978
3-YEAR AVERAGES:
1978/79 - 80/81 79,400 176,633 176,633 1979/80 - 81/82 90,900 160,200 156,000 156,000 1980/81 - 82/83 88,267 181,150 168,867 168,867 1981/82 - 83/84 65,600 151,233 172,800 172,800 1982/83 - 84/85 65,067 151,367 180,233 180,233 1983/84 - 85/86 61,667 96,167 166,433 166,433 1984/85 - 86/87 87,533 123,833 173,100 173,100 1985/86 - 87/88 83,900 161,000 193,367 193,367 1986/87 - 88/89 94,267 230,800 198,533 198,533 1987/88 - 89/90 89,067 244,667 245,933 245,933 1988/89 - 90/91 106,100 263,533 242,600 242,600 1989/90 - 91/92 118,400 283,533 244,217 244,233 1990/91 - 92/93 123,565 317,543 26,600 184,707 193,590 1991/92 - 93/94 139,476 298,805 14,200 150,646 160,129 1992/93 - 94/95 151,793 314,337 18,633 165,453 184,087 1993/94 - 95/96 168,537 342,767 16,700 201,897 218,597 1994/95 - 96/97 163,268 403,057 16,100 185,576 201,676 1995/96 - 97/98 169,012 446,322 7,333 147,506 154,840 1996/97 - 98/99 152,991 467,595 15,400 NA 77,673 1997/98 - 2000 193,725 516,240 19,750 NA 59,605 1998/99 - 2001 216,040 581,386 19,650 NA 19,650 2000 - 2002 248,601 662,427 7,350 NA 7,350 2001 - 2003 227,004 649,679 16,500 NA 16,500 2002 - 2004 212,890 631,136 24,867 NA 24,867 2003 - 2005 209,642 532,760 38,833 NA 38,833 2004 - 2006 223,417 493,880 26,053 NA 26,053 2005 - 2007 211,627 435,167 31,953 NA 31,953 2006 - 2008 232,256 519,964 15,303 NA 15,303 2007 - 2009 223,858 581,153 21,550 NA 21,550 2008 - 2010 243,659 586,765 10,150 NA 10,150 2009 - 2011 244,904 529,933 10,358 NA 10,358 2010 - 2012 284,026 505,726 14,839 NA 14,839 2011 - 2013 317,921 607,734 12,464 NA 12,464 2012 - 2014 320,687 630,997 12,539 NA 12,539 2013 - 2015 287,157 597,827 6,158 NA 6,158 2014 - 2016 213,601 459,942 266,787 520,941 5,874 NA 5,874 2015 - 2017 225,206 489,569 268,597 534,248 5,584 NA 5,584 2016 - 2018 259,410 491,345 357,599 574,689 8,739 NA 8,739 2017 - 2019 278,722 467,978 355,712 577,283 8,412 NA 8,412 2018 - 2020 243,502 484,141 397,170 472,845 8,728 NA 8,728
POPULATION OBJECTIVES:
SPRING3 SPRING3 SPRING WINTER SPRING 150,000 275,000-300,000 300,000
(3-year ave) (3-year ave)
REGULATORY SPRING
THRESHOLDS: 150,000 (restrict) 260,000
285,000 (increase) 340,000
WEST TIER
CFAN 3
EAST TIER
CFAN 3
CF ARCTIC NESTING GEESE
FILE S:\CF_D\PROJECTS\SURVEYS\MWS\GOOSESURVEYS\GEESESTATS.XLS 03/11/20
¹ Column entries reflect official December surveys (when available) from 1969/70 to 1997/98. December surveys and the separation of MF wintering Canada geese into populations were discontinued after December 1997. Subsequent entries reflect January surveys.
² Column entries reflect January counts (when available) which are the official counts for these populations or population
segments.
Starting in 2014, SGP and TGP populations have been combined into one population: Central Flyway Arctic Nesting
(CFAN) Canada Geese with a minimum population objective of 1 million birds based on a Lincoln index for the fall
population. For the MWS they will be split out by West Tier and East Tier goose hunting zones. SGP and TGP historic
counts can be found in the CF MWS 2013 report. Desired winter abundance is 350,000 (150,000 west-tier and 200,000 east-tier).
49
3

Central Flyway Databook 202012/22/2020
CENTRAL FLYWAY SNOW/ROSS'S GOOSE POPULATION STATUS ¹, OBJECTIVES, AND REGULATORY THRESHOLDS
WESTERN CENTRAL FLYWAY YR U.S. MEXICO ² TOTAL
1969/70 6,925 34,831 41,756 1970/71 11,140 11,140 1971/72 13,011 13,011 1972/73 11,579 11,579 1973/74 16,200 16,200 1974/75 26,420 26,472 52,892 1975/76 23,164 23,164 1976/77 33,640 51,345 84,985 1977/78 31,050 53,695 84,745 1978/79 28,161 59,060 87,221 1979/80 30,449 65,270 95,719 1980/81 37,551 44,855 82,406 1981/82 50,005 107,630 157,635 1982/83 76,102 76,102 1983/84 43,038 43,038 1984/85 62,905 83,605 146,510 1985/86 96,591 96,591 1986/87 63,545 63,545 1987/88 46,217 92,025 138,242 1988/89 67,637 67,637 1989/90 38,686 38,686 1990/91 104,624 77,905 182,529 1991/92 87,885 87,885 1992/93 45,145 45,145 1993/94 84,874 169,460 254,334 1994/95 80,127 80,127 1995/96 93,054 93,054 1996/97 127,172 88,910 216,082 1997/98 103,522 103,522 1998/99¹ 236,365 236,365
2000 137,535 118,445 255,980 2001 105,754 105,754
2002 3 99,875 99,875 2003 105,900 61,519 167,419 2004 135,373 135,373 2005 142,974 142,974
2006 4 140,587 87,170 227,757 2007 5 170,642 170,642 2008 188,515 188,515 2009 284,446 284,446 2010 238,084 238,084 2011 196,013 196,013 2012 205,331 205,331 2013 225,936 225,936 2014 264,836 264,836 2015 243,253 243,253 2016 239,480 239,480 2017 227,135 227,135 2018 311,330 311,330 2019 171,453 171,453 2020 343,386 343,386
MID-CONTINENT POPULATIONCENTRAL MISS. FLYWAY FLYWAY TOTAL
352,390 424,625 777,015 415,254 654,900 1,070,154 376,094 937,300 1,313,394 492,965 532,300 1,025,265 657,507 532,300 1,189,807 655,080 441,500 1,096,580 870,730 691,625 1,562,355 578,940 571,350 1,150,290
1,172,252 794,125 1,966,377 772,623 513,050 1,285,673 803,801 594,275 1,398,076 902,043 504,650 1,406,693 925,705 868,350 1,794,055 923,340 832,125 1,755,465 905,538 589,000 1,494,538 980,220 992,825 1,973,045 837,611 611,750 1,449,361 900,437 1,013,375 1,913,812 735,922 1,014,775 1,750,697 598,132 1,358,100 1,956,232 661,302 1,062,982 1,724,284 799,880 1,335,870 2,135,800 908,373 1,113,491 2,021,864 895,951 848,131 1,744,082
1,015,169 1,185,646 2,200,815 1,203,360 1,521,732 2,725,092
835,565 1,562,513 2,398,078 1,208,606 1,749,080 2,957,686 1,058,685 1,963,543 3,022,228 1,114,384 1,461,342 2,575,726 1,057,042 1,340,277 2,397,319
751,928 1,589,344 2,341,272 675,453 2,020,687 2,696,140 826,981 1,608,046 2,435,027 726,999 1,487,325 2,214,324 877,917 1,466,284 2,344,201 808,508 1,413,155 2,221,663
1,076,557 1,840,537 2,917,094 627,426 1,827,625 2,455,051 775,650 1,977,793 2,753,443 618,794 2,038,686 2,657,480
1,058,853 2,116,340 3,175,193 616,427 3,404,795 4,021,222
1,125,582 3,488,405 4,613,987 959,798 2,854,885 3,814,683
1,048,902 2,235,150 3,284,052 1,182,398 2,270,243 3,452,641
908,201 2,508,872 3,417,073 1,497,239 2,563,911 4,061,150 1,037,840 2,911,103 3,948,943 1,515,694 2,863,033 4,378,727
3-YEAR AVERAGES:
1979/80 - 81/82 39,335 72,585 111,920 1980/81 - 82/83 54,553 76,243 130,795 1981/82 - 83/84 56,382 107,630 164,012 1982/83 - 84/85 60,682 83,605 144,287 1983/84 - 85/86 67,511 83,605 151,116 1984/85 - 86/87 74,347 83,605 157,952 1985/86 - 87/88 68,784 92,025 160,809 1986/87 - 88/89 59,133 92,025 151,158 1987/88 - 89/90 50,847 92,025 142,872 1988/89 - 90/91 70,316 77,905 148,221 1989/90 - 91/92 77,065 77,905 154,970 1990/91 - 92/93 79,218 77,905 157,123 1991/92 - 93/94 72,635 169,460 242,095 1992/93 - 94/95 70,049 169,460 239,509 1993/94 - 95/96 86,018 169,460 255,478 1994/95 - 96/97 100,118 88,910 189,028 1995/96 - 97/98 107,916 88,910 196,826 1996/97 - 98/99 155,686 88,910 244,596 1997/98 - 2000 159,141 118,445 277,586 1998/99 - 2001 159,885 118,445 278,330 1999/00 - 2002 114,388 118,445 232,833 2001 - 2003 103,843 61,519 165,362 2002-2004 113,716 61,519 175,235 2003-2005 128,082 61,519 189,601 2004-2006 139,645 87,170 226,815 2005-2007 151,401 87,170 238,571 2006-2008 166,581 87,170 253,751 2007-2009 214,534 87,170 301,704 2008-2010 237,015 87,170 324,185 2009-2011 239,514 87,170 326,684 2010-2012 213,143 87,170 300,313 2011-2013 209,093 87,170 296,263 2012-2014 232,034 87,170 319,204 2013-2015 244,675 87,170 331,845 2014-2016 249,190 87,170 336,360 2015-2017 236,623 87,170 323,793 2016-2018 259,315 87,170 346,485 2017-2019 236,639 87,170 323,809 2018-2020 275,390 87,170 362,560
877,183 655,758 1,532,941 917,029 735,042 1,652,071 918,194 763,158 1,681,353 936,366 804,650 1,741,016 907,790 731,192 1,638,981 906,089 872,650 1,778,739 824,657 879,967 1,704,623 744,830 1,128,750 1,873,580 665,119 1,145,286 1,810,404 686,438 1,252,317 1,938,772 789,852 1,170,781 1,960,649 789,852 1,170,781 1,967,249 939,831 1,049,089 1,988,920
1,038,160 1,185,170 2,223,330 1,018,031 1,423,297 2,441,328 1,082,510 1,611,108 2,693,619 1,034,285 1,758,379 2,792,664 1,127,225 1,724,655 2,851,880 1,076,704 1,588,387 2,665,091
974,451 1,463,654 2,438,106 828,141 1,650,103 2,478,244 751,454 1,739,359 2,490,813 743,144 1,705,353 2,448,497 810,632 1,520,552 2,331,184 804,475 1,455,588 2,260,063 920,994 1,573,325 2,494,319 837,497 1,693,772 2,531,269 826,544 1,881,985 2,708,529 673,957 1,948,035 2,621,991 817,766 2,044,273 2,862,039 764,691 2,519,940 3,284,632 933,621 3,003,180 3,936,801 900,602 3,249,362 4,149,964
1,044,761 2,859,480 3,904,241 1,063,699 2,453,426 3,517,125 1,046,500 2,338,088 3,384,589 1,195,946 2,447,675 3,643,621 1,147,760 2,661,295 3,809,055 1,350,258 2,779,349 4,129,607
POPULATION OBJECTIVES: 110,000 1,000,000 -1,500,000
REGULATORY THRESHOLDS: 1,000,000 -1,500,000
FILE S:\CF_D\PROJECTS\SURVEYS\MWS\GOOSESURVEYS\GEESESTATS.XLS 03/11/20
¹ From 1969/70 to 1997/98 light geese were surveyed in Mid-December except in Mexico (January). After 1997, Mid-December surveys were discontinued and all subsequent surveys were conducted in January.
² Surveys in Mexico have been conducted at 3-year intervals since 1981-82. For estimation of 3-year averages after 1980/81-1982/83,
we used the most recent Mexico count. Estimates of WCF geese in this column include only those geese counted in traditional
survey areas within the Interior Highlands.The tri-annual survey in Mexico has not been conducted since 2006 due to safety concerns. 3 In 2002, traditional Mid Dec. cruise count not completed in TX, Light goose estimate based on transect in Jan. 4 Mississippi changed to a transect survey in Zone 1, only counted mallards and unidentified ducks. 5
In 2007, TX was unable to complete their traditional coastal Dec. survey, light geese were counted in January.
50

Central Flyway Databook 202012/22/2020
JAN
UA
RY
202
0 M
ID-W
INT
ER
WA
TE
RF
OW
L S
UR
VE
Y -
CE
NT
RA
L F
LY
WA
Y1
51
SP
EC
IES
N
D
MT
S
D
WY
C
O
NE
K
S
OK
N
M
TX
T
OT
AL
Mal
lard
6,
823
23,9
70
45,6
06
21,9
23
148,
183
75,5
67
253,
968
54,9
80
42,8
33
613,
601
1,28
7,45
4 B
lack
Duc
k 0
0 0
0 0
0 1
0 0
0 1
Mot
tled
Duc
k 0
0 0
0 0
0 0
0 0
22,9
70
22,9
70
Gad
wal
l 0
0 10
3
4,29
8 1
1,12
5 5,
005
184
838,
189
848,
815
Wig
eon
1 0
10
15
6,80
0 0
3,46
0 32
9 7,
041
294,
139
311,
795
G-W
Tea
l 0
0 0
63
533
25
6,28
3 3,
562
3,43
1 40
7,13
7 42
1,03
4 B
W/C
IN T
eal
0 0
0 0
0 0
0 5
0 89
,743
89
,748
S
hove
ler
0 0
0 0
2,48
4 0
1,50
2 1,
607
1,51
7 32
,268
39
,378
P
inta
il 0
0 1
0 1,
271
1 6,
334
3,89
8 30
,401
82
5,10
9 86
7,01
5 W
ood
Duc
k 0
0 0
0 63
1
110
96
8 0
W
hist
ling
Duc
ks
0 0
0 0
0 0
0 0
0 18
,068
19
,210
13
,391
13
,391
Tot
al D
abbl
ers
6,82
4 23
,970
45
,627
22
,004
16
3,63
2 75
,595
27
2,78
3 70
,354
85
,407
3,
154,
615
3,92
0,81
1
Red
head
0
0 7
0 1,
549
2 6,
668
809,
385
818,
626
Can
vasb
ack
0 0
0 0
54
1 0
24
6
26,8
84
29,3
42
Sca
up
0 0
0 0
11
8 12
1,
220
139,
715
142,
254
Rin
gnec
ked
duck
0
0 4
0
594
0
5,40
4 18
2,99
8 19
1,25
2 G
olde
neye
s 23
7 2,
250
321
3,58
8 5,
112
57
24,7
93
994
38,0
78
Buf
flehe
ad
0 0
15
0 1,
016
84
2,10
9 5,
811
10,6
43
Rud
dy D
uck
0 0
0 0
50 0
90
7
0 2,
094
90
925
106
1,
565
1,18
5 4
1,94
3 30
9 61
4 11
2 1,
143
465
1,03
5 10
2
Tot
al D
iver
s 23
7 2,
250
347
3,58
8 8,
980
155
41,3
47
6,11
6 3,
482
1,16
5,78
7 1,
232,
289
Sco
ters
0
0 0
0 0
0 0
0 0
0 Lo
ng-t
aile
d D
ucks
0
0 0
0 0
0 0
0 0
0 M
erga
nser
s 42
0 16
0 45
8 19
5 1,
562
106
4,20
6 3,
729
7,09
4 39
,563
U
nide
nt. D
ucks
0
0 0
0 1,
852
400
2,51
6 0
189,
664
197,
601
0 0 21
,633
3,
169
To
tal D
uck
s 7,
481
26,3
80
46,4
32
25,7
87
176,
026
76,2
56
338,
932
83,1
92
92,6
18
4,51
7,16
0 5,
390,
264
Bra
nt
0 0
0 0
0 0
0 0
0 S
now
/Blu
e G
oose
4
0 2,
753
0 20
0,87
3 97
3,95
8 63
,805
18
,100
41
1,94
0 1,
853,
019
Ros
s's
Goo
se
0 0
0 0
0 6,
061
0 0
6,06
1 W
hite
fron
t 0
0 0
0 14
,569
4,
306
0 94
,634
11
3,72
0 C
anad
a G
oose
93
,938
18
1,35
0 72
,233
40
,703
21
4,64
3 14
9,75
4 77
,826
19
,247
51
7,25
8 1,
490,
344
0 0
181,
586
0 0
3
20
8
123,
392
To
tal G
eese
93
,942
18
1,35
0 74
,986
40
,703
30
5,18
6 1,
138,
281
151,
998
37,3
47
1,02
3,83
2 3,
463,
144
415,
519
Tun
dra
Sw
an
0 0
0
0 0
30 5
0 3
38
T
rum
pete
r S
wan
0
0 26
0 0
342
105
0 0
0 74
2 M
ute
Sw
an
0 0
0 0
0 4
0 0
0 4
Uni
dent
. Sw
ans
0 0
0
17 0
23 12
0 0
52
0 35 0 0
To
tal S
wan
s 0
0 26
0 35
17
34
2 16
2 17
0
3 83
6
Coo
t 0
0 12
5 80
7 1
2,26
3 3,
088
6,74
5 35
9,90
9 37
2,94
35
Gra
nd
To
tal
101,
423
207,
730
66,6
50
592,
369
381,
785
1,47
9,63
8 23
8,29
5 13
6,71
0 5,
900,
904
9,22
7,18
712
1,68
3
S:\C
F_D
\PR
OJE
CT
S\m
onito
ring\
MW
S\C
FM
WS
\CF
MW
S20
20s.
XLS
*In
TX
, SG
P a
nd T
GP
bas
ed o
n cr
uise
sur
veys
. Tra
ditio
nal M
id D
ec. c
oast
al c
ruis
e co
unt c
ompl
eted
for
MC
Lig
ht/W
FG
gee
se,
Jan
coun
t in
Hig
h an
d R
ollin
g P
lain
s al
so in
clud
ed in
Lig
ht/W
FG
cou
nt b
ut tr
anse
ct n
umbe
rs in
the
othe
r su
rvey
zon
es n
ot in
clud
ed (
used
act
ual c
ount
s).

Central Flyway Databook 202012/22/2020
CE
NT
RA
L F
LY
WA
Y M
ID-W
INT
ER
WA
TE
RF
OW
L S
UR
VE
Y R
ES
UL
TS
, 202
0-29
2020
-202
0 S
PE
CIE
S
2020
20
21
2022
20
23
2024
20
25
2026
20
27
2028
20
29
AV
G
52
Mal
lard
1,
287,
454
1,28
7,45
4 B
lack
Duc
k 1
1 M
ottle
d D
uck
22,9
70
22,9
70
Gad
wal
l 84
8,81
5 84
8,81
5 W
igeo
n 31
1,79
5 31
1,79
5 G
-W T
eal
421,
034
421,
034
BW
/CIN
Tea
l 89
,748
89
,748
S
hove
ler
39,3
78
39,3
78
Pin
tail
867,
015
867,
015
Woo
d D
uck
19,2
10
19,2
10
Whi
stlin
g D
uck
13,3
91
13,3
91
Tot
al D
abbl
ers
3,92
0,81
1 0
0 0
0 0
0 0
0 0
3,92
0,81
1
Red
head
81
8,62
6 81
8,62
6 C
anva
sbac
k 29
,342
29
,342
S
caup
14
2,25
4 14
2,25
4 R
ingn
eck
191,
252
191,
252
Gol
dene
ye
38,0
78
38,0
78
Buf
flehe
ad
10,6
43
10,6
43
Rud
dy D
uck
2,09
4 2,
094
Tot
al D
iver
s 1,
232,
289
0 0
0 0
0 0
0 0
0 1,
232,
289
Sco
ter
0 0
Long
-tai
led
Duc
k 0
0 M
erga
nser
s 39
,563
39
,563
U
nide
nt. D
ucks
19
7,60
1 19
7,60
1
TO
TA
L D
UC
KS
5,
390,
264
0 0
0 0
0 0
0 0
0 5,
390,
264
Bra
nt
0 0
Sno
w/B
lue
Goo
se
1,85
3,01
9 1,
853,
019
Ros
s's
Goo
se
6,06
1 6,
061
Whi
te-f
ront
ed G
oose
11
3,72
0 11
3,72
0 C
anad
a go
ose
1,49
0,34
4 1,
490,
344
TO
TA
L G
EE
SE
3,
463,
144
0 0
0 0
0 0
0 0
0 3,
463,
144
Tun
dra
Sw
an
38
38
Tru
mpe
ter
Sw
an
742
742
Mut
e S
wan
4
4 U
nide
nt. S
wan
s 52
52
TO
TA
L S
WA
NS
83
60
00
00
0
00
0 8
36
Coo
t 37
2,94
3 37
2,94
3
GR
AN
D T
OT
AL
9,22
7,18
7 0
0 0
0 0
0 0
0 0
9,22
7,18
7 F
ILE
S:\C
F_D
\Pro
ject
s\M
onito
ring\
MW
S\C
FM
WS
\CF
MW
SA
LL.x
lsx

Central Flyway Databook 202012/22/2020
CE
NT
RA
L F
LY
WA
Y M
ID-W
INT
ER
WA
TE
RF
OW
L S
UR
VE
Y R
ES
UL
TS
, 201
0-19
2010
-201
9 S
PE
CIE
S
2010
20
11
2012
20
13
2014
20
15
2016
20
17
2018
20
19
AV
G
53
Mal
lard
1,
469,
007
1,57
2,12
8 2,
118,
885
2,12
6,64
5 1,
594,
569
1,63
9,35
8 1,
950,
864
2,00
6,91
3 1,
695,
823
1,07
4,99
0 1,
724,
918
Bla
ck D
uck
00
00
10
1
00
21
2
Mot
tled
Duc
k 23
,314
39
,458
30
,624
27
,771
32
,736
17
,028
15
,980
21
,346
14
,653
16
,403
23
,931
G
adw
all
787,
075
762,
915
922,
231
850,
676
749,
838
855,
423
749,
857
738,
381
864,
317
668,
789
794,
950
Wig
eon
423,
296
223,
430
191,
135
247,
730
152,
654
235,
511
377,
884
286,
856
284,
905
301,
874
272,
528
G-W
Tea
l 36
0,76
9 31
1,31
4 39
7,31
7 32
7,04
7 65
1,25
8 31
3,02
9 79
1,17
9 76
4,74
1 35
4,02
8 25
7,36
4 45
2,80
5 B
W/C
IN T
eal
25,9
24
75,7
20
14,1
05
2,12
9 6,
082
28,0
09
14,2
41
23,9
21
60,4
45
61,4
44
31,2
02
Sho
vele
r 19
5,45
5 13
8,21
5 18
8,70
6 16
4,15
0 31
4,43
2 16
9,46
4 12
4,93
4 22
0,88
2 10
5,64
1 12
4,06
6 17
4,59
5 P
inta
il 42
1,00
8 45
0,68
9 35
0,68
5 20
8,54
1 61
6,58
6 54
2,03
9 60
1,57
8 1,
152,
520
220,
155
321,
808
488,
561
Woo
d D
uck
12,1
09
57,5
22
18,2
59
52,8
02
25,2
96
57,5
13
58,0
67
115,
947
65,8
03
33,0
01
49,6
32
Whi
stlin
g D
uck
280
0 0
15,6
35
0 0
14,0
65
1,82
3 37
,790
58
,064
12
,766
Tot
al D
abbl
ers
3,71
8,23
7 3,
631,
391
4,23
1,94
7 4,
023,
126
4,14
3,45
2 3,
857,
374
4,69
8,65
0 5,
333,
330
3,70
3,56
0 2,
917,
824
4,02
5,88
9
Red
head
36
,970
20
9,12
1 31
8,62
6 18
5,32
7 18
4,00
2 43
1,20
3 33
3,39
3 85
1,40
3 87
,970
84
6,08
1 34
8,41
0 C
anva
sbac
k 36
,486
33
,436
29
,269
22
,818
52
,610
26
,855
29
,376
86
,278
30
,619
12
0,84
2 46
,859
S
caup
41
9,80
5 21
6,18
3 27
0,85
4 12
9,87
0 36
0,36
2 14
2,53
2 89
,748
24
2,40
0 15
2,12
4 47
1,95
3 24
9,58
3 R
ingn
eck
279,
816
278,
133
169,
012
303,
730
259,
912
356,
955
262,
663
281,
842
269,
206
204,
113
266,
538
Gol
dene
ye
35,6
85
24,6
68
39,6
44
38,4
26
22,2
17
33,7
40
37,7
02
36,9
72
23,7
70
47,8
23
34,0
65
Buf
flehe
ad
34,5
10
13,6
18
34,1
12
18,5
68
21,7
37
34,1
21
11,8
81
22,7
27
14,3
18
11,9
61
21,7
55
Rud
dy D
uck
2,60
0 3,
189
1,64
4 5,
463
6,50
8 6,
050
3,03
5 3,
026
4,85
5 3,
147
3,95
2
Tot
al D
iver
s 84
5,87
2 77
8,34
8 86
3,16
1 70
4,20
2 90
7,34
8 1,
031,
456
767,
798
1,52
4,64
8 58
2,86
2 1,
705,
920
971,
162
Sco
ter
00
00
00
0 0
07
1 Lo
ng-t
aile
d D
uck
20
10
07
0 0
10
1 M
erga
nser
s 54
,125
57
,947
37
,103
62
,342
40
,747
81
,753
55
,468
55
,960
69
,660
51
,856
56
,696
U
nide
nt. D
ucks
20
7,02
4 35
1,52
8 15
4,48
3 34
6,60
9 41
5,25
9 46
0,26
9 35
0,42
8 33
2,01
9 21
3,54
3 16
2,03
8 29
9,32
0
TO
TA
L D
UC
KS
4,
825,
260
4,81
9,21
4 5,
286,
695
5,13
6,27
9 5,
506,
806
5,43
0,85
9 5,
872,
344
7,24
5,95
7 4,
569,
626
4,83
7,64
5 5,
353,
069
Bra
nt
00
00
00
0 0
00
0 S
now
/Blu
e G
oose
84
0,34
2 1,
223,
373
780,
546
1,30
7,51
0 1,
206,
768
1,28
3,03
4 1,
403,
936
1,12
2,80
8 1,
797,
250
1,20
8,92
7 1,
217,
449
Ros
s's
Goo
se
16,5
36
31,4
93
41,2
12
44,0
08
17,8
66
9,12
1 17
,943
12
,528
11
,319
36
6 20
,239
W
hite
-fro
nted
Goo
se
161,
119
128,
171
78,8
12
48,1
87
27,0
06
69,2
66
107,
828
101,
384
110,
572
175,
285
100,
763
Can
ada
goos
e 1,
445,
762
1,54
0,34
7 1,
708,
955
1,69
3,48
2 1,
603,
125
1,81
3,80
1 1,
550,
994
1,71
9,57
8 2,
434,
766
1,54
9,26
8 1,
706,
008
TO
TA
L G
EE
SE
2,
463,
759
2,92
3,38
4 2,
609,
525
3,09
3,18
7 2,
854,
765
3,17
5,22
2 3,
080,
701
2,95
6,29
8 4,
353,
907
2,93
3,84
6 3,
044,
459
Tun
dra
Sw
an
22
14
32
59
17
24
0 10
15
19
21
T
rum
pete
r S
wan
59
2 79
0 80
8 78
5 49
1 78
2 70
3 93
1 1,
318
1,40
2 86
0 M
ute
Sw
an
00
81
03
0 0
02
1 U
nide
nt. S
wan
s 63
61
14
28
73
91
26
63
58
17
49
TO
TA
L S
WA
NS
67
7 86
5 86
2 87
3 58
1 90
0 72
9 1,
004
1,39
1 1,
440
932
Coo
t 46
0,30
0 59
2,21
9 75
,811
22
5,36
4 18
9,02
6 22
2,13
7 34
9,08
5 44
2,36
1 22
4,39
3 13
0,21
1 29
1,09
1
GR
AN
D T
OT
AL
7,74
9,99
6 8,
335,
682
7,97
2,89
3 8,
455,
703
8,55
1,17
8 8,
829,
118
9,30
2,85
9 10
,645
,620
9,
149,
317
7,90
3,14
2 8,
689,
551
FIL
E S
:\CF
_D\P
roje
cts\
Mon
itorin
g\M
WS
\CF
MW
S\C
FM
WS
ALL
.xls
x

Central Flyway Databook 202012/22/2020
CE
NT
RA
L F
LY
WA
Y M
ID-W
INT
ER
WA
TE
RF
OW
L S
UR
VE
Y R
ES
UL
TS
, 200
0-09
2000
-200
9 S
PE
CIE
S
2000
20
01
2002
20
03
2004
20
05
2006
20
07
2008
20
09
AV
G
54
Mal
lard
1,
798,
494
1,86
6,17
0 1,
877,
544
1,82
5,63
9 1,
183,
436
1,42
5,94
3 1,
696,
808
1,99
4,97
1 1,
852,
566
1,51
0,43
4 1,
703,
201
Bla
ck D
uck
110
010
413
00
10
4 M
ottle
d D
uck
30,6
39
15,0
35
25,0
76
24,7
97
23,7
34
31,3
89
18,3
96
38,2
18
27,4
70
25,3
24
26,0
08
Gad
wal
l 76
2,36
0 56
1,27
5 53
2,40
3 58
8,19
4 97
1,40
7 60
4,55
4 85
6,35
2 67
5,17
6 1,
033,
802
695,
751
728,
127
Wig
eon
421,
453
180,
825
286,
363
450,
146
326,
325
354,
509
230,
293
169,
821
278,
361
263,
168
296,
126
G-W
Tea
l 57
6,17
3 21
0,86
4 45
1,11
4 18
7,54
5 43
6,98
1 24
1,66
3 51
1,21
3 48
6,84
7 1,
261,
112
689,
119
505,
263
BW
/CIN
Tea
l 2,
519
30,8
62
24,0
93
149,
309
215,
398
287,
307
55,6
16
44,6
27
60,9
23
97,2
00
96,7
85
Sho
vele
r 16
1,85
1 15
2,70
1 12
2,97
9 17
3,30
2 16
9,73
9 10
2,24
4 13
0,21
9 10
1,93
6 11
6,27
8 10
1,47
0 13
3,27
2 P
inta
il 37
4,40
7 32
7,79
7 49
2,31
1 71
3,07
1 66
4,00
3 57
2,00
8 85
7,15
1 68
1,90
2 93
6,02
8 57
2,49
9 61
9,11
8 W
ood
Duc
k 13
,397
39
,505
10
,370
7,
454
14,2
74
6,79
8 12
,320
25
,336
9,
101
4,65
0 14
,321
W
hist
ling
Duc
k 0
0 0
11,7
19
15,2
69
27,5
71
0 52
,607
87
,007
0
19,4
17
Tot
al D
abbl
ers
4,14
1,30
4 3,
385,
034
3,82
2,25
3 4,
131,
186
4,02
0,57
0 3,
653,
999
4,36
8,36
8 4,
271,
441
5,66
2,64
9 3,
959,
615
4,14
1,64
2
Red
head
11
5,09
6 25
6,22
4 51
7,78
8 35
9,79
5 12
7,81
4 36
4,64
6 45
9,59
2 38
,462
22
4,14
0 16
2,86
7 26
2,64
2 C
anva
sbac
k 15
,438
22
,286
62
,756
16
,142
6,
798
6,55
7 17
,324
3,
769
16,9
74
35,0
87
20,3
13
Sca
up
144,
800
89,8
89
141,
456
327,
027
268,
811
97,9
61
90,8
90
95,8
90
92,4
56
791,
864
214,
104
Rin
gnec
k 12
7,73
5 98
,015
11
7,63
9 12
7,15
2 15
6,08
6 20
4,32
3 81
,773
82
,410
22
7,54
8 15
8,14
2 13
8,08
2 G
olde
neye
27
,481
36
,340
27
,775
21
,966
33
,752
20
,432
18
,088
34
,691
25
,621
38
,945
28
,509
B
uffle
head
37
,690
44
,682
18
,750
9,
244
8,52
9 34
,938
25
,234
6,
655
11,3
52
20,0
85
21,7
16
Rud
dy D
uck
54,5
70
3,20
1 2,
459
3,25
8 2,
938
2,31
3 25
4 76
3,
136
34,5
78
10,6
78
Tot
al D
iver
s 52
2,81
0 55
0,63
7 88
8,62
3 86
4,58
4 60
4,72
8 73
1,17
0 69
3,15
5 26
1,95
3 60
1,22
7 1,
241,
568
696,
046
Sco
ter
00
00
00
00
00
0 O
ldsq
uaw
0
02
10
00
00
0 0
Mer
gans
ers
190,
795
69,3
29
116,
994
96,4
55
67,8
35
38,5
87
86,9
92
37,2
81
46,5
79
68,3
64
81,9
21
Uni
dent
. Duc
ks
232,
465
85,1
10
146,
930
94,3
91
100,
430
193,
824
63,7
60
25,3
32
259,
873
177,
613
137,
973
TO
TA
L D
UC
KS
5,
087,
374
4,09
0,11
0 4,
974,
802
5,18
6,61
7 4,
793,
563
4,61
7,58
0 5,
212,
275
4,59
6,00
7 6,
570,
328
5,44
7,16
0 5,
057,
582
Bra
nt
00
00
10
00
00
0 S
now
/Blu
e G
oose
1,
186,
088
847,
996
771,
141
920,
940
842,
559
1,00
9,89
4 94
0,47
8 1,
240,
242
790,
139
1,03
6,81
0 95
8,62
9 R
oss'
Goo
se
8,48
9 9,
685
4,18
7 11
,941
19
,813
10
,997
8,
617
6,95
7 25
,802
23
,286
12
,977
W
hite
-fro
nted
Goo
se
145,
219
141,
189
260,
849
213,
343
79,3
89
147,
783
304,
093
243,
081
82,9
36
103,
172
172,
105
Can
ada
goos
e 1,
400,
416
1,28
6,39
7 1,
625,
355
1,60
6,01
7 1,
608,
775
1,27
1,51
7 1,
448,
691
1,59
7,63
1 1,
584,
979
1,48
7,19
9 1,
491,
698
TO
TA
L G
EE
SE
2,
740,
212
2,28
5,26
7 2,
661,
532
2,75
2,24
1 2,
550,
537
2,44
0,19
1 2,
701,
879
3,08
7,91
1 2,
483,
856
2,65
0,46
7 2,
635,
409
Tun
dra
Sw
an
715
13
722
1226
9
10
5 13
T
rum
pete
r S
wan
39
5 30
3 22
7 39
5 27
1 60
6 61
4 78
0 65
1 69
6 49
4 M
ute
Sw
an
20
06
16 2
00
00
3
U
nide
nt. S
wan
s 5
17
25
16
8 14
10
2
14
16
13
TO
TA
L S
WA
NS
40
9 33
5 26
5 42
4 31
7 63
4 65
0 79
1 67
5 71
7 52
2
Coo
t 21
8,70
7 26
5,06
6 54
9,36
3 34
6,89
4 56
1,93
7 24
5,74
6 29
0,87
4 43
7,76
4 73
2,68
7 41
4,10
0 40
6,31
4
GR
AN
D T
OT
AL
8,04
6,70
2 6,
640,
778
8,18
5,96
2 8,
286,
176
7,90
6,35
4 7,
304,
151
8,20
5,67
8 8,
122,
473
9,78
7,54
6 8,
512,
444
8,09
9,82
6 F
ILE
S:\C
F_D
\Pro
ject
s\M
onito
ring\
MW
S\C
FM
WS
\CF
MW
SA
LL.x
lsx

Central Flyway Databook 202012/22/2020
CE
NT
RA
L F
LY
WA
Y M
ID-W
INT
ER
WA
TE
RF
OW
L S
UR
VE
Y R
ES
UL
TS
, 199
0-99
1990
-199
9 S
PE
CIE
S
1990
19
91
1992
19
93
1994
19
95
1996
19
97
1998
19
99
AV
G
55
Mal
lard
1,
299,
805
791,
723
1,43
7,18
6 59
1,25
1 74
6,74
9 86
2,06
7 91
9,81
2 1,
328,
407
1,90
2,45
1 2,
558,
207
1,24
3,76
6 B
lack
Duc
k 0
51
06
00
10
0 1
Mot
tled
Duc
k 22
,300
11
,300
45
,100
52
,700
47
,377
41
,920
35
,863
21
,814
24
,488
17
,892
32
,075
G
adw
all
136,
621
71,0
72
129,
079
116,
749
138,
305
129,
771
152,
979
370,
233
489,
898
554,
810
228,
952
Wig
eon
32,4
44
27,3
96
214,
920
45,6
70
55,9
36
60,8
56
66,8
63
81,7
44
175,
581
155,
411
91,6
82
G-W
Tea
l 28
0,25
7 81
,307
72
2,93
5 32
7,34
1 15
6,10
2 2,
205,
886
260,
638
449,
524
381,
897
494,
256
536,
014
BW
/CIN
Tea
l 1,
112
760
5,06
5 3,
948
3,25
2 15
,949
1,
317
6,92
8 2,
784
15,1
06
5,62
2 S
hove
ler
85,9
45
41,6
82
54,1
54
59,6
83
142,
284
77,3
57
68,1
13
77,3
96
83,3
02
110,
886
80,0
80
Pin
tail
589,
250
97,1
90
905,
320
319,
120
431,
924
721,
753
317,
173
505,
419
612,
712
992,
064
549,
193
Woo
d D
uck
405
900
2,10
9 3,
038
1,92
7 10
,085
59
5 16
,772
19
,444
5,
915
6,11
9 W
hist
ling
Duc
k 10
0 10
0 1,
500
16,3
00
735
899
545
1,00
0 3,
510
2,79
6 2,
749
Tot
al D
abbl
ers
2,44
8,23
9 1,
123,
435
3,51
7,36
9 1,
535,
800
1,72
4,59
7 4,
126,
543
1,82
3,89
8 2,
859,
238
3,69
6,06
7 4,
907,
343
2,77
6,25
3
Red
head
19
3,60
8 21
3,34
7 23
6,32
6 31
3,55
7 23
1,06
7 56
5,26
8 26
2,53
0 29
6,56
7 25
1,86
6 29
3,85
5 28
5,79
9 C
anva
sbac
k 32
,934
5,
250
17,9
35
6,74
6 15
,072
57
,077
22
,676
9,
424
14,1
77
40,4
70
22,1
76
Sca
up
36,6
83
12,6
67
24,7
37
57,0
12
92,9
90
51,8
86
76,8
55
55,5
50
74,7
13
131,
968
61,5
06
Rin
gnec
k 41
,304
8,
163
45,2
32
28,9
36
18,9
54
13,8
47
12,0
68
61,5
76
186,
004
202,
481
61,8
57
Gol
dene
ye
18,2
17
12,4
46
18,3
98
12,8
39
17,0
92
24,6
33
18,0
55
17,2
96
17,4
50
22,4
64
17,8
89
Buf
flehe
ad
4,83
9 3,
811
7,62
0 24
,688
13
,899
12
,192
11
,029
7,
041
16,4
99
16,6
65
11,8
28
Rud
dy D
uck
2,72
0 1,
369
2,89
9 14
,040
5,
558
24,5
27
5,50
1 4,
190
1,31
6 3,
169
6,52
9
Tot
al D
iver
s 33
0,30
5 25
7,05
3 35
3,14
7 45
7,81
8 39
4,63
2 74
9,43
0 40
8,71
4 45
1,64
4 56
2,02
5 71
1,07
2 46
7,58
4
Sco
ter
20
00
00
00
0 0
0 Lo
ng-t
aile
d D
uck
10
00
00
00
0 0
0 M
erga
nser
s 13
4,07
3 12
4,54
3 13
1,32
2 93
,361
10
5,80
2 65
,783
12
2,79
6 90
,481
66
,516
89
,148
10
2,38
3 U
nide
nt. D
ucks
43
8,52
5 13
,937
8,
881
17,4
46
4,29
3 5,
357
18,7
73
701,
689
704,
765
407,
522
232,
119
TO
TA
L D
UC
KS
3,
351,
145
1,51
8,96
8 4,
010,
719
2,10
4,42
5 2,
229,
324
4,94
7,11
3 2,
374,
181
4,10
3,05
2 5,
029,
373
6,11
5,08
5 3,
578,
339
Bra
nt
00
00
00
00
0 0
0 S
now
/Blu
e G
oose
69
9,98
8 90
4,50
4 99
6,25
8 94
1,09
6 1,
100,
043
1,34
9,74
6 92
8,61
9 1,
330,
006
1,16
2,20
7 1,
344,
173
1,07
5,66
4 R
oss'
Goo
se
5,77
2 0
6,57
6 4,
116
Whi
te-f
ront
ed G
oose
90
,830
15
5,21
1 85
,881
15
8,62
5 18
8,87
8 19
4,84
5 15
4,51
9 21
5,25
4 35
6,53
1 20
0,39
1 18
0,09
7 C
anad
a go
ose
1,17
0,02
7 1,
648,
529
1,77
9,68
5 1,
028,
518
1,01
7,59
2 1,
316,
206
1,33
3,91
2 1,
311,
092
1,39
0,83
7 1,
640,
852
1,36
3,72
5
TO
TA
L G
EE
SE
1,
960,
845
2,70
8,24
4 2,
861,
824
2,12
8,23
9 2,
306,
513
2,86
0,79
7 2,
417,
050
2,86
2,12
4 2,
909,
575
3,19
1,99
2 2,
620,
720
Tun
dra
Sw
an
310
11
032
83
9 2
7 T
rum
pete
r S
wan
17
0 20
3 16
6 16
1 25
2 23
4 22
7 17
7 27
0 13
9 20
0 M
ute
Sw
an
02
00
12
00
0 0
1 U
nide
nt. S
wan
s 0
0 0
12
3 5
0 0
726
5
TO
TA
L S
WA
NS
17
3 21
5 16
7 17
4 25
6 27
3 23
5 18
0 28
6 16
7 21
3
Coo
t 27
3,22
1 75
,155
12
7,63
1 98
,390
15
3,17
4 28
9,63
6 24
6,53
1 13
5,87
8 65
8,34
9 44
3,53
5 25
0,15
0
GR
AN
D T
OT
AL
5,58
5,38
4 4,
302,
582
7,00
0,34
1 4,
331,
228
4,68
9,26
7 8,
097,
819
5,03
7,99
7 7,
101,
234
8,59
7,58
3 9,
750,
779
6,44
9,42
1 F
ILE
S:\C
F_D
\Pro
ject
s\M
onito
ring\
MW
S\C
FM
WS
\CF
MW
SA
LL.x
lsx

Central Flyway Databook 202012/22/2020
CE
NT
RA
L F
LY
WA
Y M
ID-W
INT
ER
WA
TE
RF
OW
L S
UR
VE
Y R
ES
UL
TS
IN 2
020
RE
LA
TE
D T
O P
RE
VIO
US
SU
RV
EY
S
56
SP
EC
IES
Mal
lard
Bla
ck D
uck
Mot
tled
Duc
k G
adw
all
Wig
eon
G-W
Tea
l B
W/C
IN T
eal
Sho
vele
r P
inta
il W
ood
Duc
k W
hist
ling
Duc
k
2020
1,28
7,45
4 1 22
,970
84
8,81
5 31
1,79
5 42
1,03
4 89
,748
39
,378
86
7,01
5 19
,210
13
,391
2019
1,07
4,99
0 21
16,4
03
668,
789
301,
874
257,
364
61,4
44
124,
066
321,
808
33,0
01
58,0
64
% C
hang
e,
2020
from
20
19
20%
-9
5%
40%
27
%
3%
64%
46
%
-68%
16
9%
-42%
-7
7%
2010
-201
9 A
vg
1,72
4,91
8 2 23
,931
79
4,95
0 27
2,52
8 45
2,80
5 31
,202
17
4,59
5 48
8,56
1 49
,632
12
,766
% C
hang
e,
2020
from
20
10-1
9 A
vg
-25%
-5
7%
-4%
7%
14
%
-7%
18
8%
-77%
77
%
-61%
5%
1948
-201
9 A
vg
1,73
2,76
2 13
22,9
91
301,
820
173,
694
375,
587
23,2
69
80,6
94
705,
046
11,7
86
7,13
8
% C
hang
e,
2020
from
48
-201
9 A
vg
-26%
-9
2%
0%
181%
80
%
12%
28
6%
-51%
23
%
63%
88
%
% C
hang
e,
2020
from
20
00-2
009
Avg
-24%
-7
4%
-12%
17
%
5%
-17%
-7
%
-70%
40
%
34%
-3
1%
% C
hang
e,
2020
from
90
-99
Avg
4%
-23%
-2
8%
271%
24
0%
-21%
14
96%
-5
1%
58%
21
4%
387%
% C
hang
e,
2020
from
80
-89
Avg
0%
-62%
-3
4%
483%
25
8%
-2%
14
06%
-3
6%
47%
50
8%
1681
%
% C
hang
e,
2020
from
70
-79
Avg
-41%
-9
7%
-49%
33
4%
68%
-2
3%
352%
-5
1%
-23%
% C
hang
e,
2020
from
60
-69
Avg
-31%
-9
7%
990%
16
94%
97
%
196%
12
03%
90
%
84%
19
74%
% C
hang
e,
2020
from
48
-59
Avg
-37%
-9
2%
1448
%
3038
%
136%
44
8%
8625
%
59%
-1
5%
1714
%
Tot
al D
abbl
ers
3,92
0,81
1 2,
917,
824
34%
4,
025,
889
-3%
3,
431,
310
14%
-5
%
41%
48
%
-11%
44
%
17%
Red
head
C
anva
sbac
k S
caup
R
ingn
eck
Gol
dene
ye
Buf
flehe
ad
Rud
dy D
uck
818,
626
29,3
42
142,
254
191,
252
38,0
78
10,6
43
2,09
4
846,
081
120,
842
471,
953
204,
113
47,8
23
11,9
61
3,14
7
-3%
-7
6%
-70%
-6
%
-20%
-1
1%
-33%
348,
410
46,8
59
249,
583
266,
538
34,0
65
21,7
55
3,95
2
135%
-3
7%
-43%
-2
8%
12%
-5
1%
-47%
335,
898
22,9
23
143,
037
69,4
93
19,2
86
10,0
24
7,10
9
144%
28
%
-1%
17
5%
97%
6%
-7
1%
212%
44
%
-34%
39
%
34%
-5
1%
-80%
186%
32
%
131%
20
9%
113%
-1
0%
-68%
255%
-9
%
95%
85
8%
105%
78
%
-81%
177%
59
%
84%
31
56%
28
9%
67%
-5
8%
165%
24
4%
130%
42
70%
24
1%
215%
-8
0%
43%
11
6%
-42%
61
84%
14
2%
1009
%
-22%
Tot
al D
iver
s 1,
232,
289
1,70
5,92
0 -2
8%
971,
162
27%
60
7,77
2 10
3%
77%
16
4%
215%
19
5%
201%
45
%
Sco
ter
Long
-tai
led
Duc
k M
erga
nser
s U
nide
nt. D
ucks
0 0 39
,563
19
7,60
1
7 0 51
,856
16
2,03
8
-100
%
-24%
22
%
1 1 56
,696
29
9,32
0 -3
0%
-34%
1 1 80
,000
11
4,00
6
-100
%
-100
%
-51%
73
%
-52%
43
%
-61%
-1
5%
-67%
58
8%
-51%
43
3%
-100
%
-49%
11
16%
-1
8%
242%
TO
TA
L D
UC
KS
5,
390,
264
4,83
7,64
5 11
%
5,35
3,06
9 1%
4,
233,
087
27%
7%
69
%
10%
67
%
25%
Bra
nt
Sno
w/B
lue
Goo
se
Ros
s's
Goo
se
Whi
te-f
ront
ed G
oose
C
anad
a go
ose
0 1,
853,
019
6,06
1 11
3,72
0 1,
490,
344
0 1,
208,
927
366
175,
285
1,54
9,26
8
53%
15
56%
-3
5%
-4%
0 1,
217,
449
20,2
39
100,
763
1,70
6,00
8
52%
-7
0%
13%
-1
3%
0 77
4,75
0 9,
849
93,4
60
874,
472
139%
22%
70
%
93%
-5
3%
-34%
0%
72%
47
%
-37%
9%
-100
%
104%
-10%
68
%
183%
133%
22
9%
514%
604%
57
9%
382%
373%
93
7%
TO
TA
L G
EE
SE
3,
463,
144
2,93
3,84
6 18
%
3,04
4,45
9 14
%
1,74
7,46
9 98
%
31%
32
%
80%
19
9%
545%
52
7%
Tun
dra
Sw
an
Tru
mpe
ter
Sw
an
Mut
e S
wan
U
nide
nt. S
wan
s
38
742 4 52
19
1,40
2 2 17
100%
-4
7%
206%
21
860 1 49
79%
-1
4%
5%
14
303 1 18
175%
14
5%
220%
19
3%
202%
50
%
54%
30
9%
451%
27
1%
700%
88
1%
1800
%
326%
32
2%
593%
84
%
365%
16
7%
68%
37
8%
TO
TA
L S
WA
NS
83
6 1,
440
-42%
93
2 -1
0%
327
156%
60
%
293%
37
4%
621%
36
0%
370%
Coo
t 37
2,94
3 13
0,21
1 18
6%
291,
091
28%
25
2,67
3 48
%
-8%
49
%
30%
74
%
56%
23
8%
GR
AN
D T
OT
AL
9,22
7,18
7 7,
903,
142
17%
8,
689,
551
6%
6,23
3,55
6 48
%
14%
43
%
71%
47
%
130%
86
%
FIL
E
S:\
CF
_D
\Pro
ject
s\M
on
itori
ng
\MW
S\C
FM
WS
\CF
MW
SA
LL
.xls
x 03
/11/
20

Central Flyway Databook 202012/22/2020
BREEDING POPULATION ESTIMATES FOR 10 SPECIES OF DUCKS (Thousands) FROM THE TRADITIONAL SURVEY AREA (strata 1-18, 20-50, 75-77) AND POND ESTIMATES FROM NORTH CENTRAL U.S. AND PRAIRIE CANADA
YEAR MAL GAD WIG GWT BWT SHO PIN RED CAN SCP TOTAL U.S.
PONDS CANADA PONDS
TOTAL
1955 8,777 652 3,217 1,807 5,305 1,643 9,775 540 589 5,620 37,925 1956 10,453 773 3,145 1,525 4,998 1,781 10,373 757 699 5,994 40,498 1957 9,297 667 2,920 1,103 4,300 1,476 6,607 509 626 5,767 33,272 1958 11,234 502 2,552 1,347 5,457 1,384 6,038 457 747 5,350 35,068 1959 9,024 590 3,788 2,653 5,099 1,578 5,873 499 489 7,038 36,631
1960 7,372 784 2,988 1,427 4,293 1,825 5,722 498 606 4,869 30,384 1961 7,330 655 3,048 1,729 3,655 1,383 4,218 323 435 5,380 28,156 1,977 1962 5,536 905 1,959 723 3,011 1,269 3,624 508 360 5,286 23,181 2,369 1963 6,749 1,055 1,831 1,242 3,724 1,398 3,846 413 506 5,438 26,202 2,482 1964 6,064 873 2,590 1,561 4,021 1,718 3,291 528 644 5,132 26,422 3,371 1965 5,132 1,260 2,301 1,282 3,595 1,424 3,592 599 522 4,640 24,347 4,379 1966 6,732 1,680 2,318 1,617 3,733 2,147 4,812 713 663 4,439 28,854 4,555 1967 7,510 1,385 2,326 1,594 4,492 2,315 5,278 736 503 4,928 31,067 4,691 1968 7,089 1,949 2,299 1,431 3,463 1,685 3,489 499 564 4,413 26,881 1,986 1969 7,532 1,573 2,941 1,491 4,139 2,157 5,904 633 504 5,140 32,014 3,548
1970 9,986 1,608 3,470 2,183 4,862 2,230 6,392 622 580 5,663 37,596 4,875 1971 9,416 1,606 3,273 1,889 4,610 2,011 5,847 534 451 5,134 34,771 4,053 1972 9,266 1,623 3,200 1,948 4,279 2,467 6,979 551 426 7,997 38,736 4,009 1973 8,079 1,246 2,878 1,949 3,333 1,619 4,356 501 621 6,257 30,839 2,950 1974 6,880 1,592 2,672 1,865 4,976 2,011 6,598 626 513 5,781 33,514 1,841 6,390 8,231 1975 7,727 1,644 2,778 1,665 5,885 1,981 5,900 832 595 6,460 35,467 1,911 5,320 7,231 1976 7,934 1,245 2,505 1,548 4,745 1,748 5,476 666 614 5,819 32,300 1,392 4,599 5,990 1977 7,397 1,299 2,575 1,286 4,463 1,452 3,226 634 664 6,260 29,256 771 2,278 3,049 1978 7,425 1,558 3,282 2,174 4,499 1,975 5,108 725 373 5,984 33,103 1,590 3,622 5,213 1979 7,883 1,758 3,107 2,072 4,876 2,407 5,376 698 582 7,658 36,417 1,522 4,859 6,381
1980 7,707 1,393 3,596 2,050 4,895 1,908 4,508 728 735 6,382 33,902 761 2,141 2,902 1981 6,410 1,395 2,946 1,911 3,721 2,334 3,480 595 621 5,991 29,404 683 1,443 2,126 1982 6,409 1,634 2,459 1,536 3,658 2,148 3,709 617 513 5,532 28,215 1,458 3,185 4,643 1983 6,456 1,519 2,636 1,875 3,367 1,876 3,511 712 527 7,174 29,653 1,259 3,906 5,165 1984 5,415 1,515 3,002 1,408 3,979 1,618 2,965 671 530 7,024 28,127 1,766 2,473 4,239 1985 4,961 1,303 2,051 1,475 3,502 1,702 2,516 578 376 5,098 23,562 1,327 4,283 5,610 1986 6,124 1,547 1,737 1,675 4,479 2,128 2,740 560 438 5,235 26,663 1,735 4,025 5,760 1987 5,790 1,306 2,013 2,006 3,529 1,950 2,628 502 450 4,863 25,037 1,348 2,524 3,872 1988 6,369 1,350 2,211 2,061 4,011 1,681 2,006 442 435 4,671 25,237 791 2,110 2,901 1989 5,645 1,415 1,973 1,842 3,125 1,538 2,112 511 477 4,342 22,980 1,290 1,693 2,983
1990 5,452 1,672 1,860 1,790 2,776 1,759 2,257 481 539 4,293 22,879 691 2,817 3,509 1991 5,445 1,584 2,254 1,558 3,764 1,716 1,803 446 491 5,255 24,316 706 2,494 3,200 1992 5,976 2,033 2,208 1,773 4,333 1,954 2,098 596 482 4,639 26,092 825 2,784 3,609 1993 5,708 1,755 2,053 1,695 3,193 2,047 2,053 485 472 4,080 23,541 1,351 2,261 3,612 1994 6,980 2,318 2,382 2,108 4,616 2,912 2,972 654 526 4,529 29,997 2,216 3,769 5,985 1995 8,269 2,836 2,615 2,301 5,140 2,855 2,758 889 771 4,446 32,880 2,443 3,893 6,335 1996 7,941 2,984 2,273 2,459 6,416 3,449 2,736 834 849 4,217 34,158 2,480 5,003 7,482 1997 9,940 3,897 3,118 2,507 6,124 4,120 3,558 918 689 4,112 38,983 2,397 5,061 7,458 1998 9,640 3,742 2,858 2,087 6,399 3,183 2,521 1,005 686 3,472 35,593 2,065 2,522 4,587 1999 10,806 3,236 2,920 2,631 7,150 3,890 3,058 973 716 4,412 39,792 2,842 3,862 6,704
2000 9,470 3,158 2,733 3,194 7,431 3,521 2,908 926 707 4,026 38,074 1,525 2,423 3,947 2001 7,904 2,679 2,494 2,509 5,757 3,314 3,296 712 580 3,694 32,939 1,893 2,747 4,640 2002 7,504 2,235 2,334 2,334 4,207 2,318 1,790 565 487 3,524 27,298 1,281 1,439 2,720 2003 7,950 2,549 2,551 2,679 5,518 3,620 2,558 637 558 3,734 32,353 1,668 3,522 5,190 2004 7,425 2,590 1,981 2,461 4,073 2,810 2,185 605 617 3,807 28,554 1,407 2,513 3,920 2005 6,755 2,179 2,225 2,157 4,586 3,592 2,561 592 521 3,387 28,555 1,461 3,921 5,381 2006 7,277 2,825 2,171 2,587 5,860 3,680 3,386 916 691 3,247 32,639 1,644 4,450 6,094 2007 8,307 3,356 2,807 2,890 6,708 4,553 3,335 1,009 865 3,452 37,282 1,963 5,040 7,003 2008 7,724 2,728 2,487 2,980 6,640 3,508 2,613 1,056 489 3,738 33,962 1,377 3,055 4,431 2009 8,512 3,054 2,469 3,444 7,384 4,376 3,225 1,044 662 4,172 38,342 2,866 3,568 6,434
2010 8,430 2,977 2,425 3,476 6,329 4,057 3,509 1,064 585 4,244 37,096 2,936 3,729 6,665 2011 9,183 3,257 2,084 2,900 8,949 4,641 4,429 1,356 692 4,319 41,810 3,240 4,893 8,132 2012 10,602 3,586 2,145 3,471 9,242 5,018 3,473 1,270 760 5,239 44,806 1,659 3,885 5,544 2013 10,372 3,351 2,644 3,053 7,731 4,751 3,335 1,202 787 4,166 41,392 2,341 4,551 6,892 2014 10,900 3,811 3,117 3,440 8,542 5,279 3,220 1,279 685 4,611 44,884 2,551 4,630 7,181 2015 11,643 3,834 3,037 4,081 8,547 4,391 3,043 1,196 757 4,395 44,924 2,157 4,151 6,308 2016 11,793 3,712 3,411 4,275 6,689 3,967 2,618 1,289 736 4,992 43,482 1,518 3,494 5,012 2017 10,488 4,180 2,777 3,605 7,889 4,353 2,889 1,115 733 4,372 42,401 1,766 4,330 6,096 2018 9,255 2,886 2,820 3,043 6,450 4,208 2,365 999 686 3,989 36,701 1,567 3,660 5,227 2019 9,423 3,259 2,832 3,178 5,428 3,649 2,269 732 652 3,591 35,013 2,135 2,856 4,991
2020 3
AVERAGES:
1955-69 7,722 1,020 2,682 1,502 4,219 1,679 5,496 547 564 5,296 30,727 3,262 1970-79 8,199 1,518 2,974 1,858 4,653 1,990 5,526 639 542 6,301 34,200 1,504 4,296 6,016 1980-89 6,129 1,438 2,462 1,784 3,827 1,888 3,018 592 510 5,631 27,278 1,242 2,778 4,020 1990-99 7,616 2,606 2,454 2,091 4,991 2,789 2,581 728 622 4,346 30,823 1,802 3,447 5,248 2000-09 7,883 2,735 2,425 2,723 5,816 3,529 2,786 806 618 3,678 33,000 1,708 3,268 4,976 2010-2019 10,209 3,485 2,729 3,452 7,580 4,431 3,115 1,150 707 4,392 41,251 2,187 4,018 6,205 1955-2019 7,941 2,048 2,626 2,179 5,107 2,638 3,888 729 592 4,968 32,714 1,705 3,515 5,230
Current Year Percent Change From:
NAWMP1 22% 70% 9% 54% 10% 45% -43% 4% 12% -29% 9% 26% -18% -4% Long Term2
19% 61% 8% 47% 6% 39% -42% 0% 10% -28% 7% 26% -19% -5% 1 NAWMP goal is BPOP average between 1955-2014. K.L. Kruse FILE S:\CF_D\PROJECTS\MONITORING\HARVEST DATA\DATABOOK\HIP\SURVEYS.XLS 11/10/20 2 Long-term average is 1955-2018. 3 Survey not conducted due to COVID-19 pandemic.
57

Central Flyway Databook 202012/22/2020
TUNDRA SWANPOPULATION STATUS & HARVESTS
58

Central Flyway Databook 202012/22/2020
1980
1985
1990
1995
2000
2005
2010
2015
2020
AT
LA
NT
IC F
LY
WA
Y
MA
V
T
NH
R
I N
Y
PA
W
V
NJ
DE
M
D
VA
N
C
SC
G
A
FL
EA
ST
ER
N P
OP
UL
AT
ION
OF
TU
ND
RA
SW
AN
S O
BS
ER
VE
D D
UR
ING
TH
E M
IDW
INT
ER
WA
TE
RF
OW
L S
UR
VE
Y
YR
M
ISS
ISS
IPP
I FL
YW
AY
O
NT
AR
IO
U.S
. T
OT
AL
3-
YR
A
VG
59
0 0
0 0
37
217
0 52
7 1,
566
29,9
94
8,35
0 19
,100
66
0
0 0
200
60,0
57
1981
0
0 0
0 3
1,26
0 0
725
959
29,9
96
13,1
22
46,6
00
100
0 0
0 20
0 92
,965
19
82
0 0
0 0
0 24
2 0
900
0 19
,600
9,
800
42,2
00
165
0 0
0 27
5 73
,182
75
,401
19
83
0 0
0 0
0 80
0 0
1,80
0 3,
000
23,0
00
5,60
0 52
,200
64
0
0 50
0 55
0 87
,514
84
,554
19
84
209
0 0
0 0
100
0 60
0 0
29,0
02
7,00
0 44
,100
19
9 0
25
100
25
81,3
60
80,6
85
0 0
0 0
0 34
0 0
1,23
0 10
0 23
,500
6,
965
61,5
00
269
5 0
2,50
0 52
5 96
,934
88
,603
19
86
0 0
0 0
0 75
6 0
800
400
30,0
20
6,37
8 52
,300
86
1
25
25
150
90,9
41
89,7
45
1987
0
0 0
0 0
5,10
5 1
4,00
0 1,
400
25,7
00
4,68
553
,543
70
0
0 1,
000
250
95,7
54
94,5
43
1988
0
0 0
0 13
5
0 2,
800
0 22
,100
5,
291
46,8
05
96
0 0
1,20
0 37
5 78
,685
88
,460
19
89
0 0
0 0
0 50
2 0
2,30
0 17
5 28
,542
5,
927
53,6
56
45
3 0
25
125
91,3
00
88,5
80
0 0
0 0
0 34
0 0
3,60
0 90
20
,078
6,
092
60,2
38
155
0 0
9 17
90
,619
86
,868
19
91
0 0
0 0
0 1,
856
0 2,
800
121
23,1
04
4,49
1 64
,999
53
0
0 75
4 20
98
,198
93
,372
19
92
0 0
0 0
35
3,05
8 0
724
144
22,9
76
7,20
7 75
,607
37
0
0 2,
929
327
113,
044
100,
620
1993
0
0 0
0 83
4,
868
0 30
5 72
18
,248
7,
046
45,9
30
41
0 0
739
858
78,1
90
96,4
77
1994
0
0 0
0 8
686
1 1,
044
126
18,7
80
9,13
2 54
,664
86
0
0 18
4 61
84
,772
92
,002
0
0 0
0 20
6 2,
012
1 77
0 64
15
,578
7,
605
53,8
70
116
0 0
2,47
3 2,
447
85,1
42
82,7
01
1996
0
0 0
0 0
115
4 51
2 19
7 16
,344
10
,945
50
,716
18
8 0
0 11
3 39
3 79
,527
83
,147
19
97
0 0
0 0
0 3,
515
0 66
7 59
4 12
,238
11
,211
57
,730
16
5 0
0 6,
027
233
92,3
80
85,6
83
1998
0
0 0
0 13
9 1,
949
0 49
5 1,
171
21,5
63
7,18
6 63
,761
28
0 0
0 2,
679
1,33
5 10
0,55
8 90
,822
19
99
0 0
0 0
0 55
3 0
935
76
15,5
57
8,81
4 83
,106
0
0 0
296
1,61
8 11
0,95
5 10
1,29
8 0
0 0
0 0
1,10
6 0
130
1,49
7 15
,609
7,
596
77,0
44
100
0 0
8,89
7 3,
364
115,
343
108,
952
2001
0
0 0
0 99
36
3 24
19
7 72
20
,798
9,
428
66,9
66
220
0 0
231
46
98,4
44
108,
247
2002
0
4 4
4 11
6 1,
098
3 47
3 92
0 16
,610
5,
994
78,3
94
222
0 0
7,16
9 3,
661
114,
672
109,
486
2003
0
0 0
0 20
5 54
8 0
105
802
15,1
12
7,72
5 83
,351
33
9 0
0 1,
379
2,16
0 11
1,72
6 10
8,28
1 20
04
0 0
0 0
8 1,
261
0 49
5 66
7 17
,891
7,
173
67,1
88
292
0 0
13,7
37
2,09
4 11
0,80
6 11
2,40
1 0
0 0
0 13
2 78
6 0
205
387
13,2
48
6,48
8 47
,364
12
5 0
0 2,
668
1,05
4 72
,457
98
,330
20
06
0 0
0 0
399
2,46
4 2
165
147
8,23
9 4,
576
54,0
64
398
0 0
9,74
6 1,
069
81,2
69
88,1
77
2007
0
0 0
0 0
363
0 29
0 52
0 8,
656
4,97
9 72
,653
37
9 0
0 16
,057
10
,521
11
4,41
8 89
,381
20
08
0 0
0 0
0 1,
178
4 33
2 65
1 10
,580
6,
738
69,0
23
NS
0
0 5,
917
1,82
6 96
,249
97
,312
20
09
0 0
0 0
0 78
3 0
165
223
14,1
83
6,58
476
,788
57
8 0
NS
32
4 55
2 10
0,18
0 10
3,61
6 0
0 0
2 0
89
2 42
5 21
5 14
,004
6,
584
70,2
73
319
0 N
S
4,08
1 1,
302
97,2
96
97,9
08
2011
0
0 0
0 0
316
0 15
5 25
8 14
,355
8,
767
69,5
01
404
0 N
S
1,44
5 2,
427
97,6
28
98,3
68
2012
0
0 0
0 0
691
0 42
5 17
8 16
,599
8,
884
59,7
16
300
0 N
S
13,5
12
11,4
36
111,
741
102,
222
2013
0
0 0
0 0
1,71
1 3
183
1,39
2 17
,330
8,
987
68,5
78
312
1 N
S
7,52
7 1,
035
107,
059
105,
476
2014
0
NS
0
0 0
975
9 48
0 26
4 16
,145
9,
399
76,2
76
305
0 N
S
287
848
104,
988
107,
929
0 N
S
0 0
461
506
0 54
0 27
3 17
,837
9,
194
78,6
63
462
0 N
S
6,19
6 2,
964
117,
096
109,
714
2016
0
NS
N
S
0 0
810
NS
82
34
1 11
,220
10
,368
63
,466
33
2 0
NS
13
,992
12
,982
11
3,59
3 11
1,89
2 20
17
NS
N
S
NS
N
S
0 22
3 N
S
124
329
14,4
95
7,47
5 92
,193
58
6 N
S
NS
1,
953
1,90
9 11
9,28
7 11
6,65
9 20
18
NS
N
S
NS
N
S
0 56
N
S
385
2,55
5 16
,364
12
,886
78
,865
11
N
S
NS
61
43
1 11
1,61
4 11
4,83
1 20
19
NS
N
S
NS
N
S
0 37
6 N
S
215
5,56
0 4,
047
5,25
5 56
,681
23
1 N
S
NS
19
,721
73
3 92
,819
10
7,90
7 N
S
NS
N
S
NS
0
798
NS
60
4,
728
7,13
9 5,
840
42,7
78
11
NS
N
S
7,99
1 9,
241
78,5
86
94,3
40
S:\C
F_D
\PR
OJE
CT
S\M
ON
ITO
RIN
G\H
arve
st D
AT
A\D
AT
AB
OO
K\H
IP\T
UN
DR
AS
WA
N.X
LSX
11
/10/
20

Central Flyway Databook 202012/22/2020
ESTIMATED HARVESTS (RETRIEVED) OF EASTERN AND WESTERN POPULATION TUNDRA SWANS
YR
1962 1963 1964 1965 1966 1967 1968 1969
1970 1971 1972 1973 1974 1975 1976 1977 1978 1979
1980 1981 1982 1983 1984 1985 1986 1987 1988 1989
1990 1991 1992 1993 1994 1995 1996 1997 1998 1999
2000 2001 2002 2003 2004 2005 2006 2007 2008 2009
2010 2011 2012 2013 2014 2015 2016 2017 2018 2019
MT
34 22 19 41 27 25 41
59 52 37 18 62 56 61
101 81 93
115 93 51 56
105 93 64 64 53 70
44 65 77 67 91
105 86 47 58 70
ND
191 511
474 704 833 712 690 805 663 870 618 867
633 561 688 235 719 772 611 652 886 956
745 704 611 769 795 635 562 772 857 702
EASTERN POPULATION SD NC VA
313 2,523 2,302 2,684 117 2,488 117 2,128 133
339 2,855 128 444 2,940 205 814 2,609 187 545 2,773 130 483 3,750 194 172 2,833 218 233 2,177 195 403 2,325 217 233 2,363 248 223 2,290 128
151 2,515 179 337 2,322 144 193 2,363 177
41 2,355 174 134 1,745 159 137 2,436 201 163 2,291 163 144 2,313 193 220 2,501 243 297 2,239 165
191 2,535 229 261 2,494 145 157 2,538 172 306 2,509 166 280 2,410 165 229 2,611 173
82 2,045 131 232 3,206 240 179 2,812 199 214 2,942 197
DE
40
TOTAL
34 335
2,542 2,343 2,828 2,821 2,813
3,855 4,345 4,480 4,178 5,179 4,084 3,329 3,916 3,543 3,601
3,593 3,457 3,472 2,861 2,862 3,639 3,292 3,366 3,903 3,727
3,744 3,669 3,555 3,817 3,741 3,753 2,906 4,497 4,105 4,165
UT
320 392 335 336 491 246 520
1,377
1,078 1,109 1,028 1,191 1,377 1,383 1,109 1,575 1,152 1,293
1,156 1,619 1,244 1,168 1,194
673 947 600 854 694
874 774 450 337 768 348 897 704
1,142 858
550 249 480 761 612 779 814 780 651 788
699 669 873 360 726 903 812 833 947
1,188
WESTERN POPULATION NV MT AK
87
208 179 102 91 124 150 109 101 190 259 188 266 206 139
84 214 90 146
214 275
103 250 301 177 161 139 169 218 229 221 145 185 196 200
94 280 78 260 16 81 302 17
67 275 16 62 79 8 29 221 17 55 290 26 89 326 40 72 182 57
119 302 50 131 300 58 185 276 51 213 226 91
82 217 112 62 289 113 45 167 51 77 119 77 82 254 51
100 284 41 155 169 71 217 306 64 136 200 67
56 293 80
118 209 60 145 247 95 203 293 55
26 240 62 25 167 47
8 264 70 127 223 36 127 113 28 233 121 38 228 148 66
TOTAL
320 392 335 336 491 246 520
1,464
1,465 1,302 1,302 1,401 1,826 1,837 1,454 1,873 1,388 1,782
1,509 2,097 1,544 1,555 1,644 1,003 1,343
974 1,208 1,094
1,232 923 717 708
1,223 659
1,368 1,193 1,654 1,388
961 713 743
1,034 999
1,204 1,209 1,367 1,054 1,217
1,086 1,156 1,424
688 965
1,245 1,198 1,101 1,339 1,630
TOTAL
320 392 335 336 491 246 520
1,464
1,465 1,302 1,302 1,401 1,826 1,837 1,454 1,873 1,388 1,782
1,509 2,097 1,544 1,589 1,979 3,545 3,686 3,802 4,029 3,907
5,087 5,268 5,197 4,886 6,402 4,743 4,697 5,109 5,197 4,989
4,554 4,170 4,215 3,895 3,861 4,843 4,501 4,733 4,957 4,944
4,830 4,825 4,979 4,505 4,706 4,998 4,104 5,598 5,444 5,795
AVERAGES:
1962-69 1970-79 1980-89 1990-99 2000-2009 2010-2019 1983-2019
30 62 76 71 62
351 724 671 715 681
2,073 122 389 2,692 185 182 2,308 180 213 2,610 182 261 2,459 177
40
1,959 4,051 3,417 3,795 3,415
502 1,230 1,015
715 646 801 750
87 152 182 156 223 17 102 248 41 101 230 73 124 203 56 115 229 54
513 1,563 1,397 1,107 1,050 1,183 1,141
513 1,563 2,769 5,158 4,467 4,978 4,556
S:\CF_D\PROJECTS\MONITORING\Harvest DATA\HIP\TUNDRASWAN.XLSX 11/10/20
60

Central Flyway Databook 202012/22/2020
MID-CONTINENT & ROCKY MOUNTAIN POPULATIONS
OF SANDHILL CRANES
POPULATION STATUS & HARVESTS
61

Central Flyway Databook 202012/22/2020
1975
1980
1985
1990
1995
2000
2005
2010
2015
2020
Annual spring abundance indices for the Mid-Continent Population of sandhill cranes.
YR
CENTROCULAR CRUISE
TRANSECT
AL PLATTE
OCULAR
TRANSECT
RIVER VALLEY, NE PHOTO CORRECTED OCULAR TRANSECT ANNUAL 3-YR AVG
OTHER OTHER
NE KS TX CO1 OK1,2 NM1 WY2
ALL AREAS OCULAR PHOTO CORRECTED CRUISE OCULAR OCULAR TRANSECT
TRANSECT TRANSECT ANNUAL 3-YR AVG
1974 162,600 9,000 1,900 3,200 0 400 0 177,100
223,600 2,300 900 tr 500 100 100 227,500
1976 147,500 2,800 300 800 0 100 1,000 152,500
1977 173,400 1,100 1,600 30,700 0 400 12,500 220,000
1978 149,800 188,582 2,200 700 4,900 0 0 2,300 159,900 198,682
1979 203,574 2,600 1,100 0 500 1,500 0 209,274
223,400 254,417 5,000 4,100 1,400 0 100 500 234,500 265,517
1981 248,882 8,300 11,200 21,800 500 0 0 290,682
1982 347,996 417,263 7,100 2,000 7,800 2,800 0 100 367,796 437,063
1983 306,316 343,378 4,100 200 7,000 0 200 tr 317,816 354,878
1984 222,710 261,802 340,814 18,100 900 800 0 1,100 tr 243,610 282,702 358,214
378,127 514,763 373,314 11,500 3,000 1,200 393,827 530,463 389,348
1986 317,025 353,040 376,535 1,000 200 2,100 320,325 356,340 389,835
1987 383,581 416,058 427,954 0 tr 400 383,981 416,458 434,420
1988 386,853 463,457 410,852 0 0 7,700 394,553 471,157 414,652
1989 391,353 391,995 423,837 100 1,000 800 393,253 393,895 427,170
385,950 412,154 422,535 11,000 5,200 10,300 412,450 438,654 434,569
1991 297,831 340,645 381,598 100 800 200 298,931 341,745 391,431
1992 257,709 406,457 386,419 12,200 300 1,100 271,309 420,057 400,152
1993 253,799 378,883 375,328 16,800 37,750 13,500 321,849 446,933 402,912
1994 395,543 477,215 420,852 14,600 0 0 2,400 410,143 491,815 452,935
273,376 326,181 394,093 30,400 0 0 6,700 303,776 356,581 431,776
1996 318,514 519,984 441,127 7,600 0 0 3,900 326,114 527,584 458,660
1997 350,932 534,630 460,265 16,200 100 0 367,232 550,930 478,365
1998 337,203 530,848 528,487 13,600 100 0 350,903 544,548 541,021
1999 219,794 284,858 450,112 3,500 100,000 0 323,294 388,358 494,612
484,585 490,118 435,275 16,900 26,100 500 528,085 533,618 488,841
2001 387,336 413,498 396,158 10,500 42,300 3,500 443,636 469,798 463,925
2002 309,029 315,044 406,220 17,100 15,100 1,200 5,800 342,429 348,444 450,620
2003 300,918 348,023 358,855 24,800 4,100 3,800 333,618 380,723 399,655
2004 365,370 426,534 363,200 17,700 1,200 2,200 100 386,470 447,634 392,267
412,285 491,915 422,157 27,100 2,900 8,700 2,600 450,985 530,615 452,991
2006 178,564 216,810 378,420 70,000 2,100 5,500 256,164 294,410 424,220
2007 307,094 384,118 364,281 20,400 3,600 5,900 336,994 414,018 413,014
2008 474,051 545,884 382,271 24,500 1,100 0 499,651 571,484 426,637
2009 457,436 565,257 498,420 29,900 tr 10,800 498,136 605,957 530,486
455,104 691,534 600,892 17,600 1,300 28,000 502,004 738,434 638,625
2011 347,501 482,797 579,863 18,800 3,500 14,300 4,700 384,101 519,397 621,263
2012 253,783 339,642 504,658 12,900 tr 4,200 270,883 356,742 538,191
2013 745,854 867,061 563,167 16,080 279 9,740 1,800 771,953 893,160 589,766
2014 402,228 617,903 608,202 24,390 5,996 7,534 239 440,148 655,823 635,242
326,053 386,471 623,812 24,545 4,479 37,121 2,195 392,198 452,616 667,200
2016 272,250 405,716 470,030 11,218 261 16,500 175 300,229 433,695 514,045
2017 436,671 568,369 453,519 18,674 180 9,193 16 464,718 596,416 494,242
2018 2 516,397 1,005,612 659,899 12,137 1,058 23,906 932 3,475 557,905 1,047,120 692,410
2019 2 633,839 945,996 839,992 16,818 2,423 39,460 777 4,140 697,457 1,009,614 884,383 3
1 CO, OK, and NM were eliminated from the Official Survey Area in 1985 by the CF CMU. 11/09/20
2 The 2018 revision to the Management Plan added OK and WY to counts for determination of the percentage of cranes in the Central Platte River Valley. 3 Survey not conducted due to COVID-19 pandemic and associated travel restrictions.
62

Central Flyway Databook 202012/22/2020
Estimated retrieved harvests of Mid-Continent sandhill cranes in the U.S.
YR CO KS MT NM
1975 91 16 911 1976 106 29 858 1977 39 18 1,456 1978 106 36 1,089 1979 129 14 1,170
1980 68 16 1,019 1981 92 11 907 1982 49 21 335 1983 70 28 354 1984 85 15 414 1985 82 7 334 1986 33 1 250 1987 86 15 159 1988 68 18 372 1989 25 33 319
1990 87 44 377 1991 224 31 593 1992 84 103 505 1993 112 602 95 506 1994 143 767 56 357 1995 208 990 156 673 1996 91 933 58 332 1997 168 1,167 45 248 1998 64 1,362 17 258 1999 56 1,275 29 321
2000 363 590 15 311 2001 257 1,033 43 297 2002 294 1,067 23 342
2003 1 230 942 49 617 2004 1 92 856 54 350 2005 1 265 471 65 578 2006 1 96 1,341 12 682 2007 1 149 516 51 427 2008 1 32 453 73 483 2009 1 58 447 34 584
2010 1 115 293 95 432 2011 1 68 908 51 297 2012 1 77 437 30 388 2013 1 47 771 77 326 2014 1 41 176 114 269 2015 1 98 1,005 91 267 2016 1 102 873 111 660 2017 1 280 1,440 85 641 2018 1 102 1,127 73 701 2019 1 131 1,160 82 1326
ND
2,122 52
4,078 2,777 2,733
2,245 2,395 2,469 6,471 4,367 4,650 6,563 5,334 3,815 4,656
6,804 4,580 4,654 6,985 6,235 7,017 6,639 6,545 7,967 5,748
5,081 5,173 2,852 4,564 3,967 3,721 3,906 4,501 4,179 4,436
4,752 3,733 3,019 4,137 2,924 2,133 2,507 3,466 3,424 1,764
OK
142 200 410 389 397
363 397 535 373 433 416 392 957
1,061 1,003
698 604 478 826
1,167 1,091 1,066
600 645 879
552 713 490 200 441 511 538 272 493 737
940 808 401
1,085 390 302 538 559 718
7---
SD
86 12 47 19 19
130 78
212 177 139 101 99 99
100 194
165 128 141 110 239 170 166 189 454 184
374 478 160 166 67
190 202 163 83 96
91 64
185 109 85
6---183 165 119 43
TX
6,123 6,122 6,094 5,720 5,917
6,305 6,245 4,295 5,471 5,811 7,184 5,149 6,117 7,330 7,400
9,865 6,916 6,455 8,769 7,233
10,322 7,816
10,800 9,054 8,469
8,208 6,999 7,837
11,560 8,715
12,446 10,834 12,511 17,169 8,882
12,069 8,493
10,309 14,991 11,740 8,283
18,196 19,559 22,526 29,607
WY
6 14 9
10 0
6 9 0
15 7 2 0 3 8 9
1 3
13 0 4 1
10 4
10 8
10 7
22 7 4
16 20 20 24 8
25 20 41 41 37 28 83
263 33 82
CENTRAL
FLYWAY
9,497 7,393
12,151 10,146 10,379
10,152 10,134 7,916
12,959 11,271 12,776 12,487 12,770 12,772 13,639
18,041 13,079 12,433 18,005 16,201 20,628 17,111 19,766 19,831 16,969
15,504 15,000 13,087 18,335 14,546 18,263 17,631 18,610 22,989 15,282
18,812 14,442 14,887 21,584 15,776 12,207 23,253 26,458 28,823 34,195
AZ 4
20 62 17 23 48
108 127 172 126
114 172 139 113 86
124 114 171 114 92
166 154 197 155 192 227 201 268 138 305
253 151 300 138 151 311 292 435 587 187
OTHER SURVEY AREAS NM 4 AK ² ³ MN 5
1,094 637 471 239 517
809 383
1,160 1,540 1,986 1,197
184 539 318 836 127 1,241 138 545
259 918 235 677 54 640
178 201 153 648 111 812 78 1,205 45 870 55 1,042
101 NA*
100 985 106 936 92 844
162 331 167 435 175 388 245 314 331 596 329 1,249 332 245
421 1,204 830 367 335 765 341 1,360 407 161 930 378 123 1,123 247
7132 --- 212 404 1,036 287 399 793 196 284 705 129 264 659 179
TOTAL
1,094 637 471 239 517
809 403
1,222 1,557 2,009 1,245
831 1,281 1,540
809
1,291 1,084
833 492 887
1,047 1,397 1,086 1,211
193
1,251 1,196 1,133
648 794 790 760
1,195 1,716
882
2,708 1,618 2,408 1,607 1,644
655 2,019 1,823 1,705 1,289
U.S.
TOTAL
10,591 8,030
12,622 10,385 10,896
10,961 10,537 9,138
14,516 13,280 14,021 13,318 14,051 14,312 14,448
19,332 14,163 13,266 18,497 17,088 21,675 18,508 20,852 21,042 17,162
16,755 16,196 14,220 18,983 15,340 19,053 18,391 19,805 24,705 16,164
21,520 16,060 17,295 23,191 17,420 12,862 25,272 28,281 30,528 35,484
AVERAGES:
1975-79 94 23 1,097 1980-89 66 17 446 1990-99 124 1,014 63 417 2000-09 184 772 42 467 2010-19 106 819 81 531 1975-2019 117 852 48 535
2,352 4,297 6,317 4,238 3,186 4,270
308 593 805 495 638 596
37 133 195 198 116 147
5,995 6,131 8,570
10,516 15,577 9,731
8 6 5
14 65 21
9,913 11,688 17,206 16,925 21,044 15,960
78 124 200 281 173
592 192 1,024 127 779 204 632 290 905 363 205 806
592 1,171
952 1,037 1,748 1,156
10,505 12,858 18,159 17,961 22,791 17,116
CURRENT YEAR PERCENT CHANGE FROM:
2018 28% 3% 12% 89% 1975-79 39% 263% 21% 1980-89 99% 397% 197% 1990-99 6% 14% 29% 218% 2000-09 -29% 50% 96% 184% 2010-19 23% 42% 1% 150% 1975-2019 12% 36% 72% 148%
-48% -25% -59% -72% -58% -45% -59%
-64% 17%
-68% -78% -78% -63% -71%
31% 394% 383% 245% 182% 90%
204%
148% 951%
1290% 1419% 494% 26%
291%
19% 245% 193% 99%
102% 62%
114%
-68%
139% 51% -7%
-33% 8%
-7% -7% 39% 11%
38% -36% 108% -15% 29% 4% -9% -27% -51% 29% -18%
-24% 118% 10% 35% 24%
-26% 11%
16% 238% 176% 95% 98% 56%
107% ¹ Preliminary K.L. Kruse S:\CF_D\projects\speciesandpopulations\sandhillcranes\Status Reports\Shcranerep.xls 11/10/20
² A proportion of the Alaskan harvest is composed of lesser sandhill cranes from the Pacific Coast Population ³ Harvest data are from state harvest surveys for only the MCP portion of the state, except in 1977-81, 1986, 1991, and 1998-99 where
federal MQS state totals are prorated by the long-term percent MC cranes; data from 2000 forward are MC portion from HIP. 4 The MC harvest for AZ and NM represents MC sandhill cranes that were harvested in RMP areas and are not represented in the CF MC Sandhill Crane Federal Harvest Survey 5 Minnesota initiated a hunt in the NW portion of state. 6 All hunters put in stratum "did not hunt" or "no" in state HIP sample frame, so no estimate is available. 7 HIP sample frame from state was incomplete, so no estimate was calculated. * No estimate is available.
63

Central Flyway Databook 202012/22/2020
Annual sport hunting mortality estimates for the Mid-Continent Population of sandhill cranes in North America.
SPORT HUNTING MORTALITY Retrieved
Central Other Survey Unretrieved YR Flyway Total Canada Mexico² No. Am.³
1975 9,497 1,094 5,906 1,650 3,615 1976 7,393 637 1,636 967 2,032 1977 12,151 471 367 1,299 2,440 1978 10,146 239 877 1,126 2,308 1979 10,379 517 3,799 1,470 2,807
1980 10,152 809 5,589 1,655 3,351 1981 10,134 403 2,966 1,350 2,724 1982 7,916 1,222 2,834 1,197 2,451 1983 12,959 1,557 3,088 1,760 3,501 1984 11,271 2,009 3,703 1,698 3,372 1985 12,776 1,245 5,139 1,916 3,520 1986 12,487 831 6,114 1,943 3,648 1987 12,770 1,281 5,144 1,920 3,379 1988 12,772 1,540 6,948 2,126 3,751 1989 13,639 809 4,975 1,942 3,626
1990 18,041 1,291 4,835 2,417 4,228 1991 13,079 1,084 5,318 1,948 3,438 1992 12,433 833 5,939 1,921 3,198 1993 18,005 492 2,915 2,141 3,362 1994 16,201 887 3,830 2,092 3,038 1995 20,628 1,047 5,827 2,750 4,161 1996 17,111 1,397 4,312 2,282 3,609 1997 19,766 1,086 5,900 2,675 4,211 1998 19,831 1,211 9,526 3,057 4,901 1999 16,969 193 4 8,400 2,556 3,947
2000 15,504 1,251 9,450 2,621 4,093 2001 15,000 1,196 8,786 2,498 4,013 2002 13,087 1,133 7,947 2,217 3,446
2003 1 18,335 648 9,585 2,857 4,246 2004 1 14,546 794 11,037 2,638 4,165 2005 1 18,263 790 9,876 2,893 4,512 2006 1 17,631 760 10,417 2,881 4,864 2007 1 18,610 1,195 11,786 3,159 4,904 2008 1 22,989 1,716 9,439 3,414 4,432 2009 1 15,282 882 4,165 2,033 3,100
2010 1 18,812 2,708 7,331 2,885 4,400 2011 1 14,442 1,618 10,431 2,649 4,006 2012 1 14,887 2,408 5,041 2,234 3,397 2013 1 21,584 1,607 9,883 3,307 4,188 2014 1 15,776 1,644 12,812 3,023 4,521 20151,5 12,207 655 10,604 2,347 3,652 2016 1 23,253 2,019 11,502 3,677 4,460 2017 1 26,458 1,823 13,442 4,172 5,527 2018 1 28,823 1,705 13,006 4,353 5,207 20191,6 34,195 1,289
Total
21,762 12,665 16,728 14,697 18,972
21,556 17,577 15,620 22,865 22,053 24,596 25,023 24,493 27,137 24,992
30,811 24,867 24,323 26,915 26,048 34,413 28,711 33,638 38,526 32,065
32,919 31,493 27,830 35,671 33,179 36,334 36,552 39,654 41,990 25,462
36,136 33,146 27,966 40,570 37,776 29,465 44,911 51,423 53,094
AVERAGES:
1975-79 9,913 592 2,517 1,302 2,641 1980-89 11,688 1,171 4,650 1,751 3,332 1990-99 17,206 1,036 5,680 2,384 3,809 2000-09 16,925 1,037 9,249 2,721 4,177 2010-19 21,044 1,748 10,450 3,183 4,373 1975-2019 15,960 1,178 6,873 2,357 3,767
16,965 22,591 30,032 34,108 39,387 29,696
CURRENT YEAR PERCENT CHANGE FROM:
2018 19% -24% 1975-79 245% 118% 1980-89 193% 10% 1990-99 99% 24% 2000-09 102% 24% 2010-19 62% -26% 1975-2019 114% 9%
¹ Preliminary 11/10/20
² Unknown harvests (Mexico) were assumed to be 10% of harvests in the U.S. and Canada.
³ Unretrieved kill as reported by hunters is used for the Central Flyway; for the remainder of harvest areas, it is assumed to be
20% of retrieved harvests. 4 There is no estimate available for AK in that year. 5 Estimates (except Canada) biased low because of HIP sampling issues in SD and AK that resulted in estimates of zero harvest for each. 6 Estimates for Canada, Mexico, North America, and Total not calculated because data for Canada was not available.
64

Spring population indices for Rocky Mountain sandhill cranes, 1984-96.
SAN LUIS VALLEY, COLORADO
YR UT CO ID WY MT TOTAL 3-YR AVG
1987 1,578 1,443 10,686 2,327 1,447 17,481
1992 2,810 3,181 5,801 2,248 5,264 19,304
1995 1,528 2,284 6,864 1,671 3,681 16,028
1996 1,849 1,255 8,334 2,526 2,974 16,938 19971, 2 2,450 1,604 8,132 2,255 3,595 18,036 17,001
1998 2,185 1,273 8,067 3,162 3,415 18,102 17,692
1999 2,292 1,102 8,761 4,205 3,141 19,501 18,546
2000 2,416 749 9,337 3,890 3,598 19,990 19,198
2001 1,522 666 7,160 2,626 4,585 16,559 18,683
2002 1,869 1,355 7,698 3,038 4,843 18,803 18,451
2003 2,546 745 7,822 3,446 4,964 19,523 18,295
2004 2,239 1,410 7,152 3,072 4,637 18,510 18,945
2005 2,646 1,052 7,668 3,911 5,588 20,865 19,633 2006 3 NS 19,633 2007 4 2,401 1,743 8,262 3,907 6,509 22,822 20,732 2008 5 3,708 1,080 6,123 3,826 6,419 21,156 21,614
2009 2,283 1,162 6,934 3,613 6,329 20,321 21,433
2010 3,242 985 5,776 3,726 7,335 21,064 20,847
2011 1,498 1,347 5,029 2,978 6,642 17,494 19,626
2012 2,109 413 3,432 3,587 5,876 15,417 17,992 2013 2,732 1,594 5,228 3,588 7,218 20,360 17,757 2014 2,783 1,258 6,064 3,008 6,555 19,668 18,482 2015 3,698 1,089 6,454 3,596 9,493 24,330 21,453
2016 6 3,298 1,135 5,445 4,879 7,507 22,264 22,087 2017 2,994 1,658 4,066 3,725 7,149 19,592 22,062 2018 2,770 1,908 4,469 5,101 7,553 21,801 21,219 2019 3,106 1,879 4,428 4,366 7,511 21,290 20,894
Central Flyway Databook 202012/22/2020
RAW ADJ. FOR ADJ. FOR OTHER COUNT EST. BIAS¹ REM. LES.² AREAS INDEX
SURVEY
COND.YR
1984 10,962 14,488 13,562 550 14,112 POOR 1985 18,393 21,773 20,382 0 20,382 GOOD 1986 14,031 14,031 13,135 20 13,155 POOR 1987 13,561 15,661 14,660 0 14,660 POOR 1988 17,510 17,510 16,381 22 16,403 POOR 1989 17,302 18,389 17,004 0 17,004 GOOD 1990 20,851 24,593 21,221 275 21,496 GOOD 1991 19,990 18,405 16,045 175 16,220 GOOD 1992 23,516 23,516 19,999 9 20,008 GROUND 1993 17,576 17,576 16,478 1,260 17,738 POOR 1994 17,229 16,036 15,063 203 15,266 FAIR 1995 25,276 23,390 20,229 0 20,229 GOOD 1996 23,019 26,379 22,737 1,010 23,747 GOOD
¹ Raw estimate adjusted by photography for estimation bias. ² Population estimate adjusted to remove the number of lesser sandhill cranes (non-RMP cranes).
Fall pre-migration population indices for Rocky Mountain sandhill cranes.
1 Incomplete survey efforts in years prior might have resulted in lower estimates; the official count begins in 11/10/20 2 In October 1997, a special survey was also conducted in the SLV, Colorado and other areas, which resulted in a total
of 27,090 Rocky Mountain and Mid-Continent cranes being counted. 3 In 2006, the survey was not conducted due to mechanical issues with the survey plane. The 3-yr Avg for 2006 is calculated using 2003-05. 4 The 3-yr average for 2007 was calculated using 2004, 2005, and 2007 because there was no survey in 2006. 5 The 3-yr average for 2008 was calculated using 2005, 2007, and 2008 because there was no survey in 2006. 6 Beginning 1n 2016 Wyoming added six new survey areas as allowed in the management plan.
65

Central Flyway Databook 202012/22/2020
Estimated retrieved harvests of the Rocky Mountain Population of sandhill cranes.
YR UT NM AZ
1981 20 1982 9 1983 35 1984 33 1985 40 1986 23 1987 60 1988 310 40 1989 54 483 51
1990 35 79 9 1991 48 47 44 1992 0 147 39 1993 28 297 61 1994 34 416 27 1995 27 270 33 1996 32 236 27 1997 30 114 22 1998 34 180 37 1999 54 198 21
2000 69 257 37 2001 77 288 26 2002 60 164 42 2003 57 169 34 2004 53 189 35 2005 62 236 50 2006 87 327 10 2007 103 276 43 2008 101 379 24 2009 149 603 67
2010 190 547 56 2011 3 149 522 37 2012 3 91 417 85 2013 3 95 241 38 2014 73 183 20 2015 86 145 67 2016 72 453 74 2017 189 395 68 2018 203 623 102 2019 130 456 38
WY
143 154 101 138 195 190 128 125
58 101 168 115 150 77 84 82 93
124
163 142 132 72
124 116 194 138 162 195
182 166 134 74 94
104 158 193 189 141
MT
42 45 40 41 49 62 59 71
91 87 51 50 51 49 54 73 85
124
108 90
129 94
121 137 140 150 154 179
ID
20 136 135 190
193 278 194 146 142 189 235 187 185 254
253 293 275 135 134 166 258 198 253 166
TOTAL
20 152 189 134 178 218 250 478 713
181 240 396 546 667 448 448 446 538 658 ¹
810 ² 898 643 528 594 702 907 820 936
1,392
1,336 1,257 1,131
677 625 705
1,155 1,193 1,524 1,110
AVERAGES:
1981-89 397 35 1990-99 32 198 32 2000-09 82 289 37 2010-19 128 398 59 1981-2019 80 301 41
147 105 144 144 134
51 72
130 87
120 200 213 192
259 457 823
1,071 663
CURRENT YEAR PERCENT CHANGE FROM:
2018 -36% -27% -63% 1981-89 15% 10% 1990-99 304% 130% 19% 2000-09 59% 58% 3% 2010-2019 2% 15% -35% 1981-2019 63% 51% -6%
-25% -4% 34% -2% -2% 5%
16%
250% 150% 37%
107%
-34%
38% -17% -22% -14%
-27% 328% 143% 35% 4%
68%
¹ RMP Sandill cranes (40) were also taken as part of research project in the San Luis Valley, CO
² RMP Sandill cranes (20) were also taken as part of research project in the San Luis Valley, CO
Harvest includes crippling loss.
66
3
11/10/20

CENTRAL FLYWAY
FRAMEWORKS
12/22/2020 67 Central Flyway Databook 2020

Central Flyway Databook 202012/22/2020
SU
MM
AR
Y O
F C
EN
TR
AL
FL
YW
AY
FR
AM
EW
OR
KS
FO
R R
EG
UL
AR
CA
NA
DA
GO
OS
E S
EA
SO
NS
, 20
15-2
024
2015
20
16
2017
20
18
2019
20
20
2021
EA
ST
TIE
R S
TA
TE
S -
ND
, S
D,
NE
, K
S,
OK
, &
Eas
tern
Go
ose
Zo
ne
of
TX
2022
20
23
2024
Beg
inni
ng
1/2
hr.
1/2
hr.
1/2
hr.
1/2
hr.
1/2
hr.
1/2
hr.
Sho
otin
g be
fore
be
fore
be
fore
be
fore
be
fore
be
fore
Tim
e su
nris
e su
nris
e su
nris
e su
nris
e su
nris
e su
nris
e
End
ing
Sho
otin
g S
unse
t S
unse
t S
unse
t S
unse
t S
unse
t S
unse
t
Tim
e
Ear
liest
Ope
ning
S
epte
mbe
r 26
S
epte
mbe
r 24
S
epte
mbe
r 23
S
epte
mbe
r 22
S
epte
mbe
r 21
S
epte
mbe
r 26
Dat
e
Late
st
Clo
sing
F
ebru
ary
14
Feb
ruar
y 12
F
ebru
ary
18
Feb
ruar
y 17
F
ebru
ary
16
Feb
ruar
y 14
Dat
e
Sea
son
Leng
th
107
107
107
107
107
107
Dai
ly B
ag/
8/24
8/
24
8/24
8/
24
8/24
8/
24
Pos
sess
ion
68
WE
ST
TIE
R S
TA
TE
S -
MT
, W
Y,
CO
, N
M,
& W
este
rn G
oo
se Z
on
e o
f T
X
Beg
inni
ng
1/2
hr.
1/2
hr.
1/2
hr.
1/2
hr.
1/2
hr.
Sho
otin
g be
fore
be
fore
be
fore
be
fore
be
fore
Tim
e su
nris
e su
nris
e su
nris
e su
nris
e su
nris
e
1/2
hr.
befo
re
sunr
ise
End
ing
Sho
otin
g S
unse
t S
unse
t S
unse
t S
unse
t S
unse
t S
unse
t
Tim
e
Ear
liest
Ope
ning
S
epte
mbe
r 26
S
epte
mbe
r 24
S
epte
mbe
r 23
S
epte
mbe
r 22
S
epte
mbe
r 26
Dat
e
Sep
tem
ber
21
Late
st
Clo
sing
F
ebru
ary
14
Feb
ruar
y 12
F
ebru
ary
18
Feb
ruar
y 17
F
ebru
ary
16
Feb
ruar
y 14
Dat
e
Sea
son
Leng
th 1
107/
95
107/
95
107/
95
107/
95
107/
95
107/
95
Dai
ly B
ag/
5/15
5/
15
5/15
5/
15
5/15
5/
15
Pos
sess
ion
1 M
T,
WY
, C
O,
NM
/Wes
tern
Goo
se Z
one
of T
X.
10-N
ov-2
0
S:\
CD
_D\E
XC
EL\
RE
GU
LAT
ION
S\F
RA
ME
WO
RK
S\C
AG
Ofr
amea
ll.xl
s

Central Flyway Databook 202012/22/2020
SU
MM
AR
Y O
F C
EN
TR
AL
FL
YW
AY
FR
AM
EW
OR
KS
FO
R L
IGH
T G
OO
SE
HU
NT
ING
, 20
15-2
024
2015
20
16
2017
20
18
2019
20
20
EA
ST
TIE
R S
TA
TE
S -
ND
, S
D,
NE
, K
S,
OK
, &
Eas
tern
Go
ose
Zo
ne
of
TX
2021
20
22
2023
20
24
Beg
inni
ng
1/2
hr.
1/2
hr.
1/2
hr.
1/2
hr.
1/2
hr.
1/2
hr.
Sho
otin
g be
fore
be
fore
be
fore
be
fore
be
fore
be
fore
Tim
e su
nris
e su
nris
e su
nris
e su
nris
e su
nris
e su
nris
e
End
ing
Sho
otin
g S
unse
t S
unse
t S
unse
t S
unse
t S
unse
t S
unse
t
Tim
e
Ear
liest
Ope
ning
S
epte
mbe
r 26
S
epte
mbe
r 24
S
epte
mbe
r 23
S
epte
mbe
r 22
S
epte
mbe
r 21
S
epte
mbe
r 26
Dat
e
Late
st
Clo
sing
M
arch
10
Mar
ch 1
0 M
arch
10
Mar
ch 1
0 M
arch
10
Mar
ch 1
0
Dat
e
Sea
son
Leng
th
107
107
107
107
107
107
Dai
ly B
ag/
50/N
one
50/N
one
50/N
one
50/N
one
50/N
one
50/N
one
Pos
sess
ion
69
WE
ST
TIE
R S
TA
TE
S -
MT
, W
Y,
CO
, N
M,
& W
este
rn G
oo
se Z
on
e o
f T
X
Beg
inni
ng
1/2
hr.
1/2
hr.
1/2
hr.
1/2
hr.
1/2
hr.
Sho
otin
g be
fore
be
fore
be
fore
be
fore
be
fore
Tim
e su
nris
e su
nris
e su
nris
e su
nris
e su
nris
e
1/2
hr.
befo
re
sunr
ise
End
ing
Sho
otin
g S
unse
t S
unse
t S
unse
t S
unse
t S
unse
t S
unse
t
Tim
e
Ear
liest
Ope
ning
S
epte
mbe
r 26
S
epte
mbe
r 24
S
epte
mbe
r 23
S
epte
mbe
r 22
S
epte
mbe
r 26
Dat
e
Sep
tem
ber
21
Late
st
Clo
sing
M
arch
10
Mar
ch 1
0 M
arch
10
Mar
ch 1
0 M
arch
10
Mar
ch 1
0
Dat
e
Sea
son
Leng
th
107
107
107
107
107
107
Dai
ly B
ag/
50/N
one
50/N
one
50/N
one
50/N
one
50/N
one
50/N
one
Pos
sess
ion
10-N
ov-2
0
S:\
CD
_D\E
XC
EL\
RE
GU
LAT
ION
S\F
RA
ME
WO
RK
S\lt
efra
mea
ll.xl
s

Central Flyway Databook 202012/22/2020
19
70
19
80
19
90
20
00
20
10
20
20
70
U.S
. F
eder
al F
ram
ewo
rks
for
the
Hu
nti
ng
of
Lig
ht
Gee
se 1
961-
2020
P
AC
IFIC
FL
YW
AY
¹
CE
NT
RA
L F
LY
WA
Y
²
MIS
SIS
SIP
PI F
LY
WA
Y
AT
LA
NT
IC F
LY
WA
Y
BA
G/P
OS
S
WE
ST
TIE
R S
TA
TE
S
EA
ST
TIE
R S
TA
TE
S
YE
AR
O
PE
N
CLO
SE
D
AY
S
SN
OW
S
RO
SS
' O
PE
N
CLO
SE
D
AY
S
BA
G/P
OS
S
OP
EN
C
LOS
E
DA
YS
B
AG
/PO
SS
O
PE
N
CLO
SE
D
AY
S
BA
G/P
OS
S
OP
EN
C
LOS
E
DA
YS
B
AG
/PO
SS
19
61
1
96
2
19
63
1
96
4
19
65
19
66
1
96
7
19
68
1
96
9
19
71
1
97
2
19
73
1
97
4
19
75
19
76
1
97
7
19
78
1
97
9
19
81
1
98
2
19
83
1
98
4
19
85
19
86
1
98
7
19
88
1
98
9
19
91
1
99
2
19
93
1
99
4
19
95
19
96
1
99
7
19
98
1
99
9
20
01
2
00
2
20
03
2
00
4
20
05
20
06
2
00
7
20
08
2
00
9
20
11
2
01
2
20
13
2
01
4
20
15
20
16
2
01
7
20
18
2
01
9
Oct
7
Jan
7
75
6
/6
Clo
sed
³
Oct
6
Jan
6
75
6
/6
Clo
sed
³
Oct
5
Jan
5
90
6
/6
1/1
O
ct 1
0
Jan
10
9
0
6/6
1
/1
Oct
9
Jan
9
90
6
/6
1/1
Oct
8
Jan
8
90
6
/6
1/1
O
ct 7
Ja
n 1
4
90
6
/6
1/1
O
ct 5
Ja
n 1
2
93
6
/6
1/1
O
ct 4
Ja
n 1
1
93
6
/6
1/1
O
ct 3
Ja
n 1
7
93
6
/6
1/1
Oct
2
Jan
16
9
3
6/6
1
/1
Oct
1
Jan
20
9
3
6/6
1
/1
Se
p 2
9
Jan
20
9
3
6/6
1
/1
Se
p 2
8
Jan
19
9
3
6/6
1
/1
Oct
4
Jan
18
9
3
3/6
1
/1
Oct
2
Jan
23
9
3
3/6
1
/1
Oct
1
Jan
22
9
3
3/6
1
/1
Se
p 3
0
Jan
21
9
3
3/6
1
/1
Se
p 2
9
Jan
20
9
3
3/6
3
/6O
ct 4
Ja
n 1
8
93
3
/6
3/6
Oct
3
Jan
17
9
3
3/6
3
/6
Oct
2
Jan
23
9
3
3/6
3
/6
Oct
1
Jan
22
9
3
3/6
3
/6
Se
p 2
9
Jan
20
9
3
3/6
3
/6
Se
p 2
8
Jan
19
9
3
3/6
3
/6
Oct
4
Jan
18
9
3
3/6
3
/6
Oct
3
Jan
17
9
3
3/6
3
/6
Oct
1
Jan
22
9
3
3/6
3
/6
Se
p 3
0
Jan
21
9
3
3/6
3
/6
Se
p 2
9
Jan
20
9
3
3/6
3
/6
Se
p 2
8
Jan
19
9
3
3/6
3
/6
Oct
3
Jan
17
9
3
3/6
3
/6
Oct
2
Jan
23
1
00
3
/6
3/6
O
ct 1
Ja
n 2
0
10
0
3/6
3
/6
Oct
1
Jan
21
1
00
3
/6
3/6
Se
p 2
9
Jan
19
1
00
3
/6
3/6
O
ct 0
4
Jan
18
1
00
3
/6
3/6
O
ct 0
3
Jan
17
1
00
3
/6
3/6
Oct
02
Ja
n 2
3
10
0
3/6
3
/6S
ep
30
Ja
n 2
1
10
0
3/6
3
/6
Se
p 2
9
Jan
20
1
00
3
/6
3/6
S
ep
21
Ja
n 1
9
10
0
3/6
3
/6
Oct
04
Ja
n 2
5
27
1
00
3
/6
3/6
S
ep
25
Ja
n 3
0
27
1
00
3
/6
3/6
O
ct 0
1
Jan
29
2
7
10
0
4/8
4
/8
Se
p 3
0
Jan
28
2
7
10
0
4/8
4
/8
Se
p 2
9
Jan
27
2
7
10
0
4/8
4
/8
Oct
04
M
ar
10
2
8
10
7
6/1
2
6/1
2
Oct
03
M
ar
10
2
8
10
7
6/1
2
6/1
2
Oct
02
M
ar
10
2
8
10
7
6/1
2
6/1
2
Oct
01
M
ar
10
2
8
10
7
6/1
2
6/1
2
Se
p 2
9
Ma
r 1
0
28
1
07
6
/12
6
/12
S
ep
28
M
ar
10
2
8
10
7
6/1
8
6/1
8
Se
p 2
7
Ma
r 1
0
28
1
07
2
0/6
0
20
/60
S
ep
26
M
ar
10
1
07
2
0/6
0
20
/60
Se
p 2
4
Ma
r 1
0
10
7
20
/60
2
0/6
0
Se
p 2
3
Ma
r 1
0
10
7
20
/60
2
0/6
0
Se
p 2
2
Ma
r 1
0
10
7
20
/60
2
0/6
0
Se
p 2
1
Ma
r 1
0
10
7
20
/60
2
0/6
0
Se
p 2
6
Ma
r 1
0
10
7
20
/60
2
0/6
0
Oct
01
Ja
n 0
8
60
5
/5
3,4
,6
Oct
06
Ja
n 0
6
75
5
/5
3,6
O
ct 0
5
Jan
05
9
0
5/5
5
,6
Oct
10
Ja
n 1
0
90
5
/5
5,6
O
ct 0
1
Jan
15
7
5
5/5
5
,6
Oct
01
Ja
n 1
5
75
5
/5
5,6
Se
p 3
0
Jan
14
7
5
5/5
5
,6
Oct
01
Ja
n 1
5
75
2
/2
5,6
O
ct 0
1
Jan
15
8
6
2/4
5
,6
Oct
01
Ja
n 1
7
90
2
/4
5,6
Oct
01
Ja
n 1
6
90
2
/4
5,6
Oct
01
Ja
n 2
4
93
2
/4
5,6
S
ep
29
Ja
n 2
0
93
2
/4
5,6
S
ep
28
Ja
n 1
9
93
2
/4
5,6
O
ct 0
4
Jan
18
9
3
2/4
5
,6
Oct
02
Ja
n 2
3
93
2
/4
5,6
,9
Oct
01
Ja
n 2
2
93
2
/4
5,6
,9
Se
p 3
0
Jan
21
9
3
2/4
5
,6,9
S
ep
29
Ja
n 2
0
93
2
/4
6,9
Oct
04
Ja
n 1
8
8 9
3
2/4
6
,10
Oct
03
Ja
n 1
7
8 9
3
2/4
6
,10
Oct
02
Ja
n 2
3
8 9
3
2/4
6
,10
O
ct 0
1
Jan
22
8
93
2
/4
6,1
0
Se
p 2
9
Fe
b 1
2
8 9
3
2/4
6
,10
S
ep
28
F
eb
16
1
1
93
5
/10
Oct
04
F
eb
15
1
1
93
5
/10
O
ct 0
3
Fe
b 1
4
11
9
3
5/1
0
Oct
01
F
eb
14
1
1
95
5
/10
S
ep
30
F
eb
18
1
1
95
5
/10
S
ep
29
F
eb
17
1
1
10
0
5/1
0
Se
p 2
8
Fe
b 1
6
11
1
07
5
/10
O
ct 0
3
Fe
b 1
4
11
1
07
5
/10
O
ct 0
2
Fe
b 1
3
11
1
07
5
/10
O
ct 0
1
Fe
b 2
8
12
1
07
5
/10
S
ep
30
M
ar
10
1
7
10
7
5/1
0
Se
p 2
8
Ma
r 1
0
10
7
10
/40
O
ct 0
4
Ma
r 1
0
10
7
10
/40
O
ct 0
3
Ma
r 1
0
10
7
20
/no
ne
Oct
02
M
ar
10
1
07
2
0/n
on
eS
ep
30
M
ar
10
1
07
2
0/n
on
e
Se
p 2
9
Ma
r 1
0
10
7
20
/no
ne
S
ep
21
M
ar
10
1
07
2
0/n
on
e
Se
p 2
7
Ma
r 1
0
10
7
20
/no
ne
S
ep
25
M
ar
10
1
07
2
0/n
on
e
Se
p 2
4
Ma
r 1
0
10
7
20
/no
ne
Se
p 2
3
Ma
r 1
0
10
7
20
/no
ne
S
ep
22
M
ar
10
1
07
2
0/n
on
e
Se
p 2
7
Ma
r 1
0
10
7
20
/no
ne
S
ep
26
M
ar
10
1
07
2
0/n
on
e
Se
p 2
5
Ma
r 1
0
10
7
20
/no
ne
Se
p 2
4
Ma
r 1
0
10
7
20
/no
ne
S
ep
22
M
ar
10
1
07
2
0/n
on
e
Se
p 2
1
Ma
r 1
0
10
7
50
/no
ne
S
ep
27
M
ar
10
1
07
5
0/n
on
e
Se
p 2
6
Ma
r 1
0
10
7
50
/no
ne
Se
p 2
4
Ma
r 1
0
10
7
50
/no
ne
S
ep
23
M
ar
10
1
07
5
0/n
on
e
Se
p 2
2
Ma
r 1
0
10
7
50
/no
ne
S
ep
21
M
ar
10
1
07
5
0/n
on
e
Se
p 2
6
Ma
r 1
0
10
7
50
/no
ne
Oct
0
1
Jan
08
6
0
5/5
3
,6
Oct
0
1
Jan
13
7
5
5/5
3
,6
Oct
0
1
Jan
15
7
5
5/5
5
,6
Oct
0
1
Jan
15
7
5
5/5
5
,6
Oct
0
1
Jan
15
7
5
5/5
5
,6
Oct
0
1
Jan
15
7
5
5/5
5
,6
Se
p 3
0
Jan
14
7
5
5/5
5
,6
Oct
0
1
Jan
15
7
5
5/5
5
,6
Oct
0
1
Jan
15
8
6
5/5
5
,6
Oct
0
1
Jan
17
7
5
5/5
5
,6
Oct
0
1
Jan
16
7
5
5/5
5
,6
Oct
0
1
Jan
24
7
2
4/4
5
,6
Se
p
29
Ja
n 2
0
72
5
/5
5,6
S
ep
28
Ja
n 1
9
72
5
/5
5,6
O
ct 0
4
Jan
18
7
2
5/5
5
, 6
Oct
02
Ja
n 2
3
72
5
/5
5
Oct
01
Ja
n 2
2
86
5
/5
5 S
ep
30
Ja
n 2
1
86
5
/5
5 S
ep
29
Ja
n 2
0
86
5
/5
Oct
04
Ja
n 1
8
86
5
/10
Oct
03
Ja
n 1
7
86
5
/10
O
ct 0
2
Jan
23
8
6
5/1
0
Oct
01
Ja
n 2
2
86
5
/10
S
ep
29
F
eb
12
8
6
5/1
0
Se
p 2
8
Fe
b 1
6
86
5
/10
Oct
04
F
eb
15
8
6
5/1
0
Oct
03
F
eb
14
8
6
5/1
0
Oct
01
F
eb
14
8
6
5/1
0
Se
p 3
0
Fe
b 1
8
10
0
5/1
0
Se
p 2
9
Fe
b 1
7
86
;10
0
5/1
0;7
/14
Se
p 2
8
Fe
b 1
6
86
;10
0
5/1
0;7
/14
O
ct 0
3
Fe
b 1
4
10
7
10
/20
O
ct 0
2
Fe
b 1
3
10
7
10
/20
O
ct 0
1
Fe
b 2
8
7 1
07
1
0/2
0
Se
p 3
0
Ma
r 1
0
13
1
07
1
0/2
0
Se
p 2
8
Ma
r 1
0
14
1
07
1
0/4
0
Oct
04
M
ar
10
1
4
10
7
10
/40
O
ct 0
3
Ma
r 1
0
15
1
07
2
0/n
on
e
Oct
02
M
ar
10
1
5
10
7
20
/no
ne
S
ep
30
M
ar
10
1
5
10
7
20
/no
ne
Se
p 2
9
Ma
r 1
0
10
7
20
/no
ne
S
ep
21
M
ar
10
1
07
2
0/n
on
e
Se
p 2
7
Ma
r 1
0
10
7
20
/no
ne
S
ep
25
M
ar
10
1
07
2
0/n
on
e
Se
p 2
4
Ma
r 1
0
10
7
20
/no
ne
Se
p 2
3
Ma
r 1
0
10
7
20
/no
ne
S
ep
22
M
ar
10
1
07
2
0/n
on
e
Se
p 2
7
Ma
r 1
0
10
7
20
/no
ne
S
ep
26
M
ar
10
1
07
2
0/n
on
e
Se
p 2
5
Ma
r 1
0
10
7
20
/no
ne
Se
p 2
4
Ma
r 1
0
10
7
20
/no
ne
S
ep
22
M
ar
10
1
07
2
0/n
on
e
Se
p 2
1
Ma
r 1
0
10
7
50
/no
ne
S
ep
27
M
ar
10
1
07
5
0/n
on
e
Se
p 2
6
Ma
r 1
0
10
7
50
/no
ne
Se
p 2
4
Ma
r 1
0
10
7
50
/no
ne
S
ep
23
M
ar
10
1
07
5
0/n
on
e
Se
p 2
2
Ma
r 1
0
10
7
50
/no
ne
S
ep
21
M
ar
10
1
07
5
0/n
on
e
Se
p 2
6
Ma
r 1
0
10
7
50
/no
ne
Oct
01
Ja
n 0
8
60
5
/5
18
O
ct 0
1
Jan
13
6
0
5/5
1
8
Oct
01
Ja
n 1
5
70
5
/5
18
O
ct 0
1
Jan
15
7
0
5/5
1
8
Oct
01
Ja
n 1
5
70
5
/5
18
Oct
01
Ja
n 1
5
70
5
/5
18
Se
p 3
0
Jan
14
7
0
5/5
1
8
Se
p 2
8
Jan
12
7
0
5/5
1
8
Se
p 2
7
Jan
11
2
1
70
5
/5
18
O
ct 0
1
Jan
24
2
1
70
5
/5
18
Oct
01
Ja
n 2
3
23
7
0
5/5
1
8
Oct
01
Ja
n 2
0
23
7
0
5/5
1
8
Oct
01
Ja
n 2
0
23
7
0
5/5
1
8
Oct
01
Ja
n 2
0
23
7
0
5/5
1
8
Oct
01
Ja
n 2
0
23
7
0
5/5
1
8
Oct
01
Ja
n 2
0
23
7
0
5/5
1
8
Oct
01
Ja
n 2
0
23
7
0
5/5
1
8
Oct
01
Ja
n 2
0
23
7
0
5/5
1
8
Se
p 2
9
Jan
20
2
3
70
5
/5
18
O
ct 0
4
Jan
20
2
3
70
5
/10
1
8
Oct
03
Ja
n 2
0
23
7
0
5/1
0
18
Oct
02
Ja
n 2
0
23
7
0
5/1
0
18
O
ct 0
1
Jan
20
2
3
70
5
/10
1
8
Se
p 2
9
Jan
20
2
3
70
5
/10
1
8
Se
p 2
8
Jan
20
2
3
70
5
/10
1
8
Oct
04
Ja
n 2
0
19
,22
7
0
5/1
0
18
Oct
03
Ja
n 1
7
19
,22
7
0
5/1
0
18
O
ct 0
1
Jan
22
2
3,2
4
70
5
/10
1
8
Se
p 3
0
Jan
21
2
3,2
4
80
7
/14
1
8
Se
p 2
9
Jan
20
2
3,2
4
80
7
/14
1
8
Se
p 2
8
Jan
31
2
3
80
7
/14
1
8
Oct
03
Ja
n 3
1
23
8
0
7/1
4
18
O
ct 0
2
Fe
b 1
4
80
7
/14
1
8
Oct
01
F
eb
14
1
07
7
/14
1
8
Oct
01
F
eb
14
2
5
10
7
10
/20
1
8
Se
p 2
8
Ma
r 1
0
10
7
10
/30
O
ct 0
4
Ma
r 1
0
10
7
10
/30
O
ct 0
3
Ma
r 1
0
10
7
20
/no
ne
O
ct 0
2
Ma
r 1
0
10
7
20
/no
ne
S
ep
30
M
ar
10
1
07
2
0/n
on
e
Se
p 2
9
Ma
r 1
0
10
7
20
/no
ne
S
ep
21
M
ar
10
1
07
2
0/n
on
e
Se
p 2
7
Ma
r 1
0
10
7
20
/no
ne
S
ep
25
M
ar
10
1
07
2
0/n
on
e
Se
p 2
4
Ma
r 1
0
10
7
20
/no
ne
Se
p 2
3
Ma
r 1
0
10
7
20
/no
ne
S
ep
22
M
ar
10
1
07
2
0/n
on
e
Se
p 2
7
Ma
r 1
0
10
7
20
/no
ne
S
ep
26
M
ar
10
1
07
2
0/n
on
e
Se
p 2
5
Ma
r 1
0
10
7
20
/no
ne
Se
p 2
4
Ma
r 1
0
10
7
20
/no
ne
S
ep
22
M
ar
10
1
07
2
0/n
on
e
Se
p 2
1
Ma
r 1
0
10
7
20
/no
ne
S
ep
27
M
ar
10
1
07
2
0/n
on
e
Se
p 2
6
Ma
r 1
0
10
7
20
/no
ne
Se
p 0
1
Fe
b 1
5
10
7
20
/no
ne
S
ep
01
F
eb
15
1
07
2
0/n
on
e
Se
p 0
1
Fe
b 1
5
10
7
20
/no
ne
S
ep
01
F
eb
15
1
07
2
0/n
on
e
Se
p 0
1
Fe
b 1
5
10
7
20
/no
ne
Clo
sed
pri
or
to 1
97
5
Oct
1
Jan
31
3
0
2/4
Oct
1
Jan
31
3
0
2/4
O
ct 1
Ja
n 3
1
60
2
/4
Oct
1
Jan
31
7
0
2/4
O
ct 1
Ja
n 3
1
70
4
/8
Oct
1
Jan
31
7
0
4/8
Oct
1
Jan
31
9
0
4/8
O
ct 1
Ja
n 3
1
90
4
/8
Oct
1
Jan
31
9
0
4/8
O
ct 1
Ja
n 3
1
90
4
/8
Oct
1
Jan
31
9
0
4/8
Oct
1
Jan
31
9
0
4/8
O
ct 1
Ja
n 3
1
90
4
/8
Oct
1
Jan
31
9
0
4/8
O
ct 1
Ja
n 3
1
90
5
/10
O
ct 1
F
eb
10
1
07
5
/10
Oct
1
Jan
10
1
07
5
/10
O
ct 1
F
eb
10
1
07
5
/10
O
ct 1
F
eb
10
1
07
5
/10
O
ct 1
F
eb
10
1
07
5
/10
O
ct 1
F
eb
10
2
6
10
7
5/1
0
Oct
1
Ma
r 1
0
10
7
8/2
4
Oct
1
Ma
r 1
0
10
7
10
/30
O
ct 1
M
ar
10
1
07
1
5/n
on
e
Oct
1
Ma
r 1
0
10
7
15
/no
ne
O
ct 1
M
ar
10
1
07
1
5/n
on
e
Oct
1
Ma
r 1
0
10
7
15
/no
ne
O
ct 1
M
ar
10
1
07
1
5/n
on
e
Oct
1
Ma
r 1
0
10
7
15
/no
ne
O
ct 1
M
ar
10
1
07
1
5/n
on
e
Oct
1
Ma
r 1
0
10
7
15
/no
ne
Oct
1
Ma
r 1
0
10
7
15
/no
ne
O
ct 1
M
ar
10
1
07
1
5/n
on
e
Oct
1
Ma
r 1
0
10
7
15
/no
ne
O
ct 1
M
ar
10
1
07
1
5/n
on
e
Oct
1
Ma
r 1
0
10
7
25
/no
ne
Oct
1
Ma
r 1
0
10
7
25
/no
ne
O
ct 1
M
ar
10
1
07
2
5/n
on
e
Oct
1
Ma
r 1
0
10
7
25
/no
ne
O
ct 1
M
ar
10
1
07
2
5/n
on
e
Oct
1
Ma
r 1
0
10
7
25
/no
ne
Oct
1
Ma
r 1
0
10
7
25
/no
ne
O
ct 1
M
ar
10
1
07
2
5/n
on
e
Oct
1
Ma
r 1
0
10
7
25
/no
ne
O
ct 1
M
ar
10
1
07
2
5/n
on
e
Oct
1
Ma
r 1
0
10
7
25
/no
ne
1 A
lask
a fr
amew
orks
are
sep
arat
e:
Gen
eral
ly 1
05
-10
7 d
ays
with
a t
otal
goo
se b
ag o
f 6
2.
Eas
t -
ND
/SD
/NE
/KS
/OK
/TX
(E
.),
Wes
t -
MT
/WY
/CO
/NM
/TX
(W
.)
3.
Th
e se
ason
is c
lose
d o
n R
oss'
gee
se
4.
Th
e se
ason
is c
lose
d o
n s
now
gee
se in
Wyo
min
g
5.
Th
e b
ag/p
osse
ssio
n li
mit
on R
oss'
gee
se is
1/1
.
6.
Ag
gre
gat
e g
oose
lim
it
7.
Exc
lud
ing
ND
, S
D,
and
NE
, w
her
e th
e en
din
g d
ate
is F
eb 1
2
8.E
xclu
din
g N
M M
RG
V,
wh
ere
the
end
ing
dat
e is
Feb
14
(1
98
1),
Feb
13
(1
98
2),
Feb
12
(1
98
3),
Feb
28
(1
98
4)
9.
Th
e b
ag/p
oss
limit
for
ligh
t g
eese
is 5
/5 fo
r N
M a
nd
th
e w
este
rn g
oose
zon
e, T
X
10
. T
he
bag
/pos
s lim
it fo
r lig
ht
gee
se is
5/1
0 fo
r N
M a
nd
th
e w
este
rn g
oose
zon
e, T
X
11
. E
xclu
din
g N
M M
RG
V,
wh
ere
the
end
ing
dat
e is
Feb
28
12
. E
xclu
din
g M
T a
nd
WY
wh
ere
the
end
ing
dat
e is
Feb
12
13
. E
xclu
din
g N
D,
SD
an
d N
E n
orth
of t
he
Pla
tte
R.
and
th
e R
ain
wat
er B
asin
Zon
e
wh
ere
the
end
ing
dat
e is
Feb
18
14
. E
xclu
din
g N
E R
ain
wat
er B
asin
Zon
e w
her
e th
e en
din
g d
ate
is F
eb 1
6
15
. E
xclu
din
g N
E R
ain
wat
er B
asin
Zon
e w
her
e th
e en
din
g d
ate
is F
eb 0
1
17
. E
xclu
din
g M
T a
nd
WY
nor
th o
f I-8
0 w
her
e th
e en
din
g d
ate
is F
eb 1
8
18
. A
gg
reg
ate
goo
se b
ag li
mit
- al
l may
be
ligh
t g
eese
19
. C
losi
ng
dat
e fo
r A
R is
Jan
31
20
. S
eaon
clo
sed
in I
ssaq
uen
a, S
har
key
and
Was
hin
gto
n C
o. M
S
21
. C
losi
ng
dat
e in
LA
is F
eb 1
5
22
. O
pen
ing
dat
e in
WI
is O
ct 0
1
23
. C
losi
ng
dat
e fo
r L
A is
Feb
14
24
. C
losi
ng
dat
e in
KY
, A
R,
TN
, M
S a
nd
AL
is J
an 3
1
25
. S
tate
s an
d p
ortio
ns
of s
tate
s so
uth
of I
-80
hav
e an
en
din
g d
ate
of M
ar 1
0
26
. N
J, D
E,
MD
, N
C,
PA
, S
C,
and
VA
clo
sin
g d
ate
of 3
/10
allo
wed
; S
C c
hos
e 2
/10
clo
sin
g
27
. T
he
Inte
rior
Sta
tes
(AZ
, C
O,
ID,
MT
, N
V,
NM
, U
T,
WY
) st
art
dat
e is
Sat
urd
ay c
lose
st t
o S
ep 2
4 a
nd
is 1
07
day
s.
28
. T
he
Inte
rior
Sta
tes
(AZ
, C
O,
ID,
MT
, N
V,
NM
, U
T,
WY
) st
art
dat
e is
Sat
urd
ay c
lose
st t
o S
ep 2
4 a
nd
th
e d
aily
bag
is 1
0.

Central Flyway Databook 202012/22/2020
SU
MM
AR
Y O
F C
EN
TR
AL
FL
YW
AY
FR
AM
EW
OR
KS
FO
R D
UC
K H
UN
TIN
G, 2
015-
2024
71
20
15
2
01
6
20
17
2
01
8
20
19
2
02
0
20
21
2
02
2
20
23
2
02
4
Be
gin
nin
g
1/2
hr.
1
/2 h
r.
1/2
hr.
1
/2 h
r.
1/2
hr.
1
/2 h
r.
Sh
oo
ting
b
efo
re
be
fore
b
efo
re
be
fore
b
efo
re
be
fore
T
ime
su
nri
se
sun
rise
su
nri
se
sun
rise
su
nri
se
sun
rise
En
din
g
Sh
oo
ting
S
un
set
Su
nse
t S
un
set
Su
nse
t S
un
set
Su
nse
t T
ime
Op
en
ing
S
ep
26
S
ep
24
S
ep
23
S
ep
22
S
ep
21
S
ep
26
D
ate
Clo
sin
g
Jan
31
Ja
n 2
9
Jan
28
Ja
n 2
7
Jan
31
Ja
n 3
1
Da
te
Se
aso
n
74
7
4
74
7
4
74
7
4
Le
ng
th
+2
3 H
P ¹
+
23
HP
¹
+2
3 H
P ¹
+
23
HP
¹
+2
3 H
P ¹
+
23
HP
¹
Da
ily B
ag
/ 6
6 6
6 6
6
Po
sse
ssio
n 3
18
1
8
18
1
8
18
1
8
S
pe
cie
s/S
ex
Re
str
icti
on
s
Ma
llard
(M
) 5
5 5
5 5
5
M
alla
rd (
F)
2 2
2 2
2 2
Pin
tail
2
2 1
2 1
1
H
. M
erg
an
ser
² 2
2
2 2
2 2
Ca
nva
sba
ck 2
2 2
2 2
2
R
ed
he
ad
2
2
2 2
2 2
Sca
up
3
3 3
3 3
1
W
oo
d D
uck
3
3
3 3
3 3
Mo
ttle
d D
uck
1
4 1
4 1
4 1
4 1
4 1
4
FIL
E
S:\
CF
_D\P
RO
JEC
TS
\RE
GU
LAT
ION
S\F
RA
ME
WO
RK
S\C
Fdk
fram
ALL
.xls
¹ H
P =
Hig
h P
lain
s M
an
ag
em
en
t U
nit:
Ad
diti
on
al d
ays
mu
st b
e t
ake
n n
o e
arl
ier
tha
n t
he
Sa
turd
ay
clo
sest
to
De
cem
be
r 1
0.
² T
he
me
rga
nse
r b
ag
ca
n b
e s
ep
ara
ted
fro
m t
he
du
ck b
ag
. 3 I
n a
dd
itio
n,
ND
, S
D,
MT
an
d W
Y m
ay
take
an
ad
diti
on
al 2
an
d 6
(b
ag
/po
sse
ssio
n)
blu
e-w
ing
ed
te
al d
uri
ng
th
e f
irst
16
da
ys o
f th
eir
re
gu
lar
du
ck s
ea
son
. 4 B
ag
lim
it is
1 a
nd
se
aso
n c
lose
d f
or
the
1st
5 d
ays
of
the
se
aso
n in
Te
xas
on
ly;
els
ew
he
re b
ag
lim
it is
6 a
nd
no
op
en
ing
se
aso
n r
est
rict
ion
.

Central Flyway Databook 202012/22/2020
SU
MM
AR
Y O
F C
EN
TR
AL
FL
YW
AY
FR
AM
EW
OR
KS
FO
R S
AN
DH
ILL
CR
AN
E H
UN
TIN
G, 2
015-
2024
M
id-C
ontin
ent
Pop
ulat
ion-
All
stat
es e
xcep
t N
ebra
ska
2015
20
16
2017
20
18
2019
20
20
2021
20
22
2023
20
24
Beg
inni
ng
1/2
hr.
1/2
hr.
1/2
hr.
1/2
hr.
1/2
hr.
1/2
hr.
Sho
otin
g be
fore
be
fore
be
fore
be
fore
be
fore
be
fore
Tim
e su
nris
e 1
sunr
ise
1 su
nris
e 1
sunr
ise
1 su
nris
e 1
sunr
ise
1
End
ing
Sho
otin
g S
unse
t S
unse
t S
unse
t S
unse
t S
unse
t S
unse
t T
ime
Ope
ning
S
ep 0
1 S
ep 0
1 S
ep 0
1 S
ep 0
1 S
ep 0
1 S
ep 0
1 D
ate
Clo
sing
F
eb 2
8 F
eb 2
8 F
eb 2
8 F
eb 2
8 F
eb 2
8 F
eb 2
8 D
ate
Sea
son
932 ,
583 ,
376
932 ,
583 ,
376
932 ,
583 ,
376
932 ,
583 ,
376
932 ,
583 ,
376
932 ,
583 ,
376
Leng
th
Dai
ly B
ag/
3
3 3
3 3
3
Pos
sess
ion5
9 9
9 9
9 9
72
1 K
ansa
s be
gins
at
sunr
ise.
2
OK
and
por
tions
of
TX
and
NM
. 3
CO
, K
S,
MT
, N
D,
port
ions
of
SD
and
WY
. 4 A
rea
2 in
ND
and
Are
a C
in T
X.
5 Bag
/pos
sess
ion
limit
is 2
/6 in
Are
a 2
in N
D a
nd A
rea
C in
TX
. 6 A
rea
C in
TX
.
Roc
ky M
ount
ain
Pop
ulat
ion-
RM
P h
unt
area
s in
CO
, M
T,
NM
, W
Y
2015
20
16
2017
20
18
2019
20
20
2021
20
22
2023
20
24
Beg
inni
ng
1/2
hr.
1/2
hr.
1/2
hr.
1/2
hr.
1/2
hr.
1/2
hr.
Sho
otin
g be
fore
be
fore
be
fore
be
fore
be
fore
be
fore
T
ime
sunr
ise
sunr
ise
sunr
ise
sunr
ise
sunr
ise
sunr
ise
End
ing
Sho
otin
g S
unse
t S
unse
t S
unse
t S
unse
t S
unse
t S
unse
t T
ime
Ope
ning
S
ep 0
1 S
ep 0
1 S
ep 0
1 S
ep 0
1 S
ep 0
1 S
ep 0
1 D
ate
Clo
sing
Ja
n 31
Ja
n 31
Ja
n 31
Ja
n 31
Ja
n 31
Ja
n 31
D
ate
Sea
son
30
30
30
60 1
60 1
60 1
Leng
th
Dai
ly B
ag/
3
3
3 3
3
Pos
sess
ion
9/se
ason
9/
seas
on
9/se
ason
9/
seas
on
9/se
ason
3
9/se
ason
1 Sea
son
may
not
be
split
into
mor
e th
an 3
seg
men
ts.

Central Flyway Databook 202012/22/2020
ADAPTIVE HARVESTMANAGEMENT CRITERIA
73

Central Flyway Databook 202012/22/2020
1995-96 AHM MATRIX 1996-97 AHM MATRIX Optimal regulatory choices¹ for midcontinent mallards during the 1995-96 hunting season Optimal regulatory choices¹ for midcontinent mallards during the 1996-97 hunting season
MALLARDS² 1.5 2.0 2.5 3.0 3.5 4.0 4.5 5.0 5.5 6.0 MALLARDS² 1.5 2.0 2.5 3.0 3.5 4.0 4.5 5.0 5.5 6.0
4.5 M M M L L L L L L L 4.5
5.0 L L L L L L L L L L 5.0 R R R 5.5 L L L L L L L L L L 5.5 R R R R M M 6.0 L L L L L L L L L L ch 6.0 R R R R R R M M L L 6.5 L L L L L L L L L L 6.5 R R R M M M L L L L 7.0 L L L L L L L L L L 7.0 M M M L L L L L L L 7.5 L L L L L L L L L L 7.5 M L L L L L L L L L 8.0 L L L L L L L L L L 8.0 L L L L L L L L L L 8.5 L L L L L L L L L L 8.5 L L L L L L L L L L 9.0 L L L L L L L L L L 9.0 L L L L L L L L L L
9.5 L L L L L L L L L L 9.5 L L L L L L L L L L 10.0 L L L L L L L L L L 10.0 L L L L L L L L L L 10.5 L L L L L L L L L L 10.5 L L L L L L L L L L 11.0 L L L L L L L L L L 11.0 L L L L L L L L L L
¹ Package choices: R = restrictive, M = moderate, L = liberal. The 1995-96 optimal choice ¹ Package choices: R = restrictive, M = moderate, L = liberal. The 1996-97 optimal choice is indicated by grey-shaded cell (1995 values = 9.32 million mallards and 3.89 million ponds). is indicated by grey-shaded cell (1996 values = 8.89 million mallards and 5.00 million ponds).
² Estimated number (millions) of midcontinent mallards during May surveys in WBPHS and MN, WI, and MI. ² Estimated number (millions) of midcontinent mallards during May surveys in WBPHS and MN, WI, and M ³ Estimated number (millions) of ponds counted in Prairie Canada during May surveys. ³ Estimated number (millions) of ponds counted in Prairie Canada during May surveys.
1997-98 AHM MATRIX 1998-99 AHM MATRIX Optimal regulatory choices¹ for midcontinent mallards during the 1997-98 hunting season. Optimal regulatory choices¹ for midcontinent mallards during the 1998-99 hunting season.
MALLARDS² 1.5 2.0 2.5 3.0 3.5 4.0 4.5 5.0 5.5 6.0 MALLARDS² 1.5 2.0 2.5 3.0 3.5 4.0 4.5 5.0 5.5 6.0
4.5 4.5
5.0 5.0 VR
5.5 VR VR VR 5.5 VR VR VR R 6.0 VR VR VR VR VR R R R 6.0 VR VR VR VR VR R R R M 6.5 VR VR VR VR R R R M M M 6.5 VR VR VR R R R M M M L 7.0 R R R R R M M M L L 7.0 R R R R M M M L L L 7.5 R R M M M M L L L L 7.5 R M M M M L L L L L 8.0 M M M M L L L L L L 8.0 M M M L L L L L L L 8.5 M M L L L L L L L L 8.5 M L L L L L L L L L 9.0 L L L L L L L L L L 9.0 L L L L L L L L L L 9.5 L L L L L L L L L L 9.5 L L L L L L L L L L 10.0 L L L L L L L L L L 10.0 L L L L L L L L L L 10.5 L L L L L L L L L L 10.5 L L L L L L L L L L
11.0 L L L L L L L L L L 11.0 L L L L L L L L L L
¹ Package choices: VR = very restrictive, R = restrictive, M = moderate, L = liberal. 1997-98 optimal ¹ Package choices: VR = very restrictive, R = restrictive, M = moderate, L = liberal. 1998-99 optimal is indicated by grey-shaded cell (1997 values = 10.97 million mallards and 5.06 million ponds). choice is indicated by large-framed cell (1998 values = 10.62 million mallards and 2.52 million ponds).
² Estimated number (millions) of midcontinent mallards during May surveys in WBPHS and MN, WI, and MI. ² Estimated number (millions) of midcontinent mallards during May surveys in WBPHS and MN, WI, and M ³ Estimated number (millions) of ponds counted in Prairie Canada during May surveys. ³ Estimated number (millions) of ponds in Prairie Canada during May surveys.
1999-2000 AHM MATRIX 2000-2001 AHM MATRIX Optimal regulatory choices¹ for midcontinent mallards during the 1999 hunting season. Optimal regulatory choices¹ for midcontinent mallards during the 2000 hunting season.
MALLARDS² 1.5 2.0 2.5 3.0 3.5 4.0 4.5 5.0 5.5 6.0
4.5
5.0 VR 5.5 VR VR VR R 6.0 VR VR VR VR VR R R R M6.5 VR VR VR R R R M M M L 7.0 R R R R M M M L L L 7.5 R M M M M L L L L L 8.0 M M M L L L L L L L 8.5 M L L L L L L L L L 9.0 L L L L L L L L L L 9.5 L L L L L L L L L L 10.0 L L L L L L L L L L 10.5 L L L L L L L L L L 11.0 L L L L L L L L L L 11.5 L L L L L L L L L L
MALLARDS²
4.5
5.0
5.5
ch 6.0
6.5
7.0
7.5
8.0
8.5
9.0
9.5
10.0
10.5
1.5 2.0 2.5 3.0 3.5 4.0 4.5 5.0 5.5 6.0
VR
VR VR VR R R VR VR VR VR VR R R R M M VR R R R R M M M L L R R M M M M L L L L M M M M L L L L L L M M L L L L L L L L L L L L L L L L L L L L L L L L L L L L L L L L L L L L L L L L L L L L L L L L L L L L L L L L L L L L L L L L L L LL
¹ Package choices: VR = very restrictive, R = restrictive, M = moderate, L = liberal. 2000-2001 optimal
choice is indicated by grey-shaded cell (2000 values = 10.5 million mallards and 2.4 million ponds).
¹ Package choices: VR = very restrictive, R = restrictive, M = moderate, L = liberal. 1999-2000 optimal ² Estimated number (millions) of midcontinent mallards during May surveys in WBPHS and MN, WI, and M choice is indicated by grey-shaded cell (1999 values = 11.8 million mallards and 3.9 million ponds). ³ Estimated number (millions) of ponds in Prairie Canada during May surveys.
² Estimated number (millions) of midcontinent mallards during May surveys in WBPHS and MN, WI, and MI. ³ Estimated number (millions) of ponds in Prairie Canada during May surveys. S:\cf_d\projects\databook\HIP\ahmmatrx
74

Central Flyway Databook 202012/22/2020
2001-2002 AHM MATRIX 2002-2003 AHM MATRIX Optimal regulatory choices¹ for midcontinent mallards during the 2001 hunting season. Optimal regulatory choices¹ for midcontinent mallards during the 2002 hunting season.
MALLARDS² 1.5 2.0 2.5 3.0 3.5 4.0 4.5 5.0 5.5 6.0 MALLARDS² 1.0 1.5 2.0 2.5 3.0 3.5 4.0 4.5 5.0 5.5 6.0
4.5 VR 4.5
5.0 VR VR VR VR R R 5.0
5.5 5.5
6.0
VR VR VR VR R R R M M M R R R R M M M M L L 6.0 VR VR VR VR
6.5 R R M M M L L L L L 6.5 VR R R R R R M M 7.0 M M M L L L L L L L 7.0 R R R R R M M M M L L 7.5 M L L L L L L L L L 7.5 R R M M M L L L L L L 8.0 L L L L L L L L L L 8.0 M L L L L L L L L L L 8.5 L L L L L L L L L L 8.5 L L L L L L L L L L L 9.0 L L L L L L L L L L 9.0 L L L L L L L L L L L 9.5 L L L L L L L L L L 9.5 L L L L L L L L L L L
10.0 L L L L L L L L L L 10.0 L L L L L L L L L L L 10.5 L L L L L L L L L L 10.5 L L L L L L L L L L L 11.0 L L L L L L L L L L 11.0 L L L L L L L L L L L
¹ Package choices: VR = very restrictive, R = restrictive, M = moderate, L = liberal. 2001-2002 optimal ¹ Package choices: VR = very restrictive, R = restrictive, M = moderate, L = liberal. 2002-2003 optimal choice is indicated by grey-shaded cell (2001 values = 8.7 million mallards and 2.7 million ponds). choice is indicated by grey-shaded cell (2002 values = 8.5 million mallards and 1.4 million ponds).
² Estimated number (millions) of midcontinent mallards during May surveys in WBPHS and MN, WI, and MI. ² Estimated number (millions) of midcontinent mallards during May surveys in WBPHS and MN, WI, and MI ³ Estimated number (millions) of ponds in Prairie Canada during May surveys. ³ Estimated number (millions) of ponds in Prairie Canada during May surveys.
2003-2004 AHM MATRIX 2004-2005 AHM MATRIX Optimal regulatory choices¹ for midcontinent mallards during the 2003 hunting season. Optimal regulatory choices¹ for midcontinent mallards during the 2004 hunting season.
CANADIAN PONDS³ CANADIAN PONDS³ MALLARDS² 1.5 2.0 2.5 3.0 3.5 4.0 4.5 5.0 5.5 6.0 MALLARDS² 1.5 2.0 2.5 3.0 3.5 4.0 4.5 5.0 5.5 6.0
<=5.25 <=5.25 C C C C C C C C C C 5.50-6.50 R R R R R R R R R R 5.50-6.25 R R R R R R R R R R
6.75 6.50R R R R R R R R M M R R R R R R R R R M 7.0 R R R R R R R M M L 6.75 R R R R R R R M M L
7.25 R R R R M M L L L L 7.00 R R R R R M M M L L 7.5 R R R M L L L L L L 7.25 R R R M M M L L L L
7.75 R M M L L L L L L L 7.50 R R M M L L L L L L 8.0 M M M L L L L L L L 7.75 M M L L L L L L L L
8.25 M L L L L L L L L L 8.00 M L L L L L L L L L >=8.5 L L L L L L L L L L >=8.5 L L L L L L L L L L
¹ Package choices: R = restrictive, M = moderate, L = liberal. 2003-2004 optimal ¹ Package choices: C = closed, R = restrictive, M = moderate, L = liberal. 2004-2005 optimal choice is indicated by grey-shaded cell (2003 values = 8.8 million mallards and 3.52 million ponds). choice is indicated by grey-shaded cell (2004 values = 8.36 million mallards and 2.51 million ponds).
² Estimated number (millions) of midcontinent mallards during May surveys in WBPHS and MN, WI, and MI. ² Estimated number (millions) of midcontinent mallards during May surveys in WBPHS and MN, WI, and MI. ³ Estimated number (millions) of ponds in Prairie Canada during May surveys. ³ Estimated number (millions) of ponds in Prairie Canada during May surveys.
2005-2006 AHM MATRIX 2006-2007 AHM MATRIX Optimal regulatory choices¹ for midcontinent mallards during the 2005 hunting season. Optimal regulatory choices¹ for midcontinent mallards during the 2006 hunting season.
CANADIAN PONDS³ CANADIAN PONDS³ MALLARDS² 1.5 2.0 2.5 3.0 3.5 4.0 4.5 5.0 5.5 6.0 MALLARDS² 1.5 2.0 2.5 3.0 3.5 4.0 4.5 5.0 5.5 6.0
<=5.25 C C C C C C C C C C <=5.25 C C C C C C C C C C
5.50-6.25 R R R R R R R R R R 5.50-6.25 R R R R R R R R R R 6.50 6.50R R R R R R R R R M R R R R R R R R M M
6.75 R R R R R R M M M L 6.75 R R R R R R R M M L
7.00 R R R R R M M L L L 7.00 R R R R M M M L L L
7.25 R R R M M M L L L L 7.25 R R R M M L L L L L
7.50 R M M M L L L L L L 7.50 R R M M L L L L L L
7.75 M M M L L L L L L L 7.75 M L M L L L L L L L
8.00 M M L L L L L L L L 8.00 M L L L L L L L L L
8.25 L L L L L L L L L L >=8.25 L L L L L L L L L L
>=8.5 L L L L L L L L L L ¹ Package choices: C = closed, R = restrictive, M = moderate, L = liberal. 2006-2007 optimal
¹ Package choices: R = restrictive, M = moderate, L = liberal. 2005-2006 optimal choice is indicated by grey-shaded cell (2006 values = 7.86 million mallards and 4.45 million ponds). choice is indicated by grey-shaded cell (2005 values = 7.54 million mallards and 3.92 million ponds). ² Estimated number (millions) of midcontinent mallards during May surveys in WBPHS and MN, WI, and MI.
² Estimated number (millions) of midcontinent mallards during May surveys in WBPHS and MN, WI, and MI. ³ Estimated number (millions) of ponds in Prairie Canada during May surveys. ³ Estimated number (millions) of ponds in Prairie Canada during May surveys.
S:\cf_d\projects\databook\HIP\ahmmatrx S:\cf_d\projects\databook\HIP\ahmmatrx
75

Central Flyway Databook 202012/22/2020
2007-2008 AHM MATRIX 2008-2009 AHM MATRIX Optimal regulatory choices¹ for midcontinent mallards during the 2007 hunting season. Optimal regulatory choices¹ for midcontinent mallards during the 2008 hunting season.
CANADIAN PONDS³ MALLARDS² 1.5 2.0 2.5 3.0 3.5 4.0 4.5 5.0 5.5 6.0
<=5.25 C C C C C C C C C C
5.50-6.25 R R R R R R R R R R 6.50 R R R R R R R R R M
6.75 R R R R R R M M M L
7.00 R R R R R M M L L L
7.25 R R R M L L L L L L
7.50 R M M L L L L L L L
7.75 M M M L L L L L L L
8.00 M L L L L L L L L L
>=8.25 L L L L L L L L L L
¹ Package choices: R = restrictive, M = moderate, L = liberal. 2007-2008 optimal
MALLARDS²
<=4.5
4.75-5.50
5.75
6.00
6.25
6.50
6.75
7.00
>=7.25
CANADIAN PONDS³ 1.5 2.0 2.5 3.0 3.5 4.0 4.5 5.0 5.5 6.0
C C C C C C C C C C
R R R R R R R R R R
R R R R R R R R R M
R R R R R R R M L L
R R R R M M M L L L
R R R M M L L L L L
R M M L L L L L L L
M M M L L L L L L L
L L L L L L L L L L
¹ Package choices: R = restrictive, M = moderate, L = liberal. 2008-2009 optimal
choice is indicated by grey-shaded cell (2008 values = 7.87 million mallards and 3.05 million ponds). choice is indicated by grey-shaded cell (2007 values = 9.05 million mallards and 5.04 million ponds). ² Estimated number (millions) of midcontinent mallards during May surveys in WBPHS and MN, WI, and MI.
² Estimated number (millions) of midcontinent mallards during May surveys in WBPHS and MN, WI, and MI. ³ Estimated number (millions) of ponds in Prairie Canada during May surveys. ³ Estimated number (millions) of ponds in Prairie Canada during May surveys.
2009-2010 AHM MATRIX 2010-2011 AHM MATRIX Optimal regulatory choices¹ for midcontinent mallards during the 2009 hunting season. Optimal regulatory choices¹ for midcontinent mallards during the 2010 hunting season.
CANADIAN PONDS³ MALLARDS² 1.5 2.0 2.5 3.0 3.5 4.0 4.5 5.0 5.5 6.0 MALLARDS²
<=4.5 C C C C C C C C C C <=4.5
4.75-5.75 R R R R R R R R R R 4.75-5.75
6.00 R R R R R R R R M M 6.00
6.25 R R R R R R M M M L 6.25
6.50 R R R R M M M L L L 6.50
6.75 R R R M L L L L L L 6.75
7.00 R M M L L L L L L L 7.00
7.25 M M L L L L L L L L 7.25
7.50 M L L L L L L L L L 7.50
>=7.75 L L L L L L L L L L >=7.75
¹ Package choices: R = restrictive, M = moderate, L = liberal. 2009-2010 optimal
CANADIAN PONDS³ 1.5 2.0 2.5 3.0 3.5 4.0 4.5 5.0 5.5 6.0
C C C C C C C C C C R R R R R R R R R R R R R R R R R R M M R R R R R R M M M L R R R R M M M L L L R R R M L L L L L L R M M M L L L L L L M L L L L L L L L L L L L L L L L L L L L L L L L L L L L L
¹ Package choices: R = restrictive, M = moderate, L = liberal. 2010-2011 optimal choice is indicated by grey-shaded cell (2009 values = 8.71 million mallards and 3.57 million ponds). choice is indicated by grey-shaded cell (2010 values = 8.60 million mallards and 3.73 million ponds).
² Estimated number (millions) of midcontinent mallards during May surveys in WBPHS and MN, WI, and MI. ² Estimated number (millions) of midcontinent mallards during May surveys in WBPHS and MN, WI, and MI. ³ Estimated number (millions) of ponds in Prairie Canada during May surveys. ³ Estimated number (millions) of ponds in Prairie Canada during May surveys.
S:\cf_d\projects\MONITORING\HARVEST DATA\databook\HIP\ahmmatrx.XLS
2011-2012 AHM MATRIX 2012-2013 AHM MATRIX Optimal regulatory choices¹ for midcontinent mallards during the 2011 hunting season. Optimal regulatory choices¹ for midcontinent mallards during the 2012 hunting season.
CANADIAN PONDS³ MALLARDS² 1.5 2.0 2.5 3.0 3.5 4.0 4.5 5.0 5.5 6.0
<=4.5 C C C C C C C C C C 4.75-6.0 R R R R R R R R R R
6.25 R R R R R R R R M M 6.50 R R R R R R M M L L 6.75 R R R R R M M L L L 7.00 R R R M M L L L L L 7.25 R M M M L L L L L L 7.50 M M L L L L L L L L 7.75 M L L L L L L L L L
>=8.0 L L L L L L L L L L
¹ Package choices: R = restrictive, M = moderate, L = liberal. 2011-2012 optimal
MALLARDS²
<=4.5
4.75-6.0
6.25
6.50
6.75
7.00
7.25
7.50
7.75
>=8.0
CANADIAN PONDS³ 1.5 2.0 2.5 3.0 3.5 4.0 4.5 5.0 5.5 6.0
C C C C C C C C C C R R R R R R R R R R R R R R R R R R R M R R R R R R R M M M R R R R R M M M L L R R R M M M L L L L R R M M L L L L L L R M L L L L L L L L M L L L L L L L L L L L L L L L L L LL
¹ Package choices: R = restrictive, M = moderate, L = liberal. 2011-2012 optimal choice is indicated by grey-shaded cell (2011 values = 9.46 million mallards and 4.89 million ponds). choice is indicated by grey-shaded cell (2012 values = 10.96 million mallards and 3.89 million ponds).
² Estimated number (millions) of midcontinent mallards during May surveys in WBPHS and MN, WI, and MI. ² Estimated number (millions) of midcontinent mallards during May surveys in WBPHS and MN, WI, and MI. ³ Estimated number (millions) of ponds in Prairie Canada during May surveys. ³ Estimated number (millions) of ponds in Prairie Canada during May surveys.
76

Central Flyway Databook 202012/22/2020
2013-2014 AHM MATRIX 2014-2015 AHM MATRIX Optimal regulatory choices¹ for midcontinent mallards during the 2013 hunting season. Optimal regulatory choices¹ for midcontinent mallards during the 2014 hunting season.
CANADIAN PONDS³ MALLARDS² 1.5 2.0 2.5 3.0 3.5 4.0 4.5 5.0 5.5 6.0
<=4.5 C C C C C C C C C C 4.75-6.25 R R R R R R R R R R
6.50 R R R R R R R R M M 6.75 R R R R R R R M M M 7.00 R R R R M M L L L L 7.25 R R M M M L L L L L 7.50 R R M M L L L L L L 7.75 M M L L L L L L L L
>=8.0 L L L L L L L L L L
¹ Package choices: R = restrictive, M = moderate, L = liberal. 2013-2014 optimal
MALLARDS²
<=4.5
4.75-6.25
6.50
6.75
7.00
7.25
7.50
7.75
>=8.0
CANADIAN PONDS³ 1.5 2.0 2.5 3.0 3.5 4.0 4.5 5.0 5.5 6.0
C C C C C C C C C C R R R R R R R R R R R R R R R R R R R M R R R R R R R M M L R R R R R M M M L L R R R M M M L L L L R R M M L L L L L L M M L L L L L L L L L L L L L L L L LL
¹ Package choices: R = restrictive, M = moderate, L = liberal. 2014-2015 optimal
choice is indicated by grey-shaded cell (2013 values = 10.80 million mallards and 4.55 million ponds). choice is indicated by grey-shaded cell (2014 values = 11.04 million mallards and 4.63 million ponds).
² Estimated number (millions) of midcontinent mallards during May surveys in WBPHS (strata 13-18, 20-50, 75-77) ² Estimated number (millions) of midcontinent mallards during May surveys in WBPHS (strata 13-18, 20-50, 75-77)
and MN, WI, and MI. and MN, WI, and MI. ³ Estimated number (millions) of ponds in Prairie Canada during May surveys. ³ Estimated number (millions) of ponds in Prairie Canada during May surveys.
2015-2016 AHM MATRIX 2016-2017 AHM MATRIX Optimal regulatory choices¹ for midcontinent mallards during the 2015 hunting season. Optimal regulatory choices¹ for midcontinent mallards during the 2016 hunting season,
based on the regulatory choice (L), mallards and ponds in 2015.
CANADIAN PONDS³ MALLARDS² 1.5 2.0 2.5 3.0 3.5 4.0 4.5 5.0 5.5 6.0
<=4.5 C C C C C C C C C C 4.75-6.25 R R R R R R R R R R
6.50 R R R R R R R R R M 6.75 R R R R R R R R M M 7.00 R R R R R R M M M L 7.25 R R R R M M L L L L 7.50 R R M M M L L L L L 7.75 R M M L L L L L L L 8.00 M M L L L L L L L L
>=8.25 L L L L L L L L LL
¹ Package choices: R = restrictive, M = moderate, L = liberal. 2015-2016 optimal
MALLARDS²
<=4.5
4.75-6.00
6.25
6.50
6.75
7.00
7.25
7.50
7.75
8.00
>=8.25
CANADIAN PONDS³ 1.5 2.0 2.5 3.0 3.5 4.0 4.5 5.0 5.5 6.0
C C C C C C C C C C R R R R R R R R R R R R R R R R R R R M R R R R R R R R L L R R R R R R M L L L R R R R R M L L L L R R R R L L L L L L R R R L L L L L L L R R L L L L L L L L R L L L L L L L L L L L L L L L L L LL
¹ Package choices: R = restrictive, M = moderate, L = liberal. 2016-2017 optimal
choice is indicated by grey-shaded cell (2015 values = 11.79 million mallards and 4.15 million ponds). choice is indicated by grey-shaded cell (2015 values = 11.79 million mallards and 4.15 million ponds).
² Estimated number (millions) of midcontinent mallards during May surveys in WBPHS (strata 13-18, 20-50, 75-77) ² Estimated number (millions) of midcontinent mallards during May surveys in WBPHS (strata 13-18, 20-50, 75-77)
and MN, WI, and MI. and MN, WI, and MI. ³ Estimated number (millions) of ponds in Prairie Canada during May surveys. ³ Estimated number (millions) of ponds in Prairie Canada during May surveys.
2017-2018 AHM MATRIX 2018-2019 AHM MATRIX Optimal regulatory choices¹ for midcontinent mallards during the 2017 hunting season, Optimal regulatory choices¹ for midcontinent mallards during the 2018 hunting season, based on the regulatory choice (L), mallards and ponds in 2016.
CANADIAN PONDS³ MALLARDS² 1.5 2.0 2.5 3.0 3.5 4.0 4.5 5.0 5.5 6.0
<=4.5 C C C C C C C C C C 4.75-6.00 R R R R R R R R R R
6.25 # R R R R R R R R R R 6.50 # R R R R R R R R M L 6.75 # R R R R R R R L L L 7.00 # R R R R R R L L L L 7.25 # R R R R M L L L L L 7.50 # R R R M L L L L L L 7.75 # R R M L L L L L L L 8.00 # R M L L L L L L L L 8.25 M L L L L L L L L L
>=8.50 L L L L L L L L L L
¹ Package choices: R = restrictive, M = moderate, L = liberal. 2017-2018 optimal
based on the regulatory choice (L), mallards and ponds in 2017.
DIAN PONDS³ MALLARDS²
<=4.5
4.75-6.00
6.25
6.50
6.75
7.00
7.25
7.50
7.75
8.00
8.25
>=8.50
1.5 2.0 2.5 3.0 3.5 4.0 4.5 5.0 5.5 6.0
C C C C C C C C C C R R R R R R R R R R R R R R R R R R R R R R R R R R R R M L R R R R R R R L L L R R R R R R L L L L R R R R M L L L L L R R R M L L L L L L R R M L L L L L L L R M L L L L L L L L M L L L L L L L L L L L L L L L L L LL
¹ Package choices: R = restrictive, M = moderate, L = liberal. 2018-2019 optimal
choice is indicated by grey-shaded cell (2016 values = 11.89 million mallards and 3.49 million ponds). choice is indicated by grey-shaded cell (2017 values = 10.64 million mallards and 4.33 million ponds).
² Estimated number (millions) of midcontinent mallards during May surveys in WBPHS (strata 13-18, 20-50, 75-77) ² Estimated number (millions) of midcontinent mallards during May surveys in WBPHS (strata 13-18, 20-50, 75-77)
and MN, WI, and MI. and MN, WI, and MI. ³ Estimated number (millions) of ponds in Prairie Canada during May surveys. ³ Estimated number (millions) of ponds in Prairie Canada during May surveys.
77

Central Flyway Databook 202012/22/2020
2019-2020 AHM MATRIX 2020-2021 AHM MATRIX Optimal regulatory choices¹ for midcontinent mallards during the 2019 hunting season. Optimal regulatory choices¹ for midcontinent mallards during the 2020 hunting season.
CANADIAN PONDS³ MALLARDS² 1.5 2.0 2.5 3.0 3.5 4.0 4.5 5.0 5.5 6.0
<=4.5 C C C C C C C C C C 4.75-6.00 R R R R R R R R R R
6.25 R R R R R R R R R M 6.50 R R R R R R R R L L 6.75 R R R R R R M L L L 7.00 R R R R R L L L L L 7.25 R R R R L L L L L L 7.50 R R R L L L L L L L 7.75 R R L L L L L L L L 8.00 R L L L L L L L L L
>=8.25 L L L L L L L L L L
¹ Package choices: R = restrictive, M = moderate, L = liberal. 2019-2020 optimal
MALLARDS²
<=4.5
4.75-6.25
6.50
6.75
7.00
7.25
7.50
7.75
8.00
8.25
>=8.5
CANADIAN PONDS³ 1.5 2.0 2.5 3.0 3.5 4.0 4.5 5.0 5.5 6.0
C C C C C C C C C C R R R R R R R R R R R R R R R R R R M L R R R R R R R L L L R R R R R R L L L L R R R R M L L L L L R R R M L L L L L L R R M L L L L L L L R M L L L L L L L L M L L L L L L L L L L L L L L L L L LL
¹ Package choices: R = restrictive, M = moderate, L = liberal. 2020-2021 optimal
choice is indicated by grey-shaded cell (2018 values = 9.57 million mallards and 3.66 million ponds). choice is indicated by grey-shaded cell (2019 values = 9.73 million mallards and 2.86 million ponds).
See annual AHM report for finer-grained optimal choice matrix. See annual AHM report for finer-grained optimal choice matrix.
² Estimated number (millions) of midcontinent mallards during May surveys in WBPHS (strata 13-18, 20-50, 75-77) ² Estimated number (millions) of midcontinent mallards during May surveys in WBPHS (strata 13-18, 20-50, 75-77)
and MN, WI, and MI. and MN, WI, and MI. ³ Estimated number (millions) of ponds in Prairie Canada during May surveys. ³ Estimated number (millions) of ponds in Prairie Canada during May surveys.
2021-2022 AHM MATRIX Optimal regulatory choices¹ for midcontinent mallards during the 2021 hunting season.
CANADIAN PONDS³ MALLARDS² 1.5 2.0 2.5 3.0 3.5 4.0 4.5 5.0 5.5 6.0
<=4.5 C C C C C C C C C C 4.75-6.25 R R R R R R R R R R
6.50 R R R R R R R R M L 6.75 R R R R R R R L L L 7.00 R R R R R R L L L L 7.25 R R R R M L L L L L 7.50 R R R M L L L L L L 7.75 R R M L L L L L L L 8.00 R M L L L L L L L L 8.25 M L L L L L L L L L
>=8.5 L L L L L L L L LL
¹ Package choices: R = restrictive, M = moderate, L = liberal. 2021-2022 optimal
choice is indicated by grey-shaded cell (2020 predicted values = 9.07 million mallards and 3.40 million ponds).
See annual AHM report for finer-grained optimal choice matrix.
² Predicted number (millions) of midcontinent mallards during May surveys in WBPHS (strata 13-18, 20-50, 75-77)
and MN, WI, and MI. ³ Predicted number (millions) of ponds in Prairie Canada during May surveys.
78
S://MBMO/CF_PROJECTS/MONITORING/HARVEST DATA/DATABOOK/HIP/AHMMATRX.XLSX

Central Flyway Databook 2020
CENTRAL FLYWAY COUNCIL
CENTRAL FLYWAY WATERFOWL TECHNICAL COMMITTEE
CENTRAL FLYWAY WEBLESS GAME BIRD TECHNICAL COMMITTEE
CENTRAL MANAGEMENT UNIT MOURNING DOVE TECHNICAL COMMITTEE
CENTRAL FLYWAY NONGAME TECHNICAL COMMITTEE
CENTRAL FLYWAY MEETING LOCATIONS
GAY SIMPSON & JOE GABIG AWARDS
CENTRAL FLYWAY CONSULTANTS
SERVICE REGULATIONS COMMITTEE
USFWS FLYWAY REPRESENTATIVES
USFWS REGIONAL MIGRATORY BIRD CHIEFS
12/22/2020 79

Central Flyway Databook 202012/22/2020
1950
1960
1970
1980
1990
2000
2010
2020
CE
NT
RA
L F
LY
WA
Y C
OU
NC
IL
1948
-202
0
80
CO
K
S
MT
N
E
NM
N
D
OK
S
D
TX
W
Y
AB
NW
TS
K
1948
C
.N. F
east
D
.D. L
eahy
W
.G. F
reem
an
L.P
. Van
ce
H.C
. Pic
kens
H
.R. M
orga
n A
. D. A
ldric
h E
. Pet
erso
n W
.C. G
laze
ner
L. B
agle
y 19
49
C.N
. Fea
st
D.D
. Lea
hy
R.D
. Shi
pley
L.
P. V
ance
H
.C. P
icke
ns
H.R
. Mor
gan
A. D
. Ald
rich
E. P
eter
son
W.C
. Gla
zene
r L.
Bag
ley
C.N
. Fea
st
D.D
. Lea
hy
R.D
. Shi
pley
L.
P. V
ance
H
.C. P
icke
ns
H.R
. Mor
gan
A. D
. Ald
rich
E. P
eter
son
W.C
. Gla
zene
r L.
Bag
ley
1951
C
.N. F
east
D
.D. L
eahy
R
.D. S
hipl
ey
L.P
. Van
ce
H.C
. Pic
kens
H
.R. M
orga
n A
. D. A
ldric
h E
. Pet
erso
n W
.C. G
laze
ner
L. B
agle
y 19
52
T.L
. Kim
ball
D.D
. Lea
hy
R.D
. Shi
pley
L.
P. V
ance
H
.C. P
icke
ns
H.R
. Mor
gan
A. D
. Ald
rich
E. P
eter
son
W.J
. Cut
birt
h L.
Bag
ley
Ern
ie L
. Pay
nter
19
53
T.L
. Kim
ball
D.D
. Lea
hy
R.D
. Shi
pley
L.
P. V
ance
H
.C. P
icke
ns
H.R
. Mor
gan
A. D
. Ald
rich
E. P
eter
son
W.J
. Cut
birt
h L.
Bag
ley
Ern
ie L
. Pay
nter
19
54
T.L
. Kim
ball
D.D
. Lea
hy
R.D
. Shi
pley
L.
P. V
ance
H
.C. P
icke
ns
H.R
. Mor
gan
A. D
. Ald
rich
E. P
eter
son
W.J
. Cut
birt
h L.
Bag
ley
Ern
ie L
. Pay
nter
19
55
T.L
. Kim
ball
D.D
. Lea
hy
R.D
. Shi
pley
L.
P. V
ance
H
.C. P
icke
ns
H.R
. Mor
gan
D.
War
e E
. Pet
erso
n W
.J. C
utbi
rth
L. B
agle
y E
rnie
L. P
aynt
er
1956
T
.L. K
imba
ll D
.D. L
eahy
A
. O'C
laire
L.
P. V
ance
H
.C. P
icke
ns
H.R
. Mor
gan
D.
War
e E
. Pet
erso
n W
.J. C
utbi
rth
A.F
.C. G
reen
e E
rnie
L. P
aynt
er
1957
T
.L. K
imba
ll D
.D. L
eahy
A
. O'C
laire
M
.O. S
teen
H
.C. P
icke
ns
I. G
. Bue
C
. Bur
ch
T. A
. Sch
rade
r H
. Dod
gen
A.F
.C. G
reen
e E
rnie
L. P
aynt
er
1958
T
.L. K
imba
ll D
.D. L
eahy
A
. O'C
laire
M
.O. S
teen
F
. A. T
hom
pson
I.
G. B
ue
C. B
urch
H
.R. W
oodw
ard
H. D
odge
n A
.F.C
. Gre
ene
Ern
ie L
. Pay
nter
19
59
T.L
. Kim
ball
D.D
. Lea
hy
W.J
. Eve
rin
M.O
. Ste
en
F. A
. Tho
mps
on
I. G
. Bue
C
. Bur
ch
H.R
. Woo
dwar
d H
. Dod
gen
A.F
.C. G
reen
e E
rnie
L. P
aynt
er
T.L
. Kim
ball
D.D
. Lea
hy
W.J
. Eve
rin
M.O
. Ste
en
F. A
. Tho
mps
on
I. G
. Bue
R
.A. S
taffo
rd
H.R
. Woo
dwar
d H
. Dod
gen
S.J
. Jia
cole
tti
Ern
ie L
. Pay
nter
19
61
H.L
. Woo
dwar
d F
. War
ders
W
.J. E
verin
M
.O. S
teen
F
. A. T
hom
pson
I.
G. B
ue
R.A
. Sta
fford
W
.J. F
illm
ore
E. W
alke
r S
.J. J
iaco
letti
E
rnie
L. P
aynt
er
1962
H
.L. W
oodw
ard
G. M
oore
W
.J. E
verin
M
.O. S
teen
F
. A. T
hom
pson
R
.W. S
tuar
t R
.A. S
taffo
rd
W.J
. Fill
mor
e A
.J. S
prin
gs
S.J
. Jia
cole
tti
Ern
ie L
. Pay
nter
19
63
H.L
. Woo
dwar
d G
. Moo
re
W.J
. Eve
rin
M.O
. Ste
en
W.S
. Hue
y R
.W. S
tuar
t R
.A. S
taffo
rd
W.J
. Fill
mor
e A
.J. S
prin
gs
G.F
. Wra
kest
raw
E
rnie
L. P
aynt
er
1964
H
.L. W
oodw
ard
G. M
oore
W
.G. F
reem
an
M.O
. Ste
en
W.S
. Hue
y R
.W. S
tuar
t W
. Bev
er
W.J
. Fill
mor
e A
.J. S
prin
gs
G.F
. Wra
kest
raw
E
rnie
L. P
aynt
er
1965
H
.L. W
oodw
ard
G. M
oore
F
.H. D
unkl
e M
.O. S
teen
W
.S. H
uey
R.W
. Stu
art
W. B
ever
W
.J. F
illm
ore
A.J
. Spr
ings
G
.F. W
rake
stra
w
Ern
ie L
. Pay
nter
19
66
H.L
. Woo
dwar
d G
. Moo
re
F.H
. Dun
kle
M.O
. Ste
en
W.S
. Hue
y R
.W. S
tuar
t W
. Bev
er
W.J
. Fill
mor
e A
.J. S
prin
gs
J.B
. Whi
te
Ern
ie L
. Pay
nter
19
67
H.L
. Woo
dwar
d G
. Moo
re
F.H
. Dun
kle
M.O
. Ste
en
W.S
. Hue
y R
.W. S
tuar
t W
. Bev
er
R.A
. Hod
gins
A
.J. S
prin
gs
J.B
. Whi
te
Ern
ie L
. Pay
nter
19
68
H.L
. Woo
dwar
d M
.D. S
chw
illin
g F
.H. D
unkl
e M
.O. S
teen
W
.S. H
uey
R.W
. Stu
art
W. B
ever
R
.A. H
odgi
ns
A.J
. Spr
ings
J.
B. W
hite
C
. Ber
nie
For
bes
1969
H
.L. W
oodw
ard
M.D
. Sch
will
ing
F.H
. Dun
kle
W.R
. Bar
bee
W.S
. Hue
y R
.W. S
tuar
t F
. Cop
elin
R
.A. H
odgi
ns
A.J
. Spr
ings
J.
B. W
hite
D
. Nea
ve
C. B
erni
e F
orbe
s H
.L. W
oodw
ard
M.D
. Sch
will
ing
F.H
. Dun
kle
W.R
. Bar
bee
W.S
. Hue
y R
.W. S
tuar
t F
. Cop
elin
R
.A. H
odgi
ns
J.R
. Sin
glet
on
J.B
. Whi
te
D. N
eave
C
. B
erni
e F
orbe
s 19
71
H.L
. Woo
dwar
d M
.D. S
chw
illin
g F
.H. D
unkl
e W
.R. B
arbe
e W
.S. H
uey
R.W
. Stu
art
F. C
opel
in
R.A
. Hod
gins
D
. Rus
sell
E. T
hom
as
D. N
eave
H
. Mal
iepa
ard
1972
H
.L. W
oodw
ard
M.D
. Sch
will
ing
W.G
. Fre
eman
W
.R. B
arbe
e W
.S. H
uey
R.W
. Stu
art
F. C
opel
in
R.A
. Hod
gins
R
. Kem
p G
.F. W
rake
stra
w
D. N
eave
H
. Mal
iepa
ard
1973
J.
R. G
rieb
M.D
. Sch
will
ing
W.G
. Fre
eman
W
.R. B
arbe
e W
.S. H
uey
R.W
. Stu
art
G. W
int
J. P
opow
ski
R. K
emp
G.F
. Wra
kest
raw
D
. Nea
ve
H. M
alie
paar
d 19
74
J.R
. Grie
b D
. Wet
ters
ten
W.G
. Fre
eman
W
.R. B
arbe
e W
.S. H
uey
R.W
. Stu
art
G. W
int
J. P
opow
ski
T.L
. Cla
rk
G.F
. Wra
kest
raw
D
. Nea
ve
H. M
alie
paar
d 19
75
J.R
. Grie
b D
. Wet
ters
ten
W.G
. Fre
eman
W
.R. B
arbe
e W
.S. H
uey
R.W
. Stu
art
G. W
int
J. P
opow
ski
T.L
. Cla
rk
G.F
. Wra
kest
raw
D
. Nea
ve
H. M
alie
paar
d 19
76
J.R
. Grie
b D
. Wet
ters
ten
W.G
. Fre
eman
W
.J. B
aile
y W
.S. H
uey
R.W
. Stu
art
G. W
int
J. P
opow
ski
T.L
. Cla
rk
G.F
. Wra
kest
raw
D
. Nea
ve
H. M
alie
paar
d 19
77
J.R
. Grie
b L.
Que
al
W.G
. Fre
eman
W
.J. B
aile
y W
.S. H
uey
R.W
. Stu
art
G. W
int
J. M
erw
in
T.L
. Cla
rk
E. T
hom
as
D. N
eave
H
. Mal
iepa
ard
1978
J.
R. G
rieb
L. Q
ueal
W
.G. F
reem
an
W.J
. Bai
ley
W.S
. Hue
y R
.W. S
tuar
t G
. Win
t J.
Mer
win
T
.L. C
lark
E
. Tho
mas
D
. Nea
ve
H. M
alie
paar
d 19
79
J.R
. Grie
b J.
Con
ley
E. A
llen
W.J
. Bai
ley
H. O
lsen
R
.W. S
tuar
t G
. Win
t J.
Lou
nsbe
rry
T.L
. Cla
rk
E. T
hom
as
D. N
eave
H
. Mal
iepa
ard
J.R
. Grie
b W
. Han
zlic
k E
. Alle
n W
.J. B
aile
y H
. Ols
en
L. K
ruck
enbe
rg
G. W
int
K. L
. Coo
l T
.L. C
lark
E
. Tho
mas
G
. Kem
p H
. Mal
iepa
ard
1981
J.
R. G
rieb
W. H
anzl
ick
E. A
llen
W.J
. Bai
ley
H. O
lsen
C
.H. S
chro
eder
S
. Lew
is
K. L
. Coo
l T
.L. C
lark
E
. Tho
mas
R
.R. A
ndre
ws
H. M
alie
paar
d 19
82
J.R
. Grie
b W
. Han
zlic
k E
. Alle
n W
.J. B
aile
y H
. Ols
en
C.H
. Sch
roed
er
S. L
ewis
K
. L. C
ool
T.L
. Cla
rk
D. D
exte
r R
.R. A
ndre
ws
H. M
alie
paar
d 19
83
J.R
. Grie
b W
. Han
zlic
k E
. Alle
n W
.J. B
aile
y H
. Ols
en
C.H
. Sch
roed
er
S. L
ewis
K
. L. C
ool
T.L
. Cla
rk
D. D
exte
r R
.R. A
ndre
ws
H. M
alie
paar
d 19
84
J. R
uch
W. H
anzl
ick
D.W
. Witt
W
.J. B
aile
y D
. Sut
cliff
e C
.H. S
chro
eder
S
. Lew
is
K. L
. Coo
l T
.L. C
lark
D
. Dex
ter
R.R
. And
rew
s H
. Mal
iepa
ard
1985
J.
Lip
scom
b W
. Han
zlic
k D
.W. W
itt
W.J
. Bai
ley
D. S
utcl
iffe
C.H
. Sch
roed
er
S. L
ewis
J.
Sal
yer
T.L
. Cla
rk
D. S
tric
klan
d R
.R. A
ndre
ws
H. M
alie
paar
d 19
86
J. L
ipsc
omb
W. H
anzl
ick
A. O
lsen
W
.J. B
aile
y W
. Mon
toya
C
.H. S
chro
eder
S
. Lew
is
J. S
alye
r B
. Ale
xand
er
D. S
tric
klan
d R
.R. A
ndre
ws
H. M
alie
paar
d 19
87
J. L
ipsc
omb
W. A
. W
entz
A
. Ols
en
W.J
. Bai
ley
W. M
onto
ya
C.H
. Sch
roed
er
S. L
ewis
R
. Ber
ings
on
C. A
llen
D. S
tric
klan
d R
.R. A
ndre
ws
H. M
alie
paar
d 19
88
R.M
. Hop
per
W. A
. W
entz
A
. Ols
en
W.J
. Bai
ley
W. M
onto
ya
M.A
. Joh
nson
S
. Lew
is
R. B
erin
gson
C
. Alle
n D
. Str
ickl
and
R.R
. And
rew
s K
. Llo
yd
H. M
alie
paar
d 19
89
R.M
. Hop
per
W. A
. W
entz
K
.L. C
ool
W.J
. Bai
ley
W. M
onto
ya
L.A
. Jon
es
S. L
ewis
R
. Ber
ings
on
B. A
lexa
nder
D
. Str
ickl
and
R.R
. And
rew
s K
. Llo
yd
H. M
alie
paa
rd
R.M
. Hop
per
W. A
. W
entz
K
.L. C
ool
W.J
. Bai
ley
W. M
onto
ya
L.A
. Jon
es
S. L
ewis
R
. Ber
ings
on
B. A
lexa
nder
J.
Tal
bot
R.R
. And
rew
s K
. Llo
yd
H. M
alie
paar
d 19
91
R.M
. Hop
per
J. K
ram
er
K.L
. Coo
l W
.J. B
aile
y W
. Mon
toya
L.
A. J
ones
S
. Lew
is
R. B
erin
gson
B
. Ale
xand
er
J. T
albo
t R
.R. A
ndre
ws
K. L
loyd
H
. Mal
iepa
ard
1992
R
.M. H
oppe
r J.
Kra
mer
K
.L. C
ool
W.J
. Bai
ley
W. M
onto
ya
L.A
. Jon
es
S. L
ewis
R
. Ber
ings
on
B. A
lexa
nder
J.
Tal
bot
R.R
. And
rew
s K
. Llo
yd
D. S
herr
att
1993
R
.M. H
oppe
r J.
Kra
mer
T
.C. H
inz
W. S
heet
s W
. Mon
toya
K
. L. C
ool
G. D
uffy
R
. Ber
ings
on
V. B
evill
P
. Pet
era
R.R
. And
rew
s D
. Mel
ton
H.M
. Hun
t 19
94
P. O
lson
J.
Kra
mer
T
.C. H
inz
W. S
heet
s W
. Mon
toya
K
. L. C
ool
G. D
uffy
R
. Ber
ings
on
V. B
evill
P
. Pet
era
R.R
. And
rew
s D
. Mel
ton
D. S
herr
att
1995
P
. Ols
on
J. K
ram
er
T.C
. Hin
z W
. She
ets
D. S
utcl
iffe
K. L
. Coo
l G
. Duf
fy
G. V
ande
l V
. Bev
ill
J. T
albo
t R
.R. A
ndre
ws
D. M
elto
n D
. She
rrat
t 19
96
J.K
. Rin
gelm
an
J. K
ram
er
T.C
. Hin
z W
. She
ets
D. S
utcl
iffe
K. T
rego
G
. Duf
fy
G. V
ande
l V
. Bev
ill
R. R
othw
ell
R.R
. And
rew
s D
. Mel
ton
D. S
herr
att
1997
J.
Lip
scom
b J.
Kra
mer
T
.C. H
inz
W. S
heet
s D
. Sut
cliff
e K
. Tre
go
G. D
uffy
G
. Van
del
V. B
evill
W
. Wic
hers
R
.R. A
ndre
ws
D. S
tew
art
D. S
herr
att
1998
J.
Mum
ma
J. K
ram
er
T.C
. Hin
z K
. Nel
son
S.R
. Gon
zale
s R
. Kre
il G
. Duf
fy
G. V
ande
l V
. Bev
ill
W. W
iche
rs
B. M
arkh
am
D. S
tew
art
D. S
herr
att
1999
W
. Gra
ul
J. K
ram
er
T.C
. Hin
z K
. Nel
son
B. H
ale
R. K
reil
G. D
uffy
G
. Van
del
V. B
evill
W
. Wic
hers
B
. Mar
kham
D
. Ste
war
t D
. She
rrat
t W
. Gra
ul
J. K
ram
er
J. H
erbe
rt
K. N
elso
n B
. Hal
e R
. Kre
il R
. Hat
cher
G
. Van
del
V. B
evill
W
. Wic
hers
B
. Mar
kham
D
. Ste
war
t D
. She
rrat
t 20
01
W. G
raul
J.
Kra
mer
J.
Her
bert
K
. Nel
son
B. H
ale
R. K
reil
R. H
atch
er
G. V
ande
l V
. Bev
ill
W. W
iche
rs
B. M
arkh
am
D. S
tew
art
D. S
herr
att
2002
J.
Ver
Ste
eg
J. K
ram
er
J. H
erbe
rt
K. N
elso
n L.
Rio
s R
. Kre
il A
. Peo
ples
G
. Van
del
V. B
evill
W
. Wic
hers
B
. Mar
kham
D
. Ste
war
t D
. She
rrat
t 20
03
J. V
er S
teeg
J.
Kra
mer
J.
Her
bert
K
. Nel
son
L. R
ios
R. K
reil
A. P
eopl
es
G. V
ande
l V
. Bev
ill
W. W
iche
rs
J. S
kren
ek
D. S
tew
art
D. S
herr
att
2004
J.
Ver
Ste
eg
J. K
ram
er
J. H
erbe
rt
K. N
elso
n R
J K
irkpa
tric
k R
. Kre
il A
. Peo
ples
G
. Van
del
V. B
evill
W
. Wic
hers
J.
Skr
enek
D
. Ste
war
t D
. She
rrat
t 20
05
J. V
er S
teeg
J.
Kra
mer
J.
Her
bert
K
. Nel
son
RJ
Kirk
patr
ick
R. K
reil
A. P
eopl
es
G. V
ande
l V
. Bev
ill
W. W
iche
rs
J. S
kren
ek
D. S
tew
art
H. H
unt
2006
J.
Ver
Ste
eg
J. K
ram
er
J. H
erbe
rt
K. N
elso
n B
. Tho
mps
on
R. K
reil
A. P
eopl
es
G. V
ande
l V
. Bev
ill
J. E
mm
eric
h R
. Mill
son
S. F
leck
H
. Hun
t 20
07
J. V
er S
teeg
J.
Kra
mer
J.
Her
bert
K
. Nel
son
B. T
hom
pson
R
. Kre
il A
. Peo
ples
G
. Van
del
V. B
evill
J.
Em
mer
ich
R. M
illso
n S
. Fle
ck
H. H
unt
2008
J.
Ver
Ste
eg
J. K
ram
er
J. H
erbe
rt
K. N
elso
n T
. Fry
barg
er
R. K
reil
A. P
eopl
es
G. V
ande
l V
. Bev
ill
J. E
mm
eric
h J.
Alle
n S
. Fle
ck
H. H
unt
2009
J.
Ver
Ste
eg
J. K
ram
er
J. H
erbe
rt
K. N
elso
n J.
Lan
e R
. Kre
il M
. O'M
elia
T
. Lei
f V
. Bev
ill
J. E
mm
eric
h J.
Alle
n S
. Fle
ck
K. C
alle
le
J. V
er S
teeg
J.
Kra
mer
J.
Her
bert
K
. Nel
son
J. L
ane
R. K
reil
M. O
'Mel
ia
T. L
eif
V. B
evill
J.
Em
mer
ich
J. A
llen
S. F
leck
L.
Sai
geon
20
11
J. V
er S
teeg
J.
Kra
mer
J.
Her
bert
T
. McC
oy
J. L
ane
R. K
reil
M. O
'Mel
ia
T. L
eif
D. M
orris
on
J. E
mm
eric
h J.
Alle
n S
. Fle
ck
L. S
aige
on
2012
J.
Ver
Ste
eg
J. K
ram
er
G. P
aule
y T
. McC
oy
C. B
aca
R. K
reil
C. E
ndic
ott
T. L
eif
D. M
orris
on
J. E
mm
eric
h J.
Alle
n L.
Yon
ge
L. S
aige
on
2013
J.
Ver
Ste
eg
J. K
ram
er
G. P
aule
y S
. Tay
lor
C. B
aca
R. K
reil
C. E
ndic
ott
T. L
eif
D. M
orris
on
J. E
mm
eric
h J.
Alle
n L.
Yon
ge
L. S
aige
on
2014
J.
Ver
Ste
eg
J. K
ram
er
J. V
ore
S. T
aylo
r C
. Bac
a R
. Kre
il C
. End
icot
t T
. Lei
f D
. Mor
rison
S
. Sm
ith
J. A
llen
L. Y
onge
L.
Sai
geon
20
15
J. V
er S
teeg
B
. Sim
pson
J.
Vor
e S
. Tay
lor
S. L
iley
J. W
illia
ms
C. E
ndic
ott
T. L
eif
D. M
orris
on
S. S
mith
M
. Bes
ko
L. Y
onge
L.
Sai
geon
2016
J.
Ver
Ste
eg
J. G
eorg
e J.
Vor
e K
. Dec
ker
S. L
iley
J. W
illia
ms
J. S
haw
T
. Lei
f D
. Mor
rison
S
. Sm
ith
M. B
esko
L.
Yon
ge
Vac
ant
2017
J.
Ver
Ste
eg
J. G
eorg
e J.
Vor
e A
. Har
din
S. L
iley
J. W
illia
ms
J. S
haw
T
. Lei
f D
. Mor
rison
S
. Sm
ith
M. B
esko
B
. Elk
in
B. K
irych
uk
2018
J.
Ver
Ste
eg
J. G
eorg
e J.
Vor
e A
. Har
din
S. L
iley
J. W
illia
ms
J. S
haw
T
. Lei
f D
. Mor
rison
S
. Sm
ith
M. B
esko
B
. Elk
in
B. K
irych
uk
2019
J.
Ver
Ste
eg
J. G
eorg
e J.
Vor
e A
. Har
din
S. L
iley
J. W
illia
ms
J. S
haw
T
. Lei
f S
.Old
enbu
rger
A
. Bru
ce
M. B
esko
B
. Elk
in
B. K
irych
uk
J. V
er S
teeg
J.
Geo
rge
B. W
akel
ing
A. H
ardi
n S
. Lile
y J.
Will
iam
s J.
Sha
w
T. K
irsch
enm
ann
S.O
lden
burg
er
A. B
ruce
M
. Bes
ko
B. E
lkin
B
. Kiry
chuk
FIL
E: S
:\MB
MO
\CF
_D\P
RO
JEC
TS
\AD
MIN
IST
RA
TIV
E\H
IST
OR
IC\C
F M
EM
BE
RS
.XLS

Central Flyway Databook 202012/22/2020
CE
NT
RA
L F
LY
WA
Y W
AT
ER
FO
WL
TE
CH
NIC
AL
CO
MM
ITT
EE
19
54-2
020
81
CO
K
S
MT
N
E
NM
N
D
OK
S
D
TX
W
YA
BN
WT
SK
1954
J.
R. G
rieb
J. C
oats
W
.G. F
reem
an
H.W
. Mill
er
H.C
. Pic
kens
B
. Fas
hing
baue
r R
.D. G
ray
E.H
. Sm
ith
J.R
. Sin
glet
on
R. L
aPat
ters
on
1955
J.
R. G
rieb
J. C
oats
W
.G. F
reem
an
H.W
. Mill
er
H.C
. Pic
kens
B
. Fas
hing
baue
r M
. Dod
son
R. M
urdy
J.
R. S
ingl
eton
R
.M. B
allo
u 19
56
J.R
. Grie
b O
. Gas
swin
t W
.G. F
reem
an
H.W
. Mill
er
L. L
ee
C.H
. Sch
roed
er
M. D
odso
n R
. Mur
dy
J.R
. Sin
glet
on
R.M
. Bal
lou
1957
J.
R. G
rieb
O. G
assw
int
W.G
. Fre
eman
H
.W. M
iller
L.
Lee
C
.H. S
chro
eder
B
. Atk
ins
R. M
urdy
J.
R. S
ingl
eton
R
.M. B
allo
u 19
58
J.R
. Grie
b O
. Gas
swin
t W
.G. F
reem
an
H.W
. Mill
er
W.S
. Hue
y C
.H. S
chro
eder
J.
F. S
ykor
a M
.E.
And
erso
n J.
R. S
ingl
eton
R
.M. B
allo
u J.
L. N
elso
n 19
59
J.R
. Grie
b D
.C. C
olem
an
W.G
. Fre
eman
H
.W. M
iller
W
.S. H
uey
C.H
. Sch
roed
er
J.F
. Syk
ora
M.E
. A
nder
son
J.R
. Sin
glet
on
R.M
. Bal
lou
J.L.
Nel
son
1960
J.
R. G
rieb
D.C
. Col
eman
W
.G. F
reem
an
G. S
child
man
W
.S. H
uey
C.H
. Sch
roed
er
F.F
. Cop
elin
M
.E.
And
erso
n J.
R. S
ingl
eton
G
.F. W
rake
stra
w
J.L.
Nel
son
1961
J.
R. G
rieb
D.C
. Col
eman
D
.W.
Witt
G
. Sch
ildm
an
W.S
. Hue
y C
.H. S
chro
eder
F
.F. C
opel
in
M.E
. A
nder
son
J.R
. Sin
glet
on
G.F
. Wra
kest
raw
J.
L. N
elso
n 19
62
J.R
. Grie
b D
.C. C
olem
an
D.W
. W
itt
G. S
child
man
W
.S. H
uey
C.H
. Sch
roed
er
F.F
. Cop
elin
M
.E.
And
erso
n E
.A. W
alke
r G
.F. W
rake
stra
w
J.L.
Nel
son
1963
J.
R. G
rieb
M.D
. Sch
will
ing
D.W
. W
itt
G. S
child
man
L.
Gor
don
C.H
. Sch
roed
er
F.F
. Cop
elin
R
.D. H
art
A.J
. Spr
ings
G
.F. W
rake
stra
w
J.L.
Nel
son
1964
J.
R. G
rieb
M.D
. Sch
will
ing
D.W
. W
itt
G. S
child
man
G
.W. M
erril
l C
.H. S
chro
eder
C
.O. G
illia
m
R.D
. Har
t A
.J. S
prin
gs
G.F
. Wra
kest
raw
R
. Cal
dwel
l 19
65
J.R
. Grie
b M
.D. S
chw
illin
g D
.W.
Witt
G
. Sch
ildm
an
G.W
. Mer
rill
C.H
. Sch
roed
er
C.O
. Gill
iam
C
. Tw
edt
A.J
. Spr
ings
G
.F. W
rake
stra
w
R. C
aldw
ell
1966
J.
R. G
rieb
M.D
. Sch
will
ing
D.W
. W
itt
G. S
child
man
G
.W. M
erril
l C
.H. S
chro
eder
C
.O. G
illia
m
C. T
wed
t A
.J. S
prin
gs
G.F
. Wra
kest
raw
W
. Wis
hart
R
. Cal
dwel
l 19
67
J.R
. Grie
b M
.D. S
chw
illin
g D
.W.
Witt
G
. Sch
ildm
an
G.W
. Mer
rill
C.H
. Sch
roed
er
C.O
. Gill
iam
R
.C. D
rew
ien
C.D
. Stu
tzen
bake
r G
.F. W
rake
stra
w
W. W
isha
rt
R. C
aldw
ell
1968
J.
R. G
rieb
M.D
. Sch
will
ing
D.W
. W
itt
G. S
child
man
G
.W. M
erril
l C
.H. S
chro
eder
L.
Due
R
.C. D
rew
ien
C.D
. Stu
tzen
bake
r G
.F. W
rake
stra
w
W. W
isha
rt
R. C
aldw
ell
1969
H
.D. F
unk
M.D
. Sch
will
ing
D.W
. W
itt
G. S
child
man
G
.W. M
erril
l C
.H. S
chro
eder
L.
Due
R
.C. D
rew
ien
C.D
. Stu
tzen
bake
r G
.F. W
rake
stra
w
D. N
eave
D
.S. G
ray
1970
H
.D. F
unk
M.D
. Sch
will
ing
D.W
. W
itt
G. S
child
man
G
.W. M
erril
l C
.H. S
chro
eder
L.
Due
T
. Kuc
k C
.D. S
tutz
enba
ker
G.F
. Wra
kest
raw
D
. Nea
ve
D.S
. Gra
y 19
71
H.D
. Fun
k M
.D. S
chw
illin
g D
.W.
Witt
G
. Sch
ildm
an
G.W
. Mer
rill
C.H
. Sch
roed
er
L. D
ue
T. K
uck
C.D
. Stu
tzen
bake
r G
.F. W
rake
stra
w
D. N
eave
D
.S. G
ray
1972
H
.D. F
unk
M.D
. Sch
will
ing
J. E
gan
G. S
child
man
G
.W. M
erril
l C
.H. S
chro
eder
L.
Due
T
. Kuc
k C
.D. S
tutz
enba
ker
G.F
. Wra
kest
raw
D
. Nea
ve
D.S
. Gra
y 19
73
H.D
. Fun
k M
.D. S
chw
illin
g J.
Ega
n G
. Sch
ildm
an
J.L.
San
ds
C.H
. Sch
roed
er
L. D
ue
T. K
uck
C.D
. Stu
tzen
bake
r G
.F. W
rake
stra
w
T. B
urge
ss
D.S
. Gra
y 19
74
H.D
. Fun
k M
.D. S
chw
illin
g J.
Ega
n G
. Sch
ildm
an
J.L.
San
ds
C.H
. Sch
roed
er
L. D
ue
T. K
uck
C.D
. Stu
tzen
bake
r G
.F. W
rake
stra
w
H. W
eave
r D
.S. G
ray
1975
H
.D. F
unk
M.D
. Sch
will
ing
D.W
. W
itt
N. D
ey
J.L.
San
ds
C.H
. Sch
roed
er
L. D
ue
T. K
uck
C.D
. Stu
tzen
bake
r G
.F. W
rake
stra
w
H. W
eave
r D
.S. G
ray
1976
H
.D. F
unk
M.D
. Sch
will
ing
D.W
. W
itt
N. D
ey
J.L.
San
ds
C.H
. Sch
roed
er
L. D
ue
T. K
uck
C.D
. Stu
tzen
bake
r G
.F. W
rake
stra
w
H. W
eave
r D
.S. G
ray
1977
H
.D. F
unk
M.D
. Sch
will
ing
D.W
. W
itt
N. D
ey
J.L.
San
ds
C.H
. Sch
roed
er
L. D
ue
T. K
uck
C.D
. Stu
tzen
bake
r G
.F. W
rake
stra
w
H. W
eave
r D
. Bre
wst
er
1978
H
.D. F
unk
M.J
. Kra
ft D
.W.
Witt
N
. Dey
J.
L. S
ands
C
.H. S
chro
eder
L.
Due
T
. Kuc
k C
.D. S
tutz
enba
ker
R. S
aul
H. W
eave
r D
. Bre
wst
er
1979
H
.D. F
unk
M.J
. Kra
ft D
.W.
Witt
J.
Hyl
and
J.L.
San
ds
C.H
. Sch
roed
er
L. D
ue
T. K
uck
C.D
. Stu
tzen
bake
r R
. Sau
l H
. Wea
ver
D. B
rew
ster
19
80
H.D
. Fun
k M
.J. K
raft
T.C
. Hin
z J.
Hyl
and
J.L.
San
ds
C.H
. Sch
roed
er
L. D
ue
T. K
uck
C.D
. Stu
tzen
bake
r R
. Sau
l H
. Wea
ver
S.
Bar
ber
1981
H
.D. F
unk
M.J
. Kra
ft T
.C. H
inz
J. H
ylan
d J.
L. S
ands
C
.H. S
chro
eder
L.
Due
T
. Kuc
k C
.D. S
tutz
enba
ker
R. S
aul
H. W
eave
r M
. Kill
aby
1982
H
.D. F
unk
M.J
. Kra
ft T
.C. H
inz
J. H
ylan
d J.
L. S
ands
M
.A. J
ohns
on
L. D
ue
T. K
uck
C.D
. Stu
tzen
bake
r R
. Sau
l H
. Wea
ver
D. B
rew
ster
19
83
H.D
. Fun
k M
.J. K
raft
T.C
. Hin
z P
. J.
Gab
ig
G. D
owne
r M
.A. J
ohns
on
L. D
ue
R. F
owle
r C
.D. S
tutz
enba
ker
R. S
aul
H. W
eave
r D
. Bre
wst
er
1984
H
.D. F
unk
M.J
. Kra
ft T
.C. H
inz
P. J
. G
abig
J.
Her
ring
M.A
. Joh
nson
L.
Due
S
.G. S
imps
on
C.D
. Stu
tzen
bake
r R
. Sau
l H
. Wea
ver
D. B
rew
ster
19
85
H.D
. Fun
k M
.J. K
raft
T.C
. Hin
z P
. J.
Gab
ig
J. H
errin
g M
.A. J
ohns
on
M.E
. O'M
eilia
S
.G. S
imps
on
C.D
. Stu
tzen
bake
r R
. Sau
l H
. Wea
ver
D. B
rew
ster
19
86
H.D
. Fun
k M
.J. K
raft
T.C
. Hin
z P
. J.
Gab
ig
J. H
errin
g M
.A. J
ohns
on
M.E
. O'M
eilia
S
.G. S
imps
on
D.W
. Witt
R
. Sau
l H
. Wea
ver
J. M
ulhe
rn
1987
H
.D. F
unk
M.J
. Kra
ft T
.C. H
inz
P. J
. G
abig
G
. Sch
mid
t M
.A. J
ohns
on
M.E
. O'M
eilia
S
.G. S
imps
on
R.L
. Jes
sen
R. S
aul
H. W
eave
r J.
Mul
hern
19
88
H.D
. Fun
k M
.J. K
raft
T.C
. Hin
z P
. J.
Gab
ig
J. W
ard
M.A
. Joh
nson
M
.E. O
'Mei
lia
S.G
. Sim
pson
R
.L. J
esse
n R
. Sau
l K
. Lun
gle
R. B
rom
ley
J. M
ulhe
rn
1989
H
.D. F
unk
M.J
. Kra
ft T
.C. H
inz
P. J
. G
abig
J.
War
d M
.A. J
ohns
on
M.E
. O'M
eilia
D
. Han
sen
R.L
. Jes
sen
R. S
aul
K. L
ungl
e R
. Bro
mle
y J.
Mul
hern
19
90
H.D
. Fun
k M
.J. K
raft
T.C
. Hin
z P
. J.
Gab
ig
J. W
ard
M.A
. Joh
nson
M
.E. O
'Mei
lia
S.J
. Vaa
R
.L. J
esse
n R
. Sau
l K
. Lun
gle
R. B
rom
ley
J. M
ulhe
rn
1991
H
.D. F
unk
M.J
. Kra
ft J.
Han
sen
P. J
. G
abig
J.
War
d M
.A. J
ohns
on
M.E
. O'M
eilia
S
.J. V
aa
R.L
. Jes
sen
R. S
aul
K. L
ungl
e R
. Bro
mle
y J.
Mul
hern
19
92
H.D
. Fun
k M
.J. K
raft
J. H
anse
n P
. J.
Gab
ig
B. H
ale
M.A
. Joh
nson
M
.E. O
'Mei
lia
S.J
. Vaa
R
.L. J
esse
n R
. Sau
l K
. Lun
gle
R. B
rom
ley
J. M
ulhe
rn
1993
H
.D. F
unk
M.J
. Kra
ft J.
Han
sen
P. J
. G
abig
B
. Hal
e M
.A. J
ohns
on
M.E
. O'M
eilia
S
.J. V
aa
B. S
ulliv
an
R. S
aul
K. L
ungl
e R
. Bro
mle
y J.
Mul
hern
19
94
J.K
. Rin
gelm
an
M.J
. Kra
ft J.
Han
sen
P. J
. G
abig
B
. Hal
e M
.A. J
ohns
on
M.E
. O'M
eilia
S
.J. V
aa
B. S
ulliv
an
R. S
aul
K. L
ungl
e R
. Bro
mle
y J.
Mu
lher
n 19
95
J.K
. Rin
gelm
an
M.J
. Kra
ft J.
Han
sen
P. J
. G
abig
B
. Hal
e M
.A. J
ohns
on
M.E
. O'M
eilia
S
.J. V
aa
B. S
ulliv
an
L. R
ober
ts
K. L
ungl
e R
. Bro
mle
y J.
Mul
hern
19
96
J.K
. Rin
gelm
an
M.J
. Kra
ft J.
Han
sen
P. J
. G
abig
B
. Hal
e M
.A. J
ohns
on
M.E
. O'M
eilia
S
.J. V
aa
B. S
ulliv
an
L. R
ober
ts
K. L
ungl
e R
. Bro
mle
y J.
Mul
hern
19
97
J. G
amm
onle
y M
.J. K
raft
J. H
anse
n P
. J.
Gab
ig
T. M
itchu
sson
M
.A. J
ohns
on
M.E
. O'M
eilia
S
.J. V
aa
B. S
ulliv
an
L. R
ober
ts
K. L
ungl
e R
. Cas
e J.
Mul
hern
19
98
J. G
amm
onle
y M
.J. K
raft
J. H
anse
n P
. J.
Gab
ig
T. M
itchu
sson
M
.A. J
ohns
on
M.E
. O'M
eilia
S
.J. V
aa
B. S
ulliv
an
L. R
ober
ts
K. L
ungl
e R
. Cas
e D
. McK
inno
n 19
99
J. G
amm
onle
y M
.J. K
raft
J. H
anse
n M
. Vrt
iska
T
. Mitc
huss
on
M.A
. Joh
nson
M
.E. O
'Mei
lia
S.J
. Vaa
B
. Sul
livan
L.
Rob
erts
K
. Lun
gle
R. C
ase
D. M
cKin
non
2000
J.
Gam
mon
ley
M.J
. Kra
ft J.
Han
sen
M. V
rtis
ka
T. M
itchu
sson
M
.A. J
ohns
on
M.E
. O'M
eilia
S
.J. V
aa
D. M
orris
on
L. R
ober
ts
K. L
ungl
e R
. Cas
e D
. McK
inno
n 20
01
J. G
amm
onle
y M
.J. K
raft
J. H
anse
n M
. Vrt
iska
T
. Mitc
huss
on
M.A
. Joh
nson
M
.E. O
'Mei
lia
S.J
. Vaa
D
. Mor
rison
L.
Rob
erts
K
. Lun
gle
R. C
ase
D. M
cKin
non
2002
J.
Gam
mon
ley
M.J
. Kra
ft J.
Han
sen
M. V
rtis
ka
T. M
itchu
sson
M
.A. J
ohns
on
M.E
. O'M
eilia
S
.J. V
aa
D. M
orris
on
L. R
ober
ts
K. L
ungl
e R
. Cas
e D
. McK
inno
n 20
03
J. G
amm
onle
y M
.J. K
raft
J. H
anse
n M
. Vrt
iska
T
. Mitc
huss
on
M.A
. Joh
nson
M
.E. O
'Mei
lia
S.J
. Vaa
D
. Mor
rison
L.
Rob
erts
R
. Cas
e D
. Bre
wst
er
2004
J.
Gam
mon
ley
M.J
. Kra
ft J.
Han
sen
M. V
rtis
ka
T. M
itchu
sson
M
.A. J
ohns
on
M.E
. O'M
eilia
S
.J. V
aa
D. M
orris
on
L. R
ober
ts
R. M
illso
n R
. Cas
e D
. Bre
wst
er
2005
J.
Gam
mon
ley
M.J
. Kra
ft J.
Han
sen
M. V
rtis
ka
T. M
itchu
sson
M
.A. J
ohns
on
M.E
. O'M
eilia
S
.J. V
aa
D. M
orris
on
L. R
ober
ts
R. M
illso
n R
. Cas
e M
. Gol
lop
2006
J.
Gam
mon
ley
M.J
. Kra
ft J.
Han
sen
M. V
rtis
ka
T. M
itchu
sson
M
.A. J
ohns
on
M.E
. O'M
eilia
S
.J. V
aa
D. M
orris
on
L. R
ober
ts
K. L
ungl
e R
. Cas
e M
. Gol
lop
2007
J.
Gam
mon
ley
F.M
. M
cNew
J.
Han
sen
M. V
rtis
ka
T. M
itchu
sson
M
.A. J
ohns
on
M.E
. O'M
eilia
S
.J. V
aa
D. M
orris
on
L. R
ober
ts
K. L
ungl
e R
. Cas
e M
. Gol
lop
2008
J.
Gam
mon
ley
F.M
. M
cNew
J.
Han
sen
M. V
rtis
ka
T. M
itchu
sson
M
.A. J
ohns
on
M.E
. O'M
eilia
S
.J. V
aa
D. M
orris
on
L. R
ober
ts
K. L
ungl
e M
. Gol
lop
2009
J.
Gam
mon
ley
F.M
. M
cNew
J.
Han
sen
M. V
rtis
ka
T. M
itchu
sson
M
.A. J
ohns
on
J. R
icha
rdso
n S
.J. V
aa
D. M
orris
on
L. R
ober
ts
J. C
asw
ell
M. G
ollo
p 20
10
J. G
amm
onle
y F
.M.
McN
ew
J. H
anse
n M
. Vrt
iska
T
. Mitc
huss
on
M.A
. Joh
nson
J.
Ric
hard
son
S.J
. Vaa
D
. Mor
rison
L.
Rob
erts
J.
Cas
wel
l M
. Gol
lop
2011
J.
Gam
mon
ley
F.M
. M
cNew
J.
Han
sen
M. V
rtis
ka
B. H
ale
M.A
. Joh
nson
J.
Ric
hard
son
R. M
uran
o K
. Kra
ai
L. R
ober
ts
J. C
asw
ell
N. M
cCut
chen
M
. Gol
lop
2012
J.
Gam
mon
ley
T. B
idro
wsk
i J.
Han
sen
M. V
rtis
ka
J. S
ands
M
.A. J
ohns
on
J. R
icha
rdso
n R
. Mur
ano
K. K
raai
L.
Rob
erts
J.
Cas
wel
l S
. Car
rière
M
. G
ollo
p 20
13
J. G
amm
onle
y T
. Bid
row
ski
J. H
anse
n M
. Vrt
iska
K
. Mad
den
M.A
. Joh
nson
J.
Ric
hard
son
R. M
uran
o K
. Kra
ai
L. R
ober
ts
J. C
asw
ell
S. C
arriè
re
M.
Gol
lop
2014
J.
Gam
mon
ley
T. B
idro
wsk
i J.
Han
sen
M. V
rtis
ka
K. M
adde
n M
.A. J
ohns
on
J. R
icha
rdso
n R
. Mur
ano
K. K
raai
L.
Rob
erts
J.
Cas
wel
l S
. Car
rière
K
. C
onki
n 20
15
J. G
amm
onle
y T
. Bid
row
ski
J. H
anse
n M
. Vrt
iska
K
. Mad
den
M.A
. Joh
nson
J.
Ric
hard
son
R. M
uran
o K
. Kra
ai
L. R
ober
ts
J. C
asw
ell
S. C
arriè
re
K.
Con
kin
2016
J.
Gam
mon
ley
T. B
idro
wsk
i J.
Han
sen
M. V
rtis
ka
M. C
line
M.L
. Szy
man
ski
J. R
icha
rdso
n R
. Mur
ano
K. K
raai
N
. Huc
k J.
Cas
wel
l S
. Car
rière
K
. Con
kin
2017
J.
Gam
mon
ley
T. B
idro
wsk
i J.
Han
sen
M. V
rtis
ka
M. C
line
M.L
. Szy
man
ski
J. R
icha
rdso
n R
. Mur
ano
K. K
raai
N
. Huc
k J.
Cas
wel
l S
. Car
rière
K
. Con
kin
2018
J.
Gam
mon
ley
T. B
idro
wsk
i J.
Han
sen
M. V
rtis
ka
M. C
line
M.L
. Szy
man
ski
J. R
icha
rdso
n R
. Mur
ano
K. K
raai
N
. Huc
k J.
Cas
wel
l S
. Car
rière
K
. Con
kin
2019
J.
Gam
mon
ley
T. B
idro
wsk
i J.
Han
sen
M. V
rtis
ka
M. C
line
M.L
. Szy
man
ski
J. R
icha
rdso
n R
. Mur
ano
K. K
raai
N
. Huc
k J.
Cas
wel
l S
. Car
rière
K
. Con
kin
M. V
rtis
ka /
W.
2020
J.
Gam
mon
ley
T. B
idro
wsk
i J.
Han
sen
Inse
lman
M
. Clin
e M
.L. S
zym
ansk
i J.
Ric
hard
son
R. M
uran
o K
. Kra
ai
N. S
mith
J.
Cas
wel
l S
. Car
rière
K
. Con
kin
FIL
E: S
:\MB
MO
\CF
_D\P
RO
JEC
TS
\AD
MIN
IST
RA
TIV
E\H
IST
OR
IC\C
F M
EM
BE
RS
.XLS

Central Flyway Databook 202012/22/2020
1970
1980
1990
2000
2010
2020
CE
NT
RA
L F
LY
WA
Y W
EB
LE
SS
MIG
RA
TO
RY
GA
ME
BIR
D T
EC
HN
ICA
L C
OM
MIT
TE
E
1966
-202
0
82
CO
K
S
MT
NE
N
M
ND
O
K
SD
T
X
WY
IA
A
RM
O
MN
M
BA
BN
WT
S
K
1966
J.
R. G
rieb
M.D
. Sch
will
ing
D.W
. Witt
G
. Sch
ildm
an
G.W
. Mer
rill
C.H
. Sch
roed
er
C.O
. Gill
iam
C
. Tw
edt
A.J
. Spr
ings
G
.F. W
rake
stra
w
K. S
adle
r E
. Kop
isch
ke
1967
H
.D. F
unk
M.D
. Sch
will
ing
D.W
. Witt
K
. Joh
nson
G
.W. M
erril
l C
.H. S
chro
eder
C
.O. G
illia
m
R.C
. Dre
wie
n C
.D. S
tutz
enba
ker
G.F
. Wra
kest
raw
G
. Klo
ngla
n K
. Sad
ler
E. K
opis
chke
19
68
H.D
. Fun
k M
.D. S
chw
illin
g D
.W. W
itt
K. J
ohns
on
G.W
. Mer
rill
C.H
. Sch
roed
er
C.O
. Gill
iam
R
.C. D
rew
ien
C.D
. Stu
tzen
bake
r G
.F. W
rake
stra
w
R. B
isho
p K
. Sad
ler
E. K
opis
chke
19
69
H.D
. Fun
k M
.D. S
chw
illin
g D
.W. W
itt
K. J
ohns
on
G.W
. Mer
rill
C.H
. Sch
roed
er
L. D
ue
T. K
uck
C.D
. Stu
tzen
bake
r G
.F. W
rake
stra
w
R. B
isho
p K
. Sad
ler
E. K
opis
chke
H.D
. Fun
k M
.D. S
chw
illin
g D
.W. W
itt
K. J
ohns
on
G.W
. Mer
rill
C.H
. Sch
roed
er
L. D
ue
T. K
uck
T. L
. Cla
rk
G.F
. Wra
kest
raw
R
. Bis
hop
K. S
adle
r E
. Kop
isch
ke
1971
C
.E. B
raun
M
.D. S
chw
illin
g D
.W. W
itt
J.T
. Sw
eet
J. L
. San
ds
C.H
. Sch
roed
er
L. D
ue
T. K
uck
T. L
. Cla
rk
G.F
. Wra
kest
raw
R
. Bis
hop
K. S
adle
r E
. Kop
isch
ke
1972
C
.E. B
raun
M
.D. S
chw
illin
g D
.W. W
itt
J.T
. Sw
eet
J. L
. San
ds
C.H
. Sch
roed
er
L. D
ue
T. K
uck
K. E
. Gam
ble
G.F
. Wra
kest
raw
A
. Far
ris
K. S
adle
r E
. Kop
isch
ke
1973
C
.E. B
raun
M
.J. K
raft
D.W
. Witt
J.
T. S
wee
t J.
L. S
ands
C
.H. S
chro
eder
L.
Due
T
. Kuc
k K
. E. G
ambl
e G
.F. W
rake
stra
w
A. F
arris
K
. Sad
ler
E. K
opis
chke
19
74
C.E
. Bra
un
M.J
. Kra
ft D
.W. W
itt
J.T
. Sw
eet
J. L
. San
ds
C.H
. Sch
roed
er
L. D
ue
T. K
uck
T. L
. Cla
rk
G.F
. Wra
kest
raw
A
. Far
ris
K. S
adle
r E
. Kop
isch
ke
1975
C
.E. B
raun
M
.J. K
raft
D.W
. Witt
J.
T. S
wee
t J.
L. S
ands
C
.H. S
chro
eder
L.
Due
T
. Kuc
k J.
Dun
ks
G.F
. Wra
kest
raw
C
. Sch
war
tz
K. S
adle
r E
. Kop
isch
ke
1976
C
.E. B
raun
M
.J. K
raft
D.W
. Witt
J.
T. S
wee
t J.
L. S
ands
C
.H. S
chro
eder
L.
Due
T
. Kuc
k J.
Dun
ks
G.F
. Wra
kest
raw
C
. Sch
war
tz
K. S
adle
r R
.L. J
esse
n 19
77
C.E
. Bra
un
M.J
. Kra
ft D
.W. W
itt
J.T
. Sw
eet
J. L
. San
ds
C.H
. Sch
roed
er
L. D
ue
T. K
uck
J. D
unks
G
.F. W
rake
stra
w
R. G
eorg
e K
. Sad
ler
R.L
. Jes
sen
1978
C
.E. B
raun
M
.J. K
raft
D.W
. Witt
J.
T. S
wee
t J.
L. S
ands
C
.H. S
chro
eder
L.
Due
T
. Kuc
k J.
Dun
ks
G.F
. Wra
kest
raw
R
. Geo
rge
K. S
adle
r R
.L. J
esse
n 19
79
C.E
. Bra
un
M.J
. Kra
ft D
.W. W
itt
J.T
. Sw
eet
J. L
. San
ds
C.H
. Sch
roed
er
L. D
ue
T. K
uck
J. D
unks
G
.F. W
rake
stra
w
R. G
eorg
e K
. Sad
ler
R.L
. Jes
sen
C.E
. Bra
un
M.J
. Kra
ft T
.C. H
inz
J.T
. Sw
eet
J. L
. San
ds
C.H
. Sch
roed
er
L. D
ue
T. K
uck
J. D
unks
R
. Sau
l R
. Geo
rge
K. S
adle
r R
.L. J
esse
n
1981
H
.D. F
unk
M.J
. Kra
ft T
.C. H
inz
J.T
. Sw
eet
J. L
. San
ds
C.H
. Sch
roed
er
L. D
ue
T. K
uck
C.D
. Stu
tzen
bake
r R
. Sau
l R
. Geo
rge
K. S
adle
r R
.L. J
esse
n 19
82
H.D
. Fun
k M
.J. K
raft
T.C
. Hin
z J.
Hyl
and
J. L
. San
ds
M.A
. Joh
nson
L.
Due
T
. Kuc
k R
. Geo
rge
R. S
aul
R. B
isho
p K
. Sad
ler
R.L
. Jes
sen
1983
H
.D. F
unk
G.J
. Hor
ak
T.C
. Hin
z J.
Hyl
and
G. D
owne
r M
.A. J
ohns
on
L. D
ue
T. K
uck
R. G
eorg
e R
. Sau
l R
. Bis
hop
K. S
adle
r R
.L. J
esse
n 19
84
H.D
. Fun
k G
.J. H
orak
T
.C. H
inz
P.J
. Gab
ig
G. D
owne
r M
.A. J
ohns
on
L. D
ue
S.G
. Sim
pson
R
. Geo
rge
R. S
aul
R. B
isho
p K
. Sad
ler
R.L
. Jes
sen
1985
H
.D. F
unk
G.J
. Hor
ak
T.C
. Hin
z P
.J. G
abig
J.
Her
ring
M.A
. Joh
nson
L.
Due
S
.G. S
imps
on
R. G
eorg
e R
. Sau
l R
. Bis
hop
K. S
adle
r R
.L. J
esse
n 19
86
H.D
. Fun
k G
.J. H
orak
T
.C. H
inz
P.J
. Gab
ig
J. H
errin
g S
.C. K
ohn
M.E
. O'M
eilia
S
.G. S
imps
on
R. G
eorg
e R
. Sau
l R
. Bis
hop
S. Y
aich
D
.L. H
alle
tt R
.L. J
esse
n 19
87
H.D
. Fun
k G
.J. H
orak
T
.C. H
inz
P.J
. Gab
ig
J. G
onza
les
S.C
. Koh
n M
.E. O
'Mei
lia
S.G
. Sim
pson
R
. Geo
rge
R. S
aul
R. B
isho
p S
. Yai
ch
D.L
. Hal
lett
R.L
. Jes
sen
1988
H
.D. F
unk
G.J
. Hor
ak
T.C
. Hin
z P
.J. G
abig
J.
War
d S
.C. K
ohn
M.E
. O'M
eilia
S
.G. S
imps
on
R. G
eorg
e R
. Sau
l R
. Bis
hop
S. Y
aich
D
.L. H
alle
tt T
. Ebe
rhar
dt
1989
H
.D. F
unk
G.J
. Hor
ak
T.C
. Hin
z P
.J. G
abig
J.
War
d S
.C. K
ohn
M.E
. O'M
eilia
S
.G. S
imps
on
R. G
eorg
e R
. Sau
l R
. Bis
hop
S. Y
aich
D
.L. H
alle
tt T
. Ebe
rhar
dt
H.D
. Fun
k M
.J. K
raft
T.C
. Hin
z P
.J. G
abig
J.
War
d S
.C. K
ohn
M.E
. O'M
eilia
S
.J. V
aa
R. G
eorg
e R
. Sau
l R
. Bis
hop
S. Y
aich
J.
H. S
chul
z T
. Ebe
rhar
dt
1991
H
.D. F
unk
M.J
. Kra
ft J.
Han
sen
P.J
. Gab
ig
J. W
ard
S.C
. Koh
n M
.E. O
'Mei
lia
S.J
. Vaa
R
. Geo
rge
R. S
aul
G. Z
enne
r S
. Yai
ch
J.H
. Sch
ulz
A. B
erne
r 19
92
H.D
. Fun
k M
.J. K
raft
J. H
anse
n P
.J. G
abig
B
. Hal
e S
.C. K
ohn
M.E
. O'M
eilia
S
.J. V
aa
R. G
eorg
e R
. Sau
l G
. Zen
ner
S. Y
aich
J.
H. S
chul
z A
. Ber
ner
1993
H
.D. F
unk
M.J
. Kra
ft J.
Han
sen
P.J
. Gab
ig
B. H
ale
S.C
. Koh
n M
.E. O
'Mei
lia
S.J
. Vaa
J.
Rob
erso
n R
. Sau
l G
. Zen
ner
T. M
oser
J.
H. S
chul
z A
. Ber
ner
1994
J.
K. R
inge
lman
M
.J. K
raft
J. H
anse
n P
.J. G
abig
B
. Hal
e S
.C. K
ohn
M.E
. O'M
eilia
S
.J. V
aa
J. R
ober
son
R. S
aul
G. Z
enne
r T
. Mos
er
J.H
. Sch
ulz
A. B
erne
r 19
95
J.K
. Rin
gelm
an
H. H
ands
J.
Han
sen
P.J
. Gab
ig
B. H
ale
S.C
. Koh
n M
.E. O
'Mei
lia
S.J
. Vaa
J.
Rob
erso
n L.
Rob
erts
G
. Zen
ner
T. M
oser
J.
H. S
chul
z A
. Ber
ner
1996
J.
K. R
inge
lman
H
. Han
ds
J. H
anse
n P
.J. G
abig
B
. Hal
e S
.C. K
ohn
M.E
. O'M
eilia
S
.J. V
aa
J. R
ober
son
L. R
ober
ts
G. Z
enne
r T
. Mos
er
J.H
. Sch
ulz
A. B
erne
r M
. Gill
espi
e K
. Lun
gle
R. B
rom
ley
J. M
ulhe
rn
1997
J.
Gam
mon
ley
H. H
ands
J.
Han
sen
P.J
. Gab
ig
T. M
itchu
sson
S
.C. K
ohn
M.E
. O'M
eilia
S
.J. V
aa
J. R
ober
son
L. R
ober
ts
T. B
ogen
schu
tz
T. M
oser
J.
H. S
chul
z A
. Ber
ner
M. G
illes
pie
K. L
ungl
e R
. Bro
mle
y J.
Mul
hern
19
98
J. G
amm
onle
y H
. Han
ds
J. H
anse
n P
.J. G
abig
T
. Mitc
huss
on
S.C
. Koh
n M
.E. O
'Mei
lia
S.J
. Vaa
J.
Rob
erso
n L.
Rob
erts
T
. Bog
ensc
hutz
M
. Hill
J.
H. S
chul
z A
. Ber
ner
M. G
illes
pie
K. L
ungl
e R
. Cas
e D
. McK
inno
n 19
99
J. G
amm
onle
y H
. Han
ds
J. H
anse
n S
. Tay
lor
T. M
itchu
sson
S
.C. K
ohn
M.E
. O'M
eilia
S
.J. V
aa
J. R
ober
son
L. R
ober
ts
T. B
ogen
schu
tz
M. H
ill
J.H
. S
chul
z A
. Ber
ner
M. G
illes
pie
K. L
ungl
e R
. Cas
e D
. McK
inno
n ¹
J. G
amm
onle
y H
. Han
ds
J. H
anse
n S
. Tay
lor
T. M
itchu
sson
S
.C. K
ohn
M.E
. O'M
eilia
S
.J. V
aa
J. R
ober
son
L. R
ober
ts
K. L
ungl
e R
. Cas
e D
. McK
inno
n 20
01
J. G
amm
onle
y H
. Han
ds
J. H
anse
n S
. Tay
lor
T. M
itchu
sson
S
.C. K
ohn
M.E
. O'M
eilia
S
.J. V
aa
J. R
ober
son
L. R
ober
ts
K. L
ungl
e R
. Cas
e D
. McK
inno
n 20
02
J. G
amm
onle
y H
. Han
ds
J. H
anse
n S
. Tay
lor
T. M
itchu
sson
S
.C. K
ohn
M.E
. O'M
eilia
S
.J. V
aa
J. R
ober
son
L. R
ober
ts
K. L
ungl
e R
. Cas
e D
. McK
inno
n 20
03
J. G
amm
onle
y H
. Han
ds
J. H
anse
n S
. Tay
lor
T. M
itchu
sson
S
.C. K
ohn
M.E
. O'M
eilia
S
.J. V
aa
J. R
ober
son
L. R
ober
ts
R. C
ase
D. M
cKin
non
2004
J.
Gam
mon
ley
H. H
ands
J.
Han
sen
S. T
aylo
r T
. Mitc
huss
on
S.C
. Koh
n M
.E. O
'Mei
lia
S.J
. Vaa
J.
Rob
erso
n L.
Rob
erts
R
. Mill
son
R. C
ase
D. M
cKin
non
2005
J.
Gam
mon
ley
H. H
ands
J.
Han
sen
S. T
aylo
r T
. Mitc
huss
on
M.L
. Szy
man
ski
M.E
. O'M
eilia
S
.J. V
aa
J. R
ober
son
L. R
ober
ts
R. M
illso
n R
. Cas
e M
. Gol
lop
2006
J.
Gam
mon
ley
H. H
ands
J.
Han
sen
S. T
aylo
r T
. Mitc
huss
on
M.L
. Szy
man
ski
M.E
. O'M
eilia
S
.J. V
aa
J. R
ober
son
L. R
ober
ts
K. L
ungl
e R
. Cas
e M
. Gol
lop
2007
J.
Gam
mon
ley
H. H
ands
J.
Han
sen
J. L
usk
T. M
itchu
sson
M
.L. S
zym
ansk
i M
.E. O
'Mei
lia
S.J
. Vaa
J.
Rob
erso
n L.
Rob
erts
K
. Lun
gle
R. C
ase
M. G
ollo
p 20
08
J. G
amm
onle
y H
. Han
ds
J. H
anse
n J.
Lus
k T
. Mitc
huss
on
M.L
. Szy
man
ski
M.E
. O'M
eilia
S
.J. V
aa
J. R
ober
son
L. R
ober
ts
K. L
ungl
e M
. Gol
lop
2009
J.
Gam
mon
ley
H. H
ands
J.
Han
sen
J. L
usk
T. M
itchu
sson
M
.L. S
zym
ansk
i J.
Ric
hard
son
S.J
. Vaa
C
. Mas
on
L. R
ober
ts
J. C
asw
ell
M. G
ollo
p J.
Gam
mon
ley
F.M
. M
cNew
J.
Han
sen
J. L
usk
T. M
itchu
sson
M
.L. S
zym
ansk
i J.
Ric
hard
son
S.J
. Vaa
C
. Mas
on
L. R
ober
ts
J. C
asw
ell
M. G
ollo
p 20
11
J. G
amm
onle
y T
. Bid
row
ski
J. H
anse
n J.
Lus
k B
. Hal
e M
.L. S
zym
ansk
i J.
Ric
hard
son
R. M
uran
o C
. Mas
on
L. R
ober
ts
J. C
asw
ell
N. M
cCut
chen
M
. Gol
lop
2012
J.
Gam
mon
ley
T. B
idro
wsk
i J.
Han
sen
J. L
usk
J. S
ands
M
.L. S
zym
ansk
i J.
Ric
hard
son
R. M
uran
o C
. Mas
on
L. R
ober
ts
J. C
asw
ell
S. C
arriè
re
M. G
ollo
p 20
13
J. G
amm
onle
y R
. Sch
ulth
eis
J. H
anse
n J.
Lus
k K
. Mad
den
M.L
. Szy
man
ski
J. R
icha
rdso
n R
. Mur
ano
S. O
lden
burg
er
L. R
ober
ts
J. C
asw
ell
S. C
arriè
re
M. G
ollo
p 20
14
J. G
amm
onle
y R
. Sch
ulth
eis
J. H
anse
n J.
Lus
k K
. Mad
den
M.L
. Szy
man
ski
J. R
icha
rdso
n R
. Mur
ano
S. O
lden
burg
er
L. R
ober
ts
J. C
asw
ell
S. C
arriè
re
K. C
onki
n 20
15
J. G
amm
onle
y R
. Sch
ulth
eis
J. H
anse
n J.
Lus
k K
. Mad
den
M.L
. Szy
man
ski
J. R
icha
rdso
n R
. Mur
ano
S. O
lden
burg
er
L. R
ober
ts
J. C
asw
ell
S. C
arriè
re
K. C
onki
n 20
16
J. G
amm
onle
y R
. Sch
ulth
eis
J. H
anse
n J.
Lus
k M
. Clin
e A
. Din
ges
J. R
icha
rdso
n R
. Mur
ano
S. O
lden
burg
er
N. H
uck
J. C
asw
ell
S. C
arriè
re
K. C
onki
n 20
17
J. G
amm
onle
y R
. Sch
ulth
eis
J. H
anse
n J.
Lus
k M
. Clin
e A
. Din
ges
J. R
icha
rdso
n R
. Mur
ano
S. O
lden
burg
er
N. H
uck
J. C
asw
ell
S. C
arriè
re
K. C
onki
n 20
18
J. G
amm
onle
y R
. Sch
ulth
eis
J. H
anse
n J.
Lus
k M
. Clin
e A
. Din
ges
J. R
icha
rdso
n R
. Mur
ano
O. F
itzsi
mm
ons
N. H
uck
J. C
asw
ell
S. C
arriè
re
K. C
onki
n 20
19
J. G
amm
onle
y R
. Sch
ulth
eis
J. H
anse
n J.
Lau
x M
. Clin
e A
. Din
ges
J. R
icha
rdso
n R
. Mur
ano
O. F
itzsi
mm
ons
N. H
uck
J. C
asw
ell
S. C
arriè
re
K. C
onki
n J.
Gam
mon
ley
R. S
chul
thei
s J.
Han
sen
J. L
aux
M. C
line
A. D
inge
s J.
Ric
hard
son
R. M
uran
o O
. Fitz
sim
mon
s N
. Sm
ith
J. C
asw
ell
S. C
arriè
re
K. C
onki
n
¹ T
he n
ame
and
com
posi
tion
of th
e C
MU
TC
was
cha
nged
in 1
999
to C
entr
al F
lyw
ay W
eble
ss M
igra
tory
Gam
e B
ird T
echn
ical
Com
mitt
ee:
Vot
ing
mem
bers
hip
rest
ricte
d to
CF
Sta
tes/
Pro
vin
FIL
E: S
:\MB
MO
\CF
_D\P
RO
JEC
TS
\AD
MIN
IST
RA
TIV
E\H
IST
OR
IC\C
F M
EM
BE
RS
.XLS

Central Flyway Databook 202012/22/2020
2000
2005
2010
2015
2020
CE
NT
RA
L M
AN
AG
EM
EN
T U
NIT
DO
VE
TE
CH
NIC
AL
CO
MM
ITT
EE
20
00-2
020
83
CO
K
SM
TN
EN
M
ND
O
K
SD
T
X
WY
IA
A
R
MO
MN
J. G
amm
onle
y H
. Han
ds
J. H
anse
n S
. Tay
lor
T. M
itchu
sson
S
. C. K
ohn
M.E
. O'M
eilia
S
.J. V
aa
J. R
ober
son
L. R
ober
ts
T. B
ogen
schu
tz
J.H
. Sch
ulz
S. M
axon
2001
J.
Gam
mon
ley
H. H
ands
J.
Han
sen
S. T
aylo
r T
. Mitc
huss
on
S. C
. Koh
n M
.E. O
'Mei
lia
S.J
. Vaa
J.
Rob
erso
n L.
Rob
erts
T
. Bog
ensc
hutz
M
. Che
cket
t J.
H. S
chul
z S
. Max
on
2002
J.
Gam
mon
ley
H. H
ands
J.
Han
sen
S. T
aylo
r T
. Mitc
huss
on
S. C
. Koh
n M
.E. O
'Mei
lia
S.J
. Vaa
J.
Rob
erso
n L.
Rob
erts
T
. Bog
ensc
hutz
M
. Che
cket
t J.
H. S
chul
z S
. Max
on
2003
J.
Gam
mon
ley
H. H
ands
J.
Han
sen
S. T
aylo
r T
. Mitc
huss
on
S. C
. Koh
n M
.E. O
'Mei
lia
S.J
. Vaa
J.
Rob
erso
n L.
Rob
erts
T
. Bog
ensc
hutz
J.
H. S
chul
z S
. Max
on
2004
J.
Gam
mon
ley
H. H
ands
J.
Han
sen
S. T
aylo
r T
. Mitc
huss
on
S. C
. Koh
n M
.E. O
'Mei
lia
S.J
. Vaa
J.
Rob
erso
n L.
Rob
erts
T
. Bog
ensc
hutz
A
. Jam
es
J.H
. Sch
ulz
S. M
axon
J. G
amm
onle
y H
. Han
ds
J. H
anse
n S
. Tay
lor
T. M
itchu
sson
M
.L. S
zym
ansk
i M
.E. O
'Mei
lia
S.J
. Vaa
J.
Rob
erso
n L.
Rob
erts
T
. Bog
ensc
hutz
A
. Jam
es
J.H
. Sch
ulz
W. P
enni
ng
2006
J.
Gam
mon
ley
H. H
ands
J.
Han
sen
S. T
aylo
r T
. Mitc
huss
on
M.L
. Szy
man
ski
M.E
. O'M
eilia
S
.J. V
aa
J. R
ober
son
L. R
ober
ts
T. B
ogen
schu
tz
J.H
. Sch
ulz
W. P
enni
ng
2007
J.
Gam
mon
ley
H. H
ands
J.
Han
sen
J. L
usk
T. M
itchu
sson
M
.L. S
zym
ansk
i M
.E. O
'Mei
lia
S.J
. Vaa
J.
Rob
erso
n L.
Rob
erts
T
. Bog
ensc
hutz
L.
Nay
lor
J.H
. Sch
ulz
W. P
enni
ng
2008
J.
Gam
mon
ley
H. H
ands
J.
Han
sen
J. L
usk
T. M
itchu
sson
M
.L. S
zym
ansk
i M
.E. O
'Mei
lia
S.J
. Vaa
J.
Rob
erso
n L.
Rob
erts
T
. Bog
ensc
hutz
L.
Nay
lor
J.H
. Sch
ulz
W. P
enni
ng
2009
J.
Gam
mon
ley
H. H
ands
J.
Han
sen
J. L
usk
T. M
itchu
sson
M
.L. S
zym
ansk
i J.
Ric
hard
son
S.J
. Vaa
C
. Mas
on
L. R
ober
ts
T. B
ogen
schu
tz
L. N
aylo
r J.
H. S
chul
z W
. Pen
ning
J. G
amm
onle
y F
.M.
McN
ew
J. H
anse
n J.
Lus
k T
. Mitc
huss
on
M.L
. Szy
man
ski
J. R
icha
rdso
n S
.J. V
aa
C. M
ason
L.
Rob
erts
T
. Bog
ensc
hutz
L.
Nay
lor
J.H
. Sch
ulz
W. P
enni
ng
2011
J.
Gam
mon
ley
T. B
idro
wsk
i J.
Han
sen
J. L
usk
B. H
ale
M.L
. Szy
man
ski
J. R
icha
rdso
n R
. Mur
ano
C. M
ason
L.
Rob
erts
T
. Bog
ensc
hutz
L.
Nay
lor
J.H
. Sch
ulz
W. P
enni
ng
2012
J.
Gam
mon
ley
T. B
idro
wsk
i J.
Han
sen
J. L
usk
J. S
ands
M
.L. S
zym
ansk
i J.
Ric
hard
son
R. M
uran
o C
. Mas
on
L. R
ober
ts
T. B
ogen
schu
tz
L. N
aylo
r J.
H. S
chul
z S
. Cor
dts
2013
J.
Gam
mon
ley
R. S
chul
thei
s J.
Han
sen
J. L
usk
K. M
adde
n M
.L. S
zym
ansk
i J.
Ric
hard
son
R. M
uran
o S
. Old
enbu
rger
L.
Rob
erts
T
. Bog
ensc
hutz
L.
Nay
lor
R. B
rede
sen
S. C
ordt
s
2014
J.
Gam
mon
ley
R. S
chul
thei
s J.
Han
sen
J. L
usk
K. M
adde
n M
.L. S
zym
ansk
i J.
Ric
hard
son
R. M
uran
o S
. Old
enbu
rger
L.
Rob
erts
T
. Bog
ensc
hutz
L.
Nay
lor
R. B
rede
sen
S. C
ordt
s
J. G
amm
onle
y R
. Sch
ulth
eis
J. H
anse
n J.
Lus
k K
. Mad
den
M.L
. Szy
man
ski
J. R
icha
rdso
n R
. Mur
ano
S. O
lden
burg
er
L. R
ober
ts
T. B
ogen
schu
tz
L. N
aylo
r T
. Tho
mps
on
S. C
ordt
s
2016
J.
Gam
mon
ley
R. S
chul
thei
s J.
Han
sen
J. L
usk
M. C
line
A. D
inge
s J.
Ric
hard
son
R. M
uran
o S
. Old
enbu
rger
N
. Huc
k T
. Bog
ensc
hutz
L.
Nay
lor
T.
Tho
mps
on
S. C
ordt
s
2017
J.
Gam
mon
ley
R. S
chul
thei
s J.
Han
sen
J. L
usk
M. C
line
A. D
inge
s J.
Ric
hard
son
R. M
uran
o S
. Old
enbu
rger
N
. Huc
k T
. Bog
ensc
hutz
C
. Jac
kson
T
. T
hom
pson
S
. Cor
dts
2018
J.
Gam
mon
ley
R. S
chul
thei
s J.
Han
sen
J. L
usk
M. C
line
A. D
inge
s J.
Ric
hard
son
R. M
uran
o O
. Fitz
sim
mon
s N
. Huc
k T
. Bog
ensc
hutz
C
. Jac
kson
T
. T
hom
pson
S
. Cor
dts
2019
J.
Gam
mon
ley
R. S
chul
thei
s J.
Han
sen
J. L
aux
M. C
line
A. D
inge
s J.
Ric
hard
son
R. M
uran
o O
. Fitz
sim
mon
s N
. Huc
k T
. Bog
ensc
hutz
C
. Jac
kson
T
. T
hom
pson
S
. Cor
dts
J. G
amm
onle
y R
. Sch
ulth
eis
J. H
anse
n J.
Lau
x M
. Clin
e A
. Din
ges
J. R
icha
rdso
n R
. Mur
ano
O. F
itzsi
mm
ons
N. S
mith
T
. Bog
ensc
hutz
C
. Jac
kson
T
. Tho
mps
on
S. C
ordt
s
FIL
E: S
:\MB
MO
\CF
_D\P
RO
JEC
TS
\AD
MIN
IST
RA
TIV
E\H
IST
OR
IC\C
F M
EM
BE
RS
.XLS

Central Flyway Databook 202012/22/2020
CE
NT
RA
L F
LY
WA
Y N
ON
GA
ME
MIG
RA
TO
RY
BIR
D T
EC
HN
ICA
L C
OM
MIT
TE
E
2006
-202
0
CO
K
S
MT
N
E
NM
N
D
OK
S
D
TX
W
Y
AB
S
K
NW
T
FW
S 1,
2
84
2006
D
. Klu
te
H. H
ands
A
. Beg
ley
J. J
orge
nsen
S
. Will
iam
s S
. Joh
nson
-
E. D
owd
Stu
kel
D. S
chlit
ter
A. O
rabo
na
S. J
ones
2007
D
. Klu
te
H. H
ands
A
. Beg
ley
J. J
orge
nsen
H
. Wal
ker
S. J
ohns
on
-E
. Dow
d S
tuke
l D
. Sch
litte
r A
. Ora
bona
S
. Jon
es
2008
D
. Klu
te
H. H
ands
A
. Beg
ley
J. J
orge
nsen
H
. Wal
ker
S. J
ohns
on
-E
. Dow
d S
tuke
l D
. Sch
litte
r A
. Ora
bona
S
. Jon
es
2009
D
. Klu
te
H. H
ands
A
. Beg
ley
J. J
orge
nsen
H
. Wal
ker
S. J
ohns
on
M. H
ower
y E
. Dow
d S
tuke
l C
. Sha
ckel
ford
A
. Ora
bona
S
. Jon
es
2010
D
. Klu
te
F.M
. M
cNew
C
. Wig
htm
an
J. J
orge
nsen
H
. Wal
ker
S. J
ohns
on
M. H
ower
y E
. Dow
d S
tuke
l C
. Sha
ckel
ford
A
. Ora
bona
S
. Jon
es
2011
D
. Klu
te
T. B
idro
wsk
i C
. Wig
htm
an
J. J
orge
nsen
H
. Wal
ker
S. J
ohns
on
M. H
ower
y E
. Dow
d S
tuke
l C
. Sha
ckel
ford
A
. Ora
bona
S
. Jon
es
2012
D
. Klu
te
T. B
idro
wsk
i C
. Wig
htm
an
J. J
orge
nsen
H
. Wal
ker
S. J
ohns
on
M. H
ower
y E
. Dow
d S
tuke
l C
. Sha
ckel
ford
A
. Ora
bona
S
. Jon
es
2013
D
. Klu
te
R. S
chul
thei
s L.
Han
ausk
a-B
row
n J.
Jor
gens
en
M. N
eal
S. J
ohns
on
M. H
ower
y E
. Dow
d S
tuke
l C
. Sha
ckel
ford
A
. Ora
bona
S
. Jon
es
2014
D
. Klu
te
R. S
chul
thei
s L.
Han
ausk
a-B
row
n J.
Jor
gens
en
P. D
arr
S. J
ohns
on
M. H
ower
y E
. Dow
d S
tuke
l C
. Sha
ckel
ford
A
. Ora
bona
B
. How
e
2015
D
. Klu
te
R. S
chul
thei
s A
. Beg
ley
J. J
orge
nsen
P
. Dar
r S
. Joh
nson
M
. How
ery
E. D
owd
Stu
kel
C. S
hack
elfo
rd
A. O
rabo
na
D. K
ruep
er
2016
3 D
. Klu
te
R. S
chul
thei
s A
. Beg
ley
J. J
orge
nsen
P
. Dar
r S
. Joh
nson
M
. How
ery
E. D
owd
Stu
kel
C. S
hack
elfo
rd
A. O
rabo
na
J. C
asw
ell
K. C
onki
n S
. C
arrie
re
K. K
ruse
2017
L.
Ros
si
D. R
iedl
e A
. Beg
ley
J. J
orge
nsen
P
. Dar
r S
. Joh
nson
M
. How
ery
E. D
owd
Stu
kel
C. S
hack
elfo
rd
A. O
rabo
na
J. C
asw
ell
K. C
onki
n S
. Car
riere
K
. Kru
se
2018
L.
Ros
si
D. R
iedl
e A
. Beg
ley
J. J
orge
nsen
E
. Duv
uvue
i S
. Joh
nson
M
. How
ery
E. D
owd
Stu
kel
C. S
hack
elfo
rd
A. O
rabo
na
J. C
asw
ell
K. C
onki
n S
. C
arrie
re
K. K
ruse
, S. S
omer
shoe
2019
L.
Ros
si
D. R
iedl
e A
. Beg
ley
J. J
orge
nsen
E
. Duv
uvue
i S
. Joh
nson
M
. How
ery
E. D
owd
Stu
kel
C. S
hack
elfo
rd
A. O
rabo
na
J. C
asw
ell
K. C
onki
n S
. C
arrie
re
K. K
ruse
, S. S
omer
shoe
2020
L.
Ros
si
D. R
iedl
e B
. Sko
ne
J. J
orge
nsen
E
. Duv
uvue
i S
. Joh
nson
M
. How
ery
E. D
owd
Stu
kel
C. S
hack
elfo
rd
A. O
rabo
na
J. C
asw
ell
K. C
onki
n S
. C
arrie
re
K. K
ruse
, S. S
omer
shoe
1 Non
gam
e Li
aiso
n (e
x-of
ficio
mem
ber)
F
ILE
: S:\M
BM
O\C
F_D
\PR
OJE
CT
S\A
DM
INIS
TR
AT
IVE
\HIS
TO
RIC
\CF
ME
MB
ER
S.X
LS
2 In 2
018
chan
ged
to R
egio
nal C
onta
cts
3 In 2
016
Can
adia
n pr
ovin
ces
wer
e in
corp
orat
ed

Central Flyway Databook 202012/22/2020
1975
1980
1985
1990
1995
2000
2005
2010
2015
2020
Central Flyway Meeting Locations
YEAR
Pittsburg, PA Denver, CO Oklahoma City, OK 1976 Washington, D.C. Denver, CO Sheridan, WY 1977 Atlanta, GA Denver, CO Calgary , Alberta 1978 Phoenix, AZ Kearney, NE North Platte, NE 1979 Toronto, Canada Albuquerque, NM
Miami Beach, FL Port Authur, TX McCallen, TX 1981 Billings, MT Billings, MT 1982 Portland, OR Ft. Collins, CO Colorado Springs, CO 1983 Kansas City, MO Ft. Collins, CO Rapid City, SD 1984 1st meeting Boston, MA Wichita, KS Wichita, KS
Washington, D.C. Bismarck, ND Bismarck, ND 1986 Reno, NV Oklahoma City, OK Tulsa, OK 1987 Quebec City, Canada Cheyenne, WY Cheyenne, WY 1988 Louisville, KY Port Authur, TX Calgary , Alberta 1989 Washington, D.C. Kearney, NE North Platte, NE
Denver, CO Albuquerque, NM Angel Fire, NM 1991 McCallen, TX Edmonton, Alberta Lubbock, TX Corpus Christi, TX 1992 Charlotte, NC Kearney, NE Yellowknife, NWT 1993 Billings, MT Washington, D.C. Great Falls, MT Great Falls, MT 1994 Anchorage, AK Alamosa, CO Crested Butte, CO
Albuquerque, NM Minneapolis, MN Pierre, SD Custer State Park, SD 1996 Tulsa, OK Great Bend, KS Kansas City, MO 1997 Washington, D.C. Kearney, NE Cypress Hills, SASK 1998 Orlando, FL Harlingen, TX Bismarck, ND 1999 San Francisco, CA Lawton, OK Bartlesville, OK
Rosemount, IL Cody, WY Memphis, TN 2001 Washington, D.C. Lethbridge, Alberta Edmonton, Alberta 2002 Wichita, KS Dallas, TX Lincoln, NE Omaha, NE 2003 Socorro, NM Winston-Salem, NC Albuquerque, NM Santa Fe, NM 2004 Amarillo, TX Spokane, WA Corpus Christi, TX Austin, TX
Amarillo, TX Arlington, VA Billings, MT Helena, MT 2006 Socorro, NM Columbus, OH Ft. Collins, CO Estes Park, CO 2007 Socorro, NM Portland, OR Brookings, SD Spearfish, SD 2008 Socorro, NM Phoenix, AZ Great Bend, KS Kansas City, KS 2009 Socorro, NM Arlington, VA Corpus Christi, TX Bismarck, ND
Socorro, NM Milwaukee, WI Tulsa, OK Norman, OK 2011 Socorro, NM Kansas City, MO Laramie, WY Cody, WY 2012 Amarillo, TX Atlanta, GA Grand Island, NE Canmore, Alberta 2013 Alburquerque, NM Arlington, VA Alburquerque, NM Ruidoso, NM 2014 Amarillo, TX Denver, CO Galveston, TX Kerrville, TX
a Corpus Christi, TX Omaha, NE Bozeman, MT Bozeman, MT 2016 Pittsburgh, PA Colorado Springs, CO Steamboat Springs, CO 2017 Spokane, WA Wichita, KS Manhattan, KS 2018 Norfolk, VA Wichita, KS Waskesiu Lake, Saskatchewan 2019 Denver, CO Port Aransas, TX Alta, WY
Omaha, NE North Platte, NE Virtual due to COVID-19
Technical Comm. Council Technical Comm. Council and Technical Working Meeting Spring Meeting Spring Meeting Summer Meeting
a Due to the change in the Federal Regulations cycle (SEIS13), additional TC and Council meeting was held in Denver, CO in Sept. FILE: S:\MBMO\CF_D\PROJECTS\ADMINISTRATIVE\HISTORIC\CF MEMBERS.XLS
85

Central Flyway Databook 202012/22/2020
Gay Simpson Award P. Joseph Gabig Award
This award is offered by the Central Flyway Council in This award is offered by the Central Flyway Council in memory of Gay Simpson whose abbreviated life
was highlighted by perceptive and aggressive waterfowl research and management. It is
presented to South Dakota State University students who have demonstrated outstanding research in the ecology or management of Central Flyway waterfowl
or their habitats.
memory of Joe Gabig who was tireless in his pursuit of scientifically-based research and management of our
nation’s migratory game bird resources and their habitats and in his support of sound hunting programs. It is
presented to college and university students whose project is conducted wholly or partly in Nebraska and who have
demonstrated leadership and/or made a significant contribution to the science of conservation or management
of wetlands or migratory game birds or their habitats1 .
1990 Kent Luttschwager 1991 Cathy Henry 1992 Dr. Charles Dieter 1993 Lisa Peskin Sausville 1994 Mark Humpert 1995 Dr. Rex Johnson 1996 Dr. Jeff Gleason 1997 Dr. Dave Naugle 1998 Dr. Diane Granfors 1999 Tate Fischer 2000 Dr. Joshua Stafford 2001 Shawn May 2002 Kent Werlin 2003 Bryan Rieger 2004 Rachel Mockler 2005 Kimberly Strand 2006 Sharon N. Kahara 2007 Jennifer L. Gutscher Zach Cunningham, University of Nebraska-Lincoln 2008 Tandi L. Perkins Ingrid Barcelo, University of Nebraska-Lincoln 2009 Nick Docken ------2010 Heather N. McWilliams Scott Groepper, University of Nebraska-Lincoln 2011 ------ Todd Buckley, University of Nebraska-Lincoln 2012 Cody Warner Dustin Casady, University of Nebraska-Kearney 2013 Anna Sidie-Slettedahl Matt Haugen, University of Nebraska-Lincoln 2014 Adam Janke -----2015 Ryann Cressey -----2016 Matt Gottlob -----2017 Neal Martorelli Heather Johnson, University of Nebraska-Kearney 2018 Fred Oslund -----2019 Charles "Will" Gallman Matthew Hinrichs, University of Nebraska-Lincoln 2020 Cynthia Anchor -----
Recipient Recipient
1 Criteria modified in 2018. FILE: S:\MBMO\CF_D\PROJECTS\ADMINISTRATIVE\HISTORIC\CF MEMBERS.XLS
86

Central Flyway Databook 202012/22/2020
1975
1980
1985
1990
1995
2000
2005
2010
2015
2020
CENTRAL FLYWAY COUNCIL CONSULTANTS TO THE U.S. FISH AND WILDLIFE SERVICE REGULATIONS COMMITTEE
YEAR CONSULTANT
1976¹
1977
1978
1979
1981
1982
1983
1984
1986
1987
1988
1989
1991
1992
1993
1994
1996
1997
1998
1999
2001
2002
2003
2004
2006
2007
2008
2009
2011
2012
2013
2014
2016
2017
2018
2019
Jack R. Grieb (CO)
Dick Wettersten (KS)
William J. Bailey (NE)
William J. Bailey (NE)
Ted L. Clark (TX)
K.L. Kool (SD)
K.L. Kool (SD)
K.L. Kool (SD)
Charles Schroeder (ND)
Charles Schroeder (ND)
Steve Lewis (OK)
Steve Lewis (OK)
Dale Witt (TX)
Dale Witt (TX)
K.L. Kool (SD)
William J. Bailey (NE)
Robert Jessen (TX)
Robert Jessen (TX)
Lloyd Jones (ND)
Vernon Bevill (TX)
Vernon Bevill (TX)
Vernon Bevill (TX)
Vernon Bevill (TX)
Vernon Bevill (TX)
Vernon Bevill (TX)
Randy Kreil (ND)
Randy Kreil (ND)
Randy Kreil (ND)
Randy Kreil (ND)
Randy Kreil (ND)
Randy Kreil (ND)
Vernon Bevill (TX)
Vernon Bevill (TX)
Vernon Bevill (TX)
Vernon Bevill (TX)
Jeffrey Herbert (MT)
Jeffrey Herbert (MT)
Dave Morrison (TX)
Dave Morrison (TX)
Dave Morrison (TX)
Dave Morrison (TX)
Dave Morrison (TX)
Dave Morrison (TX)
Dave Morrison (TX)
Stewart Liley (NM)
Stewart Liley (NM)
Jack R. Grieb (CO)
Wynn Freeman (MT)
Wynn Freeman (MT)
Harold Olson (NM)
Jack R. Grieb (CO)
Jack R. Grieb (CO)
Jack R. Grieb (CO)
Jack R. Grieb (CO)
Dale Witt (MT)
Dale Witt (MT)
Dale Strickland (WY)
Dale Strickland (WY)
Dale Strickland (WY)
Arnie Olson (MT)
Bill Montoya (NM)
Bill Montoya (NM)
Ronnie George (TX)
Tom Hinz (MT)
Tom Hinz (MT)
Tom Hinz (MT)
Tom Hinz (MT)
Tom Hinz (MT)
Tom Hinz (MT)
George Vandel (SD)
George Vandel (SD)
George Vandel (SD)
George Vandel (SD)
George Vandel (SD)
George Vandel (SD)
George Vandel (SD)
George Vandel (SD)
Jeffrey Herbert (MT)
Jeffrey Herbert (MT)
Jeffrey Herbert (MT)
Michael O'Melia (OK)
Michael O'Melia (OK)
John Emmerich (WY)
--
Cal Baca (NM)
--
Jeff Ver Steeg (CO)
Jeff Ver Steeg (CO)
Jeff Ver Steeg (CO)
Jeff Ver Steeg (CO)
Jeff Ver Steeg (CO)
¹ Chairman Wrakestraw also attended meeting
87

Central Flyway Databook 202012/22/2020
88
SE
RV
ICE
RE
GU
LA
TIO
NS
CO
MM
ITT
EE
U
.S. F
ish
& W
ildlif
e S
ervi
ce
1975
-202
0
YR
C
HA
IR
MB
M
RE
GIO
N 1
R
EG
ION
2
RE
GIO
N 3
A
DV
ISO
R
1975
H
.K. N
elso
n J.
P. R
oger
s/R
.I. S
mith
R
.K. M
artin
son
J. H
emph
ill
1976
H
.K. N
elso
n J.
P. R
oger
s/R
.I. S
mith
R
.K. M
artin
son
J. H
emph
ill
1977
H
.K. N
elso
n J.
P. R
oger
s/R
.I. S
mith
R
.K. M
artin
son
J. H
emph
ill
1978
H
.K. N
elso
n J.
P. R
oger
s/R
.I. S
mith
R
.K. M
artin
son
1979
H
.K. N
elso
n R
.I. S
mith
R
.K. M
artin
son
1980
J.
P. R
oger
s J.
P. R
oger
s R
.K. M
artin
son
H.K
. Nel
son
1981
R
.E. G
ilmor
e J.
P. R
oger
s R
.K. M
artin
son
H.K
. Nel
son
1982
R
. Put
z J.
P. R
oger
s H
.K. N
elso
n 19
83
J.P
. Rog
ers
J.P
. Rog
ers
H. B
enso
n 19
84
J.P
. Rog
ers
J.P
. Rog
ers
H.K
. Nel
son
1985
R
. Lam
bert
son
R.D
. Spa
rrow
e H
.K. N
elso
n 19
86
R. L
ambe
rtso
n R
.D. S
parr
owe
H.K
. Nel
son
1987
H
.K. N
elso
n R
.D. S
parr
owe
R.L
. Wal
lens
trom
19
88
H.K
. Nel
son
R.D
. Spa
rrow
e R
.L. W
alle
nstr
om ¹
M
. Spe
ar ¹
J.
C. G
ritm
an
1989
M
. Ple
nert
B
.K.
Will
iam
s M
. Spe
ar
J.C
. Grit
man
19
90
M. P
lene
rt/D
. Ols
en
T.J
. D
wye
r J.
C. G
ritm
an
1991
D
. Ols
en
T.J
. D
wye
r J.
C. G
ritm
an
1992
D
. Ols
en
T.J
. D
wye
r J.
S. M
arle
r 19
93
D. O
lsen
P
.R. S
chm
idt
M. P
lene
rt
J.G
. Rog
ers
J.S
. Mar
ler
1994
W
.F.
Har
twig
P
.R.
Sch
mid
t M
. Ple
nert
J.
G. R
oger
s J.
S. M
arle
r 19
95
R.G
. S
tree
ter
P.R
. S
chm
idt
N. K
aufm
an
1996
R
.G.
Str
eete
r P
.R.
Sch
mid
t N
. Kau
fman
19
97
R.G
. S
tree
ter
P.R
. S
chm
idt
N. K
aufm
an
W.F
. H
artw
ig ¹
19
98
J.G
. Rog
ers/
D. A
she
P.R
. S
chm
idt
N. K
aufm
an
W.F
. H
artw
ig
1999
D
. Ash
e R
. Wes
t/J. A
ndre
w
A. B
adge
ly
W.F
. H
artw
ig
2000
D
. Ash
e/T
.O. M
eliu
s J.
And
rew
N
. Kau
fman
¹
W.F
. H
artw
ig
2001
T
.O. M
eliu
s J.
And
rew
N
. Kau
fman
W
.F.
Har
twig
20
02
T.O
. Mel
ius
J. A
ndre
w/R
.J. B
lohm
20
03
P.R
. S
chm
idt
B.A
. Mill
sap
2004
P
.R.
Sch
mid
t B
.A. M
illsa
p 20
05
P.R
. S
chm
idt
B.A
. Mill
sap
R. T
hors
on
2006
P
.R.
Sch
mid
t B
.A. M
illsa
p D
.B.
Alle
n R
. Tho
rson
R
.O.
Mor
genw
eck
2007
P
.R.
Sch
mid
t R
.J. B
lohm
B
. Tug
gle
R. T
hors
on
R.O
. M
orge
nwec
k 20
08
P.R
. S
chm
idt
R.J
. Blo
hm
B. T
uggl
e R
. Tho
rson
R
.O.
Mor
genw
eck
2009
P
.R.
Sch
mid
t R
.J. B
lohm
B
. Tug
gle
T.O
. Mel
ius
R.O
. M
orge
nwec
k 20
10
P.R
. S
chm
idt
R.J
. Blo
hm
T.O
. Mel
ius
R.O
. M
orge
nwec
k 20
11
T.O
. Mel
ius/
J. F
ord
J.B
. Bor
tner
T
.O. M
eliu
s R
.O.
Mor
genw
eck
2012
J.
For
d J.
B. B
ortn
er
T.O
. Mel
ius
2013
J.
For
d J.
B. B
ortn
er
B. T
uggl
e T
.O. M
eliu
s 20
14
J. F
ord
J.B
. Bor
tner
B
. Tug
gle
2015
J.
For
d J.
B. B
ortn
er
B. T
uggl
e 20
16
J. F
ord
J.B
. Bor
tner
R
. Tho
rson
B
. Tug
gle
T.O
. Mel
ius
2017
J.
For
d J.
B. B
ortn
er
R. T
hors
on
T.O
. Mel
ius
2018
2
J. F
ord
K.D
. Ric
hkus
R
. Tho
rson
C
. Woo
ley
2019
J.
For
d K
.D. R
ichk
us
C. W
oole
y 20
20
J. F
ord
K.D
. Ric
hkus
A
. Lue
ders
RE
GIO
N 4
R
EG
ION
5
RE
GIO
N 6
R
EG
ION
7
RE
GIO
N 8
R
EG
ION
9
RE
SE
AR
CH
R. M
ysha
k/R
.N. S
mith
R
.E.
Lam
bert
son
J.W
. Pul
liam
R
.E.
Lam
bert
son
J.W
. Pul
liam
R
.E.
Lam
bert
son
J.W
. Pul
liam
R
.E.
Lam
bert
son
R.N
. Sm
ith
J.W
. Pul
liam
R
.N. S
mith
J.
W. P
ullia
m
R.N
. Sm
ith
J.W
. Pul
liam
G
.L. B
utte
rbau
gh
R.N
. Sm
ith
J.W
. Pul
liam
G
.L. B
utte
rbau
gh
W. S
teig
litz
¹ M
. Ple
nert
R
.N. S
mith
J.
W. P
ullia
m
G.L
. But
terb
augh
W
. Ste
iglit
z R
.N. S
mith
J.
W. P
ullia
m
G.L
. But
terb
augh
W
. Ste
iglit
z R
.N. S
mith
J.
W. P
ullia
m
G.L
. But
terb
augh
W
. Ste
iglit
z R
.E.
Lam
bert
son
R.O
. M
orge
nwec
k W
. Ste
iglit
z D
. Buf
fingt
on
R.E
. La
mbe
rtso
n R
.O.
Mor
genw
eck
D. B
uffin
gton
R
.E.
Lam
bert
son
N. C
loug
h R
.E.
Lam
bert
son
D.B
. A
llen
N. C
loug
h R
.O.
Mor
genw
eck
D.B
. A
llen
N. C
loug
h ¹
R.O
. M
orge
nwec
k D
.B.
Alle
n R
.O.
Mor
genw
eck
D.B
. A
llen
R.E
. La
mbe
rtso
n R
.O.
Mor
genw
eck
S.D
. Ham
ilton
D
.B.
Alle
n ¹
S.D
. Ham
ilton
D
.B.
Alle
n S
.D. H
amilt
on
M. P
arke
r R
.O.
Mor
genw
eck
D.B
. A
llen
S.D
. Ham
ilton
M
. Par
ker
R.O
. M
orge
nwec
k D
.B.
Alle
n M
. Mor
iarit
y R
.O.
Mor
genw
eck
R. G
ould
M
. Mor
iarit
y R
.O.
Mor
genw
eck
R. G
ould
M
. Mor
iarit
y T
.O. M
eliu
s M
. Mor
iarit
y S
. Tho
mps
on
S.D
. Ham
ilton
T
.O. M
eliu
s S
.D. H
amilt
on
G. H
aske
tt M
. Mor
iarit
y S
. Gue
rtin
G
. Has
kett
M. M
oria
rity
S. G
uert
in
G. H
aske
tt W
. Web
er
S. G
uert
in
G. H
aske
tt W
. Web
er
G. H
aske
tt C
. Doh
ner
W. W
eber
R
. Loh
oefe
ner
C. D
ohne
r W
. Web
er
R. L
ohoe
fene
r C
. Doh
ner
R. L
ohoe
fene
r 2
C. D
ohne
r/M
. Oet
ker
M. H
o gan
2M
. Hog
an
G. S
ieka
niec
2
W. W
eber
M
. Ho g
an
G. S
ieka
niec
2
W. W
eber
M
. Ho g
an
G. S
ieka
niec
¹ P
artia
l Yea
r F
ILE
: S:\M
BM
O\C
F_D
\PR
OJE
CT
S\A
DM
INIS
TR
AT
IVE
\HIS
TO
RIC
\SR
C M
EM
BE
RS
AN
DC
ON
SU
LTA
NT
S.X
LS
2 D
eput
y R
egio
nal D
irect
or
1987
-pre
sent
- C
hief
, Div
isio
n of
Mig
rato
ry B
ird M
anag
emen
t ser
ves
as n
on-v
otin
g E
xecu
tive
Sec
reta
ry

Central Flyway Databook 202012/22/2020
1950
1955
1960
1965
1970
1975
1980
1985
1990
1995
2000
2005
2010
2015
2020
USFWS FLYWAY REPRESENTATIVES 1949-2020
ATLANTIC MISSISSIPPI CENTRAL PACIFIC
FLYWAY FLYWAY FLYWAY FLYWAY
1949 Leo K. Couch Leo K. Couch
1951 Leo K. Couch 1952 1953 1954
1956 1957 1958 1959
1961 1962 1963 1964
1966 1967 1968 1969
1971 1972 1973 1974
1976 1977 1978 1979
1981 1982 1983 1984
1986 1987 1988 1989
1991 1992 1993 1994
1996 1997 1998 1999
2001 2002 2003 2004
2006 2007 2008 2009
2011 2012 2013 2014
2016 2017 2018 2019
C. Edward Addy C. Edward Addy C. Edward Addy C. Edward Addy C. Edward Addy C. Edward Addy C. Edward Addy C. Edward Addy
C. Edward Addy C. Edward Addy C. Edward Addy C. Edward Addy C. Edward Addy C. Edward Addy C. Edward Addy C. Edward Addy C. Edward Addy C. Edward Addy
C. Edward Addy C. Edward Addy C. Edward Addy
vacant Warren W. Blandin Warren W. Blandin Warren W. Blandin Warren W. Blandin Warren W. Blandin Warren W. Blandin
Warren W. Blandin Warren W. Blandin Warren W. Blandin
vacant Jerome R. Serie Jerome R. Serie Jerome R. Serie Jerome R. Serie Jerome R. Serie Jerome R. Serie
Jerome R. Serie Jerome R. Serie Jerome R. Serie Jerome R. Serie Jerome R. Serie Jerome R. Serie Jerome R. Serie Jerome R. Serie Jerome R. Serie Jerome R. Serie
Jerome R. Serie Jerome R. Serie Jerome R. Serie Jerome R. Serie Jerome R. Serie Jerome R. Serie Jerome R. Serie Paul I. Padding Paul I. Padding Paul I. Padding
Paul I. Padding Paul I. Padding Paul I. Padding Paul I. Padding Paul I. Padding Paul I. Padding Paul I. Padding Paul I. Padding Paul I. Padding Paul I. Padding
P. Devers (acting)
vacant Arthur S. Hawkins Arthur S. Hawkins Arthur S. Hawkins Arthur S. Hawkins Arthur S. Hawkins Arthur S. Hawkins Arthur S. Hawkins
Arthur S. Hawkins Arthur S. Hawkins Arthur S. Hawkins Arthur S. Hawkins Arthur S. Hawkins Arthur S. Hawkins Arthur S. Hawkins Arthur S. Hawkins Arthur S. Hawkins Arthur S. Hawkins
Arthur S. Hawkins Arthur S. Hawkins
vacant Kenneth E. Gamble Kenneth E. Gamble Kenneth E. Gamble Kenneth E. Gamble Kenneth E. Gamble Kenneth E. Gamble Kenneth E. Gamble
Kenneth E. Gamble Kenneth E. Gamble Kenneth E. Gamble Kenneth E. Gamble Kenneth E. Gamble Kenneth E. Gamble Kenneth E. Gamble Kenneth E. Gamble Kenneth E. Gamble Kenneth E. Gamble
Kenneth E. Gamble Kenneth E. Gamble Kenneth E. Gamble Kenneth E. Gamble Kenneth E. Gamble Kenneth E. Gamble Kenneth E. Gamble Kenneth E. Gamble Kenneth E. Gamble Kenneth E. Gamble
Kenneth E. Gamble Kenneth E. Gamble Kenneth E. Gamble Kenneth E. Gamble Kenneth E. Gamble Kenneth E. Gamble Kenneth E. Gamble
James R. Kelley James R. Kelley James R. Kelley
James R. Kelley James R. Kelley James R. Kelley James R. Kelley James R. Kelley James R. Kelley James R. Kelley James R. Kelley James R. Kelley
T. Cooper (acting)
T. Cooper (acting)
vacant Cecil S. Williams Cecil S. Williams Cecil S. Williams Cecil S. Williams Cecil S. Williams
Raymond J. Buller Raymond J. Buller
Raymond J. Buller Raymond J. Buller Raymond J. Buller Raymond J. Buller Raymond J. Buller Raymond J. Buller Raymond J. Buller Raymond J. Buller Raymond J. Buller Raymond J. Buller
Raymond J. Buller Raymond J. Buller Raymond J. Buller Raymond J. Buller Raymond J. Buller Harvey W. Miller Harvey W. Miller Harvey W. Miller Harvey W. Miller Harvey W. Miller
Harvey W. Miller Harvey W. Miller Harvey W. Miller Harvey W. Miller Harvey W. Miller Harvey W. Miller Harvey W. Miller Harvey W. Miller Wilbur N. Ladd Wilbur N. Ladd
David E. Sharp David E. Sharp David E. Sharp David E. Sharp David E. Sharp David E. Sharp David E. Sharp David E. Sharp David E. Sharp David E. Sharp
David E. Sharp David E. Sharp David E. Sharp David E. Sharp David E. Sharp David E. Sharp David E. Sharp David E. Sharp David E. Sharp David E. Sharp
David E. Sharp James A. Dubovsky James A. Dubovsky James A. Dubovsky James A. Dubovsky James A. Dubovsky James A. Dubovsky James A. Dubovsky James A. Dubovsky James A. Dubovsky
James A. Dubovsky
John C. Chattin John C. Chattin John C. Chattin John C. Chattin John C. Chattin John C. Chattin John C. Chattin John C. Chattin
John C. Chattin John C. Chattin John C. Chattin John C. Chattin John C. Chattin John C. Chattin John C. Chattin John C. Chattin John C. Chattin John C. Chattin
John C. Chattin John C. Chattin John C. Chattin John C. Chattin John C. Chattin John C. Chattin John C. Chattin
James C. Bartonek James C. Bartonek James C. Bartonek
James C. Bartonek James C. Bartonek James C. Bartonek James C. Bartonek James C. Bartonek James C. Bartonek James C. Bartonek James C. Bartonek James C. Bartonek James C. Bartonek
James C. Bartonek James C. Bartonek James C. Bartonek James C. Bartonek James C. Bartonek James C. Bartonek
Robert E. Trost Robert E. Trost Robert E. Trost Robert E. Trost
Robert E. Trost Robert E. Trost Robert E. Trost Robert E. Trost Robert E. Trost Robert E. Trost Robert E. Trost Robert E. Trost Robert E. Trost Robert E. Trost
Robert E. Trost Robert E. Trost Robert E. Trost Robert E. Trost Todd A. Sanders Todd A. Sanders Todd A. Sanders Todd A. Sanders Todd A. Sanders Todd A. Sanders
Todd A. Sanders
FILE: S:\MBMO\CF_D\PROJECTS\ADMINISTRATIVE\HISTORIC\FLYWAY REPS.XLS
89

Central Flyway Databook 202012/22/2020
FW
S R
EG
ION
AL
a M
IGR
AT
OR
Y B
IRD
CO
OR
DIN
AT
OR
S/C
HIE
FS
b
YE
AR
R
EG
ION
1
RE
GIO
N 2
R
EG
ION
3
RE
GIO
N 4
R
EG
ION
5
RE
GIO
N 6
R
EG
ION
7
RE
GIO
N 8
90
1973
Jo
hn W
. Elli
s W
illia
m F
renc
h 19
74
John
W. E
llis
Will
iam
Fre
nch
1975
Jo
hn W
. Elli
s D
onal
d H
. Orr
W
illia
m F
renc
h 19
76
Jam
es M
onni
e La
rry
Sm
ith
John
W. E
llis
Don
ald
H. O
rr
Will
iam
Fre
nch
Rob
ert L
. Cro
ft Ja
mes
C. B
arto
nek
1977
Ja
mes
Mon
nie
Larr
y S
mith
Jo
hn W
. Elli
s D
onal
d H
. Orr
W
illia
m F
renc
h R
ober
t L. C
roft
Jam
es C
. Bar
tone
k 19
78
Jam
es M
onni
e La
rry
Sm
ith
John
W. E
llis
Don
ald
H. O
rr
Will
iam
Fre
nch
Rob
ert L
. Cro
ft W
ilbur
N. L
add
1979
R
icha
rd B
auer
La
rry
Sm
ith
John
W. E
llis
Don
ald
H. O
rr
Will
iam
Fre
nch
Rob
ert L
. Cro
ft W
ilbur
N. L
add
1980
R
icha
rd B
auer
La
rry
Sm
ith
John
W. E
llis
Don
ald
H. O
rr
Will
iam
Fre
nch
Rob
ert L
. Cro
ft va
cant
19
81
Ric
hard
Bau
er
Larr
y S
mith
Jo
hn W
. Elli
s D
onal
d H
. Orr
W
illia
m F
renc
h R
ober
t L. C
roft
E. F
rank
Bow
ers
1982
R
icha
rd B
auer
La
rry
Sm
ith
John
W. E
llis
Don
ald
H. O
rr
Will
iam
Fre
nch
Rob
ert L
. Cro
ft D
irk V
. Der
ksen
19
83
Ric
hard
Bau
er
Larr
y S
mith
Jo
hn W
. Elli
s D
onal
d H
. Orr
va
cant
R
ober
t L. C
roft
Dirk
V. D
erks
en
1984
R
icha
rd B
auer
La
rry
Sm
ith
John
W. E
llis
E. F
rank
Bow
ers
Geo
rge
Haa
s R
ober
t L. C
roft
Dirk
V. D
erks
en
1985
R
icha
rd B
auer
Je
ffrey
Has
kins
Jo
hn W
. Elli
s E
. Fra
nk B
ower
s G
eorg
e H
aas
Rob
ert L
. Cro
ft R
icha
rd S
. Pos
paha
la
1986
R
icha
rd B
auer
Je
ffrey
Has
kins
R
ober
t O. O
ettin
g E
. Fra
nk B
ower
s G
eorg
e H
aas
Rob
ert L
. Cro
ft R
icha
rd S
. Pos
paha
la
1987
R
icha
rd B
auer
Je
ffrey
Has
kins
R
ober
t O. O
ettin
g E
. Fra
nk B
ower
s G
eorg
e H
aas
Wilb
ur N
. Lad
d va
cant
19
88
Ric
hard
Bau
er
Jeffr
ey H
aski
ns
Ste
phen
D. W
ilds
E. F
rank
Bow
ers
Geo
rge
Haa
s Jo
hn E
. Cor
nely
va
cant
19
89
Ric
hard
Bau
er
Jeffr
ey H
aski
ns
Ste
phen
D. W
ilds
E. F
rank
Bow
ers
Geo
rge
Haa
s Jo
hn E
. Cor
nely
va
cant
1990
R
icha
rd B
auer
Je
ffrey
Has
kins
S
teph
en D
. Wild
s E
. Fra
nk B
ower
s G
eorg
e H
aas
John
E. C
orne
ly
Rob
in L
. Wes
t 19
91
Ric
hard
Bau
er
Jeffr
ey H
aski
ns
Ste
phen
D. W
ilds
E. F
rank
Bow
ers
Geo
rge
Haa
s Jo
hn E
. Cor
nely
R
obin
L. W
est
1992
R
icha
rd B
auer
Je
ffrey
Has
kins
S
teph
en D
. Wild
s E
. Fra
nk B
ower
s G
eorg
e H
aas
John
E. C
orne
ly
Rob
in L
. Wes
t 19
93
J. B
radl
ey B
ortn
er
Jeffr
ey H
aski
ns
Ste
phen
D. W
ilds
E. F
rank
Bow
ers
Geo
rge
Haa
s Jo
hn E
. Cor
nely
R
obin
L. W
est
1994
J.
Bra
dley
Bor
tner
Je
ffrey
Has
kins
S
teph
en D
. Wild
s E
. Fra
nk B
ower
s G
eorg
e H
aas
John
E. C
orne
ly
Rob
in L
. Wes
t 19
95
J. B
radl
ey B
ortn
er
Jeffr
ey H
aski
ns
Ste
phen
D. W
ilds
E. F
rank
Bow
ers
Geo
rge
Haa
s Jo
hn E
. Cor
nely
R
ober
t R. L
eedy
19
96
J. B
radl
ey B
ortn
er
Jeffr
ey H
aski
ns
Ste
phen
D. W
ilds
E. F
rank
Bow
ers
Geo
rge
Haa
s Jo
hn E
. Cor
nely
R
ober
t R. L
eedy
19
97
J. B
radl
ey B
ortn
er
Jeffr
ey H
aski
ns
Ste
phen
D. W
ilds
E. F
rank
Bow
ers
Geo
rge
Haa
s Jo
hn E
. Cor
nely
R
ober
t R. L
eedy
19
98
J. B
radl
ey B
ortn
er
Jeffr
ey H
aski
ns
Ste
phen
D. W
ilds
E. F
rank
Bow
ers
Geo
rge
Haa
s Jo
hn E
. Cor
nely
R
ober
t R. L
eedy
19
99
J. B
radl
ey B
ortn
er
Jeffr
ey H
aski
ns
Ste
phen
D. W
ilds
E. F
rank
Bow
ers
Geo
rge
Haa
s Jo
hn E
. Cor
nely
R
ober
t R. L
eedy
2000
J.
Bra
dley
Bor
tner
Je
ffrey
Has
kins
S
teph
en D
. Wild
s E
. Fra
nk B
ower
s G
eorg
e H
aas
John
E. C
orne
ly
Rob
ert R
. Lee
dy
2001
J.
Bra
dley
Bor
tner
Je
ffrey
Has
kins
S
teph
en D
. Wild
s E
. Fra
nk B
ower
s G
eorg
e H
aas
John
E. C
orne
ly
Rob
ert R
. Lee
dy
2002
J.
Bra
dley
Bor
tner
Je
ffrey
Has
kins
S
teph
en D
. Wild
s E
. Fra
nk B
ower
s G
eorg
e H
aas
John
E. C
orne
ly
Rob
ert R
. Lee
dy
2003
J.
Bra
dley
Bor
tner
Je
ffrey
Has
kins
S
teph
en D
. Wild
s E
. Fra
nk B
ower
s G
eorg
e H
aas
John
E. C
orne
ly
Rob
ert R
. Lee
dy
2004
J.
Bra
dley
Bor
tner
Je
ffrey
Has
kins
S
teph
en D
. Wild
s E
. Fra
nk B
ower
s G
eorg
e H
aas
John
E. C
orne
ly
Rob
ert R
. Lee
dy
2005
J.
Bra
dley
Bor
tner
Je
ffrey
Has
kins
S
teph
en D
. Wild
s D
avid
Vik
er
Dia
ne P
ence
Jo
hn E
. Cor
nely
R
ober
t R. L
eedy
20
06
J. B
radl
ey B
ortn
er
Jeffr
ey H
aski
ns
Ste
phen
D. W
ilds
Dav
id V
iker
D
iane
Pen
ce
John
E. C
orne
ly
Rus
s O
ates
20
07
J. B
radl
ey B
ortn
er
Jeffr
ey H
aski
ns
vaca
nt
Dav
id V
iker
D
iane
Pen
ce
Jam
es A
. Dub
ovsk
y R
uss
Oat
es
2008
J.
Bra
dley
Bor
tner
Je
ffrey
Has
kins
Ja
ne W
est
Dav
id V
iker
D
iane
Pen
ce
Jam
es A
. Dub
ovsk
y R
uss
Oat
es
2009
J.
Bra
dley
Bor
tner
Je
ffrey
Has
kins
Ja
ne W
est
Dav
id V
iker
D
iane
Pen
ce
Jam
es A
. Dub
ovsk
y R
uss
Oat
es
Mar
ie E
. Str
assb
urge
r
2010
J.
Bra
dley
Bor
tner
Je
ffrey
Has
kins
Ja
ne W
est
Dav
id V
iker
D
iane
Pen
ce
Jam
es A
. Dub
ovsk
y R
uss
Oat
es
Mar
ie E
. Str
assb
urge
r 20
11
J. B
radl
ey B
ortn
er
Jeffr
ey H
aski
ns
Jane
Wes
t va
cant
S
herr
y M
orga
n C
asey
Ste
mle
r R
uss
Oat
es
Mar
ie E
. Str
assb
urge
r 20
12
Nan
ette
Set
o Je
ffrey
Has
kins
Ja
ne W
est
Em
ily J
o W
illia
ms
She
rry
Mor
gan
Cas
ey S
tem
ler
Rus
s O
ates
M
arie
E. S
tras
sbur
ger
2013
N
anet
te S
eto
Gre
g H
ughe
s Ja
ne W
est
Em
ily J
o W
illia
ms
She
rry
Mor
gan
Cas
ey S
tem
ler
Eric
Tay
lor
Mar
ie E
. Str
assb
urge
r 20
14
Nan
ette
Set
o G
reg
Hug
hes
Bar
b Jo
nes
Em
ily J
o W
illia
ms
Pam
Tos
chik
C
asey
Ste
mle
r E
ric T
aylo
r M
arie
E. S
tras
sbur
ger
2015
N
anet
te S
eto
Gre
g H
ughe
s T
om C
oope
r La
urel
Bar
nhill
P
am T
osch
ik
Cas
ey S
tem
ler
Eric
Tay
lor
vaca
nt
2016
N
anet
te S
eto
Gre
g H
ughe
s T
om C
oope
r La
urel
Bar
nhill
P
am T
osch
ik
Cas
ey S
tem
ler
Eric
Tay
lor
vaca
nt
2017
N
anet
te S
eto
Sco
tt C
arle
ton
Tom
Coo
per
Laur
el B
arnh
ill
Pam
Tos
chik
C
asey
Ste
mle
r E
ric T
aylo
r A
med
ee B
ricke
y 20
18
Nan
ette
Set
o S
cott
Car
leto
n T
om C
oope
r La
urel
Bar
nhill
P
am T
osch
ik
Bria
n S
mith
E
ric T
a ylo
r A
med
ee B
ricke
y 20
19
Nan
ette
Set
o S
cott
Car
leto
n T
om C
oope
r La
urel
Bar
nhill
P
am T
osch
ik
Bria
n S
mith
E
ric T
a ylo
r A
med
ee B
ricke
y
2020
N
anet
te S
eto
Sco
tt C
arle
ton
Tom
Coo
per
Pos
ition
elim
inat
ed
Pam
Tos
chik
B
rian
Sm
ith
Eric
Tay
lor
Am
edee
Bric
key
a F
WS
RE
GIO
NS
: Por
tland
(1)
, Alb
uque
rque
(2)
, Min
neap
olis
(3)
, Atla
nta
(4),
Had
ley
(5),
Den
ver
(6),
Anc
hora
ge (
7), S
acra
men
to (
8)
MB
MO
/CF
_D/P
roje
cts/
Adm
inis
trat
ive/
His
toric
/FW
SM
BC
.xls
b P
rior
to 2
000,
Mig
rato
ry B
irds
was
par
t of R
efug
es a
nd le
ad w
as c
alle
d C
oord
inat
or; w
hen
Mig
rato
ry B
irds
was
sep
arat
ed fr
om R
efu
ges
in 2
000,
Reg
iona
l lea
ds w
ere
Chi
efs.