Central America - World Bank Documents and Reports
274
November 30, 2005 Document of the World Bank Report No. 29946 Central America Education Strategy Paper Human Development Department Latin America and the Caribbean Region Public Disclosure Authorized Public Disclosure Authorized Public Disclosure Authorized Public Disclosure Authorized Public Disclosure Authorized Public Disclosure Authorized Public Disclosure Authorized Public Disclosure Authorized
-
Upload
khangminh22 -
Category
Documents
-
view
3 -
download
0
Transcript of Central America - World Bank Documents and Reports

November 30, 2005
Document of the World BankReport No. 29946Report No. 29946Report No. 29946Report No. 29946Report No. 29946
CeCe CeCeCentnt ntntntrr rrral al al al al A
mAm
Am
Am
Amee eeerr rrrii iiicc cccaa aaa
Edu
Edu
Edu
Edu
Educc cccaa aaatt tttii iiioo ooo
n Stn Stn Stn Stn St
rr rrraa aaatt tttee eeegg gggy Py Py Py Py P
aa aaapp pppee eeerr rrr
Report No. 29946
Central AmericaEducation Strategy Paper
Human Development DepartmentLatin America and the Caribbean Region
Pub
lic D
iscl
osur
e A
utho
rized
Pub
lic D
iscl
osur
e A
utho
rized
Pub
lic D
iscl
osur
e A
utho
rized
Pub
lic D
iscl
osur
e A
utho
rized
Pub
lic D
iscl
osur
e A
utho
rized
Pub
lic D
iscl
osur
e A
utho
rized
Pub
lic D
iscl
osur
e A
utho
rized
Pub
lic D
iscl
osur
e A
utho
rized

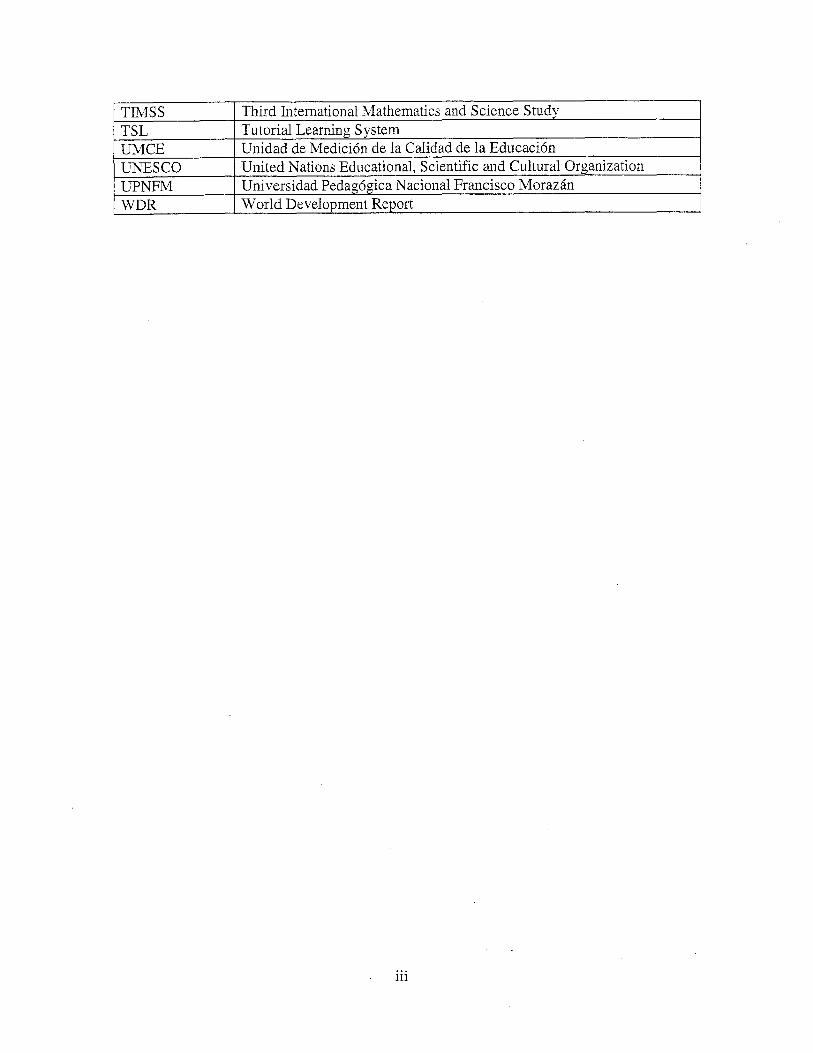
TIMS S TSL U M C E UNESCO UPNFM WDR
... 111
Third International Mathematics and Science Study Tutorial Learning System Unidad de Medici6n de l a Calidad de l a Educaci6n United Nations Educational, Scientific and Cultural Organization Universidad Pedag6gica Nacional Francisco Moraz An W o r l d Development Report

TABLE OF CONTENTS Page No .
CHAPTER I: A DIAGNOSIS OF EDUCATIONAL PERFORMANCE IN CENTRAL AMERICA ........................................................................... 1 I . COVERAGE OF THE EDUCATION SYSTEMS ...................................................................... 1
A . Average years of education attained ....................................................................... 2 B . Gross and Net Enrollment Rates ............................................................................. 3
11 . INTERNAL EFFICIENCY OF EDUCATION SYSTEMS .......................................................... 7 A . Completion Rate ...................................................................................................... 7 B . Survival Rate ......................................................................................................... 10 C . Age-by-grade Distortion and Repetition Rates ..................................................... 15
111 . QUALITY OF EDUCATION SYSTEMS ............................................................................ 20 A . Standardized testing .............................................................................................. 20 B . Learning outcomes ................................................................................................ 22
w . R A T E S OF RETURN TO EDUCATION ............................................................................ 25 V . EQUITY OF EDUCATIONAL OUTCOMES ........................................................................ 31
A . UrbadRural divide ............................................................................................... 31 B . Socio-economic differences in educational pe$ormance ..................................... 35 C . Educational Outcomes and Gender ...................................................................... 41 D . Educational outcomes and indigenous and afro-descendent population ............. 42
V I . CONCLUSIONS ............................................................................................................ 4~
CHAPTER 11: DETERMINANTS OF (AND CONSTRAINTS TO) LEARNING IN CENTRAL AMERICA .................................................. 46
.................................................................................................................................. 47 11 . EXISTING EVIDENCE ON DETERMINANTS OF LEARNING IN CENTRAL AMERICA .......... 49
A . Student Background Constraints to Learning in Central America ....................... 50 B . Teacher Quality ..................................................................................................... 53
I . A REVIEW OF CENTRAL AMERICAN NATIONAL EDUCATIONAL ASSESSMENT SYSTEMS
C . Pedagogical Practices .......................................................................................... 67 D . Education spending and school management ....................................................... 72
I11 . POLICY IMPLICATIONS ............................................................................................... 73 A . Learning Determinants of Effective Schools ......................................................... 73 B . Background Characteristics Policy Implications .............................................. 79 C . Teacher Quality Policy Implications .................................................................... 90 D . Pedagogical Practice Policy Implications ........................................................... 91
IV . CONCLUSIONS AND POLICY IMPLICATIONS ................................................................ 93
CHAPTER 111: EXPANDING SECONDARY EDUCATION IN CENTRAL AMERICA .............................................................................. 97 I . WHY I S EXPANDING COVERAGE OF SECONDARY IN A BROAD-BASED MANNER A
REGIONAL PRIORITY? ................................................................................................ 97 11 . CONSTRAINTS TO EQUITABLE SECONDARY COVERAGE .............................................. 99
i v
111 . ALTERNATIVES FOR INCREASING SECONDARY COVERAGE ...................................... 106 A . Public and Private Financing ............................................................................. 106 B . Demand-side Interventions ................................................................................. 111
D . Quality and Relevance ........................................................................................ 116 E . What Policy Combination Should be Advanced in each Country ? .................... 117
C . Alternative Delivery Models ............................................................................... 113
Iv . HOW MUCH WOULD I T COST TO INCREASE SECONDARY COVERAGE? SIMULATIONS FOR EL SALVADOR AND HONDURAS ........................................................................ 117
A . Targets and Main Assumptions of Simulations ................................................... 11 8 B . Scenarios and Cost Projections .......................................................................... 119
V . CONCLUSIONS ........................................................................................................... 126
CHAPTER IV: A REVIEW OF EDUCATION EXPENDITURE IN CENTRAL AMERICA ............................................................................ 129
1 . PUBLIC EDUCATION SPENDING: LEVELS AND EVOLUTION ......................................... 129 11 . DISAGGREGRATION OF EDUCATIONAL EXPENDITURES B Y EDUCATION LEVEL AND PER-
STUDENT AND CHILD UNIT COSTS ........................................................................... 131 111 . EQUITY CHALLENGES IN TERMS OF PER-CAPITA EDUCATION EXPENDITURE .......... 136
A . The distribution of public enrollment and school-age population across income
B . Public subsidy per school-age population by quintile ........................................ 140
INEQUITABLE EDUCATION FINANCING .................................................................... 143 V . EFFICIENCY OF PUBLIC EXPENDITURE ...................................................................... 145
A . Cost-Effectiveness ............................................................................................... 146 B . Expenditure distribution by area ......................................................................... 148 C . Case study: Low cost-efectiveness and high ineflciency in Honduras ............. 151
V I . THE ROLE OF EXTERNAL FUNDS .............................................................................. 153 A . Magnitude and composition of external funds .................................................... 154
CONCLUSIONS ................................................................................................................ 157
MANAGEMENT IN CENTRAL AMERICA ........................................ 160 I . CONCEPTUAL FRAMEWORK ........................................................................................ 161
A . History and Overview of Decentralization Reforms in Central America ........... 163
I11 . IMPACT OF DECENTRALIZATION REFORMS .............................................................. 177 A . Comparing School Environments with and without Decentralized Educational Provision .................................................................................................................. 178 B . Comparing Enrollments and Student Outcomes With and Without Decentralized Educational Provision ............................................................................................. 187 . EXPLAINING THE IMPACT ......................................................................................... 195 A . Explaining impacts and progress in terms of assets available and linking teacher effort to learning outcomes ...................................................................................... 196
. . quintiles .................................................................................................................... 136
Iv . PRIVATE HOUSEHOLD EDUCATION EXPENDITURES ALSO DEMONSTRATE
CHAPTER V: A COMPARATIVE ANALYSIS OF SCHOOL-BASED
11 . COMPARING EDUCATION DECENTRALIZATION REFORMS IN CENTRAL AMERICA ..... 163
B . Comparing the Different Reform Designs ........................................................... 168
B . Explaining the impact in terms ofthe reform design .......................................... 201
V
C . Explaining the impact in terms of contexts of implementation ........................... 205 v . CONCLUSIONS AND POLICY RECOMMENDATIONS ..................................................... 208 REFERENCES .................................................................................................................. 213
INDEX OF TABLES Page No .
TABLE 1.1: COMPLETION R A T E S AT THE PRIMARY AND SECONDARY LEVEL .................... 8 TABLE 1.2 : PRIMARY COMPLETION RATE FOR DIFFERENT COHORTS ............................... 9 TABLE 1.3: STANDARDIZED TESTING IN CENTRAL AMERICA .......................................... 22 TABLE 1.4: PRIVATE R A T E S OF RE TURN .......................................................................... 27
TABLE 2.1 : SUMMARY FINDINGS ON FAMILY AND COMMUNITY RELATED DETERMINANTS OF EDUCATION QUALITY IN CENTRAL AMERICA AND THE LATIN AMERICAN LABORATORY STUDY ............................................................................. 51
TABLE 2.2: SUMMARY FINDINGS ON TEACHER RELATED DETERMINANTS OF EDUCATION QUALITY IN CENTRAL AMERICA AND THE LATIN AMERICAN
TABLE 2.3: HIGHEST LEVEL OF EDUCATION ATTAINED BY TEACHERS IN CENTRAL LABORATORY STUDY ................................................................................................ 55
AMERICAN COUNTRIES .............................................................................................. 56 TABLE 2.4: MEASURES OF TEACHER EFFORT .................................................................. 61 TABLE 2.5: HOURLY SALARIES ACROSS TEACHERS AND PROFESSIONS WITH SIMILAR
EDUCATIONAL ATTAINMENT ...................................................................................... 6 3 TABLE 2.6: HONDURAS - SALARY PER HOUR FOR PRIMARY TEACHERS ........................... 64 TABLE 2.7: EL SALVADOR- EVOLUTION OF REAL SALARIES FOR PUBLIC AND PRIVATE
TEACHERS .................................................................................................................. 64
PRIMARY TEACHERS ................................................................................................... 6 5
DETERMINANTS OF EDUCATION QUALITY IN CENTRAL AMERICA AND THE LATIN
TABLE 2.8: HONDURAS-EVOLUTION OF REAL SALARIES FOR PUBLIC AND PRIVATE
TABLE 2.9: SUMMARY FINDINGS OF PEDAGOGICAL AND CURIUCULUM RELATED
AMERICAN LABORATORY STUDY ............................................................................. 68 TABLE 2.10: EFFECTIVE CLASS HOURS IN CENTRAL AMERICAN COUNTRIES .................. 71
CONTROL GROUP SCHOOLS ....................................................................................... 7 5 TABLE 2.1 1 : TEACHER AND PRINCIPAL CHARACTERISTICS IN EFFECTIVE AND
TABLE 2.12: PEDAGOGICAL PRACTICES IN EFFECTIVE AND CONTROL GROUP SCHOOL .. 76 TABLE 2.13: SCHOOL MANAGEMENT PRACTICES IN EFFECTIVE AND CONTROL GROUP
TABLE 2.14: NICARAGUA - TEST SCORES IN MULTIGRADE AND TRADITIONAL MODEL
TABLE 2.15: GUATEMALA - RETENTION AND PROGRESSION R A T E S FOR mu AND
SCHOOLS ................................................................................................................... 76
SCHOOLS ................................................................................................................... 82
TRADITIONAL SCHOOL STUDENTS ............................................................................. 83 TABLE 2.16: TEST SCORES IN EBI AND CONTROL SCHOOLS IN GUATEMALA
(1986-1991) .............................................................................................................. 8 6
v i
TABLE 3.1 : REASONS FOR NON ATTENDANCE IN THE 13- 15 AND 16- 18 AGE RANGES .... 100 TABLE 3.2:TOTAL EDUCATION EXPENDITURE IN SECONDARY EDUCATION BY SOURCE
OF FINANCING (US$. 000) ....................................................................................... 106
TABLE 3.4: CURRENT AND TARGET SECONDARY GER (REPETITION ADJUSTED) FOR COST SIMULATIONS .......................................................................................................... 118
MECHANISM, U S $ (2002) ........................................................................................ 119 TABLE 3.6: EL SALVADOR- SECONDARY TARGETS SIMULATION RESULTS .................... 123 TABLE 3.7: HONDURAS- SECONDARY TARGETS SIMULATION RESULTS ....................... 125
TABLE 3.3: PUBLIC ENROLLMENT SHARE IN SECONDARY EDUCATION (%) .................... 107
TABLE 3.5: UNIT COSTS PER DIFFERENT TYPE OF PUBLIC PROVIDER AND FINANCING
TABLE 4.1: PUBLIC EDUCATION EXPENDITURE IN PROPORTION OF GDP ..................... 129 TABLE 4.2: FUNCTIONAL DISAGREGATION OF EXPENDITURE ........................................ 132 TABLE 4.3: PER-CAPITA PUBLIC SUBSIDY IN PFUMARY ................................................. 142 TABLE 4.4: PER CAPITA PUBLIC SUBSIDY IN SECONDARY ............................................ 142
TABLE 4.6: PRIVATE SPENDING PER STUDENT BY INCOME QUINTILE AS A TABLE 4.5: ANNUAL PRIVATE SPENDING PER STUDENT BY INCOME QUINTILE ............ 144
PROPORTION OF ANNUAL HOUSEHOLD INCOME ...................................................... 144 TABLE 4.7: ECONOMIC DISAGREGATION OF EXPENDITURE .......................................... 149 TABLE 4.8: PROPORTION OF NATIONAL AND EXTERNAL FUNDS IN PUBLIC EDUCATION
TABLE 4.9: ALLOCATION OF EXTERNAL FUNDS ACROSS ECONOMIC CATEGORIES - EXPENDITURE, 2002 us$ MILLIONS (UNLESS OTHERWISE SPECIFIED) ..................... 154
2002 us$ MILLION ........................................................................................................... 155
TABLE 5.1: ORGANIZATIONAL AND IMPLEMENTATION RESPONSIBILITIES ..................... 170 TABLE 5.2: CHARACTERISTICS OF SCHOOL COUNCILS ................................................... 172 TABLE 5.3: FUNCTIONS DECENTRALIZED TO SCHOOL COUNCILS .................................. 173 TABLE 5.4: FINANCIAL TRANSFERS ............................................................................... 174 TABLE 5.5: TEACHER COMPENSATION AND TENURE IN S B M VS . TRADITIONAL
SCHOOLS ................................................................................................................. 176
REGULAR” SCHOOLS .............................................................................................. 179 TABLE 5.6: PARENTAL INVOLVEMENT IN COMMUNITY SCHOOLS VERSUS
TABLE 5.7: SCHOOL AND COMMUNITY AUTONOMY IN COMMUNITY SCHOOLS VERSUS “REGULAR” SCHOOLS. NICARAGUA. HONDURAS AND GUATEMALA ....................... 182
TABLE 5.8: TEACHER ATTENDANCE AND WORK HOURS .............................................. 185 TABLE 5.9: AVERAGE STUDENT-TEACHER RATIO AND ENROLLMENT .......................... 186
6 6
TABLE 5.10: COVERAGE EXPANSION: EDUCO, 199 1-200 1 ......................................... 188 TABLE 5.11: PRONADE: ACCOMPLISHMENTS 1996, 2000-2004 ................................. 190
AUTONOMOUS SCHOOLS BY GRADE, 2003 ................................................................ 192 TABLE 5.13: THIRDFOURTH GRADE TEST SCORE AVERAGES BY SCHOOL TYPE.........^^^
TABLE 5.12: NICARAGUA: EFFICIENCY INDICATORS FOR AUTONOMOUS AND NON-
vii
TABLE OF FIGURES
FIGURE 1.1 : STRUCTURE OF THE EDUCATION SYSTEMS IN CENTRAL AMERICA ................. 2 FIGURE 1.2: AVERAGE YEARS OF EDUCATION ATTAINED IN CENTRAL AMERICA ............. 3 FIGURE 1.3: EDUCATIONAL ATTAINMENT AND INCOME PER-CAPITA, 2000 ........................ 3 FIGURE 1.4: GER AND NER IN PRIMARY (DIFFERENT DATA SOURCES) ............................. 5 FIGURE 1.5: GER AND NER IN SECONDARY (DIFFERENT DATA SOURCES) ........................ 5 FIGURE 1.6: THE “SECONDARY EDUCATION GAP” ............................................................ 6 FIGURE 1.7: COMPARATIVE EVOLUTION OF NERs ............................................................ 7 FIGURE 1.8: GERs AND GCRs IN PRLMARY ..................................................................... 10 FIGURE 1.9: GERs AND GCRs IN SECONDARY ................................................................ 10
FIGURE 1.11: RCM AND SFP IN EL SALVADOR ............................................................... 14 FIGURE 1.12: RCM AND SFP IN HONDURAS .................................................................... 14
FIGURE 1.10: COMPARATIVE SURVIVOR PLOTS ................................................................ 12
FIGURE 1.13: RCM AND SFP IN NICARAGUA .................................................................. 15 FIGURE 1.14: AGE-BY-GRADE DISTORTION AND PROPORTION OF OUT OF AGE CHILDREN 16 FIGURE 1.15: COMPARATIVE SURVIVOR FUNCTION PLOTS BY AGE ................................... 17 FIGURE 1.1 6: COMPARATIVE REPETITION RATES ACCORDING TO DIFFERENT SOURCES .... 19 FIGURE 1.17: INCOME PER-CAPITA AND REPETITION RATE IN PRIMARY ........................... 20 FIGURE 1.18: TEST SCORES RESULTS IN EL SALVADOR .................................................... 24
FIGURE 1.20: TEST SCORES RESULTS IN NICARAGUA ....................................................... 24 FIGURE 1.19: TEST SCORES RESULTS IN HONDURAS ........................................................ 24
FIGURE 1.21: TEST SCORES RESULTS IN COSTA RrCA ....................................................... 24 FIGURE 1.22: THIRD GRADE MATHEMATICS TEST RESULTS AND GDP PER CAPITA FOR
SELECTED COUNTRIES ............................................................................................... 25 FIGURE 1.23: THIRD GRADE LANGUAGE TEST RESULTS AND GDP PER CAPITA FOR
SELECTED COUNTRIES ............................................................................................... 25 FIGURE 1.24: m A T E RATES OF RETURN IN CENTRAL AMERICA AND OTHER
COUNTRIES ................................................................................................................. 28 FIGURE 1.25: PRIVATE RATES OF RETURN AND EDUCATIONAL ATTAINMENT IN
CENTRAL AMERICA ................................................................................................... 28 FIGURE 1.26: RATE OF RETURN BY LEVEL OF EDUCATION ................................................ 29 FIGURE 1.27: UPPER SECONDARY RETURNS AND EDUCATIONAL ATTAINMENT ................ 29 FIGURE 1.28: EVOLUTION OF RATES OF RETURN ACROSS COHORTS ................................ 30 FIGURE 1.29: EVOLUTION OF GER AND NER ACROSS URBAN AND RURAL AREAS ......... 32 FIGURE 1.30: PRIMARY GER, NER AND GCR IN URBAN AND RURAL AREA .................. 32 FIGURE 1.3 1 : SECONDARY GER, NER AND GCR IN URBAN AND RURAL AREAS ............. 33 FIGURE 1.32: HONDURAS-LEVEL OF URBANIZATION AND COMPLETION RATE, BY
DEPARTMENT (2002) .................................................................................................. 35 FIGURE 133: EDUCATIONAL ATTAINMENT OFTHE 25 YEAR COHORT ............................... 36 FIGURE 1.34: GER, NER AND GCR ACROSS QUINTILE IN PRIMARY .............................. 36 FIGURE 1.35: GER, NER AND GCR ACROSS QUINTILES IN SECONDARY ......................... 37 FIGURE 1.36: AVERAGE SECONDARY GER AND GER BY QUINTILE IN EL SALVADOR AND
NICARAGUA ............................................................................................................... 37 FIGURE 137: SURVIVOR PLOTS BY QUINTILE ................................................................... 38
... VI11
FIGURE 1.38: REPETITION BY QUINTILE ........................................................................... 3 9
FIGURE 1.40: EVOLUTION ACROSS COHORTS OF RATES OF RETURN BY QUINTILE ............. 40 FIGURE 1.39: PRIVATE RETURNS TO SCHOOLING BY EARNING QUINTILE ........................ 3 9
FIGURE 1 . 41: PRIMARY COMPLETION RATE BY GENDER ................................................ 41 FIGURE 1.42: PRIMARY GER. NER AND GCR FOR INDIGENOUS AND NON-
INDIGENOUS ............................................................................................................... 4 3 FIGURE 1.43: SECONDARY GER. NER AND GCR FOR INDIGENOUS AND NON- INDIGENOUS
.................................................................................................................................. 4 3 FIGURE 2.1 : HONDURAS: DISTRIBUTION OF TEACHERS ACROSS URBAN AND RURAL
AREAS BY LEVEL OF EDUCATION ATTAINED ............................................................... 5 7 FIGURE 2.2: EL SALVADOR- EVOLUTION OF REAL SALARY. HOURS WORKED AND SALARY
PER HOUR FOR PUBLIC TEACHERS ............................................................................. 6 5 FIGURE 2.3: HONDURAS- EVOLUTION OF REAL SALARY. HOURS WORKED AND SALARY PER
HOUR FOR PUBLIC PRIMARY TEACHERS ...................................................................... 66 FIGURE 2.4: NOTIONAL AND EFFECTIVE CLASS HOURS PER YEAR .................................... 72
FIGURE 3.1 : ILLUSTRATION OF CENTRAL AMERICAN EDUCATION DISTRIBUTION ........... 98 FIGURE 3.2: PRIVATE COSTS OF SECONDARY ARE SIGNIRCANTLY HIGHER THAN
THE PRIVATE COSTS OF PRIMARY ............................................................................ 101 FIGURE 3.3: COMPARATIVE SURVIVOR PLOTS BY GRADE ............................................... 102 FIGURE 3.4: COMPARATIVE SURVIVOR FUNCTION PLOTS BY AGE ................................... 102 FIGURE 3.5: PUBLIC AND PRIVATE ENROLLMENT BY INCOME QUINTILES ....................... 108
FIGURE 4.1 : EDUCATION SPENDING AS A PROPORTION OF GNP. 1999/2000 ................. 1 3 0 FIGURE 4.2: EDUCATION EXPENDITURE PER SCHOOL AGE POPULATION. 2001/2002 .... 131 FIGURE 4.3: FUNCTIONAL EXPENDITURE DISAGGREGATION. 2002 ............................... 132 FIGURE 4.4: EXPENDITURE PER CHILD AND STUDENT. 2001/02 ..................................... 134 FIGURE 4.5: PUBLIC EDUCATION EXPENDITURE PER STUDENT IN % OF GDP
CAPITA. 2000 ........................................................................................................... 135
INCOME QUINTILE AND LEVELS OF EDUCATION ........................................................ 138
PER
FIGURE 4.6: DISTRIBUTION OF PUBLIC ENROLLMENT AND POPULATION SHARES BY
FIGURE 4.7: COMPOSITION OF PRIVATE EXPENDITURE IN THE PUBLIC SECTOR FOR
FIGURE 4.8 : EDUCATION EXPENDITURE/GNP AND SECONDARY GROSS ENROLLMENT
FIGURE 4.9: EDUCATION EXPENDITURE/GNP AND PRIMARY COMPLETION RATE.
FIGURE 4.10: PRIMARY COMPLETION RATE AND EDUCATION EXPENDITURE.
FIGURE 4.1 1 : SECONDARY COMPLETION RATE AND EDUCATION EXPENDITURE.
SECONDARY EDUCATION (%) .................................................................................. 145
RATE. 2001/2002 ..................................................................................................... 147
2001/2002 ............................................................................................................... 147
2001/2002 ............................................................................................................... 148
2001/2002 ............................................................................................................... 148 FIGURE 4.12: RECURRENT AND CAPITAL EXPENDITURES. 2002 .................................... 150
2002 ................................................................................................................................ 1 5 1
PRIMARY COMPLETION RATE IN HONDURAS (1998-2001) ...................................... 152
FIGURE 4.13: SALARY. NON-SALARY RECURRENT AND CAPITAL EXPENDITURES.
FIGURE 4.14: EVOLUTION OF EDUCATIONAL EXPENDITURE. TEST SCORES AND
i x

FIGURE 4.15: HONDURAS-DETERMINANTS OF WAGE BILL INCREASE ........................... 153 FIGURE 4.16: INVESTMENT. NON SALARY RECURRENT AND SALARY EXPENDITURE
FINANCED BY EXTERNAL AND TOTAL FLiNDS ............................................................ 156
FIGURE 5.1: CONCEPTUAL FRAMEWORK ....................................................................... 163
X


ACKNOWLEDGMENTS
This report was prepared b y Emanuela di Gropello under the general supervision o f Helena Ribe (previous Sector Leader, LCHSD), Eduardo Velez-Bustillo (Sector Manager, LCHSD) and Laura Rawlings (new Sector Leader, LCSHD). The task team also included Ilana Umansky (LCHSD) and Paula Savanti (LCSHD). Julie B. Nannucci was the Language Program Assistant. Peer reviewers were Manny Jimenez (EASHD) and Alec Gershberg (HDNED).
The report incorporates the comments o f the Ministr ies o f Education o f El Salvador, Guatemala, Honduras and Nicaragua (its four focus countries), largely provided through a regional workshop held in Dominican Republic on March 14-17, 2005 to present the main results o f the report.
Special thanks go to Nina Heinsohn (PRMPR), Jeff Marshall (Consultant, Stanford University), Renan Rapalo (Director o f UMCE, Honduras) and Darlyn Meza (Minister o f Education, El Salvador) for their help in putting together Chapter V o n School-Based Management in Central America. M i k e Walton (Regional Advisor, LCRCE) and Ar ie l Fiszbein (Lead Economist, LCHSD) also provided very useful comments on that same chapter.
Thanks also to the members o f the Central America HD team, Suhas Parandekar, Carlos Rojas, Joel Reyes, Angela Demas, Andy Mason and Manuel Salazar for support, advice and useful comments on this report draft.
Finally, thanks to my special group o f advisors who provided invaluable comments on education sector issues in Central America. The group includes Ian Walker (ESA Consultant, Honduras), Cecilia D e Can0 (Ex-Minister o f Education, El Salvador), Regina Caffaro de Morenos (Director of PRONADE, Guatemala), Abigail Castro de Perez (Director o f the O E I for Central America), Marvin Herrera Arraya (General Secretary o f the CECC), Arbelio Garcia (Director o f UNESCO for Central America) and Donald Winder (Consultant, The Wor ld Bank).
x i

Chapter I: A Diannosis of Educational Performance in Central America
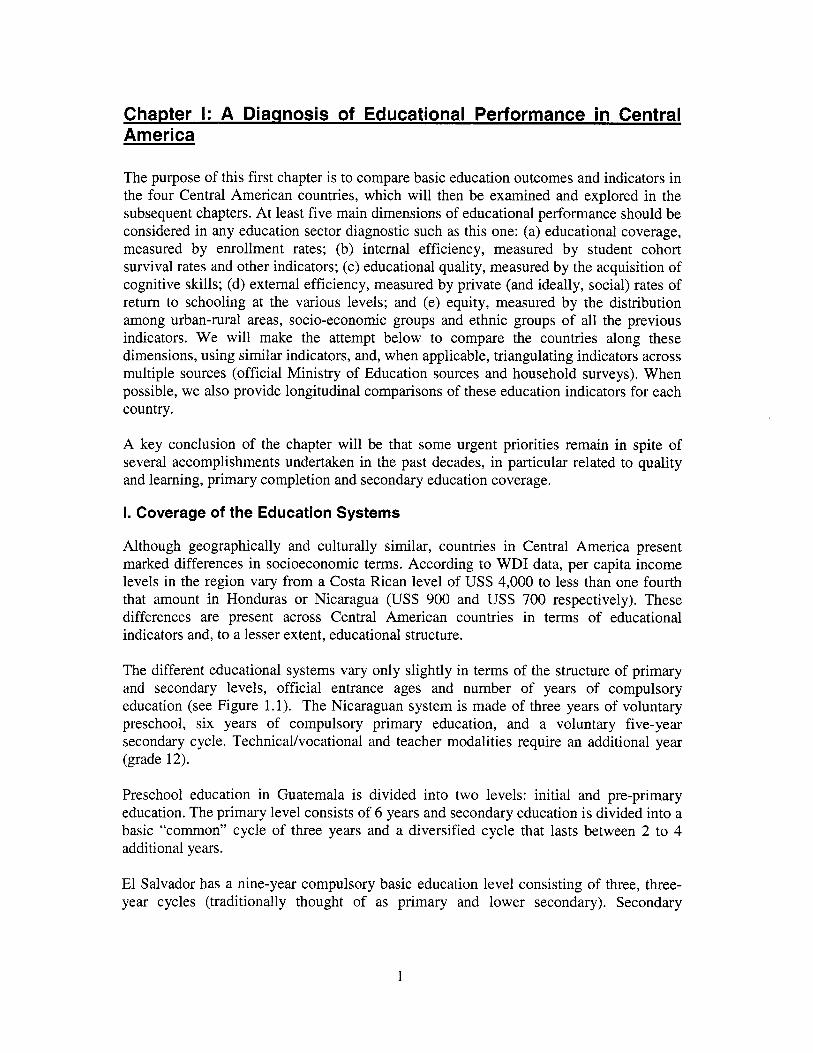
The purpose of this first chapter is to compare basic education outcomes and indicators in the four Central American countries, which wil l then be examined and explored in the subsequent chapters. At least five main dimensions of educational performance should be considered in any education sector diagnostic such as this one: (a) educational coverage, measured by enrollment rates; (b) internal efficiency, measured b y student cohort survival rates and other indicators; (c) educational quality, measured by the acquisition o f cognitive skills; (d) external efficiency, measured b y private (and ideally, social) rates of return to schooling at the various levels; and (e) equity, measured by the distribution among urban-rural areas, socio-economic groups and ethnic groups o f al l the previous indicators. We w i l l make the attempt below to compare the countries along these dimensions, using similar indicators, and, when applicable, triangulating indicators across multiple sources (official Ministry o f Education sources and household surveys). When possible, we also provide longitudinal comparisons o f these education indicators for each country.
A key conclusion o f the chapter w i l l be that some urgent priorities remain in spite o f several accomplishments undertaken in the past decades, in particular related to quality and learning, primary completion and secondary education coverage.
1. Coverage of the Education Systems
Although geographically and culturally s imi lar , countries in Central America present marked differences in socioeconomic terms. According to WDI data, per capita income levels in the region vary from a Costa Rican level of US$ 4,000 to less than one fourth that amount in Honduras or Nicaragua (US$ 900 and US$ 700 respectively). These differences are present across Central American countries in terms o f educational indicators and, to a lesser extent, educational structure.
The different educational systems vary only slightly in terms o f the structure o f primary and secondary levels, official entrance ages and number o f years o f compulsory education (see Figure 1.1). The Nicaraguan system i s made o f three years o f voluntary preschool, six years of compulsory primary education, and a voluntary five-year secondary cycle. Technicalhocational and teacher modalities require an additional year (grade 12).
Preschool education in Guatemala i s divided into two levels: ini t ial and pre-primary education. The primary level consists o f 6 years and secondary education i s divided into a basic “c011lfnon~’ cycle o f three years and a diversified cycle that lasts between 2 to 4 additional years.
El Salvador has a nine-year compulsory basic education level consisting o f three, three- year cycles (traditionally thought o f as primary and lower secondary). Secondary
1
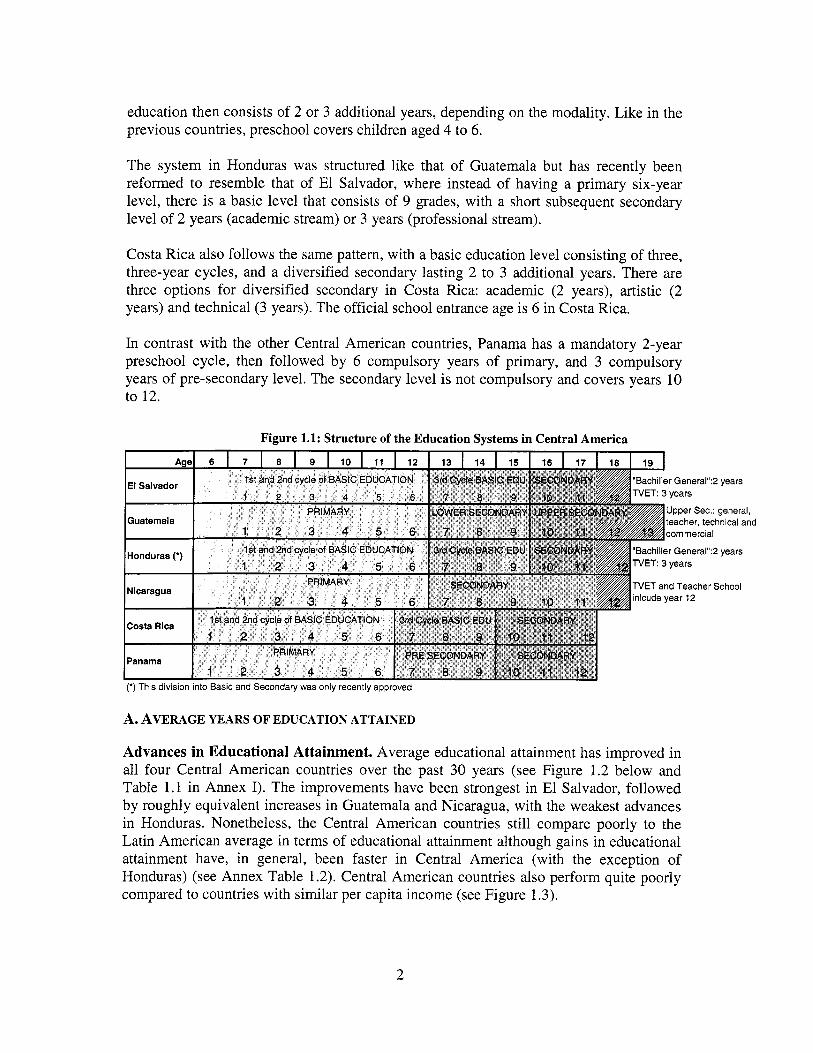
education then consists o f 2 or 3 additional years, depending on the modality. L i ke in the previous countries, preschool covers children aged 4 to 6.
The system in Honduras was structured l ike that o f Guatemala but has recently been reformed to resemble that of El Salvador, where instead o f having a primary six-year level, there i s a basic level that consists o f 9 grades, with a short subsequent secondary level o f 2 years (academic stream) or 3 years (professional stream).
Costa Rica also follows the same pattern, with a basic education level consisting o f three, three-year cycles, and a diversified secondary lasting 2 to 3 additional years. There are three options for diversified secondary in Costa Rica: academic (2 years), artistic (2 years) and technical (3 years). The official school entrance age i s 6 in Costa Rica.
In contrast wi th the other Central American countries, Panama has a mandatory 2-year preschool cycle, then followed by 6 compulsory years o f primary, and 3 compulsory years o f pre-secondary level. The secondary level i s not compulsory and covers years 10 to 12.
Figure 1.1: Structure of the Education Systems in Central America
A. AVERAGE YEARS OF EDUCATION ATTAINED
Advances in Educational Attainment. Average educational attainment has improved in al l four Central American countries over the past 30 years (see Figure 1.2 below and Table 1.1 in Annex I). The improvements have been strongest in El Salvador, followed by roughly equivalent increases in Guatemala and Nicaragua, with the weakest advances in Honduras. Nonetheless, the Central American countries still compare poorly to the Latin American average in terms o f educational attainment although gains in educational attainment have, in general, been faster in Central America (with the exception of Honduras) (see Annex Table 1.2). Central American countries also perform quite poorly compared to countries with similar per capita income (see Figure 1.3).
2
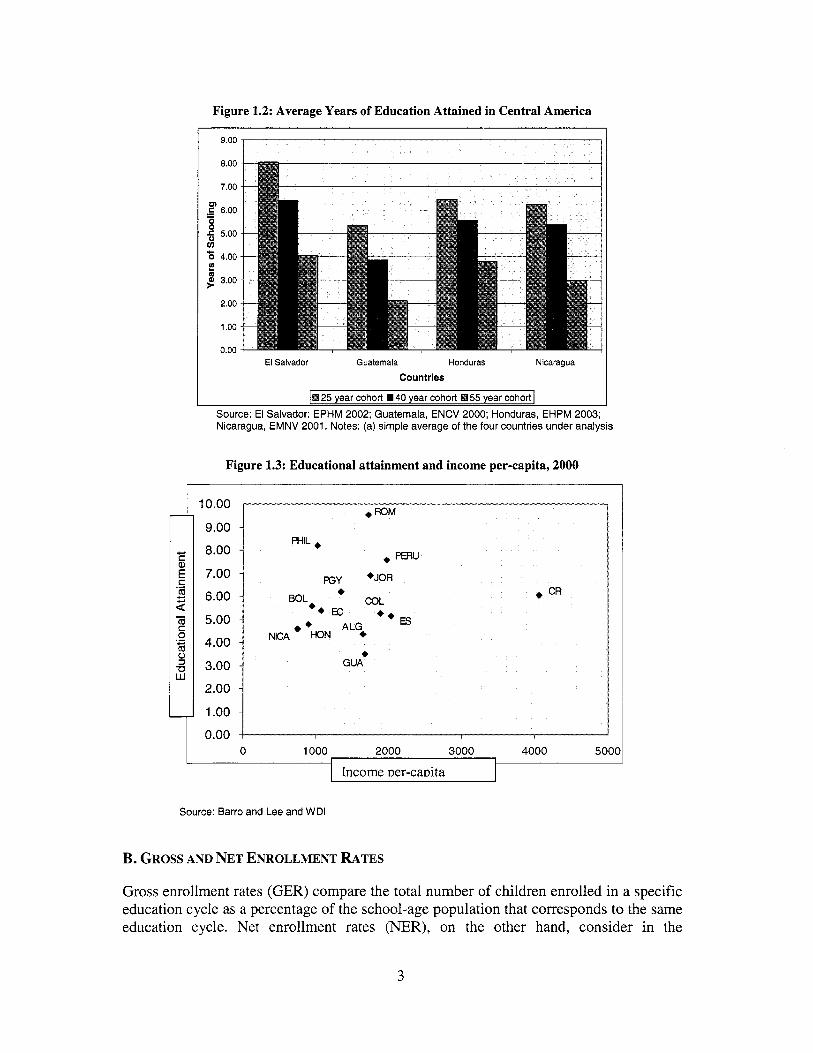
Figure 1.2: Average Years of Education Attained in Central America
Source: El Salvador: EPHM 2002; Guatemala, ENCV 2000; Honduras, EHPM 2003; Nicaragua, EMNV 2001. Notes: (a) simple average of the four countries under analysis
Figure 1.3: Educational attainment and income per-capita, 2000
1 10.00
9.00
8.00
7.00
6.00
5.00
4.00
3.00
2.00
1 .oo 0.00
. GUA
0 1000 2000 3000 4000 5000 I
Income Der-caDita
Source: Barro and Lee and WDI
B. GROSS AND NET ENROLLMENT RATES
Gross enrollment rates (GER) compare the total number o f children enrolled in a specific education cycle as a percentage o f the school-age population that corresponds to the same education cycle. Net enrollment rates (NER), on the other hand, consider in the
3
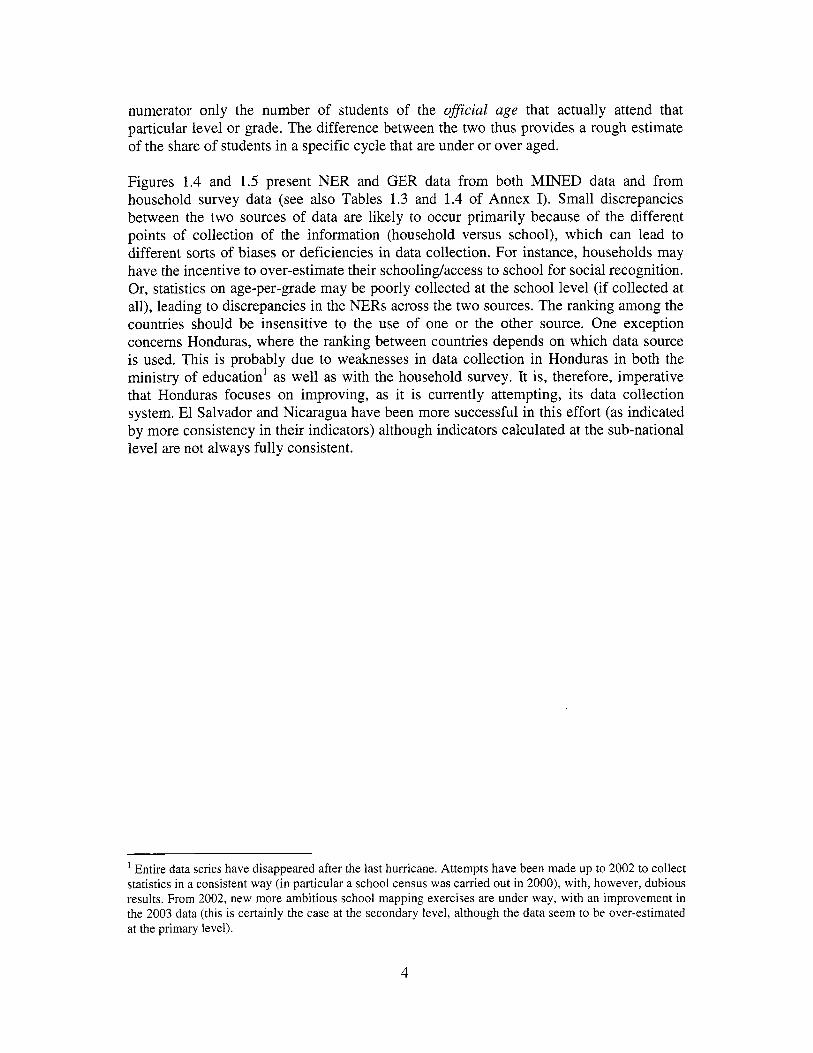
numerator only the number o f students o f the official age that actually attend that particular level or grade. The difference between the two thus provides a rough estimate o f the share o f students in a specific cycle that are under or over aged.
Figures 1.4 and 1.5 present NER and GER data f rom both MINED data and from household survey data (see also Tables 1.3 and 1.4 o f Annex I). Small discrepancies between the two sources o f data are likely to occur primarily because o f the different points o f collection o f the information (household versus school), which can lead to different sorts o f biases or deficiencies in data collection. For instance, households may have the incentive to over-estimate their schooling/access to school for social recognition. Or, statistics on age-per-grade may be poorly collected at the school level (if collected at all), leading to discrepancies in the NERs across the two sources. The ranking among the countries should be insensitive to the use o f one or the other source. One exception concerns Honduras, where the ranking between countries depends on which data source i s used. This i s probably due to weaknesses in data collection in Honduras in both the ministry o f education' as wel l as wi th the household survey. I t is, therefore, imperative that Honduras focuses on improving, as i t i s currently attempting, i t s data collection system. El Salvador and Nicaragua have been more successful in this effort (as indicated by more consistency in their indicators) although indicators calculated at the sub-national level are not always fully consistent.
Entire data series have disappeared after the last hurricane. Attempts have been made up to 2002 to collect statistics in a consistent way (in particular a school census was carried out in 2000), with, however, dubious results. From 2002, new more ambitious school mapping exercises are under way, with an improvement in the 2003 data (this i s certainly the case at the secondary level, although the data seem to be over-estimated at the primary level).
4
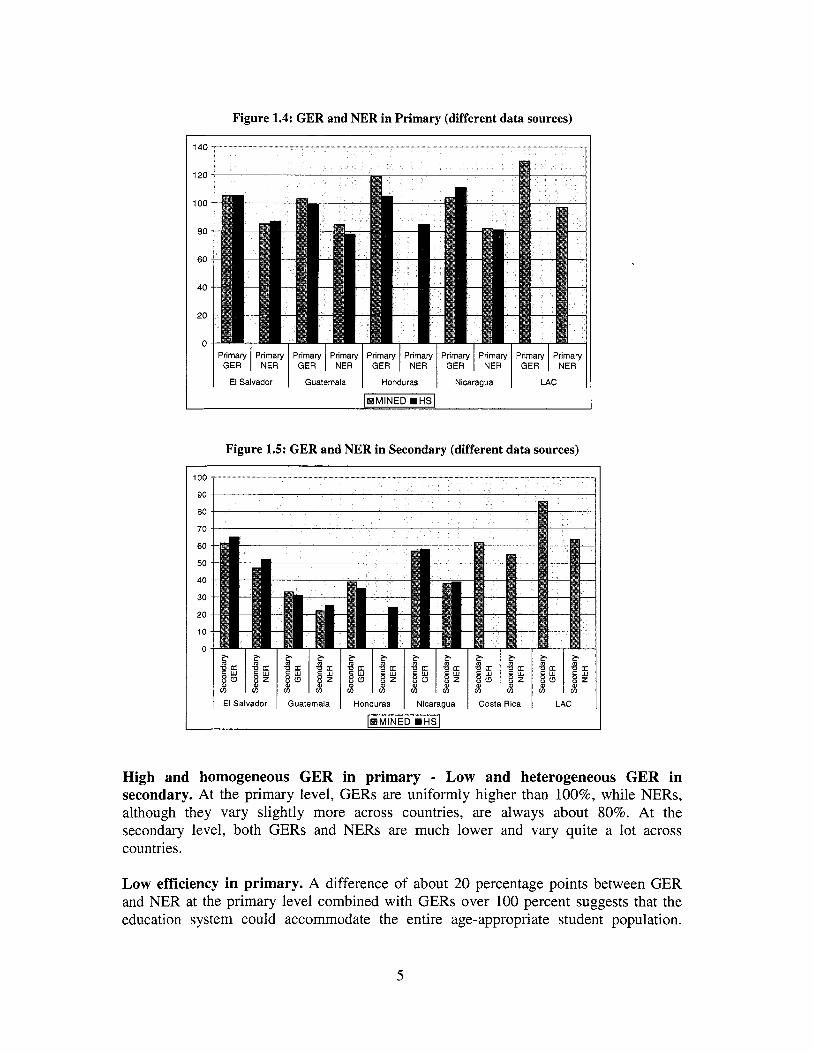
Figure 1.4: GER and NER in Primary (different data sources)
120
100
80
60
40
20
0
El Salvador Guatemala Honduras Nicaragua
Figure 1.5: GER and NER in Secondary (different data sources)
100
90
80
70
60
50
40
30
20
10
0
- ElSalvador I Guatemala I Honduras I Nicaragua I Costa Rica ' I
High and homogeneous GER in primary - Low and heterogeneous GER in secondary. At the primary level, GERs are uniformly higher than loo%, while NERs, although they vary slightly more across countries, are always about 80%. At the secondary level, both GERs and NERs are much lower and vary quite a lot across countries.
Low efficiency in primary. A difference o f about 20 percentage points between GER and NER at the primary level combined with GERs over 100 percent suggests that the education system could accommodate the entire age-appropriate student population.
5

These figures also indicate that there i s substantial room for efficiency improvements - i.e. less repetition and dropoutheentry patterns - at the primary level in al l countries.2
Low coverage in secondary. At the secondary level, a key issue for the countries under analysis i s l o w coverage, even in terms o f GER. As w i l l be discussed in subsequent sections, many students dropout after (or before) finishing primary. I t is clear from Figure 1.5 that both GER and, to a slightly lesser extent, NER are much lower in al l four countries than the Latin American average. Figure 1.6 also indicates that there is a “secondary education gap” compared to countries wi th s imi lar per capita income. The gap i s even worse when comparing NERs.
Figure 1.6 also shows that while Nicaragua compares favorably wi th the other Central American countries in terms o f GER considering i t s per capita income, Guatemala compares very poorly.
Figure 1.6: The “Secondary Education Gap”
1 1007 I
90
80
70
60 K 8 50
40
30
20
10
0 0 500 1000 1500 2000 2500 3000 3500 4000 4500
Income per-capita
Source: Table 1.3 Annex I and WDI
Figure 1.7 depicts the evolution o f NERs in primary and secondary in El Salvador, Guatemala and Nicaragua since the mid nine tie^.^ Information comes from either official MINED statistics or household survey data depending on a ~ a i l a b i l i t y . ~ Overall, we see that there was a positive trend in the GER and NER in al l countries, although varying across countries.
* This margin for efficiency improvements i s even higher at the Latin American level. I t i s difficult to find ful ly reliable comparative data before for most o f the countries analyzed. I t should be noted that the coverage o f the secondary level does not always strictly correspond to the one
used in Tables 1.3 and 1.4 o f Annex I for limitation in the availability o f past data, but the trend should not quite differ.
6
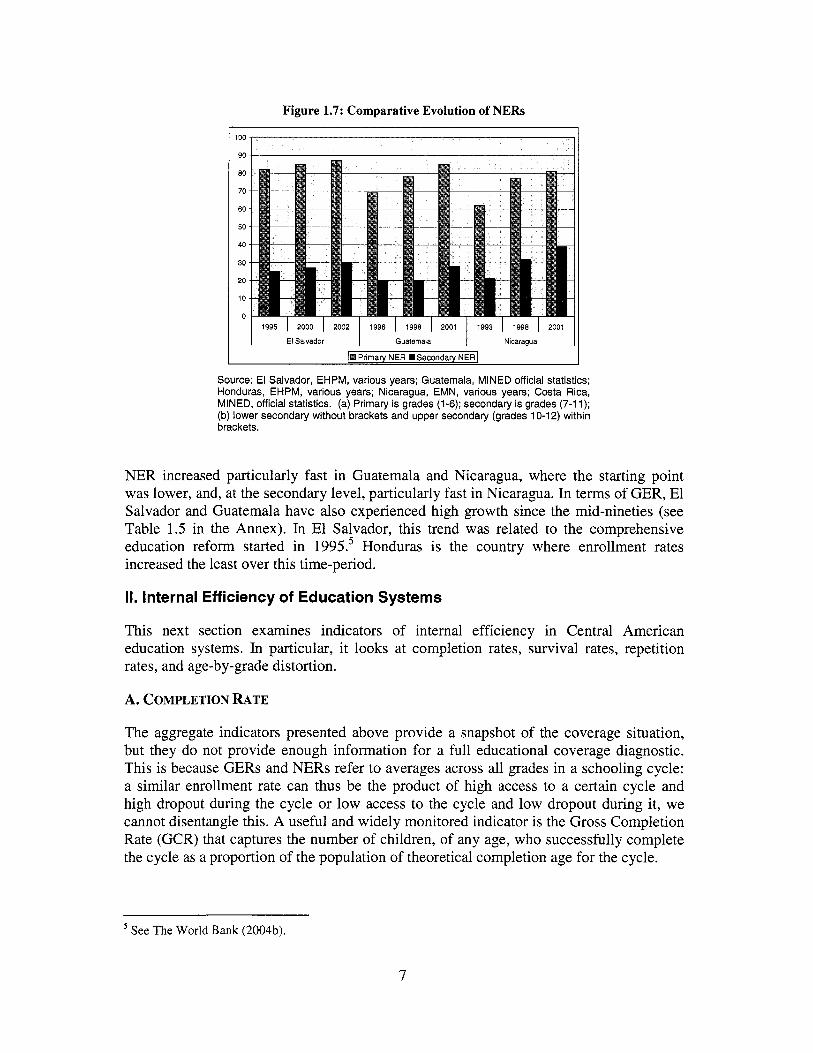
Figure 1.7: Comparative Evolution of NERs
1995 I 2000 I 2002 1996 I 1998 I 2001 1993 I 1998 1 2001
El Salvador Guatemala Nicaragua
IHPrimary NER mSecondary NERl
Source: El Salvador, EHPM, various years; Guatemala, MINED official statistics; Honduras, EHPM, various years; Nicaragua, EMN, various years; Costa Rica, MINED, official statistics. (a) Primaty is grades (1-6); secondary is grades (7-1 1); (b) lower secondary without brackets and upper secondary (grades 10-12) within brackets.
NER increased particularly fast in Guatemala and Nicaragua, where the starting point was lower, and, at the secondary level, particularly fast in Nicaragua. In terms o f GER, El Salvador and Guatemala have also experienced high growth since the mid-nineties (see Table 1.5 in the Annex). In El Salvador, this trend was related to the comprehensive education reform started in 1995.5 Honduras i s the country where enrollment rates increased the least over this time-period.
II. Internal Efficiency of Education Systems
This next section examines indicators o f internal efficiency in Central American education systems. In particular, i t looks at completion rates, survival rates, repetition rates, and age-by-grade distortion.
A. COMPLETION RATE
The aggregate indicators presented above provide a snapshot o f the coverage situation, but they do not provide enough information for a full educational coverage diagnostic. This i s because GERs and NERs refer to averages across al l grades in a schooling cycle: a s imi lar enrollment rate can thus be the product o f high access to a certain cycle and high dropout during the cycle or l o w access to the cycle and l o w dropout during it, we cannot disentangle this. A useful and widely monitored indicator i s the Gross Completion Rate (GCR) that captures the number o f children, o f any age, who successfully complete the cycle as a proportion o f the population o f theoretical completion age for the cycle.
See The World Bank (2004b).
7
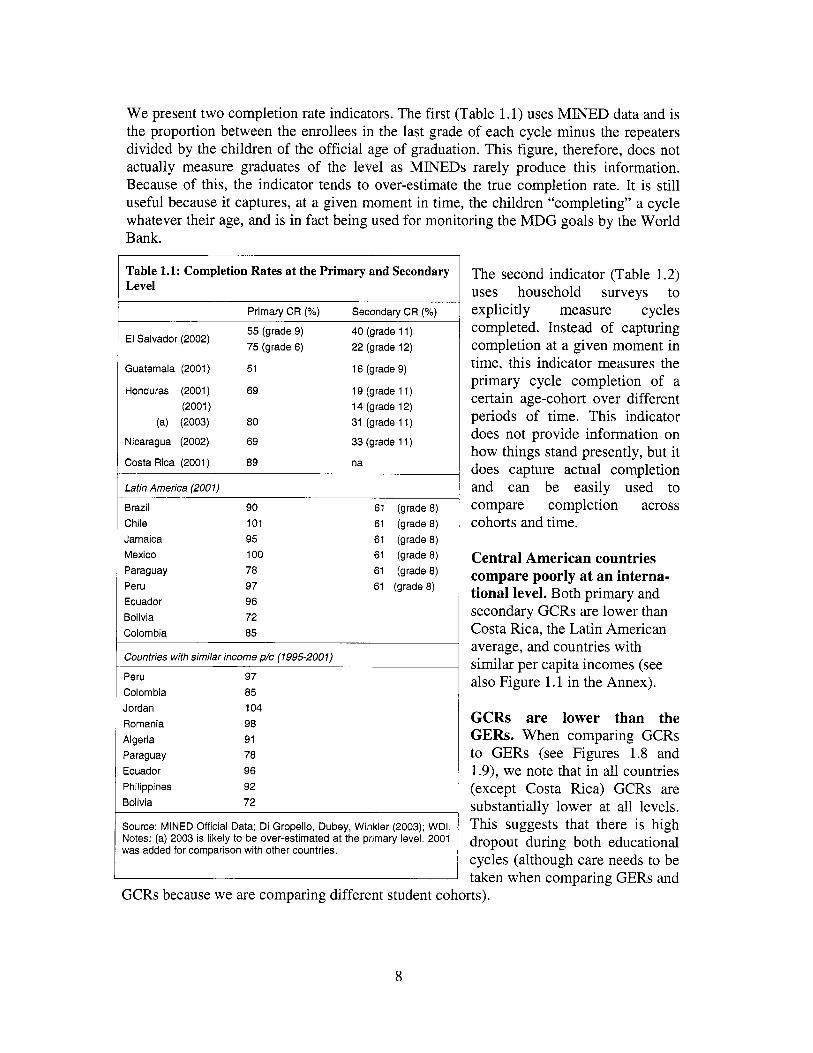
W e present two completion rate indicators. The first (Table 1.1) uses MINED data and i s the proportion between the enrollees in the last grade o f each cycle minus the repeaters divided by the children o f the official age o f graduation. This figure, therefore, does not actually measure graduates of the level as MINEDs rarely produce this information. Because o f this, the indicator tends to over-estimate the true completion rate. I t i s s t i l l useful because i t captures, at a given moment in time, the children “completing” a cycle whatever their age, and i s in fact being used for monitoring the MDG goals by the World Bank.
Table 1.1: Completion Rates at the Primary and Secondary Level
I Primary CR (Yo) Secondary CR (“/.) 55 (grade 9) 75 (grade 6)
El Salvador (2002)
Guatemala (2001) 51
Honduras (2001) 69
(a) (2003) 80
Nicaragua (2002) 69
Costa Rica (2001) 89
Latin America (2001)
(2001)
40 (grade 11) 22 (grade 12)
16 (grade 9)
19 (grade 1 1) 14 (grade 12) 31 (grade 11)
33 (grade 11)
na
Brazil Chile Jamaica Mexico Paraguay Peru Ecuador Bolivia Colom bia
90 101 95 100 78 97 96 72 85
61 (grade 8) 61 (grade 8) 61 (grade8) 61 (grade 8) 61 (grade 8) 61 (grade 8)
1 Countries with similar income p/c (1995-2001)
Peru Colombia Jordan Romania Algeria Paraguay Ecuador Philippines Bolivia
97 85 104 98 91 78 96 92 72
Source: MINED Official Data; Di Gropello, Dubey, Winkler (2003); WDI. Notes: (a) 2003 is likely to be over-estimated at the primary level. 2001 was added for comparison with other countries.
The second indicator (Table 1.2) uses household surveys to explicitly measure cycles completed. Instead of capturing completion at a given moment in time, this indicator measures the primary cycle completion o f a certain age-cohort over different periods o f time. This indicator does not provide information on how things stand presently, but i t does capture actual completion and can be easily used to compare completion across cohorts and time.
Central American countries compare poorly at an interna- tional level. Both primary and secondary GCRs are lower than Costa Rica, the Lat in American average, and countries wi th s im i la r per capita incomes (see also Figure 1.1 in the Annex).
GCRs are lower than the GERs. When comparing GCRs to GERs (see Figures 1.8 and 1.9), we note that in all countries (except Costa Rica) GCRs are substantially lower at all levels. This suggests that there i s high dropout during both educational cycles (although care needs to be taken when comparing GERs and
GCRs because we are comparing different student cohorts).
8
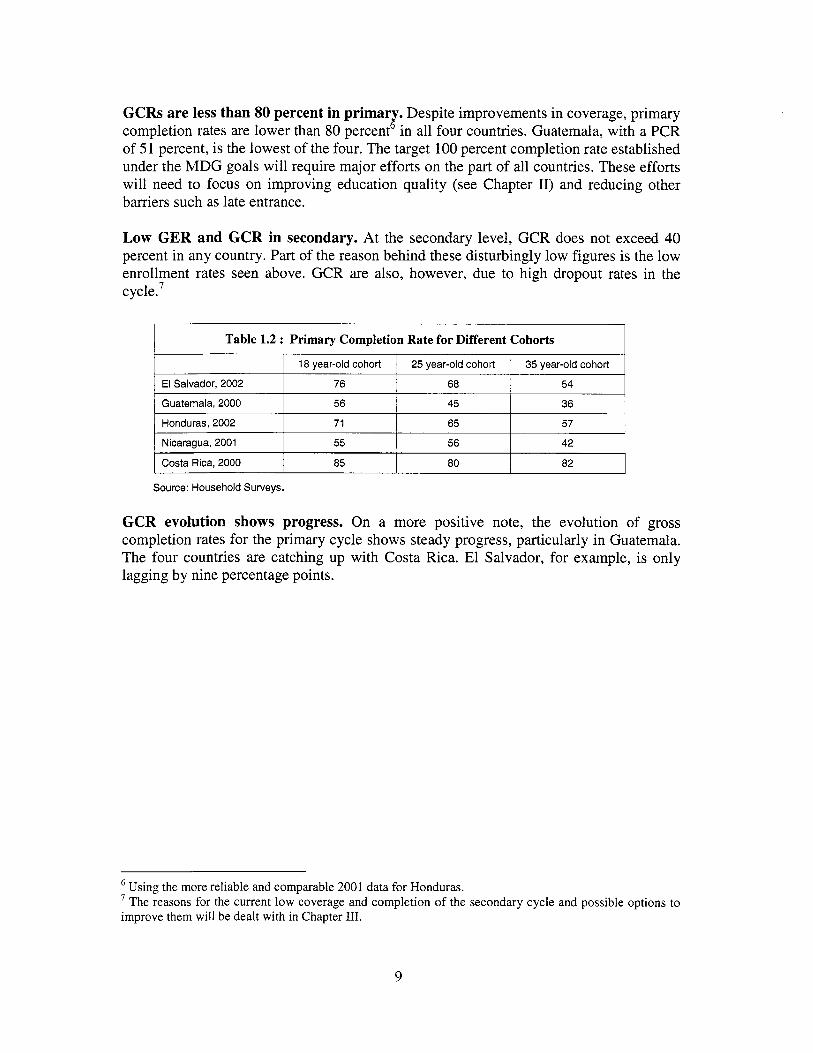
GCRs are less than 80 percent in primary. Despite improvements in coverage, primary completion rates are lower than 80 percent6 in a l l four countries. Guatemala, with a PCR of 5 1 percent, i s the lowest of the four. The target 100 percent completion rate established under the MDG goals wi l l require major efforts on the part o f all countries. These efforts wi l l need to focus on improving education quality (see Chapter 11) and reducing other barriers such as late entrance.
El Salvador, 2002
Low GER and GCR in secondary. At the secondary level, GCR does not exceed 40 percent in any country. Part of the reason behind these disturbingly low figures i s the low enrollment rates seen above. GCR are also, however, due to high dropout rates in the cycle.7
18 year-old cohort 25 year-old cohort 35 year-old cohort
76 68 54 1
1 Table 1.2 : Primary Completion Rate for Different Cohorts j
Honduras, 2002
Nicaragua, 2001
Costa Rica, 2000
71 65 57
55 56 42
85 80 82
1 Guatemala, 2000 I 56 I 45 I 36 I
Source: Household Surveys.
GCR evolution shows progress. On a more positive note, the evolution of gross completion rates for the primary cycle shows steady progress, particularly in Guatemala. The four countries are catching up with Costa Rica. El Salvador, for example, i s only lagging by nine percentage points.
Using the more reliable and comparable 2001 data for Honduras. The reasons for the current low coverage and completion o f the secondary cycle and possible options to
improve them wil l be dealt with in Chapter 111.
9
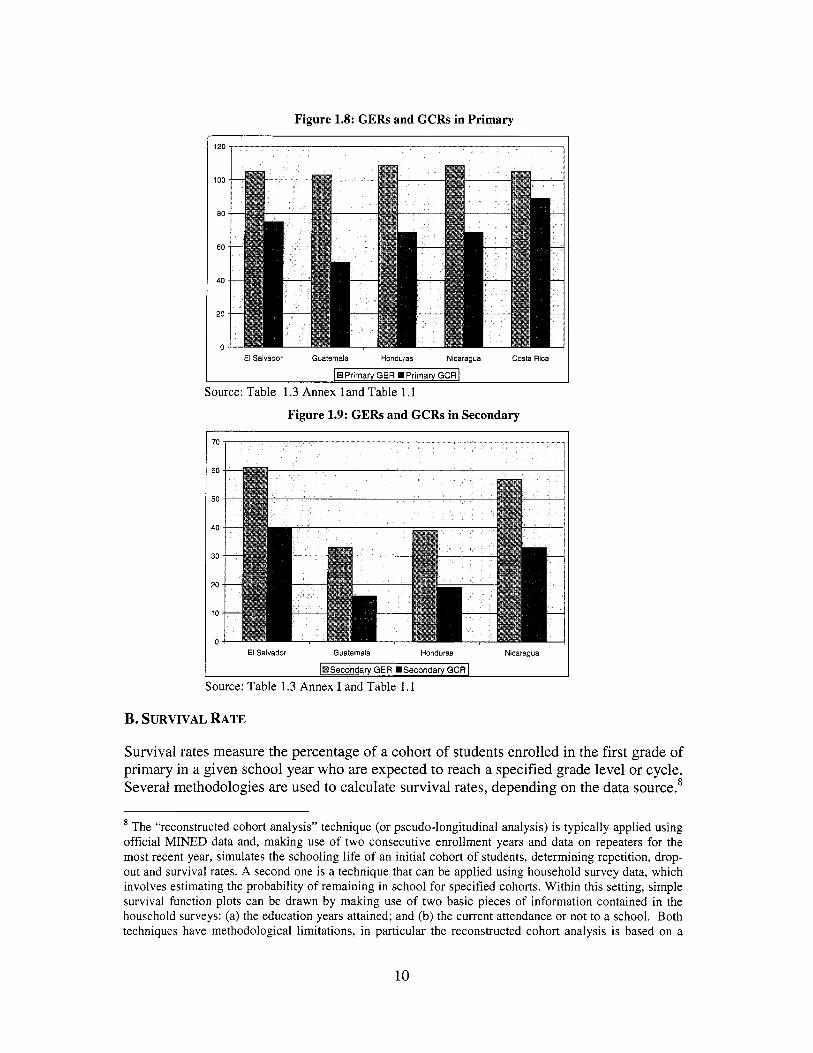
Figure 1.8: GERs and GCRs in Primary
71 I 120
100
80
60
40
20
0 El Salvador Guatemala Honduras Nicaragua Costa Rica
IB Primary GER H Primaly GCR I Source: Table 1.3 Annex land Table 1.1
Figure 1.9: GERs and GCRs in Secondary
I 70 I 60
50
40
30
20
10
0 El Salvador Guatemala Honduras Nicaragua
IBSecondary GER HSecondary GCR I Source: Table 1.3 Annex I and Table 1.1
B. SURVIVAL RATE
Survival rates measure the percentage o f a cohort o f students enrolled in the f i rs t grade of primary in a given school year who are expected to reach a specified grade level or cycle. Several methodologies are used to calculate survival rates, depending on the data source.8
The “reconstructed cohort analysis” technique (or pseudo-longitudinal analysis) i s typically applied using official MINED data and, making use o f two consecutive enrollment years and data on repeaters for the most recent year, simulates the schooling l i fe o f an initial cohort o f students, determining repetition, drop- out and survival rates. A second one i s a technique that can be applied using household survey data, which involves estimating the probability o f remaining in school for specified cohorts. Within this setting, simple survival function plots can be drawn by making use o f two basic pieces o f information contained in the household surveys: (a) the education years attained; and (b) the current attendance or not to a school. Both techniques have methodological limitations, in particular the reconstructed cohort analysis i s based on a
10
The comparison between the two main methodologies (reconstructed cohort analysis and survivor plots) can cast light on the on-going evolution of the internal efficiency o f the education system because survivor plots illustrate more recent trends in survival than does the reconstructed cohort method (see footnote for a methodological explanation o f each technique).
Figure 1.10 graphs the current survival rates of the 7 to 17 cohort in the four Central American countries under analysis, according to the survivor function plots (see also Table 1.6 in Annex I).
Although each country i s different, there i s a constant loss of students throughout primary. Figure 1.10 clearly illustrates that students drop out throughout the educational cycle in all countries, but also that there are significant differences across countries in terms of the prevalence and characteristics of the dropout phenomenon (individual countries’ survival plots are shown in Annex I). For instance, all countries currently have a sixth grade survival rate of between 70 and 80 percent, but El Salvador and Guatemala have a continuous and steady decrease in survival along the primary cycle, while Honduras and Nicaragua have a more irregular dropout pattern, with higher dropout rates in grades 4, 5 and 6. For these latter countries, this suggests that quality issues, supply- constraints (for example in Honduras, where close to 20 percent o f primary schools have fewer than 6 grades), and late-entrance may in part be responsible for the irregular dropout rates.
number o f restrictive assumptions and i s very much dependent on the quality o f the data on enrollment and repeaters collected by the MINED, while the survivor function plot measures a probability which relies on limited information and on the quality o f the households’ replies. Additionally, beyond the data source, there i s an essential methodological difference between these two techniques which, as we w i l l see, generates substantial differences between them while also making their comparison meaningful. Survivor function plots make use o f retrospective information on the survival rates o f al l the previous cohorts in working out the probability o f survival o f the most recent cohort, while at the same time updating/adjusting the survival probability to the higher grades by the increased survival probability to the lower grades, which ensures that the evolution in survival rates across cohorts and grades i s taken into account. In contrast, a reconstructed cohort analysis adopts a more retrospective approach by assuming fixed in time the probability o f survival to each o f the grades. This second methodology which tends to under-estimate the current survival rates, although mostly for the higher grades, tends to generate a survival rate, which adjusted by the gross intake rate, provides a figure close to the current gross completion rate (it w i l l in fact tend to be higher if the gross intake rate increased in time or if the internal efficiency parameters between grade 1 and grade 2 improved in time). A comparison between the two methodologies w i l l be instructive as i t can cast light on the on-going evolution o f the internal efficiency o f the education system.
11
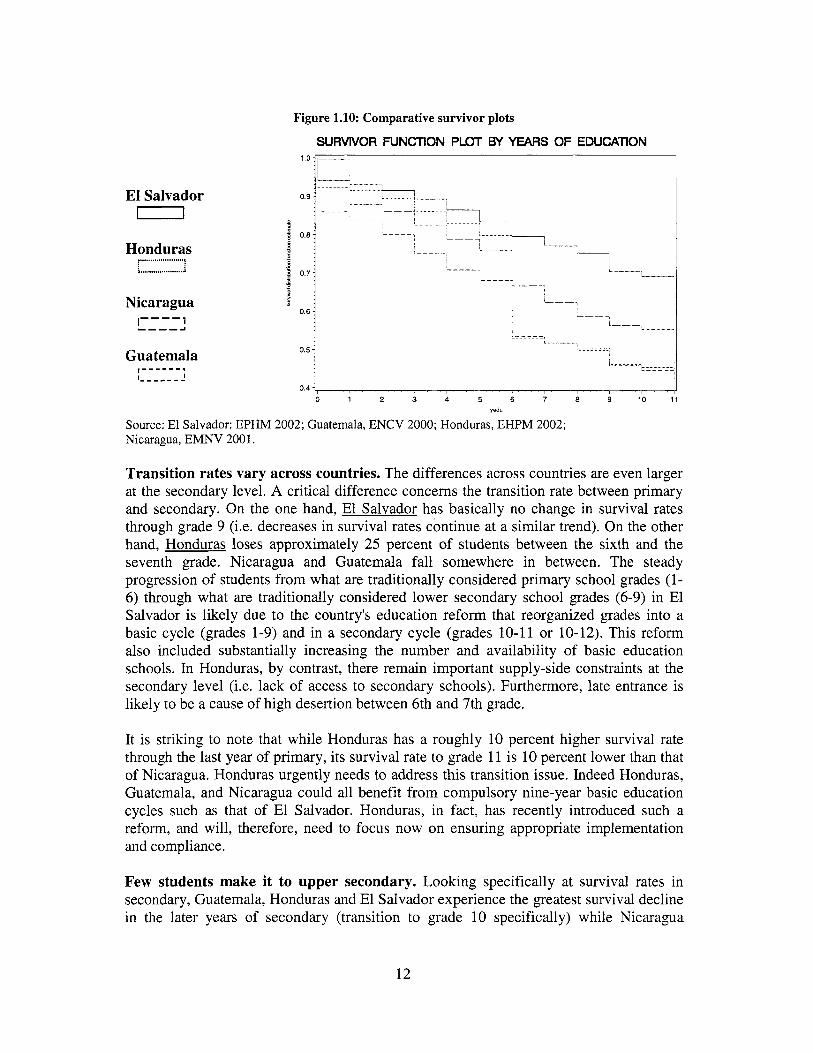
Figure 1.10: Comparative survivor plots
SURWOR FUNCTION PLOT BY YEARS OF EDUCATION 1 .o i
0.9 :
i i 5 0.8:
s : 0 .7 ;
a :
I . V '
El Salvador : ' ................ ........
-. -- .-.. ........ 1 ........ .......... ---?
. . . . . . . L ........ j . ,
I F----i ........
...
... .......... ..- , 1
!.. _-- _ _ _ _ _
.........
i_---'
_ _ _ _ _ ~ L--- I
U
----I i---
!. - ._ - .. I_--
........ : >. ..... l... ...
~. ....... i_____
0.4 , , , . , , , , , , , , , , , , , , , , , . , , , , , , , , , , , , , , , , , , , , , , , , , , , , r
Honduras ...................... i ...................... i
0.5:
Nicaragua I---- 1
Guatemala I - - - - - - ;
----a
1- - - - - - -
9 0.6
Source: El Salvador: EPHM 2002; Guatemala, ENCV 2000; Honduras, EHPM 2002; Nicaragua, EMNV 2001.
Transition rates vary across countries. The differences across countries are even larger at the secondary level. A critical difference concerns the transition rate between primary and secondary. On the one hand, El Salvador has basically no change in survival rates through grade 9 (Le. decreases in survival rates continue at a s im i la r trend). On the other hand, Honduras loses approximately 25 percent of students between the sixth and the seventh grade. Nicaragua and Guatemala fa l l somewhere in between. The steady progression of students f rom what are traditionally considered primary school grades (1- 6) through what are traditionally considered lower secondary school grades (6-9) in El Salvador i s l ikely due to the country's education reform that reorganized grades into a basic cycle (grades 1-9) and in a secondary cycle (grades 10-11 or 10-12). This reform also included substantially increasing the number and availability o f basic education schools. In Honduras, b y contrast, there remain important supply-side constraints at the secondary level (Le. lack o f access to secondary schools). Furthermore, late entrance i s l ikely to be a cause o f high desertion between 6th and 7th grade.
I t is striking to note that while Honduras has a roughly 10 percent higher survival rate through the last year o f primary, i t s survival rate to grade 11 i s 10 percent lower than that o f Nicaragua. Honduras urgently needs to address this transition issue. Indeed Honduras, Guatemala, and Nicaragua could all benefit f rom compulsory nine-year basic education cycles such as that o f El Salvador. Honduras, in fact, has recently introduced such a reform, and will, therefore, need to focus now on ensuring appropriate implementation and compliance.
Few students make it to upper secondary. Looking specifically at survival rates in secondary, Guatemala, Honduras and El Salvador experience the greatest survival decline in the later years o f secondary (transition to grade 10 specifically) while Nicaragua
12
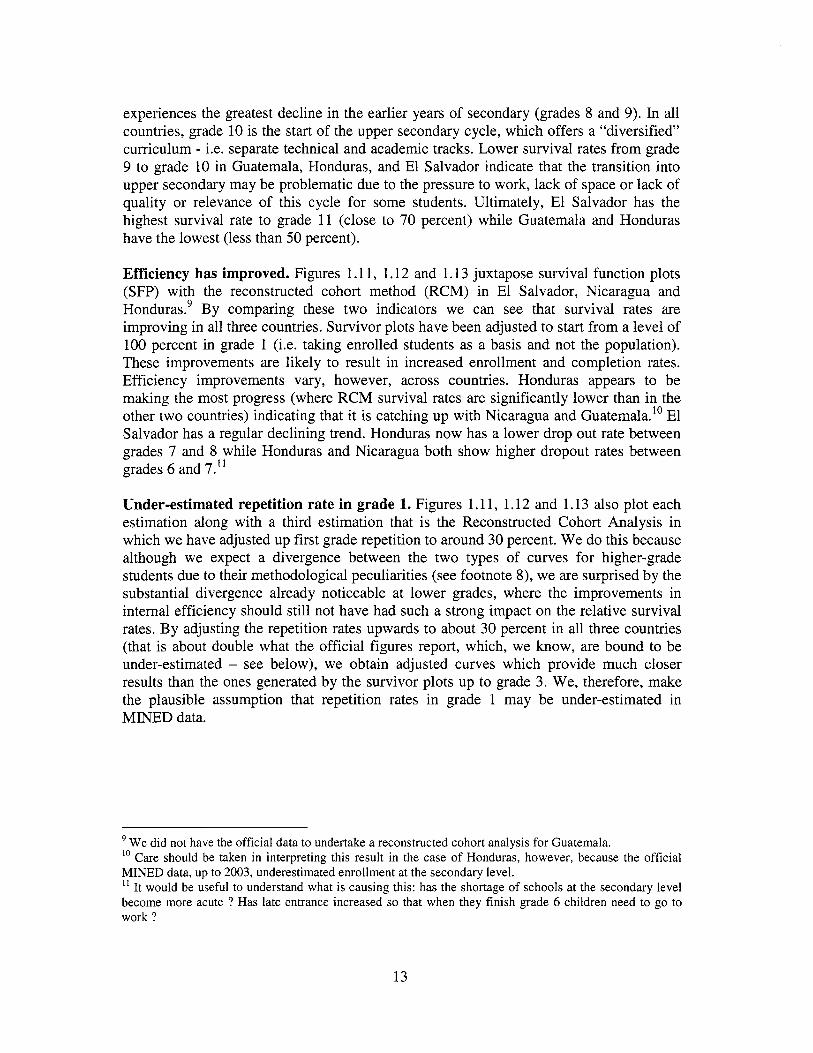
experiences the greatest decline in the earlier years o f secondary (grades 8 and 9). In al l countries, grade 10 i s the start o f the upper secondary cycle, which offers a “diversified” curriculum - i.e. separate technical and academic tracks. Lower survival rates f rom grade 9 to grade 10 in Guatemala, Honduras, and El Salvador indicate that the transition into upper secondary may be problematic due to the pressure to work, lack o f space or lack o f quality or relevance o f this cycle for some students. Ultimately, El Salvador has the highest survival rate to grade 11 (close to 70 percent) while Guatemala and Honduras have the lowest (less than 50 percent).
Efficiency has improved. Figures 1.1 1, 1.12 and 1.13 juxtapose survival function plots (SFP) wi th the reconstructed cohort method (RCM) in El Salvador, Nicaragua and Hondurasg B y comparing these two indicators we can see that survival rates are improving in all three countries. Survivor plots have been adjusted to start from a level o f 100 percent in grade 1 (i.e. taking enrolled students as a basis and not the population). These improvements are l ikely to result in increased enrollment and completion rates. Efficiency improvements vary, however, across countries. Honduras appears to be making the most progress (where RCM survival rates are significantly lower than in the other two countries) indicating that i t i s catching up with Nicaragua and Guatemala.” El Salvador has a regular declining trend. Honduras now has a lower drop out rate between grades 7 and 8 while Honduras and Nicaragua both show higher dropout rates between grades 6 and 7.“
Under-estimated repetition rate in grade 1. Figures 1.1 1, 1.12 and 1.13 also plot each estimation along with a third estimation that i s the Reconstructed Cohort Analysis in which we have adjusted up f i rs t grade repetition to around 30 percent. W e do this because although we expect a divergence between the two types o f curves for higher-grade students due to their methodological peculiarities (see footnote 8), we are surprised b y the substantial divergence already noticeable at lower grades, where the improvements in internal efficiency should s t i l l not have had such a strong impact on the relative survival rates. By adjusting the repetition rates upwards to about 30 percent in al l three countries (that i s about double what the official figures report, which, we know, are bound to be under-estimated - see below), we obtain adjusted curves which provide much closer results than the ones generated by the survivor plots up to grade 3. We, therefore, make the plausible assumption that repetition rates in grade 1 may be under-estimated in MINED data.
We did not have the official data to undertake a reconstructed cohort analysis for Guatemala. lo Care should be taken i n interpreting this result in the case o f Honduras, however, because the official MINED data, up to 2003, underestimated enrollment at the secondary level. ” I t would be useful to understand what i s causing this: has the shortage o f schools at the secondary level become more acute ? Has late entrance increased so that when they finish grade 6 children need to go to work ?
13

Figure 1.11: R C M and SFP in El Salvador
El Salvador: RCM and SFP
120 0
100 0
80 0 - 0
g 5 600
& 40 0
20 0
0 0 1 2 3 4 5 6 7 8 9 10 11
Grades
(+RCM +RCM (Rep Adi) +SFP j Source: MINED and HS
Figure 1.12: RCM and SFP in Honduras
Honduras: RCM and SFP
i Source: MINED and HS
14

Figure 1.13: RCM and SFP in Nicaragua
(Source: MINED and HS)
I Nicaragua: RCM and SFP
I 1200
1 1000
80 0
5 600
~
400
' 200 I
1 2 3 4 5 6 7 8 9 10 11 Grades
I -CRCM +RCM (Rep Adj) +SFPI
I O 0
C. AGE-BY-GRADE
REPETITION RATES DISTORTION AND
The survival profiles analyzed above tel l you what proportion o f a given cohort reach any given grade level, but they do not provide any informa- tion on how long i t takes to the students to reach that certain grade nor on the average age of students who reach that grade. Age-by-
grade distortion and repetition rates fill that gap.
a) Age-by-grade distortion
Age-by-grade distortion measures the average number of years a student in a particular grade i s older (or younger) than the official age for that grade. Age-by-grade distortion can be broadly assessed by comparing the average age corresponding to each grade with the official age for that grade in each o f the countries. The comparison between GERs and NERs presented earlier showed us that there i s a substantial proportion of over-age (or under-age) students in Central American countries at the primary and secondary level.
Age-by-grade distortion i s high. The plots in Figure 1.14 report the age-by-grade distortion as well as the proportion o f children out of age at each grade for the four countries using household survey data (see also Table 1.7 in the Annex). These plots show that the majority of students in every grade are not the official age for their grade. In all four countries under analysis, the official entrance age i s 7 and, if students proceed regularly through the grades without repeating, they should reach grade 11 at the age o f 17 (or grade 12 at the age of 18). Our evidence shows that, for each grade, between 50 and 80 percent o f children are 'out of age' in all countries. This translates into an average age-by-grade distortion o f between 5 and 20 percent higher than the official one. Several further points can be made here.
15
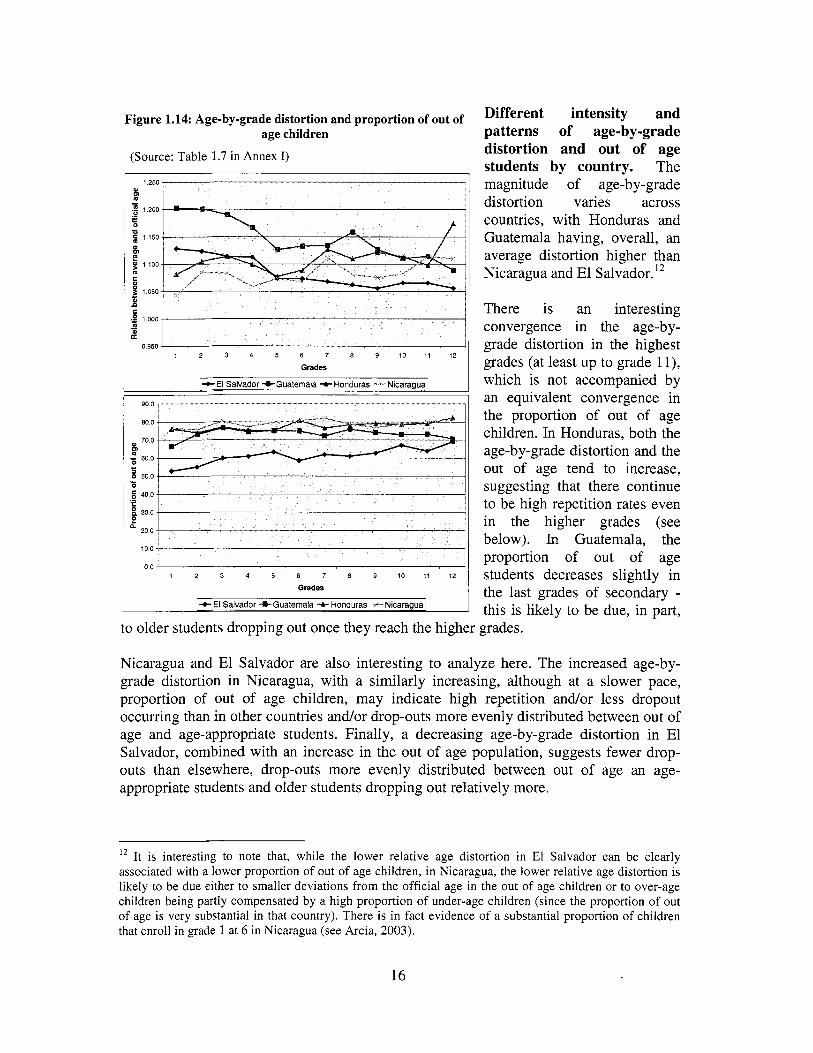
Figure 1.14: Age-by-grade distortion and proportion of out of age children
(Source: Table 1.7 in Annex I)
i - .- p a
p j
~3 6
D B m e
n
I 2 3 4 5 6 7 8 9 10 11 12
Grades
1150
1100
1050
1 wo
0 950 I
I+ El Salvador +Guatemala -A- Honduras --Nicaragua 1 1 900 .
I 80 0
700
2 500
400
300
c
1 2 3 4 5 6 7 8 9 10 11 12
Grades
I+ El Salvador +-Guatemala -A- Honduras +Nicaragua]
Different intensity and patterns of age-by-grade distortion and out of age students by country. The magnitude of age-by-grade distortion varies across countries, wi th Honduras and Guatemala having, overall, an average distortion higher than Nicaragua and El Salvador.12
There i s an interesting convergence in the age-by- grade distortion in the highest grades (at least up to grade 1 l), which i s not accompanied b y an equivalent convergence in the proportion of out o f age children. In Honduras, both the age-by-grade distortion and the out of age tend to increase, suggesting that there continue to be high repetition rates even in the higher grades (see below). In Guatemala, the proportion o f out o f age students decreases slightly in the last grades of secondary - this i s l ikely to be due, in part,
to older students dropping out once they reach the higher grades.
Nicaragua and El Salvador are also interesting to analyze here. The increased age-by- grade distortion in Nicaragua, with a similarly increasing, although at a slower pace, proportion of out of age children, may indicate high repetition and/or less dropout occurring than in other countries and/or drop-outs more evenly distributed between out of age and age-appropriate students. Finally, a decreasing age-by-grade distortion in El Salvador, combined with an increase in the out o f age population, suggests fewer drop- outs than elsewhere, drop-outs more evenly distributed between out of age an age- appropriate students and older students dropping out relatively more.
l2 I t i s interesting to note that, while the lower relative age distortion i n El Salvador can be clearly associated with a lower proportion o f out o f age children, in Nicaragua, the lower relative age distortion i s likely to be due either to smaller deviations from the official age in the out of age children or to over-age children being partly compensated by a high proportion o f under-age children (since the proportion o f out o f age i s very substantial in that country). There i s in fact evidence of a substantial proportion o f children that enroll i n grade 1 at 6 in Nicaragua (see Arcia, 2003).
16

Age-by-grade distortion i s largely the product o f late (or early) entrance to primary, and repetition along the educational cycle, and cycles o f dropout and reentry. I t i s difficult to disentangle the magnitude o f these aspects b y simply looking at the figures on age by grade, which are generated through official or household survey data. Attempts to disentangle these root causes o f age-by-grade distortion have been undertaken for Honduras and El Salvador, showing, respectively, an estimated proportion o f late entrants o f 38 percent and 15 percent, and an estimated proportion o f repeaters o f 30 percent for Honduras and 35 percent for El Sa1vad0r.l~ Along a similar line, an exploration o f the main causes of grade-by-age distortion was undertaken for Guatemala by estimating the determinants o f grade-by-age (see Box 1.1 in Annex I), revealing that repetition i s the main cause o f grade-by-age distortion in the country.
Figure 1.15: Comparative survivor function plots by age
El Salvador SURVIVOR FUNCTION PLOT BY AGE
,.... . . . . . ..?i2i.... ? ......... ... .I ....... ..: .............. ........
"" -II.kiw . . ~ ~ . ~ . ~ ~
...... .......... ---- __,. . . . . . . . . . _ _ _ _ _ _ ~ - - - - - - --& 0.9
0
Honduras ......................... ..........................
Nicaragua r---- I ----- Guatemala
0.2
I-- - -- --I I ------- I
0.1 , , , , , , , , , , , , , , , , , , , , , , , , , , , , , , I 7 8 9 10 11 12 13 14 15 16 17
edad
,ource: El Salvador: EPHM 2002; Guatemala, ENCV 2000; Honduras, EHPM 2002;Nicaragua, EMNV - 2001.
Over-age leads to lower educational attainment. Whatever the exact relative magnitude o f these causes, late entrance, repetition, and dropout-reentry cycles are bound to have negative consequences on the schooling cycle o f children. Furthermore, repetition
l3 The applied methodology i s a simple one. We mapped out the household surveys by age and grade in these two countries, calculated the proportion o f seven-year-old children enrolled in the primary cycle, multiplied the remaining proportion by the amount o f eight-year-old children currently enrolled (which gives us the maximum amount o f 8-year-old children who could have started late), and, therefore, obtained the late entrants and, by converse, also the repeaters o f eight or more years (to take account o f the seven year repeaters we also added to the repeaters the amount o f grade 1 students o f age 6 who did not make i t to grade 2 the year after). Both numbers were then divided by the total enrollees in grade 1 to obtain the late entrance and repetition rate. To be noted that this estimation, similar to a methodology applied by Schiefelbein (see Schiefelbein (2004)), assumes that all children get enrolled at either 7 or 8, which might not necessarily be true, and that the proportion o f non-enrolled 7-year-old children has been constant for the last two years.
17
imposes a financial strain on the educational system as a whole. Survivor functions b y age (not by grade this time) for al l the countries under analysis (see Figure 1.15) show clearly that the probability o f dropping-out o f school increases quite dramatically for all countries once students turn 14 (probably at least in part due to work-related reasons). This implies that students who have successfully completed fewer grades by 14 are more l ikely to have fewer years of schooling when they leave school and lower educational attainment as adults.
In fact, the higher age-by-grade distortion and proportion of over age students found for Honduras and Guatemala also contributes to explain why these two countries, in spite o f having a similar structure of dropouts b y age than the other countries, have lower attainment rates to grade 7 and each of the following grades. To illustrate this point further in Honduras, a thorough analysis undertaken b y Edwards, Fuller and ParandekarI4 using a specially designed dataset which makes i t possible to fol low a specific cohort o f students (5,204 children) over two years, determined that 13 year-old and older children are more l ikely to drop-out at some point o f the cycle, even if they have not completed primary, and, therefore, that school attainment i s substantially determined by the age o f initial enr01lment.I~ Among the main causes for late enrollment, the study finds family socio-economic status, family composition and the quality o f schooling.16
b) Repetition
High repetition rates in grade 1. For the reasons mentioned above, i t i s important to estimate the correct amount of repetition existent in the system. Figure 1.16 reports different repetition estimates, calculated according to different data sources and methodologies (see also Table 1.8 in the Annex). The evidence suggests that repetition i s particularly strong in the first year of primary education for al l countries (higher than 10 percent everywhere), while i t tends to decrease for the later grades o f primary (as shown by the lower primary averages) and, with the exception of Honduras, for secondary. These repetition rates are, however, under-estimated. As shown in Figure 1.16, the direct estimates o f repetition provided by the MINED official data and the household surveys are reasonably close, but the analysis o f the age by grade that we undertook to infer repetition for Honduras and El Salvador, and estimates for Nicaragua generated according to s imi lar method~logies’~, show that the real repetition rate i s l ikely to be at least twice as high for the first grade. Our estimates use some simplifying assumptions’*, but i t i s not surprising that the direct estimates on repetition produced f rom both the official and household survey data under-estimate real repetition rates.” Repetition rates
l4 See Edwards, Fuller and Parandekar (1997). l5 The study finds that every additional year o f age at enrollment increases the probability o f dropping out o f school by 25 percent! l6 Over-crowded schools might delay the age o f enrollment. ” See Arcia (2003).
In particular, that there are no late entrants of more than 8 years and that only i n school over-age students are accounted for. l9 With the official data, under-estimation would be due to misreporting o f the schools’ directors, who would consider drop-outs students who left their school, although they might have re-enrolled in another school (during the same year or after a lapse of time) at the same level and, therefore, should be really
18
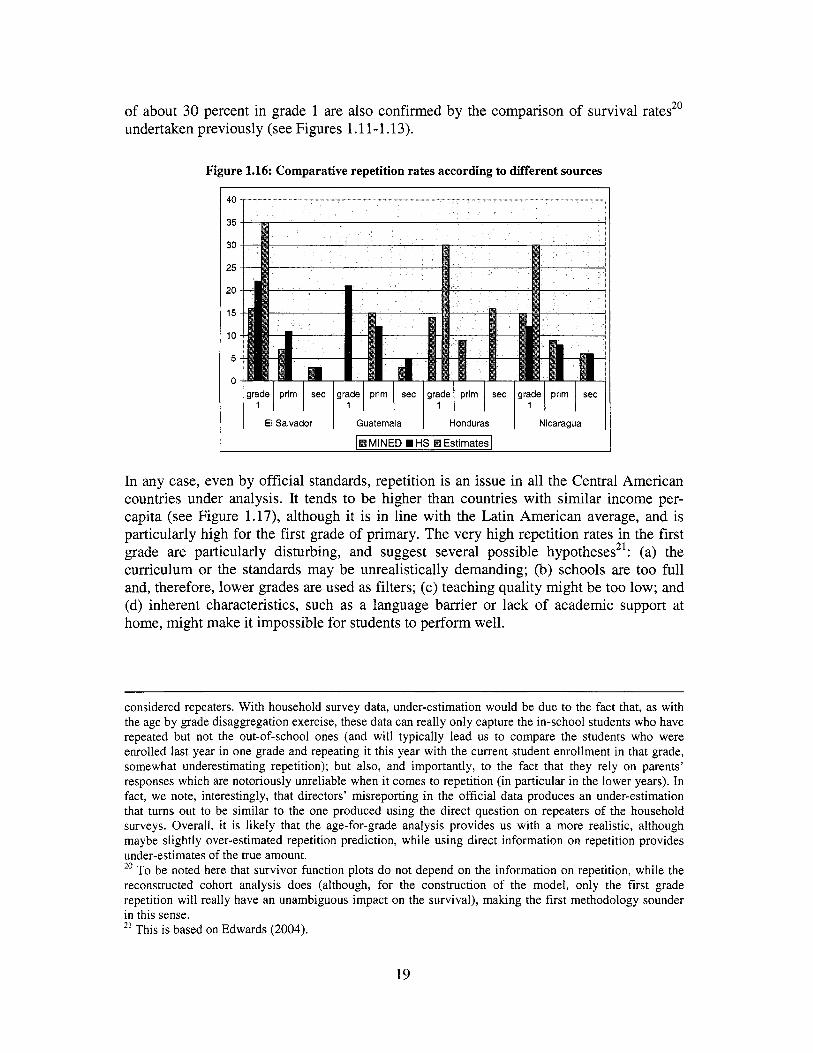
of about 30 percent in grade 1 are also confirmed by the comparison of survival rates2’ undertaken previously (see Figures 1.1 1 - 1.13).
Figure 1.16: Comparative repetition rates according to different sources
In any case, even by official standards, repetition i s an issue in all the Central American countries under analysis. I t tends to be higher than countries with s i m i l a r income per- capita (see Figure 1.17), although i t i s in l ine with the Latin American average, and i s particularly high for the f i rs t grade of primary. The very high repetition rates in the f i rs t grade are particularly disturbing, and suggest several possible hypotheses21 : (a) the curriculum or the standards may be unrealistically demanding; (b) schools are too full and, therefore, lower grades are used as filters; (c) teaching quality might be too low; and (d) inherent characteristics, such as a language barrier or lack o f academic support at home, might make i t impossible for students to perform well.
considered repeaters. With household survey data, under-estimation would be due to the fact that, as with the age by grade disaggregation exercise, these data can really only capture the in-school students who have repeated but not the out-of-school ones (and w i l l typically lead us to compare the students who were enrolled last year in one grade and repeating i t this year with the current student enrollment in that grade, somewhat underestimating repetition); but also, and importantly, to the fact that they rely on parents’ responses which are notoriously unreliable when i t comes to repetition (in particular in the lower years). In fact, we note, interestingly, that directors’ misreporting in the official data produces an under-estimation that turns out to be similar to the one produced using the direct question on repeaters o f the household surveys. Overall, it i s l ikely that the age-for-grade analysis provides us with a more realistic, although maybe slightly over-estimated repetition prediction, while using direct information on repetition provides under-estimates o f the true amount. 2o To be noted here that survivor function plots do not depend on the information on repetition, while the reconstructed cohort analysis does (although, for the construction o f the model, only the first grade repetition w i l l really have an unambiguous impact on the survival), making the first methodology sounder i n this sense. 2 ’ This i s based on Edwards (2004).
19

Figure 1.17: Income per-capita and repetition rate in primary
(Source: Table 1.8 in Annex I and WDI)
16
14 -
12 -
10 -
a -
6 -.
4 -
2 -
0 1
- _-I_____-
+ GLIA
+ +
NlCA *--- I HON ~
I - + ----I -
ES
+ A -
+ Y -
Some o f these hypotheses w i l l be tested in Chapter 11. The next section o f this chapter examines comparative indi- cators o f learning outcomes in Central America.
111. Quality of Education
Systems
Just because a chi ld i s enrolled in school does not mean that he or she i s learning the sk i l l s and
knowledge intended. There are many cases o f countries with close to full completion rates in primary or secondary, but l o w student learning outcomes. Additionally, quality itself w i l l be an important determinant of permanency in school and, ultimately, earnings. Papers such as Marshall (2003a)22 and Bedi and Edwards (2002)23 on Guatemala show that indicators of education quality such as days o f instruction, teacher experience, teacher training or school infrastructure are also significant determinants o f desertion and earnings; or even that gains in tests scores themselves are a significant determinant o f school attendance (Marshall, 2003b).24
A. STANDARDIZED TESTING
Learning outcomes are thought to be an appropriate measure of education quality and learning outcomes are frequently measured through standardized exams. Most countries now have some form o f national (census or sample-based) standardized assessment given at the end of a schooling cycle that measures literacy and numeracy skills. The participation in regional assessments or, even, international assessments, such as the TIMSS (the Third International Mathematics and Science Study implemented by the International Association for the Evaluation o f Educational Achievement and the PISA (the recently OECD launched Program for International Student Assessment)26, also provide a country wi th some measure of learning outcomes, and allow comparisons with other countries, providing some objective benchmarking o f the country’s performance. For these reasons while standardized exams - both national and
22 Marshal l (2003a). 23 Bed i and Edwards (2002). 24 Marshal l (2003b). 25 The test i s designed to assess achievement levels in mathematics and science at grades 4 and 8. 26 The test i s designed to measure reading, mathematical and scientific literacy attained by 15-year-olds.
20
international - do not measure al l the facets o f student learning, they are a useful means o f measuring learning. Countries may choose to use standardized exams in conjunction with other measures o f learning and education quality.
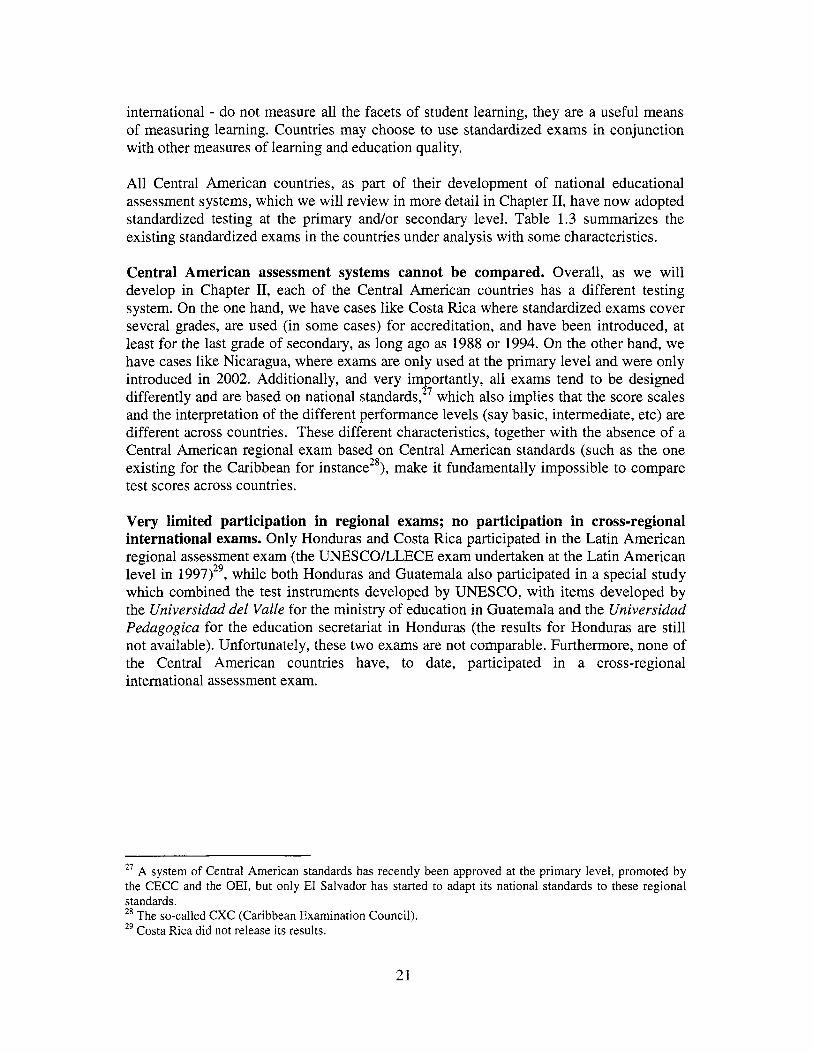
All Central American countries, as part o f their development o f national educational assessment systems, which we w i l l review in more detail in Chapter 11, have now adopted standardized testing at the primary andor secondary level. Table 1.3 summarizes the existing standardized exams in the countries under analysis wi th some characteristics.
Central American assessment systems cannot be compared. Overall, as we wil l develop in Chapter 11, each o f the Central American countries has a different testing system. On the one hand, we have cases l ike Costa Rica where standardized exams cover several grades, are used (in some cases) for accreditation, and have been introduced, at least for the last grade o f secondary, as long ago as 1988 or 1994. O n the other hand, we have cases l i ke Nicaragua, where exams are only used at the primary level and were only introduced in 2002. Additionally, and very im ortantly, al l exams tend to be designed differently and are based on national standards! which also implies that the score scales and the interpretation o f the different performance levels (say basic, intermediate, etc) are different across countries. These different characteristics, together wi th the absence of a Central American regional exam based on Central American standards (such as the one existing for the Caribbean for instance28), make i t fundamentally impossible to compare test scores across countries.
Very limited participation in regional exams; no participation in cross-regional international exams. Only Honduras and Costa Rica participated in the Lat in American regional assessment exam (the UNESCOLLECE exam undertaken at the Lat in American level in 1997)29, while both Honduras and Guatemala also participated in a special study which combined the test instruments developed b y UNESCO, wi th items developed by the Universidad del Valle for the ministry o f education in Guatemala and the Universidad Pedugogica for the education secretariat in Honduras (the results for Honduras are s t i l l not available). Unfortunately, these two exams are not comparable. Furthermore, none o f the Central American countries have, to date, participated in a cross-regional international assessment exam.
*' A system o f Central American standards has recently been approved at the primary level, promoted by the CECC and the OEI, but only El Salvador has started to adapt i ts national standards to these regional standards. 28 The so-called CXC (Caribbean Examination Council). *' Costa Rica did not release i ts results.
21
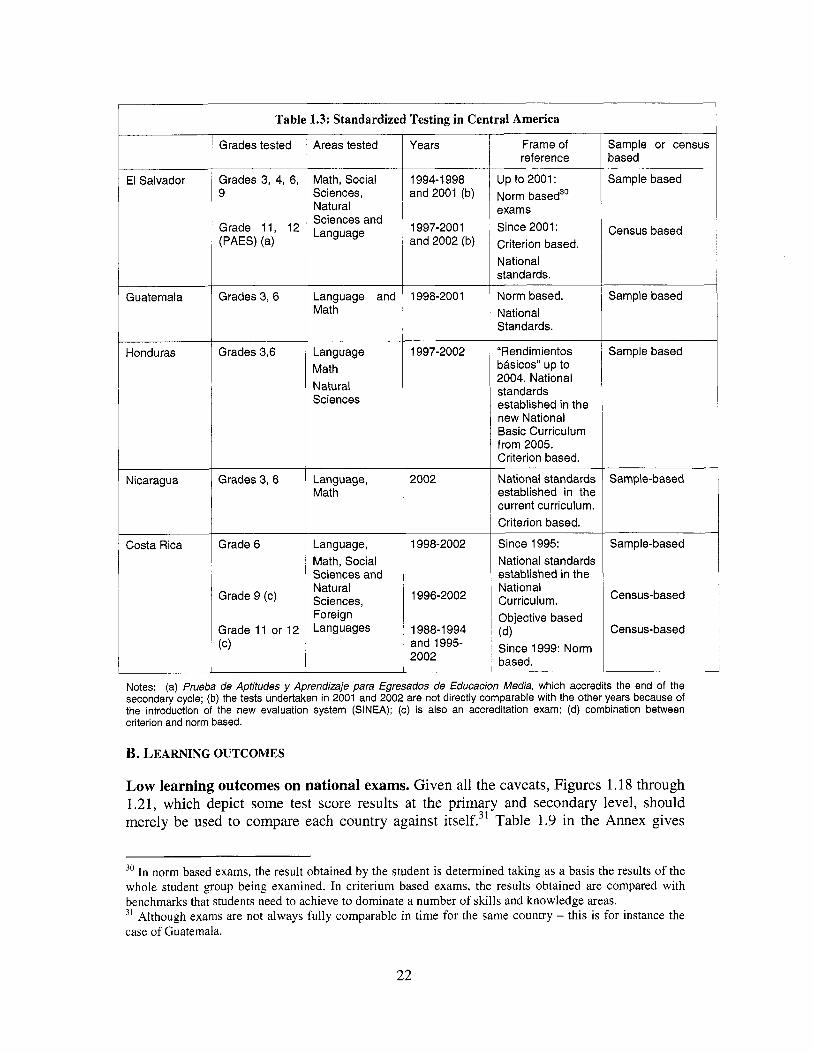
Table 1.3: Standardized Testing in Central America
Grades tested Areas tested Years Frame of reference
Sample or census based
Grades 3, 4, 6, 9
Math, Social Sciences, Natural Sciences and Language
1 994- 1998 and2001 (b)
1997-2001 and 2002 (b)
up to 2001 : Norm based3’ exams Since 2001: Criterion based. National standards.
Sample based
Census based
El Salvador
Guatemala Grades 3, 6 Language and Math
Sample based Norm based. National Standards.
“Rendimientos basicos” up to 2004. National standards established in the new National Basic Curriculum from 2005. Criterion based.
1998-2001
1997-2002
2002
Honduras Grades 3,6 Language Math Natural Sciences
Sample based
~ ~~
National standards established in the current curriculum. Criterion based.
Sample-based Nicaragua Grades 3 ,6 Language, Math
Costa Rica Grade 6 Language, Math, Social Sciences and Natural Sciences, Foreign Languages
1998-2002
1996-2002
1 988- 1994 and 1995- 2002
Since 1995: National standards established in the National Curriculum. Objective based
Since 1999: Norm based.
( 4
Sample-based
Census-based
Census-based
Grade 9 (c)
Grade 11 or 12 (c)
Notes: (a) frueba de Aptitudes y Aprendizaje para Egresados de Education Media, which accredits the end of the secondary cycle; (b) the tests undertaken in 2001 and 2002 are not directly comparable with the other years because of the introduction of the new evaluation system (SINEA); (c) is also an accreditation exam; (d) combination between criterion and norm based.
B. LEARNING OUTCOMES
Low learning outcomes on national exams. Given a l l the caveats, Figures 1.18 through 1.21, which depict some test score results at the primary and secondary level, should merely be used to compare each country against itself.31 Table 1.9 in the Annex gives
30 I n norm based exams, the result obtained by the student i s determined taking as a basis the results o f the whole student group being examined. In criterium based exams, the results obtained are compared with benchmarks that students need to achieve to dominate a number o f ski l ls and knowledge areas. ’’ Although exams are not always fully comparable in time for the same country - this i s for instance the case o f Guatemala.
22

more primary and secondary results for each country in different time periods. Overall, what i s clear when analyzing the results in each o f the countries i s that: (a) in al l countries, except Costa Rica, average test scores are considered to be either l o w (basic) or low-intermediate vis-&vis the country’s established standards; and (b) in all countries where exams are comparable over time, there i s no clear improvement trend in the results over the second half o f the 1990s or early 2000s.
I t i s important to keep in mind that being “intermediate” in El Salvador i s not the same as being “intermediate” in Nicaragua, for example. In El Salvador, students are considered to be in the intermediate achievement range if they can identify and understand but cannot elaborate or apply their knowledge. In Nicaragua, this description corresponds more closely to what the country defines as a “basic” level o f achievement. In any case, in terms o f skills, and more particularly reading ski l ls, i t i s important to understand that the l ow learning achievement reported for al l countries i s associated with l ow levels of reading comprehension (which i s often taken as the most relevant indicator of educational quality at the third grade). In Honduras, i t appears that in grade 3 a majority o f students cannot identify characters or ideas in what they read nor identify parts o f s eech. In grade 6, students test slightly higher in Spanish but slightly worse in mathp’. Results are substantially lower in disadvantaged schools. In El Salvador, around 25 percent of students were not able to identify the main message o f a simple written test in 2001 and about 40 percent were not able to make slightly more complicated inferences about it.33 These percentages increase to 50 and 60 percent respectively, if we consider the fraction o f correct answers that are the result o f mere chance, and they substantially increase for the students whose overall result to the exam i s below average. They are also substantially higher for the poorer socio-economic groups.
Progressing through the grades, we also see that grade 9 results are particularly l ow in the countries for which there i s testing at the lower education level (El Salvador and Costa Rica).
32 Care needs to be taken that the Honduras standardized exam may not reflect f u l l y the curriculum contents. 33 See Schiefelbein (2004).
23
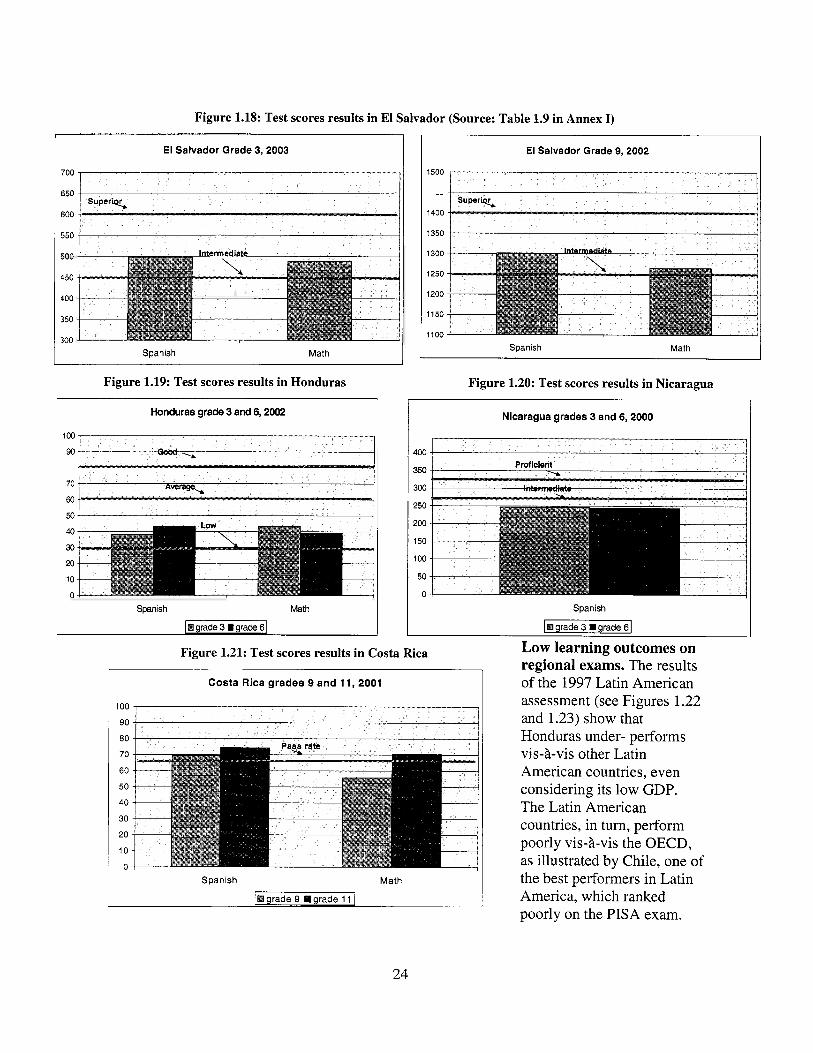
Figure 1.18: Test scores results in El Salvador (Source: Table 1.9 in Annex I)
El Salvador Grade 3,2003 I 650
600
550
500
450
400
350
300
Math I Spanish
Figure 1.19: Test scores results in Honduras
Honduras grade 3 and 6,2002
100
90
70
60
Spanish Math
El Salvador Grade 9,2002
_ _ 1400
1350
1300
1250
1200
1150
1100
Spanish Math
Figure 1.20: Test scores results in Nicaragua
Nicaragua grades 3 and 6,2000
400
350 I 300 I
Figure 1.21: Test scores results in Costa Rica
Costa Rica grades 9 and 11,2001
IO0
90
80
70
60
50
40
30
20
10
0
Spanish Math
Low learning outcomes on regional exams. The results of the 1997 Latin American assessment (see Figures 1.22 and 1.23) show that Honduras under- performs vis-&vis other Lat in American countries, even considering i t s l o w GDP. The Lat in American countries, in turn, perform poorly vis-&vis the OECD, as illustrated by Chile, one of the best performers in Lat in America, which ranked poorly on the PISA exam.
24
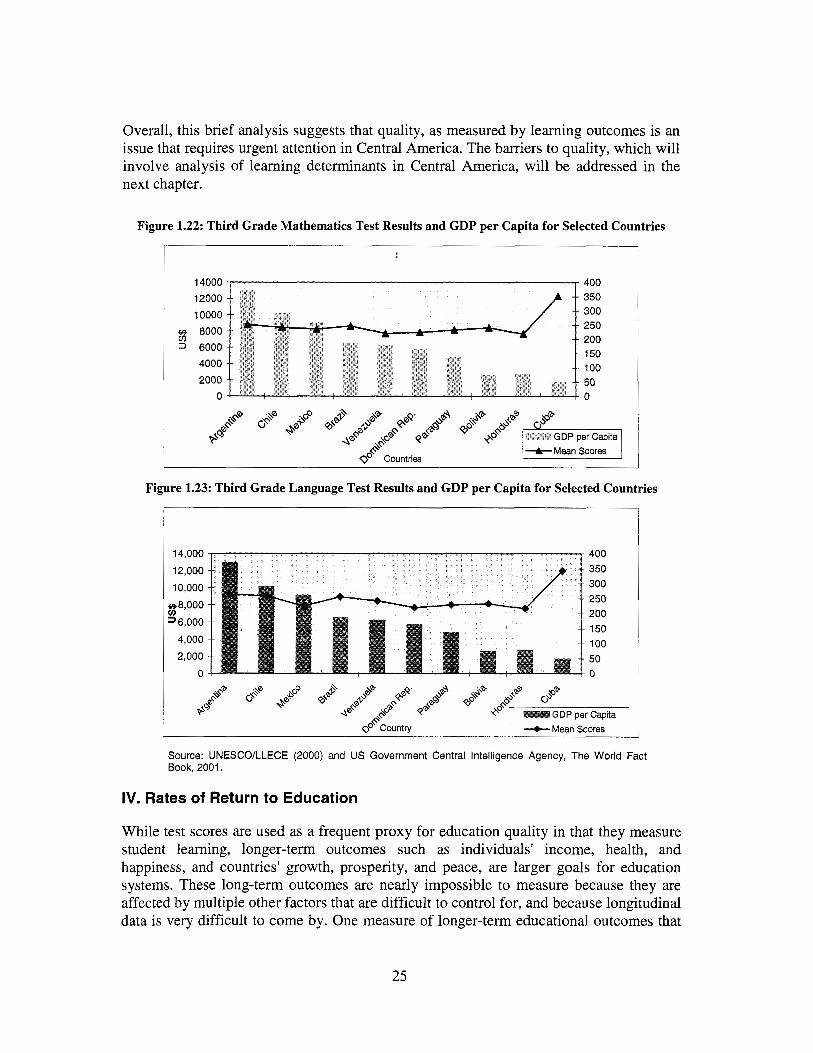
Overall, this brief analysis suggests that quality, as measured b y learning outcomes i s an issue that requires urgent attention in Central America. The barriers to quality, which w i l l involve analysis of learning determinants in Central America, wi l l be addressed in the next chapter.
Figure 1.22: Third Grade Mathematics Test Results and GDP per Capita for Selected Countries
Figure 1.23: Third Grade Language Test Results and GDP per Capita for Selected Countries
, i
400 350 300 250 200 150
10,000 te8,OOO u) 36,000
4,000 100
0 0 2,000 50
Source: UNESCO/LLECE (2000) and US Government Central Intelligence Agency, The World Fact Book. 2001.
IV. Rates of Return to Education
While test scores are used as a frequent proxy for education quality in that they measure student learning, longer-term outcomes such as individuals' income, health, and happiness, and countries' growth, prosperity, and peace, are larger goals for education systems. These long-term outcomes are nearly impossible to measure because they are affected by multiple other factors that are difficult to control for, and because longitudinal data i s very difficult to come by. One measure o f longer-term educational outcomes that
25

can be analyzed i s the rate o f return to education. Rates o f return measure the impact o f schooling on individuals' future earnings. They are important not just as a way o f measuring the quality and effectiveness o f schools, but also because people's earnings are a critical link between education and national growth, poverty reduction, and income distribution. This section analyzes the private rates o f return to schooling in Central America. W e find that while private rates o f return in Central America are generally comparable to other parts of the world, they are l ow compared with much o f Latin America and have been declining in recent years. We also find, as expected, that rates o f return are generally higher for the higher education levels but that they are oddly l ow for the lower secondary level across Central America signaling problems at this level.
Whi le many factors contribute to individuals' future earnings, calculation o f private rates o f return to schooling provides a widely used method to separate the impact o f co-varying effects on wages. This allows us to estimate the impact o f educational attainment on later earnings. Annex I1 provides a description o f the models that were specified to estimate private rates o f return for the four countries in the report. In essence, we address two main questions: (i) what is the value o f an extra year o f schooling; and (ii) what i s the value o f the different educational levels (primary, secondary, and tertiary).
Unfortunately, due to data and time restrictions we do not investigate social rates o f return to schooling.34 Social rates o f return measure the net benefit to societies o f educating their citizens. Part o f the social rate o f return to schooling i s the private rate return - how individuals benefit from schooling - but other benefits, such as higher national productivity, technological and intellectual development, and reductions in social costs due to imprisonment, health problems, high birth rates, and general poverty, are not evident in estimates o f private rates o f return. I t is highly probable that in Central America social rates o f return to schooling are considerably higher than private rates o f return.
W e report private rates o f return to schooling, overall and by education level, in Table 1.4. To make the analysis as comparable as possible among countries, we undertook these estimations using only the salary o f individuals' main occupation, and using the cohort o f 18-60 year-old dependent workers. W e also divided this group into three sub-cohorts to assess the evolution o f private rates o f return over time.35 Econometric details on the estimations are also reported in Annex II. T o facilitate the interpretation o f the rates o f return, we also present a number o f instructive figures (Figures 1.24-1.30).
Private rates of return in Central America tend to be lower than the Latin American average. Our returns indicate that an additional year o f education generates an increase between 9 and 11 percent in private earnings in the four Central American countries (Figure 1.24). Whi le this i s not an insubstantial figure, i t i s lower than the average 12 percent in Lat in America. What makes this particularly concerning i s that
34 Studies of the social returns to schooling are much rarer than those of private returns to schooling. One recent study i s Junankar and L iu (2003). 35 An F-test was performed to assess if the rates o f return are significantly different across cohorts, finding the differences statistically significant.
26

private rates o f return tend to be lower when larger proportions o f the population are educated because there i s a large supply o f ski l led labor.36 Because average educational attainment i s higher in Latin America as a whole than i t i s in Central America we would expect to see higher private rates of return in Central America.
The fact that the rate o f return i s lower in Central America raises some concerns about the quality o f schooling as well as the availability o f jobs and demand for skilled labor in the region. The lower rate o f return in the Central American countries suggests that an additional year o f education provides less added benefit to would-be employers, probably because o f the l ow quality of schooling discussed previously. I t may also mean - either alternatively or in addition - that there are not enough skilled jobs available for people as they complete their schooling. There i s l i t t le evidence, however, that the demand for skilled labor i s flat in Central America.37
Table 1.4: Private Rates of Return
18-60 18-30 31 -45 46-60 Cohorts:
Average Primary Lower Secondary Upper Secondary Tertiary
I El Salvador, 2001 9.4 6.2 4.8 11.9 18.9
6.8 2.2 4.5 8.9 17.9
10.8 6.5 6.0 14.3 18.9
11.4 9.4 7.5 18.0 13.0
Average Primary Lower Secondary Upper Secondary Tertiary
11.5 8.2 6.2 24.3 10.4
9.9 5.7 7.5
21.4 7.0
12.0 7.5 7.6 26.0 10.9
13.7 12.3 1.9
33.0 9.4
Guatemala, 2000
1 Honduras, 2002 Average Primary Lower Secondary Upper Secondary Tertiary
10.4 8.7 7.9 13.8 13.3
8.7 6.4 6.0 13.3 10.9
11.2 9.9 10.8 12.4 13.9
11.7 10.1 11.7 15.1 12.4
Nicaragua, 2001 Average Primary Lower Secondary Upper Secondary Tertiary
9.3 5.8 6.2 10.7 18.2
7.6 4.4 4.2 11.6 17.5
10.2 6.3 7.8 11.6 16.3
10.4 7.3 9.8 2.2 24.0
10 Average
Average 12 Latin America
Asia + Average 9.9
7.5 Average
Source: Household Surveys; SANIGEST (2003); and Psacharopoulos and Patrinos (2002).
36 This i s evidenced by the lower private returns to schooling in the OECD and Asian countries recorded in Table 1.4 as well as from the higher private returns in Guatemala and Honduras where average years of schooling i s lower than in Nicaragua and El Salvador (see also Figure 1.15). 37 See AED (2004) for El Salvador and The World Bank (2004d) for Honduras on this subject.
27

While private returns to schooling in Central America are more or less on par with those in Costa Rica and the Asian countries the higher educational attainment rates in these comparison countries suggest that private returns are low in Central America.
Figure 1.24: Private rates of return in Central America and other countries
I 1 4 7 I1
I E l S a l v a d o r G u a t e m a l a H o n d u r a s N ica ragua Cos ta R ica L A C Asia O E C D I Source: Table 1.4
Figure 1.25: Private rates of return and educational attainment in Central America
9 9.5 10 10.5 11 11.5 12 Coefficient on Years of Schooling
Source: Table 1.4 and Table 1.2 in Annex I.
Rising returns with the education cycle. When we disaggregate rates o f return b y education cycle (also Table 1.4), we see that in El Salvador, Honduras and Nicaragua returns increase from primary to upper secondary and again to tertiary (ignoring for the moment lower secondary). In Guatemala, the pattern i s different. Private returns increase dramatically between primary and upper secondary, but then decrease at the tertiary level. This pattern o f generally rising returns wi th the education cycle (also visible in Figure 1.26) i s consistent with those found in other Lat in American countries although the
28

returns to secondary education tend to be slightly higher in Central America.38 This pattern of rising returns can, again, be explained by supply issues. Central American countries, as we have seen, tend to have low enrollment at the secondary and tertiary level, compared to a much higher coverage at the primary level making individuals with secondary and tertiary education a limited commodity. Figure 1.27 illustrates this. I t shows that for the cohort of individuals 25 years old or older higher educational attainment i s associated with lower private returns. The particularly low educational attainment in Guatemala may, in part, explain the high returns to upper secondary.
Figure 1.26: Rate of return by level of education I
I 30
Source: Table 1.4
Figure 1.27: Upper secondary returns and educational attainment
I 5 10 15 20 25 30
Coefficient on Upper Secondary
Source: Table 1.4 and Table 1.2 in Annex I
38 See, for instance The World Bank (2003).
29
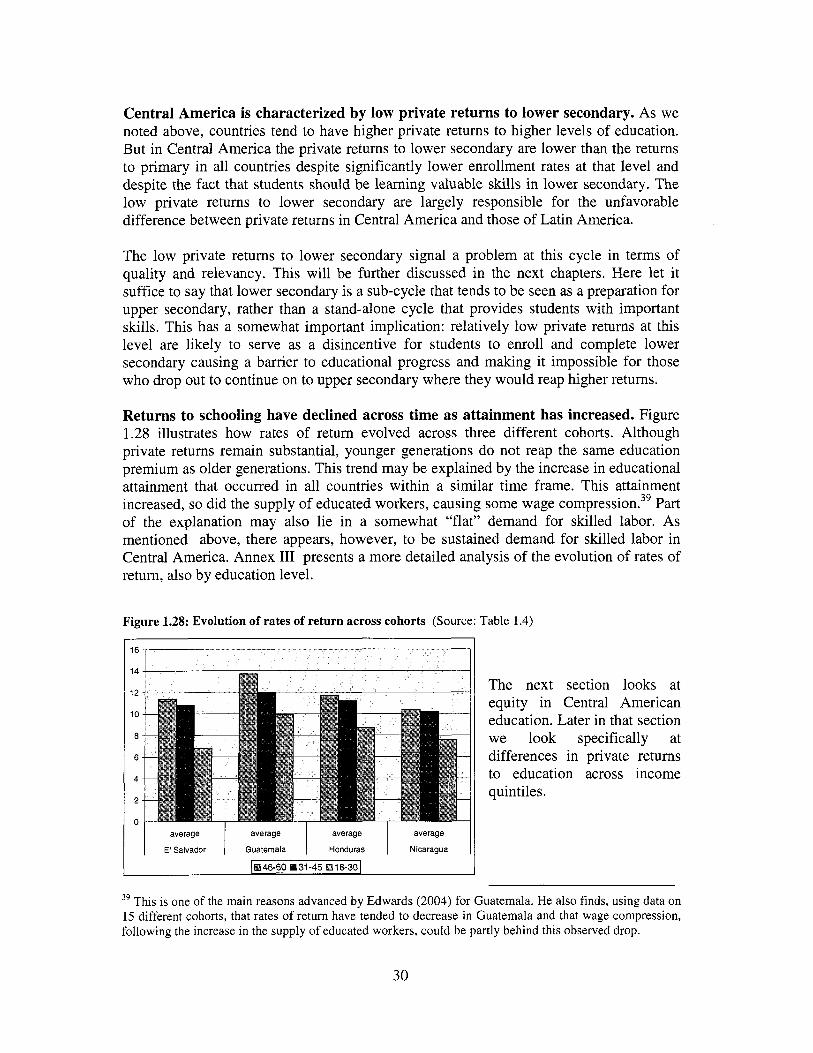
Central America i s characterized by low private returns to lower secondary. As we noted above, countries tend to have higher private returns to higher levels o f education. But in Central America the private returns to lower secondary are lower than the returns to primary in al l countries despite significantly lower enrollment rates at that level and despite the fact that students should be learning valuable skills in lower secondary. The l o w private returns to lower secondary are largely responsible for the unfavorable difference between private returns in Central America and those o f Latin America.
16
14
12
10
8
6
4
2
0
The low private returns to lower secondary signal a problem at this cycle in terms of quality and relevancy. This w i l l be further discussed in the next chapters. Here l e t i t suffice to say that lower secondary i s a sub-cycle that tends to be seen as a preparation for upper secondary, rather than a stand-alone cycle that provides students with important skills. This has a somewhat important implication: relatively l o w private returns at this level are l ikely to serve as a disincentive for students to enroll and complete lower secondary causing a barrier to educational progress and making it impossible for those who drop out to continue on to upper secondary where they would reap higher returns.
The next section looks at equity in Central American education. Later in that section we look specifically at differences in private returns to education across income quintiles.
Returns to schooling have declined across time as attainment has increased. Figure 1.28 illustrates how rates o f return evolved across three different cohorts. Although private returns remain substantial, younger generations do not reap the same education premium as older generations. This trend may be explained by the increase in educational attainment that occurred in al l countries within a similar time frame. This attainment increased, so did the supply of educated workers, causing some wage c o m p r e ~ s i o n . ~ ~ Part o f the explanation may also l ie in a somewhat "flat" demand for skilled labor. As mentioned above, there appears, however, to be sustained demand for skilled labor in Central America. Annex I11 presents a more detailed analysis of the evolution o f rates of return, also by education level.
Figure 1.28: Evolution of rates of return across cohorts (Source: Table 1.4)
39 This i s one o f the main reasons advanced by Edwards (2004) for Guatemala. He also finds, using data on 15 different cohorts, that rates of return have tended to decrease in Guatemala and that wage compression, following the increase in the supply of educated workers, could be partly behind this observed drop.
30

V. Equity of Educational Outcomes
Up to this stage, educational outcome indicators have only been presented as averages for each of the countries, not allowing us to appreciate the differences in outcomes within each of the countries. Key dimensions to be looked at in an equity diagnostic include the u rbd ru ra l discrepancy, the differences across socio-economic strata, the gender gap, and, when applicable, the differences across ethnic or linguistic groups. This section reveals that inequalities in education are a pervasive and urgent challenge.
A. URBANmURAL DIVIDE
Looking at how urban and rural populations differ across educational outcome indicators i s particularly important in Central America where large proportions o f the population continue to l ive in rural areas. Populations are slowly and steadily moving toward urban areas, (see Box 1.2 on San Salvador) which also creates challenges for urban centers that must take in new groups of students each year from a very different socio-cultural background. Table 1.10 in Annex I reports the disaggregation of a number o f core educational indicators across urban and rural areas in all countries under analysis (largely constructed using household survey data).
We compare the enrollment ratios that we obtain using the official MINED data and the household survey ones in two countries, El Salvador and Honduras, for which we had both data sources available, to show the discrepancy that may result from using these different sources because of migration patterns across areas (see Figure 1.3 in the Annex). Household and MINED data are very similar for GERs at the primary level but they differ somewhat at the secondary level. MINED data reports higher proportions of students in urban schools than does household data in both countries, although more so in El Salvador. This i s likely due to children from rural households going to live in urban areas for secondary school (and living with relatives, for example). In MINED data the child i s considered urban while in household data the child i s considered rural.40 We wi l l use the household data primarily, as i t more accurately captures the dominant urban or rural identity o f the child.
The urban-rural enrollment i s shrinking. Using household survey data, the enrollment and attainment gap between urban and rural areas has been shrinking over recent years in all countries for which we have past data (Figure 1.29). The rate o f this change differs
40 What i s more unexpected i s that, in El Salvador, household survey data show a similar primary GER in the two areas and a decrease in time in both indicators, which seems to indicate higher efficiency in the two areas, while official data show a much higher level o f the rate in rural than in urban areas and a marked decrease in urban areas and marked increase in rural areas, which suggest decreasing coverage in urban areas and higher coverage and inefficiency in rural areas. What this may imply i s that household surveys are less effective in collecting information in rural than in urban areas (population more spread out, difficult to reach), or st i l l , that official data under-estimate enrollment in urban areas compared to rural ones (schools’ directors take less time to respond, etc). In any case, this discrepancy has important policy implications since the decreasing trend i n enrollment in urban areas showed by the official data would suggest that urgent action i s required to counteract this trend, while the household survey data would not lead us to the same conclusion.
31

across countries, being strongest in Nicaragua. The progress i s due to a proportionally stronger increase in rural than in urban areas in educational attainment and enrollment. Figure 1.30 illustrates this point for primary. GERs in primary education are either equivalent or close to equivalent between urban and rural areas in al l countries (a little less so for Guatemala where the GER in rural areas i s s t i l l lower than 100 percent). Most countries invested heavily in expanding access to schools in rural areas in recent decades. The development o f rural community-based schools in Honduras, Guatemala and El Salvador discussed in Chapter V explain, in part, the coverage increase.
Figure 1.29: Evolution of GER and NER across urban and rural areas (Source: Table 1.10 Annex I)
Lower efficiency in rural areas. Nonetheless, Figure 1.30 also illustrates that primary completion rates (for the 12-21 year-old cohort) are s t i l l much lower in rural areas than in urban ones. This points to challenges in getting students to progress successfully through school and remain in school. Additionally, differences in NERs tend to be slightly larger than the ones in GERs,
indicating that there are higher levels o f inefficiency in rural areas, and both late entrance and, above all, repetition rates are higher in rural areas (see Figure 1.4 in Annex I).
Figure 1.30: Primary GER, NER and G C R in urban and rural area (Source: Table 1.10 Annex I)
terms.
Secondary coverage gap between rural and urban areas. At the secondary level there remains a huge gap in terms o f both GERs and NERs between urban and rural areas (see Figure 1.31). Keep in mind that temporary migra- t ion is accounted for when we use household survey data. The gap i s even larger in completion
32
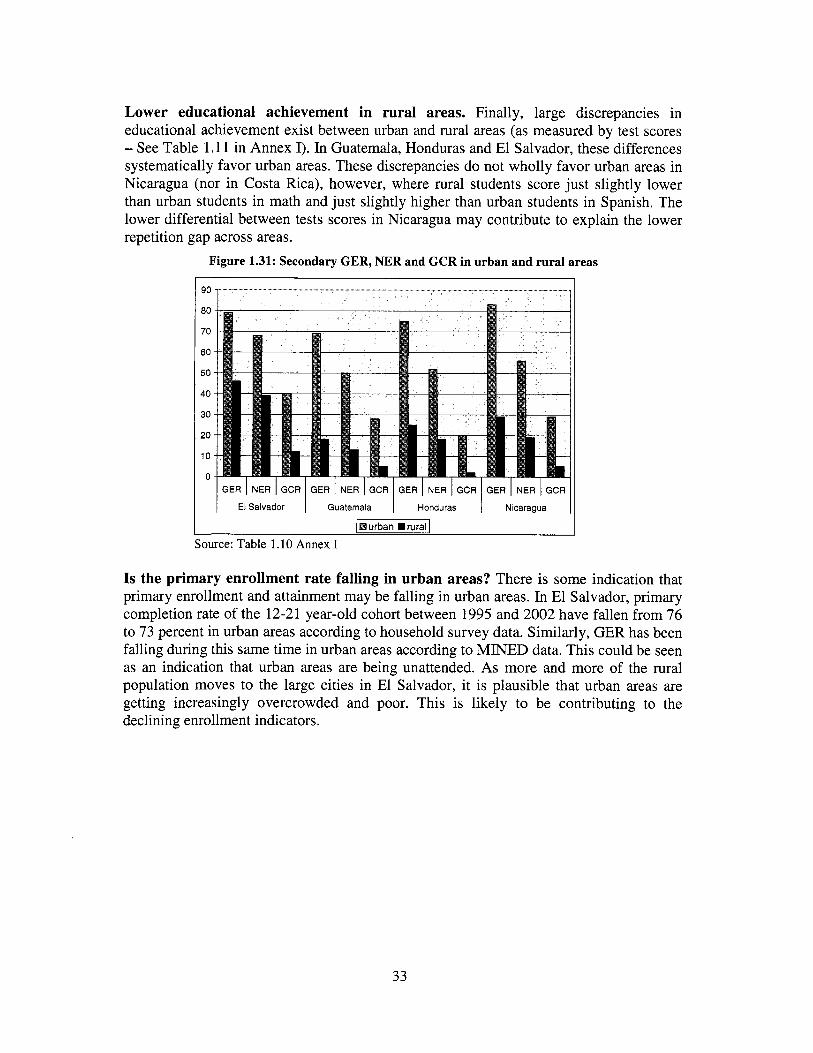
Lower educational achievement in rural areas. Finally, large discrepancies in educational achievement exist between urban and rural areas (as measured b y test scores - See Table 1.1 1 in Annex I). In Guatemala, Honduras and El Salvador, these differences systematically favor urban areas. These discrepancies do not wholly favor urban areas in Nicaragua (nor in Costa Rica), however, where rural students score just slightly lower than urban students in math and just slightly higher than urban students in Spanish. The lower differential between tests scores in Nicaragua may contribute to explain the lower repetition gap across areas.
Figure 1.31: Secondary GER, NER and GCR in urban and rural areas
GER I NER I GCR
El Salvador
90
80
70
60
50
40
30
20
10
0 GER I NER I GCR GER I NER I GCR GER I NER I GCR
Guatemala Honduras Nicaragua
Source: Table 1.10 Annex I
I s the primary enrollment rate falling in urban areas? There i s some indication that primary enrollment and attainment may be falling in urban areas. In El Salvador, primary completion rate o f the 12-21 year-old cohort between 1995 and 2002 have fallen f rom 76 to 73 percent in urban areas according to household survey data. Similarly, GER has been falling during this same time in urban areas according to MINED data. This could be seen as an indication that urban areas are being unattended. As more and more o f the rural population moves to the large cities in El Salvador, i t i s plausible that urban areas are getting increasingly overcrowded and poor. This i s l ikely to be contributing to the declining enrollment indicators.
33
that surround th
ation. Whereas t
he World Bank (20
A s im i la r trend exists in Honduras. The plots o f Figure 1.32 graph each o f the departments o f the country b y their level o f urbanization and the level o f their primary gross completion rate (calculated from official data as the current enrollees minus repeaters in grade 6 over the 12 year-old population), both overall and b y urban and rural areas of the departments. Looking at the figures, two observations come to mind. First, there i s a strong positive relationship between level o f urbanization and primary completion rate but this relationship i s driven by the rural areas o f the departments rather than by the urban areas o f the departments (in the most urban departments, rural areas do much better than in the most rural ones, while differences are less clear-cut in urban areas). In generally urban departments there i s no clear relationship between how urban a particular area is and the PCR in that area. Second, the two most urban departments in the country, Cortes and Francisco Morazan, have significantly lower completion rates than the rough pattern in the rest of the country in both urban and rural zones o f the two departments.
The main implication o f this finding i s that addressing completion in urban and rural areas in Honduras may require a dual strategy. In particular, rural completion may require a targeting o f resources in the most rural departments, while completion in urban areas seems to require a major effort in the departments of Cortes and Francisco Morazan, on the one hand, and a somewhat global approach, not targeted per level of urbanization of
34

the departments, on the other one. El Salvador may require a dual strategy as well, to address the increasing coverage issue in San Salvador.41
Figure 1.32: Honduras-Level of urbanization and completion rate, by department (2002)
2 0 _ _ _ _ . 0 0 0 100 200 300 400 500 600 700 800 ' Level of urbanization (%)
- 120 ,
5 80
2 g! 60 m K 5 40 .- L - f 20 0
0
A - * * Morazan e*
0.0 10.0 20.0 30.0 40.0 50.0 60.0 70.0 80.0 Level of urbanization ("A)
Source: The World Bank (2004~)
I 0.0 100 200 300 40.0 500 600 700 800
Level of Urbanization (%)
B. SOCIO-ECONOMIC DIFFERENCES IN EDUCATIONAL PERFORMANCE
Educational indicators in Central America are sharply divided along socio-economic lines wi th children from poor families suffering the inferior outcomes.
4' See The World Bank (2004 b).
35

Figure 133: Educational Attainment of the 25 year cohort
(Source: Table 1.12 Annex I)
~ I 4 0 0
12 00
10 00
8 00
6 00
4 00
2 00
0 00
Still substantial inequities in coverage and completion. Figure 1.33 illustrates, in a snapshot, the substantial difference in educational attainment across quintiles o f the current 25-year cohort.
Figure 1.34 shows that, while for most countries, inequities are relatively small in terms o f the current gross enrollment rates at the primary level (another encouraging result),
they tend to increase slightly in terms o f the net enrollment rates (indicating higher incidence of late entrance and repetition in poorest quintiles) and, even more, completion rate42, at this same level. Table A.12 in Annex I reports the current level o f a number o f educational indicators across income quintiles for the countries under analysis.
Figure 1.34: GER, NER and GCR across quintile in primary
140 0
120 0
io0 0
80 0
60 0
40 0
20 0
0 0 GER INER IGCR GER I NER IGCR GER I NER IGCR GER I NER IGCR
El Salvador Guatemala Honduras Nicaragua
(Source: Table 1.12 Annex I)
It should be noted that in Guatemala even GERs differ sharply over quintiles. It shows signs o f being the most inequitable country in this sense. Recall that we found that Guatemala was the only country where rural GER was below 100%.
These inequities are then magnified at the secondary education level (where even GERs are very different across quintiles) (see Figure 1.35). In El Salvador - arguably the most equitable o f the four countries - approximately f ive times as many children f rom the richest quintile complete the secondary cycle than from the poorest one (vs. about 2.5 times for primary). In Nicaragua - the least equitable country o f the four in terms of
42 Calculated as the proportion of 12-21 year-old children having completed the primary cycle. At the secondary level, the 17-21 year-old cohort was used.
36
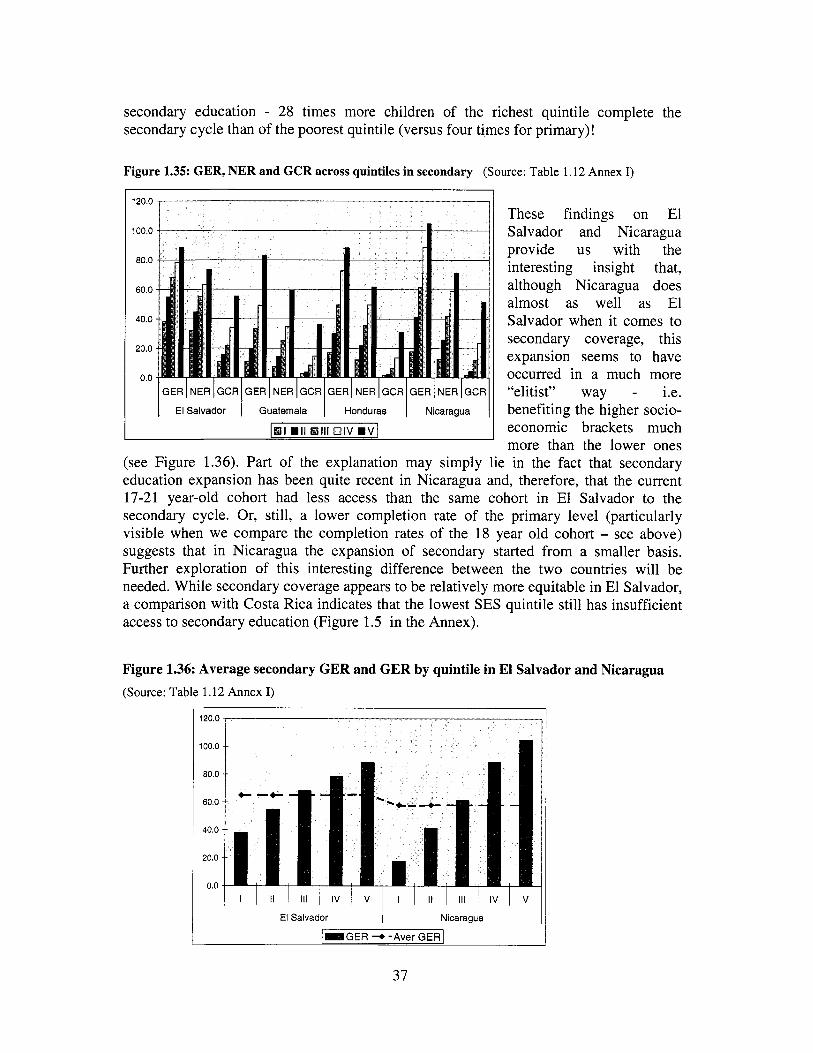
secondary education - 28 times more children of the richest quintile complete the secondary cycle than o f the poorest quintile (versus four times for primary)!
Figure 1.35: GER, NER and GCR across quintiles in secondary (Source: Table 1.12 Annex I)
120.0
100.0
80.0
60.0
40.0
20.0
0.0 GER I NER I GCR GER I NER I GCR GER I NER I GCR GER I NER ~ G C R
El Salvador Guatemala Honduras Nicaragua
These findings on El Salvador and Nicaragua provide us with the interesting insight that, although Nicaragua does almost as well as El Salvador when i t comes to secondary coverage, this expansion seems to have occurred in a much more “elitist” way - i.e. benefiting the higher socio- economic brackets much more than the lower ones
(see Figure 1.36). Part o f the explanation may simply lie in the fact that secondary education expansion has been quite recent in Nicaragua and, therefore, that the current 17-21 year-old cohort had less access than the same cohort in El Salvador to the secondary cycle. Or, sti l l , a lower completion rate of the primary level (particularly visible when we compare the completion rates of the 18 year old cohort - see above) suggests that in Nicaragua the expansion o f secondary started from a smaller basis. Further exploration of this interesting difference between the two countries wi l l be needed. While secondary coverage appears to be relatively more equitable in El Salvador, a comparison with Costa Rica indicates that the lowest SES quintile s t i l l has insufficient access to secondary education (Figure 1.5 in the Annex).
Figure 1.36: Average secondary GER and GER by quintile in El Salvador and Nicaragua (Source: Table 1.12 Annex I)
I 120.0 j 100.0
80 0
60 0
40.0
20 0
0 0
El Salvador Nicaragua
1 1 G E R + -Aver GER/
37
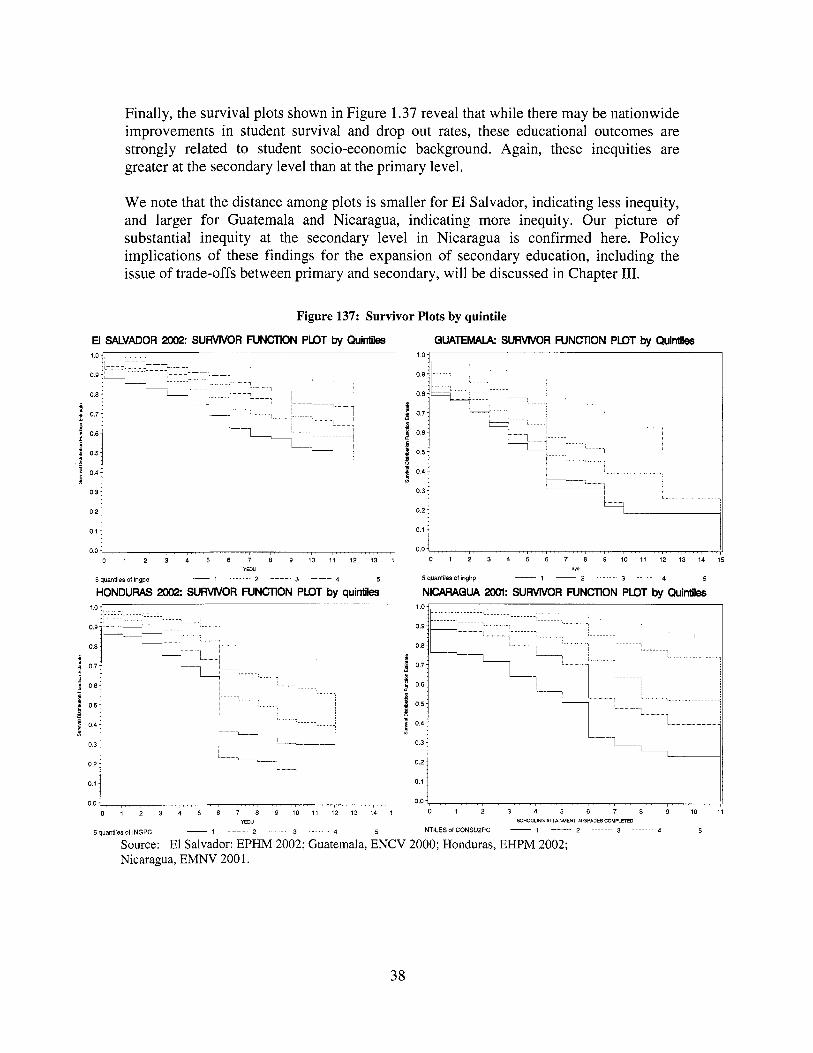
Finally, the survival plots shown in Figure 1.37 reveal that while there may be nationwide improvements in student survival and drop out rates, these educational outcomes are strongly related to student socio-economic background. Again, these inequities are greater at the secondary level than at the primary level.
1 0 -
0.9-
o,8.
1 0.7;
5 :
I $ 0.6:
$ 0.4:
5 0.5{ E -
0.3 :
0.2 :
0.1 :
We note that the distance among plots i s smaller for El Salvador, indicating less inequity, and larger for Guatemala and Nicaragua, indicating more inequity. Our picture o f substantial inequity at the secondary level in Nicaragua i s confirmed here. Policy implications of these findings for the expansion o f secondary education, including the issue of trade-offs between primary and secondary, w i l l be discussed in Chapter III.
............. ......
.. ...... ...... ........... ,. 'G , ' - - - - - - ......
- - .
L.....
+...... .... . , 8.. ....
....... i . . . . . .
. . I. .....
L .......... . . . . . . . .
LL
o . o \ , , , , , , , , , , , , . , , , , , , , , , , , , , , , , , , , , , , , , , , , , , , , , , , , , , , , , , , , , , , , , , ,
Figure 137: Survivor Plots by quintile
E - $ 0.5:
0.4-
El SALVADOR 2002: SURVIVOR FUNCTION PLOT by Quintiles
8.. , .............
...... . . . . . .
1 ..................
..-. ......
1
101-
s .
1 0.5
0.4 1 :
____.
............ ---- 0.3
0.1 4 0.0 . . . . . . . . . . . . . . . . . . . . . . . . . . . . , . . . . , . . . .
0 1 2 3 4 5 6 7 8 9 1 0 1 1 1 2 1 3 1 Y E W
- 1 ....... 5 quanliles of ingpe 2 3 - - - 4 5
HONDURAS 2002: SURVNOR FUNCTION PLOT by quintiles
- 1 1.. ...
.... L---,L. !__._
...... , : . , ......
...... 04: ...... ------L --L
1 ' 0.31
1 .......... 02: .......
0.1 j 0 0 1 , , , , , , , ,
0 1 2 3 4 5 8 7 8 9 1 0 1 1 1 2 1 3 1 4 1 YEDU
........ ........ ...... ......... ., ............. .........
........ . . . . . . ., ......... - - - - - ; . ............
. .I
0.1
jJ 0.0 , , , , , , , , , , , , , , , , , , , , , , , , , , , , , , , , ,
0 1 2 3 4 5 6 7 8 9 10 11 ScnoaiNo ATTAINMENT IN GBADES COMRETED
NTlLESolCONSUPPC ~ I __ 2 ....... 3 ....... 4 5 - 5 quantiles 01 INGPC 2 3 - 4 5
Source: El Salvador: EPHM 2002; Guatemala, ENCV 2000; Honduras, EHPM 2002; Nicaragua, EMNV 200 1.
38
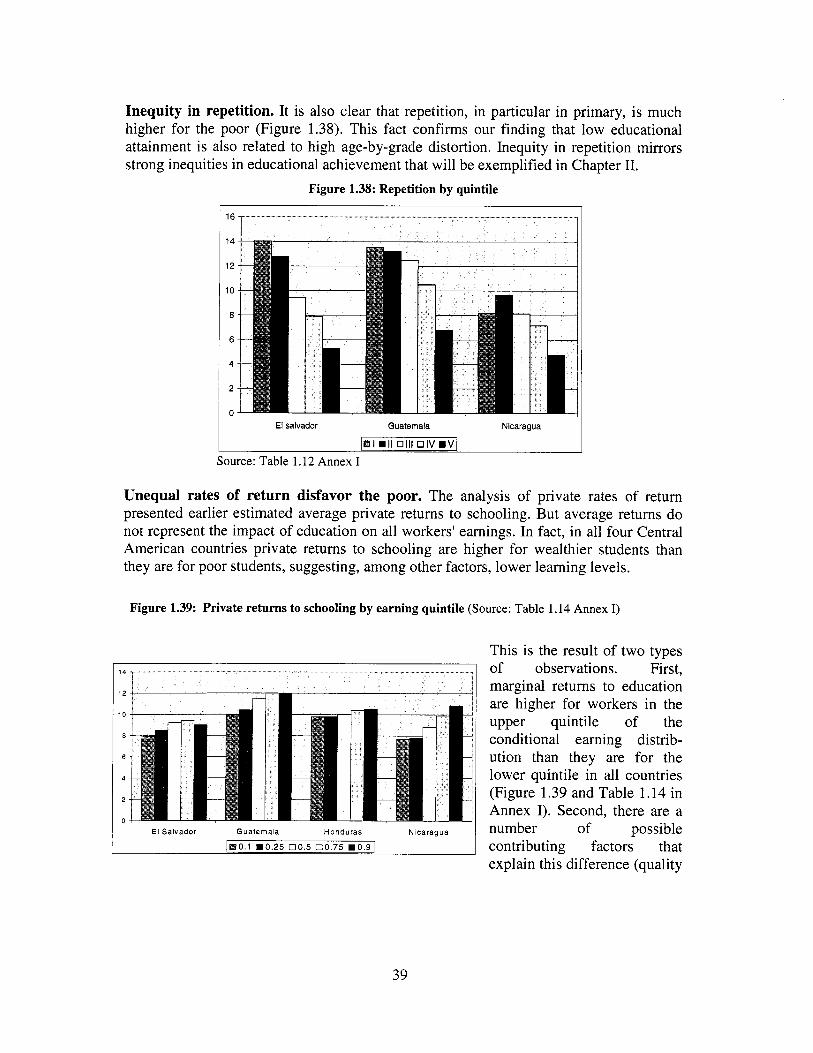
Inequity in repetition. I t i s also clear that repetition, in particular in primary, i s much higher for the poor (Figure 1.38). This fact confirms our finding that l ow educational attainment i s also related to high age-by-grade distortion. Inequity in repetition mirrors strong inequities in educational achievement that w i l l be exemplified in Chapter 11.
Figure 1.38: Repetition by quintile
I 1 6 1 1
14
12
10
8
6
4
2
0 El Salvador Guatemala Nicaragua
Source: Table 1.12 Annex I
Unequal rates of return disfavor the poor. The analysis of private rates o f return presented earlier estimated average private returns to schooling. But average returns do not represent the impact o f education on al l workers' earnings. In fact, in all four Central American countries private returns to schooling are higher for wealthier students than they are for poor students, suggesting, among other factors, lower learning levels.
Figure 1.39: Private returns to schooling by earning quintile (Source: Table 1.14 Annex I)
l 4 1 I This is the result o f two types o f observations. First, marginal returns to education are higher for workers in the upper quintile o f the conditional earning distrib- ution than they are for the lower quintile in all countries (Figure 1.39 and Table 1.14 in Annex I). Second, there are a number of possible contributing factors that explain this difference (quality
39

o f education, labour market connections, etc) and i t i s l ikely that their distribution i s biased against low income household^^^. In particular, i t i s l ikely that the education received b y the upper income quintiles i s o f higher quality than that received by the lower income quintiles, that cultural capital passed through families and schools favours upper income groups in the labour market, and that upper income groups have more access to high paying jobs through personal connections.
This finding points to a magnification o f the impact o f education on income inequity: poorer people do not only have lower levels o f educational attainment but they also seem to be reaping less benefits than wealthier people for a similar level o f attainment. These lower private rates o f return for the poor are likely to affect the incentives o f many poor people. For example, lower private rates o f return in primary for the poor in Nicaragua (shown in Table 1.14 in Annex I) could well contribute to explain why the completion rate o f the primary cycle i s so unequal, leading then also to high inequity in secondary coverage. Similarly, in Guatemala, the low private returns to lower secondary for the poor (Table 1.14 in Annex I) may explain why secondary coverage i s so unequally distributed there. The fact that rates o f return are unequally distributed only at the upper secondary level in El Salvador (Table 1.14 in Annex I) may contribute to explain why educational coverage i s more equally distributed in that country.
Figure 1.40: Evolution across cohorts of rates of return by quintile
16
14
12
10
8
6
4
2
0 I 18-30 I 31 -45 I 464
I I El Salvador, 200;
18-30 I 31 -45 I 46-60 18-30 1 31 -45 I 46-60 18-30 I 31 -45 I 46-60
Guatemala, 2000 Honduras, 2002 Nicaragua, 2001
Source: Table 1.14 Annex I
This being said, i t i s good to note in Figure 1.40 that the divergence in rates o f return across earning quintiles has tended to decrease over time in Nicaragua and Honduras,
43 See, for instance, Arias (2004).
40
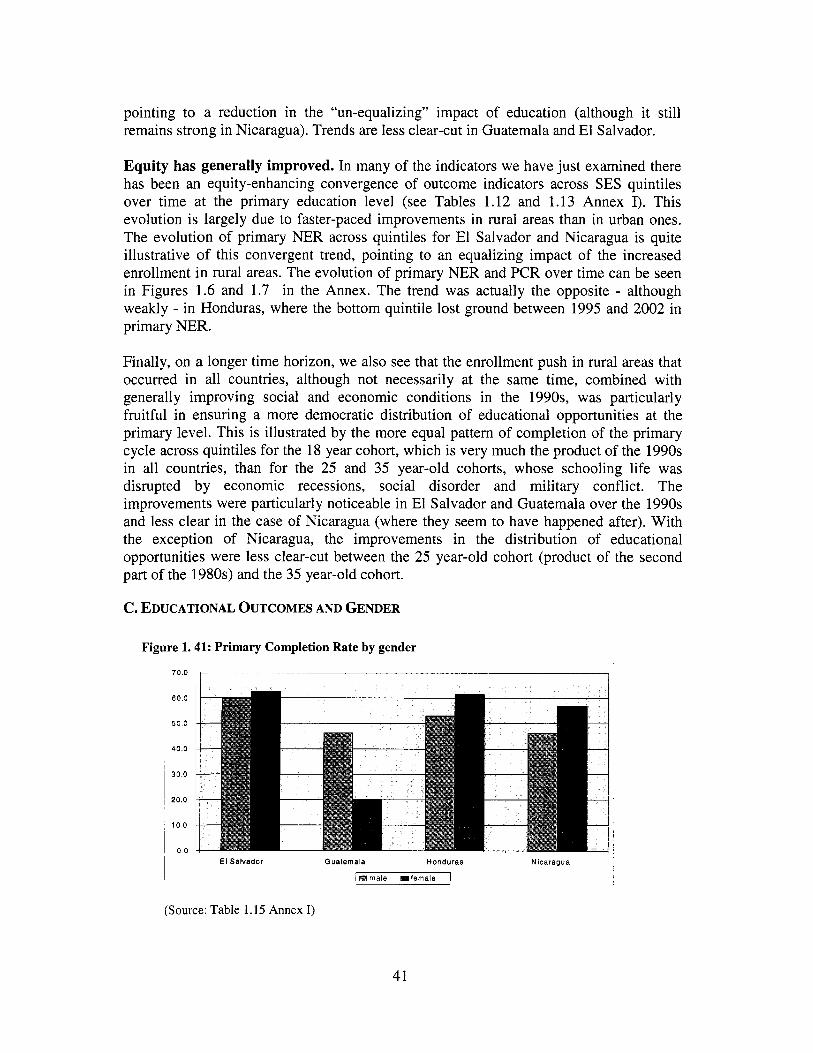
pointing to a reduction in the “un-equalizing” impact of education (although it s t i l l remains strong in Nicaragua). Trends are less clear-cut in Guatemala and El Salvador.
Equity has generally improved. In many of the indicators we have just examined there has been an equity-enhancing convergence of outcome indicators across SES quintiles over time at the primary education level (see Tables 1.12 and 1.13 Annex I). This evolution i s largely due to faster-paced improvements in rural areas than in urban ones. The evolution o f primary NER across quintiles for El Salvador and Nicaragua i s quite illustrative o f this convergent trend, pointing to an equalizing impact o f the increased enrollment in rural areas. The evolution of primary NER and PCR over time can be seen in Figures 1.6 and 1.7 in the Annex. The trend was actually the opposite - although weakly - in Honduras, where the bottom quintile lost ground between 1995 and 2002 in primary NER.
Finally, on a longer time horizon, we also see that the enrollment push in rural areas that occurred in all countries, although not necessarily at the same time, combined with generally improving social and economic conditions in the 1990s, was particularly fruitful in ensuring a more democratic distribution of educational opportunities at the primary level. This i s illustrated by the more equal pattern o f completion of the primary cycle across quintiles for the 18 year cohort, which i s very much the product o f the 1990s in all countries, than for the 25 and 35 year-old cohorts, whose schooling l ife was disrupted by economic recessions, social disorder and military conflict. The improvements were particularly noticeable in El Salvador and Guatemala over the 1990s and less clear in the case of Nicaragua (where they seem to have happened after). With the exception o f Nicaragua, the improvements in the distribution of educational opportunities were less clear-cut between the 25 year-old cohort (product of the second part of the 1980s) and the 35 year-old cohort.
c. EDUCATIONAL OUTCOMES AND GENDER
Figure 1.41: Primary Completion Rate by gender
70 0
60 0
50 0
40 0
30 0
20 0
1 0 0
0 0 - I Nicaragua
E l Salvador Guatemala Honduras
~ I m m a l e - female I
(Source: Table 1.15 Annex I)
41

Guatemala i s the only country where there i s a marked gap in educational performance between boys and girls. In all other countries girls do as well, or better, than boys (see Table 1.15 in Annex I). In Guatemala, however, females have much lower educational attainment (4.9 years versus 6.2 year for males), lower GER and NER in primary and secondary, and much lower completion rates in primary and secondary (see Figure 1.41). Repetition, age-by-grade distortion and academic performance are similar across the two genders in Guatemala. Lower enrollment, completion and attainment outcomes coupled with equitably distributed educational efficiency indicators suggest that there are cultural barriers to girls education, namely that families are less l ikely to enroll their daughters in school and are more l ikely to pull them out o f school regardless o f their performance in school.
In the three other countries, i t i s the l ow performance of boys at al l levels that seems to be more o f a concern. Lack o f interest for schooling, high repetition rates and need to work are al l reasons o f l ow completion that may be prevalent in males.
D. EDUCATIONAL OUTCOMES AND INDIGENOUS AND AFRO-DESCENDENT POPULATION
W e conclude this section on equity b y assessing if there are noticeable differences in some educational indicators across specific ethnic groups. In Central America, we can distinguish three groups o f countries according to the relative importance o f their indigenous and afro-descendent population: (a) Guatemala with over half o f i t s population, which can be identified as indigenous or afro-descendent; (b) Honduras with about 15 percent o f i t s population which can be considered indigenous or afro- descendant; and (c) a third group o f countries, composed o f El Salvador, Nicaragua and Costa Rica, with between 1-7 percent indigenous or afro-descendent population.
Figures 1.42 and 1.43 below as wel l as Table 1.16 and Table 1.17 in the Annex present key educational indicators for the indigenous and afro-descendent populations o f Central America. Official MINED data generally do not report separate information for these groups making it difficult to present definitive information on educational outcome differences across ethnicity. In the future, MINEDs should separate their data along these lines.44
Lower educational outcomes for indigenous populations. Indigenous students have lower educational attainment than non-indigenous students. In particular, differences are stark in terms o f primary completion rates and are even starker for secondary completion rates. Differences are confirmed for educational achievement in Guatemala and Honduras. I t i s also clear, however, that there are a few differences across countries, wi th a smaller overall gap between indigenous and non-indigenous in Nicaragua than in Guatemala and Honduras. I t would be interesting to explore why this i s the case, particularly in view of the fairly developed/established Guatemalan policies in multiculturalism and bilingual education (see Chapter II), which i t i s hoped are supporting the learning needs o f indigenous students in that country. The more recent
44 Although this i s changing in Honduras with the new 2003 school mapping which i s explicitly collecting and reporting information for al l the indigenous groups (Mosquitas, Mayas, Lencas, etc).
42

bilingual education strategy may be particularly effective in Nicaragua (see Chapter 11) or policies to improve the performance of indigenous populations easier to apply in countries with much smaller shares o f indigenous populations. Importantly, Nicaragua has four main ethno-linguistic populations while Guatemala has between 24 and 52 separate ethno-linguistic groups.
Figure 1.42: Primary GER, NER and GCR for indigenous and non-indigenous indigenous and non-indigenous
Figure 1.43: Secondary GER, NER and GCR for
"1 - 100
80
60
40
a
0 GER I NER I GCR GER I NER I GCR I Honduras
Source: Table 1.16 Annex I
GER I NER I GCR GER I NER I GCR
Guatemala I Honduras Nicaragua
GER 1 NER I GCR
Nicaragua and Guatemala show limited progress toward rectifying existing educational inequities for indigenous students over the past decade. In Nicaragua indigenous PCR plummeted from 67 to 51 percent between the 35 and 25 year-old cohorts before bouncing back to 64 percent for the 18 year-old cohort. In Guatemala indigenous PCR has climbed steadily but s t i l l only reaches 37 percent while in Honduras, indigenous students made significant progress between the 35 and 25 year-old cohort but then lost two percentage points between the 25 year-old and 18 year-old cohorts. 48 percent of the 18 year-old cohort has completed primary school (see Table 1.17 and Figure 1.8 in the Annex).
VI. Conclusions
Important challenges lie ahead. This chapter has shown that educational attainment, primary and secondary enrollment rates, internal efficiency o f education systems, and the gap between urban-rural areas and socio-economic groups (in primary), have generally improved in recent decades in Central America. I t also showed, however, that important challenges remain in all areas in Central American countries. In particular: (a) primary completion rates are troublingly low in most of the countries under analysis; (b) there i s a serious secondary education enrollment gap in all countries, as evidenced by low
43
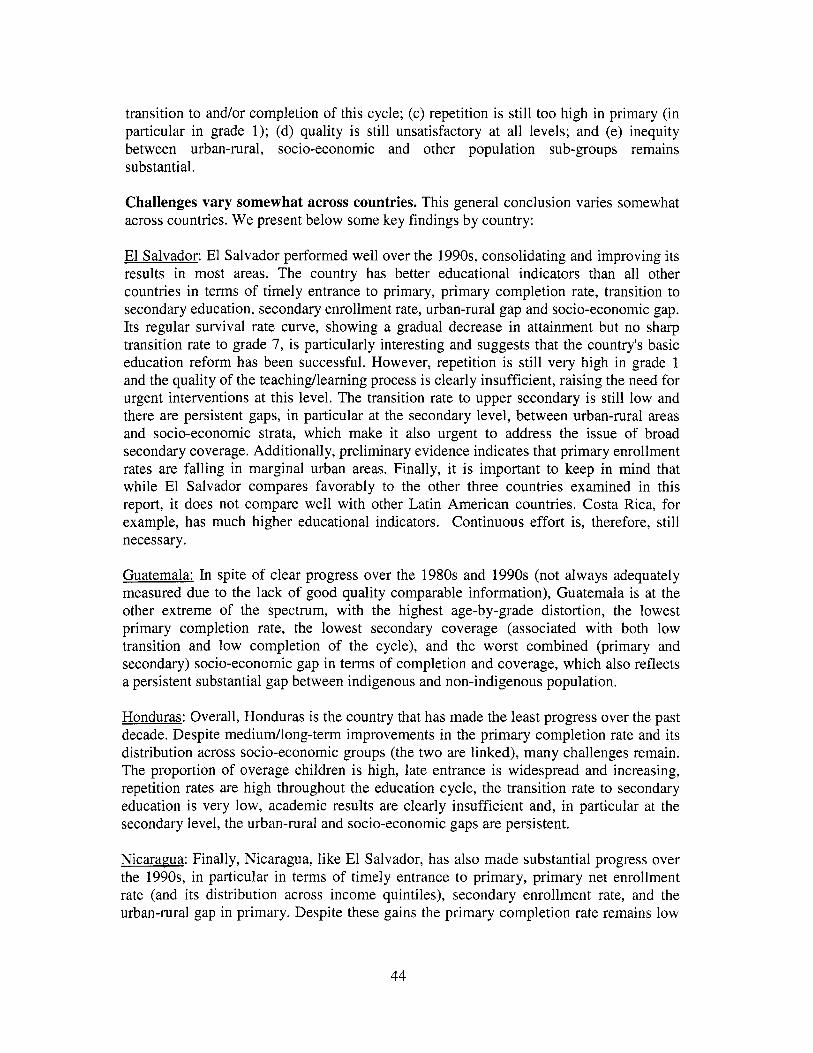
transition to andor completion o f this cycle; (c) repetition i s s t i l l too high in primary (in particular in grade 1 ) ; (d) quality i s s t i l l unsatisfactory at all levels; and (e) inequity between urban-rural, socio-economic and other population sub-groups remains substantial.
Challenges vary somewhat across countries. This general conclusion varies somewhat across countries. W e present below some key findings by country:
El Salvador: El Salvador performed well over the 1990s, consolidating and improving i t s results in most areas. The country has better educational indicators than all other countries in terms of timely entrance to primary, primary completion rate, transition to secondary education, secondary enrollment rate, urban-rural gap and socio-economic gap. I t s regular survival rate curve, showing a gradual decrease in attainment but no sharp transition rate to grade 7, i s particularly interesting and suggests that the country's basic education reform has been successful. However, repetition i s s t i l l very high in grade 1 and the quality o f the teachinglearning process i s clearly insufficient, raising the need for urgent interventions at this level. The transition rate to upper secondary is s t i l l low and there are persistent gaps, in particular at the secondary level, between urban-rural areas and socio-economic strata, which make it also urgent to address the issue o f broad secondary coverage. Additionally, preliminary evidence indicates that primary enrollment rates are falling in marginal urban areas. Finally, i t i s important to keep in mind that while El Salvador compares favorably to the other three countries examined in this report, i t does not compare well with other Latin American countries. Costa Rica, for example, has much higher educational indicators. Continuous effort is, therefore, s t i l l necessary.
Guatemala: In spite o f clear progress over the 1980s and 1990s (not always adequately measured due to the lack o f good quality comparable information), Guatemala i s at the other extreme of the spectrum, with the highest age-by-grade distortion, the lowest primary completion rate, the lowest secondary coverage (associated with both low transition and low completion o f the cycle), and the worst combined (primary and secondary) socio-economic gap in terms o f completion and coverage, which also reflects a persistent substantial gap between indigenous and non-indigenous population.
Honduras: Overall, Honduras i s the country that has made the least progress over the past decade. Despite mediudlong-term improvements in the primary completion rate and i t s distribution across socio-economic groups (the two are linked), many challenges remain. The proportion o f overage children i s high, late entrance i s widespread and increasing, repetition rates are high throughout the education cycle, the transition rate to secondary education i s very low, academic results are clearly insufficient and, in particular at the secondary level, the urban-rural and socio-economic gaps are persistent.
Nicaragua: Finally, Nicaragua, l ike El Salvador, has also made substantial progress over the 1990s, in particular in terms o f timely entrance to primary, primary net enrollment rate (and i t s distribution across income quintiles), secondary enrollment rate, and the urban-rural gap in primary. Despite these gains the primary completion rate remains low
44
as does the distribution o f primary completion across income quintiles. Repetition i s s t i l l very substantial, academic achievement unsatisfactory and the urban-rural and socio- economic gap high in secondary (the worst gap among the four countries).
Three main priorities. The diagnostic makes i t clear that the challenges presented above can be loosely grouped into three main priorities: (a) learning; (b) primary completion; and (c) secondary coverage. These can be further distilled to the f irst and third priorities (learning and secondary education covera e) considering the strong link between education quality and primary completion4' (although reaching full completion wi l l require particular focus on the quality o f the education for the poor). Addressing the grave inequities that poor, rural, indigenous, and other marginalized populations face i s fundamental to achieving all of these goals.
Chapter I1 wi l l be devoted to the determinants of learning in Central America, suggesting possible options to improve it. This chapter also focuses in on specific barriers to and options for advancing quality education for disadvantaged sectors o f the population, as this i s necessary as well for attaining universal primary completion. Chapter I11 wi l l deepen the analysis o f the causes of low secondary enrollment, which, as foreshadowed in this chapter, are diverse, and suggest policy options to address them. The last two chapters w i l l concentrate on two cross-cutting instruments, education spending and management which, i f well used, have the potential of greatly improving education delivery, both quality and coverage.
45 Illustrating this point, the internal efficiency analysis suggested that over-age, caused by late entrance and/or repetition, i s a leading cause of non-completion o f the primary cycle and low transition to secondary because o f the increasing tendency to drop-out (for work or other related reasons) in children over a certain age. Similarly, low quality o f primary and lower secondary is not only important for itself, but because, by generating lack of interest in families and students, i t i s also l ikely to explain why children drop-out at some point o f their schooling cycle. Hence, overall, policies to promote timely entrance or even lower the official entrance age, together with policies which decrease the impact o f repetition such as flexible promotion or accelerated education programs, may be useful; but even more important, however, w i l l be quality improvements at al l levels to improve cognitive skills, increase education relevance and education returns, and help reduce repetition.
45
Chapter II: Determinants of (and Constraints to) Learning in Central America
With the current global emphasis on access and enrollment in school, a focus o f the Mil lennium Development Goals, for example, there i s the risk o f pushing to the side what i s perhaps the most important objective o f schools - to teach children meaningful sk i l ls and knowledge. This report puts that fundamental objective back into the limelight because without adequate learning outcomes people's ability to l ive healthy, enjoyable lives, compete on the labor market, and contribute to national growth are severely restricted. Learning can be thought of as a result of three factors: the quality o f schooling; family, and community background and contextual factors; and personal characteristics o f each student. This chapter w i l l examine the determinants o f and constraints to learning in Central America with emphasis on the first and second factors - the quality o f schooling and background, or demand-side factors.
Poor learning outcomes are often thought o f as a problem distinct f rom educational attainment and access. But low levels o f learning directly impact educational attainment. This occurs in three primary ways: (a) inadequate learning outcomes can result in repetition and grade failure i f students do not gain sufficient skills and knowledge to pass to the next grade level; (b) the quality o f learning directly affects students' interest and enjoyment o f school which contributes to their decisions regarding whether to stay in school; and (c) the quality o f learning impacts the private rates of return o f education, which in turn creates incentives or disincentives for a t t e n d a n ~ e . ~ ~
Because o f this, learning i s key to achieving primary cycle completion as well as greater enrollment in higher levels o f schooling. This i s witnessed in several phenomena in Central America including high repetition rates associated with higher dropout rates, lack o f interest in schooling as a factor for school abandonment, and lower test scores associated with lower completion rates.47 In all cases, these phenomena acutely affect disfavored segments of the population, to a large extent comprised of poor, rural, and indigenous students.
This chapter will, therefore, focus on the reasons behind poor learning outcomes in Central America, at all levels, with emphasis on the learning o f the poor. As discussed previously, this challenge i s identified as the single most important priority for educational reform in Central America. This priority i s increasingly widely espoused by countries and development stakeholders. General quality improvements and focus on quality o f delivery for the poor are the focus o f the recent Education For All Fast Track Initiatives implemented in both Honduras4* and Nicaragua.49
46 The link between quality as well as relevance and secondary education coverage w i l l be further explored in the next chapter on the expansion o f secondary education. 47 See, for instance, Marshall (2004b) on Guatemala. 48 EFA-FTI in Honduras focuses on educational efficiency improvements, over-age children, teacher management reform, and education for indigenous peoples. 49 In Nicaragua, EFA-FTI focuses on performance-based delivery and school management.
46
This chapter begins with a discussion of the national assessment systems in the four Central American countries and how to improve them. We begin with this discussion because we argue that effective national assessment systems are key to understanding the learning challenges that confront each country and that improving these systems wi l l help countries plan methods to tackle these challenges. The remainder o f the chapter i s then divided into two sections. The first examines some o f the main determinants of and constraints to learning in Central America while the second focuses on policy options that respond to these determinants and constraints to learning. In both sections three main areas are investigated. These are: (1) student background characteristics, (2) teacher quality, and (3) curriculum and pedagogical practices. In the second section, we begin with an analysis of what differentiates high-performing low-income schools from low- and average-performing low-income schools as a means of introducing some o f the subsequent policy recommendations. The conclusion of the chapter reviews the main challenges and policy recommendations put forward in the chapter towards improving learning in Central America.
1. A Review of Central American National Educational Assessment Systems
Improving student learning and completion wi l l depend on ministries o f education and communities having clear and accurate information on the strengths and weaknesses of education systems. This section, therefore, discusses the state o f national assessment systems in Central America and proposes some ideas for strengthening evaluation and assessment in the region. Table 4.1 in Annex IV summarizes some of the main characteristics of these systems.
National assessment systems generally have two primary roles, (a) a diagnostic and action role: to provide inputs to specific audiences (education authorities, school directors, teachers, parents) for diagnostic and policy refondcorrection purposes; and (b) an accountability role: to create accountability mechanisms for education authorities, schools and teacher^.^' To a lesser extent, some national systems also have a formal student accreditation role in which assessments are used to award certificates or diplomas to students based on their performance. The primary role of the Central American national educational assessment systems i s diagnostic rather than accountability. This focus on diagnosis presents both positive and negative implications that are discussed in other research.51
The different roles of national assessment systems necessitate distinct assessment design and dissemination practices. For diagnostic purposes, teachers should be provided with detailed and accurate information on their teaching practices and their students’ learning outcomes. For accountability purposes, information should be available to a wider
50 This dual objective i s also developed in Ravela (2002). 51 See Ravela (2002) for a discusion along these lines. Essentially, the argument i s that the diagnostic role of national assessment systems i s very useful and should be the primary objective o f an assessment system but, without accountability for results, there i s no security that the diagnostic w i l l trigger changes. On the other hand, using the assessment system to evaluate schools and teachers in a “strong way”, creating clear accountability, could be seen as a threat and de-naturalize the primary objective of the evaluation.
47
audience and should be linked to clearly defined repercussions (awards and/or sanctions) used to promote behavioral changes in specific groups o f actors.
Heterogeneity across systems. While all four o f the countries covered b y this study have national assessment systems, their institutional history and integration differ considerably. El Salvador and Costa Rica have systems that date to the late 1980s/early 1990s and have evaluation departments ful ly integrated within their ministries o f education. Nicaragua, Honduras and Guatemala have begun national assessment more recently and have lower levels o f institutional i n t e g r a t i ~ n . ~ ~
Standardized testing. All countries undertake standardized testing at different levels o f the educational cycle (see Chapter I, Table 1.3 for more details) and accompany these assessments with analyses o f school, teacher, and background characteristics that are associated with higher and lower achievement. The implementation o f standardized testing for assessment purposes i s a major development in Central America in the past decade.
Lack of dissemination. Despite recent advances in standardized testing, a weak point of al l the countries' assessment systems i s the insufficient dissemination o f results on both tests and associated learning determinants. Limited dissemination greatly limits the possibility o f these assessments having an impact on educational quality (as also shown in the last column o f the table). In particular, i t i s striking that even in Honduras, where building accountability i s among the chief objectives o f the assessment system, results have not been widely disseminated. Typically, a l imited number o f reports are printed and the report i s posted on the Internet, but that i s the extent o f dissemination. Perhaps most importantly, the results o f the tests are not fu l ly and systematically shared with the schools that took part in the testing in most countries.
Misalignment with curricula and standards. There is also a lack o f timely alignment between tests, standards, texts and curriculum that characterizes the education systems in Central America. This, again, limits the potential o f national assessment to contribute to improvements in teaching practices, curricula, and teacher motivation. Tests are often adjusted only much after curricular changes or changes in standards have been introduced, limiting their effectiveness in providing feedback. An example i s El Salvador, where tests are s t i l l not ful ly reflecting the new standards introduced in 2000.53 The situation in Honduras i s similar.
Potential for regional collaboration. Up until recently, educational standards differed across each o f the Central American countries. N o w that regional Central American standards have been developed at both the primary and secondary level, there i s a possibility o f developing a regional assessment and/or accreditation system that could
52 A current debate is, for instance, under way on the sustainability of the UMCE in Honduras. The feasibility of creating a specialized institution with i t s own legal framework, organization and responsibilities i s under analysis, as i s the one o f fully absorbing UMCE within the structure of the MINED. j3 See Rapalo (2004).
48

greatly expand the potential impact o f as~essment.~~ Regional accreditation systems could even be used to facilitate students' movement across studies for educational oppor tun i t ie~.~~ The costs and benefits o f these different possibilities should be assessed.
In sum, while there have been major strides in the creation of national testing, assessment, and evaluation systems in the past decade or two, these systems for the most part lack sufficient institutionalization and as of yet have only had a limited impact on improving the quality of education and learning in Central America.56 With support, these evaluation and assessment systems w i l l become a basis for identifying challenges and improving education. In confronting barriers to learning, Central American nations should seriously address the need for more and better assessment.
II. Existing Evidence on Determinants of Learning in Central America
The following section explores some o f the most important factors contributing to student learning. For this section, a review of studies of factors associated with student achievement in Central America (including those mentioned above conducted by national assessment systems) was performed.57 Findings from these studies were compared across countries and compared to Latin American and other international meta-analyses o f such education production function ~tudies.~' In this section we discuss the main factors that were found to limit or enhance student learning in the region and offer some diagnostic information on each.
First, however, a few caveats are necessary. The findings from these Central American studies are not conclusive; there are a number o f limitations to and weaknesses of education production function studies, particularly in developing countries. One such example i s that education production function analyses face substantial methodological limitations, which are particularly well illustrated in a recent article o f Glewwe (2002).59
Secondly, these studies look at how different factors are related to student achievement on standardized exams, but standardized exams are themselves an incomplete and arguably, problematic, measure o f learning and education quality. Using test scores as a proxy for learning outcomes i s a common practice, but many researchers and theorists
54 A Central American Assessment Institute i s currently under discussion. 55 A system o f education title equivalence i s already being coordinated by the CECC for Central America, but this effort would be greatly facilitated if county standards were more aligned on regional standards
See PREAL (2003) for a similar conclusion. 57 See Umansky (2004).
Comparison studies included Fuller and Clarke, 1994; Hanushek, 1995; and Velez, Shiefelbein and Valenzuela, 1994 as well as the Latin American Laboratory UNESCOLLECE, 2000. 59 We wi l l not review these limitations here, but maybe the most important one i s related to the many variables that can affect learning and are not observed by the analyst. I f some o f these variables are correlated with some o f the included variables, the impact o f the included variables may be biased and inaccurate. Several methodological remedies have been proposed to address this issue, but none completely resolves the problem. In particular, student, family and community background variables are often insufficiently controlled leading to over or under-estimations o f the impact o f school-related factors. Additionally, there are school-related factors such as teachers' motivation, characteristics o f teaching practices and directors' leadership that are typically not well captured in these types o f studies.
49

argue that i t may be incomplete, inaccurate, and unreliable as a proxy. A test measures only very limited areas o f knowledge being a sample o f certain areas o f learning which in turn only comprise certain areas o f educational outcomes. Objectives for educational outcomes are much broader, comprising not only wide subject matter knowledge, but also social, emotional, creative, physical, and intellectual development. Tests have also been found to be vulnerable to corruption, inflation, and measurement error.6o
Lastly, the studies undertaken on each o f the countries under analysis differ substantially in the quality o f their assessment. The El Salvador study uses more than one method o f multiple regression to triangulate findings for example, while the Nicaragua study relies only on Pearson Correlation o f a very limited number o f variables without controls.61 Nonetheless, the studies provide initial evidence on the importance o f student background, teacher, curricular/pedagogical, and school management factors which are developed in this section.
A. STUDENT BACKGROUND CONSTRAINTS TO LEARNING IN CENTRAL AMERICA
Student background constraints to learning have been recognized as critical barriers to educational effectiveness for several decades by policy-makers and academics, and since time immemorial by teachers and principals. The seminal work, A Nution ut Risk, turned researchers' and policymakers' attention to the fact that students' families, communities, and backgrounds played decisive roles in students' educational outcomes. Studies in Central America corroborate these findings. Children from poor, ethnic minorities, and less educated families and communities all tend to do significantly poorer on exams than their more advantaged fellow students.
Table 2.1 below provides some initial evidence on demand-side constraints to learning. The table synthesizes the findings o f the recent Central American education production function studies, discussed above, in terms o f how student, family, and community- related characteristics impact and are related to learning. In al l studies learning was measured by student achievement on standardized exams given at the primary level. The table also presents the findings from UNESCO's regional Lat in American Laboratory study as a point of comparison. While not investigated in these studies, many o f these same background factors have been linked to secondary school learning achievement, as well as to other educational indicators such as enrollment, entry-age and attainment.
6o These and other critiques of the use o f test scores as a primary means o f measuring learning are raised i n papers such as Murnane and Cohen (1986), Koretz (2002), Kane & Staiger (2001), and Jacob & Levitt (2002). 61 See Umansky (2004).
50

merica an
9 I Familv recommendations for out of school I 1 E I time
Student Characteristics
2 3
Understands little 1 G Perceives favorable learning environment** 0 Pos
51
Notably, there i s more consistency in the findings regarding these student background determinants o f learning than for any other group o f determinants (teacher, school, pedagogy, etc) underscoring that student background has particularly strong and clear effects on learning. The table shows that both student's family and community characteristics as wel l as personal attributes impact learning. In the area o f family and community background characteristics there are clear economic, social, and cultural constraints to learning.
Students from poorer backgrounds have inferior performance on exams. The economic factors show that at the family, community, and even state level, lower income and increased poverty are associated with inferior test results. There are multiple reasons for this. Poor families are more l ikely to lack basic resources that help children learn. Lack o f a clean, quiet, well-lighted space at home prevents children from doing their homework effectively. Poverty frequently results in malnutrition and hunger, which affect children's mental capacity, concentration, and interest in school. A recent study b y the Pan-American Health Organization reports dangerously high levels o f severe F o w t h retardation in first-graders in Central America due to chronic malnutrition.6 Poor students are more l ikely to suffer psychologically at school if they are teased because of their tattered uniform or castigated for not paying voluntary school fees.
Parental education level and literacy are strongly related to student achievement. In all four countries measures o f parental literacy and education are positively related to student outcomes. Educated, literate parents can help their children with homework and explain academic questions and doubts more easily than non-educated or illiterate parents. The cultural capital (values, vocabulary, knowledge, etc) o f parents is much more l ikely to be harmonious with the cultural capital taught in schools if a student's parents were also educated in schools. This shared culture makes it much easier for children to learn because they have to learn one way o f l i fe rather than two. Parents who did not attend school are more l ikely to have very different practices and values than those the chi ld experiences in school, a situation which makes adapting and learning the ways o f either system more difficult.63 Finally, educated and literate parents are much more l ikely to feel comfortable talking wi th teachers and principals about how their chi ld i s doing and working with them to support their child's learning than parents who, not educated themselves, feel uncomfortable or unwelcome in schools.
Social and cultural characteristics also influence learning. Several o f the factors examined in the Central American and UNESCO studies find that social and cultural attributes and practices of families and communities are also related to educational achievement in predictable ways. Whether families have computers, and the number o f books and overall belongings at home appear to be positively related to achievement in studies in El Salvador and Guatemala (although these factors are not statistically significant in all studies). Relatedly, UNESCO finds that parents that read to their children tend to have children with higher test score results. Ethnicity also seems to be
62 From PAHO (2004). Severe growth retardation i s shown to be particularly acute in Honduras (15.2 percent) and Guatemala (14.5 percent) and less so in El Salvador (3.1 percent). 63 See the work of Pierre Bourdieu on cultural capital.
52
important. Studies for Guatemala and Honduras indicate that students who speak an indigenous or non-Spanish language or who live in areas where more people do not speak Spanish tend to do poorer on exams. Recent studies o f indigenous poverty in the Americas also corroborates that once controlling for other background factors, indigenous students are less likely to be enrolled in
These background characteristics not only create barriers to learning but also may relate to decreased demand for quality schooling. Many if not all o f these factors create barriers to learning, and, therefore, also barriers to regular attendance, school attainment and completion. I t i s also likely that in addition to creating actual barriers, many o f these family and student background characteristics are associated with decreased demand for schooling (because of lack o f interest in schooling, low relevance of the schooling process or high direct and opportunity costs). Children from poorer families contribute relatively more to family income than those from wealthier families. The opportunity cost of having a child in school i s therefore higher in poor families. Add to this the fact that poor children usually attend lower quality schools further decreases motivation to keep children enrolled, attending, and succeeding in school. Similarly, some indigenous families may have lower demand for quality schooling. I f families do not think the education their child w i l l receive i s relevant to or respectful of their culture, history, and values, they may be less inclined to enroll or support their children in school.
In sum, demand-side constraints are predominantly a barrier to learning for disadvantaged sectors of the population. All o f these findings regarding how background characteristics affect learning point to a fundamental conclusion: demand- side barriers to learning almost exclusively relate to marginalized segments of the population. I t i s important to note that this does not mean that in all cases it i s the students' families or communities that need to change to improve their children's learning. In some instances this may be true; for example, malnutrition i s a terrible and avoidable constraint to learning. In other cases the opposite may be true. Indigenous students may have a harder time succeeding in school, and an appropriate policy response i s not to strip them of their indigenous identity but rather transform schools such that indigenous students can and do thrive in their studies.
B. TEACHER QUALITY
Teachers are vitally important to education and the learning outcomes of students. This i s intuitively obvious but also increasingly demonstrated in academic s~ho larsh ip .~~ Nonetheless, teacher quality i s by i tself a difficult variable to measure, as are the determinants of teacher quality. I t i s generally considered that teacher quality should include both a teacher's capacity to effectively transmit the curriculum to the students and the will, effort and continuity to do so. The capacity to teach (difficult to measure) i s often considered to be related to the level and quality of the initial education received, the
See various country-specific background papers for the Indigenous People, Poverty, and Human Development in Latin America, 1994-2004 study (World Bank, forthcoming). 65 See, for example, Rivkin, Hanushek, and Kain (1998), Park and Hannum (2003), or Wright, Horn, and Sanders (1997).
53
quality o f the in-service support and training, the existence o f incentives to attract and retain talented and skilled individuals to the teaching profession, and the amount of experience a teacher has in the classroom. Teacher effort and motivation (also difficult to measure) i s frequently found to be related to performance incentives such as evaluation from direct supervision systems, salary bonuses, or hiring and firing authority b y some local actor or actors (such as a parent council).66 Clearly, however, there are other factors that contribute to teaching capacity and teacher effort, many o f which are very difficult to measure or even identify.67
B y and large, findings on the relationships between teacher characteristics and student outcomes in the Central American countries are less clear-cut than in larger meta- analyses. This could be due to data or analysis limitations as discussed above or reflect real contextual differences in these countries, such as particularly l o w quality pre-service or in-service educatiodtraining.
Following the structure o f Table 2.2 we w i l l start by reviewing some basic teachers’ characteristics which influence teaching capacity, and then move on to more complex dimensions, related to incentives, which influence capacity, effort and motivation.
a ) Teacher Capacity: Education, Professional Development, and Experience
i ) Education Level
Teacher education i s the teacher characteristic most consistently related to achievement across the studies under analysis, although this impact is less strong than the one detected in many meta-analyses. The weaker impact o f teacher education in Central America may not mean that teacher education does not matter but rather i t may point to l ow quality teacher preparation in the region, or teacher education that does not adequately prepare teachers to work with disadvantaged student populations. Relatedly, teacher subject knowledge i s consistently found to be positively related to educational achievement in the Guatemalan and Honduran study as well as in numerous other studies.
66 This last type o f incentives w i l l be more typically associated with decentralized education systems where an increasing role i s given to the creation o f “external” accountability relationships, by empowering parents and providing them with the information needed to enforce accountability. 67 Benabou and Tirole (2003) and Villegas-Reimers and Reimers (1996) write about the intrinsic motivation o f teachers.
54

Table 2.2: Summary Findings on Teacher Related Determinants of Education Quality in Central America and the Latin American Laboratory Study (N = Nicaragua, E = El Salvador, H = Honduras, G = Guatemala)
Not Num’ Of Positive Negative Mixed** Significant Studies UNESCO LLECE
I Basic Teacher Characteristics
1. Education level 3 N G* H Pos
2. Training 1 E NS
3. Bilingual ed training 1 G
5. Age 2 N E
6. Gender (female) 3 N H E
4. Experience 4 H N H, E NS
1. Temporary contract 1 H
2. More than one job worked 1 E
3. Satisfaction with salary 1 E
4. Satisfaction with school 1 E
5. Experience at school 1 E
~~
17. Subject knowledge
Neg Pos
6. Attends adminlpedagogical meetings
7. Absence
1 E
2 H G
8. Mid-year turnover
I Teacher PerceDtions I 1 H
1 E 1. Attributes student performance to student skills/interest Pos
2. Attributes student performance to family conditions/SES
3. Attributes student performance to teaching & ed. opportunity
4. Prognosis of student success
1 G* Neg
1 G* NS
1 E
Further data on teacher education i s provided in Annex V. Table 5.1 in Annex V provides an institutional description of pre-service and in-service teacher training, which can help us understand the structure, requirements and contents of teacher education programs in
5. Values multiculturalism
55
1 G
6. Positive classroom climate 1 E
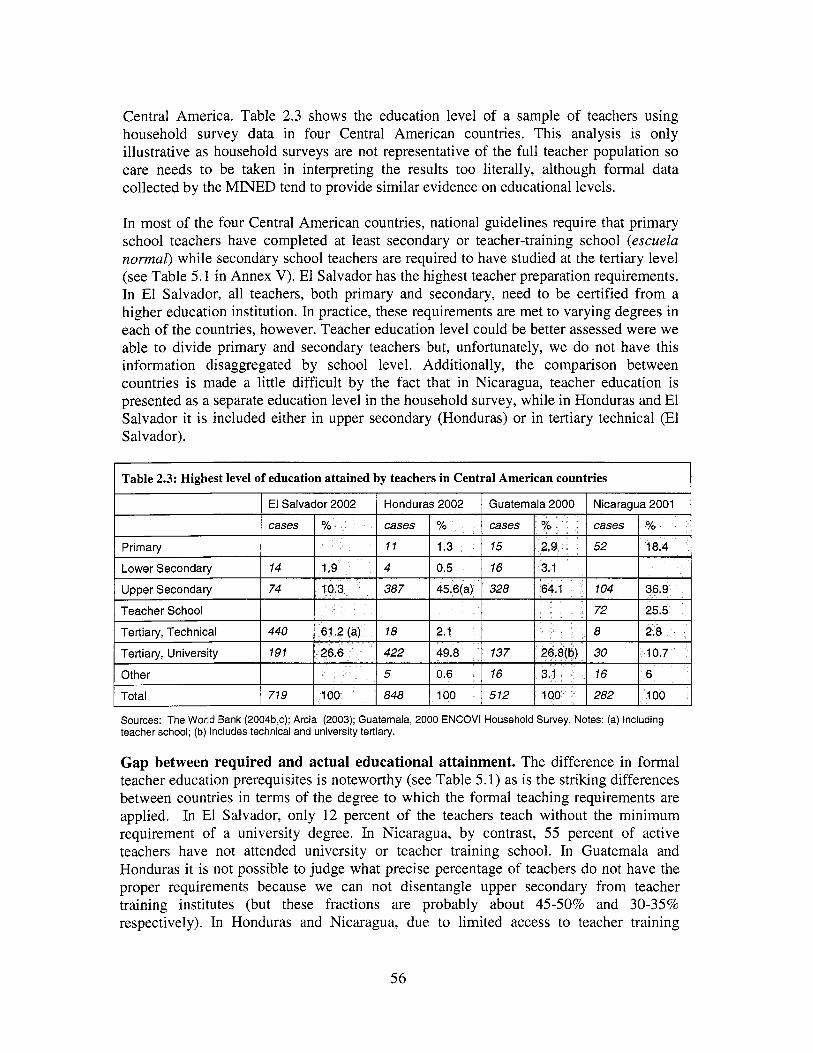
Central America. Table 2.3 shows the education level o f a sample o f teachers using household survey data in four Central American countries. This analysis i s only illustrative as household surveys are not representative o f the full teacher population so care needs to be taken in interpreting the results too literally, although formal data collected b y the MINED tend to provide similar evidence on educational levels.
In most o f the four Central American countries, national guidelines require that primary school teachers have completed at least secondary or teacher-training school (escuela normal) while secondary school teachers are required to have studied at the tertiary level (see Table 5.1 in Annex V). El Salvador has the highest teacher preparation requirements. In El Salvador, all teachers, both primary and secondary, need to be certified f rom a higher education institution. In practice, these requirements are met to varying degrees in each of the countries, however. Teacher education level could be better assessed were we able to divide primary and secondary teachers but, unfortunately, we do not have this information disaggregated by school level. Additionally, the comparison between countries i s made a l i t t le difficult by the fact that in Nicaragua, teacher education is presented as a separate education level in the household survey, while in Honduras and El Salvador i t i s included either in upper secondary (Honduras) or in tertiary technical (El Salvador).
F a b l e 2.3: Highest level of education attained by teachers in Central American countries I
Sources: The World Bank (2004b,c); Arcia (2003); Guatemala, 2000 ENCOVI Household Survey. Notes: (a) Including teacher school; (b) Includes technical and university tertiary.
Gap between required and actual educational attainment. The difference in formal teacher education prerequisites i s noteworthy (see Table 5.1) as i s the striking differences between countries in terms o f the degree to which the formal teaching requirements are applied. In El Salvador, only 12 percent o f the teachers teach without the minimum requirement of a university degree. In Nicaragua, by contrast, 55 percent o f active teachers have not attended university or teacher training school. In Guatemala and Honduras i t i s not possible to judge what precise percentage o f teachers do not have the proper requirements because we can not disentangle upper secondary from teacher training institutes (but these fractions are probably about 45-50% and 30-35% respectively). In Honduras and Nicaragua, due to l imited access to teacher training
56
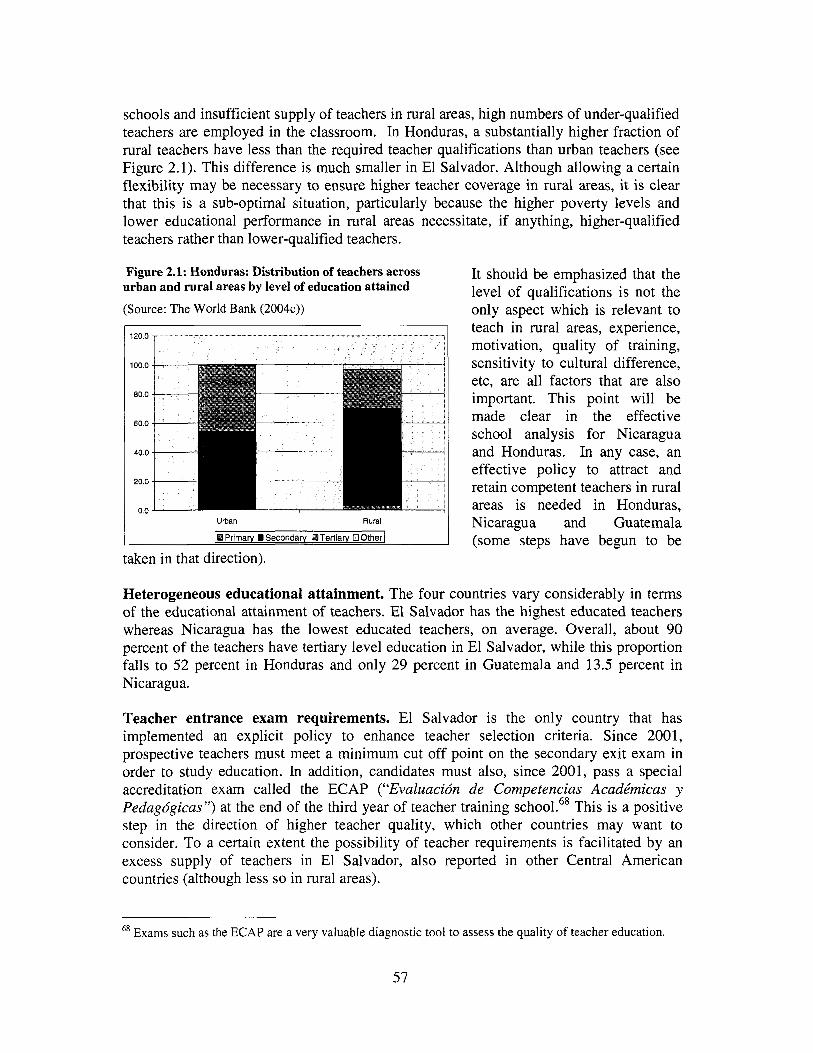
schools and insufficient supply o f teachers in rural areas, high numbers of under-qualified teachers are employed in the classroom. In Honduras, a substantially higher fraction o f rural teachers have less than the required teacher qualifications than urban teachers (see Figure 2.1). This difference i s much smaller in El Salvador. Although allowing a certain flexibility may be necessary to ensure higher teacher coverage in rural areas, it i s clear that this i s a sub-optimal situation, particularly because the higher poverty levels and lower educational performance in rural areas necessitate, if anything, higher-qualified teachers rather than lower-qualified teachers.
Figure 2.1: Honduras: Distribution of teachers across urban and rural areas by level of education attained
(Source: The World Bank (2004~))
1200 1 I
I t should be emphasized that the level o f qualifications is not the only aspect which is relevant to teach in rural areas, experience, motivation, quality o f training, sensitivity to cultural difference, etc, are all factors that are also important. This point w i l l be made clear in the effective school analysis for Nicaragua and Honduras. In any case, an effective pol icy to attract and retain competent teachers in rural areas is needed in Honduras, Nicaragua and Guatemala (some steps have begun to be
taken in that direction).
Heterogeneous educational attainment. The four countries vary considerably in terms of the educational attainment o f teachers. El Salvador has the highest educated teachers whereas Nicaragua has the lowest educated teachers, on average. Overall, about 90 percent of the teachers have tertiary level education in El Salvador, while this proportion falls to 52 percent in Honduras and only 29 percent in Guatemala and 13.5 percent in Nicaragua.
Teacher entrance exam requirements. El Salvador i s the only country that has implemented an explicit policy to enhance teacher selection criteria. Since 2001, prospective teachers must meet a minimum cut o f f point on the secondary exit exam in order to study education. In addition, candidates must also, since 2001, pass a special accreditation exam called the ECAP (“Evaluacidn de Competencias Acadkmicas y Pedagdgicas”) at the end o f the third year o f teacher training This i s a positive step in the direction o f higher teacher quality, which other countries may want to consider. T o a certain extent the possibility o f teacher requirements is facilitated by an excess supply o f teachers in El Salvador, also reported in other Central American countries (although less so in rural areas).
Exams such as the ECAP are a very valuable diagnostic tool to assess the quality o f teacher education.
57
Low quality of teacher education. For the most part, teacher preparation i s o f very low quality in Central America. In El Salvador, where as we have seen, teachers are arguable better prepared than the other countries, only about 40 percent o f eligible students passed the ECAP exam in 2001. Similarly, in Guatemala, results o f the achievement tests o f teacher-training students in teacher training institutions carried out in 2000 b y the PRONERE program show that the mean test scores obtained b y students were only 28.5 for math and 54.3 for reading, out o f a possible 100 points, another indication o f the low effectiveness o f teacher training.69 The quality and relevance o f teacher education in the region i s an extremely important challenge to confront.
Disconnect between national teacher needs and teacher education. A gap between demand and supply o f teacher specializations frequently leads to teachers working in positions they were not prepared for and can further diminish teaching quality. In El Salvador, in the schools/universities where teachers are formed, a number o f specialties are available: pre-primary education, primary education, and several different areas o f secondary education. There i s evidence that there i s a certain discrepancy between demand and supply in terms o f the specializations pursued both with respect to the educational level considered and to the specific subject^.^' Pre-primary (26 percent) and social sciences (1 8 percent) appear to prevail, while primary education (8 percent) and secondary education (7 percent) are less sought after. In Guatemala, teacher education at the teacher school level has 12 different programs; the most attended being urban primary teacher education (60 percent), followed by pre-primary (14 percent), and rural primary (7 percent).71 I t i s striking that such a low share o f teachers gets trained in rural primary (which includes special training in multi-grade and bilingual teaching) in a country where 66 percent o f the primary enrollment i s in rural areas.72 This could possibly explain why teacher education has an ambiguous impact in Guatemala.
i i ) On-going Professional Development (or In-service Training)
Teacher training i s another variable that has been traditionally analyzed in educational achievement studies. I t was also tested in three o f the studies under analysis (see Table 2.2). The mixed evidence concerning in-service training and student achievement found in the meta-analyses i s confirmed in the Central American context. In-service professional development i s generally o f very spotty quality in much o f the developing world, a fact that may account for its mixed and non-significant effects.
Overall, on-going professional development seems to have improved in all Central American countries over the last decade. Box 2.1 summarizes some characteristics o f teacher training in al l countries. In particular, the systems have become more structured, while at the same time also being more flexible and decentralized to increase their responsiveness to different training needs. Flexibility refers, for instance, to the offer o f in-site and distance education programs. Decentralization o f professional development to
69 See Guatemala GC. ‘O See, notably, PREAL (2002a).
See The World Bank (2004a). ’* This point i s also taken by PREAL (2003).
58

regional and local bodies, school-based delivery, and teacher reflective practice grou s and teacher centers have been a main thrust o f in-service training in recent years . Increasingly, professional development has also focused more on participatory methodologies and classroom innovation. In-service professional development i s being actively used in Honduras and Nicaragua to provide certification and critical skills to teachers that lack teacher preparation requirements (ducentes empiricos).
p3
icular interest are the
Notwithstanding these positive developments, there are s t i l l a number o f challenges ahead to improve the relevance and quality of these training programs. In particular, i t i s generally highlighted that: (a) too l i t t le effort i s put on changinghpdating classroom
73 A l ittle less so in Honduras where teacher training i s s t i l l quite centralized.
59

practices; (b) too little attention i s paid to non-standard education contexts (multi-cultural environments, rural areas, etc); (c) too few formal evaluations exist o f the effectiveness o f professional development programs; (d) there i s a lack o f follow-up on trained teachers to see if they are applying what they have learnt in the classroom; and (e) in some o f the countries, training implies missing substantial time from the classroom, leaving children without their primary teacher.74
Other variables, in particular teacher experience, are frequently put forward as determinants o f teaching quality and student educational achievement. However, although teacher experience i s normally found to be positively related to learning in international studies, i t s impact appears to be insignificant or, at best, mixed in the context o f the Central American studies (although it i s a significant difference between high- and low-performing low-income schools in Nicaragua as w i l l be discussed below). This seems to indicate that, at least for the average school, experience is less relevant to student learning than teacher qualifications and motivation. Why teacher experience does not appear to be more important in Central America requires future research.
b) Teacher Effort and Motivation: Incentives to Perform
i ) Teacher efSort
Typically, unobserved variables in educational achievement studies are teacher effort and motivation, although education production studies sometimes attempt to measure them b y measuring teacher effective working hours and absences, the level o f teacher satisfaction with the job, or teachers’ perceptions on student success. Two Central American studies attempt to measure teachers’ absences and one measures teacher satisfaction wi th the school, and results are generally non-significant (with one noticeable exception being that, as predictable, teachers’ absence in Honduras is negatively related to student achievement). The general lack of significant findings may be due to possible measurement errors or to the fact that teachers’ absences or satisfaction with the school fa i l to adequately proxy for teacher effort and motivation. Teachers’ perceptions on student success are more systematically related to student achievement, although it i s difficult to establish a causal relationship.
Where do Central American countries stand in terms o f teacher effort as measured by effective teaching hours and teachers’ absences? Overall, no national reliable data are available, making i t necessary to use information coming from small databases, self- reporting, and household surveys (see Table 2.4).75
74 See, for instance, PREAL (2003). 75 This data should not be interpreted too literally as i t i s subject to measurement error. For instance, al l the surveys collect self-reported estimates of number o f absences and, often, corroborate this data with the schools’ registers. Nonetheless, it i s very likely that only excused absences are declared or reported, which most likely underestimates actual teachers’ absences. Additionally, we generally do not have comparable indicators across countries as we had for other variables.
60
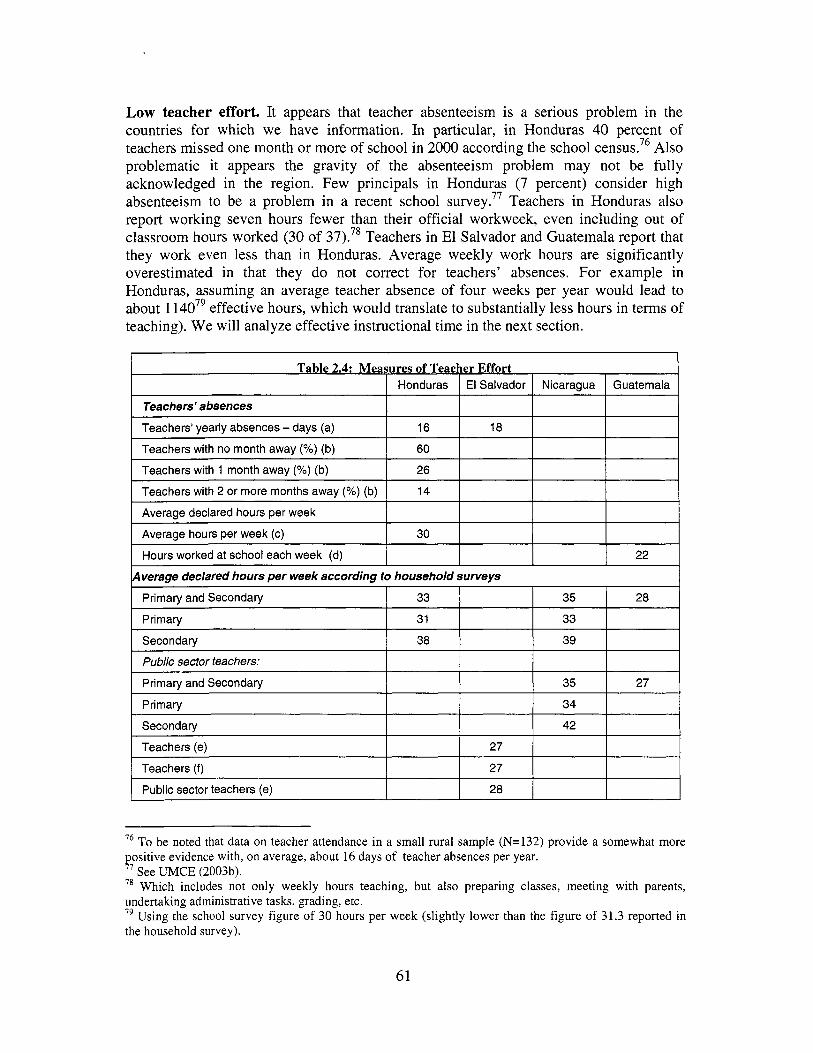
Low teacher effort. I t appears that teacher absenteeism i s a serious problem in the countries for which we have information. In particular, in Honduras 40 percent of teachers missed one month or more of school in 2000 according the school census.76 Also problematic i t appears the gravity of the absenteeism problem may not be fully acknowledged in the region. Few principals in Honduras (7 percent) consider high absenteeism to be a problem in a recent school survey.77 Teachers in Honduras also report working seven hours fewer than their official workweek, even including out o f classroom hours worked (30 o f 37).78 Teachers in El Salvador and Guatemala report that they work even less than in Honduras. Average weekly work hours are significantly overestimated in that they do not correct for teachers’ absences. For example in Honduras, assuming an average teacher absence of four weeks per year would lead to about 1 1407’ effective hours, which would translate to substantially less hours in terms o f teaching). We wi l l analyze effective instructional time in the next section.
Honduras El Salvador
Teachers’ absences
Nicaragua Guatemala
Teachers’ yearly absences - days (a)
Teachers with no month away (%) (b) Teachers with 1 month away (YO) (b)
I Teachers with 2 or more months away (Yo) (b) I 14 I I I I
16 18
60
26
~
Average declared hours per week
Average hours per week (c)
I Hours worked at school each week (d) I I I I 22 I
~~ ~
30
Teachers (e)
Teachers (f)
Public sector teachers (e)
76 To be noted that data on teacher attendance in a small rural sample (N=l32) provide a somewhat more positive evidence with, on average, about 16 days o f teacher absences per year. 77 See UMCE (2003b). 78 Which includes not only weekly hours teaching, but also preparing classes, meeting with parents, undertaking administrative tasks, grading, etc. 79 Using the school survey figure o f 30 hours per week (slightly lower than the figure of 31.3 reported in the household survey).
27
27
28
61
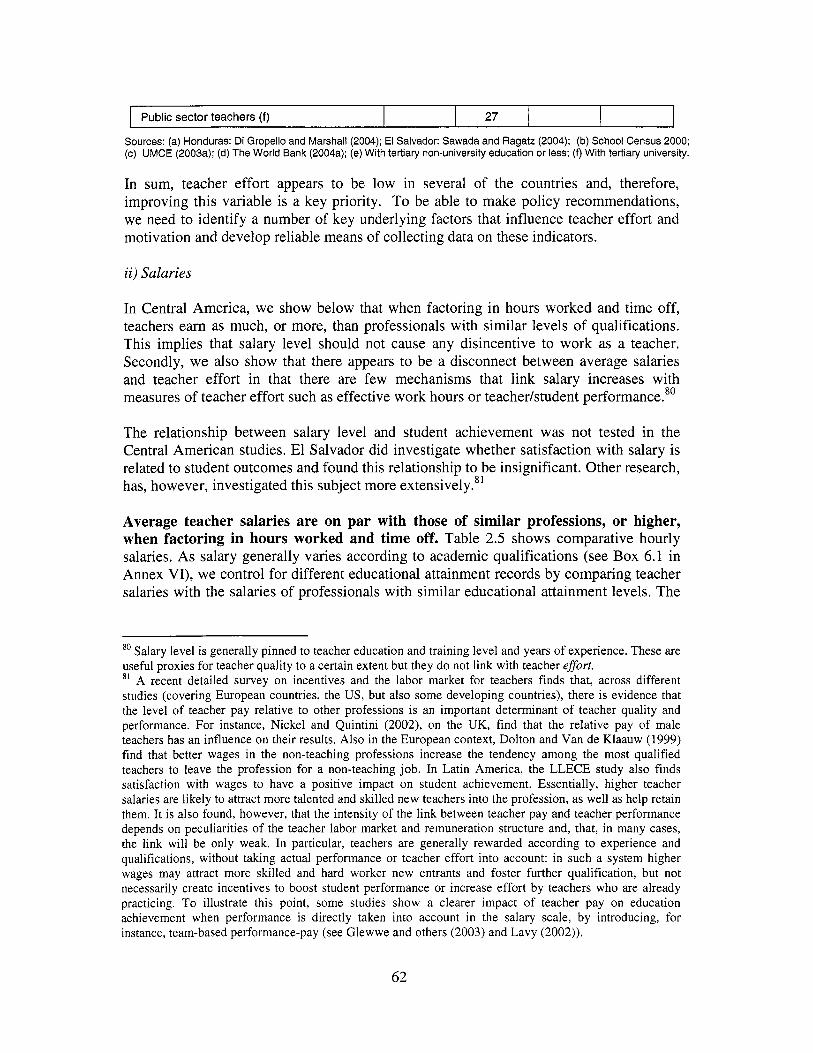
Public sector teachers (f)
In sum, teacher effort appears to be low in several o f the countries and, therefore, improving this variable i s a key priority. T o be able to make policy recommendations, we need to identify a number o f key underlying factors that influence teacher effort and motivation and develop reliable means o f collecting data on these indicators.
27
i i ) Salaries
In Central America, we show below that when factoring in hours worked and time off, teachers earn as much, or more, than professionals with similar levels o f qualifications. This implies that salary level should not cause any disincentive to work as a teacher. Secondly, we also show that there appears to be a disconnect between average salaries and teacher effort in that there are few mechanisms that link salary increases with measures o f teacher effort such as effective work hours or teacherhtudent performance.80
The relationship between salary level and student achievement was not tested in the Central American studies. El Salvador did investigate whether satisfaction wi th salary i s related to student outcomes and found this relationship to be insignificant. Other research, has, however, investigated this subject more extensively.81
Average teacher salaries are on par with those of similar professions, or higher, when factoring in hours worked and time off. Table 2.5 shows comparative hourly salaries. As salary generally varies according to academic qualifications (see Box 6.1 in Annex VI), we control for different educational attainment records b y comparing teacher salaries with the salaries o f professionals with similar educational attainment levels. The
8o Salary level i s generally pinned to teacher education and training level and years o f experience. These are useful proxies for teacher quality to a certain extent but they do not link with teacher effort. 81 A recent detailed survey on incentives and the labor market for teachers finds that, across different studies (covering European countries, the US, but also some developing countries), there i s evidence that the level o f teacher pay relative to other professions i s an important determinant o f teacher quality and performance. For instance, Nickel and Quintini (2002), on the UK, find that the relative pay o f male teachers has an influence on their results. Also in the European context, Dolton and Van de Klaauw (1999) find that better wages in the non-teaching professions increase the tendency among the most qualified teachers to leave the profession for a non-teaching job. In Latin America, the LLECE study also finds satisfaction with wages to have a positive impact on student achievement. Essentially, higher teacher salaries are likely to attract more talented and skilled new teachers into the profession, as well as help retain them. I t i s also found, however, that the intensity o f the link between teacher pay and teacher performance depends on peculiarities o f the teacher labor market and remuneration structure and, that, in many cases, the link wi l l be only weak. In particular, teachers are generally rewarded according to experience and qualifications, without taking actual performance or teacher effort into account: in such a system higher wages may attract more skilled and hard worker new entrants and foster further qualification, but not necessarily create incentives to boost student performance or increase effort by teachers who are already practicing. To illustrate this point, some studies show a clearer impact o f teacher pay on education achievement when performance i s directly taken into account i n the salary scale, by introducing, for instance, team-based performance-pay (see Glewwe and others (2003) and Lavy (2002)).
62
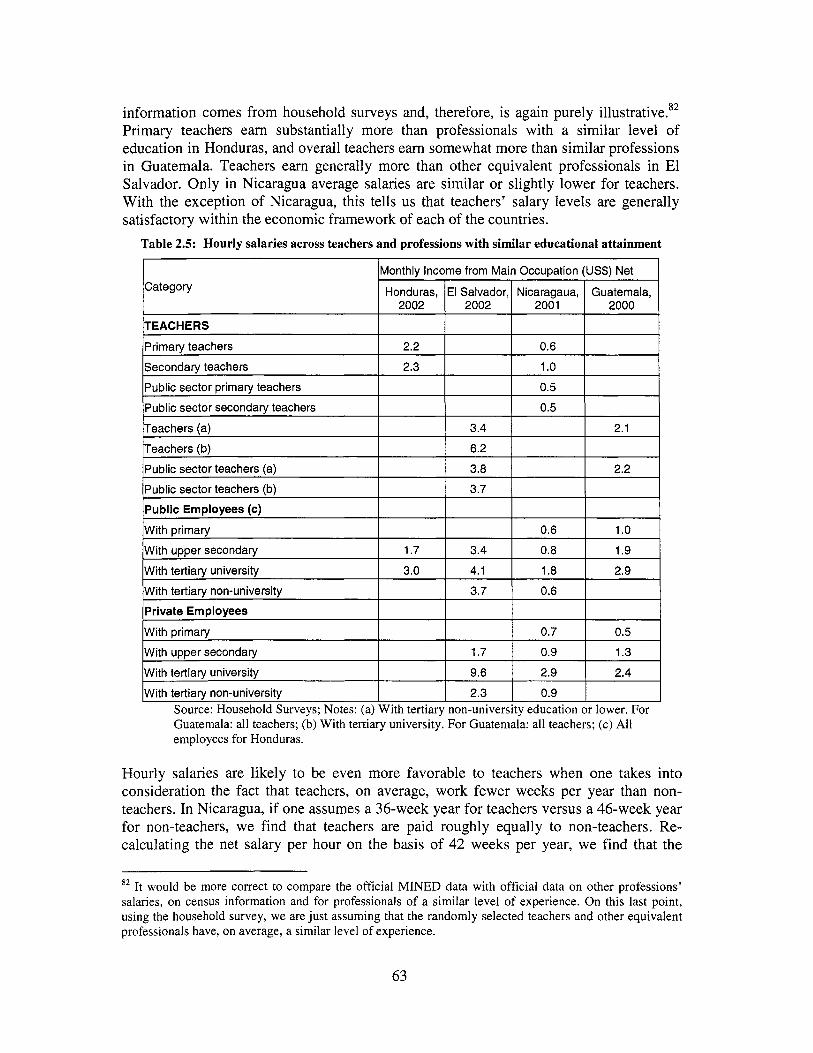
information comes from household surveys and, therefore, i s again purely illustrative.82 Primary teachers earn substantially more than professionals with a similar level o f education in Honduras, and overall teachers earn somewhat more than similar professions in Guatemala. Teachers earn generally more than other equivalent professionals in El Salvador. Only in Nicaragua average salaries are similar or slightly lower for teachers. With the exception o f Nicaragua, this tells us that teachers’ salary levels are generally satisfactory within the economic framework of each o f the countries.
Table 2.5: Hourly salaries across teachers and professions with similar educational attainment
Honduras, 2002
Category El Salvador, Nicaragaua, Guatemala, 2002 2001 2000
Primary teachers
Secondary teachers
Public sector primary teachers
Public sector secondarv teachers
ITEACHERS I I I I I 2.2 0.6
2.3 1 .o 0.5
0.5
With upper secondary
With tertiary university
With tertiary non-university
ITeachers (a) I I 3.4 I I 2.1 I
1.7 0.9 1.3
9.6 2.9 2.4
2.3 0.9
Hourly salaries are l ikely to be even more favorable to teachers when one takes into consideration the fact that teachers, on average, work fewer weeks per year than non- teachers. In Nicaragua, if one assumes a 36-week year for teachers versus a 46-week year for non-teachers, we find that teachers are paid roughly equally to non-teachers. Re- calculating the net salary per hour on the basis o f 42 weeks per year, we find that the
82 I t would be more correct to compare the official MINED data with official data on other professions’ salaries, on census information and for professionals o f a similar level o f experience. On this last point, using the household survey, we are just assuming that the randomly selected teachers and other equivalent professionals have, on average, a similar level o f experience.
63

salary per hour increases in Honduras from US$2.2 to US$2.7. Calculating in teachers’ absences, we find a further increase to US$3.0 per hour, just 10 percent less than public employees with university education (see Table 2.6).
Declared hours: 1628 hours per year (a)
The same pattern o f comparable wages in El Salvador, Honduras83, and Guatemala84 i s true when comparing average monthly, rather than hourly, salaries for teachers and non- teachers. Thus, if teachers in Central America do work fewer hours than non-teachers, i t does not appear to be resulting in significantly lower salaries for teachers in these three countries (Nicaragua has lower monthly salaries, just as it also had generally lower hourly salaries).
Table 2.6: Honduras - Salary per hour for primary teachers
Net salary per hour
2.2
Declared hours: 131 4 hours per year (b)
Effective hours: 1189 effective hours per year (c)
2.7
3.0
Notes: (a) calculated on the basis of the weekly hours reported in the Household Survey and 52 weeks; (b) calculated on the basis of the weekly hours reported in the Household Survey and 42 weeks; (c) hours reported in the Household Survey adjusted assuming an average teacher absence of 4 weeks per year.
1991 -92
Disconnect between salaries and teacher effort. Teachers in Honduras (1997), El Salvador85 (1995), and Guatemala (1996) all benefited from recent increases in the level of real salaries. In most cases, these salary adjustments followed periods o f declines in real teacher salaries. Stagnant indicators such as l ow test scores (see Chapter I), high teacher absenteeism, and stagnant or even decreasing hours worked, do not suggest any obvious improvements in teacher quality generated from these salary improvements. At the same time there are sure to be many factors that contribute to stagnation in teacher work hours, absenteeism, and testing outcomes that may be entirely independent o f salary level. Furthermore, increases in salary levels may have resulted in positive changes not captured in these indicators or there may be a lag period before positive changes are evident.
1992=100 Private Public Private Public Private Public Private Public
100.00 1,704.10 1,614.58 1,704.10 1,614.58 ----- -____ _ _ _ _ _ ____-
Table 2.7: El Salvador- Evolution of real salaries for public and private teachers
I IPC I Nominal Salaries I Real Salary I worked per I Hourly real wage
I 1995 I 142.91 I 1,459.36 I 2,132.43 1 1,021.20 I 1,492.19 I 23.43 1 24.75 I 10.90 1 15.07 I
83 I t might seem surprising that after the substantial salary increase that Honduras had since 1997 teacher salaries are just i n line, or even lower, than other salaries. A salary increase was probably justified to fill the gap between teachers and other public employees. 84 Salaries are, however, somewhat lower for secondary teachers in Honduras and public sector teachers with university degrees in El Salvador. 85 The increase compensated for eroded purchasing power in the previous years in Honduras and El Salvador (see The World Bank 2004 b,c).
64
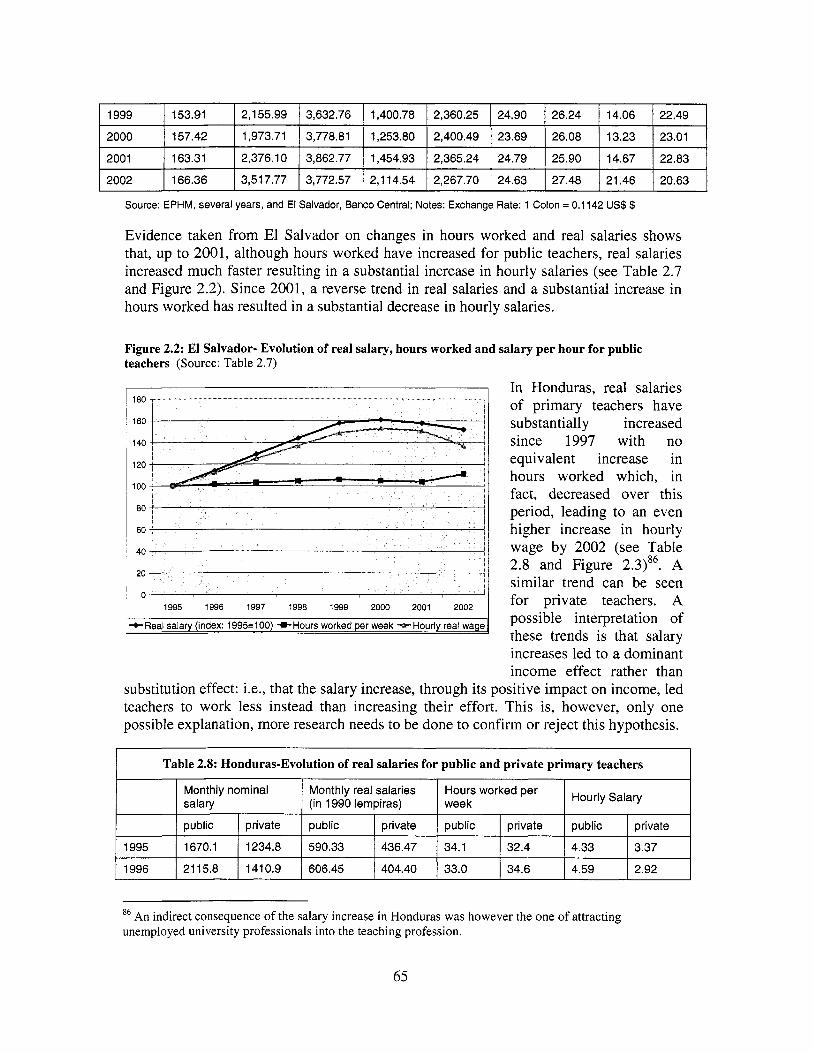
1999 I 153.91 1 2,155.99 I 3,632.76 I 1,400.78 I 2,360.25 I 24.90 1 26.24 I 14.06 1 22.49
2000
2001
2002
157.42 1,973.71 3,778.81 1,253.80 2,400.49 23.69 26.08 13.23 23.01
163.31 2,376.10 3,862.77 1,454.93 2,365.24 24.79 25.90 14.67 22.83
166.36 3,517.77 3,772.57 2,114.54 2,267.70 24.63 27.48 21.46 20.63
Evidence taken from El Salvador on changes in hours worked and real salaries shows that, up to 2001, although hours worked have increased for public teachers, real salaries increased much faster resulting in a substantial increase in hourly salaries (see Table 2.7 and Figure 2.2). Since 2001, a reverse trend in real salaries and a substantial increase in hours worked has resulted in a substantial decrease in hourly salaries.
1995
Figure 2.2: El Salvador- Evolution of real salary, hours worked and salary per hour for public teachers (Source: Table 2.7)
public private public private public private public private
1670.1 1234.8 590.33 436.47 34.1 32.4 4.33 3.37
160
140
120
100
80
60
40
In Honduras, real salaries of primary teachers have substantially increased since 1997 with no equivalent increase in hours worked which, in fact, decreased over this period, leading to an even higher increase in hourly wage b y 2002 (see Table 2.8 and Figure 2.3)86. A similar trend can be seen for private teachers. A possible interpretation of these trends i s that salary increases led to a dominant income effect rather than
substitution effect: Le., that the salary increase, through i t s positive impact on income, led teachers to work less instead than increasing their effort. This is, however, only one possible explanation, more research needs to be done to confirm or reject this hypothesis.
20
0 ~
1995 1996 1997 1998 1999 2000 2001 2002
I t R e a l salary (index: 1995=100) +Hours worked per week -.*-Hourly real wagell
I Table 2.8: Honduras-Evolution of real salaries for public and private primary teachers
Monthly nominal Monthly real salaries Hours worked per Hourly Salary (in 1990 lempiras) 1 week
] 1996 I 2115.8 I 1410.9 I 606.45 1 404.40 1 33.0 I 34.6 I 4.59 I 2.92
86 An indirect consequence o f the salary increase in Honduras was however the one of attracting unemployed university professionals into the teaching profession.
65
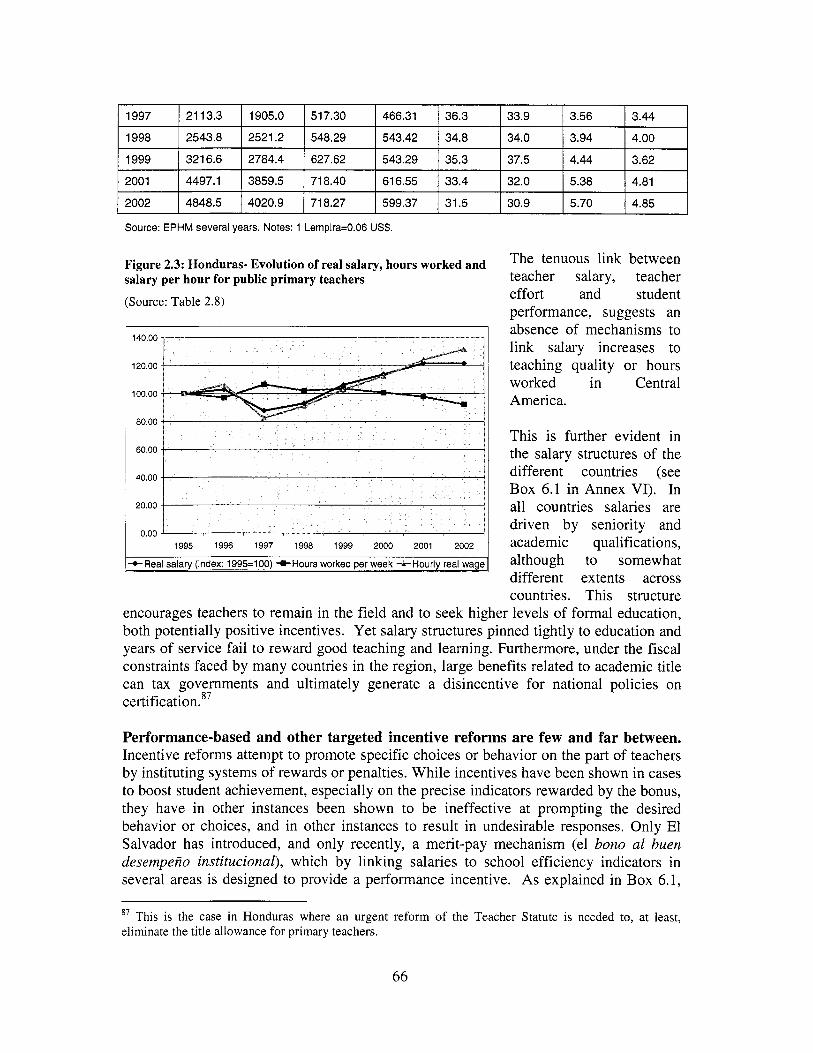
1997 I 2113.3 I 1905.0 I 517.30 466.31 I 36.3 I 33.9 I 3.56 I 3.44
1998
1999
Source: EPHM several years. Notes: 1 Lempira=0.06 US$.
2543.8 2521.2 548.29 543.42 34.8 34.0 3.94 4.00
3216.6 2784.4 627.62 543.29 35.3 37.5 4.44 3.62
Figure 2.3: Honduras- Evolution of real salary, hours worked and salary per hour for public primary teachers
(Source: Table 2.8)
2001
2002
120.00
100.00
80.00
~ 60.00
4497.1 3859.5 718.40 616.55 33.4 32.0 5.38 4.81
4848.5 4020.9 71 8.27 599.37 31.5 30.9 5.70 4.85
1995 1996 1997 1998 1999 2000 2001 2002
l+Real salary (index: 1995400) *Hours worked per week +Hourly real wage I
The tenuous link between teacher salary, teacher effort and student performance, suggests an absence o f mechanisms to link salary increases to teaching quality or hours worked in Central America.
This i s further evident in the salary structures o f the different countries (see Box 6.1 in Annex VI). In all countries salaries are driven b y seniority and academic qualifications, although to somewhat different extents across countries. This structure
encourages teachers to remain in the f ield and to seek higher levels o f formal education, both potentially positive incentives. Yet salary structures pinned tightly to education and years o f service fai l to reward good teaching and learning. Furthermore, under the fiscal constraints faced b y many countries in the region, large benefits related to academic title can tax governments and ultimately generate a disincentive for national policies on ~ e r t i f i c a t i o n . ~ ~
Performance-based and other targeted incentive reforms are few and far between. Incentive reforms attempt to promote specific choices or behavior on the part o f teachers by instituting systems o f rewards or penalties. Whi le incentives have been shown in cases to boost student achievement, especially on the precise indicators rewarded by the bonus, they have in other instances been shown to be ineffective at prompting the desired behavior or choices, and in other instances to result in undesirable responses. Only El Salvador has introduced, and only recently, a merit-pay mechanism (el bono ul bum desempeiio institucionul), which b y linking salaries to school efficiency indicators in several areas i s designed to provide a performance incentive. As explained in Box 6.1,
87 This is the case in Honduras where an urgent re form of the Teacher Statute is needed to, at least, eliminate the tit le allowance for primary teachers.
66
this mechanism works as a monetary incentive for teachers in a school to work together to improve school outputs.88 The effectiveness of this incentive s t i l l needs to be assessed.
Additionally, none of the Central American countries penalize teacher absenteeism nor reward teacher attendance or punctuality. In part, this i s because teacher hours and attendance are difficult to accurately monitor. Also, there i s very l i t t le culture of teacher assessment or accountability in Central America. A possible way to promote teacher effort might be to simply reward the number of hours worked by increasing the value of the hourly wage with the number of hours worked. This would, however, require accurate and reliable means of measuring teacher hours.
A positive development in Central America has been the introduction in El Salvador, Honduras, and Nicaragua (as well as Costa Rica) o f pay incentives for rural or otherwise disadvantaged geographic areas. These incentives are designed to encourage skilled teachers to work in marginalized areas. Notably, Guatemala does not have a similar incentive for i ts rural teachers.
Strong inspection systems, decentralized systems of teacher monitoring, and fixed-term contracts are other types o f measures which could enhance teacher performance but have been less consistently evaluated. Reflecting the weak teacher assessment culture mentioned above, centrally driven inspection systems are generally weak in all countries, with the possible exception of Costa Rica. On the other hand, several Central American countries are moving towards increasingly involving parents and principals in teacher monitoring in an effort to compensate for the lack o f central i n f ~ r m a t i o n . ~ ~ This “indirect” supervision system wi l l be fully evaluated in the chapter on community-based school management. Finally, more flexible contracting options are also increasingly being used within a decentralized framework. This w i l l also be examined in chapter V.
C. PEDAGOGICAL PRACTICES
Learning i s not only about teachers but also, as the education production function literature tries to capture, about what i s taught and how i t i s taught. Teaching strategies, in particular, together with teacher capacity and effort, w i l l ultimately influence the way curriculum i s transmitted to students. In general, Central American countries have nationally determined curricula, with limited regional differentiation. In contrast, teaching strategies are developed fairly autonomously by teachers. Teaching strategies, and to some extent curricula, can also differ according to the context in which they are applied. In particular, rural areas may require different strategies than urban ones, indigenous populations may have particular needs that traditional curricula and teaching strategies cannot address, and students who fall behind may require special teaching strategies to catch up with other students.
88 This incentive i s similar to Chile’s SNED (Sistema Nacional de Evuluucibn de Docentes) although student scores are not directly taken into account. 89 This i s the “asymmetric information” rationale for decentralization.
67

The lack o f common indicators o f pedagogical practices between studies and the difficulties in measuring these practices in the first place make i t difficult to discern clear trends (see Table 2.9 below). The meta-analyses reviewed do not find clear patterns o f significance either, perhaps for the same reasons. An exception to this i s that frequency o f homework, length o f instructional time, curriculum coverage and use o f active pedagogies seem to have, overall, a positive impact on achievement. Pedagogical variables may also have an impact on repetition and grade failure, independent o f educational achievement measured b y test scores.
1. Text use
2. Homework frequency
Table 2.9: Summary Findings of Pedagogical and Curriculum Related Determinants of Education Quality in Central America and the Latin American Laboratory Study (N=Nicaragua, E = El Salvador, H = Honduras. G = Guatemala)
1 H
2 H, G
UNESCO Num Of Positive Negative Mixed Significant 1 Studies 1 1 1 Not 1 LLECE
~
4. Teacher explains and asks questions 1 H
5. Research-based teaching 1 E
I Pedaaomf I I I I I I
7. Traditional methods
8. Use of pedagogical supplies
1 E
1 E
1 3. Blackboard use 1 1 I H l I I I
10. School has education project
Curricula
1 E
1 6. Participative methods I 3 I H ,G I I I E l
2. On schedule with curriculum
3. Bilingual curriculum
2 E, H
1 G
I 9. School-wide pedagogy 1 1 1 E l I I I
I I. Curriculum type I l l I I I E l
All the countries o f the region implemented far-reaching education reforms in the 1990s, generally coinciding with the return to peace and democracy. Curricular and pedagogical reform i s one o f the main thrusts o f these reforms, along with decentralization to school- and community-based management, increases in the Ministry o f Education budget, and the creation o f national assessment systems.
Box 7.1 in Annex VI1 presents a review o f curricular and pedagogical reform measures in all countries. Overall, except in El Salvador, the curricular reforms focused on primary schools, were based on constructivism, and were implemented f lexibly and gradually (going through different phases o f elaboration, validation and generalization). A more flexible focus also made it easier to incorporate multicultural elements closer to local
68
realities. In all cases, these curricular reforms were accompanied by the creation o f new textbooks and teaching guides. In some cases, these new teaching and learning materials were produced nationally in order to more closely reflect national curricula while in other cases they were imported from other countries. What follows i s an attempt to provide an initial summary o f evidence of the impact of these reforms, both of the new curricula per se and of the implementation of the curricula and teaching strategies in the classroom.
This section offers diagnostic information on the state of pedagogical practices and instructional time in Central America and how they impact student learning.
a) Active/Participative Teaching Strategies
On curricula per se, we have practically no assessments, with the exception o f El Salvador (see Box 7.1 in Annex VII). We have, however, some evidence on the impact of the related introduction of active/participative teaching practices that can help determine if the introduction of constructivism in the curricula was a positive factor. There i s some evidence across the studies that we have reviewed that more active/participative pedagogical practices have a positive impact on educational achievement as measured by test scores (Table 2.9). In particular, one of the two studies on Guatemala shows that a higher teacher-student interaction, typical o f more participative techniques, i s positively associated with educational achievement and the Honduran study reports a positive impact of participatory techniques on learning outcomes. The evidence from El Salvador i s less clear-cut with a surprisingly positive impact found for traditional techniques. This evidence conflicts, however, with qualitative evidence collected on 24 urban and rural schools which shows that best performing schools tend to apply participative practices.” Additionally, the impact of active practices may be stronger for particular sub-groups of students, such as students with particular learning difficulties or over-age students. This would not be captured by the studies reviewed here.” There has been some evidence along these lines for El Salvador (see Box 7.1). A recent study on Honduras also suggests that traditional teaching methods may exacerbate repetition for repeating student^.'^ Finally, the much more extensive literature on Latin America reveals that there i s some evidence of a positive impact of active strategies on learning (Annex 11.1). If this i s the case, the move towards constructivism i s a positive trend in Central America.
Weak execution of the constructivist curriculum. However, implementation of constructivist techniques has been weak at best. Box 7.1 in Annex VI1 reveals that in most countries classroom practices did not change substantially following the pedagogical reform. There are several possible reasons for this, none o f which has been examined rigorously across countries. Among the most commonly mentioned reasons are: (a) the lack o f teacher expertise in participatory pedagogies; (b) the lack o f textbooks available on a wide basis; (c) large class sizes; and (d) teacher opposition to the reforms. The lack of teacher expertise in the application o f active pedagogies was already recognized as a weakness o f in-service training above when it was mentioned that s t i l l
See Kraft (2003). 91 See Schiefelbein (2004) for an argument along these lines. 92 See Marshall, J (2002): “Grade repetition in Honduran primary schools” - mimeo (Stanford University).
69

too l i t t le effort i s put on changinghpdating classroom practices. This i s confirmed here. Applying a new curriculum requires substantial training and support to enable teachers to effectively change their methods. The magnitude o f the effort needed was probably under-estimated in the Central America countries under analysis. Class size, at least within a certain reasonable range, has not been consistently related to educational achievement, but active and participative teaching methods particularly may be easier or more effectively implemented in small to medium size classes. Finally, on teacher opposition, it appears that in many cases teachers have not been sufficiently consulted on the reform process.93
b) Instructional Time and Class Hours
Another major weakness in the execution o f the curriculum and quality o f education in Central America i s the relatively l ow number o f actual teaching hours. Instructional time (also related to coverage o f the curriculum, as measured in Table 2.9) i s frequently found to be positively related to student achievement and pass rates, including in two recent studies o f Honduras94 and G ~ a t e m a l a . ~ ~
All countries in this report have schooling calendars o f 180-200 days and a school week o f 25-30 class hours in primary. This results in roughly 900-1,200 class hours a year, similar to the rest o f Latin American.96 However, there i s a widespread perception in Central America that actual instructional time is much lower.
Teacher and student absences and school closings considerably reduce the effective class time o f students. Evidence at this point, however, i s largely anecdotal. I t i s notoriously dif f icult to assess effective class hours due to information constraints on teachers’ absences and the magnitude o f teaching hours. The ministries o f education do not usually collect this information, which i s constrained b y the absence o f systematic reporting o f attendance and hours at the school level. In this vacuum, we made an attempt to assess effective class hours in the Central American countries under analysis97 by: (a) assessing average weekly teaching hours (using school-based observations on teaching hours generated on school samples o f different size - often small, unfortunately); (b) assessing the effective number o f weeks o f instruction, using information from a similar source on teachers’ absences and, when available, school closings98; and (c) obtaining the effective yearly class hours b y multiplying the effective number o f weeks by the teaching time.
93 This has been the case in Guatemala where teachers were consulted at the beginning o f the reform but not during the reform process itself and in Nicaragua where teachers have not been part o f the reform design and teachers’ unions have been generally kept aside from the reform. The experience was different in El Salvador where teachers were consulted since the inception o f the reform and have taken part in the whole process mostly through national consultations. Teacher inclusion and national consensus may also explain why El Salvador could pass the reforms on teacher selection and remuneration discussed earlier. 94 See Di Gropello and Marshall (2004). 95 See Marshall (2003a). 96 900-1,200 hrs/yr i s significantly less than the averages for Europe or Southeast Asia (1,200-1,750 hrs/yr) as cited in P E A L (2002). ” Although no information could be gathered on Nicaragua. 98 Or, in the case o f Guatemala, directly on the effective school year.
70

This methodology i s a very simplified one99, but provides us wi th some insights that are better than the anecdotal evidence.
Weekly Teaching Hours (a)
Low instructional time. Table 2.10 reveals that in all countries there would be between 500 and 800 effective class hours at most, which represent between 58 and 80 percent o f the notional class time (see Figure 2.4). I t i s obvious that even 700 class hours per year compare very unfavorably with the more than 1,200 notional class hours o f Europe or other countries and constitute a major barrier to educational achievement in Central
Honduras El Salvador Guatemala
21 21 20
I Table 2.10: Effective class hours in Central American Countries I
Weekly Class Hours (b)
Normal Weeks per Year
21 21 20
42 42 36
Estimated Teacher’s weekly absences (c) 4 3.5 na
reasons (d) I 3 l n a I na I School closings due to non-teacher absence
Effective number of weeks (e)
Effective number of class hours per year (f)
35 38.5 26
735 808 520
Effective number of class days per year (9)
America. Honduras and Guatemala seem to have the largest gap between notional and effective class hours, while El Salvador has the smallest gap.
122 161 1 04
99 For instance, i t makes the assumption that teaching hours and class hours are similar, which w i l l be valid only i f one teacher teaches all subjects and, if there i s more than one shift, one teacher only teaches one shift. Additionally, the estimated effective class hours per year w i l l generally be an under-estimation because o f the lack o f information on unexcused teachers’ absences in Honduras and El Salvador and, for El Salvador, on schools’ closings (beyond normal holiday closings) due to reasons others than teachers’ absences. On the other hand, considering all teachers’ absences may somewhat under-estimate class hours if a substitute or replacement teacher i s used. Finally, the figures that we obtain provide an estimate o f effective class hours, but not o f time-on-task, which is expected to be even lower if we consider that a class hour includes a 15-minute break and that only a portion o f the remaining 45 minutes i s spent on the task itself (time frequently i s spent on discipline, grading, organizing, setting up, etc).
71
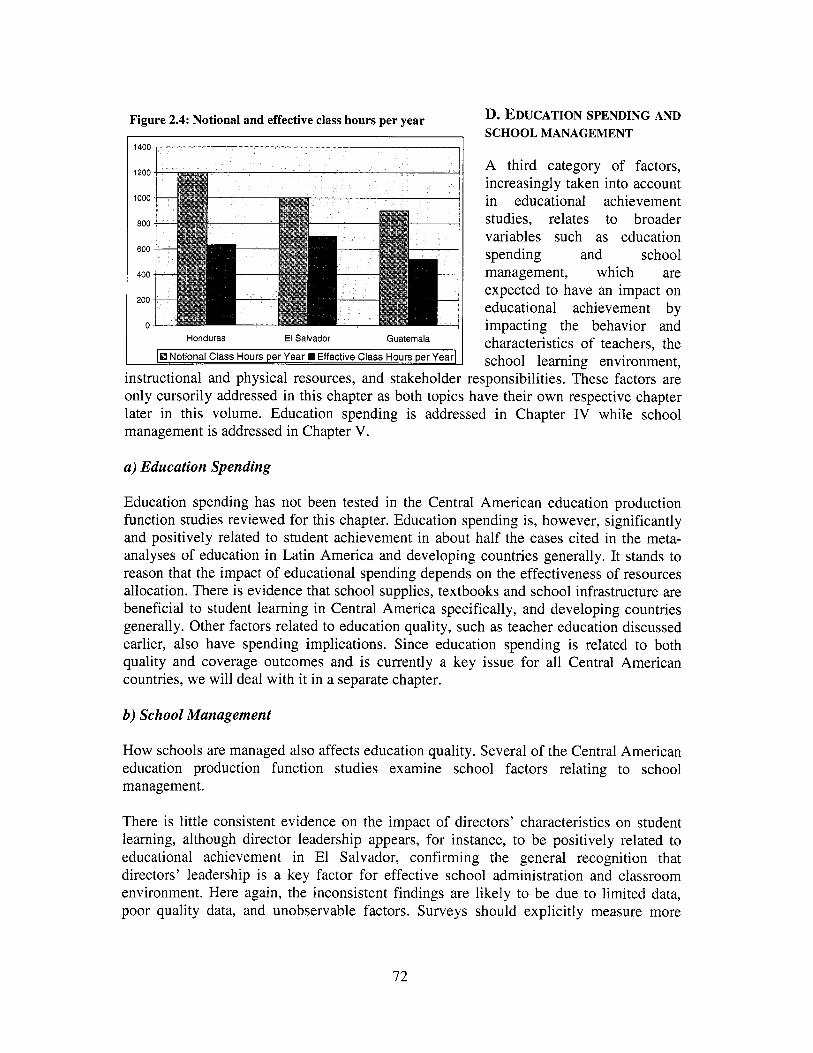
Figure 2.4: Notional and effective class hours per year
I 14001 I 1200
1000
800
600
400
200
0
D. EDUCATION SPENDING AND SCHOOL MANAGEMENT
A third category o f factors, increasingly taken into account in educational achievement studies, relates to broader variables such as education spending and school management, which are expected to have an impact on educational achievement by impacting the behavior and characteristics o f teachers, the school learning environment,
instructional and physical resources, and stakeholder responsibilities. These factors are only cursorily addressed in this chapter as both topics have their own respective chapter later in this volume. Education spending i s addressed in Chapter IV while school management i s addressed in Chapter V.
a) Education Spending
Education spending has not been tested in the Central American education production function studies reviewed for this chapter. Education spending is, however, significantly and positively related to student achievement in about half the cases cited in the meta- analyses o f education in Latin America and developing countries generally. I t stands to reason that the impact of educational spending depends on the effectiveness o f resources allocation. There i s evidence that school supplies, textbooks and school infrastructure are beneficial to student learning in Central America specifically, and developing countries generally. Other factors related to education quality, such as teacher education discussed earlier, also have spending implications. Since education spending i s related to both quality and coverage outcomes and i s currently a key issue for al l Central American countries, we w i l l deal wi th i t in a separate chapter.
b) School Management
How schools are managed also affects education quality. Several o f the Central American education production function studies examine school factors relating to school management .
There i s little consistent evidence on the impact o f directors’ characteristics on student learning, although director leadership appears, for instance, to be positively related to educational achievement in El Salvador, confirming the general recognition that directors’ leadership i s a key factor for effective school administration and classroom environment. Here again, the inconsistent findings are l ikely to be due to limited data, poor quality data, and unobservable factors. Surveys should explicitly measure more
72
principal characteristics and behaviors in order to increase understanding of the impact of, say, director selection and training, director commitment/leadership, and other factors.
More evidence i s available on school autonomy and community participation and, interestingly, these variables, in many cases, have a significant and positive association with student achievement. In particular, school autonomy i s positively related to educational achievement in both El Salvador and Honduras (which may also contribute to explain why private schools perform better in El Salvador), while i t has a more ambiguous -positive or negative- impact in Guatemala. Within the current decentralization strategies adopted in Central America, i t i s particularly important to be able to assess the impact o f autonomy and community participation. To address this issue special studies have been undertaken comparing community-based schools with traditional ones that we wi l l explicitly review in Chapter V. A separate chapter on school- based management i s required not only because of the increasing relevance o f decentralization in the countries under analysis, but also because decentralization is, l ike education spending, a crosscutting area which affects quality, efficiency and coverage.
111. Policy Implications
The previous section detailed many o f the constraints to learning in Central America. This next section takes each of these areas and proposes policy options to overcome these barriers. We begin with an analysis of the qualities o f high-performing low-income schools and what differentiates them from less effective low-income schools. This analysis i s offered in order to begin to look at what policies, characteristics, and practices being used currently in Central America may be valuable to consider. The following sub- sections then look at specific policy options to address the learning constraints identified in the previous section: (a) student background characteristics; (b) teacher quality; and (c) pedagogical practices. We do not look at policy options concerning education financing or school management because each of these sections i s dealt with in subsequent chapters o f this report.
A. LEARNING DETERMINANTS OF EFFECTIVE SCHOOLS
In Central America, where poverty continues to be a severe problem affecting large segments of the population, insuring high quality education for the poor must be a top priority. Unfortunately, to date, schools serving the poor tend to be o f significantly lower quality than those serving more privileged social sectors, and student achievement continues to parallel gaps between social class and racial divisions in ways that underscore continued urgent inequalities. The goal of the following analysis i s to identify the characteristics of high-performing low-income schools in Honduras and Nicaragua that differentiate these schools from average or low-performing low-income schools (no equivalent databases were available for El Salvador or Guatemala).
a ) Methodology and Data
Annex VIII contains a description of the data that were used and the methodology applied to undertake this effective school analysis. Here, we just point out that groups of effective
73

and “control” schools were identified in each o f the countries with effective schools being defined as schools that scored substantially higher than the mean on multiple exams and significantly below the mean in terms o f socioeconomic status. The tables below report t-tests on sample means o f control and effective schools.
b) Findings and Discussion
Before discussing specific results from the analysis, a couple of general findings are worth mentioning. First, the cut o f f boundaries to identify effective schools in Nicaragua was much less rigorous than that o f Honduras. This was necessary because there simply were very few high-performing, low-income schools in the Nicaraguan dataset. This may be partially due to sample size, but i t i s also likely that socioeconomic status (SES) and test scores are more tightly linked in Nicaragua than in Honduras; in other words, educational outcomes are more inequitable in Nicaragua. Evidence o f this sharp inequality in Nicaragua was also highlighted in Chapter I.
Second, many more schools met the criteria as effective in math than in Spanish in both countries. This phenomenon has been discussed in other literature and has been attributed to the fact that children learn more literacy sk i l ls than math skills at home. This means that children enter school on more equal footing for math than for language. The occurrence o f more effective schools in math than in Spanish in both Honduras and Nicaragua demonstrates that the inequalities in children’s backgrounds are not being sufficiently compensated for in schools.
i ) Teachers and principals
Skilled teachers matter. There are important differences between the teachers and principals o f effective and control schools in Honduras and Nicaragua (Table 2.1 l), but these differences are not entirely consistent across country. In Honduras, the education level o f teachers and principals i s significantly higher in effective schools but these same teachers and principals have fewer years o f experience (although this variable i s not significant). In Nicaragua the situation i s reversed. Although limited to the sixth grade, teachers and principals in effective schools have significantly lower education levels but more years o f experience. This evidence suggests that the policy o f hiring teachers with l o w qualifications in rural areas i s problematic in Honduras, where teachers with university degrees obtain better results in low-income schools. In contrast, in Nicaragua, hiring teachers with limited educational background may be al l right (at least for grade 6), so long as the teachers hired have a lot o f professional experience. In both cases, these findings illustrate the need for policies that attract and retain competent teachers in poor areas.
74
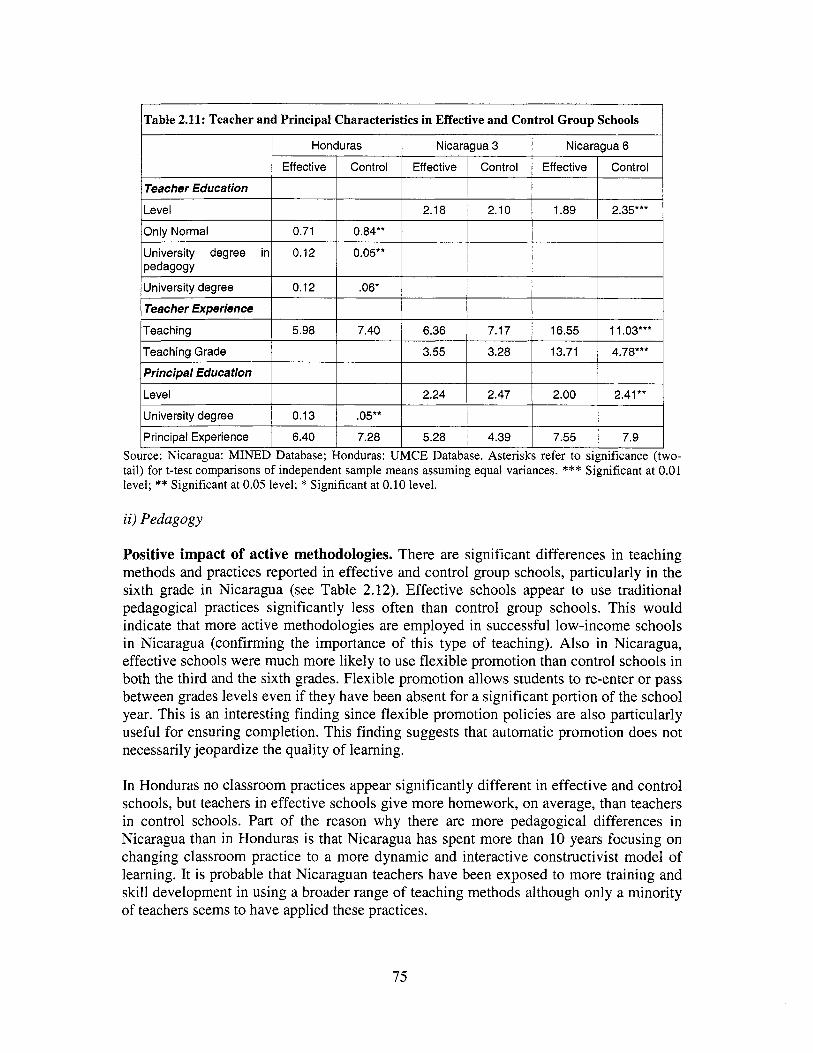
Honduras Nicaragua 3 Nicaragua 6
I Level I I I 2.18 1 2.10 I 1.89 I 2.35*** I
Effective
Teacher Education Control Effective Control Effective Control
Only Normal
University degree in pedagogy
0.71 0.84**
0.12 0.05**
1 Principal Education I I I I I I I
University degree
Teacher Experience
0.12 .06*
Teaching
Teachina Grade
i i ) Pedagogy
5.98 7.40 6.36 7.17 16.55 11.03***
3.55 3.28 13.71 4.78***
Positive impact of active methodologies. There are significant differences in teaching methods and practices reported in effective and control group schools, particularly in the sixth grade in Nicaragua (see Table 2.12). Effective schools appear to use traditional pedagogical practices significantly less often than control group schools. This would indicate that more active methodologies are employed in successful low-income schools in Nicaragua (confirming the importance o f this type o f teaching). Also in Nicaragua, effective schools were much more likely to use flexible promotion than control schools in both the third and the sixth grades. Flexible promotion allows students to re-enter or pass between grades levels even if they have been absent for a significant portion of the school year. This i s an interesting finding since flexible promotion policies are also particularly useful for ensuring completion. This finding suggests that automatic promotion does not necessarily jeopardize the quality o f learning.
Level
University degree
In Honduras no classroom practices appear significantly different in effective and control schools, but teachers in effective schools give more homework, on average, than teachers in control schools. Part of the reason why there are more pedagogical differences in Nicaragua than in Honduras i s that Nicaragua has spent more than 10 years focusing on changing classroom practice to a more dynamic and interactive constructivist model of learning. I t i s probable that Nicaraguan teachers have been exposed to more training and skill development in using a broader range o f teaching methods although only a minority of teachers seems to have applied these practices.
2.24 2.47 2.00 2.41 **
0.13 .05**
75
Principal Experience 6.40 7.28 5.28 4.39 7.55 7.9
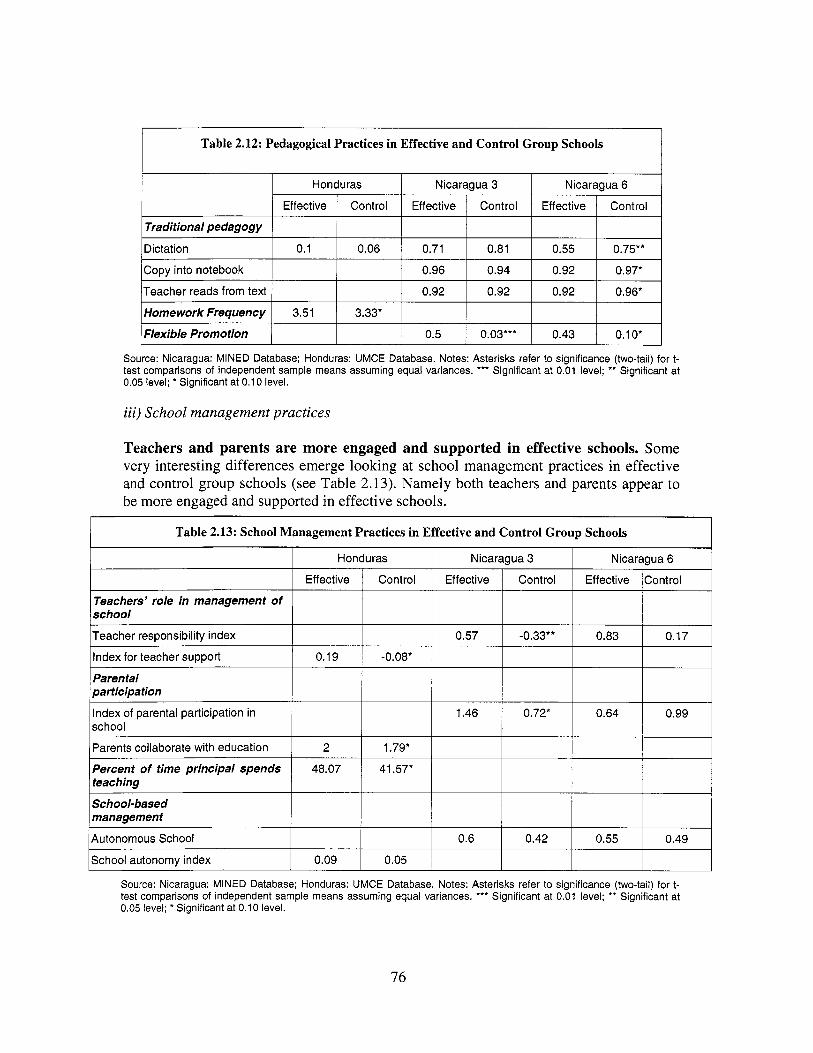
Honduras
Effective 1 Control
Nicaragua 3 Nicaragua 6
Effective 1 Control Effective 1 Control
lCopy into notebook I 1 1 0.96 I 0.94 1 0.92 1 0.97* I
Traditional pedagogy
Dictation
/Teacher reads from text 1 I 1 0.92 I 0.92 I 0.92 1 0 . 9 6 * 1
0.1 0.06 0.71 0.81 0.55 0.75**
IHomeworkFrequency I 3.51 1 3.33* I I I I I Flexible Promotion 0.5 0.03*** 0.43 0.10*
i i i ) School management practices
Effective
Teachers' role in management of school
Teachers and parents are more engaged and supported in effective schools. Some very interesting differences emerge looking at school management practices in effective and control group schools (see Table 2.13). Namely both teachers and parents appear to be more engaged and supported in effective schools.
Table 2.13: School Management Practices in Effective and Control Group Schools
Control Effective Control Effective Control 1 I Honduras I Nicaragua3 I Nicaragua6 1
Teacher responsibility index
Index for teacher support
Parental participation
school Index of parental participation in
0.57 -0.33** 0.83 0.17
0.19 -0.08*
1.46 0.72* 0.64 0.99
School-based management
Autonomous School
1 Parents collaborate with education 1 2 I 1.79* 1 I I I I
0.6 0.42 0.55 0.49
Percent of time principal spends 1 48.07 1 41.57* I teaching I I
ISchool autonomy index 1 0.09 I 0.05 I I I I I Source: Nicaragua: MINED Database; Honduras: UMCE Database. Notes: Asterisks refer to significance (two-tail) for t- test comparisons of independent sample means assuming equal variances. *** Significant at 0.01 level; *' Significant at 0.05 level; * Significant at 0.10 level.
76

In Nicaragua teachers have a wider range of responsibilities in school management in both third and sixth grade, although the difference i s only significant at the third grade level. There was no equivalent data for Honduras, but in that country teachers reported receiving more support and appreciation for their work.
Similarly, there i s indication that parents may be more involved in school functioning and activities as well as their own children's learning in both countries. In Nicaragua, parents score significantly higher on a composite index measuring parental involvement in schools in the third grade. This relationship did not hold for the sixth grade however. In Honduras, teachers reported that parents collaborate more with the education o f their children. Both of these measures indicate that there may be a closer relationship between families and schools/classrooms in high-performing low-income schools in Honduras and Nicaragua. If accurate, this i s a promising finding for community-based school management (discussed in Chapter V).
Finally, in Honduras, effective schools principals spend more time, on average, teaching. This difference suggests that principals in those schools may be more involved in instructional or pedagogical leadership rather than having more administrative functions. Unfortunately, we cannot test community-based schooling (PROHECO) directly in Honduras because the Honduran sample consisted of too few PROHECO schools. We wi l l see in Chapter V (where we use a specially generated database) that PROHECO does, indeed, have a positive impact on many schools (although PROHECO schools are weak on the teacher involvement side). We can only test a general measure of school autonomy, which, although higher in effective schools, does not reach significance. The results for the autonomous schools in Nicaragua'oo indicate that, though not significant, effective schools are more likely to be autonomous than their control group counterparts. Chapter V wi l l show that the impact of the Nicaraguan decentralization reform i s somewhat constrained by low parent and teacher involvement. The model may, however, hold promise for rural areas.
We should add that school type such as single teacher schools (Le. multigrade) in Honduras and multigrade schools in Nicaragua were also tested and, although effective schools were more likely to be single-teacher and multigrade, the difference was not significant. We wi l l see that, when focusing on rural areas, the benefits o f multigrade teaching in certain countries emerge more clearly.
iv) Student repetition and absences
One final area o f differences between effective and control group schools emerged from this analysis concerning the reported levels of repetition and absences of students in the two groups of schools.
Lower repetition and student absenteeism rates. In Honduras, students were significantly less likely to have repeated years of school in the effective schools and the
'00 Where the sample o f schools in Nicaragua was designed to allow for stratification in terms o f participation in the Autonorniu Escolar reform.
77
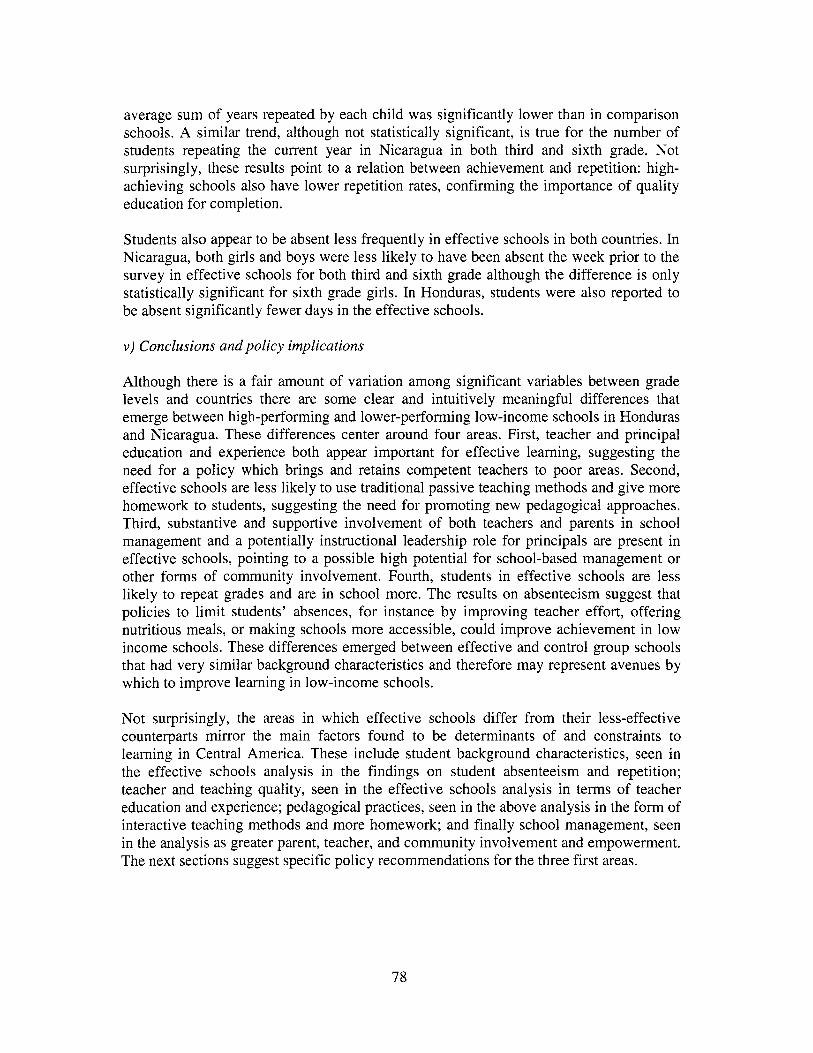
average sum o f years repeated by each child was significantly lower than in comparison schools. A similar trend, although not statistically significant, i s true for the number o f students repeating the current year in Nicaragua in both third and sixth grade. Not surprisingly, these results point to a relation between achievement and repetition: high- achieving schools also have lower repetition rates, confirming the importance o f quality education for completion.
Students also appear to be absent less frequently in effective schools in both countries. In Nicaragua, both girls and boys were less l ikely to have been absent the week prior to the survey in effective schools for both third and sixth grade although the difference i s only statistically significant for sixth grade girls. In Honduras, students were also reported to be absent significantly fewer days in the effective schools.
v ) Conclusions and policy implications
Although there i s a fair amount o f variation among significant variables between grade levels and countries there are some clear and intuitively meaningful differences that emerge between high-performing and lower-performing low-income schools in Honduras and Nicaragua. These differences center around four areas. First, teacher and principal education and experience both appear important for effective learning, suggesting the need for a policy which brings and retains competent teachers to poor areas. Second, effective schools are less l ikely to use traditional passive teaching methods and give more homework to students, suggesting the need for promoting new pedagogical approaches. Third, substantive and supportive involvement o f both teachers and parents in school management and a potentially instructional leadership role for principals are present in effective schools, pointing to a possible high potential for school-based management or other forms o f community involvement. Fourth, students in effective schools are less l ikely to repeat grades and are in school more. The results on absenteeism suggest that policies to limit students’ absences, for instance b y improving teacher effort, offering nutritious meals, or making schools more accessible, could improve achievement in low income schools. These differences emerged between effective and control group schools that had very similar background characteristics and therefore may represent avenues b y which to improve learning in low-income schools.
Not surprisingly, the areas in which effective schools differ f rom their less-effective counterparts mirror the main factors found to be determinants o f and constraints to learning in Central America. These include student background characteristics, seen in the effective schools analysis in the findings on student absenteeism and repetition; teacher and teaching quality, seen in the effective schools analysis in terms o f teacher education and experience; pedagogical practices, seen in the above analysis in the form o f interactive teaching methods and more homework; and finally school management, seen in the analysis as greater parent, teacher, and community involvement and empowerment. The next sections suggest specific pol icy recommendations for the three first areas.
78
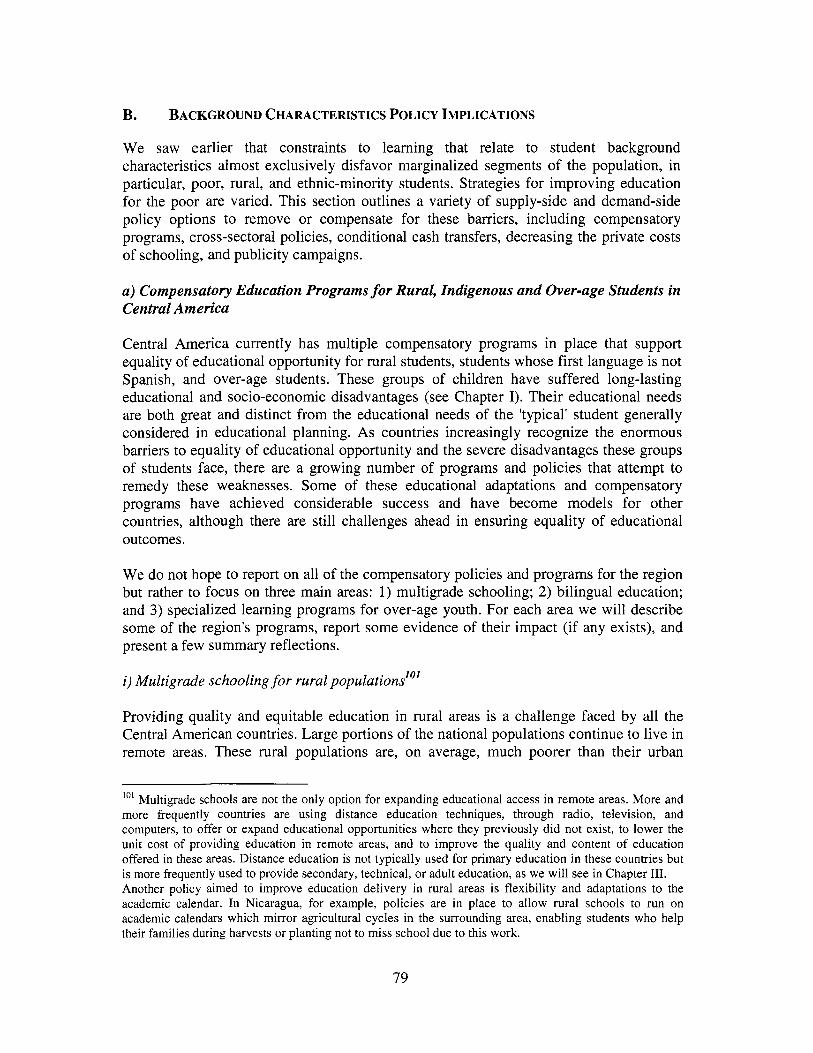
B. BACKGROUND CHARACTERISTICS POLICY IMPLICATIONS
We saw earlier that constraints to learning that relate to student background characteristics almost exclusively disfavor marginalized segments o f the population, in particular, poor, rural, and ethnic-minority students. Strategies for improving education for the poor are varied. This section outlines a variety o f supply-side and demand-side policy options to remove or compensate for these barriers, including compensatory programs, cross-sectoral policies, conditional cash transfers, decreasing the private costs of schooling, and publicity campaigns.
a) Compensatory Education Programs for Rural, Indigenous and Over-age Students in Central America
Central America currently has multiple compensatory programs in place that support equality of educational opportunity for rural students, students whose first language i s not Spanish, and over-age students. These groups of children have suffered long-lasting educational and socio-economic disadvantages (see Chapter I). Their educational needs are both great and distinct from the educational needs of the 'typical' student generally considered in educational planning. As countries increasingly recognize the enormous barriers to equality o f educational opportunity and the severe disadvantages these groups of students face, there are a growing number of programs and policies that attempt to remedy these weaknesses. Some of these educational adaptations and compensatory programs have achieved considerable success and have become models for other countries, although there are s t i l l challenges ahead in ensuring equality of educational outcomes.
We do not hope to report on all of the compensatory policies and programs for the region but rather to focus on three main areas: 1) multigrade schooling; 2) bilingual education; and 3) specialized learning programs for over-age youth. For each area we wi l l describe some of the region's programs, report some evidence of their impact (if any exists), and present a few summary reflections.
i ) Multigrade schooling for rural populationdo'
Providing quality and equitable education in rural areas i s a challenge faced by all the Central American countries. Large portions o f the national populations continue to live in remote areas. These rural populations are, on average, much poorer than their urban
lo' Multigrade schools are not the only option for expanding educational access in remote areas. More and more frequently countries are using distance education techniques, through radio, television, and computers, to offer or expand educational opportunities where they previously did not exist, to lower the unit cost o f providing education in remote areas, and to improve the quality and content o f education offered in these areas. Distance education i s not typically used for primary education in these countries but i s more frequently used to provide secondary, technical, or adult education, as we w i l l see in Chapter 111. Another policy aimed to improve education delivery in rural areas i s flexibility and adaptations to the academic calendar. In Nicaragua, for example, policies are in place to allow rural schools to run on academic calendars which mirror agricultural cycles in the surrounding area, enabling students who help their families during harvests or planting not to miss school due to this work.
79

counterparts and have fewer available material and human resources. In addition, populations are widely spread making access to school much more dif f icult and costly. Teacher shortages in rural areas are also common. As a response to these serious challenges many countries are using a multigrade model o f education in which one teacher simultaneously leads class for more than one grade level. This cuts down on the number o f teachers needed to provide more complete schools. But because o f this structure, and the rural context o f these schools, multigrade schools have unique needs, in particular teachers must be able to successfully facilitate the learning o f students o f different ages and skill levels, materials must be adapted for students who receive less frontal teaching, and schedules and curricula must be appropriate for the rural multigrade setting. At their best, multigrade schools have been shown to cost-effectively address the unique context o f remote rural areas and provide rural children with not only access to all primary education grade levels but also ensure relevance to the local setting, and successful student outcomes.'02 At their worst, however, multigrade schools can perpetuate and exacerbate the inferior education provided to rural c o m m ~ n i t i e s . ' ~ ~
Program descriptions. Although all four countries have introduced multigrade schooling programs, evidence on impact i s limited and o f varying quality. O f all the programs, the Guatemalan New Unitary School (NEU) project has been the subject o f the most academic study, while several o f the other programs have received l imited evaluation by education officials, donors, and external evaluators. B o x 2.2 includes synopses on the range o f multigrade.
lo* In UNESCO's Latin American Laboratory study of education quality in eleven Latin American countries, only Colombia had higher student achievement in the rural sector than in the urban sector. This i s largely thought to be due to the Escuelu Nuevu schools, a rural multigrade education program begun in the 1970s that i s the inspiration behind many of the Central American multigrade programs (PREAL, 2003a). lo3 Benveniste and McEwan (2000).
80

Improvements in test scores. There i s evidence that when successful, students in multigrade schools can outperform traditional rural students and even urban students. The NEU program evaluation found that NEU schools students have better reading sk i l ls than traditional rural school students.' lo Similarly, indicators of student achievement in Nicaragua's model multigrade schools are promising. Test scores were higher for math but lower or similar for Spanish than in regular model schools in 2002. Girls, however,
IO4 PREAL (2003a). IO5 AED and Juirez and Associates (2003). IO6 The Alternative Classrooms Project i s implemented in EDUCO schools, community managed rural schools in El Salvador. They will be discussed more extensively in Chapter V. lo' PREAL (2002). lo* MEP (2002); MEP (2001). '09 MINEDUC, OEI, & World Bank, no year. 'lo Kraft (1998).
81
scored lower in both Spanish and math in multigrade schools indicating that more attention may need to be directed at gender inequities in rural areas (see Table 2.14). Finally, in Honduras, when examining only rural schools, single-teacher schools score significantly higher in math and science than multiple-teacher schools (there i s no significant difference in Spanish test scores). ''
Subject
Table 2.14: Nicaragua - Test Scores in Multigrade and Traditional Model Schools
Gender Grade 3 Grade 4
2002 2002
Male 60 81
I SchoolType
Math
I Total 63 82
Male 48 64
Female 43 62
Model Regular
Total
Male t- 45 63
60 84
Model Multigrade
Spanish Female 58 80
Total 59 82
Spanish I Female I 66 I 82 I
Math
Male 52 73
Female 41 66
Total 47 69 I Source: AED and Juarez and Associates, 2003
Greater student retention. Measures o f student retention and completion also appear to be improving in some o f the programs. In Guatemala, fewer NEU school students repeat and more students get to f i f th grade than in traditional rural schools. Still, 95 percent o f monolingual Mayan students continue to drop out o f NEU schools before completing primary education (see Table 2.15). While not disaggregated b y multigrade or traditional school type, student completion in model schools in Nicaragua i s significantly higher than national averages.' l2 The alternative classrooms program in El Salvador also appears to be reducing the proportion o f over-age students in rural schools. Between 1992 and 2000 the progress in increasing the proportion o f age-appropriate enrollment was three times faster in rural schools than in urban ones.
'I' UMCE (2003a). '12AED and JuBrez and Associates (2003).
82
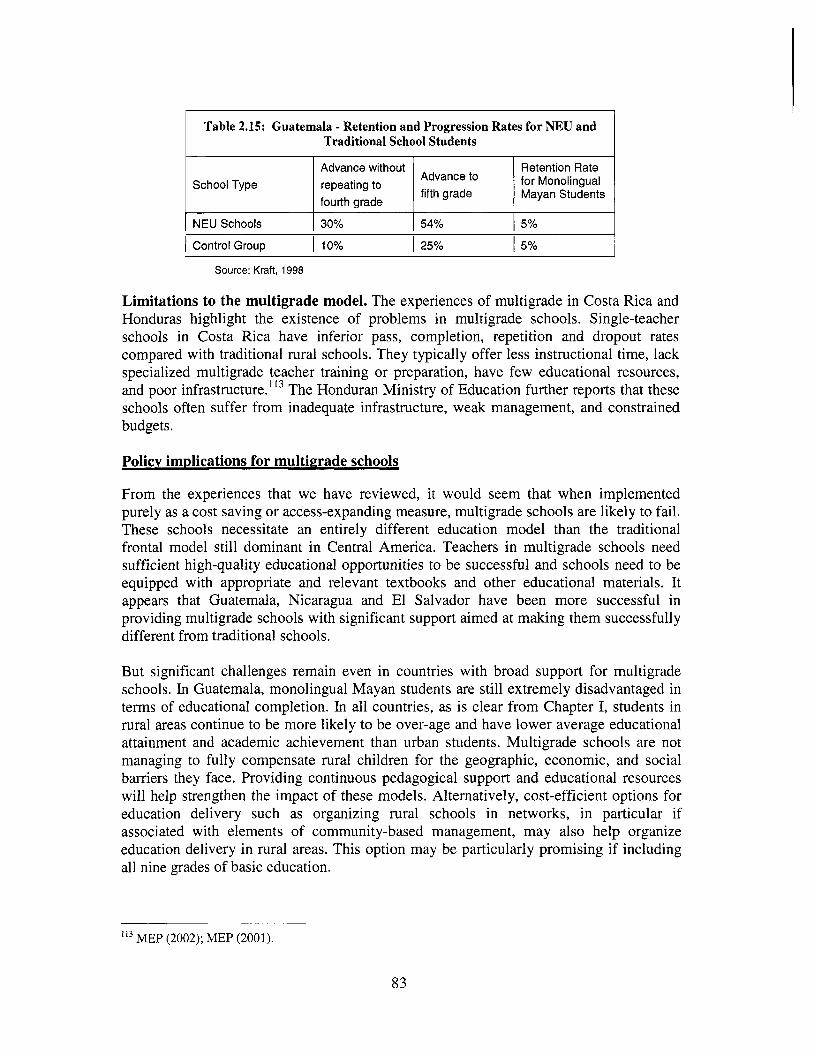
Table 2.15: Guatemala - Retention and Progression Rates for NEU and Traditional School Students
School Type Advance without Retention Rate repeating to Advance to for Monolingual
fifth grade Mayan Students fourth grade
NEU Schools I 30% 154% I 5%
I Control Group I 10% I 25% 15% ~~
Source: Kraft, 1998
Limitations to the multigrade model. The experiences of multigrade in Costa Rica and Honduras highlight the existence of problems in multigrade schools. Single-teacher schools in Costa Rica have inferior pass, completion, repetition and dropout rates compared with traditional rural schools. They typically offer less instructional time, lack specialized multigrade teacher training or preparation, have few educational resources, and poor infra~tructure."~ The Honduran Ministry o f Education further reports that these schools often suffer from inadequate infrastructure, weak management, and constrained budgets.
Policy implications for multigrade schools
From the experiences that we have reviewed, it would seem that when implemented purely as a cost saving or access-expanding measure, multigrade schools are likely to fail. These schools necessitate an entirely different education model than the traditional frontal model s t i l l dominant in Central America. Teachers in multigrade schools need sufficient high-quality educational opportunities to be successful and schools need to be equipped with appropriate and relevant textbooks and other educational materials. I t appears that Guatemala, Nicaragua and El Salvador have been more successful in providing multigrade schools with significant support aimed at making them successfully different from traditional schools.
But significant challenges remain even in countries with broad support for multigrade schools. In Guatemala, monolingual Mayan students are s t i l l extremely disadvantaged in terms o f educational completion. In all countries, as i s clear from Chapter I, students in rural areas continue to be more likely to be over-age and have lower average educational attainment and academic achievement than urban students. Multigrade schools are not managing to fully compensate rural children for the geographic, economic, and social barriers they face. Providing continuous pedagogical support and educational resources wi l l help strengthen the impact o f these models. Alternatively, cost-efficient options for education delivery such as organizing rural schools in networks, in particular if associated with elements o f community-based management, may also help organize education delivery in rural areas. This option may be particularly promising if including all nine grades of basic education.
* I 3 MEP (2002); MEP (2001).
83
i i ) Bilingual and multicultural education for ethnic and linguistic minority populations
The Central American countries have diverse ethno-linguistic populations, primarily indigenous Native American groups (largely of Mayan affiliation) and Afro-Caribbean populations along the Atlantic coast. The very distinct histories o f each country, however, have resulted in very different population compositions among the countries. As indicated in Chapter I, roughly half o f the nation's population in Guatemala i s indigenous and one quarter o f the nation's population does not speak Spanish at home. In Nicaragua, nearly 1 in 10 people i s Afro-Caribbean, an ethnic group whose primary language i s English. Other countries, such as El Salvador, have much more ethno-linguistically homogenous populations. In all o f the Central American countries, however, ethnic minorities, especially indigenous populations, face severe economic, political, and social disadvantages compared with the majority mestizo populations. Increasing the human capital o f indigenous people has been shown to decrease these ineq~al i t ies . "~ At the same time, increased education levels have been shown to have a negative association with indigenous language proficiency.' l5 Supporting cultural and linguistic diversity while combating the severe inequalities indigenous and other ethnic minorities face i s a critical challenge in most Central American countries.
Only recently have the Central American governments begun state-initiated and supported bilingual education programs. All countries, except El Salvador, have by now established these types o f programs. Here we describe the Guatemalan program, as this is b y far the most advanced o f the bilingual programs in the region and the only one that has been evaluated. Annex IX includes a box describing the programs implemented in Nicaragua and Honduras.
Guatemala - Bilingual Intercultural Education (DIGEBI): description and impact
Despite the fact that the Ministry o f Education only began bilingual education in Guatemala in 1980, they have made significant progress in the area and are frequently regarded as a model for other countries developing bilingual intercultural education programs.' l6
Due to i t s large indigenous population, Guatemala, o f al l the Central American countries, faces the most pressing need for quality bilingual education. Complicating the matter, however, i s the fact that Guatemala's indigenous population i s not monolingual. There are between 24-52 indigenous languages used in Guatemala, although 75 percent o f the total indigenous population speaks one o f four main Mayan languages. These different groups not only speak different languages but also have unique education needs as evidenced by their distinct dropout, repetition, and pass rates.' '' In addition, the diverse Guatemalan population means that there is a need for al l ethnic groups to learn respect and understanding through intercultural education.
Patrinos and Velez (1996). The World Bank (2002). Dutcher (1997); Cummings and Tamayo (1994). Cummings and Tamayo (1994); Carvajal, Morris and Davenport (1993). 117
84
Improvement and expansion o f bilingual intercultural education has a rominent place in the Guatemalan Peace Accords and the Indigenous Peoples' Accord.' Multiculturalism and interculturalism are foundations o f Guatemala's long-term national education strategy. This strategy calls for deepening knowledge about national ethnic groups, providing bilingual and intercultural education at all education levels, strengthening cultural understanding and respect, and insuring equitable educational access and participation to al l Guatemalan populations.' l9 To implement this strategy, the 2000-2004 Education Plan divides the country into ethno-linguistic areas with decentralized authority to develop and implement culturally and linguistically relevant educational adaptations.l2O
Substantial investment in bilingual intercultural education (EBI) in Guatemala has gone to the development o f a national infrastructure to support the program. This infrastructure includes experts in linguistics, curriculum development, and educational planning as wel l as trained bilingual teachers and bilingual intercultural education materials.12' EBI schools now serve 18 percent o f the indigenous Guatemalan population. Textbooks and supplementary materials have been created and produced in many languages. Guatemala has trained thousands o f bilingual teachers, and offers diplomas and degrees for these teachers in applied linguistics, education administration, curriculum development, reading and writing, and special instruction for teaching bilingual first grade.'22
Positive effect on student achievement. Studies have shown that the EBI program in Guatemala has had positive effects on student achievement, parental attitudes, and school quality. Unfortunately most o f these studies are fairly dated.
A 1986-1991 evaluation o f student achievement on standardized exams showed that students in bilingual intercultural schools outperformed students in a control group on almost all exams (see Table 2.16). B y grade three, when children have received four years o f bilingual intercultural education, students in EBI schools scored significantly higher in math and social studies. In Spanish, there was no significant difference in scores, Another evaluation indicated that EBI students in schools that had fully implemented the program had even greater achievement over traditional schools.'23
'Is Marques and Bannon (2003). 119Comisidn Consultiva para la Reforma Educativa (1999). 120 MINEDUC (2000). 12' Dutcher (1997).
123 Chuta & Chuta (1987) as cited in Dutcher (1997). The World Bank (2004a); Vawda and Patrinos (1999); Cummings and Tamayo (1994).
85
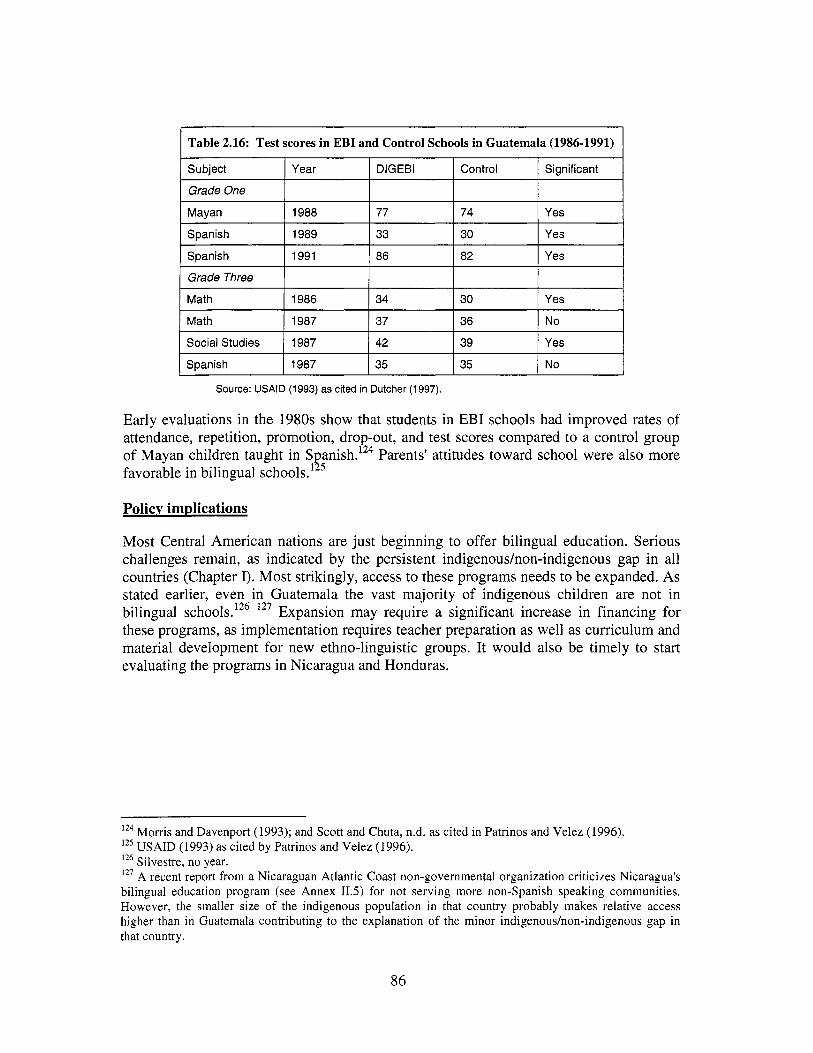
Subject
Grade One
Year DlGEBl Control Significant
1 Social Studies I 1987 I 42 I 3 9 I Yes I
Mayan
Spanish
Spanish
Grade Three
Math
Math
1988 77 74 Yes
1989 33 30 Yes
1991 86 82 Yes
1986 34 30 Yes
1987 37 36 No
Early evaluations in the 1980s show that students in EBI schools had improved rates o f attendance, repetition, promotion, dro out, and test scores compared to a control group o f Mayan children taught in S anish." Parents' attitudes toward school were also more favorable in bilingual schools. 1 E
Spanish
Policy implications
1987 35 35 No
Most Central American nations are just beginning to offer bilingual education. Serious challenges remain, as indicated b y the persistent indigenoushon-indigenous gap in all countries (Chapter I). Most strikingly, access to these programs needs to be expanded. As stated earlier, even in Guatemala the vast majority o f indigenous children are not in bilingual schools.126 127 Expansion may require a significant increase in financing for these programs, as implementation requires teacher preparation as well as curriculum and material development for new ethno-linguistic groups. I t would also be timely to start evaluating the programs in Nicaragua and Honduras.
124 Morris and Davenport (1993); and Scott and Chuta, n.d. as cited in Patrinos and Velez (1996). 125 USAID (1993) as cited by Patrinos and Velez (1996). 126 Silvestre, no year. 12' A recent report from a Nicaraguan Atlantic Coast non-governmental organization criticizes Nicaragua's bilingual education program (see Annex 11.5) for not serving more non-Spanish speaking communities. However, the smaller size o f the indigenous population i n that country probably makes relative access higher than i n Guatemala contributing to the explanation o f the minor indigenouslnon-indigenous gap in that country.
86

i i i ) Alternative programs for over-age youth
As already discussed, over-age students are more likely to drop out, repeat, or fail and require specific targeted programs and policies addressed to their needs. Programs in the region for these populations include flexible (or automatic) promotion, accelerated education and alternative schedules.
Flexible promotion allows students to continue into subsequent grade levels irrespective of whether their achievement qualifies them to pass to the next grade. This not only directly lowers repetition rates but i s also designed to decrease age-by-grade distortion, a factor that i s highly associated with future school abandonment. Accelerated education permits students who are over-age or who for some other reason need to get through school quickly to condense their education into fewer years. This creates an incentive for students who might otherwise drop out or remain out of school to study and complete basic education. Finally, flexible schedules, such as night shifts, weekend classes, or alternative calendars also target students with special needs such as working students who cannot come to school during typical school hourddays. At the primary level these programs are, in many ways, a “second best” compared with interventions that aim at increasing educational attainment by improving quality of schooling, but they can help increase primary completion, particularly in the short term. At the secondary level, when the pressure for students to drop out i s much stronger, alternative schedules are in fact often highly advisable. The following chapter on secondary education w i l l discuss this further.
Unfortunately, there i s practically no research/assessment on these compensatory programs for over-age students and therefore we just provide a summary description o f a couple of interesting programs on accelerated education and automatic or flexible promotion which have been developed in El Salvador and Nicaragua.
Program descriptions
El Salvador: Pilot Program in Accelerated Education and Flexible Promotion. This recent innovation speeds up grade transition for older, more mature or motivated students. I t employs a special curriculum, flexible promotion, and trains and provides materials for teachers in specialized teaching methods. This program i s s t i l l small. In 2000, 47 sections of accelerated education were serving 1410 students in the second through fourth grades.12* Student learning manuals have been developed and distributed to program participants. These manuals promote cooperative learning, problem solving, creative and critical thinking, and a broad range o f activities linked to c ~ r r i c u 1 a . l ~ ~
El Salvador also uses flexible promotion in i ts EDUCO (community run) schools. Flexible promotion allows students to reenter school without having to repeat or drop back a grade level if they have been absent for any length o f time. Flexible promotion i s dependent on curricula and teaching methods that allow the student to continue where he
12’ PREAL (2002). ‘29 Kraft (2004).
87

or she left off. This method i s particularly important for decreasing repetition and preventing dropout among working students, rural students, or other groups of students who are more likely to miss large segments of the school year.13'
Nicaragua: Automatic Promotion and Overage Primary. In 1998 Nicaragua began a policy o f automatic promotion from the first to the second grade. This was extended to the second to third grade transition the following year. The Ministry of Education has also adopted a policy of placing the best teachers into the earliest grades to attempt to curb the early roots of student failure, repetition, and lack of learning. Oddly, repetition in the f i rs t two grades continues at rates similar to those of 1997, indicating that the policy has not yet been implemented as planned (see Chapter I and MECD website).
Over-age Primary in Nicaragua allows children and teens age 9-15 to complete primary education in three years instead of six. In many cases these classes are offered in regular primary schools but during an evenindnight shift so that normal-aged students are not present and so that students can work during the day (MECD website).
b) Conditional Cash Transfers
Conditional cash transfer programs, such as those in Mexico and Brazil, have proven effective at increasing attendance in school, educational attainment, and boosting enr01lment.l~~ These demand-side programs give money to families - usually targeted to poor families only - on certain conditions such as a target attendance rate in school or a minimum number of doctors' visits per child per year. They address both direct and opportunity costs of schooling. Conditional cash transfer programs have limited applicability for the primary level in Central America because they could easily be prohibitively expensive. They may be more appropriate for the secondary level and are discussed further in the chapter on secondary. However, CCT programs have been applied in Honduras and Nicaragua, with varying levels of success (Box 2.3). In general, they had a positive impact on school attendance and early drop-out in both countries, while their effect on enrollment was more ambiguous. There i s evidence that the CCT program of Honduras was poorly designed and implemented, while the program in Nicaragua was better developed. Poor quality o f the supply can also constrain these programs, requiring coordination with supply-side interventions. Conditional cash transfer programs are not designed to generate quality improvements in schools and there i s no evidence that they do so.
I 3 O Kraft (2004). 13' See, for example Skoufias and Parker (2001) on Progresa (Opportunidades) in Mexico, and Bourguignon et a1 (2002) on Bolsa Escola (Bolsa Familia) in Brazil.
88

Box 2.3: Conditional Cash Transfers Can Help Increase Human Capital
Nicaragua's Social Protection Network (RPS) gives poor families cash transfers in exchange for attending health workshops, bringing their young children to regular healthcare appointments, and keeping their 7- 13 year-old children enrolled in and attending school. In i t s target population, RF'S has resulted in:
0
0
0
0
0
0
18% increase in primary school enrollment; 23% increase in school attendance; 7% increase in progression through grades; 5% decrease in child labor (age 7-13); Improved child health and nutrition; Greater improvements for the extreme poor and families in areas going through economic downturn.
(Source: Maluccio, 2004)
In Honduras, the PRAF (Programa de Asignaciones Familiares) implements a program to improve Honduran population's human capital through encouraging poor families to use education, health and nutrition services, as well as improving the quality o f such services. The program consists of several interventions, including demand-side interventions which comprise a set of vouchers for nutritional status and school attendance (for children attending school until 4" grade -Le, 6-12 years of age) [85,000 families covered]. A recent impact evaluation shows that, in i t s target population, PRAF has resulted in:
0 A growth of 4.5% in assistance rates; 0 A reduction in early drop-outs; 0 No significant impact on enrolment rates (Source: IPFRI, 2003)
c) Cross-Sectoral Interventions
Many o f the student background constraints to learning identified in this chapter are most directly dealt with cross-sectorally. If students are unable to learn and come to class regularly because they are frequently sick and malnourished, then an excellent policy option i s to ensure that communities have access to clean water, medical care, safe homes, and other basic requirements for life.
Education ministries in some countries internationally have paired up with ministries o f health or other bodies to offer nutritious meals in schools to attending students. This can address problems o f hunger and malnutrition and can also create an incentive for children to go to school and for parents to keep their kids in school.
d) Decreasing the Private Direct Costs of Schooling
One straightforward way of relieving barriers to greater demand for schooling among disadvantaged population groups i s to decrease the private costs o f schooling which, especially for poor and very poor families, can not only be a
discouragement for keeping children in school, but can be prohibitively expensive. Tables 4.5 and 4.6 in Chapter lV estimate private spending for primary and secondary by income quintiles. They show that a family in the lowest income quintile would have to spend over a third of their monthly income to keep two primary level and one secondary level child in school in El Salvador. In Guatemala the same family would have to spend 85 percent of their monthly income. Eliminating school fees, fees for exams, and providing free textbooks could considerably alleviate some of these private direct costs. Nicaragua has recently eliminated mandatory secondary school fees and i s attempting to enforce the voluntary-nature of primary and secondary school fees. For comparative
89
purposes, Kenya also recently abolished school fees at the primary level and the response from families was massive.'32
e) Publicity Campaigns
Finally, publicity campaigns o f various natures can also increase demand for quality schooling. Radio announcements, billboards, television commercials, and town meetings are a low cost means o f increasing awareness about the importance o f education. These campaigns can address demand constraints in terms o f enrollment but also in terms o f learning by encouraging families to enroll their children in school, giving important information about exams, enrollment, or school, or providing tips on how to support children's academic success in school.
C. TEACHER QUALITY POLICY IMPLICATIONS
a) Pre-Service and In-Service Teacher Education Policy Implications
As seen above, there i s substantial room for improvement o f pre-service teacher education in the region. This improvement could be focused along four main dimensions: (a) reducing the gap between required and de-facto academic qualifications for teaching; (b) developing selection criteria and diagnostic tools such as accreditation exams, which can contribute to increase teacher quality while rationalizing teacher supply; (c) improving the quality o f teacher preparation; and (d) reducing the gap between demand and supply o f teacher specializations. Resolving the first gap w i l l require addressing the lack o f teacher incentives to work in rural areas, which ends up leading to the hiring o f insufficiently skilled local teachers. The development o f selection criteria may also imply moving towards a system o f full teacher certification in al l countries, as is currently done in El Salvador and Costa Rica (in fact, both Guatemala and Nicaragua have plans to transfer teacher preparation schools to the tertiary level), although this policy may be an expensive one if salary increments are directly related to academic title. T o improve the quality o f pre-service teacher education involves ensuring talented committed teacher- educators, updated and relevant curriculum and resources, and adequate opportunities for practicum. Finally, addressing the demand and supply gap w i l l require a careful assessment o f the relevance o f subjects taught to the current socio-economic and cultural context, with particular focus on the most disadvantaged student groups.
In terms o f in-service teacher professional development, improvements w i l l require, at a minimum: (a) putting more effort on changingupdating classroom practices and taking into account non-standard education contexts (multi-cultural environments, rural areas, etc); (b) undertaking more formal evaluations o f the effectiveness o f professional development programs; (c) providing more follow-up with teachers post-training to support the often challenging application o f what they learned; and (d) improving even further the programs' flexibility.
132 See, for example, The World Bank (2004e).
90
b) Teacher Effort Policy Implications
Two main policy implications emerge from the findings on teacher effort. These are (a) future salary increases should be more accurately tied to actual improvements in teacher performance and effort such as hours worked, student test score gains, or improvements in teaching skills; (b) second, attention should be paid to avoid a possible income effect in which teacher wage increases result in a diminishment o f hours worked. Two sorts o f mechanisms that could be explored are merit-pay schemes or salary scales that promote higher effective hours o f work. A limitation o f merit-pay schemes lies in the “distorted” use that could be made o f student achievement scores (to obtain higher students scores, schools may be encouraged to select their students or cheat) and in “moral hazard” issues which are raised b y having teacher pay dependent on outcomes not entirely under the control o f teachers. Using changes in test scores rather than raw test scores as well as intermediate quality/efficiency outcomes, such as i s being done in El Salvador, could help address these issues. A limitation o f salary scales promoting higher effective hours o f work i s that they rely on teachers’ assessments while these are rarely done. Using simple increases in the hourly wage depending on the total number o f hours worked may be a simpler mechanism than salary penalties. Additionally, i t would also be important to analyze the feasibility o f other incentive mechanisms, such as effective teacher monitoring systems. Finally, i t also appears important to continue (or introduce in the case o f Guatemala) salary incentives for disadvantaged geographic areas as a policy to attract high-quality teachers in these areas.
D. PEDAGOGICAL PRACTICE POLICY IMPLICATIONS
a) Active Participative Teaching Strategies Policy Implications
Education reforms have probably taken the right direction in introducing constructivist curricula but effective implementation o f this type o f curriculum i s fairly demanding both financially and technically. Teachers need to be prepared to teach new materials in new ways and then supported as they make those changes in their practice; a wide range o f interactive educational materials needs to be available; classes may need to be smaller; etc. Central American countries do not seem to have ful ly prepared themselves for this challenge. I t is, therefore, essential to ensure that the Ministries o f Education be ful ly aware o f limitations in effective implementation and commit themselves to adequate implementation. Without this, i t is unlikely that these reforms w i l l succeed.
A particularly important set o f measures w i l l refer to teacher capacity in executing the new curricula. Possible measures to improve teacher capacity w i l l have to include greater emphasis on classroom practices in both pre-service and in-service education and innovative ways of organizing in-service teacher support such as the creation o f spaces for teachers to share new ideas and me thodo log ie~ ’~~ , following, for instance, the “teacher microcenters” concept being applied in Nicaragua (see Box 2.1), or an effective
133 Teachers Training Teachers (TTT) programs have had effective success around the world in providing support for teaching.
91
system o f school supervisors which ensures that teachers obtain continuous support in the application and ongoing application o f new method~ log ies . ’~~
Finally, i t i s also important to ensure that curricular reform, standards, training and supervision be implemented at the secondary education level as well as at the primary level. Most countries have tended to leave secondary education aside in their education reforms with negative consequences on the quality o f the secondary cycle. This shortcoming also ends up jeopardizing the transition f rom primary to secondary. I t i s particularly imperative to improve the quality o f grades 7 to 9 in al l countries. The move towards incorporating lower secondary education into the definition of ‘basic education’, undertaken in El Salvador and, more recently, Honduras, goes in the right direction b y shifting the focus from grades 1 to 6 to grades 1 to 9, and supporting a number of accompanying measures (integrated curriculum for the three cycles, introduction o f standardized testing at grade 9, etc). More, however, i s needed.
b) Instructional Time Policy Implications
The reasons for low effective class hours vary somewhat across countries. With only 180 class days, the amount o f official class hours itself seems to be a constraint in Guatemala and Nicaragua. In Honduras and Guatemala, teachers’ absences and school closings seem to be particularly problematic. In al l four countries the relative proportion o f teacher’s time spent on teaching i s too low.
What can we suggest to increase effective class time? T o start with, Nicaragua and Guatemala would be well advised to fol low the example o f El Salvador and Honduras and introduce an official 200-day school year. Second, and importantly, more effective and reliable means should be used to record teachers’ absences and school closings at the school level, through, say, continuously-updated schools’ registers. Du ly completing the school register should be made compulsory in all countries. Third, an efficient monitoring system o f teachers’ absences should be put in place, involving the department and district level. 135 Fourth, communities themselves should be ful ly involved in monitoring teachers’ absences. As we w i l l see, communities are already involved in community- based schools (Chapter V). They could also have a more responsible role in traditional schools. As a minimum, community associations should record teacher absences and report them to district offices which should then take some form o f disciplinary action. El
134 These two last measures may, in some ways, appear as an illustration o f two different approaches, one more compatible with flexibility and pedagogical decentralization, and the other with result orientation and pedagogical centralization. Countries have indeed followed preferably one or the other approach, with some having introduced very centralized frameworks where the Ministr ies o f Education determine how the curriculum wi l l be taught to the students (this is, for instance, the case in Cuba), and others where teachers are given substantial autonomy on how to teach the curriculum (such as Chile for instance). These a proaches do not however need to be incompatible with one another. lg Honduras, for example, i s in the process o f strengthening its department and district offices and delegate to them the management o f databases on human resources. Monitoring teachers’ absences should also be part o f the functions o f the newly strengthened offices. Deconcentration of, say, the teacher payroll can also reduce teachers’ absences directly by the introduction o f a more efficient payment system which does not oblige teachers to travel to get paid.
92
Salvador already has had some success in monitoring teachers’ absences through school governments. Finally, there should be a reallocation o f teachers’ time towards more time spent on teaching itself, trying to limit, for instance, time spent on school administrative activities. Improved directors’ leadership and higher community involvement should help reduce the time teachers spend on these activities.
IV. Conclusions and Policy Implications
The overarching conclusion that can be extracted from this chapter i s that, in spite o f on- going improvements, there are s t i l l serious barriers to learning in Central America. Five main general constraints to student learning have been identified:
(i) (ii) (iii) (iv) (v)
insufficient culture o f evaluation, assessment, and accountability; demand constraints associated with student background characteristics; insufficient and poor teacher preparation and education; l ow teacher effort and insufficient instructional time; weak execution o f the new constructivist curricula;
These conclusions disproportionately affect the poor as revealed b y the analysis o f effective schools.
I t i s difficult to suggest concrete reform paths to address these constraints without further examination o f each o f the countries’ contexts, but we can at least summarize some o f the policy implications developed in the chapter, trying, when possible, to address their application to specific countries.
Some suggested recommendations to address the constraint “insufficient culture o f evaluation” include:
(a) increase the level o f institutionalization o f the assessment systems, b y making sure that academic assessments are carried out routinely and have the necessary financing f rom the Ministry o f Education (an external institution could also work if the two above conditions are fulfilled). I t would also be advisable to start some evaluation at grade 1, where grade failure i s very frequent;
(b) develop effective information dissemination mechanisms at all levels. Report cards to disseminate information on school performance to different audiences could be particularly promising;
(c) improve the timely alignment o f the tests wi th standards and curricula. I t would also be worth trying to align national standards to the regionally established ones to provide the basis for a well-functioning regional accreditation system (see below);
(d) establish a well-functioning Central American accreditation system, which could also lead, if necessary, to the implementation o f a regional assessment system. However, the costs and benefits o f establishing such a system should be assessed.
93
Participating in international exams may be sufficient to promote higher levels o f quality .
Some suggested recommendations to address demand-side constraints include:
(a) where appropriate, alleviate the roots o f demand constraints. Some o f the student background characteristics associated with lower demand for schooling and poorer academic performance are things such as parent illiteracy, malnutrition, and non-Spanish first language. Offering parent literacy classes, ensuring access to health care and sufficient food and clean water, and offering at least the f i rs t grades o f primary education in the primary language o f students can remove many o f the root barriers to enrollment and learning.
(b) improve multi-grade schooling and improve and expand school-based management modalities. Chapter V focuses on SBM. The potential o f multi-grade schooling could be more ful ly realized b y making sure that teachers are specifically and adequately trained and experienced in multi-grade teaching techniques and that they obtain the on-going support necessary to successfully apply these methods.
(c) consider conditional cash transfers as a means o f boosting enrollment, attendance, and completion for disadvantaged sectors, particularly at the secondary level.
(d) reduce the private direct costs o f schooling. Central American countries should consider the feasibility o f eliminating some o f the direct costs o f schooling such as enrollment fees, exam fees, and fees for textbooks.
(e) consider using publicitv campaigns to expand awareness and acceptance o f practices linked to higher enrollment and learning (such as having reading material available in the house and reading to children).
Some suggested recommendations to address the constraint “insufficient and poor teacher preparation and education” include:
(a) reduce the gap between required and actual academic qualifications for teaching (which w i l l largely require to address the shortage o f skilled teachers in rural areas - see below);
(b) introduce effective policies to provide incentives for skilled teachers to work in rural and low-income areas. This w i l l be particularly important in Honduras, where some monetary incentives to move to disadvantaged areas have been introduced, but the disparity between levels o f qualifications in urban and rural areas remains large and i s detrimental to l o w income schools. An effective policy to attract skilled teachers (more experienced) to rural or low-income areas wil l also be particularly useful in Nicaragua to increase the number o f effective
94

schools. Overall, existing monetary incentives, while necessary, may not be sufficient in and o f themselves or may not be sufficiently large. Other measures, such as the obligation for all teachers to spend a period o f time in rural areas (as has been introduced in Honduras) or a teacher monitoring system, which limits unjustified teacher transfers between urban and rural areas, may be useful;
(c) develop selection criteria (in terms o f academic achievement) and accreditation exams (to become a teacher), which may require a move towards a system o f full teacher certification in al l countries, as i s currently done in El Salvador and Costa Rica;
(d) reduce the gap between demand and supply o f teacher specializations, undertaking a careful assessment o f the relevance o f subjects taught considering the socio-economic and cultural context o f schools, wi th particular focus on the most disadvantaged student groups. This w i l l be particularly important in Guatemala, where gaps are very substantial between rural and urban areas and ethnic groups, and not al l these differing needs are s t i l l addressed. Teacher education for multigrade teaching should be strengthened in all countries that have multigrade schools.
Some suggested recommendations to address the constraint “low teacher effort” and “insufficient instructional time” include:
(a) avoid decreasing work hours as a primary result o f teacher salary improvements;
(b) develop mechanisms which explicitly link salary increases to teacher performance and effort, analyzing the feasibility o f introducing team-based merit-pay schemes such as in El Salvador (which, however, s t i l l needs to be ful ly assessed) or salary scales which promote higher effective hours o f work;
(c) analyze the feasibility and timeliness on a large scale o f other incentive mechanisms such as: (a) strong inspection systems; (b) decentralized systems o f teacher monitoring; and (c) fixed-term contracts or local authority to hire and fire teachers. The results o f the effective schools analysis suggest that parental participation in school management may have very good potential for improving teacher effort (see Chapter V).
(d) introduce an official 200-day school year in Nicaragua and Guatemala;
(e) develop better ways o f recording teacher absences and school closings at the school level, through, continuously updated schools’ registers for example;
(0 implement an efficient monitoring system o f teachers’ absences, by involving the department and district level, as well as the communities themselves organized in school governments;
95
(g) reallocate teachers’ time towards teaching itself, trying to limit, for instance, time spent on school administrative matters (which could be to a large extent decentralized to directors and parents). Teachers should be granted the necessary autonomy and support within the school to perform their pedagogical tasks.
Some suggested recommendations to address the constraint “weak execution of the constructivist curriculum” include:
(a) put more emphasis on classroom practice in both pre-service and in-service training;
(b) develop innovative ways o f orpanizing in-service teacher support such as the creation o f spaces for teachers to share new ideas and methodologies, following, for instance, the “teacher microcenters” in Nicaragua;
(c) develop an effective system of school supervisors which ensures that teachers obtain continuous support in the application of new methodologies, while making sure that they continue using these methods (the system o f “asesores pedagdgicos” o f El Salvador should be assessed). Principals should be more actively used in a role o f academic and pedagogical leadership;
(d) ensure that curricular reform, standards, training and supervision are implemented at the secondary level as well as at the primary level.
96
Chapter 111: Expanding Secondarv Education in Central America
With the dramatic increase in primary school enrollment rates across Central America, countries are turning their attention to secondary schools. This attention i s the result o f a convergence o f factors including increased societal demand for secondary education, growing acknowledgement o f the importance o f post primary education for personal and national development, serious challenges in secondary coverage and quality, and some fiscal space for investing more resources in secondary now that many o f the fixed costs for primary are largely in place. At the same time secondary education faces challenges o f access, equity, quality and relevance as was described in Chapter I. Addressing these challenges is one o f the most urgent needs in Central American education.
In deciding policies for secondary expansion and improvement countries' first major task i s to determine the primary objectives o f secondary education in their country. The objectives of secondary education as posited by Ministries o f Education in Central America revolve around two major themes: the first i s to equip youth wi th knowledge and sk i l ls to support national economic and technological growth and, the second, to prepare students to successfully enter the labor market. This chapter begins by briefly presenting why i t i s important to expand secondary education in the region. Second, the chapter examines the reasons for l ow coverage and options to expand it, including why investment o f more public monies in the cycle i s crucial. A final section offers cost simulations to reach target secondary enrollment rates in El Salvador and Honduras.
I. Why is Expanding Coverage of Secondary in a Broad-based Manner a Reg ion a I Priority?
Chapter I showed that there i s a severe coverage gap in Central America at the secondary level. Gross enrollment rates in the four countries range from 33 percent in Guatemala to 61 percent in El Salvador. These rates are wel l below those o f comparison regions with similar per-capita income. This coverage gap, paired with quality and equity problems in secondary education in the region, create a major stumbling block to individual opportunity and national development.
Secondary education helps individuals improve their lives and it also helps countries grow and develop. The rate o f return analysis in Chapter I affirmed that people who go to secondary school, particularly upper secondary school, earn significantly more than those who do not. These additional earnings allow individuals to improve their health, nutrition, and overall quality o f life. But recently, research i s showing that secondary education also benefits national growth and development in meaningful ways.
A population with full secondary education is key to boosting national competitiveness and GDP in an increasingly technological Secondary enrollment in developing countries has been positively related to GDP levels over the past three decades and mass secondary schooling i s critical to the ability o f countries to attract and benefit from trade
I3'See Fuller and Holsinger (1993) and The World Bank (2003).
97
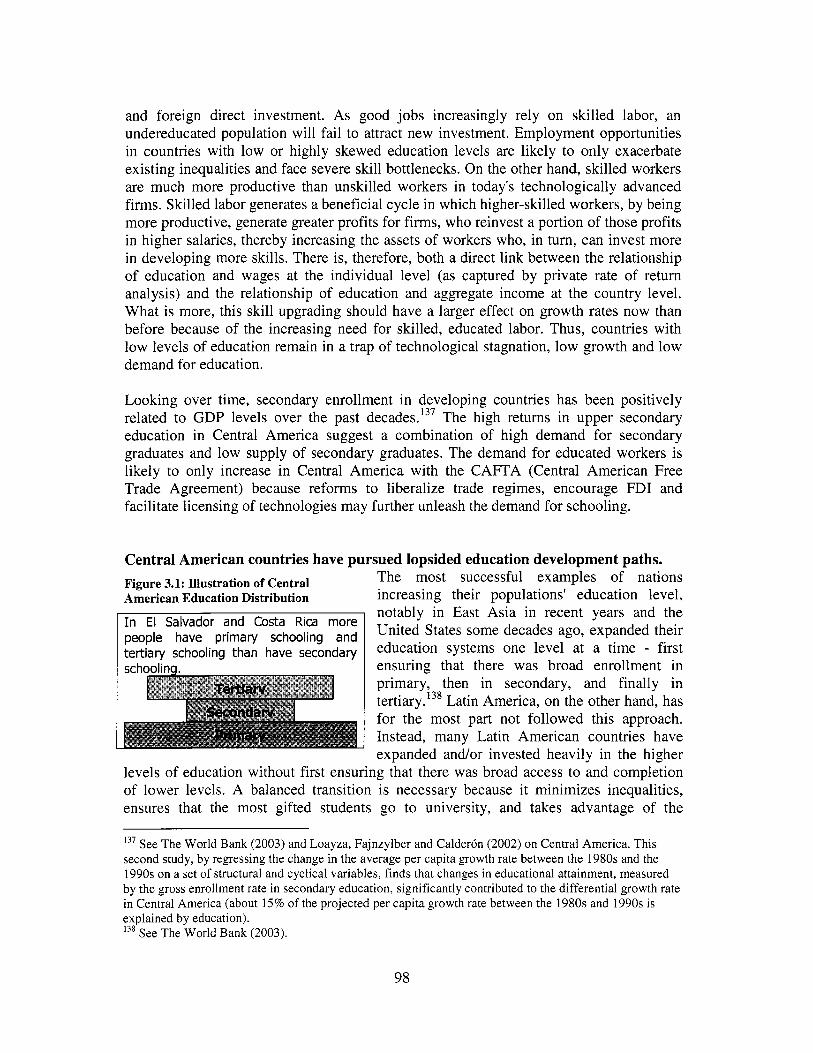
and foreign direct investment. As good jobs increasingly rely on skilled labor, an undereducated population w i l l fai l to attract new investment. Employment opportunities in countries with low or highly skewed education levels are l ikely to only exacerbate existing inequalities and face severe ski l l bottlenecks. On the other hand, skilled workers are much more productive than unskilled workers in today's technologically advanced f i rms. Skilled labor generates a beneficial cycle in which higher-skilled workers, b y being more productive, generate greater profits for f i rms, who reinvest a portion o f those profits in higher salaries, thereby increasing the assets o f workers who, in turn, can invest more in developing more skil ls. There is, therefore, both a direct link between the relationship o f education and wages at the individual level (as captured b y private rate o f return analysis) and the relationship o f education and aggregate income at the country level. What i s more, this skill upgrading should have a larger effect on growth rates now than before because o f the increasing need for skilled, educated labor. Thus, countries with l ow levels o f education remain in a trap o f technological stagnation, l o w growth and l o w demand for education.
Looking over time, secondary enrollment in developing countries has been positively related to GDP levels over the past decades.'37 The high returns in upper secondary education in Central America suggest a combination o f high demand for secondary graduates and low supply o f secondary graduates. The demand for educated workers i s l ikely to only increase in Central America wi th the CAFTA (Central American Free Trade Agreement) because reforms to liberalize trade regimes, encourage F D I and facilitate licensing o f technologies may further unleash the demand for schooling.
Central American countries have pursued lopsided education development paths. The most successful examples o f nations Figure 3.1: Illustration of Central
American Education Distribution increasing their populations' education level, notably in East Asia in recent years and the United States some decades ago, expanded their education systems one level at a time - f i rs t ensuring that there was broad enrollment in primary, then in secondary, and finally in tertiary.13* Latin America, on the other hand, has for the most part not followed this approach. Instead, many Latin American countries have expanded andor invested heavily in the higher
levels o f education without first ensuring that there was broad access to and completion o f lower levels. A balanced transition is necessary because i t minimizes inequalities, ensures that the most gifted students go to university, and takes advantage o f the
I3'See The World Bank (2003) and Loayza, Fajnzylber and Calder6n (2002) on Central America. This second study, by regressing the change in the average per capita growth rate between the 1980s and the 1990s on a set of structural and cyclical variables, finds that changes in educational attainment, measured by the gross enrollment rate in secondary education, significantly contributed to the differential growth rate in Central America (about 15% of the projected per capita growth rate between the 1980s and 1990s i s explained by education). 13'See The World Bank (2003).
98
complementarities between the phases in an educational transition and those in the technological transition of a ~ 0 u n t r y . l ~ ~
Central American countries represent no exception to this pattern of limited secondary enrollment and, subsequently, inadequate skills. Costa Rica and El Salvador have education distributions that resemble a “lopsided anvil” where the bulk of the population have only primary schooling, and fewer individuals have secondary schooling only than have tertiary level schooling (see Figure 3.1).l4’ In Nicaragua, most people have only reached primary school, very few have reached lower secondary, and more have reached upper secondary and tertiary. Finally, in Honduras and Guatemala, the largest share o f the population has only reached primary and similarly fewer people have reached lower secondary, upper secondary and tertiary education. East Asian countries, on the other hand, have a distribution resembling a diamond in which more adults have secondary schooling than primary or tertiary. This diamond shape i s more desirable for a developing country in that i t represents less educational inequality and indicates that most of the population has, at the least, attended secondary.
II. Constraints to Equitable Secondary Coverage
There i s no one single obstacle blocking greater secondary coverage. Rather, there are multiple different causes, ranging from students’ need to work and constraints such as high private direct costs o f schooling, to students’ lack of interest in attending secondary due to low quality and relevance o f schooling. To a more limited extent there are also supply shortages, particularly in rural areas. This section combines findings from household surveys, survivor function plots, rate of return analysis, and education production functions to investigate some of the reasons for low secondary enrollment figures in Central America.
Table 3.1 summarizes the primary responses from household surveys in three countries regarding why teenage students do not attend scho01.l~~ These responses are a good starting point from which to discuss the main reasons for limited secondary coverage.
139 Latin America i s the most unequal region in the world and unbalanced transitions between education levels can perpetuate inequality. An unbalanced transition, with low secondary education levels, would relegate the bulk o f workers to low-skill, low-wage jobs while a privileged few earn the high wages that come from a university education. Because o f a close relationship between schooling and earnings, an unequal distribution o f education tends to perpetuate an unequal distribution o f earnings. 140 This figure i s adapted from The World Bank (2003). 14’ Household surveys provide useful insights on the reasons for low coverage. These surveys ask families why teens are not in school. Care needs to be taken, however, when analyzing this type of information. Firstly, replies are subjective and, as such, are subject to bias, mistakes and miss-interpretations. Secondly, a thorough study o f demand relationships can only be done when there i s availability o f supply (we could then observe the revealed preference o f a family that has access to schooling). If supply i s not available, it w i l l be more difficult to disentangle the true reasons for non-attendance and the responses obtained may under or, more likely, over-estimate the weight o f demand-side factors. Also, information i s only available on reasons for non-attendance by age, providing an incomplete explanation o f reasons for non-attendance by grade (which the comparison between the survivor plots by grade and age could somewhat illustrate). Finally, this question addresses non-attendance in school rather than non-enrollment. Non-attendance most likely includes both non-enrollment as well as school absences.
99
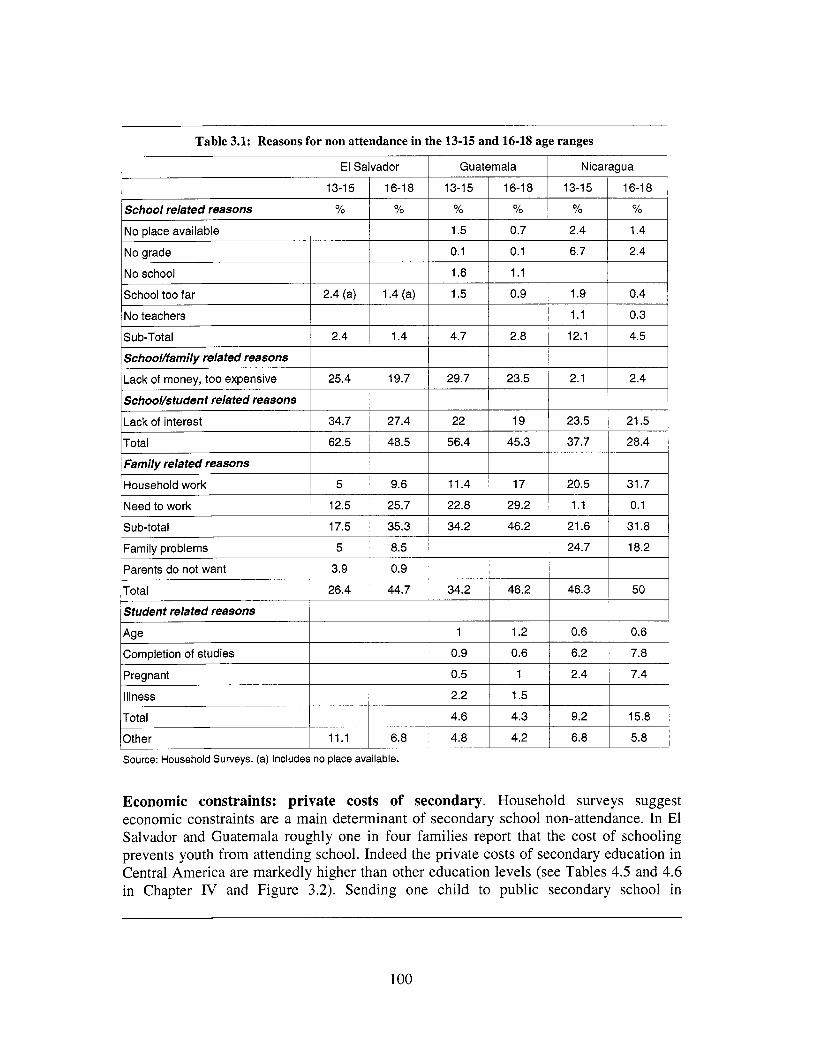
Source: Household Surveys. (a) Includes no place available.
Economic constraints: private costs of secondary. Household surveys suggest economic constraints are a main determinant o f secondary school non-attendance. In El Salvador and Guatemala roughly one in four families report that the cost of schooling prevents youth f rom attending school. Indeed the private costs o f secondary education in Central America are markedly higher than other education levels (see Tables 4.5 and 4.6 in Chapter IV and Figure 3.2). Sending one chi ld to public secondary school in
100
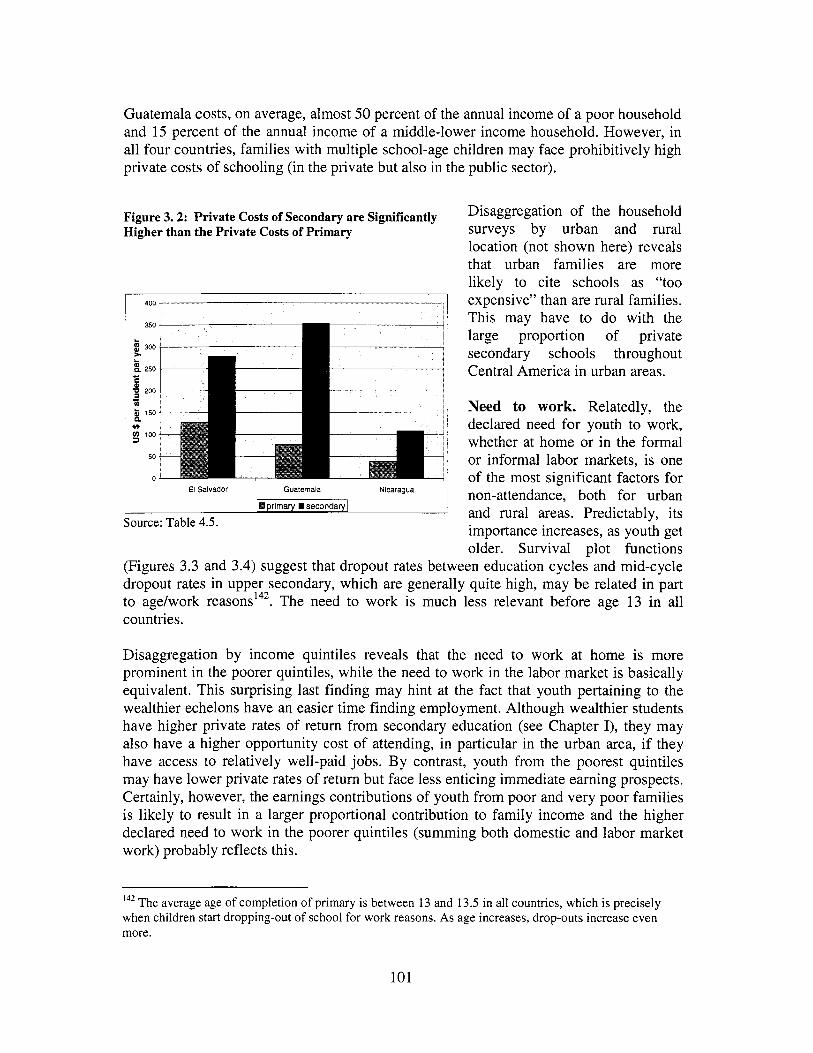
Guatemala costs, on average, almost 50 percent of the annual income of a poor household and 15 percent of the annual income o f a middle-lower income household. However, in all four countries, families with multiple school-age children may face prohibitively high private costs of schooling (in the private but also in the public sector).
Figure 3.2: Private Costs of Secondary are Significantly Higher than the Private Costs of Primary
I I
300
250
200
150
100
so
0
Source: Table 4.5.
Disaggregation o f the household surveys by urban and rural location (not shown here) reveals that urban families are more likely to cite schools as “too expensive’’ than are rural families. This may have to do with the large proportion of private secondary schools throughout Central America in urban areas.
Need to work. Relatedly, the declared need for youth to work, whether at home or in the formal or informal labor markets, i s one o f the most significant factors for non-attendance, both for urban and rural areas. Predictably, i t s importance increases, as youth get older. Survival plot functions
(Figures 3.3 and 3.4) suggest that dropout rates between education cycles and mid-cycle dropout rates in upper secondary, which are generally quite high, may be related in part to age/work reasons142. The need to work i s much less relevant before age 13 in all countries.
Disaggregation by income quintiles reveals that the need to work at home i s more prominent in the poorer quintiles, while the need to work in the labor market i s basically equivalent. This surprising last finding may hint at the fact that youth pertaining to the wealthier echelons have an easier time finding employment. Although wealthier students have higher private rates of return from secondary education (see Chapter I), they may also have a higher opportunity cost o f attending, in particular in the urban area, if they have access to relatively well-paid jobs. B y contrast, youth from the poorest quintiles may have lower private rates of return but face less enticing immediate earning prospects. Certainly, however, the earnings contributions of youth from poor and very poor families i s likely to result in a larger proportional contribution to family income and the higher declared need to work in the poorer quintiles (summing both domestic and labor market work) probably reflects this.
14* The average age of completion o f primary i s between 13 and 13.5 in all countries, which i s precisely when children start dropping-out o f school for work reasons. As age increases, drop-outs increase even more.
101

Figure 3.3: Comparative survivor plots by grade
SURVIVOR FUNCTION PLOT BY YEARS OF EDUCATION
! I
! I
0 0.8: s :
5 : 0 . 7 {
9 1
0.6 : E !
1
0.5 1
I
El Salvador n . .
. . . . > ........ . . . . ~L
1. - -. -. - - . . . . . . . + 7 1 _ _ _
... 1.. ------ -. ...............
I. ........ .........
,~ x ,_ i ~ ~.
i.. .....
Honduras .........................
Nicaragua r---- I -_---
0 9 4 - + 1
0 1 2 3 4 5 6 7 8 9 10
Figure 3.4: Comparative survivor function plots by age
El Salvador U
: ........................ :
Nicaragua r----i --_--
SURVIVOR FUNCTION PLOT BY AGE
. . . . . . . _ _ _ _ I ~
0.8 - 1T.T 1.7 I.. . . . . . A E ..........
0.7- .........
..... .- .......... j ........... Z 0.6- - g ! 0.5- I.. ...... 2
1 . . . . 2
0.4 -
0.3 -
0.1 . . . . . , . . . , , . . . . , . . , , , , , , , , , . . . , , . . ~, . . . . , , , , , , , , , . 7 8 9 10 11 12 13 14 15 16 17
&ad
Source: Household Surveys.
Another, more analytical way, o f analyzing the determinants o f enrollment and completion i s through the estimation o f demand and completion functions. We undertook this exercise in the case o f El Salvador. Without spending time on methodological
102
caveats, we report the main results of this exercise in Box 3.1 be10w.l~~ In this analysis socio-economic status i s the first determinant of enrollment and completion (proxied by parents' education, dwelling characteristics and household income). Lower socio- economic status, as seen above, i s associated with lack o f money to attend school, need to work in the household and lower access to quality education. Additionally, we can also see that there i s a positive but decreasing impact of age on enrollment and completion: this hints at the fact that while older children are more likely to be enrolled in secondary than younger ones (due to repetition, etc), i t i s also true that, as they become older, their probability o f not being enrolled increases due to increased opportunity cost of staying in school.
A widespread lack of interest in attending school points to major obstacles in terms of the quality and value of attending lower and upper secondary. Another of the most prominent reasons families state prevent school attendance i s lack of interest. While this i s clearly a subjective opinion whose root cause i s impossible to determine, i t i s likely that much of the lack of interest i s due to a belief that schooling i s not worth the time, monetary, and energy investment i t requires. This i s tied into questions of low rates of return to schooling, l i t t le relevancy to students' lives, and poor quality of schooling. The education production function on school enrollment and completion in El Salvador (Box 3.1) supports these findings. School quality, as proxied by pupil-teacher ratios, class size and public spending per child i s a particularly important determinant o f enrollment and completion.
Survival functions show that student dropout i s particularly acute at the lower secondary level (Figure 3.3). There are pieces of evidence which point to an acute problem in education at the lower secondary level. First, lack of interest i s the most important reason for non attendance in the 13-15 year old range, age of transition between primary and secondary. Secondly, low relevance and quality are also confirmed by rates of return and achievement scores particularly low at that level. As the opportunity cost of attending school increases, for the 13-15 year old range, low quality and relevance constitute another disincentive for attendance. This i s true for all countries, and is, in fact, most frequently cited in household surveys in El Salvador, the country that has put significant effort into improving i t s lower secondary cycle. This indicates that despite efforts and relatively high transition rates from primary to lower secondary, even El Salvador has to pay close attention to ensuring that students enter, and remain in lower secondary.
Lack of interest continues to be a problem in the 16-18 year old range and the survival plot graph (Figure 3.4) shows that as youth get older they are more and more likely to be out of school. The survival plot by years of schooling shows that transition from lower to upper secondary i s also problematic. Nicaragua i s the only country that does not have a large lower to upper secondary transition gap, perhaps because both cycles are generally offered in the same schools. In the other countries, where lower secondary schools and upper secondary schools are often separate, there appears to be challenge in facilitating student transition to upper secondary. This i s true despite mid-cycle dropout in lower secondary being relatively low in all countries (less so in Nicaragua).
'43 Methodological limitations include biases produced by unobservable factors, measurement error, etc.
103
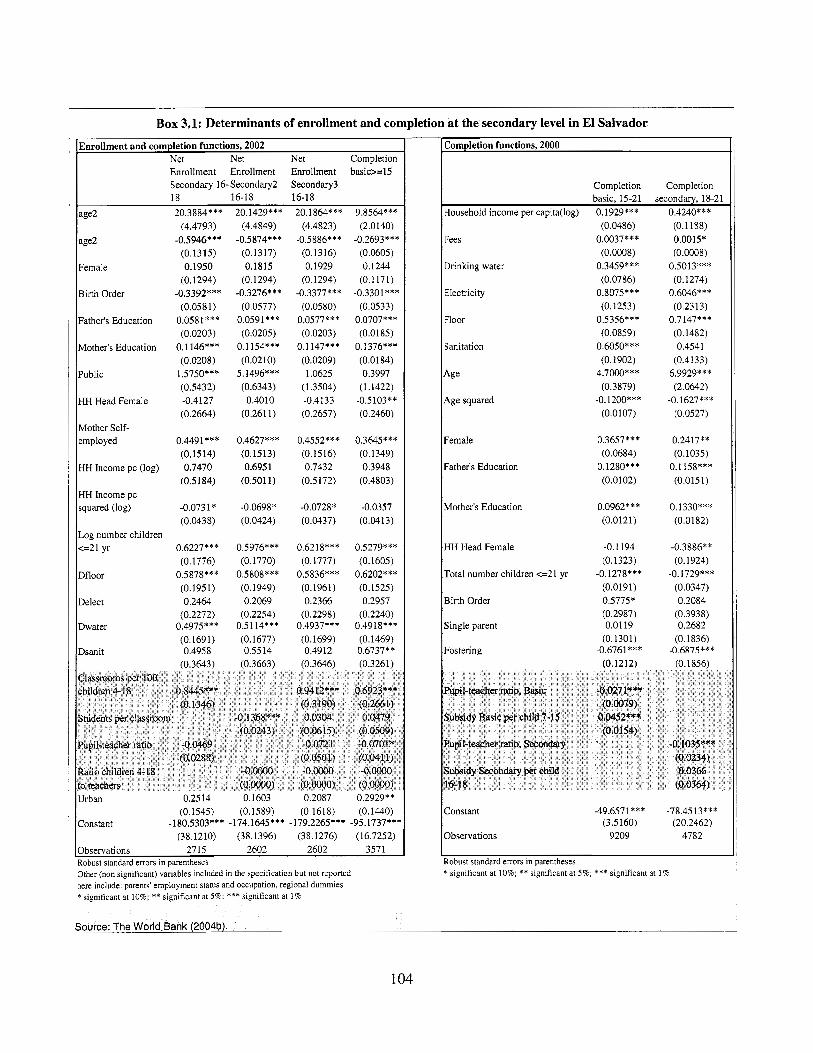
Box 3.1: Determinants of enrollment and completion at the secondary level in El Salvador
Enrollment basic>=15 Secondary3 16-18
Enrollment and completion functions, 2002 Net Net Net Completion Enrollment Enrollment Secondary 16-Secondary2 18 16-18
age2 20.3884*** 20.1429*** (4.4793) (4.4849)
(0.1315) (0.1317)
(0.1294) (0.1294)
(0,0581) (0.0577) Father's Education 0.0581*** 0.0591***
(0.0203) (0.0205) Mother's Education 0.1 146*** 0.1 154***
(0.0208) (0.0210) Public 1.5750*** 5.1496***
(0.5432) (0.6343) HH Head Female -0.4127 -0.4010
(0.2664) (0.261 1) Mother Self- employed 0.4491*** 0.4627***
HH Income pc (log) 0.7470 0.6951
HH Income pc
age2 -0.5946*** -0.5874***
Female 0.1950 0.1815
Birth Order -0.3392*** -0.3276***
(0.1514) (0.1513)
(0.5184) (0.5011)
squared (log) -0.0731* -0.0698* (0.0438) (0.0424)
Log number children <=21 yr 0.6227*** 0.5976*** 0.6218*** 0.5279***
(0.1776) (0.1770) (0,1777) (0.1605) Dfloor 0.5878*** 0.5808*** 0.5836*** 0.6202***
(0.1951) (0.1949) (0.1961) (0.1525) Delect 0.2464 0.2069 0.2366 0.2957
(0.2272) (0.2254) (0.2298) (0.2240) Dwater 0.4975*** 0.5114*** 0.4937*** 0.4918***
(0.1691) (0.1677) (0.1699) (0.1469) Dsanit 0.4958 0.5514 0.4912 0.6737**
20.1864*** 9.8564*** (4.4823) (2.0140)
(0.13 16) (0.0605) 0.1929 0.1244
(0.1294) (0.1 171) -0.3377*** -0.3301***
(0.0580) (0.0533) 0.0577"** 0.0707*** (0.0203) (0.0185)
0.1 147*** 0.1376*** (0.0209) (0.0184) 1.0625 0.3997
(1,3504) (1.1422) -0.4133 -0.5103** (0.2657) (0.2460)
-0.5886*** -0.2693***
0.4552*** 0.3645*** (0.1516) (0.1349) 0.7432 0.3948
(0.5172) (0.4803)
-0.0728* -0.0357 (0.0437) (0.0413)
0.2514 0.1603 0.2087 0.2929** (0.1545) (0.1589) (0.161 8) (0,1440)
(38.1210) (38.1396) (38.1276) (16.7252) Constant -180.5303*** -174.1645*** -179.2265*** -95.1737***
Observations 2715 2602 2602 3571 Robust standard errors in parentheses Other (non significant) variables included in the specification but not reported here include: parents' employment status and occupation, regional dummies *significant at 10%; **significant at 5%; ***significant at 1%
Completion functions, 2000
Completion Completion basic, 15-21 secondary, 18-21
Household income per capita(1og) 0.1929*** 0.4240***
Fees
Drinking water
Electricity
Floor
Sanitation
4 s
4ge squared
Female
Father's Education
Mother's Education
HH Head Female
Total number children e 2 1 yr
Birth Order
Single parent
Fostering
(0.0486) 0.0037*** (0.0008)
0.3459*** (0.0786)
0.8075*** (0.1253)
0.5356*** (0.0859)
0.6050*** (0.1902)
4.7000*** (0.3879)
-0.1200*** (0.0107)
0.3657*** (0.0684)
0.1280*** (0.0102)
0.0962*** (0.0121)
-0.1194 (0.1323)
(0.0191) 0.5775* (0.2987) 0.01 19
(0.1301)
-0.1278***
-0.6761 *** (0.12 12)
Pupil-reacher rho, Basic -0.0271*** (0.0079)
0.0452*** (0.0154)
Subsidy Basic per child 7-15
Pupil-teacher ratio, Secondary -0.1035*** (0.0234)
Subsidy Secondary per child 0.0366 16-18 (0.0364)
Zonstant
3bservations
-49.6571*** -78.4513*** (20.2462) (3.5160)
9209 4782
(0.1 188)
(0.0008) 0.0015*
0.5013*** (0,1274)
0.6046*** (0.231 3)
0.7 147*** (0,1482) 0.4541
(0.4133) 6.9929*** (2.0642)
(0.0527)
0.2417** (0,1035)
0.1 158*** (0.0151)
0.1330*** (0.01 82)
-0.1627 ***
-0.3886** (0.1924)
-0.1729*** (0.0347) 0.2084
(0.3938) 0.2682
(0.1836)
(0.1856) -0.6875***
tobust standard errors in parentheses *significant at 10%; ** significant at 5%; ***significant at 1%
104

School availability i s less of a constraint. A fourth constraint to secondary coverage that should be addressed i s lack o f supply. Pure supply-related factors, such as the lack o f presence of a school or grade, account for only a minor share of the explanation for non- attendance in household surveys, with the exception of the 13 to 15 age range in Nicaragua. This may illustrate the fact that school availability i s not a major issue anymore in Central American countries. In El Salvador, where lower secondary grades are now part of the basic cycle and are taught on the same campus as primary school grades there i s probably very l i t t le supply-constraint at the lower secondary level. Meanwhile in Nicaragua, the large number o f incomplete primary schools in rural areas may explain the more acute supply constraint finding in the 13 to 15 age range. The survival plots suggest that supply shortage (or lack of cheap public supply) may also be an issue in Honduras, where there are particularly low education cycle transition rates.
On the other hand, supply constraints may be under-estimated by the household surveys. Since these surveys give no actual information on school supply other responses such as lack of interest may camouflage actual access problems and economic constraints may reflect limited availability of low-cost schools. Certainly at the upper secondary level there are enough spaces for only a fraction of the number o f age-appropriate youth. The education production function analysis of El Salvador demonstrates that school supply, as proxied by the number of classrooms per children, i s an important determinant of school enrollment and completion at the upper secondary level (public spending per child may also proxy for availability of supply). The fact that school availability i s hardly cited as a problem in the 16-18 year old range suggests that the household surveys are, indeed, under-estimating supply constraints. As other constraints are relieved the lack o f sufficient supply of low-cost lower and upper secondary schools may become an increasingly prominent problem.
Disaggregation by urban and rural location predictably demonstrates that school availability i s more of a problem in rural areas than in urban ones.
All of these factors are likely to disproportionately affect the poor. In Chapter I survival plots by income quintile illustrated that transition rates between cycles and mid- cycle dropout rates are worse for lower income groups. Many factors are likely to contribute to this troubling pattern including greater repetition rates and proportions o f over-age students, more health related factors such as early pregnancy, more supply constraints in terms of quantity and quality o f services, and greater need to contribute to family income. Even worse, the private rate o f return analysis in Chapter I further showed that when poor students do stay in school their returns to schooling are lower than students from higher socioeconomic groups.
In sum, there are multiple factors contributing to inadequate and inequitable enrollment in secondary schools in Central America. These factors include high private and opportunity costs of schooling, low education quality, and insufficient supply of schools in certain areas. Because of the diversity o f causes of inadequate enrollment policy
105

responses wil l also have to be varied and multidimensional. The next section o f this chapter explores these options.
El Salvador 2002
111. Alternatives for Increasing Secondary Coverage
Guatemala Nicaragua 2001 2002
This section reviews four different areas o f policy responses to the constraints discussed above. W e look at (1) secondary financing, (2) demand-side interventions, (3) alternative delivery mechanisms, and (4) quality enhancing interventions.
Total education expenditure
Estimated public expenditure
Estimated private expenditure
Percent of estimated private exp.
A. PUBLIC AND PRIVATE FINANCING
21 9,000 215,000 52,200
108,000 40,400 13,900
1 1 1,000 174,300 38,400
51 % 81 Ya 74%
Public financing o f secondary education should expand in Central America and ensure a favorable environment to equitable secondary coverage. Household surveys suggest that private financing (household expenditure in public and private schools) represents between 50 and 80 percent o f total secondary education spending in Central American countries (see Table 3.2). High shares o f private financing also translate into high shares in terms o f supply. Indeed, between 20 and 55 percent o f secondary enrollment i s provided by the private sector in Central America (see Table 3.3).'44 Private schools in Central America are attended disproportionately by students in the top income quintile (see Figure 3.6)
Table 3.2:Total Education Expenditure in Secondary Education by Source of Financing (US$, 000)
Source: Table 4.2 and Household Surveys.
'44 These figures change slightly when considering official data o f the MINED in all countries. For instance, the official 2002 figures report a public share o f 67% and a private share o f 32% in El Salvador i n upper secondary. In Honduras, differences are more marked at the lower secondary level. I t i s likely that the private share be under-estimated in the Honduras household survey due to the lack o f precision o f the question which was asked for the f i rs t time in March 2003.
106

I Table 3.3: Public enrollment share in secondary education (%)
El Salvador, 2002
7-11 7-9 lo- 11
80 84 72 Public sector
Private sector
(80) (86) (68)
(20) (14) (32)
20 16 28
Guatemala, 2000 Honduras, 2003 Nicaragua, 2001
10- 7-11 7-9 l,:- 7-11 7-9 lo- 11 7-11 7-9 11
78 82 68 73 75 66
(75) (79) (68)
(25) (21) (32)
46 55 24
29 25 34 22 18 32
54 45 76
Source: Household Surveys. Notes: Between brackets: Data of the MINED, 2002 for El Salvador and 2003 for Honduras.
Additionally, within the same public sector, per capita private expenditure on secondary i s higher than public expenditure in all countries for which we have data, with the exception o f El Salvador (see Figure 3.9, which contributes to explain why public schools are attended predominantly by students from upper middle-income groups. The plots in Figure 3.6, which show what percentage of secondary enrollment i s from students in each income quintile, suggest that El Salvador has recently made great strides toward achieving broad-based secondary coverage. Private secondary schools, in recent years, have become even more targeted to the upper two income quintiles but public schools are now largely attended equitably by the three middle-income quintiles. Nicaragua, on the other hand, which has a similar lower secondary enrollment rate to that of El Salvador, i s s t i l l far from achieving equitable broad-based coverage. Despite progress toward greater equity since 1995, secondary distribution in Nicaragua i s s t i l l skewed in both public and private schools towards the upper income quintiles. A similar situation i s found in Guatemala and Honduras.
Figure 3.5: Public and Private Expenditure per School-Age Population in Public Secondary Education
I I I I I I 1 I
0 20 40 60 80 100 120 140
us $
Source: Household Surveys and Table 4.4.
107

Figure 3.6: Public and private enrollment by income quintiles
El Salvador
45 E 40
35 30
5 25 B 20
e i n E, 15
n' ' " 5 0
I I1 111 IV V Income Quintiles
-+public enrollment 2002 +public enrollment 1995 -.?-private enrollment 2002 "+ private enrollment 1995
Honduras
r
E, 20 2 2 i o
0 I II 111 IV V
Income Quintiles
l+Public enrollment 4 ~ r i v a t e enroilmentl
Source: Household Surveys.
Guatemala
60
8 50 - - 40
$, 30
- - 0
c
5 20 e 2 10
0 I II ill iv V
Income Quintiles
/+Public enrollment * Pnvate enrollment 1
~
Nicaragua
60.00
50.00
40.00
30.00
20.00
10.00
0.00 I II Ill IV V
Income Quintiles
+Public enrollment 2002 +-Public enrollment 1995 -*Private enrollment 2002 -*e, Private enrollment 1995
The high share o f private financing in secondary indicates the need for increased priority of secondary education in the national budget. Increased public financing could be used to expand traditional as wel l as alternative secondary models (discussed below), balance public-private costs in the public sector (by exempting low-income students f rom paying fees or b y providing scholarships), and promote quality improvements.
The case for public financing and trade-offs among regional priorities. There are two main reasons why we argue increasing public financing o f secondary i s important. First, as discussed in Chapter I, private rates o f return to lower secondary are low in al l countries, creating a major disincentive for enrollment, especially when coupled with the increasing opportunity costs o f attending school in the 13-18 age range. A public intervention should not be decided on the basis o f the private rate o f return but on the basis of the difference between the social and private rates o f return.'45 Social rates of
145 On this point, see also Hammer (1996).
108
return are, however, very difficult to Yet the disconnect between low private rates o f return for lower secondary and quantitative evidence that broad-based secondary education has a strong impact on the accumulation o f human capital and national growth, suggests that social rates o f return are higher than private ones and, therefore, without sufficient public intervention, a socially sub-optimal equilibrium level o f lower secondary education w i l l be reached.
A public intervention can act in different ways to ensure the social optimum. First public financing can be used to implement policies that improve the quality and relevance o f lower secondary encouraging higher demand from families and the labor market for this cycle.'47 Second, public spending can reduce the opportunity costs of schooling by providing demand-side subsidies and/or developing alternative secondary education modalities that make i t possible to combine work with schooling.
Second, as was shown in Chapter I, rates of return to secondary are particularly low for low-income groups, while direct private costs are particularly high for these same groups, creating additional disincentive to attend for low-income people. Therefore, there i s justification for additional public intervention on pure equity grounds. Public intervention may encourage higher participation of low-income groups in secondary education by implementing policies that improve the quality of the schools that they attend and/or reducing the burden o f private costs through demand-side subsidies or other policy measures (other public policies such as improving the access o f the poor to highly paid jobs would also be useful but are beyond the scope of this report).
With low income levels and high debt levels, all four Central American countries face, however, strong budgetary constraints in the funding of government services and spending areas. Because o f these fiscal constraints, there wi l l necessarily be some trade- offs among the regional priorities laid out in this report (learning improvements, universal completion and broad-based secondary coverage). The nature o f the interrelation of these three education priorities suggests an order o f intervention: first, the quality o f learning should be improved; next, universal primary completion should be assured; and finally, secondary education should be expanded for all population groups. While education quality should be the first and foremost priority for all four countries, the later two priorities could be addressed simultaneously or even in reverse order in the short or medium term if there i s substantial room for improvement in the primary to lower secondary transition rate.
Expanding secondary coverage can not happen overnight. But nor should this priority go ignored. At the very least, countries should expand lower secondary to accommodate all children finishing primary. Nicaragua, Guatemala and Honduras should aim at encouraging broad-based expansion o f lower secondary by expanding equitable access to
'46 Social rates o f return include private benefits and external effects (or externalities). j4' This approach i s also supported by Glewwe (1996). He takes Ghana as an example and as he finds that there are low returns in middle schools (grade 7 -1) suggests to increase investment, on quality grounds, to raise the rate of return.
109

secondary education for those children who are now completing primary.'48 Additionally, all countries should make an effort to expand upper secondary education, although, with the exception of El Salvador, these efforts may need to be more selective to save on scarce resources. El Salvador, a country with higher and more equitable lower secondary enrollment, should now aim at expanding upper secondary (while also pushing for full transition o f the poor and very poor to lower secondary).
In addition to balancing these trade-offs, i t wi l l be essential to envisage strategies which allow increased budgetary priority in all (or at least three) of the four countries to the education sector and promote higher resource mobilization also from other sources (private sector, households). I t wi l l be equally important to introduce measures that encourage higher efficiency in the use o f resources (more effective teacher management, higher shares of non-salary recurrent costs, re-allocation of spending across education levels within the education budget, cost-efficient delivery systems, effective demand-side interventions, lower repetition rates, etc).
Greater private financing of upper secondary may be an appropriate short-term option in Guatemala, Honduras and Nicaragua. In Guatemala, Honduras, and Nicaragua Ministries o f Education are not likely to have enough funds for the expensive tasks of expanding both lower and upper secondary in the short term. Because of this, these countries may wish to explore private financing options for upper secondary (involving civil society as a whole). Increased private financing may also be appropriate in that because few students are making i t through lower secondary, limited expansion of upper secondary i s a reasonable goal for the short term. In addition, private rates of return are high in upper secondary education, and may therefore make up for the higher opportunity and/or direct costs of schooling at that level. High private rates of return may also suggest that the price elasticity of demand for upper secondary education w i l l be lower than for lower education levels (in other words, higher direct schooling costs - as i s generally the case for private schooling - would have less o f an impact on the demand for schooling at that level). Increasing private financing does not mean abandoning or cutting public support. Public support remains important for creating an environment that i s conducive to private sector participation and expansion, and for mobilizing private resources from companies, NGOs, etc. In addition, i t i s important to keep in mind that as a larger and more diverse pool of students graduate from lower secondary schools, the government wi l l need to take increasing responsibility to ensure wider access to upper secondary.
In El Salvador, by contrast, greater public financing at the upper secondary level i s a more immediate need given current lower secondary indicators. Efforts should, however, be made to minimize crowding-out existing private financing (in other words, upper- income families who are willing to pay for upper secondary should continue to do so).
148 As the most disadvantaged groups of children begin to complete primary school in higher proportions due to reforms of primary quality and completion rates secondary expansion wil l become increasingly more equitable.
110
B. DEMAND-SIDE INTERVENTIONS
We have seen above that the reasons for low coverage go beyond school supply issues. In fact, school capacity may exist but students may s t i l l not go to school because schooling i s too expensive, they need to work, or they simply do not have any interest in a poor quality schooling system. All these reasons, we have seen, have a role to play. Two main options exist to address lack of money and need to work issues. The first option i s to intervene on the demand-side by providing demand subsidies to families and students. The second option i s to intervene on the supply-side by improving school quality and relevancy or by providing flexible delivery options that make i t possible to combine studying and working. Below we review possible demand-side interventions.
Chapter I1 discussed some demand-side mechanisms. Traditional scholarships that cover fees and other costs of schooling (uniforms, books, transportation, meals, etc) can be awarded to select (need-based or merit-based) students. Conditional cash transfer programs can provide cash to families or students subject to certain pre-established condition^.'^^ Targeted vouchers provide funds for families to select the school o f their choice, usually including both public and private schools (see the Colombian case in Box 3.2).l5O These interventions generally impact demand directly but some can have an impact on supply as well, such as the voucher program, which, by generating competition among schools for student enrollment, can create greater school accountability to local communities as well as spur quality improvements.
ation based on sound criteria, such as 1
disbursements, burden of program monitoring) led to the discontinuation o f the program at the national this, however, survived at the sub-
‘49 “Oportunidades” in Mexico and “Bolsa Escola” in Brazil are probably the most well known examples to date.
A detailed description of demand-side financing mechanisms in Latin America if provided by Patrinos, H (2002): “A Review of Demand-Side Financing Initiatives in Education”, Background Paper for the WDR 2003.
111
- Chile: During the 1980s, following the introduction of the per-student subsidy, enrolment increased considerably in the private voucher schools (from 14% in 1980 to 32% in 1990) and, controlling for socio- economic status, private subsidized schools seem to perform better than municipal schools, pointing to positive effects of competition on private schools’ performance. However, i t i s generally studies that are largely centred on the 1980s period that competition among private and was hampered by the lack of incentives and capacity of the municipal sector to compete budget constraints at the municipal level, restrictions on municipal decision-making and lack of autonomy
pedagogical municipal school autonomy, introduc student attendance improve the operation of vouch
central compensatory programs.
T o date there are few examples o f demand-side interventions in Central America in secondary education. The PRAF in Honduras and the RPS in Nicaragua are conditional cash transfer programs applied at the primary level which have been brief ly reviewed in Chapter 11. Scholarship programs exist in Costa Rica and El Salvador (see Box 3.3).
FANTEL) and for secondary
ated in 1999, and
FEPADE has established
Source: the World Bank (2004b)
112
C. ALTERNATIVE DELIVERY MODELS
Increasingly, Central American countries are using innovative delivery mechanisms to increase the supply, quality, and cost-effectiveness of secondary schooling. This sub- section looks at basic education centers, public-private partnerships, flexible delivery programs, and school-based management.
Mandatory basic education cycles can improve the transition from primary to secondary. Mandatory basic education cycles can improve the transition to lower secondary by incorporating primary and lower secondary schools on the same campuses, smoothing curricular and pedagogical transitions between the cycles, and generating public acceptance of lower secondary as a compulsory part of basic education. In Central America, this innovation has been piloted in El Salvador and Honduras where both countries have incorporated the full three years o f lower secondary (grades 6-9) into the basic education cycle (see Figure 1.1 in Chapter I). Results remain mixed, with more favorable results in El Salvador than in Honduras. These reforms address lower-education supply constraints by bringing lower secondary to primary school campuses as well as quality constraints created by disconnects between primary and secondary curricula. They also have the potential of decreasing unit costs by combining schools although there may be significant initial costs.'51
There may be opportunities for public financing-private delivery schemes. Public- private partnerships are another policy option for increasing secondary enrollment capacity as Central American countries push to expand secondary coverage. Key factors to be considered in the decision whether to support public or private secondary expansion include the current existence o f private secondary supply, the quality differential across public and private schools, the different capacity utilization o f the two sectors, and the priority given to social heterogeneity and integration.
If private schools in a particular country tend to be higher quality than public schools and have idle capacity, then public subsidization o f these schools may make sense. In the cost simulation for El Salvador later in this chapter we see that i t would be less costly to expand secondary coverage by increasing or at least maintaining i t s current private sector share than by increasing public schools disproportionately. Many examples exist of public-private partnerships in which public funds support private education delivery. Charter schools in the United States, voucher-funded private schools in Chile, and schools run by private institutions and organizations on public school campuses in Colombia (Concessionary Schools) are a few examples. These methods can support private delivery of education to students regardless o f their socioeconomic background. Publicly subsidized, privately run schools in Central America could increase secondary enrollment while improving the equitable distribution of youth in secondary if, for example, private schools were granted public funds to enroll low-income students without charging them tuition fees. This option could also foster more mixed socioeconomic distribution o f students across schools and could potentially generate
Lewin and Caillods (2001).
113
improved educational outcomes.'52 Alternatively, public subsidies could be provided to private schools to enroll middle class students at a subsidized rate. This could create new spaces in public schools for poorer students as middle class students shifted from public to private institutions. Both o f these scenarios would increase secondary coverage though the first would have a greater per-pupil cost and better equity implications.
In Central America, there are a couple o f examples o f public-private partnerships in Costa Rica and El Salvador, but these have limited coverage. The partnership approach developed in El Salvador consists o f providing public resources to private organizations, mostly education non-governmental organizations or religious groups, to help establish and administer schools. In some cases, the Ministry o f Education pays teachers' salaries and the counterpart institution provides the remaining funds (infrastructure, materials, administration, etc). In other cases, this partnership involves contracting out the administration o f the school, with MINED providing most o f the teachers and some material resources and parents providing the rest. Specific examples o f these partnerships include the Fe' y Alegriu schools, the Dominicus de la Anunciutu Congregation, and the Muristus schools. In instances where these schools are located in poor neighborhoods and admit poor students public investment in these schools i s socially progressive. In other instances middle and upper income students enroll in the schools making public financing o f these schools socially regressive.
Public-private partnerships can also support the expansion o f flexible and alternative secondary delivery models, particularly if c iv i l society or the private sector has some value-added in establishing these types o f distance or non-traditional programs.
Alternative delivery mechanisms can expand secondary accessibility in rural and low-income areas and can provide specific and relevant skills and knowledge. There have been few interventions in Central America that have aimed to overcome the inequitable enrollment distribution in the public sector b y reducing the opportunity costs or private direct costs of schooling. An exception i s the recent development o f alternative or flexible secondary modalities in rural and low-income areas, which can reduce the opportunity costs o f schooling, address supply-side constraints and provide a more relevant education to non-traditional students.
Common alternative delivery mechanisms are distance education programs and programs offered at worksites. These programs are increasingly common in Central America. The Honduran program, Educutodos, for example, served more than 85,000 people in 2003. Alternative delivery mechanisms use new pedagogical approaches designed to better serve rural and low-income communities as well as working individuals. They meet the needs o f low-income communities b y offering a free or low-cost alternative to traditional secondary. Many expand access to rural communities that have not had access to secondary school, and they avoid the high costs o f building and staffing a traditional school. Flexible delivery programs are frequently designed to allow students to continue
"* Although evidence i s mixed, private schools, at times have been found to be more cost-effective in terms o f student learning outcomes.
114
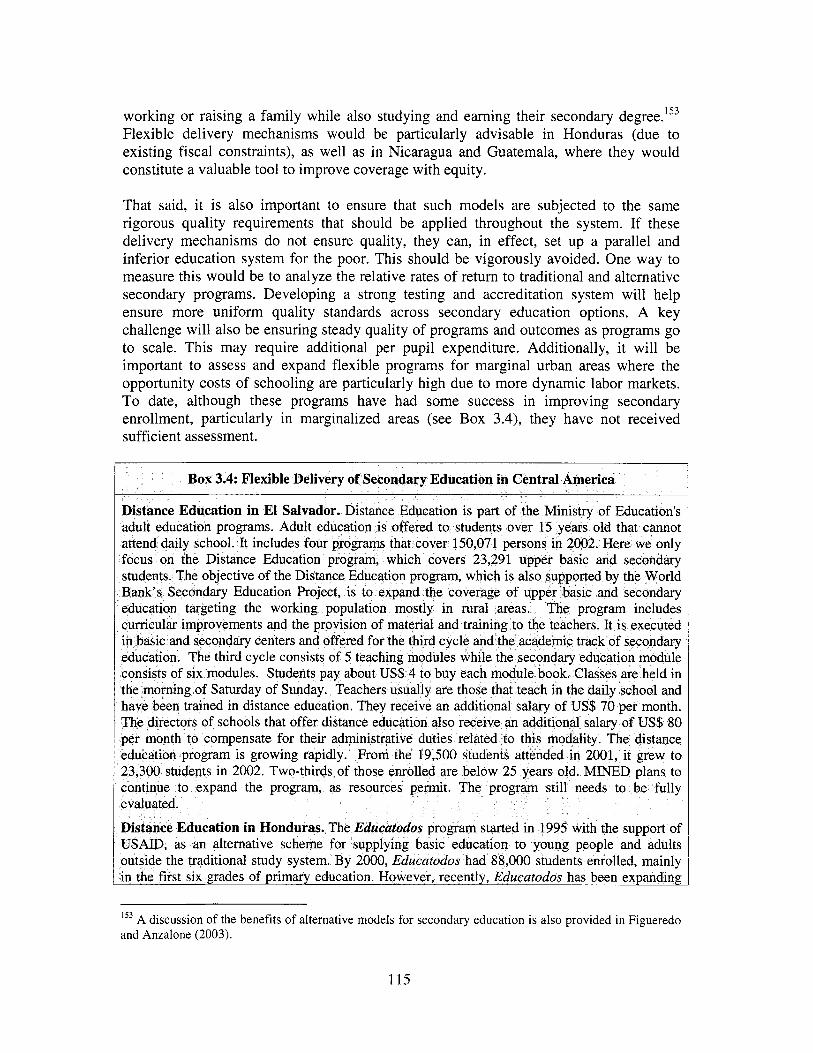
working or raising a family while also studying and earning their secondary degree.'53 Flexible delivery mechanisms would be particularly advisable in Honduras (due to existing fiscal constraints), as well as in Nicaragua and Guatemala, where they would constitute a valuable tool to improve coverage with equity.
That said, i t i s also important to ensure that such models are subjected to the same rigorous quality requirements that should be applied throughout the system. I f these delivery mechanisms do not ensure quality, they can, in effect, set up a parallel and inferior education system for the poor. This should be vigorously avoided. One way to measure this would be to analyze the relative rates of return to traditional and alternative secondary programs. Developing a strong testing and accreditation system wi l l help ensure more uniform quality standards across secondary education options. A key challenge w i l l also be ensuring steady quality of programs and outcomes as programs go to scale. This may require additional per pupil expenditure. Additionally, i t w i l l be important to assess and expand flexible programs for marginal urban areas where the opportunity costs of schooling are particularly high due to more dynamic labor markets. To date, although these programs have had some success in improving secondary enrollment, particularly in marginalized areas (see Box 3.4), they have not received sufficient assessment.
ance Education in El Salvador. Distan inistry of Education's old that cannot
g of Saturday of Sunday. Teachers
ducation in Hon an alternative s
153 A discussion of the benefits o f alternative models for secondary education i s also provided in Figueredo and Anzalone (2003).
115
into the secondary range. In 2001 it had 7,510 participants from 7 to 8 grades, and was in the
The Tutorial Learnin
s s t i l l a small-scale operation. In
evaluation o f these two programs i s s t i l l needed.
School-based management models can also improve cost-effective secondary coverage, particularly in rural areas. Chapter V focuses exclusively on the school- based management education models currently functioning in Central America. These models give management authority to school staff and community members and are shown to be a cost-effective means o f expanding coverage in rural areas although to date, most countries use the school-based management model principally at the primary school level (Nicaragua being an exception).
D. QUALITY AND RELEVANCE
Finally, i t i s clear from the previous discussion on the causes o f l ow secondary coverage that quality improvements w i l l be key to the expansion of secondary education, in particular in lower secondary. Raising the private rates of return would make investing in education today more attractive, for the same forgone income and discount rate. W e w i l l not go in any detail on quality issues here since Chapter I1 already reviewed quality constraints and areas for reform and intervention. Here, we should just add that there are challenges specific to secondary education that need to be further analyzed, but are beyond the scope o f our analysis. A key issue i s a curricular one, which refers to the offering o f different modalities o f secondary for academic and vocational preparation. This is a hotly debated issue. Different modalities enable schools to become centers o f excellence in particular areas, allow schools to meet the unique needs o f different types of students, and can result in graduates with specific and appropriate ski l ls . However,
116
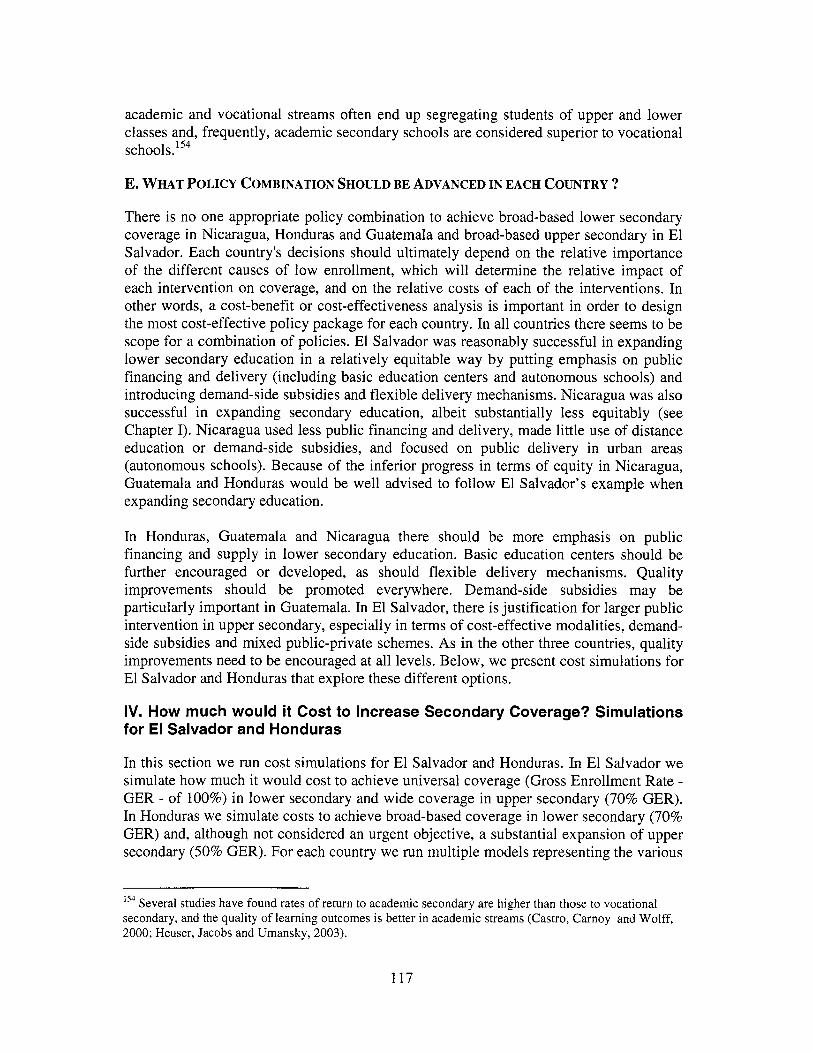
academic and vocational streams often end up segregating students o f upper and lower classes and, frequently, academic secondary schools are considered superior to vocational schools.'54
E. WHAT POLICY COMBINATION SHOULD BE ADVANCED IN EACH COUNTRY ?
There i s no one appropriate policy combination to achieve broad-based lower secondary coverage in Nicaragua, Honduras and Guatemala and broad-based upper secondary in El Salvador. Each country's decisions should ultimately depend on the relative importance of the different causes o f low enrollment, which wi l l determine the relative impact of each intervention on coverage, and on the relative costs of each of the interventions. In other words, a cost-benefit or cost-effectiveness analysis i s important in order to design the most cost-effective policy package for each country. In all countries there seems to be scope for a combination o f policies. El Salvador was reasonably successful in expanding lower secondary education in a relatively equitable way by putting emphasis on public financing and delivery (including basic education centers and autonomous schools) and introducing demand-side subsidies and flexible delivery mechanisms. Nicaragua was also successful in expanding secondary education, albeit substantially less equitably (see Chapter I). Nicaragua used less public financing and delivery, made l i t t le use of distance education or demand-side subsidies, and focused on public delivery in urban areas (autonomous schools). Because of the inferior progress in terms o f equity in Nicaragua, Guatemala and Honduras would be well advised to follow El Salvador's example when expanding secondary education.
In Honduras, Guatemala and Nicaragua there should be more emphasis on public financing and supply in lower secondary education. Basic education centers should be further encouraged or developed, as should flexible delivery mechanisms. Quality improvements should be promoted everywhere. Demand-side subsidies may be particularly important in Guatemala. In El Salvador, there i s justification for larger public intervention in upper secondary, especially in terms of cost-effective modalities, demand- side subsidies and mixed public-private schemes. As in the other three countries, quality improvements need to be encouraged at all levels. Below, we present cost simulations for El Salvador and Honduras that explore these different options.
IV. How much would it Cost to Increase Secondary Coverage? Simulations for El Salvador and Honduras
In this section we run cost simulations for El Salvador and Honduras. In El Salvador we simulate how much i t would cost to achieve universal coverage (Gross Enrollment Rate - GER - of 100%) in lower secondary and wide coverage in upper secondary (70% GER). In Honduras we simulate costs to achieve broad-based coverage in lower secondary (70% GER) and, although not considered an urgent objective, a substantial expansion of upper secondary (50% GER). For each country we run multiple models representing the various
'54 Several studies have found rates o f return to academic secondary are higher than those to vocational secondary, and the quality o f learning outcomes i s better in academic streams (Castro, Carnoy and Wolff, 2000; Heuser, Jacobs and Umansky, 2003).
117
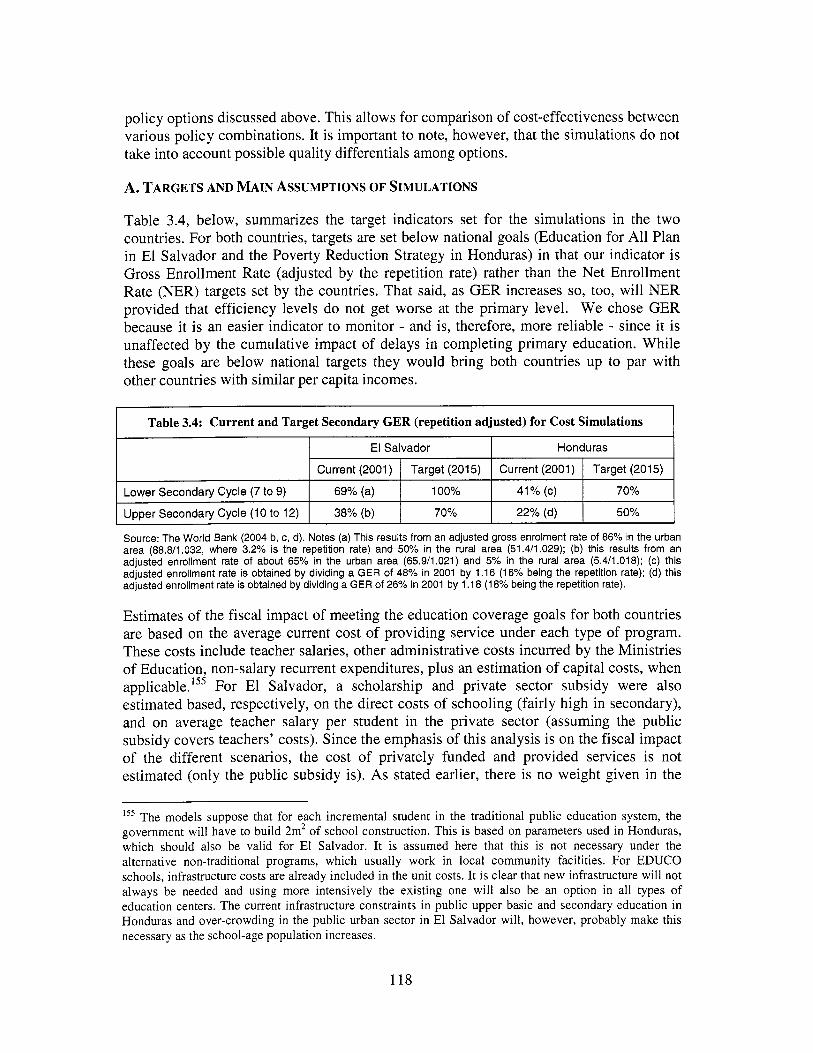
policy options discussed above. This allows for comparison o f cost-effectiveness between various pol icy combinations. I t i s important to note, however, that the simulations do not take into account possible quality differentials among options.
El Salvador
A. TARGETS AND MAIN ASSUMPTIONS OF SIMULATIONS
Honduras
Table 3.4, below, summarizes the target indicators set for the simulations in the two countries, For both countries, targets are set below national goals (Education for All Plan in El Salvador and the Poverty Reduction Strategy in Honduras) in that our indicator i s Gross Enrollment Rate (adjusted by the repetition rate) rather than the Net Enrollment Rate (NER) targets set by the countries. That said, as GER increases so, too, w i l l NER provided that efficiency levels do not get worse at the primary level. W e chose GER because i t i s an easier indicator to monitor - and is, therefore, more reliable - since i t i s unaffected b y the cumulative impact o f delays in completing primary education. While these goals are below national targets they would bring both countries up to par wi th other countries with similar per capita incomes.
Lower Secondary Cycle (7 to 9)
Upper Secondary Cycle (1 0 to 12)
Current (2001) Target (2015) Current (2001) Target (2015)
69% (a) 100% 41% (C) 70%
38% (b) 70% 22% (d) 50%
Estimates of the fiscal impact o f meeting the education coverage goals for both countries are based on the average current cost o f providing service under each type o f program. These costs include teacher salaries, other administrative costs incurred b y the Ministries of Education, non-salary recurrent expenditures, plus an estimation o f capital costs, when a p p l i ~ a b l e . ' ~ ~ For El Salvador, a scholarship and private sector subsidy were also estimated based, respectively, on the direct costs o f schooling (fairly high in secondary), and on average teacher salary per student in the private sector (assuming the public subsidy covers teachers' costs). Since the emphasis o f this analysis i s on the fiscal impact of the different scenarios, the cost o f privately funded and provided services i s not estimated (only the public subsidy is). As stated earlier, there i s no weight given in the
155 The models suppose that for each incremental student in the traditional public education system, the government wi l l have to build 2m2 o f school construction. This i s based on parameters used in Honduras, which should also be valid for El Salvador. I t i s assumed here that this i s not necessary under the alternative non-traditional programs, which usually work in local community facilities. For EDUCO schools, infrastructure costs are already included in the unit costs. I t i s clear that new infrastructure w i l l not always be needed and using more intensively the existing one w i l l also be an option i n all types o f education centers. The current infrastructure constraints in public upper basic and secondary education in Honduras and over-crowding in the public urban sector in El Salvador will, however, probably make this necessary as the school-age population increases.
118
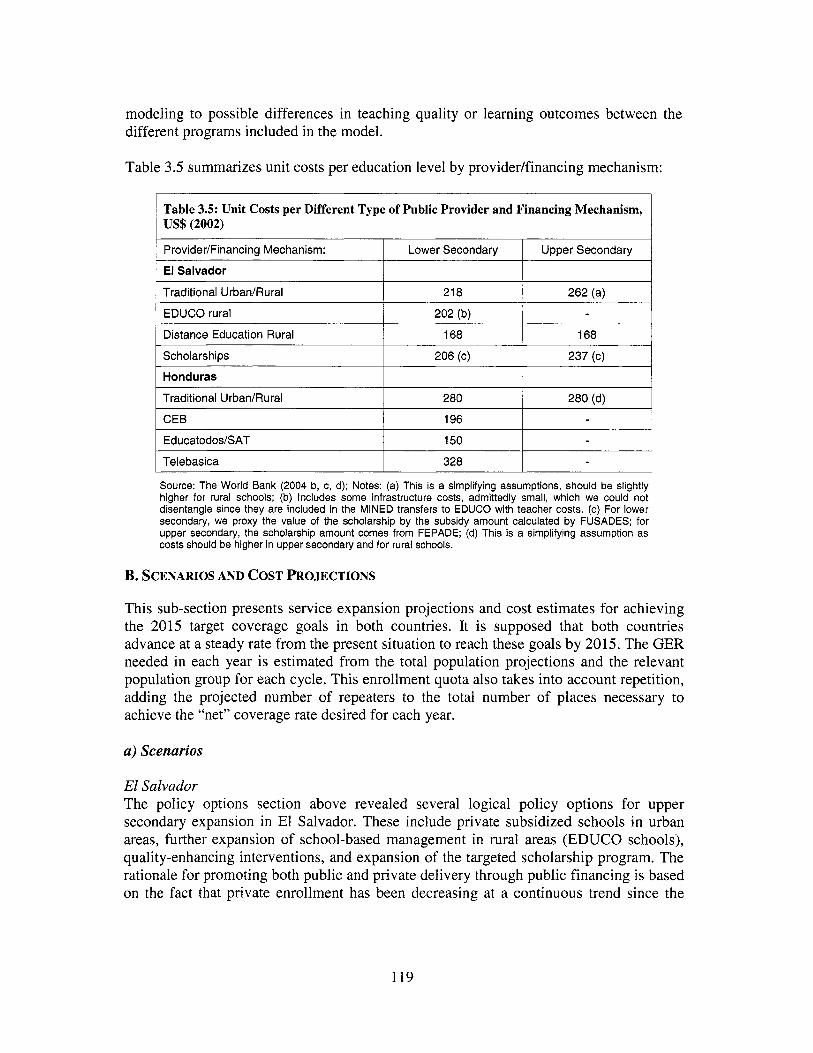
modeling to possible differences in teaching quality or learning outcomes between the different programs included in the model.
Provider/Financing Mechanism:
Table 3.5 summarizes unit costs per education level by providedfinancing mechanism:
Lower Secondary 1 Upper Secondary
Honduras
Traditional Urban/Rural
I El Salvador 1 I I
280 (d) 280
Traditional Urban/Rural
EDUCO rural 202 (b)
Educatodos/SAT
Telebasica
1 Distance Education Rural I 168 I 168 I
150
328
I Scholarships 1 206 (c) I 237 (c) I
I CEB 196
Source: The World Bank (2004 b, c, d); Notes: (a) This is a simplifying assumptions, should be slightly higher for rural schools; (b) Includes some infrastructure costs, admittedly small, which we could not disentangle since they are included in the MINED transfers to EDUCO with teacher costs. (c) For lower secondary, we proxy the value of the scholarship by the subsidy amount calculated by FUSADES; for upper secondary, the scholarship amount comes from FEPADE; (d) This is a simplifying assumption as costs should be higher in upper secondary and for rural schools.
B. SCENARIOS AND COST PROJECTIONS
This sub-section presents service expansion projections and cost estimates for achieving the 2015 target coverage goals in both countries. I t is supposed that both countries advance at a steady rate f rom the present situation to reach these goals b y 2015. The GER needed in each year i s estimated from the total population projections and the relevant population group for each cycle. This enrollment quota also takes into account repetition, adding the projected number o f repeaters to the total number o f places necessary to achieve the “net” coverage rate desired for each year.
a) Scenarios
El Salvador The policy options section above revealed several logical pol icy options for upper secondary expansion in El Salvador. These include private subsidized schools in urban areas, further expansion o f school-based management in rural areas (EDUCO schools), quality-enhancing interventions, and expansion of the targeted scholarship program. The rationale for promoting both public and private delivery through public financing is based on the fact that private enrollment has been decreasing at a continuous trend since the
119
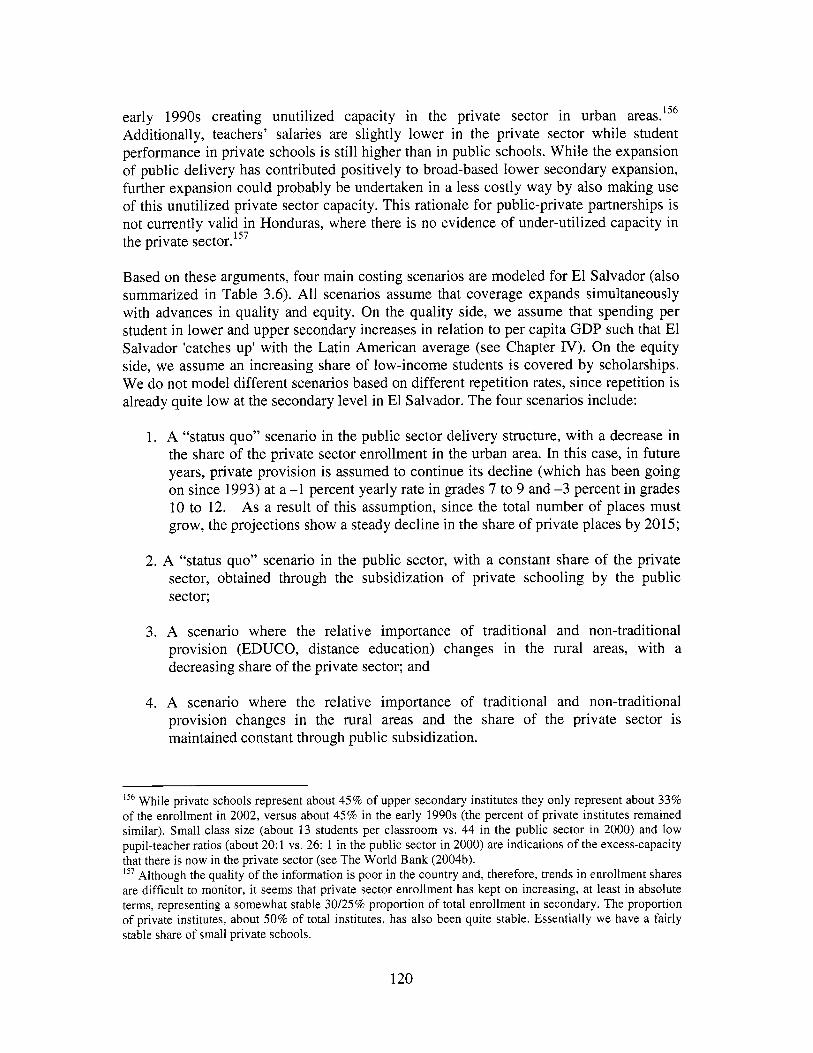
early 1990s creating unutilized capacity in the private sector in urban areas.156 Additionally, teachers’ salaries are slightly lower in the private sector while student performance in private schools i s s t i l l higher than in public schools. While the expansion o f public delivery has contributed positively to broad-based lower secondary expansion, further expansion could probably be undertaken in a less costly way b y also making use o f this unutilized private sector capacity. This rationale for public-private partnerships i s not currently valid in Honduras, where there i s no evidence of under-utilized capacity in the private sector.157
Based on these arguments, four main costing scenarios are modeled for El Salvador (also summarized in Table 3.6). All scenarios assume that coverage expands simultaneously with advances in quality and equity. On the quality side, we assume that spending per student in lower and upper secondary increases in relation to per capita GDP such that El Salvador ‘catches up’ with the Latin American average (see Chapter N). On the equity side, we assume an increasing share o f low-income students i s covered b y scholarships. We do not model different scenarios based on different repetition rates, since repetition is already quite low at the secondary level in El Salvador. The four scenarios include:
1. A “status quo” scenario in the public sector delivery structure, with a decrease in the share o f the private sector enrollment in the urban area. In this case, in future years, private provision i s assumed to continue i t s decline (which has been going on since 1993) at a -1 percent yearly rate in grades 7 to 9 and -3 percent in grades 10 to 12. As a result o f this assumption, since the total number o f places must grow, the projections show a steady decline in the share o f private places b y 2015;
2. A “status quo” scenario in the public sector, with a constant share o f the private sector, obtained through the subsidization of private schooling b y the public sector;
3. A scenario where the relative importance o f traditional and non-traditional provision (EDUCO, distance education) changes in the rural areas, with a decreasing share o f the private sector; and
4. A scenario where the relative importance o f traditional and non-traditional provision changes in the rural areas and the share o f the private sector i s maintained constant through public subsidization.
While private schools represent about 45% of upper secondary institutes they only represent about 33% of the enrollment in 2002, versus about 45% in the early 1990s (the percent o f private institutes remained similar). Small class size (about 13 students per classroom vs. 44 in the public sector in 2000) and low pupil-teacher ratios (about 20: 1 vs. 26: 1 in the public sector in 2000) are indications o f the excess-capacity that there i s now in the private sector (see The World Bank (2004b). ’57 Although the quality of the information i s poor in the country and, therefore, trends in enrollment shares are difficult to monitor, i t seems that private sector enrollment has kept on increasing, at least in absolute terms, representing a somewhat stable 30/25% proportion of total enrollment in secondary. The proportion of private institutes, about 50% of total institutes, has also been quite stable. Essentially we have a fairly stable share of small private schools.
120

Honduras The discussion in the previous section on policy alternatives to expand secondary coverage suggests that in Honduras it makes sense to expand public secondary delivery while attempting to maintain the historic growth rate o f the private sector as well as develop more alternative or cost-efficient delivery mechanisms. Because o f this, the simulated models assume an increase in non-traditional delivery in rural areas and further development of basic education centers - two key strategic policy options for Honduras. Internal efficiency improvements, through lower repetition, are also simulated since there i s sufficient space for efficiency improvements in the country. Quality improvements are also necessary in Honduras. These are modeled, in part, with the expansion o f the TeZebasica program in lower secondary. 158
Three main scenarios are envisaged in Honduras (also summarized in Table 3.8). In al l o f the scenarios for Honduras the growth rate of private provision i s held constant at i t s historic rate o f 3.6 percent a year, and all other necessary growth is assigned to the public sector.159 As a result of this assumption the projections show a decline in the share o f private secondary enrollment, to 19 percent o f the total by 2015. The three scenarios are:
1. A “status quo” scenario in the public sector (no efficiency gains, same delivery structure);
2. A scenario with efficiency improvements (this scenario allows for a gradual increase in the levels of efficiency, decreasing the repetition rates from the initial level of, respectively, 16 percent in grades 7 to 9, and 18 percent, in grades 10 to 12, to half these levels by 2015); and
3. A scenario l ike scenario 2, except with changing delivery structure in lower secondary that allows for greater participation o f alternative or more cost-efficient programs (Basic Education Centers (CEB), EducatodoslSAT) and quality improvements (through TeZebasica).160
b) Cost Simulations
The results o f the cost projections are summarized in Tables 3.6 and 3.7 for each o f the scenarios.161
TV Education i s often used to strengthen lower secondary education in Central America. 15’ This might be considered over-optimistic: an increased effort to provide more public places and improve quality in the public sector could be expected to crowd out some o f the private sector growth in the future. To the extent that this were to happen, the resulting fiscal cost estimates would be under-estimated. To be noted that the simulations were done on the basis o f 2000 official data on relative public and private shares which were indicating a share o f 30% for the private sector. I t i s very unlikely that this share was reduced from 30% to 25% in only three years, indicating deficient data either in 2000 or in 2003. If the rate of growth o f the private sector was somewhat lower than 3.6%, then there was some crowding-out, which could lead Honduras to face similar issues than El Salvador in a longer run.
Given that there are no alternative service provision programs for the diversified (upper secondary) cycle in the country, there are no sub-scenarios for that cycle (although the introduction o f some form o f distance education may have been simulated). 16’ Complete analyses o f the simulations can be found in The World Bank (2004 b, c, d).
121
El Salvador A substantial increase in public financing i s necessary to reach target enrollment rates in El Salvador. As a percentage o f GDP, the combined cost o f both lower and upper secondary cycles w i l l need to go from 0.60 percent in 2002 to between 1.45 percent and 1.61 percent, depending on the scenario, in 2015. Overall, the upper secondary share o f the education budget w i l l need to increase to three or four times i t s current level, and the share for lower secondary (termed Upper Basic in El Salvador due to the basic education reform that included grades 1 through 9 in basic education) w i l l need to double or more than double, depending on the scenario. I t i s also clear, however, that substantial savings are possible through the use o f public subsidies to finance some urban private schools (scenarios 2 and 4).’62 Scenarios 3 and 4, finally, also lead to savings in lower secondary by enrolling students in EDUCO schools where the unit costs and infrastructure costs of these schools are lower than those of traditional schools.
The share o f distance education, however, does not need to grow in El Salvador, in fact in upper secondary it should decline, as there are currently more than enough spaces to cover al l the appropriate target population groups.’63 The number o f scholarships in traditional secondary, however, should expand to support more low-income students. Both o f these changes increase the per pupil cost o f upper secondary.
162 This i s because if the public sector subsidizes private schools to keep their enrollment share i t only covers the salaries o f private teachers, while if the public sector has to absorb an increasing share o f private sector enrollment (scenario 1) i t needs to be paying for both the salaries o f public teachers (higher than private teachers’ salaries) and new infrastructure. ‘63 The share i s assumed to be constant at a 15% o f public rural enrollment, as ‘heeding to work” i s a reason for non attendance for only 13% o f the out-of-school children in rural areas and a share o f the children non attending for “cost reasons” (too expensive) would be dealt with through scholarships. In the scenarios the share o f distance education in upper secondary decreases to 30% and the share o f traditional education increases to 70%, resulting in higher costs. T o generate equity improvements the proportion of low-income students receiving a scholarship would be increased from 20 to 25%. The cost o f the sub-cycle would increase because o f the replacement o f distance education by more expensive traditional one and the increased use o f scholarships.
122

Table 3.6: El Salvador- Secondary Targets Simulation Results I I
Secondary (upper basic) Total Costs Upper Secondary Lower Secondary
(US$2OOZ millions) I 2002 I 2005 I2008 1 2011 I 2015
28.3 40.7 60.3 89.9 157.4
12.2 14.3 16.5 19.0 26.0
CostsEducation Budget I CostsEducation Budget I Upper Secondary I 6.0 I 8.0 I 10.1 I 14.6 I 22.6
I23
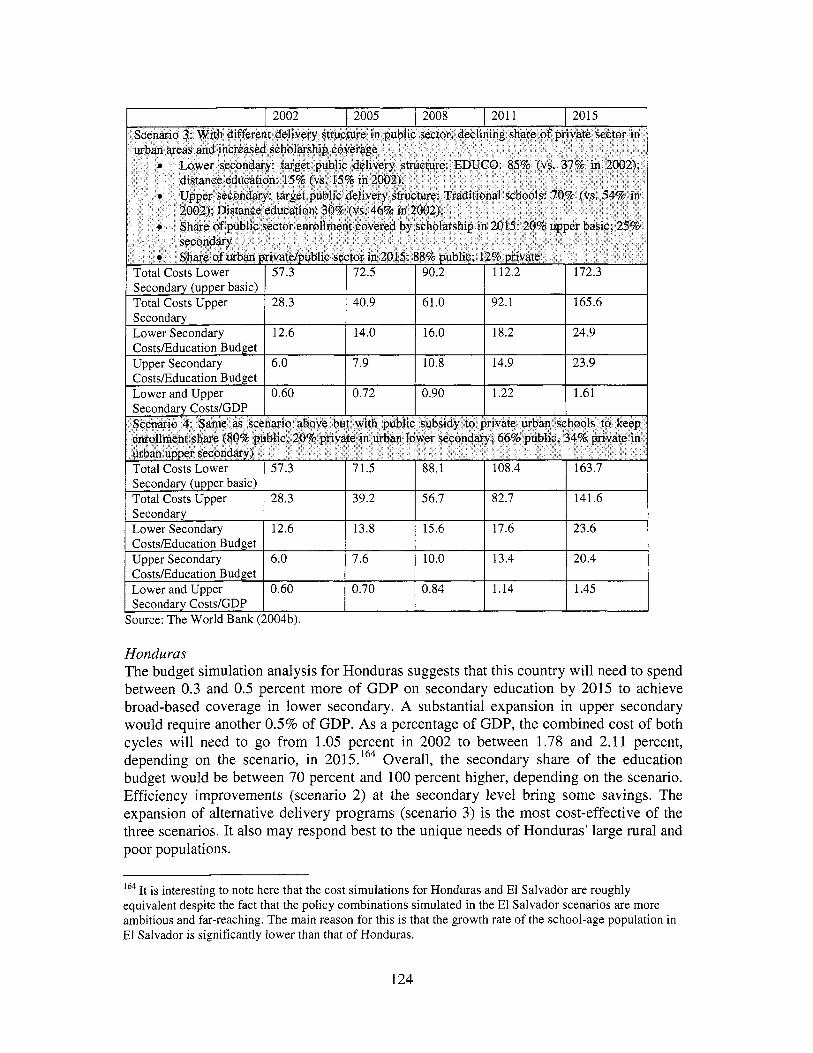
I 2002 I 2005 I2008 I 2011 I2015
CostsEducation-Budget I Upper Secondary I 6.0 I 7.9 I 10.8 I 14.9 I 23.9
Secondary (upper basic) Total Costs Upper 28.3 39.2 56.7 82.7 141.6 Secondary Lower Secondary 12.6 13.8 15.6 17.6 23.6 CostslEducation Budget Upper Secondary 6.0 7.6 10.0 13.4 20.4 CostsEducation Budget Lower and Upper 0.60 0.70 0.84 1.14 1.45 Secondary Costs/GDP
source: The World Bank (2004b).
Honduras The budget simulation analysis for Honduras suggests that this country w i l l need to spend between 0.3 and 0.5 percent more o f GDP on secondary education b y 2015 to achieve broad-based coverage in lower secondary. A substantial expansion in upper secondary would require another 0.5% of GDP. As a percentage o f GDP, the combined cost o f both cycles w i l l need to go from 1.05 percent in 2002 to between 1.78 and 2.11 percent, depending on the scenario, in 2015.'64 Overall, the secondary share o f the education budget would be between 70 percent and 100 percent higher, depending on the scenario. Efficiency improvements (scenario 2) at the secondary level bring some savings. The expansion of alternative delivery programs (scenario 3) i s the most cost-effective o f the three scenarios. I t also may respond best to the unique needs o f Honduras' large rural and poor populations.
I t i s interesting to note here that the cost simulations for Honduras and El Salvador are roughly equivalent despite the fact that the policy combinations simulated in the El Salvador scenarios are more ambitious and far-reaching. The main reason for this i s that the growth rate of the school-age population in E l Salvador i s significantly lower than that o f Honduras.
124
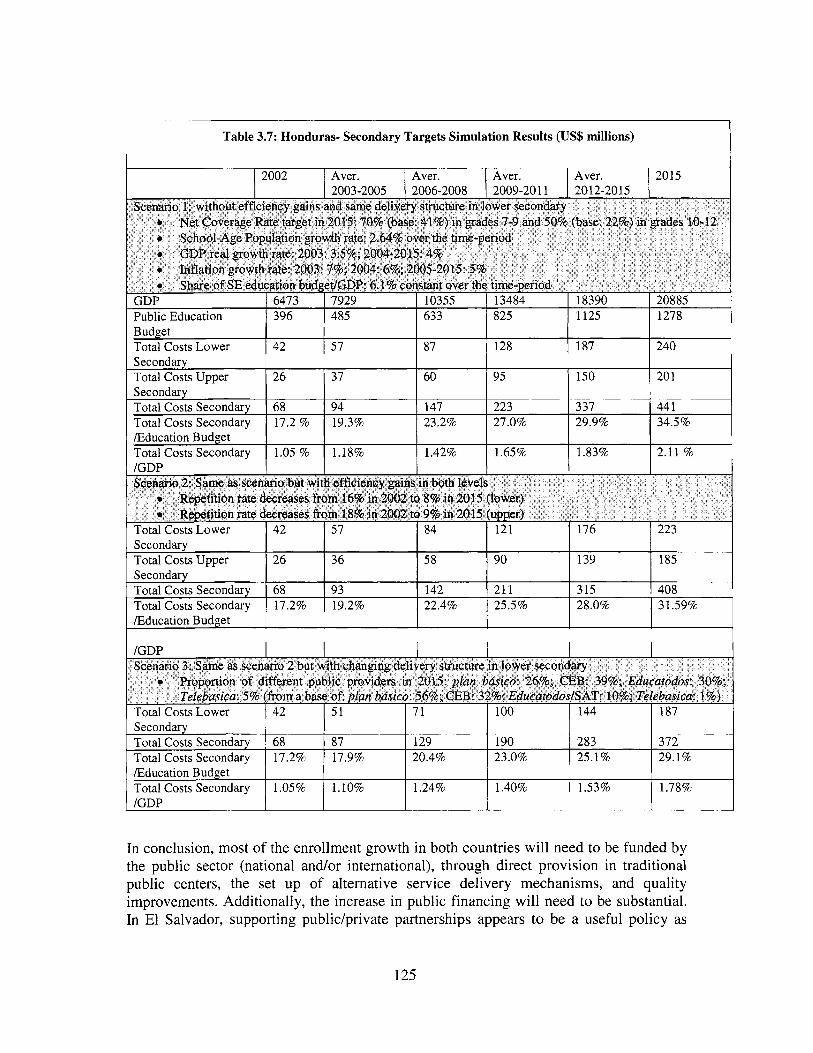
Table 3.7: Honduras- Secondary Targets Simulation Results (US$ millions)
I 2002 I Aver. I Aver. I Aver. I Aver. I2015
Secondary Total Costs Secondary Total Costs Secondary Education Budget Total Costs Secondary
Budget Total Costs Lower I 42 I 5 7 I 87 I 128 I 187 1 240
68 94 147 223 337 44 1 17.2 % 19.3% 23.2% 27.0% 29.9% 34.5%
1.05 % 1.18% 1.42% 1.65% 1.83% 2.11 %
Secondary Total Costs Upper 1 26 1 37 I 60 I 9 5 1 150 I 2 0 1
Total Costs Lower Secondary Total Costs Upper Secondary Total Costs Secondary Total Costs Secondary
42 57 84 121 176 223
26 36 58 90 139 185
68 93 142 21 1 315 408 17.2% 19.2% 22.4% 25.5% 28.0% 31.59%
I /cmP - 1 I I I I I I
Education Budget
. __.
Scenario 2: Same as scenario but with efficiency gains in both levels 0
0
Repetition rate decreases from 16% in 2002 to 8% in 2015 (lower) Repetition rate decreases from 18% in 2002 to 9% in 2015 (upper)
I
Secondary Total Costs Secondary Total Costs Secondary
68 87 129 190 283 372 17.2% 17.9% 20.4% 23.0% 25.1% 29.1 %
Education Budget Total Costs Secondary /GDP
1.05% 1.10% 1.24% 1.40% 1.53% 1.78%
In conclusion, most of the enrollment growth in both countries wi l l need to be funded by the public sector (national and/or international), through direct provision in traditional public centers, the set up of alternative service delivery mechanisms, and quality improvements. Additionally, the increase in public financing wi l l need to be substantial. In El Salvador, supporting publidprivate partnerships appears to be a useful policy as
125
does expanding demand-side subsidies.’65 In Honduras, in contrast, the primary focus of the country should remain on providing infrastructure and expanding alternative delivery mechanisms. Efficiency improvements w i l l also be particularly important in Honduras.
V. Conclusions
Expanding equitable coverage o f quality secondary education i s a critical priority for Central America. Secondary education is integral to both individual and national development and opportunities. The high rates o f return to upper secondary suggest that this level o f skilled labor i s highly demanded on the labor market. Whi le expanding the supply o f educated citizens can have the effect o f decreasing the rate o f return there i s significant reason to believe that skilled labor would attract foreign investment and promote growth in Central America enough to compensate or even outstrip any downward effect o f additional supply.
Secondary education should expand in the most broad-based way possible to minimize adverse effects on educational and socioeconomic inequality and maximize growth. Because of fiscal constraints there w i l l be some degree o f trade-off between improvements in primary and secondary. Efficiency improvements in primary can reduce the extent o f this trade-off but the necessary quality improvements at al l levels w i l l place additional burden on education budgets. At the very least, Nicaragua, Guatemala and Honduras should aim at encouraging broad-based expansion o f lower secondary by expanding equitable access to secondary education for those children who are now completing primary. El Salvador, a country with higher and more equitable lower secondary enrollment, should now aim at expanding upper secondary (while also pushing for full transition of the poor and very poor to lower secondary).
In order to expand secondary, countries w i l l have to address the unique combination o f constraints that currently limit enrollment. In this chapter we found the key constraints in Central America to include high private and opportunity costs to schooling, lack o f motivation due primarily to l ow relevance and quality o f lower secondary, and supply shortages. L o w test scores and low rates o f return to lower secondary are testament to the l o w quality and relevance o f this level, creating another barrier to enrollment. Supply o f secondary schools has expanded in recent decades but remains a challenge in rural areas.
165 This partnership could take the form of a public subsidy to some private schools to help them cover recurrent costs, such as teacher salaries, or to help them attend low-income students. In the first case, which i s the one depicted i n our scenarios, teachers’ salaries o f some private schools would be entirely financed by public funds which would allow them to keep on functioning and, hopefully, provide good quality education, retaining the existing upper-income students and attracting new middle-income students as coverage increases. The double advantage o f this intervention would be that, on the one hand, the public sector would s t i l l be saving because o f lower delivery costs in the private sector, on the other one, public sector delivery could be better targeted to lower income students, decreasing its middle-income bias. In the second case, closer to a voucher system, private schools would receive a subsidy that would cover the schooling l i fe o f a low-income student, and, as such, cover tuition fees and other private costs, as well as a portion of schools’ salaries: less students, overall, would be covered, but this system would s t i l l make i t possible to reduce the burden on the public sector (although to a lesser extent) and, above all, foster more socio-economic diversity i n schools rather than the socio-economic segmentation that the first model would produce.
126

I t i s particularly acute at the upper secondary level. In all cases these constraints disproportionately affect lower income people. Lower income groups attend poorer quality schools, have lower rates of return, higher age by grade distortion, and face more acute economic and work-related barriers.
Because of the diverse range of barriers to equitable high-quality secondary coverage, countries need to address this regional priority with policy packages that respond to the unique needs of their specific country. In the policy options section and cost simulations section of this chapter we saw that the most effective and efficient policy combination
by country. The main components of these policy combinations include:
An increase in public financing for secondary education. This i s a key condition for broad-based secondary coverage in all countries. Simulations undertaken for El Salvador and Honduras show that reaching satisfactory coverage targets in both countries wi l l require an increase by about 1 percent o f the secondary education share in terms of GDP over the 2002-2015 time period.
An increase in traditional public supply. The bulk of secondary expansion should be provided by public sphere in Central America although innovations in public service delivery are a promising form o f public supply. Promoting basic education centers, with all three sub-cycles of basic education, i s a promising intervention that has been relatively successful in El Salvador. In rural areas, promoting school networks up to grade 9 or even grade 11 or 12 andor community-based schools could also be a viable cost-efficient option.
An increase in public-private sector partnerships. In countries where private schools are more cost-effective than public schools there may be scope for encouraging public financing/private delivery systems. In practice, this may mean covering part of the recurrent costs o f private schools to have them accept middle or low-income students. The presence of idle capacity in the private sector, as in El Salvador, makes these partnerships more promising financially, since little new investment i s necessary. The El Salvador simulation suggests that this i s a good policy option for that country.
An increase in non-traditional public supply, such as distance education, in rural areas, can ensure coverage with flexibility. A program like Educatodos seems to be particularly relevant in this context, but others alternative education programs, in urban areas, for example, should be further explored. An accreditation system, ensuring comparable quality between traditional and non-traditional delivery models, needs to be put in place. Non-traditional supply appears to be a valid option for all four countries.
An increase in the quality and relevance of secondary education. Improving the relevance o f lower secondary i s particularly urgent in all countries. All the measures suggested in the previous chapter on education quality apply to this sub- cycle. Upper secondary quality and i ts relevance to labor market needs should
127
also be improved. Countries need to think carefully about the structure and main objectives of secondary, particularly in terms of the age-old debate on technical- vocational versus academic secondary. This subject, however, has not been discussed in this report.
(f) An increase in demand-side subsidies, including targeted scholarship programs and conditional and targeted cash transfers. These programs would be particularly useful in countries with relatively high tuition levels or other private costs o f schooling.
128

Chapter IV: A Review of Education Expenditure in Central America
How much money countries devote to their education systems, how that money i s distributed between different education levels and programs, and the efficiency with which i t i s used to promote the final objectives o f education are critical areas to understand and assess. The amount, distribution, and efficiency o f education expenditure affect educational coverage, quality, and equity.
In this chapter we look at some of the different aspects of educational expenditure. The first section looks at the overall level of public education funding in the four Central American countries, comparing them with the Latin American average and Costa Rica. The second section examines how public education funding i s distributed across education levels. The third section looks at equity challenges in the region that arise from per student expenditure and enrollment distributions at the various education levels. The fourth section deals with household education expenditure. The fifth section investigates the efficiency of education spending, focusing in on cost-effectiveness in the four countries and on the effectiveness of the distribution of expenditures across spending- type. Finally, the sixth explores the issue of external education funding. The conclusion of the chapter reviews main findings and presents several areas of intervention.
1. Public Education Spending: Levels and Evolution
While government spending on public education has been growing over the past decade in Central America i t i s s t i l l low both as a proportion of GDP as well as on a per-child basis.
Table 4.1: Public Education Expenditure in Proportion of GDP (%) (a)
Notes:(a) Public expenditure on education includes all public funds channelled to the educational system through public institutions, therefore including both national and external public funds. (b) New classification (only education expenditure, and excludes social security and public debt). (c) with official GDP data: (d) with "unofficial" GDP data. There is some agreement that GDP figures may be underestimated by as much as 70%, this second data series reflects this under- estimation (e) Public expenditure includes public funds channelled only through the Ministry of Education (including both national and external public funds). Sources: El Salvador: WB WDI and LAC Database: Ministerio de Hacienda: CEPAL population estimates Guatemala: Banguat, Ministry of Finance, and Planning Unit, Ministry of Education; 2001 -2003: CIEN. New classification: MFP and Bank of Guatemala. Honduras: 1990-1996:"Estudio Sectorial Plan Decenal'; 1997- 1998: UNAT 2001 ; 1999-2002: SIAFI; IMF Financial Statistic different volumes Nicaragua: 1995-2000: MCHP and Central Bank, as reported in Arcia (2003); 2001-2002: Directorate of Finance, MECD. Costa Rica: Central Bank, Ministry of Finance and ICEC (National Statistical Office).
129
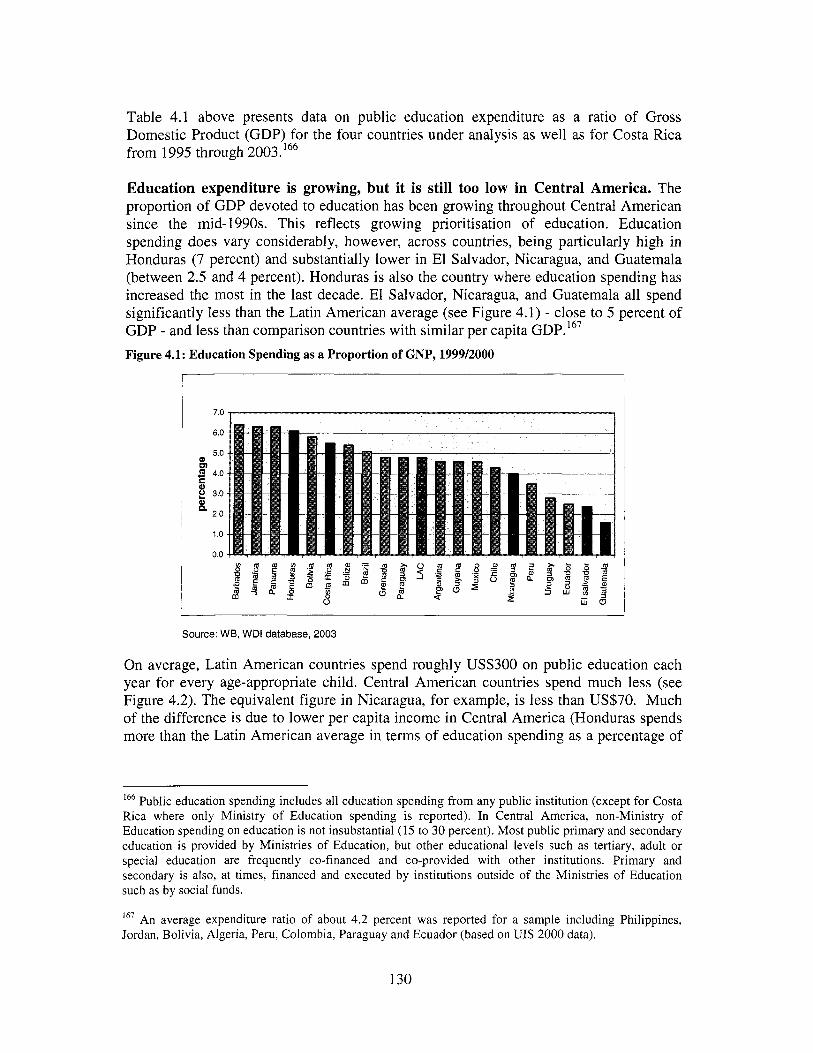
Table 4.1 above presents data on public education expenditure as a ratio o f Gross Domestic Product (GDP) for the four countries under analysis as well as for Costa Rica from 1995 through 2003.'66
Education expenditure i s growing, but i t i s s t i l l too low in Central America. The proportion o f GDP devoted to education has been growing throughout Central American since the mid- 1990s. This reflects growing prioritisation o f education. Education spending does vary considerably, however, across countries, being particularly high in Honduras (7 percent) and substantially lower in El Salvador, Nicaragua, and Guatemala (between 2.5 and 4 percent). Honduras i s also the country where education spending has increased the most in the last decade. El Salvador, Nicaragua, and Guatemala al l spend significantly less than the Latin American average (see Figure 4.1) - close to 5 percent o f GDP - and less than comparison countries with similar per capita GDP.'67 Figure 4.1: Education Spending as a Proportion of GNP, 1999/2000
I 7 0 1 1 ' 6 0
5 0
~ 8 4 0 c
3 0 0) n
I 2 0 I
1 0
0 0
Source: WB, WDI database, 2003
On average, Latin American countries spend roughly US$300 on public education each year for every age-appropriate child. Central American countries spend much less (see Figure 4.2). The equivalent figure in Nicaragua, for example, is less than US$70. Much o f the difference i s due to lower per capita income in Central America (Honduras spends more than the Latin American average in terms o f education spending as a percentage o f
166 Public education spending includes all education spending from any public institution (except for Costa Rica where only Ministry of Education spending i s reported). I n Central America, non-Ministry of Education spending on education i s not insubstantial (15 to 30 percent). Most public primary and secondary education i s provided by Ministries of Education, but other educational levels such as tertiary, adult or special education are frequently co-financed and co-provided with other institutions. Primary and secondary i s also, at times, financed and executed by institutions outside o f the Ministries of Education such as by social funds.
167 An average expenditure ratio of about 4.2 percent was reported for a sample including Philippines, Jordan, Bolivia, Algeria, Peru, Colombia, Paraguay and Ecuador (based on UIS 2000 data).
I 3 0
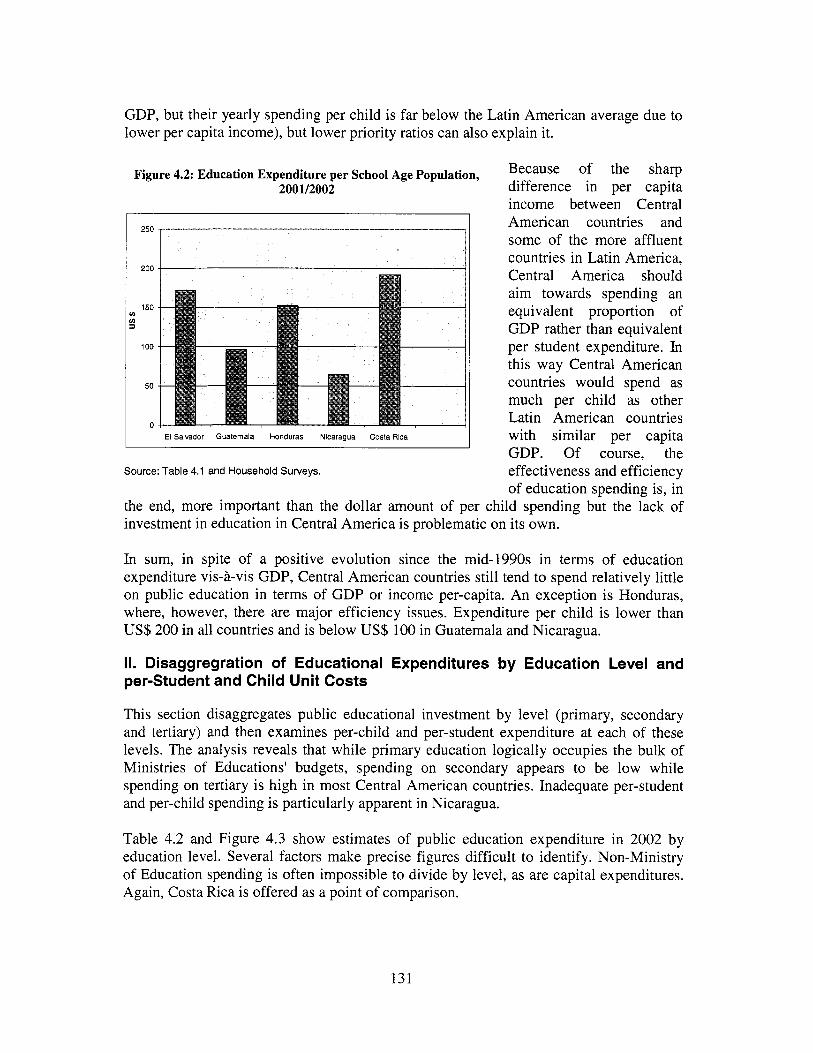
GDP, but their yearly spending per chi ld i s far below the Latin American average due to lower per capita income), but lower priority ratios can also explain it.
Figure 4.2: Education Expenditure per School Age Population, 2001/2002
150 e n
100
50
0 El Salvador Guatemala Honduras Nicaragua Costa Rica
Source: Table 4.1 and Household Surveys.
Because of the sharp difference in per capita income between Central American countries and some o f the more affluent countries in Latin America, Central America should aim towards spending an equivalent proportion of GDP rather than equivalent per student expenditure. In this way Central American countries would spend as much per chi ld as other Latin American countries wi th similar per capita GDP. Of course, the effectiveness and efficiency o f education spending is, in
the end, more important than the dollar amount o f per chi ld spending b i t the lack o f investment in education in Central America i s problematic on its own.
In sum, in spite o f a positive evolution since the mid-1990s in terms of education expenditure vis-&vis GDP, Central American countries s t i l l tend to spend relatively little on public education in terms o f GDP or income per-capita. An exception is Honduras, where, however, there are major efficiency issues. Expenditure per chi ld i s lower than US$200 in all countries and i s below US$ 100 in Guatemala and Nicaragua.
II. Disaggregration of Educational Expenditures by Education Level and per-Student and Child Unit Costs
This section disaggregates public educational investment by level (primary, secondary and tertiary) and then examines per-child and per-student expenditure at each o f these levels. The analysis reveals that while primary education logically occupies the bulk o f Ministries o f Educations' budgets, spending on secondary appears to be low while spending on tertiary i s high in most Central American countries. Inadequate per-student and per-child spending i s particularly apparent in Nicaragua.
Table 4.2 and Figure 4.3 show estimates o f public education expenditure in 2002 b y education level. Several factors make precise figures dif f icult to identify. Non-Ministry o f Education spending i s often impossible to divide by level, as are capital expenditures. Again, Costa Rica i s offered as a point o f comparison.
131
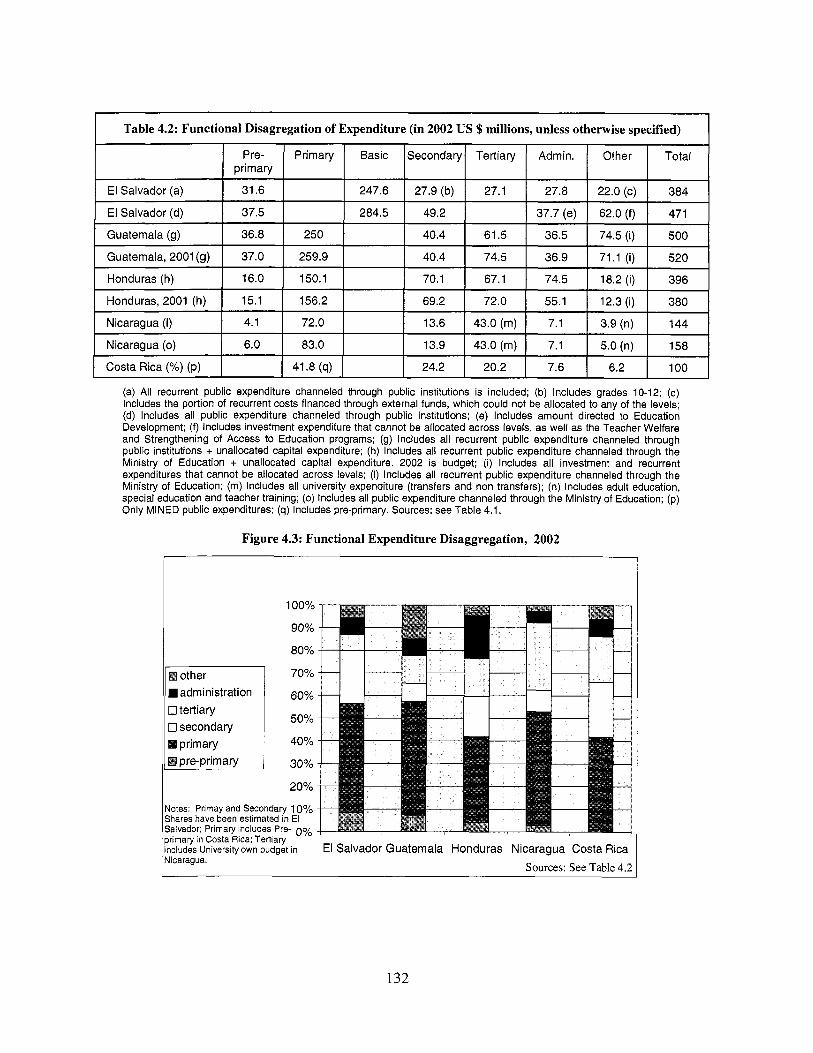
El Salvador (a)
Pre- Primary Basic Secondary Tertiary Admin. Other Total
31.6 247.6 27.9 (b) 27.1 27.8 22.0 (c) 384
primary
I Guatemala, 2001(!$ I 37.0 I 259.9 I 1 40.4 I 7 4 . 5 I 36.9 I 71.1 fi) I 520 I
El Salvador (d)
Guatemala (9)
~~~ ~~
37.5 284.5 49.2 37.7 (e) 62.0 (f) 471
36.8 250 40.4 61.5 36.5 74.5 (i) 500
Honduras (h)
Honduras, 2001 (h)
(a) All recurrent public expenditure channeled through public institutions is included; (b) Includes grades 10-12; (c) Includes the portion of recurrent costs financed through external funds, which could not be allocated to any of the levels; (d) Includes all public expenditure channeled through public institutions; (e) Includes amount directed to Education Development; (f) Includes investment expenditure that cannot be allocated across levels, as well as the Teacher Welfare and Strengthening of Access to Education programs; (9) Includes all recurrent public expenditure channeled through public institutions + unallocated capital expenditure; (h) Includes all recurrent public expenditure channeled through the Ministry of Education + unallocated capital expenditure. 2002 is budget; (i) Includes all investment and recurrent expenditures that cannot be allocated across levels; (I) Includes all recurrent public expenditure channeled through the Ministry of Education; (m) Includes all university expenditure (transfers and non transfers); (n) Includes adult education, special education and teacher training; (0) Includes all public expenditure channeled through the Ministry of Education; (p) Only MINED public expenditures; (4) Includes pre-primary. Sources: see Table 4.1.
16.0 150.1 70.1 67.1 74.5 18.2 (i) 396
15.1 156.2 69.2 72.0 55.1 12.3 (i) 380
Figure 4.3: Functional Expenditure Disaggregation, 2002
Nicaragua (I)
Nicaragua (0)
Costa Rica (%) (P)
administration
4.1 72.0 13.6 43.0 (m) 7.1 3.9 (n) 144
6.0 83.0 13.9 43.0 (m) 7.1 5.0 (n) 158
41.8 (4) 24.2 20.2 7.6 6.2 100
100%
90%
80%
70%
60%
50%
40%
30%
20%
Notes: Prirnay and Secondary 10% Shares have been estimated in El Salvador; Primary includes Pre- 0% primaly in Costa Rica; Tertialy includes University own budget in Nicaragua.
El Salvador Guatemala Honduras Nicaragua Costa Rica Sources: See Table 4.2
132
Primary education is the bulk of education budgets in all countries. All four countries spend between 40 and 50 percent o f the public education budget on primary education. This high share i s logical in that primary education i s clearly the first priority of all countries and it has by far the largest enrollment.
Low shares spent on secondary. In contrast, the share directed to secondary education i s much lower, fluctuating between roughly 8 and roughly 25 percent o f the total public education budget. Secondary shares are higher in El Salvador and Costa Rica where secondary i s more prioritized and has higher enrollment rates. All Central American countries spend a smaller roportion on secondary than the Latin American average, which i s about 30 percent.16' This fact i s probably both a contributing factor toward and a result o f low enrollment in secondary in Central America (see Chapter HI).
Relatively high shares are spent on tertiary in Central America. The tertiary share fluctuates substantially across countries, ranging from 7 percent in El Salvador to 30 percent in N i ~ a r a g u a . ' ~ ~ I t i s interesting to note that the three poorest countries spend as much or even more on tertiary as they do on ~econdary.'~'
Administration costs are likely to be under-estimated in all countries in that some administrative costs are covered by institutions outside the Ministries o f Education and are, therefore, not easy to track. From the limited data we have, however, i t appears that administration costs are relatively contained in all countries, except in Honduras where more i s spent on educational administration than i s spent on secondary education.
Per-child and per-student spending. Missing from the previous information on how education expenditure i s divided by level i s an understanding of what this means for per child and per-pupil public expenditure. As we've seen throughout this paper enrollment rates are very different in primary, secondary and tertiary institutions. B y comparing recurrent public expenditure for each of the levels to the number of school-age children and students enrolled in the public system for each of these levels we obtain expenditure per school-age population and per student by education level, two indicators that provide a more insightful picture of the actual level of resources available for each level. Figure 4.4 (and Table 10.1 in Annex X) compare expenditure per child and student across levels and countries.
"?See ECLAC (1994, 1996). 16' In Nicaragua, education level budget disaggregation defined tertiary education considered quite broadly, contributing, in part, to the high percentage o f spending identified as going to this level.
Argentina, Chile, Uruguay and Colombia spent approximately 20% of their education budget on tertiary education in the time-period 1994-2000 (see various World Bank Country Public Expenditure Reviews). This i s in the range of what these three, much poorer countries, spend.
133

Figure 4.4: Expenditure per Child and Student, 2001/02 Primary. For educa- tion levels that lack universal enrollment (Source: Table 10.1 Annex X and Household Surveys)
(particularly secondary and tertiary) we would expect per- student expenditure to be higher than per- chi ld expenditure. In a hypothetical situation
universal enrollment and zero repetition per-student
per-child expenditure would be
As enrollment decreases
per- student w i l l be higher than expenditure per
child. As repetition rates increase expenditure per-student w i l l drop relative to expenditure per-child. Similar expenditure per chi ld and student in Honduras and Nicaragua suggests high repetition rates. Reducing repetition would increase per student expenditure, funds that could be invested in improving the quality o f education and ensuring that all students complete the cycle. The higher per-student expenditure in Guatemala, in spite o f high repetition rates, reinforces the continuing unmet challenge o f universal primary enrollment in the country'71.
Per-student ex enditure at the primary level has increased in most countries over the last several years. Significant rises in teachers' salaries explains, to a large extent, this increase in per-pupil primary expenditure. In spite o f this increase, however, an international comparison suggests that all Central American countries, except Honduras, spend below average on primary given their per-capita income (Figure 4.5).
R 2
17' For El Salvador, expenditure per student i s higher because we are considering basic education, where there are drop-outs, instead of primary. "* Per-pupil public primary expenditure rose roughly 20 percent in Guatemala in the 1996 to 2001 time period (CIEN, 2003), 40 percent in Costa Rica between 1998 and 2002 (Sanigest, 2003) and 35 percent (in basic education) in E l Salvador in the 1996 to 2002 time period (The World Bank, 2004b).
134

Figure 4.5: Public Education Expenditure per Student in % of GDP per capita, 2000
1 & $ G-O +&@ $8 b'b' +Go 6 &$ ,0 .$b ,6+&9 +e 'b $9" 6." e5 *o 9
40
35
o f significant cost. Nicaragua is, however, an exception.
30
25
20
15
I 10
5
Figure 4.4 shows that per- student spending in Nicaragua is higher in
primary than in secondary. One explanation for the low per-pupil unit costs o f secondary in Nicaragua i s simply that the country has invested insufficiently at this level. A second explanation relates to the relative priority given to coverage versus quality in secondary education: although expenditure per-child in secondary i s also lower in Nicaragua than in the other countries, the gap i s much greater for expenditure per-student, suggesting that the limited resources devoted to secondary have been focused at expanding enrollment rather than spending more on each chi ld who is enrolled. The low per-pupil spending i s sure to have clear implications on secondary education quality.
Source: OECD (2002) and Table 10.1 - Notes: Central America 2002 or 2001 data
In all countries expenditure per chi ld i s dramatically lower than expenditure per pupil at the secondary level. This reflects the severe secondary coverage gap discussed in the previous chapter and underscores again the importance o f the priority o f increasing secondary enrollment in a broad-based manner.
Notably, there has been l i t t le or no gain in per student expenditure at the secondary level over the last several years in most o f Central America.'73 Expanding secondary coverage, although s t i l l limited, contributes to explain this stagnation.
Tertiary. Finally, although not shown in the graph, per-student expenditure i s particularly high at the tertiary level (see Table 10.1 in Annex X). In Honduras, for example per-student public recurrent expenditure i s US$933 at the tertiary level whereas the equivalent figure for per-child expenditure i s US$ 140. Certainly, unit costs at the tertiary level are bound to be higher than at the secondary or primary level but this huge public investment in tertiary education is socially regressive as w i l l be discussed further below.
'73 Secondary spending has stagnated in Nicaragua, Guatemala and El Salvador since 1998.
135

111. Equity Challenges in Terms of Per-Capita Education Expenditure
The distribution o f public expenditure across socio-economic strata, geographic areas, and other divisions has important implications on the equity o f education delivery. This section looks at how per chi ld spending at the various educational levels compares with how enrollment i s distributed across income groups at those same levels. This analysis reveals that much o f educational provision in Central America i s socially regressive in that i t invests disproportionately in children of wealthier backgrounds. This i s particularly true at the secondary and tertiary levels, whereas public primary provision i s relatively progressive. This fact raises serious equity concerns since public education i s financed with general tax revenues.
The section first looks at the distribution o f public enrollment according to income quintiles in order to determine the levels o f participation o f the different income quintiles in the sector. This analysis i s followed by a calculation o f levels and distribution o f spending across income groups, based on unit costs per educational level.
A. THE DISTRIBUTION OF PUBLIC ENROLLMENT AND SCHOOL-AGE POPULATION ACROSS INCOME QUINTILES
There are many fewer poor children in public secondary and tertiary schools than in public primary schools. The lines in Figure 4.6 represent the proportion o f public enrollment that serves children from each income quintile (see also Tables 10.2-10.5 in Annex X). In primary schools and pre-primary schools the poorer income quintiles tend to have the highest proportion o f enr01lment. l~~ This i s because children from wealthier families are more l ikely to enroll their children in private schools. At the secondary and tertiary levels, however, enrollment i s concentrated in the top income quintiles. Confirming the results presented in Chapter 111, the distribution o f secondary enrollment appears to be concentrated in the middle-upper class in al l countries (quintile 4), wi th El Salvador having a somewhat more balanced distribution favoring the three middle quintiles. At the tertiary level the highest proportion o f students come from the wealthiest quintile. These patterns are true for all four Central American countries.
Public delivery i s well targeted in primary, but poorly targeted in secondary and tertiary. Public education, which should provide access to schooling for all children, particularly those whose families can not afford to send them to private schools, i s fulfilling its role fairly well at the primary level but much less satisfactorily in secondary and tertiary education. The situation i s aggravated when we compare the distribution of public enrollment with the distribution o f school age population by income quintiles.
'74 Each o f the enrollment levels, which were produced on the basis o f the household surveys for distinct years, are not the ones that were used for the calculation o f the expenditure per student, where MINED official data were used for sometimes also different years. Discrepancies can then occur when recalculating unit costs on the basis of these enrollment data (in particular in Honduras). Note that the 2003 household survey was used in Honduras instead o f the 2002 one because it i s the only survey which differentiates between private and public enrollment.
136
I t i s usually the case that school-age population, in particular in the younger age range, is not distributed evenly across quintiles, but has a higher incidence in the lowest income quintiles. This i s largely because poorer families tend to have more children. B y comparing the relative public enrollment shares of each quintile with i t s school-age population share, we capture with more precision how well or badly targeted i s public delivery.
The bars in Figure 4.6 represent the proportion of the age-appropriate population that belong to each income quintile. This Figure illustrates that at the primary level the two lowest income quintiles tend to make a more than proportional use o f public delivery, compared to their school-age population share (although this i s less true for Guatemala); while the highest quintile makes a less than proportional use of public delivery, compared to i t s school-age population share (and, by converse, i t makes a much more proportional use of private delivery in all countries - although these figures are not shown here). As a result, we are not surprised to find a gross enrollment rate roughly equitably distributed across quintiles in all countries (with the exception o f Guatemala), as indicated in Chapter I.
In contrast, at the secondary level, the two lowest income quintiles make a less than proportional use o f public delivery, compared to their school-age population share (although this i s less true for El Salvador); while the fourth quintile makes a much more than proportional use of public delivery, compared to i t s school-age population share (also less so in El Salvador). The highest quintile also tends to make a more than proportional use o f public delivery although less so because of i t s much more than proportional access to the private sector (see Chapter III). As a result, the secondary gross enrollment rate i s fairly inequitably distributed across quintiles, as shown in Chapter I (again, less so in El Salvador). Finally, the highest quintile makes a much more than proportional use o f public delivery at the tertiary level.
137
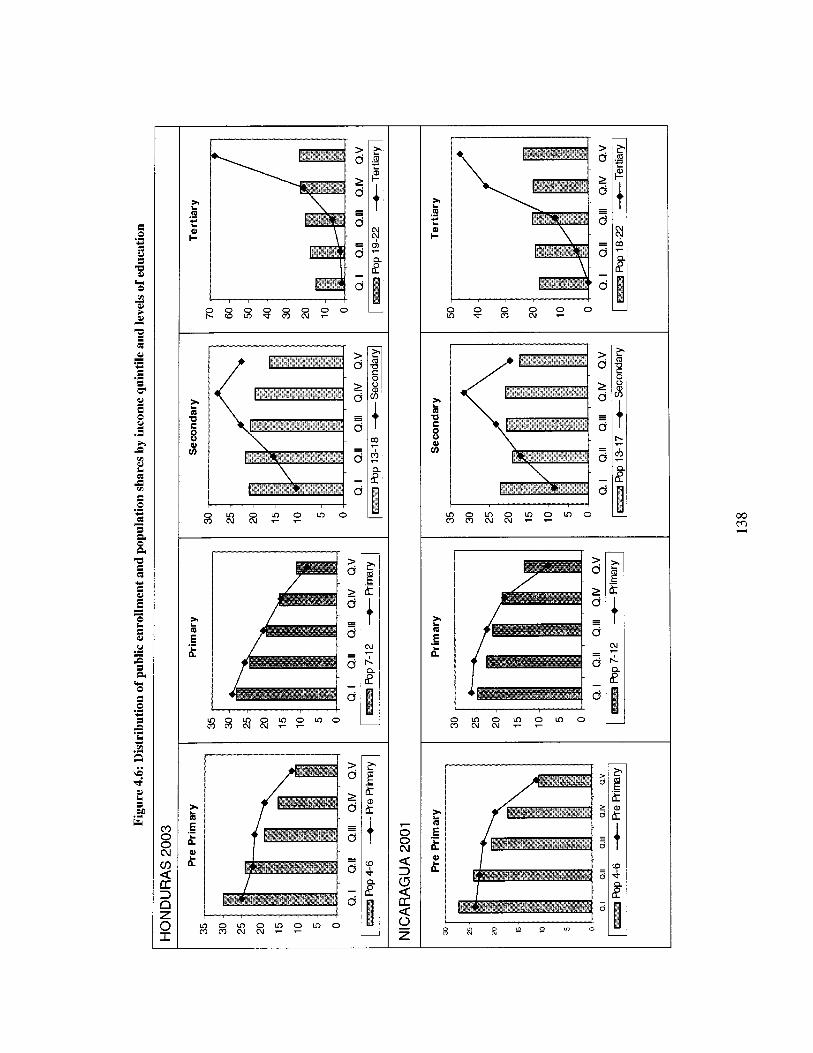
t l
? If 0 , ;
/ I

-
* m '0 E
L
8 ii
0 0 0 0 0 0 0 0 0 0 u ( 5 ) 0 0 ~ ( 0 m t m ( U ~
? U
P m
- I d

B. PUBLIC SUBSIDY PER SCHOOL-AGE POPULATION BY QUINTILE
In Tables 4.3 and 4.4 we calculate the public subsidy per school-age population by quintile for each country and for primary and secondary (where we have the most reliable unit costs). We find that while the public education subsidy at the primary level i s slightly progressive (Le. invests more heavily in the poor), the public education subsidy at the secondary level i s tremendously regressive, awarding three to four times the amount of public dollars to wealthy children as i t does to poor children.
To calculate the public education subsidy for different income quintiles at different education levels we make the im erfect assumption that per-student expenditure per student across quintiles i s uniform!75 We then divide total education expenditure across income quintiles according to their relative public enrollment share. Finally, we obtain per-capita expenditure by dividing the amount per quintile by the school-age population of each of the quintiles. The tables show the distribution of public spending for primary and secondary education, the percenta e of the spending that i s captured by each quintile and the resulting per capita subsidies. 1%
The primary education public subsidy i s progressive but the secondary education subsidy i s regressive. The per-capita public subsidy at the primary level i s fairly similar across the f i rs t four quintiles (this i s because the enrollment share generally parallels the population share by income quintile as seen above at the primary level). This i s somewhat less so in Guatemala. In general across countries, the public primary subsidy i s lower for the richest quintile because of their lower enrollment proportion. Therefore, in per capita terms, public primary spending continues to be progressively distributed, although not highly so. The situation changes quite dramatically at the secondary level, where, in al l countries except El Salvador, the per capita public subsidy i s three or even four times higher for the fourth than for the f i rs t quintile (and about 3 times higher for the fifth quintile) due to the disconnection between enrollment and population shares. In El Salvador, the public subsidy i s relatively more evenly distributed, although i t i s s t i l l regressive.
Fair access to primary schooling does not mean fair access to quality schooling. Although the public subsidy seems to be relatively progressively distributed at the primary level, and the gross enrollment rate i s quite homogenous across quintiles, there are s t i l l reasons to believe that even at the primary level public education expenditure i s not distributed progressively enough. Unit costs are higher for poor students than they are
In fact, the different quality o f the schools attended by the poor and the possible targeted interventions to the poor should both be considered and would alter unit costs per quintile. 176 Care should be given when comparing the total amounts per level with the ones o f Table 4.2. These total amounts have been obtained by multiplying expenditure per student b y the total public enrollment as reported in the household surveys. Additionally, the year o f the per student expenditure and o f the enrollment do not always coincide exactly. Discrepancies occur in particular at the secondary level and for both Honduras (whose enrollment figures were particularly high in 2003) and El Salvador (where the unit cost in upper secondary i s multiplied by the enrollment o f the whole secondary cycle). In any case, the distribution o f the public subsidy across quintiles i s what really matters here.
140
for wealthy students as poor children do not have the cultural and economic capital provided to wealthy students in their homes and communities. Concretely, poor children need more learning materials and better teachers than wealthy students in order to make up for disadvantages they bring with them to the classroom. Recent analysis showing that poor students are much more affected b y educational inputs (teacher quality, educational infrastructure, etc) confirms this.
In contrast, available evidence suggests that the public schools poor children attend tend to be o f lower quality than those that wealthy children attend. High dropout and repetition rates in poor students signal that education systems are frequently fai l ing these children. Lower rates o f return for the poor further indicate that their schools may be o f inferior quality. I t i s likely, in fact, that the assumption we made to calculate the public subsidy estimates is problematic and that per-student education expenditure i s lower, on average, for poorer students.
If this i s the case, our analysis i s over-estimating the progressiveness o f public expenditure. If we assumed that public expenditure was about 20 percent lower in the first quintile (and 5 percent higher in the remaining four quintiles to ensure a similar average expenditure per student), we would find that there i s only a marginal difference between the first and fifth quintile and that the public subsidy per capita is higher for the middle-class than for the poor in all countries.
Poor students need more public investment at the primary level. Public delivery, therefore, provides fair access to the poor in primary as judged by equal proportionally correct enrollment in primary according to the age-appropriate population (although this i s somewhat less true in Guatemala). But, judging from educational outcomes o f the poor (in particular in terms o f completion), public education delivery i s not necessarily providing fair quality schooling. Although expenditure may not be the first determinant o f quality (many improvements, in particular related to management, do not require more funds), there i s ground for ensuring higher expenditure per poor student (in terms o f teaching materials, teacher education, etc). Furthermore, in Guatemala, fair access to primary schooling, in particular for the second quintile, has s t i l l not been achieved.
Broad-based expansion of coverage i s needed in secondary education in order to correct the current regressive public subsidy. At the secondary level, the public subsidy per capita i s already very inequitably distributed, as are gross enrollment and completion rates. If our calculations over-estimate the public subsidy to the poor than this inequality i s even greater. The key issue for the secondary level i s how to provide wider access to schooling for the middle-lower and lower classes. This topic has already been dealt with in Chapter 111. Essentially, in al l Central American countries, greater public spending at the secondary level should be funneled into expanding access to quality secondary to, at least, the three middle quintiles - as is currently the case in El Salvador.
141
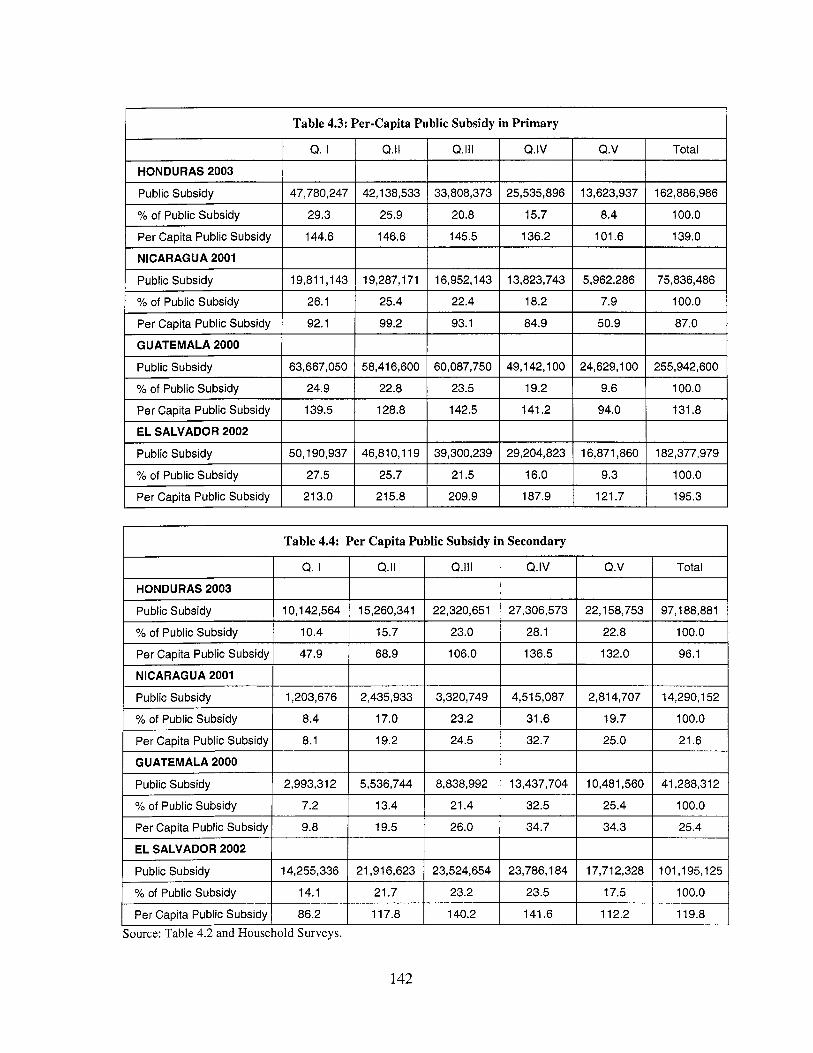
Q. I Q.II Q.III Q.IV Q.V Total
G b i c Subsidv I 29.3 I 25.9 I 20.8 I 15.7 I 8.4 I 100.0 I
HONDURAS 2003
Public Subsidy
I Per Capita Public Subsidy I 144.6 I 146.6 I 145.5 1 136.2 I 101.6 I 139.0 I
47,780,247 42,l 38,533 33,808,373 25,535,896 13,623,937 162,886,986
IAGUA 2001 I I I I I I I
Yo of Public Subsidy
Per Capita Public Subsidy
1 Public Subsidy
24.9 22.8 23.5 19.2 9.6 100.0
139.5 128.8 142.5 141.2 94.0 131.8
I 19,811,143 I 19,287,171 I 16,952,143 I 13,823,743 I 5,962,286 I 75,836,486 I
EL SALVADOR 2002
Public Subsidy
G b l i c Subsidv 1 26.1 I 25.4 I 22.4 I 18.2 I 7.9 I 100.0 I
50,190,937 46,810,l 19 39,300,239 29,204,823 16,871,860 182,377,979
I Per Capita Public Subsidy I 92.1 I 99.2 I 93.1 I 84.9 I 50.9 1 87.0 I
~
Yo of Public Subsidy 27.5 25.7 21.5 16.0 9.3 100.0
Per Capita Public Subsidy 213.0 21 5.8 209.9 187.9 121.7 195.3
IEMALA 2000 I I I I I I I
Public Subsidy
Yo of Public Subsidy
I Public Subsidy
10,142,564 15,260,341 22,320,651 27,306,573 22,158,753 97,188,881
10.4 15.7 23.0 28.1 22.8 100.0
I 63,667,050 I 58,416,600 I 60,087,750 I 49,142,100 I 24,629,100 I 255,942,600 I
~
Per Capita Public Subsidy 47.9 68.9 106.0 136.5 132.0 96.1
NICARAGUA 2001
Public Subsidy
Yo of Public Subsidy
Per Capita Public Subsidy
GUATEMALA 2000
1,203,676 2,435,933 3,320,749 4,515,087 2,814,707 14,290,152
8.4 17.0 23.2 31.6 19.7 100.0
8.1 19.2 24.5 32.7 25.0 21.6
Public Subsidy
Yo of Public Subsidy
Table 4.4: Per Capita Public Subsidy in Secondary I
2,993,312 5,536,744 8,838,992 13,437,704 10,481,560 41,288,312
7.2 13.4 21.4 32.5 25.4 100.0
I HONDURAS 2003
Per Capita Public Subsidy
EL SALVADOR 2002
9.8 19.5 26.0 34.7 34.3 25.4
Public Subsidy
Yo of Public Subsidy
14,255,336 21,916,623 23,524,654 23,786,184 17,712,328 101,195,125
14.1 21.7 23.2 23.5 17.5 100.0
Per Capita Public Subsidy 86.2 117.8 140.2 141.6 112.2 119.8
142

Reduction in the public subsidy for tertiary education. Finally, due to the highly regressive nature of the public subsidy in tertiary education it would make sense in countries such as Honduras, Nicaragua and Guatemala, which spend as much or more in tertiary as they do in secondary education, to decrease the amount o f public expenditure at that level. This is, however, a very sensitive and political subject in Central America and wi l l be difficult to modify in the short or medium term. Ideally, an effective system would be implemented in which students who could afford to do so would contribute more co-financing at public universities and the share of quality private universities would expand. This i s easier said than done given the pressures that exist in all countries for the financing of the public university system. This measure seems, however, unavoidable if countries wish to significantly improve the equity of public education subsidies.
IV. Private Household Education Expenditures Also Demonstrate Inequitable Education Financing
An important factor that contributes to low enrollment of the lower income quintiles - particularly at the secondary level - both in the public and private sector, i s the magnitude o f both direct and indirect private costs of schooling. This section looks at the magnitude and composition of household costs of education. Included in private household costs are such things as school fees, learning materials and books, exam fees, and uniforms.
Tables 4.5 and 4.6 show annual private household expenditures on education by income quintile in real terms and as a proportion of annual household income.177 They show that, while contained at the primary level, private costs to schooling are more substantial at the secondary level.
Private household education costs can be prohibitive to the poor, particularly in Guatemala and El Salvador. In Guatemala, the financial burden o f secondary education i s heavy for the first (poorest) quintile and substantial for the second one. In El Salvador, the burden i s substantial for the poorest quintile. Compounding this difficulty i s the fact that most families throughout Central America, particularly poor families, tend to have multiple school-age children. In Guatemala, an average household has more than three children between ages 1 and 15. A poor family with three children of respectively 8, 13 and 16 would have to spend 145 percent of i t s household income to send their children to In El Salvador, a similar family would have to spend about 40 percent of i t s income. In Nicaragua, private costs appear significantly 10wer . l~~ There, a family with three children would only spend about 10 percent o f household income to keep their children in school. The removal o f all compulsory fees in Nicaragua in 2002 probably contributes to explain these findings. Recall, however, from Chapter 111, that household expenditure for
177 No data was available for Honduras, unfortunately. 17* Such an analysis for Guatemala i s confirmed by Edwards (2004), who concludes that a key reason for low coverage at the secondary level i s undoubtedly related to the high direct, out-of-pocket cost of schooling. Edwards also highlights the sudden discontinuity in direct costs as key factor crucial in the decision of poorer students to not continue their studies. Using our data to illustrate this concept, a poor student having attended public primary schooling and wanting to continue onto secondary schooling in the public sector would have to go from private costs of about US$ 22 per year to US$ 155 per year. If he were to continue in the private sector for lack of room in the public sector, he would go from US$22 per year to US$ 300 per year! 179 The figures obtained for Nicaragua are broadly confirmed by Arcia (2003), who finds that private costs represent less than 3% of the poor non-food consumption in primary and about 6% of the poor non-food consumption in secondary.
143

secondary in Nicaragua i s higher than public expenditure highlighting a serious problem in the overall secondary financing structure in that country.
I Table 4.5: Annual Private Spending per Student by Income Quintile (in US$)
Total
1 44
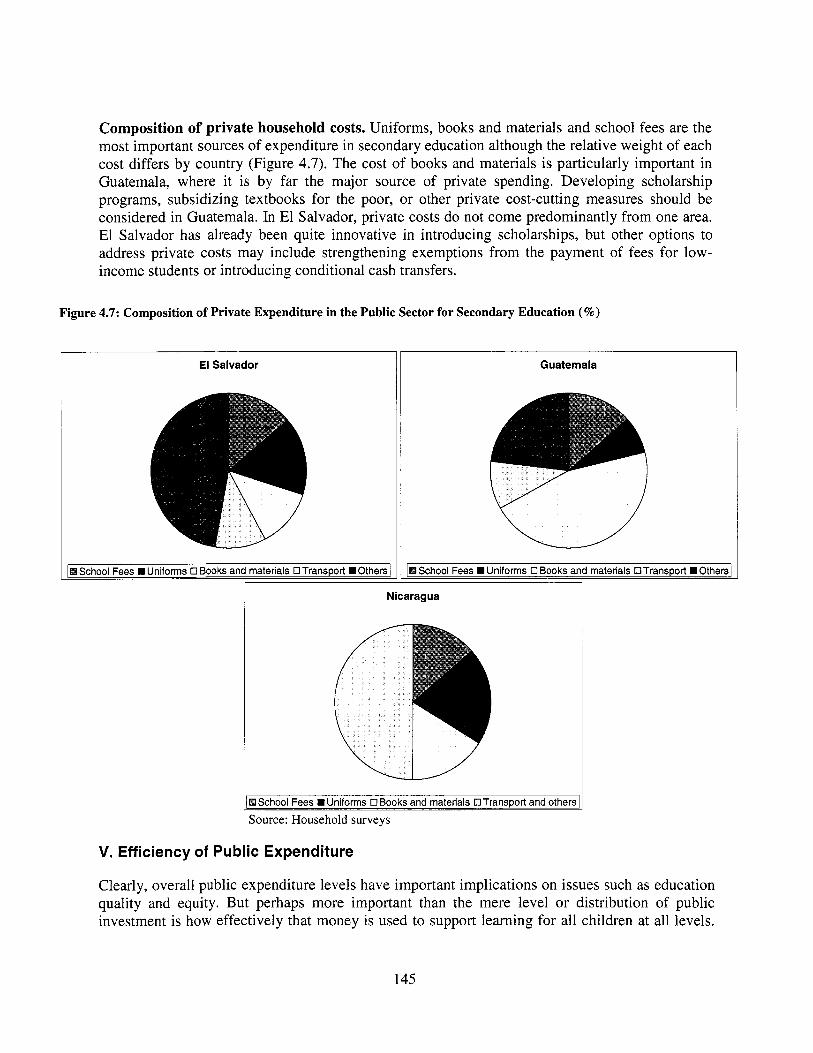
Composition o f private household costs. Uniforms, books and materials and school fees are the most important sources of expenditure in secondary education although the relative weight of each cost differs by country (Figure 4.7). The cost o f books and materials i s particularly important in Guatemala, where i t i s by far the major source of private spending. Developing scholarship programs, subsidizing textbooks for the poor, or other private cost-cutting measures should be considered in Guatemala. In El Salvador, private costs do not come predominantly from one area. El Salvador has already been quite innovative in introducing scholarships, but other options to address private costs may include strengthening exemptions from the payment of fees for low- income students or introducing conditional cash transfers.
Figure 4.7: Composition of Private Expenditure in the Public Sector for Secondary Education (%)
I El Salvador Guatemala
1 Nicaragua
IPSchool Fees =Uniforms 0 Books and materials OTransport and others
Source: Household surveys
1 materials OTransport W Others1
V. Efficiency of Public Expenditure
Clearly, overall public expenditure levels have important implications on issues such as education quality and equity. But perhaps more important than the mere level or distribution of public investment i s how effectively that money i s used to support learning for all children at all levels.
145
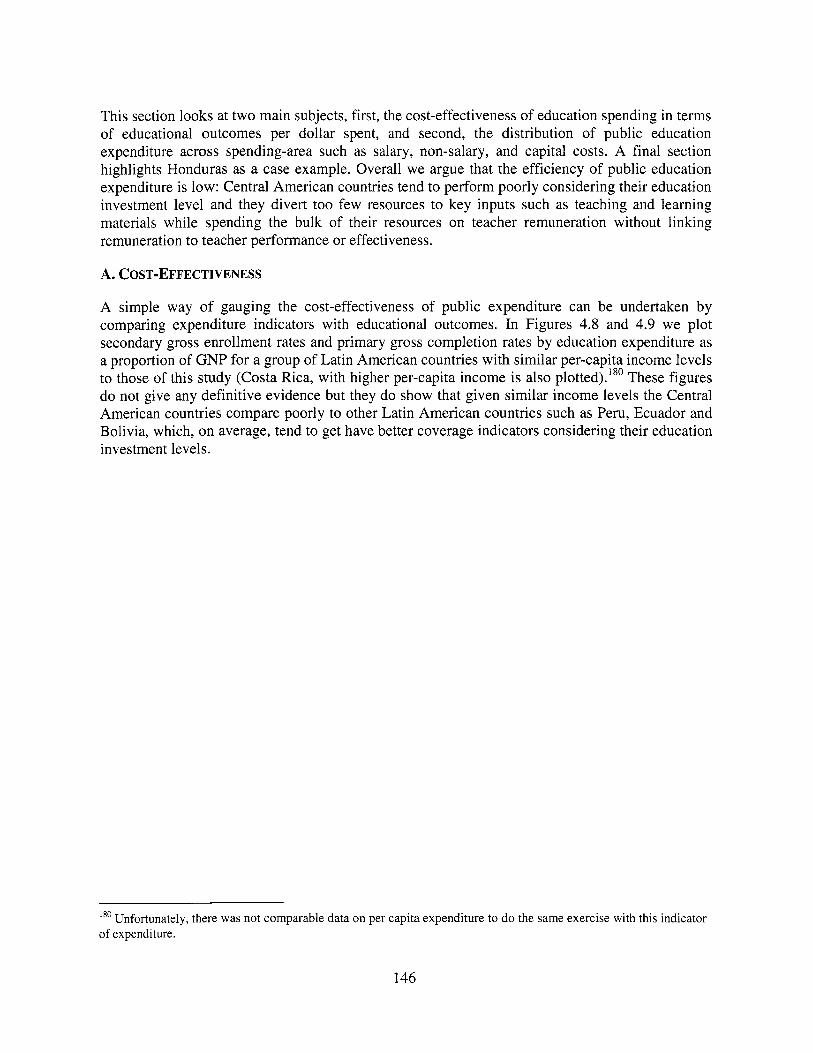
This section looks at two main subjects, first, the cost-effectiveness o f education spending in terms o f educational outcomes per dollar spent, and second, the distribution o f public education expenditure across spending-area such as salary, non-salary, and capital costs. A final section highlights Honduras as a case example. Overall we argue that the efficiency o f public education expenditure i s low: Central American countries tend to perform poorly considering their education investment level and they divert too few resources to key inputs such as teaching and learning materials while spending the bulk o f their resources on teacher remuneration without linking remuneration to teacher performance or effectiveness.
A. COST-EFFECTIVENESS
A simple way o f gauging the cost-effectiveness o f public expenditure can be undertaken b y comparing expenditure indicators with educational outcomes. In Figures 4.8 and 4.9 we plot secondary gross enrollment rates and primary gross completion rates b y education expenditure as a proportion o f GNP for a group of Latin American countries wi th similar per-capita income levels to those o f this study (Costa Rica, with higher per-capita income is also plotted).'*' These figures do not give any definitive evidence but they do show that given similar income levels the Central American countries compare poorly to other Latin American countries such as Peru, Ecuador and Bolivia, which, on average, tend to get have better coverage indicators considering their education investment levels.
Unfortunately, there was not comparable data on per capita expenditure to do the same exercise with this indicator o f expenditure.
146
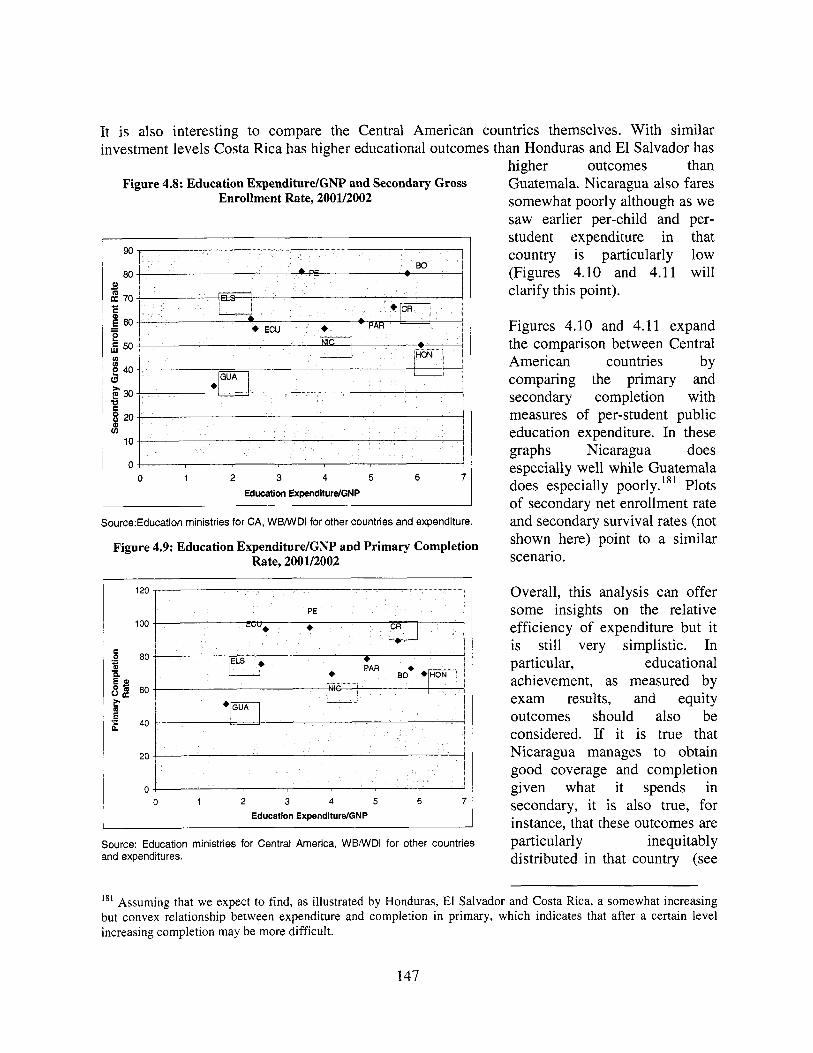
I t i s also interesting to compare the Central American countries themselves. With similar investment levels Costa Rica has higher educational outcomes than Honduras and El Salvador has
Figure 4.8: Education ExpenditureIGNP and Secondary Gross Enrollment Rate, 2001/2002
90
I 80 1 L o I
j &a
( E
- i!60
5 4 0
$20
820 t
- LD
a
10
1 2 3 4 5 6 Education ExpenditurdGNP
I I
Source:Education ministries for CA, WBMIDI for other countries and expenditure.
Figure 4.9: Education Expenditure/GNP and Primary Completion Rate, 2001/2002
2 1 2 3 4 5 6 7
Education ExpenditurdGNP
Source: Education ministries for Central America, WBMIDI for other countries and expenditures.
higher outcomes than Guatemala. Nicaragua also fares somewhat poorly although as we saw earlier per-child and per- student expenditure in that country i s particularly low (Figures 4.10 and 4.11 wi l l clarify this point).
Figures 4.10 and 4.11 expand the comparison between Central American countries by comparing the primary and secondary completion with measures of per-student public education expenditure. In these graphs Nicaragua does especially well while Guatemala does especially poorly.’81 Plots o f secondary net enrollment rate and secondary survival rates (not shown here) point to a similar scenario.
Overall, this analysis can offer some insights on the relative efficiency of expenditure but it i s s t i l l very simplistic. In particular, educational achievement, as measured by exam results, and equity outcomes should also be considered. If it i s true that Nicaragua manages to obtain good coverage and completion given what it spends in secondary, i t i s also true, for instance, that these outcomes are particularly inequitably distributed in that country (see
’*’ Assuming that we expect to find, as illustrated by Honduras, El Salvador and Costa Rica, a somewhat increasing but convex relationship between expenditure and completion in primary, which indicates that after a certain level increasing completion may be more difficult.
147

Chapter I and expenditure incidence analysis below).
Figure 4.10: Primary Completion Rate and Education Expenditure, 2001/2002
100
90
80 2 2
E
70
c 60
2 50
6 40
30 e 20
10
0
.- e
0 50 100 150 200 250 300 Education Expenditure per Student (US$)
Source: MINED Data and Table 10.1 Annex X
Figure 4.11: Secondary Completion Rate and Education Expenditure, 2001/2002
0 50 100 150 200 250 300 350 400 450 Education Expenditure per Student (US$)
Source: MINED Data and Table 10.1 Annex X
B. EXPENDITURE DISTRIBUTION BY AREA
In Table 4.7 and Figures 4.12 and 4.13 we report public education expenditure disaggregated b y spending categories.182 On average, roughly 87 percent of education expenditure goes to recurrent costs. This is a similar pattern to that of much of Latin American and OECD c~untr ies. ' '~
lS2 Unfortunately, we could not undertake this disagregation by education level due lack of data but we assume that the picture looks somewhat similar in primary and secondary. Another limitation concerns the fact that for some of the
148

El Salvador (a)
recurrent recurrent (non- capital total (salaries) salaries)
320 63 aa 471
I Honduras(e) I 403 ( 4 I
Guatemala (b)
Guatemala (d)
467 (c) 33 500
327 46 0 373
Honduras (f)
Nicaragua (9)
Low share of non-salary recurrent costs. Figure 4.13 plots the shares of capital expenditure and recurrent expenditure, sub-divided into salary and non-salary items. In al l countries, except Nicaragua, the share of non-salary recurrent costs, which includes teaching materials, teacher training, equipment, etc, represents less than 15 percent of total expenditure and less than 20 percent of total recurrent expenditure. These figures are below OECD averages. 184 185
370 15 11 396
60 30 14 104
countries we only have information on the MINED, under-estimating capital expenditure. Accounting o f recurrent versus capital expenditure i s also not always precise in the different countries. In particular, as we w i l l also see in the next sub-section, expenditure financed by external funds often tends to be accounted as investment while i t i s non- salary (or even salary) recurrent spending. An extreme case occurs in Nicaragua where al l external sources are labeled as investment even when they are used for recurrent expenditure. Arcia (2003) made a careful re-classification o f expenditure across economic categories in Nicaragua that we are using here (and which we also used in the above functional classification o f expenditure). Finally, by being largely financed by external funds, non-salary recurrent and investment expenditures can fluctuate significantly across years making a one time cross-section analysis not as meaningful as a time-series analysis, which it was however difficult to undertake for al l our countries. Our analysis shows, however, that beyond a couple o f exceptions the share o f external funds was fairly stable in our countries over these last three years making this issue somewhat less serious.
This percent i s probably over-estimated in Nicaragua and Costa Rica, where only data on the MINED budget are available, but i t may be under-estimated in El Salvador, Honduras and Guatemala due to accounting issues.
The OECD average was about 20% o f total education expenditure in 2000 (see OECD, 2002). I t was possible to make this disagregation only on the funds channeled through Ministries o f Education (with the
exception o f El Salvador). This share is, however, likely to be under-estimated in El Salvador, where capital costs are likely to also include some non-salary recurrent expenditure - see section on external funds.
Nicaragua (h)
Costa Rica (in percent) (i)
149
101 (c) 14 115
91.6 8.4 (I) 100
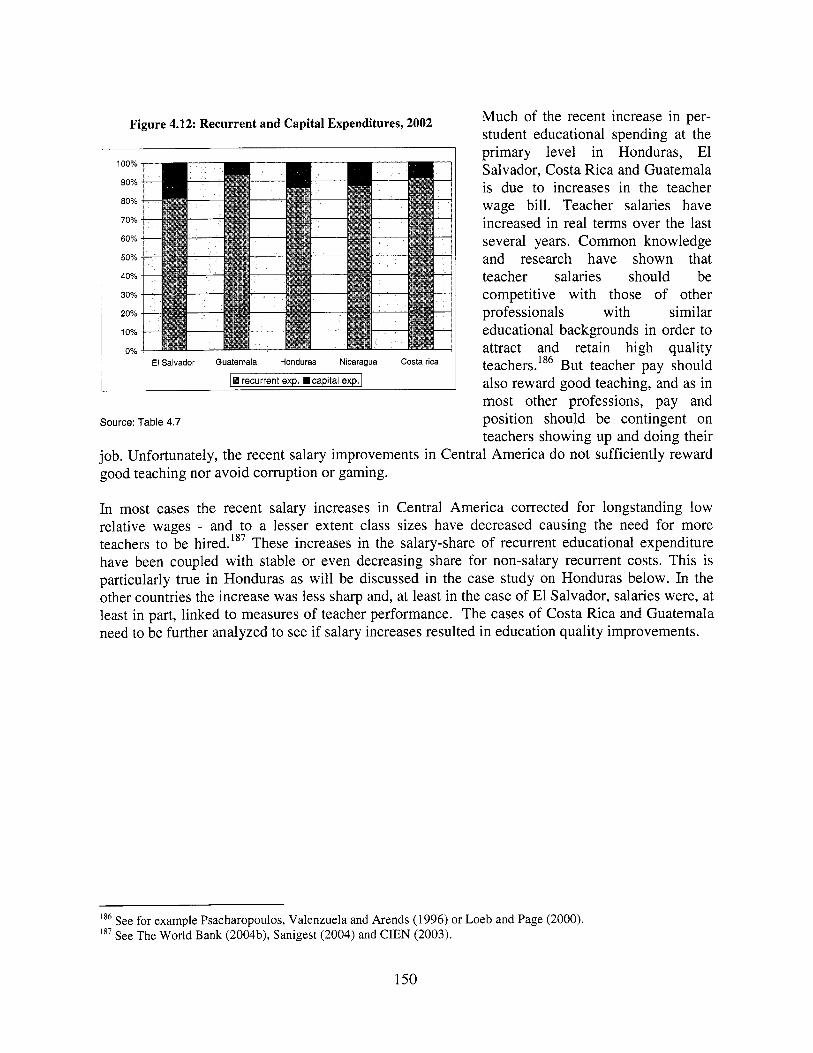
Figure 4.12: Recurrent and Capital Expenditures, 2002
Source: Table 4.7
Much o f the recent increase in per- student educational spending at the primary level in Honduras, El Salvador, Costa Rica and Guatemala i s due to increases in the teacher wage bill. Teacher salaries have increased in real terms over the last several years. Common knowledge and research have shown that teacher salaries should be competitive wi th those o f other professionals with s i mi lar educational backgrounds in order to attract and retain high quality teachers.'86 But teacher pay should also reward good teaching, and as in most other professions, pay and position should be contingent on teachers showing up and doing their
job. Unfortunately, the recent salary improvements in Central America do not sufficiently reward good teaching nor avoid corruption or gaming.
In most cases the recent salary increases in Central America corrected for longstanding low relative wages - and to a lesser extent class sizes have decreased causing the need for more teachers to be hired.' 87 These increases in the salary-share o f recurrent educational expenditure have been coupled with stable or even decreasing share for non-salary recurrent costs. This i s particularly true in Honduras as w i l l be discussed in the case study on Honduras below. In the other countries the increase was less sharp and, at least in the case o f El Salvador, salaries were, at least in part, linked to measures o f teacher performance. The cases o f Costa Rica and Guatemala need to be further analyzed to see if salary increases resulted in education quality improvements.
See for example Psacharopoulos, Valenzuela and Arends (1996) or Loeb and Page (2000). "'See The World Bank (2004b), Sanigest (2004) and CIEN (2003).
150

Figure 4.13: Salary, Non-salary Recurrent and Capital Expenditures, 2002
100%
90%
80%
70%
60%
50%
40%
30%
20%
10%
0% El Salvador Guatemala Honduras Nicaragua 1
Source: Table 4.7
In sum, although the increase in expenditure can be partially explained b y the, s t i l l limited, expansion o f secondary coverage (through the financing o f new investment and teachers - in particular in Nicaragua), and b y the trend in capital expenditure (related to both new investment and reconstruction - in particular in El Salvador"'), this analysis shows that salary increases have probably been the most significant driving force behind the increase in public education expenditure. Lit t le focus has generally been put on teaching materials, school supplies and comprehensive teacher training, which are potentially related to educational a~hievement.' '~ W e can
therefore conclude that there would be scope for: (a) increasing non-salary recurrent expenditure, both in absolute and relative amounts, in al l countries (even in Nicaragua, for secondary); (b) maintaining the wage bill under control by maintaining efficient pupil-teacher ratios (which, in our Central American countries, are generally in line wi th the Latin American average) and holding stable real salaries (which, as seen in Chapter 11, are more than in l ine with the ones of professionals wi th similar qualifications); and (c) linking real salary increases to improved teacher performance and real qualifications (this could be particularly advisable in Nicaragua where expenditure per student i s s t i l l quite low). Finally, as a pre-condition for al l these measures, it would be greatly necessary to improve the way recurrent and capital expenditures are accounted for (see below).
The case o f Honduras highlights some o f these challenges.
c. CASE STUDY: LOW COST-EFFECTIVENESS AND HIGH INEFFICIENCY IN HONDURAS
In the international cost-effectiveness comparisons shown earlier (Figures 4.8 and 4.9) Honduras appears quite cost-ineffective. This i s further evident comparing the evolution o f primary level test scores and completion rates with per student expenditure in recent years (see Figure 4.14). Between 1998 and 2001 per student spending increased significantly in Honduras. Education expenditure increased sharply in relation to GDP and the same happened with the expenditure per student per education level (which, in real terms, in primary, went from US$ 78 in 1997 to US$ 151 in 2001; and in secondary, from US$205 in 1997 to US$280 in 2001).
Where substantial external funds were directed to reconstruction after the earthquakes. 18' The availability or use of textbooks and school supplies i s significantly associated with achievement in a few countries (El Salvador, Honduras, Guatemala - see Chapter 11) and achievement of the poor, through the multi-grade and bi-lingual education programs, i n all countries.
151

Although we would not necessarily expect a clear improvement in outcomes over this same time period as improvements take time to observe, it is, nonetheless, worrisome that educational indicators got worse over the course o f these years. Disaggregating the data to the regional level we further find that the generalized increase in real spending across regions was accompanied b y a decrease in average test scores in all but three regions (see Figure 10.1 in Annex X).
Figure 4.14: Evolution of Educational Expenditure, Test Scores and Primary Completion Rate in Honduras (1998-2001)
*completion rate
Source: Table 4.2, MINED data, UMCE
160
140
120
100
=$a 80
60
40
20
0 1998 1999 2000 2001
Honduras has had a substantial wage bill increase due to increasing teacher wages and inflated payrolls. O f the four countries under analysis, Honduras is the one where the distribution between salary and non-salary recurrent costs i s b y far the most dramatic. An analysis o f the evolution o f personnel recurrent costs in real terms, illustrated in Figure 4.15 below, clearly shows that these costs were the driving force behind the recent increase in education spending in Honduras. Meanwhile, the share o f non-salary recurrent costs has decreased.
What was behind the wage bill increase? An analysis o f teacher management and remuneration in Honduras makes i t clear that the driving force behind the spending increase was a combination o f increased teachers or class hours on the payroll and increased wage rate, for both primary and secondary. 190 While official figures show stable or even increasing pupil-teacher ratios, the payroll figures show substantial increases in the number o f teachers (at the primary level) and class hours (at the secondary level) which suggest the presence o f “ghost” teachers and an over-estimation o f class hours.
I t i s highly advisable for Honduras to “clean up” the payroll records and establish an effective supervisory and monitoring system to eliminate ghost teachers and over-estimated class hours. This could be done b y involving regional and/or local Ministry o f Education offices and schools themselves.
I9’See The World Bank (2004~).
152
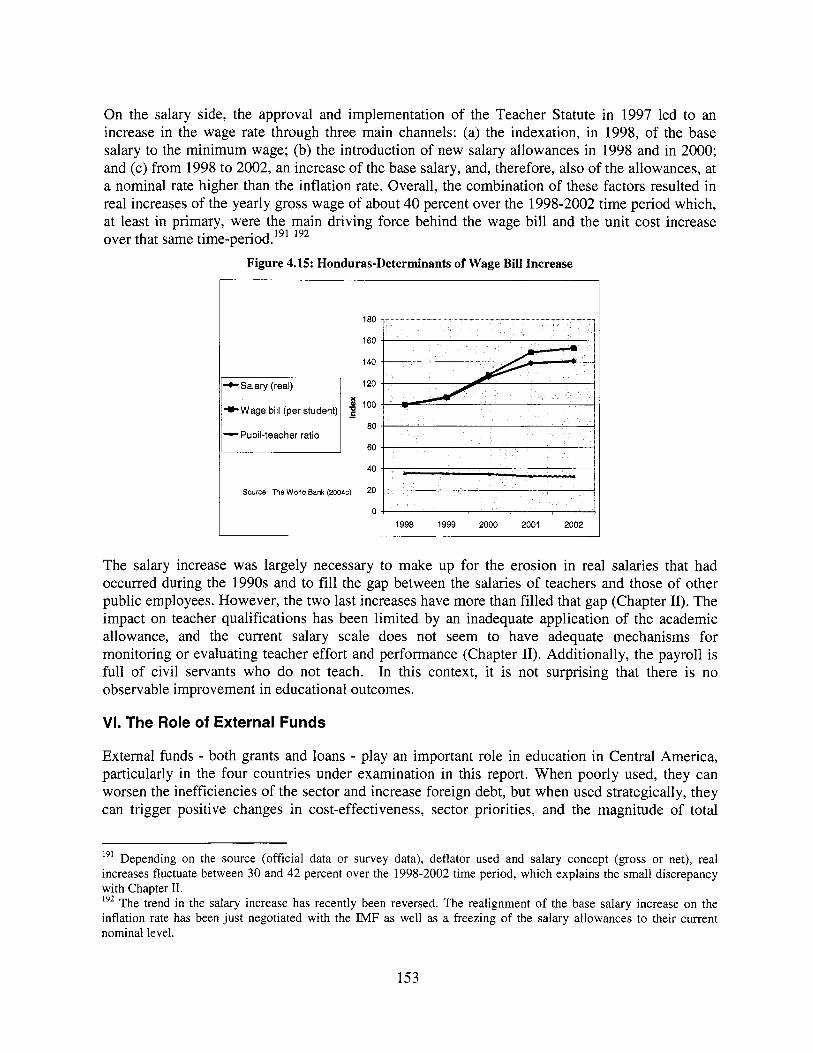
On the salary side, the approval and implementation o f the Teacher Statute in 1997 led to an increase in the wage rate through three main channels: (a) the indexation, in 1998, o f the base salary to the minimum wage; (b) the introduction o f new salary allowances in 1998 and in 2000; and (c) from 1998 to 2002, an increase o f the base salary, and, therefore, also o f the allowances, at a nominal rate higher than the inflation rate. Overall, the combination o f these factors resulted in real increases o f the yearly gross wage o f about 40 percent over the 1998-2002 time period which, at least in primary, were the main driving force behind the wage bill and the unit cost increase over that same time-period.
Figure 4.15: Honduras-Determinants of Wage Bill Increase
191 192
*Wage bill (per student)
-Pupil-teacher ratio
180
160
140
120 X
E 4 100 -
80
60
40
20 Source The World Bank (2004~)
0 1998 1999 2000 2001 2002
The salary increase was largely necessary to make up for the erosion in real salaries that had occurred during the 1990s and to fill the gap between the salaries o f teachers and those o f other public employees. However, the two last increases have more than f i l led that gap (Chapter 11). The impact on teacher qualifications has been l imited by an inadequate application o f the academic allowance, and the current salary scale does not seem to have adequate mechanisms for monitoring or evaluating teacher effort and performance (Chapter 11). Additionally, the payroll i s full o f c iv i l servants who do not teach. In this context, i t i s not surprising that there i s no observable improvement in educational outcomes.
VI. The Role of External Funds
External funds - both grants and loans - play an important role in education in Central America, particularly in the four countries under examination in this report. When poorly used, they can worsen the inefficiencies o f the sector and increase foreign debt, but when used strategically, they can trigger positive changes in cost-effectiveness, sector priorities, and the magnitude o f total
19' Depending on the source (official data or survey data), deflator used and salary concept (gross or net), real increases fluctuate between 30 and 42 percent over the 1998-2002 time period, which explains the small discrepancy with Chapter 11. 19* The trend in the salary increase has recently been reversed. The realignment o f the base salary increase on the inflation rate has been just negotiated with the IMF as well as a freezing of the salary allowances to their current nominal level.
153
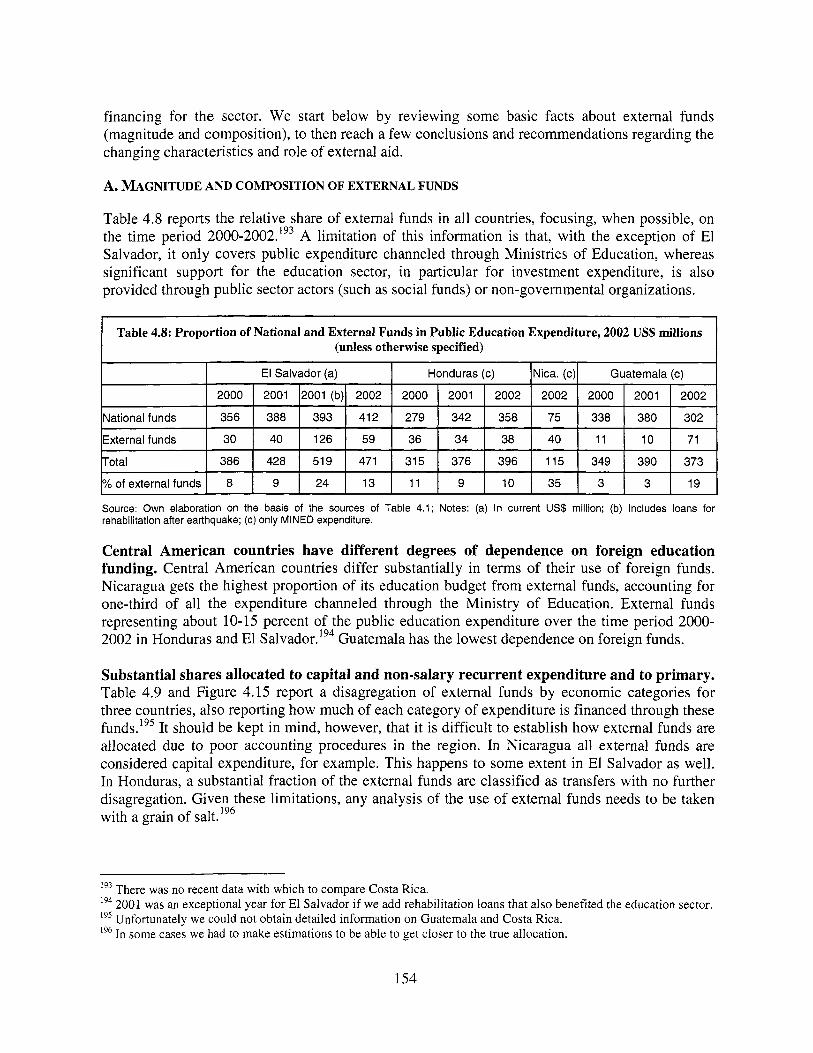
financing for the sector. We start below by reviewing some basic facts about external funds (magnitude and composition), to then reach a few conclusions and recommendations regarding the changing characteristics and role o f external aid.
El Salvador (a)
2000 1 2001 (2001 (b)l 2002
A. MAGNITUDE AND COMPOSITION OF EXTERNAL FUNDS
Honduras (c) Nica. (c) Guatemala (c)
2002 2000 I 2001 I 2002 2000 I 2001 I 2002
Table 4.8 reports the relative share o f external funds in al l countries, focusing, when possible, on the time period 2000-2002.'93 A limitation o f this information i s that, wi th the exception o f El Salvador, i t only covers public expenditure channeled through Ministries of Education, whereas significant support for the education sector, in particular for investment expenditure, i s also provided through public sector actors (such as social funds) or non-governmental organizations.
External funds 30 40 126 59 36 34 38 40 11 10 71
Total 386 428 519 471 315 376 396 115 349 390 373
Table 4.8: Proportion of National and External Funds in Public Education Expenditure, 2002 US$ millions (unless otherwise specified)
% of external funds 8 9 24 13 11 9 10 35 3 3 19
~~
=finds 1 356 I 388 I 393 1 412 I 279 1 342 1 358 1 75 1 338 I 380 I 302 I
Central American countries have different degrees of dependence on foreign education funding. Central American countries differ substantially in terms o f their use of foreign funds. Nicaragua gets the highest proportion o f i t s education budget f rom external funds, accounting for one-third o f all the expenditure channeled through the Ministry o f Education. External funds representing about 10-15 percent o f the public education expenditure over the time period 2000- 2002 in Honduras and El S a 1 ~ a d o r . l ~ ~ Guatemala has the lowest dependence on foreign funds.
Substantial shares allocated to capital and non-salary recurrent expenditure and to primary. Table 4.9 and Figure 4.15 report a disagregation o f external funds b y economic categories for three countries, also reporting how much o f each category o f expenditure i s financed through these funds.'95 I t should be kept in mind, however, that i t i s di f f icult to establish how external funds are allocated due to poor accounting procedures in the region. In Nicaragua all external funds are considered capital expenditure, for example. This happens to some extent in El Salvador as well. In Honduras, a substantial fraction o f the external funds are classified as transfers with no further disagregation. Given these limitations, any analysis o f the use of external funds needs to be taken with a grain o f salt.'96
193 There was no recent data with which to compare Costa Rica. 194 2001 was an exceptional year for El Salvador if we add rehabilitation loans that also benefited the education sector. ' 9 5 Unfortunately we could not obtain detailed information on Guatemala and Costa Rica. 196 In some cases we had to make estimations to be able to get closer to the true allocation.
154

Table 4.9 and Figure 4.15 reveal that external funds are primarily allocated to capital and non- salary recurrent costs and finance a substantial extent o f the capital and non-salary recurrent expenditure o f Nicaragua and Honduras. Evidence from Honduras and Nicaragua further suggests that external funds are largely invested in primary or at most basic education. In El Salvador, where there was a large World Bank project for secondary education, we expect the allocation to be less concentrated in basic education.
Investment
r I
El Salvador (a) Honduras (c) Nicaragua ( 4
2000 2001 2001 (b) 2002 2001 2002 2002
30 (22) 40 (1 8) 126 (1 04) 56 (22) 15 11 12
Table 4.9: Allocation of External Funds across Economic Categories - 2002 US$ million (unless otherwise b ‘ndicated)
In % of total investment
Recurrent non-salary
73 (67) 71 (51) 81 (78) 64 (41) 79 100 86
(7) (1 9) (1 9) (29) 7 12 18
In % of total recurrent non-salary
Salary
In % of total salary
Total
(13) (24) (23) (31) 100 80 60
(1) (3) (3) (5) 12 15 8
(0) (1 1 (1) (2) 3 4 13
30 40 126 56 34 38 38
Source: Own elaboration on the basis of the sources of Table 4.1 (Nicaragua: elaborations of Arcia (2003) on the basis of the sources of table 4.1); (a) In current US$ million. Between brackets are the figures we obtain when we assume that the expenditure classified under human capital finances for 85% non salary recurrent expenditures and for 15% salaries; (b) Includes loans for rehabilitation after earthquake; (c) Only MINED expenditure. In 2001 assumes 15% of transfers go for salaries, 75% to capital and 10% to recurrent non salary; in 2002 assumes 15% of transfers go to salaries, 50% to capital and 35% to recurrent non salary; (d) Only MINED expenditure (pre-primary, primary, and secondary).
Additional evidence i s provided b y a recent effort undertaken by the O E I (Organizucidn de Estudos Zberoarnericanos) to map out the areas where the different donors intervene in Central America.lg7 The O E I map shows a strong concentration o f donors in the sector “quality and equity o f basic education.” Within this sector, some areas, such as national quality assessment systems, pedagogical and curricular innovation, teacher training, infrastructure, equipment and teaching materials, multicultural-bilingual education and multi-grade schooling, are particularly invested in, with several cases of duplication between activities and projects o f the different donors. Other areas, such as specific compensatory programs, educational statistics systems, institutional strengthening and decentralization, including school based management, are relatively less covered. There i s much less concentration in the sector “youth, secondary education and preparation for the labor market”, and, within that sector, the most dynamic area i s youth at risk. Lit t le emphasis, finally, i s being put on tertiary education, or science and technology.
OEI (2004a).
155
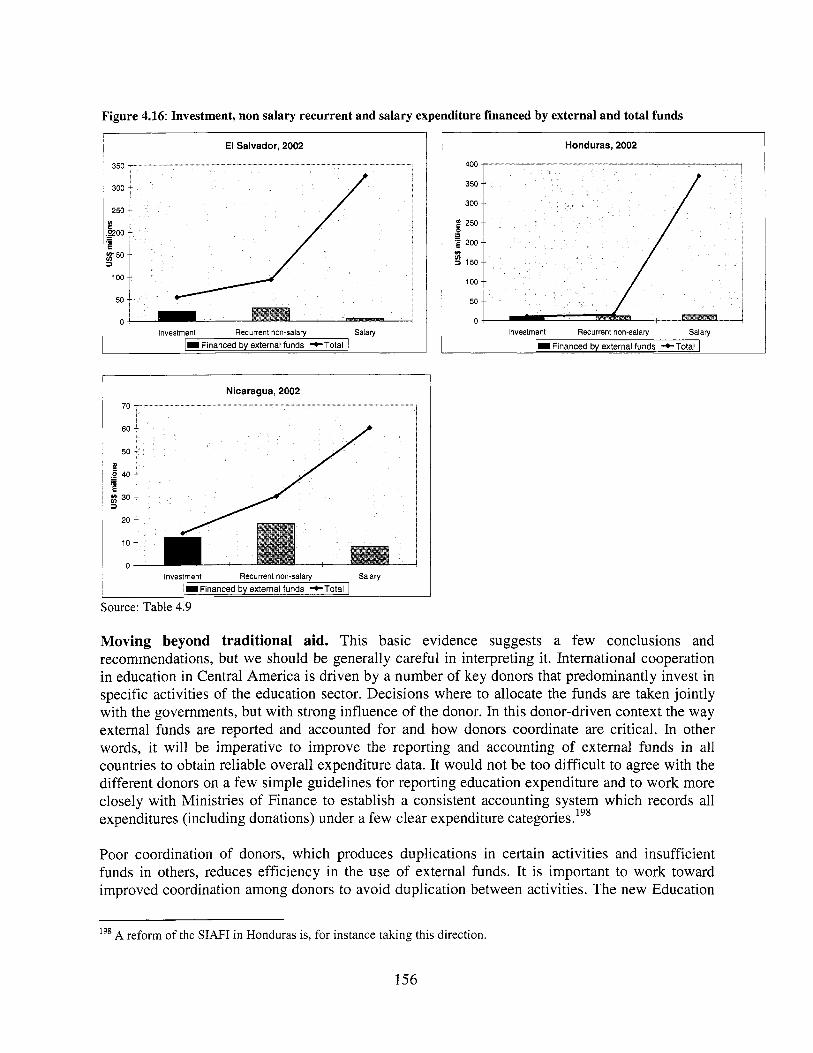
Figure 4.16: Investment, non salary recurrent and salary expenditure financed by external and total funds
El Salvador, 2002 ~
/ I 50
0 I
Investment Recurrent non-salary Salary I I Financed by external funds +Total I
Honduras, 2002
400
350
300
100
50
0 Investment Recurrent non-salary Salary
I I Financed by external funds +Total I
I
Nicaragua, 2002
I ' 60
50 v)
I 'e a $ 30
20
Investment Recurrent non-salary Salary i 'I Financed by external funds +Total 1 Source: Table 4.9
Moving beyond traditional aid. This basic evidence suggests a few conclusions and recommendations, but we should be generally careful in interpreting it. International cooperation in education in Central America is driven b y a number o f key donors that predominantly invest in specific activities o f the education sector. Decisions where to allocate the funds are taken joint ly with the governments, but with strong influence o f the donor. In this donor-driven context the way external funds are reported and accounted for and how donors coordinate are critical. In other words, i t w i l l be imperative to improve the reporting and accounting o f external funds in all countries to obtain reliable overall expenditure data. I t would not be too dif f icult to agree with the different donors on a few simple guidelines for reporting education expenditure and to work more closely with Ministries o f Finance to establish a consistent accounting system which records all expenditures (including donations) under a few clear expenditure ~ a t e g 0 r i e s . l ~ ~
Poor coordination o f donors, which produces duplications in certain activities and insufficient funds in others, reduces efficiency in the use o f external funds. I t i s important to work toward improved coordination among donors to avoid duplication between activities. The new Education
A reform o f the SIAFI in Honduras is, for instance taking this direction.
156
For All-Fast Track Programs in Honduras and Nicaragua at the primary level represent a shift from traditional project-based approach to a programmatic sector-wide approach, with five main focuses: (a) pol icy dialogue; (b) results; (c) sustainability; (d) donor harmonization; and (e) in- country dialogue. I t i s hoped that by helping design and implement a consistent and coordinated framework for intervention in the primary sector these initiatives w i l l maximize the impact o f external funds in the sub-sector. Similar initiatives may, however, also be needed for the secondary cycle.
The allocation of external funds across spending categories and education levels is not necessarily critical in that money is to some extent fungible. In other words, higher allocation o f external funds on, for instance, non-salary recurrent expenditure, may lead the countries to spend less on these items from their own national funds and free up those funds for other purposes. From the evidence presented above, this may in fact play out negatively if we want countries to be absorbing more o f these items in their national funds for sustainability. I t may then make more sense to use a greater share o f external funds to support salaries.
Overall, what w i l l really count i s having countries reach specific targets on their overall financial envelopes, both in terms o f magnitude and composition o f expenditure; and getting governments and donors to agree on the same targets. The new programmatic sector-wide approaches w i l l ensure that this happens by establishing sector-wide targets on educational outcomes (in terms o f completion, quality, etc) and expenditure. As we shift towards multi-sector programmatic approaches, such as those being supported by the World Bank in the poverty-reduction strategy credits and social sector programmatic loans, donors w i l l not even have to come to agreement with governments on specific activities to be financed anymore but just on a set o f conditionalities. In Honduras, for instance, the Poverty Reduction Support Credit (PRSC) established strong conditionalities related to expenditure reporting, efficiency and composition across education levels.
Conclusions
The magnitude of public education expenditure i s st i l l an issue in Central America. Although all countries have increased public education expenditure since the mid- 1990s, the level o f education expenditure in terms of GDP and per age-appropriate chi ld i s s t i l l below the Latin American average (with the exception o f Honduras' GDP percentage). A similar picture holds true when comparing per-student education expenditure in primary and secondary wi th countries with similar per-capita income (an exception i s again Honduras, where, however, there are major efficiency issues). Additionally, the secondary education share o f the education budget i s l ow in all countries, reflecting the s t i l l insufficient priority given to that education level in al l countries.
On efficiency grounds, Central American countries do not perform particularly well. El Salvador and Nicaragua are more efficient than Honduras and Guatemala when comparing primary and secondary enrollment and completion rates with education expenditure in terms of GDP or per- student expenditure. T o some extent, this difference in cost-effectiveness can be associated with higher shares o f non-salary recurrent and capital expenditures in the budgets o f these two countries, which ensure higher investment i n infrastructure and in learning materials and teacher training. In terms of equity and educational achievement outcomes, however, Nicaragua i s clearly
157
not performing particularly well.'99 Efficiency is low in Honduras where the increase in expenditure per-student was generated by a substantial increase in personnel costs not associated with improved educational outcomes (the share o f non-salary recurrent expenditure in Honduras i s very low). Honduras and Nicaragua also appear to be particularly dependent on external funds for non-salary recurrent expenditure and investment.200 Donor coordination issues have limited the impact o f external funds somewhat, but the new sector-wide programmatic approaches have the potential o f addressing this problem while also helping to establish common outcome indicators and expenditure targets for the education sector.
Finally, while the public education subsidy appears to be reasonably progressively distributed in primary, and the gross enrollment rate quite homogeneous across quintiles, a different situation holds for secondary and tertiary where the public subsidy i s regressively distributed, reflecting large inequities in access and completion across quintiles. Even at the primary level, the fact that a much higher proportion o f children o f the lower quintiles s t i l l leave school without completing the cycle suggests that the subsidy i s probably less progressively distributed than i t should be. Additionally, private costs are a considerable burden in Guatemala and a substantial one in El Salvador .
The main (general) policy implications o f this chapter can be summarized as follows:
Central American countries should spend at least the Latin American average in terms o f GDP to reach an acceptable public expenditure level per school-age population. This i s valid for Nicaragua, El Salvador and Guatemala;
The share of secondary education should increase in al l countries, although this should happen within an increasing overall budget in terms o f GDP to ensure more resources also for primary education. It i s particularly important that Nicaragua increases its expenditure per student in secondary education to ensure higher quality education at that level;
The share o f non-salary recurrent costs should be increased to at least 20 percent o f total education expenditure (also b y education level), to ensure the school supplies, teaching materials and teacher training necessary for improving educational achievement;
The wage bill should be kept under control by maintaining efficient pupil-teacher ratios and either stable real and relative salaries or salary increases effectively linked to teacher performance and quality. I t i s imperative for Honduras to revise i t s payroll figures and implement an effective teacher monitoring system. Real salary increases should be accompanied by improved teacher performance or meaningful teachers' qualifications (see Chapter I for more concrete actions);
In all countries, i t i s imperative to improve the reporting and accounting o f external funds, to obtain reliable overall budget data. Donors and countries should agree to a few simple guidelines for reporting education expenditure and to work more closely wi th the
199 As wil l also be shown in Chapter V analyzing autonomous schools. 2oo There are no data on Guatemala.
158
Ministries of Finances to establish a consistent accounting system which records all expenditures under a few clear expenditure categories;
(f) External funds should be better coordinated and leveraged. The new Education For A l l - Fast Track programs (EFA-FTI) are promising, as are the new multi-sector programmatic approaches, to ensure higher donor coordination and establish common outcomes and expenditure targets for the education sector;
(g) Better access to aualitv schooling should be provided to the Door (which should be partly reflected in higher unit costs per poor student) to ensure higher completion;
(h) Broad-based expansion of secondarv education should be encouraged;
(i) Public subsidies to tertiary education should be reduced in Honduras, Nicaragua and Guatemala, by leaving higher co-financing responsibility to public universities and more room for private universities;
(j) The burdens of private costs should be addressed in Guatemala and El Salvador. Developing targeted scholarship programs and subsidizing textbooks for the poor could be possible options for Guatemala. El Salvador should strengthen exemptions from the payment of fees for low-income students and introduce conditional cash transfers providing full coverage o f private costs in public or private schools.
159

Chapter V: A Comparative Analvsis of School-Based Manaqement In Central America
Introduction
This chapter analyzes and compares the impact o f education decentralization reforms in El Salvador, Guatemala, Honduras and Nicaragua. Decentralization i s the process o f re-assigning responsibility and corresponding decision-making authority for specific functions f rom higher to lower levels o f government and organizational units.20’ In the context o f education reforms, decentralized functions frequently include policy-making, revenue generation, curriculum design, school administration, and teacher management. Typically decision-making authority for these types o f functions i s decentralized either to regional or municipal government offices or to schools themselves.
Decentralization reforms take many forms and correspondingly, have many objectives. In Central America a primary objective o f these reforms has been to improve the efficiency and effectiveness of education by increasing school autonomy and community participation and the autonomy and capacity o f local and regional education offices and stakeholders. Decentralization through municipalization has also taken place in some moments o f time, for instance in Nicaragua, but has never reached the breadth and depth that decentralization to the school level has, with the consequence that municipalities are generally only a minor player in education delivery in Central America202. Internationally, a large amount o f research exists that analyzes the impact of decentralization reforms which shift certain decision-making powers to the school level (also called school-based management reforms, or SBM) on education outcomes203. O f the Central American reforms more research has been conducted on the Nicaraguan and Salvadoran reforms, and less on those o f Honduras and Guatemala, as their adoption and implementation i s more recent. Research i s substantially more limited on how the reforms have expanded community participation and empowerment and on to what extent and in what ways schools exercise meaningful autonomy. Finally, very few studies compare empowerment and education outcomes across these four countries.
This chapter w i l l be organized in five main parts: section I presents, very succinctly, the analytic framework that has guided this chapter; section I1 discusses and compares the design o f the S B M models in the four countries under investigation; section I11 analyzes the impacts the reforms have had on both empowerment and education results; section IV discusses how variations in reform design, country contexts and actors’ assets can explain differences and similarities in result; and section V provides recommendations on how to improve the impact of the S B M on empowerment and quality o f education and guarantee the sustainability o f the reforms.
Paqueo and Lammert (2000). *02 In some countries such as Honduras, however, municipalities play a noticeable “informal” role in education delivery by financing some infrastructure and, at times, even teachers. 203 Although little o f this large amount o f research i s systematic or definitive. Generally speaking, the reader wi l l need to keep in mind, throughout this chapter, that i t i s often difficult to associate reforms with outcomes, even if the most sophisticated technical tools are available. I n this sense, al l results need to be interpreted with caution.
160
1. Conceptual Framework
The conceptual framework draws on the World Bank’s recent work on empowerment and accountability as well as on principal-agent literature in order to assess the effects of decentralization reforms on empowerment and education results. In summary, the framework argues that:
1. Decentralization reforms have a positive influence on the efficiency204 and effecti~eness~’~ of education service delivery largely because decentralization: (a) enables the service provider (in this case the school) to make use of information about local preferences (asymmetric information argument), and (b) increases the opportunities for the service receiver (in this case the community) to hold the service provider accountable (accountability argument), which, in turn, can improve teaching and learning;
2. The ability o f the school to make use of i t s knowledge about local preferences and of the community to hold school staff accountable de ends on the extent to which the reforms have led to both community206 and school empowerment FO7 ;
3. School and community empowerment wi l l not be enough to ensure the fulfillment o f some national objectives, such as higher coverage or national targets in learning achievement, due to the “positive externality” argument208. Equity concerns and local institutional weakness may also not be fully addressed, as r isks o f capture by local elites. In this context, the government wi l l need to find mechanisms which lead the agent (Le. the school) to pursue i ts national interests. This wi l l require an effective accountability relationship between the policy maker and the organizational provider - Le. the school. The recent WDR209, which also highlights the importance o f the
~~
’04 We can define efficiency in two different ways, as technical (productive) efficiency or social (allocative) efficiency. Technical efficiency i s about producing a higher output for similar costs or the same output for lower costs; social efficiency i s about choices that reflect more closely consumers’ preferences. ’05 Effectiveness (although not necessarily a very precise concept) i s more about impact on outputs and outcomes, such as the coverage o f the services, their quality (measured for instance by learning achievement), their impact on poverty reduction and social development, the equity o f delivery, etc. ’06 Community empowerment refers to parents’ ability to have a stronger voice vis-&vis school staff, for instance by giving parents the power to hire and f i re teachers or to have a say in teaching methods. Strengthening accountability to local communities, through community empowerment, i s particularly important because, borrowing from the principal-agent literature, the agent, or school, once given decision-making autonomy w i l l often have the temptation to use it opportunistically. This means that the school might put i t s own interests before the achievement o f the national objective for which decentralization was undertaken in the first place (i.e. improving student learning), thereby taking advantage o f the fact that the principal (in this case the ministry o f education) w i l l typically not observe the true effort and ability o f the agent (moral hazard issue).In this setting, the community can act as a second principal (or client) and help solve the incentive issue. This approach i s also shared by the recent World Development Report (The World Bank, 20040, which highlights the key role o f the accountability relationship between the clients (in this case the community) and the providers (in this case the school staff), defined as client power, in having decentralization working in practice. *07 School empowerment (also referred to as school autonomy) involves strengthening the school’s decision-making
‘Os In other words, education has broad societal benefits (on growth, social development, etc) that are not fully captured by private benefits. As such, without national intervention, education delivery might reach a socially sub- optimal equilibrium level. *09 The World Bank (2004e).
ower (vis-&vis the education authorities), for example on pedagogical or administrative matters.
161
accountability relationships between policymakers and organizational providers, refers to this accountability relationship as the compact;
4. the effectiveness o f the accountability relationship between policymakers and education providers i s influenced by both the: (a) assets o f actors and communities, which include skills, and information as wel l as organizational, psychological, human, financial and material assets, and (b) the context in which the school and community exist. In fact, as we w i l l see, assets and context also have a direct impact on the teaching and learning environment as well as on students' education outcomes. On the formal side, the context includes the specific reform design (de jure provisions regarding the operation of the program, most notably the functions and responsibilities decentralized to the school210). On the informal side, the context consists o f a range of socio- political factors that determine whether the reform, once adopted, can be sustained, and to what extent i t i s implemented according to the de jure provisions.211 Context and assets are interrelated. The framework i s graphically presented in Figure 5.1. The chapter w i l l have a focus on the impact o f assets and reform design on empowerment and education results.
Finally, the degree to which schools and communities become empowered and
*lo Reform design i s important for community and school empowerment. For instance, the extent to which parents become empowered vis-&vis school staff i s influenced, among other things, b y the types of rights and responsibilities that are devolved to them or the degree to which the reform makes provisions for relevant parental capacity building. Similarly, school empowerment vis-&vis the education authorities w i l l be enhanced by a clear-cut decentralization of administrative functions, including extensive teacher management responsibilities and special training programs for school directors. 2 " H ~ ~ the decentralization reform works in practice or de facto i s influenced by a series o f socio-political factors. Factors that have a bearing on school empowerment, for example, may include the relation between the government and the teachers' unions, the efficiency o f the administration, and informal spaces for autonomous decision-making. In turn, factors that may influence the extent o f community empowerment include a community's tradition o f social mobilization, the extent o f social division between parents and teachers, and the implementation and operation o f policies, such as standardized evaluation and social auditing systems, which ensure the availability o f information about educational outcomes at the national and local levels.
162

Figure 5.1: Conceptual Framework
Formal Context:
1 Reform Design affects School Empowerment 2 Reform Design affects Community Empowerment 3 Reform Design affects accountability directly (compact) and information 4 lnformal Context affects SE 5 Informal Context affects CE 6 Assets affect SE 7 Assets affect CE 8 Informal Context and Assets influence each other 9 Formal Context and Assets influence each other 10 Formal Context affects Teaching and Learning Environment 11 Formal Context affects Outcomes 12.Informal Context affects Teaching and Learning Environment 13 Informal Context affects Outcomes
II. Comparing Education Decentralization Reforms in Central America
A. HISTORY AND OVERVIEW OF DECENTRALIZATION REFORMS IN CENTRAL AMERICA
This sub-section provides an overview o f each o f the four countries’ education decentralization reforms, discussing the historic background and rationale that led to the adoption o f the reform, and describing reform features such as institutional arrangements and the criteria communities have to fulfill to participate in the programs. Sub-section B compares specific aspects of the reform designs in more depth. These include the nature and extent o f community participation, the frequency and formula for financial transfers, and teacher salaries and benefits.
Overall, the community-based school management programs implemented in Central America have been aimed at increasing enrollment, strengthening community participation, and improving efficiency. A less frequently cited objective has been the improvement o f education quality through increased responsiveness to local needs and interests. In three cases-EDUCO (El Salvador), PRONADE (Guatemala), and PROHECO (Hondurasbthe main objective has been to increase enrollment in isolated rural areas affected b y conflict, poverty or natural disasters. The School Autonomy Program in Nicaragua aims instead to give voice to parents and c iv i l society on educational issues and, in this way, increase operational efficiency.212
212Arcia and Bel l i (1999).
163
a) The Case of El Salvador
El Salvador was the first among the four Central American countries under investigation to decentralize when, in 1991, the government officially launched i t s school-based management program, known by i ts Spanish acronym EDUCO (Educacidn con Participacidn de la Cornunidad - Education with Community Participation). Prior to the establishment of the program, it was clear that the country's basic education sector faced a number of serious challenges, such as low enrollment, high dropout and repetition rates, inefficient management, and low fiscal allocations for primary education.213 In part this was due to the civil war that had ravaged the country in the preceding decade. At the same time, lack of access to public schools during the civil war had led many rural communities to organize their own schools -- staffed, financed and administered by the community members themselves. The Ministry of Education regarded community participation as key to expanding access, and, under the EDUCO initiative, decided to institutionalize these, already existing, community-run schools and open up similar ones throughout the country.
The EDUCO initiative makes provisions for decentralizing some of the responsibilities of the Ministry of Education (MINED) to the regional and the school level, and for the participation of community members in school management. Both aspects create de jure spaces for school autonomy and community empowerment. The organizational structure underlying the EDUCO initiative i s as follows:214
0 MINED enters into a contractual partnership with community education associations, known by the acronym ACE (Asociacidn Comunal para la Educacidn), so that these ACEs become responsible for education delivery to a given community on the ministry's The MOE remains responsible for transferring funds to the ACEs, establishing guidelines for the distribution of funds, producing teaching and learning materials, supporting the organization, legalization and training of the ACEs, and supervising schools.
0 EDUCO's coordinating unit, which reports directly to the MoE, provides the following: policy and technical design; promoting, supervising and evaluating implementation; coordinating with MOE with regards to training for school staff and supervisors; and providing training and technical support to the regional offices.
0 EDUCO regional offices have recently been phased out216. Their original mandate was to provide immediate technical and administrative assistance to the schools, including the provision of supervision, training, curriculum development and programs for school improvement.
0 District supervisors, replaced by Technical Liaisons (t&cnicos de enlace), serve as the link between the regional and central EDUCO offices and the EDUCO schools. They are responsible for promoting community participation through the following activities: administrative and
'I3 Edge (2000). 'I4 Since i t s inception, the organizational and implementation structure o f the EDUCO program have changed. The two most important changes are that the system of the supervisors has been replaced with that of the so-called te'cnicos de enlace and that the ACEs have been assigned greater decision-making powers, including the hiring of the te'cnicos de enlace and o f administrative assistants who are responsible for organizing and monitoring the school councils. These changes wi l l be discussed in more detail in sub-section 1I.B. '15 This section draws on Edge (2000), and Meza and Guzman (2004). 'I6 To streamline the structure o f the Ministry o f Education.
164
technical support to the ACEs, technical assistance to teachers, dissemination o f information about EDUCO and MINED, assistance with the creation of schools for parents, and liaison between ACEs and MINED.
0 ACEs are school-level legal entities whose membership i s drawn from the local community. They are responsible for administering the funds transferred to them by MINED, selecting, hiring and monitoring teachers, building and maintaining schools, and mobilizing the rest o f the community in support of the school.
EDUCO schools are exclusively established in rural areas and provide for pre-school and basic education (grades 1-9). Communities qualify for the EDUCO initiative if there are at least 28 students per grade in the community and no other education services are available.217
b) The Case of Guatemala
Guatemala’s school-based management reform i s the National Community-Managed Program for Educational Development (Programa Nacional de Autogestidn para el Desarrollo Educativo, PRONADE). PRONADE, l i ke EDUCO, i s a SBM program that seeks to increase access in poor, rural, isolated areas, and foster community participation in school administration. Initially piloted in the early 1990s, the program’s expansion was linked to the 1996 Peace Accords, which were signed at the end of almost forty years of civil war. Stipulated in the Peace Accords was the demand that the government decentralize i ts education system and that all children complete at least the third grade. In an effort to fulfill these objectives, the MINED and the Commission for Education Reform focused on the PRONADE experience as an effective education delivery system. They did so for three reasons: (1) pilot programs, under implementation since 1992, appeared to be successful, though a formal evaluation was lacking; (2) the MINED believed that community involvement was essential to rapidly increase access to education, and (3) PRONADE’s objectives - decentralization, community participation, and indigenous and linguistic diversity - were in line with the Peace Accords and the overall strategic direction o f the government. 218
PRONADE decentralizes important functions to community school councils, the COEDUCAs (Comitks Educativos), de jure giving the school a greater degree o f decision-making autonomy in i t s relation with the education authorities and enabling parents to have a stronger voice in their relation with school staff. Functions and responsibilities are divided among the different organizational layers as follows:219
oPRONADE’s implementation unit, headquartered in the capital, i s responsible for planning, directing and evaluating the program’s administrative and operational activities, including determining the geographical areas the program covers, hiring and supervising the ISEs (see below), and signing the legal covenant with the COEDUCAs.
*The 21 departmental offices are in charge of coordinating policy implementation at the departmental level, assisting with the identification o f communities that lack schools, processing
’” Cuellar Marchelli (2001). *18 Vaierio and Rojas (2004). ’ I 9 Information in this section i s drawn from MINEDUC (2003a), MINEDUC (2003b), MINEDUCDP Tecnologia (2002), and Valerio and Rojas (2004).
165
the financial and administrative data gathered by the ISEs, and supervising the school feeding program.
*Educational Service Institutions (ISEs) are NGOs hired by the implementation unit to identify communities’ educational requirements, organize and assist COEDUCAs in obtaining legal status, provide capacity building opportunities to teachers and school councils, and maintain updated information on the school’s administrative and financial matters.
o C O E D U C A s are legal entities that draw membership from the local community. Their responsibilities include: selecting, hiring, paying and supervising teachers, monitoring student attendance, managing funds transferred from the central authorities, organizing school feeding programs, and defining the school schedule and calendar.
Similar to EDUCO, PRONADE schools are established in remote, rural areas and provide for pre- school and primary education. Communities may qualify to participate in the PRONADE program if they meet the following four criteria: (1) they demonstrate the ability and interest to manage the new school, (2) the nearest public school must be at least three kilometers away, (3) there are at least 20 pre-primar and primary school-age children, and (4) there is presently no official teacher in the community. dl
c ) The Case of Honduras
Honduras’ community-based education program, PROHECO (Proyecto HondureAo de Educacio’n Cornunitaria) was launched in March 1999 with the objective o f enhancing access to education and fostering community participation in school-related decision-making. Studies the Ministry o f Education had carried out in 1997 showed that more than 14 percent o f school-age children were not enrolled in schools, 85 percent o f these in rural areas. Building on the experiences in El Salvador and Guatemala, the Honduran government decided to use a school-based management model to address these deficiencies and establish new pre-school and primary schools in remote rural villages. B y the end o f 1999, PROHECO schools existed in more than 500 communities.
Responsibilities for the implementation o f PROHECO are divided among stakeholders as follows:221
0 P R O H E C O ’ s coordinating unit, located at the central level, as part o f the MINED, i s responsible for establishing the overall operational policies and strategies, including curriculum design, and for coordinating the program’s technical and financial activities, including capacity building, community participation, collection o f statistical data, and monitoring and evaluation.
0 MINED departmental offices are responsible for raising awareness about PROHECO in the communities, and for overseeing the organization and fostering o f the AECOs (see below). They should also coordinate and oversee the work o f the promoters.
0 MINED district offices support schools wi th the application o f the national curriculum and the collection o f school data, such as enrollment and drop-out rates. They also help identify communities in which PROHECO schools w i l l be established.
220 The World Bank (2001a). 221 This section draws on Secretaria de Educacidn Pdblica (2003).
166
0 Social Promoters (promotores sociales) are in close contact with the communities and the school councils, helping with the identification of communities, providing training to the AECOs, and advising on questions of community participation and budget oversight.
0 The school council, AECO (Asociacio’n Educativa Comunitaria) i s a legal entity that draws i ts membership from the community and that has the following functions: selecting and paying teachers, monitoring teacher and student attendance and performance, managing funds for school materials and school improvement activities, and building and maintaining the school.
Communities qualify for a PROHECO school if they meet the following criteria: (1) they are located in a rural area, (2) there are at least 25 pre-school and primary-school age children, (3) the nearest school i s at least 3 kilometers away, and (4) the village i s located in an area that was affected by hurricane Mitch222.
d) The Case of Nicaragua
Nicaragua’s school decentralization reform was introduced under the presidency of Violetta Chamorro and her coalition government that replaced the Sandinista regime in the 1990 election.223 The goals of the reform included raising the efficiency and effectiveness of education services. Greater participation and decision-making authority o f parents and teachers was regarded as central to this end. First steps towards the “Autonomous School Program” (ASP) were taken in 1991, when so-called consultative councils (consejos consultivos) were established in all public schools to ensure the participation of the educational community, particularly parents, in school- related dec i~ ion-mak ing .~~~ The initiative was deepened as a pilot in 1993 with the transformation of the consultative councils into full-fledged governing councils (consejos directivos) at the school level in 24 well-functioning secondary schools. The objective of this pilot was to test the feasibility of a program that not only envisioned community participation but also increased autonomous decision-making at the school level.
The autonomous school program divides responsibilities among different actors as follows225:
0 MINED i s in charge of instituting norms for the operation o f schools and the basic content o f educational programs, setting standards for the quality o f school materials, the qualifications of teachers and schools’ physical facilities, determining the national curriculum, and channeling the national budget for the financing o f public education.
0 The municipal delegate of the MINED informs schools about ASP, guides schools through the application process, supports the program in the community while also acting as a liaison with the central ministry, and provides capacity building to the members o f the school council.
0 School councils (consejos directivos), both at the school and the municipal level, have legal status and are in charge of conducting the school’s business, including hiring teachers and
222 Secretaria de Educaci6n Pdblica (2003). 223 Gershberg (1 999). 224MECD(1993).
This i s adapted from The World Bank (1995) and Gershberg (1999).
167
administrative staff, maintaining the school building, making and overseeing budget allocations, generating additional financial resources (student fees), overseeing teacher performance and making pedagogical choices.
Unlike the cases in El Salvador, Guatemala and Honduras, the Nicaraguan reform initially targeted secondary schools in urban areas. I t was not so much concerned about the establishment o f new schools but rather the transformation o f the governing structures o f already existing schools. Since 1995 the autonomous school program has also targeted primary schools, using two different models: (1) one for urban schools which i s similar to the secondary school model, and (2) one for rural schools which are organized into municipal nuclei and where a centrally located school performs the management functions and operates the bank accounts for the school cluster226. This means that in urban primary and secondary schools councils operate at the school level, whereas in rural areas they operate at the municipal level.
B. COMPARING THE DIFFERENT REFORM DESIGNS
This sub-section explores specific features o f the different reform designs, comparing a series of aspects that relate to institutional arrangements, the organization, membership characteristics and functions o f the school councils, financial transfers, and teacher salaries and benefits. It should be noted here that programs l ike El Salvador’s EDUCO and Nicaragua’s Centros Auto’nornos have evolved over time: EDUCO more in i t s organizational arrangements, Nicaragua in i t s target schools and financial arrangements. When necessary, we w i l l attempt to capture this evolution.
The information on the characteristics and responsibilities o f the councils i s particularly important for understanding and comparing the de jure provisions for community empowerment and school autonomy. Overall, however, al l the aspects o f reform design analyzed in this sub-section w i l l be key to understanding the impact o f the S B M models on empowerment and educational outcomes, as w i l l become clearer in section IV.
a) Organizational and Implementation Arrangements
S B M models can differ according to the organizational arrangements that are made for project implementation, including contracting and supervision o f council trainers, teacher training, the identification o f the communities that are to participate in the reform, as well as the organization, training and monitoring o f the school councils. Table 5.1 shows how respective responsibilities are divided among different actors, indicating which actors are most closely in contact with the school councils and to what extent representatives or delegations o f the MINED are involved with them. El Salvador’s EDUCO program, as the one longest under implementation, has undergone a series of organizational rearrangements which are discussed in the subsequent sections and/or Table 5.1.
We w i l l see in section lV that school councils’ training and support i s a key factor o f success o f an SBM model, because i t i s key to the working o f the models that parents get adequate training and support in a variety o f areas, starting from administrative matters.
King, Ozler and Rawlings (2001) and Fuller and Rivarola (1998).
168
Contracting of school council trainers. Initially, the El Salvador, Guatemala and Honduras programs did not differ substantially as to the actors responsible for contracting and supervising school council trainers (such as promoters, supervisors or ISEs). In each case, this function was carried out by the program’s central coordinating unit, located within the MINED. Whi le this i s s t i l l the case in Guatemala and Honduras, in El Salvador the respective responsibility has been shifted to the school councils directly. El Salvador’s school councils themselves are now in charge for contracting and supervising their trainers and therefore have substantially more powers than their counterparts in the other countries. Nicaragua’s ASP was different f rom the start as, unlike the case in the other three programs, no system separate f rom the government was established to provide training and supervision to the school councils. In Nicaragua, the capacity building unit of the MINED- rather than an intermediary or non-government actor such as the promoter or supervisor - provides training to the school councils.
In three of the four countries, El Salvador, Honduras, and Guatemala, teacher training is mainly organized at the regional or district level. In contrast, Nicaraguan teacher training i s organized at the central level.
169
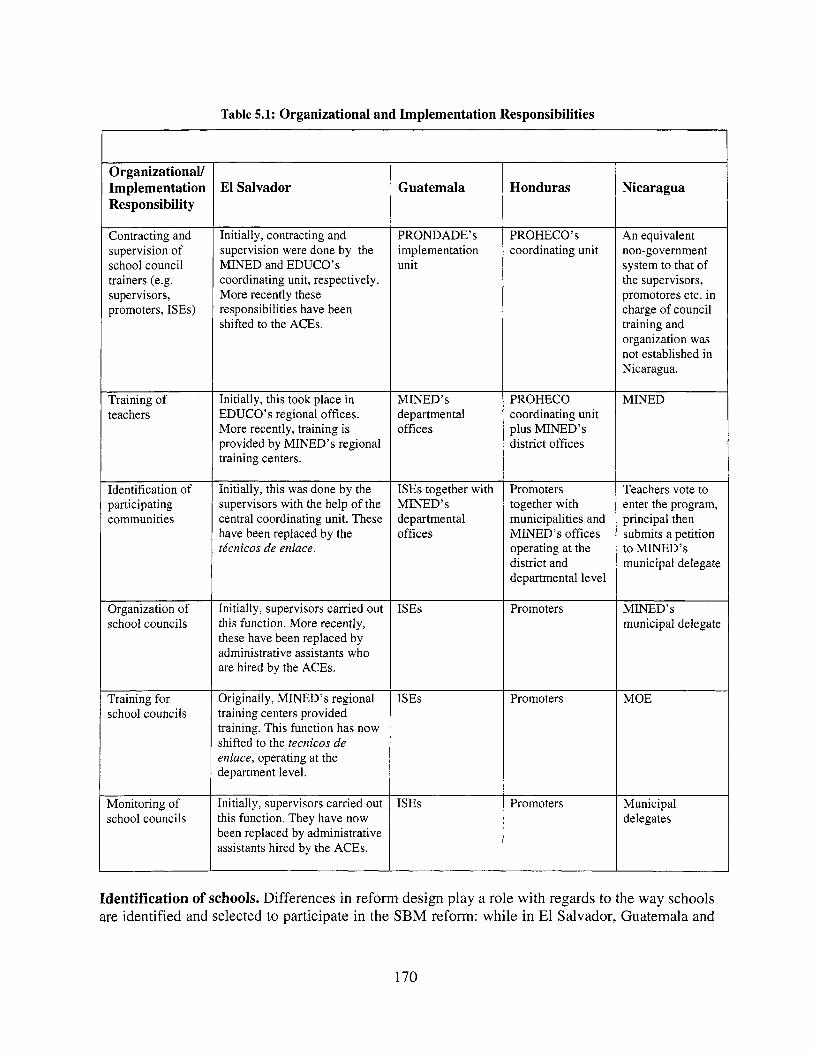
Table 5.1: Organizational and Implementation Responsibilities
Organizational/ Implementation Responsibility
Contracting and supervision o f school council trainers (e.g. supervisors, promoters, ISEs)
Training o f teachers
Identification o f participating communities
Organization o f school councils
Training for school councils
Monitoring o f school councils
El Salvador
Initially, contracting and supervision were done by the MINED and EDUCO’s coordinating unit, respectively. More recently these responsibilities have been shifted to the ACEs.
Initially, this took place in EDUCO’s regional offices. More recently, training i s provided by MINED’s regional training centers.
Initially, this was done b y the supervisors with the help o f the central coordinating unit. These have been replaced by the te‘cnicos de enlace.
Initially, supervisors carried out this function. More recently, these have been replaced by administrative assistants who are hired by the ACEs.
Originally, MINED’s regional training centers provided training. This function has now shifted to the tecnicos de enlace, operating at the department level.
Initially, supervisors carried out this function. They have now been replaced by administrative assistants hired by the ACEs.
Guatemala
PRONDADE’ s implementation unit
MINED’s departmental offices
ISEs together with MINED’s departmental offices
ISEs
ISEs
ISEs
Honduras
PROHECO’ s coordinating unit
PROHECO coordinating unit plus MINED’s district offices
Promoters together with municipalities and MINED’s offices operating at the district and departmental level
Promoters
Promoters
Promoters
Nicaragua
An equivalent non-government system to that o f the supervisors, promotores etc. in charge o f council training and organization was not established in Nicaragua.
MINED
Teachers vote to enter the program, principal then submits a petition to MINED’s municipal delegate
MINED’s municipal delegate
M O E
Municipal delegates
Identification of schools. Differences in reform design play a role with regards to the way schools are identified and selected to participate in the SBM reform: while in El Salvador, Guatemala and
170
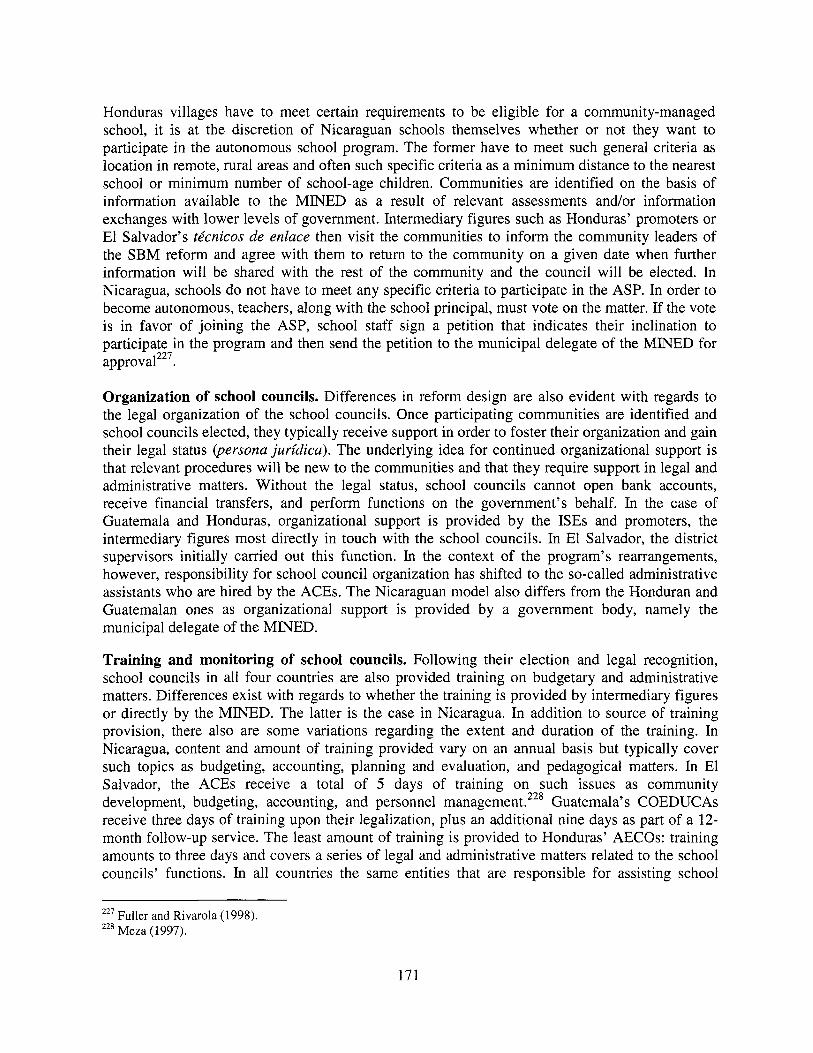
Honduras villages have to meet certain requirements to be eligible for a community-managed school, i t i s at the discretion of Nicaraguan schools themselves whether or not they want to participate in the autonomous school program. The former have to meet such general criteria as location in remote, rural areas and often such specific criteria as a minimum distance to the nearest school or minimum number of school-age children. Communities are identified on the basis o f information available to the MINED as a result of relevant assessments and/or information exchanges with lower levels of government. Intermediary figures such as Honduras’ promoters or El Salvador’s tkcnicos de enlace then visit the communities to inform the community leaders of the SBM reform and agree with them to return to the community on a given date when further information wi l l be shared with the rest o f the community and the council w i l l be elected. In Nicaragua, schools do not have to meet any specific criteria to participate in the ASP. In order to become autonomous, teachers, along with the school principal, must vote on the matter. If the vote i s in favor of joining the ASP, school staff sign a petition that indicates their inclination to participate in the program and then send the petition to the municipal delegate of the MINED for
Organization of school councils. Differences in reform design are also evident with regards to the legal organization o f the school councils. Once participating communities are identified and school councils elected, they typically receive support in order to foster their organization and gain their legal status (persona juridica). The underlying idea for continued organizational support i s that relevant procedures w i l l be new to the communities and that they require support in legal and administrative matters. Without the legal status, school councils cannot open bank accounts, receive financial transfers, and perform functions on the government’s behalf. In the case of Guatemala and Honduras, organizational support i s provided by the ISEs and promoters, the intermediary figures most directly in touch with the school councils. In El Salvador, the district supervisors initially carried out this function. In the context o f the program’s rearrangements, however, responsibility for school council organization has shifted to the so-called administrative assistants who are hired by the ACEs. The Nicaraguan model also differs from the Honduran and Guatemalan ones as organizational support i s provided by a government body, namely the municipal delegate of the MINED.
Training and monitoring of school councils. Following their election and legal recognition, school councils in all four countries are also provided training on budgetary and administrative matters. Differences exist with regards to whether the training i s provided by intermediary figures or directly by the MINED. The latter i s the case in Nicaragua. In addition to source of training provision, there also are some variations regarding the extent and duration of the training. In Nicaragua, content and amount of training provided vary on an annual basis but typically cover such topics as budgeting, accounting, planning and evaluation, and pedagogical matters. In El Salvador, the ACEs receive a total o f 5 days o f training on such issues as community development, budgeting, accounting, and personnel management.228 Guatemala’s COEDUCAs receive three days of training upon their legalization, plus an additional nine days as part o f a 12- month follow-up service. The least amount of training i s provided to Honduras’ AECOs: training amounts to three days and covers a series of legal and administrative matters related to the school councils’ functions. In all countries the same entities that are responsible for assisting school
227 Fuller and Rivarola (1998). 228 Meza (1997).
171
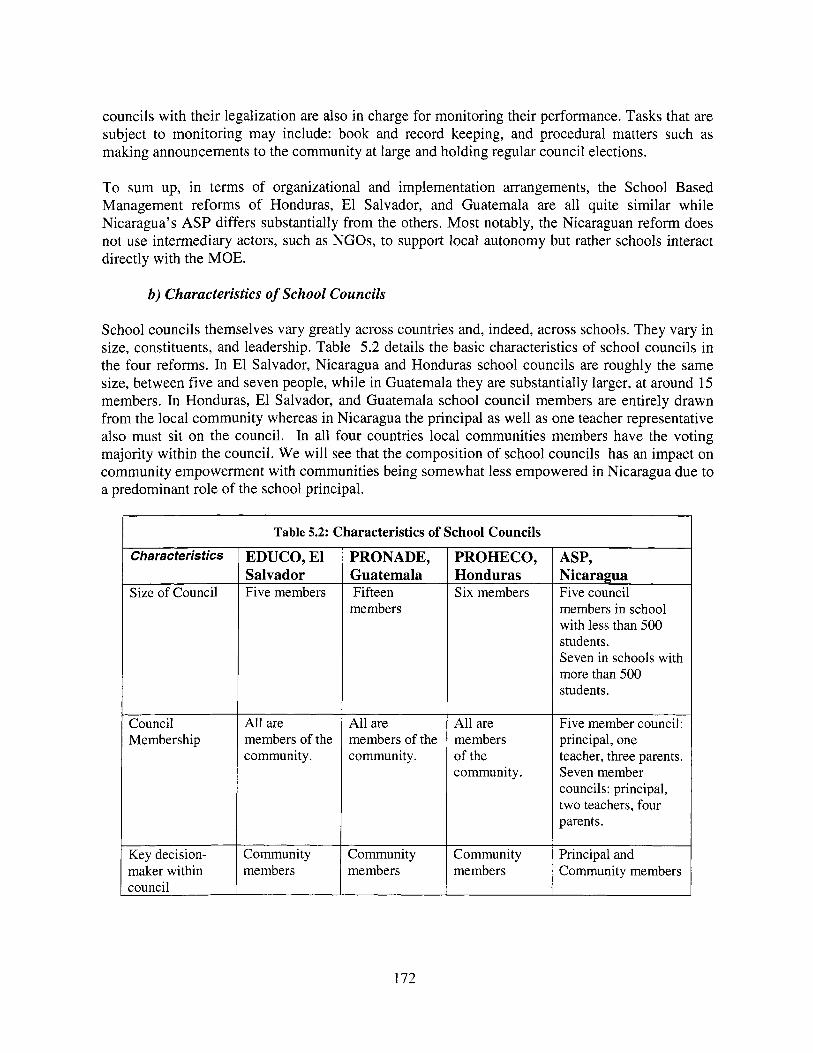
councils wi th their legalization are also in charge for monitoring their performance. Tasks that are subject to monitoring may include: book and record keeping, and procedural matters such as making announcements to the community at large and holding regular council elections.
T o sum up, in terms o f organizational and implementation arrangements, the School Based Management reforms o f Honduras, El Salvador, and Guatemala are all quite similar while Nicaragua’s ASP differs substantially from the others. Most notably, the Nicaraguan reform does not use intermediary actors, such as NGOs, to support local autonomy but rather schools interact directly with the MOE.
b) Characteristics of School Councils
School councils themselves vary greatly across countries and, indeed, across schools. They vary in size, constituents, and leadership. Table 5.2 details the basic characteristics o f school councils in the four reforms. In El Salvador, Nicaragua and Honduras school councils are roughly the same size, between five and seven people, while in Guatemala they are substantially larger, at around 15 members. In Honduras, El Salvador, and Guatemala school council members are entirely drawn from the local community whereas in Nicaragua the principal as wel l as one teacher representative also must s i t on the council. In all four countries local communities members have the voting majority within the council. We w i l l see that the composition o f school councils has an impact on community empowerment with communities being somewhat less empowered in Nicaragua due to a predominant role o f the school principal.
Characteristics
Size o f Council
Council Membership
Key decision- maker within council
Table 5.2: Characteristics of School Councils
EDUCO, El Salvador Five members
All are members o f the community.
Community members
PRONADE, Guatemala Fifteen members
All are members of the community.
Community members
PROHECO, Honduras Six members
All are members o f the community
Community members
ASP, Nicaragua Five council members in school with less than 500 students. Seven in schools with more than 500 students.
Five member council: principal, one teacher, three parents. Seven member councils: principal, two teachers, four parents .
Principal and Community members
172
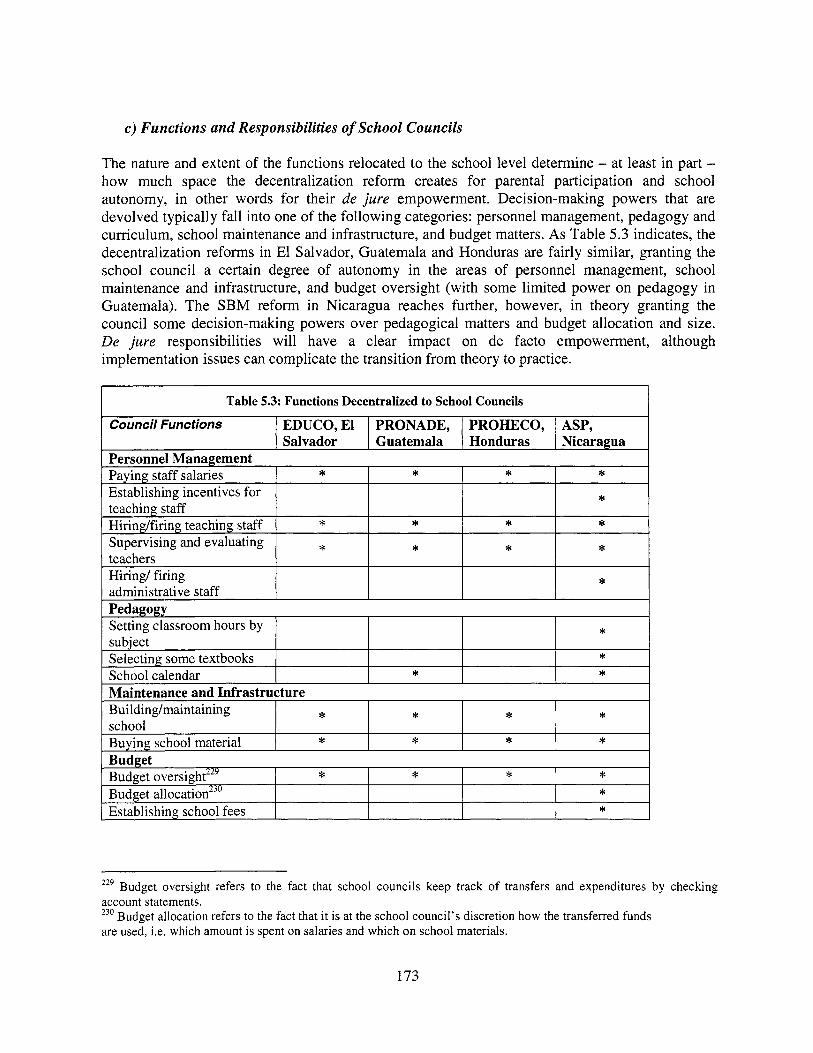
c ) Functions and Responsibilities of School Councils
Buying school material
The nature and extent o f the functions relocated to the school level determine - at least in part - how much space the decentralization reform creates for parental participation and school autonomy, in other words for their de jure empowerment. Decision-making powers that are devolved typically fa l l into one o f the following categories: personnel management, pedagogy and curriculum, school maintenance and infrastructure, and budget matters. As Table 5.3 indicates, the decentralization reforms in El Salvador, Guatemala and Honduras are fairly similar, granting the school council a certain degree o f autonomy in the areas o f personnel management, school maintenance and infrastructure, and budget oversight (with some limited power on pedagogy in Guatemala). The SBM reform in Nicaragua reaches further, however, in theory granting the council some decision-making powers over pedagogical matters and budget allocation and size. De jure responsibilities w i l l have a clear impact on de facto empowerment, although implementation issues can complicate the transition f rom theory to practice.
* * * *
Budget oversight229 Budget allocation230 Establishing school fees
* * * * * 4
229 Budget oversight refers to the fact that school councils keep track o f transfers and expenditures by checking account statements. 230 Budget allocation refers to the fact that i t i s at the school council’s discretion how the transferred funds are used, i.e. which amount i s spent on salaries and which on school materials.
173
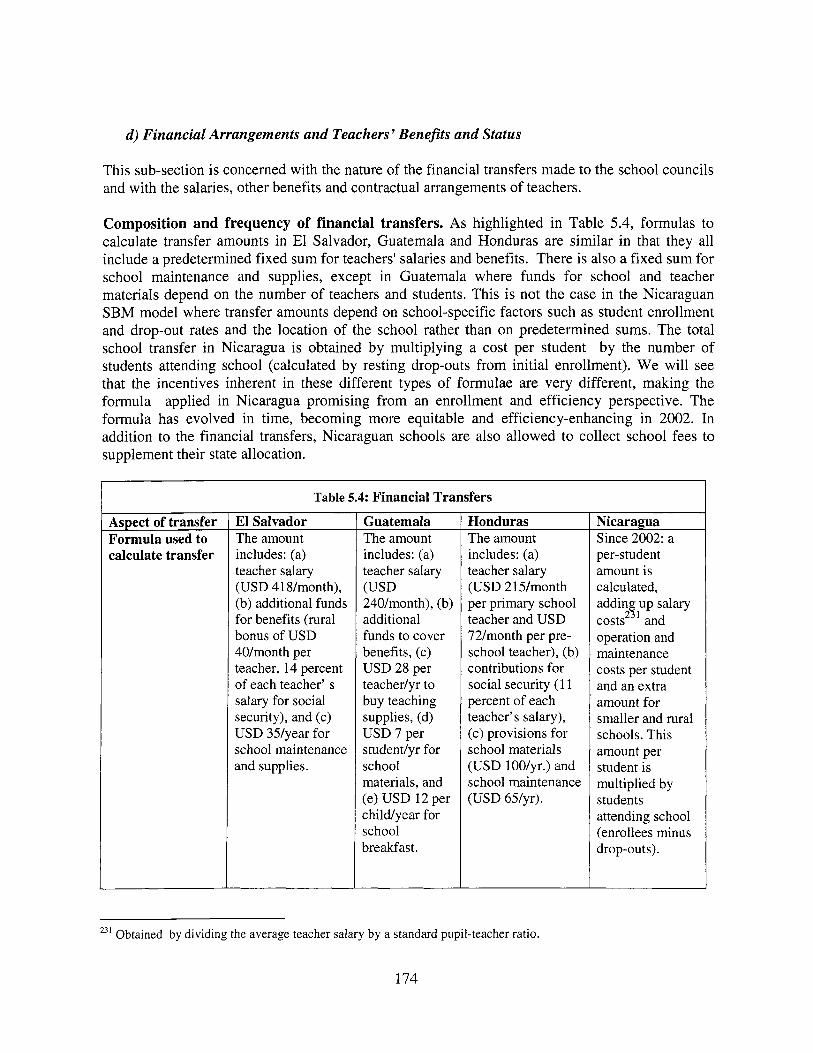
d) Financial Arrangements and Teachers’ Benefits and Status
This sub-section i s concerned with the nature o f the financial transfers made to the school councils and with the salaries, other benefits and contractual arrangements o f teachers.
Composition and frequency of financial transfers. As highlighted in Table 5.4, formulas to calculate transfer amounts in El Salvador, Guatemala and Honduras are similar in that they all include a predetermined fixed sum for teachers’ salaries and benefits. There i s also a fixed sum for school maintenance and supplies, except in Guatemala where funds for school and teacher materials depend on the number o f teachers and students. This i s not the case in the Nicaraguan SBM model where transfer amounts depend on school-specific factors such as student enrollment and drop-out rates and the location o f the school rather than on predetermined sums. The total school transfer in Nicaragua i s obtained b y multiplying a cost per student by the number o f students attending school (calculated by resting drop-outs from init ial enrollment). W e w i l l see that the incentives inherent in these different types o f formulae are very different, making the formula applied in Nicaragua promising from an enrollment and efficiency perspective. The formula has evolved in time, becoming more equitable and efficiency-enhancing in 2002. In addition to the financial transfers, Nicaraguan schools are also allowed to collect school fees to supplement their state allocation.
Aspect of transfer Formula used to calculate transfer
Table 5.4: Financial Transfers
El Salvador The amount includes: (a) teacher salary (USD 418/month), (b) additional funds for benefits (rural bonus of USD 40/month per teacher, 14 percent of each teacher’ s salary for social security), and (c) USD 35/year for school maintenance and supplies.
Guatemala The amount includes: (a) teacher salary (USD 240/month), (b) additional funds to cover benefits, (c) USD 28 per teacher/yr to buy teaching supplies, (d) USD 7 per studentlyr for school materials, and (e) USD 12 per child/year for school breakfast.
Honduras The amount includes: (a) teacher salary (USD 215/month per primary school teacher and USD 72/month per pre- school teacher), (b) contributions for social security (1 1 percent of each teacher’s salary), (c) provisions for school materials (USD 100/yr.) and school maintenance (USD 65/yr).
Nicaragua Since 2002: a per-student amount i s calculated, addin up salary
and operation and maintenance costs per student and an extra amount for smaller and rural schools. This amount per student i s multiplied by students attending school (enrollees minus drop-out s).
231 Obtained by dividing the average teacher salary by a standard pupil-teacher ratio.
174

Frequency of transfers Transfer The Ministry of
Public Finance transfers funds into PRONADE’s trust fund account which then deposits payments into local accounts opened up by COEDUCAs.
arrangements The Ministry of Finance transfers funds to PROHECO’ s coordinating unit which then makes transfers to AECO bank accounts.
Monthly
Initially, EDUCO’s coordinating unit deposited funds into local bank account registered by the ACE. Following a series of organizational rearrangements, it i s now the Ministry of Finance, through i t s departmental offices, who deposits the funds to the ACES.
I Quarterly Monthly
The Ministry of Finance transfers funds directly into local bank accounts opened up by the consejos.
Financial transfers to the school councils are made on a monthly (El Salvador, Nicaragua) or quarterly basis (Guatemala, Honduras). Transfer arrangements differ as to whether the transfer i s made directly from the Ministry o f Finance to the school councils’ bank account (El Salvador, Nicaragua) or whether the funds pass through the program’s central office (Guatemala, Honduras).
Teacher salaries, benefits and contract tenure. Comparing teacher salaries, benefits and contract tenure across countries as well as between SBM and traditional schools i s important because i t sheds light on the imbedded incentive structures that, among other factors, influences whether i t i s attractive for teachers to jo in and remain in their profession as well as their day-to- day work as teachers. Who teaches and teacher performance, in turn, i s directly related to educational achievement. Comparing teacher salaries and benefits across S B M and traditional schools, we see that, for a similar levels of qualifications, in El Salvador and Nicaragua salaries are identical across the two systems (the possibility o f raising fees would in fact allow salaries to be higher in the autonomous schools o f Nicaragua), while in Guatemala and, particularly, Honduras, salaries are higher in the traditional system. All other monetary benefits are generally higher in the traditional system (where, in particular, there are more fringe benefits), with the exception o f Nicaragua. Lower average teachers’ benefits in the S B M schools w i l l contribute to explain why teacher education i s lower in these schools. Finally, contract tenure i s fixed-term, yearly renewable, for S B M models, which constitutes one of the most salient features of the models, designed to create an incentive to perform well.
175
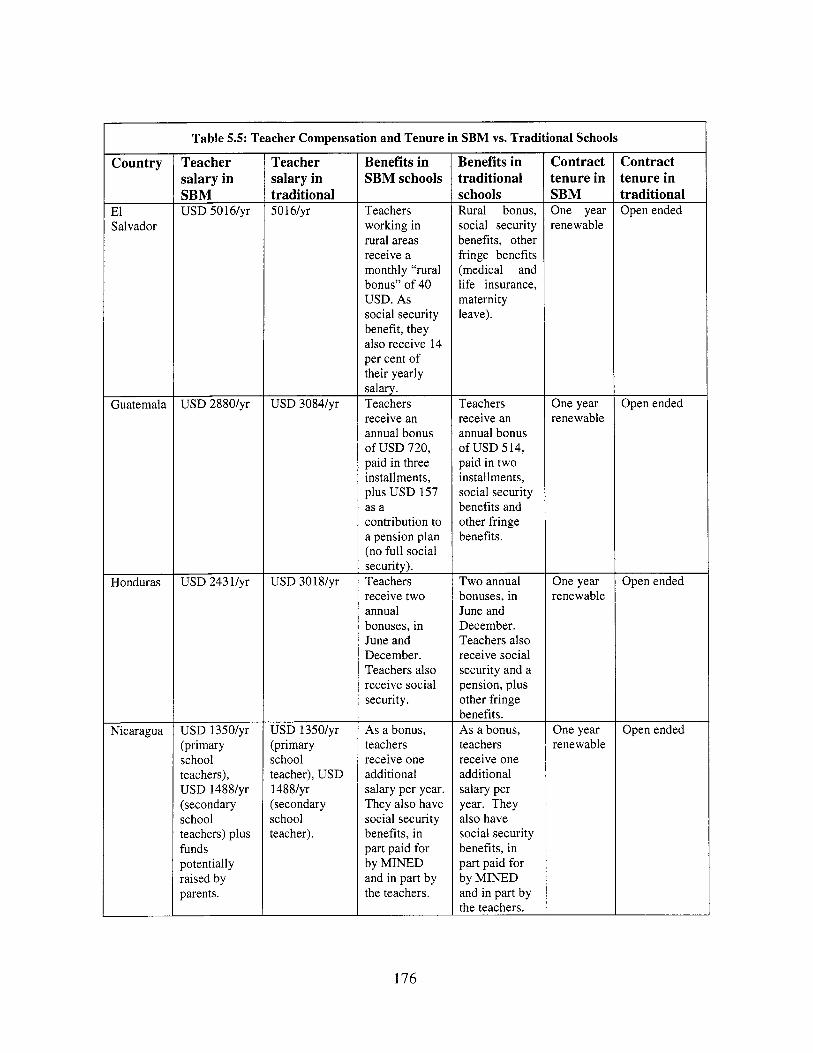
Table 5.5: Teacher Compensation and Tenure in SBM vs. Tradit ional Schools
Teacher salary in SBM USD 5016/yr
USD 2880/yr
USD 243 l / y r
USD 1350/yr (primary school teachers), USD 1488/yr (secondary school teachers) plus funds potentially raised by parents.
Teacher salary in traditional 50 16/yr
USD 3084/yr
USD 30 18/yr
USD 1350/yr (primary school teacher), USD 1488/yr (secondary school teacher).
Benefits in SBM schools
Teachers working in rural areas receive a monthly “rural bonus” o f 40 USD. As social security benefit, they also receive 14 per cent o f their yearly salary. Teachers receive an annual bonus o f USD 720, paid in three installments, plus USD 157 as a contribution to a pension plan (no full social security). Teachers receive two annual bonuses, in June and December. Teachers also receive social security.
As a bonus, teachers receive one additional salary per year. They also have social security benefits, in part paid for by MINED and in part by the teachers.
Benefits in traditional schools Rural bonus, social security benefits, other fringe benefits (medical and l i fe insurance, maternity leave).
Teachers receive an annual bonus o f USD 5 14, paid in two installments, social security benefits and other fringe benefits.
Two annual bonuses, in June and December. Teachers also receive social security and a pension, plus other fringe benefits. As a bonus, teachers receive one additional salary per year. They also have social security benefits, in part paid for by MINED and in part by the teachers.
Contract ;enure in 3BM h e year .enewable
3ne year renewable
One year renewable
One year renewable
Contract tenure in traditional 3pen ended
Open ended
Open ended
Open ended
I76

111. Impact of Decentralization Reforms
The purpose o f this sub-section i s to review and to systematize the existing analytical evidence on the progress and impact o f the school-autonomy models in Central America. The evidence relies mostly on secondary sources and, for Honduras, Guatemala and Nicaragua, recently collected data on autonomous schools. In all countries the information was complemented by interviews with key actors on specific aspects o f the impact o f the models and by additional secondary data covering aspects such as coverage, internal efficiency, etc.
Before presenting the results, we should made clear at the outset a few caveats. Firstly, as already mentioned, community-based school management programs implemented in Central America have been aimed at increasing enrollment, community participation, efficiency and, very marginally, on improving the quality o f education through more parental and local participation. Raising quality has not necessarily been at the center o f these initiatives, and the quality improvement objective has instead been considered as an indirect outcome or simply been added on as the programs have matured. Secondly, three factors complicate the use o f outcome measures (learning, years o f schooling, etc.) to evaluate the impact of education decentralization: (a) time series o f these measures are seldom available; (b) these school outcomes usually change slowly in response to any kind o f educational intervention, including decentralization; and (c) it i s very dif f icult to control for external shocks ranging from natural disasters and fiscal crises to teacher strikes and changes in national education leadership-that may also influence school outcomes. Third1 selection bias i s another major concern when assessing the effectiveness o f decentralization?” If the kinds o f communities who choose to participate in the school based management program are made up o f especially motivated individuals then evidence o f marginally higher test scores or more frequent student attendance may be incorrectly attributed to the decentralization experience itself. Also, differing rates o f student attrition between decentralized and non-decentralized school types may make comparisons o f outcomes for enrolled students very difficult to interpret.
W e are well aware o f the inherent difficulties o f decentralization research in developing countries, and we compensate for the lack o f perfect data b y bringing in multiple sources o f information that include secondary evidence from other studies as wel l as recently collected data from three o f the participating countries. Following our conceptual framework, our approach to understanding the effects o f decentralization in Central American schools focuses on two kinds of variables. The first group, which we refer to as the “first order” or direct impacts o f decentralization, includes improvements in things l ike community and school empowerment, the provision o f supporting inputs and teaching and learning processes. B y empowering communities and making teachers and directors more accountable to parent councils the S B M model predicts more effective schooling environments. These are the most immediate goals o f the S B M approach. But the story does not end here, since i t i s hoped that first order effects l ike improved teacher attendance w i l l translate into second order improvements in things l ike student learning. The first and second order distinction i s necessary from an evaluation standpoint, and i t i s important to first establish an impact o f decentralization in things l ike learning and teaching environments in order to explain any observed differences in student outcomes.
232 Jimenez and Sawada (1999).
177
This i s not necessarily a requirement for establishing that decentralization works, since differences in second order outcomes may result from things that are not measured well in the data or, for non learning outcomes such as coverage and equity, from factors related to reform design which do not affect first order results. But a more causal argument in support o f decentralization is built if the evidence shows that community participation or autonomous schools are more effective in areas that, in turn, are related to outcomes l ike test scores. This point has been somewhat neglected in the decentralization literature, at least in empirical analyses where the focus i s almost always on student outcomes such as test scores or drop out rates and less attention has been paid to understanding first order differences in school environments.
A. COMPARING SCHOOL ENVIRONMENTS WITH AND WITHOUT DECENTRALIZED EDUCATIONAL PROVISION
a) School Autonomy and Community Empowerment
Community Empowerment
Mixed evidence, although community empowerment i s generally greater in S B M schools. There i s some encouraging evidence that communities have been empowered in Central American S B M models.
In El Salvador, parents o f EDUCO students participate more in school affairs. A C E members (parent councils) in EDUCO schools visit classrooms almost 4-5 times more often than their traditional counterparts. At the parental association meetings, 80% and 79% o f ACES discussed teacher discipline and attendance o f school personnel, respectively, while corresponding figures o f schools in the traditional system are 62 percent and 38 percent, respectively.233 EDUCO parents are also three times more l ikely to engage in day to-day classroom activities than parents in traditional schools.234 Another benefit o f EDUCO, cited by Lindo (2001), has been the growth o f community social capital in communities with EDUCO. B y empowering parents, i t i s expected that other improvements w i l l result in areas such as democratic participation and state relations.
There i s also positive evidence o f community empowerment in Guatemala where each community i s represented b y the locally-elected school council, COEDUCA . A positive spillover effect o f the program has been the community’s more frequent and effective participation in other local and civic affairs.235 This has also been confirmed by other studies such as Asturias et a1 (2001) that found that COEDUCAs have used the knowledge acquired in training to lobby for projects to develop their communities such as roads, schools, electricity, running water, credits and others. A prior study by CIEN (1999) also found that COEDUCAs are a key means o f increasing social capital.
233 Sawada (2003). 234 Jimenez and Sawada (1999). 235 Valerio and Rojas (2004).
178

Table 5.6: Parental Involvement in Community Schools versus “Regular” Schools
Parent-Teacher Meetings (Parents)
Parent-Teacher Meetings (Teacher)
Parent-Teacher Meetings (Director)
Director-Parent Meetings
Meetings Coverage
Parental Participation
El Salvador
Control
1.56
EDUCO
5.65*
jource: Nicaraaua data 2~02 ; UMCE 2003; PRONA
Guatemala
Control
4.8
4.2
4.5
PRONADE
5.0*
4.7*
4.8*
Nicaragua
Non- Auto
3.43
5.41
0.55
i data 2002; Sawada and Ragatz, 2004.1
Autono m o w
3.44
4.92*
0.58*
Honduras
Public
2.62
1.65
PROHECO
1.71*
1.73 res: Data are not comparable across rom third/fourth grade questionnaires. countries due tomeasurement differences. In all countries except Guatemala the data are take
For Parent-Teacher Meetings the numbers refer to frequency, whereas Meetings Coverage measures percentage of topics covered during meetings. Parental Participation (Honduras only) is the degree of parental participation in the school activities according to the Director. Asterisk indicates comparison is significantly different at p0.01, 0.05 or 0.10 level.
Table 5.6 presents more evidence on parental participation in the region. The results are not entirely positive. In Nicaragua and Honduras parents in SBM schools appear to meet less frequently with school personnel than parents in traditional schools while in El Salvador and Guatemala the opposite i s true. This inconsistency i s somewhat surprising, and we cannot rule out measurement issues since parents at SBM school may not consider all of their trips to the school to be “visits.”
But frequency i s only part of the story, and it could be argued that the more important indicator of parental involvement relates to what parents actually do at schools and the amount of control they have, rather than how frequently they come around. On this count there i s more evidence o f an impact, as parents reported a (slightly) greater coverage of issues in Nicaraguan autonomous schools and PROHECO parents, according to Directors, have a greater degree of participation in school processes. However, neither difference i s particularly large and, in the case o f PROHECO, i t i s not significant (measurement error i s likely to be particularly relevant in Honduras). In Nicaragua, a study on the concluded “the evidence that parents’ participation in school affairs has improved with the reform i s weaker. About one-half o f parents and teachers think that i t (their participation) has become stronger, but a larger proportion of directors and council members think that i t has not changed, at best”. While this i s evidence o f 1996, these findings are confirmed in more recent
236 King and Ozler (1998). 237 See King, Ozler and Rawlings (2001); and Florez, Ruiz et al. (2003).
179
School Decision-Making Autonomy
Mixed evidence, although decision-making has generally increased. The next first order outcome to be considered i s decision-making autonomy. The S B M model predicts greater involvement by parents in day-to-day school operations, and the evidence (detailed above) i s generally supportive of this contention. The effects on autonomy are less predictable, since decision-making power may shift f rom directors and teachers to parents without necessarily increasing overall. For instance, the ability to fire teachers may shift f rom directors to parents under S B M but the locus of control versus the center may remain unchanged. This does not seem likely, however, since with more community participation and control o f schools, the overall decision-making autonomy should increase too, especially when parents have financial power. These factors, l ike those demonstrating parental participation, are also dif f icult to measure. On the one hand S B M stakeholders may not consider many o f their activities as evidence o f increased decision-making power and may under-report their real authority. On the other hand there may be significantly more de jure autonomy than de facto autonomy.
The ability to hire and fire teachers i s an important mechanism linking community participation with decision-making autonomy in all o f the S B M reforms in the four Central American countries. Parents may feel less inclined to participate in administrative processes or enter classrooms to instigate procedural and/or curriculum changes. They may instead use their ability to replace teachers as a means for improving autonomy and making schools more responsive to communities. In al l community school models parent councils have the power to hire and fire teachers. Whi le certainly an important power, it i s less clear whether communities members are skilled at choosing high-quality teachers. Additionally, communities are often faced with only a very small pool o f applicants considering the common attributes of S B M schools - lower salaries, remote locations and one-year contracts. These supply side constraints in turn make i t hard to fire teachers because readily-available replacements are largely absent.
I t is also important to consider how well parents and community members can evaluate the work of their teachers. Parents may be l imited to evaluating teachers on l imited measures, such as absenteeism, and teachers may be resentful o f being judged b y non-professionals. The PRONADE data from Guatemala reveal that less than 2 percent o f the parent councils in PRONADE schools report firing a teacher, which i s not significantly different f rom the non-PRONADE schools (PRONADE data). However, PRONADE schools report nearly three times as many instances o f teachers quitting the school. This, again, may be due to the more attractive salaries, j ob security, and working conditions in traditional schools.
The first evaluation o f Nicaragua's autonomous schools238 found that stakeholders in private schools report making 16 out of the 25 decisions pertaining to school operations and management at the school level (as opposed to a higher level), compared with 10 for traditional state schools and 13 for autonomous schools. At the primary level, respondents in both types o f autonomous schools report that the school makes 10 out o f the 25 decisions, as compared with seven for traditional public schools. These differences among the types o f schools are statistically significant. There i s some variation in the responses b y school directors, teachers, and council members within each school type, but these differences are not significant; thus, there i s general
238King and Ozler (1998).
180
agreement among the members o f the school community regarding the degree o f autonomy their school possesses. The evidence suggests that the reform has indeed successfully expanded the role o f the school in i t s governance. King and Ozler (1998) also found that autonomous schools make significantly more schooling decisions than do traditional schools, especially on personnel matters and in determining the school plan and budget. The Nicaraguan data also demonstrate that the degree o f decision-making actually exercised by autonomous schools varies greatly, and depends on i m p l e m e n t a t i ~ n . ~ ~ ~ Overall, the evidence for Nicaragua shows that the reform has indeed successfully expanded the role o f the school, although, in contrast to the other countries, we w i l l see that this came more from an increasing role o f the school director. In El Salvador, Sawada and Ragatz (2004) find that EDUCO parent councils have more power to hire and fire teachers and directors.
Some additional data on autonomy are reported in Table 5.7. The variables are not comparable and questions about measurement and quality abound. So the table is used only to highlight some o f the issues that need to be considered in the context of autonomy and implementation o f the SBM model. For example, there i s some evidence that teachers feel more “incentive-ized” in Nicaraguan autonomous schools, which i s a potentially important mechanism o f local control and autonomy if school councils and parents control the incentives. In Guatemala, the evidence from PRONADE i s that parent councils have more control over aspects o f schooling such as the work calendar and schedule, teacher supervision and even teaching methods (suggesting higher de facto than de jure autonomy). This last point i s particularly interesting, since the ability o f parents to enter classrooms, observe processes and instigate changes would appear to be limited in these contexts, especially rural Guatemala where many parents have never attended school. Finally, the results in Table 5.7 indicate that PROHECO teachers report less control over various aspects o f their work, although the results are not very significant (discussed below). Unfortunately, no evidence was specifically collected on the degree o f control o f the parents’ councils but defacto control is l ikely to be higher at that level (recent evidence extracted f rom a comprehensive assessment confirms that parents feel that they have substantial control over teachers in PROHECO schools240).
239 Parker (2004). 240 See ESA (2004).
181
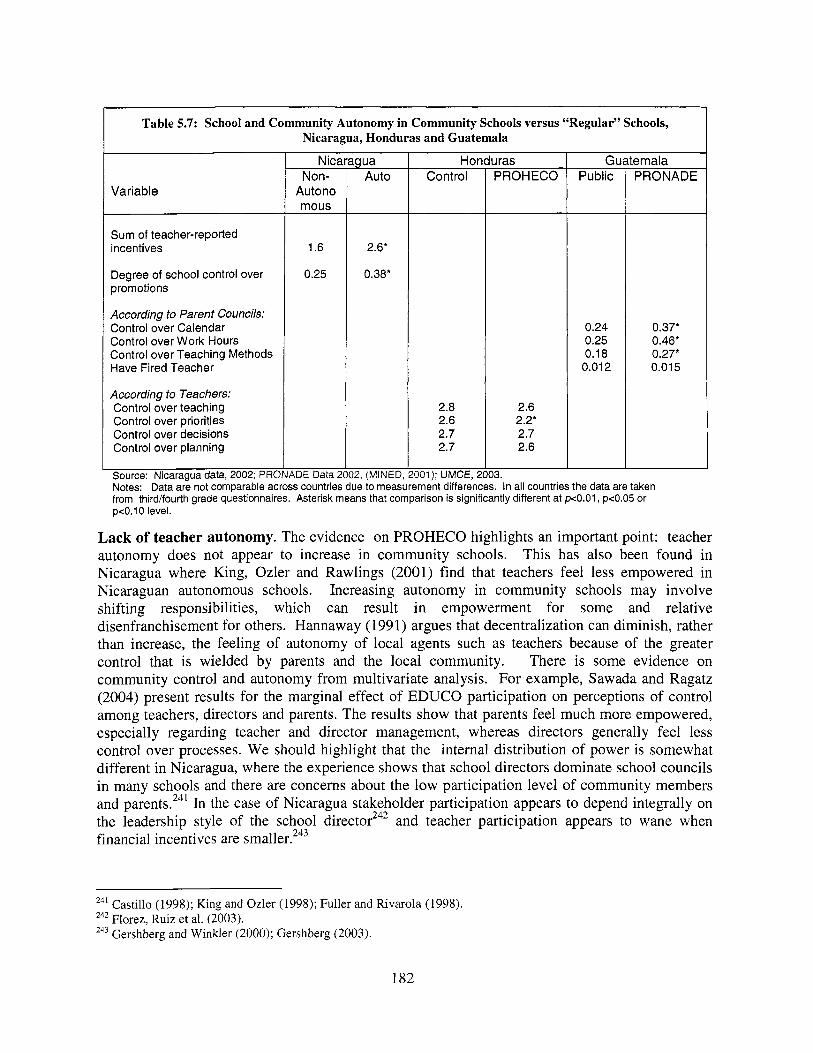
Table 5.7: School and Community Autonomy in Community Schools versus “Regular” Schools, Nicaragua, Honduras and Guatemala
2.8 2.6 2.7 2.7
Variable
Sum of teacher-reported incentives
Degree of school control over promotions
According to Parent Councils: Control over Calendar Control over Work Hours Control over Teaching Methods Have Fired Teacher
According to Teachers: Control over teaching Control over priorities Control over decisions Control over planning
Source: Nicaragua data, 2002; PRO
2.6 2.2* 2.7 2.6
Nica Non-
Autono mous
1.6
0.25
4DE Data 2
igua Auto
2.6*
0.38*
Honduras
L
0.24 0.25 0.18 0.012
temala PRONADE
0.37* 0.46* 0.27* 0.01 5
Notes: Data are not comparable across countries due to measurement differences. In all countries the data are taken from third/fourth grade questionnaires. Asterisk means that comparison is significantly different at ~ 0 . 0 1 , p<0.05 or pcO.10 level.
Lack of teacher autonomy. The evidence on PROHECO highlights an important point: teacher autonomy does not appear to increase in community schools. This has also been found in Nicaragua where King, Ozler and Rawlings (2001) find that teachers feel less empowered in Nicaraguan autonomous schools. Increasing autonomy in community schools may involve shifting responsibilities, which can result in empowerment for some and relative disenfranchisement for others. Hannaway (1 991) argues that decentralization can diminish, rather than increase, the feeling o f autonomy o f local agents such as teachers because o f the greater control that i s wielded by parents and the local community. There i s some evidence on community control and autonomy from multivariate analysis. For example, Sawada and Ragatz (2004) present results for the marginal effect o f EDUCO participation on perceptions o f control among teachers, directors and parents. The results show that parents feel much more empowered, especially regarding teacher and director management, whereas directors generally feel less control over processes. We should highlight that the internal distribution o f power i s somewhat different in Nicaragua, where the experience shows that school directors dominate school councils in many schools and there are concerns about the l ow participation level o f community members and parents.241 In the case o f Nicaragua stakeholder participation appears to depend integrally on the leadership style of the school director242 and teacher participation appears to wane when financial incentives are smaller.243
241 Castillo (1998); King and Ozler (1998); Fuller and Rivarola (1 998). 242 Florez, Ruiz et al. (2003). 243 Gershberg and Winkler (2000); Gershberg (2003).
182
How can the impacts of SBM on community participation and school autonomy be summarized ? With the available data only a few, tentative conclusions can be put forth. First, the fact that hundreds of these schools are operating in the region provides some evidence of community empowerment, at least as measured by participation. There i s also some evidence that parents are participating more in day-to-day operations in community schools, although the most certain mechanism appears to be through teacher management (hiring, paying, supervising, firing) and budgeting. What i s less clear i s the extent to which parents are actively involved in the teaching and learning environment of SBM schools. These are difficult aspects to measure, and in some cases (especially Guatemala) the parents are reporting more involvement in these facets o f school life. Final conclusions about school autonomy levels are also difficult. Decentralization may, in some cases, have the effect of switching decision-making power from teachers and directors to parents, rather than increasing overall autonomy vis-a-vis the center. However, the fact that parents are participating more in teacher management in community schools i s an important finding that may signal greater overall autonomy.
b)Teaching and Learning Environments
In this section we consider the relationship between decentralized control of schooling and teaching and learning environments. With the exception of certain observable and clear-cut school and home factors and teacher characteristics these are difficult variables to measure. I t i s also not entirely evident whether we would expect SBM schools to have better or worse teaching and learning environments compared with traditional schools. On the one hand the remote and impoverished settings of many SBM schools may lead us to believe they would have inferior teaching and learning environments. On the other hand, increased community participation and school accountability may lead these schools to have superior teaching and learning environments.
Learning Materials and School Infrastructure
The relative state of school resources and infrastructure in SBM schools compared with traditional schools varies across countries due to program design and national priorities. In El Salvador, EDUCO schools and traditional schools are equally likely to have sanitation facilities, but fewer EDUCO schools have access to electricity or piped water. There are no differences in access to textbooks between the two types of schools, but EDUCO classrooms tend to have fewer students and a larger library.244 Despite this advantage EDUCO schools have fewer overall resources than traditional or private schools and teachers use fewer resources in the classroom to improve learning.245
The quasi-experimental study of PRONADE schools in Guatemala attests that PRONADE schools are more likely to lack water and sanitary facilities than a control group o f schools.246 Another study carried out by CIEN (1999) reports that people generally believe PRONADE schools to be worse of f than traditional counterparts.
244 Sawada (2003). 245 MINEDLJES (2003). 246 MINEDUCDP Tecnologias (2002).
183
The situation i s different in Nicaragua where, largely due to program design, Autonomous Schools tend to have more resources and better infrastructure than traditional schools. Parker (2004) finds that Autonomous Schools are more l ikely to have curriculum standards and teacher guides and that school conditions and resources tend to be higher.
This i s also true for Honduras where PROHECO schools have more resources and better infrastructure, on average, than their traditional school counterparts. In terms o f infrastructure, the program has benefited from access to external funds to improve infrastructure, and construction o f PROHECO schools has been a priority o f the Honduran Social Fund (FHIS). In terms o f learning materials, PROHECO schools also tend to have more than traditional schools perhaps because school councils receive money directly to purchase materials.247 PROHECO schools are not altogether more advantaged then traditional schools however, traditional schools tend to have more schools services and larger libraries than PROHECO schools.248
Teacher EfSort
If community schools have greater autonomy and parental participation it seems l ikely that they w i l l do a better job o f maximizing existing capacity, perhaps b y eliciting more effort from teachers.249 Teacher effort i s yet another elusive idea to measure but typically researchers use proxies such as teacher attendance, hours worked, and frequency o f homework assigned. Eliciting greater or improved teacher effort i s one o f the key ways in which school-based management may improve student learning and development.
Teacher attendance and work hours
There i s some evidence that community school teachers work more days and more hours than traditional school teachers, although this i s more the case in El Salvador, and Guatemala than in Honduras or Nicaragua. In the case o f El Salvador, Jimenez and Sawada (1999) argue that close community monitoring and greater j o b insecurity in EDUCO schools result in less teacher absenteeism and fewer school closings than in traditional schools. There i s indication that school councils in EDUCO schools are more l ikely to discuss teacher attendance and disciplinary measures than parent associations in traditional schools.250 EDUCO teachers report that they are also more likely to visit students' homes if students are absent. T h i s may also be at least in part a behavior stimulated by greater accountability to parents in these schools. 25 1
Table 5.8 summarizes the evidence from El Salvador, Honduras, Nicaragua and Guatemala. Similar measures o f teacher attendance and work hours are considerably more mixed in Nicaragua. While autonomous school teachers and principals tend to report that teachers work more hours and are less absent than traditional school teachers these results are not reflected in parent or student surveys. 252
247 Durston (1999). 248 DiGropello and Marshall (2004). 249Sawada (2003); DiGropello and Marshall (2004).
251 Ibid. 252 King and Ozler (1 998).
250 . Jimenez and Sawada (1999).
184
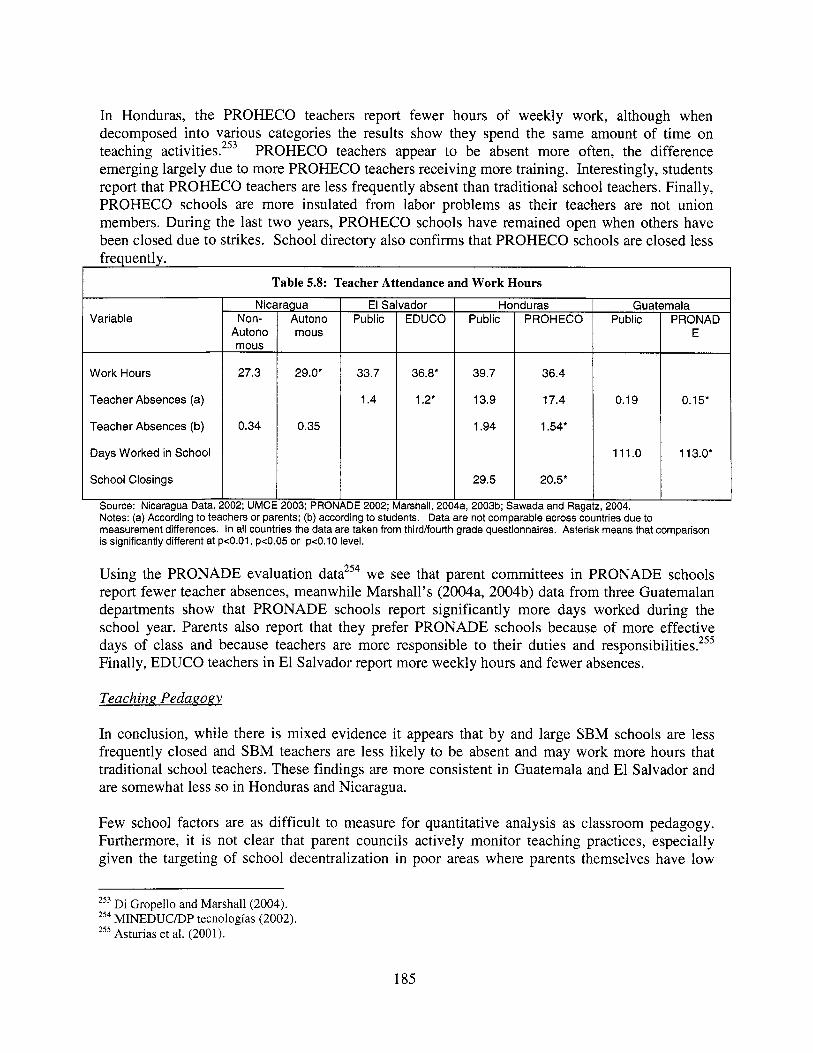
In Honduras, the PROHECO teachers report fewer hours o f weekly work, although when decomposed into various categories the results show they spend the same amount o f time on teaching activities.253 PROHECO teachers appear to be absent more often, the difference emerging largely due to more PROHECO teachers receiving more training. Interestingly, students report that PROHECO teachers are less frequently absent than traditional school teachers. Finally, PROHECO schools are more insulated from labor problems as their teachers are not union members. During the last two years, PROHECO schools have remained open when others have been closed due to strikes. School directory also confirms that PROHECO schools are closed less freauentlv.
Nicaragua
Table 5.8: Teacher Attendance and Work Hours
El S;
Work Hours
Teacher Absences (a)
Teacher Absences (b)
Days Worked in School
School Closings
Autono mous mous
27.3 29.0* 33.7
1.4
0.34 0.35
lador EDUCO
36.8’
1.2*
nrshall, 20t
Hc Public
39.7
13.9
1.94
29.5
3,2003b; 5
duras PROHECO
36.4
17.4
1.54*
20.5*
wada and Rag;
Guatemala Public PRONAD t
0.15’
111.0 113.W
,2004. Notes: (a) According to teachers or parents; (b) according to stui nts. Data are not comparable across countries due to measurement differences. In all countries the data are taken from third/fourth grade questionnaires. Asterisk means that comparison is significantly different at pcO.01, pc0.05 or pcO.10 level.
Using the PRONADE evaluation data254 we see that parent committees in PRONADE schools report fewer teacher absences, meanwhile Marshall’s (2004a, 2004b) data f rom three Guatemalan departments show that PRONADE schools report significantly more days worked during the school year. Parents also report that they prefer PRONADE schools because o f more effective days o f class and because teachers are more responsible to their duties and r e s p ~ n s i b i l i t i e s . ~ ~ ~ Finally, EDUCO teachers in El Salvador report more weekly hours and fewer absences.
Teaching Pedagogv
In conclusion, while there i s mixed evidence it appears that b y and large S B M schools are less frequently closed and S B M teachers are less l ikely to be absent and may work more hours that traditional school teachers. These findings are more consistent in Guatemala and El Salvador and are somewhat less so in Honduras and Nicaragua.
Few school factors are as dif f icult to measure for quantitative analysis as classroom pedagogy. Furthermore, i t i s not clear that parent councils actively monitor teaching practices, especially given the targeting o f school decentralization in poor areas where parents themselves have l o w
253 Di Gropello and Marshall (2004). 254 MINEDUCDP tecnologias (2002). 255 Asturias et al. (2001).
185
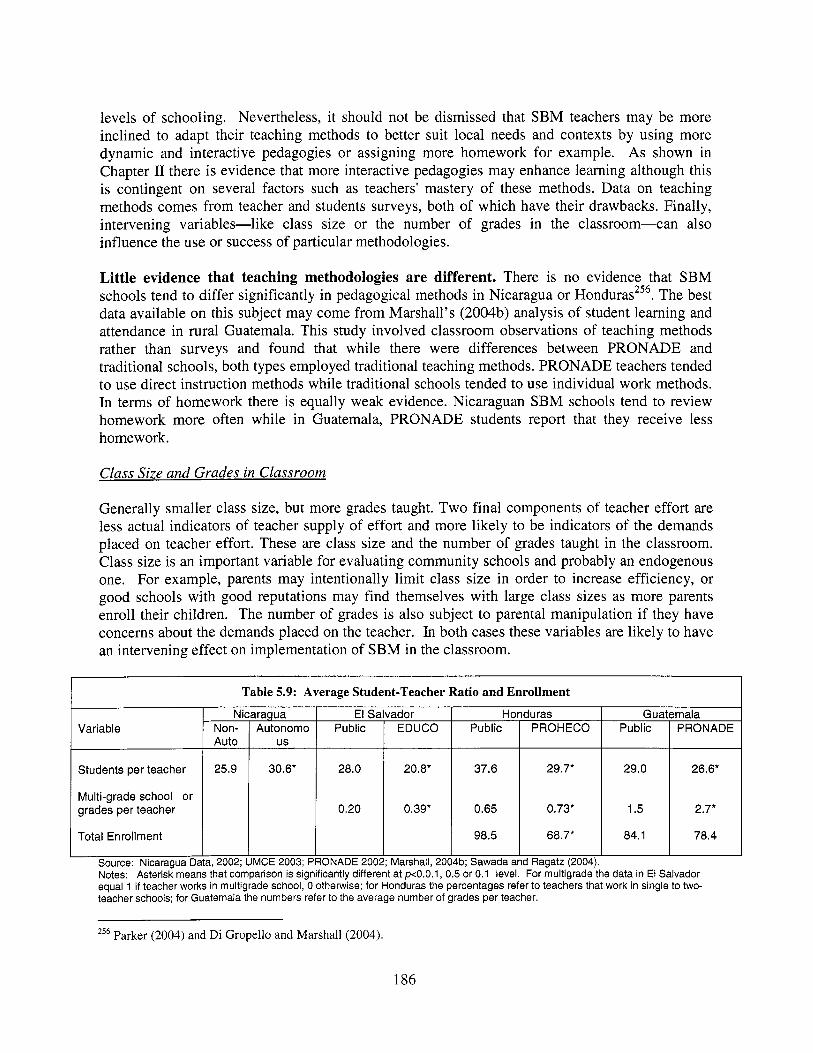
levels o f schooling. Nevertheless, i t should not be dismissed that SBM teachers may be more inclined to adapt their teaching methods to better suit local needs and contexts by using more dynamic and interactive pedagogies or assigning more homework for example. As shown in Chapter I1 there i s evidence that more interactive pedagogies may enhance learning although this i s contingent on several factors such as teachers' mastery o f these methods. Data on teaching methods comes from teacher and students surveys, both o f which have their drawbacks. Finally, intervening variables-like class size or the number o f grades in the classroom-can also influence the use or success o f particular methodologies.
Nicaragua El Salvador Honduras Variable Non- Autonomo Public EDUCO Public PROHECO
Auto us
Students per teacher 25.9 30.6* 28.0 20.8* 37.6 29.7*
Multi-grade school or grades per teacher 0.20 0.39* 0.65 0.73*
Total Enrollment 98.5 68.7*
Litt le evidence that teaching methodologies are different. There i s no evidence that S B M schools tend to differ significantly in pedagogical methods in Nicaragua or Honduras256. The best data available on this subject may come from Marshall's (2004b) analysis o f student learning and attendance in rural Guatemala. This study involved classroom observations of teaching methods rather than surveys and found that while there were differences between PRONADE and traditional schools, both types employed traditional teaching methods. PRONADE teachers tended to use direct instruction methods while traditional schools tended to use individual work methods. In terms o f homework there i s equally weak evidence. Nicaraguan S B M schools tend to review homework more often while in Guatemala, PRONADE students report that they receive less homework.
Guatemala Public PRONADE
29.0 26.V
1.5 2.7*
84.1 78.4
Class Size and Grades in Classroom
Generally smaller class size, but more grades taught. Two final components of teacher effort are less actual indicators of teacher supply o f effort and more l ikely to be indicators o f the demands placed on teacher effort. These are class size and the number o f grades taught in the classroom. Class size i s an important variable for evaluating community schools and probably an endogenous one. For example, parents may intentionally limit class size in order to increase efficiency, or good schools with good reputations may find themselves wi th large class sizes as more parents enroll their children. The number o f grades is also subject to parental manipulation if they have concerns about the demands placed on the teacher. In both cases these variables are l ikely to have an intervening effect on implementation o f S B M in the classroom.
256 Parker (2004) and Di Grope110 and Marshall (2004).
186
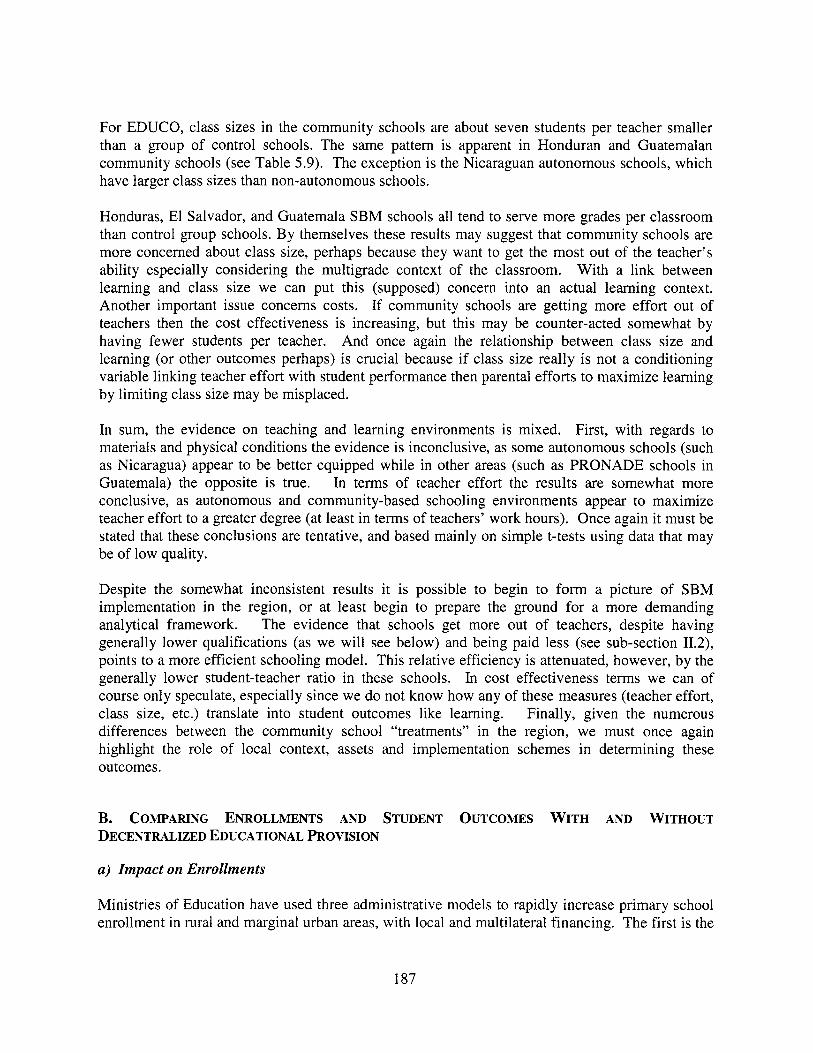
For EDUCO, class sizes in the community schools are about seven students per teacher smaller than a group o f control schools. The same pattern i s apparent in Honduran and Guatemalan community schools (see Table 5.9). The exception i s the Nicaraguan autonomous schools, which have larger class sizes than non-autonomous schools.
Honduras, El Salvador, and Guatemala S B M schools all tend to serve more grades per classroom than control group schools. B y themselves these results may suggest that community schools are more concerned about class size, perhaps because they want to get the most out o f the teacher’s ability especially considering the multigrade context o f the classroom. With a link between learning and class size we can put this (supposed) concern into an actual learning context. Another important issue concerns costs. If community schools are getting more effort out o f teachers then the cost effectiveness i s increasing, but this may be counter-acted somewhat by having fewer students per teacher. And once again the relationship between class size and learning (or other outcomes perhaps) i s crucial because if class size really is not a conditioning variable linking teacher effort with student performance then parental efforts to maximize learning b y limiting class size may be misplaced.
In sum, the evidence on teaching and learning environments i s mixed. First, wi th regards to materials and physical conditions the evidence i s inconclusive, as some autonomous schools (such as Nicaragua) appear to be better equipped while in other areas (such as PRONADE schools in Guatemala) the opposite i s true. In terms o f teacher effort the results are somewhat more conclusive, as autonomous and community-based schooling environments appear to maximize teacher effort to a greater degree (at least in terms o f teachers’ work hours). Once again i t must be stated that these conclusions are tentative, and based mainly on simple t-tests using data that may be o f low quality.
Despite the somewhat inconsistent results i t i s possible to begin to fo rm a picture o f S B M implementation in the region, or at least begin to prepare the ground for a more demanding analytical framework. The evidence that schools get more out o f teachers, despite having generally lower qualifications (as we w i l l see below) and being paid less (see sub-section 11.2), points to a more efficient schooling model. This relative efficiency i s attenuated, however, b y the generally lower student-teacher ratio in these schools. In cost effectiveness terms we can o f course only speculate, especially since we do not know how any o f these measures (teacher effort, class size, etc.) translate into student outcomes l ike learning. Finally, given the numerous differences between the community school “treatments” in the region, we must once again highlight the role o f local context, assets and implementation schemes in determining these outcomes.
B. COMPARING ENROLLMENTS AND STUDENT OUTCOMES W I T H AND WITHOUT DECENTRALIZED EDUCATIONAL PROVISION
a) Impact on Enrollments
Ministries o f Education have used three administrative models to rapidly increase primary school enrollment in rural and marginal urban areas, with local and multilateral financing. The first is the
187
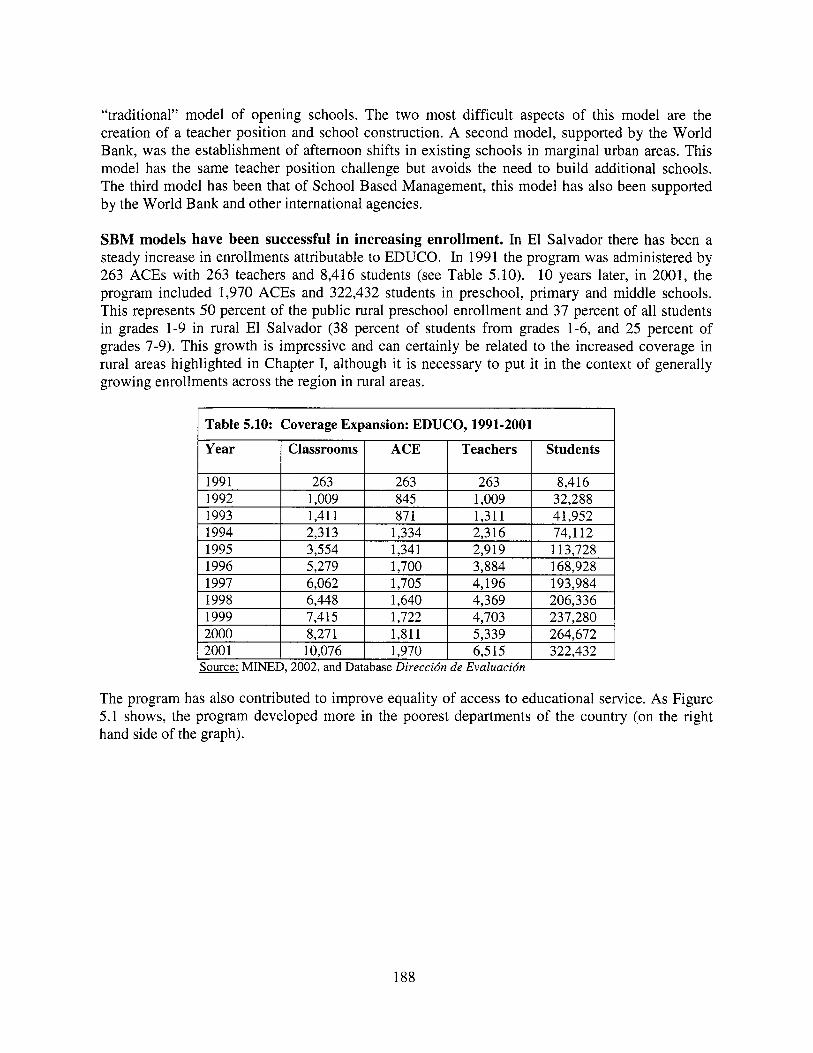
“traditional” model o f opening schools. The two most dif f icult aspects of this model are the creation o f a teacher position and school construction. A second model, supported b y the World Bank, was the establishment o f afternoon shifts in existing schools in marginal urban areas. This model has the same teacher position challenge but avoids the need to build additional schools. The third model has been that o f School Based Management, this model has also been supported by the World Bank and other international agencies.
SBM models have been successful in increasing enrollment. In El Salvador there has been a steady increase in enrollments attributable to EDUCO. In 1991 the program was administered b y 263 ACEs with 263 teachers and 8,416 students (see Table 5.10). 10 years later, in 2001, the program included 1,970 ACEs and 322,432 students in preschool, primary and middle schools. This represents 50 percent o f the public rural preschool enrollment and 37 percent o f al l students in grades 1-9 in rural El Salvador (38 percent o f students f rom grades 1-6, and 25 percent o f grades 7-9). This growth i s impressive and can certainly be related to the increased coverage in rural areas highlighted in Chapter I, although i t i s necessary to put i t in the context o f generally growing enrollments across the region in rural areas.
Source: MINED, 2002, and Database Direccidn de Evaluacidn
The program has also contributed to improve equality o f access to educational service. As Figure 5.1 shows, the program developed more in the poorest departments o f the country (on the right hand side o f the graph).
188
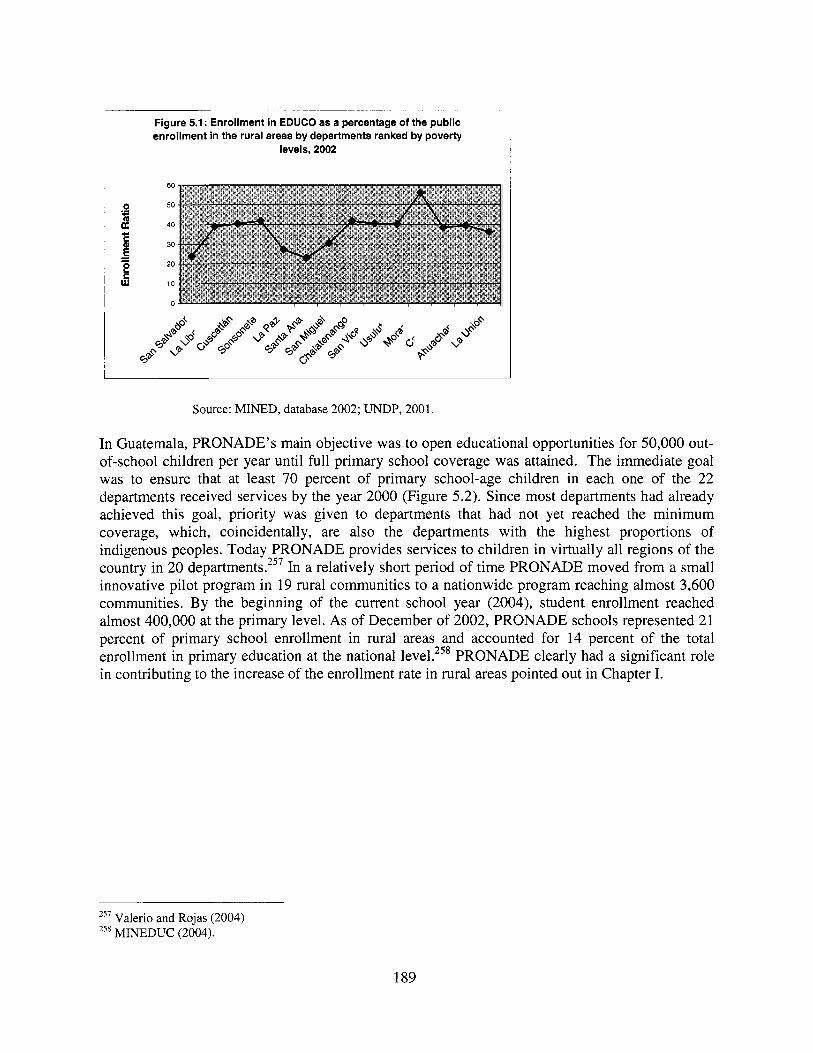
Figure 5.1 : Enrollment in EDUCO as a percentage of the public enrollment in the rural areas by departments ranked by poverty
levels. 2002
60
0 50
E 40
30 C
20
10
0
.- - c
- E : - w
Source: MINED, database 2002; UNDP, 2001.
In Guatemala, PRONADE's main objective was to open educational opportunities for 50,000 out- of-school children per year until full primary school coverage was attained. The immediate goal was to ensure that at least 70 percent of primary school-age children in each one of the 22 departments received services by the year 2000 (Figure 5.2). Since most departments had already achieved this goal, priority was given to departments that had not yet reached the minimum coverage, which, coincidentally, are also the departments with the highest proportions of indigenous peoples. Today PRONADE provides services to children in virtually all regions of the country in 20 department^.^'^ In a relatively short period of time PRONADE moved from a small innovative pilot program in 19 rural communities to a nationwide program reaching almost 3,600 communities. B y the beginning of the current school year (2004), student enrollment reached almost 400,000 at the primary level. As of December o f 2002, PRONADE schools represented 21 percent o f primary school enrollment in rural areas and accounted for 14 percent o f the total enrollment in primary education at the national PRONADE clearly had a significant role in contributing to the increase of the enrollment rate in rural areas pointed out in Chapter I.
Valerio and Rojas (2004) 251
258 MINEDUC (2004).
189
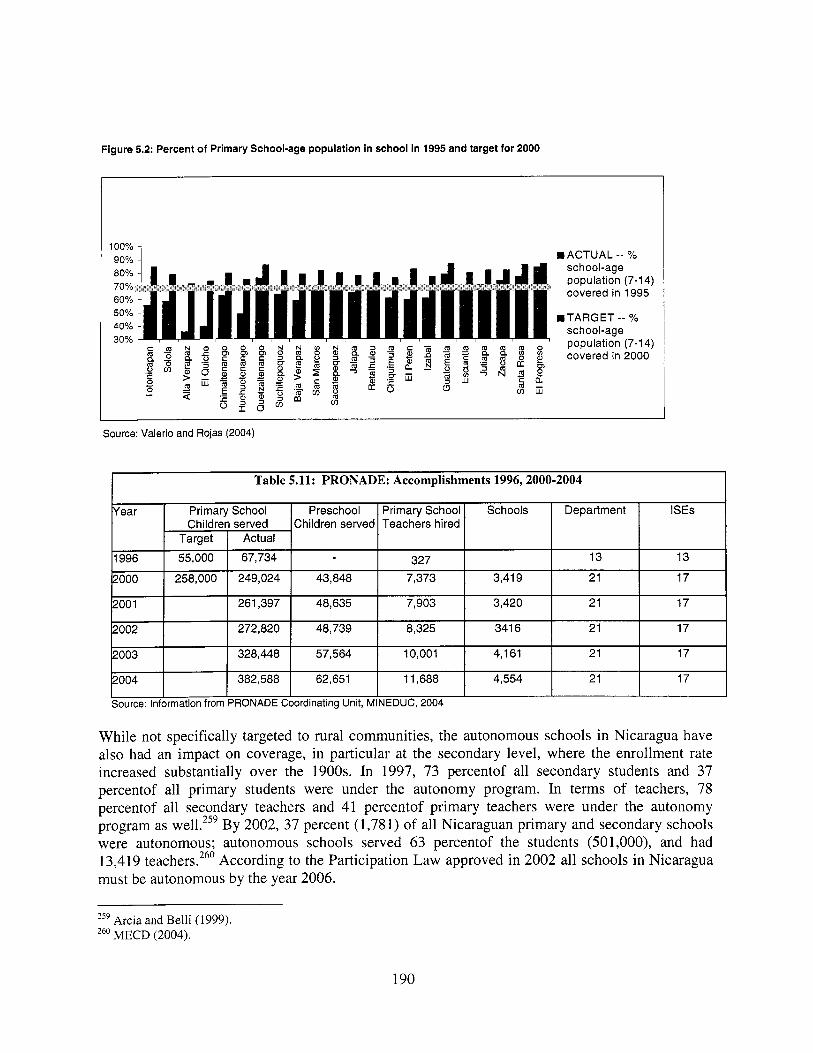
Figure 5.2: Percent of Primary School-age population in school in 1995 and target for 2000
ear Primar School Preschool Primary School Schools served Children served Teachers hired
Actual
I
Department ISEs
Source: Valerio and Rojas (2004)
67,734
249,024
261,397
272,820
328,448
382,588
Table 5.11: PRONADE: Accomplishments 1996,2000-2004
327 13 13 43,848 7,373 3,419 21 17
48,635 7,903 3,420 21 17
48,739 8,325 341 6 21 17
57,564 10,001 4,161 21 17
62,651 11,688 4,554 21 17
55,000
258,000
004
Source: Information from
While not specifically targeted to rural communities, the autonomous schools in Nicaragua have also had an impact on coverage, in particular at the secondary level, where the enrollment rate increased substantially over the 1900s. In 1997, 73 percentof al l secondary students and 37 percentof al l primary students were under the autonomy program. In terms of teachers, 78 percentof al l secondary teachers and 41 percentof primary teachers were under the autonomy program as well.259 B y 2002, 37 percent (1,781) o f all Nicaraguan primary and secondary schools were autonomous; autonomous schools served 63 percentof the students (501 ,OOO), and had 13,419 teachers.260 According to the Participation Law approved in 2002 al l schools in Nicaragua must be autonomous by the year 2006.
259 Arcia and Bel l i (1999). 260 MECD (2004).
190
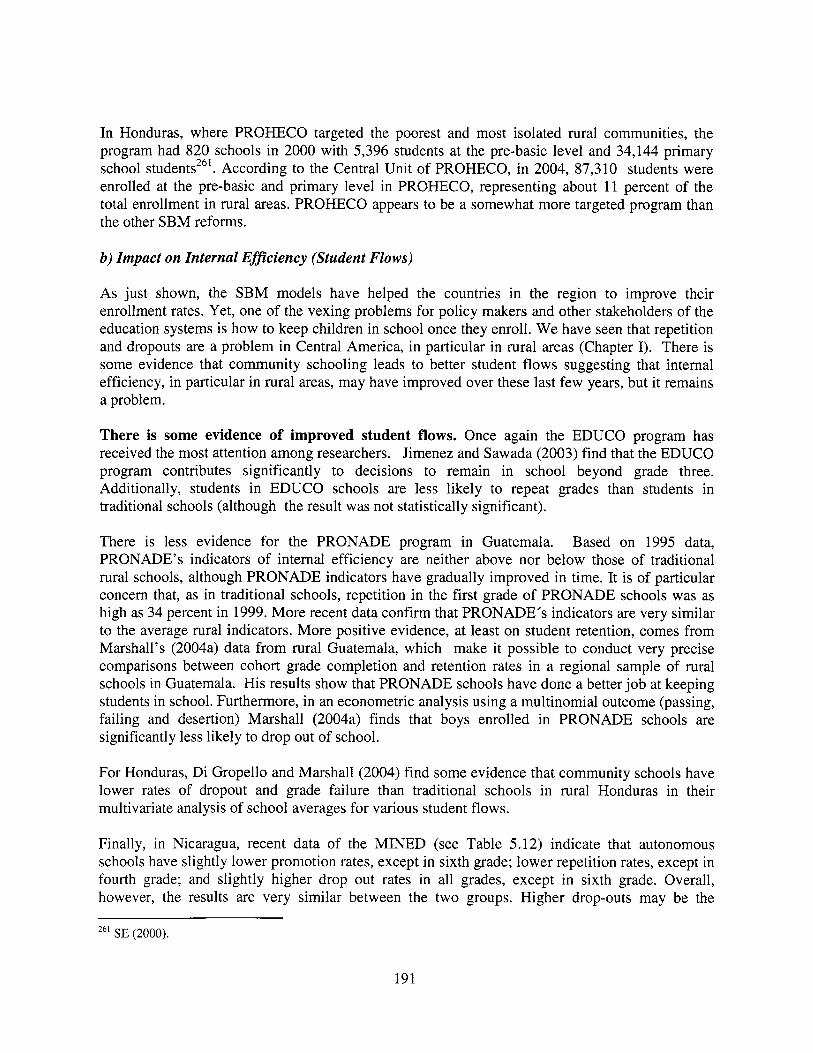
In Honduras, where PROHECO targeted the poorest and most isolated rural communities, the program had 820 schools in 2000 with 5,396 students at the pre-basic level and 34,144 primary school students261. According to the Central Unit o f PROHECO, in 2004, 87,310 students were enrolled at the pre-basic and primary level in PROHECO, representing about 11 percent of the total enrollment in rural areas. PROHECO appears to be a somewhat more targeted program than the other SBM reforms.
b) Impact on Internal Efficiency (Student Flows)
As just shown, the SBM models have helped the countries in the region to improve their enrollment rates. Yet, one o f the vexing problems for policy makers and other stakeholders of the education systems i s how to keep children in school once they enroll. We have seen that repetition and dropouts are a problem in Central America, in particular in rural areas (Chapter I). There i s some evidence that community schooling leads to better student flows suggesting that internal efficiency, in particular in rural areas, may have improved over these last few years, but i t remains a problem.
There i s some evidence of improved student flows. Once again the EDUCO program has received the most attention among researchers. Jimenez and Sawada (2003) find that the EDUCO program contributes significantly to decisions to remain in school beyond grade three. Additionally, students in EDUCO schools are less likely to repeat grades than students in traditional schools (although the result was not statistically significant).
There i s less evidence for the PRONADE program in Guatemala. Based on 1995 data, PRONADE’s indicators o f internal efficiency are neither above nor below those of traditional rural schools, although PRONADE indicators have gradually improved in time. I t i s of particular concern that, as in traditional schools, repetition in the f i rs t grade o f PRONADE schools was as high as 34 percent in 1999. More recent data confirm that PRONADE’s indicators are very similar to the average rural indicators. More positive evidence, at least on student retention, comes from Marshall’s (2004a) data from rural Guatemala, which make i t possible to conduct very precise comparisons between cohort grade completion and retention rates in a regional sample of rural schools in Guatemala. H i s results show that PRONADE schools have done a better job at keeping students in school. Furthermore, in an econometric analysis using a multinomial outcome (passing, failing and desertion) Marshall (2004a) finds that boys enrolled in PRONADE schools are significantly less likely to drop out of school.
For Honduras, Di Gropello and Marshall (2004) find some evidence that community schools have lower rates of dropout and grade failure than traditional schools in rural Honduras in their multivariate analysis of school averages for various student flows.
Finally, in Nicaragua, recent data of the MINED (see Table 5.12) indicate that autonomous schools have slightly lower promotion rates, except in sixth grade; lower repetition rates, except in fourth grade; and slightly higher drop out rates in all grades, except in sixth grade. Overall, however, the results are very similar between the two groups. Higher drop-outs may be the
SE (2000).
191
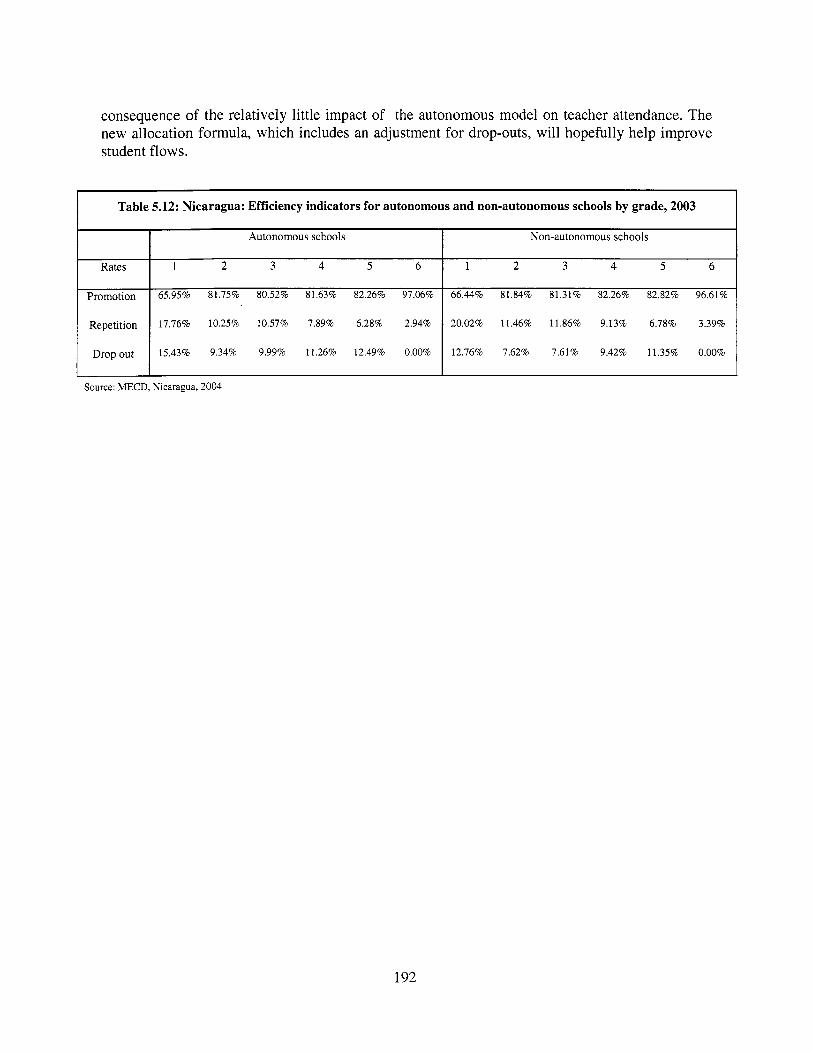
consequence of the relatively little impact of the autonomous model on teacher attendance. The new allocation formula, which includes an adjustment for drop-outs, w i l l hopefully help improve student flows.
Autonomous schools
Rates 1 2 3 4 5 6
Promotion 65.95% 81.75% 80.52% 81.63% 82.26% 97.06%
Repetition 17.76% 10.25% 10.57% 7.89% 6.28% 2.94%
Non-autonomous schools
1 2 3 4 5 6
66.44% 81.84% 81.31% 82.26% 82.82% 96.61%
20.02% 11.46% 11.86% 9.13% 6.78% 3.39%
D r o p o u t
192
15.43% 9.34% 9.99% 11.26% 12.49% 0.00% 12.76% 7.62% 7.61% 9.42% 11.35% 0.00%
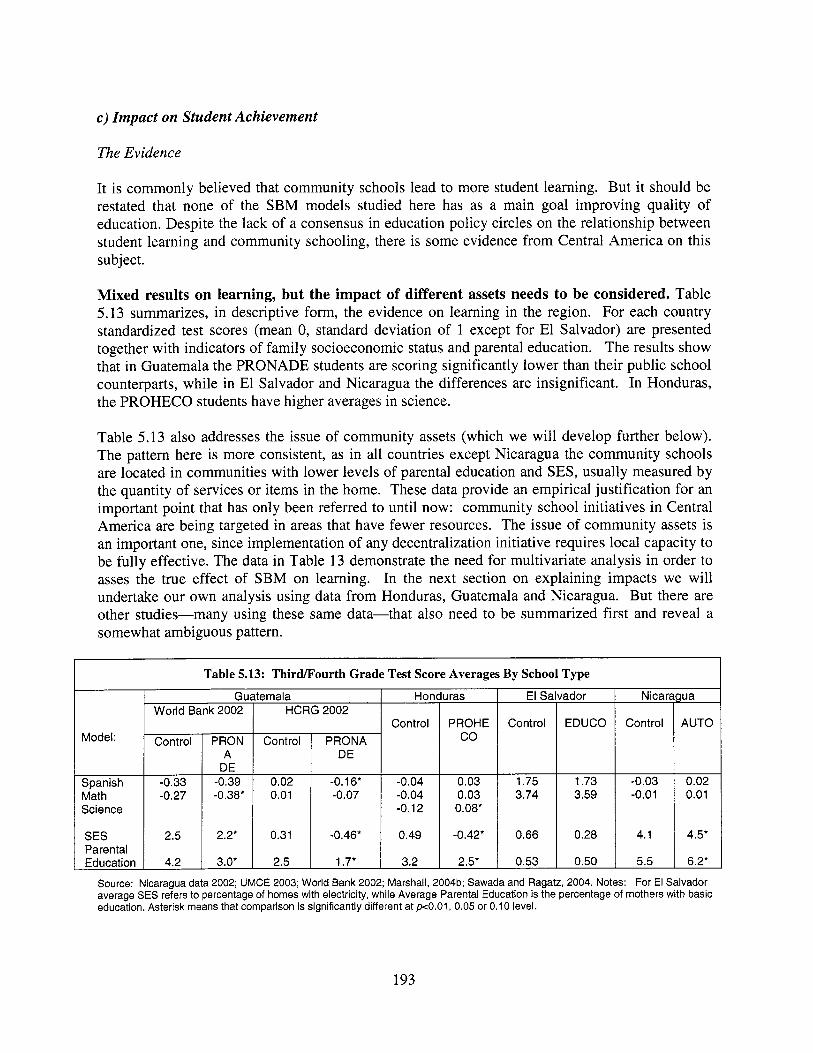
c) Impact on Student Achievement
Guatemala
The Evidence
Hon
I t i s commonly believed that community schools lead to more student learning. But it should be restated that none o f the S B M models studied here has as a main goal improving quality o f education. Despite the lack o f a consensus in education policy circles on the relationship between student learning and community schooling, there i s some evidence from Central America on this subject.
Model:
Spanish Math Science
SES Parental Education
Mixed results on learning, but the impact of different assets needs to be considered. Table 5.13 summarizes, in descriptive form, the evidence on learning in the region. For each country standardized test scores (mean 0, standard deviation o f 1 except for El Salvador) are presented together wi th indicators o f family socioeconomic status and parental education. The results show that in Guatemala the PRONADE students are scoring significantly lower than their public school counterparts, while in El Salvador and Nicaragua the differences are insignificant. In Honduras, the PROHECO students have higher averages in science.
Control Control PRON Control PRONA
A DE DE
-0.33 -0.39 0.02 -0.1 6* -0.04 -0.27 -0.38" 0.01 -0.07 -0.04
-0.12
2.5 2.2* 0.31 -0.46* 0.49
4.2 3.0* 2.5 1.7* 3.2
Table 5.13 also addresses the issue o f community assets (which we w i l l develop further below). The pattern here is more consistent, as in all countries except Nicaragua the community schools are located in communities with lower levels of parental education and SES, usually measured b y the quantity o f services or items in the home. These data provide an empirical justification for an important point that has only been referred to until now: community school initiatives in Central America are being targeted in areas that have fewer resources. The issue o f community assets i s an important one, since implementation o f any decentralization initiative requires local capacity to be ful ly effective. The data in Table 13 demonstrate the need for multivariate analysis in order to asses the true effect o f SBM on learning. In the next section on explaining impacts we w i l l undertake our own analysis using data f rom Honduras, Guatemala and Nicaragua. But there are other studies-many using these same data-that also need to be summarized first and reveal a somewhat ambiguous pattern.
Table 5.13: Third/J?ourth Grade Test Score Averages By School Type
iras
PROHE co
0.03 0.03 0.08*
-0.42*
2.5*
El Sa
Control
1.75 3.74
0.66
0.53
Nicara ua
EDUCO Control AUTO . 3.59 -0.01 1 4.1 0.28 I 4.5*
0.50 5.5 6.2'
Source: Nicaragua data 2002; UMCE 2003; World Bank 2002; Marshall, 2004b; Sawada and Ragatz, 2004. Notes: For El Salvador average SES refers to percentage of homes with electricity, while Average Parental Education is the percentage of mothers with basic education. Asterisk means that comparison is significantly different at p0.01, 0.05 or 0.10 level.
193
Existing studies indicate SBM schools support improved learning in El Salvador and Honduras and, to some extent, Guatemala and Nicaragua. In an evaluation o f El Salvador's EDUCO program, Jimenez and Sawada (1 999) compare teacher absenteeism and student achievement in EDUCO schools with that o f traditional schools, controlling for student characteristics and selection bias (since the EDUCO schools were not randomly selected). They find that despite the fact that EDUCO schools have fewer days o f teacher absenteeism than traditional schools, the student achievement in EDUCO schools was no different from that o f traditional schools. The EDUCO analysis has continued with Sawada and Ragatz's (2004) recent paper that attempts to link community school implementation with student outcomes. They make the case that teacher behavior has changed for the better in EDUCO schools. The challenge lies in linking these changes with improvements in student outcomes, and the resulting statistical analysis provides a link-if somewhat tenuous-between improvements that result from EDUCO participation and improved student outcomes l ike test scores.
The already mentioned evaluation o f Nicaragua's autonomous schools b y King and Ozler (1998), investigating the impact of two types o f autonomy (de jure, based on whether the public school officially had a contract wi th the Ministry o f Education to transform the school council to a consejo divectivo; and de facto, based on the proportion o f key decisions made b y the school council rather than central or local government), find that de j u re autonomous schools do not appear to have an impact on student achievement. The authors attribute this lack o f test score improvement to a possible lag time in becoming truly autonomous. Interestingly, they find that de facto autonomy - ie nun-autonomous schools that practice decision-making power - i s associated with higher student achievement. B y disaggregating the de facto autonomy variable into two types o f decision-making areas (decisions that are related to teachers, including such decisions as hiring and firing, evaluation, supervision, training, and relations with the teachers union; and decisions related to instruction, including decisions such as class size, curriculum, textbooks, educational plans, and the school hours and calendar), they find that the variable on pedagogy gives mixed results; while the effect o f the variable on teacher-related issues i s positive for both education levels and subjects, and i s statistically significant throughout, except for math scores at the secondary level. Recalling Levin (1995), these results suggest that the schools that are more active in tracking and monitoring teacher activity and in controlling staffing issues are l ikely to be more successful in increasing student achievement.
Parker (2004) also addresses the autonomous reform in Nicaragua and finds that autonomous schools, on average, have higher Spanish scores than centralized schools (only significant in the third grade). Unlike Spanish, student math scores are not predicted by the factors associated with school autonomy, namely teacher incentives, material resources, and professional development. Her overall conclusion i s that the study has not shown clear differences in outcomes between centralized and autonomous schools (school type is only a significant predictor in one example, third grade classroom mean Spanish scores). An initial hypothesis o f the paper was that the effects o f decentralization contribute to changes in teacher behavior, with resultant changes in student outcomes, but the study has not shown a clear relationship between these three262.
Supporting the findings of Parker, Gershberg and Kaestner (2002) show some skepticism at the results o f the King and others papers because o f the non-random participation o f schools in the reform program which, according to these two authors, was addressed using statistical procedures demonstrably not effective.
194
Despite PRONADE’s expansion by 1994, very little i s known about i t s real impact on the ground or on student learning achievement. In 1997, MINEDUC launched the National Assessment System (PRONERE) to monitor students’ achievement in mathematics and Spanish. Although a formal evaluation of student achievement in PRONADE schools has not taken place, the PRONERE’S tests carried out in 1999 and 2001 included some PRONADE schools in i t s sample of students.263 Although average scores for PRONADE students are not among the highest, the results are encouraging given the lower base from which many o f the PRONADE students begin, and the relative disadvantaged position of the communities from where the students come.264
A World Bank study on student achievement in mathematics and reading was conducted in Guatemala in 2002. The study combined the test instruments developed by the UNESCO’s Regional Office in Latin American and the Caribbean (OREALC) in 1997 for a comparative study in Latin America, with items developed by the Universidad del Valle for the MINEDUC in Guatemala. Without controlling for the characteristics o f students, teachers or schools, the results show that PRONADE schools get some of the worst average scores, even within rural schools.265 However, controlling for these background factors these negative findings disappear. In fact, they found that in comparison with urban public schools and regular rural schools, PRONADE helped students achieve higher scores in Spanish.
Finally, Di Gropello and Marshall (2004) assess the PROHECO impact on student learning in Honduras using data from the UMCE’s As with the Sawada and Ragatz paper (2004) they make a link between improvements in teacher behavior (measured by work hours, frequency o f homework, school closings, etc) and student learning, and the results are generally robust to corrections for selection bias.
2002 and 2003 data collections.
IV. Explaining the Impact
As was shown in the previous sections, the SBM reform has had an important impact in several areas of the education system in the Central America sub-region. The impact, however, has not been the same in all of the indicators and shows similarities and differences across the four countries. The degree o f the impact of SBM on different indicators and the similarities and differences across the countries can be explained to a large extent by the following factors: 1) the assets of the actors and communities involved; 2) the provisions that are made in the reform design; and 3) the context of implementation such as socio-political factors operating at both national and local levels.
All these factors mutually influence each other. But for analytical purposes, the discussion w i l l focus on one at a time. As discussed in section I, assets include multiple resources such as sk i l ls and informational, organizational, human, material and financial assets; reform design has to do with both the objectives and the de j u re provisions regarding the operation of the program; and the context of implementation consists of a series o f sociopolitical factors that determine whether the reform, once adopted, can be sustained, and whether i t i s implemented according to the de j u r e provisions. Accordingly, in what follows, an effort i s made to explain how and to what extent the
263 de Baesa (2001). *@ Valerio and Rojas (2004). 265 The World Bank (2004a).
195

differences in availability o f assets, reform design and contexts o f implementation help explain the progress and impact o f the SBM models in terms o f school and community empowerment, teaching and learning environments, and final outcomes such as student achievement within and across the four countries.
A. EXPLAINING IMPACTS AND PROGRESS IN TERMS OF ASSETS AVAILABLE AND LINKING TEACHER EFFORT TO LEARNING OUTCOMES
As was said before, the success o f the S B M models depends to a large extent on the assets that the actors and communities involved already have and the ones they receive according to the provisions o f the reform design.
a) First Order Effects
Community empowerment is high in spite of poor assets. For the S B M models to work properly, the school or community councils should be able to carry out the functions that have been delegated to them. B y assuming decision-making powers that they did not have previously, or by increasing their influence in areas they already affect, the councils are empowered. The effectiveness o f this empowerment depends on the assets that the members o f these councils have.
Because the reforms target different types o f communities in the various countries, there i s variation in the type o f assets available in each case. In El Salvador, Guatemala and Honduras, the programs targeted poor, rural areas that lack material, financial and educational assets. In the case of Guatemala and Honduras very poor and isolated rural areas that did not have a school were targeted, which means there was little pre-existing knowledge o f how schools work in these communities. In the case o f El Salvador EDUCO was originally a grassroots experience, so the sense o f ownership and motivation might be stronger than in Honduras and Guatemala. The Nicaraguan ASP model seems to be the better placed in terms o f assets since the init ial targets were larger secondary schools located in relatively well-to-do communities that had more financial resources. The schools were already operating and many parents were participating, so they had some previous experience and knowledge o f how a school functions. Finally, since joining the program was voluntary, all the actors involved had the right motivation to participate.266 Summing up, because o f the type o f communities they target, the S B M models o f El Salvador, Honduras and Guatemala look similar in terms o f community assets, although, across these countries, the communities targeted in Guatemala and Honduras have fewer resources. Higher levels o f SES are found in the ASP o f Nicaragua.
Across the region, thousands of SBM schools are functioning, attesting to at least some degree o f community empowerment. Parents are making decisions on matters related to school management (hiring, supervising and paying) and budgeting that they did not affect before, more so in El Salvador, Guatemala, and Honduras, and less so in Nicaragua where parents seem to be less empowered. This suggests that even without previous experience in managing schools, poor rural
266But this has changed since the introduction of the Education Participation law o f 2002. Beginning in 2006 all the schools in the Nicaragua education system must be participatory schools.
196
communities have certain skill-sets and motivation to manage their schools and that the reform was able to harness and develop local capacity despite the lack o f parental education, resources and experience in management. In Nicaragua, reform design was somewhat more focused on enhancing school autonomy through the role o f the school director rather than on providing all the necessary support to communities. The S B M models in Central America demonstrate that, with the right type o f assistance, even very poor and undereducated parents are able to run schools.
Poor community assets frequently mean poor school conditions. H o w does the physical and material conditions o f the schools relate to the assets already possessed by the communities and other key actors in the schools? As was pointed out before, if community schools are concentrated in the poorest and most rural parts o f the country i t seems l ikely they have fewer resources and learning materials. This i s certainly the case in Guatemala and Honduras. Communities have to meet certain requirements to be eligible such as not having another public school nearby. In Guatemala and Honduras, and even in El Salvador, schools begin to function in private houses or in huts built by the communities. So, S B M schools in these countries frequently begin with insufficient physical and material conditions, which are not always compensated b y S B M programs. A different story holds for Nicaragua where students come f rom slightly better-off fami 1 i e s .
Poor teacher assets can be a constraint for innovative teaching methods. An important component o f decentralization in the context o f education i s to maximize teacher effort. The evidence reviewed above suggests that the schools in the S B M models are maximizing teacher effort to a greater degree. I f parents have more say in how the school i s run, or more power to sanction poor performing teachers and directors, then i t seems l ikely that school personnel w i l l put forth more effort. Indeed, community school teachers work more days and hours. However, their teaching methods, overall, seem to be no different from the ones used in traditional schools. This may raise an issue o f reform design (lack o f community participation in pedagogical matters and/or lack o f teacher autonomy) which w i l l be further explored. I t may also arise due to a lack o f teacher assets (skill, knowledge, experience, creativity). Teaching methods are l ikely to depend to a large extent on the assets already possessed b y teachers. Teacher “assets” such as education and experience are considered important in educational delivery. In fact, much of the financial incentives that teachers get in the region are based on such assets. The sk i l l s and training that teachers bring with them to work are l ikely to help explain the degree to which the decentralization scheme i s implemented inside the classroom, just as parental education and community assets w i l l affect the overall implementation.
Table 5.14 reviews some basic teacher assets in the four countries. The results are, once again, mixed across countries in the region, although they are generally less favourable for autonomous schools. For Nicaragua the autonomous school teachers are more experienced but less l ikely to have a college degree. In El Salvador the opposite holds, as EDUCO teachers are highly educated and comparatively in-experienced. For PROHECO, targeted in very small communities, the teachers are less l ikely to have a degree from the national teacher’s university (UPNFM), are less experienced and in a majority o f cases did not attend a normal school. Finally, in rural Guatemala, the data from Marshall (2004b) show that PRONADE teachers are also less educated, and have less experience, than control school teachers. Overall, there does not seem to be a very clear cut relation between teachers’ assets and teaching methods, although having a high
197

proportion o f teachers with no teaching certificate (such as in Honduras) and little professional experience i s l ikely to make it more difficult to implement innovative teaching methods.
Variable
Percent Teachers with University
Percent Teachers without Certificate
Teacher Experience
Table 5.14: Teacher Education and Experience
NicE Non- Auto
44.5
5.8
.gua Autonom
ous
38.2*
7.2*
El SE Public
30.0
9.5
ador EDUCO
74.0*
3.9*
Honl Public
6.4
3.9
7.6
1 ras PROHE
co 2.9*
54.8*
2.2*
Source: Nicaragua aata 2002; UFntiE 2003; Marsnall, 2004b; Sawada and Ragatz (2004). Notes: Asterisk means that comparison is significantly different at pc0.01; pe0.05, or pe0.10 level.
Guat Public
2.5
9.7
nata PRONA
DE
o.o*
4.6*
b) Second Order Effects: Multivariate Analysis of Impact on Achievement
The evidence presented in previous sections on first order effects resulting f rom S B M implementation and differences in assets (especially for teachers) helps to form a picture o f the dynamics o f community schooling in Central America. In this section we continue this discussion by replicating the analysis o f Di Gropello and Marshall (2004). Using multivariate analysis that introduces groups o f variables one by one we can not only pinpoint the marginal effect o f community school participation on student learning but also consider how other factors interact with this variable. This kind o f analysis allows us to consider community and teacher assets together with other variables (like teacher effort) that we expect to be affected by implementation. We then can move on to larger, macro-type influences such as program design and contexts (next sections).
What are the factors that condition the results in academic achievement of the students in SBM schools compared to their traditional counterparts? Following Di Gropello and Marshall, the coefficients presented in Table 5.15 represent the marginal effect (in standard deviations) o f studying in a S B M school relative to the control categories. W e then gradually add up groups o f variables (community SES, school and teacher controls and teacher effort) to see how this marginal effect varies when controlling for these variable. In the first model student test scores are regressed onto student gender only (and the community school dummy), which provides the most basic comparison o f how community school students compare with their regular school counterparts. N o t surprisingly, we see that in Guatemala the PRONADE schools start out lower when only accounting for these basic controls.
198
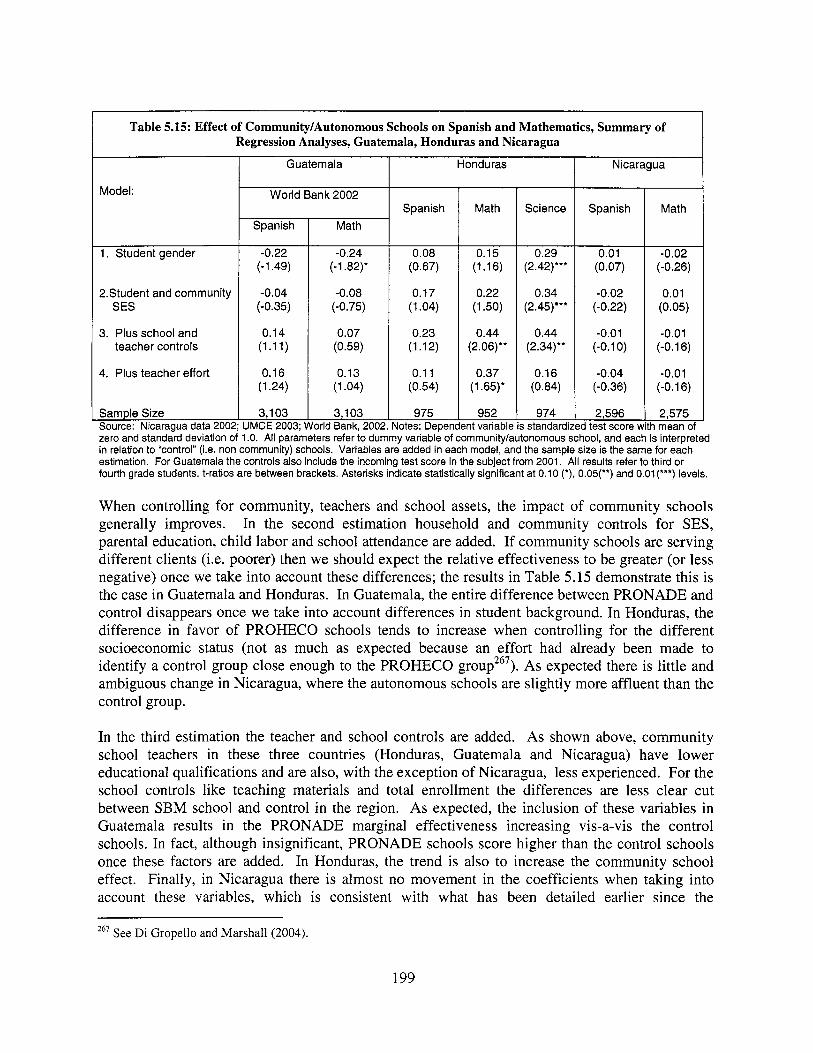
Guatemala
Sample Size Source: Nicaragua data 2002;
Table 5.15: Effect of Community/Autonomous Schools on Spanish and Mathematics, Summary of Regression Analyses, Guatemala, Honduras and Nicaragua c
3,103 I 3,103 975 I 952 JMCE 2003; World Bank, 2002. i4otes: Dependent variable
I Model:
Spanish
-0.22 (-1.49)
-0.04 (-0.35)
0.14 (1.1 1)
0.1 6 (1.24)
1. Student gender
2.Student and community
3. Plus school and teacher controls
4. Plus teacher effort
SES
Math
-0.24 (-1.82)*
-0.08 (-0.75)
0.07 (0.59)
0.13 (1.04)
World Bank 2002
Honduras
Spanish
0.08 (0.67)
0.17 (1.04)
0.23 (1.12)
0.1 1 (0.54)
Math
0.15 (1.16)
0.22 (1.50)
0.44 (2.06)**
0.37 (1.65)*
Science
0.29 (2.42)***
0.34 (2.45) **
0.44 (2.34)**
0.16 (0.84)
974 i standardi;
Nicaragua
Spanish
0.01 (0.07)
-0.02 (-0.22)
(-0.1 0) -0.01
-0.04 (-0.36)
2,596
Math
-0.02 (-0.26)
0.01 (0.05)
-0.01 (-0.16)
-0.01 (-0.1 6)
2,575
zero and standard deviation of 1 .O. All parameters refer to dummy variable of community/autonomous E 1001, and each is interpreted in relation to “control” (Le. non community) schools. Variables are added in each model, and the sample size is the same for each estimation. For Guatemala the controls also include the incoming test score in the subject from 2001. All results refer to third or fourth grade students. t-ratios are between brackets. Asterisks indicate statistically significant at 0.1 0 r), 0.05(**) and 0.01 (***) levels.
When controlling for community, teachers and school assets, the impact o f community schools generally improves. In the second estimation household and community controls for SES, parental education, child labor and school attendance are added. I f community schools are serving different clients (Le. poorer) then we should expect the relative effectiveness to be greater (or less negative) once we take into account these differences; the results in Table 5.15 demonstrate this i s the case in Guatemala and Honduras. In Guatemala, the entire difference between PRONADE and control disappears once we take into account differences in student background. In Honduras, the difference in favor o f PROHECO schools tends to increase when controlling for the different socioeconomic status (not as much as expected because an effort had already been made to identify a control group close enough to the PROHECO As expected there i s little and ambiguous change in Nicaragua, where the autonomous schools are slightly more affluent than the control group.
In the third estimation the teacher and school controls are added. As shown above, community school teachers in these three countries (Honduras, Guatemala and Nicaragua) have lower educational qualifications and are also, with the exception of Nicaragua, less experienced. For the school controls like teaching materials and total enrollment the differences are less clear cut between SBM school and control in the region. As expected, the inclusion o f these variables in Guatemala results in the PRONADE marginal effectiveness increasing vis-a-vis the control schools. In fact, although insignificant, PRONADE schools score higher than the control schools once these factors are added. In Honduras, the trend i s also to increase the community school effect. Finally, in Nicaragua there i s almost no movement in the coefficients when taking into account these variables, which i s consistent with what has been detailed earlier since the
267 See Di Gropello and Marshall (2004).
199
autonomous schools have similar, or even better assets in terms o f teaching materials, compared with control schools.
The link between teacher effort and academic achievement i s not consistent across countries. Indicators of teacher effort are added in estimation 4. These include measures o f days worked in the school and/or teacher absences and total work hours per week, school closings (in Honduras), homework frequency or frequency o f going over previous material (in Nicaragua), teaching methodology, and class size and number o f grades. If community schools have succeeded in making changes in these kinds o f outcomes-and they are positively associated with test scores- then we should expect the marginal effect o f community schooling in the production functions to decrease. In other words, the positive coefficients for community schools in Guatemala and Honduras should get smaller; and the negative ones for Nicaragua get larger. However, the results in Table 5.15 fai l to provide a uniform picture.
There i s strong evidence in Honduras that higher teacher effort, associated with autonomous schools, i s also associated with higher test scores, but such evidence i s much weaker for Nicaragua (although the dummy coefficient in Spanish moves in the right direction) and, even more, Guatemala. This can cast some doubt on the degree to which community schools have made improvements in teacher effort characteristics that, in turn, translate into differences in student achievement in Guatemala and Nicaragua. From the previous evidence, there i s ground to think that teacher effort may not have improved very substantially in Nicaragua; while the results for Guatemala are more su rising suggesting that increased teacher effort did not translate into higher scores in that country." However, before we rule out this link for these two countries altogether, we need to make an important point. The measure o f teacher effort adopted in the regressions is somewhat heterogeneous, capturing different aspects which may not have evolved in the same direction. For instance, we know that teaching methodology changed l i t t le in the countries under analysis; or, still, class size, an imperfect measure o f teacher effort, may have unpredictable impacts on achievement (as appears with class size in Honduras, which i s quite strongly positively related to achievement, driving part o f the results on the teacher effort variables).
The various estimation results in Table 5.15 are not easily summarized. For Guatemala and Honduras the community school treatment clearly needs to take into account the very different environments that these schools operate in. This relates not just to student background but also teacher assets. In Nicaragua the targeting scheme was very different, and i t is not the case that autonomous schools are serving poorer communities.
Capacity i s maximized and related to academic achievement in Honduras and El Salvador, capacity i s also maximized in Guatemala but the relation with achievement i s less clear cut. Overall, the evidence presented for Honduras, and the one that was presented for El Salvador b y Sawada and Ragatz (2004), suggest that autonomous schools have been successful in providing learning environments that are equal or even higher than their public school counterparts, although targeting poorer communities, b y maximizing existing capacity (mainly b y working more and limiting class size) to make up for the lack o f teacher and parental capacity (in particular in Honduras). The link between capacity utilization differences and student outcomes i s encouraging,
I t i s also true that different databases have been used for Guatemala, which can produce somewhat inconsistent results.
200
and provides prima facie support for community schooling on pure efficiency grounds. This i s especially true in Honduras where PROHECO teachers are paid less and have fewer qualifications.
The evidence provided for Guatemala, while less positive, s t i l l shows that, in spite of lower teacher assets, PRONADE schools manage to provide a learning environment as good as their public counterpart for students with similar characteristics, although the link between improved capacity utilization (which higher teacher effort also illustrates in Guatemala) and achievement cannot be directly made.
Overall, across these three models, we seem to have a picture where SBM school parents concentrate their oversight to the most visible aspects o f teacher effort-their attendance and hours worked-without entering classrooms and instigating changes in teaching methodology and classroom management, or choosing the best teachers. In other words, SBM parent councils may not be striving to create the best schools; they may simply want the most efficient.
Lower levels of efficiency in Nicaragua. The picture i s somewhat different in Nicaragua where autonomous schools perform as well as non-autonomous ones but with slightly more community and teacher assets, which suggests somewhat lower levels of efficiency (although class size i s kept larger counter-acting this trend).
B. EXPLAINING THE IMPACT IN TERMS OF THE REFORM DESIGN
So far the analysis of the impact of SBM on student outcomes has focused on linking differences in implementation and assets with outcomes like student achievement. What remains i s an analysis of additional “conditioning factors” that are likely to determine not only the success of the SBM in affecting first order changes in schooling but also the degree to which these differences translate into observable second order differences. These factors are left for last for the simple reason that they are, of all o f the possible influences on schools and schooling outcomes in these countries, the most difficult ones to assess from an evaluation standpoint. Nevertheless, they are likely to provide some additional clues about SBM performance.
The first factor, that we wi l l briefly review here, i s reform design.269 In section 11, i t was shown that there are differences in reform design in aspects related to institutional arrangements, organization, membership, characteristics and functions of the school councils, financial transfers, and teacher salaries and benefits. Among the differences in the reform design that are most relevant for explaining the impact of the models on community and school empowerment, teaching and learning environments and final outcomes such as enrollment rates, internal efficiency and student learning the following can be mentioned: the objectives o f the reform, i t s coverage, the composition of the councils, the range o f responsibilities delegated to the school councils, the provisions for relevant parental capacity building, and the system of transfers and teachers’ incentives.
Objectives of the reforms. In terms of the reform objectives, as already noted, none of the SBM models considered in this study had community empowerment or quality enhancement as primary
269 A more detailed analysis o f the l ink between reform design and outcomes can be found in Rapalo and Marshall (2004).
20 1
objectives o f the S B M reforms. As such, any impact on empowerment and quality i s more a by- product o f the reform than an explicit target. B y the objective o f the reform design, the Nicaragua’s SAP seems to have had the highest potential to contribute more to the empowerment of the school and communities, as school autonomy was a key instrument to increase social accountability and operational efficiency. However, for other aspects o f reform design (see below), recent qualitative analysis o f autonomous schools found that the reform has not reconstructed the social pact to increase arental participation in their children’s education, but has had a “financial-administrative’’ focus.?’ In general, because o f their lack o f focus on quality, the S B M did not make adequate pedagogic provisions to improve school quality, as w i l l be discussed below.
Coverage of the programs. In terms of coverage o f the program, we have already noted that some reforms are more targeted than others to poor areas, with consequences on community and teacher’ assets and educational achievement. Another distinction concerns the extensiordcoverage of the models in terms o f schools and students. While EDUCO, ASP, and PRONADE all cover a substantial fraction o f schools, PROHECO i s much more focused, serving a relatively small number o f schools. This may partly explain the better results o f the model, which may be due to more efficient implementation, perhaps because o f better supervision f rom program operators.
Composition of school councils. In terms o f composition o f the councils, section 11 makes i t clear that al l countries have granted a key role to parents in the management of the autonomous schools, which has effectively translated into higher levels o f empowerment. However, interviews revealed that no program has been able to involve all the community members al l the time271. Mothers of students and community leaders are most frequently involved in school councils. There i s little evidence to show that parents in the councils rotate as expected to give chance to other leaders elected in a democratic way. The case o f Nicaragua i s different insofar as the director has a leading role in the councils, limiting somewhat, as we have seen, parental empowerment (and the 2002 participation law gave even more power to school principals making them executive directors and allowing them to run the councils almost at their will).
Responsibilities of school councils. All countries also granted extensive responsibilities in teacher management, school maintenance and budget oversight to the councils which resulted in higher de facto decision-making in these areas and, overall, higher teacher effort. However, little or no transfer o f pedagogical responsibilities to parents led to little or no decision-making in this area and unchanged teaching practices, which, in part, may have also been produced by little expertise or interest o f parents themselves to instigate changes in the classrooms. In turn, no or little change in classroom processes hampered the impact o f al l the models on learning, compensated b y a positive impact of small class sizes, which can be to some extent associated with more individualized learning, and higher work hours in Honduras and El Salvador. Another important highlighted aspect o f all models i s the decreased level o f teacher autonomy which essentially occurred by design b y shifting the balance o f power towards parents: i t is l ikely that this also explain the lack o f pedagogical innovation o f S B M models.
~~~
270 Florez, Ruiz et al. (2003); Gershberg, et al. (2001). This has been confirmed in a recent assessment of PROHECO (ESA, 2004).
202

Provision for parental capacity building. In El Salvador, Honduras and Guatemala, the SBM models have all made provisions for relevant parental capacity building and technical assistance to compensate for the lack of assets and experience in running schools, with some success if we judge from the level of community empowerment achieved in all these countries. In fact, almost all the organizational structure underlying the management of these programs revolves around the issues of parental capacity building and assistance and the transfer of financial resources. In particular, one key element that has promoted community empowerment in Honduras and Guatemala has been the role played by the promoters and the ISE, respectively (although they provide largely administrative training with very little pedagogical training). In all countries, except in El Salvador, the content and duration o f the training for school councils i s decided by the central ministry or coordinating unit. As part of a general policy, recently, the Ministry of Education of El Salvador has given the power to all schools to decide about their own training and to contract trainers directly. This arrangement, although apparently instrumental in providing more power to school councils, seems to be working against them in the EDUCO schools because l i t t le funding i s given and the location o f the schools provides little access to hire quality trainers.272 Despite the differences and the generally satisfactory results, in all countries there are some complaints about the content, relevance, duration and follow-up o f the training. Again, in terms of technical assistance in administrative matters, the role of the ISE in Guatemala and the promoters in Honduras seems to be particularly important, while EDUCO schools, although they can hire accountants, complain about the l i t t le help they get from the departmental offices. Both in El Salvador and Nicaragua, many actors think that the administrative process should be simpler and more transparent. Speaking about Nicaragua, section I1 makes i t clear that in this aspect as well the ASP program i s the one that most differs from the others because no specific external facilitator/trainer i s hired to help the councils. Because the schools are already running, the communities of autonomous and non-autonomous schools are similar and the principal of the school plays such a large role in the management of the school, Nicaragua has not seen the need to create intermediary actors to provide training and technical assistance as has been done in the other countries.
Transfers. Another important element of reform design i s the design and implementation o f the monetary transfers to schools (see section II) and the provisions for budget generation. Here again there i s substantial difference between El Salvador, Honduras and Guatemala which allocate fixed amounts per teacher to the autonomous schools, plus a pre-determined amount for teaching materials, and Nicaragua which allocates funds on a per-student basis leaving the schools free to decide how to allocate them. Additionally, in Nicaragua, the schools had (initially) the right to charge fees and s t i l l have the possibility of undertaking fund raising. The evidence presented on the availability of teaching materials and equipment suggests that autonomous schools are decently provided with materials and equipment in Nicaragua, much less so in the other countries, suggesting limitations in the current allocation o f funds in El Salvador, Honduras and Guatemala. In fact, in interviews carried out for this study, schools council members in El Salvador, Honduras and Guatemala argued that funding i s insufficient and that they are only able to buy the most basic materials. Moreover, there are legal restrictions as to what can be bought with the transfers. Given that, i t i s unlikely that the strategy applied in Nicaragua can work in the communities covered by the other countries, where the socio-economic characteristics of the parents and the size o f the communities limit additional fund-raising activities by parents or other community members,
*’* Nochez (2003).
203
requiring a somewhat different strategy for the allocation o f resources, which should include a share o f non-salary recurrent costs proportional to the needs of the schools (see section on policy recommendations).
Interestingly, transfers seem to be designed to produce stronger incentives for maintaining small class sizes in the case o f El Salvador, Honduras and Guatemala, and incentives for increasing enrollment and class size in Nicaragua. In El Salvador, Honduras and Guatemala the amount transferred increases with the number o f teachers hired and in Nicaragua transfers and user fees increase with enrollment. None o f the transfer systems appear to create direct incentives to improve the quality o f education, although, to some extent, small class size seems to favour individualized learning which has a positive impact on achievement; and, b y subtracting last year drop-outs from this year initial enrollment, the formula applied in Nicaragua encourages internal efficiency and, indirectly, quality. Additionally, only in Nicaragua transfer formulae take into account equity concerns, although the new law, approved in 2002, does not have provisions to compensate small schools if they do not have enough students and fund raising activities w i l l benefit more those schools that are located in well-to-do neighborhoods, creating equity problems. Equity adjustments are clearly less important in the other three countries where autonomous schools are all rural and poor, but may become necessary if the models are scaled-up to incorporate larger and wealthier schools (as i s already happening with EDUCO).
Teachers’ incentives: monetary benefits and their link with teachers’ assets. Finally, a key element o f al l the reforms i s also the role o f teachers’ incentives. Teachers’ incentives w i l l be an important determinant o f teachers’ assets and teacher effort. Table 5.5 o f Section I1 makes it clear that, while salaries are similar across S B M and traditional teachers in Nicaragua and El Salvador, they are lower for SBM teachers in both Guatemala and, even more, Honduras. Other monetary benefits are also lower in autonomous schools in these countries. There seems to be a clear relation between teachers’ assets as measured by education and experience and the lower monetary benefits in Honduras and Guatemala. In fact, these countries are already prone to have the least skilled teachers teaching in community schools because o f the location o f the schools and the existing teachers’ incentives are doing nothing to counteract this tendency. Although Honduras may be particularly successful in maximizing the impact o f i t s available community teachers, i t seems clear that achievement results would be even better i f PROHECO schools had higher- quality teachers. This i s also l ikely to be true for Guatemala. Additionally, we have seen that teachers’ assets are also l ikely to be related to teaching methodologies which, in turn, are l ikely to be related to learning: by investing in more skilled teachers, the S B M models in Honduras and Guatemala may be able to increase class size moderately, possibly generating savings.
Contract tenure and teacher effort. Finally, teachers’ incentives w i l l also affect teacher effort. L o w salaries (or large delays in salary payment) may for instance have a negative impact on teacher motivation, although this does not appear to be the case in Honduras and Guatemala. More interestingly, fixed- instead o f open-ended contract tenure, used in al l four countries, may tend to motivate teachers to do better if contract renewal i s based upon fair and accurate evaluations o f teacher performance. Additionally, in the cases o f Honduras and Guatemala, the reform design includes provisions penalizing teacher absences: in Guatemala teachers must compensate for days lost and in Honduras absences are deducted from salaries. In the case o f Nicaragua, i t is less l ikely that teacher effort is affected b y the reforms because, although teachers are also appointed
204

through fixed-term contracts, they continue to be protected by a general law that regulates the whole system (Ley de Curreru Ducente). On the other hand, user fees in Nicaragua may provide an incentive for teachers to work in autonomous schools.
Teachers incentives and teacher permanency in the non-traditional system. Overall, judging from generally higher teacher effort, these mechanisms, together with the community empowerment that they confer, seem to be working. Two limitations of the models, however, are that: (a) none o f the programs have established an adequate system of evaluating and monitoring teacher and school performance; and (b) the combination o f lower monetary benefits and few professional development prospects could end up hampering the motivation of teachers who are doing well and would otherwise stay into the autonomous system . The f irst point wi l l be further developed in the sub-section on contexts. On the second point, there i s some evidence that, in Honduras and Guatemala, teachers move to traditional schools as soon as they get the opportunity. All SBM programs have put in place a system of teacher training, but this does not seem to be enough. Strategies to improve the medium term incentives for teachers to stay in the SBM system need to be found and applied. In fact, all SBM models (including Nicaragua, where a separate system for teachers in autonomous schools would be advisable) face the challenge of introducing some kind of professional development system, including creating a merit system (esculufun) for their teachers. Finally, we should also note that none of the SBM models has made provisions for special training for directors to develop leadership and managerial skills, which appears to be an important characteristic o f effective schools.
c. EXPLAINING THE IMPACT IN TERMS OF CONTEXTS OF IMPLEMENTATION
The discussion in the previous sub-sections shows that the impact and progress of the SBM models in the education systems of the region have been affected by the assets of the communities and actors involved and by the provisions that are made in the reform designs. In what follows an effort i s made to show that the impact, progress and sustainability of the SBM models have been also affected by the contexts of reform implementation. In this section we w i l l briefly review some of the socio-political factors which appear to be particularly relevant for the implementation o f the SBM reforms: state-related variables such as the level of political commitment, state and social linkages such as the inclusion o f different groups in the policy reform, traditions o f local participation, institutional capacity and efficiency in reform administration, and availability o f information. We should also point out that the success of the S B M models wi l l also depend on what goes on in the rest o f the education sector because o f the linkages between the different education levels and public and private delivery (for instance, an expansion of the private sector can free teachers for the public sector making more teachers available to autonomous schools).273
Political commitment. In terms o f state-related variables, there i s a consensus that successful implementation of social policy reforms depends on state commitment. In the case of the SBM reforms in the region, support was strong at the beginning and has continued steadily in El Salvador and Nicaragua, while it has shown some variability in the cases of Honduras and Guatemala where there have been changes in the ruling parties and in key bureaucratic positions in the ministries of education and in the coordinating units. In El Salvador, the government has, in
273 Illustrating this point, a massive expansion of the tertiary system much through the private sector in El Salvador helped EDUCO to hire lots of teachers.
205
effect, adopted EDUCO as i t s educational policy for rural areas. In Guatemala and Honduras the S B M programs were initially designed to improve enrollment rates in poor and isolated rural areas. In Honduras, the scope o f the program has remained the same but in Guatemala the program was quickly taken to scale. In the Portillo administration, however, there was an open attempt to terminate the program and this slowed down its implementation. In general, turnover rates have affected the expansion and implementation o f the programs but have not changed their main objectives and their “thrust” (even in Guatemala), indicating that local communities have developed a strong preference on behalf o f safeguarding the reform (stake-ownership). Lately, however, governments in Nicaragua and Honduras are discussing the possibility o f shifting the focus o f the decentralization reform from S B M models to municipalization. I t i s also interesting to note that, in al l cases, the World Bank and international donors in general have played a constructive role in combating the tendency o f new administrations to scrap the programs o f the previous administration. Because the new administrations realize that these programs are Bank- sponsored, they hesitate to dismantle them.
Inclusion in the reform. Regarding state-society linkages, there i s also evidence that including diverse groups from c iv i l society (civic, business, university and religious leaders, notable personalities, opinion-makers, NGOs, consumer groups, teachers’ unions, opposition parties) into policy discussions, both prior to the reforms and throughout the implementation process, generally helps implementation. In both aspects the S B M reforms have come up short. El Salvador seems to be the most inclusive case o f all four. There were national dialogues at the start o f the reform and repeated consultations during the implementation period. In Guatemala, there was a dialogue and consultation prior to the implementation o f the reform but this has not continued during the implementation phase. In Honduras, PROHECO was created outside the MINED and was init ial ly run by a commission o f notables appointed directly b y the Honduran president. There has been very little dialogue and consultation prior and during the implementation, and the same can be said in the case o f Nicaragua.
In no country have the reforms included the teachers’ union who are arguably the biggest cost- bearers o f decentralization reforms, although some effort to do that has been attempted in El Salvador, perhaps explaining why relationships wi th the teachers’ unions are more harmonious there than elsewhere. In general, teachers, who have not developed “stake-ownership”, remain the main opposition and can potentially derail the reform, especially in Honduras and Guatemala where teacher unions are relatively strong. As we have seen, reform designs in these same two countries have also not been favourable to the creation o f incentives for teachers in the autonomous system, aggravating the situation and creating serious issues of sustainability in spite of the success o f the models in terms o f empowerment and coverage.
Traditions of local participation. Another contextual aspect that may hinder the implementation of the decentralization reforms, especially in terms of community empowerment, may be traditions o f local participation. Despite the apparent advantage o f the Nicaragua program in terms o f the type o f communities they target, the programs in El Salvador, Guatemala and Honduras have advantages in terms o f the tradition of social participation and the creation o f social capital. Durston (1999) suggests that programs l ike PROHECO “have the advantage o f not having to concentrate efforts in fighting against institutional and traditional habits to establish the new process.” This i s to say that since the relationship between parents and teachers i s brand new, there
206
i s a better possibility to establish relationships of mutual respect, accountability, trust and compromise with the educational outcomes. Moreover, according to this author, the rural communities have better contextual conditions for creating social capital and for making possible that the school councils may influence some other social processes in the communities.274 In general, parents in the rural areas have more sense of community, more experience in social participation and more willingness to sacrifice time and money to participate in these types of programs. Parents of these communities might also feel more empowered because they know that this i s probably the only way that their children may have access to education. In the case of Nicaragua, parents and community members know that whether or not they participate they have a school where they can send their children.
Institutional capacity and efficiency of the administration: sustainability of institutional arrangements. The technical capacity and efficiency of state agencies both at the central and local levels are crucial to ensure the proper implementation o f decentralization reforms. A first issue i s the sustainability of institutional arrangements. In the SBM models discussed here, the state agencies provide schools or community councils with the necessary resources, such as money, training and information. State agencies function differently in the four cases. In El Salvador and Nicaragua the coordinating units are within the ministries and work with the school councils with the help o f the local MINED offices (departmental or municipal) (although in El Salvador, councils also work with assistants that they hire themselves). In the cases o f Honduras and Guatemala, the coordinating units belong to the Ministries o f Education but work more independently. Their work with the councils i s carried out almost exclusively with the help of intermediary agents that do not belong to the MINED, with l i t t le contact with the local units of the MINED. This i s why in these countries the programs are seen more as parallel programs than programs belonging to the MINED, with possible issues of sustainability. I t has, however, been recognized that the intermediaries have been particularly useful in these two countries, suggesting that an hybrid type of solution (involving for instance both the deconcentrated units and fixed- term external agents) may be needed.
Technical capacity of coordinating units. The composition and capacity o f the coordinating units i s important to ensure their proper functioning. In all four cases the personnel o f the coordinating units are selected by the MINED. Most of the time the personnel are selected for their technical capacity, although politics and personal connections may also enter into the selection process, especially in Honduras and Guatemala. Judged by their performance, the coordinating units have done a relatively good job, especially in El Salvador and Nicaragua. I f we review some evidence of institutional strength in terms of financial transfers, provision o f training and availability of information, we find, however, that: (a) there have been problems with the regularity of the transfers in some countries, which can indicate a difficult relationship between the ministries of education and finance but also low technical capacity o f the coordinating units (this i s particularly the case in Honduras and Guatemala); (b) the changes in government and personnel in the coordinating units have affected the provision o f training in all the countries because they have changed the rules (community and schools actors in all the countries feel that the provision of training was stronger and better at the beginning o f the programs); and (c) the
274 Durston (2002).
207

models have not generated enough and relevant information to evaluate and monitor the performance o f their schools.275
Availability of information and monitoring of teacher behavior. Related to this topic, another question that can be asked i s whether the SBM models are providing school councils with the needed information to carry out their functions. In all countries the programs provide school councils with information regarding their functions, especially in terms o f management o f material and human resources. However, parents also need information on teacher performance to exercise effectively their task of hiring and firing teachers. In most cases, i t appears that the council members do not have enough information to select the best candidates and technically evaluate them. A related point i s that parents usually find i t difficult to monitor curriculum and pedagogy. The only criteria used by parents seem to be teachers’ attendance and good behavior. These are s t i l l important dimensions which ensure, as we have seen, higher teacher effort in terms of hours worked, but having a more comprehensive picture of teacher and school performance would be helpful to enhance the impact of the models on learning. None of the programs provide information about school performance and teacher performance; and although schools do produce some information on promotion, drop-out and repetition, they often send it to higher levels, without using it or sharing it with the community. If information on teacher performance i s incomplete and i t i s difficult to relate school performance to teacher performance, “monitorability” of aspects such as pedagogical practices wi l l s t i l l be a problem and other mechanisms wi l l need to be found to make teachers accountable on this ground such as: (a) setting-up effective supervision/inspection systems, involving directors and deconcentrated levels of the ministries of education in the direct observation of classroom practices; or (b) providing incentives for pedagogical improvement such as school competitions for the best school improvement project.
V. Conclusions and Policy Recommendations
The school-based management models considered in this study seem to be a potentially promising means to promote more civic engagement in education and to cost-effectively get better or similar educational results than traditional programs. In particular, community and schools appear to have been generally empowered and teacher effort strengthened, resulting in a better use of the existing limited capacity. This i s more true for El Salvador, Honduras and Guatemala than for Nicaragua. Additionally, the models have had a very substantial impact on enrollment and are somewhat associated with better student flows. There i s also evidence that academic achievement i s at least as high in autonomous schools as in traditional schools.276 However, while some aspects related to school quality such as teacher/school effort have been prioritized in the models, some others such as availability of learning materials, teacher sk i l ls and pedagogical innovation have not been
~
’’’For instance, coordinating units have not had the technical capacity to conduct studies to evaluate the performance o f autonomous schools vis-&vis traditional schools, although they have received technical assistance by international agencies and consultants. In El Salvador, despite the proliferation o f information, most o f the information used to evaluate the program with a comparison group comes from 1996, in Nicaragua from 1997 and in Guatemala from 1999. I n the case o f Guatemala, the quasi-experimental study was not completed and did not use standardized tests. In Honduras, because the program i s more recent, i t i s only until this past year that a systematic study of its impact has been undertaken. Additionally, the available statistical information to monitor schools’ characteristics and performance i s often of poor quality and incomplete.
2’6 In Guatemala, only when taking into account the poorer communities in which these schools are located.
208

sufficiently developed, limiting the potential impact of the models on the quality of education and learning. Additionally, the sustainability of these models remains at stake in most of the countries.
The evidence presented in this chapter, including the links that have been established with reform design, assets and the socio-political context, allows us to provide a set of recommendations for consolidating the good results o f the models, improving their impact on the quality o f the teaching and learning process and ensuring their sustainability.
Reform Priorities. Empowerment and quality should be introduced as explicit objective of all the models;
Pedagogical model. At the outset, the way forward in community schools should be to provide an integrated package (called modelo pedugdgico propio) to give pedagogical strength to the model. The package should offer, in addition to community participation, bilingual education (if needed), multi-grade teaching, student assessment, teacher guides and in-service training, etc;
Pedagogical innovation: teacher autonomy. There i s international evidence that increased teacher autonomy in pedagogical practices and more skilled teachers can be conducive to higher pedagogical innovation and improved teaching-learning processes. The effective school analysis undertaken in Chapter I1 confirms this finding. Increased teacher autonomy in pedagogical practices could benefit all model designs. At a minimum, given the importance of teacher participation in improving the quality of education, i t i s necessary to give teachers a more meaningful role by establishing support committees that can tackle issues and allow for their voices to be heard. More skilled teachers should also be attracted through the implementation of a better incentive framework (see below). Teachers’ excellence also depends to a large extent on on- going professional development opportunities. For Guatemala and Honduras i t would be imperative to create special incentives (such as scholarships) for teachers who do not have a degree to get into a flexible program that allows them to be trained in pedagogical matters, while also working;
Pedagogical decentralization to communities. Another option would consist in providing more pedagogical responsibility to the communities themselves to foster changes in teaching practices. There i s less clear-cut international evidence that decentralizing this type o f decisions to community would lead to better teaching practices. Additionally, by empowering parents in this area, teachers may feel even less valued. I f it i s decided to provide more power to the school councils in pedagogical matters, the models should proceed with some caution, gradually extending authority to communities as they acquire and demonstrate capacity in this area. They should establish mechanisms o f accreditation before they grant this power and determine what kind of power they wish to hand over. There are some pedagogical matters such as the setting of policies regarding curricula, programs and evaluation which should remain, in any case, centralized;
Transfer formulae. Transfer formulae should be modified, by basing the allocation of funds on the real demands that may come from the school councils themselves (through their School Education Plans), ensuring therefore higher shares for non-salary recurrent expenditure for materials and the like, and introducing allocation criteria that take into account equity, when
209
necessary, and performance (provision for small schools in Nicaragua, measures o f student attendance or retention in Honduras, Guatemala and El Salvador);
Parental support. Continuous parental support through flexible and transparent mechanisms needs to be provided. Although the use o f intermediate agents, such as NGOs and social workers, needs to be more ful ly assessed in Guatemala and Honduras, there i s some positive evidence on their role in providing administrative support. In any case, these agents should receive training on a continuous basis, keep close ties with other local officials from the ministries o f education, and use standard procedures and provide timely advice and support. I t i s also imperative that in future strategic discussions regarding the programs’ expansion and evolution, the longer-term role and status o f these external agents be addressed. I t would also be important, in particular for the sustainability o f the models, to define with precision and strengthen the role o f the deconcentrated levels o f the ministries o f education (departmental and district offices). These levels could have particular relevance in pedagogical support and supervision to parents, teachers and directors. Additionally, i t would be useful to assess the feasibility o f having these levels hiring the external agents (in particular in Honduras and El Salvador), to contribute to the institutionalization and acceptance o f the models within the ministry o f education, while not losing the economies o f scale that can be made b y hiring external agents at an intermediate level (in contrast to the school);
Information on school and teacher performance and supervision mechanisms. A substantial effort should be made to provide good information on the performance o f schools and teachers and make i t available to all education actors (directors, teachers, parents, department and district education offices). The MINEDs could create a very simple model with the most important indicators (orientuciones) to measure teacher and school performance. Standardized testing should be used and disseminated. The model should be shared and validated with the parents and local community members and information should be produced in a systematic way to measure those indicators on a regular basis. A good information system w i l l ultimately allow parents to obtain information on the performance o f their children relative to the rest o f the school, the performance of the school relative to other schools o f similar characteristics, and the performance o f the system against itself over time. Setting-up effective supervision mechanisms, involving directors and the deconcentrated levels o f the MINEDs, would also be key to monitor teacher behavior in cases o f imperfect information.
Teachers’ skills. Financial incentives are key to make the programs attractive vis-&vis the traditional system and to attract skilled teachers. Teachers’ salaries and social security benefits should be balanced across traditional and non-traditional systems in Honduras and Guatemala. In all countries, i t i s important to ensure that fringe benefits be more similar between the traditional and non-traditional sector (teachers in community based programs usually lack access to medical and l i fe insurance benefits and female teachers do not have access to maternity benefits and leave). In al l countries, there would be room for introducing performance bonuses in the non-traditional sector. The key here i s to be bold and rely on the local school council to determine the type and size o f the bonus to be distributed at the end o f each school year, and how to allocate the bonus among teachers. The idea i s that school councils should guard against linking permanent rewards (such as salary level) to performance, but rely instead on cash or in-kind bonuses that are used to
210
specifically recognize the work of good teachers, and openly express the appreciation of the community;277
Teacher motivation and permanency in the non-traditional system: timely payment. Due to administrative and financial difficulties, some o f which are beyond the control of the coordinating units or MINEDs, there have been frequent delays in payments of teacher salaries, especially in Honduras and Guatemala. In order to ensure that teachers remain motivated and interested in working in autonomous schools, i t i s imperative that salaries be paid in a timely manner. To do this, having the school based management programs’ budgets integrated into the general budget of the ministry of educations may probably help. Secondly, in all countries, the forms and paper work to liquidate the funds should be simplified. Thirdly, explicit priority should be given to the payment of salaries within the transfer of funds. Fourth, to strengthen transparency, the programs should also contract independent f i rms to do the auditing o f the transferred funds. Fifth, if the liquidation of funds has to be done every three months, i t would seem more appropriate to pay teachers’ salaries in advance;
Professional development. While maintaining fixed-term contracts, which i s at the very core of the incentive structure of autonomous models, a merit system (esculufh), similar to the one applied in the private sector, should be designed and implemented for all countries in the non- traditional sector to retain teachers (including regular salary increases based on seniority and qualifications, increased responsibilities, training options, etc). I t i s also important to change the perception of instability which i s part o f the non-traditional system. Stability should not be understood in terms of time but in terms of performance. Teachers should feel confident that i f they perform well they wi l l keep their jobs. This can happen if they know what i s expected from them and how their work wi l l be evaluated.
Directors: role. A comparison of Nicaragua with the other three countries suggests that directors should probably not be part of the school councils, or, if they are part, that their relative responsibilities be very clearly specified, to prevent communities from not being truly empowered in administrative matters (teacher and budget management). Taking advantage o f the involvement of the communities in these matters, directors could take up a key role in academic matters in the schools, providing pedagogical support and supervision and ensuring a sound and constructive academic environment. Directors should probably be granted higher authority in larger schools (such as in Nicaragua), where monitoring school and teachers may be more complex. However, i t w i l l be necessary to ensure a democratic type o f leadership which w i l l require a more transparent way of electing directors and closer monitoring of their performance as well as special training and technical assistance to develop their leadership skills.
Training. Specific training should be introduced for directors to strengthen their management sk i l ls and leadership in a variety o f areas, in particular in academic matters.
Institutional capacity of coordinating units. People in charge o f the coordinating units should be selected according to their merit and not for political or other reasons. Their performance should be evaluated not only according to their individual actions but also according to the overall results of the community program. Their capacity o f evaluating and monitoring schools should be
*” Also see Arcia and B e l l i (1999).
21 1
strengthened. Finally, to help institutionalize the programs, i t should also be gradually envisaged to substitute the coordinating units by departments or offices that are fu l ly part o f the structure o f the ministries o f education;
Consensus and institutionalization. As already discussed, consensus i s a decisive factor in the successful expansion and institutionalization o f any educational reform. Where i t i s impossible to achieve absolute consensus, i t i s important to make sure that the main political forces know the program’s goals and i t s achievements. When this i s not possible, as was the case in Guatemala in the previous administration, it is important to make sure that other important stakeholders (such as the parents themselves, private sector, majors and others) are ready and organized to defend the programs. The S B M models should a have a network o f key people ready to act. More studies are also needed to determine the impact o f the models on student achievement, repetition and dropout rates, as well as teacher effectiveness. To institutionalize and create consensus around the programs i t i s also necessary that they appear as part o f the general policies and programs implemented by the government to improve the quality o f education. As such, they should be included in the legislation on education, in laws regarding participation, in the development plans and, especially, in the national budgets. They should be seen as part o f the routine o f the ministries o f education without loosing their innovative character;
Teacher inclusion and sustainability. Finally, i t i s key to implement strategies to include teachers and teacher’s unions in the reform process, by disseminating information on the reform, negotiating more favorable employment conditions for teachers in the non-traditional sector (see above), or granting higher teacher pedagogical autonomy. I t i s necessary to reiterate that teachers, who have not developed “stake-ownership”, remain the main opposition and can potentially derail the reform, especially in Honduras and Guatemala where teacher unions are relatively strong. I t is imperative for the same sustainability o f the models to address the issue o f teacher opposition.
Regional collaboration. A mechanism should be established that allows for community based programs to share their experience in the region. This can start with a summit o f the ministries o f education (or vice-ministries) o f the four countries to analyze the results o f this study. The purpose should be to develop a common agenda to solve the most urgent problems and to plan the long term sustainability o f the models.
212
References
Academy for Educational Development (AED) (2004): “Calidad y Equidad: Renovando l a Visi6n de Largo Plazo en la Eduaci6n Preescolar y Basica de El Salvador”, USAID, unpublished document.
AED and Jutirez and Associates (2003): “The Nicaragua Basic Education Project, BASE 11: 2002 Annual Study”, AED, unpublished document
Anderson, MH (2004): “Overview of the education sector in Guatemala” in The world Bank (2004a), Volume 11.
Arcia, G (2003): “The Financing of Public Education in Nicaragua”, consulting report for the World Bank.
Arcia, G and Belli, H (1 999): “Rebuilding the School Contract: School Autonomy in Nicaragua”, LCSHD Paper Series No. 40, The World Bank, Washington, DC
Arias, 0 (2004): “Poverty in El Salvador during the 1990s: Evolution and Characteristics”, background paper for The World Bank Poverty Assessment of El Salvador.
Arrien, J ed. (1998): “La Educacidn y la Reforma de la Educacidn en Cinco Paises Centroamericanos”, PREAL, Managua, Nicaragua.
Asturias, L. et a1 (2001): “Diseiio de un Estudio Etnografico piloto sobre l a Influencia de PRONADE en e l Desarrollo Local”, MINED, Guatemala.
Bedi, A and Edwards, J (2002): “The impact of school quality on earnings and educational returns-evidence from a low-income country”, in Journal of Development Economics, Vol. 68 (2002)
BCnabou, R, and Tirole, J (2003). “Intrinsic and Extrinsic Motivation.” Review of Economic Studies 70: 489-520.
Benveniste, L, and McEwan, P (2000): “Constraints to Implementing Educational The Case of Multigrade Schools”, International Review of Education, 46( 1/2)
Innovations:
Bommier, A and Lambert, S (2000): “Education Demand and Age at School Enrollment in Tanzania”, in Journal of Human Resources, 35( 1): 177-203.
Bourguignon, F, F Ferreira, and P Leite (2002): “Ex-Ante Evaluation of Conditional Cash Transfer Programs: The Case of Bolsa Escola”, Working Paper N. 5 16, William Davidson Institute, Michigan.
Card D (2001): “Estimating the returns to schooling: progress on some persistent econometric problems”, in Econometrica 69(5).
213

Carvajal, M, Morris, F and Davenport, L (1993): “Economic Determinants o f Academic Failure and School Desertion in the Guatemalan Highlands”, Economics of Education Review, 12( 1).
Castillo, M. (1 998): “La Descentralizaci6n de 10s Servicios de Educaci6n en Nicaragua”, Serie Reforma de Politica Publica, Naciones Unidas Comisi6n Econ6mica para AmCrica Latina y el Caribe, Santiago de Chile.
Castro, C., Carnoy, M and L. W o l f (2000): “Secondary School and the Transition to Work in Latin American and the Caribbean”, IADB, Washington DC.
C IEN (1 999): “La Experiencia del Programa Nacional de Autogesti6n Para el Desarrollo Educativo PRONADE”, Resdmen Ejecutivo. Guatemala City, Guatemala.
C IEN (2003): “Revisi6n del gasto en Educaci6n en Guatemala”, Background Paper, Guatemala
Costa Rica - Ministerio de Educaci6n Pdbl icd Departamento de Pruebas Nacionales (2001): “Informes Nacionales sobre Resultados de las Pruebas Nacionales de l a Educaci6n Formal, ciclo I1 y 111”, San JosC, Costa Rica
Costa Rica- Ministerio de Educaci6n Pdblica (MEP) (2002): “Equidad y calidad para 10s nifios y la niiias que asisten a las escuelas unidocentes”, San Jose’, Costa Rica.
Costa Rica - Ministerio de Educaci6n Pdblica (MEP) (2001): “Educaci6n Integral e l las Escuelas Pdblicas y Privadas de Costa Rica: Un Fin N o Alcanzado”, San JosC, Costa Rica.
Cuellar Marchelli, H (200 1): “Decentralization and Privatization o f Education in El Salvador: Assessing the Experience”, Occasional Paper No. 19, National Center for the Study o f Privatization in Education, Columbia University, New York
Cummings, S and Tamayo, S (1994): “Language and Education in Latin America: An Overview”, Human Capital Working Paper N. 13068, The Wor ld Bank, Washington DC.
D e Baessa, Y. (2001): “Factores del Hogar en el Rendimiento Acadkmico”, Unpublished document, Universidad del Valle, Guatemala.
Di Gropello, E and Marshall, J (2004): “Teachers’ Incentives in Rural Honduras”, The World Bank, mimeo
Di Gropello, E, Dubey, A and Winkler, D (2003): “Reaching Basic Education for All in Latin America”, The World Bank, mimeo
Di Gropello, E (2005): “Education Decentralization and Accountability Relationships in Latin America”, Policy Research Working paper N.. ., The World Bank, Washington DC
Dolton and Van Der Klaauw (1999): “The turnover o f teachers: a competing r isks explanation”, Review of Economics and Statistics, 8 1 (3).
214
Durston, J. (1 999): “La Gestidn Comunitaria de la Educacidn Rural en PROHECO’, PNUDKEPAL.
Durston, J. (2002): “El capital social campesino en l a gesti6n del desarrollo rural. Diadas, equipos, puentes y escaleras”, CEPAL, Santiago de Chile.
Dutcher, N.(1997): “The Use of First and Second Languages in Education: A Review of International Experience”, The World Bank, Working Paper N. 18803, Washington DC.
ECLAC (1 994, 1996): “El Gasto Social en America Latina: un Examen Cuantitativo y Cualitativo”, i n Cuadernos de l a CEPAL, Santiago, Chile
Edge, K (2000): “El Salvador: EDUCO”, Decentralization and School Based Management Resources Kit Case Studies, The World Bank, Washington D C
Edwards, J (2004): “Education and Poverty in Guatemala”, in The World Bank (2004a), Volume 11.
Edwards, J, Fuller, B and Parandekar, S (1997): “Primary Education Efficiency in Honduras. What remains to be done ?”, Latin America Human Development Working Paper Series N.7, The World Bank, Washington DC.
ESA (2004): “An Evaluation of PROHECO” - Consulting report for The World Bank - mimeo
El Salvador - Ministerio de Educaci6n (2002): “Factores Asociados a1 rendimiento de 10s estudiantes que se sometieron a la PAES 2000”, San Salvador, El Salvador.
El Salvador - MINEDKJES (2003): “Plan Especial de Estimulo a la Labor Educativa Institucional para el AAo 2002”, Ministerio de Educacibn, Universidad de El Salvador, San Salvador.
Figueredo, V and S, Anzalone: (2003): “Alternative models for secondary education in developing countries: rationale and realities”, American Institute for Research, mimeo
Florez, C., R. Ruiz, et al. (2003): “Lecciones aprendidas de la autonomia escolar nicaraguense”, New School University, New York City.
Fuller, B and D Holsinger (1 993): “Secondary Education in Developing Countries”, The World Bank, ESP Discussions Papers Series N.7, Washington DC.
Fuller, B and Riverola, M (1998): “Nicaragua’s Experiment to Decentralize Schools: Views of Parents, Teacher and Directors”, Working Paper Series on Impact Evaluation o f Education Reforms, Paper No. 5, The World Bank, Washington, D C
Gershberg, A I (1999): “Fostering Effective Parental Participation in Education: Lessons from a Comparison of Reform Processes in Nicaragua and Mexico”, in World Development, Vo. 27 (4), pp. 753-771
215
Gershberg, A and Winkler, D (2000) “Education Decentralization in Latin America: The Effects on the Quality o f Schooling”, LCSHD Paper Series No. 59, The World Bank, Washington, DC
Gershberg, A. et al. (2001): “Lecciones Aprendidas de la Autonomia Escolar Nicaragiiense ”, The New School University, Managua.
Gershberg, A. and Kaestner, R (2002): “Lessons learned from Nicaragua’s School Autonomy Reform: A review of Research by the Nicaragua Reform Evaluation Team of the World Bank”, Milano Graduate School of Management and Urban Policy, mimeo
Gershberg, A. I. (2003): “Empowering Parents while Making them Pay: Autonomous Schools and Education Reform Processes in Nicaragua”, paper written for the project funded by the Tinker Foundation.
Glewwe, P (1996): “The relevance of standard estimates of rates o f return to schooling for education policy: a crit ical assessment”, in Journal of Development Economics, Vo1.5 1,267-290
Glewwe, I l ias and Fremer (2003): “Teacher Incentives”, NBER Working Paper 967 1.
Guatemala - MINEDUC (2000): “Plan de Gobierno: Sector Educaci6n 2000-2004”, Guatemala.
Guatemala - MINEDUCDP Tecnologias (2000): “Estudio Cuasi-Experimental de Resultados del Aiio 1999”, Resumen Ejecutivo, Ciudad de Guatemala, Guatemala.
Guatemala - MINEDUCDP Tecnologia (2002): “Estudio Quasi-Experimental de Resultados de PRONADE 2001 ”, Guatemala City, Guatemala
Guatemala - Ministry of Education (MINEDUC) (2003a): “Programa Nacional de Autogestidn para el Desarrollo Educativo - PRONADE ”, Guatemala, Guatemala
Guatemala - Ministry of Education (MINEDUC) (2003b): “PRONADE - Actores Principales del Programa”, Available at www.mineduc.g;ob.g;t.
Guatemala - MINEDUC (2004): “Anuario Estadistico 2002”, Guatemala.
Hammer, J (1 996): “The Public Economics o f Education”, Policy Research Department, The World Bank, mimeo
Hannaway, J. (1991): “The organization and management of public and catholic schools: Looking inside the black box”, International Journal of Educational Research, 15
Hanushek, E., (1 995): “Interpreting Recent Research on Schooling in Developing Countries”, in The World Bank Research Observer, 10(2), 227-246.
Heuser, S., Jacobs, I and I. Umansky (2003) : Unpublished Base Document for the 2003 Education Ministerial Meeting, Mexico, August 2003, OAS, Washington DC.
216

Holsinger, D and Cowell, R (2000): “Positioning Secondary School Education in Developing Countries”, in Series Policies and Strategies for Secondary education, International Institute for Educational Planning, UNESCO, Paris
Honduras - Secretaria de Educaci6n Pitblica (SE) (2000): “Estadisticas de PROHECO”, Unidad Coordinadora, Tegucigalpa.
Honduras - Secretaria de Educaci6n Pitblica (2003): “Revisado y Actualizado Manual de Organizaci6n y Funcionamiento de las AECOs”, Tegucigalpa, Honduras
Honduras - UMCEKJniversidad Pedag6gica Nacional Francisco Morazan/SE (2003a): “Znforme Nacional de Rendimiento Academic0 2002”, Tegucigalpa, Honduras.
Honduras - UMCEKJniversidad Pedag6gica Nacional Francisco Morazin/SE (2003b): “Znforme sobre factores asociados a1 rendimiento acadkmico Honduras 2002”, Tegucigalpa, Honduras.
IFPRI (2003): “Proyecto PRAF/BID Fase 11: Impacto Intermedio”, Sexto Informe.
Ichino, A and Winter-Ebmer, R (1999): “Lower and upper bounds o f returns to schooling: an exercise in instrumental estimation with different instruments”, in European Economic Review N. 43.
Figueredo, V and Anzalone, S (2003): “Alternative models for secondary education in developing countries: rationale and realities”, American Institute for Research, mimeo.
Forster, P. and J. Martinez (2002): “Evaluaci6n de Impacto de Proyecto de Mejoramiento de la Educai6n Bisica (PROMBEB)”, Informe Final PKF Worldwide, Fairfax, Virginia - unpublished document .
Fuller, B, and P. Clarke (1994): “Raising School Effects While Ignoring Culture? Local Conditions and the Influence of Classroom Tools, Rules, and Pedagogy”, in Review of Educational Research 64( l), 119-157.
Fuller, B and Riverola, M (1998): “Nicaragua’s Experiment to Decentralize Schools: Views of Parents, Teacher and Directors”, Working Paper Series on Impact Evaluation o f Education Reforms, Paper No. 5, World Bank, Washington, D C
Jacob, B, and Levitt S (2002). “Rotten Apples: An Investigation of the Prevalence and Predictors of Teacher Cheating.” NBER Working Paper 9413. Cambridge, MA: National Bureau o f Economic Research.
Jimenez, E., and Sawada, Y (1999): “Do Community-Managed Schools Work? An Evaluation of El Salvador’s EDUCO Program”, in The WorZd Bank Economic Review 13(3): 415-441.
Junankar, P N, Liu, J (2003) “Estimating the social rate o f return to education for indigenous Australians.” Education Economics 1 l(2): 169-192.
217
Kane, T, and Staiger D (2001). “Improving School Accountability Measures.” NBER Working Paper 8156. Cambridge, MA: National Bureau of Economic Research.
King, E, and Ozler, B (1998): “What’s Decentralization Got to Do with Learning? The Case of Nicaragua’s Autonomy Reform”, Working Paper Series on Impact Evaluation of Education Reforms, No. 9, The World bank, Washington, DC.
King, E Ozler, B and Rawlings, L B. (2001): “Nicaragua’s School Autonomy Reform: Fact or Fiction?”, Working Paper Series on Impact Evaluation of Education Reforms N. 19, The World Bank, Washington, DC.
Koretz, D (2002). “Limitations in the Use of Achievement Tests as Measures of Educators’ Productivity.” Journal of Human Resources 37: 752-77.
Kraft, R. (1998): “Rural Education Reform in the Nueva Escuela Unitaria of Guatemala”, AED, Washington DC.
Kraft, R (2003): “Caracterizacidn del I y 11 Ciclo de educacidn bcisica en E l Salvador, un enfoque cualitativo ”.
Kraft, R. (2004): ”Educaci6n BBsica” in AID (2004), Chapter 111.
Lavy, V (1996): “School Supply Constraints and Children’s Education Outcomes in Rural Ghana”, in Journal of Development Economics, 5 1 :29 1-3 14.
Lavy, V (2002): “Paying for performance: the effect of teachers’ financial incentives on students’ scholastic outcomes” - mimeo
Lewin, K and Caillods, F (2001): “Financing the Development of Secondary Education in Developing Countries”, in Prospects, vol. XXXI, N. I, March 2001
Loayza, Fajnzylber and Calder6n (2002): “Economic Growth in Latin America and the Caribbean Stylized Facts, Explanation and Forecasts”, in International Monetary Funds Seminar Series N.2003, Washington DC.
Lloyd, C., Mensch, B. and W. Clark, (2000): “The Effects of Primary School Quality on School Dropout among Kenyan Girls and Boys”, in Comparative Education Review, 44(2): 113-147.
Lloyd, C, El Tawila, S, Clark, W and B. Mensch, (2003): “The Impact o f Educational Quality on School Exit in Egypt”, i n Comparative Education Review, 47(4): 444-467.
Loeb, S and M. Page (2000): “Examining the Link between Teacher Wages and Student Outcomes: The Importance of Alternative Labor Market Opportunities and Non-pecuniary Variation.” Review of Economics and Statistics 82: 393408.
Maluccio, J, (2004). “Using quality o f interview information to assess nonrandom attrition bias in developing country panel data.” Review of Development Economics 8( 1): 91-109.
218
Marques, J. and Bannon, I (2003) : “Central America: Education Reform in a Post-Conflict Setting, Opportunities and Challenges”, CPR Working Paper 26667, Paper No. 4, The World Bank, Washington DC.
Marshall, J (2003a): “If you Build it Wi l l They Come ? Primary School Quality and Grade Attainment in Rural Guatemala”, Stanford University, mimeo
Marshall, J (2003b): “School Attendance and Academic Achievement: a Simultaneous Equations Approach”, Stanford University, mimeo
Marshall, J. (2003~): “Academic Achievement, School Attendance, and Education Policy in Honduras” - mimeo.
Meza, D (1997): “Descentralizacibn Educativa, Organizacih y Manejo de las Escuelas a Nivel Local: El Caso de El Salvador”, EDUCO, Informe No. 9, The World Bank, Washington, D C
Meza, D (2001) “El Salvador: El Caso de EDUCO’, Presentation held at the Taller Internacional sobre Participacibn y Empoderamiento para un Desarrollo Inclusivo, July 9-1 1, 2001, World Bank, Lima, Peru
Meza, D and Guzman, J (2004): “EDUCO: A Community-Managed Education Program in Rural Areas of El Salvador (1992-2003)”, Paper prepared for the 2004 Shanghai Conference on Scaling- Up Poverty Reduction
Mella, 0 (2002): “Estudio de Factores Asociados a1 Resultado Escolar”, mimeo
MINEDUC (Guatemala), OEI, & World Bank, no year: “Material Didictico en Aulas Multigrados”, San Salvador, El Salvador.
Murnane, R, and Cohen, D (1986). “Merit Pay and the Evaluation Problem: Why Most Merit Pay Plans Fail and a Few Survive.” Harvard Education Review 56: 3-17.
Nicaragua - Ministerio de Educacibn, Cultura y Deportes (MECD) (1993): “Reglamento General de Educacibn Primaria y Secundaria”, Managua, Nicaragua
Nicaragua - Ministerio de Educacibn, Cultura y Deportes (2003): “Znforme de Resultados 2002 ”, Managua, Nicaragua.
Nicaragua - MECD (2004): “Politicas de educaci6n basica y media” - Versibn preliminar, Managua, Nicaragua.
Nicaragua Reform Evaluation Team (1996): “Nicaragua’s School Autonomy Reform: A First Look”, Working Paper Series on Impact Evaluation of Education Reforms N. 1, The World Bank, Washington D C
Nickell, T and Quintini, J (2002): “The consequences o f the decline in public sector pay in Britain: a l i t t le bit of evidence”, Economic Journal, 112 (477)
219
Ndchez, M. (2003): “Evaluacidn de la Descentralizacidn del Fondo de Desarrollo Professional Docente-aAo 2001”, San Salvador: Ministerio de Educacidn.
OECD (2002): “Education at a Glance - OECD Indicators”, Paris, France.
OEI (2003): “Organizacidn y Estructura de l a Formacidn Docente en IberoamCrica”, documento de trabajo.
OEI (2004): “Diagndstico de 10s Sistemas de Evaluacidn Educativa de CentroamCrica”, consulting report for OEI, San Salvador.
OEI (2004a): “Mapa de Cooperacibn Internacional del Sector Educacidn en CentroamCrica”, unpublished document, San Salvador
PAHO (2004): Epidemiological Bulletin, 25( l), 9- 13.
Paqueo, V and J Lammert (2000): “Decentralization in Education”, in K. Edge Decentralization and School-Based Management Resource Kit, The World Bank, Washington, DC
Patrinos, H and Velez, E (1996): “Costs and Benefits of Bilingual Education in Guatemala: A Partial Analysis”, Human Capital Development Working Paper N. 74, The World Bank, Washington DC
Patrinos, H (2002): “A Review of Demand-Side Financing Initiatives in Education”, Background Paper for the The World Bank World Development Report 2003.
Paxson, C, and N. Schady, (2002): “The Allocation and Impact of Social Funds: Spending on School Infrastructure in Peru”, in World Bank Economic Review, 16(2): 297-319.
Park, A, and Hannum E (2001). “Do Teachers Affect Learning in Developing Countries?: Evidence from Matched Student-Teacher Data from China.” Paper prepared for the conference on Rethinking Social Science Research on the Developing World in the 21st Century, Park City, Utah, June 7-1 1.
Parker, C (2004): “Teacher Incentives and Student Achievement in Nicaraguan Autonomous Schools”, Washington DC, The World Bank, mimeo
PREAL (2002): “El Tiempo de Aprendizaje en America Latina”, Serie Politicas, Santiago de Chile.
PREAL (2002a): “ Informe de Progreso Educativo: El Salvador”.
PREAL (2003): “Time to Act: A Report Card on Education in Central American and the Dominican Republic”, Task Force on Education Reform in Central America.
PREAL (2003a): “Desarrollo de l a educacibn en sectores rurales. PREAL Formas y Reformas de l a Educacibn”, Serie Politicas 5 (1 3).
220
Psacharopoulos, G, J. Valenzuela and M. Arends (1996): “Teacher Salaries in Latin America: A Review.” Economics of Education Review 15(4): 401-6.
Psacharopoulos, G and Patrinos, H (2002): “Returns to Investment in Education: a Further Update”, World Bank Policy Research Working Paper N.2881, The World Bank, Washington DC
Rapalo, R (2004): “Calidad de l a educaci6n como mejora de 10s aprendizajes” in AED (2004), (Chapter V).
Ravela, P (2002): “Como presentan sus resultados 10s sistemas nacionales de evaluacion educativa en America Latina”, PREAL, Working Paper N.22
Rivkin, S, Hanushek, E and Kain, J (1998). “Teachers, Schools and Academic Achievement.” NBER Working Paper No. w6691. Cambridge, MA: National Bureau of Economic Research.
SANIGEST (2003): “Fortalecimiento del Sector Educativo en Costa Rica: Situaci6n Actual y Opciones de Politica”, consulting report for the World Bank
Sawada, Y (1 999): “Community Participation, Teacher Effort and Educational Outcome: The Case of El Salvador’s EDUCO Program”, Working Paper No. 307, The World Bank, Washington, DC
Rivkin, S, Hanushek, E and Kain, J (1998). “Teachers, Schools and Academic Achievement.” NBER Working Paper No. w6691. Cambridge, MA: National Bureau of Economic Research.
Sawada, Y (2003): “Community participation, teacher effort and educational outcomes in a developing country”, The World Bank, mimeo
Sawada, Y and Ragatz, A (2004): “Decentralization o f Education, Teacher Behaviour and Outcomes: the Case of El Salvador’s EDUCO Program”, The World Bank, mimeo
Schiefelboin, E (2004): “Se Reduce l a Repeticibn, Deserci6n y Extraedad, per0 Continua e l Bajo Aprendizaje, Especialmente en 10s Grupos de Menores Ingresos”, in AED (2004), Chapter I.
Skoufias, E. and S Parker (2001): “Conditional Cash Transfers and Their Impact on Child Work and Schooling: Evidence from the PROGRESA Program in Mexico”, Discussion Paper N. 123, International Food Policy Research Institute, Washington DC
The World Bank (1995), Staff Appraisal Report of Nicaragua’s Basic Education Project, Report No. 13705-NI, The World Bank, Washington, DC
The World Bank (2002): Implementation Completion Report P007399, Washington DC.
The World Bank (2003): “Closing the gap in education and technology”, World Bank Latin American and Caribbean Studies, Washington DC.
The World Bank (2004a): “Guatemala - Equity and Student Achievement in Primary Education”, Volumes I and 11, Report N. 22691, Washington DC.
22 1
The World Bank (2004b): “El Salvador - Education Strategy Note”, unpublished document.
The World Bank (2004~): “Honduras - Education Strategy Note”, unpublished document.
The World Bank (2004d): “Honduras. Development Policy Report. Accelerating Broad Based Growth”, Report N. 28222,Washington DC.
The World Bank, (2004e): “Strengthening the Foundation of Education and Training in Kenya”, Sector Report No. 28064-KE, Washington DC.
The World Bank (20040: “Making service delivery work for poor people ”, The World Bank and Oxford University Press
U I S (2000, 2003): “Global Education Digest: Comparing Education Statistics across the World”, UNESCO Institute for Statistics, Montreal, Canada.
Umansky, I (2004): “Factors Associated with Education Achievement in Central America: An Examination o f Existing Research”, background paper for the World Bank Central America Education Strategy Paper.
UNESCO (2003): “Primer Foro Centroamericano de Educacidn para todos 2003”, Informe Final Relatoria.
UNESCOLaboratorio Latinoamericano de Evaluaci6n de la Calidad de la Educacidn (LLECE) (1 998): “First International Comparative Study of Language, Mathematics, and Associated Factors for Students in the Third and Fourth Years of Primary School: First Report”, UNESCO, Santiago, Chile.
UNESCO/Laboratorio Latinoamericano de Evaluaci6n de la Calidad de la Educacidn (LLECE) (2000): “First International Comparative Study of Language, Mathematics, and Associated Factors for Students in the Third and Fourth Years of Primary School: Second Report”, UNESCO, Santiago, Chile.
Valerio, A and Rojas, C (2004): “Education Decentralization and School Management Local Communities: The Case of PRONADE’, in The World Bank (2004a), Vol. 11.
Vawda, A and Patrinos, H (1999): “Producing Educational Materials in Local Languages: Costs from Guatemala and Senegal”, in International Journal of Educational Development, 19,287-299.
Velez, E, Schiefelbein, E, and Valenzuela, J (1993). “Factors Affecting Achievement in Primary Education.” Human Capital Working Paper Series 12186. Washington, DC: The World Bank.
Villegas-Reimers, E, and Reimers, F (1996). “Where Are 60 Mil l ion Teachers? The Missing Voice in Educational Reforms around the World.” Prospects 26(3): 469-92.
Wright, S, Horn, S, and Sanders, W (1997). Teacher and Classroom Context Effects on Student Achievement: Implications for Teacher Evaluation. Journal of Personnel Evaluation in Education 11: 57-67.
222

Younger, S (2000): “The Incidence of Public Services and Subsidies in Peru: Evidence from Household Surveys”, Working Paper N. 103, Ithica, Cornel1 Food and Nutrition Policy Program, NY.
Younger, S (2003): “Benefits on the Margin: Observations on the Marginal Benefit Incidence”, in World Bank Economic Review, 17(1): 89-106.
223
LIST OF ANNEXES (Tables and Figures)
Annex I: Tables and Figures for Chapter I ............................................ 226
Table 1.1 : Average Years o f Education Attained ................................................................. 226 Table 1.2: Average Years o f Educational Attainment (Barro and Lee Dataset) .................. 226 Table 1.3: GER and NER in Pre.Primary. Primary and Secondary (MINED) .................... 227
Table 1.6: Survival Rates for the 7 to 17 Cohort (survivor plots) ........................................ 228
Table 1.9: Standardized Test Scores ..................................................................................... 230 Table 1 . 10. Distribution of Educational Outcomes by UrbanRural ................................... 231
Table 1.12: Distribution o f Educational Outcomes by Quintiles ......................................... 233 Table 1.13: Primary Completion Rate b y Cohort ................................................................ 234 Table 1.14: Rates o f Return per Income Quintile ................................................................. 235 Table 1.15: Distribution o f Educational Outcomes b y Gender ........................................... 236 Table 1.16: Distribution o f Educational Outcomes by Indigenous/Non-Indigenous ........... 237
Table 1.4: GER and NER in Pre.Primary, Primary and Secondary (Household Surveys) .. 227 Table 1.5: Evolution o f GER and NER ................................................................................ 228
Table 1.7: Age-by-grade distortion ....................................................................................... 228 Table 1.8: Repetition Rate (different sources) ...................................................................... 229
Table 1.1 1 : Disagregation o f test scores across urbanhral area ......................................... 232
Table 1.17: Primary completion rate for indigenous and not indigenous and different Cohorts .......................................................................................................................... 237
Figure 1.1 : Per capita income and GCR in primary ............................................................ 238
Figure 1.3: GERs in urban and rural areas according to different sources ........................... 239
Figure 1.5: Secondary NER by quintile in El Salvador and Costa Rica ............................... 240
Figure 1.8: Evolution across cohorts o f primary completion rate ........................................ 242
Figure 1.2: Survivor function plots ....................................................................................... 238
Figure 1.4: Efficiency Indicators in Urban and Rural Areas ................................................ 239
Figure 1.6: Evolution o f primary NER b y quintile ............................................................... 240 Figure 1.7: Primary Completion Rate b y quintile and cohort .............................................. 241
Annex 11: Methodology for the Calculation of Private Rates of Return .. 244
Annex 111: Evolution of Rates of Return in Central America ................... 245
Figure 3.1 : Evolution across cohorts o f rates o f return and educational attainment for several countries ............................................................................................................................. 245
246 ............................................................................................................................................
Figure 3.2: Evolution o f private returns to schooling b y educational level and cohort ......
Annex IV: National Assessment Systems in Central America .................. 247
Table 4.1 : Characteristics o f National Assessment Systems in Central America .............. 247
224
Annex V: Teacher Education in Central America ...................................... 249
Table 5.1 : Teacher Education ............................................................................................... 249
Annex VI: Teacher Salary in Central America ........................................... 251
Annex VII: Curricular and Pedagogical Reforms in Central America ..... 253
Annex VIII: Methodological Aspects on the Analysis of Effective Schools in Honduras and Nicaragua ........................................................ 255
Annex IX: Intercultural Bilingual Programs in Nicaragua & Honduras . 257
Annex X: Tables and Figures for Chapter I V .............................................. 259
Table 10.1: Recurrent Expenditure per Child and Student ................................................ Table 10.2: Distribution of Public Enrollment by Income Quintiles - Preschool ................ 259 Table 10.3: Distribution of Public Enrollment by Income Quintiles - Primary ................... 259 Table 10.4: Distribution of Public Enrollment by Income Quintiles - Secondary ............... 260
Figure 10.1 : Test Scores and Educational Expenditure by Region in Honduras ................. 260
259
Table 10.5: Distribution of Public Enrollment by Income Quintiles - Tertiary .................. 260
************
225
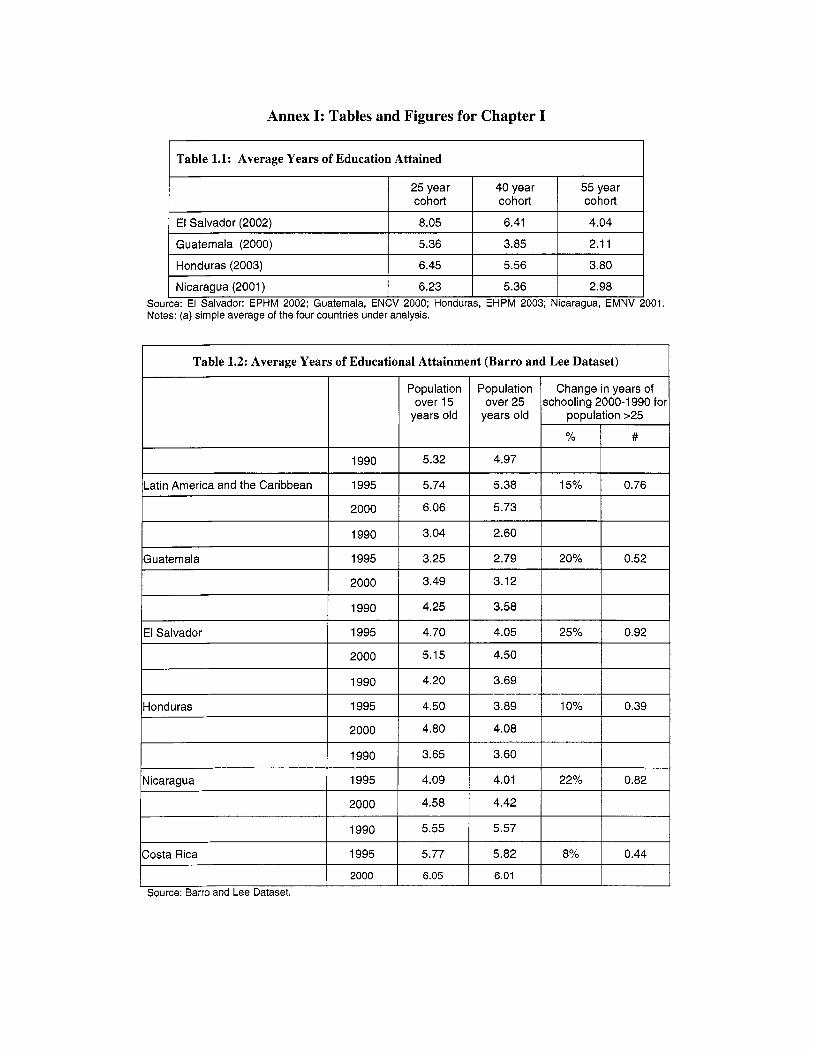
Annex I: Tables and Figures for Chapter I
El Salvador (2002)
Guatemala (2000)
Honduras (2003)
Table 1.1: Average Years of Education Attained
8.05 6.41 4.04
5.36 3.85 2.1 1
6.45 5.56 3.80
25 year 40 year 55 year cohort cohort cohort
Nicaragua (2001) 6.23 5.36 2.98
Population over 15
years old
001.
Population over 25
years old population >25
Table 1.2: Average Years of Educational Attainment (Barro and Lee Dataset)
1990
1995 Latin America and the Caribbean F ~~ ~
5.32 4.97
5.74 5.38 15% 0.76
Honduras
1990 4.20 3.69
1995 4.50 3.89 10% 0.39
2000 I 6.06 I 5.73 I
Nicaragua
I I
2000 4.80 4.08
1990 3.65 3.60
1995 4.09 4.01 22% 0.82
Costa Rica
2000 4.58 4.42
1990 5.55 5.57
1995 5.77 5.82 8% 0.44
2000 6.05 6.01
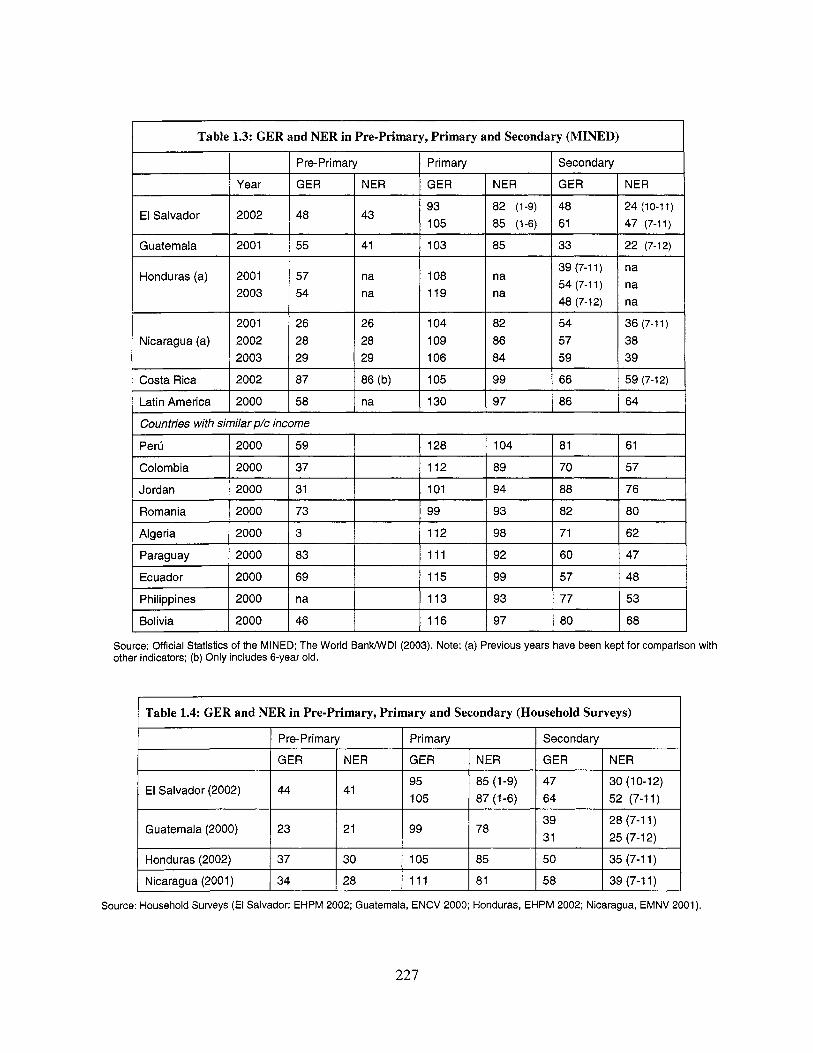
Table 1.3: GER and NER in Pre-Primary, Primary and Secondary (MINED)
I Pre-Primary I Primary I Secondary
Year GER NER GER NER GER NER
El Salvador 12002 I 4 8 I 4 3 1 y:5 1 82 ('-') 1 i! 1 24 (10-11) 1 85 (1-6) 47 (7-11)
Guatemala
Honduras (a)
Nicaragua (a)
Costa Rica
2001 55 41 103 85 33 22 (7-12)
39 (7-11) na 54 (7-11) na 48 (7-12) na
na na
2001 57 na 108 2003 54 na 119
2001 26 26 104 82 54 36 (7-11) 2002 28 28 109 86 57 38 2003 29 29 106 84 59 39
2002 87 86 (b) 105 99 66 59 (7-12)
Ecuador
Philippines
Bolivia
I Table 1.4: GER and NER in Pre-Primary, Primary and Secondary (Household Surveys) I
2000 69 115 99 57 48
2000 na 113 93 77 53
2000 46 116 97 80 68
I I Pre-Primary I Primary I Secondary I
~
Honduras (2002) 37 30 105 85 50 35 (7-1 1)
Nicaragua (2001) 34 28 111 81 58 39 (7-1 1)
85 (1 -9) 30 (1 0-1 2) 1 44 1 41 I ;:5 I87(1-6) 1 li I 52 (7-11) El Salvador (2002)
28 (7-1 1) Guatemala (2000) I 2 3 121 I 9 9 I 7 8 1 z; 1 25 (7-12)
Source: Household Surveys (El Salvador: EHPM 2002; Guatemala, ENCV 2000; Honduras, EHPM 2002; Nicaragua, EMNV 2001 ).
227
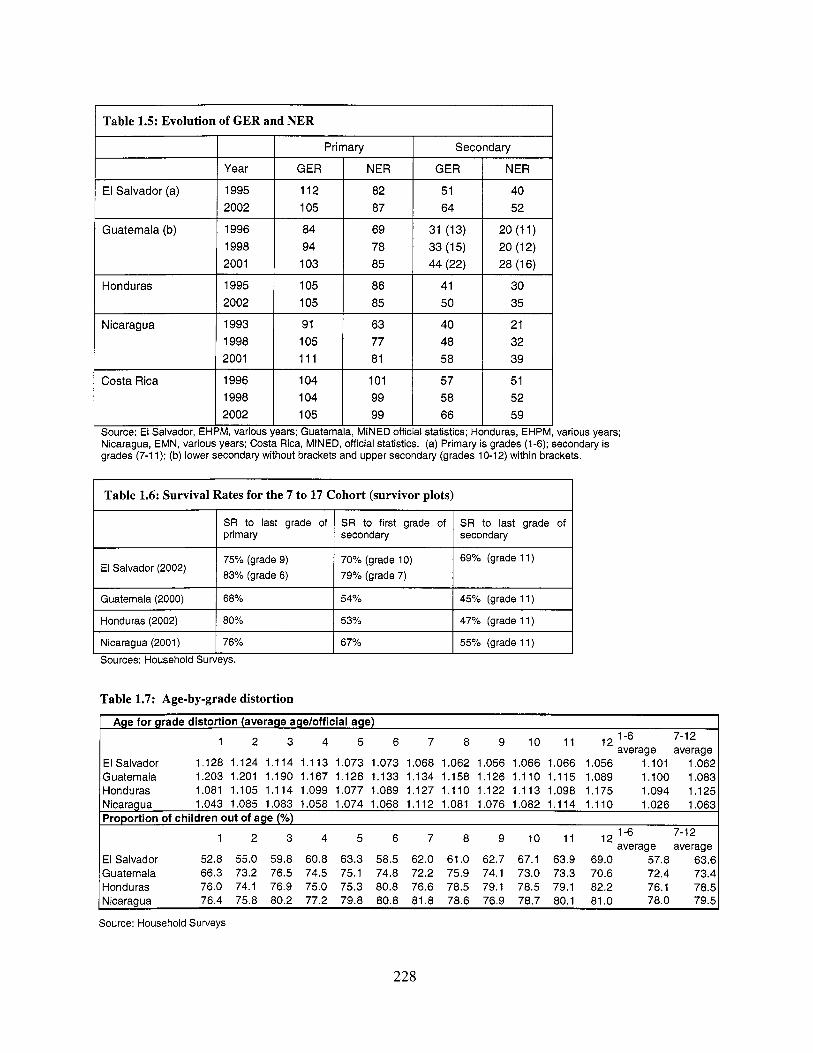
Table 1.5: Evolution of GER and NER
SR to last grade of primary
Source: El Salvador, EHPM, various years; Guatemala, MINED official statistics; Honduras, EHPM, various years; Nicaragua, EMN, various years; Costa Rica, MINED, official statistics. (a) Primary is grades (1-6); secondary is grades (7-1 1); (b) lower secondary without brackets and upper secondary (grades 10-12) within brackets.
SR to first grade of SR to last grade of secondary secondary
1 Table 1.6: Survival Rates for the 7 to 17 Cohort (survivor plots) I 75% (grade 9) 83% (grade 6)
El Salvador (2002) 70% (grade 10) 79% (grade 7)
69% (grade 11)
Guatemala (2000) 68% 54% 45% (grade 11)
Honduras (2002)
Nicaragua (2001)
Table 1.7: Age-by-grade distortion
Age for grade distortion (average age/official age) 1-6 7-1 2
lo l2 average average El Salvador 1.128 1.124 1.114 1.113 1.073 1.073 1.068 1.062 1.056 1.066 1.066 1.056 1.101 1.062 Guatemala 1.203 1.201 1.190 1.167 1.126 1.133 1.134 1.158 1.126 1.110 1.115 1.089 1.100 1.083 Honduras 1.081 1.105 1.114 1.099 1.077 1.089 1.127 1.110 1.122 1.113 1.098 1.175 1.094 1.125 Nicaragua 1.043 1.085 1.083 1.058 1.074 1.068 1.112 1.081 1.076 1.082 1.114 1.110 1.026 1.063 Proportion of children out of age (%)
lo l1 l2 average average El Salvador 52.8 55.0 59.8 60.8 63.3 58.5 62.0 61.0 62.7 67.1 63.9 69.0 57.8 63.6 Guatemala 66.3 73.2 76.5 74.5 75.1 74.8 72.2 75.9 74.1 73.0 73.3 70.6 72.4 73.4 Hond u ras 76.0 74.1 76.9 75.0 75.3 80.8 76.6 78.5 79.1 78.5 79.1 82.2 76.1 78.5 Nicaragua 76.4 75.8 80.2 77.2 79.8 80.8 81.8 78.6 76.9 78.7 80.1 81.0 78.0 79.5
1-6 7-12
80% 53% 47% (grade 11)
76% 67% 55% (grade 11)
Source: Household Surveys
228
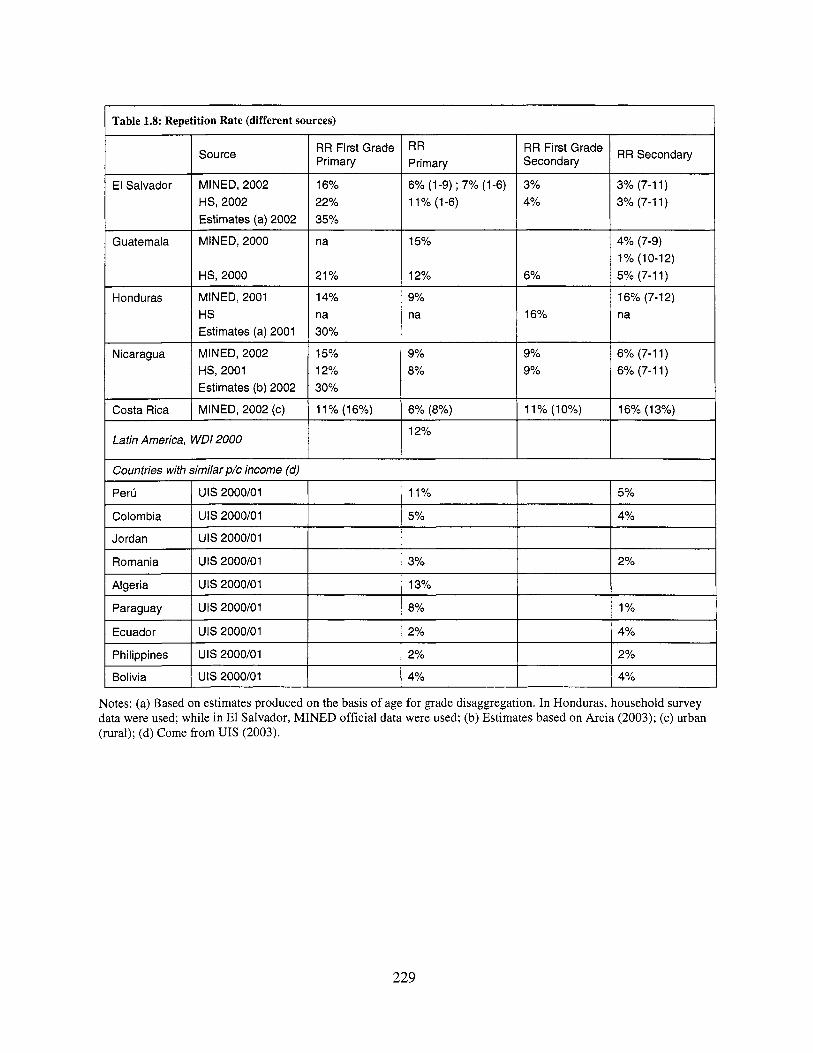
Source
El Salvador MINED, 2002 HS, 2002 Estimates (a) 2002
Guatemala MINED, 2000
HS, 2000
Honduras MINED, 2001 HS Estimates (a) 2001
Nicaragua MINED, 2002 HS, 2001 Estimates (b) 2002
Costa Rica MINED, 2002 (c)
Latin America, WDI 2000
RR First Grade RR Primary Primary Secondary
RR First Grade RR Secondary
16% 6% (1 -9) ; 7% (1 -6) 3% 3% (7-1 1) 22% 11% (1-6) 4% 3% (7-1 1) 35%
na 15% 4% (7-9) 1% (10-12)
21 Yo 12% 6% 5% (7-1 1)
14% 9% 16% (7-12) na na 16% na 30%
15% 9% 9% 6% (7-1 1) 12% 8% 9% 6% (7-1 1) 30%
11% (16%) 6% (8%) 1 1 Yo (1 OYO) 16% (13%)
12%
Jordan
Peru
Colombia
1 uIs2000/01 I I I I
UIS 2000/01 11% 5%
UIS 2000/01 5 yo 4%
Romania
Algeria
Paraguay
Ecuador
Philippines
Bolivia
Notes: (a) Based on estimates produced on the basis o f age for grade disaggregation. In Honduras, household survey data were used; while in El Salvador, MINED official data were used; (b) Estimates based on Arcia (2003); (c) urban (rural); (d) Come from U I S (2003).
UIS 2000/01 3% 2%
UIS 2000/01 13%
UIS 2000/01 8% 1 Yo
UIS 2000/01 2% 4%
UIS 2000/01 2% 2%
UIS 2000/01 4% 4%
229
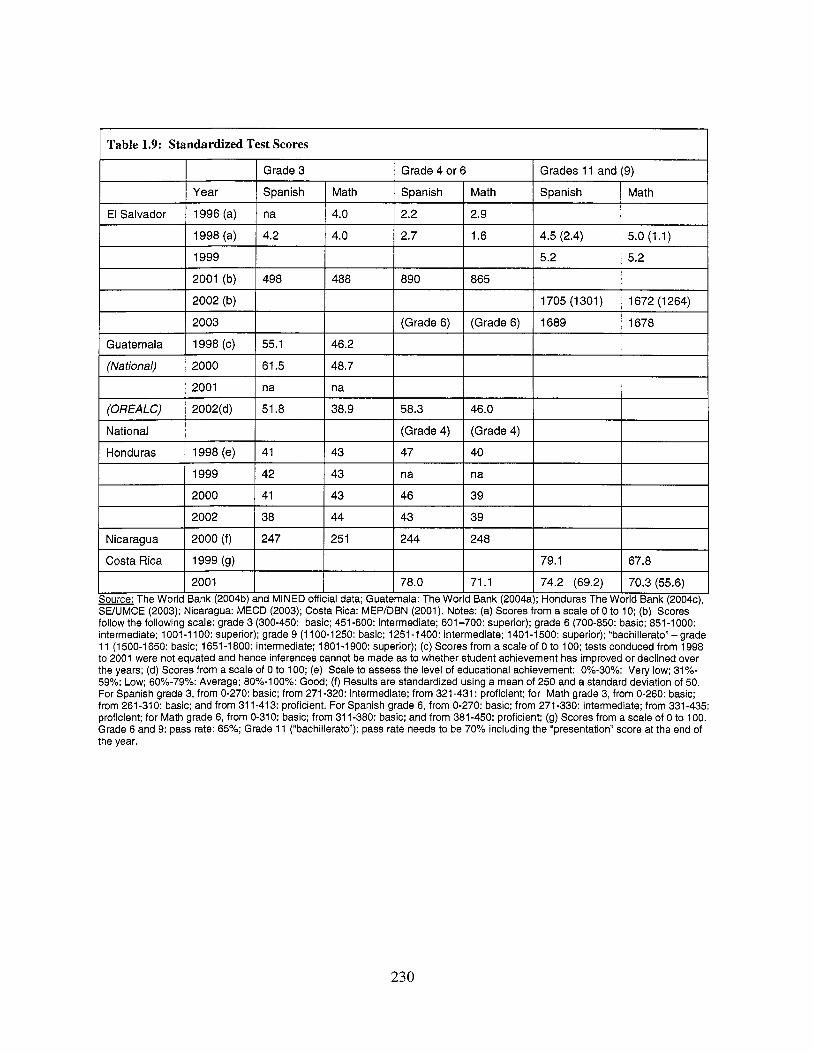
I Table 1.9: Standardized Test Scores
Year
Grade 3 Grade 4 or 6 Grades 11 and (9)
Spanish I Math Spanish 1 Math Spanish I Math
El Salvador 1996 (a) na 4.0 2.2 2.9
1998 (a) 4.2 4.0 2.7 1.6 4.5 (2.4) 5.0 (1.1)
1999
2001 (b)
5.2 5.2
498 488 890 865
2002 (b)
2003
1705 (1 301 ) 1672 (1 264)
(Grade 6) (Grade 6) 1689 1678
Guatemala
(National)
230
1998 (c) 55.1 46.2
2000 61.5 48.7
(OREALC)
National
Honduras
2001 na na
2002(d) 51.8 38.9 58.3 46.0
(Grade 4) (Grade 4)
1998 (e) 41 43 47 40
1999 42 43 na na
2000
2002
41 43 46 39
38 44 43 39
Nicaragua
Costa Rica
2000 (f) 247 25 1 244 248
1999 (9) 79.1 67.8
2001 78.0 71.1 74.2 (69.2) 70.3 (55.6)
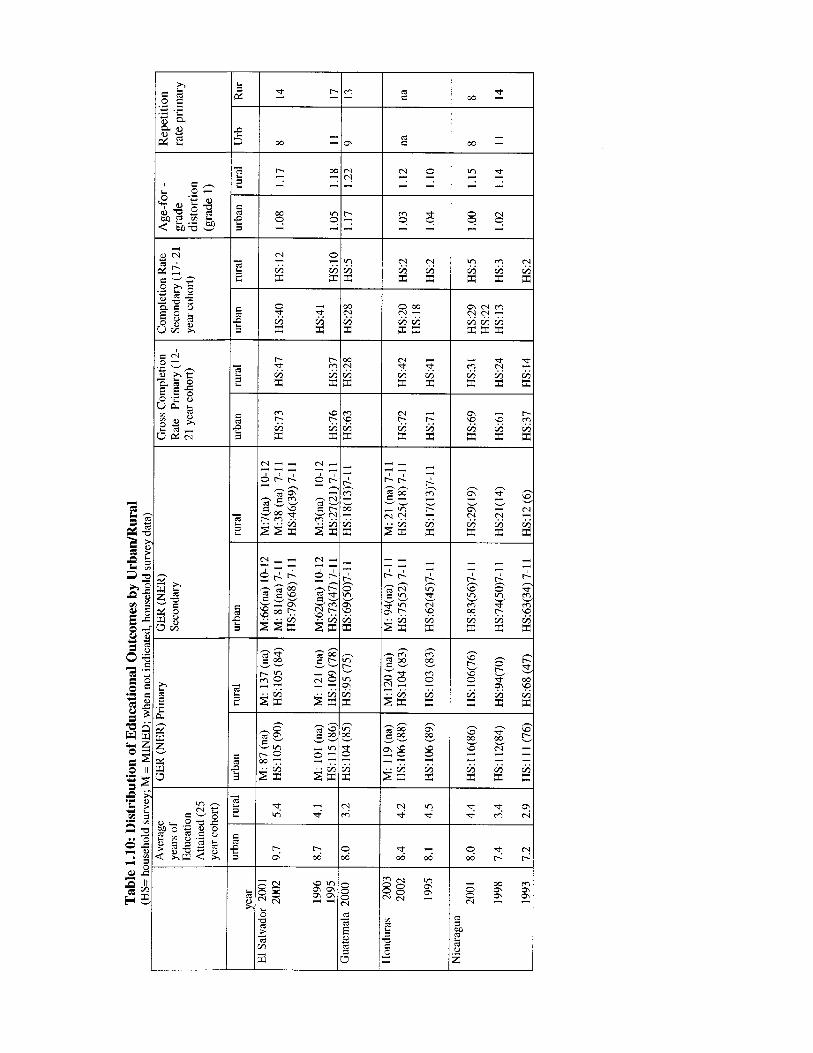
x L
2 c o z I 00 - m - I l e
I
e e 2 I
I
I
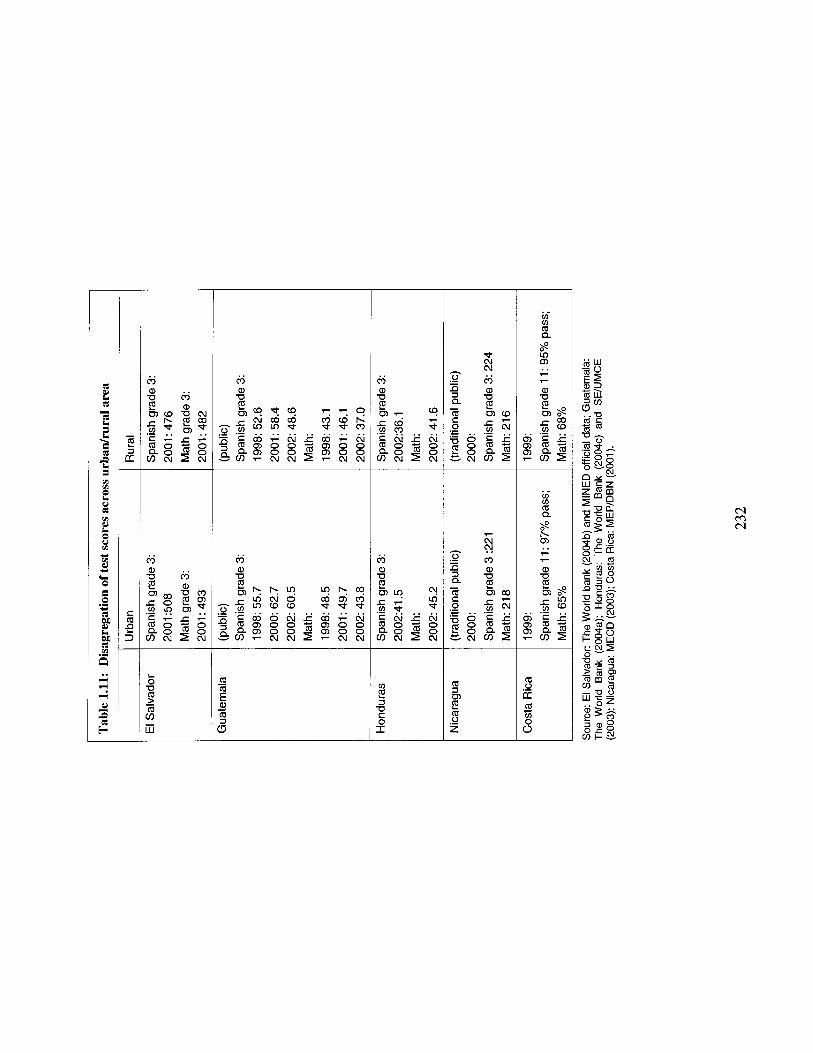
. . m
m . .
.. m a, a
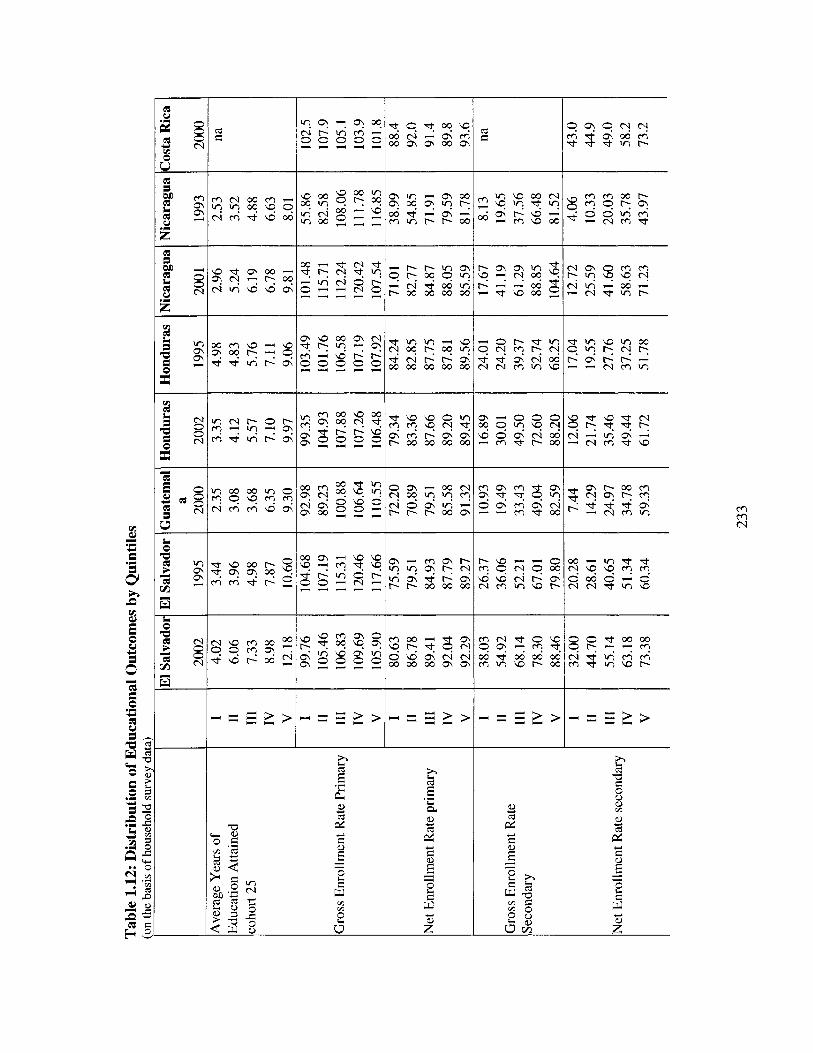
(d C
(d C
p N II m Q\ e m m
m m r\l
2 E 2 c) e, E 2 Y
Y 2 E E
E E W E w
E .e
e,
Y e e, - -
3 3
m m
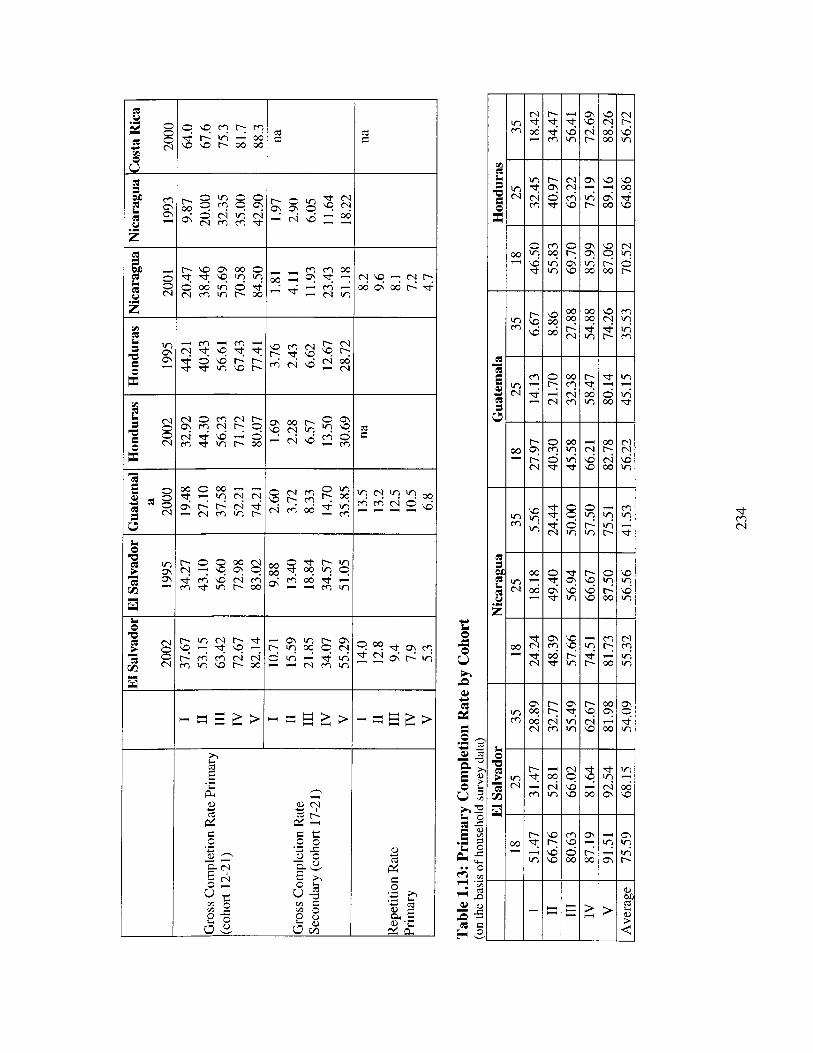
cd C
m c
cd c
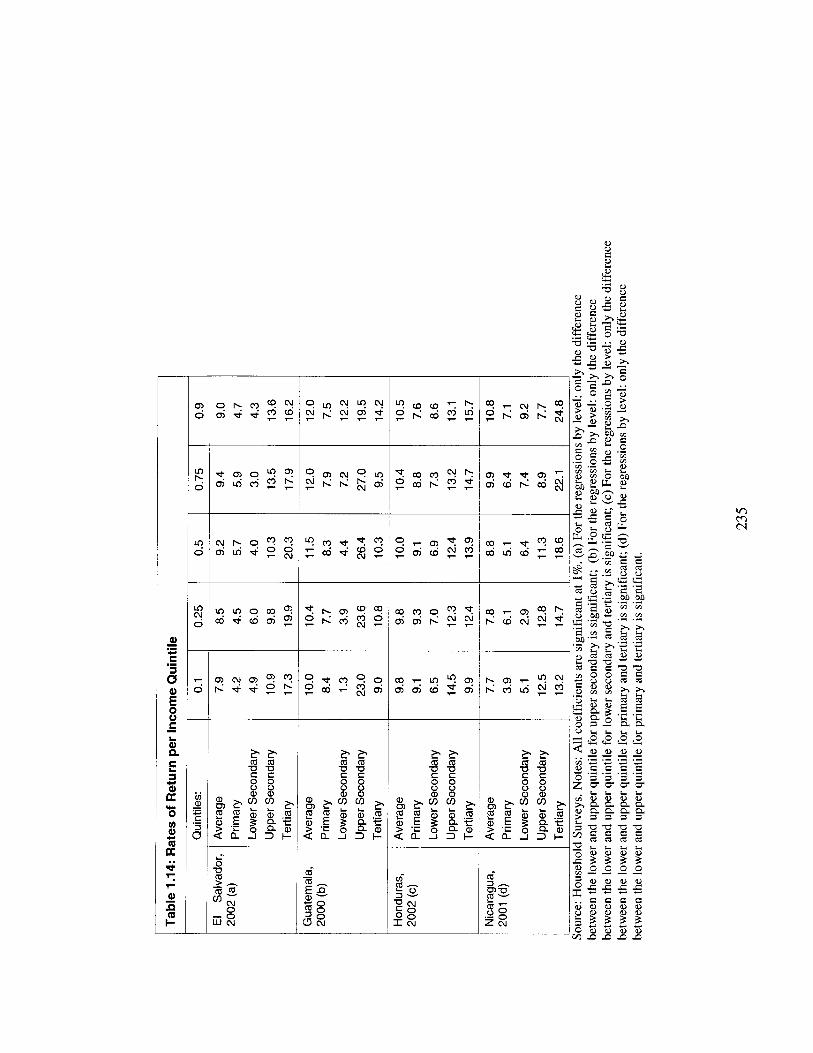
8 2 C
5 e, 5
L L L L e , e , e , e ,
0 0 0 0 3 3 3 3 - - e -
8 8 8 8 e , e , e , e , e , e , e , e ,
e , e , e , e , a C ) D C ) D I ,
3 3 3 3 C l C Y Y
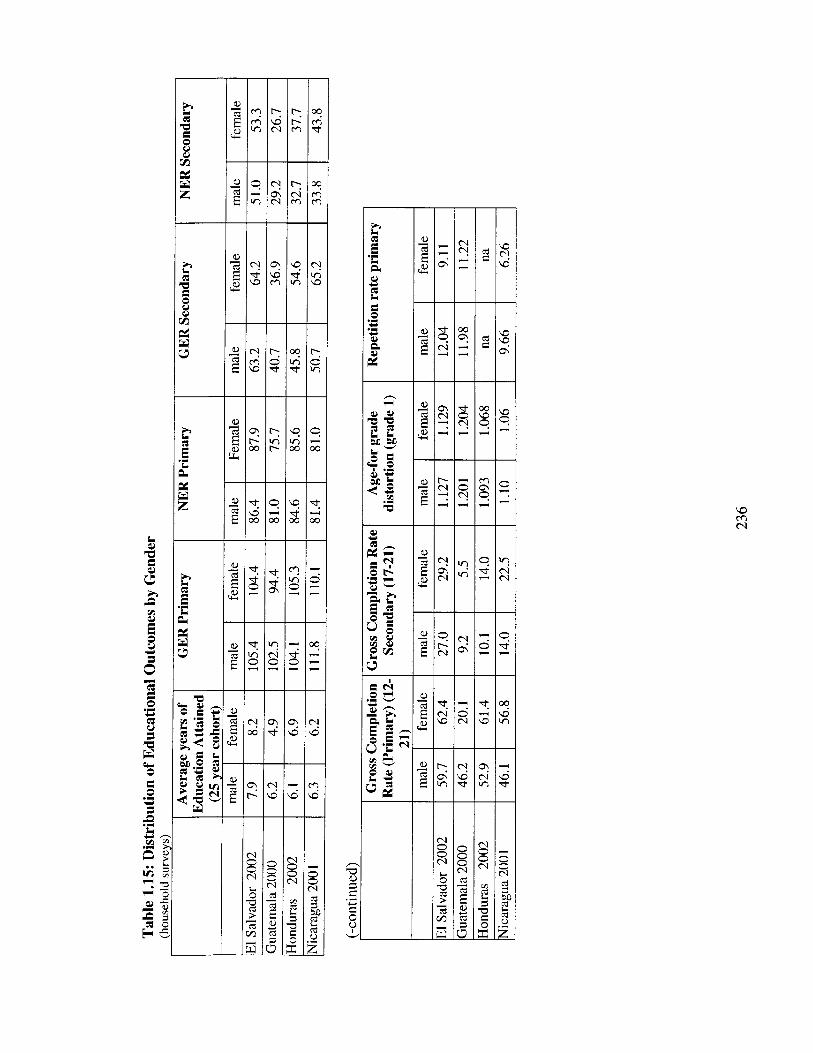
2
8 r x
Q a c
E 2
h h Q a e 8 x E 13
2,
k .L B i3 2
x h
.L B E k L7
L

Average years of Education Attained (25 year
Guatemala Honduras Nicaragua 2000 2002 2001
Non Indig Indig Non Indig Indig Non Indig Indig 6.57 3.59 6.55 5.29 6.31 5.54
GER Primary NER Primary GER Secondary
104.39 90.74 108.23 103.56 11 1.47 107.01 83.96 70.89 87.39 84.15 8 1.75 77.07 48.95 23.92 53.08 33.08 59.10 45.72
NER Secondary Gross Completion Rate Primary (cohort 12-21) Gross Completion Rate Secondary (cohort 17-21)
I 1 18 years cohort 1 25 years cohort 1 35 years cohort I
36.03 16.13 36.60 20.72 39.98 26.64 54.24 26.88 60.06 42.05 52.60 39.03 13.44 5.31 13.73 5.53 18.80 1 1.02
I Guatemala, 2000 1 68 I 37 1 56 1 28 I 49 116 I
- Repetition rate primary 10.63 13.19 na na a .07 7.14 Rate of Return of an additional year o f schooling 11.44 10.36 na na 9.25 9.28
[ Not Indig. 1 Indig. 1 Not Indig. 1 Indig.
237
Not Indig. 1 Indig.
Honduras, 2002
Nicaragua, 2001
70 48 65 50 58 23
54 64 57 51 44 67
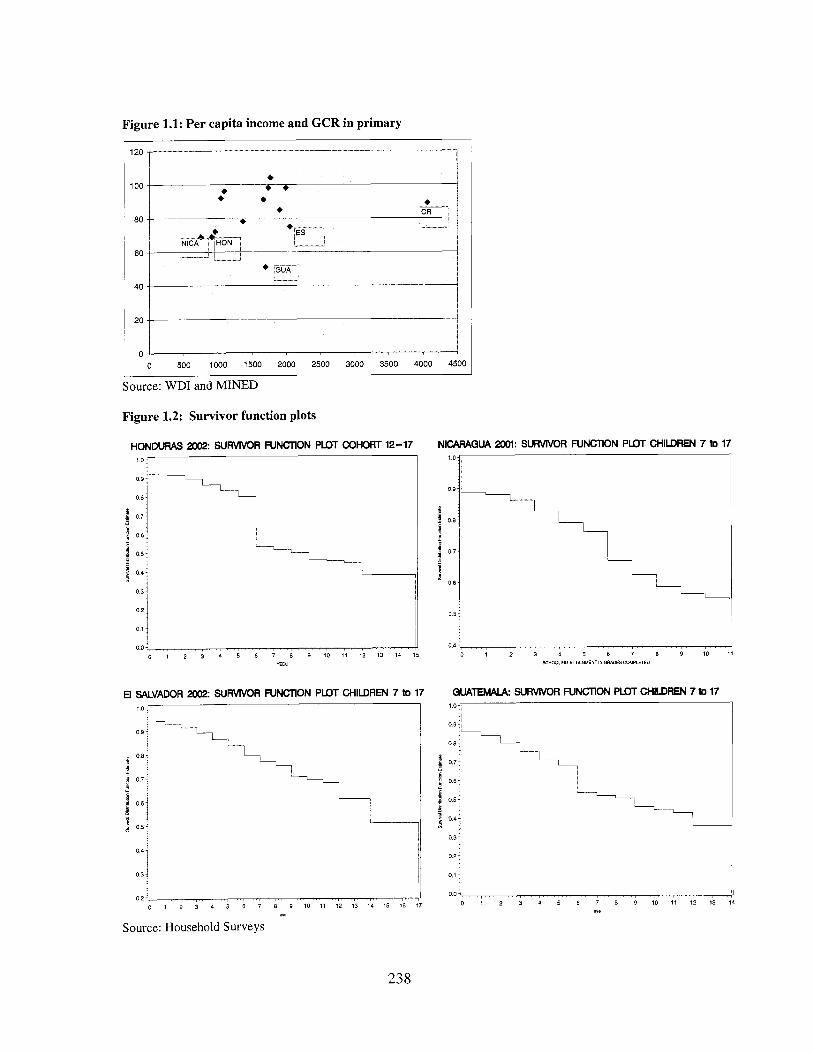
Figure 1.1: Per capita income and GCR in primary
~ 0 500 1000 1500 2000 2500 3000 3500 4000 4500
Source: WDI and MINED
Figure 1.2: Survivor function plots
HONDURAS 2002: SURVIVOR FUNCTION PLOT COHORT 12-17 1.0:
, .._
i i 9 0.81 0.7
g 0.81 L . c .
b k-. 0.5:
$ 0.4; 1 2 -
u i i
:I 0 1 4
0.0 - , - 0 1 2 3 4 5 6 7 8 9 1 0 1 1 1 2 1 3 1 4
E D "
El SALVADOR 2002: SURVNOR FUNCTION PLOT CHILDREN 7 to 17 1.0:
.- .
- --k 0.9 j
i
0 2 - , , , , , , , , , , , , , , , , , , , , , , , , , , , , , , , , , , , , , , , , , , . , , , , . , , , , , , , , , , , , , , , , -
0 1 2 3 4 5 6 7 6 9 1 0 1 1 1 2 1 3 1 4 1 5 1 6 1 7 'Ye
Source: Household Surveys
NlCARAGUA 2001: SURVIVOR NNCTION PLOT CHILDREN 7 to 17
i 0.4 , . . , , , , , , , . , , , , , , , , . . , , , , , , . , . , , , , . . , , , , , , , ,
0 1 2 3 4 5 6 7 8 9 10 S C H M U M AlTAINMENTIN WDESCOMPLETED
GUATEMALA: SURVNOR NNCTlON PLOT CHILDREN 7 to 17
0 9 o2
0 0 . . . . . . . . . . . . . . . . . . . . . . . . . . . , , , , , , , , , , , , , , , , , , . , , , , , ,
0 1 2 3 4 5 6 7 8 9 10 11 12 13 '"*
238
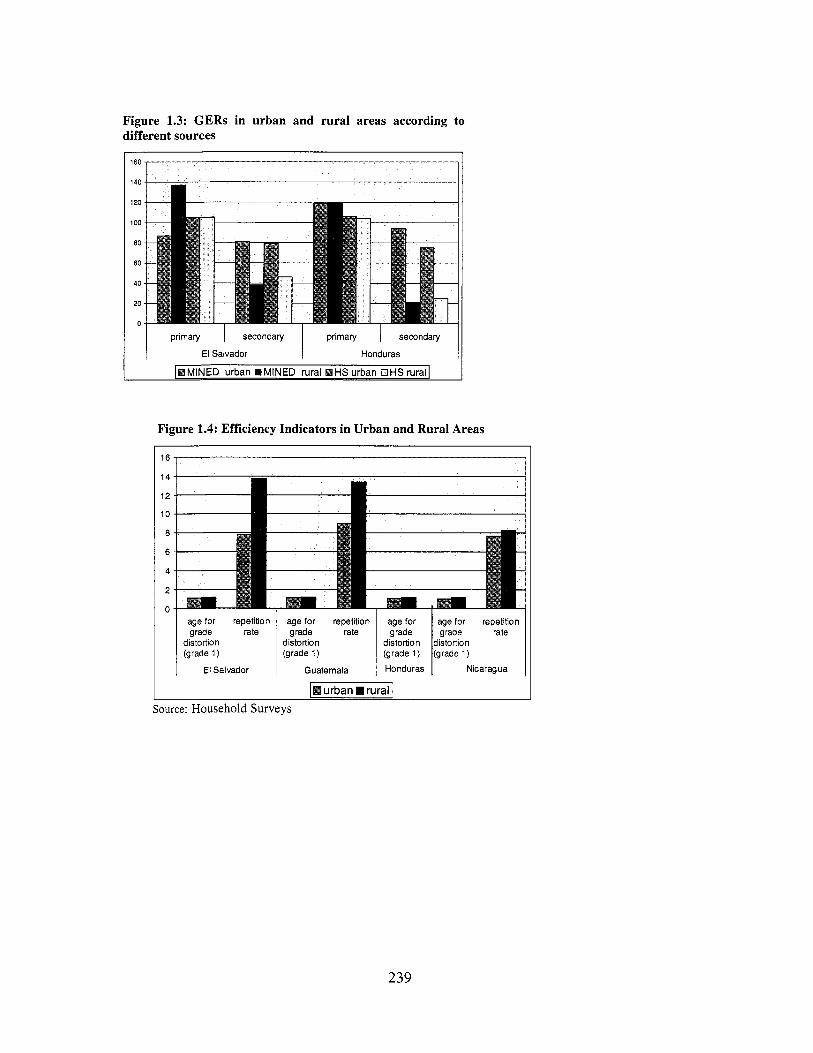
Figure 1.3: GERs in urban and rural areas according to different sources
age for repetition grade rate
distortion (grade 1)
El Salvador
primary I secondary primary 1 secondary
El Salvador
age for repetition age for age for repetition grade rate grade grade rate
distortion distortion distortion (grade 1) (grade 1) (grade 1)
Guatemala Honduras Nicaragua
Figure 1.4: Efficiency Indicators in Urban and Rural Areas
14
12
10
8
6
4
2
0
Source: Household Surveys
239
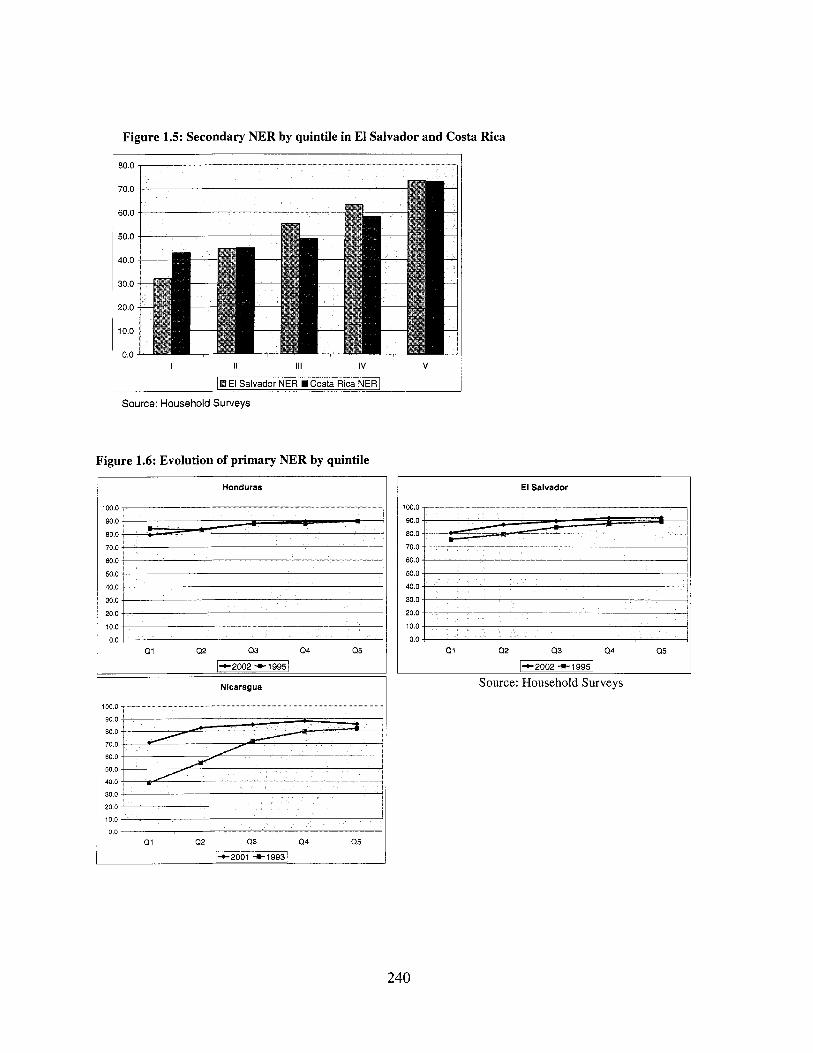
Figure 1.5: Secondary NER by quintile in El Salvador and Costa Rica
50.0
40.0
~ 80.0 1
200 -.
1 0 0 -
I 1
I
I II 111 IV V
/BE1 Salvador NER mCosta Rica NERI
Source: Household Suweys
Figure 1.6: Evolution of primary NER by quintile
Honduras
I 900
800- .
4 a o i
30 0
1+2002 3- 1995 1 Nicaragua
~ 1 0 0 0 -
60 0
50 0
~ ::: 1 :::
0 0 Qi Q2 Q3 04 0 5
I 1+2001 3-19931
El Salvador
900
80 0
70 0
60 0
50 0
400
30 0
20 0
i o 0
0 0 Qi Q2 Q3 Q4 Q5
/+ZOO2 3-19951
Source: Household Surveys
240
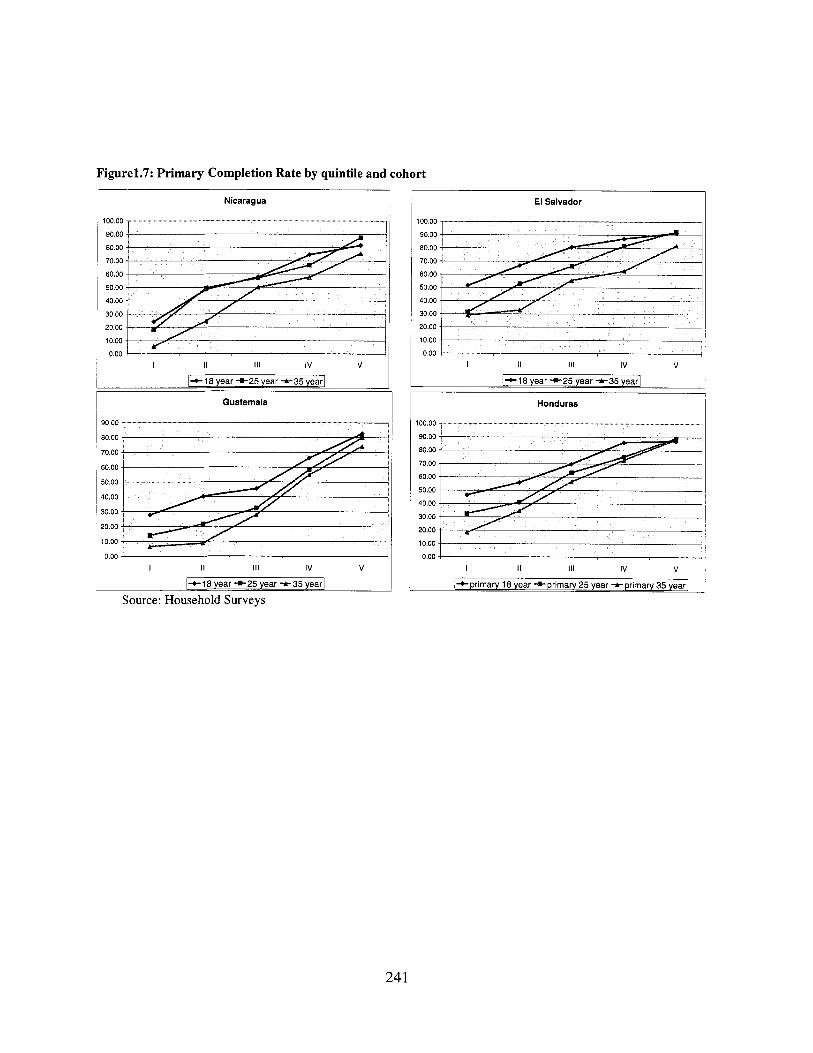
I I Nicaragua
i o 0 00
90 00
80 00
70 00
60 00
50 00
40 00
30 00
20 00
io00
0 00 I II 111 IV V
El Salvador
10000 I I
1 [+I8 year +25 year +35 year]
90 00
80 00
70 00
60 00
50 00
40 00
30 00
20 00
10 00
0 00 I II 111 IV V
1+18year+25year-t35yearI
I I+ 18 year +25 year -t 35 year I
Honduras Guatemala I
1 /+primary 18 year *primary 25 year +primary 35 year]
90 00
~ 8000
~ 4000
70 00
60 00
50 00
1 3000
20 00
i o 0 00
90 00
80 00
70 00
60 00
50 00
40 00
30 00
20 00
i o 00
0 00
I II 111 IV V
24 1
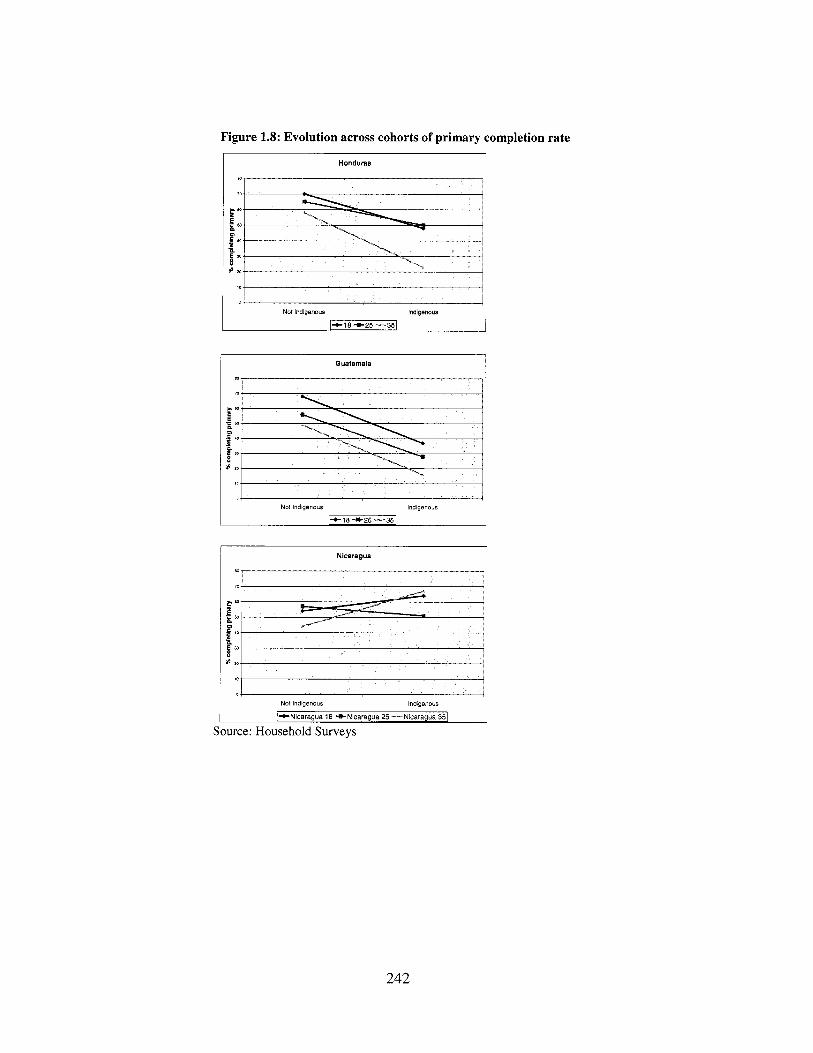
Figure 1.8: Evolution across cohorts of primary completion rate
Honduras
I
Not Indigenous Indigenous
/+I8 +25 1 - 3 5 ]
Guatemala I
E’ s P I O
B
F M
E a 8 8 so
Not Indigenous Indigenous
[+ la +25 -351
Nicaragua
W
E ”
E t o
Z W
E ” D1
- P
ae re
Not Indigenous Indigenous
[+Nicaragua I 8 +Nicaragua 25 -Nicaragua 351
Source: Household Surveys
242
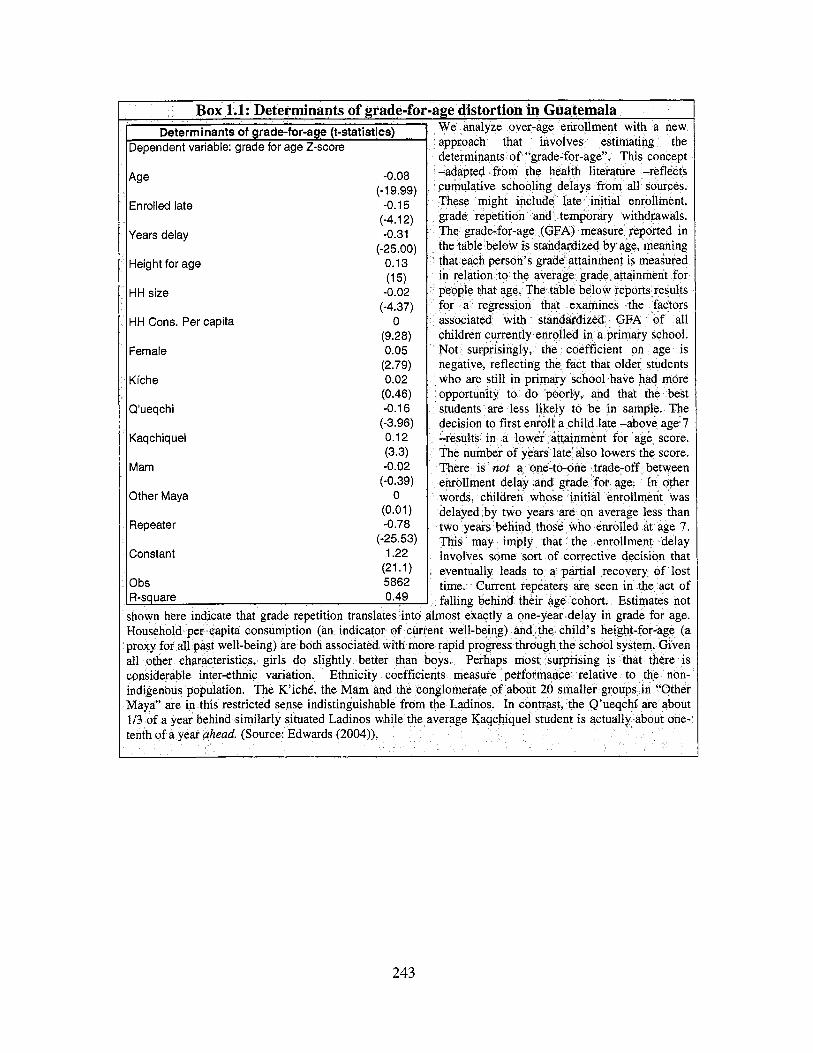
Box 1.1: Determinants of grade-foi r Determinants of grade-for-age (t-statistics) I Dependent variable: grade for age Z-score
Enrolled late
Years delay
Height for age
HH size
HH Cons. Per capita
Female
Kiche
Q'ueqchi
Kaqchiquel
Mam
Other Maya
Repeater
Constant
Obs
-0.08 (-1 9.99)
-0.15 (-4.1 2) -0.31
(-25.00) 0.13
-0.02
0 (9.28) 0.05
(2.79) 0.02
(0.46) -0.1 6
(-3.96) 0.12 (3.3) -0.02
(-0.39) 0
-0.78 .25.53) 1.22
5862
(1 5)
(-4.37)
(0.01)
(21.1)
I R-square 0.49 that grade repetition transla
pita consumption (an indicato well-being) are both associated
istics, girls do slightly bette ethnic variation. Ethnicity
tion. The K'ichb, the Mam an stricted sense indistinguishable fron
1/3 of a year behind similarly situated Ladinos while the
tge distortion in Guatemala analyze ove lment new oach that esti the
tenth of ead. (Source: Edwards (2004)).
243
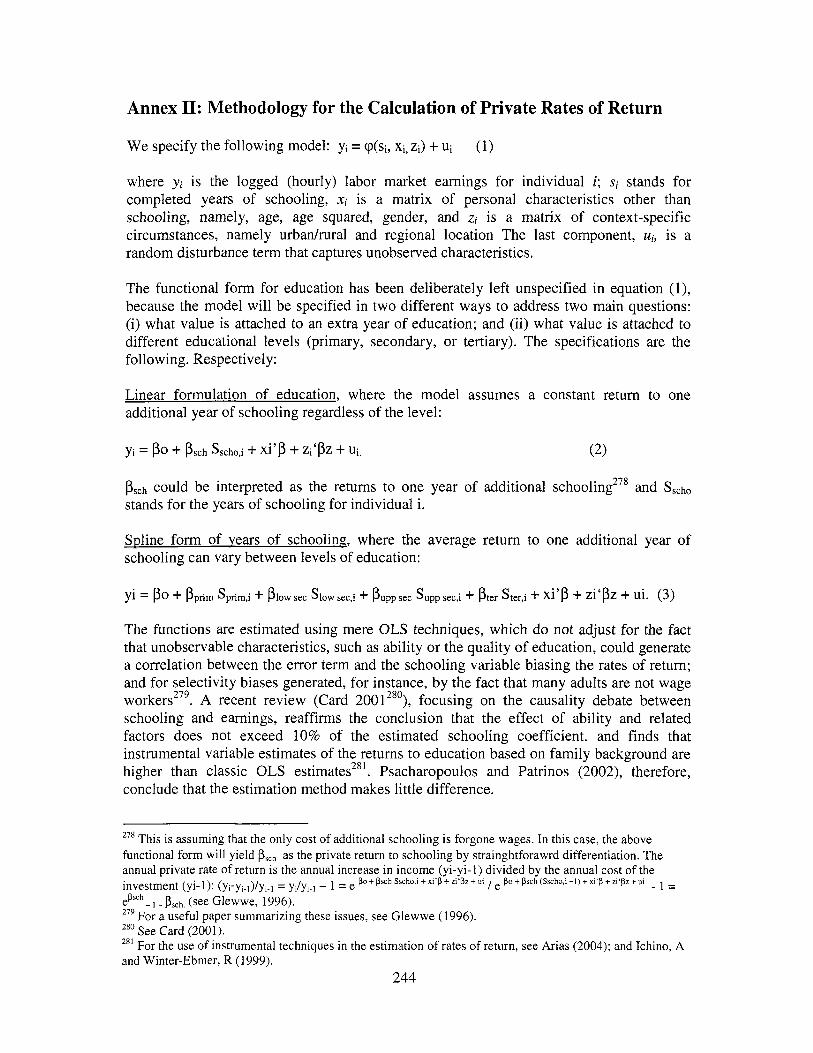
Annex 11: Methodology for the Calculation of Private Rates of Return
We specify the following model: yi = Cp(Si, Xi, Zi) + Ui (1)
where yi i s the logged (hourly) labor market earnings for individual i ; si stands for completed years o f schooling, Xi i s a matrix o f personal characteristics other than schooling, namely, age, age squared, gender, and zi is a matrix o f context-specific circumstances, namely urbanhra l and regional location The last component, ui, is a random disturbance term that captures unobserved characteristics.
The functional form for education has been deliberately left unspecified in equation (l), because the model w i l l be specified in two different ways to address two main questions: (i) what value i s attached to an extra year o f education; and (ii) what value i s attached to different educational levels (primary, secondary, or tertiary). The specifications are the following. Respectively:
Linear formulation o f education, where the model assumes a constant return to one additional year o f schooling regardless o f the level:
psch could be interpreted as the returns to one year o f additional schooling278 and Sscho stands for the years o f schooling for individual i.
Spline form o f Years o f schooling, where the average return to one additional year of schooling can vary between levels o f education:
The functions are estimated using mere OLS techniques, which do not adjust for the fact that unobservable characteristics, such as ability or the quality o f education, could generate a correlation between the error term and the schooling variable biasing the rates o f return; and for selectivity biases generated, for instance, b y the fact that many adults are not wage workers279. A recent review (Card 2001280), focusing on the causality debate between schooling and earnings, reaffirms the conclusion that the effect o f ability and related factors does not exceed 10% o f the estimated schooling coefficient. and finds that instrumental variable estimates o f the returns to education based on family background are higher than classic OLS estimates281. Psacharopoulos and Patrinos (2002), therefore, conclude that the estimation method makes little difference.
278 This i s assuming that the only cost o f additional schooling i s forgone wages. In this case, the above functional form wi l l yield Psch as the private return to schooling by strainghtforawrd differentiation. The annual private rate o f return i s the annual increase in income (yi-yi-1) divided by the annual cost o f the investment (yi-I): (yi-yi.l)/yi.l = yJyi.1 - 1 = e ePsch-, - Psch. (see Glewwe, 1996). 279 For a useful paper summarizing these issues, see Glewwe (1996). 280 See Card (2001). 281 For the use o f instrumental techniques i n the estimation of rates o f return, see Arias (2004); and Ichino, A and Winter-Ebmer, R (1999).
244
Po + Psch Sscho,i + xi 'p + zi'pz + ui / e Po + Psch (Sscho,i -1) + xi'p + zi 'pz + ui - =
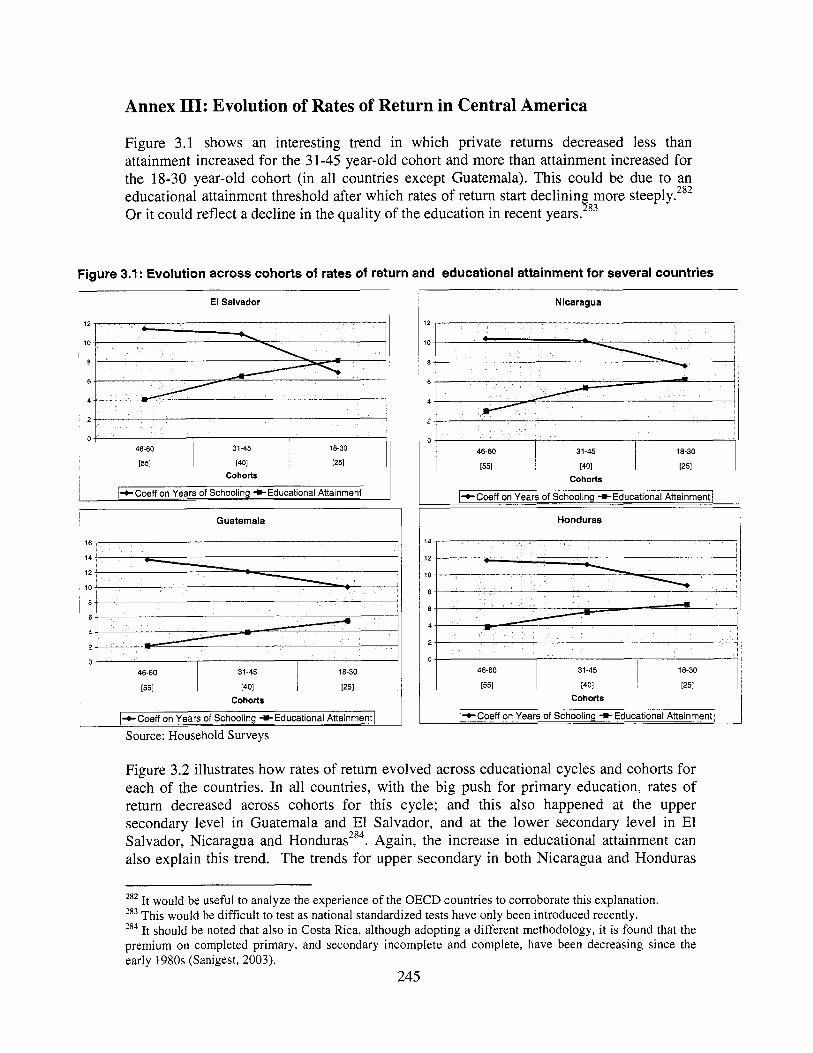
Annex 111: Evolution of Rates of Return in Central America
31-45 18-30
Figure 3.1 shows an interesting trend in which private returns decreased less than attainment increased for the 31-45 year-old cohort and more than attainment increased for the 18-30 year-old cohort (in all countries except Guatemala). This could be due to an educational attainment threshold after which rates o f return start declinin more steeply?82 Or i t could reflect a decline in the quality o f the education in recent years. f 8 3
18-30
Figure 3.1: Evolution across cohorts of rates of return and educational attainment for several countries
El Salvador
10
I : 4
2 ! I
I Guatemala
16
14
12
10
8
6
4
2
0
Cohorts
l+Coeff on Years of Schooling +Educational Attainment)
Source: Household Surveys
Nicaragua
12
10
8
Honduras I
4
2
46-60 31-45 18-30 I I551 j WI I [251 Cohorts
/+Coeff on Years of Schooling +Educational Attainment]
Figure 3.2 illustrates how rates of return evolved across educational cycles and cohorts for each o f the countries. In al l countries, wi th the big push for primary education, rates o f return decreased across cohorts for this cycle; and this also happened at the upper secondary level in Guatemala and El Salvador, and at the lower secondary level in El Salvador, Nicaragua and Honduras284. Again, the increase in educational attainment can also explain this trend. The trends for upper secondary in both Nicaragua and Honduras
282 I t would be useful to analyze the experience o f the OECD countries to corroborate this explanation. 283 This would be difficult to test as national standardized tests have only been introduced recently. 284 I t should be noted that also in Costa Rica, although adopting a different methodology, it i s found that the premium on completed primary, and secondary incomplete and complete, have been decreasing since the early 1980s (Sanigest, 2003).
245
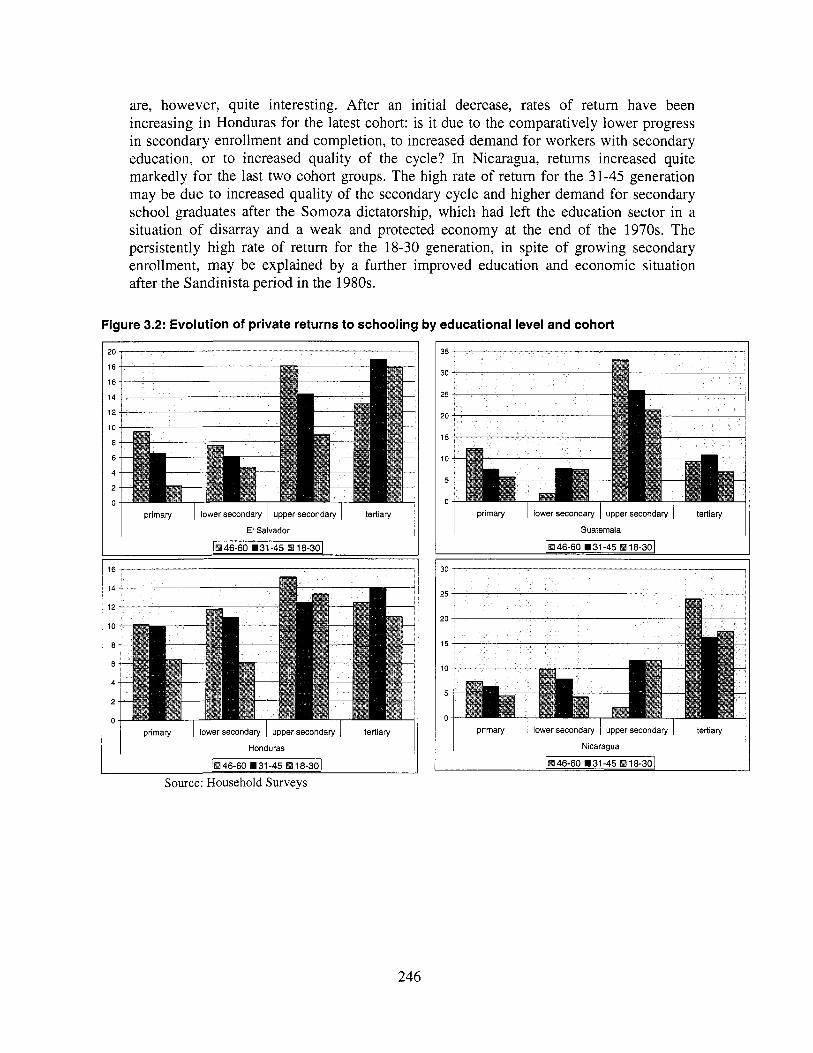
are, however, quite interesting. After an initial decrease, rates o f return have been increasing in Honduras for the latest cohort: i s i t due to the comparatively lower progress in secondary enrollment and completion, to increased demand for workers with secondary education, or to increased quality o f the cycle? In Nicaragua, returns increased quite markedly for the last two cohort groups. The high rate o f return for the 31-45 generation may be due to increased quality o f the secondary cycle and higher demand for secondary school graduates after the Somoza dictatorship, which had left the education sector in a situation o f disarray and a weak and protected economy at the end o f the 1970s. The persistently high rate o f return for the 18-30 generation, in spite o f growing secondary enrollment, may be explained by a further improved education and economic situation after the Sandinista period in the 1980s.
Figure 3.2: Evolution of private returns to schooling by educational level and cohort
18
16
14
12
10
8
6
4
2
0 primary I lower secondary I upper secondary I tertiary
El Salvador
14
12
10
8
6
4
2
0 primary 1 lower secondary 1 upper secondary 1 tertiary
Honduras
Source: Household Surveys
30
25
20
15
10
5
0 primary I lower secondary 1 upper secondary I tertiary
Guatemala
I 3 0 I I
25
20
15
10
5
0 primary 1 lower secondary 1 upper secondary 1 tertiary
246
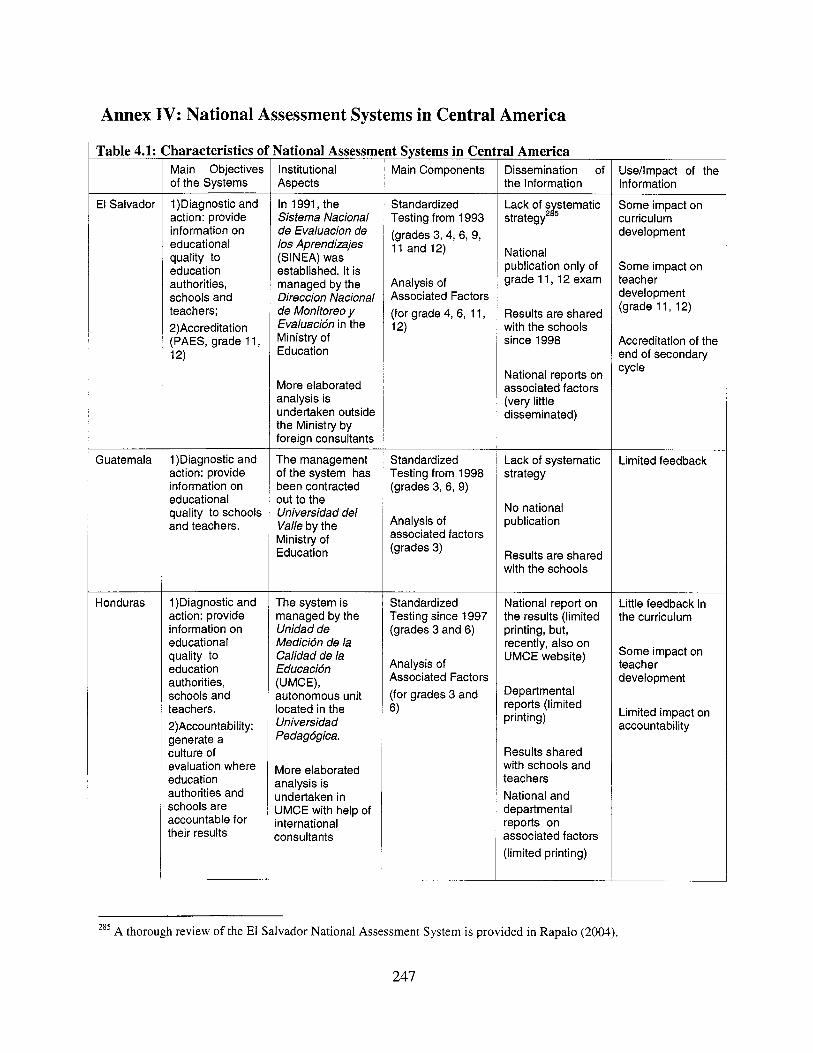
Annex IV: National Assessment Systems in Central America
Table 4.1:
El Salvador
Guatemala
Honduras
lharacteristics a Main Objectives of the Systems
1)Diagnostic and action: provide information on educational quality to education authorities, schools and teachers; 2)Accreditation (PAES, grade 11, 12)
1)Diagnostic and action: provide information on educational quality to schools and teachers.
1)Diagnostic and action: provide information on educational quality to education authorities, schools and teachers. 2)Accountability: generate a culture of evaluation where education authorities and schools are accountable for their results
gational Assessment Svstems in Central America Institutional Aspects
In 1991, the Sistema Nacional de Evaluacion de 10s Aprendizajes (SINEA) was established. It is managed by the Direccion Nacional de Monitoreo y Evaluacidn in the Ministry of Education
More elaborated analysis is undertaken outside the Ministry by foreign consultants
The management of the system has been contracted out to the Universidad del Vale by the Ministry of Education
The system is managed by the Unidad de Medicion de la Calidad de la Educacidn : U MC E), 3utonomous unit ocated in the Yniversidad Dedagdgica.
vlore elaborated malysis is indertaken in JMCE with help of nternational :onsultants
Main Components
Standardized Testing from 1993 (grades 3, 4, 6, 9, 11 and 12)
Analysis of Associated Factors (for grade 4, 6, 11, 12)
Standardized Testing from 1998 (grades 3, 6, 9)
Analysis of associated factors (grades 3)
Standardized Testing since 1997 (grades 3 and 6)
Analysis of Associated Factors (for grades 3 and 6)
Dissemination of the Information
Lack of s stematic strategq 8:
National publication only of grade 1 1,12 exam
Results are shared with the schools since 1998
National reports on associated factors (very little disseminated)
Lack of systematic strategy
No national publication
Results are shared with the schools
National report on the results (limited printing, but, recently, also on UMCE website)
Departmental reports (limited printing)
Results shared with schools and teachers National and departmental reports on associated factors (limited printing)
Use/lmpact of the Information
Some impact on curriculum development
Some impact on teacher development (grade 11, 12)
Accreditation of the end of secondary cycle
Limited feedback
Little feedback in the curriculum
Some impact on teacher development
Limited impact on accountability
285 A thorough review of the El Salvador National Assessment System i s provided in Rapalo (2004).
247
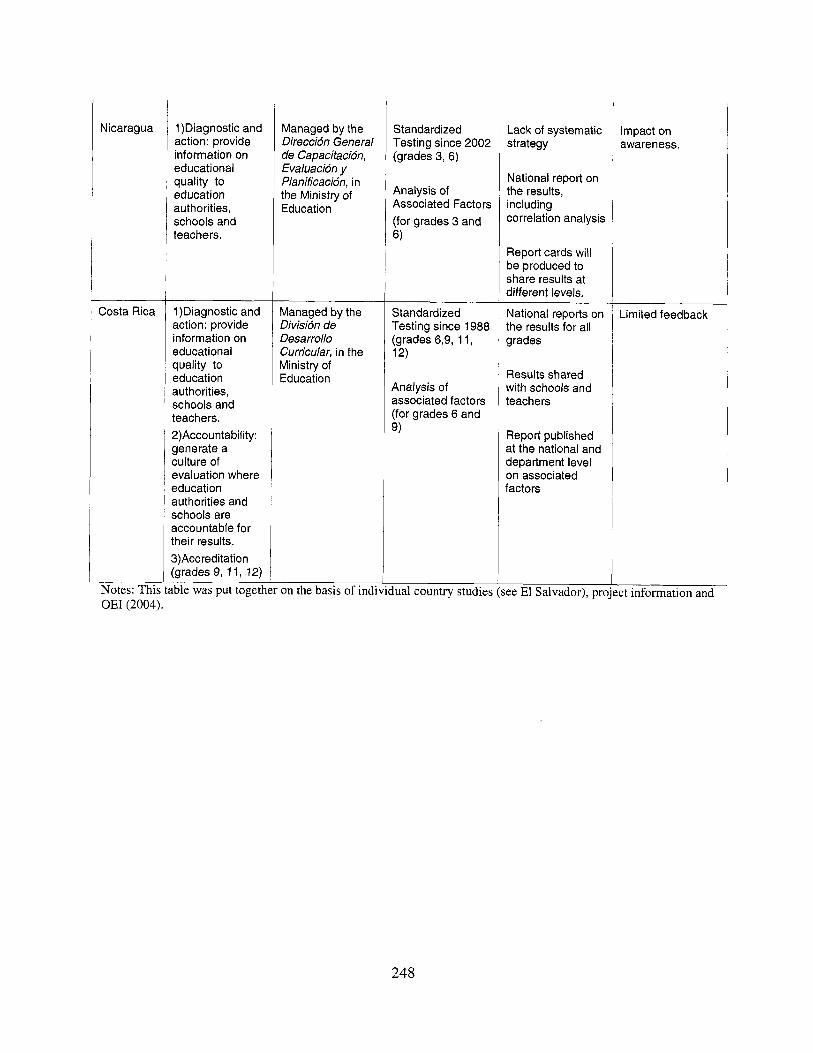
Nicaragua
Costa Rica
1)Diagnostic and action: provide information on educational quality to education authorities, schools and teachers.
1)Diagnostic and action: provide information on educational quality to education authorities, schools and teachers. 2)Accountability: generate a culture of evaluation where education authorities and schools are accountable for their results. 3)Accreditation :grades 9, 1 1, 12)
Managed by the Direccion General de Capacitacion, Evaluacion y Planificacidn, in the Ministry of Education
Managed by the Division de Desarrollo Curricular, in the Ministry of Education
Notes: This table was put together on the basis of indk OEI (2004).
Standardized Testing since 2002 (grades 3, 6 )
Analysis of Associated Factors (for grades 3 and 6)
~
Standardized Testing since 1988 (grades 6,9, 11, 12)
Analysis of associated factors (for grades 6 and 9)
lual country studies
Lack of systematic strategy
National report on the results, including correlation analysis
Report cards will be produced to share results at different levels.
National reports on the results for all grades
Results shared with schools and teachers
Report published at the national and department level on associated factors
:e El Salvador), pro
Impact on awareness.
Limited feedback
c t information and
248
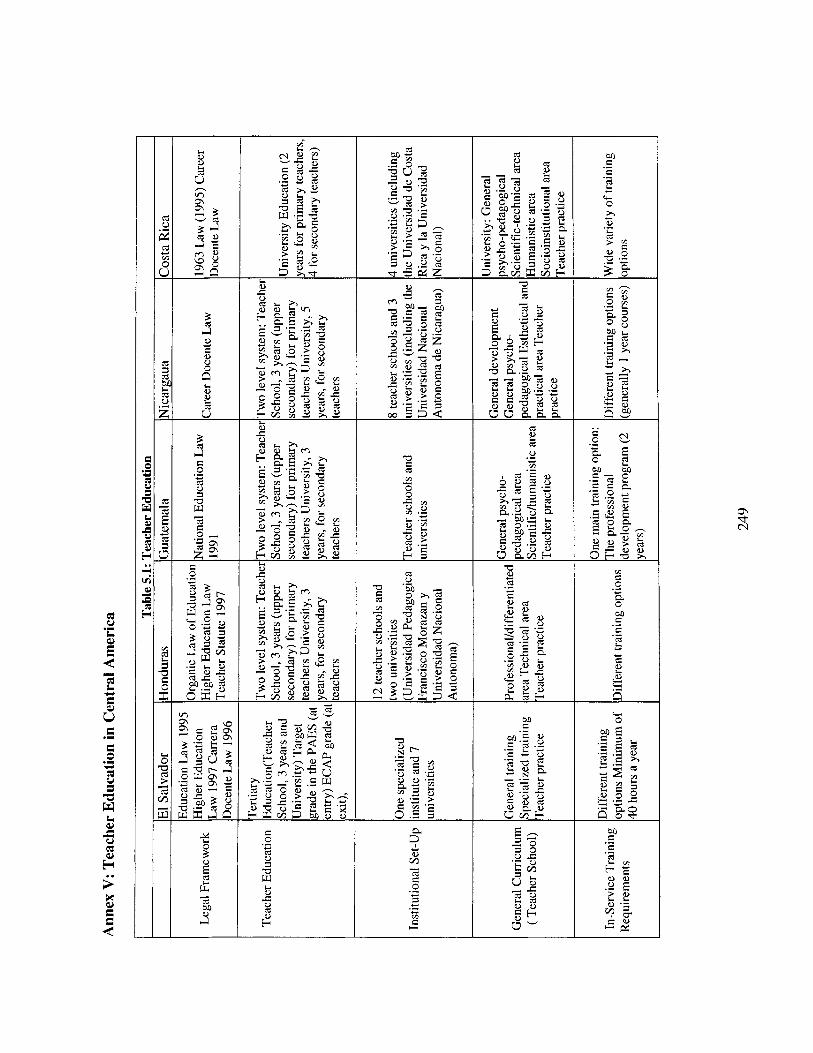
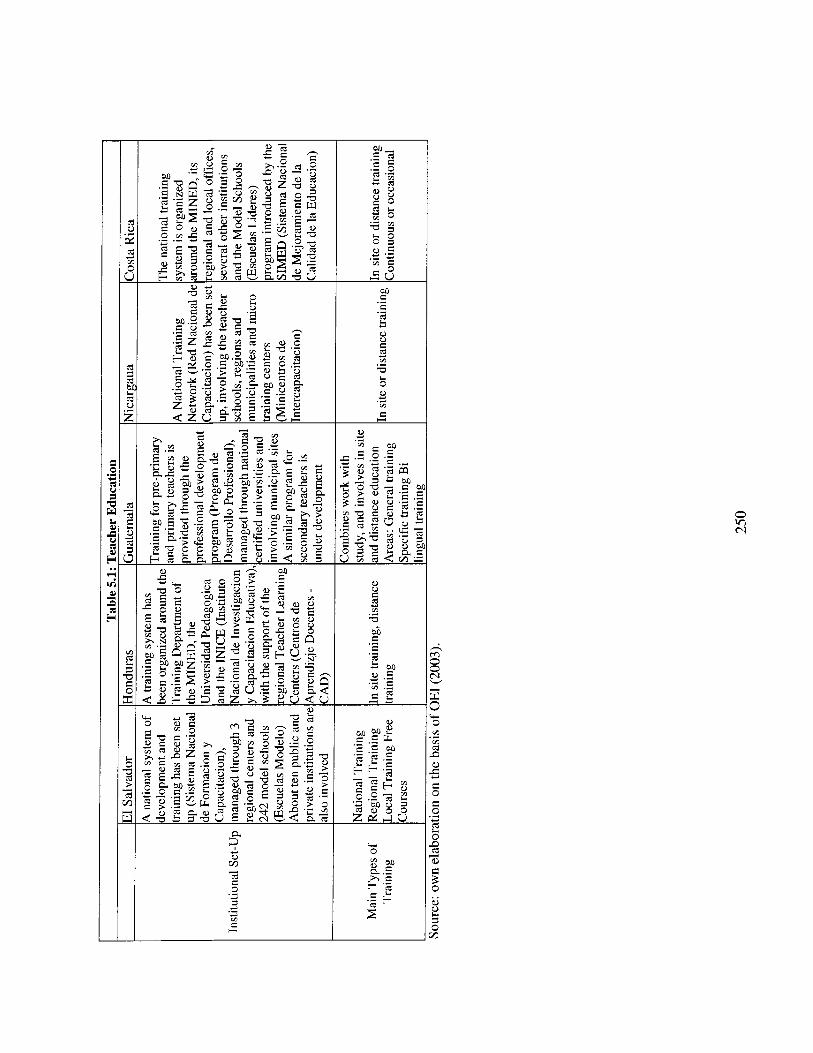
? i e,
L/1 - m C 0
f
v1 C w
.- Y
Y Y .-
on C C .- .- e,
cd 2 a Y m
6 3 .- v1
w C
e, 0 G cd Y m a
Y- O
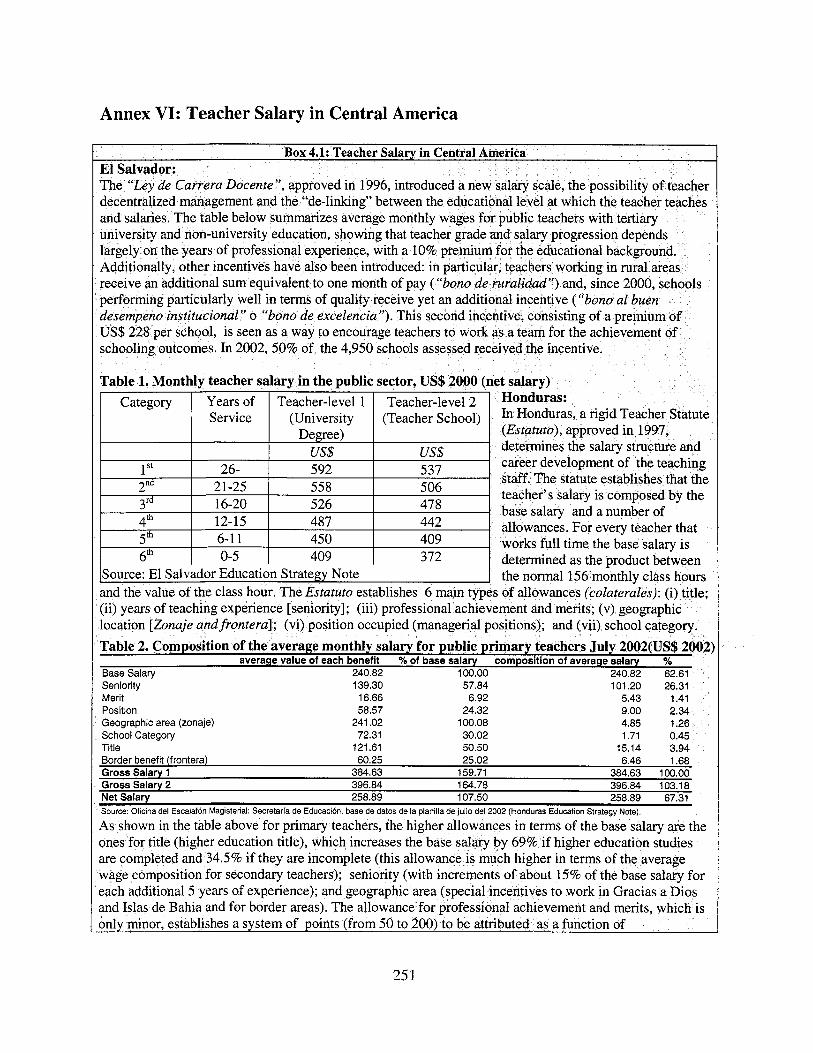
Annex VI: Teacher Salary in Central America
gement and the “de-linking” between the educ ble below summarizes average monthly wages
ich the teacher teaches
o f quality receive yet
works full time the base salary i s determined as the product between
Seniority Merit Position Geographic area (zonaje) School Category Title
139.30 57.84 16.66 6.92 58.57 24.32
241.02 100.08 72.31 30.02
121.61 50.50
101.20 26.31 5.43 1.41 9.00 2.34 4.85 1.26 1.71 0.45
15.14 3.94
each additional 5 years of experience); and geographic area
25 1

accomplishments l ike publications, participation in seminars, languages skil ls, etc.
ase salary for category A
on length of service. Since 2002, teachers
Source: Arcia
252

Annex VII: Curricular and Pedagogical Reforms in Central America
stent with the new rature, math, natura
months. The education hours in the academic
earning outcomes in studen
ce that most teachers do not teach more than four ho o f 133 days per
months, and 30 class hours per
286 See Shiefelbein (2004), which reports figures of about 500 class hours a year (however, based on old data). *” See Rubio, F (2000): “Presentation on the Status o f Bilingual Education”, MEDIR Project, USAID.
253
i n is t ry fully replaced. Th
contents and structure that had been established un
was overall an improvement over the past s ion of i t s different internal components and
~
288 See Di Gropello and Marshall (2004). 289 See Honduras-Secretary o f Education (2002): “Todos con educacion: Honduras 2003-201 5”, which reports up to 333 yearly hours (versus the official 1200 ones) in a worse case scenario. 290 See MECD (2004): “Politicas de educacion basica y media” - Version preliminar
254
Annex VIII: Methodological Aspects on the Analysis of Effective Schools in Honduras and Nicaragua
Data. The national assessment datasets used for the education production function studies reviewed earlier in this chapter were used for both Honduras and Nicaragua. In Honduras, the Ministry o f Education administered tests in Spanish, math, and science for both third and sixth graders along with surveys o f students, parents, teachers, and principals in a randomly chosen group of 1090 schools. In Nicaragua, one stratified random sample of roughly 250 schools for the third grade and another o f the same size for the sixth grade took Spanish and math exams and parents, students, teachers and principals completed surveys.
Effective and control schools. A group of “effective schools” and control group schools were then identified for each country. For Honduras, effective schools are defined as those schools that score at least three quarters o f a standard deviation below the mean on a constructed socio-economic status (SES) composite variable and at least three quarters of a standard deviation above the mean on a minimum of three o f the six exams. The control group of schools are simply the remainder o f schools whose SES index rank was three-quarters of a standard deviation or more below the mean. While this i s a somewhat rough method of choosing a control group, the effective and control groups were compared across multiple background indicators and appeared to be quite similar. In Nicaragua, there was not a sufficient number of schools that qualified as effective schools using the same criteria as Honduras. This i s probably at least in part due to the fact that the sample sizes were less than a quarter the size o f that of Honduras as separate samples took the third and sixth grade exams. Effective schools were therefore defined as those schools scoring at least one quarter o f a standard deviation above the mean on both exams and at least one quarter of a standard deviation below the mean on a constructed SES index. The control group was again defined as the remainder o f the schools with SES index rankings one quarter of a standard deviation below the mean. For the sixth grade schools a lower bound cut of f point was also established for the control group as without i t the effective and control groups were statistically significantly different on a number of background measures.
B y and large the background characteristics of the control group o f schools matched the background characteristics of the effective schools. We did not want to match schools on school characteristics as i t was those very characteristics that we wanted to observe for potential differences across high-performing and lower-performing low-income schools. At the same time we wanted to be sure that effective schools were not simply schools where parents had higher education levels, more access to services, or were located in more urban locations. Once creating the control groups we found no statistically significant differences between these types o f background indicators for any o f the groups under analysis.
Methodology of analysis. A series o f indexes were created for each data set using principal components analysis. These were based on the inter-correlation between related variables as well as on previous literature on identified characteristics o f high-
255

performing, low-income schools. Paired t-tests were then conducted on al l individual and composite variables to identify what characteristics were significantly different between the effective schools and the control groups. There were hundreds o f variables in each dataset, far to many to report here, so we have decided to only report those variables that were statistically significant as well as a few others that are interesting. There were a few variables that were statistically significant that are not reported here because they did not seem particularly enlightening or important.
256
Annex IX: Intercultural Bilingual Programs in Nicaragua and Honduras
al Education €3-
program i s limited, in part because the current a
itable education to
incorporated into EIB planning leaving scarce resources for program implementation. Issues s t i l l
291 L a Prensa (2004) and M E C D website. To be added that two Bank-funded projects support Intercultural and Bilingual Education program o f MECD. The APRENDE I1 (1999-2003) financed the construction of 58 new primary schools and 7 preschools, and the rehabilitation o f 21 schools on the Atlantic Coast. Likewise, the Social Investment Fund (FISE) has built and equipped approximately 170 schools (including Institutes) since 2000 on the Atlantic Coast region. 292 Forster and Martinez (2002).
257
requiring attention included EIB teacher training, national EIB leadership, EIB evaluation, and classroom implementationzg3 .
(ADEL-PEC); (v) a
reschools were organized se, a total of 222 PROHE
293 Forster and Martinez (2002); The World Bank (2002).
258

Annex X: Tables and Figures for Chapter I V
El Salvador (a)
Table 10.1: Recurrent Expenditure per Child and Student (in 2002 US $, unless otherwise specified)
Pre-primary Primary Secondary Tertiary
Exp. per Exp. per Exp. per Exp. per Exp. per Exp. per Exp. per Exp. per child student child student child student child student
66.8 171.8 180 217.8 69.5 260.7 55 246
Guatemala na 113 Na 142 na 184 na 684
Guatemala, 2001 34.5 110 133.9 145 24.9 184 97.6 549 -
Honduras, 2001
Nicaragua
IHonduras I 29.5 I 84.2 I 144.5 I 142 I 78.1 I 238.4 I na I na I 28.2 79.5 152.5 151.2 78.3 280.2 139.8 932.6
9.9 24 82.7 85.3 17.3 47.4 na na
HONDURAS 2003
~~
6 s t a R i c a 1 na I na I Na I 250 I na I 390 I na 1 7
NICARAGUA 2001 GUATEMALA 2000 EL SALVADOR 2002
Sources: Table 2 and MINED official enrollment data (except Costa Rica: Sanigest, 2004, and Honduras 2002: Household Survey). Notes: (a) Primary = basic and secondary = upper secondary.
Source: Household Surveys.
Source: Household Surveys.
259
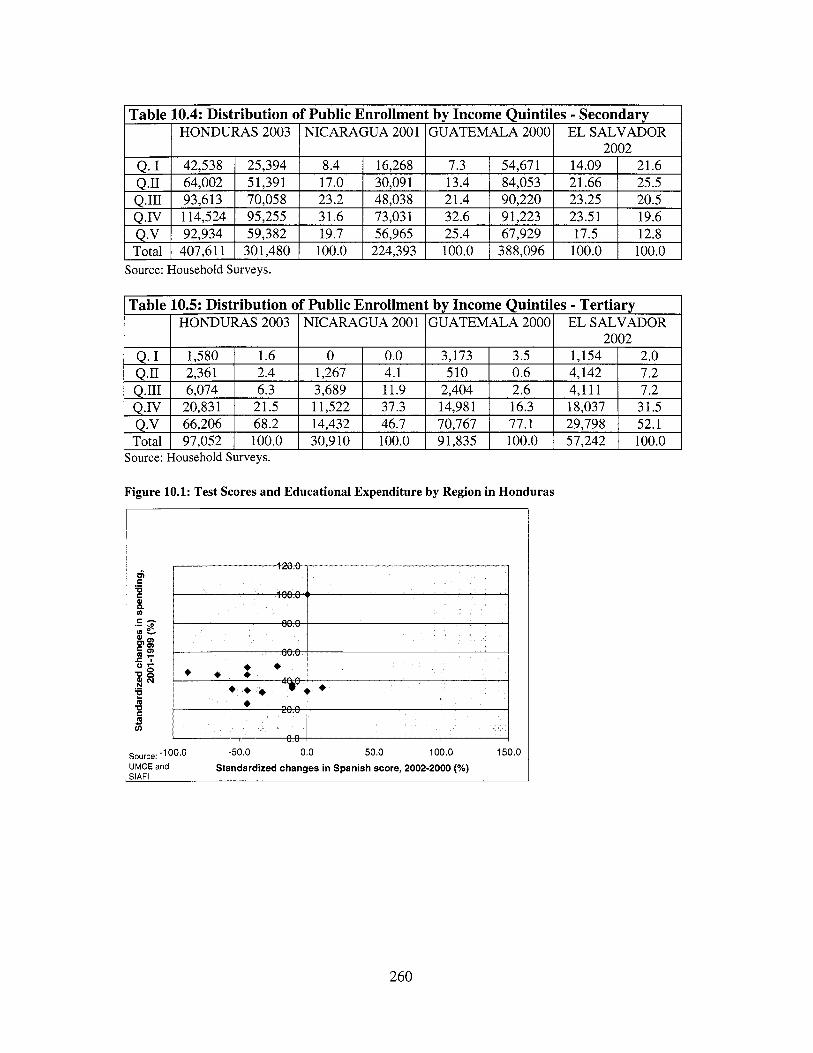
I Total I 407,611 I 301,480 I 100.0 I 224,393 I 100.0 I 388,096 I 100.0 I 100.0 I Source: Household Surveys.
Source: Household Surveys.
Figure 10.1: Test Scores and Educational Expenditure by Region in Honduras
* * * * * n n
n n "." I
-50.0 0.0 50.0 100.0 150.0 Source: -100.0 UMCE and SlAFl
Standardized changes in Spanish score, 2002-2000 (%)
260