Center on Urban & Metropolitan Policy Brookings Greater Washington Research Program
16
Center on Urban & Metropolitan Policy Brookings Greater Washington Research Program “Washington’s status as a magnet for new immigrants is a relatively new one.” FINDINGS ■ In 1998, the Washington metropol- itan area was the 5th most common destination for legal immigrants to the U.S. Only New York, Los Angeles, Chicago, and Miami were more popular. Between 1990 and 1998, nearly 250,000 immigrants from 193 countries and territories chose to live in the metropolitan area. ■ Washington’s recent immigrants are highly diverse—there is not a domi- nant country (or countries) of origin among the newcomers to the region. The largest single immigrant group— from El Salvador—comprises only 10.5 percent of the region’s newcomers. ■ Washington’s immigrants are not clustered into ethnically homoge- neous residential enclaves, but instead are dispersed throughout the region. Of the top ten immigrant zip codes, four each are located in Mary- land and Virginia, and two are in the District of Columbia. ■ In the 1990s, 87 percent of immi- grants to the region chose to live in the suburbs. Almost half (46 percent) of new immigrants located in commu- nities outside the Capital Beltway. Less than 13 percent moved to the District. ■ Asian immigrants are more likely to move to the outer suburbs, while Latin American and African immi- grants tend to live within the Beltway. The World in a Zip Code: Greater Washington, D.C. as a New Region of Immigration by Audrey Singer, Carnegie Endowment for International Peace, and Samantha Friedman, Ivan Cheung, and Marie Price, The George Washington University April 2001 • The Brookings Institution • Survey Series 1 I. Introduction T he Washington metropolitan area has, over the past decade, become one of the top immigrant destina- tions in the country, drawing the majority of its newcomers from Asia, Latin America, and Africa. Greater Washington ranks as the 6th largest metropolitan area of immigrant settlement, with over 800,000 foreign-born people living in the region. 1 In 1998, one person in six in the region was foreign-born, a striking contrast to 1970, when one out of every twenty-two residents was foreign-born. 2 According to the latest data available from the U.S. Immigration and Naturalization Service, in 1998, the Washington, D.C. metropolitan area ranked A study of recent INS data on immigration in the Washington region between 1990 and 1998 reveals that:
Transcript of Center on Urban & Metropolitan Policy Brookings Greater Washington Research Program

Center on Urban & Metropolitan Policy
Brookings Greater Washington Research Program
“Washington’s
status as a
magnet for new
immigrants is
a relatively
new one.”
FINDINGS
■ In 1998, the Washington metropol-itan area was the 5th most commondestination for legal immigrants tothe U.S. Only New York, Los Angeles,Chicago, and Miami were morepopular. Between 1990 and 1998,nearly 250,000 immigrants from 193countries and territories chose to livein the metropolitan area.
■ Washington’s recent immigrants arehighly diverse—there is not a domi-nant country (or countries) of originamong the newcomers to the region.The largest single immigrant group—from El Salvador—comprises only 10.5percent of the region’s newcomers.
■ Washington’s immigrants are notclustered into ethnically homoge-neous residential enclaves, butinstead are dispersed throughout theregion. Of the top ten immigrant zipcodes, four each are located in Mary-land and Virginia, and two are in theDistrict of Columbia.
■ In the 1990s, 87 percent of immi-grants to the region chose to live inthe suburbs. Almost half (46 percent)of new immigrants located in commu-nities outside the Capital Beltway. Lessthan 13 percent moved to the District.
■ Asian immigrants are more likely tomove to the outer suburbs, whileLatin American and African immi-grants tend to live within the Beltway.
The World in a Zip Code: Greater Washington, D.C. as a New Region of Immigrationby Audrey Singer, Carnegie Endowment for International Peace, and Samantha Friedman,Ivan Cheung, and Marie Price, The George Washington University
April 2001 • The Brookings Institution • Survey Series 1
I. Introduction
The Washington metropolitan areahas, over the past decade, becomeone of the top immigrant destina-tions in the country, drawing the
majority of its newcomers from Asia, LatinAmerica, and Africa. Greater Washingtonranks as the 6th largest metropolitan area of immigrant settlement, with over 800,000
foreign-born people living in the region.1
In 1998, one person in six in the region wasforeign-born, a striking contrast to 1970,when one out of every twenty-two residentswas foreign-born.2 According to the latest data available from the U.S. Immigration and Naturalization Service, in 1998, theWashington, D.C. metropolitan area ranked
A study of recent INS data on immigration in the Washington region between 1990 and1998 reveals that:

as the 5th most common destinationfor immigrants coming to the UnitedStates (see Table 1). Several zip codesin the metropolitan area includenewcomers from over 130 countries.
Washington’s status as a magnet fornew immigrants is a relatively newone. Unlike other large immigrantgateway cities, Greater Washington isnot built upon a rich history of immi-gration. Instead, the region began tobe a destination for newcomers to theUnited States after World War II,when Washington, D.C. changed froma purely national to an internationalcapital. Thus, there are few long-standing immigrant neighborhoods orenclaves.3 The absence of these areasbears directly on the settlement oftoday’s new arrivals and also has impli-cations for their social and economicintegration and on policies related toimmigrants’ settlement.4
This study documents the settle-ment patterns of recent immigrantsusing data from the U.S. Immigrationand Naturalization Service from 1990to 1998. By mapping the location ofimmigrants by zip code areas andcountry of origin, our research identi-fies the settlement patterns of recent
arrivals to the area. Specifically, wedocument the extent to which immi-grants are initially settling in the innersuburbs (within the Capital Beltway)versus the outer suburbs outside theBeltway. Next we examine recentimmigrants by region of origin. Lastly, we investigate whether newimmigrants are clustering among their co-ethnics5 or living in a moredispersed pattern.6
II. Methodology
This analysis is based uponadministrative data from theImmigration and Naturaliza-tion Service (INS) for fiscal
years 1990 to 1998. These data repre-sent all immigrants who were admittedas legal permanent residents (LPRs)during the period and who indicatedtheir intended residence to be theWashington metropolitan area, whichwe define as the following jurisdic-tions: the District of Columbia;Arlington, Fairfax, Loudoun, andPrince William counties and the citiesof Alexandria, Fairfax, Falls Church,Manassas, and Manassas Park inVirginia; and Charles, Frederick,Montgomery, and Prince George’s
counties in Maryland.7
Of the population in our study, 57 percent arrived from outside theUnited States with a valid immigrantvisa. Forty-three percent were alreadyin the United States in a temporarystatus and adjusted to legal permanentresidence after an average period ofstay in the United States of three years.Of those who adjusted their status,one-quarter changed from refugeestatus, and the rest adjusted from so-called nonimmigrant visas, such asstudent, visitor and worker visas.
Thus, these data constitute the flowof legal permanent immigrants intothe United States, or Green Cardrecipients. For each legal entrant, thedata include a zip code of intendedresidence, date of arrival, origincountry, age, sex, and visa type, but donot include employment status, educa-tional attainment, or householdincome information. These data alsoexclude undocumented immigrants,temporary immigrants and immigrantswho received legal permanent resi-dence through the 1986 ImmigrationReform and Control Act. We recognizethat undocumented immigrants areattracted to and reside in the metro-politan area, although there are nodata that exist to identify this popula-tion. There is evidence, however, thatthe residential patterns of the undocu-mented are similar to the legalimmigrant population.8 Even though asnapshot of the region’s immigrantpopulation in the 1990s using the INSdata is incomplete, we present themost detailed spatial analysis possiblegiven the limits of data.9
We present descriptive statisticsabout the residential choices of immi-grant newcomers to the Washingtonmetropolitan area. We then map immi-grants’ residential patterns accordingto their intended place of residence byzip code using Geographic Informa-tion Systems (GIS). The use of zipcode information for immigrants offersa far more recent rendering of immi-grant residential patterns than what is
April 2001 • The Brookings Institution • Survey Series2 CENTER ON URBAN & METROPOLITAN POLICY
Table 1: Top Ten Immigrant-Receiving Metropolitan Areas, 1998.
Metropolitan Area Immigrants admitted(from all countries)
New York, NY 82,175Los Angeles/Long Beach, CA 59,598Chicago, IL 30,355Miami, FL 28,853Washington, DC/MD/VA 24,032San Francisco, CA 14,540Oakland, CA 13,437Houston, TX 13,183Boston/Lawrence/Lowell/Brockton, MA 12,725San Jose, CA 12,656
Source: U.S. Immigration and Naturalization Service, 1999. Annual Report:
Legal Immigration, Fiscal Year 1998.

April 2001 • The Brookings Institution • Survey Series 3BROOKINGS GREATER WASHINGTON RESEARCH PROGRAM
available from the 1990 census, andgives us a preview of what 2000census data on foreign-born residentsmight reveal. However, we note thatusing zip code level data has severalimportant limitations. The first is thatzip codes vary in size, and severalincluded in this analysis have as manyas 50,000 people residing withinthem. The second is that we areunable to identify, within a zip code,where residential clustering may beoccurring. Third, zip codes are devel-oped for postal delivery and thereforedo not necessarily reflect meaningfulcommunity boundaries.
III. Findings
A. Washington’s recent immigrantsare highly diverse—there is not adominant country (or countries) of origin among the newcomers tothe region. Between 1990 and 1998, nearly one-quarter of a million immigrants from193 countries and territories chose the Washington metropolitan area astheir intended residence. The majorityof the newcomers are in their primeworking years, and thus are an important supply of new labor. Fully75 percent are 40 or younger, and the
mean age of the immigrant populationis 29. Twenty-five percent of therecent immigrants are under 18 years old. Of these recent arrivalsto the metropolitan area, 53 percentare female and 47 percent are male.
Figure 1 and Table 2 show thelargest immigrant groups who enteredthe United States between 1990 and1998 and chose Greater Washingtonas their intended residence. Out of themore than 240,000 legal immigrantswho came to live in the metropolitanarea during the 1990s, about half ofthem were from the following tencountries: El Salvador, Vietnam, India,
Figure 1Composition of New Immigrants in Washington Metropolitan Area by Country of Origin,
1990–1998
El Salvador10.5%
Vietnam7.4%
India5.5%
China4.6%
Philippines4.4%
South Korea4.1%
Ethiopia3.9%
Iran3.1% Pakistan
3.0%Peru2.9%
Former Soviet Union2.7%
Bolivia2.3%
Nigeria2.3%
Jamaica2.1%
Ghana2.0%
United Kingdom1.6%
Guatemala1.6%
Sierra Leone1.6%
Taiwan1.4%
Nicaragua1.3%
Mexico1.2%
Trinidad & Tobago1.1%
Bangladesh1.1%
Columbia1.0%
Afghanistan1.1%
Somalia1.1%
DominicanRepublic
1.1%
Other(166 countries)
24.0%
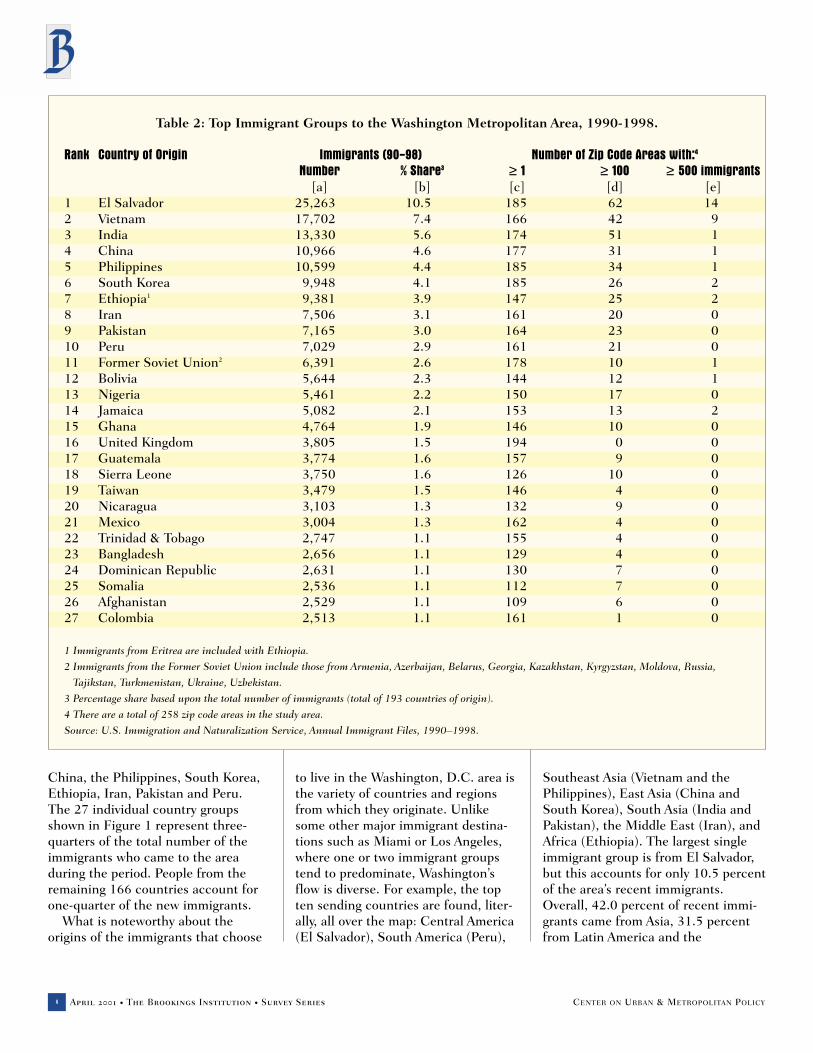
China, the Philippines, South Korea,Ethiopia, Iran, Pakistan and Peru. The 27 individual country groupsshown in Figure 1 represent three-quarters of the total number of theimmigrants who came to the areaduring the period. People from theremaining 166 countries account forone-quarter of the new immigrants.
What is noteworthy about theorigins of the immigrants that choose
to live in the Washington, D.C. area isthe variety of countries and regionsfrom which they originate. Unlikesome other major immigrant destina-tions such as Miami or Los Angeles,where one or two immigrant groupstend to predominate, Washington’sflow is diverse. For example, the topten sending countries are found, liter-ally, all over the map: Central America(El Salvador), South America (Peru),
Southeast Asia (Vietnam and thePhilippines), East Asia (China andSouth Korea), South Asia (India andPakistan), the Middle East (Iran), andAfrica (Ethiopia). The largest singleimmigrant group is from El Salvador,but this accounts for only 10.5 percentof the area’s recent immigrants.Overall, 42.0 percent of recent immi-grants came from Asia, 31.5 percentfrom Latin America and the
April 2001 • The Brookings Institution • Survey Series4 CENTER ON URBAN & METROPOLITAN POLICY
Table 2: Top Immigrant Groups to the Washington Metropolitan Area, 1990-1998.
Rank Country of Origin Immigrants (90-98) Number of Zip Code Areas with:4
Number % Share3 ≥ 1 ≥ 100 ≥ 500 immigrants[a] [b] [c] [d] [e]
1 El Salvador 25,263 10.5 185 62 142 Vietnam 17,702 7.4 166 42 93 India 13,330 5.6 174 51 14 China 10,966 4.6 177 31 15 Philippines 10,599 4.4 185 34 16 South Korea 9,948 4.1 185 26 27 Ethiopia1 9,381 3.9 147 25 28 Iran 7,506 3.1 161 20 09 Pakistan 7,165 3.0 164 23 010 Peru 7,029 2.9 161 21 011 Former Soviet Union2 6,391 2.6 178 10 112 Bolivia 5,644 2.3 144 12 113 Nigeria 5,461 2.2 150 17 014 Jamaica 5,082 2.1 153 13 215 Ghana 4,764 1.9 146 10 016 United Kingdom 3,805 1.5 194 0 017 Guatemala 3,774 1.6 157 9 018 Sierra Leone 3,750 1.6 126 10 019 Taiwan 3,479 1.5 146 4 020 Nicaragua 3,103 1.3 132 9 021 Mexico 3,004 1.3 162 4 022 Trinidad & Tobago 2,747 1.1 155 4 023 Bangladesh 2,656 1.1 129 4 024 Dominican Republic 2,631 1.1 130 7 025 Somalia 2,536 1.1 112 7 026 Afghanistan 2,529 1.1 109 6 027 Colombia 2,513 1.1 161 1 0
1 Immigrants from Eritrea are included with Ethiopia.
2 Immigrants from the Former Soviet Union include those from Armenia, Azerbaijan, Belarus, Georgia, Kazakhstan, Kyrgyzstan, Moldova, Russia,
Tajikstan, Turkmenistan, Ukraine, Uzbekistan.
3 Percentage share based upon the total number of immigrants (total of 193 countries of origin).
4 There are a total of 258 zip code areas in the study area.
Source: U.S. Immigration and Naturalization Service, Annual Immigrant Files, 1990–1998.

Caribbean, 16.2 percent from Africa,and the remaining 10.3 percent fromthe countries of Europe, Oceania andCanada. The level of immigration fromAsia is particularly significant, asWashington emerges as a major EastCoast destination for immigrants fromthat region.
B. Washington’s immigrants are notclustered into ethnically homoge-neous residential enclaves, butinstead are dispersed throughout theregion.Of the 258 metropolitan area zipcodes in our study, two-thirds had 50or more new arrivals. Only 23 werenot cited as intended areas of resi-dence, and many of these areinstitutional zip codes (used, forexample, by universities), and not onesin which one would expect to find anyresidents. Table 2 gives an initial indi-cation of the dispersion of immigrantsthroughout the metropolitan area’s258 zip codes (see columns c–e). Forexample, Salvadorans were found in185 zip code areas, 62 of which had
100 or more Salvadoran immigrants.There are also 14 zip code areas with500 or more recent Salvadoran immi-grants. Recent Indian immigrants werelocated in 174 zip code areas, 51 ofwhich had 100 or more Indians, andonly one zip code area had more than500 Indian immigrants. The results forimmigrants from the other 25 countrygroups show similar patterns of disper-sion. What these findings suggest isthat immigrants from each country oforigin group are not clustering, butinstead are scattered throughout themetropolitan area.
The zip code areas that attract highpercentages of immigrants are some ofthe most ethnically diverse locations inthe metropolitan area. Within thesepopular immigrant zip codes, it iscommon to have over 100 countries oforigin represented among newcomers.Table 3 shows the top ten immigrantdestinations by zip code. In addition toshowing the number of immigrants tothe zip code, it shows what percentagethey comprise of all recent immigrantsto the metropolitan area. For example,
the 7,823 recent immigrants to SouthArlington’s 22204 represent 3.3percent of the entire immigrant flowto the Washington metropolitan area.The last column in Table 3 indicatesthe percentage of foreign-born residents living in the zip code at thetime of the 1990 census, which is the“stock” of immigrants who were livingin each particular zip code prior to thearrival of the newcomers representedin the INS data. At the high end of therange is 22041 in Bailey’s Cross-roads/Seven Corners, where more than41 percent of the residents wereforeign-born in 1990. In the District’sPetworth area (20011 zip code), fewerthan 10 percent of the 1990 residentswere foreign-born, marking it as animmigrant destination on the rise.
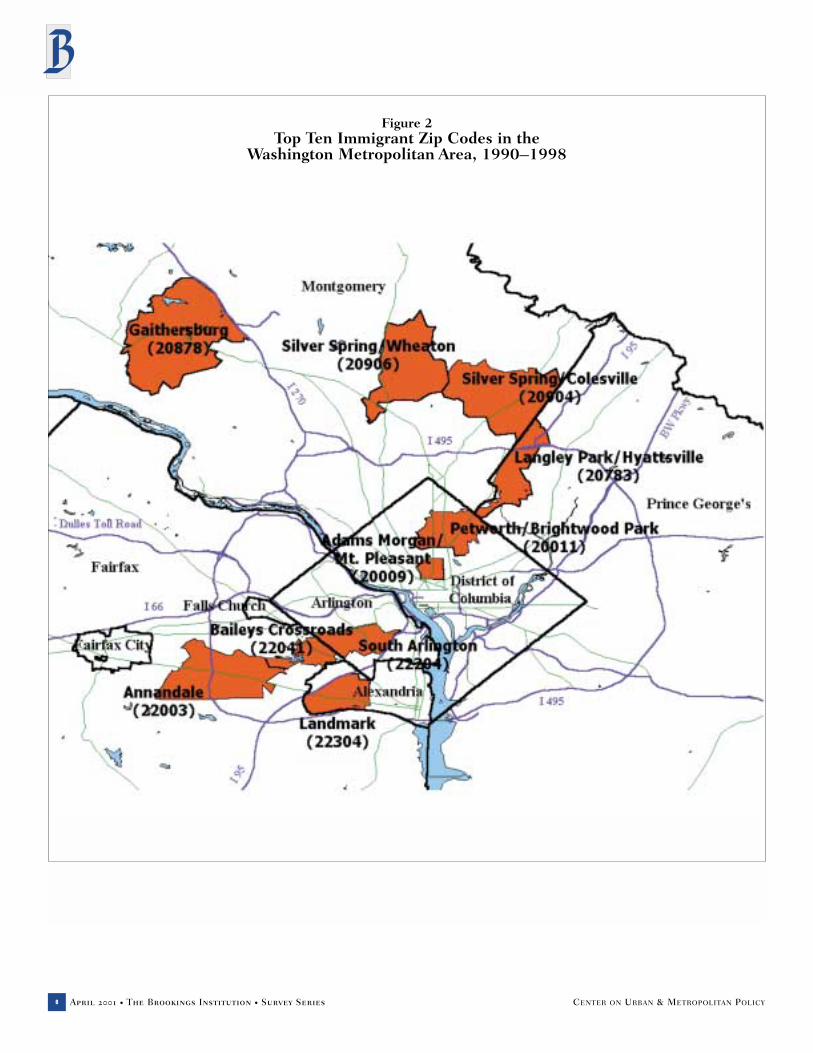
Of the top ten immigrant zip codes,four each are located in Maryland andVirginia, and two are in the District ofColumbia. As Figure 2 shows, threeare outside the Beltway, two straddle itand five are inside the Beltway. Mont-gomery and Fairfax counties containfive of the top-ten zip code areas. Two
April 2001 • The Brookings Institution • Survey Series 5BROOKINGS GREATER WASHINGTON RESEARCH PROGRAM
Table 3: Top Ten Immigrant Destination Zip Codes in the Washington Metropolitan Area, 1990-1998
ImmigrantsNumber % share Number % Foreign
of Area of BornTotal Countries 1990
Rank Zip Code Place Name County & State Census[a] [b] [c] [d]
1 22204 South Arlington Arlington, VA 7823 3.3 128 28.32 20009 Adams Morgan/Mt. Pleasant District of Columbia 6534 2.7 136 22.33 20783 Langley Park/Hyattsville Prince George’s, MD 5736 2.4 125 36.14 20906 Silver Spring/Wheaton Montgomery, MD 5365 2.2 131 21.95 20904 Silver Spring/Colesville Montgomery, MD 4812 2.0 135 18.76 20878 Gaithersburg Montgomery, MD 4811 2.0 125 17.27 22003 Annandale Fairfax, VA 4731 2.0 118 18.18 22304 Landmark Alexandria, VA 4605 1.9 125 20.79 22041 Baileys Crossroads Fairfax, VA 4526 1.9 117 41.710 20011 Petworth/Brightwood Park District of Columbia 4378 1.8 106 9.6
Source: All data from U.S. Immigration and Naturalization Service, Annual Immigrant Files, 1990–1998, except for data in column [d], from
1990 U.S. Census Summary Tape File 3B.
April 2001 • The Brookings Institution • Survey Series6 CENTER ON URBAN & METROPOLITAN POLICY
Figure 2Top Ten Immigrant Zip Codes in the
Washington Metropolitan Area, 1990–1998

more are in Arlington and Alexandria,one is in Prince George’s County, andtwo are in Washington, D.C. Thenumber of recent immigrants arrivingto these zip codes in the 1990s rangesfrom nearly 4,400 to over 7,800.Combined, these ten zip codesaccount for one-fifth of the area’s newimmigrants. This differs from the resi-dential patterns in those metropolitanareas with long-established immigrantcommunities, such as New York orChicago, where traditionally immi-grants were drawn to the inner cityand over time moved to the suburbs.
The South Arlington area alongColumbia Pike (22204) is one of themost diverse areas in the metropolitanregion, with recent immigrants from128 countries. Immigrants from thetop ten sending countries account forhalf the newcomers to this zip code,and all of the top ten countries arerepresented here, with the largestgroups from El Salvador, Bolivia,Vietnam and Ethiopia (see Figure 3).10
The next most popular destination isthe Adams Morgan/Mount Pleasantarea of the District of Columbia(20009). There, one finds recent
immigrants from 136 countries. Butunlike South Arlington, there is anotable clustering of Salvadoran andVietnamese immigrants. Immigrantsfrom those two countries account forhalf of the new immigrants to that zip code. None of the other top ten zip code areas has such a high concen-tration of immigrants from just two countries.
In the Gaithersburg/Rockville zipcode of 20878, the top ten sendingcountries account for just over half ofthe recent immigrants. In this area,the largest numbers come from India,
April 2001 • The Brookings Institution • Survey SeriesBROOKINGS GREATER WASHINGTON RESEARCH PROGRAM 7
Figure 3Immigrant Composition of the Top 10 Zip Codes in the
Washington Metropolitan Area, 1990–1998
0% 10% 20% 30% 40% 50% 60% 70% 80% 90% 100%
South Arlington
Adams Morgan/Mt. Pleasant
Langley Park/Hyattsville
Silver Spring/Wheaton
Silver Spring/Colesville
Gaithersburg
Annandale
Landmark
Baileys Crossroads
Petworth/Brightwood Park
El SalvadorChinaEthiopiaPeru
VietnamPhilippinesIranNext 17 Countries
IndiaSouth KoreaPakistanRest

China, Taiwan, and Iran.11 In thecloser-in Maryland suburb of LangleyPark/Hyattsville (20783) in PrinceGeorge’s County, the top ten sendingcountries only account for 40 percentof the immigrant population, with Salvadorans making up 23 percent ofthe zip code’s recent immigrants.
C. In the 1990s, 87 percent of theregion’s new immigrants chose tolive in the suburbs, with almost half(46 percent) locating in communi-ties outside the Capital Beltway. Immigration to the Washington regionis an overwhelmingly suburbanphenomenon. The two most populousand wealthiest counties in the regionwere also the top two destinations fornew immigrants. Combined, Fairfaxand Montgomery counties were theintended residence of 56 percent of thearea’s new immigrants. Fairfax County,which has a median household incomeof over $90,00012, was the intendedresidence of 68,115 new immigrants in the 1990s. Similarly, Maryland’sMontgomery County, with a medianhousehold income of nearly $78,000,accounted for 67,491 recent immi-grants. Fairfax and Montgomerycounties also account for much of thearea’s job growth—driven by high-tech,construction and service jobs, whichhave attracted both domestic and inter-national workers with a range of skills.
Immigrants are almost as likely tochoose to live in outer suburbs as ininner suburbs (in Washington, theinner and outer suburbs are divided bythe Capital Beltway, with the outersuburbs lying beyond the Beltway).Almost half (46 percent) of the recentimmigrants to the Washington metro-politan area chose to reside outsidethe Beltway, many in areas with highconcentrations of immigrants such asSilver Spring, Wheaton, Gaithersburgand Annandale (see Figure 4).
Of the within-the-Beltway immi-grants, three out of four chose thesuburbs of Maryland and Virginia overthe District of Columbia.13 The inner
Figure 4Recent Immigrants to the
Washington Metropolitan Area, 1990–1998
April 2001 • The Brookings Institution • Survey Series8 CENTER ON URBAN & METROPOLITAN POLICY
Number of Immigrants(by Zip Code)
0 (23)1 – 100 (85)101 – 500 (35)501 – 2500 (89)>2500 (26)

suburbs of Arlington, Alexandria,Fairfax, Montgomery and PrinceGeorge’s counties have attracted alarge and increasingly diverse immi-grant population. As for the District ofColumbia, only 12.8 percent of newimmigrants opted to reside thereduring the 1990s.
D. Different immigrant subgroupshave different settlement patterns.Asian immigrants are more likely tomove to the outer suburbs, whileLatin American and African immi-grants tend to live within theBeltway.
Asian ImmigrantsAs noted above, Washington is a risingEast Coast destination for Asian immi-grants. Forty-two percent of theregion’s immigrants are from Asia,with the majority of these new arrivalsfrom ten countries: Vietnam, India,China, the Philippines, South Korea,Iran, Pakistan, Taiwan, Bangladeshand Afghanistan. Asian immigrants arethe most suburban of the three broadregional origin groups presented, with56 percent living outside the Beltway(see Figure 5). Of the recent Asianimmigrants to the suburbs, the Indianand Chinese immigrants are the mostdispersed while Vietnamese andKoreans are more likely to cluster (see www.brookings.edu/urban forindividual country of origin maps).
The Vietnamese community is oneof the older immigrant communities inthe Washington area, dating back tothe 1970s. There is a clear concentra-tion of recent arrivals from Vietnam inBailey’s Crossroads and Seven Corners(22041, 22042, 22044). The twoareas, which straddle Arlington andFairfax counties, form a nucleus forVietnamese investment, as exemplifiedby the Eden Center, a shopping centerwhich serves the large Vietnamesepopulation.14 Unlike other Asian immi-grants, the recent Vietnameseimmigrants commonly reside in theinner suburbs and the District of
Figure 5Recent Asian Immigrants to the
Washington Metropolitan Area, 1990–1998
Number of Asian Immigrants(by Zip Code)
Percent of Total AsianImmigrants in Region
Vietnam 17.5India 13.2China 10.9Philippines 10.5South Korea 9.8Iran 7.4Pakistan 7.1Taiwan 3.4Bangladesh 2.6Afghanistan 2.5Other 15.0
0 (35)1 – 100 (90)101 – 500 (57)501 – 1000 (44)>1000 (32)
April 2001 • The Brookings Institution • Survey Series 9BROOKINGS GREATER WASHINGTON RESEARCH PROGRAM

Columbia. In fact, 22 percent ofrecent Vietnamese immigrantsreported the D.C. 20009 zip code astheir intended residence. In strikingcontrast to the other Asian immi-grants, two out of three Vietnameseimmigrants reside inside the Beltway.
Like most other Asian groups, overtwo-thirds (67.5 percent) of recentKorean immigrants prefer to live in theouter suburbs. While there is a notableconcentration of Korean immigrants inAnnandale, Virginia (22003), themajority of recent immigrants fromSouth Korea are scattered throughoutthe outer suburbs (mostly in Fairfaxand Montgomery counties) rather thanconcentrated in a single locale.
Latin American and CaribbeanImmigrants The largest source of immigrants tothe United States as a whole is LatinAmerica (including the Caribbean),but this is not the case in the Wash-ington region, where Latin Americanand Caribbean immigrants are lessnumerous than those from Asia.Latin Americans represent 31 percentof recent arrivals to the region.15 Theleading Latin American source country for the Washington region isEl Salvador, followed by Peru, Bolivia,Jamaica, Guatemala, Nicaragua,Mexico, Trinadad and Tobago, the Dominican Republic, andColombia. While Mexicans accountedfor nearly 29 percent of all newcomersto the United States between 1990and 1998, they represented only 1.2 percent of Washington’s recentimmigrants and only 4 percent of the Latin American newcomers.
Immigrants from Latin America areconcentrated inside the Beltway,where 63 percent reside. Within theBeltway, there are notable concentra-tions of Latin Americans, particularlySalvadorans: along Columbia Pike(22204) in South Arlington, inLangley Park/Hyattsville (20783) in Prince George’s County, Silver Spring/Wheaton (20906) in
Figure 6Recent Latin American and Caribbean Immigrants to the
Washington Metropolitan Area, 1990–1998
Number of Latin American and Caribbean Immigrants(by Zip Code)
0 (38)1 – 100 (99)101 – 500 (73)501 – 1000 (29)>1000 (19)
Percent of Total LatinAmerican and Caribbean
Immigrants in Region
El Salvador 33.4Peru 9.3Bolivia 7.5Jamaica 6.7Guatemala 5.0Mexico 4.0Nicaragua 4.1Trinidad & Tobago 3.6Dominican Republic 3.5Columbia 3.3Other 19.6
April 2001 • The Brookings Institution • Survey Series10 CENTER ON URBAN & METROPOLITAN POLICY

Montgomery County, and in theDistrict of Columbia’s MountPleasant/Adams Morgan (20009) andPetworth/ Brightwood Park (20011)neighborhoods. Of those residinginside the Beltway, one out of fourreported an address within the Districtof Columbia.
A little over a third (37 percent) ofrecent immigrants from Latin Americalive outside the Beltway, especially inGaithersburg (20878, 20879),Herndon (20170) and Woodbridge(22191). Latino immigrants fromparticular nations are more likely tolive in the outer suburbs than others.For example, 51 percent of the Peru-vians in the data set live outside theBeltway, whereas only 33 percent ofSalvadoran immigrants reside in theouter suburbs. The preference for theouter suburbs on the part of somenational origin groups may suggest thatthey are coming to this area with moreresources or more marketable skillsthan Latinos from other countries.
African Immigrants In addition to Latino and Asian immi-grants, the greater Washington areaattracts a significant number ofAfrican immigrants, which is anotherdistinguishing feature of the area’simmigrant profile. African immigrantsaccount for 16.2 percent of the recent arrivals in the Washingtonregion, whereas they comprise only3.6 percent of all new arrivals to theUnited States. Indeed, the Washingtonarea attracts the largest proportionalflow of Africans of any major metro-politan area in the United States.
The dominant African sourcecountry for the Washington metropol-itan area is Ethiopia16, accounting forone-quarter of all African newcomers.Nigeria, Ghana, Sierra Leone andSomalia follow, making up the top five African source countries in the1990s. Like immigrants from LatinAmerica, African immigrants preferthe neighborhoods inside theBeltway—70 percent reside there.
Although African immigrants arefound in the majority of the area’s zipcodes, there are concentrations insome suburban areas where African-Americans are the majority—especiallyin Prince George’s County, Mont-gomery County and the District ofColumbia. Figure 7 shows this patternof African residential concentration, inPrince George’s County and Mont-gomery County, in sections of SouthArlington/East Fairfax along ColumbiaPike, and in the Petworth/BrightwoodPark area of the District of Columbia.
Race seems to be a factor in theresidential patterning of recent Africannewcomers. What we don’t know fromthese data is how much of this patternis a result of self-selection, or howstrongly a role racial prejudice anddiscrimination in the housing marketplays in immigrants’ residential selection. Africans accounted for 21 percent of new immigrants to theDistrict of Columbia and 26 percentof new immigrants to Prince George’sCounty. These figures are proportion-ately higher than their overallrepresentation, 16.2 percent, withinthe immigrant population.
However, Africans are also wellrepresented in some of the mostpopular residential zip codes for allimmigrants. Ethiopians are rankedthird among new immigrants in SouthArlington’s 22204 zip code and in theDistrict’s Petworth/Brightwood Park(20011) neighborhood. They are thesingle largest immigrant group in theethnically diverse Landmark area(22304) of Alexandria, Virginia. Thus,while race is a factor in immigrants’residential selection, it appears thatAfrican immigrants are also drawn toareas where diverse immigrant popula-tions have settled.
April 2001 • The Brookings Institution • Survey Series 1 1BROOKINGS GREATER WASHINGTON RESEARCH PROGRAM
“While Mexicans
accounted for
nearly 29 percent
of all newcomers
to the United
States between
1990 and 1998,
they represented
only 1.2 percent
of Washington’s
recent immi-
grants…”

Figure 7Recent African Immigrants to the
Washington Metropolitan Area, 1990–1998
Number of African Immigrants(by Zip Code)
0 (67)1 – 100 (97)101 – 500 (70)501 – 1000 (16)>1000 (8)
Percent of Total AfricanImmigrants in Region
Ethiopia 24.1Nigeria 14.0Ghana 12.2Sierra Leone 9.6Somalia 6.5Egypt 4.5Liberia 4.3Morocco 3.8Sudan 3.1Cameroon 3.1Other 14.7
April 2001 • The Brookings Institution • Survey Series12 CENTER ON URBAN & METROPOLITAN POLICY
“The Washington
area attracts
the largest
proportional
flow of Africans
of any major
metropolitan
area in the
United States.”

Conclusion
There is remarkable dispersionin the settlement of Wash-ington’s newcomers, whichthe maps and figures
presented in this paper make clear.While our study offers some inter-esting new evidence on immigrantsettlement in the Washington area, itraises many more questions that needto be addressed. One question is whatrole does community play in immi-grants’ lives, given their spatialdispersion. The little research that hasbeen done on this issue for the Wash-ington metropolitan area17 suggeststhat a sense of community may bemaintained through social and reli-gious networks (churches, socialclubs, and sports leagues).
A second question–one that is ofclear importance at the local level–ishow well immigrants and their familiesare incorporating into the local laborand housing markets, schools, andcommunity and social life. Publicschools are an obvious stress point,where students with limited Englishproficiency (LEP) in some areas canbe high, and students may speak anenormous number of languages. For example, in the MontgomeryCounty school district, LEP studentsspoke 120 languages in 1998.18 In anovel move, the school district hascontracted with a telephone service to provide translation for parents andteachers in 140 languages.
A corollary set of questions iscentered on how areas that have notexperienced large waves of immigrantsrespond when the volume and pace ofimmigration increases dramatically.How do established organizations,institutions and programs, particularly
schools, health clinics, transportationservices, and food and other commer-cial outlets alter their services to meetthe challenges of immigrantnewcomers? As many formerly nativewhite and black neighborhoodsbecome communities of mixednational origins, how do the longer-term residents deal with newcomerswho may have very different lifestyles,needs and languages?
The Washington metropolitan area,as a new immigrant destination, offersa different model for immigrant settle-ment and integration. Washingtonreceives a mix of highly educated andlower skilled immigrant labor. Regard-less of economic status, newcomers toWashington do not rely upon estab-lished immigrant neighborhoodsbecause there have been historicallyfew. Instead residential choices appearto be made based on family ties, socialnetworks, the housing market, accessto public transportation, schoolchoices, and other local services.Given the newness of the immigrantflow, over time distinct ethnic enclavesmay emerge, like the Vietnamesesettlement in Bailey’s Crossroads/Seven Corners area. Yet what iscurrently striking about the metropol-itan area is the pattern of immigrantresidential dispersion throughout theinner and outer suburbs.
April 2001 • The Brookings Institution • Survey Series 13BROOKINGS GREATER WASHINGTON RESEARCH PROGRAM
Additional individual country of origin maps are available atwww.brookings.edu/urban
Acknowledgements:The authors gratefully acknowl-edge support from the Center for Washington Area Studies ofThe George Washington Universitythrough a Banneker FacultyResearch Grant, and the Interna-tional Migration Policy Program of the Carnegie Endowment forInternational Peace.
The Brookings Institution wouldlike to thank The Morris andGwendolyn Cafritz Foundation,Philip L. Graham Fund, Eugene & Agnes E. Meyer Foundation,Prince Charitable Trusts, TrellisFund, and the Fannie Mae Foundation for their support ofour work on the Washingtonmetropolitan area.

ReferencesAlba, Richard D. and John R. Logan.1991. “Variation on Two Themes:Racial and Ethnic Patterns in Attain-ment of Suburban Residence.”Demography 28:431-53
Bredemeir, Kenneth. 2000. “FairfaxGrows More Affluent” WashingtonPost, June 10, 2000. A01.
Cary, Francine Curro. 1996. UrbanOdyssey: A Multicultural History ofWashington, D.C. Washington DC:Smithsonian.
Greater Washington Research Center.1999. “International Diversity in theWashington Area.” Washington, DC.
Manning, Robert. 1996. “Washington,D.C.: The Changing Social Landscapeof the International Capital City.”Chapter 28, in Origins and Destinies:Immigration, Race, and Ethnicity inAmerica, Silvia Pedraza and Ruben G.Rumbaut (eds.). Washington, DC:Wadsworth Publishing Company.
Massey, Douglas S. 1985. “EthnicResidential Segregation: A TheoreticalSynthesis and Empirical Review.”Sociology and Social Research69:315–350.
Newbold, K.B. 1999. “Spatial distribu-tion and redistribution of immigrantsin the metropolitan United States,1980 and 1990.” Economic Geography.75:254–271.
Newman, Kristin E. and MartaTienda. 1994. “The Settlement andSecondary Migration Patterns ofLegalized Immigrants: Insight fromAdministrative Records.” In Immigra-tion and Ethnicity. Ed BarryEdmonston and Jeffrey S. Passel.Washington, DC: The Urban Institute Press.
Price, Marie. 2000. “Placing theTransnational Migrant: The Socio-spatial Networks of Bolivians inWashington” Paper presented at theLatin American Studies Association,Miami, FL, March 18, 2000.
Rosenbaum, Emily, SamanthaFriedman, Michael H. Schill, andHielke Buddelmeyer. 1999. “NativityDifferences in Neighborhood Qualityamong New York City Households,1996.” Housing Policy Debate10(3):625–658.
Audrey Singer and Amelia Brown.Forthcoming, 2001. “Immigration tothe Washington, DC MetropolitanArea,” in James Ciment (Ed.), Encyclopedia of American Immigra-tion. Armonk, NY: M.E. Sharpe.
U.S. Bureau of the Census. 1973.1970 Census of Population: Volume 1Characteristics of the Population, Part10, District of Columbia. Washington,DC: U.S. Government Printing Office.
U.S. Bureau of the Census. 1998.State and Metropolitan Area Data Book1997–98. (5th edition) Washington,DC: U.S. Government Printing Office.
U.S. Bureau of the Census. 2000.Unpublished data derived from MarchCPS, 1997-1999. Washington, DC:U.S. Census Bureau, Ethnic andHispanic Statistics Branch, PopulationDivision
U.S. Immigration and NaturalizationService, 1999. Annual Report: Legal Immigration, Fiscal Year 1998.Washington, DC.
Wood, Joseph. 1997. “VietnameseAmerican Place Making in NorthernVirginia” Geographical Review 87(1):58–72.
Zelinsky, Wilbur and Barrett A. Lee.1998. “Heterolocalism: al AlternativeModel of the Sociospatial Behavior ofImmigrant Ethnic Communities”International Journal of PopulationGeography 4: 1–18.
April 2001 • The Brookings Institution • Survey Series14 CENTER ON URBAN & METROPOLITAN POLICY

Endnotes
1 Washington is 6th ranked behind
Los Angeles (4.8 million), New York
(4.6 million), Miami (1.4 million),
San Francisco (1.4 million), and
Chicago (1.1 million).
2 U.S. Bureau of the Census. 1973, 2000.
3 See Cary, 1996; Manning, 1996; Singer
and Brown, 2000.
4 Alba and Logan, 1991; Rosenbaum,
Friedman, Schill and Buddelmeyer, 1999.
5 Massey, 1985.
6 Zelinsky and Lee, 1998.
7 This is similar to the Washington Metro-
politan Statistical Area (MSA) definition
used in the 1990 Census, but excludes
Calvert, MD and Stafford, VA counties.
8 Newman and Tienda, 1994.
9 The maps in this study are based on immi-
grants’ “intended” residence at the time of
application for permanent residence. This
intended residence is an imperfect
measure. In some cases, this could be the
address of a family member, and may be a
temporary address for the immigrant.
Upon obtaining their legal residence,
immigrants could leave the area; likewise
immigrants may move into the metropol-
itan area after residing elsewhere in the
United States. An analysis by Newbold
(2000) examines the issue of immigrant
settlement in the period immediately after
arrival through a comparison of 1990
Census data and INS data from 1985–90.
Although there appears to be mobility of
immigrants shortly after arrival, it does
not necessarily result in apparent changes
to the concentration of the immigrant
population.
10 Bolivia represents the second largest
country of origin group in 22204, but in
Figure 3 it is combined in the “next 17
countries” category because it is not one
of the top ten immigrant sending coun-
tries, overall, to the Washington area.
11 Taiwan represents the third largest
country of origin group in 20878, but in
Figure 3 it is combined in the “next 17
countries” category because it is not one
of the top ten immigrant sending coun-
tries, overall, to the Washington area.
12 Bredemeier, 2000.
13 Of the 130,600 recent immigrants
residing inside the Beltway, 30,701 are in
the District of Columbia and 99,998 are
outside the District.
14 Wood, 1997.
15 We recognize that it is likely that a
number of Latinos in the Washington area
are undocumented and thus would not
show up in the INS data set. Although we
have information on some 75,000 recent
Latino immigrants, if the undocumented
could be added to our data set the number
would be larger. In addition, all of the
regional origin groups presented in this
analysis would increase if we could
include their (unknown) undocumented
component.
16 Immigrants from Eritrea are included
with Ethiopia.
17 Price, 2000.
18 Greater Washington Research Center,
1999.
April 2001 • The Brookings Institution • Survey Series 15BROOKINGS GREATER WASHINGTON RESEARCH PROGRAM

The Brookings Institution
1775 Massachusetts Avenue, NW • Washington, DC 20036-2188Tel: 202-797-6000 • Fax: 202-797-6004
www.brook.edu
For More Information:
Audrey SingerAssociateInternational Migration
Policy ProgramCarnegie Endowment for
International Peace(202) [email protected]
Samantha FriedmanAssistant Professor of SociologyThe George Washington University(202) [email protected]
Ivan CheungAssistant Professor of GeographyThe George Washington University(202) [email protected]
Marie PriceAssociate Professor of Geography
and International Affairsand Director of the Latin American
Studies ProgramThe George Washington University(202) [email protected]
For General Information: Brookings Center on Urban and Metropolitan PolicyPhone: (202) 797-6139Website: www.brookings.edu/urban
Tel: 202-797-6139 • Fax: 202-797-2965www.brookings.edu/urban