Middle-Wage Jobs in Metropolitan America - Brookings ...
24
BROOKINGS | June 2009 1 METRO ECONOMY SERIES FOR THE METROPOLITAN POLICY PROGRAM AT BROOKINGS Middle-Wage Jobs in Metropolitan America Paul Sommers and Drew Osborne 1 “Despite the economic downturn, middle-wage jobs remain a prominent feature of the labor market in metropolitan areas nation- wide.” Findings This report investigates the accessibility of middle-wage jobs—good-paying jobs for less-educated workers—for those without bachelor’s degrees in 204 metropolitan areas. It measures “accessibil- ity” as the share of jobs that are middle-wage as a percentage of the share of workers without a bachelor’s degree. The higher this percentage, the more accessible middle-wage jobs are. Using American Community Survey and Bureau of Labor Statistics data for 2005, it finds that: n Many middle-wage jobs are in clerical, construction, and production occupations. The largest middle-wage occupations in metropolitan America are customer service representa- tives; bookkeeping, accounting, and auditing clerks; and secretaries. Other sizable middle-wage occupations include carpenters, laborers, industrial truck and tractor operators, and team assemblers. n Middle-wage job accessibility is at least 65 percent in the 15 metropolitan areas where those jobs are most accessible to less-educated workers, well above the average of 52 percent for all metropolitan areas in this report. The metropolitan areas where middle-wage jobs are most accessible include Elkhart, IN; Hickory, NC, and Las Vegas, NV. In the 15 metro- politan areas where middle-wage jobs are least accessible, including Boulder, CO; San Jose, NV; and Trenton, NJ, accessibility is 44 percent or less. (These rankings have almost certainly shifted due to concentrated sectoral declines in many industries during the current recession; e.g. furniture manufacture in Hickory, NC and RV production in Elkhart, IN.) n Middle-wage jobs are slightly more accessible to less-educated workers in small and medium-sized metropolitan areas, and metropolitan areas in the South. Middle-wage job accessibility is 55 percent in metropolitan areas with fewer than 1 million people, compared with 51 percent in those with 1 million or more people. It is 55 percent in Southern metropolitan areas but only 50 percent in metropolitan areas in the Northeast and West. n Less-educated workers enjoy above-average access to middle-wage jobs in metropolitan areas that specialize in leisure and hospitality and manufacturing industries. Middle-wage job accessibility is 59 percent in metropolitan areas that specialize in leisure and hospitality industries and 54 percent in metropolitan areas that specialize in manufacturing. In contrast, accessibility is only 48 percent in metropolitan areas that specialize in high-tech industries. Despite the economic downturn, middle-wage jobs remain a prominent feature of the labor market in metropolitan areas nationwide. Yet policymakers can do more to tailor economic and workforce development strategies to expand the number of middle-wage jobs in metropolitan areas to better match the number of middle-wage jobseekers. They can also strengthen policies that help more working adults earn four-year college degrees, thereby enhancing their earning power while reducing competition for middle-wage jobs. The type of analysis provided in this report can help economic and workforce developers and policymakers better align middle-wage jobs and middle-wage jobseekers in their metropolitan economies.
-
Upload
khangminh22 -
Category
Documents
-
view
1 -
download
0
Transcript of Middle-Wage Jobs in Metropolitan America - Brookings ...

BROOKINGS | June 2009 1
METRO ECONOMY SERiES fOR ThE METROpOliTaN pOliCY pROgRaM aT BROOkiNgS
Middle-Wage Jobs in Metropolitan America paul Sommers and Drew Osborne1
“ Despite the
economic
downturn,
middle-wage
jobs remain
a prominent
feature of the
labor market
in metropolitan
areas nation-
wide.”
FindingsThis report investigates the accessibility of middle-wage jobs—good-paying jobs for less-educated workers—for those without bachelor’s degrees in 204 metropolitan areas. it measures “accessibil-ity” as the share of jobs that are middle-wage as a percentage of the share of workers without a bachelor’s degree. The higher this percentage, the more accessible middle-wage jobs are. Using American Community Survey and Bureau of Labor Statistics data for 2005, it finds that:
n Many middle-wage jobs are in clerical, construction, and production occupations. The largest middle-wage occupations in metropolitan america are customer service representa-tives; bookkeeping, accounting, and auditing clerks; and secretaries. Other sizable middle-wage occupations include carpenters, laborers, industrial truck and tractor operators, and team assemblers.
n Middle-wage job accessibility is at least 65 percent in the 15 metropolitan areas where those jobs are most accessible to less-educated workers, well above the average of 52 percent for all metropolitan areas in this report. The metropolitan areas where middle-wage jobs are most accessible include Elkhart, iN; hickory, NC, and las Vegas, NV. in the 15 metro-politan areas where middle-wage jobs are least accessible, including Boulder, CO; San Jose, NV; and Trenton, NJ, accessibility is 44 percent or less. (These rankings have almost certainly shifted due to concentrated sectoral declines in many industries during the current recession; e.g. furniture manufacture in hickory, NC and RV production in Elkhart, iN.)
n Middle-wage jobs are slightly more accessible to less-educated workers in small and medium-sized metropolitan areas, and metropolitan areas in the South. Middle-wage job accessibility is 55 percent in metropolitan areas with fewer than 1 million people, compared with 51 percent in those with 1 million or more people. it is 55 percent in Southern metropolitan areas but only 50 percent in metropolitan areas in the Northeast and West.
n Less-educated workers enjoy above-average access to middle-wage jobs in metropolitan areas that specialize in leisure and hospitality and manufacturing industries. Middle-wage job accessibility is 59 percent in metropolitan areas that specialize in leisure and hospitality industries and 54 percent in metropolitan areas that specialize in manufacturing. in contrast, accessibility is only 48 percent in metropolitan areas that specialize in high-tech industries.
Despite the economic downturn, middle-wage jobs remain a prominent feature of the labor market in metropolitan areas nationwide. Yet policymakers can do more to tailor economic and workforce development strategies to expand the number of middle-wage jobs in metropolitan areas to better match the number of middle-wage jobseekers. They can also strengthen policies that help more working adults earn four-year college degrees, thereby enhancing their earning power while reducing competition for middle-wage jobs. The type of analysis provided in this report can help economic and workforce developers and policymakers better align middle-wage jobs and middle-wage jobseekers in their metropolitan economies.

BROOKINGS | June 20092
Introduction
For the last three decades, trends in the U.S. labor market have favored college-educated workers. College graduates have long earned more than high school graduates, and the col-lege wage premium (relative to high school graduates’ wages) grew by more than 75 percent during the last three decades.2 at the same time, the share of the labor force with a bach-
elor’s degree grew by nearly 40 percent.3 These trends have led many to conclude that there has been a long-term increase in the demand for college-educated workers, and that the appropriate public policy response is to increase the share of college graduates in the labor force.4
absent from this analysis is any consideration of the wages and availability of jobs for workers with less than a bachelor’s degree. Should policymakers conclude that the number of good jobs available to less-educated workers is inevitably small and declining and that policies to increase that number are unwarranted? The findings of this report suggest they should not. Every metropolitan area has what we call “middle-wage jobs”—well-paying jobs for residents who have not earned baccalaureate degrees. however, some metropolitan areas have more of these jobs than others. Metropolitan workforce and economic development policymakers and practitioners can use the information in this report to understand the kinds of middle-wage jobs that exist in their area, determine how severe the mismatch is between the number of less-educated workers and the number of middle-wage jobs, and develop policies and strategies to reduce the mismatch.
The majority of working-age adults do not have four-year degrees. Only about 30 percent of the american adult labor force has at least a bachelor’s degree.5 Moreover, this share is unlikely to increase dramatically during the next two decades. The share of the adult labor force with at least a bachelor’s degree is projected to be only approximately 36 percent by 2028.6 During the next two decades, therefore, most americans will need jobs that do not require a four-year degree.
Jobs available to workers without a four-year degree will continue to play a major role in the U.S. economy. Economists Harry Holzer and Robert Lerman find that 48 percent of all jobs fall into “middle-skill” jobs, which require more than a high school education but less than a bachelor’s degree. They cite Bureau of labor Statistics projections that 45 percent of job openings between 2004 and 2014 will be in the middle-skill occupational categories.7
The skill content of those jobs will matter not only to the workers who hold them, but also to the economic well-being of the nation. Some analysts, such as harvard economist Dale Jorgenson and his colleagues, worry that the projected leveling off of baccalaureate-level education attainment (and therefore, it is assumed, of higher skills) will harm the economy.8 furthermore, Census Bureau researchers Day and Bauman argue that the notable progress achieved in the american economy dur-ing much of the 20th century—driven largely by an increasingly educated workforce—has come to an end. The process of better-educated workers replacing less-educated older workers appeared to end by the late 20th century as the country reached limits in terms of high school and college graduation rates and as waves of immigrants lacking basic education arrived.9 if the growth of baccalaureate-level educational attainment slows, then U.S. economic growth may depend increasingly on upgrading the skill content of jobs that do not require a bachelor’s degree.
The future may also see greater public attention to the wages these jobs pay. Continued rapid increases in wages and job availability for four-year college graduates cannot be taken for granted just because they occurred in the past. Economists Jared Bernstein and Lawrence Mishel find that the wage premium for the college educated stopped growing after 2000.10 Technology policy analyst Robert atkinson and economist howard Wial have raised the disturbing prospect that many service sector jobs often filled by people with bachelor’s degrees will be subject to significant competition from overseas.11 if a bachelor’s degree is no longer a guaranteed ticket to a secure, high-paying career, then it is important to identify good jobs that do not require a four-year degree and that are less vul-nerable to global competition.
for all these reasons, state and metropolitan workforce and economic development policymakers should be concerned about the availability of good jobs for adults who have not earned at least a bachelor’s degree. however, much of the focus of local economic development efforts is on high-tech industries that mainly hire workers with bachelor’s and advanced degrees. for example, an economic development strategy document from portland, OR, calls for a focus on high-wage jobs and lists high-
BROOKINGS | June 2009 3
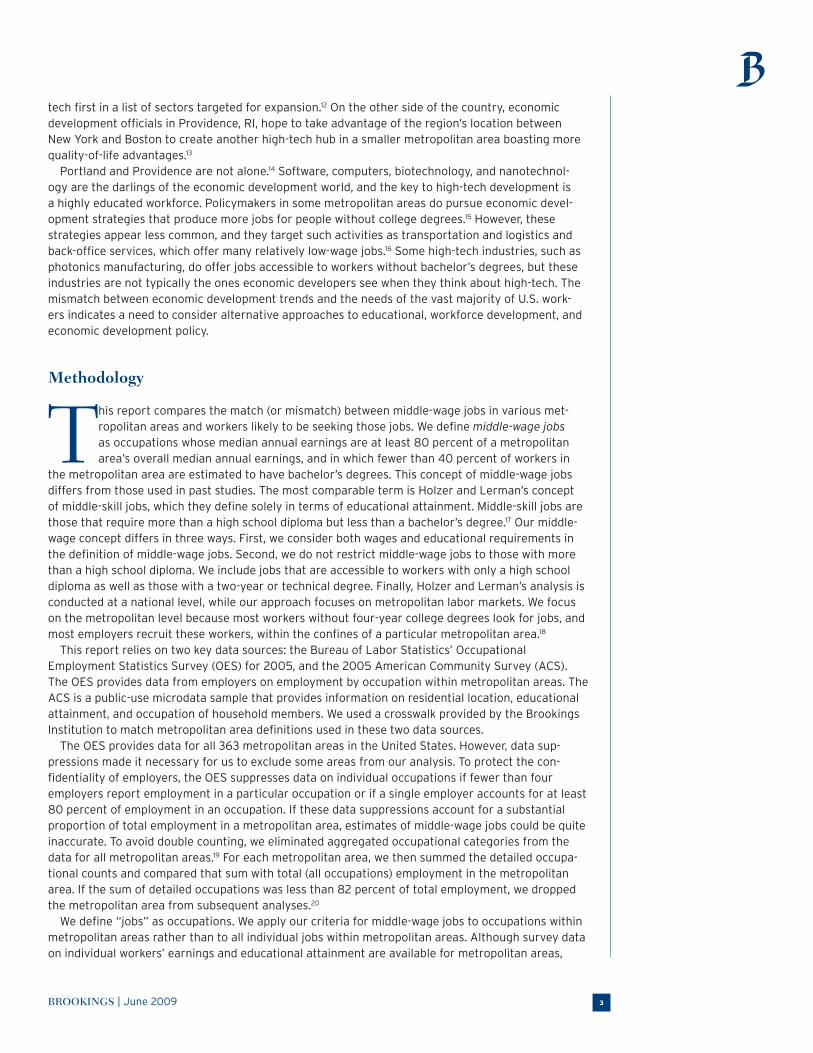
tech first in a list of sectors targeted for expansion.12 On the other side of the country, economic development officials in Providence, RI, hope to take advantage of the region’s location between New York and Boston to create another high-tech hub in a smaller metropolitan area boasting more quality-of-life advantages.13
portland and providence are not alone.14 Software, computers, biotechnology, and nanotechnol-ogy are the darlings of the economic development world, and the key to high-tech development is a highly educated workforce. policymakers in some metropolitan areas do pursue economic devel-opment strategies that produce more jobs for people without college degrees.15 however, these strategies appear less common, and they target such activities as transportation and logistics and back-office services, which offer many relatively low-wage jobs.16 Some high-tech industries, such as photonics manufacturing, do offer jobs accessible to workers without bachelor’s degrees, but these industries are not typically the ones economic developers see when they think about high-tech. The mismatch between economic development trends and the needs of the vast majority of U.S. work-ers indicates a need to consider alternative approaches to educational, workforce development, and economic development policy.
Methodology
This report compares the match (or mismatch) between middle-wage jobs in various met-ropolitan areas and workers likely to be seeking those jobs. We define middle-wage jobs as occupations whose median annual earnings are at least 80 percent of a metropolitan area’s overall median annual earnings, and in which fewer than 40 percent of workers in
the metropolitan area are estimated to have bachelor’s degrees. This concept of middle-wage jobs differs from those used in past studies. The most comparable term is holzer and lerman’s concept of middle-skill jobs, which they define solely in terms of educational attainment. Middle-skill jobs are those that require more than a high school diploma but less than a bachelor’s degree.17 Our middle-wage concept differs in three ways. first, we consider both wages and educational requirements in the definition of middle-wage jobs. Second, we do not restrict middle-wage jobs to those with more than a high school diploma. We include jobs that are accessible to workers with only a high school diploma as well as those with a two-year or technical degree. finally, holzer and lerman’s analysis is conducted at a national level, while our approach focuses on metropolitan labor markets. We focus on the metropolitan level because most workers without four-year college degrees look for jobs, and most employers recruit these workers, within the confines of a particular metropolitan area.18
This report relies on two key data sources: the Bureau of Labor Statistics’ Occupational Employment Statistics Survey (OES) for 2005, and the 2005 american Community Survey (aCS). The OES provides data from employers on employment by occupation within metropolitan areas. The aCS is a public-use microdata sample that provides information on residential location, educational attainment, and occupation of household members. We used a crosswalk provided by the Brookings Institution to match metropolitan area definitions used in these two data sources.
The OES provides data for all 363 metropolitan areas in the United States. however, data sup-pressions made it necessary for us to exclude some areas from our analysis. To protect the con-fidentiality of employers, the OES suppresses data on individual occupations if fewer than four employers report employment in a particular occupation or if a single employer accounts for at least 80 percent of employment in an occupation. if these data suppressions account for a substantial proportion of total employment in a metropolitan area, estimates of middle-wage jobs could be quite inaccurate. To avoid double counting, we eliminated aggregated occupational categories from the data for all metropolitan areas.19 for each metropolitan area, we then summed the detailed occupa-tional counts and compared that sum with total (all occupations) employment in the metropolitan area. if the sum of detailed occupations was less than 82 percent of total employment, we dropped the metropolitan area from subsequent analyses.20
We define “jobs” as occupations. We apply our criteria for middle-wage jobs to occupations within metropolitan areas rather than to all individual jobs within metropolitan areas. although survey data on individual workers’ earnings and educational attainment are available for metropolitan areas,

BROOKINGS | June 20094
we focus on occupations because occupations are more useful for workforce development planning. Nevertheless, occupations are not the same as individual jobs. Wages and educational attainment lev-els vary considerably within each occupation in each metropolitan area. Some workers have more than one job, so our measures of earnings and educational attainment for an occupation are not measures of the earnings and educational attainment for the workers who are employed in that occupation. in addition, how jobs are grouped into occupations is, to some extent, a matter of judgment. Our use of the OES required us to accept the occupational groupings used in that survey. Had we defined occupa-tions differently, our findings may have differed from those reported here.
Our definition of middle-wage jobs recognizes that labor market conditions vary substantially around the country, as does the cost of living. Jobs that require a bachelor’s degree in one metropoli-tan area may be accessible to a person with some college but no degree in another. The latter metro-politan area, for example, may have fewer job seekers with degrees, or employer demand may outstrip the available supply of workers with bachelor’s degrees, leading employers to offer jobs to less-qual-ified applicants. Living costs also vary, and a single wage standard would not reflect the adequacy of wages and salaries in meeting a household’s needs.
as noted, to be middle wage, an occupation’s median annual earnings must be at least 80 percent of the metropolitan area’s median annual earnings. We chose this earnings floor because in prior work in the Seattle area, we found that the 80 percent level corresponded to a “living wage” standard inde-pendently estimated in that area.21 however, this choice has two important but unavoidable limitations given the available data. The OES reports only the median and average earnings for each occupation. The median is more representative of the earnings of a typical worker in the occupation because a few relatively high earners within an occupation can push the average earnings up considerably. By defini-tion, however, one-half the workers in an occupation earn less than the occupation’s median earnings. Thus, if an occupation’s median earnings are 80 percent of the entire metropolitan area’s median, at least one-half of the workers in that occupation must earn less than the metropolitan area’s median. For this reason, our occupational earnings floor is not an absolute minimum for the earnings of all workers in the occupation in a given metropolitan area. a second limitation of our approach is that the OES permits employers to report earnings on either an annual or an hourly basis, and it estimates both annual and hourly earnings for the entire occupation by assuming that all workers work 2,080 hours per year (a typical full-time, year-round schedule). This assumption can produce erroneous estimates of annual earnings for occupations in which many workers are both paid by the hour and working less than full-time, full-year schedules.
The percentage of workers who have not completed a four-year degree varies substantially across metropolitan areas, even within many occupations. although the aCS provides the most accurate information about the characteristics of individuals in metropolitan areas, its sample sizes for nearly all metropolitan areas are too small to produce accurate estimates of educational attainment within occupations at the metropolitan level. To capture the variation across labor markets in the accessibil-ity of occupations to individuals who have not completed a four-year degree, we used a logit regres-sion model to estimate the percentage of workers in each occupation who have a bachelor’s degree in each metropolitan area. We used the aCS data to develop this model, which is described in detail in appendix a. for an occupation to qualify as a middle-wage job in a metropolitan area, the estimated percentage of workers employed in that occupation holding a bachelor’s degree had to be less than 40 percent in that metropolitan area, based on the logit model. We chose this cutoff because it seemed reasonable to us that an occupation could be considered accessible to workers without bachelor’s degrees if a substantial majority of its workers did not have bachelor’s degrees. at the same time, how-ever, we did not want to impose an unduly restrictive cutoff. The aCS data analysis yielded estimates for 204 metropolitan areas when matched to the OES data. Thus, we report results for 204 metropoli-tan areas.
The share (percentage) of jobs in each metropolitan area that are middle wage, derived from the OES, is a measure of the availability of middle-wage jobs. The population likely to be seeking middle-wage jobs can be estimated by the percentage of workers who have not earned at least a bachelor’s degree. We derived the latter measure from the aCS.
We use the share of jobs that are middle wage as a percentage of the share of workers without a bachelor’s degree as our measure of how accessible the middle-wage jobs in a metropolitan area

BROOKINGS | June 2009 5
are to those who are likely to be seeking them. The higher this percentage, the more middle-wage jobs there are in a metropolitan area relative to the number of people likely to be seeking those jobs. although not every worker with less than a bachelor’s degree is interested in a middle-wage job, the variation among metropolitan areas in the accessibility ratio is likely to reflect the variation among metropolitan areas in the difficulty that workers without bachelor’s degrees have in obtaining middle-wage jobs.22 Our measure of accessibility compares the percentage of jobs that are middle wage with the percentage of workers who lack a bachelor’s degree, rather than directly comparing the number of middle-wage jobs with the number of workers without bachelor’s degrees. We do this because the job measure and the worker measure come from different surveys, making a direct comparison mislead-ing. Comparing the percentages solves this problem.
In some of our findings we use results for the aggregate of all 204 metropolitan areas for which we have data. These results are obtained by adding up all the middle-wage jobs in the 204 metropolitan areas in our sample. They not “national” estimates because they do not include jobs in smaller metro-politan areas not included in our sample; nor do they include nonmetropolitan jobs.
Findings
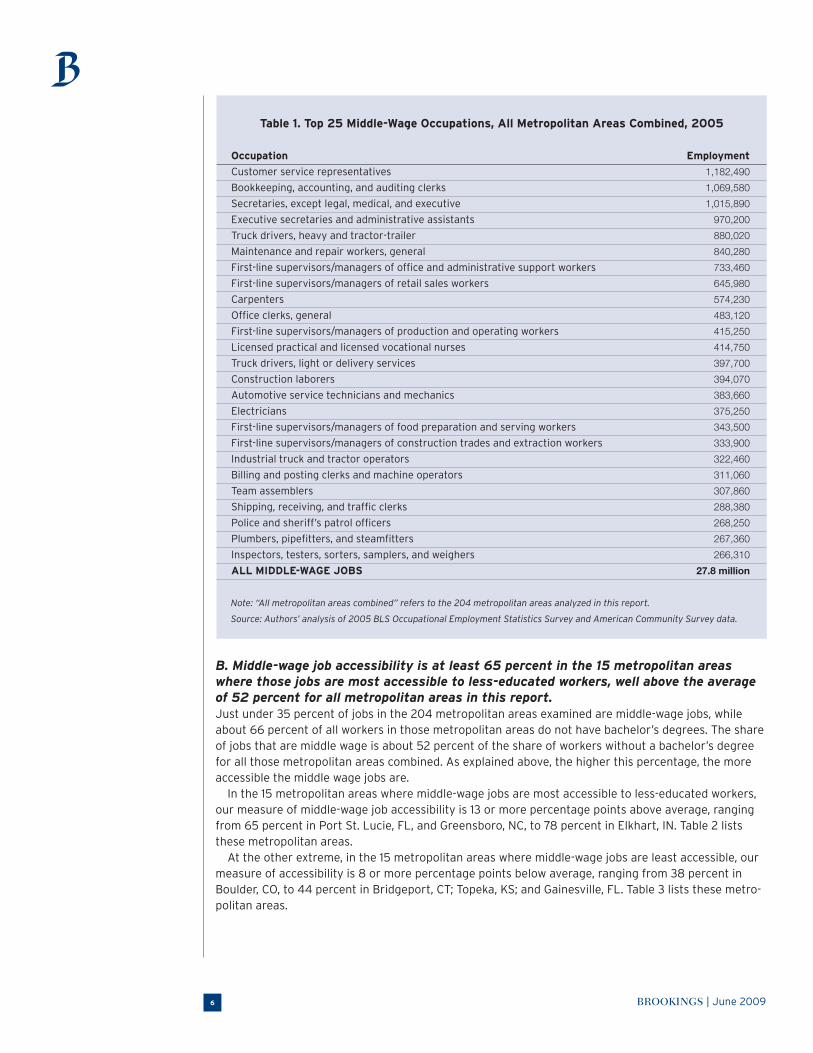
A. Many middle-wage jobs are in clerical, construction, and production occupations.The 25 middle-wage occupations with the most jobs in our 204 metropolitan areas have about 13.5 million jobs, nearly half the total number of middle-wage jobs in all 204 metropolitan areas combined. These top 25 middle-wage occupations include seven clerical occupations (bookkeeping, accounting, and auditing clerks; secretaries except legal, medical, and executive; executive secretaries and admin-istrative assistants; first-line supervisors/managers of office and administrative support workers; gen-eral office clerks; billing and posting clerks and machine operators; and shipping, receiving, and traffic clerks), five construction occupations (carpenters; construction laborers; electricians; first-line supervi-sors/managers of construction trades and extraction workers; and plumbers, pipefitters, and steamfit-ters), and four production occupations (first-line supervisors/managers of production and operating workers; industrial truck and tractor operators; team assemblers; and inspectors, testers, sorters, samplers, and weighers). They also include sales, transportation, maintenance and repair, technical, transportation, and service occupations. Table 1 shows these top 25 middle-wage occupations.
A few of these occupations are first-level supervisory jobs that typically require some previous experience, but most others are open to workers with no previous experience. Many, however, require some postsecondary education or training below the bachelor’s degree level. few of these jobs are narrowly associated with a particular industry. Most of these occupations will be found in any medium-sized or large metropolitan area.
appendix C (available at http://www.brookings.edu/reports/2009/0604_employment_sommers_osborne.aspx) shows the top 25 middle-wage occupations for 19 of the 20 largest metropolitan areas in the country. (We were unable to make estimates of middle-wage jobs for Miami.) The largest middle-wage occupations do not vary much among large metropolitan areas. among the top 25 middle-wage occupations in all 19 metropolitan areas are customer service representatives; bookkeeping, account-ing, and auditing clerks; secretaries except legal, medical, and executive; heavy and tractor-trailer truck drivers; general maintenance and repair workers; first-line supervisors/managers of retail sales workers; automotive service technicians and mechanics; and electricians. Executive secretaries and administrative assistants; first-line supervisors/managers of office and administrative support occupa-tions; carpenters; and first-line supervisors/managers of production and operating workers are among the top 25 middle-wage occupations in 18 of the 19 metropolitan areas. however, a few of the nation-wide metropolitan top 25 middle-wage jobs are on the top 25 lists in only a few of the 19 metropolitan areas. for example, team assemblers are among the top 25 middle-wage occupations only in St. louis and Tampa among the 19 metropolitan areas. General office clerks are among the 25 largest middle-wage occupations only in Boston, Dallas, houston, and Tampa among the 19.
BROOKINGS | June 20096
B. Middle-wage job accessibility is at least 65 percent in the 15 metropolitan areas where those jobs are most accessible to less-educated workers, well above the average of 52 percent for all metropolitan areas in this report. Just under 35 percent of jobs in the 204 metropolitan areas examined are middle-wage jobs, while about 66 percent of all workers in those metropolitan areas do not have bachelor’s degrees. The share of jobs that are middle wage is about 52 percent of the share of workers without a bachelor’s degree for all those metropolitan areas combined. as explained above, the higher this percentage, the more accessible the middle wage jobs are.
in the 15 metropolitan areas where middle-wage jobs are most accessible to less-educated workers, our measure of middle-wage job accessibility is 13 or more percentage points above average, ranging from 65 percent in port St. lucie, fl, and greensboro, NC, to 78 percent in Elkhart, iN. Table 2 lists these metropolitan areas.
at the other extreme, in the 15 metropolitan areas where middle-wage jobs are least accessible, our measure of accessibility is 8 or more percentage points below average, ranging from 38 percent in Boulder, CO, to 44 percent in Bridgeport, CT; Topeka, kS; and gainesville, fl. Table 3 lists these metro-politan areas.
Table 1. Top 25 Middle-Wage Occupations, All Metropolitan Areas Combined, 2005
Occupation Employment
Customer service representatives 1,182,490
Bookkeeping, accounting, and auditing clerks 1,069,580
Secretaries, except legal, medical, and executive 1,015,890
Executive secretaries and administrative assistants 970,200
Truck drivers, heavy and tractor-trailer 880,020
Maintenance and repair workers, general 840,280
First-line supervisors/managers of office and administrative support workers 733,460
First-line supervisors/managers of retail sales workers 645,980
Carpenters 574,230
Office clerks, general 483,120
First-line supervisors/managers of production and operating workers 415,250
licensed practical and licensed vocational nurses 414,750
Truck drivers, light or delivery services 397,700
Construction laborers 394,070
automotive service technicians and mechanics 383,660
Electricians 375,250
First-line supervisors/managers of food preparation and serving workers 343,500
First-line supervisors/managers of construction trades and extraction workers 333,900
industrial truck and tractor operators 322,460
Billing and posting clerks and machine operators 311,060
Team assemblers 307,860
Shipping, receiving, and traffic clerks 288,380
Police and sheriff’s patrol officers 268,250
Plumbers, pipefitters, and steamfitters 267,360
inspectors, testers, sorters, samplers, and weighers 266,310
ALL MIDDLE-WAGE JOBS 27.8 million
Note: “All metropolitan areas combined” refers to the 204 metropolitan areas analyzed in this report.
Source: Authors’ analysis of 2005 BLS Occupational Employment Statistics Survey and American Community Survey data.

BROOKINGS | June 2009 7
Table 2. Top 15 Metropolitan Areas Where Middle-Wage Jobs Are Most Accessible to Less-Educated Workers
Middle-Wage Jobs Workers without BA Accessibility: Middle-Wage
as Percentage as Percentage Job Share as Percentage
Metropolitan Area of All Jobs of All Workers of Non-BA Worker Share
Elkhart, iN 64% 82% 78%
hickory, NC 59 79 75
las Vegas, NV 56 78 72
Barnstable Town, Ma 42 62 68
Deltona, fl 52 77 68
Brownsville, TX 55 81 68
Cape Coral, fl 50 75 67
York, pa 52 78 66
Springfield, MO 51 77 66
Sarasota, fl 48 73 66
Myrtle Beach, SC 51 77 66
Mcallen, TX 54 82 66
asheville, NC 44 67 66
greensboro, NC 47 72 65
port St. lucie, fl 50 77 65
Note: The third column may not exactly equal the ratio of the first to the second because of rounding.
Source: Authors’ analysis of 2005 BLS Occupational Employment Statistics Survey and American Community Survey data.
Table 3. Metropolitan Areas Where Middle-Wage Jobs Are Least Accessible to Less-Educated Workers
Middle-Wage Jobs Workers without BA Accessibility: Middle-Wage
as Percentage as Percentage Job Share as Percentage
Metropolitan Area of All Jobs of All Workers of Non-BA Worker Share
Boulder, CO 17% 44% 38%
San Jose, Ca 20 51 39
Trenton, NJ 22 56 39
huntsville, al 24 61 39
Durham, NC 20 49 41
San francisco, Ca 21 51 41
Oxnard, Ca 28 68 41
Tallahassee, fl 25 61 41
albany, NY 27 65 42
Washington, DC 21 49 42
Binghamton, NY 31 72 43
kennewick, Wa 33 76 43
Bridgeport, CT 23 53 44
Topeka, kS 31 70 44
gainesville, fl 26 59 44
Note: The third column may not exactly equal the ratio of the first to the second because of rounding.
Source: Authors’ analysis of 2005 BLS Occupational Employment Statistics Survey and American Community Survey data.

BROOKINGS | June 20098
appendix B shows the middle-wage job share, the worker share without bachelor’s degrees, and our measure of middle-wage job accessibility for each of the 204 metropolitan areas covered in this report.
C. Middle-wage jobs are slightly accessible to less-educated workers in small and medium-sized metropolitan areas, and metropolitan areas in the South.The middle-wage job share is about 54 percent of the share of workers without a bachelor’s degree in metropolitan areas of fewer than 250,000 people. it is 55 percent in those with populations of at least 250,000 but less than 500,000. it is 54 percent in those with populations of at least 750,000 but less than 1 million, and 51 percent in those with 1 million or more residents (figure 1).23 Only one of the 15 metropolitan areas where middle-wage jobs are most accessible (las Vegas) had a population of 1 mil-lion or more, while three of the 15 metropolitan areas where middle-wage jobs are least accessible are that large (San francisco, San Jose, and Washington, DC).
Metropolitan areas in the South offer better middle-wage job accessibility than those in any other region of the country (figure 2). Their middle-wage job share is 55 percent of the share of workers without bachelor’s degrees. Metropolitan areas in the Midwest, at 53 percent, are near the average for all metropolitan areas included here. Middle-wage job accessibility in Northeastern and Western metro-politan areas is lowest, at around at 50 percent in each region.
Ten of the 15 metropolitan areas where middle-wage jobs are most accessible are in the South (hickory, NC; Deltona, fl; Brownsville, TX; Cape Coral, fl; Sarasota, fl; Myrtle Beach, SC; Mcallen, TX; asheville, NC; greensboro, NC, and port St. lucie, fl), two each are in the Midwest (Elkhart, iN, and Springfield, MO) and Northeast (Barnstable Town, MA, and York, PA), and one is in the West (Las Vegas, NV).
Of the 15 metropolitan areas where middle-wage jobs are least accessible, five each are in the South (huntsville, al; Durham, NC; Tallahassee, fl; Washington, DC; and gainesville, fl) and West (Boulder, CO; San Jose, Ca; San francisco, Ca; Oxnard, Ca; and kennewick, Wa), four are in the Northeast (Trenton, NJ; albany, NY; Binghamton, NY; and Bridgeport, CT), and one is in the Midwest (Topeka, kS).
0
10
20
30
40
50
60
1 million+ 500,000 to999,999
250,000 to499,999
Less than250,000
0
10
20
30
40
50
60
1 million+ 500,000 to999,999
250,000 to499,999
Less than250,000
Figure 1. Middle-Wage Job Share as Percentage of Non-BA Worker Share, by Population
Note: Middle wage job accessibility is the middle-wage job share as a percentage of the non-BA worker share.
Source: Authors’ analysis of 2005 BLS Occupational Employment Statistics Survey and American Community Survey data.

BROOKINGS | June 2009 9
D. Less-educated workers enjoy above-average access to middle-wage jobs in metropoli-tan areas that specialize in leisure and hospitality and manufacturing industries. Metropolitan areas that specialize in leisure and hospitality industries (hotels, restaurants, perform-ing arts, sports, and the like) offer much better than average middle-wage job accessibility. We define such metropolitan areas as those where the percentage of all jobs that are in leisure and hospitality industries is at least 125 percent of the national average. (See appendix a for a list of those metropoli-tan areas.) in these metropolitan areas, the middle-wage job share is 59 percent of the worker share lacking a bachelor’s degree, well above the 52 percent for all metropolitan areas included in this report (figure 3). Of the 15 metropolitan areas where middle-wage jobs are most accessible to less-educated workers, six (las Vegas, NV; Barnstable Town, Ma; Deltona, fl; Cape Coral, fl; Myrtle Beach, SC; and
0
10
20
30
40
50
60
WestMidwestSouthNortheast
0
10
20
30
40
50
60
WestMidwestSouthNortheast
Figure 2. Middle-Wage Job Share as Percentage of Non-BA Worker Share, by Region
Note: Middle wage job accessibility is the middle-wage job share as a percentage of the non-BA worker share.
Source: Authors’ analysis of 2005 BLS Occupational Employment Statistics Survey and American Community Survey data.
0
10
20
30
40
50
60
70
All metropolitan areasHigh techManufacturingLeisure and hospitality
0
10
20
30
40
50
60
70
All metropolitanareas
High techManufacturingLeisure andhospitality
Figure 3. Middle-Wage Job Share as Percentage of Non-BA Worker Share, by Industry Specialization
Note: Note: Middle wage job accessibility is the middle-wage job share as a percentage of the non-BA worker share. “All metro-
politan areas” includes all 204 metropolitan areas analyzed in this report.
Source: Authors’ analysis of 2005 BLS Occupational Employment Statistics Survey and American Community Survey data,
and Brookings Institution analysis of employment data provided by the economic consulting firm Moody’s Economy.com.

BROOKINGS | June 200910
asheville, NC) specialize in leisure and hospitality industries, while none of the 15 metropolitan areas where middle-wage jobs are least accessible specializes in those industries.
Middle-wage jobs are slightly more accessible than average in metropolitan areas that specialize in manufacturing (i.e., metropolitan areas in which the percentage of all jobs that are in manufacturing is at least 125 percent of the national average). in these metropolitan areas, listed in appendix a, the middle-wage job share is 54 percent of the worker share without a bachelor’s degree, slightly more than the 52 percent for all metropolitan areas included in this report. Of the 15 metropolitan areas where middle-wage jobs are most accessible to less-educated workers, four (Elkhart, iN; hickory, NC; York, pa; and greensboro, NC) specialize in manufacturing. four of the 15 metropolitan areas where middle-wage jobs are least accessible also specialize in manufacturing (San Jose, Ca; huntsville, al; Durham, NC; and Binghamton, NY).
Metropolitan areas that specialize in high-tech industries offer the poorest middle-wage job pros-pects for less-educated workers. in these metropolitan areas, the middle-wage job share is 48 percent of the share of workers without bachelor’s degrees, below the 52 percent for all metropolitan areas included in this report. None of the 15 metropolitan areas where middle-wage jobs are most accessible to less-educated workers specializes in high technology, but 11 of the 15 metropolitan areas where mid-dle-wage jobs are least accessible do (Boulder, CO; San Jose, Ca; Trenton, NJ; huntsville, al; Durham, NC; San francisco, Ca; Oxnard, Ca; Washington, DC; Binghamton, NY; kennewick, Wa; and Bridgeport, CT). appendix a lists the industries that we categorize as high-tech and the metropolitan areas that specialize in those jobs.
Our finding of a mismatch between high-tech specialization and job opportunities for less-educated workers points to a strong preference for an educated workforce in this industry. however, areas not known as advanced technology centers are also on the list of those with the least accessible middle-wage jobs. Those metropolitan areas are centered around state capitals or university towns (albany, NY; Tallahassee, fl; Topeka, kS; and gainesville, fl).
Public Policy OptionsThe accessibility of middle-wage jobs to less-educated workers varies widely among metropolitan areas. Middle-wage jobs are most accessible in small metropolitan areas, those that are located in the South, and those that specialize in leisure and hospitality or manufacturing. The major policy chal-lenge in metropolitan areas where middle-wage jobs are very accessible is to maintain this favorable balance. Middle-wage jobs are least accessible in large metropolitan areas, those in the Northeast or West, and those that specialize in high-tech industries. The challenge is to improve accessibility in these areas.
Economic and workforce development policies that maintain or increase the number of middle-wage jobs can improve middle-wage job accessibility. So can policies that encourage more working adults to enroll in four-year college degree programs, thereby reducing the number of people seeking middle-wage jobs. To craft such policies, economic and workforce developers must better understand the middle-wage jobs and middle-wage jobseekers in their metropolitan economies.
Understand middle-wage jobs and jobseekers in metropolitan economies. it is common for eco-nomic and workforce development professionals to use employment data and occupational projec-tions. although such analysis is helpful, practitioners can improve its relevance by using the concept of middle-wage jobs as outlined here.
Economic and workforce developers should use the publicly available data to understand what kinds of middle-wage jobs are currently available in their metropolitan economies. They should also use the data to identify trends in job creation and decline. To gain a more fine-grained understanding of middle-wage jobs, they should ask employers, employer associations, and worker associations to iden-tify the types of middle-wage jobs that exist, how those jobs and their wage rates are changing, and whether employers have any unmet needs.
Workforce developers should also compare occupational projections to graduation rates from community college programs to ensure that the number of graduates from technical/professional certificate and degree programs is in balance with the number of projected openings in middle-wage

BROOKINGS | June 2009 11
occupations. These analyses will reveal potential workforce shortages that educational institutions and workforce developers could avoid by expanding specific education and training programs.24
Workforce developers should also pay attention to retirements from middle-wage occupations in their regions. impending retirements of the baby boom generation are likely to create job openings in many occupations, regardless of whether the occupations are adding jobs. according to a Bureau of labor Statistics analysis, the 20 occupations likely to have the largest retiree replacement needs include four that are middle-wage occupations in many metropolitan areas: secretaries; heavy truck drivers; bookkeepers/accounting and auditing clerks, and construction supervisors.25
Use economic development policies to maintain or increase the number of middle-wage jobs. in metropolitan areas where middle-wage jobs are highly accessible to less-educated workers, eco-nomic developers should try to maintain or even increase these jobs. in general, retaining jobs requires understanding why employers may plan to reduce employment or close business establishments and developing policies to help employers avoid cutting jobs or closing establishments. likewise, increasing employment is often a matter of understanding and trying to remove the barriers that keep employers from expanding.
Economic developers may need to craft specific policies to meet the needs of specific industries that offer large numbers of middle-wage jobs. for example, metropolitan areas that specialize in leisure and hospitality often have very accessible middle-wage jobs. Those metropolitan areas are typically centers for tourism. Maintaining the attractiveness of those metropolitan areas to tourists may be necessary to preserve large numbers of middle-wage jobs in those places. Middle-wage jobs are also relatively accessible in metropolitan areas that specialize in manufacturing. preserving or expanding middle-wage manufacturing jobs may require working with the federal Manufacturing Extension partnership program’s local center to help small and medium-sized manufacturers improve productivity, modernize plants, find new markets for their products, and design new products.26
in metropolitan areas, such as high-tech centers, where middle-wage jobs are less accessible, eco-nomic developers should focus some of their resources on industries that pay relatively high wages to a less-educated workforce. for example, the aging of the population suggests that many regions will need to expand services for older people; these service industries often offer many middle-wage jobs. in addition, programs (such as the Manufacturing Extension partnership program) to improve the performance of manufacturers will, if successful, bring new middle-wage jobs into communities where the demands of employers for highly educated workers may have created an imbalance between local workforce skills and employer needs. in metropolitan areas that specialize in high-tech, economic developers should also promote technologically sophisticated manufacturing industries that may also employ production workers and technicians with community college degrees or certificates. Finally, federal, state, and local policies to raise the wages of low-wage jobs directly (e.g., raising the minimum wage and encouraging unionization) can help turn some low-wage jobs into middle-wage jobs.
Implement workforce development policies that complement economic development policies to maintain or expand middle-wage employment. Metropolitan areas with accessible middle-wage jobs may face labor shortages in these occupations. Shortages of qualified workers may even occur in metropolitan areas where middle-wage jobs are less accessible and may be a barrier to the expansion of middle-wage employment in those areas. in such places, workforce development policies should complement economic development policies directed at maintaining or increasing the number of middle-wage jobs. Workforce developers should work with employers to identify the skills needed for entry into particular middle-wage jobs, connect workers to existing community college programs (par-ticularly associate degree and certificate programs) that provide the required education and training, and work to expand those programs.
Workforce developers should also work with high-tech employers to determine whether some posi-tions currently filled by workers with bachelor’s degrees could be met in other ways. For example, associate degree or certificate programs at community colleges may be able to train certain computer programmers to meet employers’ skill demands.
federal and state governments should provide the additional funding needed to support the expan-sion of community college programs that train workers for middle-wage jobs. They could provide

BROOKINGS | June 200912
targeted funds through competitive grants conditioned on evidence that the local supply of trained workers in a particular middle-wage occupation falls short of employer demands.
In some cases, community colleges may be unable to train enough students to fill employer needs because faculty are in short supply in fields such as information technology and health care. Federal and state governments could offer grants to university teacher education programs to expand their training programs for certified vocational education teachers.27
Expand access to four-year college degree programs for working adults. a major federal effort to improve the affordability of four-year college education for working adults, including eliminating limits on federal financial aid for part-time students, will be needed to reduce the number of middle-wage jobseekers substantially. Universities and colleges with baccalaureate programs will also need to emulate some of the teaching strategies of community colleges (evening courses and teaching styles oriented towards adult learners) to assist the many working adults who might want to earn a bach-elor’s degree.
in addition, “upside-down” bachelor’s degree programs have the potential simultaneously to address skill shortages in some middle-wage occupations and increase education levels among working adults. an upside-down degree adds two years of college to a technical degree typically earned at a commu-nity or technical college. Students first complete a two-year technical degree program (e.g., an associ-ate in science program), which may provide the skills needed for a middle-wage job. They then spend the next two years studying subjects that broaden and extend their education, adding the familiar “distribution requirements” and other courses aimed at improving the problem-solving and adaptive skills of workers who want to move ahead in a technical career, perhaps aiming toward a management position. Some community colleges and cooperating four-year colleges already offer upside-down degrees.28 States should encourage their public community and four-year colleges to work together to make credits earned in a technical program at a community college more easily transferable to four-year schools.
Conclusion
Middle-wage jobs are an important part of every metropolitan labor market, but research-ers and policymakers have paid little attention to them. Metropolitan economic and workforce development policymakers and practitioners cannot control all the public policies that affect the accessibility of middle-wage jobs. State and federal policies on
access to higher education, assistance to low-income households, international trade, wages, unioniza-tion, and assistance to particular types of businesses (such as manufacturers), among other policies, powerfully shape the availability of middle-wage jobs and the number of people seeking those jobs in every metropolitan area. however, economic and workforce development policies tailored to the needs of workers and employers in each metropolitan area are needed to make middle-wage jobs more accessible to less-educated workers. This report gives metropolitan policymakers some of the back-ground knowledge they need to craft appropriate policies.
Appendix A: Technical Details
Educational attainment estimates for occupations within metropolitan areas. To be classified as a middle-wage job, an occupation must meet the median earnings criterion described in the text and must also have an estimated percentage of workers with bachelor’s degrees that is less than 40 percent. To estimate the percentage of workers in each occupation who have a bachelor’s degree in each metropolitan area, we began by distinguishing between three types of occupations in each met-ropolitan area: (1) those whose median earnings are below the median earnings floor described in the text, (2) those in which almost all incumbent workers have at least a bachelor’s degree (e.g., doctors, scientists, postsecondary teachers), and (3) all other occupations. Occupations in the first category cannot be middle-wage jobs because their wages are too low; therefore, there was no need to estimate

BROOKINGS | June 2009 13
the educational attainment of their workers. likewise, occupations in the second category cannot be middle-wage jobs because too large a percentage of their workers have bachelor’s degrees. Therefore, we estimated educational attainment only for occupations in the third category.29 The aCS microdata sample has 680,331 observations on individuals in these occupations. according to our analysis of the sample, those occupations had a percentage of incumbent workers with bachelors or higher degrees ranging from 20 to 60 percent nationwide.
Our estimates of educational attainment for occupations within metropolitan areas are based on the assumption that an individual worker’s probability of having a bachelor’s degree is made up of an occupational component that does not vary across metropolitan areas, a metropolitan area compo-nent that does not vary across occupations, and an individual-specific error. We estimated the follow-ing logit model on the ACS microdata:
ln [pijk
/(1- Pijk
)] = b0 + b
1iMSa
ik + b
2jOcc
jk + e
ijk
where
pijk
if the probability that individual k in occupation i and metropolitan area j has a bachelor’s degree or higher,
MSaik =1 if individual k lives in metropolitan area i (i = 1, . . . , 209) and MSa
ik =0 otherwise,
Occjk = 1 if individual k is employed in occupation j (j = 1, . . . , J where J is the number of occupations)
and Occjk = 0 otherwise, and
eijk
is an error term.
The estimated equation had a Cox and Snell R2 of 0.296, and a Nagelkerke R2 of 0.409. it correctly classified 87.7 percent of the observations for individuals who did not have a bachelor’s or higher degree and 56.7 percent of the observations for individuals who did have a bachelor’s or higher degree.
We derived final estimates of the proportion of workers with bachelor’s degrees in each occupation-metropolitan area cell by averaging the estimated probabilities across all individuals in that cell.30
for a small number of occupations, no logit estimates were available for a particular occupation in an individual metropolitan area. in these cases, we used the national estimate of occupational attain-ment of incumbent workers from the Occupational Employment Statistics files instead.
Classification of metropolitan areas by industry specialization. For finding D, we identified met-ropolitan areas that specialized in leisure and hospitality industries, manufacturing, and high tech in 2005. (Not all metropolitan areas specialized in one of these industries, and some specialized in more than one.) We defined metropolitan areas specializing in each of the three categories as those in which the percentage of all jobs in such industries (that is, NaiCS codes 71 and 72 for leisure and hospitality; 31-33 for manufacturing; and the NaiCS codes shown in Table a1 for high-tech industries) was at least 125 percent of the national average for those industries.31 Table a2 shows the metropolitan areas that specialize in each of the three industry groups.

BROOKINGS | June 200914
Table A1. High-Tech Industries NAICS code (2007) Industry
3254 pharmaceutical and Medicine Manufacturing
3341 Computer and peripheral Equipment Manufacturing
3342 Communications Equipment Manufacturing
3344 Semiconductor and Other Electronic Component Manufacturing
3345 Navigational, Measuring, Electromedical, and Control instruments Manufacturing
3364 aerospace product and parts Manufacturing
5112 Software publishers
5182 Data processing, hosting, and Related Services
5191 Other information Services
5413 architectural, Engineering, and Related Services
5415 Computer Systems Design and Related Services
5417 Scientific Research and Development Services
Source: Authors’ adaptation of high technology level 1 industries as classified in Daniel E. Hecker, “High-Technology Employ-
ment: A NAICS-Based Update,” Monthly Labor Review 128 (7) (July 2005): 57-72.
Table A2. Industry Specializations of Metropolitan Areas, 2005
Manufacturing Leisure and Hospitality High Tech
akron, Oh asheville, NC albuquerque, NM
appleton, Wi atlantic City, NJ austin-Round Rock, TX
Binghamton, NY Barnstable Town, Ma Baltimore-Towson, MD
Canton-Massillon, Oh Billings, MT Binghamton, NY
Cedar Rapids, ia Cape Coral-fort Myers, fl Boise City-Nampa, iD
Chattanooga, TN-ga Charleston-North Charleston, SC Boston-Cambridge-
Quincy, Ma-Nh
Cleveland-Elyria-Mentor, Oh Deltona-Daytona Beach- Boulder, CO
Ormond Beach, fl
Davenport-Moline-Rock island, ia-il fort Collins-loveland, CO Bridgeport-Stamford-
Norwalk, CT
Dayton, Oh fort Walton Beach-Crestview-Destin, fl Burlington-South Burlington, VT
Detroit-Warren-livonia, Mi glens falls, NY Colorado Springs, CO
Durham, NC gulfport-Biloxi, MS Dallas-fort Worth-arlington, TX
Eau Claire, Wi honolulu, hi Denver-aurora, CO
Elkhart-goshen, iN las Vegas-paradise, NV Detroit-Warren-livonia, Mi
Eugene-Springfield, OR Myrtle Beach-Conway- Durham, NC
North Myrtle Beach, SC
Evansville, iN-kY Napa, Ca fort Collins-loveland, CO
fayetteville-Springdale- Naples-Marco island, fl fort Walton Beach-
Rogers, aR-MO Crestview-Destin, fl
florence, SC New Orleans-Metairie-kenner, la hartford-West hartford-
East hartford, CT
fort Smith, aR-Ok Ocean City, NJ huntsville, al
fort Wayne, iN Orlando-kissimmee, fl kennewick-Richland-pasco, Wa
grand Rapids-Wyoming, Mi Reno-Sparks, NV los angeles-long Beach-
Santa ana, Ca
green Bay, Wi Salinas, Ca Manchester, Nh

BROOKINGS | June 2009 15
Table A2. Industry Specializations of Metropolitan Areas, 2005 (continued)
Manufacturing Leisure and Hospitality High Tech
greensboro-high point, NC San luis Obispo-paso Robles, Ca Minneapolis-St. paul-
Bloomington, MN-Wi
greenville, SC Santa Barbara-Santa Maria, Ca Oxnard-Thousand Oaks-
Ventura, Ca
hickory-lenoir-Morganton, NC Santa fe, NM palm Bay-Melbourne-
Titusville, fl
huntsville, al Savannah, ga philadelphia-Camden-
Wilmington, pa-NJ-DE-MD
kalamazoo-portage, Mi Shreveport-Bossier City, la phoenix-Mesa-Scottsdale, aZ
kingsport-Bristol-Bristol, TN-Va Wilmington, NC portland-Vancouver-
Beaverton, OR-Wa
lancaster, pa poughkeepsie-Newburgh-
Middletown, NY
lexington-fayette, kY provo-Orem, UT
lima, Oh Raleigh-Cary, NC
Manchester, Nh Salt lake City, UT
Milwaukee-Waukesha-West allis, Wi San Diego-Carlsbad-
San Marcos, Ca
Napa, Ca San francisco-Oakland-
fremont, Ca
peoria, il San Jose-Sunnyvale-
Santa Clara, Ca
Reading, pa Santa Barbara-Santa Maria, Ca
Rochester, NY Seattle-Tacoma-Bellevue, Wa
Rockford, il Trenton-Ewing, NJ
San Jose-Sunnyvale-Santa Clara, Ca Tucson, aZ
Scranton—Wilkes-Barre, pa Washington-arlington-
alexandria, DC-Va-MD-WV
South Bend-Mishawaka, iN-Mi Wichita, kS
St. Cloud, MN
Terre haute, iN
Toledo, Oh
Vineland-Millville-Bridgeton, NJ
Waco, TX
Wausau, Wi
Wichita, kS
Winston-Salem, NC
York-hanover, pa
Youngstown-Warren-Boardman, Oh-pa
Note: Metropolitan areas not listed in this table are those that do not specialize in manufacturing, tourism, or high technology.
Source: Brookings Institution analysis of data supplied by the economic consulting firm Moody’s Economy.com.

BROOKINGS | June 200916
Appendix B. Middle-Wage Jobs as Percentage of All Jobs; Workers without Bachelor’s Degrees as Percentage of All Workers; and Middle-Wage Job Accessibility,
by Metropolitan Area, 2005
Middle-Wage Jobs Workers without BA Accessibility: Middle-Wage
as Percentage as Percentage Job Share as Percentage
Metropolitan Area of All Jobs of All Workers of Worker Share without BA
abilene, TX 40% 75% 53%
akron, Oh 39 69 56
albany-Schenectady-Troy, NY 27 65 42
albuquerque, NM 34 67 51
allentown-Bethlehem-Easton, pa-NJ 40 71 56
anchorage, ak 37 72 52
appleton, Wi 42 76 55
asheville, NC 44 67 66
atlanta-Sandy Springs-Marietta, ga 32 61 52
atlantic City, NJ 44 74 60
augusta-Richmond County, ga-SC 40 74 54
austin-Round Rock, TX 31 60 52
Bakersfield, CA 45 81 56
Baltimore-Towson, MD 32 62 52
Bangor, ME 40 77 52
Barnstable Town, Ma 42 62 68
Baton Rouge, la 43 72 60
Beaumont-port arthur, TX 44 81 54
Bellingham, Wa 37 66 56
Billings, MT 34 75 45
Binghamton, NY 31 72 43
Birmingham-hoover, al 39 75 52
Boise City-Nampa, iD 32 70 46
Boston-Cambridge-Quincy, Ma-Nh 31 54 57
Boulder, CO 17 44 38
Bremerton-Silverdale, Wa 35 72 48
Bridgeport-Stamford-Norwalk, CT 23 53 44
Brownsville-harlingen, TX 55 81 68
Buffalo-Niagara falls, NY 35 71 49
Burlington-South Burlington, VT 29 57 51
Canton-Massillon, Oh 46 79 58
Cape Coral-fort Myers, fl 50 75 67
Cedar Rapids, ia 36 70 51
Charleston, WV 43 73 59
Charleston-North Charleston, SC 39 67 58
Charlotte-gastonia-Concord, NC-SC 35 67 52
Chattanooga, TN-ga 39 71 55
Chicago-Naperville-Joliet, il-iN-Wi 31 63 49
Chico, Ca 39 72 54
Cincinnati-Middletown, Oh-kY-iN 39 70 56
Clarksville, TN-kY 50 80 63
Cleveland-Elyria-Mentor, Oh 38 69 55
Colorado Springs, CO 33 64 52
Columbia, SC 38 64 59
Columbus, Oh 35 66 53

BROOKINGS | June 2009 17
Appendix B. Middle-Wage Jobs as Percentage of All Jobs; Workers without Bachelor’s Degrees as Percentage of All Workers; and Middle-Wage Job Accessibility,
by Metropolitan Area, 2005 (continued)
Middle-Wage Jobs Workers without BA Accessibility: Middle-Wage
as Percentage as Percentage Job Share as Percentage
Metropolitan Area of All Jobs of All Workers of Worker Share without BA
Corpus Christi, TX 43 79 54
Dallas-fort Worth-arlington, TX 36 67 54
Davenport-Moline-Rock island, ia-il 40 77 52
Dayton, Oh 38 72 53
Deltona-Daytona Beach-Ormond Beach, fl 52 77 68
Denver-aurora, CO 33 59 56
Des Moines-West Des Moines, ia 34 65 53
Detroit-Warren-livonia, Mi 33 69 48
Dover, DE 38 80 47
Duluth, MN-Wi 40 75 53
Durham, NC 20 49 41
Eau Claire, Wi 42 81 52
El paso, TX 44 77 57
Elkhart-goshen, iN 64 82 78
Eugene-Springfield, OR 43 73 59
Evansville, iN-kY 45 79 57
fargo, ND-MN 38 69 55
fayetteville, NC 42 77 55
fayetteville-Springdale-Rogers, aR-MO 33 72 46
florence, SC 43 79 54
fort Collins-loveland, CO 31 57 54
fort Smith, aR-Ok 44 81 54
fort Walton Beach-Crestview-Destin, fl 41 73 56
fort Wayne, iN 45 75 60
fresno, Ca 41 77 54
gainesville, fl 26 59 44
glens falls, NY 40 74 54
grand forks, ND-MN 42 76 55
grand Rapids-Wyoming, Mi 48 74 65
green Bay, Wi 42 76 55
greensboro-high point, NC 47 72 65
greenville, SC 44 72 61
gulfport-Biloxi, MS 49 76 65
hagerstown-Martinsburg, MD-WV 51 85 60
harrisburg-Carlisle, pa 36 72 50
hartford-West hartford-East hartford, CT 29 61 47
hattiesburg, MS 37 73 51
hickory-lenoir-Morganton, NC 59 79 75
honolulu, hi 32 66 49
houma-Bayou Cane-Thibodaux, la 45 83 54
houston-Sugar land-Baytown, TX 37 67 55
huntington-ashland, WV-kY-Oh 44 79 56
huntsville, al 24 61 39
indianapolis-Carmel, iN 38 67 57
Jackson, MS 39 65 60

BROOKINGS | June 200918
Appendix B. Middle-Wage Jobs as Percentage of All Jobs; Workers without Bachelor’s Degrees as Percentage of All Workers; and Middle-Wage Job Accessibility,
by Metropolitan Area, 2005 (continued)
Middle-Wage Jobs Workers without BA Accessibility: Middle-Wage
as Percentage as Percentage Job Share as Percentage
Metropolitan Area of All Jobs of All Workers of Worker Share without BA
Jacksonville, fl 38 71 53
kalamazoo-portage, Mi 35 72 49
kansas City, MO-kS 35 65 54
kennewick-Richland-pasco, Wa 33 76 43
killeen-Temple-fort hood, TX 43 79 55
kingsport-Bristol-Bristol, TN-Va 44 80 55
knoxville, TN 42 69 61
lakeland, fl 46 81 57
lancaster, pa 48 76 63
lansing-East lansing, Mi 33 70 47
las Vegas-paradise, NV 56 78 72
lexington-fayette, kY 37 57 65
lima, Oh 38 80 47
lincoln, NE 32 69 47
little Rock-North little Rock, aR 40 71 56
los angeles-long Beach-Santa ana, Ca 30 67 45
louisville-Jefferson County, kY-iN 42 70 60
Macon, ga 37 72 51
Madison, Wi 33 61 54
Manchester, Nh 36 66 55
Mcallen-Edinburg-Mission, TX 54 82 66
Memphis, TN-MS-aR 44 71 62
Milwaukee-Waukesha-West allis, Wi 36 66 55
Minneapolis-St. paul-Bloomington, MN-Wi 31 63 49
Modesto, Ca 43 81 53
Montgomery, al 40 74 54
Myrtle Beach-Conway-North Myrtle Beach, SC 51 77 66
Napa, Ca 34 65 53
Naples-Marco island, fl 44 69 64
Nashville-Davidson—Murfreesboro, TN 42 66 63
New haven, CT 33 63 52
New Orleans-Metairie-kenner, la 37 68 54
New York-Northern New Jersey-long island,
NY-NJ-pa 28 58 48
Ocean City, NJ 37 70 53
Ogden-Clearfield, UT 39 75 52
Oklahoma City, Ok 39 72 54
Omaha-Council Bluffs, NE-ia 35 71 49
Orlando-kissimmee, fl 41 69 59
Oxnard-Thousand Oaks-Ventura, Ca 28 68 41
palm Bay-Melbourne-Titusville, fl 32 71 45
parkersburg-Marietta-Vienna, WV-Oh 46 81 57
pensacola-ferry pass-Brent, fl 41 75 54
peoria, il 37 76 49
philadelphia-Camden-Wilmington, pa-NJ-DE-MD 29 64 45

BROOKINGS | June 2009 19
Appendix B. Middle-Wage Jobs as Percentage of All Jobs; Workers without Bachelor’s Degrees as Percentage of All Workers; and Middle-Wage Job Accessibility,
by Metropolitan Area, 2005 (continued)
Middle-Wage Jobs Workers without BA Accessibility: Middle-Wage
as Percentage as Percentage Job Share as Percentage
Metropolitan Area of All Jobs of All Workers of Worker Share without BA
phoenix-Mesa-Scottsdale, aZ 40 71 56
pittsburgh, pa 35 69 51
port St. lucie-fort pierce, fl 50 77 65
portland-South portland-Biddeford, ME 37 67 55
portland-Vancouver-Beaverton, OR-Wa 33 65 51
poughkeepsie-Newburgh-Middletown, NY 33 67 49
providence-fall River-Warwick, Ri-Ma 33 69 48
provo-Orem, UT 38 69 55
Raleigh-Cary, NC 30 54 56
Reading, pa 40 76 53
Redding, Ca 40 76 53
Reno-Sparks, NV 40 69 58
Richmond, Va 35 64 54
Riverside-San Bernardino-Ontario, Ca 44 79 56
Roanoke, Va 43 73 59
Rochester, NY 31 67 46
Rockford, il 42 77 54
Sacramento—arden-arcade—Roseville, Ca 35 67 53
Salem, OR 41 79 52
Salinas, Ca 37 75 50
Salt lake City, UT 41 71 58
San antonio, TX 40 73 55
San Diego-Carlsbad-San Marcos, Ca 28 63 44
San Jose-Sunnyvale-Santa Clara, Ca 20 51 39
San francisco-Oakland-fremont, Ca 21 51 41
San luis Obispo-paso Robles, Ca 33 70 47
Santa Barbara-Santa Maria, Ca 33 67 49
Santa fe, NM 32 57 56
Santa Rosa-petaluma, Ca 34 66 51
Sarasota-Bradenton-Venice, fl 48 73 66
Savannah, ga 35 67 52
Scranton—Wilkes-Barre, pa 44 76 58
Seattle-Tacoma-Bellevue, Wa 29 62 47
Shreveport-Bossier City, la 37 77 48
Sioux falls, SD 47 73 65
South Bend-Mishawaka, iN-Mi 41 72 57
Spokane, Wa 36 70 52
Springfield, IL 33 71 47
Springfield, MA-CT 36 67 54
Springfield, MO 51 77 66
St. Cloud, MN 45 81 56
St. louis, MO-il 36 69 52
Stockton, Ca 45 80 57
Syracuse, NY 33 70 47
Tallahassee, fl 25 61 41

BROOKINGS | June 200920
Appendix B. Middle-Wage Jobs as Percentage of All Jobs; Workers without Bachelor’s Degrees as Percentage of All Workers; and Middle-Wage Job Accessibility,
by Metropolitan Area, 2005 (continued)
Middle-Wage Jobs Workers without BA Accessibility: Middle-Wage
as Percentage as Percentage Job Share as Percentage
Metropolitan Area of All Jobs of All Workers of Worker Share without BA
Tampa-St. petersburg-Clearwater, fl 45 72 63
Terre haute, iN 39 78 50
Texarkana, TX-Texarkana, aR 45 83 54
Toledo, Oh 41 75 55
Topeka, kS 31 70 44
Trenton-Ewing, NJ 22 56 39
Tucson, aZ 35 69 50
Tulsa, Ok 42 73 57
Tyler, TX 42 76 55
Utica-Rome, NY 35 77 45
Vallejo-Fairfield, CA 35 74 47
Vineland-Millville-Bridgeton, NJ 41 82 50
Virginia Beach-Norfolk-Newport News, Va-NC 40 72 56
Visalia-porterville, Ca 48 84 57
Waco, TX 45 76 59
Washington-Arlington-Alexandria, DC-VA-MD-WV 21 49 42
Wausau, Wi 48 81 59
Wheeling, WV-Oh 43 77 56
Wichita, kS 36 73 49
Wilmington, NC 38 65 59
Winston-Salem, NC 33 70 47
Worcester, Ma-CT 30 65 46
Yakima, Wa 43 82 52
York-hanover, pa 52 78 66
Youngstown-Warren-Boardman, Oh-pa 43 78 55
Note: The third column may not exactly equal the ratio of the first to the second because of rounding.
Source: Authors’ analysis of 2005 BLS Occupational Employment Statistics Survey and American Community Survey data.
References
atkinson, Robert, and howard Wial. 2007. The Implications of Service Offshoring for Metropolitan Economies. Washington: Brookings.
Bernstein, Jared, and lawrence Mishel. 2008. “Economy’s gains fail to Reach Most Workers’ pay-checks.” Economic Policy Institute Briefing Paper 195. Washington: Economic Policy Institute.
Berube, alan. 2007. MetroNation. Washington: Brookings.
Brown, Bettina. 2000. Vocational Teacher Professional Development. Columbus: Ohio State University College of Education and human Ecology.
Card, David. 1999. “The Causal Effect of Education on Earnings.” in Orley ashenfelter and David Card, eds., Handbook of Labor Economics, Vol. 3A. Amsterdam: Elsevier.

BROOKINGS | June 2009 21
Christopherson, Susan, and Michael Belzer. 2009. “The Next Move: Positioning Metropolitan Regions for the Transformation of the freight Transport and Distribution System.” in Nancy pindus, howard Wial, and harold Wolman, eds., Urban and Regional Policy and Its Effects, Vol. 2. Washington: Brookings.
Day, Jennifer Cheeseman, and kurt J. Bauman. 2000. “have We Reached the Top? Educational at-tainment Projections of the U.S. Population.” Population Division Working Paper 43. Washington: U. S. Census Bureau.
Dohm, arlene. 2000. “gauging the labor force Effects of Retiring Baby Boomers.” Monthly Labor Review 123 (July): 17-25.
Ellwood, David T. 2001. “The Sputtering Labor Force of the 21st Century: Can Social Policy Help?” Working Paper 8321. Cambridge, MA: National Bureau of Economic Research.
greater louisville, inc. 2002. 2002 Visioning Report Update. louisville, kY.
Hecker, Daniel E. 2005. “High-Technology Employment: A NAICS-Based Update.” Monthly Labor Review 128 (July): 57–72.
Helper, Susan, 2008. “Renewing U.S. Manufacturing: Promoting a High Road Strategy.” EPI Briefing Paper 212. Washington: Economic Policy Institute.
holzer, harry J., and Robert i. lerman. 2007. America’s Forgotten Middle-Skill Jobs: Education and Training Requirements in the Next Decade and Beyond. Washington: Workforce Alliance.
Johnson, Carolyn Y. 2008. “Can Smallest State Be high-Tech hub?” The Boston Globe, february 27.
Jorgenson, Dale, and others. 2007. “U.S. labor Supply and Demand in the long Run.” paper prepared for Labor Supply in the New Century: 52nd Economic Conference, Federal Reserve Bank of Boston, June 18–20.
katz, lawrence f., and David h. autor, 1999. “Changes in the Wage Structure and Earnings inequality.” in Orley ashenfelter and David Card, eds., Handbook of Labor Economics, Vol. 3A. Amsterdam: Elsevier.
Osterman, paul. 2008. College for All? The Labor Market for College-Educated Workers. Washington: Center for american progress.
portland Development Commission. 2002. Economic Development Strategy for the City of Portland: Summary Report of the Blue Ribbon Committee. portland, OR.
Sommers, paul, and Mark gardner. 2007. “accessible Middle Wage Jobs in Seattle and the puget Sound Region.” Seattle Jobs Initiative Working Paper. Seattle: Seattle Jobs Initiative.
Sommers, paul, and Deena heg. 2002. Occupational Supply and Demand by Industry Cluster and Region. Report for Washington State Board for Community and Technical Colleges and Workforce Training and Education Coordinating Board. Seattle: Daniel J. Evans School of Public Affairs, University of Washington.
Walsh, anthony. 1987. “Teaching Understanding and interpretation of logit Regression.” Teaching Sociology 15: 178-183.

BROOKINGS | June 200922
Endnotes
1. paul Sommers is an economics and public policy professor at Seattle University. Drew Osborne is a graduate student in econom-
ics at the University of British Columbia.
2. for a review of the evidence, see lawrence f. katz and David h. autor, “Changes in the Wage Structure and Earnings inequality.”
in Orley ashenfelter and David Card, eds., Handbook of Labor Economics, vol. 3A (Amsterdam: Elsevier, 1999). In 1980, for
example, workers with bachelor’s degrees earned 42 percent more per hour than high school graduates, while in 2005, they
earned 74 percent more. paul Osterman, College for All? The Labor Market for College-Educated Workers (Washington: Center
for american progress, 2008), p. 5.
3. in 1980, 21.6 percent of the labor force aged 25 or older had at least a bachelor’s degree. in 2000, 30.2 percent did. David
T. Ellwood, “The Sputtering Labor Force of the 21st Century: Can Social Policy Help?” Working Paper 8321 (Cambridge, MA:
National Bureau of Economic Research, 2001), p. 89, table 2.
4. See, e.g., David H. Autor, Lawrence F. Katz, and Alan B. Krueger, “Computing Inequality: Have Computers Changed the Labor
Market?” Quarterly Journal of Economics 113 (1998): 1169-1213, and Osterman, College for All?
5. Ellwood, “Sputtering labor force,” p. 16. This estimate is for 2000.
6. Ellwood, “Sputtering labor force,” p. 89, table 2.
7. harry J. holzer and Robert i. lerman, America’s Forgotten Middle-Skill Jobs: Education and Training Requirements in the Next
Decade and Beyond (Washington: The Workforce Alliance, 2007).
8. Dale Jorgenson and others, “U.S. labor Supply and Demand in the long Run.” paper prepared for labor Supply in the New
Century: 52nd Economic Conference, Federal Reserve Bank of Boston, June 18–20, 2007.
9. Jennifer Cheeseman Day and kurt J. Bauman, “have We Reached the Top? Educational attainment projections of the U.S.
Population” (Washington: U.S. Census Bureau, 2000).
10. Jared Bernstein and lawrence Mishel, “Economy’s gains fail to Reach Most Workers’ paychecks.” Economic policy institute
Briefing Paper 195 (Washington: Economic Policy Institute, 2007).
11. Robert atkinson and howard Wial, The Implications of Service Offshoring for Metropolitan Economies (Washington: Brookings,
2007).
12. portland Development Commission, Economic Development Strategy for the City of Portland: Summary Report of the Blue
Ribbon Committee (2002).
13. Carolyn Y. Johnson, “Can Smallest State Be high-Tech hub?” The Boston Globe, february 27, 2008, available at www.boston.
com/news/local/rhode_island/articles/2008/02/27/can_smallest_state_be_high_tech_hub,
14. an internet search using the terms “high tech” and “economic development” reveals states and localities in all regions of the
country pursuing high-tech development in one way or another. a search using the phrase “technology based development”
reveals many more.
15. for example, logistics and distribution is a key component of the economic development strategy of the leading economic devel-
opment organization in metropolitan louisville, kY. See greater louisville inc., 2002 Visioning Report Update (2002).
16. See Susan Christopherson and Michael Belzer, “The Next Move: Positioning Metropolitan Regions for the Transformation of the
freight Transport and Distribution System.” in Nancy pindus, howard Wial, and harold Wolman, eds., Urban and Regional Policy
and Its Effects, vol. 2 (Washington: Brookings, 2009).
17. holzer and lerman, America’s Forgotten Middle-Skill Jobs, p. 8.
18. for the vast majority of workers, and particularly for those without a bachelor’s degree, the job market that matters is the one
in the metropolitan area in which they live. Our analysis of 2007 Census population estimates for metropolitan areas (www.
census.gov/popest/metro/tables/2007/CBSA-EST2007-01.csv) and for the entire United States (www.census.gov/popest/national/
files/NST-EST2007-alldata.csv) shows that 83.5 percent of the U.S. population lives in metropolitan areas. In the 100 largest
metropolitan areas, 94 percent of workers worked and lived in the same metropolitan area in 2000. alan Berube, MetroNation
(Washington: Brookings, 2007), p. 29. Few workers move to a different metropolitan area in search of a job. Only 13 percent of all
U.S. residents moved from an initial metropolitan location between 2006 and 2007, and under 5 percent, a little more than one-
third of the movers, relocated outside their initial metropolitan area. authors’ calculation based on data in U.S. Census Bureau,
Current population Survey, 2007 annual Social and Economic Supplement, Table 16, available at www.census.gov/population/
socdemo/migration/cps2007/tab16.xls.
19. The original files include fields for all managers as well as detailed data on specific types of managers, all production workers as
well as specific occupations such as machinists, etc.
20. We chose an 82 percent cutoff because this was the highest percentage for which we were able to include all of the five largest
metropolitan areas.
21. paul Sommers and Mark gardner, “accessible Middle Wage Jobs in Seattle and the puget Sound Region,” Seattle Jobs initiative

BROOKINGS | June 2009 23
Working Paper (Seattle: Seattle Jobs Initiative, January 2007).
22. Some people may be willing to accept jobs that pay less than middle wages because they rely in part on other sources of income,
such as student financial aid or the earnings of other family members.
23. all population data cited in this paragraph are Census estimates for 2005.
24. for example, in Washington state, the community college system has programs training students to enter many occupations, but
the total number of program completers leaving the colleges is only about 85 percent of the projected demand from employ-
ers in the state. paul Sommers and Deena heg, Occupational Supply and Demand by Industry Cluster and Region. Report for
Washington State Board for Community and Technical Colleges and Workforce Training and Education Coordinating Board
(Seattle: Daniel J. Evans School of Public Affairs, University of Washington, 2002).
25. arlene Dohm, “gauging the labor force Effects of Retiring Baby Boomers,” Monthly Labor Review 123 (July 2000): 17-25.
26. For more on the federal Manufacturing Extension Partnership program, see Susan Helper, “Renewing U.S. Manufacturing:
Promoting a High Road Strategy.” EPI Briefing Paper 212 (Washington: Economic Policy Institute, 2008).
27. Brown suggests upgrading professional development programs for vocational instructors, bringing in new technology and
assisting qualified industry experts in making the transition into vocational education. See Bettina Brown, Vocational Teacher
Professional Development (Columbus: Ohio State University College of Education and Human Ecology, 2000).
28. See examples of upside down degree programs at Evergreen State College (www.evergreen.edu/admissions/UpsideDown.htm)
and Whitworth University (www.whitworth.edu/Academic/Department/AdultDegree/BachelorLiberalStudies.htm).
29. We also tried estimating our educational attainment model (described in appendix a) using all occupations in all three groups,
but the model would not converge.
30. for details see anthony Walsh, “Teaching Understanding and interpretation of logit Regression,” Teaching Sociology 15 (1987):
178-183.
31. We adapted the list of high-tech industries in Table A1from Hecker’s list of high technology level 1 industries. Hecker defined such
industries as those in which scientists, engineers, and technicians made up at least 24.7 percent of industry employment. We
used 2007 NAICS industry definitions rather than the 2002 NAICS industry definitions that Hecker used. See Daniel E. Hecker,
“High-Technology Employment: A NAICS-Based Update,” Monthly Labor Review 128 (July 2005): 57-72.
AcknowledgmentsThe authors thank howard Wial and three anonymous reviewers for editorial comments and alec friedhoff for research assistance. The Brookings institution Metropolitan policy program thanks the John D. and Catherine T. Macarthur foundation for its support of this report and of the Metropolitan Economy initiative.
For More Informationpaul Sommersinstitute of public Service207 Casey BuildingSeattle UniversitySeattle, Wa [email protected](206) 296-6967
For General InformationThe Brookings institution Metropolitan policy program(202) 797-6139www.brookings.edu/metro
1775 Massachusetts avenue, NW Washington D.C. 20036-2188telephone 202.797.6000fax 202.797.6004web site www.brookings.edu
telephone 202.797.6139 fax 202.797.2965web site www.brookings.edu/metro
Brookings
About the Brookings Institution Metropolitan Economy InitiativeTo inform debate about metropolitan economic development, the Brookings institution has launched a series of analyses designed to promote understanding of the economic transformation underway in the nation’s metropolitan areas. The Metropolitan Economy initiative provides practi-cal research and policy advice that state and local leaders can use to maximize their communities’ economic potential and achieve prosperity.
In the Series:• The Local Economic Impact of “Eds & Meds”:
How Policies to Expand Universities and Hospitals Affect Metropolitan Economies
• Living Wage Laws: How Much Do (Can) They Matter?
• Where Workers Go, Do Jobs Follow?• Bearing the Brunt: Manufacturing Job Loss in the
Great Lakes Region, 1995–2005• The Implications of Service Offshoring for
Metropolitan Economies• New Housing, Income Inequality, and Distressed
Metropolitan Areas