CAUSES AND CONSEQUENCES FOR POLITICAL ECONOMY
255
TAX PILFRAGE IN PAKISTAN – CAUSES AND CONSEQUENCES FOR POLITICAL ECONOMY PhD Dissertation To be presented at the Faculty of Contemporary Studies National Defence University, Islamabad in partial fulfillment for the degree of Doctor of Philosophy in Government and Public Policy Asad Kamal Registration No: NDU-GPP-PhD/S-13/015 Supervisor Dr. Muhammad Bashir Khan Faculty of Contemporary Studies, Department of Government and Public Policy, National Defence University, Islamabad, Pakistan. 2020
-
Upload
khangminh22 -
Category
Documents
-
view
1 -
download
0
Transcript of CAUSES AND CONSEQUENCES FOR POLITICAL ECONOMY

TAX PILFRAGE IN PAKISTAN – CAUSES
AND CONSEQUENCES FOR POLITICAL
ECONOMY
PhD Dissertation
To be presented at the Faculty of Contemporary Studies National
Defence University, Islamabad in partial fulfillment for the degree of
Doctor of Philosophy in Government and Public Policy
Asad Kamal
Registration No: NDU-GPP-PhD/S-13/015
Supervisor
Dr. Muhammad Bashir Khan
Faculty of Contemporary Studies, Department of
Government and Public Policy,
National Defence University, Islamabad, Pakistan.
2020


Acknowledgement
First of all I would thank the ALMIGHTY without whose blessings this degree would not have
been possible.
I would like to acknowledge my parents and siblings who have supported throughout my life and
are the main reason I have reached this stage in my life, who have also been my motivational
source throughout this journey.
I would also like to acknowledge my supervisor Dr. Muhammad Bashir Khan from National
Defence University; Dr Sarfraz Hussain Ansari as a teacher of doctoral studies; Dr. Shahzad
Hussain for overall guidance throughout the PhD studies – all of whom were an infinite support
and motivation throughout my doctoral degree. Other faculty member od National Defence
University on the whole for their support as well as all my PhD classmates.
I would also like to support my current organzationa – PAF – that enabled me to continue my
studies. in this regard I highly appreciate the efforts of Air Marshall Arsha Malik Chairman PIA
who enabled my to continue my studies. I would also like to thank Muhammad Zafar Khan of PAF
for giving me support during the course of my degree.
I would also thank my collegues from NDU who helped me as required. Dr. Fiaz Kazmi, Dr Naila
Erum, Dr. Shahzad Rao and Dr. Muhammad Zaheer Khan who motivated me in tough times and
also assisted me in times of need.

Dedication
This thesis is dedicated to my parents, siblings and daughter.

i
ABSTRACT
Taxation and pilferage are very old phenomena and were there in ancient civilizations as well. Tax evasion
is widespread in Pakistan and is a significant cause of poor tax collection since inception that has led to
inadequate provision of public services. The study measured attitude towards tax evasion, their
demographic profile and tax morale through a survey. The study included a sample of 400 potential
taxpayers who were randomly selected and their responses were taken on a carefully constructed
questionnaire. The questions measured evasion behavior, tax morale and demographic indicators.
Responses of questions were taken on a six point likert scale. The data was analyzed using using Linear
Regression and Chi Square Test (wherever applicable).
The results of the survey suggest that in terms of demographic variables, income level and age both had
significantly positive relationship with tax evasion while gender and educational level had insignificant
relationship. Similarly, in terms of tax morale, perceived penalties and elements of shame had significantly
inverse relationship with tax evasion while perceived extent of utilization of tax money on public services
had significantly positive relationship. However, Gender, Educational level, perceived corruption and
element of guilt had insignificant relationship with tax evasion in the country. The findings were robust at
95% level of significance.
The study also touched upon some political and economic consequences of tax evasion that has affected the
economic growth of Pakistan. the first issue is related to inflation. Tax evasion leads to too much money
held by the private sector causing price hike. Another important consequence of tax evasion is related to
public debt where the government - in order to fulfill its responsibilities – has to borrow from internal and
external sources to finance its expenditures. This borrowing is done to fulfill certain government
requirements like provision of basic public services to its citizens that has political repercussions as most
citizens in developing nations like Pakistan depend on such public services. Secondly, due to lack of
finances, the government is unable to finance PSEs and so the government has to go for borrowing.
The study concludes by giving some policy implications which includes progressive fines on evasion, public
awareness regarding tax payment, depicting payment as a social norm and control of corruption in tax
administration. Use of media in this regard is of much importance.

ii
Table of Contents
ABSTRACT .................................................................................................................................... i
LIST OF TABLES ........................................................................................................................... v
LIST OF FIGURES ....................................................................................................................... vi
.......................................................................................................................................... 1
INTRODUCTION ........................................................................................................................... 1
Historical Background ................................................................................................................. 1
Tax System of Pakistan ................................................................................................................ 3
Tax Collection in Pakistan ....................................................................................................... 4
Types of Taxes ......................................................................................................................... 5
Direct Taxes ............................................................................................................................. 5
Tax Evasion and Underground Economy in Pakistan................................................................ 10
Tax Collection Profile for the Years 2010 – 2015 ..................................................................... 11
Tax Collection FY 2012 – 13 ................................................................................................. 15
Tax Collection FY 2013-14 .................................................................................................... 17
Tax Collection FY 2014-15 .................................................................................................... 18
Initiatives by Government as of 2015 to 2018 ....................................................................... 19
Statement of the Problem ........................................................................................................... 20
Objectives of the Study .............................................................................................................. 21
Significance of the Study ........................................................................................................... 21
Organization of the Study .......................................................................................................... 23
........................................................................................................................................ 24
LITERATURE REVIEW .............................................................................................................. 24
Role of Taxation in Economic Growth ...................................................................................... 24
Tax Collection in Developing Countries ................................................................................... 26
Tax Issues in Pakistan ................................................................................................................ 28
Determinants of Tax Evasion ..................................................................................................... 29
Hypothesis .................................................................................................................................. 58
........................................................................................................................................ 65
METHODOLOGY ........................................................................................................................ 65
Research Methods ...................................................................................................................... 65
Type of Data (Primary VS Secondary) ...................................................................................... 66

iii
Approach used to Measuring Tax Evasion ................................................................................ 66
Questionnaire Development ....................................................................................................... 70
Rationale behind integrative research design / methods ............................................................ 72
Figure 3-1: Conceptual Framework of the Study ....................................................................... 73
Operationalization of Concepts .................................................................................................. 73
Selection of Appropriate Scale .................................................................................................. 78
Pilot Testing ............................................................................................................................... 82
Rectification of questionnaire .................................................................................................... 83
Re-testing ................................................................................................................................... 83
Population and Sample Size ....................................................................................................... 84
Rationale behind Target population –The Salaried Class .......................................................... 85
Study Area .................................................................................................................................. 87
Data Analysis ............................................................................................................................. 87
Research paradigms ................................................................................................................... 95
........................................................................................................................................ 97
DEMOGRAPHIC PROFILE OF RESPONDENTS ..................................................................... 97
Gender of Respondents ............................................................................................................ 100
Income Level of Respondents .................................................................................................. 101
Educational Qualification......................................................................................................... 102
Ethnic Background of the Respondents ................................................................................... 105
...................................................................................................................................... 119
FINDINGS AND ANALYSIS .................................................................................................... 119
Demographic Variables and Tax Evasion ................................................................................ 119
Age and Tax Evasion ........................................................................................................... 119
Gender and Tax Evasion ...................................................................................................... 122
Income Level of Respondents .............................................................................................. 124
Educational Qualification of Respondents ........................................................................... 128
Tax Morale and Tax Evasion ................................................................................................... 131
Perceived Shame and Guilt .................................................................................................. 133
Trust in Government ............................................................................................................ 144
Perception about others paying taxes ................................................................................... 150
Penalties on of Tax Evasion ................................................................................................. 153
Summary of Key Findings ....................................................................................................... 156

iv
...................................................................................................................................... 157
CONSEQUENCES OF EVASION ON POLITICAL ECONOMY ........................................... 157
Political Economy .................................................................................................................... 157
Consequences of Tax Evasion on Political Economy .............................................................. 161
...................................................................................................................................... 165
CONCLUSION AND POLICY IMPLICATIONS ..................................................................... 165
Conclusion ............................................................................................................................... 165
Policy Implications .................................................................................................................. 167
Implication for Stakeholders .................................................................................................... 178
...................................................................................................................................... 185
FUTURE RECOMMENDATIONS ............................................................................................ 185
Limitations of The Study ......................................................................................................... 185
Recommendations for Future Research ................................................................................... 185
REFRENCING ............................................................................................................................ 187
APPENDICES ............................................................................................................................. 235
Appendix A .............................................................................................................................. 235
Appendix B .............................................................................................................................. 236
Appendix C .............................................................................................................................. 238

v
LIST OF TABLES
Table 1-0-1 : Tax Collection FY 2010 – 11 .................................................................................. 12 Table 1-0-2 : Tax Collection FY 2011 - 12 ................................................................................... 14 Table 3-1: First indicator of Tax Evasion ...................................................................................... 92 Table 3-0-2 : Second indicator of Tax Evasion ............................................................................. 93 Table 3-0-3 : Third Indicator of Tax Evasion ................................................................................ 93
Table 4-1 : Age of the Respondent ................................................................................................ 97 Table 4-2 : Gender of Respondents ............................................................................................. 100 Table 4-3 : Education-wise roportion of Pakistan ....................................................................... 101 Table 4-4: Income Level .............................................................................................................. 102 Table 4-5 : Education Qualification ............................................................................................ 103
Table 4-6: Provincial Share of Survey Population ...................................................................... 106 Table 4-7 : Province wise Population as in 1998 Census ............................................................ 107
Table 4-8 : Area-wise represenatation of respondents ................................................................ 108 Table 4-9 : Percentage of Response on first indicator of Evasion ............................................... 112
Table 5-1: Chi Square Test (Age Vs Tax Evasion Behavior) ..................................................... 120 Table 5-2 : Cramer’s V : Age Vs Tax Evasion Behavior ............................................................ 121 Table 5-3 : Chi Square Test (Gender and Evasion Behavior) ..................................................... 123
Table 5-4 : Cramer’s V (Gender VS Evasion Behavior) ............................................................. 123 Table 5-5 : Chi Square Test (Income Level VS Evasion Behavior) ............................................ 126
Table 5-6 : Craver’s V (Income Level VS Evasion Behavior) .................................................... 127 Table 5-7 : Chi Square Test (Education VS Evasion Behavior) ................................................. 130 Table 5-8 : Chi Square Test (Fear of being listed VS Evasion Behavior) ................................... 136
Table 5-9 : Cramer’s V (Fear of being listed VS Evasion Behavior) .......................................... 136
Table 5-10 : Chi Square Test (Fear of being Reported VS Evasion Behavior) ........................... 139 Table 5-11 : Cramer’s V (Fear of Being Reported VS Evasion Behavior) ................................. 139 Table 5-12 : Chi Square Test (Perceived Guilt VS Evasion Behavior) ....................................... 143
Table 5-13 : Chi Square Test (responsibility towards Others VS Evasion Behavior) ................. 143 Table 5-14 : Chi Square Test (Perceived Service Delivery VS Evasion Behavior) .................... 148
Table 5-15 : Cramer’s V (Peerceived Service Delivery VS Evasion Behavior) ......................... 148
Table 5-16 : Chi Square Test (Perceived Corruption VS Evasion Behavior) ............................. 150 Table 5-17 : Chi Square Test (Perceived Social Norms VS Evasion Behavior) ......................... 152
Table 5-18 : Cramer’s V (Perceived Social Norms VS Evasion Behavior) ................................ 152 Table 5-19 : Chi Square Test (Perveiced Penalties VS Evasion Behavior) ................................ 154 Table 5-20 : Cramer’s V (Perceived Penalties VS Evasion Behavior) ....................................... 155

vi
LIST OF FIGURES
Figure 3-1: Conceptual Framework of the Study .......................................................................... 73 Figure 3-2: Graphical Representtion of Tax Evasion indicators ................................................... 94 Figure 3-3 : Fiscal Psychological Theory ...................................................................................... 96
Figure 4-1 : Age Profile of Pakistan .............................................................................................. 99 Figure 4-2: Geographical Representation of Population as per 1998 Census ............................. 107 Figure 4-3 : Depiction of Central Punjab Area ............................................................................ 109 Figure 5-1 : Response of Fear of Being included in Defaulters List ........................................... 135
Figure 5-2: Perception regarding being reported on evasion ....................................................... 138 Figure 5-3 : Graphical Representation of Responses on Guilt .................................................... 142 Figure 5-4: Response Chart for Social Norm and Rax Evasion .................................................. 151

1
TAX EVASION IN PAKISTAN – CAUSES AND CONSEQUENCES
FOR POLITICAL ECONOMY
INTRODUCTION
Historical Background
“Nothing is certain but death and taxes” - Benjamin Franklin. Taxes trace their origin as old as
3000 BC when in ancient Egypt, Pharaohs used to take part of harvest as taxes. As mentioned in
the bible, Chapter 47, Verse 33, Pharaohs used to send his commissioners to collect one-fifth of
grains harvested as taxes. According to archeological records, the first available records of taxation
can be traced to The Egyptian King Scorpion the First who ruled the Southern Egypt between 3300
and 3200 BC (Samsun 2002). Taxation existed in the ancient times in other empires outside Egypt
also. Taxes also existed in the region of Mesopotamia dating back to 2500 BC where citizens of
Babylonia paid taxes to the government for many purposes the foremost of which being enabling
the government to spend on maintaining the irrigation canals from Euphrates and the Tigris rivers
(Garbutt 1984).
Taxation was also found in the Achaemenid Empire between 538 and 330 BC where the central
government in collaboration with the provincial governments levied taxes on the citizens as the
King’s share (Kleber 2015). Similarly taxation was also found out to be a major object recorded
by archeologists in the Inca civilization in the present day Peru. The empire flourished during the
1500 century AD where taxation was an integral part of the economic and social development of
the rising empire (Yeakel 1983). The conquered tribes were required to pay taxes to the central
government that in turn provided them with road infrastructure and protection and also provided
food in case of famine like situation in a particular tribe or area. Similarly China and Greece also
imposed war taxation on their citizens while the Roman Empire were pioneers in levying customs
duties on imports and exports that was known as Portoria (Adams 1993).

2
Like taxation, tax evasion also has its roots deeply entrenched in history. In Ancient Egypt, the
Pharaohs had employed their representatives called ‘Scribes’ who were responsible to collect tax
on their behalf. These scribes were empowered to collect tax and had their own tax courts that
could not be challenged by the taxmen (Rostovtzeff 1953). As the Pharaohs were perceived by
their citizens as God therefore they did not want to press their masses to an extent where they start
revolting against them. The Pharaohs would even let those citizens go untaxed whose harvest was
poor (Ehrenberg 1960). Moreover, given much powers, even the scribes were not given autonomy.
These administrators were also kept under surveillance. Special agents were employed who had
been tasked to keep a check on overtaxing by the scribes and were also authorized to spy on the
scribes to ensure any corrupt practice was not being carried out (C. Adams 2001).
The first available record of corruption and tax heavens can also be seen form the ancient Egypt.
According to (Adams, 2001), as scribes were given tremendous judicial and executive powers over
taxation they indulged in unfair practices of overtaxing the masses. The special agents who were
tasked to restrict such practices and listen to tax related complaints. Although these agents were
subject to extreme punishments (having his nose cut off) on non-compliance still they collaborated
with the scribes and both parties shared the tax money generated. Similarly during the 17 year
reign of Akhenaten, all the temples and religious buildings were exempted from taxation that
provided a tax heaven for tax evaders. That practice enabled many evaders to get away from the
scribes that ultimately resulted in the decline of tax revenue during that time period.
In Ancient Greece, the tax money collected was used for the construction of road and other public
facilities (Viljoen 2016). All the rich members of the society were approached to forcefully fund
projects and it had become a status symbol in Greece at that time that proved a person to be wealthy
(Frank 2012). Apart from such funding, other taxes were also there in Greece. Like the Egyptian
Scribes, The Greek government also had agents who were responsible to collect taxes as part of
harvest (Viljoen, 2016). Such taxes were easier to evade as agents were not there at the time of
harvesting. In order to compensate for the lost revenue as a result of evasion in harvesting, foreign
merchants in Athens were levied with Poll Tax (Roberts 2002). People also tried to evade poll tax
by forging their birth certificates as a person having both parents form Greece were exempt from
such tax. Such practices of evasion on harvesting and poll tax were there despite the fact that heavy
punishments were there for non-compliance (Adams, 2001).

3
The Roman empire that boasted off being the greatest civilization of that time and were confident
of having a strong army that could never be defeated was defeated by Odovacor and his army in
the year 476 AD. The main cause of that invasion was attributable to tax evasion by some
historians. The Roman empire did not have enough revenue available to sustain its military that
led to the invasion by Odovacor (Cousin 2015). During the third century AD, Diocletian, the then
emperor of the Roman Empire tried to build his empire such that it could not be defeated easily
(Cousin, 2015). However, in order to persue his goals, he taxed his masses heavily in the form of
harvest tax. He also employed tax agents who would use harsh techniques to receive taxes that
resulted in poor farmers selling their lands to the rich ones (Viljoen, 2016).
The rich farmers in turn started bribing the agents and hence tax evasion rose in the empire that
ultimately led to lower revenue collections (Pope 2010) and ultimately a hindrance in fulfilling the
desired goal of Diocletian. When Julian assumed power, he determined higher taxes as the main
reason of poor tax collection and reduced taxes. However, the taxes were again doubled to support
the Roman Army at that time that again led to the previously deteriorated situation. People could
not bear the burden of those taxes and after selling their lands, the farmers also sold their slaves
who were useless for them to fight in the military (Viljoen, 2016) that ultimately led to the demise
of the great Roman Empire (Adams, 2001).
Tax System of Pakistan
The system of Pakistan is based on the revenue-sharing structure provided under the Government
of India Act 1935 that served as a guideline for future constitutions of the country in distributing
financial powers between the Federation and provinces (Khan A. , 1992). The 1973 Constitution
of Islamic Republic of Pakistan empowers the Federal government to levy and collect taxes on
personal income, corporate income, sales tax, import and export duties, excise duties and any other
tax med necessary by the President of Pakistan.1 FBR, previously known as the Central Board of
Revenue (CBR) which works under the Ministry of Finance is vested with the responsibility to
collect taxes on behalf of the Federal Government.2
The government relies mostly on indirect taxes which comprise 55% of total tax revenue generated
by the Federal Government (Sherani, Pakistan's Taxation Crisis, 2015). The main reason to rely
1 Clause 3, Chapter 1, Part VI of the Constitution of 1973 2 FBR website: http://www.fbr.gov.pk/ShowArticle.aspx?actionID=57

4
on indirect taxes is that direct taxes that include income taxes are mostly evaded due to corruption
and collusion of tax officers with the tax payers – a fact that was admitted by Mr. Haroon Tareen,
Director Intelligence and Investigation, FBR (Ansaari, 2015).
Tax Collection in Pakistan
Federal Government levies taxes on income, customs, sales tax on goods and FED etc. while
income tax on agriculture and property taxes among others have been given to provinces (Pasha
& Pasha, 2015). After 18th Amendment the sales tax on services has also been given to the
provinces (pp. 175).
Pakistan is a developing country and 79%3 of the total revenue by the Federal Government is
generated through taxes. According to a report published by the UK Parliament’s International
Development Committee in 2013, only 0.57% of Pakistanis paid their share of taxes and that the
tax to GDP ratio of Pakistan was around 10% that was the lowest compared to countries of its per
capita income group. The report also showed Pakistan’s VAT performance to be just 25% which
was 45% for Sri Lanka and 90% for New Zealand. It should be noted that Sales Tax comprises the
largest proportion of Pakistani Tax structure.
Pakistan’s tax collection has remained a point of concern since the 1970s a period that was marked
with nationalization of assets without downsizing of public servants while at the same time
regional conflicts called for increasing defense expenditures all that led to deficit financings
through external borrowings (Cashin, Haq, & Olekalns, 1999). Similarly during the 1980s due to
huge aid coming by the west during Afghan war and also the military government wanted to protect
itself from the wrath of the masses and maintain its legitimacy (Chaudhary & Munir, 2010).
The budget deficits of the country remained between 5.4 to 8.7% of GDP with around 6% in 1970s,
7.6% in 1980s and again souring to 7% in the first decade of the 21st century. The era of 1990s
saw decline in the deficit due to lack of investments by the government in development projects
hence affecting long term development (Chaudhary & Shabbir, 2005).
3 FBR Annual Budget FY 2015-16 Revised

5
Types of Taxes
In Pakistan, a total of 70 different types of taxes are being levied and are administered by 37
government agencies (Horrigan, 2010). According to FBR, the federal taxes imposed in Pakistan
are mainly divided into Direct and Indirect taxes. Direct taxes include Income Tax, Workers
Welfare Fund and Capital Value Tax while indirect taxes include Customs, Sales and Excise ies.
There are, however, other taxes included in the federal budget that comprise Airport Tax, Gas
Development and Petroleum levy.
Direct Taxes
a. Income Tax
Income Taxes comprise the largest part of direct taxes and constitute more than 40% of the total
direct taxes4. Income Tax is regulated under the provision of the Income Tax Ordinance, 2001. At
the time of independence, Pakistan adopted the Income Tax Act, 1922 but soon afterwards, the
Central Board of Revenue was tasked with devising a new framework as new forms of income
emerged ending in enactment of the Income Tax Ordinance of 1979 that enabled enhance tax net
and increase the tax base (Ahmed & O'Donoghue, 2009). 21 years later the Income Tax Ordinance
2001 was enacted that is still prevalent in Pakistan with certain amendments made in it through
different Finance Acts the latest being Finance Act 2016. The heads of income specified in the
Income Tax Ordinance 2001 are as follows:
i. Salaries
ii. Income from Property
iii. Income from Business
iv. Capital Gains
v. Income from other Sources
According to the federal Board of Revenue (FBR)5, entities subject to income tax are as follows:
Companies
4 FBR Documents and Author’s own computations 5 FBR Website:
http://www.fbr.gov.pk/OfficeHomePage.aspx?view=Office%20Home%20Page&ActionID=40&ArticleID=149

6
a. Association of Persons (AOPs)
b. Non salaried Persons
c. Salaried Persons
a. Personal Income Tax
Personal income tax includes income of salaried persons, non salaried persons and unincorporated
firms (including AOPs). The personal income tax system of Pakistan has its roots in the mid 19th
century British India and is one of the oldest tax income tax system in the world and is very close
to India and other developing countries (Klevin & Waseem, 2011).
The income tax of Pakistan is divided into different notches. As per the Income Tax Ordinance
2001 (Amended till 30 August, 2016) the income tax of salaried persons has been divided into 12
notches while the income tax for all other individuals is divided into 8 notches.
b. Corporate Tax
Corporate tax in Pakistan is divided into 3 main categories namely Banking Sector, Public
Companies and Private limited Companies. Tax rates as in 2016 are 40%, 35% and 45%
respectively6. There are however, small companies that –according to Section 2 of Income Tax
Ordinance, 2001 – should not have paid up capital of more than 50 million, a workforce of less
than 250 people and its annual turnover should not increase PkR. 250 million. Tax rate on such
companies has been 25%.
In September, 2015, the Federal Government through finance Act, 2015 imposed Super tax over
and above the normal tax rates applied to the companies at the rate of 4% for Banking companies
and 3% for all other persons whose income exceeds PkR. 500 million in the fiscal year 2015 – 16.
c. Workers Welfare Fund
Workers Welfare Fund is governed under the provisions provided by the Workers Welfare Fund
Ordinance 1971. WWF was established in 1971 by the Federal Government with an initial capital
paid by the federal Government amounting to Rs. 100 million while the rest is to be paid by the
industrial sector while income generated from investments by the WWF and voluntary
contributions may also be used as sources of income for the fund7.Section 4 of the ordinance states
6 Finance Act 2016 7 Section 3 (2)a & b of Workers Welfare fund Ordinance

7
that the industrial sector8 firms having annual income of more than PkR. 500,000 would pay
amount at the rate of 2% of the total income. WWF had been established with the aim to provide
low cost housing, marriage and educational grants and scholarships for the industrial workers9.
d. Capital Value Tax
Capital Value Tax (CVT) is the tax levied on the capital value of the immovable property. The
Constitution of 1973 authorized the Federal government to levy CVT on immovable property
while the provision was abolished after the 18th amendment to the Constitution of Islamic Republic
of Pakistan in 2010. According to the Finance Act 2012, CVT has been made provincial subject
while the Federal Legislature is only allowed to levy such tax on immovable property within the
Islamabad Capital Territory at the rates given in Table II. CVT constitutes a fraction of the total
budget contributing around 0.02 – 0.04 % of the annual Federal Tax revenue.10
Indirect Taxes
Indirect taxes are common in countries like Pakistan that affect the poor to due their regressive
nature which affects the poor more especially when such taxes are implemented on necessity items
(Empirical Analysis of Tax Revenues and Its Impact on Economic Groeth of Pakistan, 2015).
Indirect taxes imposed in Pakistan are of the following types:
a. Sales Taxes
Sales Tax in Pakistan is governed under the provisions provided in the Sales Tax 1990 that keeps
on being amended from time to time by different governments. In Pakistan, sales tax constitutes
the largest proportion of the federal taxes comprising more than 41% of the total taxes.11 Sales tax
is a regressive tax and in Pakistan it is known as GST or Generalized Sales Tax which is levied at
the rate of 17% on all goods and services (Ahmad E. , 2010). GST performance in Pakistan is one
of the worst in the world (i.b.i.d. p. 11). The sales tax remained at 16% from 2006 – 2016 and was
raised to 17% through the Finance Act, 2016.
b. Customs Duties
Customs Duties are enforces and implemented in Pakistan under the Customs Act, 1969 with
certain amendments from time to time by the Federal Government. Section 1 of the act authorizes
8 Definition provided in Section 2(f) of Workers Welfare Fund Ordinance 1971 9 WWF Website: http://www.wwf.gov.pk/ 10 Authors computations for the FY 2014-16 11 FBR Budget documents of FY 1991 - 2016

8
the Federal Government to enact laws as and when required to make amendments as it deems
necessary from time to time. Total share of Customs duty in the total federal tax revenue has
remained less than 7% in the last two fiscal years.
c. Federal Excise Duty
The Federal Excise Duty of FED was named as Central Excise Duty and was governed under the
provisions of the ‘Central Excise Act, 1944’12. FED was enforced in wef 1 July, 2005 and was
extended in the entire country under the provisions of federal Excise Act, 2005. According to
Section 3 of the act, FED is applicable to goods manufactured or imported in Pakistan and also on
services provided in the country irrespective of whether these services originate within the country
of abroad. Clause‘d’ has specified the rate of FED at 15% and FED applicable on imported goods
has to be paid at the time of import by the import. The total share of FED in total revenue generation
has been just 6 – 6.5% of the total federal tax revenue in FY 2014 – 16.
Other Taxes
Other taxes include the Airport Tax, Gas Infrastructure, Natural Gas Development Surcharge and
Petroleum and constitute 10 – 11 % of the total federal tax collection as evident from the federal
budget documents of the last 02 years.
National Finance commission
Pakistan is a federation that is divided into four provinces. The majority of tax revenue generated
in Pakistan is done at the Federal level. According to the Federal budget analysis, around 95% of
the total tax revenue is generated at federal level that includes taxes on income, customs and excise
duties and other taxes as mentioned above. While the provinces generate only 5% of the total tax
revenue that does not suffice their requirements. Provincial taxes include sales tax on services,
stamp duty, vehicle tax, capital value tax etc. The constitution of Islamic Republic of Pakistan lays
down procedure of distribution of federal income from tax collection to the provinces through the
National Finance Commission (NFC).
Article 160(1) of the Constitution of Islamic Republic of Pakistan 1973 clearly explains the
distribution of federal revenue to provinces in a systematic manner through the constitution of
12 FBR website:
http://www.fbr.gov.pk/OfficeHomePage.aspx?view=Office%20Home%20Page&ActionID=49&ArticleID=160

9
National Finance Commission having federal and provincial Finance ministers as its members and
is proposed to be held at intervals of every five years (Constitution of Pakistan 1973). The aim,
according to the constitution is to distribute federal tax revenue to the provinces
History of NFC Awards
The redistribution of federal resources was never the same as of today in Pakistan. After
independence, Pakistan adopted the Neimeyer Award for the distribution of resources between the
Federal and the provincial governments based on the Government of India act. During that time
sales tax was a provincial subject while income tax was a federal subject that was distributed
between the federation and the provinces in equal ratio with some additional grants for Sindh and
NWFP (Ahmed, Mustafa, & Khalid, 2007).
Soon after independence, the Prime Minister conferred Sir Jeremy Raisman with the responsibility
of preparing another feasible system of income redistribution. Raisman awards were presented in
1948 and were enforced with effect from 1 April 1952 with certain amendments like the provinces
gave 50% of their share of sales tax collection to the Federal Government while the federal
government distributed half of its income and other taxes collected to the provinces in the ratio of
45% and 55% to East and West Pakistan respectively. the share of West Pakistan was further
distributed among the provinces with special grants for the NWFP (Government of Pakistan ,
1991).
After Pakistan was divided into two units namely East and the West Unit, all the provinces in the
West Pakistan were amalgamated into one unit. Under this system two awards were presented.
Under the 1961 awards divisible pool comprising of income taxes and 70% of the sales tax
proceeds were distributed between East Pakistan and West Pakistan in the ratio of 54% and 46%
share. The remaining 30% sales tax proceeds were distributed to provinces according to their share
of sales tax collection. Other duties were distributed between the units on the basis of their
collection (Government of Pakistan , 1991).
The next national Finance Commission was setup in 1964 under the provisions of article 144 of
the Constitution of 1962. Sales tax, income tax, exercise and export duties were included in the
divisible pool and the share was distributed between federal government and both units in the
ration 35:65 with the same proportion for both the units including the provision of 30% sales tax
as per collection by the province. However, after the abolishing of one unit concept, the share of

10
West Pakistan was further divided in the ratio 56.5, 23.5, 15.5 and 4.5for Punjab, Sindh, NWFP
and Baluchistan respectively (Bilgrami Jaffery & Sadaqat, 2006).
In April 1970, a National Finance Committee was formed under the Federal Finance Minister to
distribute the resources. The share of provinces and units remained the same as of 1964 but the
Federal share was reduced to 20%. After the separation of West Pakistan (Now Bangladesh) the
provincial share in West Pakistan remained the same but the volume of their share increased
(Ahmed, Mustafa, & Khalid, 2007).
After the separation of East Pakistan and the promulgation of a new constitution of 1973, the
financial distribution between the Federal and Provincial governments was amended. Under the
article 160 of the constitution, the President was bound to form a committee consisting of the
Federal and Provincial Finance Ministers and the the government was obliged to compose NFC
at an interval of maximum five years for a fair distribution of resources between the Federal and
provincial Governments (Bilgrami Jaffery & Sadaqat, 2006).
Since that time a total of seven NFC Awards have been setup. All the NFCs redistributed income
to the provinces mainly in accordance with the population share with certain grants also provided
to under developed provinces. The matter was resolved in the seventh NFC award that was
population was not made the main criterion for income distribution rather backwardness, tax effort
and inverse population density were also included as a proportion for income distribution
(Mustafa, 2011).
Tax Evasion and Underground Economy in Pakistan
According to Saqib Sherani13, out of seven million eligible taxpayers only five hundred thousand
pay their taxes that constitutes 0.3% of the population making this proportion as the lowest in the
world (Sherani, Pakistan's Taxation Crisis, 2015). IMF in its report14 termed Pakistan’s tax-to-
GDP at around 11% in FY 2014-15 that was far below the potential ratio of 22% while the potential
tax base was much less as compared to the potential figures15. The NFC report finalized in a
13 Saqib Sherani is the former economic advisor to the Government and presently heads a macroeconomic
consultancy based in Islamabad, Pakistan 14 IMF ninth Review Report (IMF Country Report No 16/1) 15 According to the report, a total of Registered Income Tax filers were only 970,000 against the potential
figure of 5.7 million while the number of Corporate income tax filers was less than 1% of commercial
electricity users

11
meeting held on 28 November, 2015 revealed that Pakistan lagged much behind the promised tax
to GDP ratio of 15% in the FY 2014 – 15 in the 7th NFC Award (Kayani, 2016).
According to one study tax evasion in Pakistan increased from PkR. 1.5 Billion in 1973 to PkR.
152 Billion in 1996 (Iqbal, Qureshi, & Mehmood, The Underground Economy and Tax Evasion
in Pakistan : A Fresh Assessment, 1998) while according to another estimate tax evasion grew
from PkR. 405 Million in 1960 to Rs. 123.6 Billion in 1998 that was 84% of the total budget deficit
of the country (Aslam S. , 1998). The World Bank report also claimed that the tax gap of Pakistan
in 2008-09 was 79% amounting to Rs. 796 billion in total or Rs. 4800 evaded by every Pakistani
on an average (Government of Pakistan, World Bank, Georgia State University, 2009).
Similarly Underground Economy has a positive and highly positive correlation with tax evasion
(Kemal, 2007). Underground Economy in Pakistan grew from 29% in 1960 to 43% of the total
GDP of Pakistan in 1998 (Aslam S. , 1998).
Tax Collection Profile for the Years 2010 – 2015
According to the Fiscal Policy statements issued by the Ministry of Finance, Government of
Pakistan the tax collection by the Federal Government during the Fiscal Years 2009-2010 through
2015- 16 has been calculated. The collection figures are appended below:
Tax Collection during FY 2009-10
During the FY 2009 – 10, total tax collection was estimated to be Rs. 1380 Billion in the federal
Budget. Of which actual collection amounted to Rs. 1327.4 Billion with a shortfall of Rs. Rs. 52.6
billion. The total tax collection during the year was 9% of the total DGP.
a. Direct Taxes
Direct taxes amounted to Rs. 528.6 Billion against estimated 540.4 Billion constituting 40% of the
total tax collection during the year. Withholding Taxes constituted the largest portion of the direct
taxes amounting to Rs. 298.4 Billion. Voluntary payments that included payments with returns
and advances generated Rs. 165.8 Billion in the total Tax revenue.
b. Indirect Taxation
Sales Tax collection constituted around 65% of the total indirect tax collection while 39% of the
total tax collection during the said period. A total of Rs. 516 Billion were collected as sales tax
12
during FY 2009-10. Sales tax is sub categorized into Domestic GST and GST on imports with Rs.
269 Billion coming from domestic while the remaining Rs. 247 generated through imports.
Customs duty contributed 20.2% of the total indirect tax while 12.2%of the total tax collection in
FY 2010 with Rs. 161.5 Billion against budgeted estimates of Rs. 164.9 billion. The reason as
stated in the FBR report was mainly due to 0.3% reduction in dutiable imports. Similarly the FED
contributed Rs. 121.2 billion in total tax collection that made 9.1% of the total tax collected.
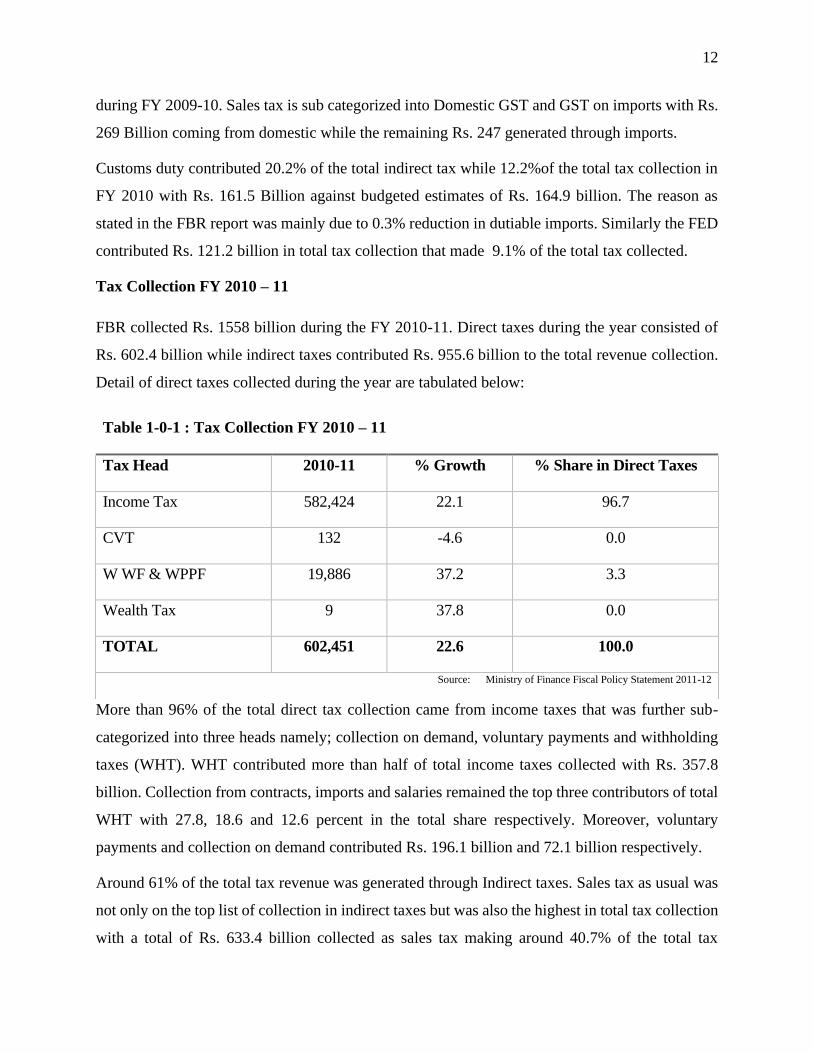
Tax Collection FY 2010 – 11
FBR collected Rs. 1558 billion during the FY 2010-11. Direct taxes during the year consisted of
Rs. 602.4 billion while indirect taxes contributed Rs. 955.6 billion to the total revenue collection.
Detail of direct taxes collected during the year are tabulated below:
More than 96% of the total direct tax collection came from income taxes that was further sub-
categorized into three heads namely; collection on demand, voluntary payments and withholding
taxes (WHT). WHT contributed more than half of total income taxes collected with Rs. 357.8
billion. Collection from contracts, imports and salaries remained the top three contributors of total
WHT with 27.8, 18.6 and 12.6 percent in the total share respectively. Moreover, voluntary
payments and collection on demand contributed Rs. 196.1 billion and 72.1 billion respectively.
Around 61% of the total tax revenue was generated through Indirect taxes. Sales tax as usual was
not only on the top list of collection in indirect taxes but was also the highest in total tax collection
with a total of Rs. 633.4 billion collected as sales tax making around 40.7% of the total tax
Table 1-0-1 : Tax Collection FY 2010 – 11
Tax Head 2010-11 % Growth % Share in Direct Taxes
Income Tax 582,424 22.1 96.7
CVT 132 -4.6 0.0
W WF & WPPF 19,886 37.2 3.3
Wealth Tax 9 37.8 0.0
TOTAL 602,451 22.6 100.0
Source: Ministry of Finance Fiscal Policy Statement 2011-12

13
collection while 66% of the indirect taxes were collected as sales tax. Of the total sales tax more
than half of the sales tax collected during the year amounted to Rs. 357.5 billion were collected
from the domestic products while the remaining Rs. 308.7 billion was collected through sales tax
on imports. POL products remained at the top of both domestic and imports component of sales
tax with a contribution of 41.2 and 36.8 percent of the total collection in both components
respectively.
Customs duty collected during the FY 2010-11 amounted to Rs. 184.9 billion making around 12%
of the total tax revenue and 19% of the indirect collection. Imported vehicles, POL products and
Edible oil remained at the top of total customs duty collection with a share of 14.5, 11.1 and 8.9
percent of total customs duty collection respectively.
Another Rs. 137.4 billion were collected as Federal Excise Duty (FED) the major portion of which
came from FED on cigerattes with more than 34% share in total FED collection. Cement remained
the second top contributor with 11.2 percent share while 1% special FED also enabled to collect
more than 18% of the total FED during the year. Natural gas, POL, Services, beverages and
perfumes & cosmetics also contributed in FED collection.
Tax Collection FY 2011-12
The Federal Government of that time brought many changes in the tax structure during the FY
2011 – 12 that included reduction on GST on goods from 17% to 16%, abolishment of special
Excise duty, abolished regulatory duties on many products and enhanced exemption limit on
income tax.16
Total Taxes collected in FY 2012 amounted to Rs. 1882.7 billion against the target of Rs. 1952
billion adding Rs. 324. 7 billion from the previous year that was termed as the highest growth in
the history of FBR by the Government of Pakistan.17 The distribution of total tax collected during
FY 2011 along with growth rate has been appended in the following Table:
1616 FBR Fiscal Policy Statement 2012-13 (pp. 7) 17 FBR Year Book 2011-12 (pp. 9)

14
Table 1-0-2 : Tax Collection FY 2011 - 12
Description 2011-12 2010-11 Change
(%) Direct Taxes 738.4 602.4 22.6
Sales Tax (Total) 804.9 633.4 27.1
Federal Excise 122.5 137.4 -10.8
Customs Duty 216.9 184.8 17.3
All Taxes 1,882.7 1,558.0 20.8
Source: Ministry of Finance Fiscal Policy Statement 2012-13
a. Direct Tax Collection
Tax Head 2011-12 2010-11 % Growth
% Share in Direct Taxes
2011-12 2010-11
Income Tax 711,017 582,424 22.1 96.3 96.7
CVT 126 132 -4.6 0.0 0.0
W WF & WPPF 27,275 19,886 37.2 3.7 3.3
Wealth Tax 5.6 9 37.8 0 0.0
TOTAL 738,424 602,451 22.6 100.0 100.0
Source: Ministry of Finance Fiscal Policy Statement 2012-13
b. Income Taxes
Tax Head
2011-12 2010-11 %
Growth
% Share in Direct
Taxes
2011-12 2010-11
(A) Out of Demand 130,054 72,182 80.2 16.0 11.5
(B) Voluntary payments 237,366 196,065 21.0 29.2 31.2
(C) Withholding Taxes 420,088 357,836 17.5 51.8 56.9
Miscellaneous 24,016 3,019 696.5 3.0 0.5

15
Gross 811,524 629,102 29.0 100.0 100.0
Refund 91,560 46,678 96.2
Net 719,964 582,424 23.6
Source: Ministry of Finance Fiscal Policy Statement 2012-13
c. Indirect Tax Collection
Indirect tax collected included Sales Tax, Customs Duty and FED. Sales tax contributed the largest
portion of total tax collected in FY 2011-12 with a total of 42.8% of the total tax collected during
the year. Rs. 805 billion were collected as sales tax that was further divided into two sources.
Domestic GST constitution 46.5% of the total sales tax collected while the remaining included
GST on imports. POL products were the main contributors in sales tax collection with 40.9% and
36.5% of the total domestic sales tax and sales tax on imports collection respectively.
Another Rs. 217 billion were collected as Customs Duty that was 18.9% of the total indirect tax
and 11.5% of the total federal taxes collection in FY 2012. The largest share in customs duty was
from imported vehicles that was 19.1% of the total Customs duty.
The remaining Rs. 122.5 billion were collected as FED and the major share was from cigarettes
that constituted 43.6% of the total FED making around Rs. 53.5 Billion during FY 2011-12.
Tax Collection FY 2012 – 13
The financial Year 2012 – 13 brought with it more reliance on non-tax revenue to compensate for
the rationalization of tax revenues by the government that included reducing tax slabs to only 5
and raising tax on dividend from 25% to 35% while reducing tax on company profits from 1% to
0.5%. Similarly, zero-rated products were taxed to enhance tax base and all tax rates were unified
to 16% to avoid multiplicity. However, sales tax on may products was reduced from 16% to 5%
to discourage the trend of smuggling. Furthermore, FED was on construction material was reduced
from Rs. 500 to Rs. 400 per metric ton and maximum rate of customs tariff was reduced.
The total tax collected by the FBR during the FY 2012-13 was Rs. 1936.1 billion against the
estimated target of Rs. 2381 billion achieving around 81% efficiency. Direct tax collection stood
at Rs. 735.8 billion that contributed 38% of the total tax collected during the year. Direct tax
collection stood at 79% of the amount estimated in the federal budget. The breakdown of direct

16
taxes during the year as provided by Ministry of Finance in th Fiscal Policy Statement of 2013 -
14 is as follows:
Tax-wise Analysis
Direct Taxes
A total of 38% of the total taxes collected during the FY 2013-13 were collected as direct taxes
that amounted to Rs. 735.8 Billion. The maximum chunk of the direct taxes came from
Withholding Taxes (WHT) comprising 57% of the total direct tax collection. There was 3%
increase in WHT collection because of many reasons namely; 8% increase in imports of dutiable
products resulting in 21% increase in WHT from imports. Similarly, increased dividends due to
lack of investment opportunities, increased electricity tariffs and increased bank interests led to
increase in WHT collection. On the contrary, due to increase in tax free band of salary and cash
withdrawal limits, WHT collection on salary and cash withdrawal decreased.
Voluntary payments that comprised 29% of the total direct taxes also showed an increase from the
previous year. An amount of Rs. 245billion of which Rs. 230 billion was collected as advance
payments and the remaining was collected as payments with returns. Collection on demand
showed a decrease by 31% from the previous year due to lack of audit by the government that
failed to produce demand for new taxpayers. Around 11% of the total direct taxes were collected
on demand.
Indirect taxes
Around 62% of the total taxes collected in FY 2012-13 were indirect taxes amounting to Rs. 841.3
billion. Sales tax had been the biggest contributor that comprised 44% of the total tax collected
showing an increase of 4.5% entirely due to increase in sales tax from domestic market. The share
of both domestic and imports components in sales tax were approximately equal during the year.
POL comprised the largest contributor in sales tax collection both from domestic and import
components comprising 36.3 and 42.3% of their total contribution respectively.
Customs duty collection stood at Rs. 239 billion comprising 12% of the total tax revenue collected
during the year. This head showed an increase of 10% with 11% increase in import of dutiable
products achieving around 97% of the target. As far as FED was concerned, a total of Rs. 119.6
Billion were collected comprising 6% of the total tax revenue. The major portion of Fed was

17
collected from domestic sources and cigarettes contributed more than 50% of the total revenue
collected as FED.
Tax Collection FY 2013-14
In the FY 2013-14, FBR achieved 92% of the estimated budget by collecting Rs. 2266.3 billion as
federal taxes. Of this total amount, 61% were collected as indirect taxes including sales tax,
customs duty and FED while the remaining 39% were collected as direct taxes. The tax-to-gdp
ration stood at 8.9% during the said year.
Tax-wise Collection
Direct Taxes
An amount of Rs. 884.1 billion was collected as direct taxes 97% of which comprised of income
tax (voluntary payments Rs. 262.6 billion, collection on demand Rs. 80.6 billion and WHT Rs.
578.6 billion) during the year. Another Rs. 26.1 billion were collected under the miscellaneous
head of direct taxes.
Voluntary payments during the year grew by 7% with advance tax increasing by 8.1% and
payments with returns reducing by 6.8% from the previous year. Overall voluntary payments
consisted of 28% of the total direct tax collection. Collection on demand again decreased by 10%
and the reason attributed to was the lack of audit, cases under litigation and ineffectiveness of the
tax administration in the Fiscal Policy statement 2014-15.
The major share of direct taxes (61%) came from WHT that grew by 33% from the previous year.
Contracts, Imports and Salaries were the top three contributors of WHT with collection of Rs.
136.6, 123.8 and 64.6 billion respectively. Another measure by the government to enhance WHT
during the year was introduction of WHT on marriage halls., hotels, restaurants, educational
institutions with fees above Rs. 200,000, foreign movies and dramas moreover, FBR claimed and
attributed the overall growth in WHT to effective monitoring and rationalization of tax rates.
Indirect Taxes
Indirect taxes that included sales tax, customs duties and FED comprised 61% of the total tax
collection during the year. Sales tax that has been the major source of tax collection accounted for
44% of the total tax revenue. Sales tax grew by 19% from previous year mainly due to increase in

18
domestic sales tax collection as a result of fixing sales tax at from 16% to 17%. Sales tax on
domestic products was 52% of the total sales tax collection and petroleum contributed the major
portion in both domestic and import components of the sales tax with 45.6 and 34.2 percent of the
total collection respectively.
Customs duties contribution in indirect and total tax collection was around 17% and 11%
respectively. dutiable imports consisted only 38% of the total imports that grew by 7.6%. customs
duty collection grew by only 0.8% from previous year and the main reason attributed to it was
appreciation in Pak Rupee during the year. Vehicles remained the top contributor in Customs duty
despite decline in imports by 18% from the last year causing a decline in revenue of 14%. Edible
oil and POL products remained the second and third contributor of Customs duties collection
resepecitely. POL products duty fell by 18% due to exemption of crude oil, furnance oil and motor
spirit from customs duty.
FED contributed 6% of the total tax revenue that was the same as in the previous year. Major
contribution of FED was collected through the domestic component of FED while cigerattes
remained at the top in FED collection with more that 51% of the total FED. Collection on services
surpassed the target by 39% and reached an amount of Rs. 20 billion.
Other taxes imposed by the Federal government also include petroleum levy, airport taxes and
other taxes. Collection from petroleum levy amounted to Rs.104 billion showing a decline of 6
percent against previous year. Other taxes registered growth of 73 percent owing to small base
year collection and stood at Rs.5 billion.
Tax Collection FY 2014-15
Tax collection ratio registered consistency in FYs 2014 and 2015 at 92% of budget estimate while
showing growth by 14% of the last year collection. The Tax to GDP ratio during the year was
14.4%.with an improvement to 9.5% against last year’s improvement of 8.9%.
Direct Taxes
The share of direct taxes in total tax revenue collection increased to 40% and income tax that
included voluntary payments, collection on demand and WHT contributed 99% in the total direct
tax collection. Direct tax collection achieved 87% achievement of targets against 91% in the
previous year.

19
WHT witnessed a growth of 21% and contributed 62% of the total share in direct tax collection.
The top three contributors in WHT again remained Contracts, Imports and Salaries with maximum
growth witnessed in electricity bills from the last year. Voluntary payment share in total direct tax
collection reduced by 2% from previous year to 26% while payments with returns increased by
30%. Collection on demand grew to Rs. 116 billion from 89 billion of last year. This increase in
collection after many years was attributed to fresh audits and effective administrative system of
the tax agencies.
Indirect Taxes
Indirect taxes, as usual, provided 60% share in the total tax collection in the year of which sales
tax contributed 42%, Customs Duty 12% and FED 6% in total tax collection. Sales tax grew by
9% while more than half of the share came from sales tax on domestic products while the
remaining was collected through sales tax on imports. Majority of share in both domestic and
import components of sales tax came from POL which was was 43.9 and 30 percent for domestic
and imports respectively.
Customs duty comprised 20% and 12% of indirect tax and total tax collection respectively.
Dutiable imports consisted of 57% of the total imports during the year and custom duties grew by
27% achieving 119% of the budgeted estimates of FY 2014-15. Customs duty on vehicles and
POL products remained at the top of the list with share of 15.7 and 7.7 percent of total custom duty
collection respectively.
FED contributed 6% in the total tax revenue achieving 91% of the target. Again cigarettes
remained as the top contributor of FED collection with around 51% and international travel
segment scoring second position with 17.1% share in total FED collection. Overall FED collection
recorded an increase of 17% from the previous year.
Initiatives by Government as of 2015 to 2018
The Government of Pakistan took certain steps in order to enhance tax base and increase tax
collection. Three major steps in this regards included:
a. CNIC to be NTN
Previous NTN or the National Tax Number was issued for registration with FBR. However, the
present Federal government took the initiative of replacing National Tax Number (NTN) with

20
Computerized National Identity Card (CNIC). According to an SRO18 issued by FBR any
individual having a valid CNIC will be able to file returns manually without prior registration.
However, online enrollment would be required through FBR website. However, any person
without a CNIC would be required to register on application. The SRO empowered the Income
Tax Commissioner to register or enroll any individual provided he is satisfied that the person falls
into tax bracket.
b. Withholding Tax on Banking Transaction
The government also introduced 0.6% WHT on banking transactions exceeding Rs. 50,000 by
non-filers vide section 236P of Income Tax Amendment Ordinance 2015. However the WHT rate
was reduced to 0.3% for a period of four months and was later increased again to 0.6%.19
c. Discriminatory WHT Rates by FBR
Apart from the above, the government has made discriminatory rates on withholding Tax (WHT)
for filers and non-filers on different transactions including registration and transfer of cars import
of goods, dividends and profits on bonds and shares as well as on profits on bank savings etc. 20
Statement of the Problem
Pakistan is one of the worst countries hit by the menace of tax evsion. According to the
International Development Committee of British Parliament in 201321, just under 0.79 million
Pakistanis or 0.57% of the total population paid taxes. According to the Current Prime Minister
of the Country Mr. Imran Khan, the country was collecting PkR 3.8 trillion as tax revenues while
it has the potential to generate around PkR 8 trillion (Hassan, 2018). According to the Federal
Board of Revenue (FBR), Pakistan is generating taxes from only 0.5% of the entire population and
pakistan generates only 9% of GDP from taxes as opposed to countries of the same per capita
income who generate approximately 14% (Khan, 2014) This is despite the fact that pakistan is
listed amonsgt the top nations in terms of generocity. According to studies, Pakistanis pay around
PkR 240 billion or US$ 2 Billion annually in some sort of charity while approximately 98% of the
population of Pakistan pays voluntarily either in cash or in kind (Amjad and Ali 2018). The same
study also reveals that Pakistan contributes 1 percent of GDP as charity which brings it at par with
18 S.R.O. 1076(I)/2015 dated 02 November, 2015 19 DG (WHT) FBR letter No DO.No.1 (1) DG (WHT)/2015/103767/2015-R dated 03 August, 2015 20 FBR Withholding Tax Card 2017/2018 21 BBC website : http://www.bbc.co.uk/news/uk-politics-22017091
Invalid source specified.

21
nations like Canada and the UK while the proportionate contributions is twice as much as that of
India. On the other hand, the Tax-to-GDP ratio of the country for the Fiscal years 2017 – 2019
remained around 11 percent22 as compared to Tax-to-GDP ratios of 33.4% and 33% for UK and
Canada (OECD 2020). The ratio of India and Pakistan during the same period remained the same.
One of the main cause of this reluctance to pay taxes is lack of trust on the government. This is
evident from the fact that in 2014, a large gathering of people followed his disovbedience
movement and burned their utility bills in an attempt to describe the government of the country as
corrupt and having no return for the taxes paid by the public (Tahir 2019). It is because of this
reason that the tax gap of the country stands at 22.3% which is about PkR 3.3 trillion as estimated
by the World Bank. The main cause of this poor tax collection in the country is tax evasion that
needs to be addressed on priority in order to stabilize the economic situation of the country
(Hassan, 2018). The World Bank has suggested that all Pakistan needs is to enhance its revenue
generation without imposing any additional taxes by eliminating evasion (Ahmed 2019).
Objectives of the Study
The study aims at finding the main causes of tax evasion in Pakistan and also tries to study the
consequences of tax evasion on the political economy. Based on the aim, possible objectives of
the study are as follows:
1. To determine the relationship of demographic variables and behavior towards tax evasion
in Pakistan
2. To analyze attitudes of taxpayers towards tax system of the country
3. To measure the association of different indicators of tax morale with tax evasion in
Pakistan
4. To analyze the consequences of tax evasion on the political economy of Pakistan
5. To find out the policy implications of tax evasion in Pakistan
Significance of the Study
Although scholars have investigated many determinants of tax evasion from political and
economic determinants (Becker, 1968) and (Allingham and Sandmo 1972) to lack of Deterrence
22 Ministry of finance, Government of Pakistan

22
(Anderson, 1977) to psychological factors (Robben et al., 1990) to personal characteristics
(Recardson, 2008). However, there is a list of determinants of tax evasion as described by (Jackson
& Milliron, 1986) and explained by (Recardson, 2006) that include personal characteristics like
age, gender, education, income level, income source, while other determinants like marginal tax
rates, fairness, complexity, revenue authority initiated contact and tax morale. The causes have not
also been confined to issues like lack of audit, lack of documentation (Bilqees, 2004) and economic
issues like higher tax rates, high unemployment rates by prominent scholars like (Kemal, 2006) as
in case of Pakistan. Scholars at international level have taken up issues like impact of gender and
other demographic variables (Slemrod, 2007), tax morale (Torgler & Schneider, 2007) and the
like.
The current study has taken up the challenge of finding relation of tax evasion with determinants
that include demograhpic variables of age, gender, income level and education level. While
different indicators of tax morale have also been included in the study. At policy level, the study
will be of prime importance to policy makers and legislators as the study incluldes non-monetary
variables that are different from typical stereotype economic variables. the findings of the study
will be useful in handling different segments of society based on age, gender and income level in
order to get rid of the menace of tax evasion from the society. Similarly, tax morale that inlucdes
intrincic motivation to pay taxes would be useful for the policy makers in tackling the minds of
individuals and changing minds of the people to curb the evil of non-compliance form pakistan.
The study will be a great source of help for policymakers in that it pakistan in getting pakistan out
of the menace of poor tax collection tht has the following repurcussions for the country:
Increasing Tax Revenue
Pakistan’s budget deficit for the year 2019 remained 3.4 trillion that could have been overcome
through tax compliance as the tax gap during the same year was Rs. 3.3 trillion. World Bank has
already termed tax non-compliance as a major hurdle in the economic development of the country.
Public Service Delivery
The aim of government is to provide better public services to the citizens which is only possible if
the government has revenue to provide such services. in case of Pakistan where the 90% of revenue
of government is generated through taxes, tax compliance is very much necessary

23
Countering Money Laundering
Curbing tax evasion would further have an indirect benefit to the economy. Presently, Pakistan is
also on the watch list of FATF (Financial Action Task force) who has placed Pakistan in the grey
list since June 2018. Motivating citizens to pay taxes and bring them into the tax net would have
an added advantage that their assets would be declared to the government. This will enable the
government to further track their transaction to a greater extent and ultimately would also enable
the government to watch out for unwanted transaction, if any.
Organization of the Study
In the first chapter, the study includes introduction and background of the study. In this section
history of tax evsion worldwide and in Pakistan has been discussed. This will be followed by
introduction to taxes being enforced in the country and the tax collection profile of Pakistan for
the last five years starting from 2010 upto 2015. Afterwards, the chapter includes statement of
problem, objectives and significance of the study. The second chapter discusses the review of
existing literature in which literature containing evasion at global and national level has been
discussed. All possible causes of tax evasion have been discussed in this chapter. Methodogoly
has been discussed in the third chapter while fourth chapter contains the demographic profile of
the respondents and some of the impacts of demographic characteristics on tax evasion in Pakistan.
The fifth chapter includes determining relationship of some demographic factors including age,
gender, income and education level with tax evasion. Similarly different indicators of tax morale
and their impact on tax evsion in Pakistan have also been been observed in the chapter. The sixth
chapter involves provididing a comprehensive discussion regarding impacts of tax evasion on the
political economy of the country. The last chapter includes policy implications and
recommendations have been discussed in the same chapter followed by conclusions.

24
LITERATURE REVIEW
Literature has been speaking much on the issue of tax evasion since very long. The first available
evidence of mentioning of tax evasion as a reason of currency holding was presented by (Cagan
1965) who claimed that higher tax rates led people to keep their cash undocumented hence evading
their share of tax payment (Chapter iv). The argument was taken further by Baker who placed tax
evasion under the umbrella of crime and stated that tax evasion along-with other crimes – apart
from felonies – had erupted as a result of increase in the circulation of currency since the late 1920s
up to 1960 (Baker 1968).
Role of Taxation in Economic Growth
This is a quote by a Roman. Cicero who was a Roman Statesman, orator, Philosopher and lawyer,
Marcus Tullius Cicero and remained part of the Roman Council in the year 63 BC. He stated that
“Taxes are the Sinews of the State” and was of the view that taxes played crucial role in the Roman
Empire and that the state could not flex its muscles till the time they abstract revenue from the
private sector (Winer, Profeta, & Hettich, 2013). James and Nobes presented the definition of
taxation in the year 1997 which states that, ‘Taxation is a levy that is paid by a person who does
not receive anything directly in return” (Obasa, 2018). Taxation is a main source of government
revenue that is used by the government for the purpose of growth and development (Edame &
Okoi, 2014). If this source of government revenue is not available in sufficient quantity, the
government will not be able to spend in areas necessary to address and hence the economic growth
and development of the country will be hampered (Martinez-Vazquez, Vulovic, & Liu, 2011).
Taxes play an important role in the economic development of a country. According to Prammer,
Taxes enable a government to collect funds for utilization for provision of necessary public
services, redistribution of income in the society, and overall stabilization of economy as a whole
(Prammer, 2011). The study also claimed that revenue generation through taxing items like
tobacco and alcohol and other environmental related taxes helps the government to address issues
related to externalities. However, literature has suggested that there are different types of taxes and
impact of each type of tax is different on the economic growth. However, literature also suggests

25
that taxation alters the economic decisions regarding investment the three factors of production
namely labor, capital and entrepreneurship.
A study by (Zipfel & Heinrichs, 2012) taking 27 European countries concluded that all factors of
production were affected by tax structure of the country. According to the study, labor supply is
affected by taxation when taxes are imposed on salaries. Progressive income taxation affects
motivation to work more hours and even higher educated labor force is demotivated to participate
due to high taxation on higher incomes. Similarly, taxation on capital forces people to save more
rather than investing while this also reduces investments in research and development. However,
taxation on consumption produce somewhat results otherwise as people are motivated more
towards investment that indirectly leads to economic growth of a country.
Literature has also shown that tax structure has an impact on the economic growth. Income taxes
have shown to be non-productive for the growth as compared to consumption and indirect taxes.
(Johansson, et al. 2008) concluded that corporate income taxes were the most harmful for
economic growth while consumption and property taxes had the least. Similar results were
obtained from other studies like those carried out by (Arnold, 2008), (Myles, 2009) and (Arnold
J. B., 2011) all of whom supported taxes on immovable properties as the least harmful for
economic growth. (Petru-Ovidiu, 2015) also suggested the same findings and proved that direct
income taxes had significantly negative impact on economic growth. The study concluded that
consumption tax produced growth friendly results.
Studies have also produced results that are vice versa. (Skinner, 1988) collected tax data of thirty
one African countries and concluded that increases in consumption tax had a positive impact on
economic growth while increase in direct taxes had a negative economic repercussions. Similar
time series analysis was carried out by (Ibadin & Oladipupo, 2015) concluded that indirect taxes
including VAT (value added tax) and Petroleum Levi had a significantly positive impact on
economic growth for the study period.
A very few studies have been found that that indirect taxation has a positive impact on economic
growth. A study by (Koch, Schoeman, & Tonder, 2005) who conducted a time series study in
South Korea revealed that higher level of indirect taxes as compared to direct taxes produced
negative results for the economy. Similarly, (Mashkoor, Yahya, & Ali, 2010) conducted a time

26
series data from 1973 – 2008 on Pakistani tax structure and concluded that direct taxation had a
significantly positive relationship with economic growth in the short run. However, the result did
not show any significance in the long term.
Tax Collection in Developing Countries
The main source of revenue in developing economies is taxation. According to IMF, developing
nations generate 80% of the total revenue through taxing (IMF, 1989). A study carried out by
(Burgess & Stern, 1993) studied difference between developed and developing nations and found
a few difference in the tax system. The first difference as identified in the study included reliance
on borrowing by developing countries that relieved the issues in the short term but had to be paid
off through over taxing the public in the long term. Secondly, tax-to-GDP ratio of developing
economies was not more than 20% of the GDP compared to 30 – 35% for developed nations. This
claim also conforms to the findings of (Tanzi & Gee, 2000) who conducted a penal study for the
period 1995-1997 and found that tax-to-DGP ratio of developing nations was around 18.2% while
that of OECD nations was 37.9%.
A study by (Burgess & Stern, 1993) also noted that reliance on indirect taxation was another
significant feature of developing or less developed nations as mentioned in the study while poor
tax administration was also an issue being faced by less developed nations as stated in the study.
(Burgess and Stern, 1993) also pointed out that developing countries are characterized by small
scale enterprises, have week administration and evasion is substantial in these countries. As far as
reliance on indirect taxation is concerned, a study by (Auriol & Warlters, 2005) suggested that
direct taxation is week in developing economies. According to the study, direct tax-to-GDP ratio
of African nations averaged 7% as compared to 22% in developed nations while direct taxation in
African nations was 10% of GDP that was equivalent to developed nations. (Bird & Zolt, 2005)
also apprised that progressive taxation was falling short of required level in developing countries
hence causing issues in redistribution of wealth in those nations.
Another issue relating to the developing nations is the procyclical behavior. According to (Talvi
& Végh, 2005), procyclic policy means that a fiscal policy is expansionary in good times and
contractionary in bad times. The study suggests that developed nations follow the principles of
(Barro, 1979) which states that the public spending and taxation is independent of the business
cycle i.e; fiscal policy remains neutral in economic recessions or booms. These findings are in line

27
with the study carried out by (Fiorito, 1997) who studied the correlation of government
expenditures and output of G7 nations and found it to be equal to zero. The study by (Talvi &
Végh, 2005) found that more than half of the fourteen developing nations, the correlation between
government consumption and output was positive. The study claimed that the developing
economies reduced their expenditures and increased taxes during recessions. On the other hand,
during times of fiscal surplus, the governments increased their expenditures rather than saving for
bad times.
A main issue regarding poor tax collection in developing economies as highlighted in literature is
the presence of high level of informal sector. International Labor Organization noted that 61%
urban employment in Africa and 40 – 50% in Asia was in the informal sector (ILO, 1999). (Enste
& Schneider, 2000) in a penal study of 76 countries and found that informal sector in developing
countries was 39% as compared to a mere 12% for OECD nations. Similarly (Kuchta-Helbling,
2000) took a penal data of Latin American and Sub Saraha African nations for the period 1990 –
1994 and found that new job creations in Latin American and African nations during the said
period were 80% and 90% respectively.
Liberalization of trade has further added to the agony of the developing nations. Trade
liberalization and globalization have affected the revenue base of developing nations where
revenue generation is already considered inadequate to cater for basic development needs (IMF,
2011). According to (Aizenman & Jinjarek, 2009) trade liberalization has forced developing
nations to rely more on personal income and Value Added Taxes. The United Nations urged
developing countries to increase tax-to-GDP ratio from 18% to 22% in the beginning of 21st
century (United Nations, 2005), that has still not achieved (Bahl, 2014).
All these factors leading to poor tax structure in developing countries has further led to income
inequality in these countries (Alvaredo & Gasparini, 2015) claimed that income inequality in
developing nations increased in 1980s and 1990 and despite a slight reduction in 2000s income
inequality remains a significant issue in these countries. This increasing and deepening income
inequality has also been termed as a foremost global challenge in the contemporary world by
World Economic Forum while globalization has further aggravated the issue of income inequality
as MNCs who operate in developing nations have more opportunities of evading and avoiding

28
taxes that increases their wealth and the issue of social transfers and hence increasing inequality
in already poor economies (Swank, 2016).
Tax Issues in Pakistan
Work on tax evasion in Pakistan till the 90s was very rare and most studies while calculating the
tax pilferage in the country considered tax avoidance in addition to tax evasion estimates that made
it difficult to precisely exclude tax revenue lost due to illegal ways from amnesties, waivers and
other forms of system loopholes exploited by the taxpayers (Azhar 1996). The main causes of tax
evasion as exposed by B. A. Azhar were the absence of deterrent punishment of evaders, lack of
documentation in the economy, lack of political will, lack of effective follow ups / audits (p. 662).
There were studies in the later half of 1990s that had focused their research on reforming tax
system in the country (Pasha 1995) while other scholars like Chaudhary had been focusing on poor
tax collection and had been attributing non-taxed agricultural sector of the country as the main
cause of poor tax collection in the country (Chaudhry 1999).
Similarly some other studies during the same era had been focusing on the estimations of
underground economy and tax evasion (Aslam 1998) and (Iqbal, Qureshi and Mehmood 1999).
Chaudhary and Munir in the year 2010 investigated whether economic variables, tax base, social
indicators and other external variables do have an impact on tax revenue collection in Pakistan
(Chaudhary and Munir 2010) whereas some studies were carried out to determine the main source
of revenue in the country. A study carried out by (Aamir, et al. 2011) in this regard is of much
importance as it compares Pakistan with India and concluded that the major junk of tax collection
in Pakistan is through indirect taxes as compared to other countries (India) which had more
potential to collect revenue from direct taxes. As evident from the previous researches,
underground economy has been a topic of interest of scholars with reference to Pakistan where
underground economy has mostly been joined with tax evasion and underground economic
activities have been shown as the most obvious cause of evasion in the country (Yasmeen and
Rauf 2014).
However, there has been very recent that literature on determinants of tax evasion has been found
in the case of Pakistan. a study carried out by (Khan and Ahmad 2014) suggested that tax evasion
is a major problem with the Pakistani economy and the main determinants attributable to the
menace of tax evasion as suggested in the study were lowering tax rates, check and balance on the

29
government institutions and enhancing tax awareness among the masses through different means
to enlighten the people about the advantages of tax payments and the issues related otherwise. The
study also concluded that the tax system should be as such it was based on ground realities rather
than copying a system of other cultures that do not fit in Pakistani context.
(Phillips 2009) who claim that tax morale by the political and economic elite in developing
countries like Pakistan is an important factor that needs to be taken care of to enhance a culture of
tax compliance in the country. According to the study, tax morale of the elites is a key to
sustainable development of capacity of revenue collection authorities in developing countries like
Pakistan. The study is in conformity with the claims of (Sánchez 2006) who carried out the same
study in Latin America and concluded that institutional development is shaped by accountability
and tax morale of the elite class. A same study was carried out by (J. Sánchez 2008) who concluded
the same in case of Argentina where tax reforms were the result of financial decision making by
the economic elites in collaboration with political elites of the country.
Phillips’ argument of perception about corruption and fairness is taken further by (Gangl, et al.
2015) who took the wealthy self-employed citizens of Pakistan who were non-filers as population
of the study and claimed that lack of taxpayers’ knowledge and perceived corruption in the tax
administration creates doubts about perceived fairness and trust in government authorities as well
as legitimacy of the tax system as a whole that becomes a cause of non-filing of tax returns - a
statement also supported by (Cummings, et al. 2009). Moreover, the study also indicated the fact
that perceived corruption in tax system of the country had led people to justify themselves as non-
filers – again an idea supported by another study by (Levi, Sacks and Tyler 2009). (Gangl, et al.
2015) concluded that people in developing countries like Pakistan do not file their tax returns when
they are skeptical about the services being provided by the tax authorities and perceived corruption
is high. Moreover, people who had less knowledge about taxpayers’ rights were amongst those
who had not filed their tax returns.
Determinants of Tax Evasion
(Allingham and Sandmo 1972) took Becker’s Economies of crime and combining it with the
theory of Economic of Uncertainty claimed that tax evasion is a decision that is made under
uncertainty as it is unsure whether the authorities will get to know about the evasion or not. As the
probability of detection and penalties increase, the chances that people will go for tax evasion will

30
decrease. Tax rates, penalties on evasion and probability of being discovered have been taken as
the main determinants of tax evasion. On the other hand a study carried out by (Wentworth and
Rickel 1985) suggested that psychological factors like individual’s feeling of equity and perception
of social norms has a significant impact on the tax evasion behavior of individuals as opposed to
sanctions imposed by the authorities. The main reason for comparing the two studies is that both
had been carried out within the domain of income tax evasion.
(Anderson 1977) supported the idea that penalties and probability of being detected have an impact
on the tax evasion decisions. The study went on to say that non-salaried income is less prone to
being detected as wage income is subject to third party reporting that increases chances of being
detected. (Tanzi and Shome 1993) took the debate further and claimed that tax evasion varied with
the type of tax, the type of income on which tax is being levied and the economic size of the tax
payer. The major determinants of evasion in the study included level of penalties and probability
of being caught; competency of the tax administration; and perception about the level of corruption
in the government sector. Another study by (Robben, et al. 1990) experimentally stated that
objective situational effects (refund of taxes paid VS more tax to be paid in coming years) had
psychological implications like perceived opportunity of evasion, perception about others evading
and gain or loss on tax payments that further led to the decisions of whether or not to evade taxes.
It is observed that the literature till the late 90s was more focused on deterrence, economic and
non-economic factors like demographics, perceptions and attitudes towards compliance. However,
the focus of literature in the first decade of the twenty first century changed to other factors like
the tax morale and social contracts. A study carried out by Feld & Frey suggested that tax
compliance was a result of the interaction between the tax payers and tax authorities. The study
also concluded that tax morale of tax payers was more in a political setup that was more democratic
than those with lesser chances of political participation (Feld and Frey 2002). Riahi-Belkaoui
carried out a study of 30 countries in the year 2004 and was of the opinion that tax compliance is
the product of high level of political and economic freedom, competitive market, and strict
implementation of laws and low crime rates of serious nature. The crux of the study includes that
tax compliance is affected by institutional and moral factors rather than just economic and
deterrence (Riahi-Belkaoui 2004).

31
Taking the study of Riahi-Belkaoui further, Grant Recardson in 2006 carried out a study
incorporating 45 countries in order to determine the impact of non-economic factors like
complexity , income source, education level and tax morale on tax evasion of the citizens
(Recardson 2006). The study found a highly significant relationship of tax evasion with variables
of complexity, general education level, income source and tax morale. However, the study
concluded that other variables such as compliant peers, occupation, probability of being caught,
sanctions on being caught and detection may also be included in the studies for future research .
Two of the aspects identified by Recardson were addressed by Slemrod in his article in 2007 where
he concluded that probability of being detected and penalization played an important role in
curbing tax evasion while third-party reporting also plays a vital role in minimizing tax evasion
especially on income taxes from salaries (Slemrod J. , Cheating Ourselves : The Econmics of Tax
Evasion, 2007).
(Tsakumis, Curatola and Porcano 2007) managed to measure the impact of national culture on tax
compliance. The study took the cultural dimensions as proposed by (Hofstede 1980) and found
that national cultural dimensions had a significant impact on the overall tax compliance at the
international level. The study concluded that uncertainty avoidance and power distance had a
positive relationship with tax evasion while masculinity and and individualism had a negative
relationship. A study by (Recardson, The Relationship between Culture and Tax Evasion Across
Countries : Addition Evidence and Extentions 2008) also took Hofstede’s dimensions of culture
along with other variables like political, legal and religious factors to compare them with tax
evasion across 47 countries. The results of the study revealed that in cultural dimensions, only two
dimensions namely individualism and uncertainty avoidance had significant relationship with tax
evasion across the sampled countries. Moreover, legal enforcement, trust in government and
religion also had significant impact in shaping tax evasion behaviors across countries. The study
has controlled for the factor of economic development in different sample countries.
Literature has also taken the form of ethics and religion and its impact on tax evasion at national
level. A study carried out by (Strielkowski and Čábelková 2015) concluded that religion had a role
to play in motivating citizens to comply with the taxes as is the same for national pride. The study,
however, contradicted the previous studies in the sense that it did not support the idea of the
relationship between trust in government and institutions on tax compliance attitudes atleast for a
country like the Czech Republic. Although studies like those by Recardson, 2008 and

32
Strielkowsky, 2015 have found a significant relationship between religiosity and tax compliance,
the concept has been refuted in a study by Jun and Yoon who claimed that economic and social
incentives are more effective tools to achieve tax compliance than the concept of religiosity
religion (Jun and Yoon 2018).
Demographic Variables and Tax Evasion
Empirical literature on tax evasion suggests that demographic variables do shape tax compliance
attitudes of (Mittone, Kastlunger, Dressler, Kirchler, & Voracek, 2010). Socio demographic
factors are critical determinants while studying tax compliance behavior of the individuals (Torgler
& Schneider, What shapes attitudes toward paying taxes? Evidence from multicultural European
countries, 2007). However, mixed results are obtained in the literature when demographic
variables like age, gender, education, income level and source are related against the compliance
attitudes of individuals. Whereas studies like (Chung & Trivedi, 2003) & (Ahmed & Braithwaite,
When tax collectors become collectors for child support and student loans: Jeopardizing the
revenue base?, 2004) show significant results, there are studies like (Muehlbacher, Kirchler and
Schwarzenberger 2011) who claim that show no relationship or effect between the variables.
However, there are also studies like those carried out by (Pratama 2018), (Arbex, et al. 2018) and
(Jeyapalan & Abdul-Jabbar, 2006) that show a significant relationship of some demographic
variables with compliance while exclude others as having an insignificant or no relationship with
the compliance attitudes. An academic debate – based on opinions of different scholars regarding
the variables that may cause a change in the evasion behavior of individuals have been discussed
in details in the preceding paragraphs.
A study carried out by (Mason & Calvin, 1978) found a significant relationship between gender
and evasion where males were considered to evade more than women. Literature has also
suggested that women are considered to possess more ethical behaviors than men in business
related transactions (Betz, O'Connell, & Shepard, 1989). Although women are less politically
active than men (Lawless and Fox, 2010) still they have known to be more in favor of state
intervention and the expansion of welfare services of the state as compared to men (Morgan-
Collins 2013). Literature also suggests that women are proven to be more opposed to corrupt
practices (including tax evasion) as compared to men (Barnes and Beaulieu 2014). Literature
varies in its interpretation of the gender differences in attitudes towards government intervention.

33
Some scholars like (Eckel and Grossman 2001) are of the view that women are politically more
self-sacrificing while others believe that men contribute more towards public services (Bruner,
D’Attoma and Steinmo 2017).
According to (Colemen & Freeman, 1997) people respond favorably to government actions and
strategies that take in to account gender and cultural differences. Coming specifically on attitudes
towards taxation, it is argued that women tend to be more inclined towards thinking that the tax
systems is fair and that they perceive comparatively more chances of being caught on non-
compliance while they overestimate the fines and penalties on tax (Kinsey 1991). It is also
suggested in the literature that while making fiscal policy decisions the policy makers should take
into account the gender difference as men and women have different compliance atttudes and
behaviors towards tax payments (Sour, 2009). Men are considered to be more risk taking then
women especially when making financial decisions (Croson & Gneezy, 2009). (Bertrand 2011)
commenting on the gender difference also document that positive attitudes towards tax compliance
are affected by gender differences. The reason attributed for this affect is is risk aversion where
women tend to be more risk averse that results in increased willing ness to pay taxes.
Similarly (Doerrenberg & Peichl, Progressive Taxation and Tax Morale, 2013) conclude that
women have a higher willingness to pay their due share of taxes than men do. Overall the situation
demands that women tend to be more tax compliant as compared to their male counterparts (Lohse
and Qari 2014). It is also argued in the literature that gender has a strong and significant
relationship with tax evasion that remains the same across different cultures (Lin & Carrol, 2000).
A study carried out by (Brockmann, Genschel and Seelkopf 2015) compared the gender
differences in light of certain incentives given by authorities in an attempt to enhance compliance.
According to the study, on an average men are less complianct than women. However, women
were claimed to be more rrsponsive to incentives being given on tax compliance than men while
men were responsive to deterrence in the form of imposition of fines and penalties. Moreover, the
study also concluded that men were more responsive to the material rewards while less responsive
to immaterial incentives. The difference for women in this case hardly matters according to
Brockmann, Genschel and Seelkopf.
This difference in tax compliance attitudes between men and women are the same irrespective of
differences in cultures as women are universally considered to be more risk averse when it comes

34
to payment of taxes as compared to men (D’Attoma, Volintiru, & Steinmo, 2017). Even in
developed countries like Sweden where gender differences are at the minimum, behavioral
differences towards fiscal decisionos like tax evasion always persist between men and women
(D’Attoma, Volintiru and Steinmo 2017) hence concluding that men and women have differing
attitudes towards tax evasion irrsepective or cultures and norms of the societiy. A survey
determining the determinants of tax morale or the internal willingness of an individual to pay taxes
by (Doerrenberg and Peichl 2018) claimed that women were more compliant than men as their
willingness to pay was significantly higher than the men involved in the study. The study held risk
aversion as a conditional factor of increasing compliant attitudes and concluded that the man risk
aversion score of women was higher as compared to men with women being more risk avers than
men. Moreover, females have not only been shown to be more risk averse than men, (Bilgin and
Bilgin 2016) maintains that wome are more tax compliant as they have more ethical values as
compared to their gender counterparts – the men.
Although scholars have been able to maintain the view that women tend to be more tax complaint
than men and their tax morale is higher as compared to men, some scholars however maintain the
view that although there is a significant relationship however this relationship is comparatively
week (Jeyapalan & Abdul-Jabbar, 2006). There have also been studies who claim that gender and
evasion are not related to each other. A study carried out by (Al-Mamun, et al. 2014) in the city of
Johor, Malaysia concluded that men and women were same as far as their compliance preferrences
were concerned. The same results was suggested by (Pratama 2018) who - in a city of Indonesia -
concluded that gender did not possess any significant relationship with tax evasion habits of the
individuals. Same conclusion was made by Arbex, et al. who claimed many personal
characteristics including gender and age of the individuals as not having any significant
relationship with their tax compliance attitudes (Arbex, et al. 2018).
Like gender, literature has been mixed as far as age and its relationship with the tax evasion
behavior is concerned. Age can have dissimilar results across different situations (Riley, Foner and
Warner 1988). There may be a situation where elderly people may acquire more compliance
behavior while in another situation the element of honesty may erode with age. According to
(Mason and Calvin 1978) youngsters are more prone to tax evasion as compared to elderly people
hence showing a negatively significant relationship between the two variables. The more
compliant behavior of the elderly towards tax payment may be attributable to the fact that elderly

35
people are more in need of benefiting from public services like social security while they are better
off than the young aged people who are striving in their financial progression (Kirchler 2007).
Moreover, people at old ages also acquire knowledge regarding the tax laws that may also be a
factor in compliant attitudes and behaviors (Eriksen and Fallan 1996).
Similarly (Bilgin and Bilgin, 2016) suggested that elder people tend to be more compliant as they
are more sensitive to legal punishments and possess more status that makes them more compliant
as the social costs of penalizing on tax non-complliance are more for the elderly. Moreover, as
older a person gets – Bilgin and Bilgin suggest, they become more dependent on other’s behaviors
and hence tend to be more conscious to legal sanctions on non-compliance.Another study by
(Doerrenberg and Peichl 2018) through a survey explianed that an individual’s willingness to pay
increased with age. The study distributed respondents into different age groups and concluded that
people in the highest age bracket were the most willing to pay taxes and those in the lowest bracket
had the least interest in paying taxes. The study also claimed that other factors like income,
employment status and retirement status were also dependent on age when it comes to the
relationship with tax commpliance attitudes. A study carried out by (Hofmann, et al. 2017)
constituting a sample size including 111 countries concluded that although age had a significantly
positive relationship with tax compliance however, the relationship was a bit week and was based
on the geographic region of the individuals.
Hofmann et, al. also claimed that there was no significant relationship between age and tax
compliance attitudes of individuals in the South Asian Region (p. 66). There is however, another
group of scholars who even consider and propose the fact that age has a negative relationship with
tax compliance meaning that it has a positive relationship with tax evasion. However, the
significance level is very week as compared with other variables like gender (NatrahSaad, 2014).
On the other hand studies have shown a highly significant and positive relationship of age with tax
evasion (Mason & Calvin, 1978) (Wärneryd & Walerud, 1982) and (Torgler, 2004). Studies have
also tried to dig up the reason for this positive relationship. Most of the reasons attributable to this
lack of compliance are beyond the intentions of the individuals. According to (Widianto, 2015)
Some of the reasons attributable to this positive relationship are complex filing procedures, lack
of knowledge and information regarding use of modern technology like online filing of forms and
also distance from tax office that causes hurdles in complying to the tax laws by elderly people.

36
Literature has also produced mixed results as far as tax compliance and income level of individuals
is concerned. Vogel in the year 1974 suggested that people in Sweden who reported an
improvement in their incomes during the last five years had shown to be more towards evasion as
compared to people who had seen decline in their income (Vogel 1974). A study published by
(Clotfelter 1983) concluded that as income increases the compliance decreases or in other words
increase in income leads to increased tax evasion. The reason identified in the study was that
increased income leads to risk aversion. A similar result was obtained by Feinstein (1991) that
proved income to be having a positive relationship with frequency of tax evasion. Aim, Bahl, and
Murray while analyzing the Jamaican Tax system suggested that economic variables like income
do shape evasion behavior (Aim, Bahl and Murray 1990). According to the study, underreporting
increased with increased income hence having a positive relationship.
The same issue is highlighted in the Fischer’s model that claims income source and level to be
having an effect on the tax compliance behavior of individuals (Fischer, Wartick and Mark 1992).
According to the Fischer’s model, income increase has an impact on the evasion trend by
individuals as higher income people do not want their hard-earned income to be submitted to the
authorities as tax payments. An extension of this argument has been provided by Kirchler,
Muehlbacher, Hölzl and Webley that individuals who earn income effortlessly are more likely to
evade taxes as compared to those who have earned their income through hard-earned sources. The
main reason for this is the fact that people do not want their hard-earned income to be lost in the
form of penalties on non-payment of taxes to the authorities (Kirchler, Muelbacher, et al. 2007). It
is pertinent to mention that higher income people are more affected in tax system where there is
progressive taxation which is mostly the case in income taxation (Hofmann, Voracek, Bock, &
Kirchler, 2017).
A study carred out by (Duch, Palmer and J. 2000) documented the fact that people in the lower
income levels were more compliant in paying taxes than the higher income counterparts.
According to the study, lower income people are aware of the fact that they benefit from the public
services provided by the state that increases their morale and ultimately the compliance behavior.
on the other hand – according to Duch et,al. – higher income individuals have a lower willingness
to pay taxes as they perceive themselves to be benefiting less from public services being provided
that others. Till now, much of the research presenting the positive relationship between income
level and tax evasion like the one carried out by (Halla and Schneider, Taxes and benefits: Two

37
distinct options to cheat on the State 2008) who claimed that an increase in income decrease tax
morale of the individuals while increasing their benefit morale. According to the study both the
type and level of income are responsible for the tax compliance attitudes.
However, such approach has become obsolete as per the recent research and had mostly been
carried out in developed nations. There is a need to measure the relationship between demographic
variables like income level with compliance attitudes in developing nations as well (Chau and
Leung 2009). A comparatively recent literature suggests the results otherwise. (Houston and Tran,
2001) concluded that people in lower income brackets use methods like underreporting their
incomes and overestimating expenses to save their taxes as compared to higher income people
who seldom engage in such window dressing (Houston and Tran 2001). Moreover, higher income
individuals do not need to indulge in illegal practices to avoid taxation. Rather they do away by
exploiting loopholes in the existing tax system and avoid the burden of taxation (Luttmer &
Singhal, 2014) while also colluding with the authorities and paying extra sums to the officials in
the form of bribes to relieve themselves from the burden of taxation (Alstadsæter, Johannesen, &
Zucman, 2018) .
Another study carried out by (Bilgin and Bilgin, 2016) estimated a significantly positive
relationship with tax compliance attitudes. According to the study, people belonging to the lower
income bracket felt a discrepancy between their current and desired financial status and thought
themselves to be financially worse off as compared to others. Hence, according to them paying
taxes would lead to further deterioration of their financial condition. The study was carried out in
Bosnia – Herzegovina and the findings concluded that the higher the income level of respondents,
the higher was the tax morale that ultimately led to more chances that they would pay their due
share of taxes to the government authorities.
Literature has shown a significantly positive relationship between the level of education of an
individual and his attitudes and behavior towards tax compliance. Acquisition of education is a
measure of increased cognitive abilities of an individual that enable him or her to understand the
functioning of a modern system of welfare state and the relationship tax compliance and the
indirect benefits gained from the state in return (Arrow 1973). Obtaining a certain level of
education is a necessary condition for understanding the tax laws (Lewis, The psychology of
taxation 1982) that in turn leads to increased trust in the government authorities (Niemirowski,

38
Baldwin and Wearing 2003). It is also evident from literature that political awareness and
manipulation of information received through any means is more likely to be the norm of more
educated people (Sniderman, Brody and Tetlock 1993). A study carried out (Johnson and Kaye
2003) in USA during the period 1996 – 2000 found a highly significant and positive relationship
between the level of education of an individuals and the time spend by an individual in seeking
political information online.
Moreover, knowledge from certain sources like media regarding performance of the government
authorities can only be understood by a knowledgeable person who is able to process the
information being provided when an individual is educated enough (Norris 2000). This argument
is in compliance with that of (Tichenor, Donohue and Olien 1970) who stated that higher educated
persons have a better ability to comprehend and understand information obtained from certain
channel of news when many citizens are exposed to the same level of information. It is therefore
recommended by authors like (Price and Zaller 1993) that previous knowledge (as gained through
education) is an important element in gaining access to latest information as highly educated
people are more active in accessing political news than their less educated counterparts (Freedman
and Goldstein 1999). The same argument has been taken further by (Dalton 2005) who claimed
that education is a key to motivate individuals towards political and civic engagement as more
educated people are more likely to be politically active.
According to (Hite 1997), educating the masses can be of great help in solving issues like tax
evasion which can be of great help rather than inducing penalties. Hite quotes an example of the
USA where instead of imposing penalties on littering, the government started campaign to target
demographic variables including educating masses and hence reducing the amount of littering.
Studies have shown that there is a strong positive relationship between education and tax
compliance by the individuals. Educating the masses helps improve tax knowledge of the people
which in turn increases tax compliance in the society (Kornhauser 2007). A study carried out by
(Loo 2006) in Malaysia proved the importance of education and tax knowledge in increasing tax
compliance especially in countries like Malaysia where self-assessment tax system has been
introduced. the results of a survey carried out in Australia found that attitude towards tax
compliance was affected by the educational level of the respondents and policies to enhance tax
compliance needed to cater for educational programs (as mentioned by Hite) in addition to other
tools like penalties for tax defaulters (Devos 2019).

39
On the other hand studies have viewed the relationship between tax evasion and education
otherwise. A study carried out by (Lewis 1982) highlighted that education was a tool that enabled
the individuals to learn about the tax laws of the land. This helps them not only in paying their due
share of taxes but also enables them to save themselves from paying their due share of taxes. (Hite,
Identifying and Mitigating Taxpayer Compliance 1995) claimed that there was no linkage between
educational level of the taxpayers and their decisions to comply with the tax laws. (McGee & Ross,
2014) has claimed that the relationship between eduation attainment and tax compliance varies
across regions. For some countries the relationship is positive while for others it is either negative
or even no significant relationship exists for some countries.
Similatly acording to (Chan, Troutman and O’Bryan 2000), who carried out a research on tax
evasion in USA and Hong Kong found that evasion behavior was related to education in USA
while in Hong Kong no such evidence was found. However, the study claimed that where there
was a relationship between the two variables, it was negative. However, (Togler, 2007) claimed
that highly educated individuals have a higher tax morale as they are well aware of the benefits
associated with benefits being provided by the state and government. (Al-Mamun, Entebang,
Mansor, & Yasser, The Impact of Demographic Factors on Tax Compliance Attitude and Behavior
in Malaysia, 2014) also concluded that educational qualification – among other demographic
variables – was positively and significantly related to tax compliance in Malaysia. However recent
literature has concluded the relationship to be contextual. A study carried out by (Rodriguez-
Justicia and Theilen 2018) concluded that educational level of an individual has a significant
impact on the tax morale of people who are beneficiaries of the public services. Moreover, the
study also claims that attainment of education has a significantly positive impact on tax morale on
people in countries where public service delivery is more efficient and is vice versa for countries
where public service delivery is not up to the required standards.
There has been research that has linked tax compliance with tax related knowledge. Some scholars
have taken into account the impact of tax related education on tax compliance attitudes of the
taxpayers. (Kołodziej, 2011) suggested that education related to economics has a favorable affect
on the tax compliance attitudes of taxpayers. (McGee and Ross 2012) studied the relationship
between educational attainment and tax compliance in six countries and found mixed results.
According to the results of the study, some countries exhibited a positive relationship between
education acquired and tax compliance behavior while some showed a negative result. However,

40
they also found that in Germany, the level of tax compliance was high on both extremes of
educational attainment level of individuals while the lowest level of compliance in the country was
among the mid-level education individuals. Studies like the ones carried out by (Groot and van
den Brink 2010) and (Alarc´on-Garc´ıa, Beyaert and De Pablos 2012) in Netherlands and Spain
respectively found an indirect relationship between education and criminal behaviors and found
that the more educated a person was, the more inclined he or she was towards committing fraud
and other illegal crimes.
Studies have also focused on the relationship between tax compliance attitudes and informal
education rather than formal education. (Torgler and Garc´ıa-Vali˜nas, The determinants of
individuals’ attitudes towards Preventing Environmental Damage 2007) found a positive
relationship between the proxies of informal education (interest in politics and discussion of
politics with others). (B. Torgler, Tax morale, Eastern Europe and European enlargement 2012)
took two proxy variables for informal education namely, discussing politics with friends and
interest in watching politics in media. The study found a positive relationship between one proxy
of informal education i.e discussion of politics with friends and tax morale while negative
relationship with the other proxy. (Torgler and Valev, Gender and public attitudes toward
corruption and Tax Evasion 2010) made an attempt to find out the relationship between interest in
politics (a proxy for informal education) and tax compliance attitudes and found an insignificant
relationship between the two variables. While some scholars have taken tax related knowledge and
tax compliance attitudes as their variables of interest. However, the linkage between tax related
knowledge and tax compliance behavior is not for sure.
Studies like that carried out by (Crane 1990) supported the idea that tax related education increases
chances that people having more tax related knowledge would perceive the tax system as fair and
will act favorably to the tax laws. Similarly a research carried out on undergraduate students found
that students who have undergone one semester of taxation course were more compliant to tax
laws than those who did not take such courses (Kasipilla, Norhani, & Amran, 2003). The same
result was obtained by (Gitaru, The Effect of Taxpayer Education on Tax Compliance in Kenya :
A Case Study of SME's in Nairobi Central Business District, 2017) who carried out research on
the SME sector in Kenya and found that sensitization of taxpayers through tax related education
increased chances that the SME owners would be more compliant towards tax system of the
country. The same was concluded by (Wong and Lo 2015) who carried out research in Hong Kong

41
and found that students who had studied general level tax courses had positive attitudes towards
sales taxation while those who had taken technical taxation courses had positive attitudes towards
sales as well as income taxation. However, there have been studies that have proven the
relationship otherwise. A study carried out in New Zealand concluded that there was no such
relationship between tax related education and knowledge on tax compliance attitudes (Lin and
Carrol 2000).
Literature has cited a significant relationship between ethnicity and tax compliance. Before
discussing the relationship between ethnicity and evasion, there is a need to define the term.
According to (Basu 2006) an ethnic group includes a group of people living in a larger society that
have a known and common ancestors and share the same historical past. Tajfel et al. in the year
1971 explained the Social Identity theory which states when people characterize themselves with
a certain group of people then they start comparing themselves with other groups (Tajfel, et al.
1971). The study also explains that people belonging to a certain group react positively to the
welfare of their group members while they react negatively to the welfare of other group members.
When it comes to public service delivery different groups have different requirements of public
services (Bates 1973) that leads to intergroup conflict of interests and the utility of a public service
for a particular group reduces when they perceive that the other group or groups are also using that
service (Alesina, Baqir and Easterly 1999).
According to (Habyarimana, et al. 2007) societies with homogenous ethnic groups have a higher
tax morale as compared to societies with heterogeneity. The reasons are three folds the first one
being the fact that there is commonality of preferences for public services to be provided by the
government. Different groups have differing preferences of services being provided (Bates, 1973).
Moreover, as stated by (Becker, 1957) people react negatively to the services being provided for
the services being provided to other ethnic groups while they react favorably to those being
provided to their own ethnic groups. The other reason pointed out by Habyarimana et al. (2007)
is the fact that when interest of people in a society are common they take care of the public goods
being provided to them while it is easy for the people to punish whosoever cheats on taxes due to
the social stigmatization that is not easily possible in heterogeneity of ethnic groups. Habyarimana
et al. (2007) also conclude that it is easier to enhance tax morale of the society with homogeneous
ethnic groups through the threat of social sanctioning than for heterogeneous societies.

42
The same results for the negative correlation between tax compliance attitudes and ethnic diversity
have also been found in various other studies. (Lago-Pe˜nas and Lago-Pe˜nas 2010) while using
the data of European countries have concluded that ethno-linguistic fractionalization has an impact
on tax morale and that racial discrimination has been observed to be negatively correlated with tax
morale in European nations. Another study in the same year by (Li 2010) while working on the
European and World Values Survey taking the micro data has also confirmed the negative
relationship of tax morale with ethnic identities. A study conducted by (Tusicisny 2014) went a
step further to find out the conditions of the negative relationship between ethno-linguistic
fractionalization and tax morale. The findings included the fact that ethnic fraction in minorities
has a lower moral in multi ethnic societies and that trust in government was a factor that increased
tax morals even of the smaller ethnic groups. A somewhat similar conclusions were made by
(Belmonte, Dell’Anno and Teobaldelli 2016) who claimed that aversion to ethnic diversity is more
in countries where public services provision is centralized and in societies where there is more
ethnic fragmentation.
Research has found a significant relationship between cultural norms and values and the business
management attitudes by individuals (G. Hofstede 2005). It is necessary to understand the culture
of a particular group or society in order to understand their business practices (Crocombe 2008).
(Rothengatter 2005) carried out an intra-cultural study in Australia and found that different ethnic
groups living in Australia had differing attitudes towards tax compliance. According to the
findings of the study ethnic groups namely Asians, Greeks, Lebanese and locally born Australians
had different norms and values regarding business including payment of taxes with Asians being
more inclined towards making plans to get away with taxes as much as possible. According to
(Yong and Mooney 2017) ethnicity based cultural norms of businesses owned by different ethnic
groups do have an impact on the tax evasion behavior of these businesses especially at smaller
level. Such business are termed as ‘SBOs’ or Small Business Operators in the study. According to
the study, such cultural difference based on ethnic differences not only impact the tax compliance
behavior of these SBOs rather it also cultivates the way in which the tax authorities have to deal
with such issues. The study recommends that tax authorities need to take into account the cultural
differences of each ethnic group operating SBOs and make taxations policies according to each
cultural group as the strategy of ‘one size fits all’ is ineffective in such heterogeneous societies.

43
Studies have contradicted in whether tax morale is inherited or is a result of socioeconomic
development of a society. According to (Martinez-Vazquez and Torgler 2009), tax morale is a
result of changes in the economic and institutional setup of a country. Quoting the example of
Spainards the study claimed that improved socioeconomic conditions and better public services
resulted in changing the tax morale of the people in Spain. However, another study by (Halla M. ,
2010) claimed that tax morale was a result of inheritance from parents and relatives. According to
the study, people inherited tax morals and tax paying attitudes from their ancestors rather than
from the economic or institutional environment in which he or she is living in. Halla found out in
the study that second generation Americans had adopted their tax morales from the social structure
of the country of origin of their parents hence proving that their ethnic inheritance played a vital
role in their tax morale. The main conclusion of the study by (Halla, 2010) is not that such
inheritance is genetic rather it is based on the attitudes of parents regarding the tax compliance
behavior that is transmitted to the children. (Deyneli 2014) also concluded that cultural influence
does have a significant impact on the tax morale of the tax compliance behavior of an individual.
One of the aspects of ethnicity is religion. Although scholars have not been able to identify an
interconnection between religion and ethnicity, there is a one between the two (Kim, 2011).
Religiosity plays an important role in determining the difference between right and wrong and
therefore scholars like (Frank, 1996) believe that tax compliance being an ethical decision has a
significantly positive relationship with religiosity. Similarly, (Hull, 2000) believed that countries
with a higher level of religiosity had higher levels of tax morale and vice versa. Religion has been
observed to be an important factor in determining the tax compliance attitude of an individual
(Stack and Kposowa 2006) . Like ethnicity itself, scholars have tried to find out the correlation
between religion and tax evasion attitudes of the individuals. A study carried out by (Gupta and
McGee 2010) concluded that religions play an important role in shaping evasion behaviors.
According to them, in Australia, Buddists were the least opposed to tax evasion as compared to
Christians. The study also concluded that within Christians themselves, Roman Catholics were
less opposed than Protestants to tax evasion. However no other religion was shown to be having a
significant relationship with evasion. A study conducted by (Bilgin and Bilgin 2016) in the context
of Bosnia Herzegovina produced the same results and suggested that religiosity plays an important
role in tax compliance where more religious people having more propensity to get engaged in tax
compliance.

44
A somewhat same result was obtained by (Ross and McGee 2011) who made a similar attempt in
Malaysia and found out the that protestant Christians were the most opposed to tax compliance
than Roman Catholacs and other religions. However, this study also included other religions as
having significant relationship with tax evasion including Muslims, Hindus and the Buddists. (Ross
and McGee, Attitudes toward Tax Evasion: A Demographic Study of Switzerland 2011) concluded that in case
of Switzerland, Ethiest were most opposed to tax compliance while people who were more included towards
religion were more opposed to tax evasion than those who were on a comparatively more liberal side. A study
carried out by (B. Torgler 2003) concluded that religiosity plays an important role in defining the
tax morale of individuals.
According to the study, after controlling for many demographic variables including age, gender,
education and even income factors, it was revealed that people who attended the church regularly
had a significantly positive impact on their tax morale while their religious beliefs did not have
any significant affect on their tax morale. An explanation to this fact is supported by the findings
of (Strielkowski and Čábelková, Religion, Culture, and Tax Evasion: Evidence from the Czech
Republic 2015) who also claimed that peoples’ beliefs in their religion and on the government did
not have any significant influence on their tax moral. This meant that it was more important what
people do rather than what people think in shaping the tax morale of an individual.
Tax Rates and Evasion
Higher tax rates are also an important factor contributing to tax evasion. (Allingham and Sandmo,
1972) had shown that for risk-neutral individuals, tax evasion increases with marginal tax rates in
order to maximize their expected utility. However, the study did not see any significant
relationship between the two variables in case of rist averse attitude. The argument was supported
by (Levis, 1978) who concluded that tax compliance behavior of an individual is determined by
the amount of tax paid. Higher paying people are less willing to pay and wise versa. (Cox, 1984)
went against the arguments in favor of a significant relationship between tax rates and compliance
and claimed that there was no significant relationship bwtween the two. This claim was taken and
accepted by (M. D. Phillips 2011) (Alm and Torgler 2006)who remarked that as per the
indormation reported to him, tax rates were of little practical significance in determining tax
compliance.

45
Literature has found out an indirect measure of tax evasion that is the underground economy that,
according to literature is a result of higher tax rates. (Gutmann, 1977) claimed that higher the tax
rates will lead to more underground economy that is an indirect measure of tax evasion in the
economy. (Blackburn, Bose, & Capasso, 2012) claimed that individuals and firms indulge in
underground economy with the basis aim of saving themselves from the extensive burden of taxes
or to save themselves form the costs in the form of interest rates. According to (Alm, Bahl and
Murray 1980) tax rates along-with higher penalties reduces the tax base that in turn leads to
reduced tax revenue by the government. Another study conducted in order to seek explanation of
underground economy in the United States of America was carried out by (Tanzi, 1980) who found
that tax rates had a significantly direct relationship with currency holding hence providing an
indirect indication to the notion that evasion increases as tax rates are on the higher side.
A study carried out by (Clotfelter 1983) also suggested that marginal tax rates did have a significant
impact on tax evasion in that with increased tax rates, there was an increase in income evaded. The
study concluded that apart from other policies to curb evasion which included effective
enforcement, simplicity in procedures and mechanisms of reporting information, there needed to
be a mechanism that would take the marginal tax rates to a level where people do not evade more
of the income that has been taxed. (Fisman and Wei 2001) explained the same behavior in purely
quantitative terms and argued that one percent change in the rate of tax leads to a 3 percent increase
in tax evaded by an individual hence showing a significantly positive relationship between tax
rates and evasion and avoidance of taxation. The findings of a survey carried out by (Gashi and
Kukaj 2016) on the customs duty concluded that out of many issues asked form the respondents
the issue of higher tax rates was the foremost as highlighted by people that discouraged them from
paying customs duty.
Literature has found similar results on marginal tax rates. As marginal tax rate goes up, people
start underreporting their incomes and hence they start indulging themselves in tax evasion
(Slemrod and Bakija., Taxing Ourselves: A Citizen’s Guide to the Debate over Taxes 2008). While
discussing the marginal tax rates, mentioning of bunching at notches and kinks is also of due
importance. According to (Kleven and Waseem 2012), there are tax systems where there are tax
brackets and each bracket has a different tax rate. Each higher tax bracket has a higher marginal
tax rate. Under such systems – Kleven & Waseem argue – there are discontinuous jumps between
each tax bracket. If the difference between the rates of two consecutive tax brackets is

46
disproportionality high, such a situation is known as notch and taxpayers make such an
arrangement where they try to remain at the higher end of the lower tax bracket as there is high
incentive of remaining at that point. Such a situation is known as bunching at the notches.
On the other hand, according to (Saez 2010) there are situations where there are tax brackets in the
tax structure and the marginal tax rates between two consecutive brackets are linear, however
discontinuous, there is no or less incentive that people bunch at the higher side of the lower bracket
due to the fact that the difference between the two consecutive tax brackets is not very large. Such
a situation is known as kink. (Chetty, et al. 2011) argues that only very sharp kinks create bunching
at the lower bracket and holes in (gaps) in the lower side of the higher tax bracket as the incentive
to bunch at kinks is not very much as compared to notches. According to Klevin & Waseem
notches are only better than kinks in a situation where the system is frictionless. They also point
out to the study by (J. Slemrod 2010) who claim that under special structural conditions and under
certain policy tools, notches are a better tool for tax revenue however, certain conditions need to
be fulfilled.
Tax morale
Tax morale has been defined as the intrinsic motivation to comply with the taxes levied on an
individual (Frey 1997). Tax morale, as defined by literature, is the willingness and the morale
responsibility of a person to pay his share of taxes (Alm and Torgler 2006) and the fact that tax
compliance contributes to the development of the society at large (Alasfour, Samy and Bampton
2016). Tax morale actually consists of all those factors that are non-rational and affects the
volunteer compliance of a person with the prevailing tax laws (Brink and Porcano 2016).
According to Brink and Porcano, tax morale assists in explaining the compliance behavior of an
individual even when non-compliance would enhance his or her economic situation which would
be worsen off when he complies with the tax laws and regulations and pays his share of taxes. the
latest definition of tax morale comes from (Rodriguez-Justicia and Theilen 2018) who defined tax
morale as ‘cheating on tax if you have the chance’ (pp. 9)
Like tax evasion, the concept of tax morale is not a new one. (Strümpel 1969) was the first one
who used the term ‘tax mentality’ and described it as the willingness of an individual to pay taxes.
As a result of a cross country survey, Strümpel concluded that this willingness or the tax mentality
was influenced by the perception of individuals about the way they were treated by the tax

47
authorities. (Lewis, An empirical assessment of tax mentality. Public Finance 1979) took the
argument further through a survey research and concluded that although there was no general
factor that influenced tax mentality, however the most significant predictor was the amount of tax
being paid by an individual. According to Lewis, higher tax paying individuals were less willing
to pay taxes. however, the argument was refuted by (Cox 1984) who concluded that there was no
significant causal relationship between tax rates and an individual’s willingness to pay taxes.
The same was endorsed by (Phillips, 2011) who reaffirmed the stance of Cox that tax rates had
little significance when it came to their relationship with tax compliance behaviors. These intrinsic
factors include social norms, values and cognitive abilities of an individual. It is important to note
that tax tax morale consists of all factors that cause internal motivation. Studies like the one carried
out by (Torgler, Schaffner and M. and Macintyre, Tax compliance, tax morale, and Governance
Quality 2010) have concluded that intrinsic factors do play a vital role in shaping tax morale of an
individual .They noted that in some countries the level of deterrence (external factor) was too low
to explain the higher level of compliance rate however, the outside world also have an influence
on the tax morale (Kirchler, The Economic Psychology of Tax Behaviour 2007). Studies have also
tried to identify those external factors that help in shaping the tax evasion behavior of an individual.
A study by (Torgler, Schaffner and Macintyre, Tax Compliance, Tax Morale, and Governance
Quality 2007) provided an explanation of the relationship between tax morale and compliance
behavior. the study maintained that tax morale is a basic factor that leads to enhanced compliance
behavior despite lower level of external factors and this intrinsic motivation is based on trust in
government and its agencies.
Like many other researchers (Torgler and Murphy, Tax morale in Australia: What Shapes it and
Has it Changed Over Time 2007) have also defined tax morale as an intrinsic motivation to pay
taxes however, the study like many others has not been able to identify those values or principle
that individuals hold in order to comply with the tax laws. Torgler and Murphy have also claimed
that only one factor to measure tax morale is not sufficinent and would be vulnerable to criticism.
This task has been accomplished by (B. Torgler, Tax Compliance and Tax Morale: A Theoretical
and Empirical Analysis 2007) who identified three factor responsible for enhancing the tax moral
of an individual. According to Torgler moral rules that are the result of social norms prevailing in
the society is an important factor in determining the tax moral. Feeling of guilt as a result of
religious motivation has also been an important influencer of tax morale in the study. Moreover,

48
perception regarding fairness in the tax system and trust in government are the other factors that
influence tax morale of an individual.
The factor related to religiosity has not been proven to be a significant factor of tax morale and its
resulting compliance attitude and has therefore given mixed results in the literature (Henrich, et
al. 2010). (McKerchar, Bloomquist and Pope 2013) has also denied the fact that religiosity plays
a role in tax morale rather personal integrity has a major role to play in the internal motivation to
pay the tax burden. A study carried out by (Kondelaji, et al. 2016) in Iran claimed that in order to
determine the tax compliance behavior of an individual, one needs to take into account the social
norms attitudes and beliefs rather than the purely rational approach of utility maximizing. The
study categorized determinants of tax morale into four broad categories and concluded that out of
four only two namely conditional cooperation and economic situation if the taxpayers were
significant determinants while demographic variables like gender and marital status and the
importance of politics and religion did not play any role in determining the tax morale.
However the role of culture has been missed out by Torgler but the same has been given due
importance in the literature as an influencer of tax compliance attitudes (Ashby and Webley 2010)
and is discussed in the section related to ethnicity and its impacts on tax evasion behavior.
Torgler’s perception of fairness has also been supported by literature. Perceived fairness is shown
to be a significantly high contributing factor in tax compliance attitudes in the literature
(Hallsworth M. , List, Metcalfe, & Vlaev, The behavioralist as tax collector: Using natural field
experiments to enhance tax compliance, 2017). The third factor as discussed by Torgler has also
been verified by literature and found out to be a contributing factor in tax morale. (Feld and Frey
2007) argued that trust in government institutions and agencies is a contributing factor in
motivating taxpayers to pay their taxes. Similarly, according to (Kirchler, Hoelzl, & Wahl,
Enforced Versus Voluntary Tax Compliance the ‘Slippery Slope’ Framework, 2008) higher level
of trust results in a high level of tax compliance by taxpayers.
One of the factors that contribute to the intrinsic motivation of the tax morale of an individual is
the perceived trust in government and institutional capacity of the country. According to (Feld and
Frey, 2007) there is a give and take relationship between the taxpayers and the government in
which one party (the government) gives away in the form of government policies, behavior of the
government servants and institutional capacity of governmental agencies to the taxpayers. In return

49
to this, the taxpayers pay to the government money in the form of tax. According to (Feld and
Frey, 2007) this relationship constitutes a psychological contract in which the taxpayers perceive
the tax system to be fair and hence comply to the tax laws. (Torgler and Schneider, The Impact of
Tax Morale and Institutional Quality on the Shadow Economy 2009) studied tax compliance in
Switzerland and concluded that tax evasion was negatively related to perceived governance and
quality of government institutions. All these variables related to perceived government
effectiveness have been termed a ‘Trust in Government’ by (Brink and Porcano, 2016).
Earlier (Alm and Torgler 2006) had already talked about the difference in tax morale in countries
as a result of differences in the structure and quality of political and economic institutions. These
differences in perceptions towards government institutions and their resulting trust in government
determine whether people should evade taxes or not and ultimately shaping their tax morale. (Nerre
2006) also pointed out to that each country has unique national culture that determines the
interactions between the taxpayers and government agencies and ultimately tax compliance
behavior of the citizens. (Martinez-Vazquez and Torgler 2009) pointed out the fact that shaping
government institutions in such a way as to provide higher income opportunities to its citizens and
improving public service delivery led to increased trust in government that in turn led to increased
tax morale of the citizens. The same is highlighted by (Barone and Mocetti, Tax morale and public
spending inefficiency 2011) who claimed that when the taxpayers perceive the government to be
efficient in providing public service, while the effect is otherwise when they perceive themselves
to be betrayed by the government authorities.
Inefficiencies in public service delivery is an important factor in shaping tax morale of an
individual. (Barone and Mocetti 2011) tried to established that inefficiencies in public service
delivery negatively affects the tax morale off the tax payers. According to them, inefficient public
service delivery affects more where the expenditure on such deliveries is lower. The study also
claimed that people who receive higher public service spending are less concerned about the
inefficiencies as compared to those who receive lesser amount of these services as these people
already have lack of access to adequate public services. It is therefore imperative to note that and
increase in social expenditures is a necessary condition for an increase in the tax morale of
individuals (Halla and Schneider, Taxes and benefits: Two distinct options to cheat on the State
2008). (Bahl and Bird 2008) explained the same and claimed that economic development depends

50
more on the efficiency of spending rather than tax collection. This is most importantly the case in
developing nations where citizens look towards the government to live comparatively better lives.
Another interesting piece of literature came from (Kiow, Salleh and Kassim 2017) who stated that
compliance behavior of taxpayers depends on the ethical perceptions that in turn lead to declaration
of tax payable correctly by the individuals. Ethics by the government as defined in the study by
Kiow, Saleh and Kassim includes perceived utilization of tax money by the government and
benefits that a taxpayer gains from the taxes paid in terms of public goods and amenities.
According to the study people who perceive government to be acting ethically are more likely to
have better compliance rates than those who consider the government to be unfair in its utilization
of the tax money. Moreover, Kiow et. al also claimed that transparency in government spending
increases trust in government that in turn leads to enhanced tax compliance.
However, very much transparency in the government spending has an inverse effect on the trust
in government as people have more opportunities to audit government agencies and hence they
can hold agencies accountable and hence loose trust in governments on minute mistakes that are –
according to (Kiow, Salleh and Kassim 2017) – possible at government levels. The same facts can
be seen from the findings of (Doerrenberg 2015) who carried out a laboratory experiment and
concluded that people were very sensitive towards the utilization of their tax money. According to
the findings of the research, people were more compliant when the tax money was being utilized
on charity and research while their compliance attitude diminished when their tax money was
being given to the government. The study concluded that overall perception regarding government
spending is that money spent by government is inefficient as compared to the same money being
utilized on noble and professional causes like on research and on charity.
Literature has also found out a significant relationship between financial autonomy and the tax
morale of the taxpayers. According to (Alm, McClelland and Schulze, Why do people pay taxes?
1992) tax morale is highly influenced by the level of financial autonomy given at local government
level as taxpayers perceive more benefits in return for their tax contributions to the government.
The same argument was given by (Gu¨th, Levati and Sausgruber 2005) who claim that taxpayers
exhibit a lower level of willingness to pay under centralized tax structures where the revenue
collection is strictly under the supervision of the central governments. The reason for this
relationship between fiscal decentralization and tax morale has been given by (Torgler, Schneider

51
and Schaltegger, Local autonomy, tax morale, and the Shadow Economy 2010) according to which
fiscal decentralization leads to enabling the local governments to spend according to local
preferences and choices that in turn leads to higher tax morale or willingness to pay by the
taxpayers who perceived that their tax money is being spent on their benefits.
Corruption the other parameter of trust in government has been proved to be an important cause
of decreasing tax morale amongst taxpayers in the literature. (B. Torgler, Tax morale and direct
democracy 2005) also found a negative correlation between perceived corruption and unfair tax
system and tax morale as – according to him – the taxpayers did not find equitable comparison
between taxes being paid by them and the services being provided by the government. According
to (Levin and Satarov 2000) corruption has a negative impact on the perception amongst citizens
in that it reduces trust in the government and its institutions. One of the main causes of corruption
amongst the government officials as quoted by (Torgler, 2007) is the fact that they are not being
paid enough for their jobs. Torgler in his study quoted the example of Scribes (tax collectors in
the ancient Egypt). Those Scribes were engaged in bribery for releasing tax evaders. However, at
the time –according to Torgler – when their salaries were made better off, these Scribes started
pursuing the tax cheaters more efficiently and effectively.
(Jain 2001) assigns the reason to this relationship and states that corruption reduces efficient
allocation of resources by the government. According to Jain there are two reasons one being the
fact that corrupt bureaucrats assign contracts not to the best producers but to producers who pay
the most bribe. According to Jain, kickbacks and other restraints due to non-payments to corrupt
bureaucrats delay provision of facilities that ultimately affect the provision of public services to
the masses. (Friedman, et al. 2000) argue that corruption leads to underground economy as people
who perceive system to be unfair don’t pay their taxes and ultimately get indulge in underground
economy that in turn leads to low tax revenue collection by the government. Some scholars have
also found the relationship between corruption and some types of government expenditures. A
study by (Mauro 2002) claimed that government expenditure on education was associated with
corruption with less spending on education led to higher rates of corruption in the society.
(Abed and Davoodi 2002) empirically concluded that countries with a higher level of corruption
lead to a higher level of underground economy. (Bird and Zolt 2005) have argued that developing
countries lack a higher tax net and the main reason attributable – according to Bird & Zolt is higher

52
levels of corruption prevailing in these societies. A similar claim comes from (Dreher and
Schneider 2006) who state that corruption is the foremost cause of widespread underground
economy in different countries especially the underdeveloped nations. According to (Torgler and
Schneider 2007) corruption leads to trust in government agencies that in turn pave way for the
people to indulge themselves in underground activities. Till now the findings are in compliance
with the previous studies, however, there is another dimension of corruption that leads to other
social evils. According to (Torgler and Schneider 2007) when the citizens perceive the tax system
to be unfair they start distrusting the government authorities.
The level of trust in government declines to such an extent that most people resist in payment of
taxes to the government. Rather they start indulging themselves in underground or the shadow
activities. It is at this point when a large number of citizens start participating in such underground
activities, it becomes a norm and the social costs of indulging in tax non-compliance and shadow
economy at this point become low as people perceive it to be a widespread phenomenon. Hence
people easily join the evaders club and ultimately the economy as a whole suffers. ( (K. Gangl, et
al. 2015) have also found that people in Pakistan do not file their tax returns because they perceive
high levels of corruptions in the tax administration if the country. This speaks volumes about the
issues of tax non-compliance in Pakistan that has one of the lowest tax-to-GDP rations in the world.
According to (Cyan, Koumpias, & Martinez-Vazquez, 2016) corruption has a significant
relationship with perception regarding the tax net. The study also claims that tax evasion is a
product of widespread corruption in the tax administration. Higher levels of corruption in the tax
administration lead to lack of effective audits of firms that further enable the firms to evade
especially on withholdings on salaries. Moreover, the study also concluded that corruption has a
significant relationship with perceived fairness in the system. When taxpayers perceive special
treatment being given to some sectors or a certain group of people or firms, they start distrusting
the system and ultimately their tax moral decreases. This decrease in tax morale further leads to
non-compliance by the taxpayers. (Litina and Palivos 2016) also take in to account 45 countries
and conclude that tax morale has a significantly negative relationship with perceived level pf
corruption at political level.
A study by (Jahnkea and Weisser 2018) carried out in 25 Sub-Saharan nations demonstrated that
effect of petty corruption (bribery by street level bureaucrats) on the tax morale is highly

53
significant in countries where corruption is less prevalent. This is because in such countries when
people are confronted with forced bribe, their motivation to pay taxes diminishes to a great extent.
The case is however different for countries where level of such petty corruption is high. According
to Jahnkea and Weisser, even in such countries people exposed to forced bribe have their tax
morale diminished. The study concluded that corruption has an indirect effect on tax morale.
Corruption reduces trust on institutions that in turn leads to decrease in the tax moral of individuals.
The same is seconded by (Horodnic 2018) who claimed that widespread corruption leads to lower
tax morale because people do not trust their government institutions and feel they are being
cheated. Hence they refrain from giving their share of hard-earned money to the government.
Another indicator or the determinant of tax morale or the internal willingness to pay taxes is the
perception about others paying taxes. In other words, literature has termed this as social norm (e.g;
Dwenger et al. 2016). Literature has cited two main motives behind compliance behavior one being
the fact that people contribute to public goods provision (by paying taxes) when they feel and
perceive that others in their society are also contributing for those public goods (Van Windon,
2000). Moreover, people also decide whether to pay taxes or not based on their perception of public
goods being provided to them (Zelmer 2003). Similarly people also respond to the social norms to
pro-social behaviors like contributing in charitable donations or saving energy when they perceive
that others in their society are also engaging themselves in such activities (Allcott 2011). Although
there are many studies that show no significant relationship between social norms and tax morale,
there are scholars who have found a significant relationship between the variables.
(Traxler, 2010) included the variable of social norm into the Allingham and Sandmo’s model and
found a significant relationship between decision to evade and perceived level of evasion in the
society. The study concluded that the higher the number of evaders in a society, the more
willingness of an individual to evade his share of tax burden. Luttmer and Singhal (2014) pointed
out the fact that scholars as cited above who did not recognize the relationship between social
norms and willingness to pay taxes actually underestimated the power of external interventions.
Luttmer and Singhal termed the following of social norms as ‘moral appeals’ and claimed that it
was possible to follow the moral appeals through small scale external interventions by the
authorities. According to them views or behaviors of others are an important aspect of tax morale.
(Paetzold and Winner, 2016) showed that firms had a great influence on tax compliance attitudes
of the individuals. according to the study, on switching jobs, people evaded taxes more when they

54
joined firms where tax evasion was more than in those firms where compliance was comparatively
more.
Similarly (Kondelaji, et al. 2016) carried out an experimental research in Iran and concluded that
among many other economic and psychological factors, tax compliance in the country was greatly
affected by the perceived level of evasion in the Irani society. (Hallsworth et al., 2017)
acknowledged through a randomized experiment that taxpayers who were told that 90% or 9 out
of 10 people in the UK paid their share of taxes increased their chances of ‘ontime’ payment of
taxes. Moreover, (Bohne and Nimczik, 2018) also claimed and concluded that a person’s
willingness to evade taxes was a function of his perception of level of evasion in a society. A
survey research carried out in Germany suggested that people are not only sensitive to the social
norm affect of the perceived number of people evading in the society, provision of information
regarding the level of non-compliance to the individuals also results in people considering it a
normal activity and thus get themselves engaged in the same process as they have the knowledge
of prevailing trend and hence following the concept as given by (Cialdini 2003) ‘if so many others
do it, it must be OK’
As discussed earlier, people follow the social norms and when they perceive non-compliance to
be a social norm then they themselves indulge in such unethical practices. Till now the review of
literature has given one side of the story. The other side of the story includes a situation where a
person indulges in non-compliance practice and fears being notified by the government and society
at large. There are times when people indulge in ethical practices despite the fact that they are
financially at a loss by paying taxes. (Erard and Feinstein 1994) has defined this phenomena as
moral sentiments of guilt and shame that serve as important determinants of compliance behavior
of an individual. (Markel 2001) has defined the element of shame as ‘the emotion one feels when
subjected to public degradation’ where guilt as ‘the emotion one feels after continuously becoming
aware of wrongdoing over which one feels responsible’ (p. 2179).
Literature has found shame to be a determining factor in reducing tax evasion behavior of
individuals. (Erard and Feinstein , 1994) have documented that a person who decides to indulge
in tax evasion feels ashamed - which in turn minimizes his or her utility to be gained through tax
evasion - when his accounts are audited by authorities. Similarly, (Bosco and Mittone 1997)
conducted an experiment and showed that there was no deterrent effect of tax publicity on the tax

55
evasion behavior of the subjects. However, the study concluded that tax audit publicity had a
significantly positive effect on the evasion behavior. The results of the study showed that despite
the fact that audit publicity incited an element of shame amongst the respondents, this sentiment
of shame was not linked by the subjects for being announced as evader. Rather audit publicity
increased evasion that might be due to the contagion effect of unethical behavior as described by
Gino et al. (2009). This contagion effect is described as the fact that when a certain wrongdoing
or an unethical behavior is publicized, people consider it as a social norm due to its wide publicity
and start indulging themselves in such unethical behaviors.
Likewise (Kirchler, 2007) has observed that shame or the feeling of being degraded is a
contributing factor in making evasion decisions and this feeling acts as a cost of evading taxes.
Literature has cited mixed results for publically disclosing tax information. A study carried out by
(Laury and Wallace 2005) took two groups of subjects in which one group included participants
who were intimated about the fact that tax audit information would be kept confidential while in
the other group partial confidentiality was considered. The results showed that in the beginning
income declaration in the partial confidential group increased. However, in the longer run the
results became insignificant. Another study by (Coricelli, et al. 2010) took eight participants in an
experimental research where the name and picture of the evader (declared through audit
probability) was decided to be shared among the other members of the group. the findings of the
study revealed that the threat of being ‘named and shamed’ increased the number and amount of
income. The study concluded that the shame effect reduced the chances of evasion by 8.2%
(Hasegawa, et al. 2013) analyzed Japanese tax data and found that seizure of government policy
of disclosing defaulters’ data to the public did not have any impact on the corporation income
disclosure to the authorities. On the other hand, (Bø, Slemrod and Thoresen 2015) used data from
Norway and found that disclosing tax data on internet did have a significant impact as reported
incomes increased in the country.
(Lefebvre, et al. 2015) studied the impact of public disclosure of tax information of compliance
and found that listing information about tax compliance has a deterring impact on tax compliance
as it alters beliefs regarding tax compliance and thus leads people to engage in con-compliance
considering it as a social norm. (Perez-Truglia and Troiano 2016) conducted a field experiment
in three states of the United States on tax defaulters and found two observations during the course

56
of the study. First of all the study concluded that people who owed a small amount of default
towards tax authorities were more prone to the shame effect than those who owed larger amount.
Hence proving that greater the amount of default, the less prone a person is to shame effect. Second
conclusion made by the study included the fact that information regarding other tax defaulters’ did
not change tax morale of the internal motivation to pay taxes of individuals. The reason for this
could be the design of the study that included a one-shot case study.
(Dulleck, et al. 2016) who carried out an experiment and studied the relationship between the
moral costs and tax compliance. The study used heart beat variations of the subjects and
determined that moral costs had a significantly positive impact on tax compliance behavior of
individuals. (Blaufus, et al. 2016) described fear of name being published publically as the main
element of shame that reduces a person’s motivation of not paying his or her due share of taxes to
the authorities. Publicity of tax records have two effects as described in the literature. (Blaufus, et
al. 2016) described two effects of disclosure of information to the public namely the shame effect;
and the Contagion effect. According to the study the shame effect is for the time being. However,
when people perceive evasion or non-compliance of the taxes to be wide spread, they start
considering it a social norm and ultimately in the longer run, such publicity has a negative impact
on tax compliance.
Apart from fear of being detected by authorities, literature also suggests that people indulge in tax
evasion when they do not fear being reported by any third party (Alm, Bahl and Murray, Audit
Selection and Income Tax Underreporting in the Tax Compliance Game 1993). According to
(Andreoni, Erard and Feinstein 1998) (p. 821) people who are engaged in sole proprietorship or
are self employed and their income is not subject to third party reporting indulged in
underreporting of income more than the national average as per the statistics of 1998 Taxpayers
Compliance Measurement Program in the USA. (Joulfaian and Rider 1998) also suggested that
individuals’ compliance decisions are based on the fact that chances of their income is not being
reported by third party. According to the study, wage earners whose income tax can be matched
by the records of employer have a lesser tendency to evade than those being self-employed. Studies
like those carried out by (Bruce 2000)) have claimed that people try to enter into self employment
if they want to evade taxes as self employment income is less vulnerable to third party reporting.

57
Although much literature discussed on the issue of third party reporting pertains to developed
nations, the situation is the same for underdeveloped countries. (Alm, Bahl, and Murray 1993)
used records from Jamaica and found the same results that individuals whose income could not be
matched with the records of third party were more prone to income tax evasion. It is also evident
form the literature that people who are wealthier and have the opportunity to prepare their own tax
return have more chances of non-compliance than otherwise (Alm, Deskins and McKee, Third-
Party Income Reporting and Income Tax COmpliance 2006). A study carried out by (OECD 2006)
also concluded that in order to increase compliance third party reporting with some technological
and administrative advancements in the tax system are required which incomde rapid disclosure
of information to the tax authorities and capability of the tax authority to deal with reported
discrepancy. (Gillitzer and Skov 2018) carried out his research in Denmark on charitable tax
deductions claimed that with an increase in the use of information reporting in the year 2008, there
was a significant increase in the number of claims hence supporting the stance that increase in
reporting mechanism has a significant impact on tax compliance behavior of individuals.
Penalties and fines on tax non-compliance can also be a motivating factor in complying with the
tax laws of the land. In contrast to the norms model where people comply to the tax laws as they
want to adhere to the social norms and to reciprocate the cooperation of other citizens and
respecting the law, literature has also suggested that such compliance is merely a result of cost-
benefit analysis where the expected costs of non-compliance are higher than the perceived benefits
of evasion (Milliron & Toy, 1988, p. 85). The decision of whether to evade or not is made on the
premise that a taxpayer has fear of being caught and penalized on evasion of taxes (Alm & McKee,
1998). Literature has found mixed results as regards the impact of penalties on evasion decision of
an indiviaual. Previous studies like those carried out by Alm, Bahl, & Murray, 1990; Alm, Jackson,
& McKee, 1992) concluded that there was a negative or no relationship between the rate of penalty
on tax evasion and tax compliance. On one hand studies claim that higher penalties have a positive
impact on tax compliance of an individual (Park & Hyun, 2003).
During budget analysis the policymakers are faced with a serious problem of tax gap that is the
difference between the tax levied and the tax actually paid. This tax gap in turn affects the budget
in the form of budget deficit or expenditures more than income required to incur those
expenditures. In order to overcome the budget deficit issues, the policymakers have the option to
curtail expenditures that may in turn affect them politically while on the other hand they are left

58
with the option of increasing tax compliance and ultimately reducing the tax gap (Doran 2009).
However, in order to ensure full compliance, the tax administration needs to incur compliance
costs hence in order to ensure maximum compliance within acceptable costs, the tax administration
permits certain level of non-compliance (Polinsky and Shavell 2000). According to Doran, one of
the tools that can be used by the authorities in order to enhance compliance is through imposition
of penalties on tax non-compliance that proves to be an effective tool in producing desired results.
(Loo, 2006a) described that the penalties in the Malaysian tax system were effective in determining
the compliance behavior of individuals. The same findings were generated by (Loo, 2006b) who
took tax rate, audit rate and penalty rate as the possible determinants of tax compliance behavior
and found rate of penalty to be the greatest determinant of tax compliance behavior especially after
the introduction of Self Assessment Scheme of filing of taxes in Malaysia. In contrast to these
findings, (Mohdalia, Isa and Yusoff 2014) suggested that punishments and penalties not always
prove to be fruitful in enhancing tax compliance of individuals. People who already have positive
intentions towards tax compliance are negatively affected when they are coerced to tax while they
already have the intensions to do so.
Hypothesis
An analysis of the literature review has clearly shown that demographics and morals of an
individual have a significant impact on the tax compliance behavior worldwide. As far as
demographic variables are concerned, studies like those carried out by (Chung & Trivedi, 2003),
(Togler & Schneider, 2017) and (Mittone et. al, 2010) have shown that there is a significant
relationship of socio demographic variables with tax evasion behavior of an individual. Similarly,
tax morale which is the intrinsic motivation to pay taxes as defined by (Frey, 1997) also has a
significant relationship with tax compliance behaviors. Literature has shed light on its importance
in shaping tax compliance attitudes of a person. According to (Brink & Porcano, 2016) tax morale
consists of non-rational factors that affect tax compliance attitude of an individual.
Demographic Variables
Demographic variables include an extensive list of variables like age, gender, income level and
marital status of an individual (Landy, 2001). However, for the purpose of study a total of five
variables have been considered including Age, Gender, Income Level, Education Status and

59
Ethnicity of an individual. Literature has shown mixed results as far as their relationship with tax
evasion is concerned. However, the hypotheses constructed are as follows:
Age
There are reasons to believe in non-compliance literature that age has a relationship with tax
evasion behavior of an individual. Although literature claims that the relationship varies across
situations (Riley, Foner and Warner 1988) still there is a significant relationship. Some scholars
are of the view that the elderly are more comliant as far as tax payments are concerned (Kirchler
2007) and (Bilgin and Bilgin, 2016) while studies like carried out by (Torgler, 2004). And
(Widianto, 2015) believe that the relationship is vice versa. Proponents have given their own
reasons to justify their claims. As there is no agreement in literature as regards the direction of
relationship between age and tax evasion, therefore the present study doesnot take into account the
direction of relationship. Rather the hypothesis is constructed as follows:
H1 = Age has a significant relationship with tax evasion behavior of individuals
H0 = There is no significant relationship of age with tax evsion habits of an individual
Gender
Literature suggests that gender do have a significant relationship with tax compliance behavior of
a person. Much literature advocates the fact that women tend to be much more compliant than men
(Doerrenberg & Peichl, 2013) and (Lohse and Qari 2014). The main reason attributable is the fact
that willingness to pay taxes in women is more that that in men (Doerrenberg and Peichl 2018)
while women tend to be less risk taking in term of financial decision as compared to their male
counterparts (Bilgin and Bilgin 2016) and (D’Attoma, Volintiru, & Steinmo, 2017). It is therefore
hypothesize:-
H2 = Gender has a significant relationship with tax evasion behavior where men tend to be less
tax compliant
H0 = Gender has no significant relationship with tax evsion habits of an individual
Income Level
Similarly, income level has also been observed in the literature as having significant relationship
with tax evasion. Previously, literature suggested a positive relationship between the level of

60
income and tax evasion behavior. (Vogel 1974), (Feinstein, 1991), (Aim, Bahl and Murray 1990)
and many others of the time considered a positive relationship i.e; as income increased, compliance
decreased or in other words evasion behavior increased. However, recent literature has proposed
the results to be otherwise. Studies by (Houston and Tran, 2001), (Bilgin and Bilgin, 2016) and
(Alstadsæter, Johannesen, & Zucman, 2018) are amongst many who advocated the negative
relationship between income level and tax evasion behavior. Another interesting aspect of
thisrelationship is that there is a difference in such relationship between developed and developing
nations. People in developing nations mostly show a negative relationship between income level
and tax evasion (Chau and Leung 2009). As pakistan is also a developing nation, therefore it is
considered that the same rule applies to the country as well. Therefore the hypothesis is as follows:-
H3 = As income level increases, tax evasion behavior decreases in Pakistan
H0 = there is no relationship between income level and tax evasion behavior in Pakistan
Education Qualification
Educational qualification here means attainment of formal degrees regardless of any type of
specialization. Keeping in view the topic and required population, the lowest qualification was
taken to be Matriculation or 10th standardwhile going upto Doctoral degree. Literature on
educational attainment and its relationship with tax complliance has produced mixed results.
Scholars like (Lewis 1982) argue that there is an inverse relationship between the two where
educational attainment enables people to know tax laws that led them to know the grey areas and
hence to save themselves from tax payments. On the other hand scholars like M. E. Kornhauser
are of the view taht educating the masses improves their tax knowledge which in turn leads to
increase in their compliance behavior (Kornhauser, 2007).
However, (McGee & Ross, 2014) suggested that relation of tax compliance with education veries
across regioss. The idea was supported and proven by (Chan, Troutman and O’Bryan 2000) while
scholars like (Rodriguez-Justicia and Theilen 2018) support the idea that the relationship is context
specific and issues like public service delivery, level of benefits from taxes intervene in the
relationship. As literature does not settle the dispute regarding direction of relationship, therefore
this will be out of scope of this study. In order to check and verify the claims, following hypothesis
will be studied during the course of the study:

61
H4 = Educational attainment has a significant relationship with tax evasion behavior in Pakistan
H0 = there is no relationship between educational qualification and tax evasion behavior in
Pakistan
Ethnicity
An ethnic group is a group of people that have a common ansestory and share common historical
past (Basu, 2006). Ethnicity is a significant determinant of tax compliance behavior as seen from
the existing literature. According to (Lago-Pe˜nas and Lago-Pe˜nas 2010) who carried out a study
on ethno-linguistic diversity in europe observed that ethnicity was a significant factor in
determining tax morale of individuals. (Yong and Mooney 2017) went a step further and
investigated that cultural norms of a perticular ethnic group had an impact on the tax morale of
inviduals associated with that perticular group. (Halla M. , 2010) identified that as ethnic group
share a common ansestory, therefore the tax compliance behaviors of its individuals was because
of inheretance from their parents and elders. Religion has also been termed as an element of
ethnicity (Kim, 2011) that also has an impact on the tax compliance behavior of individuals (Frank,
1996) while (Hull, 2000) has suggeted that countries where religiocity is strong, tax morale is high.
In order to verify the claims made by literature, ethnicity has been added in the study. In case of
pakistan, where more than 95% population is muslims, it is not possible to make groups on the
basis of religion. Therefore another proxy has been taken. people usually associate themselves in
terms of provincial divide and each province has same cultural norms and values based on their
ethnicity. Pakistan basically is divided into four provinces namely Punjab, Sindh, Baluchistan and
Khyber Pakhtunkhawa while FATA (Federally Administrated Tribal Areas) also form an integral
part of the country under Article 1 of the Constitution of the country. Similarly, Gilgit Baltistan
that was annexed with pakistan in 194923 and was given a unique provincial status in 2009. In
order to further categorize provinces based on their ethnic coherence, the province of Punjab and
Sindh were sub divided for the sake of the study. For the sake of this study provinces of Punjab
have been divided into Punjab (North), Punjab (Central), Punjab (South) while Sindh has bee
nboken down into Sindh (Rural), Sinh (Urban). The hypothesis constructed for the purpose of the
study is as follows:
23 Karachi Agreement of 28 April, 1949

62
H5 = Ethnicity has an impact on the tax evasion behavior of individuals in Pakistan
H0 = there is no relationship between ethnicity and tax evasion behavior in Pakistan
Tax Morale
Tax morale is defined as the internal motivation of an individual to comply with taxes (Frey, 1997).
Similarly (Alm and Torgler 2006) describes morale as the willingness of a person to pay his due
share of taxes. Definition of tax morale is given by Rodriguez-Justicia and Theilen who describes
morale as Cheating on tax if you have the chance (Rodriguez-Justicia and Theilen, 2018, pp. 9).
As morale is the internal willingness, therefore there are many elements of tax morale which
include – but are not limited to – level of trust on government, perceived level of corruption,
perceived shame and guilt associated with evasion and perception about others in the society
paying taxes. For the purpose of this study, only three elements i.e; perceived shame and guilt,
perceived penalty on evasion and perception about others evading taxes are taken as proxies for
tax morale. All these will be discussed in this section of the study.
Perceived Shame and Guilt
Moral sentiments of shame and guilt shame serve as fundamental ingredients in shaping
compliance behavior of an individual (Erard and Feinstein 1994). A dependable definition of guilt
and shame is given by (Markle, 2001) who has defined shame as ‘the emotion one feels when
subjected to public degradation’ while guilt has been defined as ‘the emotion one feels after
continuously becoming aware of wrongdoing over which one feels responsible’ (Markle, 2001, p.
2179). The elements of shame and guilt apply the same moral sentiments on tax evasion behavior.
Looking at the element of shame, (Kirchler, 2007) has suggested that fear of degradation enables
a person to abide by the tax rules and pay taxes and this fear acts as a cost of evading taxes. Taking
the definition of shame from Erard and Feinstein, the following hypothesis has been constructed:
H6 = Moral sentiment of shame (fear of public degradation) leads to tax compliance behavior in
Pakistan
H0 = There is no relationship between shame and tax compliance behavior in Pakistan
Similarly, literature has also identified a relationship of guilt or – as described by Markle – feeling
of responsibility over wrongdoing on the tax evasion behavior of an individual. Therefore, the

63
hypothesis showing the relationship between guilt or the feeling responsible for wrongdoing and
the tax evasion behavior of an individual is as follows:
H7 = Moral Sentiment of Guilt leads to tax compliance behavior in Pakistan
H0 = There is no relationship between guilt and tax compliance behavior in Pakistan
Perceived Social Norm
Perceived social norm in this study will be used for perception about others evading taxes in the
country (Dwenger et al. 2016). People respond to pro-social behaviors when they perceived it to
be a social norm or in other words when they perceive that others in the society are following the
same practices (Allcott 2011). Tax compliance behavior is no exception to the rule. Literature has
presented a significant relationship between perceived social norms and tax compliance behavior.
A study carried out by (Traxler, 2010) concluded that higher the level of perceived compliance of
taxes in a society, the higher will be the tax compliance behavior. In order to check the same
relationship in the study, the following hypothesis has been included:
H8 = Higher the perceived social norms lower will be the tax evasion behavior in Pakistan
H0 = There is no relationship between perceived social norms and tax evasion behavior in Pakistan
Perceived Level of Penalties on Evasion
In contrast to the moral sentiments and perceived social norms where people abide by the laws for
non-monetary benefits, fear of monetary penalties is also a contributing factor in shaping tax
evasion behavior. People fear penalties because of simple methamatics and cost-benefit analysis
where the monetary benefits of evasion are higher than the monetary costs of penalties on tax
evasion (Milliron & Toy, 1988). Therefore people refrain from evasion not just for reciprocating
the good deeds done by others or the government they rather refrain from it due to fear of monetary
punishments in the form of fines and penalties. Although previous studies denied any significant
relationship between rates of penalties and evasion but later on, literature found a relationship.
(Park & Hyun, 2003), (Loo, 2006a) and (Loo, 2006b) have concluded that there is a significantly
negative relationship between perceived level of penalties and tax evasion behaviors. In order to
verify the claim of literature, the study also includes hypothesis to be tested which will be as
follows:
H9 = Perceived level of penalties has a negative relationship with tax evasion behavior in Pakistan

64
H0 = There is no relationship between perceived level of penalties and tax evasion behavior in
Pakistan

65
METHODOLOGY
Research Methods
According to (McCusker and Gunaydin 2014) there are two approaches to conduct research
namely Qualitative and Quantitative. Previously quantitative research was the main method used
in educational research till the 1980s that originated from natural sciences and was taken over by
researchers in the field of social science (Antwi and Hamza 2015). Quantitative research remained
the generally accepted method till the 1980s when proponents of qualitative research also started
contesting those of quantitative research.
According to (Antwi and Hamza 2015) Qualitative research mainly relies on non-numerical data
that is qualitative in nature like words and pictures whereas quantitative research focuses on
collection of numerical data. Moreover, quantitative research follows scientific method in which
first a hypothesis is constructed and is then tested with empirical data. On the other hand,
qualitative research follows exploratory method of investigation where observation proceeds
hypothesis generation. Hence qualitative research is used where little or no knowledge is available
in the beginning of research.
(McCusker and Gunaydin 2014) has differenciated qualitative from quantitative research in terms
of aim of the research. According to them, qualitative research collects data in the form of words
rather than numbers for the purpose of data analysis and usually tries to understand perceptions
and attitudes of individuals.. Qualitative research aims to answer questions regarding ‘how’ and
‘what’ rather than ‘how many’ in quantitative research (Baruch 1999). Similarly, McCusker and
Gunaydin argue that qualitative research focuses more on the quality of process as interpretation
of data is of utmost importance whereas in quantitative research quality of data is important. The
basic difference between the two types of research methods as presented by (Mack, et al. 2011) is
tabulated as Appendix A:

66
Mixed Research
Quantitative Research utilized aspects of both the quantitative and qualitative research in a single
study concurrently with the aim to address a research question or a number of related questions.
The proponents of mixed research view it as important especially when exploring complex
research questions as qualitative data gathered is useful in having an in-depth knowledge of survey
responses while at the same time the statistical analysis enables in detailed understanding of a
particular pattern of responses (McCusker and Gunaydin 2014).
The current study incorporated both qualitative and quantitative techniques in that the responses
from potential taxpayers of the country were gathered through a closed-ended questionnaire and
these responses were then analyzed through statistical techniques and findings were then
interpreted. However, the qualitative techniques was gathered when a semi-structured interview
of some experts in the field of taxation was carried out that was useful in analyzing the impacts
tax evasion has on the overall economy of the country especially in context of Pakistan. the
responses gathered were also utilized in making policy recommendations for the study.
Type of Data (Primary VS Secondary)
Both Primary and Secondarty data was used during the course of study. Responses regarding tax
evasion behavior were first gathered through circulating a structured questionnaire from potential
taxpayers of the country while semi-structured interviews of tax experts were also utilized to
determine impacts of tax evasion on the overall economy and in making policy recommendations.
In order to strengthen the claims made by gathering the primary data, secondary sources like
newspapers, government of Pakistan reports like Economic Survey of Pakistan and even research
carried out by other scholars in the field of tax evasion and its consequences on political Economy
of Pakistan were utilized. Moreover, facts and figures regarding tax revenue collection and tax
pilferage etc were also incorporated in the study through a comprehensive study of secondary data
through different sources.
Approach used to Measuring Tax Evasion
According to (Gemmell & Hasseldine, 2012), there are two approaches to measure tax evasion.
One approach to measure tax evasion includes audits of taxpayers’ returns and survey carried out
in order to ask different questions from taxpayers to determine tax evasion. Whereas, indirect

67
approaches measure certain variables like currency circulation, electricity consumption and others
to access hidden economy and hence tax evasion.
Direct approach: Direct approach is also termed as micro approach as in this approach
to measure tax evasion; survey or audits are carried out to determine taxpayer’s non-compliance
or illegal income through a carefully selected sample of taxpayers and applying the results to the
entire population. In direct or micro approach, selecting an appropriate sample size is of utmost
importance.
Indirect approach: This approach includes general estimation of overall hidden economy
through different measures rather than individual surveys and audits. As indirect approach takes
into account an overall view of the economy, therefore it is also sometimes termed as macro
approach. Some macro approaches are appended below:
Deficiency Method Approach: In this approach, tax evaded is indirectly calculated by
measuring the hidden economy by taking the difference between the reported income and the
actual income in the economy. This difference gives an estimate of the hidden economy and hence
the tax that has been evaded. The income can be calculated by comparing income and expenditure
data gathered from some government agency or through comparison of data gathered from a
government agency and an independent source.
Single Indicator Approach: This approach relates hidden income to any single variable such as
cash circulation in the economy provided that it fulfils two assumptions; a threshold point of
hidden economy is known in advance to make reference; and change in cash circulation (the causal
variable) is solely due to hidden economy.
Multiple indicator Approach: In Multiple Indicator approach, hidden economy is measured
by taking atleast two causal variables. This enables to overcome the deficiencies of single indicator
approach where it is to be assumed that changes in hidden economy are due to a single variable
which is practically not possible.
(Alm, 2012) has categorized measuring Tax Evasion into traditional and modern approaches. He
further divided traditional approaches into ‘direct approach’ and ‘indirect approach’. While
modern approaches include measuring tax evasion by using certain proxy variables and then
inferring from them the tax evasion behavior of individuals.

68
Traditional Approach
Direct Method: direct approach to measure tax evasion according to (Alm, 2012) includes
tax audits of selected taxpayers by the Tax agencies while the other method of measurement is
survey evidence in which the taxpayers are asked about their tax evasion behavior.
Indirect Method: indirect methods to measure tax evasion include the following:
Currency demand Method: Currency Demand Approach (CDA) is mostly used for the
measurement of underground economy and tax evasion. The method was first used by Cagan in
1958 and was adopted by many scholars. Tanzi (1980, 1983) took it further and developed
econometric techniques using currency demand approach to find the level of underground
economy in the USA for the period 1929 – 1980 (Ariyo & Bekoe, 2012).
CDA is based on the assumption that in underground economy transactions are made mostly in
cash to avoid traceability and higher tax rates lead to higher tax evasion which in turn increases
demand for cash. The CDA measures shadow economy and hence tax evasion in two stages.
Firstly, all cash transactions including cash payments of wages, interest payments and other cash
payments are aggregated and tax burden is also calculated using econometric equations. During
the second stage, quantity theory of money and more precisely Fisher Equation (as done by Tanzi,
1980, 1983) is used to find out the estimate ratio of shadow economy to GDP (Nchor & Konderla,
2016) and (Iqbal, Qureshi, & Mahmood, 1998).
Electricity Consumption method: Underground economy can also be measured using physical
output method or more precisely how much electricity is consumed in a particular area or over a
particular time period (Heath & Jones, 2013). Two methods have been used in literature for
measuring underground economy through electricity consumption method.
One method has been devised by (Kaliberda & Kaufmann, 1996). According to the study, official
GDP estimates do not include hidden or underground economy and therefore, do not present the
actual state of production within an economy. In order to get a true and fair picture of the entire
economic activity, physical output especially in terms of electricity consumption can be used as a
proxy of economic activity. The study is based on two assumptions; first being unitary elasticity
of electricity consumption in relation to GDP. The second assumption is based on the premise that
underground economy can be biased upwards due to over estimating electricity consumption due

69
to factors like substitution of electricity for any other energy source, inefficient utilization of
electricity and underutilization of electricity. Similarly, vice versa could take place due to efficient
utilization of electricity, increased prices and even using any other power source. The study
assumes that all these factors have been offset and balanced.
Another method had been used by (Lacko, 2000) who also calculated underground economy
through electricity consumption approach but it differed for the one above in that it took only
household electricity usage based on the premise that in East European nations, large part of
underground economy was carried out at households. Moreover, in order to establish a relationship
between electricity consumption and GDP, a base country was taken whose underground economic
activity level was estimated through some other method and the same ratio was then applied to all
other countries.
Analysis of different Approaches
Different people have used different techniques and have justified their way of looking at tax
evasion in different ways. However, it does not go without saying that all methods stated above
have some drawbacks as well.
As far as surveys are concerned, they provide a maximum insight of an individual tax evasion
behavior but may be subject to integrity of the respondent specially when involvement in illegal
activities are asked. Till the time survey questionnaires are structured properly and answered with
full honesty by the respondents, survey methods cannot reveal the true picture. Similarly, tax audits
that sample the declared incomes captures only those activities that are successfully detected
(Heath & Jones, Using Electricity Demand to Estimate State-Level Underground Economic
Activity in the US, 2013). Both survey and tax audits are micro approaches as a segment of
economy can be targeted and in both approaches, long term time series estimates are lost as both
approaches provide a point estimate of tax evasion and they capture only undeclared part of the
underground activity and hence tax evasion while illegal activities are not captured (Schneider &
Enste, 2000).
As far as Currency Demand and electricity consumption methods are concerned, they are
macroeconomic approaches used to estimate shadow economy over time and are free from the
drawbacks faced by direct approach like integrity of the respondent and structure of questionnaire.
Both approaches are, however, subject to criticism. The currency demand approach is based on the
70
assumption that all illegal transactions are made in cash and that tax burden is the only motivation
to evade taxes. Moreover, the approach also assumes that velocity of money remains the same
which is an idealistic and somewhat unrealistic assumption. Similarly, the approach assumes that
shadow economy in the base year is zero which is again an unrealistic assumption. (Schneider &
Buehn, Estimating the size of the Shadow Economy: Methods, Problems and Open Questions,
2013). The electricity consumption method that assumes electricity to GDP ratio close to 1 is also
an unrealistic assumption as it is not necessary that all illegal activities require electricity usage.
Moreover, due to technical and other advancements, electricity consumption can change with time.
Keeping in view all the pros and cons and also the scope of the present research, survey method
would be used in the study.
Questionnaire Development
The main purpose of the study as seen from the objectives of the study included determining the
causes of tax evasion in Pakistan. Different causes namely the personal characteristics like Age,
Gender, Educational Qualification and Income level of the respondents was included in the study.
Moreover, elements of tax morale were also included in the study. It is pertinent to mention that
tax evasion and Tax morale are abstract terms and needed to be quantified for the purpose of
effective measurement. For that purpose constructs for such variables needed to be established. A
construct is a quantifiable representation of human behavior that cannot be observed quantified
which needs to be as objective as possible (Nunnally 1976). Ensuring the accuracy of the
measurements of constructs is a difficult task (Barrett 1972). According to the American
Psychological Association the operational definition of a variable needs to have a high level of
construct validity which means that the indicator of a construct should measure what it is supposed
to measure (APA 1995).
According to (APA, 1995), the construct validity includes content validity, criterion-related
validity and internal consistency. All these will be discussed in the succeeding sections of the
study. After determining the operational definitions, scale of measurement needs to be obtained so
that each item is measured for the purpose of the study. There are two approaches to determine the
scale (Hinkin 1998). One is the deductive approach in which literature review is used to determine
the scale that is used in different parts of the world that can then be deduced to the particular study.
Similarly, in inductive approach, usually a pilot study is carried out in which the respondents are

71
asked how they try to measure a particular phenomenon (Hinkin 1998). Language is of utmost
importance in questionnaire development. The language used has to be simple and understandable
to the respondents, while double barreled and leading questions must be avoided at all costs for
the questionnaire to be an effective one (Harrison and McLaughlin 1993).
(Frary 2003) suggested some techniques that are required for the questionnaire to obtain minimum
information with a minimum number of missed questions. First of all, Frary recommended that a
minimum number of questions be included in the questionnaire and a pilot survey or a field trial
be carried out so that the researcher obtains information regarding response rate. If one type say
mailed questionnaire donot generate satisfactory reuults, the design may be changed accordingly.
Same is the case with wording of the questions. It is necessary that a logical and systematic
approach may be employed while doing survey approach that should start from questionnaire
design and should go all the way till evaluation of the questionnaire (Rattray and Jones 2007).
Accoridng to them, pilot testing is a very important part of any survey and may be carried out
effective for the research to be reliable.
After field trial, the questions were narrowed down to 20 and only those questions that were
extremely necessary to get required information were included while those questions that were
difficult to understand were either eliminated or modified so that the respondents could easily
understand them. The final questionnaire included a total of 20 questions that were sufficient
enough to gain information regarding all the variables that were to be studies and included in the
study. The questionnaire was developed on the basis of steps provided by (Stehr-Green, Stehr-
Green and Nelson 2003) that included identifying the hypothesis, identifying information needed
to test hypothesis, writing questions to collect information, organizing questions into a particular
format, testing and then revising the questionnaire according to the results of the pilot testing. The
questionnaire was based on excessive literature review that was a necessary condition for the
development of an effective questionnaire.
(Colosi 2006) has suggested that after deciding what information is needed, the researcher should
carry out an extensive literature review that enables the researcher to decide whether an existing
questionnaire should be sufficient to be used to collect the information required for the study or it
needs some modifications or a new questionnaire is to be constructed based on the requirements
of the study. The questionnaire of the current study was developed on the lines as presented by

72
(Song, Son and Oh 2015) that suggested some point for the development of an effective
questionnaire. The first step included operationalizing the key concepts according to the
understanding of the target population, choosing a clear format that in the present survey included
closed ended questions with likert scale for all questions except for demographics of the
respondents. Similarly, content validity be taken into consideration before choosing the
appropriate questions. Afterwards, a pilot survey be carried out to find out the reliability and
validity of the questionnaire.
Rationale behind integrative research design / methods
Literature has cited two approaches of conducting research on the issue of tax evasion. Indiret
approach takes into account the macro ecoomic variables like electricity consumption method in
which differences in change in electricity consumption over perticular time period is taken as a
proxy for measuring underground economy (Heath and Jones 2013). Similalry, Currency demand
approach deals with increase or decrease in demand for liquid cash that leads to underground
economy and indirectly tax evasion in the society. On the contrary, direct approach deals with
surveys and audits that focus on micro level where surveys are carried out for a carefully selected
sample size and tax evasion is calculated directly. Survey research is the best suited approach if
the objective is to gather data regarding behavioral responses of individuals.
The questionnaire was developed on the premise to gather information regarding behavioral
responses of individuals. therefore, the best was to gather data on likert scale that is best suited in
behavioral research as respondents are not confined to either – or options and can show their level
of agreement or disagreement to a statement and even show neutrality if they want. Such options
are not available in continuous data (Hartley 2013).
Chi-square statistic is a non-parametric test designed to analyze data when dependent variable is
measured at a nominal level. Chi-square test is also followed with a strength statistic. The Cramer’s
V is the most common strength test used to test the data when a significant Chi-square result has
been obtained. Advantages of the Chi-square include its robustness with respect to distribution of
the data, its ease of computation, the detailed information that can be derived from the test, its use
in studies for which parametric assumptions cannot be met, and its flexibility in handling data from
both two group and multiple group studies(McHuge 2013).

73
Similarly, primary and secondary data have both been used during the course of data collection.
For the purpose of obtaining information regarding the tax compliance behavior of respondents,
primary data was collected whereas secondary data was collected to strengthen claims while also
providing recommendations and implications hence advantages of bboth types of data were
utilized in the research.
Figure 3-1: Conceptual Framework of the Study
Literature Review has identified many variables that are associated with the concept of tax evasion
and which shape a person’s behavior towards tax evasion. The most common variables identified
in the litewrature include demographic variables and tax morale. The dissertation will be an
attempt to find out the association between different indicators (as mentioned in the diagram
above) with a person’s behavior and attitude towards tax evasion. it is pertinent to mention here
that the objectives of the study do not include finding a causal relationship between different
variables with tax evasion behavior, rather the study aims at finding whether there is an association
between variables or not. Double sided aeros indicate association rather than causality of variables
in question. The diagram below indicates the conceptual framework of the study.
Operationalization of Concepts
In order to proceed further, all the concepts mentioned in the Figure 3-1 are defined as they will
be taken along during the course of the study.
Demographic Variables
• Age• Gender
• Income Level
• Educational Qualification
Tax Morale
• Feeling of Shame
• Feeling of Guilt
• Trust in Government
• Perceived Level of Penalties
• Prceived level of evasion
Individual’s Behavior
pattern on Tax Evasion

74
Tax Evasion
The first concept that needed to be defined for the purpose of the survey is the dependent variable
of the study i.e; Tax Evasion. Tax evasion as defined by Dictionary.com is “the illegal non-
payment or under payment of taxes”. The term was first coined by Srinivasam in the year 1973
who described tax evasion and stated that understatement of incomes to the authorities for the
purpose of tax returns was a widespread phenomena that spread in all countries of the world
(Srinivasan 1973). Similarly, (Yitzhaklt 1974) also suggested that lack of fines and penalties was
a contributing factor in encouraging people to understate their incomes form the tax authorities.
Recent literature has distinguished tax evasion form other sources of preventing tax payments to
tax authorities like Tax avoidance and tax planning. (Kirchler, Maciejovsky and Schneider 2003)
Tax evasion illegal methods of preventing payment of taxes that include understatement of income
or overstatement of expenditures as opposed to tax avoidance that includes finding loopholes in
the tax system to avoid taxes in a legal manner.
Tax evasion is a situation where a person tries to reduce his or her tax liability by hiding income
or information from the tax authorities that is different from tax fraud which includes providing
false statements or fake documents (Otto, et al. 2015). There are two main distinctions in tax
evasion as provided in the literature. According to (Boll, 2015) tax evasion includes intentional
evasion by Commission or evasion by Omission. In the former type, a person includes extra
deductions to save his share of tax payment while in the later type the tax payer omits or excludes
part of his income to reduce tax burden. As evident form the literature, tax evasion is a subpart of
tax non-compliance. Tax non-compliance includes all forms of getting the tax return rightly filled
which may be due to tax evasion, avoidance or even due to unintentional errors that may have
arisen as a result of lack of tax knowledge (HMRC 2019). Keeping in view the literature following
questions were included in the questionnaire that were then used for the purpose of calculating tax
evasion behavior of the respondents:
1. In your opinion, is it acceptable to make arrangements to minimize tax burden
2. In your opinion, is it acceptable to manipulate incomes and expenditures to reduce tax
burden
3. In your opinion, is it acceptable to not to report true income to the authorities to reduce
tax burden?

75
The three questions were asked to determine the evasion behavior of the respondents. The reason
why three questions were asked is attributable to the fact - as described in the literature – that
asking for issues involving unethical behavior by the respondents is not an easy task as such
questions offend people (Housnek & Palda, 2004 and Gerxani, 2007). Such questions –as
suggested by Gerxani should be asked by asking indirect questions in the beginning and then going
on to more direct questions that will provide better response for the survey (Gerxani, 2007). As
seen from the questions mentioned above, the most indirect question regarding making
arrangement to minimize tax burden had been asked in the beginning. Making arrangements can
include legal ways like in the case of tax avoidance or tax planning (Hong 2017) in addition to
illegal ways (that is the actual intent of the survey). the second question that is included in the pet
definition of tax evasion as given by (Boll, 2015) includes manipulating incomes and / or expenses
to reduce tax burden is included in the questionnaire. The third and the last question that relates to
not reporting true income to the authorities is the most direct way to ask someone whether he
cheats the government or not. Tax evasion has been termed to be the most important tool of tax
cheating (Grundmann and Lambsdorff 2017).
Moreover, another thing to be noticed in the questions is the fact that all the questions start with
the statement In your opinion ….. . Much literature who worked on determining psychological
factors related to tax evasion have started the questios in the same way. Studies carried out by
(wadhwa and Pal 2012) and (Awan and Hannan 2014) carried out their research on the same topic
and had used the same survey techniques in Indian and Pakistani contexts respectively and used
the same format of question starting form In your opinion. Interestingly both the studies had the
same objective of obtaining the opinions of respondents regarding tax evasion. it is an established
psychological fact that whenever a person given his opinion regarding acceptability for something
(e.g Tax Evasion) he or she is believed to possess the same preferences for that particular variable
(Moussaïd, et al. 2013). Therefore asking opinions meant that the respondent had the same
preference for acceptability and hence the response could be concluded as own behavior of the
respondent.
Tax Morale
Tax morale is defined as the ‘internal willingness to pay taxes’ (Doerrenberg and Peichl 2018) and
has been identified as one of the key determinants in understanding tax compliance behavior

76
(Kornhauser 2007). There are many definitions of the term tax morale provided in the literature.
(Torgler, 2007) defined three main factors to measure tax morale that included the social norms
and religious motivation, perceived fairness of the tax system and level of trust in government
authorities. (McKerchar, Bloomquist and Pope 2013) identified six indicarots of tax morale that
included trust in government institutions, perceived fairness, personal integrity, fear of third party
reporting, perception regarding others paying taxes in the neighbourhood and fear of audit. Tax
moral has been described as an internal motivation to pay taxes (Alm and Torgler 2006).
Literature has also suggested appropriate ways to ask questions in order to measure the tax morale
or the internal willingness to pay taxes. Choosing more than one question during the course of
study in order to measure this internal willingness increases validity and the reliability of the
variable (Torgler & Valev, Gender and Public Attitudes Toward Corruption and Tax Evasion,
2010). According to (Russo, 2013), Tax morale is measured as a percentage a respondent agrees
to the statements like ‘Citizens should not cheat on their taxes’, ‘Cheating on taxes is justifiable if
there is an opportunity to do so’ and ‘Managing to avoid tax payments is legitimate’. However,
for the sake of survey to be carried out, the terms has been defined based on the description given
by (Nathan, 2014) who describes the term as:
1. Concern about guilt and shame in non-payment of taxes
2. Concern about services being provided by the state
3. Concern about others paying their share of taxes
4. Perceived penalties and punishments on Tax evasion
Shame refers to an emotion in which a person feels degraded baraced when his act of wrongdoing
is exposed whereas guilt is the feeling of repent one feels after one becomes of the wrongdoing for
which he or she think is responsible for (Markel, 2001, p. 2179). Sentiments of shame and guilt
change the tax compliance behavior of the individuals (Erard and Feinstein 1994). As evident from
the discriptions above, shame and guilt are feelings and need to be quantified to measure them
properly. For that purpose, proxies have been taken for the variables. For that purpose the elements
of shame and guilt were further categorized into two proxies or indicators each.
Shame or the feeling of being degraded is a contributing factor in making evasion decisions and
this feeling acts as a cost of evading taxes (Kirchler, 2007). One of the indicators for determining
the element of shame as evident form the literature is fear of name being included in defaulter’s

77
list. There is a significant impact of public disclosure of an individual’s tax information and listing
information about tax compliance on tax compliance as it alters beliefs regarding tax compliance
and thus leads people to engage in con-compliance considering it as a social norm (Lefebvre, et
al. 2015). Therefore, one of the questions asked in order to determine shame was regarding “fear
of name being included in the defaulters’ list of FBR”.
Similarly, fear of being reported by another person is also a factor to be included as a second
element of shame. Literature has suggested that countries where people fear that their evasion
behavior would be liable to third party reporting, tax evasion is lower (Alm, Bahl & Murray, 1993).
Therefore literature has suggested that in order to enhance tax compliance, there is a need to ensure
that a mechanism of third party reporting or ‘whistleblowing’ is in place so that compliance is
ensured (OECD, 2006). Therefore, in order to cheek whether people are vulnerable to third party
reporting, a question was also added that read ‘fo you pay taxes as you fear that someone would
inform authorities regarding tax evasion on your part’.
The other element included in the questionnaire is the element of guilt. Literature has suggested
that fear of doing wrong is a significant determinant of tax compliance. According to (Markle,
2001), guilt is the emotional feeling of repent after one becomes aware of the wrongdoing for
which one is responsible. There are two indicators of guilt included in the questionnaire, one being
‘is it acceptable that others bear the burden of taxes when one evades’ and the second being ‘is it
the right thing to evade taxes imposed by the government’. The aim of asking these questions was
to understand whether people have intrinsic motivation to pay taxes as opposed to the element of
shame where external factors motivate a person to comply with the tax law.
The literature has established a significant relationship between level of public service delivery
and its effect on tax revenue generation by the government in that area. According to (Kasim,
Umar, Martin, & Yassin, 2018) the level of public service delivery has a significantly positive
effect on the tax revenue generation. Shaping government institutions in such a way as to provide
higher income opportunities to its citizens and improving public service delivery leads to increased
trust in government that in turn leads to increased tax morale of the citizens (Martinez-Vazquez
and Torgler 2009). When the taxpayers perceive the government to be efficient in providing public
service, they are willing to pay more taxes while the effect is otherwise when they perceive
themselves to be betrayed by the government authorities (Barone and Mocetti, 2011). Keeping in

78
view the facts the questionnaire included a question regarding perception of public service
delivery.
Similarly social norms and culture have been observed to be having a significant impact on the tax
evasion behavior of the citizens (Cullis, Joanes & Slovioa, 2012). Individuals comply with the
rules when they are aware that compliance is a social norm (Alm, 2012). When a person observes
unethical behavior in his or her vicinity, ones perception about the social norms regarding honesty
and ethics change (Gino, Ayal and Arely, 2009). The taxpayers conditionally comply with the
rules (eg; tax rules) till the time others in the society are doing the same (Fray & Torgler, 2007 and
Traxler, 2010). Therefore, perception about the tax compliance behavior in the social circle has a
direct impact on the tax compliance behavior of an individual. Hence a question regarding
perception regarding others paying taxes in the vicinity was also made part of the questionnaire.
Penalties and fines have shown to have a significant impact on tax compliance behaviors. Large
fine on tax evasion is more detrimental for tax compliance as compared to large probability of
being caught (Christiansen, 1980) and (Nourzad., 1986). Penalties effect tax compliance behavior
of individuals till the time effective tools are used by the government (Obid, 2004). Moreover, rate
of penalties also has direct impact on the tax evasion behavior of individuals. Similarly, studies
have claimed that penalty, if not imposed and regulated effectively, may lead to the loss or revenue
to the state (Artemenk, L.A.Aguzarova, F.S.Aguzarova, & Porollo, 2017). The question regarding
perception about level of penalties was also included in the questionnaire based on a study by
(Kinsey 1991) who concluded that people who perceive level of penalties to be on the higher side
tend to be more compliant in terms of tax payment.
Selection of Appropriate Scale
Demographic variables
Similarly the demographic variables were also part of the study. Therefore, questions related to
determining the demographic variables including age, gender, educational qualification and
income level of the respondents were also made part of the questionnaire. The questions again
were taken from literature review. Questions regarding all the demographic variables included in
the study were constructed that are discussed below under each variable head.

79
1. Age
The age brackets were designed in accordance with Pakistan Bureau of Statistic who have taken
the same age brackets. The reason was to make further calculations that will be included in the
successive paragraphs. The first age bracket started from 18 years because of the fact that
according to the international law, the age of majority is eighteen years24. However according to
the Pakistani law, the age for majority varies from 15 years for some regulations and while 21 for
others.
The Economic Survey of Pakistan, that is the official document of the Ministry of Finance of the
country – along-with some other regulations – consider adult as any person having age more than
15 years. While on the other extreme, according to the Pakistan Citizenship Act 1951, a minor is
a person who has not attained the age of 21 years. However, practically definition of adult that is
applied in Pakistan is any person reaching the age of 18 years. The same is considered as an adult
age for the eligibility for National Identity card also known as the CNIC (Computerized National
Identity Card), driving license and even owing property and go for jobs like military25 etc.
Moreover, the last bracket consisted of age group ’55 + years’. According to the Pakistani law, the
retirement age for employees in the government sector is 60 years26. However, none of the
individuals who participated in the survey had age limit beyond the age of 55 years. That is why
the last age bracket as seen in the table above is above 55 years. It is pertinent to mention that the
document of Pakistan Bureau of Statistics has taken age in brackets of 05 years but for the ease of
computation, the age brackets taken in the present study were 10 years. Yet the brackets were set
in such a way that a single age bracket in the study coincided with two consecutives age brackets
as taken in the documents of Pakistan Bureau of Statistics.
2. Gender
Gender is always divided into two categories namely Males and Females. However, studies like
the one carried out by Human Rights Campaign also included third gender. They also included an
24 Article 1 of UNHCR 25 The Pakistan National Service Ordinance 1970 26 Establishment Division of Pakistan Document retrieved from:
http://www.establishment.gov.pk/estab/userfiles1/file/Establishment/publication/ESTA%20CODE%20(Edition%20
2015)/Chapter%205%20Front%20Page.pdf

80
open-ended questions as a fourth option ‘Prefer to self-describe’. Moreover, literature also
suggests that not only the third category ‘transgender’ be included in the surveys involving local
people but the word ‘Gender’ may be used instead of ‘sex’ as this offends people in certain
societies (Bauer, et al. 2017). Nevertheless, our study included only two categories of gender due
to the fact that salaried class was included in the survey and in virtually all public and private
sectors of the country, only two categories of gender namely Male and Female are used. Therefore
the question for determining gender in the study was as taken from (Rechardson, 2008) and the
question was ‘Please Identify your Gender’ while the options included ‘Male’ and ‘Female’.
3. Educational Qualification
Increased knowledge acts as a contributing factor in increasing knowledge about fiscal policies
(Devo, 2005) while higher level of education leads people to take use tactics that involve finding
ways to reduce the tax burden of an individual (Hofmann, Hoelz, & Kirchler, 2008). Moreover, a
cross-country study carried ut by (Recardson, 2006) also included education level as a significant
factor in tax compliance behavior. Studies like the one carried out by (Devos, 2019) also concluded
that educational attainment was a contributing factor in tax compliance and had a positively
significant relationship with tax compliance. Therefore, the variable education level was also
included in the questionnaire.
According to a report published by NORIC (Nordic Recognition Information Centres), the
education system of Pakistan is divided into six categories namely the Preschool that includes
children from 3 to 5 years of age. The primary level consists of grades 1 to 5 while the middle
level of education consists of classes 6th to 8th. Then there is a High School that consists of grades
9th and 10th. In Pakistani context the higher schools is also named ‘Secondary School certificate of
SSC’ and is mostly termed as Matric. Similarly the next level is the Higher Secondary School
Certificate level of the Intermediate level. This level consists of grades 11 and 12. After these six
levels there is the tertiary level or the Higher education level 27. According to the Higher education
Commission of Pakistan28, university or the tertiary level of education consists of bachelors (14
years), BS (Honors) (16 years), Masters (18 years) and PhD degrees.
27 A Report on the System of education in Pakistan published by NORIC in October, 2006
Retrieved from https://norric.org/files/education-systems/Pakistan-2006.pdf on 17 July, 2019 28 HEC Website : https://hec.gov.pk/english/pages/home.aspx

81
Although this makes a total of ten levels of education including tertiary level. However, during the
course of field testing, it was revealed that most of the target population had attained levels
between Matric and PhD while there was no respondent that had attained any level below matric,
therefore, the levels of education in the study were narrowed down from Matric to PhD. A total of
five levels were identified. The question asked for the purpose was marked “Educational
Qualification” and the responses included included the following options:
a. Matriculation
b. Intermediate
c. Bachelors (14 Yrs)
d. Masters (16 Yrs)
e. M. Phil / Ph.D
4. Income Level
As the main objective of the study was to determine the tax evasion behavior and attitude of the
individuals, determining the right income levels of respondents was of utmost importance. In case
of Pakistan, although annual income from salary is included in the tax return forms, still according
to the Payment of Wages Act, 193629, salary is to be distributed among employees on monthly
basis in almost all sectors of the economy. Moreover, studies like those carried out by (Philip &
Palda, 2004) and (Recardson, 2006) arranged the scale to determine the income in range of figures,
the same range was taken in the current survey. In order to construct an appropriate scale for the
measurement of monthly salaries for the purpose of survey, the salary brackets in accordance with
the Tax Slabs were taken. As the survey was carried out in the year 2017 – 18, therefore, the tax
slabs on Salary were taken as the scale. The Tax Slabs as taken from the Finance Act of 2017 are
appended as Appendix B.
According to the table, there are a total of 12 slabs in which salaries are divided for the purpose of
taxation each given a range of annual salary brackets. The first slab was left intentionally as it had
a zero rate of tax and the purpose of the survey was to target people whose income was taxable
with salary income taken as a proxy for that. Hence, each salary bracket was divided into a range
29 Act No. IV of Payment of Wages Act, 1936 (23rd April, 1956)

82
of PkR. 10,000 the first one being PkR. 35,000 – 45,000. Another change done in the scale was
that the first salary bracket when converted into monthly income was Rs. 33,333. However, it was
rounded off to 35,000. Similarly, no one in the survey mentioned a salary of more than PkR.
105,000 during a careful distribution to 50 respondents during the pilot survey, therefore, the last
bracket was taken as 105,000 so that anyone falling in or above this bracket selects this option. A
total of 08 income slabs were made in the questionnaire to determine the monthly income of the
respondents.
5. Ethnic Background
Ethnic diversity has also been seen as a major, tax morale is lower in countries where there is
ethnic diversity and heterogeneity (Habyarimana, et al. 2007). In case of pakistan, people are
mostly divided ethnically based on provinces therefore, provinces had been taken as a proxy for
ethnicity. In case of Pakistan, there are a total of 08 main ethnic groups divided into in all the four
provinces of the country and Gilgit Baltistan. FATA of the Federally Administrative Tribal Areas
constitute the majority of Pakhtuns that are also inhabitats of Khyber Pakhtunkhawa province
(Levesque 2013). Moreover, keeping in view the intra-provincial ethnic conflicts, the provinces of
Punjab and Sindh were further divided into sub-categories based on a study by (Siddiqui 2012).
The question regarding ethnicity was catagorised as follows:
N.Punjab C.Punjab S.Punjab KPK Sindh Balochistan FATA G/B Kashmir
Although the FATA region was also included as an option to the question of Ethnicity, however,
none of the people from FATA participated in the survey and therefore in the final analysis, FATA
option was excluded. Moreover, during the analysis stage, all sub-categories of Punjab and Sindh
was amalgamated due to the fact that the analysis was carried out by Spearmens Correlation that
required some assumptions to be met that could only be possible by amalgamating some options
together.
Pilot Testing
As the questionnaire was developed from other studies carried out in different countries, therefore
the first step included developing a questionnaire that could easily be understood by Pakistani
taxpayers. The pilot testing phase consisted of three phases. During the first phases, a total of 10

83
respondents from salaried class was selected and questionnaire was distributed among them
manually. Although non-probability snowball sampling was carried out in the research study,
selection of respondents in the pilot study was based on diversified education level so that level of
difficulty of questions contained in the questionnaire could be ascertained and questions should be
modified accordingly. Moreover, the first phase also aimed at checking for the validity and
reliability of the questionnaire.
Rectification of questionnaire
The pilot project identified some technical terms used in some of the questions that were not easily
understandable by layman and difficulties were being faced by respondents in answering them.
Such issued faced were noted down without letting the respondents know. However, as the
researcher was with the respondents at the time of filling of questionnaires, the questions were
rephrased for them verbally in understandable language. The aim was to obtain true responses for
the subsequent phases.
After obtaining responses from the selected respondents and taking their views on the
questionnaire, certain necessary amendments were made in the questionnaire while certain
questions were also eliminated or altered in accordance with the feedback obtained. A new
questionnaire was constructed and this time on google form with certain amendments.
Re-testing
The amended questionnaire was again distributed among the same respondents after a period of
almost one month. The aim of this re-test was manyfold. First it provided feedback on the amended
questions and secondly it was useful in checking the reliability of the instrument i.e; to check
whether the questionnaire produced consistent responses on successive attempts. Similarly, after
adding 10 more respondents in the re-test phase, a dummy analysis could also be carried out by
transferring data into SPSS v.24 and running certain statistical techniques. The results obtained in
the re-test phase for the 10 respondents that were previously part of the testing phase were almost
the same, hence pointing towards reliability of the questionnaire. The differences in results of the
first and second phase were minimal and could be considered insignificant as there can be slight
changes even for the data to be truly reliable (Vaz, Falkmer, Passmore, Parsons, & Andreou, 2013).
These slight variations could be due to the fact that the same respondents were chosen after a

84
period (almost 01 month) and first phase might had an influence on their answers OR time change
may have changed their views.
Population and Sample Size
Population of the study included salaried taxpayers of the country. The reason for selecting salaried
personnel was that they are the de-facto taxpayers of the country and the rationale of study included
getting information regarding attitudes towards tax evasion from tax payers of the country.
Salaried personnel are subject to withholding tax according to the Income Tax Ordinance, 2001.
Salaries and wages are subject to withholding taxes which is an effective tool for tax compliance.
According to an estimate, 99 percent of such incomes are properly reported as compared to 37%
incomes that are not reported by third party (Internal Revenue Service 2016)30. As Pakistan follows
the Universal Self-Assessment Scheme in filing tax returns, therefore, it is easier for people to
manipulate tax returns (Loo, McKerchar and Hansford 2010).
A question arises why salaried taxpayers when they cannot evade taxes as their taxes are subject
to withholding taxes. According to FBR, there are two main forms that are filled in by a taxpayer.
The first one includes Form 114 that includes voluntary income declaration and includes incomes
from salary, agriculture, business, capital gains and foreign income. The form also includes Tax
adjustments and computations where the net tax is calculated. The second form is Form 116 which
includes declaration of Assets and includes all movable and immovable assets both inland and
abroad. As per self-assessment scheme an individual is allowed to fill in data as per his desire.
Although Tax audit is conducted by FBR and for that purpose the organization has established a
“Tax Audit Management System” to ensure that audit is being carried out and the government’s
interests are safeguarded31.
According to the FBR, only 2.3% of cases are selected for Income Tax Audit after balloting on
parametric basis (FBR 2019). The audit probability is very low as out of 100 only 2.3 people have
a chance of being audited. Therefore there is more likelihood that people would get away with
small manipulations in the filing process. Moreover, due to lack of documentation in the economy,
the chances of manipulation increase manifolds. Therefore, even salaried people whose basic
salary is taxed anyway, have a chance of manipulating their incomes and expenditures to
30 https://www.irs.gov/pub/irs-soi/p1415.pdf 31 FBR Website : https://www.fbr.gov.pk/taxpayers-audit/131167/131272

85
understate their tax liability. The definition of tax evasion in the study also includes manipulation
in tax return such that income is understated or expenses overstated. Therefore, salaried personnel
are taken for the study.
Rationale behind Target population –The Salaried Class
One of the objectives of the study was to include the respondents from the entire country living in
Rawalpindi / Islamabad region. This is evident from the fact that almost more than half of the
chapter 3 is composed of tax compliance attitudes of respondents based on their provincial divide.
This could only have been possible either for students or the salaried class as both segments of
society come to Islamabad for respective purposes form all regions of the country. However,
salaried class was better suited for the survey as compared to students.
The sample size was measured by taking the entire population of salaried class of Islamabad
region and then by applying slovins formula. However, it would not have been possible due to an
informal economy amounting to more than 70% of the total economic activity of the country (ILO,
2019).
As salaried class thinks that they are taxpayers (as their taxes are deducted at source), therefore
chances of giving false responses due to fear of being caught are lower. It is pertinent to mention
here that (Gerxani, 2007) was of the view that asking questions on critical topics from wrongdoers
themselves usually results in false responses. It is important to note here that The World Bank in
a document was of the view that salary taxes deducted at source are also indirect taxes as GST and
FED etc and therefore, the myth that salaried persons are actual taxpayers is actually not correct
(World Bank 2019).
Sampling Frame
As mentioned earlier, population of the study includes salaried taxpayers of the country. as the
researcher had easy access to reespondents living in Rawalpindi and Islamabad, it was convenient
to take Rawalpindi and Islamabad region as area of the study. Another rationale for selecting the
said region di the fact that Islamabad is the capital city of Pakistan and job seekers mostly come
and settle in the city and its adjoining Rawalpindi region for the sake of getting employment as
salaried employees. Therefore, it was convenient for the researcher to have access to respondents

86
of different provinces and regions of the country. Diversity has been discussed in detail in Chapter
4 of the dissertation.
After selecting the population and then the Accessible population, sampling frame was selected
which includes salaried class taxpayers form all regions of the country, therefore it can be assured
that the sample size is representative of the entire country.
Sample Size
Sample size of the study was calculated using Slovins formula. The formula calculation was as
follows:
n = N/(1+Ne^2)
where: n = sample size
N = population size
e = margin of error (taken as 0.05 as in most social science research)
According to the Active Taxpayers List of the Federal Board of Revenue, the total number of
salaried class in the country amounted to 62230,000 as on 30 June, 2017. Therefore the population
size was taken as 62.230 million persons. Howver, as the exact number of salaried personnel in
Islamabad were not known therefore, the total population of the country was taken as the sampling
frame and sample size was calculated from the total population. Therefore, the total sample size
calculated was as follows:
n = 62230000/(1+62230000 x 0.05^2)
n = 62230000 / (1+62230000 x 0.0025)
n = 62230000 / 155576
n = 399.99 or 400
Therefore a total of 400 questionnaires were distributed among salaried taxpayers in Islamabad
region. The samples were taken in equal amount form four sectors namely; Public Sector that
included government offices; Education Sector including University, College and School teachers
and management staff; employees working in NGO sector of the country and lastly the Private
sector including all offices that were not under any of the other three categories. As mentioned

87
earlier, exact information regarding total number of salaried personnel was not known therefore a
total of 50 individuals were selected from each sector and questionnaires were distributed among
them.
Study Area
The area selected for the purpose of survey was Islamabad. Islamabad is the capital city of Pakistan
having a population of more than 2 million according to the census of 2017. Being the capital of
the country, Islamabad is home to many migrants from all the provinces of the country. The largest
share of population in the country is from Punjab which is followed by Urdu-speaking Mohajirs
(a community living in Urban areas of Sindh) that include 14% and Pashtuns contribute 10.51%
of the total population of the city. The remaining seven percent include other communities
including Sindhis, Baluchis and Kashmiris32. As far as population33 of the city is concerned, 59%
of the population constitutes people aged between 15 and 64 while 37% are below 15 years. The
remaining 2.73% are above 64 years of age.
Another important reason to select Islamabad as the area of study is the fact that the city hosts all
sectors to be included in the survey. As far as the public sector is concerned, being the federal
capital, all ministries and head offices of autonomous bodies are established in the city. Similarly,
a total of 983 NGOs have their established offices in Islamabad, AS far as the education sector is
concerned, the city has sufficient number of institutions at primary, secondary and at tertiary level
of education (UNICEF, 2018) and has the highest number of enrolment. Similarly many private
sector organizations including the telecom sector, Financial institutions and other enterprises
maintain their presence in the city of Islamabad. All this makes Islamabad a better suited area to
conduct the survey research.
Data Analysis
As mentioned before, data gathered was of two types, primary and secondary. The secondary data
gathered was in the form of literature citations, newspaper articles, and other published work in
order to determine the consequences of tax evasion in the country. However, during the first phase
32 http://worldpopulationreview.com/world-cities/islamabad-population/ 33 Pakistan Bureau of Statistics Provisional Census 2017 Report
http://www.pbs.gov.pk/sites/default/files/PAKISTAN%20TEHSIL%20WISE%20FOR%20WEB%20CENSUS_201
7.pdf

88
of data collection, primary data was collected from potential taxpayers of the country by circulating
a structured questionnaire as discussed in the preceding paragraphs. Data was analyzed by
applying certain tests that enabled to interpret the collected data for further analysis and making
recommendations. The test applied included the following:
1. Measure of Central Tendency
In statistics, the central tendency includes three measures namely, Arithmetic Mean or Mean,
Median and Mode (Rayat 2018). All these measures aim at finding the central point of data. There
are however slight differences in their uses. Arithmetic mean is determined as a sum of all
observations divided by the number of observations. Mean is better suited for Symmetric data
where there are no outliers. If there are outliers in data distribution, mean would not be an accurate
measure of finding the central value (Berry, Johnston and Mielke 2019).
In case data is not symmetric or is skewed, median is a better measure. Median measures the center
most point in a data set (Rayat 2018). Calculation of median is different for even and odd number
of observations in a data set. If the number of observations in a data set is odd, Median is simply
calculated by taking the centermost value. However, if the number of observations is even, then
mean or average of the two innermost values is taken to be the median.
In case of categorical and / or ordinal data, another measure of central tendency is appropriate that
is known as Mode (Kahraman and Sarı 2016). Mode is measured as the most frequently occurring
value in a data set. To be more precise, the value having the highest frequency is the Mode. As
mode is used for categorical and ordinal data, therefore most of the data in the present study
included Mode as a measure of central tendency.
2. Chi Square Test of Independence (X2)
Chi Square test of independence is a statistical test that compares two categorical (nominal or
ordinal) variables in a contingency table and checks whether the variables are related to each other
or not. The null hypothesis in the test indicates that the two variables are independent of each other
or there is no association between them, hence the name of the test Chi Square Test of
Independence. The chi square statics is measured by the following formula:

89
Where:
X2 = chi square statictics
c = degrees of freedom
O = Observed Values
E = Expectd Values
Expected Value in X2
Expected value is that value which we is expected to be there if the two variables in question are
independent of each other. The expected value is calculated as follows:
(row total) (column total)
EV = ________________________
Total no of Observations
Dummy Representation
Variable 1
Variable 2
Category 1 Category 2 Category 3 Category 1
Category 1 A B C A+B+C
Category 2 D E F D+E+F
Category 3 G H I G+H+I
Total A+D+G B+E+H C+F+I Grand Total
In order to calculate expected values the table will be as follows:
Variable 1
Variable 2
Category 1 Category 2 Category 3
Category 1 [(A+D+G)(A+B+C)] / Grand [(B+E+H)(A+B+C)] / Grand [(C+F+I)(A+B+C)] / Grand
Category 2 [(A+D+G)(D+E+F)] / Grand [(B+E+H)(D+E+F)] / Grand [(C+F+I)(D+E+F)] / Grand
Category 3 [(A+D+G)(G+H+I)] / Grand [(B+E+H+)(G+H+I)] / Grand [(C+F+I)(G+H+I)] / Grand

90
Threshhold Value
Data presented in the chi square test is presented in the form of a table. The two categorical
variables are distributed in such a way that their intersections are presented in each cell of the
table. The test of independence determines the association between these variables by plotting their
observed values against expected value that would have been there if the variables were
independent of each other. If the difference between the observed and expected values is small,
the model fits well otherwise it does not.
As discussed before, a lower value of Chi Square statistic shows a higher correlation between the
variables and vice versa. In other words, a lower value of X2 indicates a highly significant
correlation and a higher value means lower significance. In order to check the significance, the
calculated value of X2 is compared against the Critical value and if the value calculated is larger
than critical value we consider it as significant otherwise it is vice versa.
Critical Value
The Critical Value of Chi Square is presented in a Chi Square distribution table (attached as
Appendix D) that has degrees of freedm on the vertical planne while the significance values on the
horizontal plane. In order to find the critical value, degrees of freedom calculated while calculating
the Chi Square value are seen in the table against level of significance. Degrees of freedom vary
with the calculation while the level of significance or the p0value in this case would remain 5% or
0.05.
Degrees of Freedom
Degrees of Freedom are calculated by using the formula:
df = (r-1) x (c-1)
where:
df = degrees of freedom
r = no. of rows in the chi square
c = no. of columns in chi square

91
Cramer’s V
After calculating the association between two variables, the next step involves determining the
strength of association between them . a good way to find strength of association bwtween
categorical variables is by applying Cramer’s V by using the following formula:
Cramer’s V = Sqrt [X2 / {n x (q – 1)}]
where X2 = Chi Square (calculated value)
n = no of observations
q = minimum value of no of rows OR no of columns
min ( r , c)
(we will choose a value from r and c whichever is smaller)
Tax Evasion – the Dependent Variable
As mentioned earlier, tax evasion cannot be measured directly due to social and cultural issues
therefore proxies have been used in order to measure the extent of perceived tax evasion by the
individuals. These proxies include finding ways to making illegal arrangements to minimize tax
payments and misreporting taxable income to reduce tax burdens. The study will proceed by
measuring and calculating these proxies and their mean against other independent variables as
collected during the data collection phase.
Arrangements to Minimize Tax burden
The first question asked was regarding making arrangements to reduce tax burden. The question
was comparatively mild and indirect so that the respondents did not feel any harm or did not feel
offended to answer this question (as referred by Gerxani 2007 and Housnek & Palda, 2004). It is
evident from Table 3-1 below that more than 50% of the total respondents strongly agreed to
making arrangements to minimize tax burden. It is pertinent to mention here that making
arrangements to minimize tax burden is not necessarily illegal as taxes can be legally minimized
using certain loopholes in the system that is not illegal but is of course unethical (Azhar B. A.,
1992). Such arrangements lie in between tax evasion and legal tax planning and are surely
unethical and have therefore been declared as issues that need to be taken care of by authorities
(Bulbuc, 2016). However for the purpose of this research the question has been included in order

92
to check out the preference of respondents so that they can be compared with other two indicators
and differences, if any, may be observed. The question had differing response as compared to other
indicators of evasion. The response is shown in the table below:
Table 3-1: First indicator of Tax Evasion
Indicator Response Frequency Percentage
Degree of Acceptance to
making arrangements to
minimize tax burden
(MARed)
Strongly Agree 99 27.9
Somewhat Agree 98 27.6
Neutral 58 16.3
Somewhat Disagree 44 12.4
Strongly Disagree 51 14.4
Don’t Know 5 1.4
Total 355 100
Manipulating Expenditures or Income
Another question asked to determine the tax evasion preference of the respondents included
whether they thought minimizing income or exaggerating expenses in order to minimize tax
burden was acceptable. This question falls within the exact scope of the definition of tax evasion.
Tax evasion is involves all those activities through which taxpayers indulge in minimizing their
income, profits and gains or exaggerate their expenses in order to hide the true state of affairs
regarding tax payments from the tax authorities (Chandrappa, 2016). As the question involved
obtaining direct information regarding tax evasion, it had a different response. Unlike the first
indicator, the the response has shifted to the disagreement side as majority of the respondents
considered manipulating the income statement as highly unacceptable. However, as the question
was not exactly describing tax evasion therefore, there were some respondents constituting more
than 30% who also considered such a practice as acceptable. of the total sample size, those who
considered such practice as completely acceptable consisted only 11% of the total respondents.
The responses of the second indicator of evasion are appended below in the following table:

93
Table 3-2 : Second indicator of Tax Evasion
Indicator Response Frequency Percentage
Degree of Acceptance to
manipulate incomes and /
or expenses so that tax
burden is reduce
(LHSys)
Strongly Agree 42 12.5
Somewhat Agree 82 24.5
Neutral 35 10.4
Somewhat Disagree 71 21.2
Strongly Disagree 104 31.0
Don’t Know 1 0.3
Total 335 100
Not fully reporting income
Similarly the third question to collect information regarding the third – and the most direct -
indicator of tax evasion involved asking respondents whether it is acceptable to not report full
income to the tax authorities? The response of the third indicator is tabulated as follows:
Table 3-3 : Third Indicator of Tax Evasion
Indicator Response Frequency Percentage
Degree of Acceptance
regarding not fully reporting
income to Tax authorities
(NFRep)
Strongly Agree 35 10.5
Somewhat Agree 69 20.7
Neutral 43 12.9
Somewhat Disagree 73 21.9
Strongly Disagree 113 33.9
Don’t Know 0 0
Total 333 100

94
The question had a usual response wherein an absolute majority of 51% was of the view that it
was not acceptable at all. While only 30% said that it was acceptable. IT is pertinent to mention
here that as we move from the indirect to direct questions, the response rate has also been on the
decline. The response rate for the first and the most indirect indicator was 355 which reduced to
335 in the second and to 333 in the third indicator. Moreover, the proportion of respondents
disagreeing with the statement has also been on the increase as we moved from the indirect to the
direct question.
The results are in conformity to the findings of Gerxani who states that people especially in
developing nations try to avoid direct questions while they do not tend to be comfortable with
direct questions, however, if questions are embedded in indirect methods, then the response tends
to be more realistic (Gerxani 2007, pp. 560). The comparison of all the three questions asked can
be clearly observed through the following graph:
Figure 3-2: Graphical Representtion of Tax Evasion indicators
As seen from the graph above, it is evident that as we move from indirect to the direct indicators,
the acceptability rate decreases i.e; for the first indicator (Ind 1) the ‘Strongly Agree’ has the
longest bar while for the third indicator ‘Ind 3’ ‘Strongly Disagree’ has the longest bar. The
graphical representation is also evident from the discussions of (Elffers, Robben, & Hessing, 1992)
which states that the more direct questions in such surveys involving controversial issues where
0
20
40
60
80
100
120
Strongly Agree SomewhatAgree
Neutral SomewhatDisagree
StronglyDisagree
Don’t Know
Ind 1
Ind 2
Ind 3

95
there are chances of the respondents being offended, indirect questions reveal a true picture as
compared to direct questions that directly pertain to an individual’s behavior or attitude to such
controversial issue like tax evasion.
Research paradigms
The Research Paradigm of the present study is based on the premise that human beings are selfish
and utility mazimizing individuals who interact with other individuals based on belifs, attitudes
and norms (James & Alley, 2002). Attitude of an individual shape their behaviors through a
rigorous decision making process (Anwar, 1995) assuming that their future will be certain
(Achmat, 2013). Achmat called this phenomenon as Theory of Planned behavior which states that
people make rational decisions based on information and under the environment of certainity.
However this is not always the case because there is mostly a disconnect or disparity between the
intented and actual behavior of an individual (Ajzen, 2005) especially in pakistani tax law
environment where there is probability of being caught on evasion and the environment may not
be too much certain.
As far as the tax compliance behavior of indivicuals is concerned, tax compliance behavior is
highly dependent on the perception and attitude towards the government (Damayanti &
Supramono, 2012). Whenever people perceive government actions to be favorable and public
services being provided are perceived to be fair, people respond favorably to the tax laws (Torgler,
Demir, Macintyre, & Schaffner, 2008). The attitude towards government actions and the resulting
behavior towards tax laws is part of the Fiscal Psychological Theory which states that taxpayers
loose motivation to pay taxes when they perceive no benefits in return by the government
(Hasseldine & Bebbington, 1991). Much literature has shed light on the taxpayer’s behavior that
is influenced by the beliefs towards the tax system. (Saad N. , 2009) has imperically demonstrated
the influence in this regard. According to (Damayanti, Sutrisno, & Baridwan, 2015), there are three
factors that determine the tax compliance behavior of an individual.These factors include attitude
towards tax compliance is shaped by subjective norms which ultimately lead to tax compliance
behavior of an individual; uncertainity in environment leads to behavior towards tax compliance
with higher degree of uncertainity disrupts their decision to comply with the tax laws; while trust
in government and its provision of public services to the masses leads to tax compliance behavior
(p. 939, 940).

96
Attitudes towards compliance are highly motivated by subjective norms rather than by objective
facts (Benk, Budak, & Cakmak, 2012). Moreover, tax systems in most countries have an element
of uncertainity under which people try to find out take decision based on gut feeling on whether to
make evasion decision or not (Walker, Courneya, & Deng, 2006) Similarly there is a contract
between the taxpayer and the government where taxpayers pay the taxes and government in return
provides public services (Torgler et al., 2008). However, perceived attitude towards provision of
these services determine the attitude of an individual towards tax compliance (Perumal, 2008).
Overall, based on the throry of fiscal Psychology as presented by (Damayanti, Sutrisno, &
Baridwan, 2015), following theoretical framework will be followed in the study:
Figure 3-3 : Fiscal Psychological Theory
According to the theory, tax compliance behavior is a product of perceived fairness in the tax
system, perceived social norms towards tax compliance in the society and willingness of the
taxpayers to pay their due share of taxes. All these determinants shape the attitude of taxpayers
towards tax compliance and ultimately lead to – according to (Damayanti, Sutrisno, & Baridwan,
2015) – tax compliance behavior of an individual. Therefore, the study will follow this framework
during the course of investigation.
Fiscal Psychological Theory
Perceived Fairness
Perceived Social Norms
Willingness to Pay

97
DEMOGRAPHIC PROFILE OF RESPONDENTS
According to the results of the survey, 369 individuals participated in the survey. The details of
the respondents according to age is appended below in the following table.
Table 4-1 : Age of the Respondent
Age Bracket Frequency Percent Cumulative Percent
26 – 35 154 43.1 66.7
36 – 45 77 21.6 88.2
46 – 55 29 8.1 96.4
56 – 65 13 3.6 100.0
Total 357 100.0
As evident from the above table, the age of respondents was divided into five groups each having
a range of 10 years. The age brackets were designed in accordance with Pakistan Bureau of
Statistic who have taken the same age brackets. The reason was to make further calculations that
will be included in the successive paragraphs. The first age bracket started from 18 years because
of the fact that according to the international law, the age of majority is eighteen years34. However
according to the Pakistani law, the age for majority varies from 15 years for some regulations and
while 21 for others.
The Economic Survey of Pakistan, that is the official document of the Ministry of Finance of the
country – along-with some other regulations – consider adult as any person having age more than
15 years. While on the other extreme, according to the Pakistan Citizenship Act 1951, a minor is
a person who has not attained the age of 21 years. However, practically definition of adult that is
applied in Pakistan is any person reaching the age of 18 years. The same is considered as an adult
34 Article 1 of UNHCR

98
age for the eligibility for National Identity card also known as the CNIC (Computerized National
Identity Card), driving license and even owing property and go for jobs like military35.
Moreover, the last bracket consisted of age group ’55 + years’. According to the Pakistani law, the
retirement age for employees in the government sector is 60 years36. However, none of the
individuals who participated in the survey had age limit beyond the age of 55 years. That is why
the last age bracket as seen in the table above is above 55 years. It is pertinent to mention that the
document of Pakistan Bureau of Statistics has taken age in brackets of 05 years but for the ease of
computation, the age brackets taken in the present study were 10 years. Yet the brackets were set
in such a way that a single age bracket in the study coincided with two consecutives age brackets
as taken in the documents of Pakistan Bureau of Statistics.
It is evident from the results of the survey that out of 369 people who responded to the
questionnaire, the greatest percentage was from the second age bracket (25 – 34 years) and
represented 66.9% of the total sample size. This means more than half of the sample size fell
between 25 and 34 years of age. This age bracket was followed by the first age bracket i.e; 18 –
24 years group that constituted 15.5% and the third age group of 35 – 44 falling in the third position
with 12.9% representation in the total sample size. The forth age group from 45 – 55 years had
only 1.6% respondents while there was no respondent in the category above 55 years age group.
In order to understand these figures more appropriately, we have taken into account the total
estimated population from the Economic Survey of Pakistan for the year 2017 – 18. According to
the document, the total population of the country in the year 2017 was estimated to be around
199.1 million while the proportion of population between 15 and 54 years is 61.4%. The chart
representing the population of the country in proportion to different age groups is appended below:
35 The Pakistan National Service Ordinance 1970 36 Establishment Division of Pakistan Document retrieved from:
http://www.establishment.gov.pk/estab/userfiles1/file/Establishment/publication/ESTA%20CODE%20(Edition%20
2015)/Chapter%205%20Front%20Page.pdf

99
Figure 4-1 : Age Profile of Pakistan
Source: Economic Survey of Pakistan for the year 2017 – 18
Thy above chart shows that the population of the country is in the form of a pyramid which means
that as the age increases, the proportion in total population reduces. This sort of pyramid is known
as the ‘demographic dividend’ that is defined as ‘the demographic dividend can be defined as the
potential economic benefit offered by changes in the age structure of the population, during the
demographic transition, when there is an increase in working age population and an associated
decline in the dependent age population’ (Dur-e-Nayab, 2006). As mentioned above, a total
working population of 61.4% is an indication that Pakistan has been going through a phase of
demographic dividend. Such phase has been captured by many East Asian economies who reaped
the benefits of their demographic dividend for their economic development (Mason A. , 2001).
Whether Pakistan has the potential to do the same is beyond the scope of this paper. The aim of
this research is to find out the relationship of age with attitudes towards tax evasion, therefore, the
research will keep its focus on this issue only.
As seen from the above figure, as the age increases, the proportion of population in the age group
decreases. Coming to the working age group i.e; 15 – 54 years, the proportion diminishes in that
segment also. This decreasing proportion is not in line with the findings of this survey as the

100
highest percentage of respondents are within the age group 25 – 34 years. If we analyze the table
above, the first age bracket has a total proportion of 15.5%, the third 12.9% and the forth 1.6% of
the total sample size. Till now we are in line with the estimates of the total population of the
country. The difference arises on the second age group i.e; 25-34 years of age group. This peculiar
trend can be explained if we take into account the educational qualifications of the respondents
that will be discussed in the coming section.
Gender of Respondents
The questionnaire included the option to include the gender of the reppndents. The reason was an
attempt to determine the relationship bwtween the variable gender and tax evasion. The details of
respondents with resepct to gender are appended in the table below:
Table 4-2 : Gender of Respondents
Frequency Percent Cumulative Percent
Male 256 71.7 71.7
Female 101 28.3 100.0
Total 357 100.0
Results of the survey indicate that a total of 256 respondents were male while 101 were females.
The total contribution of the sample size included 71.1% males while the remaining 28.3% were
females. This figure is not compatible with the population statistics of the country. According to
the Pakistan Bureau of Statistics, the proportion of male and female population of the country
stands around 52% and 48% respectively. This discripancy in the nation-wide figures and those
determined through the survey is not unusual. Rather there are other reason for that discripancy.
The gender-wise eduational attainment in pakistan can be attributed as a factor in the result of the
survey. According to an estimate, 15.6% males and 8.4% females had crossed the secondary level
of education (Imran, Butt, & Jehangir, 2018). In order to understand the quesiotnnaire and by
virtue of being salaried persons, the population of the survey included people who were atleast
matriculate of had passed secondary level of education. Similarly educational attainment at higher

101
levels also produces the same gender-wise results. The results of gender-wise attainment of
education in pakistan is as follows:
Table 4-3 : Education-wise roportion of Pakistan
Educational Level Proportion of Males Proportion of Females
Matric 15.6 8.4
Intermediate 6.7 4.3
Bachelors (14 years) 5.3 3.3
Masters (16 years) 3.3 1.9
MS/ PhD 0.10 0.10
Source: Author’s own calculations from PERI
Income Level of Respondents
In order to find out the relationship bwtween income and tax evasion, the correlation was applied
between the variable gender and different indicators of tax evasion including the average. In order
to gather information about the income level of the respondents, the income levels were divided
into eight cetagories with each bracket having a range of PkR 10,000. The first income bracket
taken was ‘upto PkR 45000. The reason for taking PkR 35,000 as the smallest bracket was the fact
that the survey was carried out in the year 2017 – 18. The tax during the time period was NIL on
income upto PkR 400,000 annual income. This made a monthly income of PkR. 33,333. Rounding
off the income to closest figure made it PkR 35,000.
The final category included a monthly income bracket of PkR, 95,000. The reason for taking this
amount was that during the survey, first 50 responses revealed that a total of 02 responses were
more than PkR 100,000 therefore, in order to obtain such a small percentage in the sample size,
the last salary bracket was made ‘above PkR 95,000’. It is also evident from the table that a very
few respondents even reached that limit in the survey.

102
Table 4-4: Income Level
Frequency Percent Cumulative Percent
35000 - 45000 91 25.5 25.5
45000 – 55000 59 16.5 42.0
55000 – 65000 30 8.4 50.4
65000 – 75000 35 9.8 60.2
75000 – 85000 50 14.0 74.2
85000 – 95000 31 8.7 82.9
95000 – 105000 24 6.7 89.6
105000 above 37 10.4 100.0
Total 357 100.0
The above table shows that there are total eight income brackets starting from upto 45,000 as
option ‘1’ while above PkR 95,000 as option 8. The remianing 6 values remained in between with
a range of PkR 10,000 each. According to the survey, a total of 91 respondents had monthly income
of 35,000 to 45000 while 59 had income of upto PkR 55,000, 30 upto PkR 65,000, 35 respondents
upto 75,000, 50 people upto 85,000, 31 upto 95000 while the remianing 24 and 37 respondents
claimed to be having income brackets of 95000 – 105,000 and above 105,000 respectively.
Educational Qualification
In order to check the relationship between education attainment and attitudes towards tax evasion
the survey questionnaire also included the question regarding educational qualification of the
respondents. The options included Matriculate, Intermediate, Bachelors, Masters, M. Phil / PhD.
In order to proceed further, there is a need to clarify different levels of education for the readers to
iunderstand prevailing in pakistani education system. Matriculate in pakistan means secondary
school that is considered equal to O levels in British system or the Junior High School in the USA.
Similarly, the intermediate is almost equal to A – Levels in the British system of the High School
in USA.

103
Coming to the tertiary education, Bachelors is a 2 years degree in Pakistan that is not at par with
the international Bachelors that is 3 to 4 years in advanced countries. Therefore, in case of Pakistan,
a 02 years Masters is considered equal to international level Bachelors and is considered 16 years
education. It is therefore, mandatory for students who wish to pursue Doctoral degrees to first carry
out Masters in Philosophy or an P.Mhil degree before enrolling themselves for PhD. M. Phil is an
18 years education that is considered equivelant to international level Masters Degree that is
followed by 02 years Masters degree done after 02 years of Bachelors degree.
Although there are certain levels below the Matriculate level that include primary and Middle
schoolings. However, these levels have been excluded from the studies due to the fact that most
people who had that level of education did not have much salary that could be taxed as discussed
in the previos section related to income level of the respondents. Moreover, people included in that
education level could not easily understand the questionnaire and not a single questionnaire filled
in by such respondents had valid responses. Therefore, such questionnaires were excluded form
the final analysis stage. The educational qualification of all the respondents who participated in
the survey is appended below:
Table 4-5 : Education Qualification
Frequency Percent Cumulative Percent
Matriculation 24 6.7 6.8
Intermediate 16 4.5 10.7
Bachelors (14 Yrs) 39 10.9 21.7
Masters (16 Yrs) 161 45.1 67.0
M. Phil / Ph.D 117 32.8 100.0
Total 357 100.0
The results of the survey indicated that a total of 24 respondents who participated were
matriculated meaning they had completed 10 years of education. This segment contributed 6.7%
of the total sample size. Similarly, a total of 16 rerspondents or 4.5% of the total sample size had
completed 12 years of education while the remaining 88.8% were university graduates of which
39 respondents or 10.9% had 14 years of bachelors degree and 161 people constituting 45.1% had

104
16 years education or were either Bachelors Honors degree holders or had done Masters (02 years
degree after 02 years Bachelors). Finally 117 respondents or 32.8% of the total sample size were
M.Phil or Ph.D holders.
It is interesting to note that the sample size included 88.8% of the total respondents who were
university graduates or had completed tertiary level degrees. This figure is far against the national
average for a country that has a literacy rate of 58% in 2018 and that to – according to the sitting
Federal Education Minister of the country – had fallen from 60%37. The definition of literacy as
taken from the Census of Pakistan 1998 includes a person who can read newspaper and write basic
level letters.
This discripancy between the national figures and proporion of the survey is twofolds. First of all,
as mentioned before, the required population for the survey inlcuded respondents who could read
and understand complex termonologies and could fill in the questionnairs related to tax evasion.
Moreover, the population included salaried class who had been working in different sectors and
had salaries that were taxed. All these requirements could be fulfilled by taking into consideration
the learned segment of the society.
According to a report published by the Ministry of Federal Education and Professional Training,
Government of Pakistan in coordination with UNESCO38, a total of 3.325 million children were
enrolled in secondary schooling in pakistan. Of this 58% were males while the remaining 42%
were females. similarly, 1.583 million students enrolled themselves at Higher Secondary level of
education with the gender proportion of 61% and 31% for boys and girls respectively.
Coming to the tertiary education level, a total of 0.204 million boys and girls of the country got
admissions in Degree colleges providing education at Bachelors level (14 years of education). The
gender proportion at this level stood at 56% and 44% for boys and girls respectively. Total
enrollment for post graduate degrees including Masters 16 years and M.Phil / PhD degrees for the
year 2016 – 17 was 1.463 million with the ratio of Boys to Girls to be 54% and 46% respectively.
As mentioned earlier, the literacy rate of pakistan is 58%. It is important to note here that in
pakistan the number of out of school children at the higher school level stood at 4.97 million while
37 Education Minister Shafqat Mahmood addressing the Senate of Pakistan on 20 December, 2018 (Source : Pakistan
Today dated 20 December, 2018) 38 Invalid source specified.

105
that of higher secondary level or intermediate level was 6.29 million. This means that out of a total
of 8.295 million potential students only 40% had got a chance to get themselves enrolled at higher
school level. Similarly the total number of children eligible to be enrolled at higher secondary level
or at intermediate level in the year 2017 was 7.873 while only 20% could actually get the chance
for enrollment. Similarly, a total of 1.463 million students got enrollments in higher education
studies in the year 2017 that shows a lower percentage of the national population.
Ethnic Background of the Respondents
The next variable involved determining the area of permanent residence of the respondent.
Pakistan has been divided into four provinces namely Punjab, Sindh, Baluchistan and Khyber
Pakhtunkhwa (KPK) (previously known as North Western Frontier Province). Federally
Administered Tribal Areas or FATA is a territory of Pakistan consisting of seven agencies and six
forward regions.39 The area is direct under the executive power of the President of Pakistan through
his agent – the Governor of KPK province40 - and is governed by Frontier Crimes Regulations
1901. The laws passed by the National Assembly of Pakistan (the legislative body of the country)
are not applicable in FATA till the time they are ordered by the President. It is pertinant to note
that no respondent from the area of FATA represented in the survey that also remained a limitation
of the study.
Moreover, Gilgit Baltistan region comprises seven districts and is situated to the north of Pakistan
amidst the highest mountain ranges of the world namely the Hindukush, the Himalayas and the
Karakuram ranges. This region is therefore sometimes also referred to as the the Northern Areas
Azad Jammu and Kashmir or simply Kashmir is located at the North-East of Pakistan and is a
separate state with its own constitution, legislative Assembly, Prime Minister and the President.
However, certain sectors like Defence, Foreign Affairs and Currency and Coin are vested with
Pakistan.
For the purpose of study all four provinces, FATA, Gilgit-Baltistan and Kashmir had been taken
as the area of permanent residence of the respondents to check whether geographical region has
an impact on the tax evasion choices of the individuals. Although literature has not sighted any
specific justification for the relationship still there has been some studies that have established a
39 FATA website : https://fata.gov.pk 40 Articles 51, 59 and 247 of Constitution of The Islamic Republic of Pakistan, 1973

106
relationship between tax evasion and geographical area. A study carried out by (Brosio, Cassone,
& Ricciuti, 2000) showed that tax evasion is dependent on geographical area. The main
determinants included per capita income of the area, proportion of taxes levied at central
government level and the level of public services provided to the individuals. The study justified
its hypothesis by the fact that poor regions have more tax evasion as compared to the rich areas.
Moreover, taxes levied at central level are indiscriminately levied in all the regions of the country
hence burdening the poor regions more than they do to the rich locations of the country (pp. 4 -5).
Although there is no direct relationship between the study mentioned above and our hypothesis
because this research is based on finding opinions about the behaviors of people who are not living
in that area but have just hailed form the areas in question. Whereas the study carried out by
(Brosio, Cassone, & Ricciuti, 2000) concluded that tax evasion is dependent upon the geographical
area.
Moreover, there are people living in different areas of the country that have differences as far as
language, traditions and color of skin are concerned despite the fact that the only thing binding
force that enabled the creation of Pakistan is religion (Ali & Rehman, 2013). Ethnicity is defined
as the self-consciousness of a group of people united by shared experiences’ i.e. language common
religion, economic and political interests etc (Shahzad, 2011).
For the purpose of the study, the provinces of Panjab and Sindh had been divided into sub-division.
This is because of the reason that the population of Punjab was proportionately very large as
compared to other provinces of the country. The share of respondents as tabulated by area is as
under:
Table 4-6: Provincial Share of Survey Population
Punjab Sindh KPK Baluchistan Gilgit Kashmir TOTAL
Frequency 244 23 75 14 7 5 369
Percentage 66.4 6.3 20.3 3.8 1.9 1.4 100
It is evident from the table above that a total of 66.4% respondents were from the province of
Punjab. Therefore, the province was further broken down into three sections namely Northern
Punjab, Central Punjab and Southern Punjab.

107
It is also pertinent to mention here that Islamabad –the Capital city of Pakistan – is a separate area
and is not part of any province. The city was nonexistent and was purposely established under the
Regime of General Ayub Khan in 1960 to shift the capital of the country from Karachi to some
central location.41 However, during the survey only two respondents claimed that they had their
permanent residence in Islamabad. On further investigation, even they revealed that they belonged
to different regions and had recently shifted to Islamabad. Therefore, their native land areas were
then taken into consideration. The newly constructed area-wise division and frequency in each is
tabulated as follows:
N.Punjab C.Punjab S.Punjab KPK Sindh Balochistan G/B Kashmir TOTAL
104 110 31 75 23 14 7 5 369
The results of census of 1998 are tabulated as under:
Table 4-7 : Province wise Population as in 1998 Census
Punjab KPK Sindh Baluchistan
73621 17744 30440 6566
55.63 13.41 23 4.96
Figure 4-2: Geographical Representation of Population as per 1998 Census
41 Capital Development Authority, Islamabad website: http://www.cda.gov.pk/about_islamabad/history/#ad-image-0
0
10
20
30
40
50
60
70
Punjab Sindh KPK Balochistan
Response
Population

108
It is evident from the graph above that with the exception of Sindh, the proportion of population
of the province with respect to the total population of the country, the response rate is almost the
same. However, the case of Sindh is a bit different due to the fact that literacy rate in the province
is not very high and has remained to more than 47% of the total population with only 30% of the
total population attaining qualifications secondary (Matric in Pakistani system) and above
The said study also discussed disparity in the rural and urban areas of the province stating that the
proportion of the same category rests at 17.3% in the rural areas while 48.17% in urban areas (p.
173). Therefore the province of Sindh was further divided into two areas namely; Sindg (Rural)
and Sindh (Urban). The results of the survey indicated that around 65% of the respondents form
Sindh were from Urban areas while the remaining 35% hailed from rural areas of the province
making almost the same proportion when compared to the percentage of population of the province
who had attained education matric and above.
Although no authentic evidence for such such argument is not available, still such reduced
population of Sindh province can be attributed to the fact that Karachi which is considered as the
financial hub of Pakistan is located in Sindh and most people from Sindh naturally prefer going to
Sindh for employment than in Islamabad that is much far as compared to Karachi. Same reason
has led to the increased proportion of KPK in the study whose most cities are at a close proximity
to the capital - Islamabad.
Based on the above situation, the area of permanent residence was divided into the following
regions:
Table 4-8 : Area-wise represenatation of respondents
Region N.Punjab C.Punjab S.Punjab KPK Sindh
U.
Sindh
R.
Balochistan Kashmir GB
Number 104 110 31 75 15 8 14 5 7
Proportion 28 30 08 20 04 02 04 01 02
The figures above show that the highest proportion of the respondents hailed from Central Punjab
Region that consisted of areas as shown in the map attached as figure

109
Figure 4-3 : Depiction of Central Punjab Area
Source : (Ahmed, Zafar, & Yaseen, 2017)
Punjab is the largest province of Pakistan as regards population and has been divided into three
regions based on languages being spoken namely Northern Punjab, Potowari speaking region –
the Northern Punjab; Punjabi speaking – the Central Punjab; and Siraiki speaking region – the
Southern Punjab (Mushtaq, Regional Identities in Quest of Separate Provinces: A New Challenge
for the Pakistani Federation, 2016). According to the Census of 1998 Punjab had a population of
approximately 73.621 million and a total of 34 districts. Of these 13 districts of central Punjab, as
shown above have a population of approximately 36 million making 49%42 of the total population
of the province. As per the study is concerned, a total of 45% respondents who mentioned Punjab
as their area of domicile claimed to be from central Punjab region.
Northern Punjab consists of the area south of the mountains and in between the rivers Indus and
Jhelum and consists of a total of four main districts namely Rawalpindi, Chakwal, Jhelum and
42 Own calculations from Pakistan Bureau of Statistics documents

110
Attock (PIPS, 2011). The population of the region is more than six and a half million43 that
constitutes almost ten percent of the total population of Punjab. However, Rawalpindi that
constitutes almost half of the population of the entire region was included in the study because the
survey was carried out in Rawalpindi and Islamabad (referred to as the twin cities due to their
proximity).
The remaining seventeen districts of the province of Punjab form the southern Punjab. According
to the census of 1998, the total population of the area is around thirty one million that constitutes
forty two percent of the total population of the province. However, illiteracy in South Punjab is
higher as compared to all the other areas of Punjab (Khan & Mehmood, 2009) which may have
been the reason why the representation of the people in the survey is lesser as compared to their
proportion in the actual population as the survey included people who are not only literate but have
also attained Secondary level of education and are working as salaried employees in organizations.
KPK that was previously known as the North West Frontier Province or simply NWFP is the third
largest province by population after Punjab and Sindh respectively and has a population share of
13.4% of the total population of the country44. however a higher proportion of respondents i.e 20%
of the total sample size may be due to the fact that comparatively the representation of Sindh is
lower as compared to the relative proportion of the other regions.
Similarly the least populated and the least literate province of the country. Only 27.8 percent of
children of the province reach secondary level school (Government of Balochistan, 2011). The
total share of population of the province is less than five percent of the total population. The
representation of the respondents belonging to the province in the survey was also around four
percent showing almost an equal representation as the actual share in the total population.
Gilgit Baltistan that is situated in the north of the country is a federally administered territory and
is not part of any province due to its association with the disputed territory of Kashmir. According
to estimates the population of Gilgit Baltistan is around two million which when compared to the
actual population of the country constitutes around 1 percent of the total population when
compared to the population of Pakistan. however a share of two percent in the total sample size
justifies its relative proportion.
43 Own Calculations from Pakistan Bureau of Statistics Documents 44 As per of 1998

111
Similarly Kashmir is also a separate state but has visa free entry into Pakistan. people from
Kashmir are employed in Civil and military institutions of Pakistan and work in other public and
private sectors of the country. The proportion of population of Azad Jammu and Kashmir is
approximately 17% of that of Pakistan45 However, the proportion of the respondents belonging to
Kashmir in the survey was only one percent i.e; only five people responded from Kashmir. This
may be attributable to the fact that as mentioned earlier Kashmir is a separate state and especially
has its own public services.
Although there is no direct relationship between the study mentioned above and our hypothesis
because this research is based on finding opinions about the behaviors of people who are not living
in that area but have just hailed form the areas in question. Whereas the study carried out by
(Brosio, Cassone, & Ricciuti, 2000) concluded that tax evasion is dependent upon the geographical
area.
After discussing the profile of all the regions included in the survey, we come to find out the
relation of the variable in question i.e; area of permanent residence with the three indicators of tax
evasion. The results are produced as under:
Region-wise Poverty
According to a policy by Pakistan Poverty Alleviation Fund (PPAF), Pakistan 31.3% of the total
population of the country was below poverty line (Naveed, Geography of Poverty and Public
Service Delivery in Pakistan , 2017). Moreover, this proportion is not evenly divided among
different provinces. According to the same report Baluchistan was the most poor region with
around 75% people living below poverty line, while Punjab was the least poor with only 24.3% in
the same range. Similarly the percentage of poverty in Sindh and KPK was 39.3 and 37.5%
respectively. The same report also reveals that as we move from Northern to Southern Punjab, the
poverty percentage increases.
Out of the three indicators of tax evasion, the only indicator whose results are in conformity with
the literature is the first and the most indirect indicator i.e; Do you think making arrangements to
reduce tax burden is acceptable? The results are tabulated as follows:
45 According to the estimates of Census of Census of Pakistan and Kashmir carried out in 1998

112
Table 4-9 : Percentage of Response on first indicator of Evasion
N.Punjab C.Punjab S.Punjab KPK Sindh
R
Sindh
U
Balochis G/B Kashmir
53% 55% 60% 56% 73% 50% 69% 43% 100%
55.95 61.67%
The table above shows an inverse relationship between Tax evasion and poverty. As described
earlier that the province with the most percentage of poverty is Baluchistan and that the least poor
province is the Punjab. While the provinces of Sindh and KPK fall in between respectively. As
seen from the table above, the total percentage of people who agreed to the statement that some
sorts of arrangements are acceptable to reduce the burden of tax payment varied between
provinces. The least poor provinces i.e; Punjab had the least proportion of respondents who
claimed that such practice is acceptable and the most proportion for the same was from Baluchistan
and FATA .Baluchistan lack behind not only in the country but in the Region as well as in the
world as far as human development index is concerned with poverty indexes increasing (Siddiqui,
2015). Siddiqui also argues that Baluchistan ranks lower in nine out of ten indicators for education,
literacy, health, water and sanitation and has the country’s lowers GDP (pp. 64).
According to a report published in the Economic Survey of Pakistan, 2015-16, the poverty in Gilbit
Baltistan region stood at 43% it is stinking to note here that coincidently, the same figure shows
the proportion form Gilgit Baltistan who responded to the question as acceptable.
However, a slight differentiation comes from the provinces of Sindh and KPK. This is due to the
fact that KPK as a whole has been taken while the province of Sindh had been divided into Rural
and Urban areas. As seen from the table there is a remarkable difference between the mindsets of
people belonging to Rural and Urban areas of Sindh. As explained by (Naveed, Geography of
Poverty and Public Service Delivery in Pakistan , 2017) there is much parity between the urban
and rural areas of the country, therefore, the proportion for Sindh seems more than KPK despite
the fact that as per Naveed, 2017, the percentage of poverty of KPK is comparatively more than
that of Sindh.

113
Ethnic Issues
Another issue that affects tax evasion behavior of the individuals is identified as ethnic
fractionalization whereby people discourage contributing to public services (through taxes) due to
their unwillingness to pay for these services that benefit other groups of the society (Lassen, 2007).
According to Anthropologists, Ethnic means “A group possessing some degree of coherence and
solidarity composed of people which are, or at least latently, aware of having common origin and
interests” (Ahmed, Ghosh, & Reifelt, 2000). However the most comprehensive definition of ethnic
groups has been coined by Crystal who states that “An ethnic group is a self-perceived inclusion
those who hold in common a set of traditions not shared by others with when they are in contact.
Such traditions typically include folic, religious belief and practices, language, a sense of
historical continuity and common ancestry or place of origin”.
Pakistan like most other South Asian and African states – came into being from a colonial rule of
states that had a concept of a Nation State as no other identity could be recognized for them in the
international order (Sheth, 1989). As Pakistan came into being in the name of Islam, therefore
Islam was the only identity that united the Muslims of the sub-continent to gain a separate
homeland for themselves. According to the Pakistan Bureau of Statistics, more than 96% of
population of the country is Muslims.
Pakistan has been faced with the issues of Ethnic groups since it came into being in 1947 and this
ethnic confrontation even led to the separation of Bengal as Bangladesh (Khan A. , Ethnic
NAtionalism and the State in Pakistan, 2001). Pakistan has seen many movements in the course of
its history in the form of Hazara movement, the movement for greater Baluchistan and the
movements of Sindhi, Muhajir conflicts in Sindh (Azhar & Muhammad, 2017). The movements
by areas that constitute the Southern Punjab have also been demanding the division of Punjab
based on language dispute (Akhtar, 2013).
FATA is situated in the North West of Pakistan as is a buffer zone between Pakistan and
Afghanistan. The area consists of seven agencies and six forward regions. The agencies include
Bajaur, Mohmand, Khyber, Orakzai, Kurram, North and South Waziristan while the forward
regions (FRs) include Peshawar, Kohat, Laki marwat, Tank and Dera Ismail Khan. The area has
an estimated population of 3.5 million (Iqbal & Khan, 2014).

114
Again starting from Baluchistan, which is the largest province of Pakistan as far as area is
concerned while is the smallest province as far as population is concerned. As discussed in the
preceeding section, Baluchistan has an issue of poverty and economic depreviation, there are issues
of ethnicity and nationalism as well. The province has seen many ups and downs in its relations
with the central government (Azhar & Muhammad, 2017). Baluchistan has a history of conflicts
with the central government based on political economic as well as on ethnic issues which is still
going on (Siddiqui 2015 p. 62-63). The situation of national movements was fueled in 2002 after
the central govenrnment of pakistan awarded lisences to Australian and French firms fro the
exploration of gold and copper in the province (Aslam R. , 2011). Grare (2006) has identified three
main factors have been contributing to the ethno-national movements going on in the province
(Grare, 2006). The first claim made by the proponents of the movement is made on the premise
that they consider Baluchistan as being colonized by Pakistan’s politically and economically
dominant province of Punjab. The most prominent example quoted is of the Natural Gas being
extracted from Baluchistan that was supplied to the cities of Multan and Rawalpindi (both in
Punjab province) in 1964 but Quetta – the capital of Baluchistan Province – got this supply in 1984
(Grare, 2006, p.5). Moreover, military cantonments being established in Sui, Gwader and Kohlu
are being seen as steps to depossess Baluchs of their own lands. The third factor, as claimed by
Grare is the establishent of Gwader port that Baluchs think would lead them to become a minority
in their own province (p.6). Adeel Khan Asian Survey 42/2 213-229
The second most marginalized ethnic group in Pakistan after the Baluchis is the Sindhis. (Khan,
2002) Sindh is known as the land of Sufis and people there had been living in peace despite the
influx of people from parts of the region who not only settled there but merged themselves with
the locales both culturally and linguistically (Tekchandani, 2005). Sindh is ethnically the most
diverse province of the country. The province has witnessed an intensive inflow of immigrants
both internationally from India and domestically – mostly the Punjabis and Pathans (Kennedy,
1993). The most important reasons that led to this inflow were threefold that included economic
opportunities in Karachi46, allotment of agricultural land to military and civil bureaucrats and also
the secular and non-violent culture of the Sindhis (Khatwani & Abbasi, 2014).
46 Karachi is the largest city of Pakistan and is the economic hub of the country.

115
The main issues started at the time of partition in 1947 after the migration of Urdu speaking
Muslim migrants from India who were different from local Sindhis ethnically, linguistically and
culturally (Feroz, 1989). Only in the first four years of partition, around one million refugees from
India migrated to the urban areas of Sindh including Karachi, Hyderabad, Nawab Shah and Mirpur
Khas (Azhar & Muhammad, 2017). These Muhajirs 47 stayed in harmony with the local population
till 1970s in the name of Islam (Khan, 2002). These Urdu speaking migrants were educationally
much advanced than the locals, therefore, they managed to dominate the politics, civil and military
bureaucracy and even the business and the media and were mostly settled in the urban areas (Khan,
2004)
Soon after the partition, Pakistan fell into the hands of Punjabi elites and the Muhajirs (Khan,
2004). The most prominent examples as quoted by Khan are the fact that the then Prime Minister
of the country, Mr. Liaqat Ali Khan was a Muhajir while, Mr. Chaudhari Khaliquzzaman who took
over as the president of the only Political Party the Muslim League after the death of Muhammad
Ali Jinnah, was a Punjabi elite. The resettlement policies of Mr. Liaqat Ali Khan made the Sindhis
a minority in the urban areas of the province. Moreover, in 1948, Karachi was made the capital of
Pakistan and was given under control of the central Government and the imposition of the “One
Unit Plan”, all led to resentment by the Sindhis and they protested the decisions (Khan, 2002).
This led the local Sindhis to launch protest against the central government’s policies which they
believed were strengthening the Muhajirs economically specially in urban areas of the province
(Akhtar, 2013). In 1970s, Mr. Zulfiqar Ali Bhutto the then president of Pakistan and the leader of
Sindhi dominated political party Pakistan Peoples Party or PPP critical of the emerging influence
of Urdu speaking community in the province went on to protect his political interests (Akhtar,
2013). Bhutto introduced quota system in the federal and provincial government setups based on
Rural and Urban Sindh (Azhar and Muhammad 2017, pp. 76). This further led to the Rural Urban
and Sindhi – Urdu divide in the province. Moreover, Mr. Bhutto in 1972 also made an effort to
secure Sindhi language by passing a bill in the Sindh Assembly making Sindhi and Urdu the
compulsary languages to be taught in schools of the province (Rehman T. , 1996). This led violent
47 In Islam Muhajirs are people who migrate in the name of ALLAH. The name was given to migrants as Pakistan
was created as a result of the Two nation theory

116
retaliations by the Muhajirs that surfaced in the shape of burning of books in University of Karachi
(Khan, 2004).
To counter this situation general Zia ul Haq helped the Urdu speaking community by enabling
them to raise their own political party and thus the urban – based MQM or Muhajir Quomi
Movement came into being (Akhtar, 2013). The main purpose of this party was to help Muhajirs
maintain their identity by politically defending their interests (Khatwani and Abbasi 2014, pp. 45).
According to Azhar and Muhammad the party remained a dominant political party of Sindh since
1988 and enjoyed full support of the Urdu speaking community since then. In the 1990s the
Muhajirs even demamde a separate province for themselves (Rehman J. , 1994).
Two main political parties who remained in power since that time had started military operation
against MQM claiming that the party members were incolved in kidnappind, killings and other
social evils (p. 76). However all these wefforts failed and the next military ruler General Pervez
Musharaf again strengthened the party in Karachi and Hyderabad – the two largest cities of Sindh
while the party also changed its name to Mutahida Quomi Movement hence inviting people from
all ethnic groups of the country (Khatwani and Abbasi 2014).
The Sindhi – Muhajir conflict did not only have a political stance but socio economic as well.
Being more educated, Muhajirs had more share in the civil bureaucracy. According to the 1973
Civil Bureaucracy Report, Sindhis despite being indigeneous people and in majourity had only 2.5
% share while the Muhajirs had 30.20% while out of 3532 to level bureaucrats, only 90 were
sindhis (Shahzad, 2011).
After the General elections of 2008, PPP and MQM made an effort to unite but they could not end
their disputes due to the fact they represented Rural and urban areas respectively (Khatwani &
Abbasi, 2014). Moreover, in 2014 when PPP swept the elections, after some efforts, MQM still
made an effort to work in coordination with PPP in order to lessen down the Rural – Urban gap in
the province (ibid). Although efforts are in progress speaks about the social, economic and political
depreviation of the Sindhis and the cause and magnitude of ethnic conflicts in Sindh.
Siraiki Community is in majority in Multan, Bahawalpur and Dera Ghazi Khan divisions of the
Southern Punjab who have been demanding the division of Punjab on ethnic lines (Mushtaq &
Shaheen, The Siraiki Province Movement in Punjab, Pakistan : Prospects and Challenges, 2017).
The Siraiki nationalist movement traces back to 1818 when the province of Multan was annexed

117
with the province of Lahore. This annexation led to the sense of deprivation among the locals
(Langah, 2005). This sense of depreviation continued even during the British rule as the area
remained neglected in development projects and induction of people in civil and military
bureaucracy (Taabish, 2014), (Engerman & Sokoloff, 2005). According to Mushtaq and Shaheen
this sense of depreviation of development and representation in civil and military bureaucracy
continued even after the partition of 1947 (p.140).
Another Siraiki majority region of the state of Bahawalpur joined Pakistan after the partition on
5th October, 1947 (Khanum, 2016). The state was very well off but after the abolishing of “one-
unit system”, the state was made part of the province of Punjab and was given the status of Division
(Kakar, 2012). According to Kakar the people of the state resisted the decision but the state was
forcefully merged with Punjab. In 1960s the movement for making Bahawalpur a separate
province gained momentum that withered away in the aftermaths of the separation of East Pakistan
(Now Bangladesh) when Nawab of Bahawalpur termed that that call for the separate province was
“Not a priority” (Qayyum, 2013).
Afterwards, some of the activists of Bahawalpur movement joined hands with those of the Multan
movements in an attempt to make a separate province for the Siraiki people and the term
‘Siraikistan’ was coined (Langah, 2011). However, the movement could not last for long as some
proponents of the Bahawalpur movement termed it as a tactics of the Bhutto regime to suppress
the Bahawalpur Movement (Manan, 2012). The movement restricted itself to the protection of
Siraiki language and Culture. In this process, the first All Pakistan Siraiki Literary Conference was
held in 1975 that, among many other demands, condemned the allotment of lands to non-Siraikis
in the region (Baloch, 2014). This conference led to identity based political activity in the form of
creation several organizations devoted to Siraiki cause (Mushtaq and Shaheen, 2017).
The movement gained momentum after the eighteenth amendment in the constitution of Pakistan
of 1973 that granted much autonomy to the provinces. This decentralization revived the demand
for a separate Siraiki province (Ahmer, 2013; Hanif & Khan, 2011). This movement was also used
by political parties to achieve their political motives. Pakistan Peoples' Party that was in power in
the central Government moved and passed a resolution for the establishment of new provinces in
Punjab (Babar et al., 2013). Similalry at the same time, Pakistan Muslim League (N) passed a

118
resolution in the Punjab Assembly for the creation of creation of Siraiki as well as Bahawalpur
provinces (Manan, 2012). However all such resolution had been halted till date.

119
FINDINGS AND ANALYSIS
Demographic Variables and Tax Evasion
As evident from the literature, at global level, much emphasis has been laid on the personal
characteristics of the taxpayers and tax morale and their relationship with tax evasion. studies
carried out by (Recardson, 2006), (Recardson, 2008), all have stressed upon the behavioral aspects
i.e; they all have related tax evasion with personal characteristics including age, gender, marital
status, education and even source of income. Some studies like that carried out by (Philip & Palda,
2004) have went to the extent of carrying out surveys to find out behavioral responses along with
their perceptions and personal characteristic to measure the relationship with tax evasion.
Much work has been carried out on the demographics of taxpayers and the effect of these variables
on tax evasion. The results of such studies have proven to be mixed. at one time, studies have
found a significant relationship between sociodemographic variables like age, gender, income
source and occupational groups (Ahmed and Braithwaite, 2004, Bobek et al., 2007, Kastlunger et
al., 2010, Wenzel, 2007) while others show the results and relationship to be otherwise (Ashby et
al., 2009, Braithwaite and Ahmed, 2005, Grasmick and Bursik, 1990, Muehlbacher et al., 2011).
Even the significance of these sociodemographic variables in not clear in the research circle. Some
studies like the ones carried out by Ashby et al., 2009) include them in their studies while others
like Muehlbacher & Kirchler, 2009) do not consider them worthy enough to be part of their studies.
In order to clarify such situation, the present research aims to find out the impact of demographic
variables including age, gender, income level, educational attainment and occupational group on
tax evasion behavior and attitudes of the respondents.
Age and Tax Evasion
Age has been shown to have a significant relationship with tax compliance behavior of individuals.
Studies carried out by (Mason & Calvin, 1978) (Wärneryd & Walerud, 1982) and (Torgler, 2004)
– along-with many others – have shown that young people are more compliant as far as tax
payment is concerned when compared to older people. A study carried out by (Widianto, 2015)
went a step further and concluded that less compliance by elderly people is because of other factors

120
like distance of tax office from their location, complicated procedures and even lack of knowledge
of use of modern technology by the elderly people that becomes a hurdle in filing returns or even
making accurate tax returns.
However, there are some scholars who are of the view that compliance and age have a positive
relationship. Studies carried out by Jackson and (Chung & Trivedi, 2003) have tried to prove that
tax compliance increases as the age of individual increase. Another study carried out in turkey also
pointed out that people above the age of 41 years of age were seen to be more optimistic towards
the tax structure and systems as compared to the young age group people (TazegüL, 2016). The
difference in differing results is because of different approaches used in the process of research.
Taking the examples of (Wärneryd & Walerud, 1982) and (Chung & Trivedi, 2003) it is clear that
both had used the same survey method to explore the tax compliance behavior of the individuals.
The main difference in both the studies was the approach or the factors being included in the survey
instrument.
(Chung & Trivedi, 2003) used questions related to the internal factors and measured the attitudes
and perceptions of taxpayers while (Wärneryd & Walerud, 1982) determined the tax knowledge
and abilities of the taxpayers. In short, the former study focused on the internal or psychological
factors while the later focused on the external factors. Research focusing on such issues as tax
compliance behavior is more accurate if internal factors like perceptions and attitudes of
respondents are taken into account rather than external factors like knowledge and education
(Torgler & Schneider, the Impact of Tax Morale and Institutional Quality on the Shadow
Economy, 2007). This proves that the research carried out by Chung and Trivedi has to be more
reliable than the other. In order to find out the relationdhip between age and compliance behavior,
chi square test of independence was conducted, results of which are tabulated as under:
Table 5-1: Chi Square Test (Age Vs Tax Evasion Behavior)
Chi-Square Tests
Value df Significance (p-value)
Pearson Chi-Square 105.682a 16 .000
N of Valid Cases 357
a. 5 cells (20.0%) have expected count less than 5. The minimum expected count is 1.49.

121
The results indicate a significant relationship between the variable of age and all the indicators of
dependent variable. The value of X2(calculated) at df = 16 is much higher than the X2(Tabulated) value of
26.296 which speaks of the high significance of the results. The study is in conformity to the one
carried out by (Chang & Trivede, 2003) (Al-Mamun, Entebang, Mansor, & Yasser, 2014) who
showed a relationships bwtween age and tax compliance. It is also interesting to note that the age
groups as taken in the study by (Al-Mamun, Entebang, Mansor, & Yasser, 2014) were the same
as in the current study. Moreover, the ratio of different age groups in the study was also
approximately the same as the highest constritubiion in the sample size was of age group of 26 –
35 years followed by 18 – 25, 35- 45 and ‘over 45 years’ respectively. In order to further check
the strength of relationship, Cramer’s V test will als obe used the results of which are tabulated as
follows:
Table 5-2 : Cramer’s V : Age Vs Tax Evasion Behavior
Symmetric Measures
Value Approximate Significance
Nominal by Nominal Phi .258 .000
Cramer's V .258 .000
N of Valid Cases 357
The Cramer’s V value of 0258 shows a moderate association between the two variables in question.
This enables us to reject with confidence the null hypothesis that there is no relationhip between
age and behavior towards tax evasion. however, the strength is moderate. Hence it is concluded
that age has a moderately strong association with an individuals’s behavior and attitude towardstax
evasion.
It is pertinent to mention her most studies carried out in Asian countries have proved similar results
as compared to studies carried out in American and European contexts. For example the results
about the relationship between age and tax compliance are similar in the studies carried out in
Malaysia and Indonesia by (Al-Mamun, Entebang, Mansor, & Yasser, 2014) and (Widianto, 2015)
respectively. In conclusion it can be stated that age has a statistically significantly positive
relationship with the variable tax evasion especially with reference to Pakistan.

122
Gender and Tax Evasion
There is a common belief that men and women have differing mindsets and attitudes and are also
different biologically and psychologically. Men and women are different and need to be dealt with
differently while taking policy decisions (NRSP, 2018). Same is the case in making financial
decisions. Women and men have proven out to be having different attitudes and behaviors while
taking financial decisions. The same has been a topic of interest in the existing literature. Women
have found out to be less risk taking than men when it comes to making financial decisions (Croson
& Gneezy, 2009). Similalry women have also been seen to be less likely to indulge themselves in
unethical behavior than men in business transactions (Betz, O'Connell, & Shepard, 1989).
Likewise all other economic decisions, women have proven to be less likely to evade and more
compliant in terms of tax payments. According to (Kastlunger, Dressler, Kirchler, Mittone, &
Voracek, 2010) women are more risk averse in terms of making evasion decisions than men due
to psychological and biological reasons. Moreover, the study also concluded that due to more
compliant nature of women, even the audit probabilities did not affect their tax payments attitudes
while tax payment pattern of men changed on the increased side after audits. Studies have also
confirmed that people respond favorabley to government strategies and actions regarding
economic choices that take into account the cultural and gender difference (Colemen & Freeman,
1997) and (Lin & Carrol, 2000). Due to difference in the tax evasion habits, there is a need for the
governments to make fiscal policies that are different for men and women due to their differing
compliance attitudes towards tax payments (Sour, 2009).
This difference in behavior and attitude towards tax evasion is not even culture specific. A research
carried out by (D’Attoma, Volintiru, & Steinmo, 2017) the attitude and behavioral difference
between genders regarding tax compliiance are the same irrespective of the country wherenin
women are thought to be more compliance and risk averse when it comes to tax compliance. The
study concluded that gender had a strong and significant relationship with tax compliance after
controling for institutional and cultural factors. Hence gender and tax compliance had been shown
to have a strong correlation given differing levels of legal and social gender equality.
It is evident form the survey results that proportion of the male population had comparatively more
share in the educational attainment in pakistan as compared to the proportion of females. As the
population included people who were employed and had attained atleast matric degree, and the

123
situation worsened as the education level increases.. Moreover, as per the cultural norms of the
society, women are discouraged to work outside their homes and their activities are mostly
confined with the boundries of their household (Malik, 2017). Therefore, the proportion of females
in the overall sample size was comparatively lower than the national statistics.
As gender is a categorical variable, it is not possible to check the correlation for such a variable,
therefore another test was used to determine the relationship between gender and tax evasion habits
of the respondents. Chi Square Test of independence had been used to find out the relationship.
As Chi Square test tells the significance and not the strenngth, therefore Cramers’ square has been
used to check the strength the relationship between the two variables. The results of the chi square
test are shown in the proceeding paragraphs.
Table 5-3 : Chi Square Test (Gender and Evasion Behavior)
Value df Asymptotic
Significance (2-sided)
Pearson Chi-Square 24.049a 5 .000
a. 2 cells (16.7%) have expected count less than 5. The minimum expected count is .28.
The chi square test statistics has calculated a value of 24.049 at 05 degrees of freedom. The
calculated chi square value of X2(calculated) in this case is 24.049. This value has an importance when
it is compared with the critical value for chi square. In our case the X2 (tabulated) at 5 degrees of
1freedom and p-value of 0.05 is 11.0705 that is much smaller than the calculated value or
X2(calculated). In this case we reject the null hypothesis that there is no relationship between the
variable gender and tax evasion. After calculating significance of relationship between gender and
tax evasion, the next step involved measuring the strength of the relationship between the two
variables. For that purpose Cramers’ Square is also calculated and tabulated as follows:
Table 5-4 : Cramer’s V (Gender VS Evasion Behavior)
Symmetric Measures
Value Approximate Significance
Nominal by Nominal Phi .258 .000
Cramer's V .258 .000

124
N of Valid Cases 357
The relationship is significant and is in line with the literature cited that states that women different
than males in terms of tax evasion habits (Kastlunger, Dressler, Kirchler, Mittone, & Voracek,
2010), however, the strength of rlationship between the variable does not seem to be strong as seen
from the table above. The value of V indicates that the strength of relationship between the variable
gender and response to the question ‘Making arrangements to minimize tax patable’ is not very
trong rather it is moderate.
The findings of the current study are in line with the findings of (Jeyapalan & Abdul-Jabbar, 2006)
that showed a relatively moderate relationship between gender and tax compliance attitudes of
respondents. The reason attributable to the peculiar result was same perceptions regarding the tax
system.
Income Level of Respondents
Income and tax compliance has been a matter of concern for researchers for very long. (Allingham
& Sandmo, 1972) who are considered pioneers in taxation had studied the relationship of income
on tax compliance that remained inconclusive in its conclusion of causal relationship. The main
aim of resistance to tax compliance is the fact that taxes reduce the amount of income of an
individual especially for low-income group. However, higher income group also suffers in
economies where there is progressive taxation (Hofmann, Voracek, Bock, & Kirchler, 2017).
Despite being part of interest to the research scholars, income and tax compliance literature has
produced mixed results.
For some, higher income leads to lower compliance (e.g; Chung & Trivedi, 2003). Out of many
reasons the most logical reasoning for this is that they have the money and they can easily utilize
the assistance of professional accountants to get ayay with high payments by exploiting loopholes
in the tax system (Luttmer & Singhal, Tax morale, 2014). Similarly, they have the power to collude
with corrupt officials who help them get away with paying less that the actual amount after
receiving money in the form of bribes (Alstadsæter, Johannesen, & Zucman, 2018).
For others higher income group is more risk averse as far as tax compliance is concerned as they
have to pay higher taxes and fear higher amount of penalties than low income group of people
(Ahmed & Braithwaite, 2004). This school of thought follows the concept of (Maslow, 1970) that

125
fulfilling basic needs is more important than paying taxes. However, there is another school of
thought that claim people whose income bracket falls in between the higher and lower income
group to be more prone to evasion than extreme. The reason attributed to such a peculiar hypothesis
is the fact that people try to remain at the higher edge of the lower income bracket in which it
actually falls (Slemrod J. , An empirical test for tax evasion, 1985). In order to check the
relationship between income and evasion, regression analysis was conducted results of which are
as follows:
Descriptive Statistics (Income Level of Respondents)
N Mean Median Mode Std Dev
Income Level 357 3.75 3.00 1 2.397
The descriptive statistics shows that out of a total of 357 observations as taken from the survey, a
mean of 3.75 was observed. This means that means the average income of the respondents
circulated between PkR 60,000 to 75,000 per month. Moreover, looking at the median, the figure
comes to 3.00 meaning that the median income range of the respondents was between PkR 55,000
to 65,000 per month. Moreover, a Mode of 1 shows that the largest number of respondents fell in
the income bracket of Rs. 45,000 and less.
In order to look for the validity of the data, when compared to the national statistics, Pakistan
Bureau of Statistics estimated the per capita annual income of Pakistanis to be US$ 1629 or PkR
170, 556. Dividing this figure with the number of months the monthly income reached out to be
PkR 14,213. This figure is obviously far beyond the survey average of around PkR 70,000. This
difference is not a valid one because of the fact that the per capita income per capita income of
around 197.3 million people48. This figure also includes around 6% unemployed people as
estimated by Pakistan Bureau of Statistics.
The survey also excludes more than 30% children population below the age of 18 years and also
the skilled type labor force and focuses only on employees of public, private, NGO and Education
sector of the country. Moreover, the survey also excluded some respondents whose income was
48 Estimated figure of 2017 by Pakistan Bureau of Statistics, Government of Pakistan

126
less that PkR 35000 as this figure did not come in the taxation limits as described by the
Government of Pakistan at the time of survey i.e; in the FY 2017 – 18. Therefore, the sample mean
differs from the national mean in terms of average income. Before proceeding further, its better to
have a view of the tax brackets on tax on salary. The salary brackets as proposed by the government
in the fiscal year 2017 (as per Finance Bill, 2017) are discussed below.
As per the statistics of the Bill, there are a total of 12 tax slabs for the salaried income of individuals
as in the fiscal year 2017. It is seen from the table that income below PkR 400000 is exempted
from taxation therefore people belonging to this income bracket were exempted from the survey.
Moreover, the highest income group that could be gathered in the survey fell in between PkR
105,000 and 115,000 therefore, the last salary group was taken as above 105,000 that fell in the 5th
tax slab of income that does not exceed PkR. 15,00,000 or PkR. 125,000 per month. This however,
remains a limitation of the research and further research can be carried out by ascertaining all
income group falling into all the tax slabs in order to have a more accurate picture of the situation
and causal relationship. Coming back to the relationship between the variable income and tax
evasion, the association between the two variables is appended below in the proceeding
paragraphs:
Table 5-5 : Chi Square Test (Income Level VS Evasion Behavior)
Chi-Square Tests
Value df
Asymptotic Significance
(2-sided)
Pearson Chi-Square 243.338a 28 .000
N of Valid Cases 357
a. 4 cells (10.0%) have expected count less than 5. The minimum expected count is 3.97.
As seen from the above figures, the chi square value X2(calculated) of 243.338 seems to be the largest
of all other demographic variables discussed so far. The association measure at df = 28 is far
beyond the X2(tabulated) 39.693 even in terms of ratio as compared to ther variables of demographic
characteristics. Hence, the results show that the association seems to be better between income
level of the respondent and their behavior towards tax evasion.

127
After finding the association between income level and Tax evasion attitudes and perceptions, the
next step involves calculating strength of their association to determine the impact of income level
of the tax evasion attitudes of individuals. In other words, to determine how much strongly income
level is associated with an individual’s behavior towards tax evasion, Cramer’s V has been
calculated the results of which are tabulated as follows:
Table 5-6 : Craver’s V (Income Level VS Evasion Behavior)
Symmetric Measures
Value Approximate Significance
Nominal by Nominal Phi .826 .000
Cramer's V .413 .000
N of Valid Cases 357
The results of Cramer’s V surther strengthens the claim that income level has a strong relationship
with behavior towards tax evasion. A figure of 0.413 indicates a very strong relationship and
association between the two variables. We therefore, reject the Null Hypothesis that Income tax
evasion and income level are independent of each other. Thus, we can say that income and tax
evasion behavior are strongly related to each other at 0.05 level of significance.
The findings are in compliance with the findings of (Hofmann, Voracek, Bock, & Kirchler, 2017)
who states that there is a relationship with tax compliance meaning that the relationship is positive
with tax evasion. Interestingly, the study claimed to have a negative association between the
variables, however, there was a slight slight difference that the quoted study shows a week
relationship between the two variables. However, the study clarifies the situation by stating that
the relationship between compliance behavior and income level of individuals is weak in the
southern hemisphere while the same relationship is stronger for countries in the northern
hemisphere. As Pakistan is also located in the northern hemisphere therefore, a comparatively
strongly relationship is found between income level and attitudes towards tax evasion as evident
from the study by (Hofmann, Voracek, Bock, & Kirchler, 2017).
The main reasons for this positive relationship between income and tax evasion is presented in the
literature. There are two main reasons for resistance to taxation by higher income groups. As in
case of pakistan whre the income tax is progressive in nature, higher income group resists when

128
people observe the entire burden of revenue generation by the government and fearing the issue of
‘Free-riders’ who enjoy the facilities based on taxes paid by them (Berens & Schiller, 2016).
Another reason why higher income groups have more opportunity to get away with the taxes is
through finding legal ways to avoid payments of taxes through the process of collussion with tax
officers or paying professional accountants to find loopholes in the tax system to avoid taxes
(Alstadsæter, Johannesen, & Zucman, 2018).
Exploiting such loopholes becomes easier in countries where corruption is high and collussion
with corrupt tax officials is easier for the taxpayers by giving bribes and in turn taking advantages
of the complexities in the system (Marjit, Seidel, & Thum, 2016). In case of pakistan, where
corruption is high and the tax system is complex, taking advantage of the complexities and
loopholes in the system is easier. The same is also highlighted in the results of the survey as the
highest correlation coefficient is observed between the variable Income and indicator of tax
evasion ‘Finding loopholes in the sustem to avoid tax payments’. Hence the situation conforms to
the findings of (Marjit, Seidel, & Thum, 2016) and (Alstadsæter, Johannesen, & Zucman, 2018)
that higher income individuals engage in tax evasion by exploiting loopholes in the system and
also try to legalize their acts to avoid fines and penalties (Luttmer & Singhal, Tax morale, 2014).
Educational Qualification of Respondents
Literature till date has not been able to clearly show the relationship bwtween education and
attitudes towards tax evasion. Different studies have concluded different results on the
relationship. Much literature has shed light on the effect of tax education on attitudes towards tax
compliance. For referrence see (Wong & Lo, 2015), (Olowookere & Fasina, 2013) and (Gitaru,
2017). However, literature has not been able to establish significnt relatiponship between formal
attainment of education and attitudes towards tax evasion.
A comprehensive study accumulating results of several studies by (McGee & Ross, Education
Level and Ethical Attitude Toward Tax Evasion : A Six - Country Study, 2014) concluded that the
relationship between educational attainment and attitudes towards tax evasion veried among
different regions and countries. For some countries the relationhip was positive while for some it
was negative and even some countries had no significant relationship. Literature has also taken
into account the positive relationshp between education related to economics and favourable
attidude towards tax system and compliance (Kołodziej, 2011).

129
The main reason for assumed positive relationship between education attainment and attitudes
towards tax evasion is the fact that in countries where tax systems are complex and difficult to
understand, education plays an important role to make taxpayers understand the complex
procedueres and even language to fill in the forms (Hofmann, Hoelz, & Kirchler, 2008). In case of
pakistan where tax system is indeed complex and the tax forms are not only difficult to fill in but
are also to be filled online, therefore, role of education has to be important.
As all respondents selected for the study were salaried employees who had incomes more than
35,000 and their education was at least matriculation, therefore, the sample size did not exactly
matched the actual population statistics of the country. However, the sample statistics are sufficient
enough to justify the objectives of the study as it only includes finding out the relationship between
educational qualification of the respondents and attitudes towards tax evasion. In order to find out
the relationship between the said variables,
The correlation coefficient shown in the above table indicate a negative correlation between
educational qualification attainment of the respondents and attitudes towards tax evasion as
indicated by three indicators of evasion. This means that as qualification increases, the attitude
towards tax evasion decreases. This is seen from all the three indicators. The correlation coefficient
of education with ‘finding loopholes in the taxsystem to minimize tax payable’ is -0.030 whch is
not only small but also negative. Similarly, the indicator ‘Not reporting income intentionally to
avoid tax payable’ and educational qualification has a negative coefficient of -0.010 which is again
a negative and a small number. The result of education with the mean value of all the three
indicators is also the same i.e; -0.006 which is negative and very small in value.
It is also interesting to note that all the indicators of tax evasion have an extremely insignificant
relatipnship. As seen in the table, the p-values are 0.919, 0.579,0.847 and 0.910 for all the
indicators representing attitudes towards tax evasion. This shows that the relationship has proven
to be highly insignificant. the results are consistant with the findings and recommendations of
(Gunathilaka, 2012), (McGee & Ross, 2014) and (Gitaru, 2017).
Till now, only two indicators and their relationship with educational attiainment have been
discussed. The third indicator ‘making arrangement in the paperwork so that tax payable can be
reduced’ has not been touched upon as it ha a positive – although insignificant relationship with
the variable educational attainment of the respondents. This may be attributable to the fact – as

130
touched upon by (Devo, 2005) – that increased knowledge may increase knowledge about the
fiscal system and people with higher education may use such tactics as legal ways in order to lower
their tax payable (Hofmann, Hoelz, & Kirchler, 2008). And as discussed earlier, this indicator in
question is the most indirect way of dealing with tax authorities, therefore, more educated
respondents might consider it a wise decision to save their money by using apparently legal means.
Although the correlation cofficient has proven the relationship to be insignificant, still in order to
strenghten out claim the regression coefficient has also been appended as follows:
Table 5-7 : Chi Square Test (Education VS Evasion Behavior)
Chi-Square Tests
Value df
Asymptotic Significance
(2-sided)
Pearson Chi-Square 4.953a 12 .960
N of Valid Cases 355
a. 0 cells (0.0%) have expected count less than 5. The minimum expected count is 6.32.
The results of chi square statistics clearly indicate the insignificant relationship bwtween
educational attainment and attitudes towars tax evasion. The X2[Tabulated] at 12 degrees of freedom
comes out to 21.026 which is far more than the X2[Calculated] of 4.953 which shows that shows that
there is no association between tax evasion attitudes and formal educational attainment of an
individual. Moreover, a high p-value of 0.960 clearly indicates that the relationship is highly
insignificant almost close to 1.0. Therefore, the null hypothesis ‘There is no relationship between
educational attainment and attitude towards tax evasion’ is accepted and the alternate hypothesis
in this regard is rejected.
The main reason attributable to such finding ma be the fact that it is not clear which aspect of
education is to be measured. There can be four measures of the relationship as presented in the
literature which include degree of tax knowledge, knowledge incolving evasion opportunities,
general intellectual level and knowledge specific to taxation (Devo, 2005). This claim is verified
by some studies carried out to find out the affect of fiscal and technical education on the variable
tax evasion attitudes. The results of the relationship in these studies have been found to be positive.
For referrence see (Palil, Akir, & Ahmad, The Perception of Tax Payers on Tax Knowledge and

131
Tax Education with Level of Tax Compliance: A Study the Influences of Religiosity , 2013) and
(NatrahSaad, 2014).
Tax Morale and Tax Evasion
Apart from the personal characteristics and native town, literature has identified other variables
that do have impact on the tax evasion behavior of individuals. A very important determinant of
tax evasion is the Tax morale. Previously the main focus of research remained on those who did
not pay their taxes rather than on those who voluntarily paid their due share of taxes (Slemrod J. ,
Why people pay taxes, tax compliance and enforcement, 1992). Despite several attempts by fiscal
psychologists it was established that internal factor did play a role in tax compliance behavior
however, there was no consensus about the nature of relationship (Vogel, 1974). It is therefore
important for the tax administrators trying to improve revenue collection to study people who
willingly pay taxes so that they are aware of the causes of tax compliance rather than tax evasion
(Kornhauser, 2007).
Tax morale has been described by (Kornhauser 2007) as a key to understand tax compliance
behavior that is difficult to understand because its influence on tax evasion behavior is not clearly
understood till now (Feld & Frey, Trust breeds trust: How taxpayers are treated, 2002).
Researchers have tried many options to understand the concept of understanding the concept of
tax morale or the internal motivation of comply with the tax laws by using different research
techniques including surveys and experiments, still there no concrete answer to their questions has
yet been obtained (Halkyard, Memon, Mookhey, & Salaheen, 2013). Higher the morale of the
individuals the lower will be tax evasion and vice versa (Brink & Porcano, 2016).
Origin and History of Tax Morale
The concept of tax morale is not new as it was there as a topic of interest by different authors doing
research in the field of tax compliance. The concept was developed by G¨unter Schmolders and
his associates during the 1960s and 1970s and was taken by psychologists and economics during
the era of 1990s while it gained actual attention with the start of the twenty first century
(Rodriguez-Justicia & Theilen, 2018). (Schmölders, 1959) first used the concept and made an
attempt to study the taxpayers’ attitudes towards tax liability. It was only in the year 1969 when
(Strümpel, 1969) introduced the word ‘Tax Mentality’ and described it as a person’s willingness
to pay taxes. Strümpel carried out a cross country survey and concluded that tax mentality or the
132
willingness to pay taxes was an outcome of their perception of how they were being treated by the
authorities.
Later on (Lewis, 1979) took the concept of tax mentality forward and after conducting a cross
country analysis found out that many factors including the national social setup, exchange factors
and certain demographic variables including age, gender, marital status, education were
responsible in shaping an individual’s willingness to pay the tax burden imposed upon them.
According to Lewis, there was no significant factor of tax mentality that fitted into all situation
except for one i.e; amount of tax payable. According to him, the higher the amount payable the
lower would be the willingness of a person to pay taxes. (Cox, 1984) using the IRS TCMP
(Taxpayers Compliance Measurement Program) could not establish a significant relationship
between tax rates and willingness to pay taxes. His conclusions were later on supported by
(Phillips, 2011) who argued that tax rates could not establish practically significant relationship
with the compliance attitudes as far as his findings were concerned.
It is pertinent to mention here that (Allingham & Sandmo,1972) model of Economics of Crimes
dominated the field of research for many years (Kirchler, 2007). The model assumed man to abe
a rational being who decided to evade or not based on his monetary benefits or due to fear of
penalties and punishments. Although this model was popular with economists, fiscal psychologists
made attempts to identify and remained convinced to the fact that there were internal and non-
monetary factors that shaped the tax compliance behavior of taxpayers (Slemrod, 1992). (Phillips,
2011) observed that certain people complied to the tax system even when they remained financially
worse off and concluded that tax compliance behavior was not only a result of rational approach
– as described by the Economics of Crimes approach but there were other factors that led to
positive compliance behavior by individuals.
The matter regarding how people shape their attitudes and corresponding behavior and how it
ultimately leads to decision making process regarding tax compliance has remained a focus of
research and a challenging area for researchers despite the fact that much literature is available on
the subject (McKerchar M. , 2001). It is interesting to note that tax morale was not a widely
discussed topic prior to 2000 that gained importance afterwards. It is estimated that since the year
2006, the topic hosts around 100 articles annually (Halla M. , The link between the intrinsic
motivation to pay and compliance behavior: A Critical Appraisal of Existing Evidence, 2010).

133
Torgler and Murphy in the year described tax morale as an intrinsic motivation of a person to pay
taxes (Torgler & Murphy, Tax morale in Australia: what shapes it and has it Changed Over Time?,
2004)). The study argued that tax morale did not have a concrete definition however it was
generally based on the values and principles individuals hold regarding tax burden.
Different authors have defined tax morale in a variety of ways. As described earlier, tax moral has
been described as an internal motivation to pay taxes (Alm & Torgler, Culture differences and tax
morale in the United States and in Europe, 2006). Choosing more than one question during the
course of study in order to measure this internal willingness increases validity and the reliability
of the variable (Torgler & Valev, Gender and Public Attitudes Toward Corruption and Tax
Evasion, 2010). According to (Russo, 2013). Tax morale is measured as a percentage a respondent
agrees to the statements like ‘Citizens should not cheat on their taxes’, ‘Cheating on taxes is
justifiable if there is an opportunity to do so’ and ‘Managing to avoid tax payments is legitimate’.
There are, however, other definitions that have been given in the literature. (Torgler, 2007) defined
three main factors to measure tax morale that included the social norms and religious motivation,
perceived fairness of the tax system and level of trust in government authorities. (McKerchar,
Bloomquist, & Pope, 2013) identified six indicarots of tax morale that included trust in government
institutions, perceived fairness, personal integrity, fear of third party reporting, perception
regarding others paying taxes in the neighbourhood and fear of audit. However, for the purpose of
this study, the term ‘Tax Morale’ has been defined and described according to (Nathan, 2014) that
describes tax morale as:
1. Concern about guilt and shame in non-payment of taxes
2. Concern about services being provided by the state
3. Concern about others paying their share of taxes
4. Perceived penalties and punishments on Tax evasion
Perceived Shame and Guilt
Shame refers to an emotion in which a person feels degraded baraced when his act of wrongdoing
is exposed whereas guilt is the feeling of repent one feels after one becomes of the wrongdoing for
which he or she think is responsible for (Markel, 2001 , p. 2179). Sentiments of guilt and shame
do change the tax compliance behavior of the individuals (Erard and Feinstein 1994). Whenever
an individual

134
3. evaluates his choice of tax evasion the factor of shame is considered while doing the cost and
benefit analysis (Kirchler, 2007) as shame and moral costs are positively correlated with the tax
compliance of an individual (Dulleck et all., 2016).
For the purpose of the study, two indicators for guilt and two for shame had been taken during the
course of survey. The indicators for shame included “do you fear that your name will be included
in the defaulters’ list by FBR” and “do you think someone else will report if you evade your share
of taxes” while those for guilt included “do you think others will have to pay for the amount that
you evade” and “do you think evading taxes is the Right thing to do”.
Indicators for Shame
Shame due to disclosure of information by the tax authorities has a deterrent effect on the tax
compliance behavior of individuals as people fear being notified as evaders in front of other
citizens of the country or people living in their vicinity (Cullis, Jones, & Savoia, 2012). However,
this element of shame remains there till the time people think that it has become a social norm after
which the shame effect due to disclosure starts to fade away from a society (Alm J. , 2012). The
shame effect due to disclosures remains for a shorter period of time till it becomes contagious and
other people of the society start accepting such acts of dishonesty as social norms (Blaufus, Bob,
Otto, & Wolf, 2016).
Although research has been carried out on the effect of shame due to public disclosures of tax
evaders, but it has provided mixed results. A study carried out in japan revealed that there was no
change in the tax compliance behavior of individuals after the abolition of public disclosure policy
by the government authorities (Hasegawa, Hoopes, Ishida, & Slemrod, 2013). Alternatively, a
study carried out using tax data of Norway concluded that there was a significant increase in the
tax compliance increased as a result of public disclosure on the internet by tax authorities (Bø,
Slemrod, & Thoresen, 2015). As a proxy for shame, the respondents were asked to give their
opinion regarding acceptability fear of their name being published in the defaulters’ list on the
Federal Board of Revenue website. The answer was required on a 6 point Likert scale with 5 as
highly acceptable and 1 being not-at-all acceptable while 0 was given to the option ‘Don’t Know’.

135
Response for Fear of being included in Defaulters list
Indicator Response Frequency Percentage
Fear of name bring included in
the defaulters’ list for Tax
evasion
5 56 16.9
4 73 22.1
3 94 28.4
2 48 14.5
1 54 16.3
Don’t know 06 1.8
Total 331 100
A majority of 39% respondents were on the acceptability side of the table while only 30.8% had
opinions discouraging the act. Most of the respondents making 28.4% or 94 out of the total sample
size selected option 3 meaning that they showed neutrality to the question. The same trend can
also be observed through the graphical representation of the collected data. The graphical
representation is appended below:
Figure 5-1 : Response of Fear of Being included in Defaulters List
The graph above shows the responses provided by the respondents against the question regarding
fear of being included in the defaulters list for tax evasion. The responses are on a scale 6 starting
from 5 till 0 with point 5 indicating ‘Strongly Agree’ and 1 indicating ‘Strongly Disagree’. And

136
Don’t know was given the 0 value. The graph shows that the majority of responses are bunched
on option 3 that states ‘Neutral’ hence indicating that most respondents remained neutral to the
fact that they had fear of their name being published in the defaulters’ list of FBR. The mean score
of 2.8 also proves the same. It is also pertinent to mention here that such practice of publishing
names of tax defaulters is uncommon in case of Pakistan as the FBR website only contains lists of
Active taxpayers. Therefore, the respondents did not care about the issues and the majority
responded as neutral to the question in the survey.
Table 5-8 : Chi Square Test (Fear of being listed VS Evasion Behavior)
Chi-Square Tests
Value df
Asymptotic Significance
(2-sided)
Pearson Chi-Square 145.504a 20 .000
N of Valid Cases 357
a. 5 cells (16.7%) have expected count less than 5. The minimum expected count is 2.15.
Coming to the relationship between fear of name being published in the defaulters’ list of the tax
authorities (DefLst) and indicators of tax evasion, the results of the survey observed a sizeable and
highly significant relationship between the two variables. As evident from the table, Chi square
X2[calculated] value of 145.504 at 20 degrees of freedom is much higher tahtn the X2[tabulated] value of
31.410 which is significant at 0.05 and even at 0.01 level of significance. So far, this element of
shame seems to be highly associated with the dependent variable as shown by the difference in
X2[calculated] and X2[calculated]. However, in order to chek and verify this claim of strength of
association, Cramer’s V is calculated the results of which is as follows:
Table 5-9 : Cramer’s V (Fear of being listed VS Evasion Behavior)
Symmetric Measures
Value Approximate Significance
Nominal by Nominal Phi .638 .000
Cramer's V .319 .000
N of Valid Cases 357

137
The value of 0.319 on Cramer’s V table asserts that the relationship between fear of being added
in the defaulters’ list is very highly associated with ones behavior towards tax evasion. This means
that as the fear of being termed as a defaulter by the tax authorities by putting name of a person on
FBR’s website or in newspaper had a direct effect on tax evasion attitudes of an individual. The
results clearly mean rejecting the null hypothesis that there is no relationship between ‘Fear of
name being entered in the defaulters’ list’ and the variable ‘Attitudes towards tax evasion’. It is
pertinent to note that the relationship between the two variables is shown to be negative in the
literature.
Likewise, the second indicator for shames as taken in the study consists of fear and acceptability
of someone reporting ones tax evasion behavior to the tax authorities. The affect of whistleblowing
– reporting of evasion by another person – has been cited to be a factor in increasing tax compliance
(Breuer, 2012). However, its affect has been observed to be comparatively small (Rettig, 2012)
and (Davis-Nozemack & Webber, 2012). In order to check the affect of whistleblowing on tax
compliance, a question was asked to the respondents regarding what and how they felt if someone
would provide information to the tax authorities about their tax evasion. The results of the question
are appended below:
Acceptance of being repoterd on Evasion
S No. Indicator Response Frequency Percentage
2.
Acceptablity of being reported
by someone to the authorities
on tax evasion
5 38 11.5
4 72 21.9
3 101 30.7
2 45 13.7
1 48 14.6
Don’t know 25 7.6
Total 329 100

138
It is evident from the table above that like the previous indicator of shame, the result of the present
indicator i.e; whistleblowing is almost exactly the same where out of 329 respondents, 202
respondents or 30.7% of the total response rate showed neutrality to the question. Similarly the
responses remained skewed in favor of the question asked. A mean score of 2.8 also proves that
the respondents were neutral to the second question as well. The same trend can be better
understood with the help of following graph:
Figure 5-2: Perception regarding being reported on evasion
This peculiar trend of neutrality can be attributable to the fact that respondents included in the
study are employees whose tax deduction is already subject to third party reporting and their taxes
are deducted at source (Kleven, Knudsen, Kreiner, Pedersen, & Saezi, 2011). The results are also
in conformity with a study carried out by (Amir, Lazar, & Levi, 2018) that claims that effect of
whistleblowing is more on sectors more prone to tax evasion due to self-reporting mechanism
rather than on sectors prone to third party reporting.
The results can also be attributable to the fact that people did not want to accept the factor of shame
(as determined by the responses of the two questions asked). People usually try to hide their actual
responses on such topics and give responses that are biased (Schneider F. a., 2003). It is also
pertinent to mention here that Pakistan has a very low tax to GDP ratio of just 12.4% of GDP while
the tax gap stands at 9.8% making a total of PkR 3.2 trillion (Hassan, 2018). This shows a high
culture of tax evasion in the country. Moreover, the findings are also in conformity with (John
Cullis, 2012)and (Alm, 2012) who state that individual behavior of tax compliance are shaped by
the social norms prevailing in the society. In order to investigate the issue further, the relationship
0
20
40
60
80
100
120
StronglyAgree
Agree Neutral Disagree StronglyDisagree
DEFLST
OTHREP
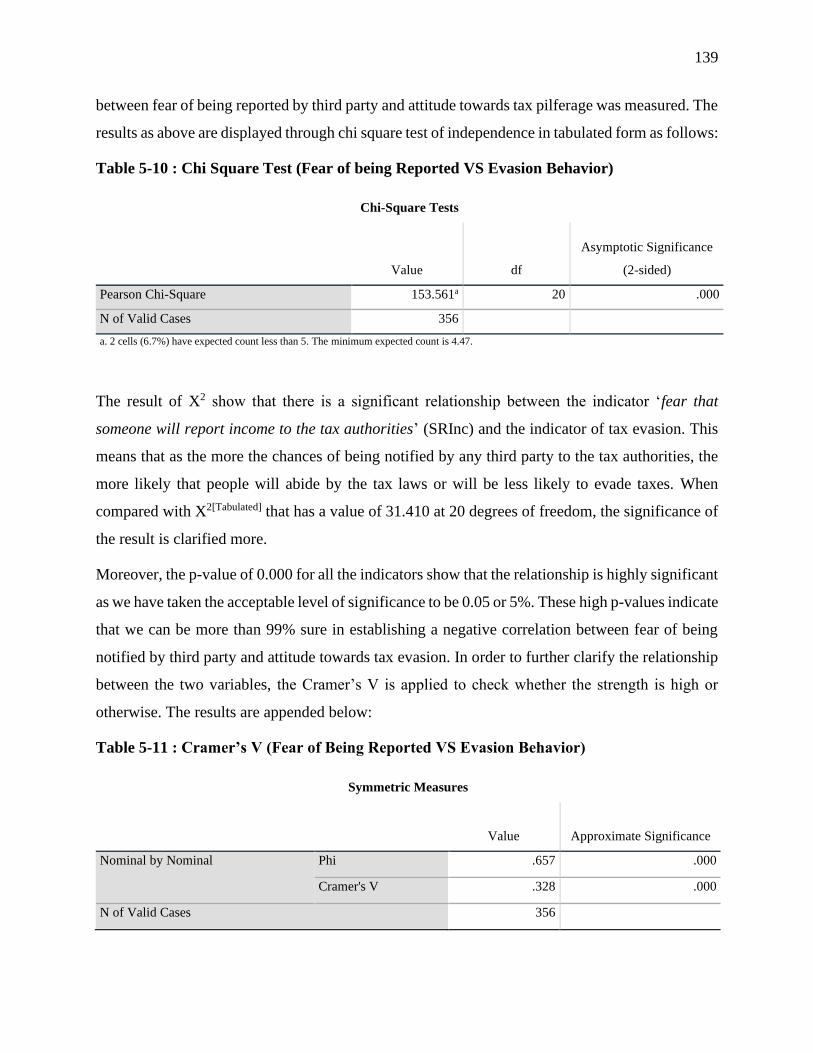
139
between fear of being reported by third party and attitude towards tax pilferage was measured. The
results as above are displayed through chi square test of independence in tabulated form as follows:
Table 5-10 : Chi Square Test (Fear of being Reported VS Evasion Behavior)
Chi-Square Tests
Value df
Asymptotic Significance
(2-sided)
Pearson Chi-Square 153.561a 20 .000
N of Valid Cases 356
a. 2 cells (6.7%) have expected count less than 5. The minimum expected count is 4.47.
The result of X2 show that there is a significant relationship between the indicator ‘fear that
someone will report income to the tax authorities’ (SRInc) and the indicator of tax evasion. This
means that as the more the chances of being notified by any third party to the tax authorities, the
more likely that people will abide by the tax laws or will be less likely to evade taxes. When
compared with X2[Tabulated] that has a value of 31.410 at 20 degrees of freedom, the significance of
the result is clarified more.
Moreover, the p-value of 0.000 for all the indicators show that the relationship is highly significant
as we have taken the acceptable level of significance to be 0.05 or 5%. These high p-values indicate
that we can be more than 99% sure in establishing a negative correlation between fear of being
notified by third party and attitude towards tax evasion. In order to further clarify the relationship
between the two variables, the Cramer’s V is applied to check whether the strength is high or
otherwise. The results are appended below:
Table 5-11 : Cramer’s V (Fear of Being Reported VS Evasion Behavior)
Symmetric Measures
Value Approximate Significance
Nominal by Nominal Phi .657 .000
Cramer's V .328 .000
N of Valid Cases 356

140
As with the first indicator of shame, the Cramer’s V value of 0.328 signifies a highly significant
and highly associated relationship between the two variables hence rejecting the null hypothesis
that ‘There is no relationship between fear of being reported by third person on tax evasion’ and
‘attitudes towards tax evasion’ while establishing a highly significant negative relationship
between the two variables.
The findings are consistent with those of (Coricelli, Joffily, Montmarquette, & Villeval, 2010) and
(Maciejovsky, Schwarzenberger, & Kirchler, 2011) who have claimed that shaming has an impact
on the tax compliance behavior of individuals. These studies have proven through experiments
that when in group, people avoid being labelled as cheaters or tax evaders and therefore, prefer to
comply with social norms (like tax compliance) so that they are saved from being labelled as tax
evaders in front of their group mates. A person in a group will try to refrain from evading and will
follow the social norms till the time he is aware that others in the group are also evading taxes or
till the time he or she is stigmatized for long period i.e; the evader is not given a chance to modify
himself and is labelled a cheater forever (Coricelli, Rusconi, & Villeval, 2014).
Indicators for Guilt
The other variable of ‘Guilt’ was also measured with the help of two indicators namely; is it
acceptable that others pay your share of taxes if you evade them? and is it a morally right thing
to evade taxes? The responses to the two questions are appended in Table. According to the figures
an absolute majority of respondents fall in the disagreement range of the scale. According to the
figures, a total of 24.7% strongly disagreed while another 23.2% disagreed to the statement that it
was acceptable to transfer their burden of tax to others by the way of evading taxes. The percentage
of respondents falls as the table moves from disagreement towards the agreement side. This is
evident from the fact that only 7.6% strongly agreed to the statement. Although the mean of 2.4
falls somewhat near to the neutral side, still it shows an inclination towards the disagreement side
of the table.
The second and somewhat a more direct indicator for guilt had a stronger trend towards the
disagreement side. Almost half of the respondents making almost 48% of the respondents strongly
disagreed to the statement of whether it was the right thing to evade taxes while another 30.6%
fairly disagreed to the statement. Only around 20% of the respondents were on the rest three points
on the likert scale. A stronger skewness is shown by the mean of 1.8, hence rejecting the statement

141
altogether. Responses to both indicators of guilt in terms of frequency and percentage in total
sample size alongwith graphical representation of responses is appended below:
Response on Indicators of Guilt
Indicator 1
Indicator Response Frequency Percentage Mean
Acceptance for someone
else bearing the burden of
tax evasion on your part?
5 81 24.7
2.4
4 76 23.2
3 62 18.9
2 48 14.6
1 36 11.0
Don’t know 25 7.6
Total 328 100
Indicator 2
Indicator Response Frequency Percentage Mean
Perception regarding tax
compliance as doing the
right thing
5 13 3.6
1.8
4 16 4.2
3 49 13.8
2 109 30.5
1 169 47.6
Total 334 100

142
Figure 5-3 : Graphical Representation of Responses on Guilt
The graph also shows a decreasing trend as we move towards acceptability side on both the
indicators namely attitude towards others paying the burden (OTHRPY) and is it the right thing to
evade taxes (RGHTHG). The result is in consistence with a study carried out by (Baumeister,
Stillwell, & Heatherton, 1994) that states that when people believe that their actions will over
burden others or when they think that the actions would be looked down upon by others, people
try to alter their behavior that will be in line with what they think is accepted by others (p. 247).
Moreover, literature also suggests that religion also has an impact on the tax evasion behavior of
individuals (Murtuza & Ghazanfar, 1998) and (McGee, The Ethics of Tax Evasion and Trade
Protectionism from an Islamic Perspective, 1997) have established a relationship between the
ethics of tax evasion and Islam and have claimed that Islam teaches to be law abiding citizens and
follow rule of the land. However, according to (Bank, Mcgee, & Yüzbaşı, 2015) Muslims are to
strictly abide by the tax laws when the state is following the Shariah Law. In case of Pakistan, the
constitution states that Pakistan is an Islamic Republic and all laws will be made in the light of
Shariah, therefore, following tax laws in Pakistan is the responsibility of every citizen of the
country. The relationship between the indicators of guilt and those of tax pilferage is again shown
with the help of chi square and its strength through Cramer’s V.
0
20
40
60
80
100
120
140
160
180
Strongly Agree Agree Neutral Disagree StronglyDisagree
Guilt OTHRPY
Guilt RGHTHG

143
Table 5-12 : Chi Square Test (Perceived Guilt VS Evasion Behavior)
Chi-Square Tests
Value df
Asymptotic Significance
(2-sided)
Pearson Chi-Square 26.242a 20 .158
N of Valid Cases 355
a. 14 cells (46.7%) have expected count less than 5. The minimum expected count is 3.10.
The first indicator of guilt mentioned here is the feeling of burden being transferred to other
taxpayers if one does not pay the tax (OTHRPY). As seen above, chi Square value X2 [Calculated] for
the variable with behavior regarding tax evasion is less than the X2 [Tabulated] value at 20 degrees of
freedom which is 31.410 at 0.05 level of significance which means the relationship between the
two is negative. The figures of p-value is also very high at 0.158 as compared to the acceptable
level of significance of 0.05. Therefore it is concluded that the relationship between the variable
‘others will have to pay if one evades tax’ and ‘attitude towards tax evasion’ is highly insignificant
at 0.05 or even at 0.10 level of significance.
Likewise the relationship between the second element or indicator of guilt i.e; ‘belief in doing the
right thing’ and attitudes towards tax evasion was also checked through the same tests of
correlation and regression and found to be equally insignificant. The results again showed negative
but highly insignificant relationship between all the indicators of tax evasion and the second
element of shame. The results are appended below:
Table 5-13 : Chi Square Test (responsibility towards Others VS Evasion Behavior)
Chi-Square Tests
Value df
Asymptotic Significance
(2-sided)
Pearson Chi-Square 14.749a 8 .064
N of Valid Cases 356
a. 3 cells (20.0%) have expected count less than 5. The minimum expected count is 3.65.

144
Again the issue of expected count less than 5 arose in the data. Therefore, the data was managed
in such a way that the categories were reduced from five to three which two categories of
agreement and disagreement side were merged together. According to the estimates, a total of 356
valid observations were received. The X2[calculated] value of 14.749 was observed. The X2[Tabulated]
value at eight degrees of freedom comes to 15.507 that is higher than the X2[calculated] value at 0.05
level of significance. Moreover, the p-value of 0.064 is higher than the level of significance. In
this case the null hypothesis ‘there is no significant relationship between Guilt and attitude
towards tax evasion in Pakistan’ proves accepted and the alternate hypothesis is rejected.
Hence we are sure with 95% confidence that there is no relationship between tax evasion and guilt
in case of Pakistan. The results are in conformity with the findings of (Coricelli, Joffily,
Montmarquette, & Villeval, 2010) who stated that guilt did not have any effect on the tax evasion
behavior while underreporting incomes. As guilt is an internal feeling and there needs to be
motivation to comply with the norms by an external source (government or social setting) (Farrar,
Hausserman, & Dunn, 2018).
Trust in Government
Trust is the expectation that other person’s behavior will not affect the interests of oneself
negatively (Paxton and Smith, 2008). Trust in this research refers to the response of individual’s
tax evasion behavior to the perception of services being provided by the state. Trust in government
has a direct link with compliance behaviors of the citizens including their decisions to comply with
tax regulations (Levi & Stoker, 2000). If taxpayers have trust in the government and they perceive
the government to be working in their interest, they will go for tax compliance even if evasion has
been a better option for them (Levi, 1998). According to (Alm & Togler, 2004) there is a positive
relationship between trust in government and the parliament and the tax compliance behavior of
the individuals. This means that cheating government especially through tax evasion is found to
be less justifiable in countries where level of trust in government is higher and vice versa. The
research includes two variables of trust in government that include:
1. Public Service Delivery
Public Service is defined by (Duguit, 1923) as “Every activity of general interest which is of such
an importance to the entire collectivity that those in authority are under a duty to insure its
accomplishment in an absolutely continuous manner, even by the use of force” (p. 431). According

145
to Duguit, public service initially included safety from external enemies by the state but as societies
developed the concept of public service included other things like economy and other services like
postal, police and utilities etc. Public services include services being provided by a not-for-profit
entity – usually the Government (Besleya & Malcomson, 2018) and these services include – but
are not confined to – health and education that are given at less cost than those provided by for-
profit entities.
According to Besleya & Malcomson the aim of provision of these services is the welfare of its
consumers who are the citizens of any state as the consumers do not have to pay for these services
directly. Although these public services are for the welfare of the citizens and are not priced
directly, still such services come with a price and that is taxation. Therefore, citizens are very
sensitive about the provision of these public services. The literature has established a significant
relationship between level of public service delivery and its effect on tax revenue generation by
the government in that area. According to (Kasim, Umar, Martin, & Yassin, 2018) the level of
public service delivery has a significantly positive effect on the tax revenue generation. As the
level of public service delivery diminishes, so is the tax revenue generation. In order to make the
task easy for the respondents and the researcher, the respondents were directly asked whether they
were satisfied with the public services being provided by the government. An indirect question
had also been asked to the respondents in the start of the questionnaire stating for what purpose
the tax money was being used by the government.
2 Corruption
According to Tanzi “Corruption is the intentional non-compliance with the arm’s-length principle
aimed at deriving some advantage for oneself or for related individuals from this behavior” (Tanzi,
1995). The World Bank49 defined corruption as “the abuse of public power for private benefits”.
Similarly Transparency International50 views corruption as “misuse of entrusted power for private
gain. It hurts everyone who depends on the integrity of people in a position of authority”. It is
evident from these definitions that there are certain elements that distinguish corruption from other
forms of illegal activities.
49 V. Bhargava, [2006], “Curing the Cancer of Corruption”, p.1, Available online at:
http://siteresources.worldbank.org/EXTABOUTUS/Resources/Ch18.pdf 50 http://www.transparency.org/whatwedo?gclid=CI34t8yS4LICFaTJtAodRS0A2g

146
According to (Morris, 2011) corruption has many types that have been differentiated on the basis
of level of the actor involved in corruption, nature of transaction and motives of the transaction. In
the level of actor involved, corruption is divided into higher level corruption – by the politicians;
and lower level corruption – by the bureaucrats. The second differentiation made on the basis of
nature of transaction involves division in types of corruption based on mutual agreement between
both parties and extortion. The third type through which corruption can be segregated is the
motives. This distinction involves whether corrupt activity is being carried to execute an illegal
task or just to help a lawful task to be completed in time and ofr the betterment of a needy person.
Apart from all the types discussed corruption has some elements that distinguish it from other
types of crimes. (Hodgson & Jiang, 2007) has distinguished corruption from other types of abuses
and socially unacceptable activities that constitute crime. First of all, gaining financial advantage
through misappropriating funds from the organizational budget is although a crime but is not
corruption. This is due to the fact that it involves a crime known as ‘theft’. Moreover, ‘extortion’
that using official powers to get some sort of monetary benefit by force is a crime and is abuse of
office to gain monetary benefit but is not included in corruption.
Similarly, as is evident from the definition given by World Bank, corruption is the use of public
power. This means that corruption involves using public office for personal financial gains. The
definition excludes private sector and confines its focus entirely on the public sector. The essence
of this definition is in line with the opinion of Garry Becker a renowned Noble Laureate – who
claimed “if we abolish the state, we abolish corruption”. Therefore, the current study takes into
account as corruption as an abuse of public office for personal financial gains. When compared
with tax, corruption includes getting away with the tax money by public officials and politicians.
Corruption is a factor related to tax non-compliance as evident from the literature. Tax evasion has
been termed as a form of corruption (Akdede, 2006). According to (Levin & Widell, 2007) tax
non-compliance has topped the list of corrupt practices especially in the third world nations with
countires in the Middle East having the issue of reduced tax revenue collection as a result of high
levels of corruptions in those countries (Imam & Jacobs, 2014). Tax revenues may also decline
as a result of higher tax revenues in the presence of corruption prevailing in the society s. (Sanyal,
Gang, and Omkar 2000). There has been a significantly positive relationship between corruption
and tax evasion Gupta, 2008. Bribery is a form of corruption whereby corrupt officials encourage

147
the taxpayers go away by evading their share of tax by paying bribes to these tax officials
(Joulfaian 2009). Therefore it can be attributed that the higher the corruption levels, the lower will
be the tax morale as corruption has a negative impact on tax morale and compliance behavior of
the taxpayers.
Lack of Trust in government
For the purpose of measuring trust in government, two indicators have been taken first being
satisfaction with the services being provided by the government. The question asked in this
regarding states do you think taxes paid are being utilized for providing adequate services by the
government to its citizens? Second indicator to measure trust included asking respondents
regarding their perception of corruption. The question asked was to what extent do you think your
tax money is being used to fill pockets of politicians and officials? The responses are presented in
the following table:
Relation between Service delivery and Evasion
Indicator Response Frequency Percentage Mean
Evasion is related to Poor
Service Delivery
Strongly agree 8 2.5
4.12
Agree 24 7.1
Neutral 34 10.5
Disagree 105 32.4
Strongly Disagree 153 46.9
Don’t know 2 0.6
TOTAL 324 100
The above table shows an increasing trend while moving towards disagreement to the statement.
Almost half of the sample size of 46.9% strongly disagreed to the statement that their tax money
was being utilized for the public services being provided by the government. The mean of 4.12
rejects the statement about provision of public services by the government. After interpreting the

148
frequencies let us look at the relationship of the perception about utilization of tax money with
attitude towards tax evasion.
Table 5-14 : Chi Square Test (Perceived Service Delivery VS Evasion Behavior)
Chi-Square Tests
Value df
Asymptotic Significance
(2-sided)
Pearson Chi-Square 25.210a 8 .001
N of Valid Cases 345
a. 1 cells (6.7%) have expected count less than 5. The minimum expected count is 4.96.
Before proceding further, it is pertinent to note that the chi square value X2 between perception
regarding the use of tax money and dependent variable was giving a warning of more than 37%
cells having an expected value of less than 5. Therefore, the scale of the independent variable was
reduced to three by combining the two ends of the responses. In this was the responses Strongly
Agree and Fairly Agree were merged together into Agree while Strongly Disagree and Fairly
Agree responses were converted into Disagree. The resulting chi square test is shown as above.
The test statistic shows the X2[Calculated] value of 25.210 at 08 degrees of freedom which when
seen of the table gives X2[Tabulated] value of 15.507 at 0.05 level of significance. At first the
relationship seems to be significant. However, the strength speaks otherwise.
Table 5-15 : Cramer’s V (Peerceived Service Delivery VS Evasion Behavior)
Symmetric Measures
Value Approximate Significance
Nominal by Nominal Phi .191 .001
Cramer's V .175 .001
N of Valid Cases 345
The result of Cramer’s V shows a value of 0.175 meaning that the strength of association is week.
The relationship, therefore, does not seem to be strong enough as seen from the Cramer’s V values.

149
Coming to the significance side, the p-value indicates that the relationship is significant at 0.05
level of significance. This means that although we reject the null hypothesis that ‘there is no
relationship between perception about utilization of tax money by the government and attitudes
towards tax evasion in Pakistan’ and we can conclude that although lower in strength but still the
alternate hypothesis stating an association between the two variables holds true and is accepted.
The findings are in line with the fact that when there is a large possibility of politicians and public
servants eating away public money for their own vested interests, there is less left to spend on
public services that results in the inclination of citizens more towards tax evasion (Litinaa &
Palivos, 2015).
The second indicator has produced the same results. An absolute majority of 62.6% strongly
agreed to the statement while around a quarter agreed but to a lesser extent. The mean of 1.5 shows
that the response pattern is skewed towards agreement side hence the response trend accepts the
statement. The frequencies are appended below in the following table:
Perception Regarding Relatonship of Corruption with Evasion
Indicator Response Frequency Percentage Mean
Perception regarding
Relationship of
Corruption with Evasion
Strongly agree 214 60.8
1.5
Agree 87 24.7
Neutral 26 7.4
Disagree 11 3.1
Strongly Disagree 14 4.0
TOTAL 352 100
In Pakistan corruption is on the rise. According to Transparency International, Pakistan ranked
117 in Corruption Perception Index with the index of 32 in two consecutive years of 2016 and
2017. The corruption in Pakistan is so much that the sitting Prime Minister of the country was
charged with corruption and removed from office in 2017 after accusations being proven on him
and his close allies. This led to an increased perception about corruption in minds of the citizens
that decreased the level of trust for the government in the minds of the masses. Moreover there has

150
been an increasing gap in the government and citizens of the country as far as public service
delivery is concerned. According to a report published by Pakistan Poverty Alleviation Fund
(PPAF) in 2017, there is much gap between the requirement and provision of public services in
the country especially to the poor population away from the main cities (Naveed, 2017).
Table 5-16 : Chi Square Test (Perceived Corruption VS Evasion Behavior)
Chi-Square Tests
Value df
Asymptotic Significance
(2-sided)
Pearson Chi-Square 15.093a 8 .057
N of Valid Cases 352
a. 3 cells (20.0%) have expected count less than 5. The minimum expected count is 3.63.
Before proceding with the interpretation of the table, it is pertinent to note that the five categories
of perceived corruption have been shrunk to three for the sake of calculation otherwise the result
of Chi Square was showing a higher number of expected counts less than 5. The X2[Calculated] value
of 15.093 at 08 degrees of freedom is comparatively less as compared to the X2[Tabulated] value of
15.507 at 0.05 level of significance. Moreover, a p-value of 0.57 is higher than the significance
level. Hence the hypothesis ‘there is no significant relationship between perception about level of
corruption and attitudes towards tax evasion in Pakistan’ is rejected at 0.05 level of significance.
Perception about others paying taxes
Social norms and culture have an impact on the tax evasion habits of its citizens (Cullis, Joanes &
Slovioa, 2012). Individuals comply with the rules when they are aware that compliance is a social
norm (Alm, 2012). When a person observes unethical behavior in his or her vicinity, ones
perception about the social norms regarding honesty and ethics change (Gino, Ayal and Arely,
2009). Literature shows that the taxpayers conditionally comply with the rules (eg; tax rules) till
the time others in the society are doing the same (Fray & Torgler, 2007 and Traxler, 2010).
Therefore, perception about the tax compliance behavior in the social circle has a direct impact on
the tax compliance behavior of an individual. In order to measure the impact of perception about
others paying their share of taxes on tax evasion, the question asked included ‘in your opinion, do
you think other people in your neighborhood are paying taxes honestly?’

151
Perceived Social Norm and Evasion
Indicator Response Frequency Percentage Mean
Perception about increase
in evasion when others in
your neighborhood are
evading their taxes
Strongly Agree 45 13.6
2.7
Agree 87 26.4
Neutral 99 30.0
Disagree 36 10.9
Strongly Disagree 47 14.2
Don’t Know 16 4.8
TOTAL 330 100
In order to understand the responses better, the same can be depicted in graphical form as under:
Figure 5-4: Response Chart for Social Norm and Rax Evasion
As evident from the above graph, most respondents are in the neutral to fairly agree region of the
scale. According to the statistics, 30% of the respondents remained neutral to the statement while
26.4% fairly agreed to the statement. The mean score of 2.7 also indicates the same region of
acceptability of the statement. Hence the statement is not strongly supported by the survey.
Similarly the relationship of the variable with tax evasion is also measured through chi square test
which are as follows:
0
20
40
60
80
100
120
Strongly Agree Agree Neutral Disagree Strongly Disagree
Response

152
Table 5-17 : Chi Square Test (Perceived Social Norms VS Evasion Behavior)
Chi-Square Tests
Value df
Asymptotic Significance
(2-sided)
Pearson Chi-Square 244.438a 20 .000
N of Valid Cases 357
a. 3 cells (10.0%) have expected count less than 5. The minimum expected count is 4.13.
The results show a highly significant association for relationship between tax evasion and
perception about others in the vicinity paying their due share of taxes (PrOth). THe value of
X2[Calculated] is much higher than X2[Tabulated] which is only 31.410 at 20 degree of freedom at 0.05
level of significance. This situation is in conformity to the literature cited for shame where people
act in a certain way as it is a social norm (Coricelli, Rusconi, & Villeval, 2014). Moreover, it is
also observed from the table above that the p-values of 0.000 for all the relationships mean that
the relationship is highly significant at 0.05 level of significance.
Table 5-18 : Cramer’s V (Perceived Social Norms VS Evasion Behavior)
Symmetric Measures
Value Approximate Significance
Nominal by Nominal Phi .827 .000
Cramer's V .414 .000
N of Valid Cases 357
Similarly the Cramer’s V value indicated that the relationship between perception about others
paying taxes and attitude towards tax evasion is very strong. This figure of 0.414 is the highest of
all the other variables used in this research dissertation so far. Hence it can be concluded with 95%
level of confidence that the alternate hypothesis ‘there is a significant relationship between
perception regarding other people evading taxes and attitudes towards tax evasion in Pakistan’
and the relationship is found out to be positive.

153
Penalties on of Tax Evasion
Penalties and fines have shown to have a significant impact on tax compliance behaviors.
However, large fine on tax evasion has shown to be more detrimental for tax compliance as
compared to large probability of being caught (Christiansen, 1980) and (Nourzad., 1986). However
a study by (Obid, 2004) concluded that audit probability and penalties have significant effect on
the tax compliance behavior of individuals till the time effective tools are used by the government.
Although penalties and probability of being caught help shape compliance behavior of individuals,
these effects vary based on demographic factors like gender, age and even occupational status of
the taxpayer (Devos, 2008).
Rate of penalties also have an effect on the tax evasion behavior of individuals. a study carried out
by (Artemenk, L.A.Aguzarova, F.S.Aguzarova, & Porollo, 2017) concluded that penalty, if not
imposed and regulated effectively, may lead to the loss or revenue to the state. This is specially
the case for large corporation who have very high taxes on their revenue. However, a situation
where penalties on evasion are not very high motivates big taxpayers to evade the taxes by paying
penalties and hence saving the money earned for future investments. The negative effects of
penalties on tax compliance increases when there are collaborations between the people transacting
with each other i.e; the buyers and the sellers or –in case of salaries – the employers and the
employees (Abraham, 2016).
Penalties are basically the ‘monetary costs’ of tax evasion which should not only be imposed
efficiently keeping in view the societal norms and the level of taxpayers, but also in conjuncture
with other monetary and non-monetary steps including punishments, imprisonments and even
psychological measures aimed at reducing tax evasion habits among the taxpaying (Thomas,
2015). The present survey also checked the impact of perceived penalties on tax evasion behavior
of individuals.
The response indicates that the majority of individuals agreed to the statement that penalties were
adequately enough on tax evaders. A total of 102 respondents making 30.5% agreed while 19.8%
strongly agreed to the statement making a total of almost 50% or half of the sample size on the
agreement side of the table. Disagreement was only 22.2% of the total response rate while 24%
remained neutral. The mean figure of 2.5 shows an inclination towards disagreement (although not
strongly agreeing) side. The results are tabulated as follows:

154
Level of Perceived Penaltiess on Evasion
Indicator Response Frequency Percentage Mean
Perception regarding
Level of Penalties on
Tax Evaion in Pakistan
Strongly Agree 66 19.8
2.52
Agree 102 30.5
Neutral 80 24.0
Disagree 37 11.1
Strongly Disagree 37 11.1
Don’t Know 12 3.6
TOTAL 334 100
According to Section 183 of the Income Tax Ordinance, 200151 penalty for income tax default is
5% in first default, additional twenty percent in the second, additional twenty five percent in the
third and fifty percent in the fourth time on the amount of tax evaded. However, the penalty cannot
go above 100% of the total amount. This situation when compared to the neighboring India is a bit
change as the penalty for non- payment of taxes can lead upto 300% of the tax evaded52. In USA,
the IRS fines upto 25% on tax evaded per month. Having viewed the penalty situation of the two
countries, the comparison shows that the penalty on tax evasion in Pakistan is high but not to that
extent. Coincidently, the results of the survey prove the same as most respondents were on the
agreement side of the scale while not going for strong agreement.
Table 5-19 : Chi Square Test (Perveiced Penalties VS Evasion Behavior)
Chi-Square Tests
Value df
Asymptotic Significance
(2-sided)
Pearson Chi-Square 116.703a 20 .000
N of Valid Cases 350
51 Income Tax Ordinance 2001 amended by Finance Bill 2013 52 Section 261(c) of Income Tax Act of India

155
a. 5 cells (16.7%) have expected count less than 5. The minimum expected count is 1.85.
Again the X2[Calculated] for the relationship between perceived level of penalties on tax evasion and
resulting attitude towards tax evasion shows some interesting results. As seen, the X2[Calculated] value
comes out to be 116.703 at 20 degrees of freedom. Looking at the Chi Square Table taking level
of significance to be 0.05 the X2[Tabulated] value comes out to be 31.410 which is far less than the
X2[Calculated] value. It can therefore be incurred that as the perception regarding level of penalties
increases, tax evasion behavior tends to diminish. Now moving towards the strength of
relationship, the results are as follows:
Table 5-20 : Cramer’s V (Perceived Penalties VS Evasion Behavior)
Symmetric Measures
Value Approximate Significance
Nominal by Nominal Phi .577 .000
Cramer's V .289 .000
N of Valid Cases 350
The result of Cramer’s V suggests that the strength of the two variables is moderate in nature. This
moderate association is in line with the literature on psychology of tax evasion that people usually
respond less to level on penalties rather than other variables (Musa, Saad, & Ibrahim, 2016). THe
results overall suggest rejecting of the null hypothesis that ‘there is no relationship between
perception about level of penalties and attitudes towards tax evasion in Pakistan’. The alternate
hypothesis in this case is accepted meaning there is a significant relationship between perception
about level of penalties on tax evasion and resulting attitudes towards tax evasion.
The findings of the study suggest and strengthen the findings of (Devos, 2008) and (Thomas, 2015)
who state that although penalties and audit of being caught are determinants to fight the menace
of tax evasion, still there are other variables that can contribute to tax evasion and these variables
include – but are not limited to – age, gender, occupational status of the taxpayer and psychological
variables. According to the behavioral science literature as mentioned above, certain demographic
variables have far more impact on attitudes towards making tax evasion decisions than external
issues like penalties, fines and probability of being audited (Thomas, 2015).

156
Summary of Key Findings
0.05 level of significance
Variable X2 P-Value Cramer’s
V
Nature of
Association
Perceived Social Norms 244.43 0.001 0.414 High
Income Level 243.338 0.000 0.413 High
Age 105.682 0.001 0.258 Moderate
Gender 24.049 0.000 0.247 Moderate
Shame Fear of Being Reported 153.561 0.000 0.328 Moderate
Fear of being in defaulters’ List 145.504 0.000 0.319 Moderate
Perceived Penalties 116.703 0.000 0.289 Moderate
Trust in
Government
Perceived Service Delivery 25.210 0.001 0.175 Low
Perceived Corruption 15.093 0.107 - Insignificant
Education Level 4.953 0.960 - Insignificant
Guilt Belief in doing Right 26.242 0.158 - Insignificant
Concern about others 14.479 0.094 Insignificant

157
CONSEQUENCES OF EVASION ON POLITICAL ECONOMY
Political Economy
The term political economy is derived from the Greek polis, meaning “city” or “state,”
and oikonomos, meaning “one who manages a household or estate.” Political economy thus can
be understood as the study of how a country—the public’s household—is managed or governed,
taking into account both political and economic factors.”53 The term political economics was
pioneered by Adam Smith in his famous book the wealth of Nations in the year 1776 he termed
the concept of economics as political economics. According to (Groenewegen, 1987) the term
actually originated in France by Montchrétien (1575 - 1621) in the seventeenth century while Sir
James Steurt (1761) was the first English economist who used the term in his book titled ‘An
Inquiry in to the Principles of Political Economics ’. Political Economics is basically a study that
involves rational decision making keeping in mind the political and economic factors (Alt &
Shepsle, 1990).
As obvious from the definition of Alt & Shaple, political economy is a combination of two terms,
politics and economics, therefore there is a need to first define and explain both terms before
proceeding further. Politics is termed in the political science literature as study of authority and
power. According to Uphoff & Ilchman politics is the exercise of authority over a group of people
which may be in the form of control over economic resources, legitimacy, information, status and
power to exert force to form an organized group (Uphoff & Ilchman, 1997). People in authority
need these resources in desired amount in order to sustain the operations of the polity (intra-state
activities) and to sustain their authority which they get either from the public or generate from the
state directly (Uphoff N. , 1989). The authority can also be shared to some extent with the members
of public or by making decisions desired by them as a result of demands created so that there is a
political exchange to keep the process running (Emerson, 1976). As a result of the decisions made
53 Britanica Online : https://www.britannica.com/topic/political-economy

158
by person in authority and which are in the benefit of the public, the public provides resources that
enable the government and the regime to run and function properly (Miliban, 1968).
Authority gives a particular person power to influence his decisions as authority establishes certain
roles and relationships that allow a person to enforce power either through economic incentives or
physical or moral force over other people (Uphoff & Ilchman, 1997). The roles thus established as
a result of attainment of authority are either through consent of the parties or coerced and they
establish what Easton calls political division of labor where one party is authorized to exert
authority and the others (the public) is bound to abide by those roles (Oppenheum, 1978). However
authority ceases to exist at the very instance when a person is no longer qualified or cannot have
claim over the resources or to enforce decisions.
Authority is valid till the time authority with a specific person is recognized by others or he or she
fulfils certain qualifications as laid down in the polity (Uphoff, 1989, p. 312). Power and Authority
are two different things. Power is the ability of an individual or a group of people to achieve their
desires objectives (Henderson, 2012) whereas authority is the direct or tacit approval of a group of
people by permitting an individual to take decisions for them in a specifically defined area
(Lindblom, 1977). Lindblom has described politics as a struggle for authority where people are
making efforts to gain authority over the others. He termed politics as an ‘untidy process’ where
some people are in an effort to gain authority over others in a society while there are others who
try to gain control of those who hold authority. Politics can be considered as a study of finding
mechanism to make collective choices whereas authority can be thought of a particular type of
mechanism that can be used to make collective decisions (Keohane, 1984).
If power of a person cannot be exercised in relation to another person as a result of his wealth or
any other resource he obtains but cannot claim authority, then the first person has no authority and
in this case the first person will have to exercise any power other than authority to keep the affairs
running (Uphoff N. , 1989). Power is a term in politics that was first described by Max Waber as
a social relationship where one actor is in a position to exercise his will despite resistance within
that social setup (Waber, 1947). However, later literature did not produce a substantial distinction
between power and authority. Authors have used power and authority interchangeably and no
distinction has been made so far. Concluding the two elements of politics, politics is the exercise
of power and authority to fulfil certain objectives by people in command over those subject to their

159
authority. Politics in short is the division of political labor where one group is given power and
authority over another group to run the system of a society.
Economics on the other hand is the efficient utilization of scarce resources to fulfil unlimited
wants. Adam Smith who is considered as the father of economics defined Economics as ‘Science
of Wealth’ in his famous book “An Inquiry into the Nature and Causes of Wealth of Nations” which
was published in 1776. Jean - Baptiste Say also defined Economics as a science that dealt with
wealth (Say, 1803). Previously, economics was not a separate subject rather it was studied in
conjuncture with other concepts like philisiohy or politics. Political Economics at that time meant
the study of conditions where production was organized in states of the capitaliast system
(Khumalo, 2012).
Alfred Marshall in the year 1890 criticized the definition of economics as proposed by Adam Smith
by saying that the definition was too narrow and was focused on creation of wealth hence teaching
selfishness. Marshall came up with his own definition of economics. According to Marshall,
Economics studied both the individual and social actions that were aimed at promoting wel being
of the individuals (Marshall, 1890). According to (Robbins, 1932), ‘‘Economics is the science
which studies human behavior as a relationship between ends and scarce means that have
alternative uses.’’ (p. 15). According to Robbins, the end were wants that were unending and
unlimited whereas means were the resources that are always limited. According to him, Economics
is the satisfaction of unlimited wants with limited available resources.
If we look at derivation of the word from Greek language meaning oikonomos which means
management, the definition clearly means that economics means management of scare resources
and unlimited wants. Similarly Robbins also talked about making choices. As resources are
limited, therefore – according to Robbins – people make choices and choose the option that best
fulfils their wants. Paul Anthony Sameulson came up with another definition in his book
“Economics – An Introductory Analysis” in the year 1948. Sameulson took the features of previous
definitions as it took in to consideration the scarcity of resources and their management while he
also took in to account the best use of those resources so that those scarce resources could be used
for present as well as for future consumption. Sameulson’s definition focused not only on
production but also on consumption and was both growth and future oriented in nature (Sameulson,
1948).

160
According to Khumalo, Sameulson’s definition included utilizing scarce resource of the society to
produce valuable output and distribute them among different people. The separation between
economics and politics occurred and economics became a specialized subject competing other
sciences and included mathematics as mathematics was thought to be the basis of any science
(Heilbroner, 1980) Later on in 1995, Lypsey and Chrystal came up with a concept of modern
economics and defined Economics as an allocation of resources among different alternatives and
distribution among different individuals (Lipsey & Chrystal, 1995). Lipsey basically talked about
the way allocation and distribution of a society’s resources change over time that can change due
to change in the mode of production or can be a result of changes in social system (Khumalo,
2012).
Economy is the study that deals with the distribution of goods and services in a society such that
the concept of welfare is maintained (Nelson, 2008). However, some economics also considered
knowledge as part of economic development. Thorstein Veblen termed knowledge an important
determinant of economic development as – according to Veblem – material lost could be replaced
with the right knowledge but technology was nothing without sufficient knowledge to use it
(McCormick, 2006). Veblem was of the view that economy was always knowledge-based and
human survival was not possible without knowledge (Veblen, 1915). The argument was taken
further by Dale Neef who defined knowledge economy as a recent concept and added that
knowledge was a prime resource (Neef, 1998). However, this knowledge-based economy has
existed since the existence of manking (as proposed by Veblem) and is not a new phenomenon
(Khumalo, 2012).
Political Economy has been another name for Economics. As evident from the literature the term
Economics was previously used by Economists like Adam Smith, John Stewart Mill and
Sameulson among others. According to Paul Adler, “Political economy refers to the combined
and interacting effects of economic and political structures or processes, and by extension, to the
scholarly study of this domain” (Adler, 2009). Accoridng to Adler, as the market mechanism
strengthened in the 19th century in the capitalst world, the role of government reduced to public
economics (taxes and expenditures policies) for the purpose of social welfare. One of the main
aspects of public economics –as explained by Adler – includes how tax efficiency affects the
service delivery of the government (Black, Calitz, & Steenkamp, 2015). Therefore, the later part
of this chapter would include the effects of tax evasion mainly on the service delivery in Pakistan.

161
“Taxes are the Sinews of the State”. This quote was stated by a Roman Statesman, orator,
Philosopher and lawyer, Marcus Tullius Cicero who remained part fo the Roman Council in the
year 63 BC. Cicero was of the view that taxes played crucial role in the Roman Empire and that
the state could not flex its muscles till the time they abstract revenue from the private sector (Winer,
Profeta, & Hettich, 2013). Although Cicero referred to taxing the private sector as an instrument
of taxation, modern literature suggests other instruments which include a variety of direct and
indirect taxes. According to Winer et, al. taxation is mostly an economic issue as it enables th
government to collect resources, however, choice of instrument of taxation is a political issue and
that is why taxation has both political as well as economic implication. These political and
economic repercussions viz-a-viz poor tax collection as a result of tax evasion will be discussed in
detail in the coming paragraphs.
Consequences of Tax Evasion on Political Economy
Tax evasion has shown to be having a significant impact on the economic growth of a country. As
tax evasion in an economy increases, the economic growth decreases (Chen, 2003). Moreover, tax
evasion also have an impact on the provision of public goods and capital accumulation in the
economy. When there is tax evasion in an economy, capital accumulation will increase in the hands
of entrepreneurs and hence that capital accumulation would lead to economic growth as
entrepreneurs will have more money to invest (Cerqueti & Coppier, 2009). However, on the other
hand – as described by (Cerqueti & Coppier), tax evasion would lead to less tax revenue available
with the government which will not be sufficient for the government to provide better public goods.
This will again lead to lower level of economic growth.
Public service has many definitions and includes many things however, the most important public
services include health, education sector and policing (Spicker, 2009). However in case of Pakistan
these services are not being provided upto required standards. Pakistan ranked 164th out of 195
countries in terms of health and education standards (Lim, et al., 2018). This speaks loads about
the situation of these sectors in the country. budget figures also have an alarming situation. A
country where more than 40% of the total budget is utilized for debt servicing and 18 to 20% are
spent on defence, a mare 5% is allocated to health and education. This istuation speaks volumes
regarding the level of public services being provided to a population of more than 190 million

162
people. However, spending more than 40% on debt servicing leave the country with no other
option but to save from these areas.
Literature has also discussed about the role of monitoring level in increasing economic growth that
can be affected by tax evasion. Monitoring level is an important instrument used in literature for
economic growth. This is because as monitoring level will increase, all those dishonest individuals
who evaded taxes would have a greater probably of being caught (Cerqueti & Coppier, 2009). This
higher probability of being caught will increase tax revenues and in turn this will increase
economic growth of a country. If any individual is caught evading he or she has to be penalized.
Penalties play an important role in this regards as shown by literature. Provision of public goods
will be the result of revenue collected that is again a function of taxes collected plus fines imposed
on evasion (Blackburn, Bose, & Haque, 2006). Care needs to be taken on imposing penalties.
Research has shown that if penalties are imposed proportionately to the amount evaded, there will
be a reduction in private capital accumulation and increased economic growth, however, if
penalties are imposed at flat rates then increased tax rate would encourage more evasion and the
result will be negative for revenue collection (Caball´e & Panad´es, 2007).
Another issue faced by low revenue collection is lack of financing the Public Sector Enterprises
or the PSEs that are run by the government and fed through taxpayers’ money (Dalu T. , Maposa,
Pabwaungana, & Dalu, 2012). According to Asian Development Bank, the Public Sector
Enterprises contributed to 400,000 jobs in the country and are week in terms of revenue generation
to the state (ADB, 2017). It is therefore, according to an estimate that the loss incurred by PSEs in
Pakistan amounted to PkR. 1.068 trillion as of FY 2018 (Dawn, 2018). This situation worsens in
a country where only 2% of the total population pays taxes (Memon, 2018) while – according to
the Economic Survey of Pakistan 2018 - having a Tax-to-GDP ratio of 12.4% and fiscal deficit of
6.8% in the FY 2018. Under these circumstances, the country has to go to external agencies for
loans on strict conditions. According to the budget analysis of the country available at the Ministry
of Finance website, the last five years analysis shows that more than 40% of the total expenditure
carried out by the Federal Government is in debt servicing. The situation is evident from the fact
that only in 2017, the Pakistani government signed an agreement with Asian Development Bank
for a loan of US$ 300 million to support PSEs (ADB, 2017).

163
The other impact as pointed out by Dalu et, al. was inflation. According to them, tax evasion leads
to accumulation of wealth that causes a large amount of cash into the hands of entrepreneurs. As
a result, there is a large amount of cash available in the market that is chasing fewer number of
goods. This phenomenon falls into the definition of inflation where too large money is chasing too
few goods. As discussed in the previous sections of the study, people comply with taxes mostly
due to the fear of penalties n taxes evaded. This is evident from the fact that the relationship
between tax evasion and fear of penalties on tax evasion was significantly negative. Tax evasion
that creates inflation has an added advantage. Tax evasion being done at a time t is audited at a
later time. Hence future value of evaded money sometimes lower than the penalties imposed after
the audit is carried out, therefore, people find it beneficial to evade and keep the fines being
imposed at a later time (Caball´e & Panade's, 2004).
The case of Pakistan is not different as inflation and tax evasion have shown to have a significant
relationship with each other. A study carried out by Khan et, al. took a time span from 1972 to
2006 and concluded that tax revenue was one of the main factors significantly effecting inflation
in the country with lower tax collection leading to higher inflation (Khan., Ahmed, & Hyder,
2007). Another study by took the same time period and revealed the same results. According to
the study, money supply that is indirectly related to tax evasion as shown by (Cerqueti & Coppier,
2009) was a significant indicator of inflation in pakistan (Khan & Gill, 2010). Similarly, Bashir et,
al also presented the same results and suggested that taxation is an important determinant of
inflation in the long run (Bashir, et al., 2011). The study took a time series analysis 38 years and
concluded that tax collection was significantly related to inflation in pakistan.
Supply of money has also been thought of as a major deteminant of inflation in an economy.
According to the quantity theory of money presented by (Fisher, 2006), quantity of money in an
economy is directly responsible for inflation. Fisher argues that as quantity of money increases,
the price level increases which increases inflation. Keeping all other factors constant doubling the
quantity of money in an economy would double the inflation (Bashir, Yousaf, & Aslam, 2016).
Whenever tax evaion is on the rise, companies and individuals have more money at their disposal
from which they declare more profits and dividents (Macharia, 2014). This factor leads to
increased quantity of money in the hands of individuals and hence due to increased quantity of
money inflation in the ceonomy increases (p. 36).

164
Public Debt has a negative relationship with economic growth. Tax evasion reduces government
revenue and is a main source of fiscal deficit that further leads to increase in government debt in
order to finance the deficit (Pappa, Sajedi, & Vella, 2015). Government debt is a bured on
economies large and small and all economies including USA, European and other developing
nations face the issue of fiscal deficit which ultimately leads them to go for debt (Marakbi &
Villieu, 2018). Accoridng to the budget analysis for the last five years, Pakistan’s budget deficit
in the FY 2017 – 18 stood at PkR. 2.3 Trillion that was increased to 3.444 trillion in the FY 2018-
19. 54 In order to finance these deficits, the government has to take loans through both internal and
external borrowing. An estimated 40% of the total expenditure of the Federal government as
evident from the budget statemsnets is paid as debt servicing by the government. Now comparing
it with the tax gap of 3.3 trillion, this deficit can easily be catered for if tax evasioin is controlled.
Accoridng to IMF Report 55 the total tax evasion in pakistan was estimated to be PkR. 3.3 trillion.
Hence, PkR 3.3 Trillion was being circulated in the economy and was not being transferred to the
government wich has a double effect. First of all, as stated by Macharia, the quantity of money
increased to PkR. 3.3 Trillion as a result of money being saved from taxes and kept with the
investors themselves. This money that could have been used for provision of goods and services
was washed away. Secondly, the money does not goes to the government institution who are
responsible to provide public services. Hence the quality of goods and services provided by public
sector remain poor and this calls for political issues.
54 Economic Survey of Pakistan 2019 55 Selected Issue Paper issued with Ninth IMF Review Report in 2016

165
CONCLUSION AND POLICY IMPLICATIONS
Conclusion
From the discussion in the preceding chapters it is clear that not all variables taken in the study
prove to be having significant relationship with tax evasion. A total of three objectives had been
served during the course of action that included ‘to determine the effect of demographic variables
on tax evasion attitudes of the respondents’, ‘to determine the impact of ethnic location of the tax
evasion attitudes of the respondents’ and ‘to determine the impact of tax moral on the tax evasion
attitudes of the individuals’. The demographics variables included the age, gender, income level,
educational qualification and employment sector of the respondents. Similarly the tax moral
included variables of shame and guilt, trust in government, perceived level of penalties and
perception about other citizens paying their taxes. However, the last objective ‘ethnic location of
respondents’ was divided into the four provinces, Gilgit-Baltistan and Kashmir regions. Further
Punjab and Sindh were divided into three and two sub-divisions respectively.
In the first objective, the variable Age had a highly significant and positive relationship with
attitudes towards Tax evasion. This means that elder people were more prone to tax evasion than
youngsters. The regression coefficient of the relationship was 23%. Similarly, the variable Income
level also had a significant and positive relationship with tax evasion attitudes of the respondents.
An increase in income level resulted in an increase in the attitudes towards tax evasion. The R-
Squared value of the relationship amounted to 47% the highest in the demographics section.
However, the variables Gender, Educational Qualifications and Employment Status has
insignificant relationships with the dependent variable attitudes towards tax evasion.
In the Tax morale section where four independent variables had been measured against the
dependent variable. In this section Guilt and Shame had been further divided into two indicators
each. The indicators of Shame had a significant relationship with attitudes towards tax evasion.
Moreover, both indicators had a negative relationship with the dependent variable meaning as
shame affect deceased, their responses regarding attitude towards tax evasion increased. The
regression for both the variables of shame is calculated to be 29% and 30%. Similarly, out of the

166
two indicators of Trust in Government, the indicator ‘Perception about utilization of tax money by
the government’ had a significant and negative relationship with attitudes towards tax evasion.
Despite a significant relationship, the Regression coefficient was very low i.e; around 2 – 3%.
Perception about others paying taxes in the County had the strongest relationship with tax evasion
attitudes of the respondents calculated in the survey. Both the correlations and the regression of
the relation was the highest proving it to be the most influencing factor in determining the tax
evasion attitudes in Pakistan. The sign of relationship is positive indicating that as the perception
regarding others in the country evading their share of tax payments increases, the tax evasion
attitudes also increases and vice versa. The significance level p-value < 0.05 shows significant
relationship. The regression of 0.45 shows that 45% variance caused in the dependent variable is
due to the independent variable perception about others evading taxes. The relationship is
significant at 0.05 level of significance.
Although perception about fines and penalties on tax evasion had a significant relationship with
respondents’ attitudes towards tax evasion, the strength as shown by the Correlation coefficient
were very law. Similarly the regression of only 4% proved a low variance being caused in the
dependent variable by the independent variable. The finding was in line with the existing literature
that suggests intrinsic variables to be more responsible to bring change in the dependent variable
that extrinsic variables. The variables including elements of guilt and perception regarding
corruption remained insignificant contributors of attitudes towards tax evasion in the present study.
Combining the results of all the variables it can be concluded that Income level contributed the
most in producing variance in the dependent variable i.e; Tax evasion which are followed by the
variable perception about other citizens evading taxes. These variables were followed by ‘elements
of shame and Age as moderate contributors of variance in the dependent variable. However, the
independent variables Perception about utilization of taxes and perceived level of penalties on
evasion were also the contributors but their contribution in causing variance in the dependent
variable was very low.
As regards the impact of tax evasion on political economy is concerned, political economy is much
influenced by poor tax collection. First of all, political economy that is taken as a merger of
political and economic activities of a country was a term used by Economists at the time of Adam
Smith to define Economics. However, later on it came to be known as economics. Therefore most

167
of the discussion in the study focused on the economic impacts of tax evasion on Pakistani society.
Tax evasion effects the economic growth of the country. First of all lack of tax collection have an
impact on public service delivery that also had political repercussions as people especially in
developing nations like Pakistan are mostly dependent on government for the provision of basic
services like health and education but due to lack of tax collection the government is not left with
enough finances to allocate for these issues. Secondly, the government has to finance Public Sector
Enterprises (PSEs) that run on government expenses and are a burden on government. However,
due to lack of finances available with the government, the government is unable to finance them
by itself and has to reach for loans. Moreover, inflation is another aspect of tax evasion that leads
to more income in to the hands of private sector. This evaded money ultimately leads to too much
money into the hand of public chasing too fewer things hence leading to price hike. Last issue
related to tax evasion is public debt that is borrowed by the government on strict conditions when
the government is not able to generate its own finances. Then a case comes where the government
spends more than 40% of its total budget in servicing of these loans.
Policy Implications
Policy implication are an important aspect of any research as these implications not only help in
interpreting the meaning of and results of the research but also enables the researcher to explain
how these results can help in the future research and how the results can be put into practice
(NCFR, 2019). As seen from the previous section that a total of five variables had been seen as
significant contributors of tax evasion attitudes of the individuals. Therefore, all the policy
implication should be focused on addressing those variables.
Income and Tax Evasion
Starting from the first variable that includes the income level of the respondents and its relationship
with attitude towards tax compliance. Although literature has suggested mixed results regarding
the income level and tax compliance. However, (Alm & Torgler, 2006) and (Chung & Trivedi,
2006) have asserted that there is a negative relationship between the two variables hence
supporting the results of this survey. However scholars who have supported the hypothesis of a
positive relationship have suggested that the reason for this relationship is the fact that higher
income individuals have more opportunity to use loopholes in the system [insert citation]. It is due

168
to this reason that the correlation coefficient for the variables income level and manipulating
income and expenses was the highest as compared to other indicators of tax evasion.
The highest correlation with the dependent variable was for income level. According to the results
of the survey carried out, the correlation was 46% between the variables while the regression was
around more than 25%. The reason attributable to this peculiar trend where most literature states
otherwise can be many. One reason can be that income tax on salaries in Pakistan is progressive
in nature. As discussed before, there are a total of 12 salary tax brackets. However, in each salary
bracket there is a marginal increase in tax liability as with each increase in rupee, there is a slight
increase in tax payable. As opposed to notches where the entire amount is taxed on going to a
higher tax bracket which (Klevin & MAzhar, 2012) claimed as notches, there are kinks in which
only that portion is taxes higher that falls into the higher tax bracket (Mortenson & Whitten, 2016).
Another issue highlighted in the literature is the fact that the relationship between the two variables
is such that increased income leads to avoidance as people with higher incomes have access to
more professionals who can then play for them and find out loopholes in the system hence cheating
the tax authorities but in a legal way. It is therefore, the most significant indicator of tax evasion
with income was with finding loopholes in the system that is more closely related to tax avoidance
than tax evasion.
Another plausible reason that can be attributable to this positive relationship between the variables
is that penalties and fines on tax evasion in Pakistan might be less (Akram, Ilyas & Alam, 2017).
The underlying assumption is the fact that when income tax becomes higher than penalties on tax
evasion, people are more happy paying penalties rather than paying higher taxes. However, the
relationship cannot be ascertained for sure because literature has not found any significant
relationship between penalties and tax evasion [e.g see (Oladipupo & Obaze, 2016)]. There is
another factor that plays a vital role in establishing an indirect relationship between tax evasion
and income level of the individuals. that variable is corruption.
A study by (Alm, Martinez-Vazquez, & McClellan, Corruption and Firm Tax Evasion, 2014) has
identified a relationship between corruption and tax evasion. according to the study although both
concepts are not different as one involves using of public office for personal financial gains while
the other calls for saving tax payable by using illegal means. However – according to (Alm et al.,
2014) corruption leads officials to seek more income through bribes. These bribes also help people

169
who evade taxes to bribe the corrupt officers by enabling them to find ways to overstate
expenditures or understate their incomes. Coming back to the positive relationship of the two
variables is due to the reason that higher income people have more money available to pay rather
than those who have less.
Therefore, the relationship between tax evasion and income is positive. Corruption acts as an
intervening variable in the relationship. This argument is supported by the fact that Pakistan ranks
very high in corruption as far as international standards are concerned. According to Transparency
International’s Corruption Perception Index, Pakistan ranks 117 out of 180 countries as far as
corruption is concerned. On the other hand, tax evasion in Pakistan is also on the higher side in the
country. According to the World Bank56, Pakistan has the second lowest tax collection in Asia
after Afghanistan. The county lags behind many Asian economies including India, Malaysia and
others. It is also interesting to note that the TI’s CPI also indicates the same trend hence
establishing a relationship between corruption and tax evasion. This relationship is a separate topic
beyond the scope of this study and requires further investigation in the field of research.
It is therefore imperative for the government of Pakistan to curb corruption in the tax
administration so that tax evasion can also be halted. Tax administration needs to be made
corruption free as corrupt tax administration not only helps taxpayers to evade taxes but the corrupt
officials also misappropriate funds that could have gone to the government (Wane, 2000).
Similarly an honest tax administration helps in strict enforcement of laws while also enabling the
government to design mechanism that will enable the government to make reforms necessary to
reduce tax evasion and enhance tax collection (Alm, Martinez-Vazquez, & McClellan, Corruption
and Firm Tax Evasion, 2014).
Perception about others evading in the economy
The second variable that needs to be addressed is the perception regarding other taxpayers evading
in the country. According to (Jimenez & Iyer, 2016) social norms help shape compliance behavior
of an individual. Individuals respond to things they perceive are the norm of the society in which
they reside. An individual’s acts positively to those acts he perceives are the norms being followed
by his family, friends and even relatives. When perceived evasion in a country is very high it
56 Payment of Taxes - World Bank, 2018

170
becomes a social norm and is socially and economically undesirable as people start following the
social norms and hence evasion becomes widespread (Doerrenberg & Peichl, 2018). One of the
methods that can be used in changing unbecoming social norms in the society is educating the
masses about the issue (Sunstein, 1996).
(Suryadi, 2006) identified some indicators that can increase taxpayers’ awareness which include
building a positive perception in the minds of people regarding tax obligation, improving
taxpayers’ knowledge about tax regulations and tax socializing. The first two aspects of improving
awareness can be done through imparting tax education. According to (Harris, 1989) there are two
forms of imparting education to the taxpayers thought formal education and the other through
guidance and media help. (Fallen, 1996) has also claimed that educating taxpayers about the tax
system is essential in shaping their attitudes and behavior towards the tax payments. According
to (Sommerfeld, 1966) tax education is very much necessary for tax compliance. He termed
taxation as education’s orphan and stressed upon the need that there should be more focus on tax
education rather than practicing tax compliance for tax compliance to be higher.
Under the Universal Self-Assessment system, taxpayers in Pakistan are required to submit their
income tax returns under the provisions of the Article 120 (1) (2) of the Income Tax Ordinance,
2001 while the Commissioner is authorized to audit the selected returns on random basis as per
the provisions of Article 177 of the Ordinance. Under such Self-Assessment schemes, taxpayers
knowledge and taxpayers education plays an important role as taxpayers can carefully access their
tax liability and are capable enough to file their returns on time (Palil, Akir, & Ahmad, The
Perception of Tax Payers on Tax Knowledge and Tax Education with Level of Tax Compliance:
A Study the Influences of Religiosity, 2013). Education and tax knowledge also enables the
taxpayers to be able to have basic information regarding taxable income, deductible expenses,
entitlements, reliefs, rebates and exemptions etc (Fatt & Khin, 2011)
Tax knowledge is necessary to ensure the voluntary compliance by taxpayers (Kasippilai, 2000).
The need for tax knowledge increases for determining accurate liability especially in case of self-
assessment system (Palil M. R., 2005). A study carried out by (Kasipillai, Aripin, & Amran, 2003)
suggested that students who had undergone tax related courses in the universities had a positive
attitude towards tax compliance than those who did not get any course. The same had been
suggested by many other studies that have empirically confirmed a highly significant relationship

171
between tax knowledge and compliance especially in Asian Pacific region (Loo, McKerchar, &
Hansford, 2009) and (Kirchler, Niemirowski, & Wearing, Shared subjective views, intent to
cooperate and tax compliance: Similarities between Australian taxpayers and tax officers, 2006).
A recent study carried out in New Zealand concluded that lack of tax knowledge coupled with tax
complexity was a major hindrance in the voluntary tax compliance in the country (Saad, 2014).
Tax education enhances the tax awareness that can be explained as a condition where the taxpayers
are able to understand and calculate their tax liability and also increases the tax morality. Morality
refers to a situation where people feel that it is the responsibility of every citizen of a country to
pay their share of taxes as these taxes are needed by the government to perform different
expenditures (Siahaan, 1996). Higher levels in morality in this regard leads the people to abide by
the tax laws which in turn leads the government to keep the wheel of economic activity rolling
(Nurmantu, 2010). Tax education is especially important in a system where self-assessment is
carried out by the taxpayers as statistics have shown that introduction of self-assessments without
tax knowledge has proven to increase the number of defaulters. According to an estimate, the
number of tax defaulters increased to 10 times in Malaysia in 2005 within a span of just 2 years
after the introduction of self-assessment system in the country (Palil, Akir, & Ahmad, The
Perception of Tax Payers on Tax Knowledge and Tax Education with Level of Tax Compliance:
A Study the Influences of Religiosity, 2013).
Another way, as described by (Suryadi, 2006) to enhance awareness is through Tax socialization
which is the way of providing information to the taxpayers through different means by the tax
authorities one of which include the use of media (Savitria & Musfialdy, 2016). Literature has
shown a significant impact of media on the tax compliance and filing attitudes of the individuals.
Taxpayers comply with the tax laws when they perceive it to be in their favor rather than being
coerced to do so for the interest of the state (Kirchler, Hoelzl, & Wahl, Enforced versus voluntary
tax compliance: The‘‘slippery slope’’ framework, 2008). A study carried out by (Kastlunger,
Lozza, Kirchler, & Schabmann, 2013) found that enforced compliance led to increased tax evasion
in Italy. Therefore there is a need for the governments to be focused on persuading individuals to
pay their taxes rather than being coercive (Prinz, Muehlbacher, & Kirchler, 2014).
Use of media can have a significant impact on the compliance behavior of taxpayers provided that
the medium of choice used to circulate information has targeted the correct segment of individuals

172
keeping in view the age and wealth status of the viewers (Saeed & Shah, 2011). There has been
much literature citing the significant and positive impact of use of media on the tax compliance
behavior of individuals. Studies carried out by (Povoledo, 2011), (Eurofound, 2013), (Castro &
Scartascini, Tax compliance and enforcement in the Pampas: Evidence from a field experiment,
2013) and (Pomeranz, 2015) among many others have shown the impact of use of media to
disseminate information regarding incentives of paying taxes and the penalties and punishments
on non-payment on increased compliance in different countries including Estonia, Italy, Chile and
many other countries.
The use of medium of information dissemination also affects the success of information provided
by the authorities. A study carried out by Ortega and Scartascini (2015) concluded that the
response was different on dissemination of tax related information via letters, emails and personal
visits to the tax authority reps in Colombia. Similarly, Koumpias (2016) proved the differences in
responses to payment deadlines on telephone calls and e-mails made by the Treasury department
of Greece in the year 2013. Literature has also shown that the use of impersonal methods like
robotic phone calls (Ramirez, 2005; Shaw et al., 2012) and other methods like emails (Stollwerk,
2006) have little or no affect as compared to personal contacts with the tax authorities through
phone calls and personal visits.
Like all other countries of the world, literature has also made an attempt to find out the impact of
media on the tax compliance behavior of Pakistani taxpayers. A study carried out by (Cyan,
Koumpias, & Martinez-Vazquez, 2016) concluded that people who were exposed to media
campaigns on TV and Newspaper became more compliant than those who did not receive any
media input. Although no attempt was made to draw a comparison between people who were
exposed to media coverage though TV and newspaper, the results showed that people who were
exposed to newspaper ads had a more significant attitude towards tax compliance than those who
were exposed to TV. The research, therefore concluded that not only exposure to media but also
the type of media used did have a significant impact in shaping behavior of the individuals in case
of Pakistan.
Another study carried out by (Koumpias & Martinez-Vazquez, 2019) concluded with the same
results as above that TV ads and newspapers ads did have a significant impact on the tax filing
attitudes of individuals. Moreover, the same results were observed that people exposed to ads on

173
newspaper had more significant impact than those who watched adds on TV. The study also
suggested that people who had read newspapers were comparatively more educated and wealthy
than those who had access to TV ads. The study went a step further and stated that persuasion was
only valid till the time it also included process of filing the return that enabled the taxpayers to
easily fill in the forms. The paper also concluded that moral persuasion to pay taxes when coupled
with enforcement provides stronger results in terms of higher rates of compliance. The findings
are consistent with those of (Hallsworth M. , List, Metcalfe, & Vlaev, 2017) which states that
moral persuasion is ineffective till the time it is followed by strict enforcement mechanism by the
tax authorities.
Catering for the Elements of Shame
Element of shame also contributed to be having a significant relationship with tax evasion
according to the survey. The two indicators in the survey included fear of name being included in
the defaulters list and the second being fear of being reported by any third person. As far as the
first indicators is concerned, like the media campaign, using websites, TV and newspapers can
also be used to publish names of tax defaulters. In case of Pakistan, a list of active taxpayers is
published on the website whereas there is no mechanism in place that caters for the names of those
people or individuals – both persons and corporations – who have defaulted their share of taxation
to the government.
Tax evasion means paying taxes from the hard-earned money of individuals. Rationality demands
that people should keep their money and do not give anything to the government. However, people
do pay such an amount because of two possible reasons; fear of being caught – shame; or feel their
duty to pay (Scholz & Pinney, 1995). The former included self-interest while the later calls for
collective responsibility. Taxpayers’ decision of noncompliance is sensitive to the fear of being
detected by the authorities and all rational taxpayers weigh the benefits of evading taxes with the
level of enforcement and probability of being detected on hiding their share of taxes form the
government authorities (Klepper & Nagin, 1989). Economic deterrence approach as described in
the Economics of Crime model developed by (Becker, 1968) with an attempt to determine the
effects of incentives of unethical behavior and possible measures to enact anti-crime laws to
counter such behavior.

174
Threat of detection and punishment of detection has been made part of anti-crime policies in many
countries and literature has found a highly significant and positive relationship between such
deterrent policies and tax compliance. However, audit probabilities have proven to be having
different effects on different group of tax payers therefore, taxpayers should be segregated before
tax audit to take place rather than randomly auditing any taxpayer (Mohdalia, Isab, & Yusoff,
2014). In a country like Pakistan where fear of being detected on tax evasion is very low.
According to (Becker, 1968) probability of detection and severity of punishments on wrongdoing
has a detrimental effect on the behavior of individuals.
Targeting the defaulter by publishing their names in the defaulters list is a tricky task as the aim is
not to just defame the individuals but to make an attempt to enhance tax compliance. Pakistani
system of taxation is based on Universal Self-assessment especially in case of income tax filing
by the individuals. Under such systems, third party reporting is not possible as the individual
himself / herself files all this incomes and expenditures that remain undetected till the time the
authorities go for the audit of such tax returns (Slemrod J. , Tax compliance and enforcement,
2018). It is also evident from previous research that when there is a possibility of being audited by
tax authorities, the evaders go for cost-benefit analysis and evade only when the perceived odds
are less than perceived benefits however, sometimes it is not possible for some taxpayers to cheat
on taxes even if the monetary benefits of evasion are more than its costs (Halla & Schneider, 2012).
People do anticipate the negative impacts of cheating due to the fact that they are considered as a
violation of the social norms prevailing in a society (de Hooge, Breugelmans, & Zeelenberg,
2008). These negative emotional feeling are beneficial for the society as they lead individuals to
behave in a prosocial manner that is beneficial for the society and this point has been a matter of
concern for the economists and psychologists since long (De Hooge, Zeelenberg, & Breugelmans,
2007). Feelings of shame is also the same feeling that is anticipated by the tax cheaters before
making any such decision. However all emotions do not lead to the same reparatory and prosocial
behavior as different emotions can only be explained by identifying the motivating factors
accompanying those emotions (Zeelenberg & Pieters, 2006).
According to (Coricelli, Joffily, Montmarquette, & Villeval, 2010) shame is only effective till the
time it is short term hence conforming to the findings of (Zeelenberg & Pieters, 2006) of
motivating factor accompanying the emotions. In our study where fear of name being made public

175
is taken as one element of shame. Such an act by the tax authorities triggers the emotion of shame
in an attempt to discourage tax evasion. such act, if prolonged, may not produce detering effect by
the tax authorities. According to a study carried out by (Coricelli, Elena, & Villeval, Tax evasion
and emotions: An empirical test of re-integrative Shaming Theory, 2013), fear of name being made
public is a detering factor by the governments for encouraging tax compliance. However, it this
element of shame is prolonged for a longer period of time, this leads to stigmatization – a situation
where a person is stigmatized as tax evader – and the individual does not further have any repent
on his decision of evasion as he / she is now a declared evader for good.
It is therefore, recommended that the government authorities need to keep the deterrence effect by
keeping a check on tax returns randomly and publish the names of defaulters for a short period of
time so that pressure remains on the taxpayers, hence cashing the element of shame. Long term
publications would lead to stigmatization and would lead to negative effects as discussed above.
Moreover, the medium of communication of names needs to be very effective. As discussed
earlier, medium of information has an impact on the results of policy as different class of people
have access to different type of medium. According to (Koumpias & Martinez-Vazquez, 2019),
mostly higher income group individuals have access to newspapers as compared to people having
access to TV sets.
HMRC (Her Majesty’s Revenue and Customs) publishes the names of tax defaulters in the form
of a report namely, PDDD or Publishing Details of Deliberate Defaulters that contains names of
all the defaulter individuals and corporations. Accoridng to HMRC’s own research, it was revealed
that the report did not have as detering effect on the individuals as it was thought out to be (Sweet,
2018). According to the report, most of the individuals did not have any access to the report and
were not aware of the names of defaulters hece the report proed out to be ineffective in achieving
the results. The same survey also concluded that people were more fearful of fines and penalties
than the nanmes being published due to the fact that they had information available regarding fines
and penalties on evasion but no information on the PDDDD. It is also pertinant to mention that
those who were aware of the report feared names being included in the report.
In case of Pakistan the government announced two programs that were analyzed by (Slemrod,
Rehman, & Waseem, Pecuniary And Non-Pecuniary Motivations For Tax Compliance: Evidence
from Pakistan, 2019). The report concluded that one of the program included making public the

176
names and amount of tax liability being paid by the taxpayers and the second included mentioning
the names of top 100 taxpayers. In another program the tax authorities also published the names
all taxpayers who had paid taxes including Members of Parliament. According to the report,
publishing the names of taxpayers on the website had a deterrent effect on those who had tried to
alter their tax liability due to whistle-blower effect. Moreover, MPs who had not provided their
true state of affairs in the Election Commission of Pakistan also had to face consequences as a
result. The results of these programs – according to this report – concluded that there was an
increase in tax payments especially by large taxpayers while this practice affected the results of
elections of Members of Parliament in Pakistan.
Perception regarding Public service Delivery
Till now the deterrence model that inculcates within it the negative incentives for tax evasion in
the form of fear of being detected and punishments by the state authorities. However, there is
another model that explains that explains a psychological contractual agreement between taxpayers
and the state in which the taxpayers pay their share of taxes to the state and in return the state or
the government provides public goods that have to be of the same perceived value as that of the
taxes paid (Feld & Frey, 2007). All the aspects of deterrence model including punishments, fines
and penalties that are used as tools to curb tax evasion by the government prove out to be expensive
methods as they involve high administrative and human costs to the tax authorities (Alm & Yunas,
2009). And despite such efforts by the authorities, tax evasion remains there. According to the IRS
(Internal Revenue Service) of the United States of America, despite all deterrence efforts to curb
evasion, the amount lost due to tax evasion in the year 2006 remained exceptionally high at $385
billion57.
Trust in government has been cited as a major determinant in shaping tax compliance behavior of
the citizens. When the citizens consider government as being trust worthy, the citizens support all
actions taken by the government whereas the situation is vice versa if the government losses its
credibility in the eyes of the citizens (Rudolph, 2009). This trust in government further leads to
positive consequences for the government one of these consequences being people complying to
the tax laws and hence increased tax compliance (Togler, 2007). Studies have found out a positive
correlation between level of trust in government and tax compliance attitudes of the masses e.g;
57 IRS website : IRS.gov

177
(Recardson, 2008) carried out a comprehensive study comparing 47 countries and found out trust
in government to be a determining factor in shaping tax compliance behaviors of the masses across
countries.
Literature has defined trust as a psychological state where one expects some positive behavior in
exchange of ones act from another person (Rousseau, Sitkin, Burt, & Camerer, 1998). This
definition includes two elements one being risk associated as one perceives that the other person
will act favorably in response to the act. The other element is the expectation that the result would
be favorable in the future. Trust is an element that develops slowly through a series of interactions
between the partners (Holtz, 2013). People usually evade taxes when they believe that the public
services are not commensurate with the tax being paid by them or if they perceive that the tax
money is not being utilized in a manner that is fair (Jimenez & Iyer, 2016). Hence perceived
fairness in the utilization of tax money or - as described by (Bordignon, 1993) – provision of public
services by the authorities has a significant impact in shaping the tax compliance behavior of the
individuals.
The results of the present study show that people were highly skeptical of the services being
provided by the government. This shows that trust on government by the masses was at an
exceptionally lower side and this factor needed to be addressed by the state authorities. Studies
have also found that there is a positive correlation between the perception about behavior of public
officials regarding spending of the tax money and tax morale of the citizens. Studies carried out
by (Mocetti, 2009) and (Aguirre & Rocha, 2010) have taken a view of the correlation between
government spending and tax compliance behavior and have found a positive correlation between
the two variables. A study carried out by (Torgler, Torgler, 2013) in Costa Rica concluded that
there was a highly significant and positive relationship between tax morale of the subjects and
provision of public service delivery. Similar results were obtained from the findings of
(Hallsworth, List, & Metcalfe, 2014) who carried out a research in the UK taking one of the largest
sample size of 200,000 taxpayers found that tax payment reminder letters that included messages
regarding public services had a significant impact on compliance to those letters.
As evident from the literature, attitudes towards public services being provided to the state have a
fairly large impact on the tax compliance behavior of the citizens. The impact increases when the
service providers are in the close vicinity of the taxpayer. In other words, people are more

178
responsive to services being provided at local government level. A study carried by taking
household survey data for 17 Latin American cities by (Ortega, Ronconi, & Sanguinetti, 2013)
concluded that there was a highly significant and a positive relationship between perceived public
services being provided by the local government and their tax compliance attitudes. People who
were satisfied with the services being provided to them were more willing to pay their share of
taxes to the government and vice versa. The study also found that people who had more access to
factual data regarding public services being provided to them were more sensitive than those who
had just perceived it.
The case of Pakistan is no different. Pakistan is a federation with three tiers of government The
Centre, Provinces and the District level government. The district level government is also divided
into District, Tehsil Municipal Authority and Union Council (Arif, Cartier, Golda, & Nayyar-
Stone, 2010). All Pakistan needs is to reap the benefits of providing basic public services of health
and education at local level. As the citizens will gain from the services, they will be more inclined
towards the government and their trust in the government will increase. This trust will lead to tax
compliance as evident from the literature cited above. All the government needs is to enable its
citizens perceive that the government will reciprocate to the taxes being paid by them
(Hashimzade, Myles, & Tran-Nam, 2010) who will then act in a positive way in response to this
perception. Another added advantage of public service delivery at local level would be that the
authorities will be better able to access the attitudes of taxpayers and will be able to implement tax
compliance strategies accordingly (Castro & Scartascini, 2015). Following all these would not
only help in eradicating tax evasion from the society but will also enable the country to function
well and stand on its feet without any outside support.
Implication for Stakeholders
Broadening the Tax Net
According to the FBR, the tax gap of the two largest tax streams i.e; Sales and Income tax came
out to be 65% and 57% respectively. This shows that Pakistan has a potential to generate revenues
However, due to lack of institutional capacity, the country has been unable to reap that potential.
According to the FBR documents, the tax gap during FY 2018-19 remained at PkR 3.3 trillion
while the budget deficit remained to be PkR. 3.4 Trillion. As the main source of revenue of the
country is Tax therefore the entire deficit is overcome through borrowing (Mayo 2020).

179
This borrowing in turns increases the budget deficits as a large chunk is utilized in debt servicing.
As per the budget estimates, around 40% of the total expenditure is done on debt servicing.This
means that all Pakistan needs is to enhance its capacity to reduce tax gap. The same issue has been
highlighted by World Bank58 that Pakistan could enhance its tax-to-GDP ratio from 11% to 26 %
(around PkR, 10 trillion) using the existing tax base if it mitigates the tax gap. It is therefore, not
necessary for the country to enhance tax base or even raise tax rates to increase tax revenue for the
country.
Focus on Direct Taxation
Although there are advantages of indirect taxes that constitute major portion of the government
tax net in Pakistan. The first advantage is its wide coverage as it covers all income segments of the
society and no one is exempt from paying an indirect tax. Secondly, indirect taxes are commonly
used to control consumption of a certain commodity like cigerrates whose price increases as a
result of tax and is therefore consumed comparatively in lesser quantity due to higher price.
Moreover, people usually are not aware of paying an indirect tax as the tax is included in the price
of a product and sometimes goes unnoticed. Lastly, it increases the government revenue that is the
main aim of imposing taxes.
Apart from these merits, there are certain demerits of indirect taxation. The main disadvantage of
indirect taxation is that it is regressive in nature (Esmaeel 2013). As mentioned earlier, the tax is
to be paid by everyone on consumption irrespective of their income level, it effects lower income
groups more. Similarly, due to its inclusion in the overall price of the products, it increases
commodity prices and as a result the overall price level in the country also increases. Although
governments impose these taxes to avoid tax evasion as indirect taxes cannot be evaded. In case
of Pakistan FBR estimate provide that the largest tax gap in Pakistan is of Sales tax that has a gap
of 65%.Despite strict punishments and penalties under Section 37A of the Sales Tax Act 1990,
sales tax evasion is on the high in Pakistan. Similarly, customs duty is also evaded in the country
due to smuggling of products is on the high in Pakistan as also suggested by OICCT in 2019 that
more than 60% of products in more than 6 sectors were being smuggled to avoid taxation.
58 The Project Information Document of Pakistan Revenue Mobilization Project was a World Bank funded project in
2019 that aimed at providing US$ 1.5 Billion to enable Pakistan strengthen its tax enforcement

180
Therefore keeping in view the regressive nature of the indirect taxes, it is recommended that
Pakistan must keep a balanced tax system where the major chunk of ttrhe revenue should be
generated by progressive direct taxation. (Aamir et al. 2011) who compared the tax structure of
Pakistan with India also suggested that unlike India, Pakistan focueed more on indirect taxation
that made its tax system inferior to India. The study also recommended that in order to make tax
system productive Pakistan needs to focus more on direct forms of taxes.
Public Service Delivery
Public Service Delivery is also an important implication of tax literature worldwide as well as the
results of the present study also show that public service delivery has an impact o nthe compliance
behavior of individuals. Studies carried out in different countries have found a significantly
positive relationship with compliance behavior of individuals. Study by (Torgler, Torgler, 2013)
in Costa Rica found a positive relationship of perception regarding public service delivery and tax
compliance behavior of individuals. Similarly, (Hallsworth, List, & Metcalfe, 2014) who carried
out a research in the UK taking one of the largest sample size of 200,000 taxpayers found that tax
payment reminder letters that included messages regarding public services had a significant impact
on compliance to those letters.
It is therefore recommended that in roder to improve tax compliance, it is necessary that the
government authorities must enhance public service delivery so that trust in government is
reinstated and people comply with tax laws. Studies have also proven that public services being
provided close to the public have even higher positive impact on tax compliance behavior of
individuals. A study carried by taking household survey data for 17 Latin American cities by
(Ortega, Ronconi and Sanguinetti 2013) concluded that there was a highly significant and a
positive relationship between perceived public services being provided by the local government
and their tax compliance attitudes. People who were satisfied with the services being provided to
them were more willing to pay their share of taxes to the government and vice versa.
The case of Pakistan is no different. Pakistan is a federation with three tiers of government The
Centre, Provinces and the District level government. The district level government is also divided
into District, Tehsil Municipal Authority and Union Council (Arif, et al. 2010). All Pakistan needs
is to reap the benefits of providing basic public services of health and education at local level. As
the citizens will gain from the services, they will be more inclined towards the government and

181
their trust in the government will increase. All the government needs is to enable its citizens
perceive that the government will reciprocate to the taxes being paid by them
(Hashimzade, Myles and Tran-Nam 2010) who will then act in a positive way in response to this
perception. Another added advantage of public service delivery at local level would be that the
authorities will be better able to access the attitudes of taxpayers and will be able to implement tax
compliance strategies accordingly (Castro & Scartascini, 2015).
Target the Elites first
The results of the study suggest that the highest level of association with the tax evasion behavior
was of perception about others evading taxes. when people perceive others in their vicinity evading
taxes, they follow the same behavior and ultimately evade more. When combined with fear of
name being published in defaulters list and fear of being reported on evasion, it can be concluded
that the element of shame is there till the time people perceive something to be a taboo in a society
(Bonavia and Brox-Ponce 2018). Studies carried out by (Phillips, 2009) suggested that the tax
morale or willingness to pay by the economic and political elites play an important role in shaping
the compliance behavior of the masses. The study concluded that citizens in Pakistan did not file
their retunrs as they were skeptical of the elite’s behavior towards tax compliance.
The study was taken further by (Gengl et al. 2015) who concluded that people in countries like
Pakistan did not trust the government and thought that their tax money would be used in filling
pockets of the already rich people who did not pay their taxes. A study by world bank suggested
that the main hurdle in developing countries is perception regarding elites not paying their taxes
(Prichard, et al. 2019) In order to ensure tax compliance there is a need for the governments in
developing nations to ensure compliance by the rich that will have an impact on the masses
compliance behavior otherwise people believe the tax system to be unfair and this will ultimately
result in social unrest (Gangl and Torgler 2019). Therefore, if the government wants to raise its
tax revenue, changing perception.
Improving Financial Disclosures
Loopholes in the tax system of Pakistan lead to financial disclosure by the potential taxpayers.
Most common loopholes in the system include informal economy that provides more than 70 %
of the employment in Pakistan, disparity among different sectors in terms of taxes, and investment

182
in near cash instruments that are anonymous in nature and tax exempt. Moreover, too much
reliance on indirect taxes also forces individuals to indulge in grey economy in order to save
themselves from taxation on products and services. Apart from all these factors, money laundering
is also an issue being faced by Pakistan that has also contributed to Pakistan being listed in the
Grey List of FATF. All these factors have led to huge losses to the government and these losses
are in addition to the tax gap of more than PkR. 3 trillion. In order to eliminate these issues, the
government needs to take the following steps:
Documentation of Economy
OCCI (2015) has suggested cettain measures some of which have also been implemented by the
government of Pakistan that will enable increase documentation of the Pakistani economy. These
strategies include:
1. Implement culture of Amnesty Schemes. Amnesties are given for some time in which
individuals are given a chance to declare their black money and convert it intolegal money. The
aim is to give a chance to the public to declare and document their money for future tax purposes.
Government of Pakistan keeps on giving such amnesties from time to time through different SROs
the last one being given in 2018 by the Federal Government.
2. Filing Tax Retunrs by all individuals. The government needs to device policies that enable all
individuals to file tax retunrs and become active taxpayers. The government of Pakistan in this
regard has taken concrete steps as many exemptions are provided to tax filers including reduced
rates of taxes on purchase of cars, property etc.
3. Utilization of NADRA Database. NADRA or the National Database Registration Authority is
entrusted with the responsibility of keep a record of all citizens, residents and non-resident
Pakistanis. The database can be connected with various sectors including banks and other sectors
and keep track of transactions of individuals. Such practice has been in place as the CNIC number
of individuals has been replaced by the NTN since 2015. The government also announced a scheme
to note CNIC of individuals making transaction of more than PkR. 50,000 however the scheme

183
was thwarted due to intervention of different pressure groups. Although the system of integration
is in place in certain sectors of the economy, this integration need to be strengthened.
4. High Incidents of Tax Audits. Tax audits should be made a practice that will enable the tax
department to track incidences of evasion and avoidance. This will enable the government to
implement effective financial disclosure. FBR59 has a dedicated Audit Wing that has been tasked
to carry out random audits .According to the FBR, ―taxpayers are selected for audit on the basis
of transparent, discretion free and automated process. The selection is done randomly by computer,
using different information items and parameters, without resorting to any identity details of the
taxpayers.
Countering Money Laundering
Money laundering and tax evasion has a direct relationship as people send money through illegal
channels hence bypassing the legal institutions and hence evading taxes in turn (Storm 2013). It is
also interesting to note that Pakistan has been placed in the grey list of FATF in terms of its non-
compliance with the recommendations of the task force. Pakistan was placed in the grey list and
was required to fulfill 27 recommendations by the end of year 2020. Although Pakistan has been
successful in implementing 21 out of those 27 recommendations, the country still lags behind in
others. According to (Hussain 2020), FATF has advised Pakistan to work on the following lines:
1. Strengthen its law enforcement agencies in effectively countering money laundering
2. Effective implementation of targeted financial sanctions against all designated terrorists
and those acting for or on their behalf
3. Demonstrating that terror financing prosecutions result in effective, proportionate and
dissuasive sanctions
4. Enforcement against violation of terror financing sanctions, including in relation to NPOs,
of administrative and criminal penalties and provincial and federal authorities cooperating on
enforcement cases
59 FBR website :
https://www.fbr.gov.pk/taxpayersaudit/131167/131272#:~:text=Tax%20system%20in%20Pakistan%20is,which%20
compliance%20level%20is%20m onitored

184
In order to get out of the grey list, Pakistan has to counter the menace of money laundering from
the country. Pakistan has been countering money laundering through different acts. Previously the
Anti Terrorism Act 1997 was dealing with money laundering. However, new acts came into force
from time to time. Being part of the Asia Pecific Group on Money Laundering, the first specific
law in this regard was the Anti-Money Laundering Ordinance (‘AMLO’) promulgated in 2007,
which suffered from various flaws. The AMLO was replaced with Anti-Money Laundering Act
2010 (‘AMLA’) incorporating various changes, including thorough definition of money
laundering. The aim of all these acts was to refrain terror financing and stop transactions through
hawala and Hundi services. moreover, the executing powers in this regard rest with NAB(Ali
2020).

185
FUTURE RECOMMENDATIONS
Limitations of The Study
The Current study revolves around finding the association between demographic variables
including age, gender, income and educational level with tax compliance behavior of individuals.
Moreover, certain psychological and morale factors and their association with tax compliance
behavior are also part of this study.
Education and Age have produced mixed results in literature. Some scholars are of the view that
there is a positive relationship some consider it negative and others consider an insignificant
relationship between these variables. However, in case of the present study, Age has a moderate
while education has no significant relation with tax evasion behavior of respondents. Other studies
may carry out result to check and very the results of the study by employing different methods.
Similarly, area of study may also be expanded to others regios of the country while a comparative
study of salaried versus self employed can also be carried out by future researchers.
Recommendations for Future Research
The aim of the research was to determine the association of certain demographic and psychological
variables with the tax evasion behavior of individuals. An attempt was made to keep the results as
anticipated as possible through thorough literature review. However, there were some
unanticipated results that were surfaced during the course of the study and need to be researched
more. Future recommendations in this regard are as follows:
1. Trust in Government
Much work has been carried out on the association of perceived corruption and public service
delivery and their association with tax evasion. Almost all scholars are unanimous in the fact that
these factors do effect the tax evasion behavior of individuals. However, the results of current
research show an insignificant relationship between the variables. This issue may be attributable
to the fact that the responses for both indicators of trust in government were skewed irrespective

186
of responses of tax evasion. However, there is a need for future research in this regard to check
and verify the relationship.
2. Guilt and Tax Evasion
Similar to trust in government, element of guilt that is an emotional feeling of repentance of
wrongdoing has also shown a significant relationship with tax evasion. However, the current study
shows an insignificant relationship. A reason, as shown in literature may be attributable to the fact
that some mediating and moderating variables affect the relationship. It is therefore recommended
that the relationship of these variables may also be examined in future researches.

187
REFRENCING
Aamir, M., Qayyum, A., Nasir, A., Hussain, S., Khan, K. I., & Butt, S. (2011). Determinants of
Tax Revenue : A Comparative Study of Direct and Indirect Taxes of Pakistan and India.
International Journal of Business and SOcial Science, 2(19), 173 - -178.
Abbasi, E., & Heidaryemady, H. (2012). Investigating Causes of Tax Evasion among Employees
and Legal Persons. Journal of Basic and Applied Scientific Research, 2(11), 11589 - 11595.
Abed, G. T., & Davoodi, H. (2002). The Economics of Corruption: An Overview. In G. T. Abed,
& S. Gupta, Governance, Corruption and Economic Performance (pp. 1 - 16). Washington
D.C.: International Monetary Fund.
Abraham, M. L. (2016). Collusive tax evasion and social norms. International Tax and Public
Finance, 24(2), 179 - 197.
ADB. (2017, June 22). ADB Provides $300 Million to Support Public Sector Enterprises Reform
in Pakistan. Retrieved from adb.org: https://www.adb.org/news/adb-provides-300-
million-support-public-sector-enterprises-reform-pakistan
Adler, P. (2009). Political Economy. University of Southern California, LA, USA.
Aghion, P., Akcigit, U., J., C., & W., K. (2016). Taxation, Corruption, and Growth. National
Bureau of Economic Research, NBER Working Paper 21928.
Aguirre, B., & Rocha, F. (2010). Trust and Tax Morale in Latin American and Caribbean
Countries. Paper presented at the 14th Annual Conference of The International Society for
New Institutional Economics, (pp. 17 - 19 June). Stirling, Scotland, UK .
Ahmad, E. (2010). The political-economy of tax reforms in Pakistan: The ongoing Saga of the
GST. Bonn: Center for Development Research.
Ahmad, S., Sial, M. H., & Ahmad, N. (2018). Indirect Taxes and Economic Growth: An Imperical
Analysis of Pakistan. Pakistan Journal of Applied Economics, 28(1), 65 - 81.
Ahmed, A. (2019, May 06). Pakistan Doesn't Need Additinoal Taxes to Cover Revenue Shortfall.
Dawn News, p. Online Publication. Retrieved from dawn.com/news/1480560

188
Ahmed, A. F., Zafar, T., & Yaseen, G. (2017). Ethnopharmacological relevance of medicinal
plants used for the treatment of oral diseases in Central Punjab-Pakistan. Journal of Herbal
Medicine.
Ahmed, E., & Braithwaite, V. (2004). When tax collectors become collectors for child support and
student loans: Jeopardizing the revenue base? Kyklos, 57, 303-326.
Ahmed, E., & Braithwaite, V. (2004). When tax collectors become collectors for child support and
student loans: Jeopardizing the revenue base? Kyklos, 57, 303 - 326.
Ahmed, F., Raza, H., Hussain, A., & Lal, I. (2013). Determinant of inflation in pakistan: An
econometrics analysis, using johansen co integration approach. European Journal of
Business and Management, 5(30), 115 - 122.
Ahmed, I., Ghosh, P. S., & Reifelt, H. (2000). Pluralism and Equality : Values in Indian Society
and Politics. New Delhi: Sage Publication.
Ahmed, I., Mustafa, U., & Khalid, M. (2007). National Finance Commission Awards in Pakistan
: A Historical Perspective. ISlamabad: Pakistan Institute of Development Economics
(PIDE).
Ahmed, V., & O'Donoghue, C. (2009). Redistributive Effect of PErsonal Income Taxation in
Pakistan. PAkistan Economic and Social Review, 4(1), 1-17.
Aim, J., Bahl, R., & Murray, M. N. (1990). Tax Structure and Tax COmpliance. The Review of
Economics and Statistics, LXXII 4, 603 - 613.
Ajaz, T., & Ahmed, E. (2010). The Effect of Corruption and Governance on Tax Revenues. The
Pakistan Developmental Review, 49(4), 405 - 417.
Ajzen, I. (2005). Attitudes, Personality, and Behavior. McGraw-Hill International.
Akhtar, N. (2013). Ethnic Politics in Pakistan. Pakistaaniat : a JOurnal of Pakistan Studies, 5(3).
Akram, M., Iqbal, M. A., & Mughal, M. M. (2012). The Phenomenon of Tax Evasion and
Avoidance in Pakistan: An Exploratory Approach. Elixir Fin. Mgmt., 46, 8240-8247.
189
Alarc´on-Garc´ıa, G., Beyaert, A., & De Pablos, L. (2012). Fiscal awareness : A study of the
female attitude towards fraud in Spain. In M. P. Prinz, Tax Evasion and the Shadow
Economy (pp. 61 - 86). Cheltenham, UK, Northampton, MA, USA: Edward Elgar.
Alasfour, F., Samy, M., & Bampton, R. (2016). The Determinants of Tax Morale and Tax
Compliance: Evidence from Jordan. Advances in Taxation, 125–171.
Alesina, A., Baqir, R., & Easterly, W. (1999). Public goods and ethnic divisions. The Quarterly
Journal of Economics, 114(4), 1243 - 1284.
Ali, S., & Rehman, J. (2013). Indigenous peoples and ethnic minorities of Pakistan: constitutional
and legal perspectives. Surrey: Curzon Press.
Allingham, M. G., & Sandmo, A. (1972). Income Tax Evasion : A Theoratical Analysis. Journal
of Public Economics, 1, 323 - 338.
Allingham, M. G., & Sandmo, A. (1972). Income Tax Evasion: A Theoretical Analysis . Journal
of Public Economics, 323 - 338.
Alm, J. (2012). Measuring, Exl=planing and Controling Tax Evasion : Lessons from Theroy,
Experiments and Field studies. International Tax and Public Finance, 19(1), 54 - 77.
Alm, J. (2012, February). Measuring, explaining, and controlling tax evasion: lessons from theory,
experiments, and field studies. International Tax and Public Finance, 19(1), 54-77.
Alm, J. (2012). Measuring, explaining, and controlling tax evasion: Lessons from theory,
experiments, and field studies. International Tax and Public Finance, 19, 54 - 77.
Alm, J., & Torgler, B. (2006). Culture differences and tax morale in the United States and in
Europe. Journal of Economic Psychology, 27(2), 224 - 246.
Alm, J., & Yunas, M. (2009). Spatiality and persistence in U.S. individual income tax compliance.
National Tax Journal, 62(1), 101 - 124.
Alm, J., Bahl, R., & Murray, M. N. (1980). Tax Structure and Tax Compliance. The Review of
Economics and Statistics, 72(4), 603 - 613.

190
Alm, J., Bahl, R., & Murray, M. N. (1993). Audit Selection and Income Tax Underreporting in the
Tax Compliance Game. Journal of Development Economics, 42(1), 1 - 33.
Alm, J., Deskins, J., & McKee, M. (2006). Third-Party Income Reporting and Income Tax
COmpliance. Georgia State University: Andrew Young School of Public Policy.
Alm, J., Martinez-Vazquez, J., & McClellan, C. (2014). Corruption and Firm Tax Evasion.
International Center for Public Policy Working Paper Series, Georgia State University,
Atlanta, Georgia.
Alm, J., McClelland, G., & Schulze, W. (1992). Why do people pay taxes? Journal of Public
Economics, 48(1), 21 - 38.
Al-Mamun, A., Entebang, H., Mansor, S. A., & Yasser, Q. R. (2014). The Impact of Demographic
Factors on Tax Compliance Attitude and Behavior in Malaysia. Journal of Finance,
Accounting and Management, 5(1), 109 - 124.
Al-Mamun, A., Entebang, H., Mansor, S. A., & Yasser, Q. R. (2014). The Impact of Demographic
Factors on Tax Compliance Attitude and Behavior in Malaysia. Journal of Finance,
Accounting and Management, 5(1), 109 - 124.
Alstadsæter, A., Johannesen, N., & Zucman, G. (2018). Tax Evasion and Avoidance. gabriel-
zucman.eu, 1 - 21.
Alt, J. F., & Shepsle, K. E. (1990). Perspectives on Positive Political Economy. Cambridge:
Cambridge University Press.
Amin, A., Nadim, A. M., Perveen, S., Kamran, M. A., & Anwar, S. (2014). Factors Affecting Tax
Collection in Pakistan: An Emperical Investigation. Journal of Finance and Economics,
2(5), 149-155.
Amir, E., Lazar, A., & Levi, S. (2018). The Deterrent Effect of Whistleblowing on Tax Collections.
European Accounting Review, 27(5), 939 – 954.
Anderson, P. (1977). Tax Evasion and Labor Supply. The Scandinavian Journal of Economics,
79(3), 375 - 383.

191
Andreoni, J., Erard, B., & Feinstein, J. (1998). Tax Compliance. Journal of Economic Literature,
36(2), 818 - 860.
Ansaari, I. (2015, December 22). Corruption, Tax Evasion on the Rise: FBR Official. The Express
Tribune.
Antwi, S. K., & Hamza, K. (2015). Qualitative and Quantitative Research Paradigms in Business
Research : A Philosophical Reflection. European Journal of Business and Management,
7(3), 217 - 225.
Anwar. (1995). Sikap Manusia: Teori dan Pengukurannya (Vol. 2). Pustaka: Pelajar.
APA. (1995). Standards for Educational and Psychological Testing. Washington D.C. : American
Psychological Association.
Arbex, M., Carre, J. M., Geniole, S. N., & Mattos, E. (2018). Testosterone, personality traits and
tax evasion. Working Paper 1801.
Arif, S., Cartier, W., Golda, A., & Nayyar-Stone, R. (2010). The Local Government System in
Pakistan: Citizens’ Perceptions and Preferences. IDG Working Paper(2).
Ariyo, A., & Bekoe, W. (2012). Currency Demand, the Underground Economy and Tax Evasion:
The Case of Nigeria. Journal of Monetary and Economic Integration, 11(2), 130 - 157.
Arrow, K. J. (1973). Higher education as a filter. Journal of Public Economics, 2(3), 193 - -216.
Artemenk, D., L.A.Aguzarova, F.S.Aguzarova, & Porollo, E. (2017). Causes of Tax Risks and
Ways to Reduce Them. European Research Studies Journal, XX(3B), 453 - 459.
Ashby, J. S., & Webley, P. (2010). Exploring the Existence of Distinct Occupational Taxpaying
Cultures in Australia. Australian Tax Forum, 25, 29 - 55.
Aslam, R. (2011). Aslam, R. 2011. Greed, Creed, and Governance in Civil Conflicts : A Case
Study of Baluchistan. Contemporary South Asia, 189 - 203.

192
Aslam, S. (1998). The Underground Economy and Tax Evasion in Pakistan: Annual Estimated
(1960-1998) and the Impact of Dollarization of the Economy. The Pakistan Development
Review, 37(4), 621-631.
Aslam, S. (1998). The Underground Economy and Tax Evasion in Pakistan: Annual Estimates
(1960-1998) and the Impact of Dollarisation of the Economy. The Pakistan Developmental
Review, 37(4), 621 - 631.
Awan, A. G., & Hannan, A. (2014). THE DETERMINANTS OF TAX EVASION IN
PAKISTAN-A CASE STUDY OF SOUTHERN PUNJAB. International Journal of
Development and Economic Sustainability, 2(4), 50-69.
Awan, A. G., & Hannan, A. (Oct 2014). The Determanents of Tax Evasion in Pakistan - A Case
Study of Southen Punjab. International Journal of Development and Economic
Sustainability, 2(4), 50-69.
Azhar, B. A. (1992). Tax Pilferage : Causes and Cures. The Pakistan Development Review, 35(4
Part II), 657 - 667.
Azhar, B. A. (1996). Tax Pilferage - Causes and Cures. The Pakistan Development Review, 35(4
(Part II)), 657 - 667.
Azhar, M., & Muhammad, A. (2017). Ethnic Fragmentation and Dynamics of Politics in Pakistan.
Journal of Political Studies, 24(1), 67 - 81.
Bahl, R. W., & Bird, R. M. (2008). Tax policy in developing countries: Looking back - and Way
Forward. National Tax Journal, 61(2), 279 - 301.
Baker, G. S. (1968). Crime and Punishment : An Economic Approach. Journal of Political
Economy, 169 - 217.
Bank, S., Mcgee, R. W., & Yüzbaşı, B. (2015). How Religions Affect Attitudes Toward Ethics of
Tax Evasion? A Comperative and Demographic Analysis. Journal of the Studies of
Religions and Ideologies, 14(41), 202 - 223.

193
Barnes, T., & Beaulieu, E. (2014). Gender stereotypes and corruption : How candidates affect
perceptions of election fraud. Politics and Gender, 10(3), 365 - 391.
Barone, G., & Mocetti, S. (2011). Tax morale and public spending inefficiency. International
Taxation Public Finance, 18(6), 724 - 749.
Barone, G., & Mocetti, S. (2011). Tax morale and public spending inefficiency. International Tax
and Public Finance, 18(6), 724 - -729.
Barrett, G. V. (1972). New Researhc Models of the Future for Industrial and and Organizational
Psychology. Personal Psychology, 25, 1 - 17.
Baruch, Y. (1999). Response Role in Academic Studies-a Comparative Analysis. Human
Relations, 52, 421 - 438.
Bashir, F., Nawaz, S., Yasin, K., Khursheed, U., Khan, J., & Qureshi, M. J. (2011). Determinants
of inflation in pakistan: An econometric analysis using johansen cointegration approach.
Australian Journal of Business and Management Research,, 1(5), 71 - 82.
Bashir, F., Yousaf, F., & Aslam, H. (2016). Determinants of Inflation in Pakistan: Demand and
Supply Side Analysis. Journal of Finance & Economics Research, 1(1), 43 - 57.
Basu, A. (2006). Ethnic minority entrepreneurship. In B. Y. M. Casson, The Oxford handbook of
entrepreneurship (pp. 580 - 600). New York, US: Oxford University Press.
Bates, R. (1973). Ethnicity in Contemporary Africa. Syracuse: Program in East African Studies.
Bauer, G. R., Braimoh, J., Scheim, A. I., & Dharma, C. (2017, May 25). Transgender-inclusive
measures of sex/gender for population surveys: Mixed-methods evaluation and
recommendations. (A. R. Dalby, Ed.) PLoS ONE, Published Online.
Baumeister, R., Stillwell, A., & Heatherton, T. (1994). Guilt: An Interpersonal Approach.
Phychological Bulletin, 115, 243 - 267.
Becker, G. (1968). Crime and punishment: An economic approach. The Journal of Political
Economy, 76(2), 169 - 217.

194
Belmonte, A., Dell’Anno, R., & Teobaldelli, D. (2016). Tax Morale, Aversion to Ethnic Diversity,
and Decentralization. University of Urbino.
Benk, S., Budak, T., & Cakmak, A. F. (2012). Tax Profesionals' Perceptions of Tax Fairness:
Survey Evidence in Turkey. International Journal of Business and Social Sciences, 3(2),
112 - 117.
Berens, S., & Schiller, A. v. (2016). Taxing Higher Incomes: What Makes the High-Income
Earners Consent to More Progressive Taxation in Latin America. Polit Behav, 39(3), 703
- 729.
Berry, K. J., Johnston, J. E., & Mielke, P. W. (2019). Central Tendency and Variability. A Primer
of Permutation Statistical Methods, 83 – 100 .
Bertrand, M. (2011). New perspectives on Gender. Handbook of Labor Ecoonomics, 4 (Part B),
1543 - 1590.
Besleya, T., & Malcomson, J. M. (2018). Competition in public service provision: The role of non-
for-Profit Providers. Journal of Public Economics, 162, 158 - 172.
Betz, M., O'Connell, L., & Shepard, J. M. (1989). Gender differences in proclivity for unethical
behavior. Journal of Business Ethics, 8 (5), 321 - 324.
Bilgin, C., & Bilgin, H. K. (2016). An Imperical Analysis of Tax Morale in Bosnia - Herzegovina.
Balkan Journal of Social Sciences, 9, 166- -183.
Bilgrami Jaffery, N., & Sadaqat, M. (2006). NFC Awards - Commentary and Agenda. Pakistan
Economic and Social Review, 44(2), 209-234.
Bird, R. M., & Zolt, E. M. (2005). The limited role of the personal income tax in developing
countries. Journal of Asian Economics, 16(6), 928 – 946.
Black, P., Calitz, E., & Steenkamp, T. (2015). Public Economics (6 ed.). Oxford: Oxford
University Press.
Blackburn, K., Bose, N., & Haque, M. (2006). The incidence and persistence of corruption in
economic development. Journal of Economic Dynamics & Control, 30, 2447 - 2467.

195
Blaufus, K., Bob, J., Otto, P. E., & Wolf, N. (2016). The Effect of Tax Privacy on Tax Compliance
– An Experimental Investigation. European Accounting Review.
Blaufus, K., Bob, J., Otto, P. E., & Wolf, N. (2016). The Effect of Tax Privacy on Tax Compliance
– An Experimental Investigation. European Accounting Review, 26(3), 561 - 580.
Bø, E. E., Slemrod, J., & Thoresen, T. O. (2015). Taxes on the internet: Deterrence effects of
public disclosure. American Economic Journal: Economic Policy, 7(1), 36 - 62.
Bø, E. E., Slemrod, J., & Thoresen, T. O. (2015). Taxes on the internet: Deterrence effects of
Public Disclosure. American Journal of Economic Policy, 7(1), 36 - 62.
Bordignon, M. (1993). A fairness approach to income tax evasion. Journal of Public Economics,
52(3), 345 - 362.
Bosco, L., & Mittone, L. (1997). Tax Evasion and Moral Constraints: Some Experimental
Evidence. Kyklos, 50(3), 297 - 324.
Breuer, L. (2012). Tax compliance and whistleblowing – The role of incentives. Bonn: University
of Bonn.
Brink, W. D., & Porcano, T. M. (2016). The Impact of Culture and Economic Structure on Tax
Morale and Tax Evasion: A Country-Level Analysis Using SEM (John Hesseldine ed., Vol.
23). (J. Hasseldine, Ed.) Emerald Group Publishing Limited.
Brink, W. D., & Porcano, T. M. (2016). The Impact of Culture and Economic Structure on Tax
Morale and Tax Evasion: A Country-Level Analysis Using SEM. Advances in Taxation,
87 - 123.
Brockmann, H., Genschel, P., & Seelkopf, L. (2015). Happy taxation: increasing tax compliance
through positive rewards? . Journal of Public Policy, 381 - 406.
Brosio, G., Cassone, A., & Ricciuti, R. (2000). Tax Evasion Across Italy: Rational Noncompliance
or Inediquate Civic Concern. Pavia: Department of Public and Territorial Economics -
University of Pavia.
196
Bruce, D. (2000). Effects of the United States Tax System on Transitions Into Self Employment.
Labour Economics, 7, 545 - 574.
Bruner, D., D’Attoma, J., & Steinmo, S. (2017). Going Dutch? The Role of Gender in the Provision
of Public Goods through Tax Compliance. Working Paper.
Bukhari, H., & Haq, I. (2014). Budget 2014-15 : Another Ritualistic Exercise. Lahore: Huzaima
& Ikram.
Bulbuc, C. (2016, May 27). Where is the dividing line between acceptable and unacceptable tax
planning for corporates. TaxJournal.
Caball´e, J., & Panad´es, J. (2007). Tax rates, tax evasion, and growth in a multi-period Economy.
Revista de Economia Publica , 183(4), 67 - 80.
Caball´e, J., & Panade's, J. (2004). Inflation, Tax Evasion, and the Distribution of Consumption.
Journal of Macroeconomics, 26(4), 567 - 595.
Cagan, P. (1965). Determinants and Effects of Changes in the Stock of Money 1875 - 1960. New
York: Columbia University Press.
Cashin, P., Haq, N., & Olekalns, N. (1999). Spend Now, Pay Later? Tax Smoothing and Fiscal
Sustainability in South Asia. International Monetory Fund.
Castro, L., & Scartascini, C. (2013). Tax compliance and enforcement in the Pampas: Evidence
from a field experiment (Vol. No 472). Washington, DC: IDB Publications (Working
Papers).
Castro, L., & Scartascini, C. (2015). Tax compliance and enforcement in the pampas evidence
from a field experiment. Journal of Economic Behavior & Organization, 116, 65 - 82.
Centre for Peace and Development Initiatives & Centre for Investigative Reporting in Pakistan.
(2011). Representtion withour Taxation! An Analysis of MPs Income Tax Returns for 2011.
Islamabad: CPDI & CIRP.
Cerqueti, R., & Coppier, R. (2009). Economic Growth, Corruption and Tax Evasion. Department
of Economic and Financial Institutions, Deptt Book No. 58.

197
Chan, C. W., Troutman, C. S., & O’Bryan, D. (2000). An Expanded Model of Taxpayer
Compliance : Empirical Evidence from the United States and Hong Kong. Journal of
International Accounting, Auditing and taxation, 9(2), 83 - 103.
Chandrappa, M. (2016). Tax Evasion and Black Money in india: Causes and Remedies.
International Journal of Management Research and Review, 6(10), 1376 - 1381.
Chau, G., & Leung, P. (2009). A critical review of Fischer tax compliance model: A Research
Synthesis. Journal of Accounting and Taxation, 1(2), 34- 40.
Chaudhary, I. S., & Munir, F. (2010). Determinants of Low Tax Revenue in Pakistan. Pakistan
Journal of Social Sciences, 30(2), 439-452.
Chaudhary, I. S., & Munir, F. (2010). Determinants of Low Tax Revenue in Pakistan. PAkistan
Journal of Social Sciences, 30(2), 439 - 452.
Chaudhary, M. A., & Shabbir, G. (2005). Macroeconomic Impacts of Budget Deficit on Pakistan's
Foreign Sector. PAkistan Economic and Social Review, XLIII(2), 185-198.
Chaudhry, I. S., & Munir, F. (Dec 2010). Determanents of Low Tax Revenue in Pakistan. Pakistan
Journal of Social Sciences, 30(2), 439-452.
Chaudhry, M. G. (1999). The Theory and Practise of Agricultural Income Tax in Pakistan and a
Viable Solution. Ther Pakistan Developmental Review, 38(4 (Part II)), 757 - 768.
Chetty, R., Friedman, J., Olsen, T., & Pistaferri, L. (2011). Adjustment Costs, Firm Responses,
and Micro vs. Macro Labor Supply Elasticities: Evidence from Danish Tax Records.
Quarterly Journal of Economics, 126, 749 - 804.
Christiansen, V. (1980). Two Comments on Tax Evasion. Journal of Public Economics, 14.
Chung, J., & Trivedi, V. (2003). The Effect of Friendly Persuasion and Gender on Tax Compliance
Behavior. Journal of Business Ethics, 47(2), 133 - 145.
Cialdini, R. B. (2003). Crafting normative messages to protect the environment. Current
Directions in Psychological Science , 12(4), 105 - 109.

198
Clotfelter, C. T. (1983). Tax Evasion and Tax Rates: An Analysis of Individual Returns. The
Review of Economics and Statistics, LXI 3, 363 - 373.
Colemen, C., & Freeman, L. (1997). Cultural foundations of taxpayer attitudes to voluntary
compliance. . Australian Tax Forum, 13(3), 311 - 336.
Colosi, L. (2006). Designing an effective questionnaire. Ithaca, NY USA: Cornell University.
Coricelli, G., E. R., & Villeval, M. C. (2013). Tax evasion and emotions: An empirical test of re-
integrative Shaming Theory. Journal of Economic Psychology.
Coricelli, G., Joffily, M., Montmarquette, C., & Villeval, M. C. (2010). Cheating, emotions, and
rationality: an experiment on Tax Evasion. Journal of Experimental Economics, 13, 226 -
247.
Coricelli, G., Joly, M., Montmarquette, C., & Villeval, M. (2010). Cheating, emotions, and
Rationality : an experiment on tax evasion. Experimental Economics, 13, 226 - 247.
Cox, D. (1984). Raising revenue in the underground economy. National Tax Journal, 37, 283 -
288.
Crane, S. E. (1990). Tax Rates and Tax Evasion:Evidence from California Amnesty Data. National
Tax Journal, 43(2).
Crocombe, R. (2008). The South Pacific (7th ed.). University of the South Pacific: Suva: IPS
Publications.
Croson, R., & Gneezy, U. (2009). Gender Differences in Preferences. JOURNAL OF ECONOMIC
LITERATURE, 47(2), 448 - 474.
Cullis, J., Jones, P., & Savoia, A. (2012). Social norms and tax compliance: Framing the decision
to pay tax. The Journal of Socio-Economics, 41, 159–168.
Cummings, R. G., Martinez-Vazquez, J., McKee, M., & Torgler, B. (2009). Tax morale affects
tax compliance: Evidence from survey and an artefactual field experiment. Journal of
Economic Behavior and Organization, 70, 447 - 457.

199
Cyan, M. R., Koumpias, A. M., & Martinez-Vazquez, J. (2016). The determinants of tax morale
in Pakistan. Journal of Asian Economics, 47, 23 - 34.
Cyan, M. R., Koumpias, A. M., & Martinez-Vazquez, J. (2016). The Effects of Media Campaigns
on Individual Attitudes towards Tax Compliance; QuasiExperimental evidence from
survey data in Pakistan. Georgia State University: International Centre of Public Policy.
D’Attoma, J., Volintiru, C., & Steinmo, S. (2017). Willing to share? Tax compliance and gender
in Europe and America. Research & Politics, 4(2), 1 - 10.
D’Attoma, J., Volintiru, C., & Steinmo, S. (2017). Willing to Share? Tax Compliance and Gender
in Europe and America. Research and Politics, 1 - 10.
Dalton, R. J. (2005). The social transformation of trust in government. International. International
Review of Sociology, 15(1), 133 - 154.
Dalu, T., Maposa, V. G., & Dalu, S. P. (2012). The Impact of Tax Evasdion and Avoidance on the
Economy : A Case of Harare, Zimbabwe. African J. Economic and Sustainable
Development, 1(3), 284 - 296.
Dalu, T., Maposa, V., Pabwaungana, S., & Dalu, T. (2012). The impact of tax evasion and
avoidance on the economy: a case of Harare, Zimbabwe. African Journal of Economic and
Sustainable Development, 1(3), 284 - 296.
Damayanti, T. W., & Supramono. (2012). Apa Kata Mereka? Pengetahuan, Sikap, Niat Patuh
Calon Pelaku Pajak. Akuntabilitas Jurnal Ilmiah, 12, 114 - 123.
Damayanti, T. W., Sutrisno, S. I., & Baridwan, Z. (2015). Trust and Uncertainty Orientation: An
Efforts to Create Tax Compliance in Social Psychology Framework. Procedia - Social and
Behavioral Sciences, 211, 938 - 944.
Davis-Nozemack, K., & Webber, S. (2012). Paying the IRS whistleblower: A critical analysis of
collected Proceeds. Virginia Tax Review, 32, 1 - 53.
Dawn. (2018, August 28). PSEs debt up Rs500bn in two years. The Dawn News, p. online
publication. Retrieved July 11, 2019, from https://www.dawn.com/news/1429398

200
de Hooge, I. E., Breugelmans, S. M., & Zeelenberg, M. (2008). Not so ugly after all: When shame
acts as commitment device. Journal of Personality and Social Psychology, 95(4), 933 -
943.
De Hooge, I. E., Zeelenberg, M., & Breugelmans, S. M. (2007). Moral sentiments and cooperation:
Differential influences of shame and guilt. Cognition and Emotion, 21(5), 1025 - 1042.
Devo, K. (2005). The Attitudes of Tertiary Students on Tax Evasio and the Penalties for ta
Evasion- a Pilot Study and Demographic Analysis. eJournal of Tax Research. Retrieved
from http://classic.austlii.edu.au/au/journals/eJlTaxR/2005/11.html#fn66
Devos, K. (2008). Tax Evasion Behaviour and Demographic Factors: An Exploratory Study in
Australia. Revenue Law Journal, 18(1), 1 - 43.
Devos, K. (2019). A Comparative Study of Compliant and Non-Compliant Individual Taxpayers
in Australia. Journal ofbusiness and Policy Research, 7(2), 180 - 196.
Deyneli, F. (2014). Analyzing the relationship between national cultural dimensions and tax
Morale. Journal of Alanya Faculty of Business, 6(2), 55 - 63.
Doerrenberg, P. (2015). Does the use of tax revenue matter for tax compliance behavior?
Economics Letters, 128, 30 - 34.
Doerrenberg, P. a. (2013). Progressive Taxation and Tax Morale. Public Choice, 155(3-4), 293 -
316.
Doerrenberg, P., & Peichl, A. (2018). Tax Morale and the Role of Social Norms and Reciprocity.
Evidence from a Randomized Survey Experiment. CESifo Working Paper No. 7149
(Cetagory 1).
Doerrenberg, P., & Peichl, A. (2018). Tax Morale and the Role of Social Norms and Reciprocity:
Evidence from a Randomized Survey Experiment. Bonn, Germany: IZA Institute of LAbor
Economics.
Doran, M. (2009). Tax Penalties and Tax Compliance. USA: e Georgetown Law Library.

201
Dreher, A., & Schneider, F. (2006). Corruption and the Shadow Economy: An Empirical Analysis.
CREMA Working Paper 2006-01.
Duch, R. M., Palmer, H. D., & J., A. C. (2000). Heterogeniety in Perception of National Economic
Conditions. American Journal of Political Science, 44(4), 635 - -652.
Duguit, L. (1923). The Concept of Public Service. Yale Law Journal, XXXII, 425 - 435.
Dulleck, U., Fooken, J., Newton, C., Ristl, A., Schaffner, M., & Torgler, B. (2016). Tax
Compliance and psychic Costs: Behavioral Experimental Evidence Using a physiological
Marker. Journal of Public Economics, 9 - 18.
Dur-e-Nayab. (2006). Demographic Divident or Demographic threat in Pakistan. ISlamabad:
Pakistan Institute of Development Economics.
Eckel, C. C., & Grossman, P. (2001). Chivalry and solidarity in Ultimatum Games. Economic
Inquiry, 39(2), 171 - 188.
Eja, B. R., Idaka, S. E., & John, O.-A. (2018). Inhibiting Factors to Tax Revenue Generation in
Cross River State, Nigeria. Global Journal of Social Sciences, 17, 11 - 19.
Elffers, H., Robben, H., & Hessing, D. (1992). On measuring tax evasion. Journal of Economic
Psychology, 13(4), 545 - 567.
Emerson, R. (1976). Social Exchange Theory. Annual Review of Sociology, 2, 335 - 362.
Empirical Analysis of Tax Revenues and Its Impact on Economic Groeth of Pakistan. (2015).
Journal of Economics and Sustainable Development, 110-118.
Erard, B., & Feinstein, J. (1994). The role of moral sentiments and audits perceptions in tax
Compliance. Public Finance, 49, 70 - 89.
Eriksen, K., & Fallan, L. (1996). Tax knowledge and attitudes towards taxation: A report on a
quasi-experiment. Journal of Economic Psychology, 17, 387–402.
Eurofound. (2013). Information campaign on tax compliance. Estonia. Brussels : Eurofound.

202
Farrar, J., Hausserman, C., & Dunn, P. (2018). The Influence of Guilt Cognitions on Taxpayers’
Voluntary Disclosures. Journal of Business Ethics, 148(3), 689 - 701.
Fatt, C. K., & Khin, E. W. (2011). A Study on Self-Assessment Tax System Awareness in
Malaysia. Australian Journal of Basic and Applied Sciences, 5(7), 881 - 888.
Fauziati, P., A. F. Minovia, R. Y., & Nasrah, R. (2016). The Impact of Tax Knowledge on Tax
Compliance Case Study in Kota Padang, Indonesia. Journal of Advanced Research in
Business and Management Studies, 2(1), 22 - 30.
FBR. (2019). The Audit Policy 2018. Islamabad: Taxpayers' Audit Wing, FBR .
Feld, L. P., & Frey, B. S. (2002). Trust breeds trust: How taxpayers are treated. Economics of
governance, 3(2), 87 – 99.
Feld, L. P., & Frey, B. S. (2002). Trust Breeds Trust: How Taxpayers are Treated. Economics of
Governance, 3, 87 - 99.
Feld, L. P., & Frey, B. S. (2007). Tax Compliance as the Result of a Psychological Tax Contract:
The Role of Incentives and Responsive Regulations. Law & Policy, 29(1), 102 - 120.
Feld, L. P., & Frey, B. S. (2007). Tax Compliance as the Result of a Psychological Tax Contract:
The Role of IUncentives and Responsive Regulation. Law and Policy, 29, 102 - -120.
Feltenstein, A., & Cyan, M. R. (2013). A computational general equilibrium approach to sectoral
analysis for tax potential: An application to Pakistan. Journal of Asian Economics, 27, 57-
70.
Feroz, A. (1989). The rise of Muhajir separatism in Pakistan. Journal of asian African Affairs,
1(2), 101 - 120.
Fischer, C., Wartick, M., & Mark, M. (1992). Detection Probability and Taxpayer Compliance: A
Review of the Literature. Journal of Accounting Literature, 11, 1 - 46.
Fisman, R., & Wei, S.-J. (2001). Tax Rates and Tax Evasion: Evidence from “Missing Import”
from China. NBER Working Paper N0. 8551.

203
Fisman, R., & Wei, S.-J. (2004). Tax Rates and Tax Evasion: Evidence from Missing Importas in
China. Journal of Political Economy, 112(2), 471 - 496.
Frary, R. B. (2003). A Brief Guide to Questionnaire Development. Blacksburg, VA: Virginia
Polytechnic Institute and State University.
Freedman, P., & Goldstein, K. (1999). Measuring media exposure and the effects of Negative
Campaign Ads. American Journal of Political Science, 43(4), 1189 - 1208.
Frey, B. (1997). Not just for the money: An economic theory of personal motivation. Cheltenham:
Edward Elgar.
Friedman, E., Johnson, S., Kaufmann, D., & Zoido-Lobaton, P. (2000). Dodging the Grabbing
Hand : The Determinants of Unofficial Activity in 69 Countries. Journal of Public
Economics, 76, 459 - 493.
Gangl, K., Kirchler, E., Lorenz, C., & Torgler, B. (2015). Wealthy tax non-filers in a developing
nation: The roles of taxpayer knowledge, perceived corruption and Service Orientation in
Pakistan. Center for research in economics, management and the arts working paper series
No. 2015-08.
Gangl, K., Kirchler, E., Lorenz, C., & Torgler, B. (2015). Wealthy Tax Non-filers in Developing
Countires : Taxpayers Knowledge, Perceived Corruption and Service Orientation in
Pakistan . https://papers.ssrn.com/sol3/papers.cfm?abstract_id=2643456.
Gashi, M., & Kukaj, H. (2016). The Effect of Tax Rates on Fiscal Evasion and Avoidance.
European Journal of Sustainable Development, 5(1), 31 - 38.
Gemmell, N., & Hasseldine, J. (2012). The Tax Gap: A Methodological Review. Advances in
Taxation, 20, 203 - 231.
Gerxani, K. (2007). "Did you pay your taxes?" HOw (Not) to Conduct Tax Evasion Syrveys in
Transition Countries. Social Indicators Research, 80, 555 - 581.

204
Gillitzer, C., & Skov, P. E. (2018). The use of third-party information reporting for tax deductions:
evidence and implications from charitable deductions in Denmark. Oxford Economic
Papers, 70(3), 892 - 916.
Gitaru, K. (2017). The Effect of Taxpayer Education on Tax Compliance in Kenya : A Case Study
of SME's in Nairobi Central Business District. MPRA Paper 80344, University Library of
Munich, Germany.
Gitaru, K. (2017). The Effect of Taxpayer Education on Tax Compliance in Kenya. (A case study
of SME’s in Nairobi Central Business District). Munich Personal RePEc Archive, MPRA
Paper No. 80344.
Government of Balochistan. (2011). Balochistan Multiple Indicator Cluster Survey 2010. Quetta:
Government of Balocistan.
Government of Pakistan . (1991). Report of the National Finance Commission, Islamabad:
National Finance Commission Secretariat. Islamabad: NFC secretariat.
Government of Pakistan, World Bank, Georgia State University. (2009). Pakistan Tax Policy
Report - Tapping Tax Basis for Development . World Bank.
Grare, F. (2006). Pakistan: The Resurgence of Baluch Nationalism. Washington DC: Carnegie
Endowment for International Peace.
Groenewegen, P. (1987). Political Economy’ and ‘Economics : The New Palgrave. In M. M. J.
Eatwell, A Dictionary of Economics (Vol. 4, pp. 904 - 907). London: Macmillan.
Groot, W., & van den Brink, H. M. (2010). The effects of education on crime. Applied Economics,
42(3), 279 - 289.
Grundmann, S., & Lambsdorff, J. G. (2017). How income and tax rates provoke cheating – An
Experimantal Investigation of Tax Morale. Journal of Economic Psychology, 63, 27 - 42.
Gu¨th, W., Levati, V., & Sausgruber, R. (2005). Tax morale and (De-) centralization: An
Experimental Study. Public Choice, 125(1 - 2), 171 - 188.

205
Gunathilaka, C. (2012). Tax Evasion Ethics: Empirical Evidence from Sri Lanka. International
Conference of Business Management, Volume: 8.
Gupta, R., & McGee, R. (2010). Study on Tax Evasion Perceptions in Australasia. Australian Tax
Forum, 25, 507 - 534.
Habyarimana, J., Humphreys, M., Posner, D., & Weinstein, J. (2007). How Does ethnic diversity
undermine public goods provision? American Political Science Review, 101(4), 709 - 725.
Halkyard, A., Memon, N., Mookhey, S., & Salaheen, A. (2013). Indicators of Tax Morale : An
Exploratory Study. eJournal of Tax Research, 11(1), 5 - 22.
Halla, M. (2010). Tax morale and compliance behavior: First evidence on a causal link. IZA. IZA
Discussion Paper No. 4918. Bonn, Germany: Institute for the Study of Labor (IZA).
Halla, M. (2010). The link between the intrinsic motivation to pay and compliance behavior: A
Critical Appraisal of Existing Evidence. In F. G. Schneider, Handbook on the Shadow
Economy. Cheltenham, UK: Edgar Elgar.
Halla, M., & Schneider, F. G. (2008). Taxes and benefits: Two distinct options to cheat on the
State. IZA Discussion Paper No. 3536. Bonn, Germany: Institute for the Study of Labor
(IZA).
Halla, M., & Schneider, F. G. (2012). Two Options to Cheat on the State. Johannes Kepler
University.
Hallsworth, M., List, J. A., Metcalfe, R. D., & Vlaev, I. (2017). The behavioralist as tax collector:
Using natural field experiments to enhance tax compliance. Journal of Public Economics,
148, 14 - 31.
Hallsworth, M., List, J. A., Metcalfe, R. D., & Vlaev, I. (2017). The behavioralist as tax collector:
Using natural field experiments to enhance tax compliance. Journal of Public Economics,
148, 14 - 31.
Hallsworth, M., List, J., & Metcalfe, I. (2014). The Behavioralist as Tax Collector: Using Natural
Field Experiments to Enhance Tax Compliance. NBER Working Paper 20007.

206
Hanousek, J., & Palda, F. (2004). Quality of Government Services and the Civic Duty to Pay Taxes
in the Czech and Slovak Republics, and other Transition Countries. Kyklos International
Review of Social Sciences, 57(2), 149-300.
Haq, R., & Farooq, N. (2017). Impact of CPEC on Social Welfare in Pakistan: A District Level
Analysis. Pakistan Development Review, 56(4), 597 .
Harris, T. (1989). The effect of type of tax knowledge on individuals’ perceptions of fairness and
compliance with the federal income tax system: An Emperical Study. PhD Thesis,
University of South Carolina.
Harrison, D. A., & McLaughlin, M. E. (1993). Cognitive Process in Self-report Responses : Tests
of Item Context in Work Attitude Measures. Journal of Applied Psychology, 78, 129 - 140.
Hasegawa, M., Hoopes, J. L., Ishida, R., & Slemrod, J. (2013). The effect of public disclosure on
reported taxable income: Evidence from individuals and corporations in Japan. National
Tax Journal, 66, 571 - 608.
Hasegawa, M., Hoopes, J., Ishida, R., & Slemrod, J. (2013). The effect of public disclosure on
reported taxable income: Evidence from individuals and corporations in Japan. National
Tax Journal, 66, 571 - -608.
Hashimzade, N., Myles, G., & Tran-Nam, B. (2010). New Approaches to the Economics of Tax
Evasion. Exeter, United Kingdom, : University of Exeter.
Hassan, B. (2018, September 24). Bridging the Tax Gap. Dawn News, p. Online publication.
Retrieved from dawn.com/news/1434551
Hassan, B. (2018, September 24). Bridging the Tax Gap. Dawn News, p. online publication.
Retrieved from dawn.com/news/1434551
Hassan, B. (2018, August 20). Is Tax Evasion Always bad for Economic Growth. Dawn.
Hasseldine, D., & Bebbington, K. J. (1991). Blending Economic Deterrence and Fiscal Psychology
Models in the Design of Responses to Tax Evasion. The New Zealand Experience. . Journal
of Economic Psychology, 12(2), 299 - 324.

207
Heath, E. B., & Jones, L. R. (2013, July). Using Electricity Demand to Estimate State-Level
Underground Economic Activity in the US. International Journal of Business and Social
Science, 4(8 ), 272-280.
Heath, E. B., & Jones, L. R. (2013). Using Electricity Demand to Estimate State-Level
Underground Economic Activity in the US. International Journal of Business and Social
Science, 4(8), 272-280.
Heilbroner, R. (1980). The Worldly Philosophers: The Lives, Times and Ideas of the Great
Economic Thinkers. New York: Simon and Schuster.
Henderson, A. M. (2012). The Theory of Social and Economic Organization. (T. Parsons, Ed.)
Eastford: Martino Fine Books.
Henrich, J., Ensminger, J., McElreath, R., Barr, A., Barrett, C., Bolyanatz, A., . . . Ziker, J. (2010).
Markets, Religion, Community Size, and the Evolution of Fairness. Science 327, 1480 -
1484.
Hinkin, T. R. (1998). A Brief Tutorial on the Development of Measures for Use in Survey
Questionnaires. Organizational Research Methods, 1(1), 104 - -121.
Hite, P. A. (1995). Identifying and Mitigating Taxpayer Compliance. Paper given at Australian
Tax COmpliance Conference (p. December). Canberra, Australia: ATCC.
Hite, P. A. (1997). Identifying and Mitigating Taxpayer Non-compliance. Australian Tax Forum,
13(2), 155 - -180.
HMRC. (2019). Tackling tax avoidance, evasion, and Other Forms of Non-compliance. London,
UK: Her Mejasty's Revenue and Customs.
Hodgson, G. M., & Jiang, S. (2007). The Economics of Corruption and the Corruption of
Economics: An Institutionalist Perspective. Journal of Economic Issues, 41(4), 1043 -
1061.

208
Hofmann, E., Hoelz, E., & Kirchler, E. (2008). Preconditions of Voluntary Tax Compliance:
Knowledge and Evaluation of Taxation, Norms, Fairness and Motivation to Cooperate.
Zeitschrift für Psychologie, 216(4), 209 - 217.
Hofmann, E., M. V., C. B., & E. K. (2017). Tax compliance across sociodemographic categories:
Metaanalyses of survey studies in 111 countries. Journal of Economic Psychology, 62, 63
- 71.
Hofmann, E., Voracek, M., Bock, C., & Kirchler, E. (2017). Tax compliance across
sociodemographic categories: Meta-analyses of survey studies in 111 Countries. Journal
of Economic Psychology, 62, 63 - 71.
Hofstede, G. (2005). Cultures and organizations: Software of the mind (2nd ed.). New York, USA:
McGraw Hill.
Hofstede, G. H. (1980). Cultures consequences: International differences in work-related values.
Beverly Hills, CA: Sage Publications.
Holtz, B. (2013). Trust primacy: A model of the reciprocal relations between trust and Perceived
Justice. Journal of Management, 39(7), 1891 - 1923.
Hong, Y. F. (2017). Tax Planning or Tax Avoidance? Retrieved 07 15, 2018, from SIATP.org.sg:
https://www.siatp.org.sg/images/PDF/taxplannavoid-siatpmbers.pdf
Horodnic, I. A. (2018). Tax Morale and Institutional theory : A Systematic Review. International
Journal of Sociology and Social Policy, 38(9 / 10), 868 - 886.
Horrigan, K. (2010, 09 26). Take a Lesson from Pakistan. Taxes are for Suckers. Saint Louis Post-
Dispatch.
Houston, J., & Tran, A. (2001). A survey of tax evasion using the randomized response technique.
In Advances in Taxation (Vol. 13, pp. Jodie Houston, , Alfred Tran, (2001), A survey of
tax evasion using the randomized respons69 - 94). Emerald Group Publishing Limited.
IMF. (2015). Current challenges in revenue Mobilization : Improving Tax Compliance.
Washington D.C.: International Monetary Fund.

209
Imran, M., Butt, A. T., & Jehangir, H. (2018). EDUCATIONAL ATTAINMENT IN PAKISTAN:
Measurement and Barriers at the District Level. Lahore, Pakistan: Punjab Economic
Research Institute (PERI).
India Today. (2017, February 02). Union Budget 2017-18: Income Tax rate halved to 5 per cent
for Rs 2.5-5 lakh slab. India Today, p. Online Publication. Retrieved June 20, 2019, from
https://www.indiatoday.in/budget-2017/story/union-budget-2017-income-tax-rate-slabs-
958339-2017-02-01
Internal Revenue Service. (2016). Federal Tax Compliance Research : Tax Gap Estimates for Tax
Years 2008 - 2010. USA: IRS. Retrieved from https:www.irs.gov/pub/irs-soi/p1415.pdf
Iqbal, H., & Khan, S. (2014). FEDERALLY ADMINISTERED TRIBAL AREAS (FATA): From
No-Man's land to Political Mainstreaming. Journal of COntemporary Studies, 3(1), 64 -
82.
Iqbal, Z., Qureshi, S. K., & Mahmood, R. (1998). Assessment, The Underground Economy and
Tax Evasion in Pakistan : A Fresh. Islamabad, Pakistan: Pakistan Institute of Development
Economics.
Iqbal, Z., Qureshi, S. K., & Mehmood, R. (1998). The Underground Economy and Tax Evasion in
Pakistan : A Fresh Assessment. Islamabad: Pakistan Institute of Development Economics.
Iqbal, Z., Qureshi, S. K., & Mehmood, R. (1999). The Underground Economy and Tax Evasion in
Pakistan : A Fresh Assessment. Islamabad, Pakistan : Pakistan Institute of Development
Economics.
Jahnkea, B., & Weisser, R. A. (2018). How does petty corruption affect tax morale in Sub Saharan
Africa ? European Journal of Political economy, 1 - 17.
Jain, A. (2001). Corruption: A Review. Journal of Economic Surveys, 15, 71 - 120.
Jain, A. (2016). Impact of E-Taxation on Revenues of Central Indirect Taxes in India. PhD Thesis.
James, S., & Alley, C. (2002). Tax Compliance, Self-Assessment and Tax Administration. Journal
in Finance and Management in Public Services, 2(2), 27 - 42.

210
Jeyapalan, K., & Abdul-Jabbar, H. (2006). Gender and Ethnicity Differences in Tax Compliance.
Asian Academy of Management Journal, 11(2), 73 - 88.
Jimenez, P., & Iyer, G. S. (2016). Tax compliance in a social setting: The influence of social norms,
trust in government, and perceived fairness on taxpayer compliance. Advances in
Accounting, 34, 17–26.
John Cullis, P. J. (2012). Social norms and tax compliance: framing the decision to pay tax. Journal
of Socio Economics, 41(2), 159 - 168.
Johnson, T. J., & Kaye, B. K. (2003). How the Web Influenced political attitudes and behaviors in
the 1996 and 2000 presidential elections. The International Journal of Press/Politics, 8(3),
9 - 34.
Joulfaian, D., & Rider, M. (1998). Differential Taxation and Tax Evasion by Small Businesses.
National Tax Journal, 51(4), 676 - 687.
Jun, B. W., & Yoon, S. M. (2018). Taxpayer’s Religiosity, Religion, and the Perceptions of Tax
Equity : Case of South Korea. Religions, 9, 333 - 347.
Kahraman, C., & Sarı, İ. U. (2016). Fuzzy Central Tendency Measures. Studies in Fuzziness and
Soft Computing, 65 – 83.
Kaliberda, A., & Kaufmann, D. (1996). Integrating the Unofficial Economy into the Dynamics of
Post-Socialist Economies: A Framework of Analysis and Evidence. World Bank Polivy
Research Working Paper, WPS 1691, 1-39.
Kangave, J., Nakato, S., Waiswa, R., & Zzimbe, P. (2016). Boosting revenue collection through
taxing high net worth individuals: The Case of Uganda. ICTD Working paper, No. 2541.
Kasim, R., Umar, M. A., Martin, D., & Yassin, A. M. (2018). Public Goods Delivery as a
Contributing Factor to the Property Tax Revenue Generation in Malaysian Local
Governments. Advance Science Letters, 24(6), 4674 - 4678.
Kasipilla, J., N. A., & Amran, N. A. (2003). The Influence of Education on Tax Avoidance and
Tax Evasion. eJournal of Tax Research, 1(2), 134 - 146.

211
Kasipillai, e., Aripin, N., & Amran, N. A. (2003). The Influence of Education on Tax Avoidance
and Tax Evasion. eJournal of Tax Research, 1(2), 134 - 146.
Kasippilai, J. (2000). Taxpayer knowledge index as a clue for non-compliance. Journal on
Pakistan’s Taxation Laws, 81(3).
Kastlunger, B., Dressler, S. G., Kirchler, E., Mittone, L., & Voracek, M. (2010). Sex differences
in tax compliance: Differentiating between demographic sex, gender-role orientation, and
prenatal masculinization (2D:4D). Journal of Economic Psychology, 31, 542 - 552.
Kastlunger, B., Lozza, E., Kirchler, E., & Schabmann, A. (2013). Powerful authorities and trusting
citizens: The Slippery Slope Framework and tax compliance in Italy. Journal of Economic
Psychology, 34c, 36 - 45.
Kayani, K. (2016, Dec 24). Country nowhere Near to Tax-to-GDP target : NFC. Dawn.
Kemal, M. A. (2007). Fresh Assessment of the Underground Economy and Tax Evasion in
Pakistan: Causes, Consequences, and Linkages with the Formal Economy. PIDE Working
Paper 2007:13.
Kennedy, C. H. (1993). Managing Ethnic Conflict: the case study of Pakistan. Regional Politics
and Policy, 3(1), 123 - 143.
Keohane, R. (1984). After Hegemony: Cooperation and Discord in World Political Economy. New
Jercy: Prinston University Press.
Khan, A. (1992). Determinants of Income Tax Base in Pakistan: A Policy Review. Pakistan
Development Review, 31(4), 1123-1142.
Khan, A. (2001). Ethnic NAtionalism and the State in Pakistan. Wollongong: University of
Wollongong.
Khan, A. (2002). Pakistan’s Sindhi ethnic nationalism: migration, marginalisation and the threat
of Indianization. Asian Survey, 42(2), 213 - 229.
Khan, A. (2002). Pakistan’s Sindhi ethnic nationalism: migration, marginalisation and the threat
of Indianization. Asian Survey, 42(2), 213 - 229.

212
Khan, A. (2004). Muhajir ethnic nationalism in Pakistan : El Dorado Gone Sour. Asian Studies
Review, 28(1), 41 - 56.
Khan, A., & Mehmood, N. (2009). Education order in Punjab : A District LEvel Study. The
Pakistan Development Review, 635 - 652.
Khan, R. E., & Gill, A. R. (2010). Determinants of inflation: A case of pakistan (1970 - 2007).
Journal of Economics, 1(1), 45 - 51.
Khan, W. A. (2014). Causes of Tax Evasion in Pakistan: A case study on Southern Punjab.
International Journal of Accounting and Financial Reporting, 4(2), 273 - 292.
Khan, W. A., & Ahmad, P. F. (2014). Causes of Tax Evasion in Pakistan : A Case Study of
Douthern Punjab. International Journal of Accounting and Financial Reporting, 4(2), 273
- 293.
Khan, W. A., & Ahmed, P. F. (2014). Causes of Tax Evasion in pakistan: A Case Study on
Southern Punjab . International Journal of Accounting and Finance Reporting, 2(4), 273-
293.
Khan., A. A., Ahmed, Q. M., & Hyder, K. (2007). Determinants of recent inflation in Pakistan.
Karachi: Social Policy and Development Centre (SPDC).
Khatwani, M. K., & Abbasi, I. A. (2014). Assessment of Socio-Political and Socioeconomic
Factors Causing Sindhi - Muhajirs Conflicts in Sindh - Pakistan. British Journal of
Interdisciplinary Studies, 1(1), 40 - 51.
Khumalo, B. (2012). Defining Economics in the Twenty First Century. Modern Economy, 3, 597
- 607.
Kinsey, K. A. (1991). Deterrence and alienation effects of IRS enforcement: An analysis of survey
data Issue 9102. Americal Bar Foundation.
Kiow, T. S., Salleh, M. F., & Kassim, A. A. (2017). The Determinants of Individual Taxpayers’
Tax Compliance Behaviour in Peninsular Malaysia. International Business and Accounting
Research Journal, 1(1).

213
Kirchler, E. (2007). (2007). The economic psychology of tax behaviour. Cambridge: Cambridge
University Press.
Kirchler, E. (2007). The Economic Psychology of Tax Behaviour. Cambridge MA: Cambridge
University Press.
Kirchler, E., Hoelzl, E., & Wahl, I. (2008). Enforced Versus Voluntary Tax Compliance the
‘Slippery Slope’ Framework. Journal of Economic Psychology, 29, 210 - 225.
Kirchler, E., Hoelzl, E., & Wahl, I. (2008). Enforced versus voluntary tax compliance:
The‘‘slippery slope’’ framework. Journal of Economic Psychology, 29(2), 210 - 225.
Kirchler, E., Maciejovsky, B., & Schneider, F. (2003). Everyday Representations of Tax
Avoidance, Tax Evasion, and Tax Flight: Do Legal Differences Matter? Journal of
Economic Psychology, 24(4), 535 - 553.
Kirchler, E., Maciejovsky, B., & Schneider, F. (2003). Tax avoidance, tax evasion, and tax flight:
Do legal differences matter? Journal of Economic Psychology, 24(4), 535 - -553.
Kirchler, E., Muelbacher, S., Kastlunger, B., & Wahl, I. (2007). Why pay taxes? A review of tax
compliance decisions (Working Paper 07 - 03 ed.). Altanta, USA: Georgia State
University.
Kirchler, E., Niemirowski, A., & Wearing, A. (2006). Shared subjective views, intent to cooperate
and tax compliance: Similarities between Australian taxpayers and tax officers.
International Journal of Economic Psychology, 27(4), 502 - 517.
Klepper, S., & Nagin, D. (1989). Tax Compliance and Perceptions of the Risks of Detection and
Criminal Prosecution. Law & Society Review, 23(2), 209 - 240.
Kleven, H. J., & Waseem, M. (2011). Tax Notches in Pakistan: Tax Evasion, Real Responses and
Income Shifting. Quarterly Journal of Economcics.
Kleven, H. J., & Waseem, M. (2012). Behavioral Responses to Notches: Evidence from Pakistani
Tax Records. ICG Working PAper.

214
Kleven, H., Knudsen, M., Kreiner, C., Pedersen, S., & Saezi, E. (2011). Unwilling or unable to
cheat? Evidence from a tax audit experiment in Denmark. Econometrica, 79(3), 651 - 692.
Klevin, H. J., & Waseem, M. (2011). Tax Notches in Pakistan: Tax Evasion, Real Responses, and
Income Shifting. Quarterly Journal of Economics.
Kołodziej, S. (2011). The Role of Education in Forming Voluntary Tax Compliance. General and
Professional Education, 1/2011, 22 - 25.
Kondelaji, M. H., Sameti, M., Sameti, M., & Moayedfar, R. (2016). Analyzing Determinants of
Tax Morale Based on Social Psychology Theory : Case Study of Iran. Iran. Econ. Rev.,
20(4), 579 - 595.
Kornhauser, M. E. (2007). A Tax Morale Approach to Compliance: Recommendations for the IRS.
Florida Tax Review, 8, 599 - 632.
Koumpias, A. M., & Martinez-Vazquez, J. (2019). The Impact of Media Campaigns on Tax Filing:
Quasi-Experimental : Evidence from Pakistan. Georgia State University: International
Centre for Public Policy.
Lacko, M. (2000, March). Hidden Economy - An Unknown Quantity? Comparative Analysis of
Hidden Economies in Transition Countries, 1989–95. Economics of Transition, 8(1), 117-
149.
Lago-Pe˜nas, I., & Lago-Pe˜nas, S. (2010). The determinants of tax morale in comparative
Prespective Evidence from European countries. European Journal of Political Economy,
26, 441 - 453.
Lassen, D. D. (2007). Ethnic Divisions, Trust and the Size of Infomral Sector. Journal of Economic
Behavior and Organization, 63(3), 423 - 438.
Laury, S., & Wallace, S. (2005). Confidentiality and taxpayer compliance. National Tax Journal,
58, 427 - 438.

215
Lefebvre, M., Pestieau, P., Riedl, A., & Villeval, M. C. (2015). Tax Evasion and Social
Information: An Experiment in Belgium, France and the Netherlands. International Tax
and Public Finance, 22, 401 - 425.
Levesque, J. (2013). MAnaging Diversity in Pakistan : Nationalism, Ethnic Politics and Cultural
Resistance. South Asia Multidisciplinary Journal.
Levi, M., Sacks, A., & Tyler, T. R. (2009). Conceptualizing legitimacy, measuring legitimating
beliefs. American Behavioral Scientist, 53, 354 - 375.
Levin, M., & Satarov, G. (2000). Corruption and Institutions in Russia. European Journal of
Political Economy, 16, 113 - 132.
Lewis, A. (1978). Perception of tax rates. British Tax Review, 6, 358-366.
Lewis, A. (1979). An empirical assessment of tax mentality. Public Finance. Public Finance, 2,
245 - -257.
Lewis, A. (1982). The psychology of taxation. Oxford: Martin Robertson.
Lewis, A. (1982). The psychology of taxation. Oxford: Martin Robertson.
Li, X. (2010). Social identities, ethnic diversity, and tax morale. Public Finance Review, 38(2),
146 - 177.
Lim, S. S., Updike, R. L., Kaldjian, A. S., Barber, R. M., Cowling, K., York, H., . . . M, C. J.
(2018). Measuring human capital: A systematic analysis of 195 countries and territories
(1990 to 2016,]. The Lancet, 392, 1217 - 1234.
Lin, M. T., & Carrol, C. (2000). The impact of tax knowledge on the perception of tax fairness and
attitudes towards compliance. Asian Review of Accounting, 8(1), 44 – 58.
Lin, M., & Carrol, C. (2000). The Impact of Tax Knowledge on the Perceptions of Tax Fairness
and Attitudes Towards Compliance. Asian Review of Accounting, 8(1), 44 - 58.
Lindblom, C. E. (1977). Politics and Markets - the World's Political Econimic System. New Jercy:
Basic Books.

216
Lipsey, R., & Chrystal, K. A. (1995). Positive Economics. Oxford: Oxford University Press.
Litina, A., & Palivos, T. (2016). Corruption: Tax evasion and social values. Journal of Economic
Behavior & Organization, 24(C), 164 - 177.
Litinaa, A., & Palivos, T. (2015). Corruption, Tax Evasion and Social Values. Journal of Economic
Behavior & Organization, 124, 164 / 177.
Lohse, T., & Qari, S. (2014). Gender differences in deception behaviour – The role of the
counterpart. Applied Economics, 21(10), 702 - 705.
Loo, E. C. (2006). Tax Knowledge Tax Structure and Compliance: A Report on a Quasi-
Experiment. New Zealand Journal of Taxation Law and Policy, 12, 117 - 140.
Loo, E. C., McKerchar, M., & Hansford, A. (2009). Understanding the compliance behavior of
Malaysian individual taxpayers using a mixed method approach. Loo, E. C., McKerchar,
M., & Hansford, A. (2009). Understanding the compliance behavior of Malaysian
individual Journal of the Australasian Tax Teachers Association, 4(1), 181 - 202.
Loo, E. C., McKerchar, M., & Hansford, A. (2010). FIndings on the impact of Self Assessment on
the compliance behavior of individual Taxpayers in Malaysia. Journal of Australasian Tax
Teachers Association, 4(1), 181 - 202.
Luttmer, E. F., & Singhal, M. (2014). Tax morale. Journal of Economic Perspectives, 28(4), 149
– 168.
Luttmer, E. F., & Singhal, M. (2014). Tax Morale. Journal of Economic Perspectives, 28(4), 149
- 168.
Macharia, J. K. (2014). The Effect of Tax Evasion on Tax Revenues in Kenya. Masters Thesis.
Maciejovsky, B., Schwarzenberger, H., & Kirchler, E. (2011). Rationality vs. emotions: The case
of tax ethics and compliance. Journal of Business Ethics, 109, 339 - 350.
Mack, N., Woodsong, C., Macqueen, K. M., Guest, G., & Namey, E. (2011). Qualitative Research
Methods : A Data Collector's Field Guide. North Carolina, USA: Family Health
International.

217
Malik, R. (2017, October 22). Womn in Pakistan's Workforce. The NAtion.
Marakbi, R., & Villieu, P. (2018). Tax Evasion, Public Debt and Aggregate Instability. University
of Orléans, Laboratoire d’Économie d’Orléans, CNRS.
Marjit, S., Seidel, A., & Thum, M. (2016). Tax Evasion, Corruption and Tax Loopholes. German
Economic Review, 18(3), 283 - 301.
Markel, D. (2001). Are Shaming Punishments Beautifully Retributive: Retributivism and the
Implications for the Alternative Sanctions Debate. Vanderbilt Law Review, 54, 2157 -
2242.
Marshall, A. (1890). Principles of Economics. London and New York: MacMillan & Co.
Martinez-Vazquez, J., & Torgler, B. (2009). The evolution of tax morale in modern Spain. Journal
of Economic Issues, 43(1), 1 - 28.
Maslow, A. H. (1970). Motivation and personality. Nw York, USA: Harper & Row.
Mason, A. (2001). Population Change and Economic Development in East Asia: Challenges Met,
Opportunities Seized. Stanford, CA: Stanford University Press. .
Mason, R., & Calvin, L. (1978). A Study of Admitted Income Tax Evasion. Law and Society
Review, 13(1), 74-89.
Mauro, P. (2002). Corruption and the Composition of Government Expenditure. In G. T. Abed, &
S. Gupta, Governance, Corruption and Economic Performance (pp. 225 - 244).
Washington D.C.: Internationmal Monetary Fund.
McCormick, K. (2006). Veblen in Plain English. New York: Cambria Press.
McCusker, K., & Gunaydin, S. (2014). Research using qualitative, quantitative or mixed methods
and choice based on the research. Perfusion, 30(7), 537 - 542.
McGee, R. W. (1997). The Ethics of Tax Evasion and Trade Protectionism from an Islamic
Perspective. Commentaries on Law and Public Policy, 1, 250 - 262.

218
McGee, R. W., & Ross, A. (2014). Education Level and Ethical Attitude Toward Tax Evasion : A
Six - Country Study. SSRN Electronic Journal, 15(2).
McGee, R. W., & Ross, A. M. (2012). Education level and ethical attitude towards Tax Evasion :
A six-country study. Journal of Legal, Ethical and Regulatory Issues, 15(2), 93 - 138.
McKerchar, M. (2001). Why do taxpayers comply? Past lessons and future directions in
Developing a Model of Compliance Behavior. Australian Tax Forum, 16, 99 - -134.
McKerchar, M., Bloomquist, K., & Pope, J. (2013). Indicators of tax morale: an exploratory study.
eJournal of Tax Research (2013), 11(1), 5 - -22.
Mehrara, M., M. B., & S. R. (2016). The Impact of Government Spending on Inflation through the
Inflationary Environment, STR Approach. World Scientific News, 37, 153 - 167.
Memon, W. U. (2018, October 07). Tax Administration and Tax Evasion. The Nation, p. online
Publication. Retrieved July 10, 2019, from https://nation.com.pk/21-Oct-2018/tax-
administration-and-tax-evasion
Miliban, R. (1968). The State in Capitalist Society: The Western System of Power. New York:
Basic Books.
Mittone, L., Kastlunger, B., Dressler, S. G., Kirchler, E., & Voracek, M. (2010). Sex differences
in tax compliance: Differentiating between demographic sex, gender-role orientation, and
prenatal masculinization (2D:4D). Journal of Economic Psychology, 31, 542 - 552.
Mohdalia, R., Isab, K., & Yusoff, S. H. (2014). The impact of threat of punishment on tax
compliance and noncompliance attitudes in Malaysia. Procedia - Social and Behavioral
Sciences, 164, 291 – 297.
Morgan-Collins, M. (2013). Universal suffrage and the rise of socialist parties: Evidence from
eleven European countries. American Political Science Association 2013 annual meeting
Paper,
https://www.researchgate.net/publication/256053534_Universal_Suffrage_and_the_Rise_
of_Socialist_Parties_Evidence_from_Eleven_European_Countires.

219
Morris, S. D. (2011). Forms of Corruption. Murfreesboro, Tennessee: Middle Tennessee State
University.
Moussaïd, M., Kämmer, J. E., Analytis, P. P., & Neth, H. (2013). Social Influence and the
Collective Dynamics of Opinion Formation . PLOS ONE, 1 - 24.
Muehlbacher, S., Kirchler, E., & Schwarzenberger, H. (2011). Voluntary versus enforced tax
compliance: Empirical evidence for the ‘‘slippery slope” Framework. European Journal
of Law and Economics, 32, 89 - 97.
Mughal, M. M., & Akram, M. (2012). Reasons of Tax Avoidance and Tax Evasion: Reflections
from Pakistan. Journal of Economics and Behavioural Studies, 4(4), 217-222.
Muhrtala, T. O., & Ogundeji, M. (2013). Professionals’ Perspective of Tax Evasion: Some
Evidence from Nigeria. Universal Journal of Accounting and Finance, 1(2), 35 - 41.
Mukhlis, I., Utomo, S. H., & Soesetio, Y. (2015). The Role of Taxation Education on Taxation
Knowledge and Its Effect on Tax Fairness as well as Tax Compliance on Handicraft SMEs
Sectors in Indonesia. nternational Journal of Financial Research, 6(4), 161 - 169.
Murtuza, A., & Ghazanfar, S. (1998). “Taxation as a Form of Worship: Exploring the Nature of
Zakat. Journal of Accounting, Ethics and Public Policy, 1(2), 134 - 161.
Musa, S. U., Saad, N., & Ibrahim, I. (2016). Small Corporate Tax Compliance Behavior and the
Indirect Effect of Tax Compliance Costs: A Proposed Model. International Journal of
Management Research & Review, 6(12), 1740 - 1750.
Mushtaq, M. (2016). Regional Identities in Quest of Separate Provinces: A New Challenge for the
Pakistani Federation. Journal of Political Studies, 23(1), 289 - 307.
Mushtaq, M., & Shaheen, M. (2017). The Siraiki Province Movement in Punjab, Pakistan :
Prospects and Challenges. Journal of the Punjab University Historical Society, 30(2), 139
- 150.
Mustafa, U. (2011). Fiscal Federalism in Pakistan: The 7th National Finance Commission Award
and its Implications. Islamabad: Pakistan Institute of Development Economics.

220
Nagel, H., Huber, L. R., Praag, M. V., & Goslinga, S. (2018). The effect of a tax training program
on tax compliance and business outcomes of starting entrepreneurs: Evidence from a field
experiments. Journal of Business Venturing,
https://doi.org/10.1016/j.jbusvent.2018.10.006.
Nathan, T. M. (2014). The Impact of Demographic Factors on Tax Compliance Attitude and
Behavior in Malaysia. Journal of Finance, Accounting and Management, 5(1), 109 - 124.
NatrahSaad. (2014). Tax Knowledge, Tax Complexity and Tax Compliance: Taxpayers’ View.
Procedia - Social and Behavioral Sciences, 109, 1069 - 1075.
Naveed, A. (2017). Geography of Poverty and Public Service Delivery in Pakistan. Islamabad:
Pakistan Poverty Alleviation Fund.
Naveed, A. (2017). Geography of Poverty and Public Service Delivery in Pakistan . Islamabad:
PPAF.
NCFR. (2019, March 17). National Council on Family Relations. Retrieved from www.ncfr.org:
https://www.ncfr.org/news/making-case-policy-implications-research-reflexive-
contemplation-and-call-action
Nchor, D., & Konderla, T. (2016). The Underground Economy of Czech Republic and Tax
Evasion: Thr Currency Demand Approach. Procedia - Social and Behavioral Sciences,
220, 294-301.
Neef, D. (1998). The Knowledge Economy. Woburn: Butterworth Heinemann.
Nelson, C. R. (2008). Macroeconomics: an Introduction . In An Overview of Economics (pp. 1 -
17). Washington D.C. : University of Washington (online publication).
Nerre, B. (2006). The concept of tax culture. Intereconomics(July/August), 189 - 194.
Niemirowski, P., Baldwin, S., & Wearing, A. J. (2003). The Influence of Tax Related behaviours,
beliefs, attitudes, and values on Australian taxpayer compliance : Is Tax avoidance
intentional and how serious an offence is it? Journal of Australian Taxation, 6(1), 132 -
165.

221
Niemirowski, P., Wearing, A. J., Baldwin, S., Leonard, B., & Mobbs, C. (2003). The influence of
tax related behaviours, beliefs, attitudes and values on Australian taxpayer compliance, Is
tax avoidance intentional and how serious an offence is it? JOURNAL OF AUSTRALIAN
TAXATION, 6(1), 132 - 165.
Norris, P. (2000). A virtuous circle: Political communications in postindustrial societies.
Cambridge University Press.
Nourzad., S. E. (1986). Inflation and Tax Evasion: An EmpiricalAnalysis. Review of Economics
and Statistics, 68.
NRSP. (2018). Gender Mainstreaming Policy and Action Plan. Islamabad: National Rural Support
Program.
Nunnally, J. C. (1976). Psychometic Theory (Vol. 2nd Edition). New York: McGraw-Hill.
Nurmantu, S. (2010). Introduction to Taxation (Second ed.). Granite: Jakarta: Granite.
Obid, S. N. (2004). THE INFLUENCE OF PENALTIES ON TAXPAYERS’COMPLIANCE: A
COMPARISON OF THETHEORETICAL MODELS. IIUM Journal of Economic and
Management, 12(1).
OECD. (2006). Using Third Party Information Reports to Assist Taxpayers Meet their Return
Filing Obligations— Country Experiences with the Use of Pre-populated Personal Tax
Returns . Paris: Centre for Tax Policy and Administration.
Olowookere, J. K., & Fasina, H. T. (2013). Taxpayers’ Education: A Key Strategy in Achieving
Voluntary Compliance in Lagos State, Nigeria. European Journal of Business and
Management, 5(10), 145 - 154.
Oppenheum, F. E. (1978). Politics Revisited. The Journal of Politics, 40(3), 589 - 608.
Ortega, D., Ronconi, L., & Sanguinetti, P. (2013). Reciprocity and Willingness to Pay Taxes,
Evidence from a Survey Experiment in Latin America. CIAS Working Paper 2. Centro de
Investigación y Acción Social, Buenos Aires, Argentina.

222
Otto, F., Michael, F., Philipp, G., Gertraud, L., Martina, N., & Martin, S. (2015). Tax avoidance,
Tax Evasion and Tax Hevans. Vienna, Australia: Chamber for Workers and Employees for
Vienna.
Pak Observer. (2016, February 20). Pakistan third highest country subject to taxes. Pakistan
Observer.
Palil, M. R. (2005). Does tax knowledge matter in self assessment system? Evidence from the
Malaysian tax administration. alil, M. R. (2005). Does tax knowledge matter in self
assessment Journal of American Academy of Business, 6(2), 80 - 85.
Palil, M. R., Akir, M. R., & Ahmad, W. F. (2013). The Perception of Tax Payers on Tax
Knowledge and Tax Education with Level of Tax Compliance: A Study the Influences of
Religiosity. ASEAN Journal of Economics, Management and Accounting, 1(1), 118 - 129.
Palil, M. R., Akir, M. R., & Ahmad, W. F. (2013). The Perception of Tax Payers on Tax
Knowledge and Tax Education with Level of Tax Compliance: A Study the Influences of
Religiosity . ASEAN Journal of Economics, Management and Accounting , 118-129 .
Pappa, E., Sajedi, R., & Vella, E. (2015). Fiscal consolidation with tax evasion and corruption. .
Journal of International Economics , 96, 556 - 575.
Pasha, H. A. (1995). Political Economy of Tax Reforms: GThe Pakistan Experience. Karachi:
Social Policy and Development Centre.
Pasha, H. A., & Pasha, A. G. (2015). The Future Path of Tax Reforms in Pakistan. In R. Amjad,
& S. J. Burki, PAkistan - Moving the Economy Forward (pp. 171 - 197). Delhi: Cambridge
University Press.
Paul, P., Shivraj, K., & Bhuimali, A. (2016). Internet User Base in Asian Countries: An Analytical
Review. Indian Journal of Information Sources and Services, 6(2), 37 - 40.
Perez-Truglia, R., & Troiano, U. (2016). Shaming Tax Delinquents: Evidence from a Field
Experiment in the United States. NBER Working Paper No. 21264.

223
Perumal, K. (2008). Tax Fairness Dimensions and Tax Compliance in an Asian Context: The
Malaysian Perspective. International Review of Business Research Papers, 4(5), 11 - 19.
Phillips, M. D. (2011). Taxpayer response to targeted audits, PhD Dessertation. Retrieved
February 10, 2019, from
http://home.uchicago.edu/~mdp/webdocs/TargetedAudits_20101117.pdf.
Phillips, M. E. (2009). When do Elites Pay Taxes? Tax Morale and State Building in Developing
. WIDER Elites conference.
PIPS. (2011). Understanding North Punjab in the Context of Pakistani. Islamabad: Pakistan
Institute for Peace Studies (PIPS).
Polinsky, A. M., & Shavell, S. (2000). The Economic Theory of Public Enforcement of Law.
Journal of Economic Literature, 38, 45 - 76.
Pomeranz, D. (2015). No taxation without information: Deterrence and self-enforcement in the
Value added Tax. American Economic Review, 105(08), 2539 - 2569.
Povoledo, E. (2011, August 08). Italy Tries to Get Tax Cheats to Pay Up. New York Times.
Pratama, A. (2018). Individual Taxpayer Characteristics and Taxpayer Knowledge: Exploratory
Survey on Individuals Taxpayers in Bandung City, Indonesia. Review of Integrative
Business and Economics Research, 7(Supplimentary Issue No. 1), 338 - -349.
Price, V., & Zaller, J. (1993). Who gets the news? Alternative measures of news Receptions and
theri Implications for Research. Public Opinion Quarterly, 57(2), 133 - 164.
Prinz, A., Muehlbacher, S., & Kirchler, E. (2014). The slippery slope framework on tax
compliance: An attempt to formalization. Journal of Economic Psychology, 40C, 20 - 34.
RAFTAAR. (2015). Pakistan's Public Expenditures : Insights & Reflections. Islamabad:
Consortium for Development Policy Research.
Rantelangi, C., & Majid, N. (2017). Factors that Influence the Taxpayers’ Perception on the Tax
Evasion. Advances in Economics, Business and Management Research (AEBMR), 35, 219
- 225.

224
Rattray, J., & Jones, M. (2007). Essential elements of questionnaire design and Development.
Journal of Clinical Nursing, 16(2), 234-243.
Rayat, C. S. (2018). Measures of Central Tendency. Statistical Methods in Medical Research, 33–
46., 33 - 46.
Raza, S. I. (2018, April 27). Nawaz says Gen Zia praised him for building quality road. Dawn
Newspaper.
Recardson, G. (2006). Determinants of Tax Evasion : A Cross-Country Investigation. Journal of
International Accounting, Auditing and Taxation, 15(2), 150 - 169.
Recardson, G. (2008). The Relationship between Culture and Tax Evasion Across Countries :
Addition Evidence and Extentions. Journal of International Accounting, Auditing and
Taxation, 17(2), 67 - 78.
Rehman, J. (1994). Self –determination, state-building and the Muhajirs: an international legal
perspective of the role of Indian Muslim refugees in the constitutional development of
Pakistan. Contemporary South Asia, 3(2), 111 - 129.
Rehman, T. (1996). Language and politics in Pakistan. Karachi: Oxford University Press.
Rettig, C. P. (2012). The IRS whistleblower program: Making money the old-fashioned way!
Journal of Tax Practise and Procedure, 14(2), 21 - 29.
Riahi-Belkaoui, A. (2004). Relationship between tax compliance internationally and selected
determinants of tax morale. Journal of International Accounting, Auditing and Taxation,
13(2), 135 - 143.
Riley, M., Foner, A., & Warner, J. (1988). Sociology of age. In N. Smelser, In N.J. Smelser (Ed.),
Handbook of sociology (pp. 243 - 290). Newbury Park: Sage Publications.
Robben, H. S., Webley, P., Weigel, R. H., Wärneryd, K.-E., Kinsey, K. A., Hessing, D. J., &
Scholz, J. T. (1990). Decision Frame and Opportunity as Determinants of Tax Cheating.
Journal of Economic Psychology, 11, 342 - 364.

225
Robbins, L. (1932). An Essay on the Nature nad SIgnificance of Economic Science. London:
Macmillan & Co., Limited.
Rodriguez-Justicia, D., & Theilen, B. (2018). Education and tax morale. Journal of Economic
Psychology, 64, 18 - 48.
Ross, A., & McGee, R. (2011). Attitudes toward Tax Evasion: A Demographic Study of Malaysia.
Asian Journal of Law and Economics, 2, 1 - 49.
Ross, A., & McGee, R. (2011). Attitudes toward Tax Evasion: A Demographic Study of
Switzerland. Business Studies Journal, 3, 1 - 47.
Rothengatter, M. (2005). Social networks and tax (non-) compliance in a multicultural nation:
Emerging themes from a focus group study among ethnic minorities in Australia.
International Journal of Entrepreneurial Behaviour & Research, 11(4), 280 - 314.
Rousseau, D. M., Sitkin, S. B., Burt, R. S., & Camerer, C. (1998). Not so different after all: A
cross-discipline view of trust. The Academy of Management Review, 23(3).
Rudolph, T. J. (2009). Political Trust, Ideology, and Public Support for Tax Cuts. Public Opinion
Quaterly, 73(1), 144 - 158.
Russo, F. (2013). Tax Morale and Tax Evasion Reports. Economics Letters, 12(1), 110 - 114.
Saad, N. (2009). Fairness Perceptions and Compliance Behaviour: The Case of Salaried Taxpayers
in Malaysia after Implementation of the SelfAssessment System. eJournal of Tax
Research, 8(1), 32 - 63.
Saad, N. (2014). Tax Knowledge, Tax Complexity and Tax Compliance: Taxpayers’ View.
Procedia - Social and Behavioral Sciences, 109, 1069 - 1075.
Sadozai, A. M. (2012). Impact Of Favoritism, Nepotism And Cronyism On Job Satisfaction A
Study From Public Sector Of Pakistan. Interdisciplinary Journal of Contemporary
Research in Business, 4(6), 760 - 771.
Saeed, A., & Shah, A. (2011). Enhancing tax morale with marketing tactics: A review of Literature.
African Journal of Business Management, 5(35), 13559 - 13565.

226
Saez, E. (2010). Do Taxpayers Bunch at Kink Points? American Economic Journal: Economic
Policy, 2, 180 - 212.
Sam, C. Y. (2010). Exploring the Link between Tax Evasion and the Underground Economy.
Pakistan Economic and Social Review, 48(2), 167 - 182.
Sameulson, P. A. (1948). Economics - An Introductory Analysis. USA: McGraw - Hill.
Sánchez, J. (2008). Shaping Taxation: Economic Elites and Fiscal Decision-Making in Argentina,
1920–1945. Journal of Latin American Studies, 40, 83 - 108.
Sánchez, O. (2006). Tax system reform in Latin America: Domestic and international causes.
Review of International Political Economy, 13(5), 772 – 801.
Sarstedt, M., & Mooi, E. (2014). Regression Analysis. In A Concise Guide to Market Research
(pp. 193 - 233). DOI : 10.1007/978-3-642-53965-7_7.
Savitria, E., & Musfialdy. (2016). The Effect of Taxpayer Awareness, Tax Socialization, Tax
Penalties, Compliance Cost at Taxpayer Compliance with Service Quality as Mediating
Variable. Procedia - Social and Behavioral Sciences, 219, 682 - 687.
Say, J. -B. (1803). A Treatise on Political Economy. In Demand or Market for Products (p. Chapter
No XV).
Schmölders, G. (1959). Fiscal psychology: a new branch of public finance. National Tax Journal,
15, 184 - 193.
Schneider, F. a. (2003). The Shadoq Economy, An International Survey. Cambridge: Cambridge
University Press.
Schneider, F., & Buehn, A. (2013). Estimating the size of the Shadow Economy: Methods,
Problems and Open Questions. IZA.
Schneider, F., & Enste, D. H. (2000). Shadow Wconomies: Size, Causes and Consequences.
Journal of Economic Literature, XXXVIII (38), 77-114.

227
Scholz, J. T., & Pinney, N. (1995). Duty, Fear, and Tax Compliance: The Heuristic Basis of
Citizenship Behavior. American Journal of Political Science, 39(2).
Seltman, H. J. (2018). Statistical Power. In H. J. Seltman, Experimental Design and Analysis (pp.
293 - 318). Carnegie Mellon University. Retrieved June 20, 2018, from
http://www.stat.cmu.edu/~hseltman/309/Book/Book.pdf
Shafique, S., & Ali, M. M. (2018). Growth, Development and Social Welfare: An Empirical Study
of Pakistan. NUML International Journal of Business & Management, 13(1), 55 - 65.
Shahzad, A. (2011). The Issue of Ethnicity in Pakistan : Historical Background. Pakistan Vision,
124 - 164.
Shehzad, A. K. (2017). Crisis Of Governance In The Bureaucracy of Pakistan: A Study of
Administrative Ramifications with Apposite Policy Recommendations. Issra Papers, 15 -
34.
Sherani, S. (2015, 08 07). Pakistan's Taxation Crisis. Dawn.
Sherani, S. (2015, Aug 07). Pakistan's Taxation Crisis. Dawn.
Sheth, D. (1989). State Nation and Ethnicity : Experience of Third World Conuntries. Economical
and Political Weekly, 24(12), 622.
Siahaan, M. P. (1996). Elementary Tax Law. Graha Science: Yogyakarta.
Siddiqui, F. H. (2012). The Politics of Ethnicity in Pakistan: The Baloch, Sindhi and Mohajir
Ethnic Movements. Routledge, 2012.
Siddiqui, F. H. (2015). The Political Economy of the Ethno-nationalist Uprising in Pakistani
Balochistan, 1999–2013. In M. J. Webb, & A. Wijeweera, The Political Economy of
Conflict in South Asia (pp. 57 - 74). London: Palgrave Macmillan.
Slemrod, J. (1985). An empirical test for tax evasion. Review of Economics and Statistics, 67 (2)
(1985), 67(2).

228
Slemrod, J. (1992). Why people pay taxes, tax compliance and enforcement. Ann Arbor: University
of Michigan Press.
Slemrod, J. (2007). Cheating Ourselves : The Econmics of Tax Evasion. Journal of Economic
Perspectives, 21(1), 25 - 48.
Slemrod, J. (2007). Cheating Ourselves : The Economics of Tax Evasion. Journal of Economic
Perspectives, 2(1), 25 - 48.
Slemrod, J. (2010). Buenas Notches: Lines and Notches in Tax System Design. Working Paper.
Slemrod, J. (2018). Tax compliance and enforcement. Journal of Economic Literature,
forthcoming.
Slemrod, J., & Bakija., J. (2008). Taxing Ourselves: A Citizen’s Guide to the Debate over Taxes.
Cambridge MA: MIT Press.
Slemrod, J., & Yitzhaki, S. (2002). Tax Evasion, Avoidance and Administration. In Handbook of
Public Economics (pp. 1423 - 1470). University of Michigan.
Slemrod, J., Rehman, O. U., & Waseem, M. (2019). Pecuniary And Non-Pecuniary Motivations
For Tax Compliance: Evidence from Pakistan. Cambridge, MA: National Bureau Of
Economic Research.
Sniderman, P. M., Brody, R. A., & Tetlock, P. E. (1993). Resoning and choice: Explorations in
Political Psychology. Cambridge University Press.
Sommerfeld, R. M. (1966). Taxation: Education’s Orphan. The Journal of Accountancy, 38 - 44 .
Song, Y., Son, Y., & Oh, D. (2015). Methodological Issues in Questionnaire Design. Journal of
Korean Academy of Nursing, 45(3), 323 - 328.
Sour, L. (2009). Gender Equity, Enforement Spending and Tax Compliancde in Maxico. New
Mexico: CIDE.
Spicker, P. (2009). The Nature of a Public Service. International Journal of Public Administration,
32(11), 970 - 991.

229
Srinivasan, T. N. (1973). Tax Evasion : A Model. Journal of Public Economics, 2, 339 - 346.
Stack, S., & Kposowa, A. (2006). The effect of religiosity on tax fraud acceptability : A Cross-
National Analysis. Jounal for the Scientific Study of Religion, 45, 325 - 351.
Stehr-Green, P., Stehr-Green, J., & Nelson, A. (2003). Developing a Questionnaire. FOCUS on
Field Epidemiology, 2(2), 1 - 6.
Strielkowski, W., & Čábelková, I. (2015). Religion, Culture, and Tax Evasion: Evidence from the
Czech Republic. Religions, 6, 657 - 669.
Strielkowski, W., & Čábelková, I. (2015). Religion, Culture, and Tax Evasion: Evidence from the
Czech Republic. Religions, 6, 657 - 669.
Strümpel, B. (1969). The contribution of survey research to public finance. In A. Peacock,
Quantitative Analysis in Public Finance (pp. 13 - 32). New York: Praeger.
Sunstein, C. R. (1996). Social Norms and Social Roles. Columbia Law Review, 96, 903 - 968.
Sustainable Develoopment Policy Institute (SDPI). (2013). Reforming Tax System in Pakistan.
Islamabad: SDPI.
Sweet, P. (2018, July 27). Publishing details of deliberate tax defaulters found ineffective.
Accountancy Daily.
Syadullah, M. (2015). Governance and Tax Revenue in Asean Countries. Journal of Social and
Development Sciences, 6(2), 76 - 88.
Tajfel, H., Billig, M., Bundy, R. P., & Flament, C. (1971). Social Cetagorization and intergroup
behaviour. European Journal of Social Psychology, 1(2), 149 - 178.
Tanzi, V. (1995). "Corruption, Arm's-Length Relationships, and Market. (G. F. Peltzma, Ed.) The
Economics of Organised Crime, 161 - 180.
Tanzi, V., & Shome, P. (1993). A Primer on Tax Evasion. Staff Papers - International Monetary
Fund, 40(4), 807 - 828.

230
TazegüL, A. (2016). Evaluation of Factors Having Impact on Tax ompliance as Regards to
Taxpayers: Application for the City of Kars. Open Journal of Social Sciences, 4, 80-90.
Tekchandani, K. (2005). The discrimination and denial for fundamental rights for the people of
Sindh. Santa Clara Journal of International Law, 3(1), 99 - 131.
The Economist. (2017, Jan Jan). Roads to nowhere. The Economist, p. Asia Edition.
The Nation. (2017, November 19). Number of Internet Users Hits 32 Million. The Nation.
The Observer. (2018, July 4). PML-N payed no attention to provide clean water to people: Imran.
The Observer .
Thomas, K. D. (2015). The Physic Cost of Tax Evasion. Boston College Law Review, 56(2), 617
- 670.
Tichenor, P. J., Donohue, G. A., & Olien, C. N. (1970). Mass media flow and differential Growth
in Knowledge. Public Opinion Quarterly, 34 (2), 159 - 170.
Torgler, B. (2003). To evade taxes or not to evade: That is the question. The Journal of Socio
Economics, 32, 283 - 302.
Torgler, B. (2004). Moral Suasion: An Alternative Tax Policy Strategy? Evidence from a
Controlled Field Experiment in Switzerland. Economics of Governance, 5(3), 235 - 253.
Torgler, B. (2005). Tax morale and direct democracy. European Journal of Political Economy,
21(2), 525 - 531.
Torgler, B. (2007). Tax Compliance and Tax Morale: A Theoretical and Empirical Analysis.
Cheltenham, UK: Edward Elgar.
Torgler, B. (2012). Tax morale, Eastern Europe and European enlargement. Communist and Post-
Communist Studies, 45(1 - 2), 11 - 25.
Torgler, B. (2013). A Field Experiment in Moral Suasion and Tax Compliance Focusing on
Underdeclaration and Overdeduction. FinanzArchiv: Public Finance Analysis, 69(4), 393
- 411.
231
Torgler, B., & Garc´ıa-Vali˜nas, M. A. (2007). The determinants of individuals’ attitudes towards
Preventing Environmental Damage. Ecological economics, 63(2), 536 - 552.
Torgler, B., & Murphy, K. (2004). Tax morale in Australia: what shapes it and has it Changed
Over Time? Journal of Australian Taxation, 7, 298 - -335.
Torgler, B., & Murphy, K. (2007). Tax morale in Australia: What Shapes it and Has it Changed
Over Time. Journal of Australian Taxation, 7, 298 - 335.
Torgler, B., & Schneider, F. (2007). the Impact of Tax Morale and Institutional Quality on the
Shadow Economy (Vol. 2541). Bonn: IZA.
Torgler, B., & Schneider, F. (2007). The Impact of Tax Morale and Institutional Quality on the
Shadow Economy. IZA DP No. 2541.
Torgler, B., & Schneider, F. (2007). What shapes attitudes toward paying taxes? Evidence from
multicultural European countries. Social Science Quarterly, 88(2), 443 - 465.
Torgler, B., & Schneider, F. (2009). The Impact of Tax Morale and Institutional Quality on the
Shadow Economy. Journal of Economic Psychology, 30, 228 - 245.
Torgler, B., & Valev, N. (2010). Gender and Public Attitudes Toward Corruption and Tax Evasion.
Contemporary Economic Policy, 28(4), 554 - 568.
Torgler, B., & Valev, N. T. (2010). Gender and public attitudes toward corruption and Tax
Evasion. Contemporary Economic Policy, 28(4), 554 - 568.
Torgler, B., Demir, I. C., Macintyre, A., & Schaffner, M. (2008). Causes and Consequences of
Tax Morale: An Empirical Investigation. Economic Analysis and Policy, 38(2), 313 - 339.
Torgler, B., Schaffner, & M. and Macintyre, A. (2010). Tax compliance, tax morale, and
Governance Quality. In J. Alm, J. Martinez-Vazquez, & B. Torgler, Developing Alternative
Frameworks for Explaining Tax Compliance (pp. 141 - -173). New York: Routledge.
Torgler, B., Schaffner, M., & Macintyre, A. (2007). Tax Compliance, Tax Morale, and
Governance Quality. Andrew YOung School of Public Policy. Georgia, USA: Georgia
State University.

232
Torgler, B., Schneider, F., & Schaltegger, C. (2010). Local autonomy, tax morale, and the Shadow
Economy. Public Choice, 144, 293 - 321.
Tsakumis, G. T., Curatola, A. P., & Porcano, T. M. (2007). The Relation between National Cultural
Dimensions and Tax Evasion. Journal of International Accounting, Auditing and Taxation,
16, 131 – 147.
Tusicisny, A. (2014). Is ethnic diversity a poverty trap? : a complex relationship between ethnicity,
trust, and tax morale. European University Institute MWP, 2014/09.
UCLA. (2019). UCLA Institute of Digital Research and Education. Retrieved June 20, 2018, from
https://stats.idre.ucla.edu/spss/output/regression-analysis/
Umar, M. A., Derashid, C., & Ibrahim, I. (2017). Challenges of tax revenue generation in
developing countries: Adopting the carrot and Stick Approach. Journal of Humanities and
Social Sciences, 22(1), 30 - 34.
Uphoff, N. (1989). Distinguishing Power, Authority & Legitimacy: Taking Max Weber at His
Word by Using Resources-Exchange Analysis. Polity, 22(2), 295 - 322.
Uphoff, N. T., & Ilchman, W. F. (1997). The Political Economy of Change. New Jercy:
Transaction Publishers.
Vaz, S., Falkmer, T., Passmore, A. E., Parsons, R., & Andreou, P. (2013). The Case for Using the
Repeatability Coefficient When Calculating Test–Retest Reliability. PLoS ONE, 8(9),
https://doi.org/10.1371/journal.pone.0073990.
Vazquez, J. M., Vulovik, V., & Liu, Y. (2009). Direct Versus Indirect Taxation : Trends, Theory
and Economic Significance. Atlanta, Georgia: Youngs Andrew School of Public Policy,
Georgia State University.
Veblen, T. (1915). Imperial Germany and the Industrial Revolution. Kitchener: Batoche Books.
Vogel, J. (1974). Taxation and public opinion in Sweden: an interpretation of recent survey data.
National Tax Journal, 27, 499 - -513.

233
Vogel, J. (1974). Vogel J (1974). Taxation and Public Opinion in Sweden: an Interpretation of
Recent Survey Data. National Tax Journal, 27, 499 - 513.
wadhwa, L., & Pal, V. (2002). TAX EVASION IN INDIA: CAUSES AND REMEDIES.
International Journal of Applied Engineering Research, 7(11).
wadhwa, L., & Pal, V. (2012). Tax Evasion in India : Causes and Remedies. International Journal
of Applied Engineering Research, 7(11).
Walker, G. J., Courneya, K. S., & Deng, J. (2006). Ethnicity, Gender, and the Theory of Planned
Behavior:The Case of Playing the Lottery. Journal of Leisure Research, 38(2), 224 - 239.
Wane, W. (2000). Tax Evasion, Corruption and the Remuneration of Heterogenous Inspectors.
Washington D.C: Development Research Group, World Bank.
Wärneryd, K., & Walerud, B. (1982). Taxes and Economic Behavior: Some In. terview Data on
Tax Evasion in Sweden', Journal of Economic Psycholology, 2(3), 187 - 211.
Wentworth, D. K., & Rickel, A. U. (1985). Determinanat of Tax Evasion and Compliance.
Behavioral Sciences and the Law, 3(4), 455 - 466.
Widianto, R. (2015). The Effect of Demographic Factors on Individual Tax Compliance in Duren
Sawit. The Hague, Netherlands: PhD Dessertation, International Institute of Social Studies.
Winer, S. L., Profeta, P., & Hettich, W. (2013). The Political Economy of Taxation. Oxford
Bibliographies, online access. Retrieved from
https://www.oxfordbibliographies.com/view/document/obo-9780199756223/obo-
9780199756223-0083.xml
Wong, R. M., & Lo, A. W. (2015). Can education improve tax compliance? Evidence from
Different Forms of Tax Education. Tuen Mun, Hong Kong: Lingnan University.
Wong, R. M., & Lo, A. W.-y. (2015). Can education improve tax compliance? Evidence from
different forms of tax education. Hong Kong Institute of Business Studies Working Paper
Series, WPS 074 - 1415.

234
Yasmeen, B., & Rauf, H. (2014). Measuring the Underground Economy and its Impact on the
Economy of Pakistan. The Lahore Journal of Economics, 9(II), 93 - 103.
Yasmeen, B., & rauf, H. (Dec 2004). Measuring the Underground Economy and its Impact on the
Economy of Pakistan. The Lahore journal of Economics, 9(2), 93-103.
Yitzhaklt, S. (1974). Income Tax Evasion : Atheoretical Analysis. Journal of Public Economics,
3, 201 - 202.
Yong, S., & Mooney, S. (2017). Risky business: Ethnicity and tax compliance practices of small
Business Operators. 04 Gender, Diversity and Indigeneity COmpetitive Session.
Zaman, U., & Saif, M. I. (2016). Perceived Accountability And Conflict Management Styles As
Predictors Of Job Performance Of Public Officials in Pakistani. Gomal University Journal
of Research [GUJR], 32(2), 24 - 35.
Zeelenberg, M. N., & Pieters, R. (2006). Emotion, motivation and decision making: A Feeling is
for Doing Approach. In H. Plessner, C. Betsch, & T. Betsch, A new look on intuition in
judgment and decision making. Mahwah, NJ: Lawrence Erlbaum Associates, Inc.

235
APPENDICES
Appendix A
Quantitative Qualitative
General Framework Seek to confirm hypotheses about
phenomena Instruments
Use more rigid style of eliciting and
categorizing responses to questions
Use highly structured methods such
as questionnaires, surveys, and
structured observation
Seek to explore phenomena
Instruments use more flexible,
iterative style of eliciting and
categorizing responses to questions
Use semi-structured methods such
as in-depth interviews, focus groups,
and participant observation
Analytical objectives To quantify variation
To predict causal relationships
To describe characteristics of a
population
To describe variation
To describe and explain
relationships
To describe individual experiences
To describe group norms
Flexibility in study design Study design is stable from
beginning to end
Participant responses do not
influence or determine how and
which questions researchers ask next
Study design is subject to statistical
assumptions and conditions
Some aspects of the study are
flexible (for example, the addition,
exclusion, or wording of particular
interview questions)
Participant responses affect how and
which questions researchers ask
next
Study design is iterative, that is, data
collection and research questions are
adjusted according to what is
learned
Data Format Numerical (obtained by assigning
numerical values to responses)
Textual (obtained from audiotapes,
videotapes, and field notes)

236
Question Format Closed-ended Open-ended
Appendix B
Where the taxable income does not exceed Rs,
400,000
0%
2. Where the taxable income exceeds Rs, 400,000
but does not exceed Rs, 500,000
2% of the amount exceeding Rs, 400,000
3. Where the taxable income exceeds Rs, 500,000
but does not exceed Rs, 750,000
Rs,2,000+5% of the amount exceeding Rs, 500,000
4. Where the taxable income exceeds Rs, 750,000
but does not exceed Rs, 1,400,000
Rs, 14,500+10% of the amount exceeding Rs, 750,000
5. Where the taxable income exceeds Rs, 1,400,000
but does not exceed Rs, 1,500,000.
Rs, 79,500+12.5% of the amount exceeding Rs,
1,400,000
6. Where the taxable income exceeds Rs, 1,500,000
but does not exceed Rs, 1,800,000
Rs, 92,000+15% of the amount exceeding Rs,
1,500,000
7. Where the taxable income exceeds Rs, 1,800,000
but does not exceed Rs, 2,500,000
Rs, 137,000+17.5% of the amount exceeding Rs,
1,800,000
8. Where the taxable income exceeds Rs, 2,500,000
but does not exceed Rs, 3,00,000
Rs, 259,500+20% of the amount exceeding Rs,
2,500,000
9. Where the taxable income exceeds Rs, 3,000,000
but does not exceed Rs, 3,500,000
Rs, 359,500+22.5% of the amount exceeding Rs,
3,000,000
10. Where the taxable income exceeds Rs, 3,500,000
but does not exceed Rs, 4,000,000
Rs, 472,000+25% of the amount exceeding Rs,
3,500,000
11. Where the taxable income exceeds Rs, 4,000,000
but does not exceed Rs, 7,000,000
Rs,597,000+27.5%of the amount exceeding Rs,
4,000,000
12. Where the taxable income exceeds Rs,7,000,000 Rs,1,422,000+30% of the amount exceeding Rs,
7,000,000

237
Tax Slabs to be deducted by salaried employees on payment of Salary

238
Appendix C
QUESTIONNAIRE
TAX EVASION IN PAKISTAN
TAX EVASION IN PAKISTAN – A STUDY OF CAUSES AND CONSEQUENCES
1. In your opinion what the taxes, duties and other contributions that you pay are used for?
• Health
• Education
• Public Transport
• Social Welfare
• Others
2. In the past year, have you ever contacted Tax office through any of the methods?
• Visited Tax office in person
• Visited FBR website
• Sent email query on FBR official email
• Completed Tax return online
• Phoned officials in FBR
3. If YES to any of the above options, how satisfied were you with the service you received
by contacting Tax Office?
• Highly Satisfied
• Quite Satisfied
• Satisfied
• Quite Dissatisfied
• Highly Dissatisfied
4. Have you ever completed Tax return form?
• Yes
• No

239
5. If Yes to Question 3, do you think it is easy to file tax return in Pakistan?
• Strongly Agree
• Fairly Agree
• Neutral
• Fairly Disagree
• Strongly Disagree
6. In your opinion, why people do not pay their share of taxes? (1 for Strongly Agree and 5 for
strongly disagree)
Question
Response
1 2 3 4 5 Don’t
Know
Tax rates are too high
People are unfamiliar with tax system
Probability of getting caught is low
Perception that money is wasted on unnecessary
things
Money goes into the pockets of politicians and
officials
People cannot afford to pay taxes

240
7. What motivates you to pay taxes? (1 for Strongly Agree and 5 for strongly disagree)
Question
Response
1 2 3 4 5 Don’t
Know
Concern that others will have to pay more if you
pay less
Because it is the law to pay taxes
Belief in doing the right things
Concern that someone will report your non-
compliance
Concern that penalties on evasion are high
Concern that your name will be flashed in
defaulters’ list for non-compliance
8. What motivates you to pay taxes? (1 for Strongly Agree and 5 for strongly disagree)
Question
Response
1 2 3 4 5 Don’t
Know
Making financial arrangements to minimize tax
payable
Using loopholes in tax system to avoid payment
Not fully reporting your income to authorities

241
Demographic Profile of Respondents
1. Specify your age bracket (in years)
• 18 – 25
• 26 – 35
• 36 – 45
• 46 – 55
• 55 – 65
• 65 +
2. Specify your Gender
• Male
• Female
3. What is your net monthly income (in Pak Rupee)?
• Below 35,000
• 35,000 – 45,000
• 45,000 – 55,000
• 55,000 – 65,000
• 65,000 – 75,000
• 75,000 – 85,000
• 85,000 – 95,000
• 95,000 above
4. Specify your Educational qualification (completed)
• Matric
• Intermediate
• Bachelors (14 years education)
• Masters (16 years education)
• M.Phil / PhD

242
5. Specify your hometown (Province)
• Punjab (North)
• Punjab (Central)
• Punjab (South)
• Sindh (Rural)
• Sindh (Urban)
• Khyber Pakhtunkhaw
• Baluchistan
• Gilgit Baltistan
• Azad Jammu and Kashmir
• FATA (Federally Administered Tribal Areas)