A longitudinal study of job stress in the nursing profession: causes and consequences
24
Chapter 4 A Longitudinal Study of Job Stress in the Nursing Profession: Causes and Consequences Tanya I. Gelsema, Margot van der Doef, Stan Maes, Marloes Janssen, Simone Akerboom, Chris Verhoeven Published in: Journal of Nursing Management 2006, 14, 289-299 59
Transcript of A longitudinal study of job stress in the nursing profession: causes and consequences
Chapter 4
A Longitudinal Study ofJob Stress in the NursingProfession: Causes andConsequences
Tanya I. Gelsema, Margot van der Doef, Stan Maes, Marloes Janssen,Simone Akerboom, Chris VerhoevenPublished in: Journal of Nursing Management 2006, 14, 289-299
59

60

A Longitudinal Study ofJob Stress in the NursingProfession: Causes andConsequences
Abstract
This study examines the influence of changes in work conditions on stress out-comes as well as influence of changes in stress outcomes on work conditions. Assuch, it answers questions still open in literature regarding causality of workenvironmental characteristics and the health of nurses. A complete, two wavepanel design was used with a time interval of three years. The sample con-sisted of 381 hospital nurses in different functions, working at different wards.Changes in work conditions are predictive of the outcomes, especially of jobsatisfaction and emotional exhaustion. The strongest predictors of job satisfac-tion were social support from supervisor, reward, and control over work. Thestrongest predictors of emotional exhaustion were work and time pressure andphysical demands. Reversed relationships were also found for these outcomes.The results of this study are consistent with transactional models of stress thatindicate that stressors and stress outcomes mutually influence each other. Toprevent nurses from a negative spiral, it seems of importance to intervene earlyin the process.
61
4.1 Background
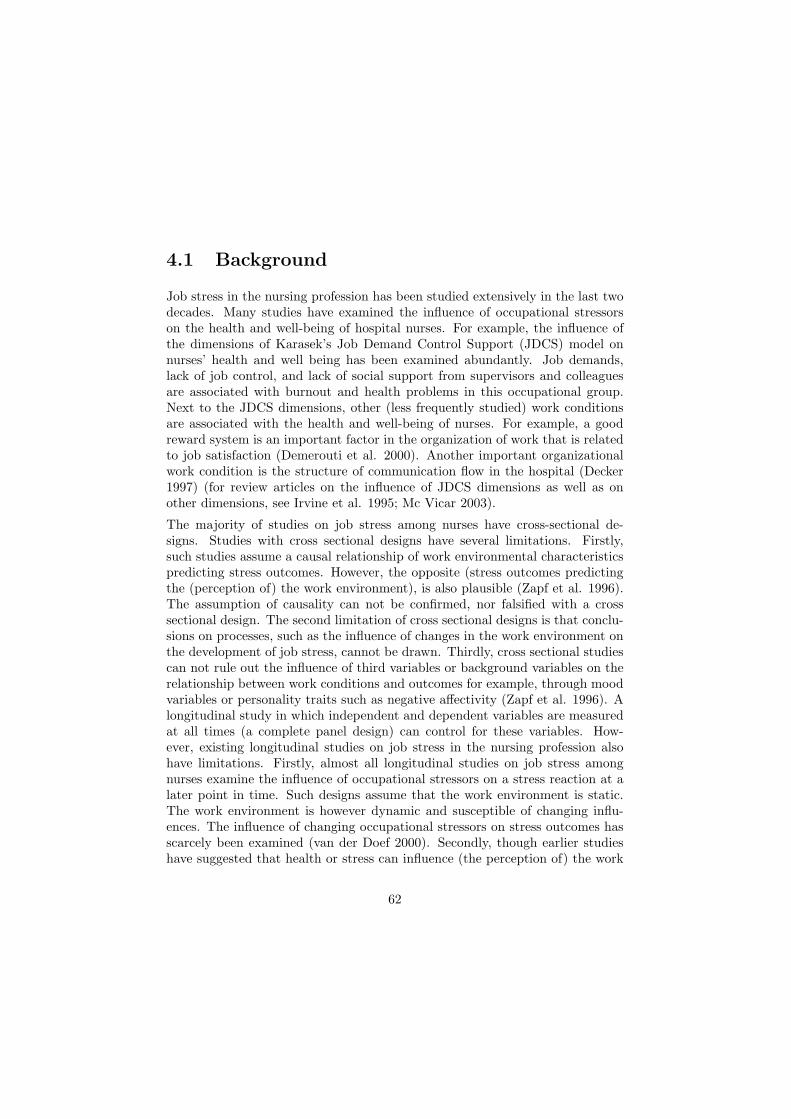
Job stress in the nursing profession has been studied extensively in the last twodecades. Many studies have examined the influence of occupational stressorson the health and well-being of hospital nurses. For example, the influence ofthe dimensions of Karasek’s Job Demand Control Support (JDCS) model onnurses’ health and well being has been examined abundantly. Job demands,lack of job control, and lack of social support from supervisors and colleaguesare associated with burnout and health problems in this occupational group.Next to the JDCS dimensions, other (less frequently studied) work conditionsare associated with the health and well-being of nurses. For example, a goodreward system is an important factor in the organization of work that is relatedto job satisfaction (Demerouti et al. 2000). Another important organizationalwork condition is the structure of communication flow in the hospital (Decker1997) (for review articles on the influence of JDCS dimensions as well as onother dimensions, see Irvine et al. 1995; Mc Vicar 2003).
The majority of studies on job stress among nurses have cross-sectional de-signs. Studies with cross sectional designs have several limitations. Firstly,such studies assume a causal relationship of work environmental characteristicspredicting stress outcomes. However, the opposite (stress outcomes predictingthe (perception of) the work environment), is also plausible (Zapf et al. 1996).The assumption of causality can not be confirmed, nor falsified with a crosssectional design. The second limitation of cross sectional designs is that conclu-sions on processes, such as the influence of changes in the work environment onthe development of job stress, cannot be drawn. Thirdly, cross sectional studiescan not rule out the influence of third variables or background variables on therelationship between work conditions and outcomes for example, through moodvariables or personality traits such as negative affectivity (Zapf et al. 1996). Alongitudinal study in which independent and dependent variables are measuredat all times (a complete panel design) can control for these variables. How-ever, existing longitudinal studies on job stress in the nursing profession alsohave limitations. Firstly, almost all longitudinal studies on job stress amongnurses examine the influence of occupational stressors on a stress reaction at alater point in time. Such designs assume that the work environment is static.The work environment is however dynamic and susceptible of changing influ-ences. The influence of changing occupational stressors on stress outcomes hasscarcely been examined (van der Doef 2000). Secondly, though earlier studieshave suggested that health or stress can influence (the perception of) the work
62

environment, few studies have actually examined reversed causation (de Langeet al. 2003). The present study attempts to fill in these gaps. We will exam-ine the influence of changes in work conditions on changes in the health andwell-being of nurses. Furthermore, reversed causal relationships are tested.
Two studies among nurses that did examine the consequences of changes in de-mands, control and support, found that a decrease in control and a decrease insupport resulted in emotional exhaustion and psychological and somatic com-plaints, and diminished job satisfaction (de Jonge et al. 1998; van der Doef2000). Moreover, an increase in demands over time resulted in emotional ex-haustion (de Jonge et al. 1998).
As the job demand control support model is considered as an important occupa-tional stress model, most longitudinal studies among nurses focus on these threedimensions in relation to various stress related outcomes. Job demands (such asworkload and meeting deadlines, involvement in life and death situations, dailyhassles) have been longitudinally associated with emotional exhaustion (Bour-bonnais et al. 1999; de Lange et al. 2004;), depression (de Lange et al. 2002;de Lange et al. 2004), health problems (Bradley et al. 2002), and decreasedjob satisfaction (Davidson et al. 1997; de Jonge et al. 2001). However, otherstudies among nurses found no relationship between job demands and job sat-isfaction (Bradley et al. 2002; de Lange 2004; Tyson et al. 2004). It could bethat the relation between time demands and work pressure and job satisfactionis in some cases moderated by other factors, such as pay or job commitmentor satisfaction of helping others. Job control (participation in decisions, abilityto make decisions on the job) has been longitudinally associated with enhancedwell-being (Mikkelsen et al. 2000) and job satisfaction (de Lange et al. 2004),and with diminished psychological distress and emotional exhaustion (Bourbon-nais et al. 1999; de Lange et al. 2002). Social support (being taken seriously,feeling appreciated, peer cohesion) is beneficial for nurses’ well-being and jobsatisfaction (Mikkelsen, et al. 2000; de Jonge et al. 2001). Through socialsupport, nurses gain better health (Bradley et al. 2002), and their emotionalexhaustion and distress diminishes (Firth et al. 1989; de Lange et al. 2004).
Inclusion of other job stressors besides the Job Demand Control Support dimen-sions improves the prediction of health and well-being (van der Doef 2000). Fewlongitudinal studies have considered the influence of environmental conditions ororganizational conditions on the health and well being of nurses. Organizationalconditions can be described as: the way the work is managed and structured(Cooper et al. 1994). Environmental conditions refer to the physical work en-vironment, such as the design of the workplace, tools and equipment. Studies
63

among nurses reveal that the way in which the work is organized is related tonurses’ job stress. For example, associations are found between the amount andquality of personnel, work agreements and planning of work, and the availabil-ity and quality material and medical equipment on the one hand, and stressoutcomes on the other hand. Furthermore, the importance of financial rewardis recognized in studies among nurses (Demerouti et al. 2000; Tyson et al.2004). Finally, good communication between departments on patient informa-tion is beneficial for the job satisfaction of nurses (Davidson et al. 1997). In linewith the above described studies, we hypothesize that decreases in job demandand increases in control and support, as well as more favorable conditions withregard to personnel and material resources, rewards, work agreements and com-munication will result in higher job satisfaction and lower emotional exhaustionand less psychological and physical health problems (hypothesis one).
A review of longitudinal studies in organizational stress research revealed thatthe problem of reversed relationships is not discussed in many cases (Zapf etal. 1996). Longitudinal studies in general assume normal causal relationships.However, half of the studies that do explore reversed causation find significantassociations (Zapf et al. 1996). In some cases, this reversed relationship iseven dominant over the normal causal relationship. For example, a longitudinalstudy among health care workers revealed that increases in emotional exhaustionwere related to increases in (perceived) demands, and that this association wasdominant over the normal causal relationship (de Jonge et al. 2001). Anotherstudy among nurses found the same reversed association, but did not find causaldominance of the reversed relationship over the normal causal relationship (deLange et al. 2004). We hypothesize that increases in job satisfaction and de-creases in emotional exhaustion and psychological and physical health problemswill result in less (perceived) job demand and higher (perceived) job control andsocial support, as well as (a) better (perception of) work conditions with regardto personnel resources, material resources, rewards, work agreements and com-munication (hypothesis two). Because of unequivocal results of earlier research,we had no prior expectations concerning the dominance of causal or reversedrelationships.
64

4.2 Methods
4.2.1 Design and Participants
We used a complete panel design for this study (see for example Zapf et al.1996). All independent and dependent variables (see the “measures” section)were measured two times with an interval of three years. This time intervalis long enough for changes in work conditions to occur. The research sampleconsisted of 1267 registered nurses working within an academic hospital in theNetherlands. A total of 807 questionnaires were returned at the first measure-ment time (Time 1, or T1), which is a response rate of 64%. All 621 nurses stillholding their position three years later (at Time 2 or T2) were sent a secondquestionnaire, of which 381 (61%) responded. The analyses within this articleare based on the data of these nurses. Of these respondents, the majority was fe-male (84%). The mean age was 38.8 years (S.D. 8.6; range 20-57 years). Abouthalf of the nurses worked 30 hours per week or more. Of the nurses, 60% hadjob tenures of more than 10 years and 40% had held their present position forat least 5 years. We examined the selectivity of the final sample, by comparingT1 scores for a) nurses that still held their position at T2 versus those that hadnot held their position at T2, and b) for those nurses that were still employed atT2, we compared responders versus non responders at T2. For the instrumentsused, see the section measures. The nurses who still worked in their positionscored lower on their T1 emotional exhaustion (t(750) = 3.58, p<.001), psy-chological distress (t(748) = 2.65, p<.01) and physical demand (t(750) = 2.30,p<.05) and higher on decision authority (t(746) = -2.10, p<.05) than the nurseswho had quit their job between T1 and T2. Furthermore the respondents atT2 had a higher T1 job satisfaction than the non-respondents at T2 (t(745) =-4.28, p<.001). The respondents of T2 did not differ significantly from the nonrespondents of T2 on the work conditions measured at T1.
4.2.2 Measures
Socio-demographic variables
Data were collected on age, gender, and years of employment.
65

Quality of work: Work Conditions
The Leiden Quality of Work Life Questionnaire for nurses (LQWLQ-N; Maeset al. 1999) was used to measure the theoretical constructs of the independentvariables of the research model. This questionnaire is based on the LeidenQuality of Work Questionnaire (LQWQ; van der Doef et al. 1999) and onthe Organizational Risk Factor Questionnaire (ORFQ; Akerboom 1999). Theitems of the LQWLQ-N are occupation specific. All items are formulated asstatements that had to be rated on a 4 point rating scale, ranging from totallydisagree to totally agree. The scales are defined below and for each scale thecronbach’s alpha is given at T1 and T2, as well as the number of items and anitem-example.
Work and Time Demands(α=.77/.81, 6 items): workload, and time pressure (I must care for too manypatients at once).
Physical Demands(α=.70/.83, 5 items): physical burden of work (At work I must sit in the sameposition for long periods of time).
Skill Discretion(α=.70/.80, 6 items): task variety and the extent to which the job challengesone’s skills (My job gives me opportunities for self-development).
Decision Authority(α=.70/.73, 7 items): freedom of decision-making over one’s work (I can decidefor myself when I engage in patient-related versus non-patient-related tasks).
Social Support Supervisor(α=.92/.94, 7 items): support provided by the supervisor (I feel appreciated bymy supervisor).
Social Support Colleagues(α=.80/.87, 7 items): instrumental and emotional support provided by col-leagues (The nurses in my department work well together).
Nurse-Doctor Collaboration(α=.77/.74, 5 items): interaction with doctors (In my department, the nursesand doctors work well together).
Personnel Resources(α=.73/.78, 4 items): amount and quality of personnel on a particular ward (Inmy department, there are enough nurses to provide good care).
66

Material Resources(α=.77/.78, 4 items): availability, amount and quality of materials and instru-ments on a particular ward (Materials and instruments are not always availablewhen necessary).
Rewards(α=.80/.82, 6 items): rewards in terms of salary, bonuses or appreciation (Inthis organization, there are sufficient funds and / or facilities for nurses).
Work Agreements(α=.80/.87, 7 items): quality and feasibility of procedures (In my department,regulations and procedures are often insufficiently defined).
Communication(α=.70/.75, 6 items): communication between departments, information provi-sion (In this organization, there is effective interdepartmental communicationabout patients).
Outcome measures
Job SatisfactionJob satisfaction was assessed with the LQWLQ-N Job Satisfaction scale (6items; e.g. “If I had to choose now, I would take this job again”, “I am satisfiedwith my job”, α= .82/.86). Statements were rated on a 4 point rating scale,ranging from totally disagree to totally agree.
Emotional ExhaustionEmotional exhaustion appears to be the major aspect of occupational burnoutamong human service professionals, including nurses (Buunk et al. 1994). Thevalidated Dutch client version of the Maslach Burnout Inventory (MBI-NL,Schaufeli et al. 1994) was used to assess emotional exhaustion. The scaleconsists of eight items; (e.g. “At the end of a work day, I feel empty”). Itemswere scored on a seven-point rating scale, ranging from “never” to “every day/ always”.
Psychological Distress and Somatic ComplaintsPsychological distress and somatic complaints were assessed by means of threesubscales of a validated Dutch version of the SCL-90, a 90-item inventory de-veloped by Derogatis (1983). This inventory measures the presence of physicaland psychological complaints, scored on a five point rating scale ranging from“not at all” to “very much”. The Dutch version of the SCL-90 has been foundto have adequate internal consistency, reliability and validity (Arrindel et al.
67
1986). Two subscales were used to measure psychological distress: anxiety (10items, e.g. “feeling afraid”) and depression (16 items, e.g. “feeling lethargic”).A mean score of the two scales was calculated, because of the high correlationbetween the two scales (r=.77). Somatic complaints were measured using asubscale of the SCL-90 (12 items, e.g. “pain in chest and heart region”).
4.2.3 Data Collection
The questionnaires were sent to the home address of the nurses. Participationin the study was on a voluntary basis. To guarantee confidentiality, an identi-fication code was used on the questionnaires. Only the researchers had accessto the key. An answering envelope could be used to return the questionnairewithout costs.
4.2.4 Data analyses
In the hierarchical regression analyses, we corrected for the T1 scores of boththe independent and the dependent variables. In this way, we controlled forregression towards the mean, ceiling- and floor effects, which are the most im-portant artifacts of change-score analyses (Finkel 1995; Campbell et al. 1999;Taris 2000). A series of regression analyses was performed to test hypothesisone concerning the causal effects of changes in work environment on job stressoutcomes. The variables were entered in several steps: in step 1, and step 2, thecorresponding T1 outcome and T1 work conditions were entered. In step 3, thechanges in the work conditions were entered (T2-T1) into the equation. Thisset of analysis was repeated for each outcome variable. The reversed relation-ships (hypothesis 2) were tested with hierarchical regression analyses in whichwe controlled for the corresponding T1 work condition and T1 outcomes. Weperformed separate regression analyses for each outcome, because the changescores of the outcomes were highly correlated (Pearson’s r of .26 to .52).
4.3 Results
Analysis of the change scores revealed that nurses experience considerable changesin all job conditions and outcomes over time. Depending on the job condition,
68
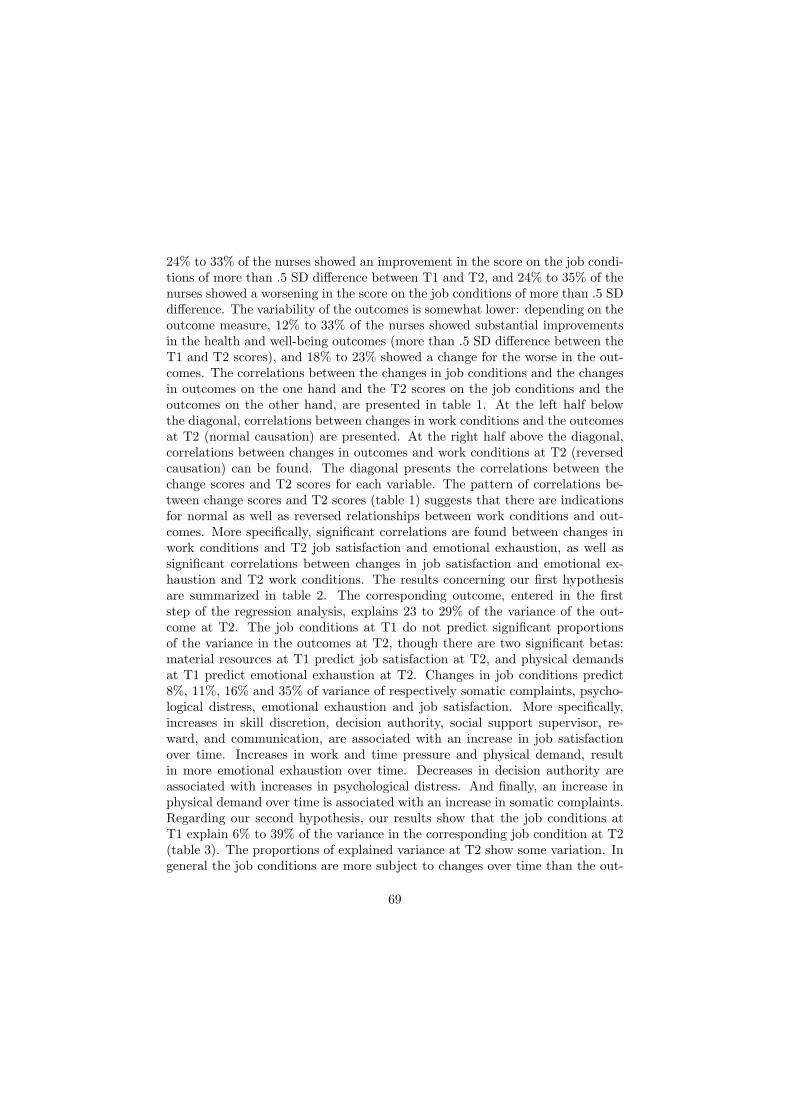
24% to 33% of the nurses showed an improvement in the score on the job condi-tions of more than .5 SD difference between T1 and T2, and 24% to 35% of thenurses showed a worsening in the score on the job conditions of more than .5 SDdifference. The variability of the outcomes is somewhat lower: depending on theoutcome measure, 12% to 33% of the nurses showed substantial improvementsin the health and well-being outcomes (more than .5 SD difference between theT1 and T2 scores), and 18% to 23% showed a change for the worse in the out-comes. The correlations between the changes in job conditions and the changesin outcomes on the one hand and the T2 scores on the job conditions and theoutcomes on the other hand, are presented in table 1. At the left half belowthe diagonal, correlations between changes in work conditions and the outcomesat T2 (normal causation) are presented. At the right half above the diagonal,correlations between changes in outcomes and work conditions at T2 (reversedcausation) can be found. The diagonal presents the correlations between thechange scores and T2 scores for each variable. The pattern of correlations be-tween change scores and T2 scores (table 1) suggests that there are indicationsfor normal as well as reversed relationships between work conditions and out-comes. More specifically, significant correlations are found between changes inwork conditions and T2 job satisfaction and emotional exhaustion, as well assignificant correlations between changes in job satisfaction and emotional ex-haustion and T2 work conditions. The results concerning our first hypothesisare summarized in table 2. The corresponding outcome, entered in the firststep of the regression analysis, explains 23 to 29% of the variance of the out-come at T2. The job conditions at T1 do not predict significant proportionsof the variance in the outcomes at T2, though there are two significant betas:material resources at T1 predict job satisfaction at T2, and physical demandsat T1 predict emotional exhaustion at T2. Changes in job conditions predict8%, 11%, 16% and 35% of variance of respectively somatic complaints, psycho-logical distress, emotional exhaustion and job satisfaction. More specifically,increases in skill discretion, decision authority, social support supervisor, re-ward, and communication, are associated with an increase in job satisfactionover time. Increases in work and time pressure and physical demand, resultin more emotional exhaustion over time. Decreases in decision authority areassociated with increases in psychological distress. And finally, an increase inphysical demand over time is associated with an increase in somatic complaints.Regarding our second hypothesis, our results show that the job conditions atT1 explain 6% to 39% of the variance in the corresponding job condition at T2(table 3). The proportions of explained variance at T2 show some variation. Ingeneral the job conditions are more subject to changes over time than the out-
69

Tabl
e 1
Cor
rela
tion
Coe
ffici
ents
for S
tudy
Var
iabl
es1 2
Cha
nge
scor
e 1
2 3
4 5
6 7
8 9
10
11
12
13
14
15
16
T2 sc
ore
1.
Per
sonn
el R
esou
rces
.5
6**
.13
.19*
* .3
1**
.19*
* -.3
5**
-.17*
* .1
4*
.26*
* .2
4**
.06
.19*
* .3
0**
-.15*
-.0
8 -.1
1 2.
Mat
eria
l Res
ourc
es
.15*
.4
7**
.13
.14*
.2
1**
-.09
-.22*
* .0
4 .0
3 .0
0 .0
6 .0
8 .1
4 -.1
2 -.0
1 -.0
8 3.
Rew
ard
.06
.05
.53*
* .0
7 .1
7**
-.04
-.10
-.06
.00
.04
-.06
.05
.21*
* -.0
9 -.1
1 -.1
2 4.
Wor
k A
gree
men
ts
.17*
* .1
0 .0
5 .6
5**
.13
-.11
-.18*
* .2
1**
.25*
* .3
0**
.30*
* .1
1 .2
7**
-.14*
-.0
3 -.0
5 5.
Com
mun
icat
ion
.12
.16*
.1
5*
.17*
* .5
5**
-.12
-.11
.05
.10
.07
.01
.09
.21*
* -.1
6*
-.08
-.06
6. W
ork/
Tim
e Pr
essu
re
-.24*
* .0
1 -.1
5*
-.26*
* -.1
3 .5
7**
.15*
-.1
4*
-.22*
* -.2
1**
-.04
-.17*
* -.2
4**
.18*
* .0
9 .0
9 7.
Phy
sica
l Dem
and
-.12
-.19*
* -.1
2 -.1
1 -.1
4*
.07
.53*
* -.1
6*
-.14*
-.1
2 -.0
5 .0
3 -.1
7*
.22*
* .0
7 .2
1**
8. S
kill
Dis
cret
ion
.12
.03
.06
.22*
* .0
2 -.1
5*
-.15*
.6
7**
.22*
* .2
6**
.12
.01
.23*
* -.1
1 -.0
2 .0
0 9.
Dec
isio
n A
utho
rity
.24*
* .0
7 .1
0 .2
9**
.09
-.17*
* -.1
2 .2
1**
.61*
* .2
2**
.17*
* .0
9 .2
5**
-.19*
* -.1
2 -.1
0 10
. Soc
ial S
uppo
rt Su
perv
isor
.1
4*
.00
.07
.36*
* .0
6 -.1
5*
-.21*
* .1
9**
.18*
* .6
8**
.29*
* -.0
2 .2
8**
-.16*
-.0
8 -.1
1 11
. Soc
ial S
uppo
rt C
olle
ague
s .1
1 .0
8 .0
4 .3
8**
-.04
-.09
-.08
.15*
.1
2 .3
0**
.61*
* .0
1 .1
4*
-.11
.02
-.02
12. N
urse
/Doc
tor C
olla
bora
tion
.26*
* .1
3 .1
5*
.17*
* .1
4*
-.10
-.17*
* .0
8 .1
2 .0
5 .0
1 .5
1**
.22*
* -.1
2 -.0
3 -.0
7 13
. Job
Sat
isfa
ctio
n .2
1**
.09
.24*
* .2
8**
.22*
* -.2
6**
-.17*
.2
1**
.25*
* .2
4**
.07
.11
.56*
* -.2
3**
-.17*
-.1
6*
14. E
mot
iona
l Exh
aust
ion
-.12
-.05
-.08
-.15*
-.1
5*
.17*
* .0
8 -.1
2 -.1
7**
-.15*
-.0
9 -.0
9 -.2
4**
.46*
* .2
2**
.22*
* 15
. Psy
chol
ogic
al D
istre
ss
-.10
-.06
-.11
-.08
-.15*
.0
6 .0
0 -.1
3 -.1
8**
-.07
-.01
-.09
-.25*
* .3
0**
.43*
* .3
0**
16. S
omat
ic C
ompl
aint
s -.1
4*
-.00
-.08
-.04
-.09
.12
.07
-.14*
-.1
0 -.0
3 -.0
2 -.0
8 -.1
8**
.28*
* .2
2**
.48*
*
1 Cor
rela
tions
bet
wee
n ch
ange
s in
wor
k co
nditi
ons a
nd T
2 ou
tcom
es (n
orm
al c
ausa
l rel
atio
nshi
ps) c
an b
e fo
und
at th
e lo
wer
left
half
of th
e di
agon
al,
corr
elat
ions
bet
wee
n ch
ange
s in
outc
omes
and
T2
wor
k co
nditi
ons (
reve
rsed
cau
sal r
elat
ions
hips
) can
be
foun
d at
the
uppe
r rig
ht h
alf o
f the
dia
gona
l. Th
e di
agon
al p
rese
nts c
orre
latio
ns o
f cha
nge
scor
es w
ith T
2 sc
ores
of t
he c
orre
spon
ding
wor
k co
nditi
on a
nd o
utco
me.
2 *
p =
<.0
1; *
* p
=<
.001
70
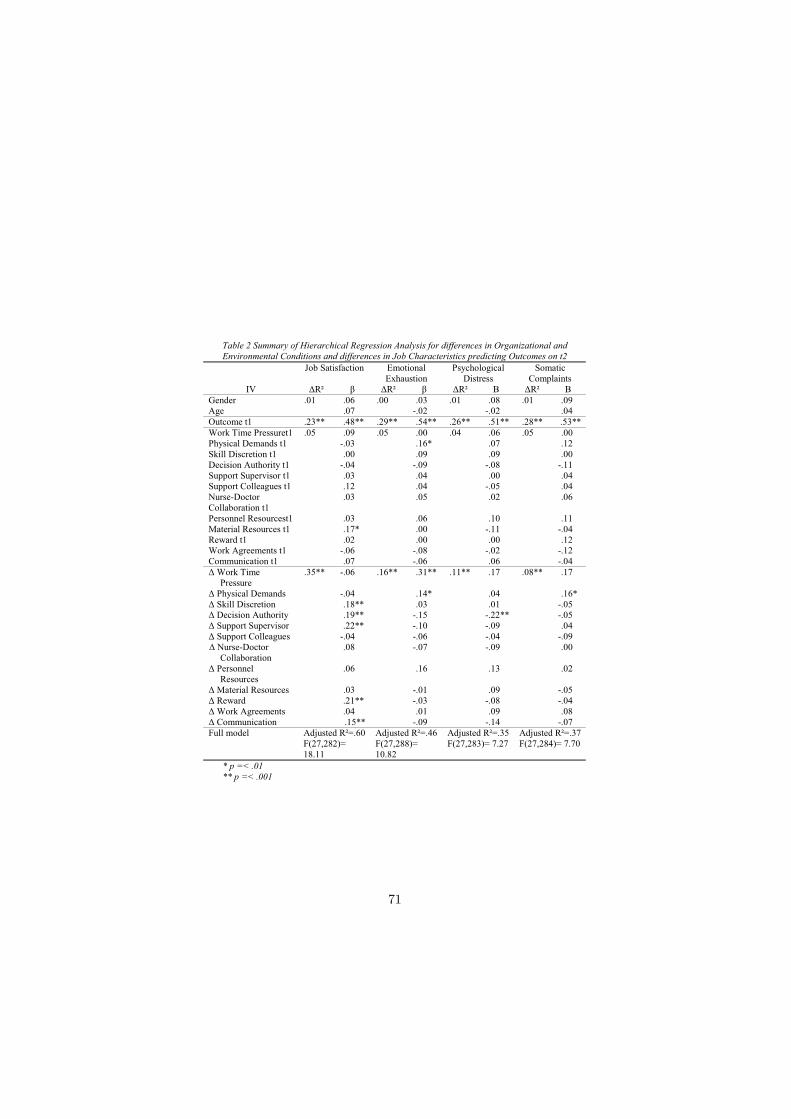
Table 2 Summary of Hierarchical Regression Analysis for differences in Organizational and Environmental Conditions and differences in Job Characteristics predicting Outcomes on t2
Job Satisfaction Emotional Exhaustion
Psychological Distress
Somatic Complaints
IV �R² � �R² � �R² � �R² � Gender .0� .06 .00 .03 .0� .08 .0� .09 Age .07 -.02 -.02 .04 Outcome t� .23** .48** .29** .54** .26** .5�** .28** .53**Work Time Pressuret� .05 .09 .05 .00 .04 .06 .05 .00 Physical Demands t� -.03 .�6* .07 .�2 Skill Discretion t� .00 .09 .09 .00 Decision Authority t� -.04 -.09 -.08 -.�� Support Supervisor t� .03 .04 .00 .04 Support Colleagues t� .�2 .04 -.05 .04 Nurse-Doctor Collaboration t�
.03 .05 .02 .06
Personnel Resourcest� .03 .06 .�0 .�� Material Resources t� .�7* .00 -.�� -.04 Reward t� .02 .00 .00 .�2 Work Agreements t� -.06 -.08 -.02 -.�2 Communication t� .07 -.06 .06 -.04 � Work Time Pressure
.35** -.06 .�6** .3�** .��** .�7 .08** .�7
� Physical Demands -.04 .�4* .04 .�6* � Skill Discretion .�8** .03 .0� -.05 � Decision Authority .�9** -.�5 -.22** -.05 � Support Supervisor .22** -.�0 -.09 .04 � Support Colleagues -.04 -.06 -.04 -.09 � Nurse-Doctor Collaboration
.08 -.07 -.09 .00
� Personnel Resources
.06 .�6 .�3 .02
� Material Resources .03 -.0� .09 -.05 � Reward .2�** -.03 -.08 -.04 � Work Agreements .04 .0� .09 .08 � Communication .�5** -.09 -.�4 -.07 Full model Adjusted R²=.60
F(27,282)= �8.��
Adjusted R²=.46 F(27,288)= �0.82
Adjusted R²=.35 F(27,283)= 7.27
Adjusted R²=.37 F(27,284)= 7.70
* p =< .01 ** p =< .001
71

come measures. The outcome measures at T1 predict up to four percent of thejob conditions at T2. Changes in outcomes predict up to 17% of the variance of(perceived) changes in the job conditions. An increase in job satisfaction overtime is related to changes in (ratings of) all occupational stressors. A changein emotional exhaustion also predicts changes in (ratings of) all occupationalstressors, though the betas are all smaller than those for job satisfaction. Nursesthat develop more somatic complaints over time, also experience more work andtime pressure, higher physical demands, and less decision authority, less person-nel resources and less reward over time. Finally, an increase in psychologicaldistress over time is related to more (experienced) work and time pressure, lessdecision authority, and with poorer evaluation of quality of work agreementsand procedures, and less well rated communication. We performed separateregression analyses for each work condition predicting each outcome, to be ableto make a comparison between the proportions of explained variance and beta’sof the normal causal relationships and the reversed causal relationships. The re-sults are summarized in tables 4a (comparison of R2) and table 4b (comparisonof betas). The results show different patterns for job satisfaction and emotionalexhaustion on the one hand and psychological distress and somatic complaintson the other hand. For psychological distress and somatic complaints, the workconditions explain more variance in the outcomes than vice versa. Similarly,all betas are higher in case of the normal causal relationships compared to thereversed causal relationships. For job satisfaction and emotional exhaustion,there is no clear dominance of normal or reverse causality.
4.4 Discussion
The present study extends previous research on occupational stress by simulta-neous examination of normal causal relationships (the influence of job conditionson health and wellbeing outcomes) and reversed causal relationships (the influ-ence of health and wellbeing outcomes on job conditions). Furthermore, wheremost longitudinal studies focus on the influence of static work conditions onhealth and well-being at later point in time, the present study examines theinfluence of changes in job conditions on changes in health and well-being (andvice versa). Generally, the results indicate that changes in work conditions andchanges in health and well being mutually influence each other.
The results partly confirm our first hypothesis: Changes in work conditions arerelated to changes in health and well-being of nurses. Changes in work con-
72

Table 3 Summary of Hierarchical Regression Analysis for differences in Outcomes predicting Organizational and Environmental Conditions t2 and Job Characteristics t2. Separate regression analyses for each outcome
WTP PhD SD DA IV �R² � �R² � �R² � �R² �
Gender .00 .07 .03 -.05 .0� -.06 .0� -.03 Age -.03 -.�6* -.�� .06 Outcome t� .��** .33** .39** .63** .07** .26** .06** .40** Job Satisfaction t� .02 -.�3** .00 .00 .03** .20** .02 .�4 Em Exhaustion t� .02* .�5* .00 -.07 .00 -.06 .02* -.�3* Som Complaints t� .0� .�0 .00 -.07 .04** -.22** .0� -.08 Psych Distress t� .00 .05 .00 -.05 .04** -.20** .0� -.�0 �Job Satisfaction .�3** -.40** .05** -.26** .�5** .43** .�7** .46** �Em Exhaustion .�2** .39** .04** .23** .04** -.2�** .09** -.34** �Som Complaints .03** .�9** .03** .�8** .0� -.�� .03** -.�8** �Psych Distress .02* .�6* .00 .06 .02 -.�4 .05** -.25** SSS SSCO NDC PR
IV �R² � �R² � �R² � �R² � Gender .0� -.06 .02 -.02 .0� .�� .00 .02 Age -.�� -.�5* -.02 .0� Outcome t� .09** .29** .�8** .43** .�3** .36** .07** .26** Job Satisfaction t� .02* .�5* .00 .02 .00 .03 .0� .�0 Em Exhaustion t� .0� -.07 .00 .00 .00 -.04 .00 -.04 Som Complaints t� .00 .02 .00 .00 .00 -.02 .00 .03 Psych Distress t� .0� -.07 .00 -.06 .00 -.0� .00 -.0� �Job Satisfaction .�8** .48** .04** .24** .09** .34** .�7** .46** �Em Exhaustion .06** -.28** .03** -.�9** .03** -.20** .05** -.26** �Som Complaints .0� -.�2 .00 -.06 .0� -.�� .02* -.�7* �Psych Distress .0� -.�3 .00 -.05 .00 -.07 .0� -.�� MR R WA CO
IV �R² � �R² � �R² � �R² � Gender .04* .06 .02 .�� .00 .02 .0� .�0 Age .�9** .�0 .00 .07 Outcome t� .�7** .4�** .23** .49** .�3** .36** .25** .50** Job Satisfaction t� .02** .�6** .0� .�2 .02* .�4* .0� .�3 Em Exhaustion t� .00 -.03 .0� -.07 .02* -.�4* .00 -.07 SomComplaints t� .00 -.03 .00 .06 .0� -.08 .00 -.05 Psych Distress t� .00 .02 .00 .00 .0� -.�2 .00 -.02 �Job Satisfaction .05** .25** .��** .29** .�5** .44** .�2** .39** �Em Exhaustion .03** -.�9** .02** -.�7** .06** -.28** .04** -.2�** �Som Complaints .0� -.�2 .02* -.�5* .0� -.09 .0� -.�2 �Psych Distress .00 .00 .0� -.�3 .02* -.�5* .02** -.�7**
* p =< .01 ** p =< .001
73
Table 4a R² for each pair of regression analyses. Left: normal causal regression. Right: reverse causal regression
Job Satisfaction Emotional Exhaustion
Psychological Distress
Somatic Complaints
Normal R²
Reverse R²
Normal R²
Reverse R²
Normal R²
Reverse R²
Normal R²
Reverse R²
Personnel Resources
.13** .17** .04** .05** .02** .01 .02** .02**
MaterialResources
.04** .05** .03** .03** .00 .00 .02* .01
Reward .12** .11** .02** .02** .03** .01 .02** .02** Work Agreements
.12** .15** .05** .06** .02** .02** .01 .01
Communication
.11** .12** .04** .04** .03** .02** .02* .01
Work/ Time Pressure
.11** .13** .10** .12** .04** .02** .03** .03**
Physical Demand
.07** .05** .06** .04** .01* .00 .04** .03**
Skill Discretion
.12** .15** .03** .04** .02* .02 .02** .01
Decision Authority
.15** .17** .07** .09** .05** .05** .03** .03**
Support Supervisor
.15** .18** .05** .06** .02* .01 .01* .01
Support Colleagues
.04** .04** .02** .03** .01 .00 .01 .00
Nurse-Doctor Collab
.08** .09** .02** .03** .02** .00 .01* .01
* p =< .01 ** p =< .001
74

Table 4b Beta’s for each pair of regression analyses. Left: normal causal regression. Right: reverse causal regression
Job Satisfaction Emotional Exhaustion
Psychological Distress
Somatic Complaints
Normal �
Reverse �
Normal �
Reverse �
Normal �
Reverse �
Normal �
Reverse �
Personnel Resources
.48** .46** -.27** -.26** -.20** -.�� -.20** -.�7**
Material Resources
.27** .25** -.23** -.�9** -.06 .00 -.�7* -.�2
Reward .39** .29** -.�7** -.�7** -.�8** -.�3 -.�6** -.�5** Work Agreements
.40** .44** -.26** -.28** -.�6** -.�5** -.�2 -.09
Communication
.38** .39** -.23** -.2�** -.�9** -.�7** -.�4* -.�2
Work/ Time Pressure
-.4�** -.40** .39** .39** .25** .�6** .2�** .�9**
Physical Demand
-.27** -.26** .26** .23** .�0* .06 .22** .�8**
Skill Discretion
.42** .43** -.20** -.2�** -.�5* -.�4 -.�8** -.��
Decision Authority
.44** .46** -.30** -.34** -.26** -.25** -.�9** -.�8**
Support Supervisor
.45** .48** -.27** -.28** -.�6* -.�3 -.�4* -.�2
Support Colleagues
.22** .24** -.�7** -.�9** -.09 -.05 -.�� -.06
Nurse-Doctor Collab
.35** .34** -.�9** -.20** -.�9** -.07 -.�5* -.��
* p =< .01 ** p =< .001
75

ditions are most strongly related to changes in job satisfaction and emotionalexhaustion. The influence of changes in work conditions on somatic complaintsand psychological distress is much weaker, which is in accordance with otherstudies that examine multiple stress related outcomes (van der Doef, Maes, &Diekstra, 2000). It seems that somatic complaints and psychological distressoutcomes are more influenced by variables outside the work environment. Theresults of our study suggest that changes in different work conditions are re-sponsible for changes in job satisfaction and changes in emotional exhaustion.Emotional exhaustion is most strongly influenced by increases in job demands,which is in accordance with other longitudinal studies among nurses (Bour-bonnais et al. 1999; de Lange et al. 2004). This means that lowering the workpressure or giving nurses more time to be able to provide good care may preventserious health consequences for nurses. Physical demands could be lowered bygood equipment, such as mechanical lifts. The results of our study suggest thatnurses’ job satisfaction can be increased by giving nurses more control over theirjob. Increases in support from a supervisor and rewards can also contribute toan increase in job satisfaction. The results of our study furthermore underlinethe importance of financial reward in relation to job satisfaction, as is found inrecent studies among nurses (Demerouti et al. 2000; Mc Vicar 2003; Tyson etal. 2004). Finally, our results suggest that a better communication flow betweendepartments and a good structure of patient information can also increase jobsatisfaction, which confirms results of cross sectional studies (Davidson et al.1997). We did not find that changes in demand or personnel resources wererelated to job satisfaction. The results in studies that examine the relationshipbetween job demands and job satisfaction are inconsistent: some find a relation-ship (de Jonge et al. 2001), whereas others do not (de Lange et al. 2004). Thisdifference could be due to differences in operalizations of either the concept ofjob demands or the concept of job satisfaction. The study of de Jonge et al.(2001) used a wide range of qualitative and quantitative demanding aspects,whereas de Lange et al. (2004) only measured work and time pressure, as wedid. It could be that more qualitative aspects of job demands (exposure todeath and dying or dealing with emotions of patients and relatives) are morerelated to job satisfaction than the quantitative aspects (time pressure).
The results partly confirm our second hypothesis. Again, a distinction can bemade in the results concerning job satisfaction and emotional exhaustion on theone hand and somatic complaints and psychological distress on the other hand.Changes in job satisfaction and in emotional exhaustion have an influence onall job conditions. Changes in somatic complaints and psychological distress
76

predicted changes in some of the job stressors, and the proportion of explainedvariance was considerably lower. Similarly, de Lange et al. (2004) found thatjob satisfaction and emotional exhaustion, but not depression influenced jobstressors. Daniels and Guppy (1997) found that only extreme psychologicaldistress lead to higher reported intensity of stressors. Reversed associationsbetween emotional exhaustion and work conditions were found in other stud-ies as well, for example for job demands (Leiter et al. 1996; de Jonge et al.2001; de Lange et al. 2004), and social support (de Lange et al. 2004). It thusseems that mainly changes in the work related outcomes (job satisfaction andemotional exhaustion) have an influence on the work conditions. Zapf et al.(1996) give two possible explanations for these reverse relationships. Firstly, achange in health and well being can result in a real change in work environment.For example, workers that feel less healthy or less satisfied over time, possiblyhave less chance of promotion than their healthy and satisfied co-workers. Itis also plausible that the pressure and responsibilities are temporarily loweredfor someone with physical or mental health problems. Although this seems aplausible explanation, the results do not point in that direction: for examplea reduction in job satisfaction and an increase in emotional exhaustion lead tomore work pressure. A second possible explanation for reversed causal rela-tionships is that a decrease in satisfaction and the development of physical orpsychological complaints has an influence on nurses’ perceptions of their workenvironment and tasks (Zapf et al. 1996). It could be that more exhaustedand less healthy workers experience the demands as more heavy, because theirresources are already at an end. Or perhaps they simply recall more negativesituations. Future research should examine these mechanisms underlying theeffect of health on work conditions.
For job satisfaction and emotional exhaustion, the proportion of explained vari-ance and the betas of the normal and reversed associations are comparable.There appears to be no dominance of the normal causal relationship over thereversed causal relationship. For psychological distress and somatic complaints,there is a trend of normal causal relationships being dominant over reversedcausal relationships. Other studies have found evidence for dominance of nor-mal causal relationships (de Lange et al. 2004) as well as for dominance ofreversed causality (de Jonge et al. 2001). More longitudinal research is neededto examine the relative strength of normal causal relationships and reversedcausal relationships for different work conditions and outcomes.
The present study has some limitations that should be noted. A common biasin longitudinal occupational research concerns the healthy worker effect: un-
77

healthy workers are more likely to have quit their jobs at a second measurementtime; hence the healthy workers are overrepresented in the sample of workersthat respond both times. The nurses who still worked in their position at T2 ex-perienced less emotional exhaustion and psychological distress at T1 than thosewho had quit their job. Furthermore, the respondents at T2 had a higher T1job satisfaction than the non-respondents. It appears that the participants inour study were healthier and more satisfied than the non-participants. This hasimplications for the generalization of our results. The results of our study applyespecially to the more healthy and satisfied subpopulation. A second limitationconcerns the design of our study. We used a two-wave panel design with a timeinterval of three years. The choice of a time interval should be based on howthe effect of work conditions on outcomes evolves over time. For example, itis not likely that a change in work conditions will lead to emotional exhaus-tion in a few months time. Burnout is a chronic stress reaction that usuallybecomes manifest after exposure to stressors of more than one year (Bakker etal. 2003). We suggest that future studies explore the influence of changes inmultiple waves with different time intervals so that the time process underlyingthe mutual influence of work conditions and different health outcomes becomesclearer.
In conclusion, the results of this study are consistent with transactional modelsof stress, which indicate that stressors and stress outcomes mutually influenceeach other. This study confirms the mutual influence of stressors and stressreactions, at least for the stress outcomes of job satisfaction and emotionalexhaustion. Future study on the underlying mechanisms is needed.
Because of this mutual influence, the question of cause and consequence becomesmore of a discussion on the chicken or the egg. However, the findings do havelarge consequences in the light of interventions. Because of the mutual influenceof nurse’s health and environment, it seems of even bigger importance to preventnurses from a negative spiral where adverse work conditions and reduced healthand well being negatively influence each other. For hospital management, it istherefore to intervene early in this process by improving the work environment.The findings of this study can be a point of departure for the focus of suchinterventions.
78

References
Akerboom, S. (1999) The Organizational Risk Factor Questionnaire (ORFQ).Cognitive Psychology, Leiden University, Leiden, The Netherlands.
Arrindel, W.A., & Ettema, J.H.M. (1986) Symptom Checklist-90, SCL-90, eenmultidimensionele psychopathologie-indicator, handleiding [Symptom Checklist-90, SCL-90, a multidimensional psychopathology-indicator, manual]. Lisse, theNetherlands: Swets Test Services.
Bakker, A., Taris, T. and de Jonge, J. (2003) Onderzoek in de psychologie vanarbeid en gezondheid. In De psychologie van arbeid en gezondheid (Schaufeli,W., Bakker, A., & Schreurs, P.J.G. eds), Bohn Stafleu Van Loghum, Houten,pp. 217-240.
Bourbonnais, R., Comeau, M. and Vezina, M. (1999) Job strain and evolutionof mental health among nurses. Journal of Occupational Health Psychology 4,95-107.
Bradley, J.R. and Cartwright, S. (2002) Social support, job stress, health, andjob satisfaction among nurses in the United Kingdom. International Journal ofStress Management 9 (3), 163-182.
Buunk, B.P., Schaufeli, W.B. and Ybema, J.F. (1994) Burnout, Uncertainty,and the desire for social comparison among nurses. Journal of Applied SocialPsychology 24(19), 1701-1718.
Campbell, D.T. and Kenny, D.A. (1999) A primer on regression artifacts. TheGuilford Press: New York.
Cooper, C.L. and Cartwright, S. (1994) Healthy mind, healthy organization: Aproactive approach to occupational stress. Human Relations 47, 455-471.
Daniels, K. and Guppy, A. (1997) Stressors, locus of control, and social supportas consequences of affective psychological wellbeing. Journal of OccupationalHealth Psychology 2, 156-174.
Davidson, H., Folcarelli, P.H., Crawford, S., Duprat, L.J. and Clifford, J.C.(1997) The effects of health care reforms on job satisfaction and voluntaryturnover among hospital-based nurses. Medical Care 35(6), 634-645.
Decker, F.H. (1997) Occupational and nonoccupational factors in job satisfac-tion and psychological distress among nurses. Research in Nursing and Health20, 453-464.
79

De Jonge, J., Dormann, C., Janssen, P.P.M., Dollard, M., Landeweerd, J.A.and Nijhuis, F.J.N. (2001) Testing reciprocal relationships between job charac-teristics and psychological well-being: a cross-lagged structural equation model.Journal of Occupational and Organizational Psychology 74, 29-46.
De Jonge, J., Le Blanc, P.M., Schaufeli, W.B. and van der Linden, S. (1998)Veranderingen In werkkenmerken in relatie tot verandering in burnout en ar-beidstevredenheid. Gedrag en Organisatie 11, 121-134.
De Lange, A.H., Taris, T. W., Kompier, M. A. J., Houtman, I. L. D. andBongers, P. M. (2002) Effects of stable and changing demand-control histories onworker health. Scandinavian Journal of Work Environment and Health 28(2),94-108.
De Lange, A. H., Taris, T. W., Kompier, M. A. J., Houtman, I. L. D. andBongers, P. M. (2003) “The very best of the millenium”: Longitudinal researchand the demand-control-(support) model. Journal of Occupational Health Psy-chology 8, 282-305.
De Lange, A. H., Taris, T. W., Kompier, M. A. J., Houtman, I. L. D. andBongers, P. M. (2004) The relationships between work characteristics and men-tal health: examining normal, reversed and reciprocal relationships in a 4-wavestudy. Work and Stress 18(2), 149-166.
Demerouti, E., Bakker, A. B., Nachreiner, F. and Schaufeli, W. B. (2000) Amodel of burnout and life satisfaction amongst nurses. Journal of AdvancedNursing 32, 454-464.
Derogatis, L.R. (1983) SCL-90-R: Administration, Scoring & Procedures Manual-II (2nd Ed.). Baltimore: Clinical Psychometric Research.
Finkel, S.E. (1995) Causal analysis with panel data. Sage Publications: Thou-sand Oaks, California.
Firth, H., & Britton, P. (1989) Burnout, absence and turnover amongst Britishnursing staff. Journal of Occupational Psychology 62(1), 55-59.
Irvine, D.M. and Evans, M.G. (1995) Job satisfaction and turnover amongnurses: integrating research findings across studies. Nursing Research 44(4),246-253.
Leiter, M.P. and Durup, M.J. (1996) Work, home, and in-between: A longitu-dinal study of spill-over. Journal of Applied Behavioral Science 32, 29-47.
Maes, S., Akerboom, S., Van der Doef, M., and Verhoeven, C. (1999) De Lei-dse Arbeids Kwaliteits Schaal voor Verpleegkundigen (LAKS-V) [The Leiden
80

Quality of Work Life Questionnaire for Nurses (LQWLQ-nurses)]. Health Psy-chology, Leiden University, Leiden, The Netherlands.
McVicar, A. (2003) Workplace stress in nursing: a literature review. Journal ofAdvanced Nursing 44(6), 633-642.
Mikkelsen, A., Saksvik, P.O. and Landsbergis, P. (2000) The impact of a par-ticipatory organizational intervention on job stress in community health careinstitutions. Work & Stress 14(2), 156-170.
Schaufeli, W. and Van Dierendonck, D. (1994) Burnout, een begrip gemeten: deNederlandse versie van de Maslach Burnout Inventory (MBI-NL). [Burnout, aconcept measured: the Dutch version of the Maslach Burnout Inventory (MBI-NL)]. Gedrag en Gezondheid, Tijdschrift voor Psychologie en Gezondheid 22(4),153-172.
Taris, T.W. (2000) A primer in longitudinal data analysis. London: Sage.
Tyson, P.D and Pongruengphant, R. (2004) Five-year follow-up study of stressamong nurses in public and private hospitals in Thailand. International Journalof Nursing Studies 41, 247-254.
Van der Doef, M. (2000) The Job Demand-Control(-Support) model: from thepast to the future. Unpublished doctoral dissertation, Leiden University, Leiden,the Netherlands.
Van der Doef, M. and Maes, S. (1999) The Leiden Quality of Work Question-naire: its construction, factor structure, and psychometric qualities. Psycholog-ical Reports 85, 954-962.
Van der Doef, M., Maes, S. and Diekstra, R. (2000) An examination of theJob Demand-Control-Support model with various occupational strain indica-tors. Anxiety, Stress and Coping, 13, 165-185.
Zapf, D., Dormann, C. and Frese, M. (1996) Longitudinal studies in organiza-tional stress research: A review of the literature with reference to methodologicalissues. Journal of Occupational Health psychology 1, 145-169.
81

82