Male and Female Photographic Representation in 50 Years of Music Educators Journal
Upload
khangminh22Category
view
0download
0
Female Representation in the Academic Finance Profession
Mila Getmansky Sherman* Isenberg School of Management, UMass Amherst
Heather Tookes** Yale School of Management
First Draft: August 2019
This Draft: June 2020
We are grateful to Gen Li and Tianyi (Summer) Qu for excellent research assistance and to Renee Adams, Nikolaos Artavanis, Michael Ash, Diane Del Guercio, Ashleigh Eldmire-Poindexter, Ina Ganguli, Will Goetzmann, Robin Greenwood, Wenting Ma, Maureen O’Hara, Anna Pavlova, Manju Puri, Laura Starks, Raisa Velthuis, and seminar participants at the University of Massachusetts Amherst and Harvard Business School for helpful comments and discussions about this project. We thank Academic Analytics for providing us with data and the International Center for Finance for generous research support. We also thank Evelyn Yanyuk and Abigail Varney for data support.
*Isenberg School of Management, University of Massachusetts, Amherst, MA 01003. Email: [email protected].
**Yale School of Management, Yale University, New Haven, CT 06511. Email: [email protected].
Female Representation in the Academic Finance Profession
Abstract
We present new data on female representation in the academic finance profession. In our sample of finance faculty from the top-100 U.S. business schools during 2009–2017, only 16.0% are women. The gender imbalance manifests itself in several ways. First, after controlling for research productivity, women have less favorable career outcomes. They hold positions at lower-ranked institutions, are less likely to be tenured and full professors, and there is evidence that they are paid less. Second, women publish fewer papers. Third, women have more female coauthors, which suggests smaller publication networks. Time-series data suggest shrinking gender gaps in recent years.
1
1. Introduction
We present new data on female representation in the academic finance profession. The
paper contributes to the rapidly growing literature examining the status of women in the economics
profession (e.g., Lundenberg and Stearns (2019); Boustan and Langan (2019); Hengel (2019); Chari
and Goldsmith-Pinkham (2018)) and to the vast literature on gender representation more broadly
(see e.g., Ginther, Kahn, and McCloskey (2016) for a survey).1 To date, there is no large-sample
empirical evidence on gender balance and career outcomes in academic finance. Finance academia is
a useful setting for an examination of these issues because it is a fairly well-defined area and faculty
productivity is largely observable. The finance field is also historically male. In our sample of finance
faculty from the top-100 U.S. business schools during 2009–2017, only 16.0% of them are women.2
Our analysis is primarily descriptive; however, the data point to at least three important
forms of gender imbalance in the academic finance profession. First, after controlling for research
productivity, we find that women tend to have less favorable career outcomes than men. They hold
positions at lower-ranked institutions, they are less likely to be tenured than men, and they are less
likely to be full professors. There is also some evidence that women are paid less than men during
the 2009–2017 sample period.
Second, we find that women in finance tend to have fewer publications than men. The
analyses of gender gaps in the rank of institution, tenure, and salary all explicitly control for the
number of publications; however, the quantity of publications is of independent interest because
successful publishing records are associated with higher rates of tenure and lower rates of exit from
the profession. We estimate a publication gap of approximately 17.2%. While publication gaps have
been well-documented in economics and other fields (e.g., Bentley, 2011; McPherson et al., 2013;
Antecol et al. (2018); Ghosh and Liu, 2020), our narrower focus on the finance subfield allows us
for us to control for potentially important confounding factors. Closer examination of this quantity
gap reveals that it is mainly driven by publications that are not in top journals and articles that are
1 See also Bayer and Rouse (2017) for a review of earlier papers in economics. 2 This percentage is consistent with Chari and Goldsmith-Pinkham (2018), who report that women comprise 14.6% of all people on the finance programs at the NBER Summer Institute. This is the lowest female representation of all of the economics subfields that they report.

2
coauthored.3 On average, we do not find a significant difference between men and women in the
number of solo publications or top publications. The latter finding is consistent with no difference
in the quality of papers written by women.
Our third finding is related to coauthorship on published papers. On average, women tend
to have fewer coauthors than their male colleagues. The finding that women tend to have a smaller
network of successful collaborations is not particularly surprising, given that women tend to publish
fewer papers. But, consistent with findings in economics (e.g., McDowell, Singell and Stater, 2006;
Boschini and Sjogren, 2007), we also find that women tend to have more female coauthors than their
male colleagues. Our finding is in line with AFFECT (2018) who report that, if the first author on a
published paper in finance is female, that paper is more likely to have another female coauthor.4
Given the fact that the finance profession is only 16.0% female during our sample period, both of
these complementary findings suggest that women have smaller publication networks. We also find
that women tend to have fewer coauthors from within their own Ph.D. cohort, which may indicate a
social networking constraint and could be relevant if coauthor seniority is taken into account in
promotion cases.
The career outcomes that we document could be driven by factors that have been found to
affect the status of women in other fields, such as child-rearing policies (Antecol et al. 2018), time
and family considerations (Goldin, 2014; Ginther 2006; Ginther 1999), stereotypes (Nosek et al.,
2009; Reuben, Sapienza and Zingales, 2014), or psychological attributes (Bertrand, 2018). We do not
take a stand on these potentially important drivers. The main goal of this paper is to present basic
facts that might motivate additional work to uncover the mechanisms that drive the differences that
we observe in the data.
The three main findings highlighted above might, at face value, suggest a poor outlook for
women entering the profession. A closer look at the time series reveals a more optimistic picture.
3 We define top publications as papers published in the top-3 finance journals and the top-5 economics journals. The top-3 finance journals are Journal of Finance, Journal of Financial Economics, and Review of Financial Studies. The top-5 economics journals are American Economic Review, Econometrica, Journal of Political Economy, Review of Economic Studies, and Quarterly Journal of Economics. 4 AFFECT (2018) is different from our analysis in that their focus is at the publication rather than individual faculty level, and some of the results could be driven by particularly prolific women.

3
When we examine relationships between gender and various measures of success within the
profession on a year-by-year basis, the gender gap (i.e., imbalance that cannot be explained by
differences in observable productivity or seniority) shrinks or even disappears during the last years
of the sample. Moreover, among a subsample of recent graduates, we find that research productivity
(and not gender) explains most of the variation in where a faculty member is employed, whether the
faculty member has tenure, or exits the profession. These changes are occurring at the same time
that we observe another slow-moving trend in the data: more women are entering the profession
and obtaining tenure. Of the faculty who have tenure during the entire 2009–2017 sample period,
9.7% are women. Of the faculty obtaining tenure during the sample period, 20.4% are women. And
24.3% of rookie new hires (i.e., 2009–2017 graduates where PhD year equals the first year of
employment as an assistant professor) are women.
The conditions for women taking a first tenure track job in finance appear to be improving
over time; however, there are two important exceptions. First, unlike in economics (Antecol et al.
(2018); Ghosh and Liu, 2020) we do not observe shrinking differences between men and women in
publication rates. Second, we find persistent gender gaps at the very top of the academic ladder (i.e.,
among full professors).
The literature offers much discussion about the “leaky pipeline,” in which the representation
of women declines at each phase in the progression from student to tenure (for a survey of the
literature and interventions, see Buckles (2019)). To identify the most important sources of
underrepresentation of women in the academic finance profession, we would ideally track people
from the very beginning phases of their academic careers: PhD applicants, admitted PhD students,
graduates from PhD programs, initial academic placements, and subsequent tenure rates. Although
our data do not allow us to comment on each of these important phases of the academic career, we
are able to shed some descriptive light on the source of potential leaks in the pipeline after one
obtains a tenure track job. If the low representation of women in finance were due entirely to the
small numbers entering the profession from Ph.D. programs (i.e., a pipeline issue), then the women
who do enter finance academia would see their careers progress along trajectories that are similar to

4
men. That is, we would not observe important gender gaps in career outcomes after we control for
research productivity.
The low representation of women in finance that we document could have implications
beyond the careers of the faculty members that we study. For example, female faculty might serve
as role models that impact the career choices of female MBA students. Consistent with this idea,
Lim and Meer (2019) and Carrell et al (2010) use randomization approaches to study whether female
role models increase female student interest and performance in traditionally male-dominated
subject areas. Both of these papers report that female instructors positively impact the performance
and future pursuits of women in the subject areas without changing the outcomes of men. If the
same holds true in finance, then efforts to increase female representation in academic finance could
have spillover effects in the broader finance industry.
The paper proceeds as follows. In Section 2, we describe the data and sample selection. In
Section 3, we provide comparative descriptive statistics on placement, rank, and research
productivity. In Section 4, we present regression results. Section 5 concludes.
2. Data
2.1. School Ranking
We begin with the U.S. News & World Report Best U.S. Business Schools rankings for every
year from 2009 to 2017. We define a top-100 school as any school that appears in the top-100
rankings at any point during the 2009–2017 period.
2.2. Business School Faculty Rosters
To construct annual rosters of finance faculty, we merge the U.S. News & World Report’s top-
100 list with the faculty roster data that we obtained from Academic Analytics (AcA). AcA collects
and disseminates (on a subscription basis) information on faculty and research activity of faculty at
more than 400 universities across most departments and schools in the United States. The AcA
faculty rosters come from two sources: direct submissions from universities and snapshots of
university websites as of November 1 of each calendar year. AcA provided us with a directory of
business school faculty for the years 2009–2017. The data include all faculty names, faculty titles,

5
names of the institutions at which faculty are employed, the names of institutions from which
faculty received their PhDs, and PhD year. We focus the analysis on ladder faculty (i.e., those with
the title of “Assistant Professor,” “Associate Professor,” or “Professor”). For an institution to be
included in the sample, we require both a U.S. News & World Report top-100 ranking at any point
during the sample period and AcA coverage of that institution in at least one year from 2009 to
2017. This filter results in 97 “top-100” business schools, all of which are listed in Table 1.5
2.3. Finance Faculty
From the AcA list of ladder business school faculty, we need to identify the subsample of
finance scholars. AcA classifies faculty by subfield: finance, accounting, business administration,
business various, management, management information systems, and marketing, but these
classifications are noisy. While they are usually consistent, we encounter two issues with the AcA
classifications. First, the classification can vary across years for the same individual. Second, some
finance faculty are listed in other subfields and some non-finance faculty have finance designations.
Misclassification could result from, for example, multiple subject area listings on business school
websites. If a faculty member is identified as finance faculty at least once during our sample period
and if that person is not also classified as accounting faculty, we assign that person to the initial list
of finance faculty. We then refine the list, using publication and CV information.
Starting with the initial list of finance faculty, we create four groups of faculty for which we
hand check the official school websites, faculty members’ CVs and/or public LinkedIn pages to
determine whether they should be classified as finance. Group 1 consists of all faculty who do not
have an initial finance assignment but have more than 25% of their papers published in a Tier A or a
Tier B finance journal (as defined in Currie and Prandher (2011)).6 Group 2 comprises all recent
5 There are 88 schools for which the AcA roster data are complete for the entire sample period. For the remaining 9 schools, we hand-collect rosters from snapshots of business school websites using the internet’s Wayback Machine. Incomplete coverage occurs most often during the first half of the sample period. The schools with incomplete coverage in AcA are: Babson College, Brigham Young University, Chapman University, Georgetown University, Northeastern University, Northern Arizona University, San Diego State University, Stevens Institute of Technology, and University of California (Riverside). As a group, these schools do not differ systematically from the full sample in their gender representation or average ranking. We do, however, find that their historical websites are particularly difficult to navigate. This may explain the incomplete coverage in AcA. 6 These are Journal of Finance, Review of Financial Studies, Journal of Financial Economics, Journal of Financial and Quantitative Analysis, Journal of Money, Credit and Banking, Journal of Banking and Finance, Mathematical Finance, Journal of Financial

6
graduates (those with graduation years 2009 or later) who do not have an initial finance assignment
and have zero publications. Groups 1 and 2 help to detect finance faculty that are not classified as
finance in AcA. Group 3 comprises all faculty initially classified as finance but who do not have at
least 5 of their publications in a Tier A or a Tier B finance journal or at least 3 of their publications
in a Top 3 finance journal (these are the Journal of Finance, Journal of Financial Economics and Review of
Financial Studies). Group 4 are all faculty with zero publications but have an initial finance
classification.7 Groups 3 and 4 help us detect non-finance faculty who are misclassified as finance in
AcA. As a result of this process of refining the finance faculty classifications, we identify 2,011
unique finance faculty members employed by the sample of the top-100 schools during 2009–2017.8
We emphasize that all of the analysis conditions on having a job at a top-100 school at some point
during the sample period. We do not observe individuals with PhDs who do not take jobs at these
institutions.
2.4. Tenure and Full Professor Status
AcA provides a tenure status variable. AcA assigns tenure status for all faculty with an
“Associate Professor” or a “Professor” title, consistent with the policies at the majority of
institutions. We hand check the CVs of all individuals with an AcA title change during the sample
period to confirm the year of the title change. We rely on faculty web pages and/or public LinkedIn
pages when CVs are unavailable. In some cases, the AcA title change appears one year later than the
Intermediation, Journal of Corporate Finance, Financial Management, Journal of Empirical Finance, Journal of International Money and Finance, Journal of Financial Markets, Financial Analysts Journal, Review of Finance, Journal of Risk and Insurance, Quantitative Finance, Journal of Financial Research, Journal of Futures Markets, Journal of Portfolio Management, Journal of Business Finance and Accounting, Finance and Stochastics, Financial Review, Journal of Derivatives, Journal of International Financial Markets Institutions and Money, and Journal of Real Estate Finance and Economics. 7We also hand check the CVs of faculty members who appear to be visitors. AcA generally does not include visiting faculty; however, in a few cases, AcA data incorrectly assigns visitors as full-time faculty. Potential visiting faculty members are those who remain at a given institution for only one year and those who remain at a given institution for two years before returning to their previous institution. 8Our classification system, along with potentially incomplete coverage in AcA, could possibly cause us to include some faculty who are not finance faculty and to exclude some faculty who are, indeed, finance scholars. Our hand checks of the data help mitigate these concerns. And, as long as the gender balance of the subsamples of incorrectly included or excluded faculty are similar to that of the full sample, we do not expect misclassification errors to bias our findings.
7
title change reported on the CV. In those cases, we rely on the title change year from the CV. When
the CV title change year is unavailable, we rely on the AcA title dates.
We use the “Professor” title to infer full professor status. Tenure is more complicated
because several schools have both tenured and untenured associates (and there are a couple in which
all associates are untenured). We use a variety of sources to refine the AcA tenure status
classification for these schools. First, we check the faculty handbooks of all top-100 business schools
to determine whether there are both tenured and untenured associate professors as well as term
limits. Nineteen schools have both tenured and untenured associates, and the tenure status of 33
individuals is ambiguous based on title. For these individuals, we first perform an internet search for
the faculty member’s CV. Many of these faculty (approximately 50% of cases) indicate on their CVs
the year in which they obtain tenure. Second, if tenure year is missing from the CV and if the faculty
member is from a top-50 program during 2009–2014 (the subsample in Brogaard, Engelberg, and
Van Wesep (2018) that overlaps with our data), we use the tenure status variable from Brogaard,
Engelberg, and Van Wesep (2018). In cases in which CVs and Brogaard, Engelberg, and Van Wesep
(2018) methods fail to identify the tenure year, we rely on the AcA tenure status.
2.5. Research Output
We rely on the Scopus database at Scopus.com for faculty publications and citations data.
The Scopus data include a unique author identifier, the article’s title, the journal’s name, coauthor
names, the date of publication, and citations data.9 We merge the AcA roster and Scopus by faculty
name and institution. For multiple potential matches or when we are unable to match on name and
institution, we match on name and then hand check the Scopus publications against the faculty
member’s CV. To minimize the potential for errors in name matching, we examine only those
publications from the Scopus journals in the following areas: Economics, Econometrics and
Finance; Business, Management and Accounting; and Decision Sciences. We limit to these areas
because, in a couple of cases, faculty with very common names are given credit for publications in
9Some faculty change their names. We examined Scopus for name changes, and we find that the author ID generally preserves name changes.

8
science journals by faculty members with the same name but who are in different departments at the
same institution.10
Journal publications are the main measure of output, because, like other subfields in
economics, finance is an articles-based field. We use publications through year t in the various
regressions of year t outcome variables. We do so because publication lags are such that most
publications are known to authors and their employers well in advance of actual publication dates.
2.6. Gender
AcA uses genderize.io to infer faculty gender using the faculty member’s first and middle
names. Whenever the gender probability is greater than 90%, based on genderize.io, gender is
provided in the AcA. Gender is missing for 382 individuals. Because of the importance of gender in
our context, we hand-check the gender variable to fill in missing gender and to make any
appropriate corrections.11 We conduct the hand-checking in two stages. First, we examine the faculty
member’s photograph on the university’s website. If the photo is unavailable, we rely on pronouns
used on the RateMyProfessor website to infer gender. This process results in gender classification
for all but two faculty members, leaving a sample of 2,009 unique faculty members for the analysis.
2.7. Transitions
To characterize faculty exits, we conduct a CV search for the first employer after the faculty
member exits the sample. When we are unable to locate a CV, we relied on LinkedIn and university
websites on the Way Back Machine. Faculty leave the sample for several reasons: for example:
transition to a nontenure track position, such as Lecturer; accepting a job in government or the
private sector; transition to a university outside of the top-100 U.S. business schools, such as a non-
U.S. school; moving to an economics department; moving to a lower-tiered business school;
retirement; or death. Our sample contains 364 exits, 79 of which are exits to government, the private
sector, or nonladder positions.
2.8. Salary (Public Institutions)
10 The list contains 2,694 journal titles, including all of the major finance, economics, accounting, and marketing outlets. Although our approach would miss a publication by a finance faculty member in, for example, Nature, such publications are sufficiently rare and the error that we introduce is likely to be smaller than the error that we introduce by potentially misattributing science journal articles to finance faculty. 11 Gender is missing or incorrect in AcA for approximately 19% of the sample.

9
We obtain salary data for faculty at 37 of the 60 public institutions in the sample. Most states
have Freedom of Information Acts that require public employers to provide salary information for
all employees. We submitted data inquiries to all 60 institutions, and we include salary data from all
schools that sent usable data in response to our requests. We merge the salary data with AcA data
based on institution, faculty name and department (where department is available). We obtain salary
and total compensation information for 4,123 faculty-year observations. Because most schools
report 9-month salaries rather than total compensation, we focus on the 3,614 observations for
which we have non-missing 9-month salary data.12
3. Comparative Descriptive Statistics
3.1. Gender Composition of Finance Faculty
Table 2 summarizes the gender composition of finance faculty. The sample of top-100
schools during the 2009–2017 sample period contains 2,009 individual unique faculty members, of
which 16.0% are women. In addition to the full sample of the top-100 schools, Table 2 shows the
gender composition for the subsample of the top-30 and top-10 institutions (based on U.S. News &
World Report rankings), as well as institutions in the first quartile of research productivity, public
institutions, and private institutions. The table shows that percentage of female faculty declines with
program rank. The percentages of female faculty at the top-30 and top-10 institutions are 14.3% and
13.1%, respectively. Public institutions tend to have more female faculty than do private institutions.
Figure 1 illustrates the very slow changes in the composition of faculty over the sample
period. In 2009, the sample is 14.9% female, and, by 2017, this percentage rises to 16.8%. By
comparison, women accounted for 19.7% of all economics faculty in 2009 and 23.1% in 2017
(CSWEP, 2019). Female representation in finance lags economics, and both lag the overall
population of college and university faculty. AAUP (2019) reports that women made up 40.1 percent
12 We treat as missing the 7 observations in which reported salaries are zero, as well as salaries in which we observe large (>40%) year-to-year increases or decreases for the same individual. This can occur because salaries are reported for calendar (and not academic) years. Individuals receive only a fraction of the 9-month salary during the first or last calendar year of employment. To reduce the influence of outliers, we winsorize the remaining salary data at the 0.5% and 99.5% levels.

10
of full-time college and university faculty across all disciplines in 2008-2009 and 44.8% of all faculty
in 2018-2019.
In finance, the changes in female representation have been somewhat faster among tenured
faculty, as depicted in Figure 2. In 2009, 10% of the sample of tenured faculty are women. By 2017,
that number rises to 14.8%. Despite the slow change in the total fraction of faculty who are female,
we are observing important changes in the gender balance among newly tenured faculty. In
particular, of the 1,058 faculty who have tenure for all years of our sample, only 9.7% are women,
but women comprise 24.3% of the 309 faculty obtaining tenure and 19% of the faculty promoted to
Full Professor during our sample period. 13,14
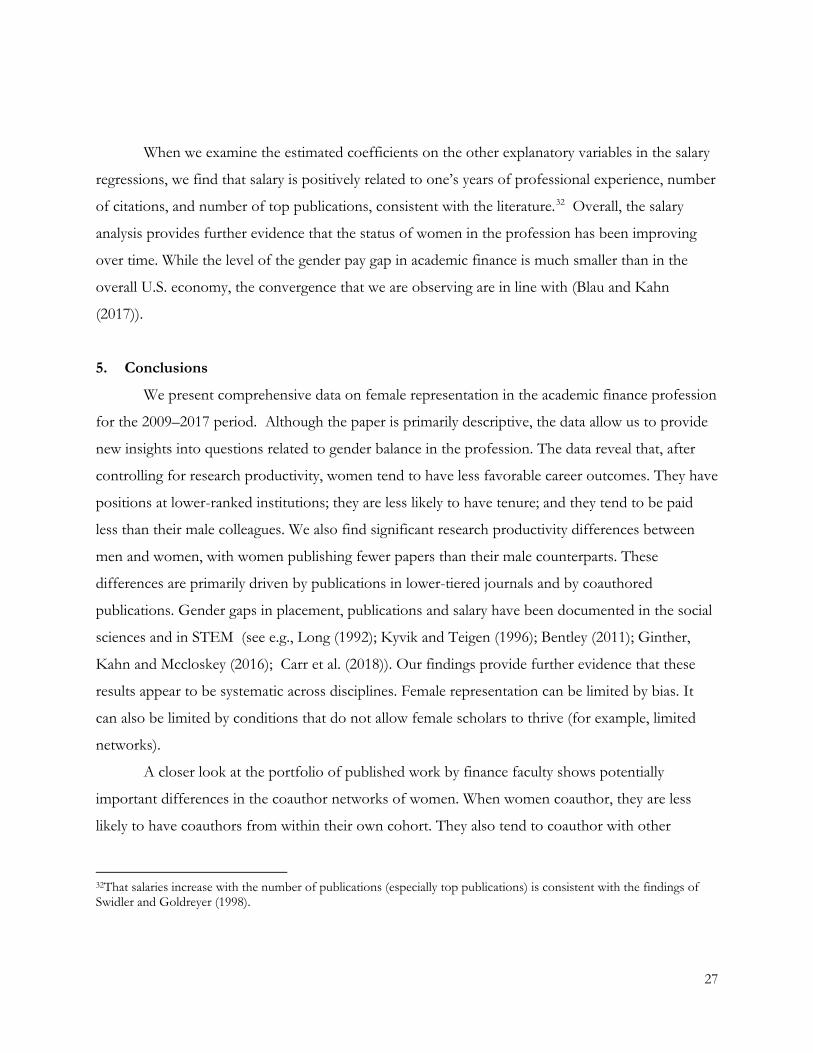
The gender balance has been much stickier at the new assistant professor ranks. Women
comprise 20.4% of recent graduates (faculty with graduation dates from 2009 onward), and Figure 3
shows that there is little time-series variation in the fraction of women graduates that are entering
the sample.
The faculty in our sample come from a wide range of PhD institutions.15 No institution has
more than 8% market share of faculty. However, six schools (Chicago, MIT, Harvard, Stanford,
New York University, and the University of Pennsylvania) dominate. Appendix Table 1 shows each
institution in the sample, along with the fraction of graduates from our sample of top 100 schools
that are female. Women do not appear less likely to graduate from top programs; however, they do
come from a more dispersed set of programs. Differential dispersion might be important if research
networks stem from graduate schools.
3.2. Faculty Publications
13 These numbers line up with those of Fishe (1998). The focus of that paper is on promotion to full professor, but the female representation is consistent: of the 51 full professors at top 20 departments from 1980 to 1991, we count 4 (i.e., 8%) women; of the 68 promoted full professors at departments ranked 21–96, 7 (10%) are women (see tables 4 and 5). 14 Note that, on average, men obtain tenure somewhat earlier in their careers than do women (especially at top schools). Our data are based on calendar time and not tenure clock time, so it is possible that maternity leaves and differential use of child-rearing leaves factor into this difference. The additional time for women to obtain tenure in our sample is shorter than the findings in Kahn (1993), who reports the median time until tenure was 7 years for males but 10 years for females. However, the author concentrates on both economics and management fields and uses older data, from 1970 to 1989. 15 See Internet Appendix Figures 1 and 2.
11
Finance is an articles-driven field. If research productivity determines placement and
promotion, then publication differences between men and women can help with our understanding
of the observation that female representation within the profession is low, especially in top
programs.
Table 3 summarizes the publication records of male and female faculty. In interpreting the
data, it is important to emphasize that women tend to be much newer to the profession than men.
In our sample of faculty-year observations, the mean number of years since obtaining a PhD is 18.5
for men, and it is 12.1 for women. Still, the patterns in the table can be informative.
The summary statistics in Table 3 show that female faculty have fewer publications than
males: the average female in our sample has approximately 51% (7.24/14.33) of total publications
compared with the average male. This publication difference is particularly high at lower-tiered
journals.16 When we consider only the top-3 finance and top-5 economics journals, the average
female publication ratio jumps to 61% (2.83/4.64) of the total top publications of the average male.
Second, as noted above, women have much shorter career histories. When we condition on tenure
status, the year in which the person receives tenure, the year in which the person is promoted to full
professor, or when we focus on the subsample of recent graduates, the ratio of female publications
to male publications increases even further, but it generally remains less than 1 (with the exception
of top-10 and top-30 programs, where women have slightly more top solo-authored publications
than men by their tenure year). Not surprisingly, the number of top publications for both men and
women are higher at top schools. In the regression analysis that follows, we control for years since
PhD and the institution at which the faculty member is employed to help clarify the interpretation of
the differences that we observe in Table 3.
Publication records are an important indicator of faculty productivity, but the publication
record data in Table 3 and in the regressions that follow come with an important caveat. We do not
observe productive activities outside of publications. Differential engagement in nonresearching
16 Total Publications includes all publications in journals in the Scopus Business and Economics category. Top Publications are all publications in the top-3 finance journals and in the top-5 economics journals (footnote 3 lists the top journals in each field). Top Solo-Authored Publications are all top publications that are solo authored, and Other Solo-Authored Publications are all solo-authored publications that are not in a top journal.

12
tasks can possibly explain some of the gender differences in the publication rates that we observe.
Babcock, et al. (2017) report that women, more than men, volunteer for tasks that tend to benefit
the organization rather than their individual career advancement prospects. Guarino and Borden
(2017) provide survey evidence that female faculty provide 30 more minutes per week of service and
1.5 more service activities per year than do men. El-Alayli, Hansen-Brown, and Ceynar (2018) report
that students perceive female professors to be more nurturing. They argue that this perception can
lead to more burden for female professors. If similar patterns exist among finance faculty, then the
publications-based measures of productivity for women are biased downward. Importantly, if non-
research services are valued, this should result in a bias toward results that indicate more favorable
outcomes for women in the regressions that condition only on publication records.
4. Regression Analysis
Before turning to the regressions, we emphasize that the paper is primarily descriptive. The
regressions allow us to control for important variables such as the number of years of professional
experience and institution fixed effects. Our objective is to provide a comprehensive view of the
status of women in the academic finance profession, but we are unable to make strong causal
statements. In addition, because our data cover only 9 years, we do not follow faculty through their
entire careers. This means that survivorship is a concern, especially among the population of more
experienced faculty. To help address it, and to aid in the overall interpretation, we supplement the
cross-sectional regressions with analyses of exit patterns among recent graduates.
Internet Appendix Table 2 provides summary statistics for all of the variables that we use in
the regressions. The table shows all faculty-year observations. Along with the faculty-level findings
from Tables 1 and 2 and Figures 1 through 3, the unconditional means in Internet Appendix Table 2
suggest greater employment of women by lower-ranked institutions; lower tenure rates among
female faculty; and somewhat lower salaries for women compared to men. We provide more formal
analyses of these in the regression analyses that follow.

13
4.1. Rank of Institution
Table 2 suggests that women are underrepresented in the profession, especially at top-ranked
schools. We begin this section with a more formal analysis of the representation of women among
the top-100 programs.
Table 4 presents results of ordinary least squares (OLS) regressions in which the dependent
variable is the Institution rank, defined as the mean U.S. News & World Report ranking over the 2009–
2017 sample period. The explanatory variable of interest is Female, a dummy equal to one if the
faculty member is female. We also control for rank in the profession (Tenured, a dummy equal to one
if the faculty member has tenure during year t); professional experience (YearsSincePhD, the number
of calendar years since the faculty member earned a PhD); status in the profession/subfield
popularity (Citations, defined as ln(number of citations+1)); and research productivity (Top Pubs,
defined as ln(number of top publications+1), where the number of top publications is the total
number of top-3 finance and top-5 economics publications through year t; and Other Pubs, defined as
ln(number of other publications+1), where the number of other publications is defined as
publications through year t in all outlets that are not top publications). We take natural logs of the
citation and publication variables following Heckman and Moktan (2018) and Sarsons (2017). We
distinguish top publications to account for the findings in Heckman and Moktan (2018), who report
that publishing in top journals predicts career outcomes in economics. We estimate pooled
regressions using data for the entire 2009–2017 sample period, and we cluster standard errors by
year and unique faculty identifier. The regression in Column (1) has no fixed effects. In Column (2),
we add PhD year fixed effects to the model. Column (2) is the preferred specification since there
might be systematic differences in placements across cohorts. Column (3) is identical to Column (2),
but we estimate the model for the subsample of faculty who obtained their PhDs between 2009 and
2017. We also run year-by-year regressions (results are shown in Figure 4). In these regressions, we
omit the YearsSincePhD control because of its correlation with the PhD year fixed effects.
We find that, after controlling for research output, women faculty tend to hold positions at
lower-ranked schools. In Column (2) of Table 4, the estimated coefficient of 3.970 on the Female
dummy implies that, all else equal, women hold jobs at schools ranked nearly four places lower than

14
male faculty. Broadly consistent with this, Ghosh and Liu (2020) examine the rank of first placement
within economics and find that women have a 9% lower probability of obtaining a first job in a US
economics department. They do not, however, examine potential convergence over time. Figure 4
shows that time series variation is important in our sample. Interestingly, the early years of our
sample drive all of the placement differences that we observe in Table 4. The estimated coefficient
on the Female dummy is 6.443 in 2009 and is significant at the 1% level. In 2017, the coefficient is
0.778 and is statistically indistinguishable from zero. The difference in the estimated coefficients is
significant at the 1% level. Thus, differential placement of female faculty, measured by rank of
institution, has disappeared.17 The results in Column (3) of Table 4, in which we examine only recent
graduates and where we observe a positive but statistically insignificant estimated coefficient on the
Female dummy, are consistent with the trend of a decrease in the gender gap over time.18 The
coefficients on the other control variables in Table 4 also deserve mention. Not surprisingly, we find
that faculty with more citations and top publications are at higher-ranked schools. And more
publications that are not in top journals are associated with employment at a lower-tiered school.
In Table 4, we define institution rank based on U.S. News & World Report rankings of MBA
programs. This ranking is correlated with research ranking, but it is also true that the MBA rankings
place substantial weight on variables such as recruiter assessments and MBA student placements and
starting salaries. To address this potential concern, we construct an alternative ranking variable using
faculty publication data. Institution Rank is measured as the equal weighted average (across all sample
years) of the mean number of top publications by individual finance faculty members at the
institution. Internet Appendix Table 5 provides results of regression analyses that are analogous to
those shown in Table 4 and in Figure 4 but they use this alternative measure of institution rank.
Similar to Figure 4, the results show a gender gap in placement during the first three years of the
sample, but this gap becomes statistically insignificant in the later years.
4.2. Tenure Status
17 The full results from the year-by-year regressions are shown in Internet Appendix Table 3. 18Although there does not appear to be a significant gender gap among recent graduates, it is also the case that the average gender gap in institution rank shown in Table 4 is driven by untenured faculty (Internet Appendix Table 4).

15
Figure 2 reveals that less than 15% of tenured faculty are female in every year of the sample.
Table 2 shows that this gender imbalance among tenured faculty is present at both top schools and
at lower-ranked ones. In interpreting these averages, it is useful to control for variables such as time
since PhD (because women tend to be more recent graduates), as well as publication records.
Our focus is on understanding gender differences in tenure among all finance faculty, for the
full sample and over each year of the sample period. We take two complementary approaches in
analyzing tenure status. First, we study the entire sample of finance faculty. Second, in the spirit of
recent literature on tenure and promotion in economics (Sarsons (2017); Heckman and Moktan
(2018)), we ask the following question: conditional on having a position at a top-100 school at some
point during our sample period, what is the likelihood of having tenure by year X post-PhD? We
define X as 6, 8, 10, and 12 years post-PhD. Unfortunately, given the 8-year sample period, we are
limited in what we can say about tenure rates among new graduates. The median time to obtain
tenure is greater than 8 years for both men and women, and our data are therefore inappropriate for
a formal examination of the career trajectories of the subsample of recent graduates (although we
can use the recent graduate subsample to examine exits rates; we do so in the next section).
In the first approach, we estimate a linear probability model in which the dependent variable
is a dummy variable equal to one if the faculty member has tenure during year t. Explanatory
variables are Female, YearsSincePhD, Citations, Top Pubs, and Other Pubs. The disaggregation of
publications into top and other publications (Top Pubs and Other Pubs, respectively) is important,
given findings in Heckman and Moktan (2018) that, in the top-35 economics departments,
publishing in a top-5 economics journal strongly predicts tenure rates. The results are in Table 5.
Column (1) does not include any fixed effects, but we add Ph.D. year fixed effects in Column (2)
and we include both Ph.D. year and institution fixed effects in Column (3). Column (3) is our
preferred specification because the institution fixed effects help us control for different rates of
tenure at a given institution, and the PhD year fixed effects allow us to absorb differential tenure
status across cohorts within our 8-year sample of data. We include data for all faculty-years and we
cluster standard errors are clustered by year and unique faculty identifier. Figure 5 shows results of
year-by-year analysis, in which we repeat the Table 5 regressions. The detailed results from the year-

16
by-year regressions from Figure 5 are shown in Internet Appendix Table 6. We do not include the
years since PhD control in the year-by-year regressions because it does not vary for a given
individual within a single year and maps to the PhD year fixed effects.
Table 5 reveals a significant gender gap in tenure rates among male and female faculty. The
results shown in Column (3) of Table 5 imply that women are 3.1% less likely to be tenured than
male faculty.19 This is the gap that we observe after controlling for publications and citations, which
are the most important variables in explaining tenure. Second, when we repeat the Table 5 analysis
by running year-by-year regressions, Figure 5 shows a pattern consistent with the trends from Figure
4: there is a significant gender gap during the first 5 years of the sample period, and this gap entirely
disappears by 2014. For example, the estimated coefficient of -0.045 on the Female dummy in the
2009 regression is statistically significant and implies that women are 4.5% less likely to have tenure
in that year. By 2017, the estimated coefficient of 0.007 is indistinguishable from zero. Thus, female
representation among senior female faculty is, indeed, improving.20
The coefficients on the control variables in Table 5 are also of interest. Not surprisingly, we
find that the number of years since PhD, citations, top publications, and other publications are all
positively related to tenure status. The estimated coefficient on Other Pubs publications is larger than
the estimated coefficient on Top Pubs in the pooled regressions shown in Table 5, but this difference
is not statistically significant. Still, it is somewhat curious that other publications are as important as
top publications. One possible explanation is that evaluation standards differ within the sample of
the top-100 schools. In Internet Appendix Table 7, we repeat the analysis for the subsample of the
top-30 schools. The estimated coefficient on top publications is 0.032 and it is 0.029 for other
19 Column (1) shows a statistically insignificant estimated coefficient on the Female dummy. This is likely due to the fact that women are from more recent PhD year cohorts. The YearsSincePhD variable accounts for some of this variation, but it may not adequately account for cohort effects. Once we control for PhD Year (in both Columns (2) and (3)), the Female dummy becomes significant and the adjusted R-squared of the regressions increase. 20The regressions in Table 5 include institution fixed effects. In Panel A of Internet Appendix Table 8, we replace institution fixed effects with the institution ranking variable. Column (1) of Internet Appendix Table 8 is analogous to Column (3) of Table 5 and Columns (2) through (10) show results of year-by-year analyses, analogous to the findings in Figure 5. On average, we find slightly higher tenure rates of faculty at lower-ranked schools. Importantly, the estimated coefficients on all the other variables are similar to those in Table 5 and in Figure 5. Given our choice of a linear probability model, in Panel B of Internet Appendix Table 8, we also check that our results are robust to a logit specification. Similar to Panel A, we replace the institution fixed effects with the institution ranking variable. Again, the results are qualitatively similar to those shown in Table 5.
17
publications. Moreover, the standards appear to be increasing over time. The estimated coefficient
on top publications increases in magnitude over time, while the estimated coefficient on other
publications goes from being statistically significant in 2009 to insignificant after 2015. Similar to
Figure 5, for the subsample of top-30 schools, we find that women are 6.0% less likely to have
tenure in the beginning of the sample period, and there is no significant difference between men and
women by 2017.
Sarsons (2017) reports that women receive less credit for coauthored work. In Column (4) of
Table 5 and in Figure 6, we repeat the tenure analysis from Column (3), but we divide publications
variables into solo-authored or coauthored publications. In addition, we follow Sarsons (2017), and
we interact all publications variables with Female, a dummy variable equal to one if the faculty
member is female. We find a negative and significant coefficient on the Female dummy, implying
lower average rates of tenure for female faculty. The estimate of the direct effect of Female is -0.090,
larger than what we report in Column (3). Like the findings from Figure 5, Figure 6 reveals that the
estimated coefficients on the female dummy approach zero over time.
When we examine the interactions, unlike Sarsons (2017), we do not find evidence that
women are penalized for their coauthored work. The estimated coefficients on Fem*TopCoauthor Pubs
and on Fem*Other Coauthor Pubs are both insignificant in the regressions shown in Column (4) of
Table 5. If anything, there is some evidence women receive more credit for their solo work (in the
later years of the sample).21 Time-series variation may explain the difference between the
coauthorship results and those in Sarsons (2017). Specifically, the Sarsons (2017) sample period is
from 1985 through 2014. It ends precisely when our results show improvements in the gender gap.
Separate from the gender findings, Column (4) of Table 5 shows that top coauthored publications
are more important than top solo publications. It is possible that collaborations result in better
papers (e.g., Hollis, 2001), although we do not examine this possibility here.
Table 6 presents results of the tenure analyses using the second approach. In particular, we
ask whether female faculty at top-100 schools are as likely as men to have tenure at exactly 6, 8, 10,
and 12 years post-PhD. We emphasize that, to be included in the sample, a faculty member must
21 See Internet Appendix Table 9 for the full year-by-year analysis using the extended specification.

18
appear in the AcA data at least once in our sample period and the 6-, 8-, 10-, or 12-year mark post-
graduation must occur during 2009–2017 sample period (thus, the analyses include only graduates
between 1997 and 2011).22 We do not observe a significant gender gap at 8, 10, or 12 years post-
PhD. At 6 years post-PhD, the estimated coefficient of -0.086 in Column (1) of Table 6 implies that,
after controlling for research productivity, women are 8.6% less likely to have tenure by year 6.23
This could occur because of discrimination, longer tenure clocks (e.g., because of maternity leaves),
or a tendency for women to exit the profession early in their careers. That we do not find important
gender differences at longer horizons suggests that women take longer to obtain tenure. In Internet
Appendix Figure 3, we show Kaplan-Meier curves for men and women that are consistent with the
results in Table 6.
Column (2) of Table 6 shows results using the extended specification based on Sarsons
(2017). Interestingly, the results suggest the negative effect of gender at the 6-year horizon is driven
by female faculty with more coauthored publications that are not in top journals.24 The other
estimated coefficients are similar to those in Column (1) and there are no significant gender
interactions at 8, 10, and 12 year horizons.
The widely observed “leaky pipeline” shows fewer women at each stage of one’s academic
career. Similar to the tenure analysis shown in Table 5, it is instructive to examine the gender
balance in the population of full professors. In Table 7, we focus only on the subsample of associate
and full professors. We estimate a linear probability model in which the dependent variable is a
dummy variable equal to one if the faculty member is a full professor during year t. The estimated
coefficient of -0.088 in Column (3) of Table 7 suggests that women are 8.8% less likely to be full
professors. Notably, this gap is much larger in magnitude than the difference in tenure rates from
Table 5. And, unlike the tenure and institution rank results, Figure 7 shows that the gender gap
22 Given the small sample size, we do not undertake year-by-year analysis using this approach. 23 Internet Appendix Table 10 shows results for the regressions in Table 6 except that we replace the institution fixed effects with the institution ranking variable. Internet Appendix Table 11 shows logit specification results. The findings in both Internet Appendix Tables 10 and 11 are consistent with those in Table 6. 24 In Internet Appendix Table 10, we repeat the analysis, but we replace the institution fixed effects with the institution ranking variable. The results are qualitatively the same, except women with solo publications that are not in top journals appear to have less favorable tenure outcomes.

19
among full professors remains significant in every year, through the end of the sample period. In
other words, the gender gap at the top of the ladder within the academic finance profession remains.
Full year-by-year regressions are in Internet Appendix Table 12.
4.3. Exits
To understand the tenure patterns that we observe, it is useful to examine exits from the
profession. Internet Appendix Table 13 and in Internet Appendix Figures 4 and 5, we show t+1
faculty-year transitions, given that a faculty member is untenured as of year t. 25 At least
unconditionally, women do not appear to be exiting the profession at higher rates than men. To
examine this more formally, we conduct two sets of regression analyses. The first are analogous to
the regressions in Table 6, in which we ask whether there are gender differences in obtaining tenure
by year X. We are particularly interested in the 6-year horizon for the analysis of exits, because we
observe significant differences in the tenure status of men and women at this horizon. In the second
approach, which closely maps to the regressions that we would ideally run for tenure outcomes
absent any data constraints, we follow all new faculty from their first academic placement to 3, 4, 5,
and 6 years following receipt of their PhD, and we ask whether there are gender differences in exit at
these horizons.
Column (1) of Table 8 provides results of analysis of exits by sample faculty as of 6 years
post-PhD. We do not detect strong evidence that women are exiting the profession early. Low
publication rates at top journals are the most important predictor of exit by year 6. Results of
analyses in which we replace the institution fixed effects with the institution ranking variable (in
Internet Appendix Table 14, Column (1)) are similar. Results in Table 8 are also robust if we use a
logit specification (Internet Appendix Table 14, Column (2)). Columns (2) through (5) of Table 8
focus on the subsample of recent graduates and shows exits by exactly 3, 4, 5, and 6 years post-PhD.
25 Following Heckman and Moktan (2018), we define a lateral move as a movement to an institution within five ranks of the period t institution. Up (down) moves are defined as year t+1 movements to institutions that are five ranks higher than the period t institutions, and down moves are movements to institutions that are at least five ranks lower than the period t institution. Of individuals who obtain tenure, Internet Appendix Table 13 shows that the majority obtain tenure at their period t institution and downward moves are much more common than lateral or upward moves. This is true for both men and women.

20
We do not observe significant differences between men and women at any horizon.26 The most
important determinant of exit is low publication output.
4.4. Publications
So far, we have focused on differences between men and women in employer rank, tenure
and full professor status, and exits. The gender gaps that we document in the previous analyses
represent the part of the gender imbalance in the profession that is unexplained by differences in
research productivity. Besides the gender gap, in all regressions, we find that the quantity of
publications consistently predicts the outcome variables of interest. Therefore, a more formal look at
publication differences between men and women will be instructive. Table 3 reports that women
tend to publish less (unconditionally). If women in the profession tend to publish less than men,
then these output differences contribute to some of the gender imbalance that we observe in the
profession.
There are two important caveats in the analysis that follows. First, we do not consider
potential gender bias in the publication process. For example, consistent with a higher bar for female
authors, Card, DellaVigna, Fung, and Iriberri (2019) report that, conditional on publication, female-
authored papers in economics receive 25% more citations.27 Second, we do not observe productive
activities outside of publications. This is relevant if there is differential engagement in non-research
tasks between men and women. Indeed, Guarino and Borden (2017) provide survey evidence that
female faculty provide 30 more minutes per week of service and 1.5 more service activities per year
than do men.
Table 9 shows results from OLS regressions in which the dependent variable is Total
Publications, defined as ln(number of total publications+1) through year t. Like in the previous
regressions, the coefficient of interest is that on Female, a dummy equal to one if the faculty member
is female. The other explanatory variables are Tenured, YearsSincePhD, as well as institution and PhD
26 Internet Appendix Table 15 shows results of analysis analogous to Columns (2) through (5) of Table 8 except that we replace institution fixed effects with the ranking variable (Panel A) and estimate a logit model (Panel B). In both cases, we fail to find evidence that women exit early. In Appendix Figure IA 3, we show Kaplan-Meier curves for men and women that are consistent with the findings in Table 8 and with those in Internet Appendix Table 15. 27 Moreover, Hengel (2019) finds that female-authored papers are better written than male-authored papers. In our analysis, we are only able to make statements about differences in publication rates.

21
year fixed effects. We do not include the Citations variable (a proxy for publication quality in the
employer rank, tenure and salary regressions), given that the number of citations is partially a
function of the number of publications. Column (1) does not include any fixed effects. We add
Ph.D. year fixed effects in Column (2) and we include both Ph.D. year and institution fixed effects
in Column (3). As in the prior analyses, Column (3) is our preferred specification because the
institution fixed effects help us control for different publication norms a given institution, and the
PhD year fixed effects allow us to absorb differential publication rates across cohorts within our 8-
year sample of data.
Some useful observations can be gleaned from Table 9 and from the results of the year-by-
year analysis shown in Figure 8. First, consistent with the summary statistics, even after controlling
for tenure status, PhD cohort, and current institution, women tend to publish less than men. For
example, the estimated coefficient of -0.190 on Female in Column (3) implies that, all else equal,
women produce roughly 17.3% fewer published papers than their male colleagues. And, unlike the
earlier tables, Figure 8 shows no evidence that this publication gap is decreasing over time.28 This is
roughly in line with recent evidence in economics (Ghosh and Liu, 2020); however, there, the
evidence is that the publication gap is increasing over time. In Column (4) of Table 9, we examine
only the subsample of recent graduates. The estimated coefficient of -0.123 on the Female dummy
implies that recently graduated women produce 11.5% fewer publications than male, a smaller gap
than in the full sample. In Internet Appendix Table 17, we repeat the Table 9 analysis, except that
we split the sample according to tenure status. Consistent with the findings in Columns (3) and (4)
of Table 9, we find the publication gap to be less pronounced among untenured faculty.
To shed more light on the publication differences in Table 9, we decompose total
publications into top publications and other publications, and then we further divide these into top
solo publications, top coauthored publications, other solo publications, and other coauthored
publications (these are the publication variables that we use in the extended specifications based on
Sarsons (2017)). Results are in Table 10. We find that the publication gap for women, documented
in Table 9, is mainly driven by coauthored publications in lower-tiered journals. We do not find
28 The full results of the year-by-year regressions from Figure 8 are available in Internet Appendix Table 16.

22
statistically significant differences in either solo authored or coauthored publications at top journals.
If female faculty are time-constrained (e.g., Guarino and Borden, 2017), then it is possible that
women publish fewer papers but focus on their most impactful work. The fact that we do not
observe important differences in top publications is consistent with this. We also investigate
citations data. If the gap in citations is not very large, then the data would be consistent with women
focusing on their impactful work. In line with this idea, Appendix Table 18 shows a less significant
gender gap in citations than the gap that we observe in publications, although there is some evidence
that the citations gap is increasing over time.29
4.5. Coauthors
It is clear that publications are related to more favorable career outcomes. The extended
specifications in the tenure analysis (from Tables 5 and 6) reveals that coauthored publications are
even more important in explaining tenure status than solo-authored ones. It is possible that
collaborations result in higher quality work, which is rewarded in the profession. Given that
published coauthored work tends to be at least as important as solo-authored work in explaining
tenure, it is useful to explore potential gender differences in coauthor networks.
We examine three potential network channels through which successful collaborations (i.e.,
publications) might occur: same gender, common cohort, and common institution. We examine the
role of gender in coauthor networks because there is evidence from other fields that women tend to
work with other women. If the same is true in the finance profession, then it would suggest that
womens’ coauthor networks are limited (since our data show that the profession is only 16%
female). AFFECT (2018) presents data on the gender composition of coauthor teams on papers at
finance journals and reports evidence of gender clustering on published work. Our analysis is
complementary to theirs in that we focus at the individual faculty level (rather than at the publication
level, which places more weight on differences among very prolific faculty) and we ask whether a
given faculty member is more or less likely to have a female coauthor. Doing so allows us to control
for factors such as tenure status, institution, and cohort, and author status within the profession (i.e.,
citations), all of which might explain differential gender composition of coauthor teams. Outside of
29 We thank an anonymous referee for encouraging this line of analysis.

23
gender, we also examine the role of common cohorts, especially among faculty who studied at the
same PhD institution at the same time. Both of these could be important social networking
channels. We also look at potential collaborations among individuals working at the same institution
at the same time, as research relationships might evolve through day-to-day contact within one’s
own department.
Table 11 shows results of OLS regressions in which the dependent variable is the natural log
of the number of coauthors of an individual faculty member through year t. We consider 6 coauthor
variables. All Coauthors (Column 1) indicates all unique coauthors. Top-100 Coauthors (Column 2)
indicates the number of unique coauthors from the sample of the top-100 schools. Female Top-100
Coauthors (Column 3) indicates the number of unique female coauthors from the top 100 schools.
Same Cohort (Column 4) is the number of unique coauthors from top 100 schools who have obtained
their PhDs within 4 years of the faculty member. Same PhD and Cohort (Column 5) indicates the
number of unique coauthors from the same PhD program who have obtained their PhDs within 4
years of the faculty member. Same Institution (Column 6) indicates the number of unique coauthors
who were employed by the same institution as the individual faculty member at some point during
years t-3 to t-1 relative to the publication date.
In Panel A of Table 11, we investigate whether there are gender differences in the size of
coauthor networks after controlling for PhD cohort, institution, tenure status and citations. This
first set of regressions allows us to characterize the size of an individual’s network of successful
collaborations, where success is defined as the number of publications. The estimated coefficient on
the Female dummy captures the gender difference in the total number of coauthors in published
work. There are several useful observations from the Table 11 Panel A. First, women have
significantly smaller coauthor networks. The estimated coefficient of -0.126 in Column (1) in Panel
A of Table 11 implies that, all else equal, women have approximately 11.8% fewer coauthors than
their male counterparts. Within the pool of the top-100 coauthors, we find that women have
approximately 7.5% fewer coauthors than do men (Column 2).30 The findings in Columns (1) and
30 McDowell, Singell, and Slater (2006) also find that women are less likely to coauthor. This may, in part, explain research productivity differences between men and women.
24
(2) might not be surprising, given the observations in Tables 9 and 10 that women tend to publish
less. However, even though women tend to publish less, Column (3) of Panel A implies that women
have 5.9% more female coauthors. That is, the second important observation from Panel A of Table
11 is that women are more likely to publish with other women. These findings are consistent with
AFFECT (2018), but their methodology is different from ours. AFFECT (2018) focuses at the
publication level, rather than at the individual faculty level, and their results could be driven by
particularly prolific women. In Column (4) of Panel A, we ask whether there is a gender difference
in the number of coauthors from one’s own PhD cohort. The estimated coefficient of -0.081 on the
Female implies that women have 7.7% fewer coauthors from within their own cohorts. This may
indicate a social networking constraint. When we dive deeper and ask whether the same-cohort
finding stems from fewer productive relationships from graduate school (Column 5), we find a
negative but statistically insignificant estimated coefficient on Female. We also fail to find important
gender differences in coauthorship with colleagues from one’s own institution (Column 6). When we
examine the estimated coefficients on the control variables in Panel A of Table 11, we find that
more seasoned faculty and faculty with more citations have larger coauthor networks.
In Panel B of Table 11, we add controls for the number of publications. We do this because
we want to understand the extent to which the gender differences in coauthor networks that we
observe in Panel A are separate from the finding that women publish less. Different from Panel A,
the estimated coefficients on the Female dummy in Panel B capture gender differences in the size of
coauthor teams. In this second set of regressions, we observe insignificant estimated coefficients on
the Female dummy in both Columns (1) and (2), suggesting that women do not publish with smaller
coauthor teams when they do publish. However, we do find that coauthor teams of women tend to
include other women. The estimated coefficient of 0.073 on the Female dummy in Column (3) of
Panel B suggests that women publish with 7.6% more women on their coauthor teams (not
including themselves). We also find that the coauthor teams of female faculty tend to include
members from different PhD cohorts. The estimated coefficient of -0.061 on Female implies that
women publish on teams that include 5.9% fewer coauthors from the same PhD cohort (Column 4).
25
As in Table 1, we do not find a significant difference in same-cohort coauthors from the same
graduate program or in coauthors employed by the same institutions.
To summarize, Panels A and B of Table 11 reveal that, even though women tend to publish
less, they are more likely than men to have successful collaborations with other women. Given that
the profession is comprised of less than 20% women, female faculty may be limited by the pool of
potential collaborators. In addition, we find that the structures of collaboration networks differ in
that women are less likely to have successful collaborations with others from their own cohorts. This
difference might be important if, for example, coauthor characteristics are considered in promotion
cases. However, interestingly, when we examine the subsample of recent graduates in Table 11,
Panel C, we do not observe statistically significant gender differences in coauthor networks,
suggesting that the main findings are driven by more senior women. Consistent with this, when we
sort the sample according to tenure status in Internet Appendix Table 19, we find that women tend
to work with other women in both groups (untenured and tenured), but the subsample of tenured
faculty is driving the same-cohort findings.
In all of the Table 11 regressions, we control for citations in order to account for a faculty
member’s status within the profession and any differences in the popularity of the individual’s
subfield. This is important because there are differences in the subject areas in which men and
women publish. In our sample, 49.1% of men publish mainly in asset pricing (JEL code G1), while
only 38.7% of women do. By contrast, 40.1% of women publish in mainly corporate finance and
governance (JEL code G3), while only 29.6% of men do. Financial institutions and services (JEL
code G2) is more balanced, accounting for 17.1% and 20.1% of all males and females, respectively.
As a further check that the observed differences in coauthor network structure are not due to
subfield effects, we extend the regressions to include subfield controls, where an individual’s
subfield maps to the most frequent JEL code of all of the faculty member’s published finance
articles through year t. The results are in Internet Appendix Table 20 and are similar to those in
Table 11.
4.6. Salary
26
Is there evidence of a gender wage gap in academic finance? Unconditional wage differences
have been documented in other fields (e.g., Binder et al. 2010; Monks and Robinson, 2000; Ginther
and Hayes, 1999), but it is also the case that research productivity and academic rank explain much
of this difference in pay. As a final exploration of potential gender differences in career outcomes
within the academic finance profession, we obtain salary data for the faculty at 37 of the 60 public
institutions in the sample. Most states have Freedom of Information Acts that require public
employers to make public salary information for all employees. Our requests for salary data for the
2009–2017 period are fulfilled, at least in part, in the majority of cases. Internet Appendix Table 21
lists the institutions and years for which we have salary data. We use all available data in the analysis.
Table 12 and Figure 9 show results of OLS regressions in which the dependent variable is
the natural log of the faculty member’s 9-month salary. As in previous tables, Column (1) shows
results with no fixed effects. Column (2) contains results of the specification with Ph.D. year fixed
effects and Column (3) has both Ph.D. year and institution fixed effects. We prefer the specification
in Column (3) because it allows us to compare wages of faculty within the same institution, after
controlling for their productivity and seniority. The point estimate of 0.038 in the pooled regressions
in Column 3 suggest a gender wage gap of approximately 3.7% during the entire 2009–2017 sample
period but it is not statistically significant. The wage gap is also insignificant in the subsample of
recent graduates (Column 4).31 However, consistent with the rank of employer and tenure
regressions, Figure 9 shows that the pay gap is significant during some of the early years of the
sample, and it goes away by 2015. Given the public scrutiny on salary information, it is somewhat
surprising that any gap exists in any year. Interestingly, the largest estimated wage gaps are in 2011
and 2012, just as many schools began to recover from the financial crisis. It is possible that the post-
financial crisis wage adjustments were faster for men than for women. The full year-by-year results
of the regressions shown in Figure 9 are available in Internet Appendix Table 22.
31 Ginter and Hayes (1999) report that salary differences can largely be explained by faculty rank. In Internet Appendix Table 23, we add faculty title to the tenure status and Ph.D. cohort controls, and all results are similar to those in Column (3) of Table 12 and in Appendix Table 22. When we control for rank by examining tenured and untenured faculty separately, we find a statistically significant gender wage gap of approximately 1.8% among untenured faculty, and a larger point estimate but statistically insignificant difference in salary among faculty with tenure.
27
When we examine the estimated coefficients on the other explanatory variables in the salary
regressions, we find that salary is positively related to one’s years of professional experience, number
of citations, and number of top publications, consistent with the literature.32 Overall, the salary
analysis provides further evidence that the status of women in the profession has been improving
over time. While the level of the gender pay gap in academic finance is much smaller than in the
overall U.S. economy, the convergence that we are observing are in line with (Blau and Kahn
(2017)).
5. Conclusions
We present comprehensive data on female representation in the academic finance profession
for the 2009–2017 period. Although the paper is primarily descriptive, the data allow us to provide
new insights into questions related to gender balance in the profession. The data reveal that, after
controlling for research productivity, women tend to have less favorable career outcomes. They have
positions at lower-ranked institutions; they are less likely to have tenure; and they tend to be paid
less than their male colleagues. We also find significant research productivity differences between
men and women, with women publishing fewer papers than their male counterparts. These
differences are primarily driven by publications in lower-tiered journals and by coauthored
publications. Gender gaps in placement, publications and salary have been documented in the social
sciences and in STEM (see e.g., Long (1992); Kyvik and Teigen (1996); Bentley (2011); Ginther,
Kahn and Mccloskey (2016); Carr et al. (2018)). Our findings provide further evidence that these
results appear to be systematic across disciplines. Female representation can be limited by bias. It
can also be limited by conditions that do not allow female scholars to thrive (for example, limited
networks).
A closer look at the portfolio of published work by finance faculty shows potentially
important differences in the coauthor networks of women. When women coauthor, they are less
likely to have coauthors from within their own cohort. They also tend to coauthor with other
32That salaries increase with the number of publications (especially top publications) is consistent with the findings of Swidler and Goldreyer (1998).

28
women. Given the importance of coauthored publications in explaining many of the outcome
variables that we consider (i.e., tenure status, exits from the profession, and salary), the finding that
women tend to coauthor with other women, along with the fact that women comprise only 16.0%
of the sample of finance faculty, suggest that women have smaller publication networks. A larger
flow of women into the profession could expand the pool of potentially successful collaborations.
Much has been written about the “leaky pipeline” in academia, where the representation of
women declines at each stage of the academic career. Although we do not observe finance faculty at
each stage in the pipeline, the analysis in this paper can still shed some light on the issue. If the low
representation of women in finance were due entirely to small numbers of women entering the
profession from Ph.D. programs (i.e., a pipeline issue), then the women who do enter finance
academia would see their careers progress along trajectories that are similar to those of men.
Specifically, we would not observe important gender differences in career outcomes after controlling
for research productivity.
Despite the average evidence of gender gaps during the 2009-2017 sample period, we also
find that the status of women in the profession is improving. In the last years of our sample, the
evidence that women are at lower-ranked schools; are less likely to have tenure; or receive lower
wages disappears. However, the research productivity gap remains. Mentoring programs might help
reduce the publication gap. For example, Blau, Currie, Croson, and Ginther (2010) conduct a
randomized trial with mentoring interventions, in which junior women participate small group
workshops with senior female economists working in similar research areas. They report that the
mentoring program increased publication rates in top journals among female economists by 25
percent. Of course, one implementation challenge within the academic finance profession could be
the supply of mentors, given our finding of a persistent gender gap in the composition of full
professors. Efforts to increase rates of promotion beyond tenure might increase gender balance
within the profession, at all levels.

29
References
AAUP, 2019, The Annual Report on the Economic Status of the Profession, 2018–19.
AFFECT, 2018, Publication patterns of women in the finance profession? Preliminary data from the AFFECT board, presented at the 2018 AFA (Philadelphia).
Antecol, Heather, Kelly Bedard, and Jenna Stearns, 2018, Equal but inequitable: Who benefits from gender-neutral tenure clock stopping policies, American Economic Review 108(9), 2420-41.
Babcock, Linda, Maria P. Recalde, Lise Vesterlund, and Laurie Weingart, 2017, Gender differences in accepting and receiving requests for tasks with low promotability, American Economic Review 107(3), 714-47.
Bayer, Amanda and Cecilia Elena Rouse, 2017, Diversity in the economics profession: A new attack on an old problem, Journal of Economic Perspectives 30(4), 221–242.
Bentley, Peter, 2011, Gender differences and factors affecting publication productivity among Australian university academics, Journal of Sociology 48(1), 85-103.
Bertrand, Marianne, 2018, Coase lecture–The glass ceiling, Economica 85(338), 205-231.
Bettinger, Erin P. and Briget Terry Long, 2005, Do faculty serve as role models? The impact of instructor gender on female students, American Economic Review 95(2), 152-157.
Binder, Melissa, Kate Krause, Janie Chermak, Jennifer Thacher, and Julia Gilroy, 2010, Same Work, Different Pay? Evidence from a US Public University, Feminist Economics 16:4, 105-135.
Blau, Francine, Janet Currie, Rachel Croson, and Donna Ginther, 2010, Can mentoring help female assistant professors? Interim results from a randomized trial, American Economic Review 100(2), 348–352.
Blau, Francine and Lawrence M. Kahn, 2017, The gender wage gap: Extent, trends, and explanations, Journal of Economic Literature 55(3), 789-865.
Boschini, Anne and Anna Sjogren, 2007, Is team formation gender neutral? Evidence from coauthorship patterns, Journal of Labor Economics 25(2), 325–65.
Boustan, Leah and Andrew Langan, 2019, Variation in women’s success across PhD programs in economics, Journal of Economic Perspectives 33(1), 23–42.
Brogaard, Jonathan, Joseph Engelberg, and Edward Van Wesep, 2018, Do economists swing for the fences after tenure? Journal of Economic Perspectives 32(1), 179–194.
Buckles, Kasey, 2019, Fixing the leaky pipeline: Strategies for making economics work for women at every stage, Journal of Economic Perspectives 33(1), 23–42.

30
Card, David, Stefano DellaVigna, Patricia Funk, and Nagore Iriberri, 2019, Are referees and editors in economics gender neutral? Working Paper.
Carrell, Scott E., Marianne E. Page, and James E. West, 2010, Sex and science: How professor gender perpetuates the gender gap, The Quarterly Journal of Economics 125(3), 1101-1144.
Ceci, Stephen, Ginther, Donna K., Shulamit Kahn, and Wendy M. Williams, 2014, Women in academic science: A changing landscape. Psychological Science in the Public Interest 15(3), 75-141.
Chari, Anusha and Paul Goldsmith-Pinkham, 2018, Gender representation in economics across topics and time: Evidence from the NBER Summer Institute, Working Paper.
Committee on the Status of Women in the Economics Profession, Annual Report (December 2019).
Currie, Russell and Gurupdesh Prandher, 2011, Finance journal rankings and tiers: An active scholar assessment methodology, Journal of Banking and Finance 35(1), 7–20.
El-Alayli, Amani, Ashley Hansen-Brown, and Michelle Ceynar, 2018, Dancing backwards in high heels: Female professors experience more work demands and special favor requests, particularly from academically entitled students, Sex Roles 79(3-4), 136–150.
Fishe, P. H. Raymond, 1998, What are the research standards for full professor of finance? Journal of Finance 53(3), 1053–1079.
Ghosh, Pallab and Zexuan Liu, 2020, Coauthorship and the gender gap in top economics journal publications, Applied Economics Letters 27(7), 580-90.
Ginther, Donna K, 2006, The Economics of Gender Differences in Employment Outcomes in Academia, National Academy of Sciences (US) Committee on Maximizing the Potential of Women in Academic Science and Engineering.
Ginther, Donna K. and Katy Hayes, 1999, Gender Differences in Salary and Promotion in the Humanities, American Economic Review, 89(2): 397–402.
Ginther, Donna K., Shulamit Kahn, and Jessica McCloskey, 2016, Gender and academics. The New Palgrave Dictionary of Economics Online, Palgrave Macmillan.
Goldin, Claudia, 2014, A grand gender convergence: Its last chapter, American Economic Review 104(4), 1091-1119.
Guarino, Cassandra and Victor Borden, 2017, Faculty service loads and gender: Are women taking care of the academic family? Research in Higher Education 58(6), 672–694.
Heckman, James and Sidharth Moktan, 2018, Publishing and promotion in economics: The tyranny of the top five, Working Paper.

31
Hengel, Erin, 2019, Gender differences in citations at top economics journals, Working Paper.
Hollis, Aidan, 2001, Co-authorship and the output of academic economists, Labor Economics 8, 503-530.
Kahn, Shulamit, 1993, Gender differences in academic career paths of economists, American Economic Review, 83(2), 52–56.
Kyvik, Svein, and Mari Teigen (1996). Child care, research collaboration, and gender differences in
scientific productivity, Science, Technology, & Human Values 21(1), 54-71.
Lim, Jaeguem and Jonathan Meer, 2019, Persistent effects of teacher-student gender matches, Journal of Human Resources (preprint).
Long, Scott J., 1992, Measures of sex differences in scientific productivity, Social Forces 71(1), 159-178.
Lundenberg, Shelly and Jenna Stearns, 2019, Women in Economics: Stalled progress, Journal of Economic Perspectives 33(1), 3–22.
McDowell, John M., Larry D. Singell, Jr., and Mark Stater, 2006, Two to tango? Gender differences in the decisions to publish and coauthor, Economic Inquiry 44(1), 153–168.
McPherson, Michael A., Myungsup Kim, Megan Dorman, and Nishelli Perera, 2013, Research output at US economics departments, Applied Economics Letters 20(9), 889-892.
Monks, James and Robinson, Michael, 2000, Gender and Racial Earnings Differentials in Academic Labor Markets, Economic Inquiry, 38(4): 662–71.
Nosek, Brian A., Frederick L. Smyth, N. Sriram, Nicole M. Lindner, Thierry Devos, Alfonso Ayala, Yoav Bar-Anan, Robin Bergh, Huajian Cai, Karen Gonsalkorale, Selin Kesebir, Norbert Maliszewski, Félix Neto, Eero Olli, Jaihyun Park, Konrad Schnabel, Kimihiro Shiomura, Bogdan Tudor Tulbure, Reinout W. Wiers, Mónika Somogyi, Nazar Akrami, Bo Ekehammar, Michelangelo Vianello, Mahzarin R. Banaji, and Anthony G. Greenwald, 2009, National differences in gender–science stereotypes predict national sex differences in science and math achievement, Proceedings of the National Academy of Sciences 106(26), 10593-10597.
Reuben, E., Sapienza, P., & Zingales, L. (2014). How stereotypes impair women’s careers in science, Proceedings of the National Academy of Sciences, 111(12), 4403-4408.
Porter, Catherine and Danila Serra, 2017, Gender differences in the choice of major: The importance of female role models,” American Economic Journal: Applied Economics (forthcoming).
Sarsons, Heather, 2017, Gender differences in recognition for group work, Working Paper.
Swidler, Steve and Elizabeth Goldreyer, 1998, The value of a finance journal publication, Journal of Finance 53(1), 351–363.

32
Figure 1: Sample of Finance Faculty, by Year
Figure 2: Sample of Tenured Finance Faculty, by Year
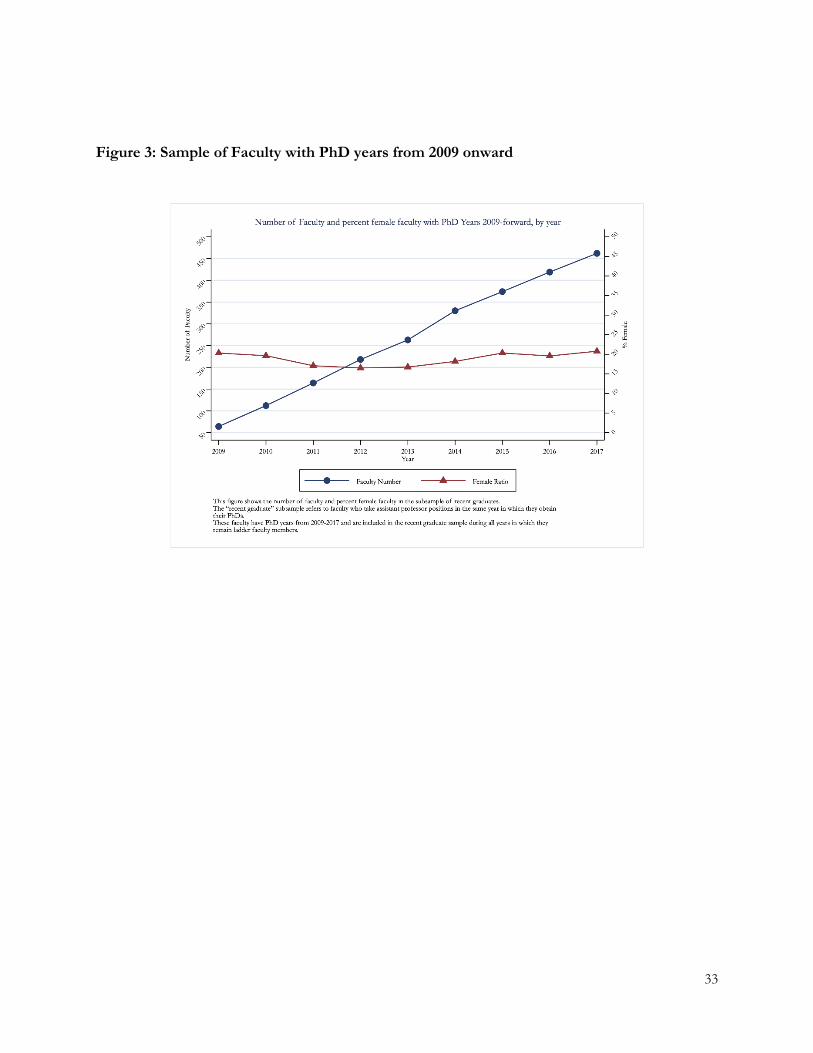
33
Figure 3: Sample of Faculty with PhD years from 2009 onward

34
Figure 4: Are female faculty more likely to be employed by lower-ranked schools? Year-by-year analysis
The figure plots results of OLS regressions in which the dependent variable is institution rank, defined as the U.S. News & World Report ranking of the school at which the faculty member is employed. The specification and all explanatory variables are identical to those in Column 2 of Table 4 except that the model is estimated for each year of the sample period. The figure shows the point estimates and 95% confidence intervals around the coefficients on the female dummy for each year. The figure also plots the difference between the estimated coefficient on the female dummy in year t and the estimated coefficient in 2009 (the first year of the sample).
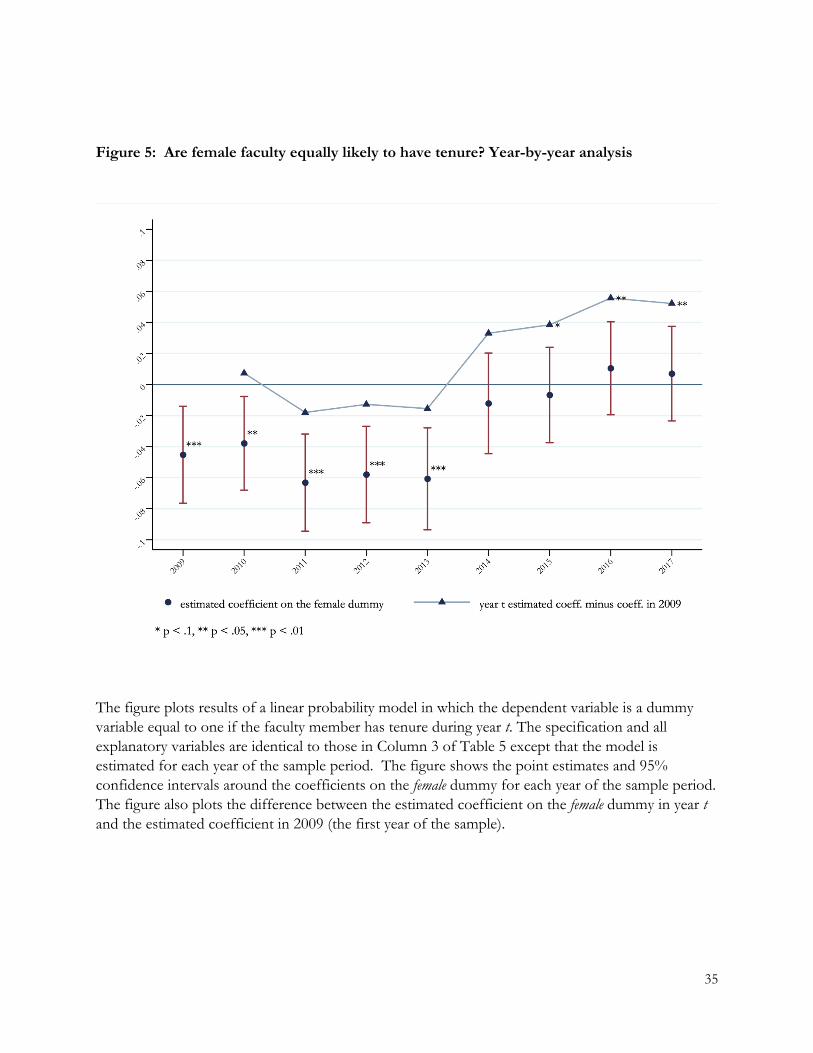
35
Figure 5: Are female faculty equally likely to have tenure? Year-by-year analysis
The figure plots results of a linear probability model in which the dependent variable is a dummy variable equal to one if the faculty member has tenure during year t. The specification and all explanatory variables are identical to those in Column 3 of Table 5 except that the model is estimated for each year of the sample period. The figure shows the point estimates and 95% confidence intervals around the coefficients on the female dummy for each year of the sample period. The figure also plots the difference between the estimated coefficient on the female dummy in year t and the estimated coefficient in 2009 (the first year of the sample).

36
Figure 6: Are female faculty equally likely to have tenure? Year-by-year analysis (Extended specification)
The figure plots results of a linear probability model in which the dependent variable is a dummy variable equal to one if the faculty member has tenure during year t. The specification and all explanatory variables are identical to those in Column 4 of Table 5 (the extended specification based on Sarsons, 2017) except that the model is estimated for each year of the sample period. The figure shows the point estimates and 95% confidence intervals around the coefficients on the female dummy for each year of the sample period. The figure also plots the difference between the estimated coefficient on the female dummy in year t and the estimated coefficient in 2009 (the first year of the sample).

37
Figure 7: Are female faculty equally likely to be full professors? Year-by-year analysis
The figure plots results of a linear probability model in which the dependent variable is a dummy variable equal to one if the faculty member is a full professor during year t. The specification and all explanatory variables are identical to those in Column (3) of Table 7 except that the model is estimated for each year of the sample period. The figure shows the point estimates and 95% confidence intervals around the coefficients on the female dummy for each year of the sample period. The figure also plots the difference between the estimated coefficient on the female dummy in year t and the estimated coefficient in 2009 (the first year of the sample).

38
Figure 8: Are there gender differences in research output? Year-by year analysis
This table shows results of OLS regressions in which the dependent variable is Total Publications, defined as the number of total publications by the faculty member through year t. The specification and all explanatory variables are identical to those in Column (3) of Table 9 except that the model is estimated for each year of the sample period. The figure shows the point estimates and 95% confidence intervals around the coefficients on the female dummy for each year of the sample period. The figure also plots the difference between the estimated coefficient on the female dummy in year t and the estimated coefficient in 2009 (the first year of the sample).

39
Figure 9: Is There Evidence of a Gender Wage Gap? Year-by year analysis
This table shows results of OLS regressions in which the dependent variable is the natural log of the faculty member’s 9-month salary. The specification and all explanatory variables are identical to those in Column 3 of Table 12 except that the model is estimated for each year of the sample period. The figure shows the point estimates and 95% confidence intervals around the coefficients on the female dummy for each year of the sample period. The figure also plots the difference between the estimated coefficient on the female dummy in year t and the estimated coefficient in 2009 (the first year of the sample).
40
Table 1: Sample of Top-100 Business Schools
This table lists the sample of top-100 business schools. To be included in the sample, the school must appear in the U.S. News & World Report list of top-100 U.S. business schools at least once during the 2009–2017 sample period. We also require coverage in the Academic Analytics database for at least one year during sample period. Mean USN Ranking is the average U.S. News & World Report ranking during the sample period. Publication Tier is the alternative ranking variable, equal to the quartile of research productivity, where productivity is measured as the average (across all sample years) number of top publications by finance faculty members at the institution. The top publication measure is calculated in each year as the mean number of top publications by finance faculty at the institution. %Female is the fraction of faculty-year observations where the faculty member is female.
Institution Mean USN
Ranking
Publication Tier
All Faculty Tenured Faculty
Faculty-Yr Obs.
% Female
Faculty-Yr Obs.
% Female
Harvard University 1.2 1 270 11.1% 165 6.7% Stanford University 1.6 1 143 11.9% 99 9.1% University of Pennsylvania 2.9 2 361 11.1% 233 7.7% MIT 4.2 1 168 16.7% 106 24.5% University of Chicago 4.2 1 300 9.3% 200 4.5% Northwestern University 4.6 1 243 19.3% 148 18.2% UC Berkeley 7.0 1 183 19.1% 143 22.4% Dartmouth College 8.2 1 89 10.1% 64 12.5% Columbia University 8.7 1 339 11.5% 253 7.1% Yale University 10.8 1 148 16.9% 101 13.9% New York University 11.6 1 367 7.6% 267 3.4% University of Michigan 12.3 1 156 12.2% 114 10.5% Duke University 12.4 1 148 12.8% 112 8.0% University of Virginia 12.4 2 227 19.8% 199 18.6% UCLA 14.8 1 143 6.3% 115 6.1% Cornell University 16.2 1 131 22.1% 83 15.7% UT Austin 16.7 1 216 12.5% 144 13.9% Carnegie Mellon 17.9 2 124 10.5% 77 0.0% UNC Chapel Hill 18.9 2 198 14.6% 125 12.0% Wash U (St. Louis) 20.8 2 151 10.6% 77 0.0% Emory University 21.0 1 105 5.7% 71 0.0% Indiana University 22.0 3 224 24.1% 144 25.0% Georgetown University 23.0 2 156 18.6% 116 15.5% USC 23.9 2 286 6.6% 161 2.5%
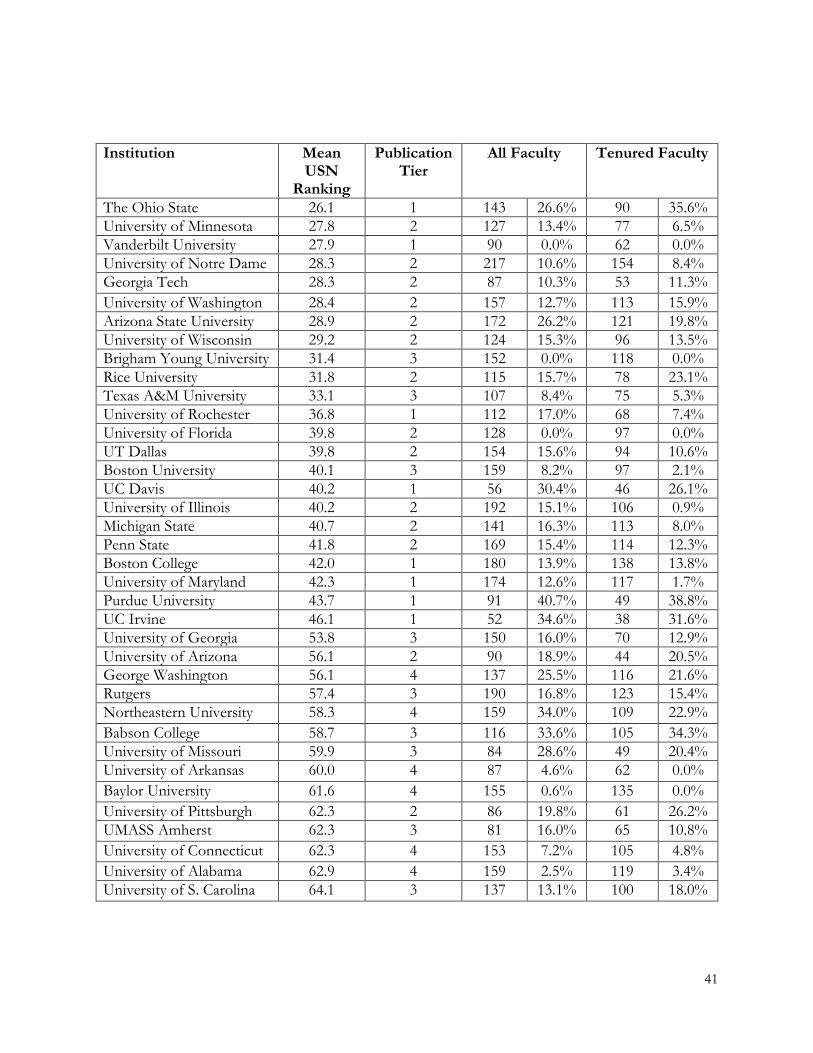
41
Institution Mean USN
Ranking
Publication Tier
All Faculty Tenured Faculty
The Ohio State 26.1 1 143 26.6% 90 35.6% University of Minnesota 27.8 2 127 13.4% 77 6.5% Vanderbilt University 27.9 1 90 0.0% 62 0.0% University of Notre Dame 28.3 2 217 10.6% 154 8.4% Georgia Tech 28.3 2 87 10.3% 53 11.3% University of Washington 28.4 2 157 12.7% 113 15.9% Arizona State University 28.9 2 172 26.2% 121 19.8% University of Wisconsin 29.2 2 124 15.3% 96 13.5% Brigham Young University 31.4 3 152 0.0% 118 0.0% Rice University 31.8 2 115 15.7% 78 23.1% Texas A&M University 33.1 3 107 8.4% 75 5.3% University of Rochester 36.8 1 112 17.0% 68 7.4% University of Florida 39.8 2 128 0.0% 97 0.0% UT Dallas 39.8 2 154 15.6% 94 10.6% Boston University 40.1 3 159 8.2% 97 2.1% UC Davis 40.2 1 56 30.4% 46 26.1% University of Illinois 40.2 2 192 15.1% 106 0.9% Michigan State 40.7 2 141 16.3% 113 8.0% Penn State 41.8 2 169 15.4% 114 12.3% Boston College 42.0 1 180 13.9% 138 13.8% University of Maryland 42.3 1 174 12.6% 117 1.7% Purdue University 43.7 1 91 40.7% 49 38.8% UC Irvine 46.1 1 52 34.6% 38 31.6% University of Georgia 53.8 3 150 16.0% 70 12.9% University of Arizona 56.1 2 90 18.9% 44 20.5% George Washington 56.1 4 137 25.5% 116 21.6% Rutgers 57.4 3 190 16.8% 123 15.4% Northeastern University 58.3 4 159 34.0% 109 22.9% Babson College 58.7 3 116 33.6% 105 34.3% University of Missouri 59.9 3 84 28.6% 49 20.4% University of Arkansas 60.0 4 87 4.6% 62 0.0% Baylor University 61.6 4 155 0.6% 135 0.0% University of Pittsburgh 62.3 2 86 19.8% 61 26.2% UMASS Amherst 62.3 3 81 16.0% 65 10.8% University of Connecticut 62.3 4 153 7.2% 105 4.8% University of Alabama 62.9 4 159 2.5% 119 3.4% University of S. Carolina 64.1 3 137 13.1% 100 18.0%

42
Institution Mean USN
Ranking
Publication Tier
All Faculty Tenured Faculty
University of Tennessee 66.0 4 98 11.2% 81 12.3% Iowa State University 66.7 4 121 22.3% 70 18.6% Case Western Reserve 67.2 3 87 19.5% 62 6.5% North Carolina State 69.9 4 49 20.4% 37 8.1% William & Mary 70.8 4 113 23.9% 91 13.2% University of Utah 71.0 2 132 19.7% 96 16.7% Louisiana State University 72.0 3 96 25.0% 67 10.4% University of Oklahoma 73.6 2 88 14.8% 65 0.0% University of Cincinnati 74.8 3 89 2.2% 67 0.0% SUNY Buffalo 76.6 3 101 5.0% 51 0.0% University of Louisville 77.0 4 62 27.4% 54 20.4% Syracuse University 77.1 4 105 21.0% 78 11.5% U. Colorado (Boulder) 77.9 3 124 8.9% 81 11.1% University of Miami 80.1 3 112 16.1% 78 16.7% CUNY 81.1 3 268 23.5% 214 18.7% Auburn University 82.6 4 116 19.8% 97 18.6% Stevens Inst. of Tech. 83.0 4 28 39.3% 9 0.0% Fordham University 88.8 4 222 27.0% 134 14.2% SUNY Binghamton 91.0 3 66 4.5% 41 0.0% University of Kentucky 92.0 3 100 23.0% 63 20.6% University of Oregon 92.6 3 93 21.5% 38 23.7% University of Houston 93.3 3 165 9.7% 126 7.1% SUNY Albany 94.0 4 53 50.9% 39 43.6% Oklahoma State University 94.6 4 111 11.7% 90 12.2% Drexel University 96.2 2 133 11.3% 106 7.5% Chapman University 98.9 4 38 15.8% 24 0.0% University of Mississippi 99.7 4 88 20.5% 54 33.3% University of Delaware 100.0 4 101 31.7% 68 23.5% University of Kansas 100.6 3 76 5.3% 51 2.0% Howard University 101.1 4 62 30.6% 45 15.6% Clemson University 101.5 4 82 23.2% 55 20.0% American University 104.1 3 89 39.3% 79 36.7% San Diego State University 104.6 4 133 15.8% 100 10.0% Mississippi State 106.7 4 64 4.7% 44 6.8% Northern Arizona U. 107.0 4 41 17.1% 33 21.2% UC Riverside 109.0 3 70 37.1% 27 14.8%
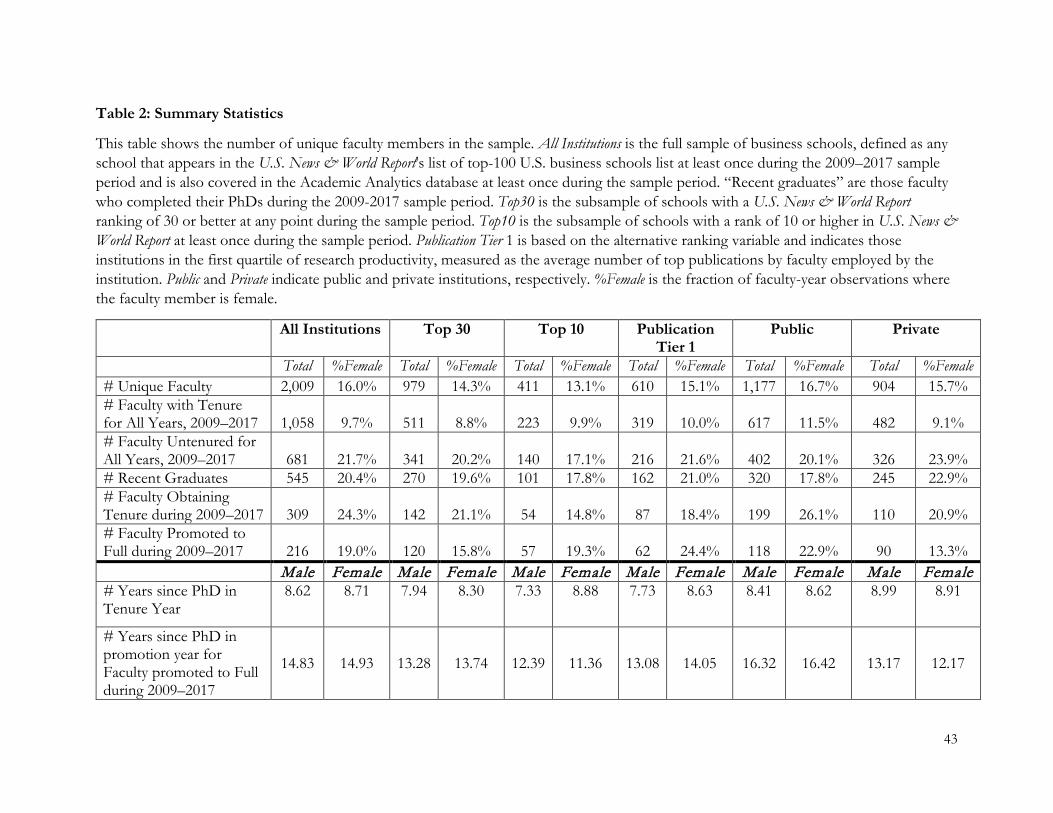
43
Table 2: Summary Statistics
This table shows the number of unique faculty members in the sample. All Institutions is the full sample of business schools, defined as any school that appears in the U.S. News & World Report's list of top-100 U.S. business schools list at least once during the 2009–2017 sample period and is also covered in the Academic Analytics database at least once during the sample period. “Recent graduates” are those faculty who completed their PhDs during the 2009-2017 sample period. Top30 is the subsample of schools with a U.S. News & World Report ranking of 30 or better at any point during the sample period. Top10 is the subsample of schools with a rank of 10 or higher in U.S. News & World Report at least once during the sample period. Publication Tier 1 is based on the alternative ranking variable and indicates those institutions in the first quartile of research productivity, measured as the average number of top publications by faculty employed by the institution. Public and Private indicate public and private institutions, respectively. %Female is the fraction of faculty-year observations where the faculty member is female.
All Institutions Top 30 Top 10 Publication Tier 1
Public Private
Total %Female Total %Female Total %Female Total %Female Total %Female Total %Female # Unique Faculty 2,009 16.0% 979 14.3% 411 13.1% 610 15.1% 1,177 16.7% 904 15.7% # Faculty with Tenure for All Years, 2009–2017 1,058 9.7% 511 8.8% 223 9.9% 319 10.0% 617 11.5% 482 9.1% # Faculty Untenured for All Years, 2009–2017 681 21.7% 341 20.2% 140 17.1% 216 21.6% 402 20.1% 326 23.9% # Recent Graduates 545 20.4% 270 19.6% 101 17.8% 162 21.0% 320 17.8% 245 22.9% # Faculty Obtaining Tenure during 2009–2017 309 24.3% 142 21.1% 54 14.8% 87 18.4% 199 26.1% 110 20.9% # Faculty Promoted to Full during 2009–2017 216 19.0% 120 15.8% 57 19.3% 62 24.4% 118 22.9% 90 13.3%
Male Female Male Female Male Female Male Female Male Female Male Female # Years since PhD in Tenure Year
8.62 8.71 7.94 8.30 7.33 8.88 7.73 8.63 8.41 8.62 8.99 8.91
# Years since PhD in promotion year for Faculty promoted to Full during 2009–2017
14.83 14.93 13.28 13.74 12.39 11.36 13.08 14.05 16.32 16.42 13.17 12.17
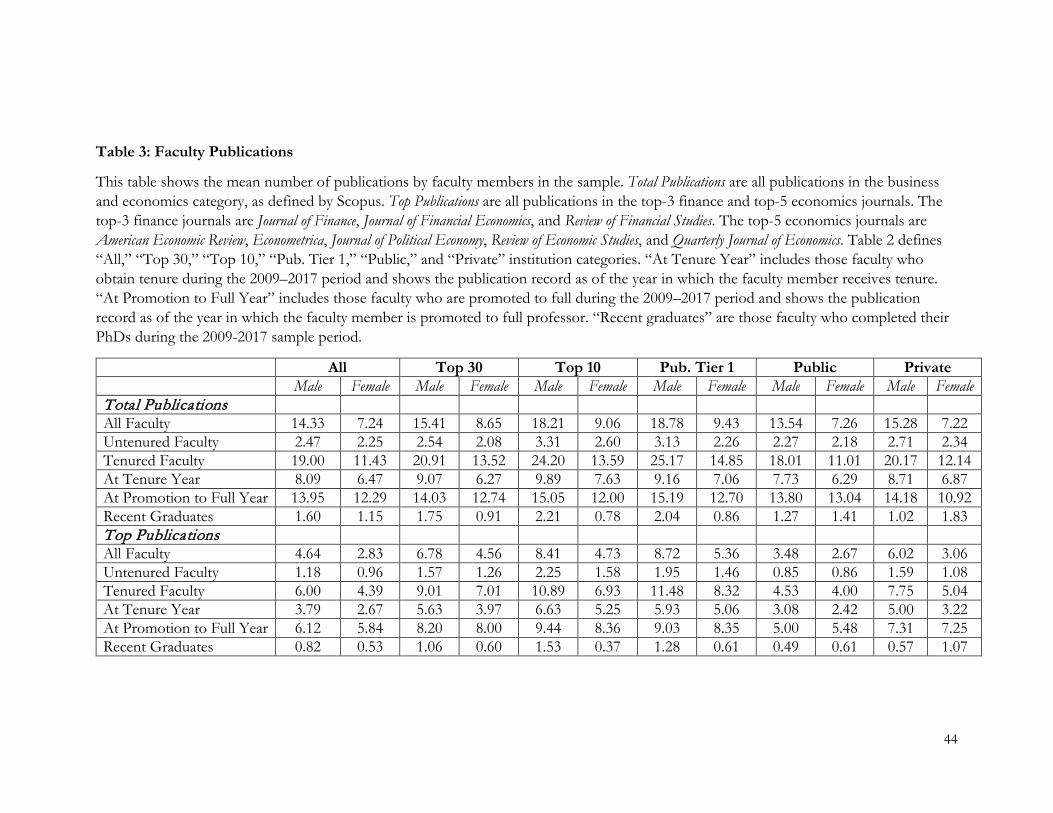
44
Table 3: Faculty Publications
This table shows the mean number of publications by faculty members in the sample. Total Publications are all publications in the business and economics category, as defined by Scopus. Top Publications are all publications in the top-3 finance and top-5 economics journals. The top-3 finance journals are Journal of Finance, Journal of Financial Economics, and Review of Financial Studies. The top-5 economics journals are American Economic Review, Econometrica, Journal of Political Economy, Review of Economic Studies, and Quarterly Journal of Economics. Table 2 defines “All,” “Top 30,” “Top 10,” “Pub. Tier 1,” “Public,” and “Private” institution categories. “At Tenure Year” includes those faculty who obtain tenure during the 2009–2017 period and shows the publication record as of the year in which the faculty member receives tenure. “At Promotion to Full Year” includes those faculty who are promoted to full during the 2009–2017 period and shows the publication record as of the year in which the faculty member is promoted to full professor. “Recent graduates” are those faculty who completed their PhDs during the 2009-2017 sample period.
All Top 30 Top 10 Pub. Tier 1 Public Private
Male Female Male Female Male Female Male Female Male Female Male Female Total Publications
All Faculty 14.33 7.24 15.41 8.65 18.21 9.06 18.78 9.43 13.54 7.26 15.28 7.22 Untenured Faculty 2.47 2.25 2.54 2.08 3.31 2.60 3.13 2.26 2.27 2.18 2.71 2.34 Tenured Faculty 19.00 11.43 20.91 13.52 24.20 13.59 25.17 14.85 18.01 11.01 20.17 12.14 At Tenure Year 8.09 6.47 9.07 6.27 9.89 7.63 9.16 7.06 7.73 6.29 8.71 6.87 At Promotion to Full Year 13.95 12.29 14.03 12.74 15.05 12.00 15.19 12.70 13.80 13.04 14.18 10.92 Recent Graduates 1.60 1.15 1.75 0.91 2.21 0.78 2.04 0.86 1.27 1.41 1.02 1.83 Top Publications
All Faculty 4.64 2.83 6.78 4.56 8.41 4.73 8.72 5.36 3.48 2.67 6.02 3.06 Untenured Faculty 1.18 0.96 1.57 1.26 2.25 1.58 1.95 1.46 0.85 0.86 1.59 1.08 Tenured Faculty 6.00 4.39 9.01 7.01 10.89 6.93 11.48 8.32 4.53 4.00 7.75 5.04 At Tenure Year 3.79 2.67 5.63 3.97 6.63 5.25 5.93 5.06 3.08 2.42 5.00 3.22 At Promotion to Full Year 6.12 5.84 8.20 8.00 9.44 8.36 9.03 8.35 5.00 5.48 7.31 7.25 Recent Graduates 0.82 0.53 1.06 0.60 1.53 0.37 1.28 0.61 0.49 0.61 0.57 1.07

45
Table 3 (cont’d)
All Top 30 Top 10 Pub. Tier 1 Public Private Male Female Male Female Male Female Male Female Male Female Male Female
Top Solo-Authored Publications
All Faculty 0.67 0.36 1.08 0.64 1.43 0.68 1.40 0.73 0.41 0.30 0.98 0.45 Untenured Faculty 0.19 0.15 0.27 0.24 0.44 0.30 0.35 0.29 0.12 0.16 0.28 0.13 Tenured Faculty 0.86 0.54 1.42 0.94 1.82 0.95 1.83 1.07 0.53 0.40 1.25 0.76 At Tenure Year 0.48 0.44 0.76 0.83 0.98 1.13 0.93 0.81 0.34 0.40 0.72 0.52 At Promotion to Full Year 0.64 0.49 0.84 0.58 0.98 0.73 1.08 0.65 0.51 0.41 0.80 0.67 Recent Graduates 0.12 0.09 0.16 0.11 0.27 0.13 0.20 0.16 0.06 0.09 0.18 0.08 Other Solo-Authored Publications
All Faculty 2.38 1.00 2.99 1.44 4.00 1.64 3.81 1.38 1.81 0.85 3.05 1.23 Untenured Faculty 0.40 0.34 0.42 0.38 0.61 0.51 0.56 0.44 0.35 0.39 0.46 0.27 Tenured Faculty 3.15 1.56 4.09 2.23 5.36 2.44 5.14 2.10 2.39 1.18 4.05 2.20 At Tenure Year 1.20 1.03 1.37 1.33 1.33 1.38 1.54 1.19 1.11 1.10 1.36 0.87 At Promotion to Full Year 1.65 1.32 1.58 1.68 1.61 1.64 1.95 1.40 1.59 1.19 1.71 1.67 Recent Graduates 0.26 0.16 0.26 0.16 0.34 0.23 0.28 0.22 0.21 0.19 0.31 0.13

46
Table 4: After Controlling for Research Productivity, Are Female Faculty More Likely to Be Employed by Lower-Ranked Institutions?
This table shows results of OLS regressions in which the dependent variable is Institution rank, defined as the mean U.S. News & World Report ranking over the 2009–2017 sample period. The explanatory variables are: Female, a dummy equal to one if the faculty member is female; Tenured, a dummy equal to one if the faculty member has tenure during year t; YearsSincePhD, the natural log of the number of calendar years since the faculty member earned a PhD; Citations, defined as ln(number of citations+1), where the number of citations is calculated through year t; Top Pubs, defined as ln(number of top publications+1), where the number of top publications is the total number of the top-3 Finance and top-5 economics publications through year t; and Other Pubs, defined as ln(the number of other publications+1), where the number of other publications is defined as publications through year t in all outlets that are not top publications. Column (1) shows results of a pooled regression, in which we include data for all faculty-years. Column (2) is identical to Column (1) except we include PhD year fixed effects (estimated but not reported in the table). In Column (3) regressions are run for the subsample of recent graduates, i.e., faculty with a PhD between 2009 and 2017. All specifications show results of pooled regressions, in which we include data for all faculty-years and where standard errors are clustered by year and institution identifier. *p < 0.1; **p < 0.05; ***p < 0.01.
Full Sample Recent Graduates (1) (2) (3)
Female 5.668** 3.970* 1.955 (1.985) (1.928) (3.780)
Tenured 7.778*** 4.600** 7.619* (1.733) (1.690) (3.491)
YearsSincePhD 1.672 10.448*** 7.600*** (1.052) (0.836) (0.686)
Citations -0.490 -1.679** -1.606 (0.638) (0.626) (1.400)
Top Pubs -18.277*** -17.829*** -15.062*** (1.107) (1.074) (3.141)
Other Pubs 6.348*** 7.747*** 7.633** (0.900) (0.919) (2.503)
N 13,071 13,071 2,329 Adj. R-Squared 0.292 0.338 0.114 PhD Year Fixed Effects No Yes Yes
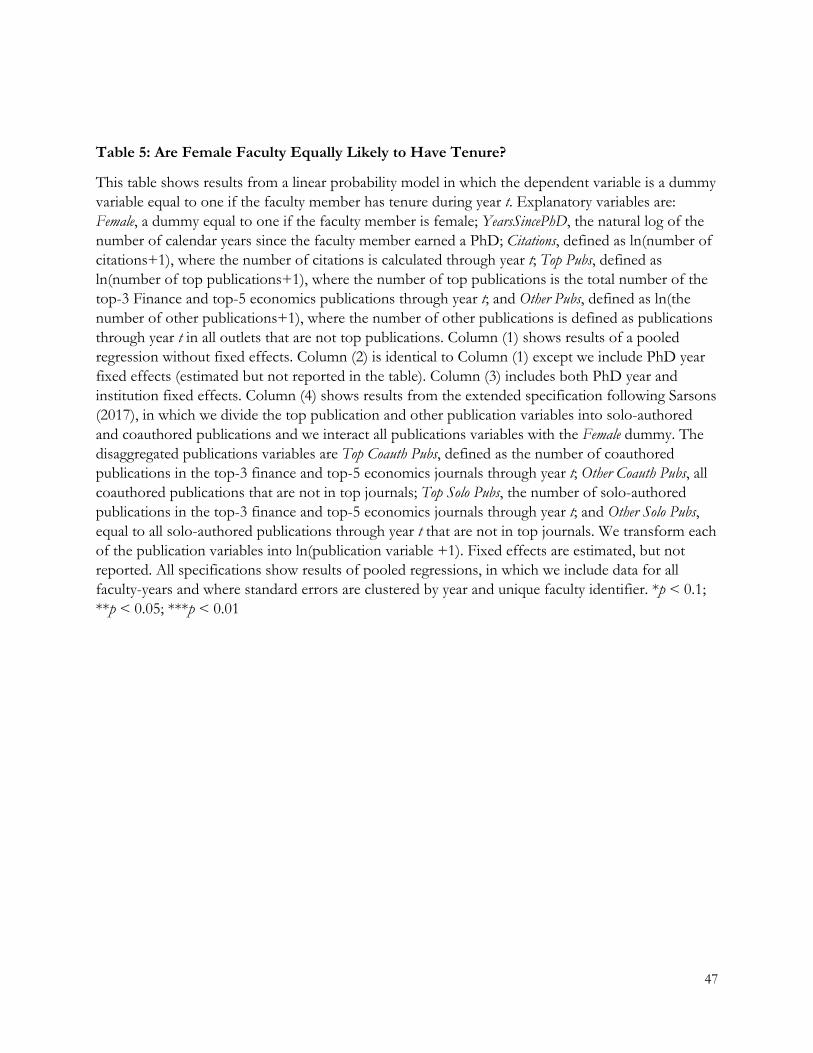
47
Table 5: Are Female Faculty Equally Likely to Have Tenure?
This table shows results from a linear probability model in which the dependent variable is a dummy variable equal to one if the faculty member has tenure during year t. Explanatory variables are: Female, a dummy equal to one if the faculty member is female; YearsSincePhD, the natural log of the number of calendar years since the faculty member earned a PhD; Citations, defined as ln(number of citations+1), where the number of citations is calculated through year t; Top Pubs, defined as ln(number of top publications+1), where the number of top publications is the total number of the top-3 Finance and top-5 economics publications through year t; and Other Pubs, defined as ln(the number of other publications+1), where the number of other publications is defined as publications through year t in all outlets that are not top publications. Column (1) shows results of a pooled regression without fixed effects. Column (2) is identical to Column (1) except we include PhD year fixed effects (estimated but not reported in the table). Column (3) includes both PhD year and institution fixed effects. Column (4) shows results from the extended specification following Sarsons (2017), in which we divide the top publication and other publication variables into solo-authored and coauthored publications and we interact all publications variables with the Female dummy. The disaggregated publications variables are Top Coauth Pubs, defined as the number of coauthored publications in the top-3 finance and top-5 economics journals through year t; Other Coauth Pubs, all coauthored publications that are not in top journals; Top Solo Pubs, the number of solo-authored publications in the top-3 finance and top-5 economics journals through year t; and Other Solo Pubs, equal to all solo-authored publications through year t that are not in top journals. We transform each of the publication variables into ln(publication variable +1). Fixed effects are estimated, but not reported. All specifications show results of pooled regressions, in which we include data for all faculty-years and where standard errors are clustered by year and unique faculty identifier. *p < 0.1; **p < 0.05; ***p < 0.01
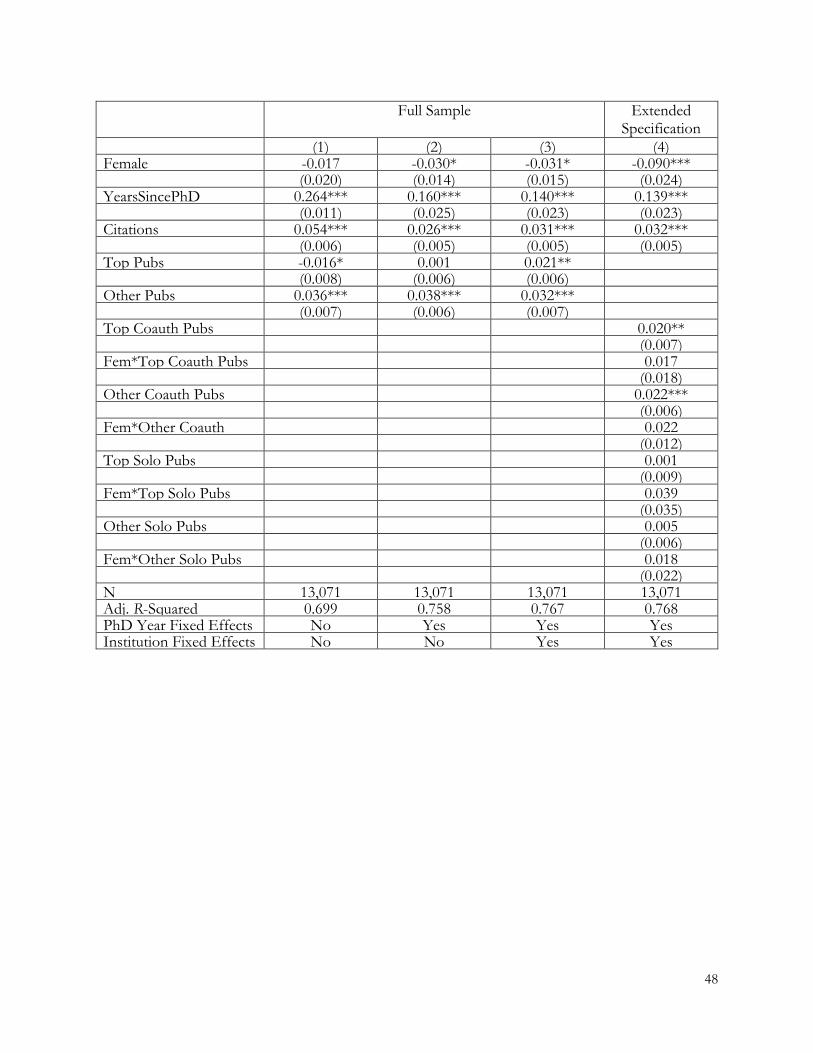
48
Full Sample Extended Specification
(1) (2) (3) (4)
Female -0.017 -0.030* -0.031* -0.090*** (0.020) (0.014) (0.015) (0.024)
YearsSincePhD 0.264*** 0.160*** 0.140*** 0.139*** (0.011) (0.025) (0.023) (0.023)
Citations 0.054*** 0.026*** 0.031*** 0.032*** (0.006) (0.005) (0.005) (0.005)
Top Pubs -0.016* 0.001 0.021** (0.008) (0.006) (0.006) Other Pubs 0.036*** 0.038*** 0.032*** (0.007) (0.006) (0.007) Top Coauth Pubs 0.020**
(0.007) Fem*Top Coauth Pubs 0.017
(0.018) Other Coauth Pubs 0.022***
(0.006) Fem*Other Coauth
0.022 (0.012)
Top Solo Pubs 0.001 (0.009)
Fem*Top Solo Pubs 0.039 (0.035)
Other Solo Pubs 0.005 (0.006)
Fem*Other Solo Pubs 0.018 (0.022)
N 13,071 13,071 13,071 13,071 Adj. R-Squared 0.699 0.758 0.767
0.768
PhD Year Fixed Effects No Yes Yes Yes Institution Fixed Effects No No Yes Yes
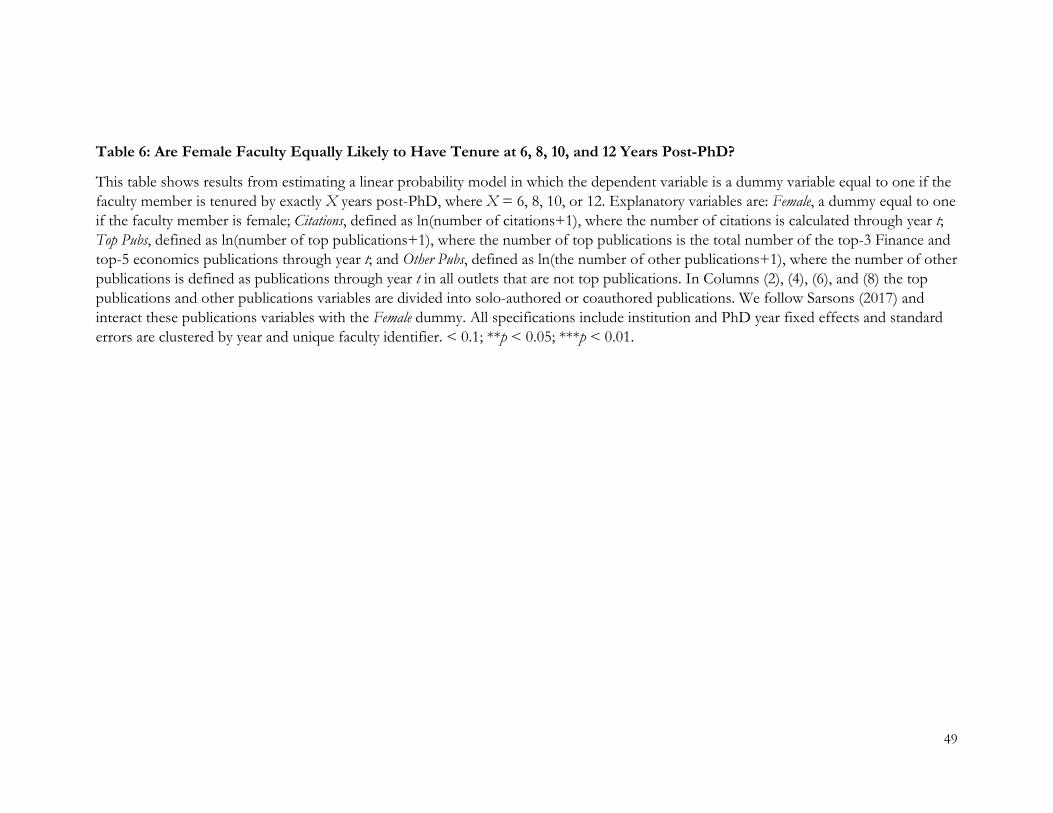
49
Table 6: Are Female Faculty Equally Likely to Have Tenure at 6, 8, 10, and 12 Years Post-PhD?
This table shows results from estimating a linear probability model in which the dependent variable is a dummy variable equal to one if the faculty member is tenured by exactly X years post-PhD, where X = 6, 8, 10, or 12. Explanatory variables are: Female, a dummy equal to one if the faculty member is female; Citations, defined as ln(number of citations+1), where the number of citations is calculated through year t; Top Pubs, defined as ln(number of top publications+1), where the number of top publications is the total number of the top-3 Finance and top-5 economics publications through year t; and Other Pubs, defined as ln(the number of other publications+1), where the number of other publications is defined as publications through year t in all outlets that are not top publications. In Columns (2), (4), (6), and (8) the top publications and other publications variables are divided into solo-authored or coauthored publications. We follow Sarsons (2017) and interact these publications variables with the Female dummy. All specifications include institution and PhD year fixed effects and standard errors are clustered by year and unique faculty identifier. < 0.1; **p < 0.05; ***p < 0.01.

50
6 Years 8 Years 10 Years 12 Years (1) (2)
(3) (4)
(5) (6)
(7) (8)
Female -0.086** 0.071 -0.028 0.034 -0.019 -0.093 -0.030 -0.049 (0.036) (0.069) (0.043) (0.091) (0.041) (0.081) (0.037) (0.074) Citations -0.015 -0.014 -0.002 -0.002 0.071*** 0.067*** 0.056*** 0.053*** (0.017) (0.017) (0.022) (0.021) (0.020) (0.019) (0.018) (0.018) Top Pubs 0.204*** 0.317*** 0.200*** 0.117*** (0.040) (0.048) (0.043) (0.038) Other Pubs 0.140*** 0.212*** 0.124*** 0.114*** (0.028) (0.031) (0.028) (0.026) Top Coauth Pubs 0.198*** 0.307*** 0.189*** 0.119*** (0.038) (0.045) (0.042) (0.036) Fem*Top Coauth Pubs -0.065 -0.040 0.038 0.030 (0.064) (0.069) (0.056) (0.052) Other Coauth Pubs 0.126*** 0.193*** 0.125*** 0.092*** (0.031) (0.035) (0.032) (0.029) Fem*Other Coauth
-0.133** -0.040 0.006 0.019
(0.057) (0.061) (0.056) (0.053) Top Solo Pubs 0.130** 0.140** 0.054 0.043 (0.051) (0.060) (0.051) (0.044) Fem*Top Solo Pubs 0.098 0.079 0.106 0.028 (0.117) (0.140) (0.116) (0.105) Other Solo Pubs 0.174*** 0.139*** 0.038 0.079** (0.043) (0.047) (0.038) (0.034) Fem*Other Solo Pubs -0.209* -0.021 0.039 -0.108 (0.108) (0.107) (0.096) (0.087) N 505 505 541
541
539 539 522 522
Adj. R Squared 0.205
0.237
0.408
0.415
0.528
0.528
0.609
0.609 PhD Year FE Yes Yes Yes Yes Yes Yes Yes Yes
Institution FE Yes Yes Yes Yes Yes Yes Yes Yes

51
Table 7: Are Female Faculty Equally Likely to Be Full Professors?
This table shows results from a linear probability model in which the dependent variable is a dummy variable equal to one if the faculty member is a full professor during year t. The sample excludes assistant professors. Explanatory variables are: Female, a dummy equal to one if the faculty member is female; YearsSincePhD, the natural log of the number of calendar years since the faculty member earned a PhD; Citations, defined as ln(number of citations+1), where the number of citations is calculated through year t; Top Pubs, defined as ln(number of top publications+1), where the number of top publications is the total number of the top-3 Finance and top-5 economics publications through year t; and Other Pubs, defined as ln(the number of other publications+1), where the number of other publications is defined as publications through year t in all outlets that are not top publications. Column (1) shows results of a pooled regression without fixed effects. Column (2) is identical to Column (1) except we include PhD year fixed effects (estimated but not reported in the table). Column (3) includes both PhD year and institution fixed effects. Column (4) shows results from the extended specification following Sarsons (2017), in which we divide the top publication and other publication variables into solo-authored and coauthored publications and we interact all publications variables with the Female dummy. The disaggregated publications variables are Top Coauth Pubs, defined as the number of coauthored publications in the top-3 finance and top-5 economics journals through year t; Other Coauth Pubs, all coauthored publications that are not in top journals; Top Solo Pubs, the number of solo-authored publications in the top-3 finance and top-5 economics journals through year t; and Other Solo Pubs, equal to all solo-authored publications through year t that are not in top journals. We transform each of the publication variables into ln(publication variable +1). Fixed effects are estimated, but not reported. All specifications show results of pooled regressions, in which we include data for all faculty-years and where standard errors are clustered by year and unique faculty identifier. *p < 0.1; **p < 0.05; ***p < 0.01

52
Full Sample Extended Specification
(1) (2) (3) (4)
Female -0.100** -0.091** -0.088** -0.284** (0.031) (0.030) (0.030) (0.098)
YearsSincePhD 0.434*** 0.280*** 0.309*** 0.296*** (0.025) (0.046) (0.046) (0.046)
Citations 0.046*** 0.047*** 0.043*** 0.047*** (0.012) (0.012) (0.012) (0.012)
Top Pubs 0.083*** 0.085*** 0.074*** (0.018) (0.018) (0.019) Other Pubs 0.090*** 0.095*** 0.105*** (0.014) (0.014) (0.014) Top Coauth Pubs 0.073***
(0.018) Fem*Top Coauth Pubs 0.066
(0.036) Other Coauth Pubs 0.080***
(0.014) Fem*Other Coauth
0.044 (0.041)
Top Solo Pubs -0.037* (0.020)
Fem*Top Solo Pubs 0.048 (0.064)
Other Solo Pubs 0.022 (0.014)
Fem*Other Solo Pubs 0.027 (0.048)
N 9,058 9,058 9,058 9,058 Adj. R-Squared 0.438 0.461 0.508 0.512 PhD Year Fixed Effects No Yes Yes Yes Institution Fixed Effects No No Yes Yes

53
Table 8: Do Women Exit Early?
This table shows results of a linear probability model in which the dependent variable is a dummy variable equal to one if the faculty member exits to the government, the private sector, or a nonladder position by 6 years post-PhD (for Full Sample) and by exactly 3, 4, 5, and 6 years post-PhD (for the Recent Graduates subsample only). Recent Graduates are faculty with ladder positions at a top-100 school and who earned PhDs between 2009 and 2017. Explanatory variables are: Female, a dummy equal to one if the faculty member is female; Citations, defined as ln(number of citations+1), where the number of citations is calculated through year t; Top Pubs, defined as ln(number of top publications+1), where the number of top publications is the total number of the top-3 Finance and top-5 economics publications through year t; Other Pubs, defined as ln(the number of other publications+1), where the number of other publications is defined as publications through year t in all outlets that are not top publications. Institution and PhD year fixed effects are included, but not reported in the table. Standard errors are clustered by year and unique faculty identifier. p < 0.1; **p < 0.05; ***p < 0.01.
Full Sample Recent Graduates (1) (2) (3) (4) (5) 6 Years 3 Years 4 Years 5 Years 6 Years Female 0.043 -0.005 -0.005 0.037 0.086
(0.033) (0.026) (0.044) (0.058) (0.075) Citations 0.004 0.002 -0.003 0.038 0.023
(0.016) (0.011) (0.019) (0.026) (0.037) Top Pubs -0.117*** -0.038 -0.083* -0.200*** -0.236***
(0.035) (0.029) (0.047) (0.062) (0.075) Other Pubs -0.016 -0.020 -0.023 -0.079* -0.081
(0.025) (0.025) (0.037) (0.045) (0.057) N 508 357 282 232 162 Adj. R-Squared 0.058 0.058 0.082 0.043 0.084 PhD Year Fixed Effects Yes Yes Yes Yes Yes Institution Fixed Effects Yes Yes Yes Yes Yes

54
Table 9: Gender Differences in Research Output
This table shows results of OLS regressions in which the dependent variable is Total Publications, defined as ln(number of total publications+1), where the number of total publications by the faculty member are calculated through year t. The explanatory variables are: Female, a dummy equal to one if the faculty member is female; Tenured a dummy equal to one if the faculty member has tenure during year t; and YearsSincePhD, the natural log of the number of calendar years since the faculty member earned a PhD. Column (1) shows results of a pooled regression without fixed effects. Column (2) is identical to Column (1) but includes PhD year fixed effects. Column (3) includes both PhD year and institution fixed effects. Column (4) shows regression results for the subsample of recent graduates (i.e., faculty earning PhDs between 2009 and 2017). Fixed effects are estimated, but not reported. Standard errors are clustered by year and unique faculty identifier. *p < 0.1; **p < 0.05; ***p < 0.01.
Full Sample Recent Graduates
(1) (2) (3) (4)
Female -0.180*** -0.221*** -0.190*** -0.123**
(0.036) (0.036) (0.037) (0.046)
Tenured 0.733*** 0.599*** 0.619*** 0.800***
(0.038) (0.036) (0.034) (0.129)
YearsSincePhD 0.594*** 0.648*** 0.659*** 0.519***
(0.025) (0.033) (0.035) (0.043)
N 13,145 13,145 13,145 2,349
Adj. R-Squared 0.630 0.659 0.707 0.469 PhD Year Fixed Effects No Yes Yes Yes Institution Fixed Effects No No Yes Yes
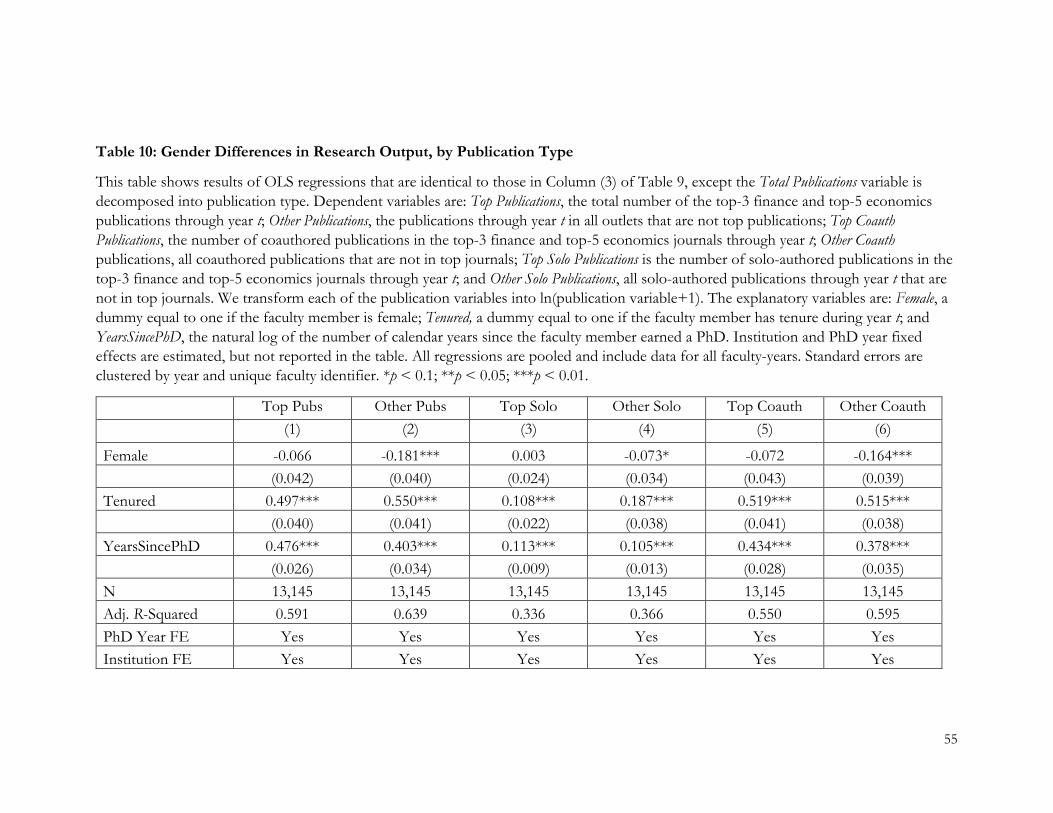
55
Table 10: Gender Differences in Research Output, by Publication Type
This table shows results of OLS regressions that are identical to those in Column (3) of Table 9, except the Total Publications variable is decomposed into publication type. Dependent variables are: Top Publications, the total number of the top-3 finance and top-5 economics publications through year t; Other Publications, the publications through year t in all outlets that are not top publications; Top Coauth Publications, the number of coauthored publications in the top-3 finance and top-5 economics journals through year t; Other Coauth publications, all coauthored publications that are not in top journals; Top Solo Publications is the number of solo-authored publications in the top-3 finance and top-5 economics journals through year t; and Other Solo Publications, all solo-authored publications through year t that are not in top journals. We transform each of the publication variables into ln(publication variable+1). The explanatory variables are: Female, a dummy equal to one if the faculty member is female; Tenured, a dummy equal to one if the faculty member has tenure during year t; and YearsSincePhD, the natural log of the number of calendar years since the faculty member earned a PhD. Institution and PhD year fixed effects are estimated, but not reported in the table. All regressions are pooled and include data for all faculty-years. Standard errors are clustered by year and unique faculty identifier. *p < 0.1; **p < 0.05; ***p < 0.01.
Top Pubs Other Pubs Top Solo Other Solo Top Coauth Other Coauth (1) (2) (3) (4) (5) (6)
Female -0.066 -0.181*** 0.003 -0.073* -0.072 -0.164*** (0.042) (0.040) (0.024) (0.034) (0.043) (0.039)
Tenured 0.497*** 0.550*** 0.108*** 0.187*** 0.519*** 0.515*** (0.040) (0.041) (0.022) (0.038) (0.041) (0.038)
YearsSincePhD 0.476*** 0.403*** 0.113*** 0.105*** 0.434*** 0.378*** (0.026) (0.034) (0.009) (0.013) (0.028) (0.035)
N 13,145 13,145 13,145 13,145 13,145 13,145 Adj. R-Squared 0.591 0.639 0.336 0.366 0.550 0.595 PhD Year FE Yes Yes Yes Yes Yes Yes Institution FE Yes Yes Yes Yes Yes Yes

56
Table 11: Gender Differences in Coauthor Networks
This table shows results of OLS regressions in which the dependent variable is the number of unique coauthors through year t, where All Coauthors (Column 1) indicates the number of unique coauthors; Top-100 Coauthors (Column 2) indicates the number of unique coauthors from the sample of top-100 schools; Female Top-100 Coauthors (Column 3) indicates the number of unique female coauthors from top-100 schools; Same Cohort (Column 4) indicates the number of unique coauthors through year t from top-100 schools who have graduated within 4 years of the faculty member; Same PhD and Cohort (Column 5) indicates the number of unique coauthors from the same PhD program who have obtained their PhDs within 4 years of the faculty member; and Same Institution (Column 6) indicates the number of unique coauthors who were employed by the same institution as the faculty member at some point during years t-3 to t-1 relative to the publication date. We transform each of the coauthor variables into ln(coauthor variable +1). In Panel A, the explanatory variables are: Female, a dummy equal to one if the faculty member is female; Tenured, a dummy equal to one of the faculty member has tenure during year t; YearsSincePhD, the natural log of the number of calendar years since the faculty member earned a PhD; and Citations, defined as the number of citations, where the number of citations is calculated through year t. In Panel B, we add publications variables Top Pubs and Other Pubs as explanatory variables. Top Pubs, defined as ln(number of top publications+1), where the number of top publications is the total number of the top-3 Finance and top-5 economics publications through year t. Other Pubs, defined as ln(the number of other publications+1), where the number of other publications is defined as publications through year t in all outlets that are not top publications. Panel C is identical to Panel B, but includes only the subsample of faculty with a PhD from 2009 to 2017. All standard errors are clustered by year and unique faculty identifier. *p < 0.1; **p < 0.05; ***p < 0.01.
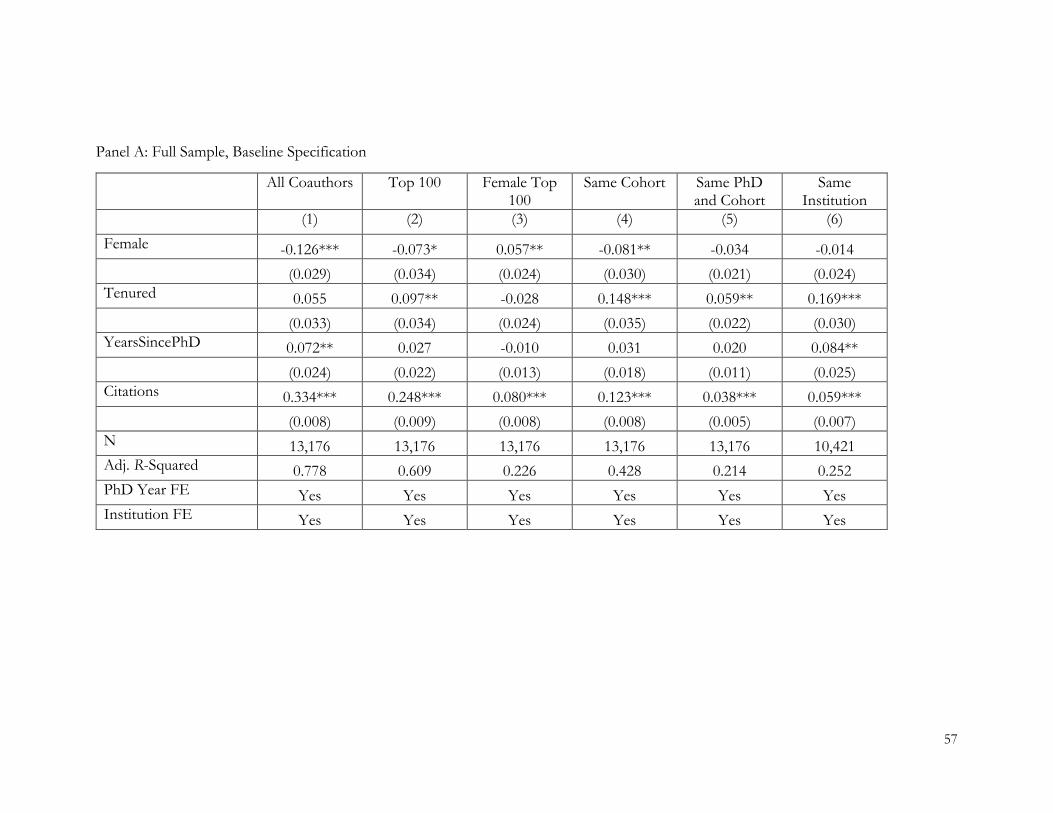
57
Panel A: Full Sample, Baseline Specification
All Coauthors Top 100 Female Top 100
Same Cohort Same PhD and Cohort
Same Institution
(1) (2) (3) (4) (5) (6) Female -0.126*** -0.073* 0.057** -0.081** -0.034 -0.014
(0.029) (0.034) (0.024) (0.030) (0.021) (0.024) Tenured 0.055 0.097** -0.028 0.148*** 0.059** 0.169***
(0.033) (0.034) (0.024) (0.035) (0.022) (0.030) YearsSincePhD 0.072** 0.027 -0.010 0.031 0.020 0.084**
(0.024) (0.022) (0.013) (0.018) (0.011) (0.025) Citations 0.334*** 0.248*** 0.080*** 0.123*** 0.038*** 0.059***
(0.008) (0.009) (0.008) (0.008) (0.005) (0.007) N 13,176 13,176 13,176 13,176 13,176 10,421 Adj. R-Squared 0.778 0.609 0.226 0.428 0.214 0.252 PhD Year FE Yes Yes Yes Yes Yes Yes Institution FE Yes Yes Yes Yes Yes Yes

58
Panel B: Full Sample, With Publication Controls
All Top 100 Female Top 100
Same Cohort Same PhD and Cohort
Same Institution
(1) (2) (3) (4) (5) (6) Female -0.024 -0.020 0.073** -0.061* -0.033 0.016
(0.025) (0.032) (0.024) (0.030) (0.021) (0.024) Tenured -0.062** 0.042 -0.045 0.129*** 0.060** 0.137***
(0.026) (0.033) (0.024) (0.034) (0.022) (0.029) YearsSincePhD 0.116*** 0.068*** 0.004 0.052** 0.025* 0.100***
(0.021) (0.020) (0.013) (0.017) (0.011) (0.026) Citations 0.116*** 0.059*** 0.018* 0.027* 0.018* -0.027**
(0.010) (0.012) (0.009) (0.012) (0.008) (0.010) Top Pubs 0.250*** 0.448*** 0.154*** 0.273*** 0.075*** 0.173*** (0.019) (0.027) (0.019) (0.024) (0.016) (0.022) Other Pubs 0.542*** 0.185*** 0.052** 0.040* -0.017 0.122*** (0.016) (0.023) (0.016) (0.020) (0.015) (0.016) N 13,176 13,176 13,176 13,176 13,176 10,421 Adj. R-Squared 0.866 0.675 0.255 0.471 0.226 0.293 PhD Year FE Yes Yes Yes Yes Yes Yes Institution FE Yes Yes Yes Yes Yes Yes
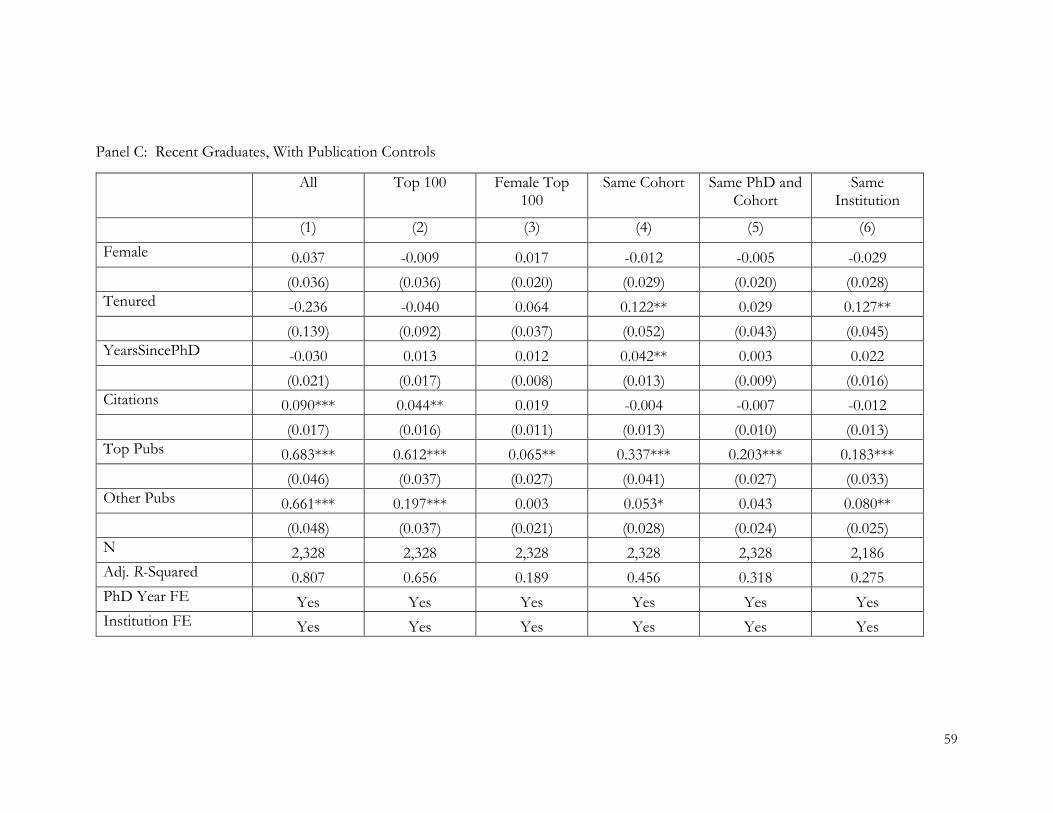
59
Panel C: Recent Graduates, With Publication Controls
All Top 100 Female Top 100
Same Cohort Same PhD and Cohort
Same Institution
(1) (2) (3) (4) (5) (6) Female 0.037 -0.009 0.017 -0.012 -0.005 -0.029
(0.036) (0.036) (0.020) (0.029) (0.020) (0.028) Tenured -0.236 -0.040 0.064 0.122** 0.029 0.127**
(0.139) (0.092) (0.037) (0.052) (0.043) (0.045) YearsSincePhD -0.030 0.013 0.012 0.042** 0.003 0.022
(0.021) (0.017) (0.008) (0.013) (0.009) (0.016) Citations 0.090*** 0.044** 0.019 -0.004 -0.007 -0.012
(0.017) (0.016) (0.011) (0.013) (0.010) (0.013) Top Pubs 0.683*** 0.612*** 0.065** 0.337*** 0.203*** 0.183*** (0.046) (0.037) (0.027) (0.041) (0.027) (0.033) Other Pubs 0.661*** 0.197*** 0.003 0.053* 0.043 0.080** (0.048) (0.037) (0.021) (0.028) (0.024) (0.025) N 2,328 2,328 2,328 2,328 2,328 2,186 Adj. R-Squared 0.807 0.656 0.189 0.456 0.318 0.275 PhD Year FE Yes Yes Yes Yes Yes Yes Institution FE Yes Yes Yes Yes Yes Yes

60
Table 12: Is There Evidence of a Gender Wage Gap?
This table shows results of OLS regressions in which the dependent variable is the natural log of the faculty member’s 9-month salary. The sample includes faculty at public institutions for which we have salary data. The explanatory variables are: Female, a dummy equal to one if the faculty member is female; Tenured, a dummy equal to one if the faculty member has tenure in year t; YearsSincePhD, the natural log of the number of calendar years since the faculty member earned a PhD; Citations, defined as ln(number of citations+1), where citations are calculated through year t; Top Pubs, defined as ln(number of top publications+1), where the number of top publications is the total number of the top-3 Finance and top-5 economics publications through year t; and Other Pubs, defined as ln(the number of other publications+1), where the number of other publications is defined as publications through year t in all outlets that are not top publications. Column (1) shows results of a pooled regression without fixed effects. The specification in Column (2) is identical to that in Column (1) except that PhD Year fixed effects are added. Column (3) includes both PhD Year and institution fixed effects. The specification in Column (4) is identical to Column (3) but the model is estimated using the subsample of faculty with a PhD between 2009 and 2017. All standard errors are clustered by year and unique faculty identifier. *p < 0.1; **p < 0.05; ***p < 0.01.
Full Sample Recent Graduates (1) (2) (3) (4)
Female -0.065* -0.052* -0.038 -0.014 (0.028) (0.027) (0.024) (0.013)
Tenured -0.055 0.014 0.040 0.044 (0.030) (0.028) (0.024) (0.026)
YrsSincePhD -0.131*** 0.000 0.029 0.044*** (0.019) (0.021) (0.017) (0.008)
Citations 0.046*** 0.050*** 0.042*** 0.009* (0.013) (0.013) (0.011) (0.005)
Top Pubs 0.171*** 0.159*** 0.104*** 0.030* (0.025) (0.025) (0.023) (0.014)
Other Pubs 0.002 -0.007 0.029 -0.003 (0.017) (0.017) (0.016) (0.009)
N 3,614 3,614 3,614 661 Adj. R-Squared 0.424 0.513 0.652 0.824 PhD Year FE No Yes Yes Yes Institution FE No No Yes Yes
Copyright © 2022 FDOKUMEN