The Colonial Origins of Inequality: The Causes and Consequences of Land Distribution
38
University of Groningen Groningen Growth and Development Centre The Colonial Origins of Inequality: Exploring the Causes and Consequences of Land Distribution Research Memorandum GD-81 Ewout Frankema RESEARCH MEMORANDUM
Transcript of The Colonial Origins of Inequality: The Causes and Consequences of Land Distribution
University of Groningen Groningen Growth and Development Centre
The Colonial Origins of Inequality: Exploring the Causes and Consequences of Land Distribution
Research Memorandum GD-81 Ewout Frankema RESEARCH MEMORANDUM
The Colonial Origins of Inequality: Exploring the Causes and Consequences of Land Distribution Research Memorandum GD-81
Ewout Frankema
Groningen Growth and Development Centre July 2006
The Colonial Origins of Inequality: Exploring the Causes and Consequences of Land Distribution
E.H.P. Frankema
Groningen Growth and Development Centre University of Groningen
July 2006
Abstract The colonial heritage of high land inequality in Latin American countries is still, after nearly two centuries of independence, one of the crucial underpinnings of its persistent high levels of income inequality. This paper assesses the colonial strategy of land redistribution in a global comparative perspective using new and existing land inequality figures in an OLS regression framework. The two central questions addressed are 1) what explains the cross-country variation in land inequality at the end of the colonial age? 2) how does initial land inequality relate to current income inequality? The main conclusions of the paper are that geography and factor endowments play a less decisive role than often argued in literature. And second, controlling for regional fixed effects, initial land inequality explains a substantial part of the present cross-country variation in current income inequality.
JEL Classification Numbers: N30, N50, O15, P51 Keywords: Latin America, colonial institutions, geography, factor endowments, land distribution, income distribution
The author wishes to thank Jan Pieter Smits, Bart van Ark, Marcel Timmer, Lammert Jan Dam, Stephan Klasen, Denis Cogneau, Peer Vries and Jan Luiten van Zanden and two anonymous referees for their useful comments on previous drafts. Correspondence: Ewout Frankema, Groningen Growth and Development Centre, www.ggdc.net, Faculty of Economics, University of Groningen, P.O.Box 800, 9700 AV, Groningen, The Netherlands, e-mail: [email protected], tel. +31 50 363 7190, fax +31 50 363 7337
3
1 Introduction In order to explain the observed rigidities in the distribution of income recent inequality literature has paid renewed attention to the historical evolution of asset inequality (Atkinson and Bourguignon 2000). This paper analyses the causes and consequences of the historical evolution of land inequality, employing a new dataset of land inequality figures. Land inequality is widely regarded as a key determinant of persistent asset inequality and institutional rigidity (Engerman and Sokoloff 1997, Galor et.al. 2003, North et. al. 2000).
In Latin America the colonial heritage of land inequality has gradually transformed in
persistent high levels of income inequality during the 20th century (World Bank 2004). For the Spanish Crown land was a convenient resource to reward the early colonists’ efforts of conquest, conversion and settlement. Land was deliberately redistributed from indigenous peasants to the Creole elite. The institution of the encomienda provided the large estates (latifundia) (and silver mines) with the necessary supplies of indigenous labour. With the establishment of distinct Spanish and Indian estates the policy of land distribution was also directed to separate the political, juridical and administrative spheres, creating a pervasive social dualism. In Brazil and the Caribbean this dualism was primarily shaped by the establishment of a plantation economy driven by African slave labour. The Catholic church materialized its position as the supreme religious authority by acquiring large estates. In other words, land inequality formed a core ingredient of the colonial institutional matrix (Bakewell 2004, Williamson 1992, Fernandez-Armesto 2003).
With the Latin American experience in mind, this paper explores two questions: 1) what
explains the cross-country variation in land inequality at the end of the colonial age? 2) how does initial land inequality relate to current income inequality? Exploring these questions may improve our understanding of the path-dependent characteristics of inequality and may also indicate to which extent the Latin American experience was a unique experience. As this paper relies on scarce historical data, the empirical analysis is carried out in a simple OLS framework. The regression results serve to illustrate, rather than demonstrate, the validity of the hypotheses derived from historical analysis.
The paper is structured as follows. In section 2 the literature on the causes and consequences
of land inequality is discussed. Section 3 introduces the land distribution data (gini and theil coefficients) and evaluates these figures in a global comparative perspective. Section 4 presents the two multivariate regression models and the included variables. In section 5 the results are presented and interpreted. In section 6 the long run consequences of initial land inequality are evaluated. Section 7 concludes.
4
2 Literature on the causes and consequences of land inequality
2.1 The causes of land inequality: colonial institutions in response to local factor endowments and the objectives of the European motherlands. The extent of land inequality developed during the colonial age is the result of the interaction between local conditions and overseas objectives. Literature has paid specific attention to the feasibility of settlement and exploitation in various regions of the world. Local conditions relate to the nature of land endowments (soil, climate, location), the relative quantity of land and labour endowments (land-labour ratios, population density), the local disease environment and the comparative resistance of the native population to colonial occupation. When the local conditions meet the objectives of the colonial motherland, institutional development takes place as a response process. This brief overview of literature aims to discuss these institutional responses.
1) Testing the hypothesis of Engerman and Sokoloff that “land endowments of Latin America lent themselves to commodities featuring economies of scale and the use of slave labour”, Easterly concludes that a natural environment suitable to cash-crop production is associated with high levels of income inequality in the long run (Easterly 2002; pp. 3-4, Engerman and Sokoloff 1997). Cash crops such as sugar, tobacco, coffee, cocoa, rubber and bananas can be efficiently produced on large estates employing cheap coerced labour. A coexistence of large estates focusing on the production of exportable cash-crops and small subsistence holdings concentrating on the production of food crops for the domestic market skews the distribution of land. (Leamer et. al. 1999, Easterly and Levine 2003). Since tropical climates allow a larger variety of cash-crop production than temperate climates, the geographic location of a country may indirectly affect the distribution of land. A specialization in scale-neutral food crops has a moderating effect on land inequality. Before the introduction of modern agricultural technologies (motorized) food crops such as wheat and maize could be efficiently produced on plots of modest size, while rice crops could be grown on even smaller plots of land (Hayami and Ruttan 1985).
The variety in land endowments induced different paths of colonisation in British North America, mainland Spanish America and the sugar plantation economies along the coast of Brazil and the Caribbean islands. Agriculture in British North America became organized around a homogenous group of white European farmers producing food crops (mainly wheat) on small to medium-scale farms. Contrary to the slave plantations in the Southern states, the egalitarian distribution of land in the Northern States fitted into a strategy to attract European settlers to the land frontier. In Spanish America on the other hand the main objective was to guarantee a steady supply of mineral resources (silver, gold, diamonds) to the Iberian Peninsula employing native labour. The British, French, Dutch and Portuguese plantation economies arose along with the Trans-Atlantic slave trade in the mid 17th century. In both cases a white minority elite held absolute authority in an ethnic heterogeneous society. The redistribution of land was part of a strategy to vest and remain in control.
2) Apart from the nature of land endowments, the relative quantity of land and labour also shapes the potential efficiency of the rural economy. Land abundance invokes labour saving production methods and favours crops that use land intensively. The land-labour ratio also shapes institutional developments. Domar (1970) argues that in pre-modern agricultural societies, elites face the problem

5
of recruiting sufficient labour to toil their soil. In land abundant countries landless labourers have an opportunity to start farming at the land frontier. In response, the landowning elite tends to develop coercive labour market institutions, such as serfdom, slavery or permanent debt peonage (Domar 1970, Demsetz 2000). An alternative strategy is to distribute (virgin) territories among the elite or restrict access to land of certain groups (indigenous farmers or landless labourers). In labour abundant countries on the other hand, elites dispose of more opportunities to extract rents from taxes and trade margins without having to intervene directly into the land market. All these arguments support the hypothesis that low levels of population density create incentives to regressively redistribute land, in particular in the context of the colonial society.
3) Acemoglu et.al. (2001) argue that in areas unfavourable to colonial settlement, i.e. with a high disease incidence or fierce native resistance, colonial institutions will be created in order to maximize the extraction of resources from a distance. As a result the path of institutional development was characterised by weak property rights protection and a political context supporting rent seeking behaviour. In regions favourable to colonial settlement institutions were moulded according to the motherland with the purpose to accumulate capital and skills, enhancing economic growth during the age of independence. Settler mortality rates appear to be significantly correlated with present-day risks of expropriation.
In Sub Saharan Africa the rates of colonial settlement were considerably lower than in the America’s and also more concentrated in the coastal regions. The colonial powers created institutions to extract rents via taxation (head tax) and trade in slaves and natural resources with high margins (Young 1994, Manning 1988). Since settlers did not directly interfere with the daily practices of agricultural production on a large scale, the traditional rural institutions were left in tact however. African slaves were shipped across the Atlantic in order to work on American plantations, rather than being put to work on African plantations (Stavrianos 1981, Eltis 2000, Ayittey 2005). High rates of settler mortality may have prohibited the redistribution of land. 4) The conversion of Indians to Catholicism was a specific objective of Iberian colonial policy As a result of the strong pact between Rome and the Iberian monarchies against the backdrop of the Reformation in Europe, the Catholic church gained omni-presence in Iberian American society. The penetration of the regular and secular orders into the daily life of Amerindians went much further than Protestant missions were ever capable of. Lal (1998) points out, following Goody (1983), that the Catholic church devised specific inheritance laws in order to enlarge its landed estates and traded salvation and sacraments in return for (generous) gifts of its members. The concentration of land in the hands of the Catholic church’ may indeed have had a significant impact on the distribution of land (Van Oss 2003, Bakewell 2004).
2.2 The relation between initial land inequality and current income inequality Land is the most important production factor and source of wealth in the pre-industrial economy. Since land generally depreciates at a much slower pace than most other forms of human, physical and natural capital and can, in principle, be accumulated without limitation, inequality can be easily passed on from one generation to the next in rural societies. Although the direct impact of land
6
inequality on income inequality diminishes as the share of agriculture in total GDP declines, indirect effects of land inequality (and landowning elites) may generate long run consequences for the distribution of income. Indirect effects consist of institutional rigidities enhancing the perpetuation of land inequality into several types of non-land asset inequality.
Literature generally focuses on the (land) inequality-growth rather than the land inequality-income inequality relationship. Several empirical studies have revealed that initial land inequality is bad for growth. This result appears to be stronger, more robust and less contested than tests showing that income inequality is bad for growth (Barro 2000, Easterly 2002, Helpman 2004). Using land gini’s around 1960 Birdsall and Londono (1997) show that the initial distribution of land is significantly negatively related to long run economic growth and this is confirmed by papers of Deininger and Squire (1998), Li, Squire and Zou (1998) and Deininger and Olinto (1999).
One of the major theoretical underpinnings of this empirical observation is that land is an
important collateral asset to get capital market access. In a context of imperfect capital markets, initial land inequality can pose barriers to individual entrepreneurship or investments in human capital (Galor and Zeira 1993). If public policy fails to remove capital market imperfections this not only hampers growth, but also leads to persistent asset and income inequality. In Hernando de Soto’s the Mystery of Capital (2000) this argument is developed with specific attention for the case of Latin America.
Initial land inequality also enhances persistent inequality in a context of concentrated political
power. If the political and landowning elite are largely overlapping policies that suppress democratic accountability and social development in order to preserve the distributional status quo are likely to prevail (Olson 2000, Bourguignon and Verdier 2000, Acemoglu and Robinson 2006). In comparison to the USA and Canada public education investments and franchise extensions lagged far behind Latin America (Engerman, Haber and Sokoloff 2001, Mariscal and Sokoloff 2000). Galor, Moav and Vollrath (2003) find empirical evidence for a negative effect of land inequality on public education expenditures in a cross-state US analysis and Gylfason and Zoega (2002a, 2002b) report a positive relation between land and income inequality and a negative relation of both variables with secondary school enrolment rates in cross-country analyses.
Theory clearly predicts a negative relation between initial land inequality and growth and a
positive relationship between land and income inequality, ceteris paribus. It is therefore surprising that Deininger and Squire (1998) find a correlation of historical land gini’s (1960’s) and current income gini’s (1990’s) of just 0.39. (see also Deininger and Olinto 1999). Gylfason and Zoega (2002a and 2002b) report an r of 0.33. The correlation-coefficients estimated in section 5 are even lower ranging from 0.19 to 0.23. If land inequality indeed is an important determinant of (persistent) income inequality, there will be some important conditional variables which need to be included in a multivariate analysis.
7
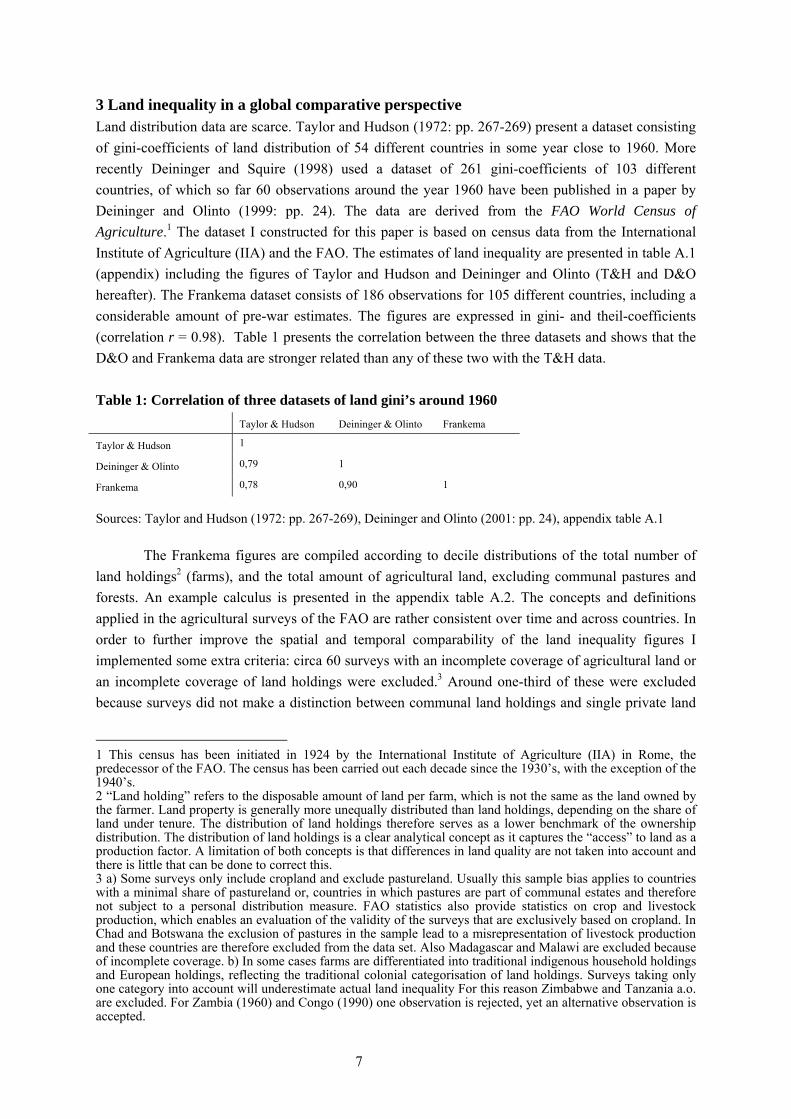
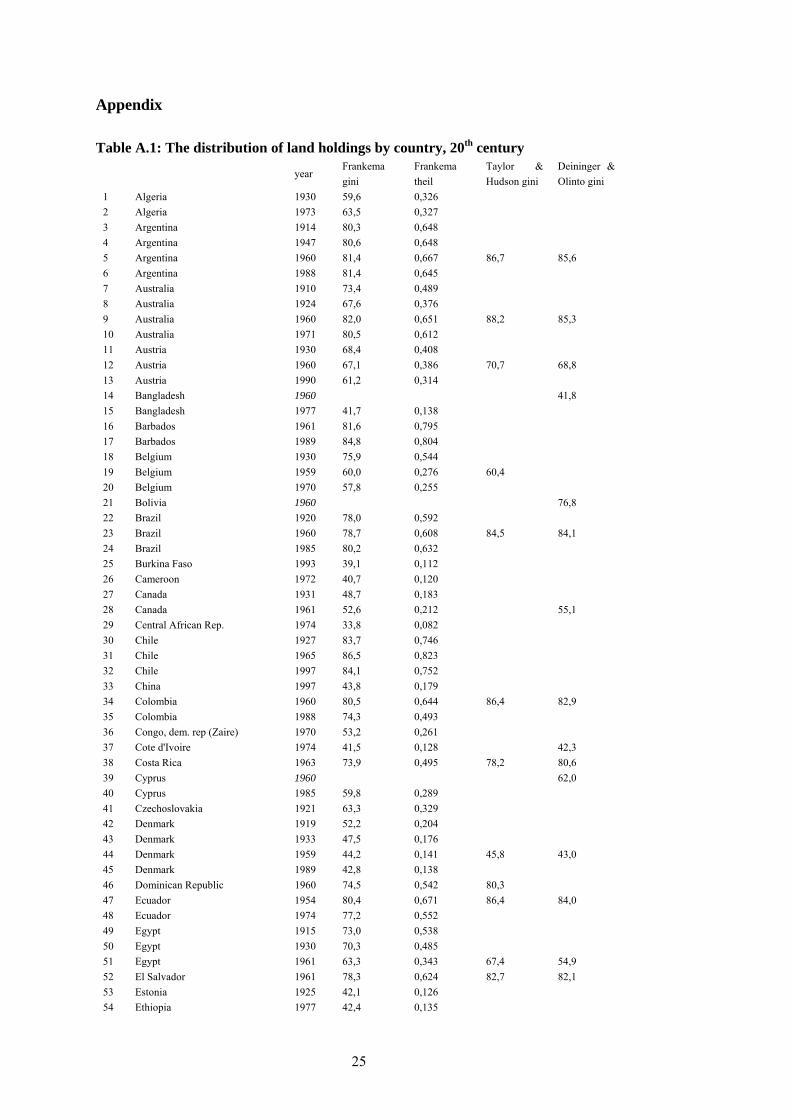
3 Land inequality in a global comparative perspective Land distribution data are scarce. Taylor and Hudson (1972: pp. 267-269) present a dataset consisting of gini-coefficients of land distribution of 54 different countries in some year close to 1960. More recently Deininger and Squire (1998) used a dataset of 261 gini-coefficients of 103 different countries, of which so far 60 observations around the year 1960 have been published in a paper by Deininger and Olinto (1999: pp. 24). The data are derived from the FAO World Census of Agriculture.1 The dataset I constructed for this paper is based on census data from the International Institute of Agriculture (IIA) and the FAO. The estimates of land inequality are presented in table A.1 (appendix) including the figures of Taylor and Hudson and Deininger and Olinto (T&H and D&O hereafter). The Frankema dataset consists of 186 observations for 105 different countries, including a considerable amount of pre-war estimates. The figures are expressed in gini- and theil-coefficients (correlation r = 0.98). Table 1 presents the correlation between the three datasets and shows that the D&O and Frankema data are stronger related than any of these two with the T&H data. Table 1: Correlation of three datasets of land gini’s around 1960 Taylor & Hudson Deininger & Olinto Frankema
Taylor & Hudson 1
Deininger & Olinto 0,79 1
Frankema 0,78 0,90 1
Sources: Taylor and Hudson (1972: pp. 267-269), Deininger and Olinto (2001: pp. 24), appendix table A.1
The Frankema figures are compiled according to decile distributions of the total number of
land holdings2 (farms), and the total amount of agricultural land, excluding communal pastures and forests. An example calculus is presented in the appendix table A.2. The concepts and definitions applied in the agricultural surveys of the FAO are rather consistent over time and across countries. In order to further improve the spatial and temporal comparability of the land inequality figures I implemented some extra criteria: circa 60 surveys with an incomplete coverage of agricultural land or an incomplete coverage of land holdings were excluded.3 Around one-third of these were excluded because surveys did not make a distinction between communal land holdings and single private land
1 This census has been initiated in 1924 by the International Institute of Agriculture (IIA) in Rome, the predecessor of the FAO. The census has been carried out each decade since the 1930’s, with the exception of the 1940’s. 2 “Land holding” refers to the disposable amount of land per farm, which is not the same as the land owned by the farmer. Land property is generally more unequally distributed than land holdings, depending on the share of land under tenure. The distribution of land holdings therefore serves as a lower benchmark of the ownership distribution. The distribution of land holdings is a clear analytical concept as it captures the “access” to land as a production factor. A limitation of both concepts is that differences in land quality are not taken into account and there is little that can be done to correct this. 3 a) Some surveys only include cropland and exclude pastureland. Usually this sample bias applies to countries with a minimal share of pastureland or, countries in which pastures are part of communal estates and therefore not subject to a personal distribution measure. FAO statistics also provide statistics on crop and livestock production, which enables an evaluation of the validity of the surveys that are exclusively based on cropland. In Chad and Botswana the exclusion of pastures in the sample lead to a misrepresentation of livestock production and these countries are therefore excluded from the data set. Also Madagascar and Malawi are excluded because of incomplete coverage. b) In some cases farms are differentiated into traditional indigenous household holdings and European holdings, reflecting the traditional colonial categorisation of land holdings. Surveys taking only one category into account will underestimate actual land inequality For this reason Zimbabwe and Tanzania a.o. are excluded. For Zambia (1960) and Congo (1990) one observation is rejected, yet an alternative observation is accepted.
8
holdings. Indeed, the estimated land gini’s of socialist Eastern European countries in the 1970’s and 1980’s display extreme land inequality since private small-holders and communal holdings are both counted as individual farm holdings. In fact, these gini’s do not properly reflect the inequality of “access” to land.4
The selected sample includes 111 country observations5 for a year close to independence: for
the majority of Asian and African countries this is an observation close to 1960; for non-colonised countries and most New World countries it is the earliest observation available. As temporal changes in land inequality remain confined in most countries6 and the pre-war figures precede most of the considerable structural changes in land distribution during the 20th century I regard this sample as the most reliable proxy of historical land inequality, given the data available. Historical evidence for Latin American countries suggests that land inequality did not fundamentally change during the 19th and 20th centuries, which is illustrated by the time-series data for Argentina, Brazil and Chile in table A.1. For the USA, Canada, Australia and New Zealand there are early observations available (respectively 1880, 1931, 1910 and 1910).7
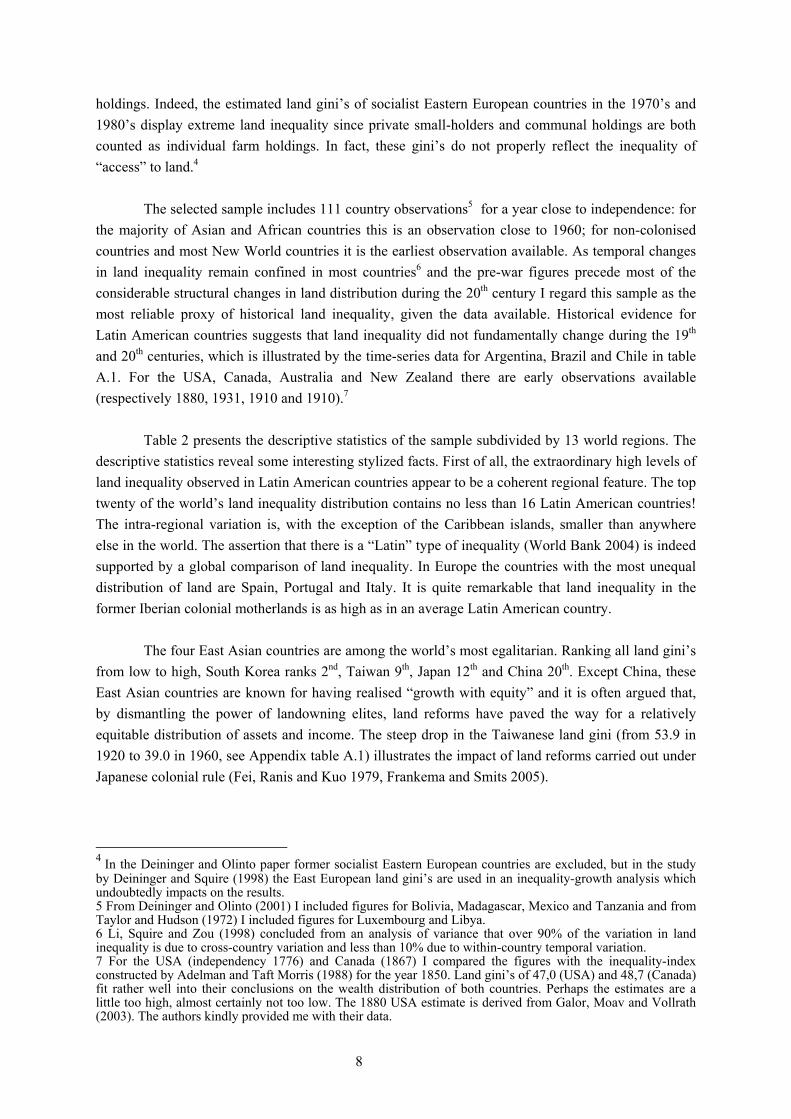
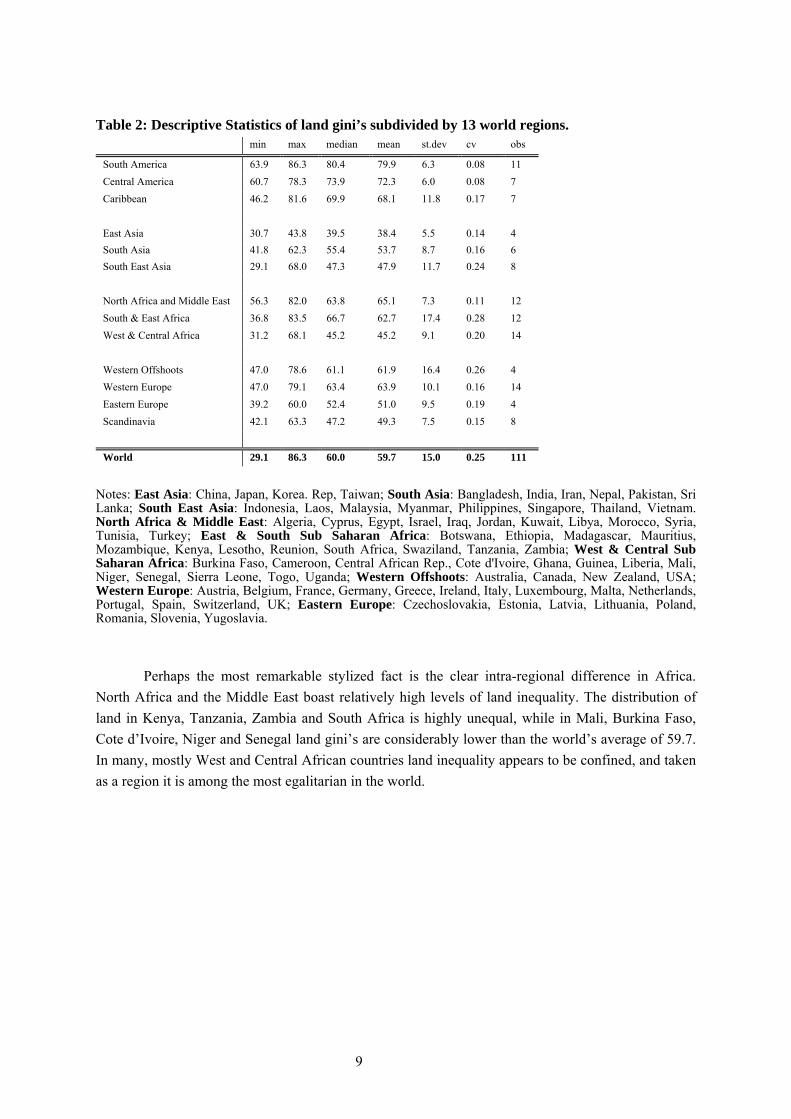
Table 2 presents the descriptive statistics of the sample subdivided by 13 world regions. The
descriptive statistics reveal some interesting stylized facts. First of all, the extraordinary high levels of land inequality observed in Latin American countries appear to be a coherent regional feature. The top twenty of the world’s land inequality distribution contains no less than 16 Latin American countries! The intra-regional variation is, with the exception of the Caribbean islands, smaller than anywhere else in the world. The assertion that there is a “Latin” type of inequality (World Bank 2004) is indeed supported by a global comparison of land inequality. In Europe the countries with the most unequal distribution of land are Spain, Portugal and Italy. It is quite remarkable that land inequality in the former Iberian colonial motherlands is as high as in an average Latin American country.
The four East Asian countries are among the world’s most egalitarian. Ranking all land gini’s
from low to high, South Korea ranks 2nd, Taiwan 9th, Japan 12th and China 20th. Except China, these East Asian countries are known for having realised “growth with equity” and it is often argued that, by dismantling the power of landowning elites, land reforms have paved the way for a relatively equitable distribution of assets and income. The steep drop in the Taiwanese land gini (from 53.9 in 1920 to 39.0 in 1960, see Appendix table A.1) illustrates the impact of land reforms carried out under Japanese colonial rule (Fei, Ranis and Kuo 1979, Frankema and Smits 2005).
4 In the Deininger and Olinto paper former socialist Eastern European countries are excluded, but in the study by Deininger and Squire (1998) the East European land gini’s are used in an inequality-growth analysis which undoubtedly impacts on the results. 5 From Deininger and Olinto (2001) I included figures for Bolivia, Madagascar, Mexico and Tanzania and from Taylor and Hudson (1972) I included figures for Luxembourg and Libya. 6 Li, Squire and Zou (1998) concluded from an analysis of variance that over 90% of the variation in land inequality is due to cross-country variation and less than 10% due to within-country temporal variation. 7 For the USA (independency 1776) and Canada (1867) I compared the figures with the inequality-index constructed by Adelman and Taft Morris (1988) for the year 1850. Land gini’s of 47,0 (USA) and 48,7 (Canada) fit rather well into their conclusions on the wealth distribution of both countries. Perhaps the estimates are a little too high, almost certainly not too low. The 1880 USA estimate is derived from Galor, Moav and Vollrath (2003). The authors kindly provided me with their data.
9
Table 2: Descriptive Statistics of land gini’s subdivided by 13 world regions.
min max median mean st.dev cv obs
South America 63.9 86.3 80.4 79.9 6.3 0.08 11 Central America 60.7 78.3 73.9 72.3 6.0 0.08 7 Caribbean 46.2 81.6 69.9 68.1 11.8 0.17 7 East Asia 30.7 43.8 39.5 38.4 5.5 0.14 4 South Asia 41.8 62.3 55.4 53.7 8.7 0.16 6 South East Asia 29.1 68.0 47.3 47.9 11.7 0.24 8 North Africa and Middle East 56.3 82.0 63.8 65.1 7.3 0.11 12 South & East Africa 36.8 83.5 66.7 62.7 17.4 0.28 12 West & Central Africa 31.2 68.1 45.2 45.2 9.1 0.20 14 Western Offshoots 47.0 78.6 61.1 61.9 16.4 0.26 4 Western Europe 47.0 79.1 63.4 63.9 10.1 0.16 14 Eastern Europe 39.2 60.0 52.4 51.0 9.5 0.19 4 Scandinavia 42.1 63.3 47.2 49.3 7.5 0.15 8
World 29.1 86.3 60.0 59.7 15.0 0.25 111
Notes: East Asia: China, Japan, Korea. Rep, Taiwan; South Asia: Bangladesh, India, Iran, Nepal, Pakistan, Sri Lanka; South East Asia: Indonesia, Laos, Malaysia, Myanmar, Philippines, Singapore, Thailand, Vietnam. North Africa & Middle East: Algeria, Cyprus, Egypt, Israel, Iraq, Jordan, Kuwait, Libya, Morocco, Syria, Tunisia, Turkey; East & South Sub Saharan Africa: Botswana, Ethiopia, Madagascar, Mauritius, Mozambique, Kenya, Lesotho, Reunion, South Africa, Swaziland, Tanzania, Zambia; West & Central Sub Saharan Africa: Burkina Faso, Cameroon, Central African Rep., Cote d'Ivoire, Ghana, Guinea, Liberia, Mali, Niger, Senegal, Sierra Leone, Togo, Uganda; Western Offshoots: Australia, Canada, New Zealand, USA; Western Europe: Austria, Belgium, France, Germany, Greece, Ireland, Italy, Luxembourg, Malta, Netherlands, Portugal, Spain, Switzerland, UK; Eastern Europe: Czechoslovakia, Estonia, Latvia, Lithuania, Poland, Romania, Slovenia, Yugoslavia.
Perhaps the most remarkable stylized fact is the clear intra-regional difference in Africa. North Africa and the Middle East boast relatively high levels of land inequality. The distribution of land in Kenya, Tanzania, Zambia and South Africa is highly unequal, while in Mali, Burkina Faso, Cote d’Ivoire, Niger and Senegal land gini’s are considerably lower than the world’s average of 59.7. In many, mostly West and Central African countries land inequality appears to be confined, and taken as a region it is among the most egalitarian in the world.
10
4 A multivariate regression analysis. The hypotheses discussed in section 2 are specified in a simple cross-country OLS model. The first equation considers the explanation of cross-country variation in post-colonial land inequality:
y = α + β1 x1’ + β2 x2’ + ε where y refers to post-colonial land inequality, α is a constant and ε is an error term. The
vectors x1 and x2 respectively capture the impact of colonial factor endowments and the specific objectives of the motherland on land inequality. The second equation considers the explanation of cross-country variation in current national income inequality levels:
z = α + δ1y + δ2 (y * g) + δ3m + δ4x4’ + ε where z refers to current income inequality, α is a constant, ε is an error term, y refers to land
inequality, g represents the level of economic development, capturing the direct effect of land inequality on income inequality. The m refers to a measure of the dominance of mineral resources in exports and vector x4 represents regional fixed effects.
4.1 The determinants of land inequality: endowments and institutions Several proxies for the feasibility of tropical cash-crop production can be used. One rough variable is the mean annual temperature (MEANTEMP) (McArthur and Sachs 2001). Easterly (2002) applies variables of “land use” (percentage share of land yielding a specific crop) and “land suitability” (percentage share of land suitable to the cultivation of a specific crop). Since the use of land may be endogenous to the distribution of land, the land suitability indicator is preferable. The FAO provides data on land suitability for a.o. bananas, cotton, maize, rice, sugarcane and wheat. For coffee, cocoa, rubber and tobacco only land use data is available. Land use data are transformed into dummies of land suitability. If a country devotes over 1% of their agricultural land to one of these crops and has a historical record as a net exporter of one of these crops (Mitchell 2003), the dummy is set at 1. Cash crops (bananas, coffee, cocoa, cotton, rubber, tobacco and sugar) are expected to yield a positive effect, food crops (maize, rice and wheat) are expected to yield a negative effect. The crops are also included as an aggregate measure: the CASHCROP aggregate includes bananas, cotton and sugar and the FOODCROP aggregate includes maize, rice and wheat. The land labour ratio is approximated by the log of population per square kilometre of agricultural land in the early colonial period (LNPOPDENSE). For most New World countries the year 1700 or 1800 is used. For African countries and most Asian countries the year 1900 is used. Square kilometres of agricultural area are from Taylor and Hudson (1972: pp. 303-305) and population estimates for 1700, 1800 and 1900 are from McEvedy and Jones (1978).
The hypothesis that European colonial rule has interfered in the distribution of land is
accounted for by a dummy variable (EURCOL DUMMY) with a value 1 for each former European colony. The special conditions in the Iberian colonies, i.e. the institutions of the encomienda and latifundia, the authoritarian political and stratified social order are accounted for by another dummy variable (IBERCOL DUMMY). The log of historical settler mortality rates is included as a proxy for
11
settler conditions of colonial settlement (LNSETMORT). The data are taken from Acemoglu et.al. (2001). For countries that have not been subject to European colonial settlement the mortality rate is set at zero. The impact of the Catholic church on the distribution of land is covered by inserting the log of the percentage share of Catholics (LNCATHOLICISM) in a year close to 1965 (Taylor and Hudson 1972).
4.2 The effect of land inequality on income inequality in a regression with fixed effects Income inequality figures are derived from the World Income Inequality Database (UNU/WIDER WIID version 1.0). The sample consists of high-quality gini-coefficients with a national coverage for the latest year available in the period 1987-1998 for 95 countries.8 The land inequality variable (LANDGINI) is represented by the land gini’s discussed above (section 4). The log of GDP per capita in 1990 (LNGDPPC) (Maddison 2003) is included as an interaction term to separate the direct effect from the indirect effect of land inequality on income inequality.
To control for other sources of inequality a variable is included which captures the impact of
mineral resource dominance in exports. Isham et.al. (2003) provide point-source estimates of mineral resource abundance as the percentage share of one or two minerals dominating national exports. Mineral resources include crude petrol, gas, coal, ferrous and non-ferrous metals, ivory, diamonds, pearls and wood.9 The variable is specified in log and denoted as LNMINERALS. Regional fixed effects are accounted for by including dummy variables for Latin America, Sub Saharan Africa, Asia and (former) Socialist countries.
8 These are the criteria: income gini’s are preferred over expenditure gini’s, net income over gross income estimates and household income over personal income. For ca. half of the countries only expenditure gini’s are available for the 1990’s, which are increased with 5 percentage points to correct for potential underestimation of actual income inequality. I did not correct for gross to net income or personal to household income. In case there was more than one observation to choose from the average is calculated and included. Additionally included countries are: Argentina and Uruguay with an urban income gini, Barbados with an income gini for 1979, Switzerland, Trinidad and Tobago and Cyprus with a low-quality income gini, and finally Mozambique with an income gini derived from the CIA (2005) World Fact Book, (www.cia.gov/cia/publications/factbook/). 9 Three observations for Guinea, Guyana and Libya were included on the basis of UN Trade Statistics.
12
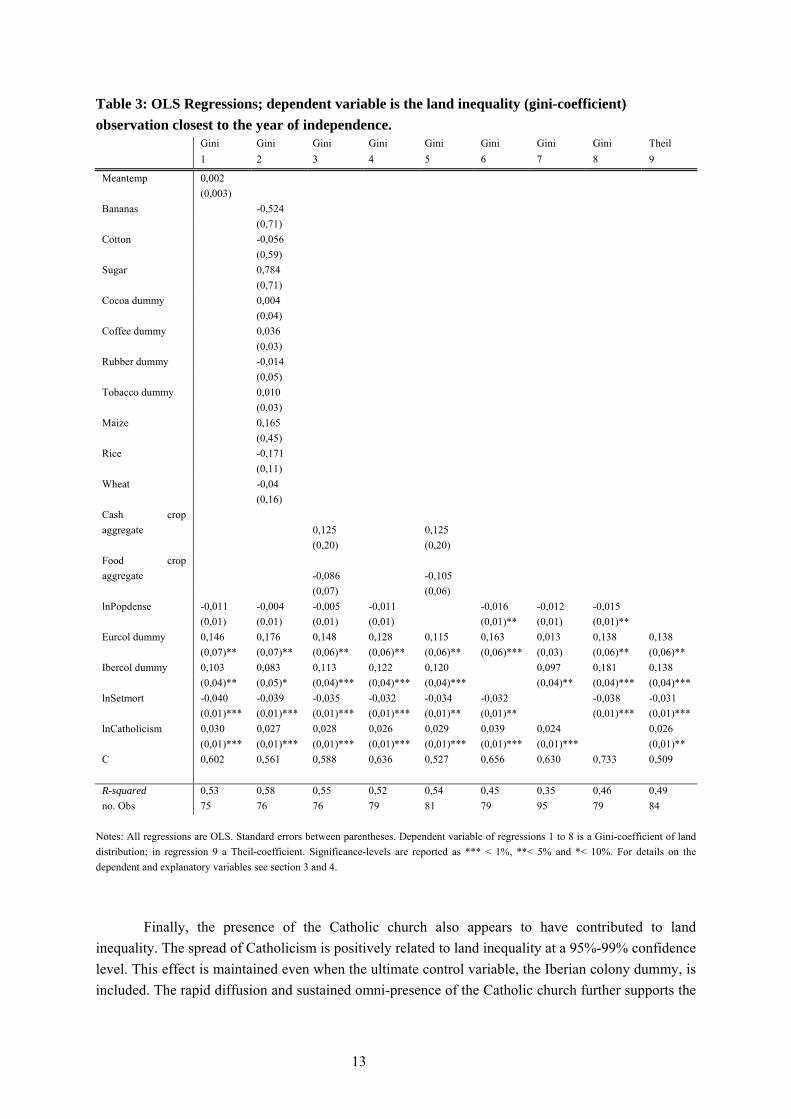
5 Results and interpretation A spatial regression analysis employing scattered data, rough proxy variables and large time lags cannot do much more than illustrate rather than to demonstrate the validity of the historical analysis. The analysis may give a plausible indication however which are the most fruitful paths for further research. In table A.3 and A.4 (appendix) the descriptive statistics and pair-wise correlations of the variables are presented. Table 3 reports ordinary least square regressions of land inequality.
The hypothesis that tropical climates are related to land inequality can not be sustained. The
mean annual temperature variable does have a positive sign but is completely insignificant (1). Moreover, none of the food or cash crop variables yields a significant result (2). Although the aggregate cash crop and food crop variable have the predicted signs, positive and negative respectively, both variables are insignificant. The hypothesis that countries with substantial sources of land suitable to the production of cash crops have a more unequal distribution of land cannot be sustained on the basis of this analysis and this does not have to come as a great surprise. Large parts of West and Central Sub Saharan Africa are suitable to the production of cash crops but do not reveal high levels of land inequality. Land abundant countries are clearly characterised by higher levels of land inequality than densely populated countries. The sign is consistent but the coefficient is not robust. The null-hypothesis cannot be rejected at the 90% confidence level in most regressions, except 6 and 8.
Former European colonies display significantly higher levels of land inequality and this effect
is even stronger for former Iberian colonies. The significance of the Iberian colony dummy supports the view that typical “Latin” colonial institutions, such as the encomienda, had an inherent enhancing effect on land inequality, apart from the colonies endowments structure. Controlled by the European colony dummy, the redistribution of land under Iberian colonial rule indeed appears to be a distinctive element of its colonial policy.
Settler conditions also seem to make a substantial difference. The log of setter mortality rates,
as a proxy for settler conditions, is consistently negative and significant at a 95%-99% confidence level. In colonies with favourable settler conditions average land inequality is higher. It is, moreover, noteworthy that the European colony dummy is only significant when controlled for settler mortality rates (7). This evidence indeed suggests that the conditions of settlement are an ultimate cause of land inequality which probably also have been decisive in shaping the nature of long run income inequality in different regions.
13
Table 3: OLS Regressions; dependent variable is the land inequality (gini-coefficient) observation closest to the year of independence.
Gini Gini Gini Gini Gini Gini Gini Gini Theil 1 2 3 4 5 6 7 8 9
Meantemp 0,002 (0,003) Bananas -0,524 (0,71) Cotton -0,056 (0,59) Sugar 0,784 (0,71) Cocoa dummy 0,004 (0,04) Coffee dummy 0,036 (0,03) Rubber dummy -0,014 (0,05) Tobacco dummy 0,010 (0,03) Maize 0,165 (0,45) Rice -0,171 (0,11) Wheat -0,04 (0,16) Cash crop aggregate 0,125 0,125 (0,20) (0,20) Food crop aggregate -0,086 -0,105 (0,07) (0,06) lnPopdense -0,011 -0,004 -0,005 -0,011 -0,016 -0,012 -0,015 (0,01) (0,01) (0,01) (0,01) (0,01)** (0,01) (0,01)** Eurcol dummy 0,146 0,176 0,148 0,128 0,115 0,163 0,013 0,138 0,138 (0,07)** (0,07)** (0,06)** (0,06)** (0,06)** (0,06)*** (0,03) (0,06)** (0,06)** Ibercol dummy 0,103 0,083 0,113 0,122 0,120 0,097 0,181 0,138 (0,04)** (0,05)* (0,04)*** (0,04)*** (0,04)*** (0,04)** (0,04)*** (0,04)*** lnSetmort -0,040 -0,039 -0,035 -0,032 -0,034 -0,032 -0,038 -0,031 (0,01)*** (0,01)*** (0,01)*** (0,01)*** (0,01)** (0,01)** (0,01)*** (0,01)*** lnCatholicism 0,030 0,027 0,028 0,026 0,029 0,039 0,024 0,026 (0,01)*** (0,01)*** (0,01)*** (0,01)*** (0,01)*** (0,01)*** (0,01)*** (0,01)** C 0,602 0,561 0,588 0,636 0,527 0,656 0,630 0,733 0,509 R-squared 0,53 0,58 0,55 0,52 0,54 0,45 0,35 0,46 0,49 no. Obs 75 76 76 79 81 79 95 79 84
Notes: All regressions are OLS. Standard errors between parentheses. Dependent variable of regressions 1 to 8 is a Gini-coefficient of land distribution; in regression 9 a Theil-coefficient. Significance-levels are reported as *** < 1%, **< 5% and *< 10%. For details on the dependent and explanatory variables see section 3 and 4.
Finally, the presence of the Catholic church also appears to have contributed to land
inequality. The spread of Catholicism is positively related to land inequality at a 95%-99% confidence level. This effect is maintained even when the ultimate control variable, the Iberian colony dummy, is included. The rapid diffusion and sustained omni-presence of the Catholic church further supports the
14
view that the objectives of the Iberian mother countries have played a decisive role, apart from the local conditions the Iberian settlers were confronted with.
In sum, a typical “land unequal” country at the start of its independence is a land
abundant Catholic country, which has comparatively favourable settler conditions and specific Iberian institutions. Such a description indeed comes remarkably close to the “average” Latin American country. This impression arises from a global sample (covering all regions) including a dummy for Iberian colonies. The nature and structure of factor endowments do not play a decisive role, but provided a context in which redistribution of land was more or less likely to take place. The West African conditions to produce cash crops such as sugar were probably comparable to those in the Caribbean and Brazil, but Europeans could not enforce access into this area as easy as in Latin America. The objectives of European mother countries were therefore really constrained by settler conditions in general, local endowments were important in second instance.
In areas with unfavourable settler conditions, colonists adhered to a type of rent seeking behaviour that may have suppressed the rural economy as a whole due to the burden of taxes, but did not affect the existing distribution of land. The redistribution of land from natives to colonists was part of a colonial policy with extractive and developmental objectives. The expropriation of land and the exploitation of forced labour served extractive purposes, but investments in the local economy in order to raise the profitability of agricultural production served developmental purposes. Current levels of income inequality in Latin America and Sub Saharan Africa are among the highest in the world but the characteristics and sources of inequality differ distinctively.
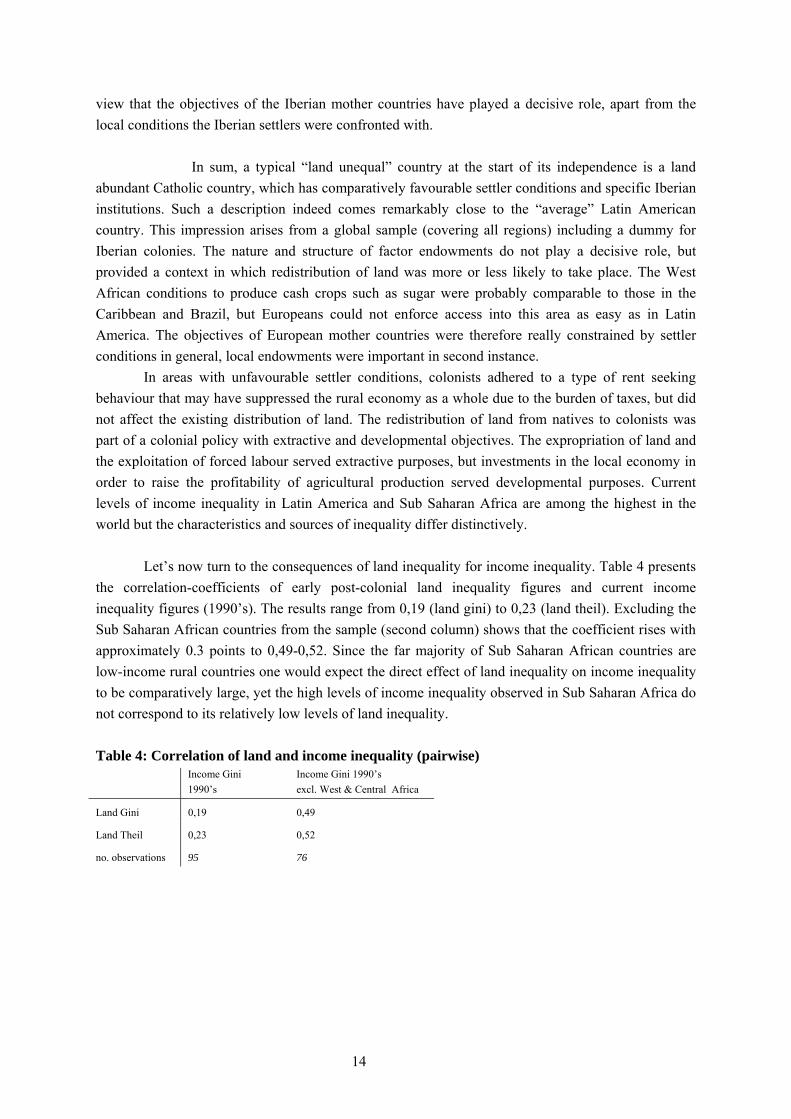
Let’s now turn to the consequences of land inequality for income inequality. Table 4 presents
the correlation-coefficients of early post-colonial land inequality figures and current income inequality figures (1990’s). The results range from 0,19 (land gini) to 0,23 (land theil). Excluding the Sub Saharan African countries from the sample (second column) shows that the coefficient rises with approximately 0.3 points to 0,49-0,52. Since the far majority of Sub Saharan African countries are low-income rural countries one would expect the direct effect of land inequality on income inequality to be comparatively large, yet the high levels of income inequality observed in Sub Saharan Africa do not correspond to its relatively low levels of land inequality.
Table 4: Correlation of land and income inequality (pairwise)
Income Gini 1990’s
Income Gini 1990’s excl. West & Central Africa
Land Gini 0,19 0,49
Land Theil 0,23 0,52
no. observations 95 76
15
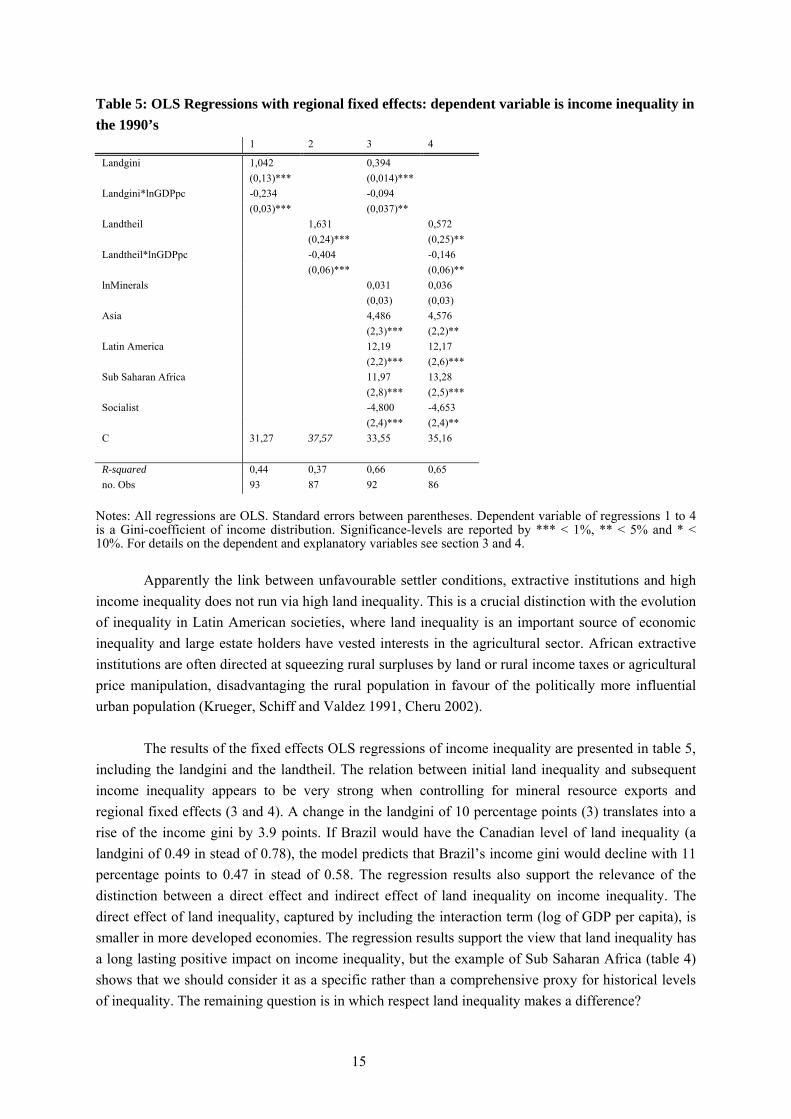
Table 5: OLS Regressions with regional fixed effects: dependent variable is income inequality in the 1990’s
1 2 3 4
Landgini 1,042 0,394 (0,13)*** (0,014)*** Landgini*lnGDPpc -0,234 -0,094 (0,03)*** (0,037)** Landtheil 1,631 0,572 (0,24)*** (0,25)** Landtheil*lnGDPpc -0,404 -0,146 (0,06)*** (0,06)** lnMinerals 0,031 0,036 (0,03) (0,03) Asia 4,486 4,576 (2,3)*** (2,2)** Latin America 12,19 12,17 (2,2)*** (2,6)*** Sub Saharan Africa 11,97 13,28 (2,8)*** (2,5)*** Socialist -4,800 -4,653 (2,4)*** (2,4)** C 31,27 37,57 33,55 35,16 R-squared 0,44 0,37 0,66 0,65 no. Obs 93 87 92 86
Notes: All regressions are OLS. Standard errors between parentheses. Dependent variable of regressions 1 to 4 is a Gini-coefficient of income distribution. Significance-levels are reported by *** < 1%, ** < 5% and * < 10%. For details on the dependent and explanatory variables see section 3 and 4.
Apparently the link between unfavourable settler conditions, extractive institutions and high
income inequality does not run via high land inequality. This is a crucial distinction with the evolution of inequality in Latin American societies, where land inequality is an important source of economic inequality and large estate holders have vested interests in the agricultural sector. African extractive institutions are often directed at squeezing rural surpluses by land or rural income taxes or agricultural price manipulation, disadvantaging the rural population in favour of the politically more influential urban population (Krueger, Schiff and Valdez 1991, Cheru 2002).
The results of the fixed effects OLS regressions of income inequality are presented in table 5,
including the landgini and the landtheil. The relation between initial land inequality and subsequent income inequality appears to be very strong when controlling for mineral resource exports and regional fixed effects (3 and 4). A change in the landgini of 10 percentage points (3) translates into a rise of the income gini by 3.9 points. If Brazil would have the Canadian level of land inequality (a landgini of 0.49 in stead of 0.78), the model predicts that Brazil’s income gini would decline with 11 percentage points to 0.47 in stead of 0.58. The regression results also support the relevance of the distinction between a direct effect and indirect effect of land inequality on income inequality. The direct effect of land inequality, captured by including the interaction term (log of GDP per capita), is smaller in more developed economies. The regression results support the view that land inequality has a long lasting positive impact on income inequality, but the example of Sub Saharan Africa (table 4) shows that we should consider it as a specific rather than a comprehensive proxy for historical levels of inequality. The remaining question is in which respect land inequality makes a difference?
16
6 The consequences of land inequality: distributive conflicts and development In their recent book The Economic Origins of Democracy and Dictatorship (2006) Acemoglu and Robinson argue that distributive conflicts between “elites” and “citizens” play a key role in the development of political institutions. The authors presume an initial state in which the elite (initially) disposes of greater political and economic power than the majority of common people (citizens). Consequently, the various paths societies follow in the transfer of power from the elite to the citizens (i.e. democratisation) are analysed. One of the determinants of this process is the source of income of the elite. In the light of this simple dual framework, one can ask what the specific consequences for the nature of distributive conflicts are if the elites are primarily “landowning elites”, facing a majority of citizens that are poor landless labourers or small subsistence holders. The consequences may be divided into those obstructing development and those supporting development.
Obstructing development 1) The issue of the persistent effects of land inequality on non-land assets has already been raised in section 2. In a context of capital market imperfections initial land inequality leads to underinvestment in and an unequal distribution of non-land assets, particularly human capital. Public investments in education may compensate for suboptimal investments in and access to schooling. However, public education expenditures require public revenues which induces a redistribution of income from the landowning elite to landless citizens. Besides, in land abundant countries, landowning elites have a special interest in a steady supply of cheap unskilled labour. Therefore, landowning elites have several reasons to oppose the expansion of public education (Galor and Zeira 1993, Mariscal and Sokoloff 2000, Galor et.al. 2003). 2) In a pre-industrial economy land inequality may obstruct industrialization via the demand side. If the gains of agricultural productivity increases or export expansion (for instance during the golden age in Latin America between 1870-1914) are adversely distributed to the landowners at the expense of the landless labourers, the purchasing power of the landless poor remains limited. The more the growth of middle class demand for basic industrial products is reduced, the harder it is to generate economies of scale. In a pre-industrial society land inequality may therefore lead to suboptimal consumer demand spillovers depressing the rise of domestically oriented basic industries (Kay 2001, Murphy et.al. 1989). 3) Land is a specific source of income for the elites. In comparison to elites whose sources of income are based on physical and human capital, landowners may have extra reasons to oppose institutional changes leading to a transfer of power to the majority (i.e. democratisation). Acemoglu and Robinson mention three differences (2006: pp. 32): Land is easier to tax than other assets; social and political instability may be more damaging to owners of physical and human capital (relying on cooperation in the workplace and the trading process) than landowners; and landowners may have different preferences of economic institutions (related to coercive rural labour market institutions) than the majority (see also Engerman and Sokoloff 2005). Supporting development 1) The landowning elite has a specific interest in the development of the agricultural (exports) sector. Elites insist on necessary public investments in physical and commercial infrastructure needed to
17
expand their business. These investments generate spillover effects. If the landowning aristocracy is in the exclusive position to decide, many problems of collective action are circumvented and the effectiveness of public investments and potential spill over effects increase (Johnson 1991). 2) In comparison to elites whose sources of income are exclusively based on their position in a predatory state bureaucracy, landowners may have extra reasons to support a process of democratisation. If the elites’ income exclusively depends on rent seeking behaviour backed by a monopoly on coercive power (violence) its economic and political position are inextricably intertwined. In such a context political concessions to the majority come at extremely high costs, which is likely to result in an “all or nothing” game (i.e. armed conflicts). The political and economic position of a landowning elite can, in principle, be separated if a credible and sustainable protection of their property rights is negotiated. This creates an opening for the development of participative political institutions and urban entrepreneurship. The adverse long run effect of extractive colonial institutions is, indeed, that it has destroyed the basis for such cooperation among contesting social (or ethnic) groups. 3) Related to the former argument, the presence of a powerful landowning elite will, in the course of a democratisation process, prevent an outright squeeze of rural citizens through taxes and food price manipulation in favour of the politically more influential urban citizens. If elites have a stake in the rural sector (where they hold their assets, derive their labour force and have an important social role/standing), as well as the urban economy (on which they depend for commercial and transport services and supplies of industrial products), there is a geographic balance of interests. Without such balancing forces, the roots of long run economic development that grow in the fertile soil of a certain base level of agricultural prosperity, may fall prey to a rent seeking urban elite operating under short-run horizons.
18
7 Conclusion In this paper a new dataset of land inequality is introduced in order to explore the causes and consequences of land distribution in a global comparative perspective. The two central questions addressed are 1) what explains the cross-country variation in land inequality at the end of the colonial period? 2) how does initial land inequality relate to current income inequality? The main argument of this paper is that post-colonial levels of land inequality are largely determined by the response of colonists to local endowments (land, people, climate and soil) and settler conditions (disease environment, local resistance). An account of the colonial origins of inequality provides some crucial insights in the long run consequences of land distribution for economic inequality in general and the nature of distributive conflicts in particular.
On the determinants of land inequality the following can be concluded. The suitability of colonial land to the production of scale intensive tropical cash crops enhanced the deliberate redistribution of land only in so far these geographic conditions were complemented by favourable settler conditions (disease environment and resistance of natives) and a guaranteed supply of indigenous or imported (slave) labour. In response to these local conditions and the specific objectives of the European colonial powers a varied pattern of colonial institutions evolved. This institutional variety can be evaluated on the basis of its relative extractive or developmental content. With respect to the regressive redistribution of land from natives to settlers a threefold categorization appears:
1) Extractive institutions prevailed in areas with unfavourable settler conditions (large parts of Sub Saharan Africa, in particular Central and West Africa). In these areas colonists did not intervene directly into the production process, but concentrated their rent seeking efforts on collecting taxes, and engage in the trade and exploitation of natural resources and slaves. Consequently, little direct intervention in land markets and traditional rural institutions took place. 2) In regions with favourable settler conditions colonists became directly involved in the production process and the factor markets. In settler colonies without suitable conditions to produce cash-crops using indigenous labour or slave labour, the cultivation of land for food crops mainly depended on European immigration (British North America). In these areas the creation of developmental institutions reflected an interest of settlers to attract immigrants to the land frontier, to accumulate capital and skills and to evenly distribute resources (such as land) in line with a relative homogenous social order. 3) In settler colonies where the cultivation of cash crops was feasible European colonists directed their efforts at guaranteeing a stable supply of indigenous or African slave labour to work the land (and silver mines) (large parts of Latin America and the Caribbean). In these areas coercive institutions such as slavery and serfdom evolved to control the labour force and economically reinforce a fundamentally heterogeneous social order. The unequal distribution of land formed a cornerstone of such a colonial strategy.
On top of these determinants there are clear indications that specific Iberian colonial institutions contributed to high land inequality in Latin America. More than in any other region the Catholic church acquired the status of supreme religious authority. The accumulation of land was part of a deliberate policy of the church to express and consolidate this unique position. And second, in Spain and Portugal landownership was the exclusive and ultimate key to social mobility and the
19
acquisition of (noble) titles, more than in other European motherlands. Indeed, in the land inequality figures of both mother countries the traits of medieval feudalism are still visible.
What about the consequences of land inequality for long run distribution and development?
Controlling for the level of economic development it turns out that the impact of land inequality has to be separated in a direct effect (the share of rural inequality in total inequality) and an indirect effect related to path dependent effects of initial land inequality on the distribution of non-land assets. Given the large weight of the rural sector in low developed countries, one would expect that the relation between land and income inequality would be strongest in Sub Saharan African countries. The empirical analysis presented in this paper points out the opposite however. This surprising conclusion reveals an important difference between the colonial heritage of West and Central Africa versus Latin America.
Both regions are characterised by abundant endowments of land suitable to the production of
cash crops. In Latin America a powerful landowning elite developed under three centuries of colonial rule. During the first wave of globalisation in the last quarter of the 19th century this elite was able to consolidate and probably even enhance its position, as the agricultural export sector expanded. West and Central African income inequality in the second half of the 20th century is based on a systematic squeeze of the rural majority population in favour of a small predatory urban elite. This type of inequality is rooted in the weak protection of property rights in unstable independent “states without nations”. Both regions carry the burden of “disproportional” levels of economic inequality. Those in power want to hold on to what they have and feel threatened by demands for accountability. Yet, the incentives shaping the attitude and actions of the elites in both regions differ fundamentally.
A landowning elite not only derives income from rent extraction, but also from the
accumulation of capital and investments in agricultural enterprise. If landowners see opportunities to defend their stakes in economic development and are able to negotiate credible and sustainable protection of property rights, they may be willing to lift their bans on institutional change and a transfer of power to other social groups. They may also allow for the development of an urban class of entrepreneurs competing for (scarce) sources of cheap labour. If the stakes of the elite are primarily vested in the consolidation of a predatory bureaucracy, the economic and political position of the elite are maximal overlapping. In this context a transfer of power or the development of new sectors poses such a severe threat to the distributive status quo, that the elites are willing to bear the very high costs of violent repression and armed conflicts.
20
References
Acemoglu, D., Robinson, J.A. (2006) The Economic Origins of Dictatorship and Democracy, Cambridge University Press: New York
Acemoglu, D., Johnson S., Robinson, J.A. (2001) The Colonial Origins of Comparative Development:
An Empirical Investigation, American Economic Review, 91, 5, 1369-1401 Adelman, I., Taft Morris, C. (1988) Comparative Patterns of Economic Development 1850-1914,
John Hopkins University Press: Baltimore Alesina, A., Rodrik, D. (1994) Distributive Politics and Economic Growth, The Quarterly Journal of
Economics, 109, 2, May, 465-90 Atkinson, A.B. (1997) Bringing Income Distribution in from the Cold, The Economic Journal, 107,
March, 297-321 Atkinson, A.B., Bourguignon, F. (2000) Introduction to the Handbook of Income Distribution,
Volume 1, Atkinson, A.B. and Bourguignon, F. (eds.), Elsevier: Amsterdam, London, New York
Ayittey, G.B.N. (2005) Africa Unchained. The Blueprint for Africa’s Future, Palgrave Macmillan:
New York, Basingstoke Bakewell, P. (2004) A History of Latin America, 2nd edition, Blackwell Publishing: Malden MA,
Oxford, UK Barro, R.J. (2000) Inequality and Growth in a Panel of Countries, Journal of Economic Growth, 5, 5-
32 Birdsall, N., Londono, J.L. (1997) Asset Inequality Matters: An Assessment of the World bank’s
Approach to Poverty Reduction, The American Economic Review, 87, 2, May, 32-37 Bourguignon, F., Verdier, T. (2000) Oligarchy, Democracy, Inequality and Growth, Journal of
Development Economics, 62, 2, 285-313 Cheru, F. (2001) African Renaissance. Roadmaps to the Challenge of Globalization, Zed Books,
London CIA (2005) The World Factbook (WFB); www.cia.gov/cia/publications/factbook/ Deininger, K., Squire, L. (1996) A New Data Set Measuring Income Inequality, The World Bank
Economic Review, 10, 3, 565-591
21
Deininger. K., Squire, L. (1998) New ways of looking at old issues: inequality and growth, Journal of Development Economics, 57, 259-287
Deininger, K., Olinto P. (1999) Asset distribution, inequality, and growth, World Bank Policy
Research Working Paper No. 2375 Demsetz, H. (2000) Dogs and Tails in the Economic Development Story, in: Menard, C., ed.,
Institutions, Contracts and Organizations. Perspectives from New Institutional Economics, Edward Elgar: Cheltenham UK, Northampton (MA)
De Soto, H. (2000) The Mystery of Capital, Bantam Press Domar, E.D. (1970) The Causes of Slavery or Serfdom: A Hypothesis, The Journal of Economic
History, 30, 1, The Tasks of Economic History, March, 18-32 Easterly, W. (2002) Inequality does Causes Underdevelopment: New Evidence, Center for Global
Development, Working Paper no. 1 Easterly, W., Levine, R. (2003) Tropics, Germs, and Crops: how endowments influence economic
development, Journal of Monetary Economics, 50, 3-39 Eltis, D. (2000) The Rise of African Slavery in the Americas, Cambridge University Press: Cambridge
UK, New York Engerman, S.L., Haber, S.H., Sokoloff, K.L. (2001) Inequality, institutions and differential paths of
growth among New World economies, in: Menard, C., ed., Institutions, Contracts and Organizations. Perspectives from New Institutional Economics, Edward Elgar: Cheltenham UK, Northampton (MA)
Engerman, S.L., Sokoloff, K.L. (1997) Factor Endowments, Institutions, and Differential Paths of
Growth Among New World Economies: A View from Economic Historians of the United States, in: Haber, S. (ed) How Latin America Fell Behind, Stanford University Press, Stanford CA
Engerman, S.L., Sokoloff, K.L. (2005) Colonialism, Inequality and Long-Run Paths of Development,
NBER Working Paper 11057, Cambridge MA FAO (1955) Report on the 1950 World Census of Agriculture, Rome FAO (1971) Report on the 1960 World Census of Agriculture, Rome FAO (1981) Report on the 1970 World Census of Agriculture, Rome FAO, Report on the 1980 World Census of Agriculture, Rome
22
FAO, Report on the 1990 World Census of Agriculture, Rome FAO, IIASA, Global Agro-Ecological Zones (GAEZ); www.fao.org/ag/AGL/agll/gaez/index.htm FAO, Statistical Databases (Faostat); www.faostat.fao.org/ Fei,J.C.H., Ranis, G., Kuo, S.W.Y. (1979) Growth with Equity. The Taiwan Case, A World Bank
Research Publication, Oxford University Press: New York Fernandez-Armesto, F. (2003) The Americas. A Hemispheric History, The Modern Library: New
York Frankema, E., Smits, J.P. (2005) Exploring the Historical Roots of Eastern Asia’s Post-War Catch-Up
Growth: A Trade Perspective, 1906-1999, Journal of the Asia Pacific Economy, Vol. 10, No. 2, 178-194
Galor, O., Zeira, J. (1993) Income Distribution and Macroeconomics, The Review of Economic
Studies, vol. 60, no. 1, January Galor, O., Moav, O., Vollrath, D. (2003) Land Inequality and the Origin of Divergence and
Overtaking in the Growth Process: Theory and Evidence, CEPR Discussion Paper No. 3817 Goody, J. (1983) The Development of the Family and Marriage in Europe, Cambridge University
Press: Cambridge Gylfason, T., Zoega, G. (2002a) Inequality and Economic Growth: Do Natural Resources Matter? ,
in: Eicher, T., Turnovsky, S., eds. Growth and Inequality: Theory and Implications, MIT Press: Cambridge MA
Gylfason, T., Zoega, G. (2002b) Globalisation, Inequality and Well-Being, CESifo Seminar Paper,
Munich Hayami,Y., Ruttan, V.W. (1985) Agricultural Development. An International Perspective, 2nd
edition, The Johns Hopkins University Press: London Helpman, E. (2004) The Mystery of Economic Growth, The Belknap Press of Harvard University
Press: Cambridge (MA), London Institut International d’Agriculture (IIA), International Yearbook of Agricultural Statistics 1932-1933,
Rome
23
Isham, J. Woolcock, M., Pritchett, L., Busby, G. (2003) The Varieties of Resource Experience: Natural resource Export Structures and the Political Economy of Economic Growth, Middlebury College Discussion Paper No. 2003-08
Johnson, D.G. (1991) Agriculture in the Liberalization Process, in: L.B. Krause and K. Kihwan (eds.),
Liberalization in the Process of Economic Development, University of California Press: Berkeley, Los Angeles, Oxford
Kay, C. (2001) Asia’s and Latin America’s development in comparative perspective: Landlords,
peasants and industrialization, ISS Working Paper Series No. 336, The Hague Krueger, A.O., Shiff, M., Valdés, A. (eds.) (1991) The political Economy of Agricultural Pricing
Policy, A World Bank comparative study, several volumes, The John Hopkins University Press: Baltimore, London.
Lal, D. (1998) Unintended Consequences. The impact of factor endowments, culture and politics on
long-run economic performance, MIT Press: Cambridge (MA), London Leamer, E.E., Maul, H., Rodriguez, S., Schott, P.K. (1999) Does natural resource abundance increase
Latin American income inequality ? Journal of Development Economics, Vol. 59, pp. 3-41 Li, H., Squire, L., Zou, H. (1998) Explaining International and Intertemporal Variations in Income
Inequality, The Economic Journal , Vol. 108, January, pp. 26-43 Maddison, A. (2003) The World Economy: Historical Statistics, OECD, Paris Manning, P. (1988) Francophone Sub-Saharan Africa 1880-1985, Cambridge University Press: New
York Mariscal, E., Sokoloff, K.L. (2000) Schooling, Suffrage, and Inequality in the Americas, 1800-1945,
in: S. Haber (ed.) Political Institutions and Economic Growth in Latin America. Essays in Policy, History, and Political Economy, Hoover Institution Press: Stanford, California
McArthur, J.W., Sachs, J.D. (2001) Institutions and Geography: Comment on Acemoglu Johnson and
Robinson (2000), NBER Working Paper 8114, Cambridge MA McEvedy, C., Jones, R. (1978) Atlas of World Population History, Penguin Books: Harmondsworth Mitchell, B.R. (2003) International Historical Statistics, 5th edition, Palgrave Macmillan: London,
Basingstoke Murphy, K.M., Shleifer, A., Vishny, R. (1989) Income Distribution, Market Size, and
Industrialization, The Quarterly Journal of Economics, vol. 104, no. 3, 537-564
24
North, D.C., Summerhill, W. and Weingast, B.R. (2000) Order, Disorder and Economic Change: Latin America versus North America, in: Bueno de Mesquita, B. and Root, H.L. (eds.) Governing for Prosperity, Yale University Press: New Haven, London
Olson, M. (2000) Power and Prosperity. Outgrowing Communist and Capitalist Dictatorships, Basic
Books: New York van OSS, A.C. (2003) Church and Society in Spanish America, Aksant: Amsterdam PRS Group, International Country Risk Guide (ICRG); www.prsgroup.com Smits, J.P. (2005) Long-Run African Growth, 1910-2000: An Analysis Based on a Broad Capital
Concept, Paper presented at the Sixth European Historical Economics Society Conference, September 9-10, Istanbul
Stavrianos, L.S. (1981) Global Rift. The Third World Comes of Age, Quill: New York Taylor, C.L., Hudson, M.C. (1972) World Handbook of Political and Social Indicators, 2nd edition,
Yale University Press: New Haven, London Williamson, E. (1992) The Penguin History of Latin America, Penguin Books: London World Bank (2004) Inequality in Latin America. Breaking with History?, World Bank Latin American
and Caribbean Studies, Washington D.C. UNDP, World Income Inequality Database (WIID), Version 1.0;
www.wider.unu.edu/wiid/wwwwiid.htm Young, C. (1994) The African Colonial State in Comparative Perspective, Yale University Press:
New Haven
25
Appendix
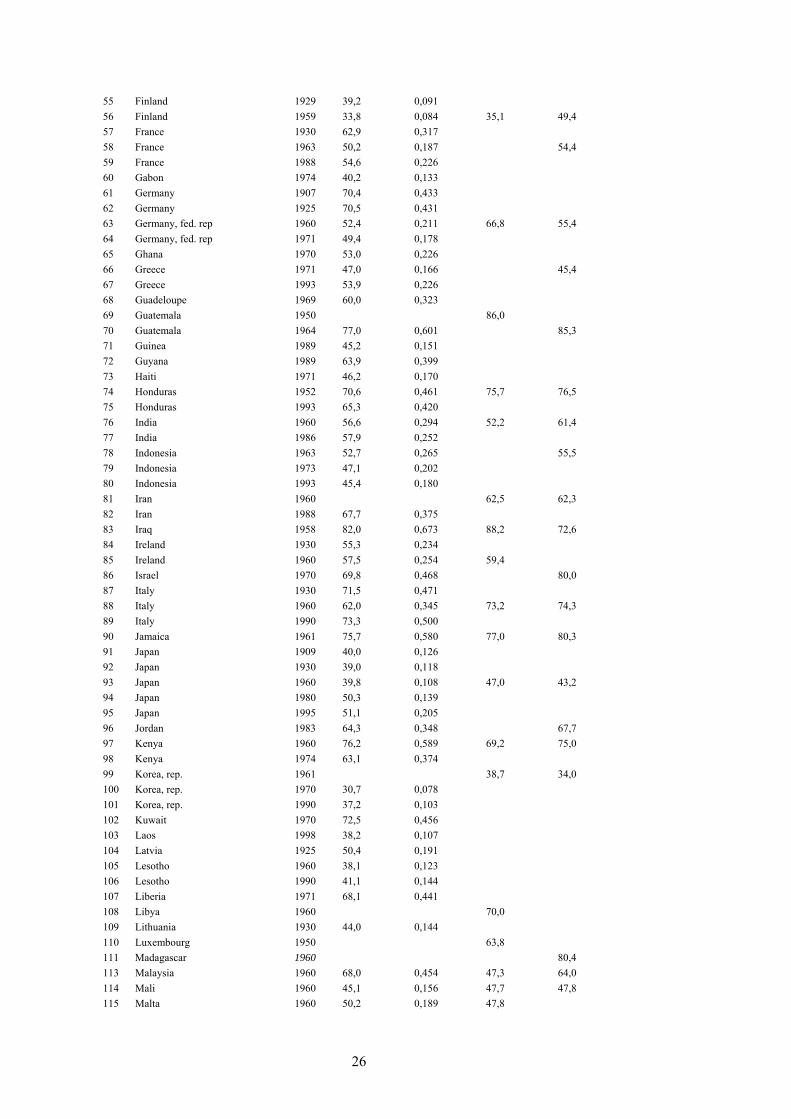
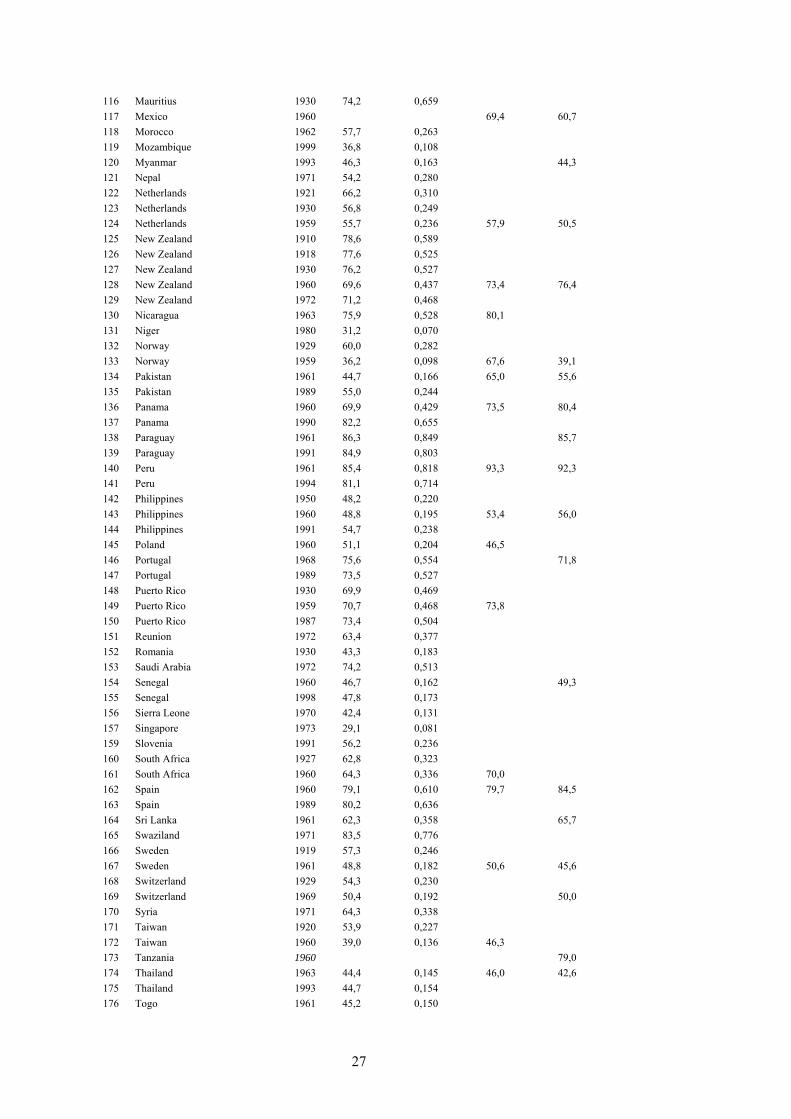
Table A.1: The distribution of land holdings by country, 20th century
year
Frankema gini
Frankema theil
Taylor & Hudson gini
Deininger & Olinto gini
1 Algeria 1930 59,6 0,326 2 Algeria 1973 63,5 0,327 3 Argentina 1914 80,3 0,648 4 Argentina 1947 80,6 0,648 5 Argentina 1960 81,4 0,667 86,7 85,6 6 Argentina 1988 81,4 0,645 7 Australia 1910 73,4 0,489 8 Australia 1924 67,6 0,376 9 Australia 1960 82,0 0,651 88,2 85,3 10 Australia 1971 80,5 0,612 11 Austria 1930 68,4 0,408 12 Austria 1960 67,1 0,386 70,7 68,8 13 Austria 1990 61,2 0,314 14 Bangladesh 1960 41,8 15 Bangladesh 1977 41,7 0,138 16 Barbados 1961 81,6 0,795 17 Barbados 1989 84,8 0,804 18 Belgium 1930 75,9 0,544 19 Belgium 1959 60,0 0,276 60,4 20 Belgium 1970 57,8 0,255 21 Bolivia 1960 76,8 22 Brazil 1920 78,0 0,592 23 Brazil 1960 78,7 0,608 84,5 84,1 24 Brazil 1985 80,2 0,632 25 Burkina Faso 1993 39,1 0,112 26 Cameroon 1972 40,7 0,120 27 Canada 1931 48,7 0,183 28 Canada 1961 52,6 0,212 55,1 29 Central African Rep. 1974 33,8 0,082 30 Chile 1927 83,7 0,746 31 Chile 1965 86,5 0,823 32 Chile 1997 84,1 0,752 33 China 1997 43,8 0,179 34 Colombia 1960 80,5 0,644 86,4 82,9 35 Colombia 1988 74,3 0,493 36 Congo, dem. rep (Zaire) 1970 53,2 0,261 37 Cote d'Ivoire 1974 41,5 0,128 42,3 38 Costa Rica 1963 73,9 0,495 78,2 80,6 39 Cyprus 1960 62,0 40 Cyprus 1985 59,8 0,289 41 Czechoslovakia 1921 63,3 0,329 42 Denmark 1919 52,2 0,204 43 Denmark 1933 47,5 0,176 44 Denmark 1959 44,2 0,141 45,8 43,0 45 Denmark 1989 42,8 0,138 46 Dominican Republic 1960 74,5 0,542 80,3 47 Ecuador 1954 80,4 0,671 86,4 84,0 48 Ecuador 1974 77,2 0,552 49 Egypt 1915 73,0 0,538 50 Egypt 1930 70,3 0,485 51 Egypt 1961 63,3 0,343 67,4 54,9 52 El Salvador 1961 78,3 0,624 82,7 82,1 53 Estonia 1925 42,1 0,126 54 Ethiopia 1977 42,4 0,135
26
55 Finland 1929 39,2 0,091 56 Finland 1959 33,8 0,084 35,1 49,4 57 France 1930 62,9 0,317 58 France 1963 50,2 0,187 54,4 59 France 1988 54,6 0,226 60 Gabon 1974 40,2 0,133 61 Germany 1907 70,4 0,433 62 Germany 1925 70,5 0,431 63 Germany, fed. rep 1960 52,4 0,211 66,8 55,4 64 Germany, fed. rep 1971 49,4 0,178 65 Ghana 1970 53,0 0,226 66 Greece 1971 47,0 0,166 45,4 67 Greece 1993 53,9 0,226 68 Guadeloupe 1969 60,0 0,323 69 Guatemala 1950 86,0 70 Guatemala 1964 77,0 0,601 85,3 71 Guinea 1989 45,2 0,151 72 Guyana 1989 63,9 0,399 73 Haiti 1971 46,2 0,170 74 Honduras 1952 70,6 0,461 75,7 76,5 75 Honduras 1993 65,3 0,420 76 India 1960 56,6 0,294 52,2 61,4 77 India 1986 57,9 0,252 78 Indonesia 1963 52,7 0,265 55,5 79 Indonesia 1973 47,1 0,202 80 Indonesia 1993 45,4 0,180 81 Iran 1960 62,5 62,3 82 Iran 1988 67,7 0,375 83 Iraq 1958 82,0 0,673 88,2 72,6 84 Ireland 1930 55,3 0,234 85 Ireland 1960 57,5 0,254 59,4 86 Israel 1970 69,8 0,468 80,0 87 Italy 1930 71,5 0,471 88 Italy 1960 62,0 0,345 73,2 74,3 89 Italy 1990 73,3 0,500 90 Jamaica 1961 75,7 0,580 77,0 80,3 91 Japan 1909 40,0 0,126 92 Japan 1930 39,0 0,118 93 Japan 1960 39,8 0,108 47,0 43,2 94 Japan 1980 50,3 0,139 95 Japan 1995 51,1 0,205 96 Jordan 1983 64,3 0,348 67,7 97 Kenya 1960 76,2 0,589 69,2 75,0 98 Kenya 1974 63,1 0,374 99 Korea, rep. 1961 38,7 34,0 100 Korea, rep. 1970 30,7 0,078 101 Korea, rep. 1990 37,2 0,103 102 Kuwait 1970 72,5 0,456 103 Laos 1998 38,2 0,107 104 Latvia 1925 50,4 0,191 105 Lesotho 1960 38,1 0,123 106 Lesotho 1990 41,1 0,144 107 Liberia 1971 68,1 0,441 108 Libya 1960 70,0 109 Lithuania 1930 44,0 0,144 110 Luxembourg 1950 63,8 111 Madagascar 1960 80,4 113 Malaysia 1960 68,0 0,454 47,3 64,0 114 Mali 1960 45,1 0,156 47,7 47,8 115 Malta 1960 50,2 0,189 47,8
27
116 Mauritius 1930 74,2 0,659 117 Mexico 1960 69,4 60,7 118 Morocco 1962 57,7 0,263 119 Mozambique 1999 36,8 0,108 120 Myanmar 1993 46,3 0,163 44,3 121 Nepal 1971 54,2 0,280 122 Netherlands 1921 66,2 0,310 123 Netherlands 1930 56,8 0,249 124 Netherlands 1959 55,7 0,236 57,9 50,5 125 New Zealand 1910 78,6 0,589 126 New Zealand 1918 77,6 0,525 127 New Zealand 1930 76,2 0,527 128 New Zealand 1960 69,6 0,437 73,4 76,4 129 New Zealand 1972 71,2 0,468 130 Nicaragua 1963 75,9 0,528 80,1 131 Niger 1980 31,2 0,070 132 Norway 1929 60,0 0,282 133 Norway 1959 36,2 0,098 67,6 39,1 134 Pakistan 1961 44,7 0,166 65,0 55,6 135 Pakistan 1989 55,0 0,244 136 Panama 1960 69,9 0,429 73,5 80,4 137 Panama 1990 82,2 0,655 138 Paraguay 1961 86,3 0,849 85,7 139 Paraguay 1991 84,9 0,803 140 Peru 1961 85,4 0,818 93,3 92,3 141 Peru 1994 81,1 0,714 142 Philippines 1950 48,2 0,220 143 Philippines 1960 48,8 0,195 53,4 56,0 144 Philippines 1991 54,7 0,238 145 Poland 1960 51,1 0,204 46,5 146 Portugal 1968 75,6 0,554 71,8 147 Portugal 1989 73,5 0,527 148 Puerto Rico 1930 69,9 0,469 149 Puerto Rico 1959 70,7 0,468 73,8 150 Puerto Rico 1987 73,4 0,504 151 Reunion 1972 63,4 0,377 152 Romania 1930 43,3 0,183 153 Saudi Arabia 1972 74,2 0,513 154 Senegal 1960 46,7 0,162 49,3 155 Senegal 1998 47,8 0,173 156 Sierra Leone 1970 42,4 0,131 157 Singapore 1973 29,1 0,081 159 Slovenia 1991 56,2 0,236 160 South Africa 1927 62,8 0,323 161 South Africa 1960 64,3 0,336 70,0 162 Spain 1960 79,1 0,610 79,7 84,5 163 Spain 1989 80,2 0,636 164 Sri Lanka 1961 62,3 0,358 65,7 165 Swaziland 1971 83,5 0,776 166 Sweden 1919 57,3 0,246 167 Sweden 1961 48,8 0,182 50,6 45,6 168 Switzerland 1929 54,3 0,230 169 Switzerland 1969 50,4 0,192 50,0 170 Syria 1971 64,3 0,338 171 Taiwan 1920 53,9 0,227 172 Taiwan 1960 39,0 0,136 46,3 173 Tanzania 1960 79,0 174 Thailand 1963 44,4 0,145 46,0 42,6 175 Thailand 1993 44,7 0,154 176 Togo 1961 45,2 0,150

28
177 Togo 1970 51,0 0,206 178 Trinidad and Tobago 1963 69,1 0,446 69,1 179 Tunisia 1961 61,6 0,314 64,6 180 Turkey 1927 56,3 0,256 181 Turkey (in deunums) 1960 60,8 0,294 59,2 59,5 182 Turkey 1991 58,5 0,274 183 Uganda 1963 48,1 0,176 54,9 184 Uganda 1991 57,4 0,277 185 UK (England and Wales) 1921 62,6 0,308 186 UK (Scotland) 1925 64,6 0,327 187 UK (Northern Ireland) 1925 58,9 0,269 188 UK 1960 68,7 0,399 72,3 67,7 189 UK 1993 64,4 0,340 190 Uruguay 1937 77,5 0,563 191 Uruguay 1960 79,1 0,591 82,6 81,3 192 USA 1910 57,1 0,253 193 USA 1930 60,1 0,305 194 USA 1959 67,7 0,411 71,0 73,1 195 USA 1987 71,9 0,456 196 Venezuela 1956 90,9 91,7 197 Venezuela 1961 85,7 0,819 198 Vietnam (South) 1960 56,2 0,253 58,7 199 Vietnam 1994 47,4 0,184 200 Yugoslavia 1950 43,7 201 Zambia 1971 69,9 0,476
Sources: Institut International d’Agriculture (IIA), International Yearbook of Agricultural Statistics 1932-1933, Rome; Various issues of the decennial FAO, Report on the World Census of Agriculture, Rome; Taylor, C.L., Hudson, M.C. (1972) World Handbook of Political and Social Indicators, 2nd edition, Yale University Press: New Haven, London; Deininger, K., Olinto P. (1999) Asset distribution, inequality, and growth, World Bank Policy Research Working Paper No. 2375
Gini coefficient =
µ2
1 1
2n
xxn
i
n
jji∑∑
= =
− = 0,865
Where xi and xj are the percentage shares of land of n deciles (n = 10) and µ is 1/n.
Theil coefficient = ( )∑=
n
iiii xpp
1
ln/ln = 0,823
Where pi is the ith share of farms and xi is the ith share of land of n deciles (n = 10)
Table A.2: Calculation of Gini- and Theil-coefficient of land inequality (Chile 1965) number of holdings total area in hectares Average size per holding less than 1 ha 51.000 22.000 0,43 1 to 2 ha 34.699 46.100 1,33 2 to 5 ha 43.761 138.500 3,16 5 to 10 ha 33.076 230.300 6,96 10 to 20 ha 29.976 413.800 13,80 20 to 50 ha 29.360 911.900 31,06 50 to 100 ha 14.785 1.022.500 69,16 100 to 200 ha 9.164 1.261.500 137,66 200 to 500 ha 6.998 2.167.500 309,73 500 to 1000 ha 3.156 2.143.400 679,15 1000 ha and over 3.324 22.286.230 6704,64 total 259.299 30.643.730 118,18
29
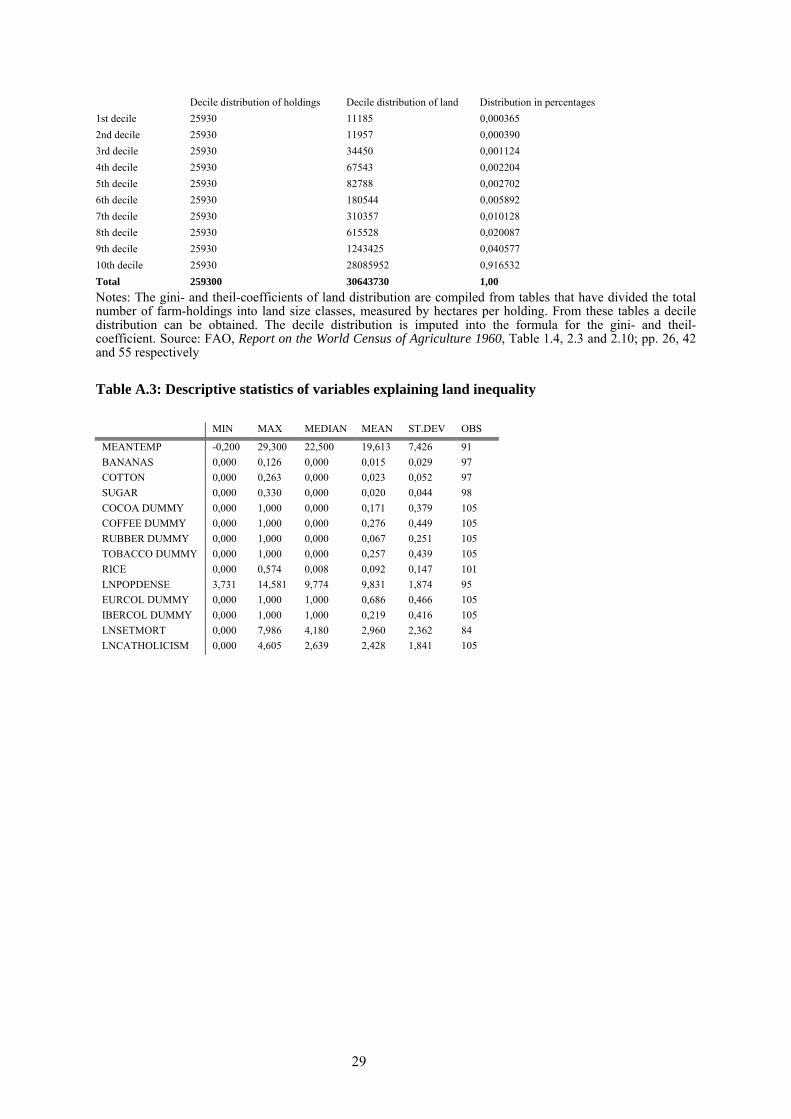
Decile distribution of holdings Decile distribution of land Distribution in percentages 1st decile 25930 11185 0,000365 2nd decile 25930 11957 0,000390 3rd decile 25930 34450 0,001124 4th decile 25930 67543 0,002204 5th decile 25930 82788 0,002702 6th decile 25930 180544 0,005892 7th decile 25930 310357 0,010128 8th decile 25930 615528 0,020087 9th decile 25930 1243425 0,040577 10th decile 25930 28085952 0,916532 Total 259300 30643730 1,00 Notes: The gini- and theil-coefficients of land distribution are compiled from tables that have divided the total number of farm-holdings into land size classes, measured by hectares per holding. From these tables a decile distribution can be obtained. The decile distribution is imputed into the formula for the gini- and theil-coefficient. Source: FAO, Report on the World Census of Agriculture 1960, Table 1.4, 2.3 and 2.10; pp. 26, 42 and 55 respectively
Table A.3: Descriptive statistics of variables explaining land inequality
MIN MAX MEDIAN MEAN ST.DEV OBS
MEANTEMP -0,200 29,300 22,500 19,613 7,426 91 BANANAS 0,000 0,126 0,000 0,015 0,029 97 COTTON 0,000 0,263 0,000 0,023 0,052 97 SUGAR 0,000 0,330 0,000 0,020 0,044 98 COCOA DUMMY 0,000 1,000 0,000 0,171 0,379 105 COFFEE DUMMY 0,000 1,000 0,000 0,276 0,449 105 RUBBER DUMMY 0,000 1,000 0,000 0,067 0,251 105 TOBACCO DUMMY 0,000 1,000 0,000 0,257 0,439 105 RICE 0,000 0,574 0,008 0,092 0,147 101 LNPOPDENSE 3,731 14,581 9,774 9,831 1,874 95 EURCOL DUMMY 0,000 1,000 1,000 0,686 0,466 105 IBERCOL DUMMY 0,000 1,000 1,000 0,219 0,416 105 LNSETMORT 0,000 7,986 4,180 2,960 2,362 84 LNCATHOLICISM 0,000 4,605 2,639 2,428 1,841 105
30
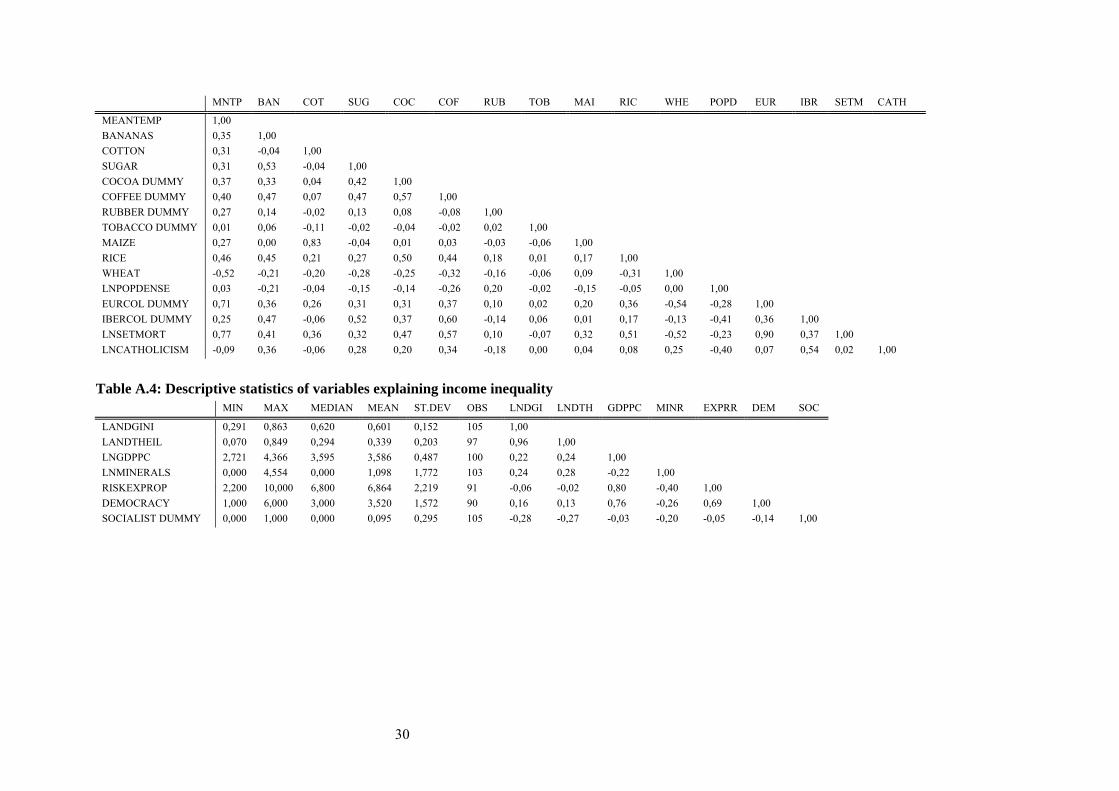
MNTP BAN COT SUG COC COF RUB TOB MAI RIC WHE POPD EUR IBR SETM CATH
MEANTEMP 1,00 BANANAS 0,35 1,00 COTTON 0,31 -0,04 1,00 SUGAR 0,31 0,53 -0,04 1,00 COCOA DUMMY 0,37 0,33 0,04 0,42 1,00 COFFEE DUMMY 0,40 0,47 0,07 0,47 0,57 1,00 RUBBER DUMMY 0,27 0,14 -0,02 0,13 0,08 -0,08 1,00 TOBACCO DUMMY 0,01 0,06 -0,11 -0,02 -0,04 -0,02 0,02 1,00 MAIZE 0,27 0,00 0,83 -0,04 0,01 0,03 -0,03 -0,06 1,00 RICE 0,46 0,45 0,21 0,27 0,50 0,44 0,18 0,01 0,17 1,00 WHEAT -0,52 -0,21 -0,20 -0,28 -0,25 -0,32 -0,16 -0,06 0,09 -0,31 1,00 LNPOPDENSE 0,03 -0,21 -0,04 -0,15 -0,14 -0,26 0,20 -0,02 -0,15 -0,05 0,00 1,00 EURCOL DUMMY 0,71 0,36 0,26 0,31 0,31 0,37 0,10 0,02 0,20 0,36 -0,54 -0,28 1,00 IBERCOL DUMMY 0,25 0,47 -0,06 0,52 0,37 0,60 -0,14 0,06 0,01 0,17 -0,13 -0,41 0,36 1,00 LNSETMORT 0,77 0,41 0,36 0,32 0,47 0,57 0,10 -0,07 0,32 0,51 -0,52 -0,23 0,90 0,37 1,00 LNCATHOLICISM -0,09 0,36 -0,06 0,28 0,20 0,34 -0,18 0,00 0,04 0,08 0,25 -0,40 0,07 0,54 0,02 1,00
Table A.4: Descriptive statistics of variables explaining income inequality
MIN MAX MEDIAN MEAN ST.DEV OBS LNDGI LNDTH GDPPC MINR EXPRR DEM SOC
LANDGINI 0,291 0,863 0,620 0,601 0,152 105 1,00 LANDTHEIL 0,070 0,849 0,294 0,339 0,203 97 0,96 1,00 LNGDPPC 2,721 4,366 3,595 3,586 0,487 100 0,22 0,24 1,00 LNMINERALS 0,000 4,554 0,000 1,098 1,772 103 0,24 0,28 -0,22 1,00 RISKEXPROP 2,200 10,000 6,800 6,864 2,219 91 -0,06 -0,02 0,80 -0,40 1,00 DEMOCRACY 1,000 6,000 3,000 3,520 1,572 90 0,16 0,13 0,76 -0,26 0,69 1,00 SOCIALIST DUMMY 0,000 1,000 0,000 0,095 0,295 105 -0,28 -0,27 -0,03 -0,20 -0,05 -0,14 1,00
31
Papers issued in the series of the Groningen Growth and Development Centre
Papers marked * are also available in pdf-format on the internet: http://www.ggdc.net/ Hardcopies of other papers can be ordered (as long as available) from [email protected]
536 (GD-1) Maddison, Angus and Harry van Ooststroom, The International Comparison of Value
Added, Productivity and Purchasing Power Parities in Agriculture (1993) 537 (GD-2) Mulder, Nanno and Angus Maddison, The International Comparison of Performance in
Distribution: Value Added, Labour Productivity and PPPs in Mexican and US Wholesale and Retail Trade 1975/7 (1993)
538 (GD-3)* Szirmai, Adam, Comparative Performance in Indonesian Manufacturing, 1975-90 (1993) 549 (GD-4) de Jong, Herman J., Prices, Real Value Added and Productivity in Dutch Manufacturing,
1921-1960 (1993) 550 (GD-5) Beintema, Nienke and Bart van Ark, Comparative Productivity in East and West German
Manufacturing before Reunification (1993) 567 (GD-6)* Maddison, Angus and Bart van Ark, The International Comparison of Real Product and
Productivity (1994) 568 (GD-7) de Jong, Gjalt, An International Comparison of Real Output and Labour Productivity in
Manufacturing in Ecuador and the United States, 1980 (1994) 569 (GD-8) van Ark, Bart and Angus Maddison, An International Comparison of Real Output,
Purchasing Power and Labour Productivity in Manufacturing Industries: Brazil, Mexico and the USA in 1975 (1994) (second edition)
570 (GD-9) Maddison, Angus, Standardised Estimates of Fixed Capital Stock: A Six Country Comparison (1994)
571 (GD-10)* van Ark, Bart and Remco D.J. Kouwenhoven, Productivity in French Manufacturing: An International Comparative Perspective (1994)
572 (GD-11) Gersbach, Hans and Bart van Ark, Micro Foundations for International Productivity Comparisons (1994)
573 (GD-12)* Albers, Ronald, Adrian Clemens and Peter Groote, Can Growth Theory Contribute to Our Understanding of Nineteenth Century Economic Dynamics (1994)
574 (GD-13)* de Jong, Herman J. and Ronald Albers, Industrial Output and Labour Productivity in the Netherlands, 1913-1929: Some Neglected Issues (1994)
575 (GD-14) Mulder, Nanno, New Perspectives on Service Output and Productivity: A Comparison of French and US Productivity in Transport, Communications Wholesale and Retail Trade (1994)
576 (GD-15) Maddison, Angus, Economic Growth and Standards of Living in the Twentieth Century (1994)
577 (GD-16) Gales, Ben, In Foreign Parts: Free-Standing Companies in the Netherlands around the First World War (1994)
578 (GD-17) Mulder, Nanno, Output and Productivity in Brazilian Distribution: A Comparative View (1994)
579 (GD-18) Mulder, Nanno, Transport and Communication in Mexico and the United States: Value Added, Purchasing Power Parities and Productivity (1994)
32
580 (GD-19) Mulder, Nanno, Transport and Communications Output and Productivity in Brazil and the USA, 1950-1990 (1995)
581 (GD-20) Szirmai, Adam and Ren Ruoen, China's Manufacturing Performance in Comparative Perspective, 1980-1992 (1995)
GD-21 Fremdling, Rainer, Anglo-German Rivalry on Coal Markets in France, the Netherlands and Germany, 1850-1913 (December 1995)
GD-22* Tassenaar, Vincent, Regional Differences in Standard of Living in the Netherlands, 1800-1875, A Study Based on Anthropometric Data (December 1995)
GD-23* van Ark, Bart, Sectoral Growth Accounting and Structural Change in Postwar Europe (December 1995)
GD-24* Groote, Peter, Jan Jacobs and Jan Egbert Sturm, Output Responses to Infrastructure in the Netherlands, 1850-1913 (December 1995)
GD-25* Groote, Peter, Ronald Albers and Herman de Jong, A Standardised Time Series of the Stock of Fixed Capital in the Netherlands, 1900-1995 (May 1996)
GD-26* van Ark, Bart and Herman de Jong, Accounting for Economic Growth in the Netherlands since 1913 (May 1996)
GD-27* Maddison, Angus and D.S. Prasada Rao, A Generalized Approach to International Comparisons of Agricultural Output and Productivity (May 1996)
GD-28 van Ark, Bart, Issues in Measurement and International Comparison of Productivity - An Overview (May 1996)
GD-29* Kouwenhoven, Remco, A Comparison of Soviet and US Industrial Performance, 1928-90 (May 1996)
GD-30 Fremdling, Rainer, Industrial Revolution and Scientific and Technological Progress (December 1996)
GD-31 Timmer, Marcel, On the Reliability of Unit Value Ratios in International Comparisons (December 1996)
GD-32 de Jong, Gjalt, Canada's Post-War Manufacturing Performance: A Comparison with the United States (December 1996)
GD-33 Lindlar, Ludger, “1968” and the German Economy (January 1997) GD-34 Albers, Ronald, Human Capital and Economic Growth: Operationalising Growth Theory,
with Special Reference to The Netherlands in the 19th Century (June 1997) GD-35* Brinkman, Henk-Jan, J.W. Drukker and Brigitte Slot, GDP per Capita and the Biological
Standard of Living in Contemporary Developing Countries (June 1997) GD-36 de Jong, Herman, and Antoon Soete, Comparative Productivity and Structural Change in
Belgian and Dutch Manufacturing, 1937-1987 (June 1997) GD-37 Timmer, M.P., and A. Szirmai, Growth and Divergence in Manufacturing Performance in
South and East Asia (June 1997) GD-38* van Ark, B., and J. de Haan, The Delta-Model Revisited: Recent Trends in the
Structural Performance of the Dutch Economy (December 1997) GD-39* van der Eng, P., Economics Benefits from Colonial Assets: The Case of the
Netherlands and Indonesia, 1870-1958 (June 1998) GD-40* Timmer, Marcel P., Catch Up Patterns in Newly Industrializing Countries. An
International Comparison of Manufacturing Productivity in Taiwan, 1961-1993 (July 1998)
33
GD-41* Ark, Bart van, Economic Growth and Labour Productivity in Europe: Half a Century of East-West Comparisons (October 1999)
GD-42* Smits, Jan Pieter, Herman de Jong and Bart van Ark, Three Phases of Dutch Economic Growth and Technological Change, 1815-1997 (October 1999)
GD-43* Fremdling, Rainer, Historical Precedents of Global Markets (October 1999) GD-44* Ark, Bart van, Lourens Broersma and Gjalt de Jong, Innovation in Services. Overview of
Data Sources and Analytical Structures (October 1999) GD-45* Broersma, Lourens and Robert McGuckin, The Impact of Computers on Productivity in
the Trade Sector: Explorations with Dutch Microdata (October 1999, Revised version June 2000)
GD-46* Sleifer, Jaap, Separated Unity: The East and West German Industrial Sector in 1936 (November 1999)
GD-47* Rao, D.S. Prasada and Marcel Timmer, Multilateralisation of Manufacturing Sector Comparisons: Issues, Methods and Empirical Results (July 2000)
GD-48* Vikström, Peter, Long term Patterns in Swedish Growth and Structural Change, 1870-1990 (July 2001)
GD-49* Wu, Harry X., Comparative labour productivity performance in Chinese manufacturing, 1952-1997: An ICOP PPP Approach (July 2001)
GD-50* Monnikhof, Erik and Bart van Ark, New Estimates of Labour Productivity in the Manufacturing Sectors of Czech Republic, Hungary and Poland, 1996 (January 2002)
GD-51* van Ark, Bart, Robert Inklaar and Marcel Timmer, The Canada-US Manufacturing Gap Revisited: New ICOP Results (January 2002)
GD-52* Mulder, Nanno, Sylvie Montout and Luis Peres Lopes, Brazil and Mexico's Manufacturing Performance in International Perspective, 1970-98 (January 2002)
GD-53* Szirmai, Adam, Francis Yamfwa and Chibwe Lwamba, Zambian Manufacturing Performance in Comparative Perspective (January 2002)
GD-54* Fremdling, Rainer, European Railways 1825-2001, an Overview (August 2002) GD-55* Fremdling, Rainer, Foreign Trade-Transfer-Adaptation: The British Iron Making
Technology on the Continent (Belgium and France) (August 2002) GD-56* van Ark, Bart, Johanna Melka, Nanno Mulder, Marcel Timmer and Gerard Ypma, ICT
Investments and Growth Accounts for the European Union 1980-2000 (September 2002)
GD-57* Sleifer, Jaap, A Benchmark Comparison of East and West German Industrial Labour Productivity in 1954 (October 2002)
GD-58* van Dijk, Michiel, South African Manufacturing Performance in International Perspective, 1970-1999 (November 2002)
GD-59* Szirmai, A., M. Prins and W. Schulte, Tanzanian Manufacturing Performance in Comparative Perspective (November 2002)
GD-60* van Ark, Bart, Robert Inklaar and Robert McGuckin, “Changing Gear” Productivity, ICT and Services: Europe and the United States (December 2002)
GD-61* Los, Bart and Timmer, Marcel, The ‘Appropriate Technology’ Explanation of Productivity Growth Differentials: An Empirical Approach (April 2003)
GD-62* Hill, Robert J., Constructing Price Indexes Across Space and Time: The Case of the European Union (May 2003)
34
GD-63* Stuivenwold, Edwin and Marcel P. Timmer, Manufacturing Performance in Indonesia, South Korea and Taiwan before and after the Crisis; An International Perspective, 1980-2000 (July 2003)
GD-64* Inklaar, Robert, Harry Wu and Bart van Ark, “Losing Ground”, Japanese Labour Productivity and Unit Labour Cost in Manufacturing in Comparison to the U.S. (July 2003)
GD-65* van Mulligen, Peter-Hein, Alternative Price Indices for Computers in the Netherlands using Scanner Data (July 2003)
GD-66* van Ark, Bart, The Productivity Problem of the Dutch Economy: Implications for Economic and Social Policies and Business Strategy (September 2003)
GD-67* Timmer, Marcel, Gerard Ypma and Bart van Ark, IT in the European Union, Driving Productivity Divergence?
GD-68* Inklaar, Robert, Mary O’Mahony and Marcel P. Timmer, ICT and Europe’s Productivity Performance, Industry-level Growth Accounts Comparisons with the United States (December 2003)
GD-69* van Ark, Bart and Marcin Piatkowski, Productivity, Innnovation and ICT in Old and New Europe (March 2004)
GD-70* Dietzenbacher, Erik, Alex Hoen, Bart Los and Jan Meist, International Convergence and Divergence of Material Input Structures: An Industry-level Perspective (April 2004)
GD-71* van Ark, Bart, Ewout Frankema and Hedwig Duteweerd, Productivity and Employment Growth: An Empirical Review of Long and Medium Run Evidence (May 2004)
GD-72* Edquist, Harald, The Swedish ICT Miracle: Myth or Reality? (May 2004) GD-73* Hill, Robert and Marcel Timmer, Standard Errors as Weights in Multilateral Price
Indices (November 2004) GD-74* Inklaar, Robert, Cyclical productivity in Europe and the United States, Evaluating the
evidence on returns to scale and input utilization (April 2005) GD-75* van Ark, Bart, Does the European Union Need to Revive Productivity Growth? (April
2005) GD-76* Timmer, Marcel and Robert Inklaar, Productivity Differentials in the US and EU
Distributive Trade Sector: Statistical Myth or Reality? (April 2005) GD-77* Fremdling, Rainer, The German Industrial Census of 1936: Statistics as Preparation
for the War (August 2005) GD-78* McGuckin, Robert and Bart van Ark, Productivity and Participation: An International
Comparison (August 2005) GD-79* Inklaar, Robert and Bart van Ark, Catching Up or Getting Stuck? Europe’s Troubles to
Exploit ICT’s Productivity Potential (September 2005) GD-80* van Ark, Bart, Edwin Stuivenwold and Gerard Ypma, Unit Labour Costs, Productivity
and International Competitiveness (August 2005) GD-83* Timmer, Marcel and Gerard Ypma, Productivity Levels in Distributive Trades: A New
ICOP Dataset for OECD Countries (April 2005)
35
GD-86* Frankema, Ewout, and Jutta Bolt, Measuring and Analysing Educational Inequality: The Distribution of Grade Enrolment Rates in Latin America and Sub-Saharan Africa (April 2006)
36
Groningen Growth and Development Centre Research Monographs Monographs marked * are also available in pdf-format on the internet: http://www.ggdc.net/ No. 1* van Ark, Bart, International Comparisons of Output and Productivity: Manufacturing
Productivity Performance of Ten Countries from 1950 to 1990 (1993) (http://www.eco.rug.nl/GGDC/ThesisArk.html)
No. 2 Pilat, Dirk, The Economics of Catch-Up: The Experience of Japan and Korea (1993) No. 3 Hofman, André, Latin American Economic Development. A Causal Analysis in
Historical Perspective (1998) No. 4 Mulder, Nanno, The Economic Performance of the Service Sector in Brazil, exico and the
United States (1999) No. 5* Smits, Jan-Pieter, Edwin Horlings and Jan Luiten van Zanden, Dutch GNP and Its
Components, 1800-1913 (2000) (http://www.eco.rug.nl/GGDC/PUB/dutchgnp.pdf)