CATALYST AGING TESTS AND THE ROLE OF ... - ShareOK
253
CATALYST AGING TESTS AND THE ROLE OF CATALYST WETTING ON HYDRODESULFURIZATION OF A COAL DERIVED LIQUID By DHIRENDRA CHHOTALAL MEHTA II Bachelor of Science Banaras Hindu University Varanasi, India 1970 Master of Science Oklahoma State University Stillwater, Oklahoma 1972 Submitted to the Faculty of the Graduate College of the Oklahoma State University in partial fulfillment of the for the Degree of DOCTOR OF PHILOSOPHY May, 1978
-
Upload
khangminh22 -
Category
Documents
-
view
3 -
download
0
Transcript of CATALYST AGING TESTS AND THE ROLE OF ... - ShareOK

CATALYST AGING TESTS AND THE ROLE OF CATALYST
WETTING ON HYDRODESULFURIZATION OF
A COAL DERIVED LIQUID
By
DHIRENDRA CHHOTALAL MEHTA II
Bachelor of Science Banaras Hindu University
Varanasi, India 1970
Master of Science Oklahoma State University
Stillwater, Oklahoma 1972
Submitted to the Faculty of the Graduate College of the Oklahoma State University
in partial fulfillment of the requirement~ for the Degree of
DOCTOR OF PHILOSOPHY May, 1978

CATALYST AGING TESTS AND THE ROLE OF CATALYST
WETTING ON HYDRODESULFURIZATION OF
A COAL DERIVED LIQUID
·Thesis Approved:
ii

ACKNOWLEDGMENTS
The subject of this study was the catalytic hydrodesulfurization
of raw anthracene oil in a trickle bed reactor. Experiments were
carried out at temperatures of 600, 650, 700 and 750 F (314, 343, 371
and 399 C), pressures of 500, 1,000 and 1,500 psig and liquid volume
hourly space times ranging from 0.325 to 1.480 hours. The effect of
catalyst wetting characteristics were investigated and the catalysts
were also tested for their aging characteristics. Various reaction
rate models were compared for their relative fit to the data.
I am deeply indebted to my thesis adviser Dr. B~ L. Crynes for his
expert guidance and valued suggestions during the course of my doctoral
program. I would like to express my sincere gratitude to my examining
committee which consisted of Dr. J. H. Erbar, Dr. R. L. Robinson, Jr.,
and Dr. D. F. Kincannon for their constructive criticism and sugges
tions. Discussions with other faculty members and fellow graduate
students were also of considerable help.
Special thanks are due Dr. R. Sivasubramanian and Mr. Mushtaq
Ahmed for their continued assistance during the course of my doctoral
program. I am thankful to Richard Cavett, Donald Kennedy, Mohamed
Ghaly, Kerry Scott, Nitin Mehta and Anthony Jones for the long hours
they patiently spent operating the equipment. I am also grateful to
my fellow graduate student, Mr. Kam Tong Wan, for his fortitude during
the project.
iii

The financial assistance from the School o£ Chemical Enginee~ing
at Oklahoma State University, Pittsburg and Midway Coal Mining Company
and The U. S. - Energy Research and Development Administration is
gratefully acknowledged.
The financial assistance from my present employer - Combustion
Equipment Associates, Inc. - is gratefully acknowledged. Special
thanks are due my supervisor, Mr. J. M. Falco, and colleagues, Mr. R.
Davis, Mr. R. Rasbold, Mr. M. Kinkhabwala and Mr. H. Master, for their
continued cooperation.
The editorial assistance from Mr. Ed Kelly is gratefully appreci
ated. I am also grateful to Ms. Rosalie LoBono and Mrs. Wanda Dexter
for typing assistance. Special thanks to them for adhering to my
schedule.
On a personal note, I shall always be thankful to all my family,
relatives and friends who came to my mother's aid at the time of her
greatest need. I am deeply grateful to Prof. and Mrs. Crynes and
their entire family for extending to my wife and me the warmth of
their friendship and making us feel like members of their family.
I shall always be indebted to my mother and sister, without whose
personal sacrifices and encouragement this graduate study would not
have been possible. I am eternally grateful to my father and brother
for the guidance and provision they afforded their family. May their
souls rest in peace.
Last, but in no ways least, I can never repay the debt I owe to
my beloved wife, Rajul.
iv

TABLE OF CONTENTS
Chapter
I. INTRODUCTION
II. LITERATURE REVIEW
Trickle Bed Reactor Backmixing in Trickle Bed Reactor Catalyst Wetting and Mass Transfer Effects Hydrogen Rate Effects Temperature Effects Pressure Effects Effects of Space Time and Kinetics
of HDS Reaction Organic Sulfur Containing Compounds in Feedstocks Selection of Catalysts . . . . . . Effects of Catalyst Characteristics Catalyst Aging Characteristics
III. EQUIPMENT SELECTION AND SET UP
Expe·rimental Equipment
Reactor . . . . . Reactor Heating System Reactor Insulation Temperature Measurement Pressure Holding and Measurement Sample Collection System Oil and Hydrogen Feed Systems Material of Construction Safety Measures
Analytical Apparatus
IV. EXPERIMENTAL PROCEDURE
Reactor Operation
Reactor Preparation Catalyst Pretreatment Reactor Feed-Preparation Startup Procedure Normal Operation
v
Page
1
22
23 25 29 34 36 37
39 45 47 50 52
55
59
59 61 63 65 65 68 68 70 70
73
79
79
79 81 83 84 86

Chapter
Sample Collection . . . . . . Control of Operating Conditions Changing Operating Conditions Shutdown Procedure
Analyzer Operation
Sulfur Analysis
V. EXPERIMENTAL RESULTS
Analytical Precision Study of Catalyst Aging Characteristics Pressure Effects . . . . . . . . Temperature Effects . . . . . . . . . . Space Time Effects and Rate Equations Effects of Catalyst Pore Size Distribution Physical Properties of Feed and Product Oils
VI. DISCUSSION
Consistency Test for Data Liquid Distribution and Backmixing Catalyst Wetting and Mass Transfer Effects Particle Size and Effectiveness Factor Hydrogen Rate . . . . . . . . . . Pressure Effects . . . . . . . . Temperature and Space Time Effects Effect of Catalyst Pore Size Catalyst Aging Characteristics
VII. CONCLUSIONS AND RECOMMENDATIONS
Conclusions Recommendations
A SELECTED BIBLIOGRAPHY
APPENDIX A
APPENDIX B
APPENDIX C
APPENDIX D
APPENDIX E
APPENDIX F
APPENDIX G
vi
Page
87 90 92 94
96
96
102
104 106 113 113 117 127 134
137
138 141 145 147 152 154 159 176 182
193
193 195
197
207
208
218
221
223
225
234

Chapter
APPENDIX H
APPENDIX I
APPENDIX J
APPENDIX K
vii
Page
236
238
239
241

LIST OF TABLES
Table Page
I. Present Status of Leading Coal Gasification Processes 11
II. Comparative Costs of Generating Electricity 12
III. Major Areas of ERDA Research Projects 17
IV. Present Status of Leading Coal Liquefaction Processes 18
V. Organic Sulfur Containing Compounds in Coal Derived Liquids . . 46
VI. Comparative Reactor Rating for Gas-Liquid, Powdered Catalyst, and Nondecaying System . 57
VII. List of Experimental and Analytical Equipment Items 76
VIII. Valve Positions During Catalyst Pretreatment 82
IX. Valve Positions During Normal Operations 87
X. List of Chemicals Used in Experiments and Analysis 101
XI. Comparison of the Analytical Precision of the Samples With That of the Equipment 105
XII. Experimental Run 2, MCM 1 Catalyst 107
XIII. Experimental Run 3, MCM 2 Catalyst 108
XIV. Experimental Run 4, MCM 3 Catalyst 109
XV. Experimental Run 6, MCM 4 Catalyst 110
XVI. Experimental Run 8, MCM 5 Catalyst 111
XVII. Experimental Run 5, MCM 4 Catalyst 114
XVIII. Experimental Run 1, MCM 1 Catalyst 118
XIX. Experimental Run 7, MCM 5 Catalyst 119
viii

Table Page
XX. List of Samples Collected for Catalyst Activity Tests 122
XXI. Results of the Relative Fits of Five Kinetic Models 125
XXII. Comparison of Catalyst Chemical Analyses and Physical Properties . . . . . . . . 128
XXIII. Physical Properties of Feed Oil 135
XXIV. Density and Kinematic Viscosity of Distillation Fractions of Feed . . . . . . . . . . . . . 136
XXV. Comparison of Weights of Distillation Fractions of Feed and Product Samples . . . . . 136
XXVI. Comparison of Results for Equipment Operation Consistency Tests . . . . . . . . . . 139
XXVII. Sets of Data Used for the Non-Linear Regression Analysis . . . . . . . . . . . . 166
XXVIII. .Results of the Non-Linear Regression Analysis of First Order Reaction Model . . . . . . . 167
XXIX. Results of the Non-Linear Regression Analysis of Second Order Reaction Model . . . 168
XXX. Comparative Fit of Various Reaction Rate Models 171
XXXI. Activation Energies
XXXII. Reaction Rate Constant per Unit Catalyst Surface Area
XXXIII. Results of the Aging Tests
XXXIV. Analytical Data
XXXV. Mercury Penetration Data
XXXVI. Calculations for Pore Size Distribution CurveMCM 5 Catalyst
XXXVII. Experimental Data
ix
173
18.2
190
210
219
220
226

LIST OF FIGURES
Figure Page
1. The Forecast of the Energy Demand up to Year 2000 . . . . . . 2
2. The Role of Various Energy Sources in Future Energy Situations . . . . . . . . . . . . . 4
3. The Unbalance in the Energy Reserves and Production 15
4. Distribution of U. S. Coal Reserves by Sulfur Content 19
5. Distribution of Coal Reserves East of Mississippi by Sulfur Content . . . . . . . 19
6. Trickle Bed Reactor and the Related Measurements. 60
7. Different Views of the Aluminum Heating Block 62
8. Heater Block Showing Insulation 64
9. Equipment Setup for the Experimental Program 67
10. Exploded View of Bomb . 69
11. Hydrogen Manifold System 71
12. Schematic Diagram of Apparatus for the Determination of Sulfur . . . . . . . 75
13. A Typical Temperature Profile 91
14. Results of the Catalyst Aging Tests 112
15. A Typical Pressure Effect on Sulfur Removal Efficiency 116
16. A Typical Temperature Effect on Sulfur Removal Efficiency 121
17. Comparative Fit of Various Reaction Models to a Typical Data Set . . . . . . . 124
18. Pore Size Distribution of MCM 1 Catalyst 129
19. Pore Size Distribution of MCM 2 Catalyst 130
X

Figure
20o Pore Size Distribution of MCM 3 Catalyst
21. Pore Size Distribution of MCM 4 Catalyst o
22o Pore Size Distribution of MCM 5 Catalyst o
23. Thiele Modulus vs. Effectiveness Factor
24. Effect of Pressure on Sulfur Removal at 650 F
25. Effect of Pressure on Sulfur Removal at 700 F
26. Effect of Pressure on Sulfur Removal at 750 F
27. Comparative Fit of Various Reaction Rate Models
28o Typical Pore Size Distributions
29. Results of Catalyst Aging Test Run·for MCM 1 Catalyst
30. Results of Catalyst Aging Test Run for MCM 2 Catalyst
31. Results of Catalyst Aging Test Run for MCM 3 Catalyst
32. Results of Catalyst Aging Test Run for MCM 4 Catalyst
33. Results of Catalyst Aging Test Run for MCM 5 Catalyst
xi
Page
131
132
133
150
156
157
158
170
178
185
186
187
188
189
CHAPTER I
INTRODUCTION
The idea that the United States faced a critical shortage in
energy supplies was first discussed some five years ago. At the time,
neither the American people nor government gave the notion serious
consideration. Sudden action, however, by the Organization of
Petroleum Exporting Countries (OPEC) in 1973 made the Western indus
trial nations realize the great extent to which they depended upon
imported oil. Authoritative projections of future energy requirements
then began to forecast the serious crisis that lay ahead.
Energy consumption in the U. S. increased steadily from 1960 to
1974 at an average annual rate of about 4.1% (1). According to the
reports of the U. S. Bureau of Mines (2), the energy consumption in
the U. S. then showed successive declines in 1974 and 1975. The energy
use in 1973 was at 74,555 trillion British thermal units (Btu) followed
by 73,121 trillion Btus in 1974 and 70,580 trillion Btus in 1975.
Despite the drop in 1974 and 1975, the projections for future energy
requirements show a steady increase. The U. S. energy use in 1976 has
already shown a rise of 4.8% over 1975. Jack Bridges (3) has summa
rized some of these projections in his report presented before the
Joint Senate Commitee on Atomic Energy, March 1973. Figure 1 shows
various energy consumption forecasts by different agencies in terms
1

85
YEAR
95
Figure 1. The Forecast of the Energy Demand up to Year 2000 (3).
::> 0 w -I
0 0 lri Ill z 2 -I -I
i
2

of millions of barrels of oil equivalent (BOE*) per day. These fore-
casts show a distinct trend in energy consumption for any given year
based on different annual growth rates. Figure 1 only demonstrates
the projected consumption while not considering the source of energy.
3
Based on recent trends and projected rates of development of resources,
Jack Bridges indicated in Figure 2 what source of energy would possibly
fill the demand in the years to come. Note that the energy from coal
and nuclear will play an increasingly dominant role in the attempt to
fulfill the high energy demand. Also noticeable are the contributions
of oil and natural gas, which are expected to decline both quantita-
tively and in relation to other sources. Any delay in the development
of the alternative energy sources (such as geothermal, Alaskan and
offshore oil, solar, shale oil or even nuclear) could mean another
round of energy shortages and/or increasing imports.
The OPEC unilaterally raised the price of their crude oil almost
fourfold during October 1973 (4). At the same time, the OPEC also
imposed an embargo on oil exported to the U. S. These drastic actions
by the OPEC had a significant impact on the economy and stability of
those nations depending heavily on the oil imports. The sudden jump
in the crude oil price was a temporary disaster for Japan and continues
to have lingerjng effects on many of the European nations and the U. S.
(5). The crude price increase had the greatest immediate impact on the
foreign balance of payment deficit. For example, the U. S. imported
5.7 million barrels per day (BPD) of crude oil in May 1973 at an
*Amount of energy produced from various energy sources converted in terms of barrels of oil producing equivalent energy.

w
8 Iii z Q .... .... i
70
Figure 2.
75 80 85 YEAR
90
NUCLEAR (FISSION AND
FUSION)
95 2000
The Role of Various Energy Sources in Future Energy Situation (3).
w
8 Iii z Q .... .... i
4

approximate cost of $17 million daily or $6.2 billion annually (6).
In November 1974, the crude oil imports were 6.5 million BPD, an
approximate cost of $70 million daily or $25 billion annually. The
crude oil imports in 1976 rose to 7.3 million BPD. At this rate, it
is estimated that the reliance on the import of crude oil would cost
the U. S. about $800 billion between 1974 and 1985.
5
Although the OPEC actions may have been the catalyst for the
energy crisis in the U. S., other internal factors have also contribut
ed greatly. The U. S. government's price control of natural gas is
one such factor. These controls resulted in a downward trend in the
natural gas prices from 23.25 cents per thousands cubic feet (¢/Me£)
in 1960 to 18.5 ¢/Mcf in 1968 (6), (7). The price of natural gas was
controlled to such a great degree that in 1973 the average cost of
natural gas was less than one-third the cost of oil for an equivalent
amount of heating value. The·result has been a reduction in explora
tion activities for natural gas. Developed reserves have dropped from
21.1 trillion cubic feet (Tcf) per year during 1964-1967 to 11 Tcf per
year during 1967-1971 period. The controlled natural gas price has
also resulted in depressing the prices of other energy sources. On a
constant 1972 dollar basis the price of crude oil in the U. S. has
declined from $3.93 per barrel in 1963 to $3.39 per barrel in 1972 (6).
These lower costs also lessen the incentive for exploration and hinder
the development of new reserves. A new analysis made by the Staff of
the American Gas Association (AGA) (8) projects a continued decline in
the overall production of natural gas under price controls. The AGA
staff analysis shows that at a maximum wellhead price of 52 ¢/Mcf, the
natural gas production would decline from 19.2 Tcf in 1975 to 12.5 Tcf

6
in 1990. They also conclude that at the deregulated prices, natural
gas production would be maintained at a steady rate of 20.0 Tcf.
Other factors include actions of the Environmental Protection
Agency (EPA). The stringent environmental regulations delayed or
halted some of the exploration and production plans for additional
sources of energy. EPA actions also hindered the leasing of public
lands for exploration purposes. The drop in new reserve developments
coupled with rising energy consumption brings us back to oil import to
fill the gap between supply and demand. This 1s clearly shown in
Figure 2.
Middle Eastern crude oil was abundant, at cheap rates, until
October 1973. This supply was taken for granted and was assumed to be
perpetual by its users. But the turn of events in the Fall of 1973
shattered these delusions. The situation in the U. S. became grave
due to the threat of future crude oil embargoes at the whim of the OPEC.
These chain of events prompted President Nixon (9) to announce major
initiatives in a nationally televised speech on November 7, 1973:
Let us unite in committing the resources of this nation to a major new endeavor. An endeavor that in this bicentennial era we can appropriately call Project Independence. Let us pledge that by 1980 under Project Independence we shall be able to meet America's energy needs from America's own energy resources (9, p. 92).
The energy experts do not believe that the U. S. could achieve
independence from imported oil by 1980. But the concept of Project
Independence (PI) is still conceivable and could be fulfilled by some
later date. The appropriation by the Energy Research and Development
Administration (ERDA) for research in the energy related areas for the
year 1976 was $2.2 billion and the budget during 1977 has jumped to

$3.0 billion (10). ERDA is also lobbying for a law to provide $2.0
billion in loan guarantees for synthetic fuel productions from coal,
oil shale and other sources. The details of the research activities
will be discussed later in this chapter. The Federal Energy Adminis
tration (FEA) has completed a massive energy report that scrutinizes
the concepts of PI. This 800-page document, released November 12,
1974, made non-conclusive but very specific remarks (9). The major
remarks from the report include:
(i) Even though zero imports are possible by 1985, this course of
action is not warranted economically or politically.
(ii) The U. S. will have to depend on the existing technology to
raise any additional energy sources through 1985. New resources
would play significant roles in the energy supply picture some time
:in future dates.
(iii) New exploration and research funding will depend primarily on
the price of crude oil.
7
(iv) Although some environmental and economic dislocations will occur
due to the energy crunch, major disruption may not be necessary and
probably can be avoided.
(v) The U. S. economic resources will probably have greater influence
on the accelerated supply strategy.
The principal goal of PI is to reduce the impact on the economy
of future oil embargoes and balance of trade deficits. There are
several alternatives at hand by which the goal of energy independence
may be achieved. These are:
(a) Conserve energy,
(b) Explore for more oil and gas in the U. S.

8
(c) Convert coal by liquefaction and gasification processes.
(d) Develop new sources of energy.
A discussion of these alternatives follows:
(a) The days of wasteful use of energy are gone. Every effort
must be made to use energy at a higher and higher efficiencies. As a
matter of fact, the energy consumption in 1974 dropped about 2.2% from
the 1973 level and it further declined another 3.5% in 1975 (2). This
declining trend in energy consumption is the first since 1952. The
Secretary of the Interior, Rogers C. B. Morton (1) attributed the
decline in the energy consumption to (a) the Arab oil embargo during
Fall 1973 and Spring 1974, (b) the escalation of fuel costs, which
have had a direct influence on everybody's pocketbook, (c) the 1973
recession and ~lowdown of industrial production, (d) a relatively mild '
winter in 1973, which required comparatively less energy to heat our
homes, and (e) the participation of government and private sectors in
conservation efforts (such as lowering thermostat settings from 72 F
to 68 F (22 C to 20 C) during winter, increased insulation of commer-
cial and household buildings, reducing speed limit on highways from 70
miles per hour (mph) to 55 mph, etc.). The combination of all of these
factors resulted in the decrease in energy consumption during 1974 and
1975. This decline boosted the morale of the proponents of Project
Independence.
(b) Although every effort is and will be made to reduce energy
waste, more oil and gas will have to be found to meet the growing
energy demands of an expanding economy. A report of the Potential Gas
Committee at Colorado School of Mines revealed that there is about
1,178 Tcf of gas yet to be discovered in the U. S., one third of which

is in Alaska (11). There is also an estimated 9.6 billion barrels of
oil lying under the northern slopes of Alaska (12). The Alaskan oil·
and gas were discovered in 1968, but avid environmentalists forced
delay in construction of the 789 mile trans-Alaska pipeline, citing
possible ecological disruptions along the route. The construction of
the pipeline was finally approved by Congress in 1974. The pipeline
was completed recently and a complex system start-up operations began
in the Summer of 1977 (13). The pipeline will handle 300,000 BPD of
oil during the start-up stages and will later transport up to
9
2,000,000 BPD. The report by the Potential Gas Committee also indi
cated that most of the new reserves are deeper than 15,000 feet on the
off-shores bordering the U. S. and Alaska. This is compared to the
average well depth of 5,000 feet today. The operations on some of the
oil wells were curtailed long ago due to unfavorable economics. Now
that the oil and gas prices have gone up, these deep drilling operations
can be resumed. In spite of the energy crisis, leases for drilling and
exploring off-shore U. S. reserves. are still delayed by the threats of
environmentalists. (The exploration in the Gulf of Mexico is the only
one in which small quanti ties of oil have been found (14).) These
complications will certainly delay the accomplishment of PI. It is
hoped that these obstacles will be overcome soon so that the goal of PI
may be achieved.
(c) One of the major alternatives considered for supplementing the
energy supplies of the U. S. is the increased use of coal. Since
liquids and gases are more convenient and desired forms of energy,
the efforts given to the concept of coal conversion to these forms have
increased markedly. The U. S. coal reserves are estimated to be 3.2

10
trillion tons (15). A National Petroleum Council (NPC) study indicates
that, based on present technology, approximately 150 billion tons (450
billion BOE) can be recovered economically from the total coal re
serves.
In fact, the technology of coal processing to produce a synthetic
liquid fuel is not new. The pioneering work by Bergius, a German
scientist, earned him the Nobel prize for chemistry in 1932 (16). It
is also believed that the Germans used the Bergius process to produce
about 90 percent of their peak-time aviation and motor fu.el during
World War II. Another old process is the Fisher-Tropsch synthesis
method. These processes must be further tested for use on the variety
of U. S. coals. The economics of these methods must also be assessed,
New investigations under the sponsorship of ERDA are developing new
processes for the liquefaction of various U. S. coals. The details of
these processes will be discussed later in this chapter.
Coal gasification technology is not new either. Gases such as
water gas, producer gas, town gas, carburetted blue gas, and oil gas
have been produced for over fifty years (17). The heat content of
these gases has varied from 70 Btu per standard cubic feet (scf) to
420 Btu/scf compared to about 1,000 Btu/scf for natural gas. There
fore, these low-Btu gases became nearly obsolete once natural gas came
into the energy_market. The present drive for coal gasification
requires gas from coal whose heat content can match that of the natural
gas. With an abundant quantity of coal scattered throughout the U. S.,
the synthetic natural gas (SNG) can reach the diversified markets with
less difficulty. ERDA (then Office of Coal Research) sponsored studies
on different types of U. S. coals for gasification. Various private

11
industries also developed other processes to produce SNG. The status·
of the leading coal gasification processes is presented in Table I
(15).
TABLE I
PRESENT STATUS OF LEADING COAL GASIFICATION PROCESSES
Process Developer
Hygas Institue of Gas Technology
C02 acceptor Consolidation Coal Company
Big as Bituminous Research Inc.
Synthane Bureau of Mines
Lurgi Lurgi Mineralol-technik GmbH
COGAS FMC Corporation
EXXON Esso Research Inc.
Status
Operating a 100 T/D pilot plant. Planning a scale-up facility.
Operating a 40 T/D pilot plant. Planning a scale-up facility.
Operating a 120 T/D pilot· plant.
Operating a 70 T/D pilot plant.
Process less methane synthesis in operation. A full scale plant is in design.
Operated a pilot plant.
Operated a pilot plant.
The previous studies have indicated that for a common basis of
amount of SNG production, coal price, and the rate of return, the cost
of SNG would vary from 90 ¢/Mscf to 135 ¢/Mscf (18). The shape of the

price structun· has since changed and the current predictions state
that SNG may co~t in the neighborhood of $3.00/Mscf. But this latter
price for SNG may still be competitive since imported oil and gas
prices have also risen so sharply.
(d) The final alternative is to develop new sources of energy.
12
With reference to the Project Independence, the FEA r~port suggests an
ever expanding role of nuclear power (9). According to Thomas G. Ayers,
Chairman and President of the Commonwealth Edison Co. of Chicago, the
cost of generating electricity from different fuel sources is as
illustrated in Table II.
TABLE II
COMPARATIVE COSTS OF GENERATING ELECTRICITY
h1el Source
Oil-fired peaking units
Conventional oil-fired
Western low-sulfur coal
Nuclear
Cost of Electricity, ¢/kwh
4.00
1. 80
0.80
0.25
The expansion in the role of nuclear power will largely depend
upon federal policies toward granting of permits and lic~nses as well
as federal funds for research and development.

13
Another new source of energy could very well be shale oil. The
oil shale deposits are mixed hydrocarbon reserves. The world's
largest deposits'of the Green River formation are estimated to have a
total recoverable product of up to 600 billion BOE (9). In a conven
tional oil production there is generally large initial investments
followed by relatively low operating expenses. Oil shale, however, is
feared to require both large initial investments and significantly
higher operating expenses. Should oil prices drop, oil shale prices
could be non-competitive. The risks involved in such investments may
have to be protected by federal regulations.
There are also plans for harnessing energy from certain natural
sources such as solar, wind, and geothermal and ocean thermal. The
studies are underway to transform these energies to conventional forms
for convenient usage.
Solar energy can be redirected from numerous sour~es to a central
location to attain a temperature of up to 1200 F (649 C) (9). This
absorbed heat can then be utilized to produce steam wh~ch in turn can
generate electricity. Certain modifications in building designs can
also capture solar energy for heating and cooling.
There are several areas in the U. S. where the prevailing wind
velocities can generate significant amounts of power.
Likewise, there are numerous locations in the U. S. where there
are geysers or hot springs (19). Energy from these hot springs can be
transformed via an intermediate fluid to generate electricity. The
same is the case for seawater. The key questions are when and how much
of these naturally available energies can be converted economically to
meaningful end uses. The National Science Foundation is sponsoring

14
several research studies to explore different design concepts that can
produce favorable answers.
The Project Independence is a big challenge as is the decision of
which of these alternatives is most economical and reliable for an
extended use. Probably a combination of all or most of these alterna
tives must be used to ease the pressure from the current energy supply
and demand situation. In spite of all this confusion, one of the
fossil fuels is now getting a lot of attention. President Ford (20),
in his speech before a group from The National Coal Association,
proclaimed that coal is the ace in the hole for the U. S. Similarly
the Director of the U. S. Bureau of Mines, Dr. Thomas V. Falkie (21),
stated that there is a growing appreciation of the enormous stand-by
energy wealth represented in the public and privately owned deposits
of coal that are widely distributed throughout the country. With these
remarks Dr. Fa1kie stressed that for the next 20 to 30 years all new
fossil fuel power plants should use coal instead of petroleum products
or natural gas to generate electricity. Figure 3 illustrates the
unbalance in energy reserves and production (9). Up to 94.5% of the
U. S. recoverable fossil fuel reserves are coal but only 18% of the
energy production is shared by coal. Coal began to play an increasing
role in the energy picture only since 1974. Coal has accounted for
17.69.;, 17.8%, JR.l% and 18.4% of the total energy use during the years
1973, 1974, 197S and 1976 respectively (1), (2). The gain does not
appear significant but the trend is certainly important.
The technology and fuel resources may be available to make the
U. S. independent of all foreign energy reliance.. The financing,
however, may become the limiting factor in expanding the U. S. supplies.

Recoverable U. S. Reserves
2.8%
Coal 94.5%
2.7%
Petroleum 46%
1%
Coal 18%
Natural 31%
Figure 3. The Unbalance in the Energy Reserves and Production (9).

16
At the New York public hearings on PI, the chairman of AGA's finance
committee mentioned that the U. S. might run out of money before run
ning out of gas (9). Mr. Collado of Exxon Corporation estimated that
the energy industry will have to invest about $500 billion (1973
dollars) between now and 1985 just to end the growth in the energy
imports. The chairman of the board of directors of the New York Stock
Exchange, Mr. Needham, commented that presently the U. S. corporations
are heavily in debt and there is too much risk involved in investing
so much money in the energy related areas.
Another possible obstacle to achieving the PI goal could be the
danger of environmental pollution and safety problems. The increased
burning of coal and other fossil fuels may increase air pollution.
The hurried licensing of the nuclear power plants might overlook
certain safety precaution measures. Some of the stiff anti-pollution
legislation may have to be set aside temporarily in order to conserve
energy and to improve the supply situation.
In spite of these obstacles, the efforts to explore new horizons
of energy supply should continue at their peak. ERDA has numerous
research projects underway at institutions across the U. S. Listing
all the projects under the sponsorship of ERDA is probably beyond the
scope of this work. The four major areas of research are listed here
in Table I II.
The subject of high-Btu gas was also discussed earlier in this
chapter. Low-Btu gas and direct coal combustion processes have been in
practice in the U. S. for decades. Coal liquefaction is the major area
of research which is developing new processes. The basic concept of
coal liquefaction is to produce a non-polluting liquid product from

17
coal at a reasonable cost. This coal derived liquid can not only
replace petroleum as a power plant and industrial heating fuel but it
can also act as a crude for hydrocracking and refining purposes. The
present status of some of the leading coal liquefaction programs is
presented in TLJ.ble IV (15), (16).
TABLE III
MAJOR AREAS OF ERDA RESEARCH PROJECTS
Area of Research Project Objectives
Coal liquefaction products To be utilized for power generation, industrial, commercial, residential, and transportation requirements.
High-Btu gasification products To supplement the industrial, residential, and commercial needs.
Low-Btu gas products For power generation and industrial application.
Direct coal combustion products For power generation and industrial application.
The U. S. has abundant coal reserves and some of the research
programs for coal liquefaction have reached advanced stages. Capital
investment and certain technical questions will be worked out during
the upcoming p dot plant programs. The remaining major obstacle is
pollution control. Sulfur content of coal is the primary concern.
The distribution of the estimated U. S. coal reserves by sulfur

18
content as of Jan. 1, 1975 is shown in figure 4 (22). 1bis figure may
be misleading. About 70% of the coal, including most of the low-
sulfur coal, lies west of the Mississippi, while, over 90% of the coal
production activity and major market have been in the areas east of
the Mississippi. The distribution of the estimated reserves in states
cast of the Mississippi by their sulfur content is presented in
Figure 5 (22).
TABLE IV
PRESENT STATUS OF LEADING COAL LIQUEFACTION PROCESSES
Process Developer
SRC Gulf-Pittsburg and Midway Coal Mining Company
I-I- Coal Ashland Oil Company
SASOL II South African Coal Oil & Gas Company
Synthoil Bureau of Mines
COED FMC Corporation
Exxon Esso Research & Engineering
Liquefaction Step
Non-catalytic
Catalytic ebullating bed
Fischer-Tropsch
Catalytic fixed bed
Fluid bed hydrotreating
Hydrogenated solvent
Status
Successfully operating a 50 TID pilot plant since 1974.
Constructing a 600 TID pilot plant.
Constructing 40,000 TID Power Plant
Operating a 0.5 TID pilot plant.
Operated a 0.5 TID pilot plant undergoing further analysis. Operated a 0.5 TID pilot plant. Building a 250 TID unit.

Low-Sulfur coal
High-Sulfur· Coal
Medium-Sulfur Coal
Figure 4. Distribution of U. S. Coal Reserves by Sulfur Content (22).
High-Sulfur Coal
Figure 5. Distribution of Coal Reserves East of Mississippi by Sulfur Content (22).
19

20
Sulfur in coal is undesirable for twA. reasons. The first con
sideration is certainly air pollution. The second consideration is
that higher sulfur content coal derived liquid will probably poison
catalysts in any subsequent processing steps. Hence, the removal.of
sulfur from the coal derived liquids becomes more than essential.
Predictably, part of the attention in the coal liquefaction program is
focused towards sulfur removal from the coal derived liquids.
The present study is a part of a continuing investigative program
at the Oklahoma State University directed towards developing hydro
treating catalysts for coal derived liquids. The hydrodesulfurization
(liDS) of raw anthracene oil, a coal derived liquid, was investigated in
a trickle-bed reactor in the presence of several commercially available
Co-Mo-Alumina catalysts. These catalysts were also tested for their
aging characteristics for the HDS of raw anthracene oil.
The objectives of the present study were as follows:
1. To provide useful information with regards to developing
hydrotreating catalysts for coal derived liquids.
2. To determine the effects of the reactor operating conditions
on the hydrodesulfurization of raw anthracene oil using
selected catalysts.
3. To develop a reaction rate model for hydrodesulfurization of
raw anthracene oil in the presence of selected catalysts.
4. To evaluate the aging characteristics of the hydrotreating
catalysts.
There are a few techniques available in the literature for the
sulfur removal from coal, petroleum feedstocks and coal dervied liquids.

21
The next chapter covers some of these techniques as well as the types
of suitable reactors that can be employed, properties of the catalysts
used and areas related to this investigation.

CHAPTER II
LITERATURE REVIEW
The catalytic HDS of petroleum distillates has been practiced for
several years, but the chemistry of the process has not been fully
understood. Recently, the research efforts in the area of HDS have
increased sharply because of tough air pollution control standards
requiring low sulfur fuel oils. Most of the current engineering
research on the catalytic HDS is proprietary and hence the related
information is not available in the open literature. At the same time,
other related aspects of the reactor operation are reported quite
extensively. The type of reactor used for research studies on the HDS
is generally a trickle bed reactor. Therefore, the literature reivew
related to the fluid flow characteristics is limited only to the trickle
bed reactor. Ample information on the flow characteristics and other
related subjects such as axial dispersion, backmixing and catalyst
wetting is available in the open literature. Very limited research
studies are available regarding the effects of reactor temperature,
pressure and space time on the kinetics of HDS. A number of recent
research studies are concentrated on the study of different HDS
catalysts with a special attention to the Co-Mo-Alumina catalysts.
These studies cover a wide range of catalyst characteristics such as
pellet size, surface area, pore size, active life, etc.
22

There are a few industrial scale HDS techniques available in the
market. But most of these techniques apply to a specific type of
petroleum feedstock. With feedstock of varying physical and chemical
properties, the type of sulfur containing compounds present in a
particular feedstock may vary and, thus, the methods to attack the
sulfur containing compounds also vary. At present, the methods to
attack particular sulfur containing compounds in the coal-derived
liquid are not reported.
23
This chapter is organized to take the reader step by step, through
the reactor to the catalyst bed. The type of reactors used for the HDS
is discussed first. The fluid flow characteristics of the trickle bed
reactor are presented. Next, the effects of varying reactor operating
conditions are examined. The current techniques for the HDS are out
lined along with the type of feedstocks and respective sulfur contain
ing compounds. Finally, the attention is concentrated on numerous
catalyst characteristics including the studies on various HDS catalysts.
The catalyst deactivation is also covered along with the reasoning
behind such deactivation.
Although there are many chemical reactors, only trickle bed
reactors are used extensively in the HDS studies. Very rarely is the
reasoning behind such selection reported. A portion of the explanation
is presented in the next chapter, certain specific aspects of the
selection are briefly explored here.
Trickle Bed Reactor
Two of the most frequently used reactors in the hydroprocessing
industries are fluidized bed and trickle bed reactors. In a fluidized

24
bed reactor, the catalyst particles stay in motion and the liquid and
gas phases flow cocurrently upward while chemical reactions take place.
In a fluidized bed reactor, the catalyst particles must be of very
small size to remain in suspension. In a trickle bed reactor, the
liquid phase flows downward through a fixed bed of catalyst particles
and the gas phase may be flowing upward or downward. (The downward
flow of both fluid and gas occurs most frequently.)
Both of these reactor types have their advantages and disadvan
tages. Some of the advantages of the fluidized bed reactors include
good temperature control, convenient heat recovery, easier removal and
replacement of short lived catalysts, and a significantly high rate of
reaction per unit volume of catalyst for highly reactive catalysts
(23). The disadvantages of the fluidized bed reactors include lower
degree of conversion per pass because of the residence time distribu
tion patterns approaching a continuous stirred tank reactor,
difficulties in separation of the catalyst particles from the reaction
products, and relative.ly greater chances of the occurrence of
homogeneous side reactions. The advantages of trickle bed reactors
consist of easier separation of the catalyst particles and the reaction
products and higher conversion per pass due to the residence time
distribution patterns approaching the plug flow'reactors. The major
disadvantage of the trickle bed reactor is the temperature control.
Additionally, the factors that weigh heavily in favor of the trickle
bed reactor arc the easier construction and lower cost of operation
than that of the fluidized bed reactor. The trickle bed reactor is the
most frequently used reactor in the petroleum industry for
hydroprocessing (24).

25
In spite of the extensive application of the trickle bed reactor
for hydroprocesslng, virtually no fundamental research has been
published on the chemical aspects of its operation. This, in part,
may be because of the operating complexities involved in the handling
of three phases. Some nonconclusive inferences have been made from the
experimental data that has been published, but none of these address
the high pressure and high temperature operations in the HDS reactions.
Backmixing in Trickle Bed Reactor
The trickle bed reactor is designed on the assumption that the
liquid flow through the packed bed is a plug flow. The plug flow
condition is the ideal flow pattern for these catalytic reactors.
Deviation from plug flow conditions requires additional reactor volume
to attain the same level of chemical reaction at identical process
conditions. Complete backmixing is the maximum nonideality from the
plug flow condition. The disturbances at the entrance and exit of the
packed bed reactor create liquid distribution problems. Several
researchers attempted to establish a "critical" or a minimum packed
column height to diameter (L/D) ratio above which any deviation from
the plug flow conditions is negligible. The pioneering work on this
subject was done by Partington and Parker (25) in 1919. They
recommended that the L/D ratio should be at least 5 for adequate
liquid distribution. The results of the subsequent work on the subject
of backmixing by Scott (26) in 1935 demonstrated that the L/D ratio
ought to be above 25 to limit the liquid distribution problems to a
negligible level. Most of the early work on the trickle bed reactors,
to include that of Scott, was performed with air and water systems.

26
While analyzing his results, Scott also observed that the critical L/D
ratio lie somewhere between 10 and 20, depending upon the size of the
packings used. Scott did not correlate the critical ratio to the pack
ing size. The studies of Baker, Chilton, and Vernon (27) confirmed
Scott's observation of a critical L/D ratio above 10 for adequate
liquid distribution. The later studies on liquid backmixing attempted
to incorporate particle diameter. The investigation by Schwartz and
Smith (28) in 1953 revealed that the tube diameter to particle diameter
ratio (Dt/dp) should be above 30 to significantly limit the liquid
distribution problems. The works by Schiesser and Lapidus (29) on air
water system and by Glaser and Lichtenstein (30) on brine-air and
kerosene-hydrogen systems suggested that the Dt/dp ratio must be above
16 to avoid significant deviation from plug flow conditions. All the
above information does give a general idea of ways to avoid deviation
from plug flow conditions, but the conclusions are still very vague.
During the last fifteen years, a more exact mathematical model of
liquid distribution has been developed.
Initially, the concept was to include the physical properties of
the fluids. Two of the most frequently used non-dimensional numbers
are Reynolds number (dpUp/~) and Peclet number (dpU/E) where dp is the
particle diameter, U is the liquid linear velocity, p is the liquid
density, E is the dispersion coefficient, and~ is the liquid viscos
ity. M1ile reviewing the work of Wilhelm (31), Satterfield (32)
observed that the radial dispersion approaches a constant value above
the liquid Reynolds number of 100, and the axial dispersion approaches
a steady value above the liquid Reynolds number of 10. Examination of
the definition of the Reynolds number indicates that, with other items

27
remaining constant, the Reynolds number rises as the liquid velocity
increases. And therefore, as the liquid velocity ultimately increases
the Reynolds number beyond 10 (or 100, as the case may be), the axial
or radial dispersions make no significant contributions to the fluid
. flow situation.
Schwartz and Roberts (33) evaluated some Qf the most recent models
·representing the liquid flow in trickle bed reactors. The summary
included a "dispersion" model of Levenspiel and Smith (34), which
requires only one adjustable parameter to describe the deviation from
plug flow. The other models developed.tend to lean towards more exact
mathematical modeling of residence time distribution (RTD) of the
liquid phase, such as the "modified mixing-cell" model by Dean (35),
the "crossflow" model by Hoogendoorn and Lips (36), and the "time
delay" model by Buffham, et al. (37). All three of these models
require two adjustable parameters to describe the liquid flow situa
tions. A fourth model by Van Swaaij, et al. (38), requires three
adjustable parameters. Schwartz and Roberts observed that the math
ematical and experimental efforts required to estimate two parameters
from the measured RTD data are greater than those required for the
one parameter dispersion model. Moreover, correlations such as Furzer
and Mitchell (39), Hochman and Effron (40), and Sater and Levenspiel
(41), are readily available for estimating the axial Peclet number,
but only one attempt has been made to develop general correlation for
a two parameter model (40). All the above models were put to test by
Schwartz and Roberts (33) for a first order reaction. They concluded
that the simple dispersion model adequately represents the liquid flow

28
situation. However, it should be emphasized that the two-parameter
models do offer a closer fit of the experimental RTD curves than the
one-parameter dispersion model. They also suggested that in most
laboratory trickle bed reactors, except for those that are very small,
liqu.id backmixing is not of major significance.
The most effective model expressing the reactor design limitations
to restrict the deviation from plug flow situation is proposed by Mears
(42), (43). This model postulates that for the reactor length to be
increased no more than 5% due to the axial dispersion effects over a
minimum length required with plug flow, the criteria to be met is as
shown in Equation (2.1).
L > dp
20 n x ln (C·/C ) Pe 1 f m (2. 1)
where L/dp is the ratio of the reactor length to the particle diameter,
n .is the order of reaction, Pem is the liquid Peclet number and Ci/Cf
represents the ratio of reactant concentrations entering and leaving the
reactor. The most significant contribution of Mears' work is that a
portion of the investigation was applied to a bench scale hydroproc-
cssing unit. The reactor operating conditions for the work were almost
identical to the operating conditions selected for the HDS reactions,
such as 700 F (371 C), 1,500 psig and a liquid volume hourly space
velocity of 2.0 per hour. The minimum L/dp estimated by Mears was 350.
Mears' model also suggests that, for frequently occurring reaction
conditions and most general length of a foot for reactor, the deviation
from plug flow condition would be negligible for conversion roughly
less than 90%.

29
The operation of a commercial reactor may be considerably differ
ent from a laboratory reactor. Because of the larger dimensions in the
commercial units, the inability of the reactor to achieve the expected
conversions may have nothing to do with the mass transfer effects or
catalyst activjty caused by increased liquid distribution problems.
Most of the deviation from the plug flow situations could be avoided
by adequate design and operation of the trickle bed reactor.
Catalyst Wetting and Mass Transfer Effects
The multiple reactant and product phases in the HDS reactions
provide a very complex mass transfer situation. In the three phase
situation that occurs in HDS reactions, there are several stages of
mass transfer that can affect the rate of the overall reaction. These
mass transfer stages are: (a) diffusion of the reactants in the gas
and liquid bulk phases to the liquid film surrounding the catalyst
pellet; (b) diffusion of the reactants to the cat~lyst surface;
(c) diffusion of the reactants through the catalyst pores to the
active sites; (d) adsorption of the reactants on the active sites;
(e) chemical reaction between the reactive molecules on the catalyst
surface; (f) desorption of product molecules from the active sites;
(g) diffusion of the products through the catalyst pores; (h) diffu
sion of the products through the liquid film surrounding the catalyst
pellet; and (i) the diffusion of products to the bulk gas and liquid
phases. Any one or a combination of the above can be rate controlling
steps. Because of the complexities involved in the three phase
reactions, the results of an experiment on mass transfer effects can
hardly be generalized for other systems. Occasionally, catalyst

30
wetting characteristics are incorporated in the mass transfer effects.
The catalyst wetting characteristics are discussed later in this
section. In a review of trickle bed reactors, Satterfield (23)
discussed the mass transfer effects, among other·aspects. He con
tended that the mass transfer phenomenon is a combination of two
processes, a diffusional process predominating in the direction normal
to the flow and a convective process predominating in the direction of
the flow. Satterfield explained that the mass transfer in a catalyst
bed occurs for a predominance of the particles. Several models
available to estimate the overall mass transfer coefficient, Kls• such
as stagnant film model, non-mixed model, mixed model, and a model from
penetration theory were compared by Satterfield (23) to hydrogen in an
a-methyl styrene system. The comparison of these four models, when
plotted for predicted K1s against the liquid flow rate, offered general
guidelines: (a) the predicted values of K1s by the non-mixed model and
the stagnant fjlm model were almost identical and may be used at low
liquid flow rates; (b) the model from penetration theory predicted
reasonable K1s values only when the liquid flow rates were above
0.7 cc/sec; and (c) the mixed model provided a better fit at high
liquid flow rates. A significant conclusion drawn from the comparison
of these models was that for a fixed average concentration in the bulk
liquid, the observed rate of reaction changed little with large varia
tions in the U quid flow rates, even if substantial mass transfer
limitations prevailed in the liquid film.
Satterfield (23) also presented the criteria to predict the
sensitivity of mass transfer through the liquid film. He stated that
the mass transfer through the liquid film will be significant only if

31
the following relationship exists,
(10 X dp/C*) X r X (1 - e) > Kls (2. 2)
where dp is the particle diameter, C* is the saturation concentration
of gas in liquid, :r is the rate of reaction, e is the void fraction,
and K15 is the overall mass transfer coefficient.
Another aspect of mass transfer in a trickle bed reactor is the
diffusion within the catalyst pores. Generally, these internal
diffusion limitations are expressed in terms of the catalyst effective-
ness factor, n, defined as the ratio of the observed rate of reaction
to the expected rate of reaction in the absence of any internal con-
centrution or temperature gradients. The methods to estimate n are
presented in reference (32) in detail. Satterfield (32) contends that,
for a first order chemical reaction, the internal diffusion would be
insignificant if the following inequality is true,
( dp/ 2) 2 X r X (1 - £ ) < 1 (2. 3)
0eff X Cs
where dp is the particle diameter, r is the rate of reaction, e is the
void fraction, Deff is the effective diffusion coefficient and Cs is
the reactant concentration at the catalyst surface. Deff is defined
as D x e j-r: where D is the diffusi vi ty, a is the catalyst void fraction,
and 1 is the tortuosity factor. The value oft falls between 2 and 7,
usually taking a value of 4. In one of the experiments by Ma (44), the
estimated value of T for hydrogen in an a-methyl styrene system was
3.9. The reported estimates of the effectiveness factor range from
0.36 to 0.8 for different systems. Van Deemter (45) used 0.5 em
diameter CoO/Mo03/Al203 particles in an industrial desulfurizer and
calculated an effectiveness factor of 0.36. Adlington and Thompson (46)

32
reported an effectiveness factor of 0.6 for the same catalyst of
different size (0.32 em pellets) in another dcsulfurizer. At the same
time, Van Zoonen and Douwes (47) reported the results of their work on
the liDS. They concluded that the effectiveness factor varied from 0.5
to 0.8 on 3 x 3 mm pelleted catalyst by merely changing their densi-
ties. No quantitative measurement of large solute molecule size versus
pore size is available. Qualitatively, it is inferred that the rate of
diffusion within the pores becomes less than expected because of the
shorter distance between the molecules and the pore walls.
Other aspects of the mass transfer reported to be affecting the
reaction kinetics are the liquid holdup an~ catalyst wetting. Based
on various data on hydroprocessing, Henry and Gilbert (48) concluded
that the catalyst activity was proportional to the liquid holdup, which
-2/3 1/3 in turn was proportional to dp and v where v =\liP· Therefore,
they derived a correlation to express the catalyst activity as shown
in Equation (2.4),
m (Ci/Cf) a: Ll/ 3 X (LHSV)-2/3 X d -2/3 p
X V 1/3 (2.4)
A close scrutiny of this correlation reveals that the catalyst activity
will increase as the particle diameter decreases, which is contrary to
the findings of many other researchers. But, in a recent study on the
reduction of crotonaldehyde over a palladium catalyst, Sedriks and Kenney
(49) observed that the prewetting of the catalyst bed caused substan-
tially different behavior than if the catalyst bed was initially dry.
Therefore, based on this and similar observations, Mears (43) suggested
that, instead of the liquid holdup, the catalyst activity was propor-
tional to the fraction of the outside catalyst surface which was
effectively wetted by the fresh batch of the flowing liquid. Several

33
investigators have reported that the wetted area of the catalyst bed
at moderate liquid flow rates is proportional to the 0.25 to 0.4 power
of the mass velocity. A recent study by Puranik and Vogelpohl (50)
indicated the wetted area to be proportional to 0.32 power of the
liquid velocity. Mears included above results and the effectiveness
factor to express the catalyst activity as shown in Equation (2.5),
0.32 . -0.68 0.18 -0.05 0.21 (2 5) ln(Ci/Cf) ~ L x(LHSV) xdp xv x{ac!a) xn ·
where oc/o relates to the surface tension properties of the liquid
phase.
After analyzing all the information concerning the rise in activi-
ty as the wetted area and liquid holdup increased, Sylvester and
Pitayagulasarn (51) investigated the effect of the diffusion coeffi-
cient on the behavior of conversion and catalyst wetting. The results
of their study demonstrated that Mears' concept of direct
proportionality is true for a non-volatile liquid phase. However,
the gas phase to liquid phase diffusivity ratio of the reactants
determines the effects of catalyst wetting for a volatile ~iquid
phase. Sylvester and Pitayagulasarn illustrated that the reaction rate
is directly proportional to catalyst wetting for higher gas phase to
liquid phase diffusion ratio of the reactants. Conversely, the
reaction rate is inversely proportional to catalyst wetting for lower
gas phase to Equid phase ratio of the reactant. Thus, it can be
seen that the present status of the reported information on mass
transfer in the heterogeneous systems is rather confusing, primarily
because of the complexities of the system itself. Additionally,
Satterfield (2}) contended that the mass transfer through the liquid
film did not appear to be of significant resistance under normal HDS

34
conditions.
Hydrogen Rate Effects
The results of most of the HDS investigations generally give
greater emphasis to aspects other than the hydrogen flow rate. Very
few really attempt to study the effects of hydrogen flow rates on the
activity of an HDS catalyst. Since hydrogen is one of the reactants
for HDS reactions, the hydrogen flow rates are certainly included in
almost all the related reports. The hydrogen flow rates used in the
HDS studies have ranged from 250 standard cubic feet (scf)/barrel (Bbl)
of feed oil to 39,800 scf/Bbl. Wan (52) studied hydrogen flow rates
of 3,980 scf/Bbl and 39,800 scf/Bbl of a raw anthracene oil and con
cluded that the variations in hydrogen flow rates, within the range
tested, had insignificant effect on the desulfurization ability of the
catalyst. The efforts of Jones and Friedman (53) concerning the Char
Oil Energy Development project included work in trickle bed reactors
at hydrogen flow rates of 5,700 scf/Bbl and 13,500 scf/Bbl of the feed
stock. The results of their work did not demonstrate any difference
in the HDS activity of the catalyst at identical operating conditions.
Other hydrogen feed rates reported include 1,260 scf/Bbl of feed for
gasoline desulfurization by Byrns, et al. (54), 1,500 scf/Bbl to 4,500
scf/Bbl by Gwin and coworkers (55) in the hydrogenation of asphalt,
3,000 scf/Bbl of feed rate by Berg (56) for the desulfurization of gas,
approximately 90% hydrogen by Stevenson and Heinemann (57), and up to
6,000 scf/Bbl of feed used by Frost and Cottingham (58). Gregoli and
Hartos (59) conducted experiments on a number of feedstocks with the
sulfur concentration ranging from 3.2% to 5.4% by weight. The

consumption rate of hydrogen changed extensively depending upon the
sulfur content in the feedstock as well as the product oil. Gregoli
and Hartos reported that the hydrogen consumption rate varied from
400 scf/Bbl for Venezuelan atmospheric residual to almost 1,000
scf/Bbl for Khafji vacuum residual.
All the above experiements tend to emphasize that, within the
range of hydrogen flow rates used, there was no measurable effect of
changing the hydrogen flow rate on the rate of the HDS reaction. But
the above mentioned findings can be partially explained by inspecting
the rate of hydrogen consumption. Frost and Cottingham (58) reported
the hydrogen consumption rates during the HDS of petroleum residuum
ranging from 200 to 700 scf/Bbl, with higher consumption rates
occurring at the most severe reaction conditions of 600 F (314 C) and
800 psig. Schmid (60) recorded the hydrogen usage rate ranging from
290 to 730 scf/Bbl feed, with maximum consumption rate at the most
severe reaction conditions. Sooter (61) outlined different areas of
the hydrogen consumptions which include sulfur removal (formation of
HzS), nitrogen removal (formation of NH3), oxygen removal (formation
35
of HzO), gas making, and hydrocracking. Considering all these factors,
Sooter estimated the average hydrogen consumption rate as 450 scf/Bbl
feed with some 493 scf/Bbl feed at the most severe reaction conditions.
With the hydrogen consumption rates in mind, it is evident that the
effects of hydrogen flow rate would be noticeable when the flow rate
would be less than the rate of its consumption. That is exactly what
was observed by Hoog and his coworkers (62). During the experiments
of desulfurization of petroleum oils, Hoog and his colleagues observed
a slight effect on the HDS reactions of the hydrogen flow rates between

36
250 scf/Bbl and 1,500 scf/Bbl feed and no measurable effect beyond
1,500 scf/Bbl·feed. This gives a lead value of 1,500 scf/Bbl feed for
the hydrogen flow rate, which may be changed according to the estimates
of the hydrogen consumption rates. The hydrogen flow rate of three
times the rate of its consumption may be more than adequate for the HDS
experiments.
Temperature Effects
The reaction temperature is one of the most frequently investi
gated operating variables in the desulfurization of the coal derived
liquids and the petroleum residua. The three different criteria for
which the temperature effects are studies are rate of reaction,
activation energy of the HDS reaction, and catalyst life and stability.
Numerous investigations have reported that the rate of the HDS reaction
increases with an increase in the reaction temperature (52), (61), (63),
(64), (65), (66), However, there is a wide spectrum of values reported
for the activation energy ranging from 6,800 Btu/mole (3.8 Kcal/mole)
to 101,200 Btu/mole (56.2 Kcal/mole) (56), (67). Even then, most of
the reports have the activation energy ranging from 43,200 Btu/mole
(23 Kcal/mole) to 61,200 Btu/mole (34 Kcal/mole) (58), (60), (68), (69).
In a more recent work, Sooter (61) estimated the activation energies
of an HDS reaction to be 80,370 Btu/mole (44.65 Kcal/mole) and 9,720
Btu/mole (5.4 Kcal/mole) for "slow" and "fast" reacting molecules,
respectively. (The terms "slow" and "fast" refer to the sulfur con
taining molecules found in the heavy and light distillation fractions
of the feed.) The diversity in the reported values of the activation
energies of the HDS reactions may be attributed to the fact that these

37
experiments were conducted: (1) on a variety of feedstocks; (2) with
different catalysts; (3) under different experimental conditions; and
(4) with many liDS kinetic models, ranging from the simple first order,
pseudo-second order, to the third order. For heavy petroleum feed
stocks, the initial desulfurization reaction is chemically controlled.
As the temperature increases, however, a suspected deviation in the
reaction mechanism diverts the reaction to a diffusion controlled.
Many of the petroleum feedstocks contain a relatively high con
centration of metals. Because of this high metal content, the catalyst
activity tends to deviate due to the pore plugging phenomena (70),
(71). Therefore, the reaction temperature is raised to such a degree
that the rate of reaction will increase just enough to balance the
deactivation due to pore plugging. The active life of a catalyst can
then be improved considerably.
Normally, the HDS reactions are exothermic. These reactions,
when conducted in the trickle bed reactors, could create a rather
unstable temperature condition (72), (73). Although the overall
reactor temperature may be stable, there can be significant inter
phase temperature. variations that include momentary temperature
runaways and hot spots. These unstabilities, though predictable, can
make a significant impact on the rate of an HDS reaction.
Pressure Effects
The research of pressure effects is as diversified as that of
temperature. Unlike temperature, the course of the pressure effect is
not unanimous, since different investigators may vary the pressure
ranges they are studying. There may also be a variety of feedstocks

38
and experimental conditions involved that can make a difference in the
ultimate results. Hoog (62), working on a shale oil at 750 F (399 C)
and pressure ranging from 735 psia to 2,200 psia, observed a slight
increase in the extent of sulfur removal with increasing pressure.
Schmid (60), on the other hand, experimenting on a petroleum vacuum in
a trickle bed reactor, noticed a dramatic improvement in the sulfur
removal for pressure increase up to about 1,000 psia. While studying
the HDS of a coal derived liquid at 725 F (385 C), Jones and Friedman
(53) did not observe any significant change in the rate of sulfur re
moval reaction in pressure range of 2,000 to 3,000 psia. Qader and
Hill (64) demonstrated a trend of increasing sulfur removal with
increase in pressure only up to 1,500 psia. Wan (52) and Sooter (61)
used the same feedstock as the one used in this latter research. Wan
worked within the pressure range of 1,000 psig to 2,500 psig and
reported no significant increase in the sulfur removal with rise in
reactor pressure. Sooter worked at pressures between 500 psig and
1,500 psig. His results demonstrate a substantial improvement in the
sulfur removal for pressure increase from 500 psig to 1,000 psig, but
hardly any increase after that. Combining these observarions, it
appears that 1,000 psig is a limiting pressure. Below this level, an
increase in the reaction pressure is acknowledged by an increase in
the sulfur removal. Above 1,000 psig, the effect of changing pressure
almost subsides.

Effects of Space Time and Kinetics
of HDS Reaction
The effects of temperature and space time are established to
follow an identical trend in the desulfurization of oil. Like
temperature, both space time and sulfur removal decrease or increase
correspondingly. These variations irt the sulfur removal with respect
to space time are generally attempted to fit a kinetic model. The
numerous kinetic models reported to represent the desulfurization
process vary significantly from pseudo-first order model (61), (74),
(75), (76), (77), second order kinetic models (60), (78), (79), (80),
(81), (82), pseudo-second order kinetic models (83), (84), (85) and
up to a third order kinetic model (58). A more recent concept in
explaning the desulfurization process is to derive reaction rate
models for each sulfur containing compound in the feedstock (86).
The diversity in the kinetic models and the subsequent confusion may
be clarified following a study of the above mentioned articles.
Hoog (87) appears to have done the pioneering work in attempting
to explain desulfurization in the trickle bed reactors. His data on
the wide range of boiling distillates did not fit a first order rate
model. But his similar data on the narrow range boiling distillates
did fit the first order kinetic model. Hoog tried to describe that
39
the higher molecular weight sulfur containing compounds may be shielded
from the hydrogen atoms by the hydrocarbon groups. In other words, the
possibility exists that different sulfur containing compounds may be
following different reaction rates.

40
The various types of sulfur containing compounds in the feedstock
are certainly very difficult to identify. However, work has been done
to separate the sulfur containing compounds into different groups.
These groups are listed later in this section. Cecil, et al. (74)
worked on a Middle Eastern residuum at different hydrogen partial
pressures and space velocities. They divided the sulfur containing
compounds in the feedstock into reactive and nonreactive fractions.
The data from their experiments showed that each of these fractions
followed a first order kinetic reaction whereas the overall order of
reaction turned out to be of the second order. Working along similar
lines, Sooter (61) tried successfully to fit his data to a two parallel I
first order reaction model. The fractions of the feedstock were termed
as low boiling fraction and high boiling fraction. However, the data
' '
fit the overall second, third or fourth order reaction rate models
equally well. Sooter explained that the surface adsorption and
desorption of the sulfur containing compounds in the higher boiling
fractions could be the limiting step in the desulfurization process.
Yitzhaki and Aharoni (75) studied the HDS of gas oil over
Co-Mo-Alumina catalyst bed at 450-700 psig pressure and 662 F (350 C).
They fractionated the feedstock and product at temperature intervals
of 38 F (20 C) and analyzed each fraction for its sulfur content. The
results indicated that the HDS reaction for the corresponding fractions
in feedstock and product follow first order rate models. Qader, Wiser
and Hill (76) investigated the HDS of low temperature coal tar at
varying operating conditions. The authors demonstrated that the over-
all HDS reaction followed a first order rate model with respect to
sulfur concentrations. The authors went on to mention that, if hydrogen

41
concentration were considered, the HDS would be a pseudo-first order
reaction. Aboul-Gheit and Abdou (77) also demonstrated that the
results from the HDS study of an Egyptian crude oil best fit a pseudo
first order rate model.
Yergey et al. (86) worked extensively on the sulfur containing
compounds in coal. These sulfur containing compounds are likely to
eventually appear in the coal derived liquids. The sulfur containing
compounds in 10 different coals were sub-divided into eight groups,
such as Organic I, Organic II, Pyrite, Sulfide, Organic III, Sulfur
with Fe, Sulfur with C, and Sulfur with CaO. Their kinetic data
presented a mixed bag of orders of reactions. The sulfur containing
compounds in Organic I, Organic II and Pyrite group followed one-half
order. The remaining groups followed first order, except for Organic
III, which followed a second order reaction rate model. This represents
that each and every sulfur containing compound in a feedstock may be
following its own reaction rate. Therefore, the overall rate of the
HDS reaction can vary depending upon the concentrations of various
sulfur containing compounds in the feedstock.
The second order kinetic models have been reported to be
successfully fit to data by Schmid and Beuther (60) and Massagutov, et
al. (88). While working on a petroleum vacuum distillate from a crude
oil, Massagutov and coworkers demonstrated that the activation energy
of the desulfurization reaction dropped dramatically from 60,000
Btu/mole (33 Kcal/mole) to 9,500 Btu/mole (5.3 Kcal/mole) with an
increase in reaction temperature from 662 F (350 C) to 806 F (430 C).
This observation helped them to conclude that diffusion must be playing
a significant role at the higher reaction temperatures. To substantiate

42
the claim of the diffusion control, they further demonstrated that the
rate of desulfurization reaction increases more than four-fold with a
decrease in the catalyst particle size from 5/64 inch to 1.25/64 inch
(0.2 em to 0.05 em). The experiments by Schmid and Beuther (60),
besides showing a second order fit of the data, also showed that the
removal of higher boiling fractions (such as asphaltenes) from the
feedstocks increased the rate of desulfurization reaction almost
four-fold. Schmid and Beuther also attempted to incorporate the
effects of catalyst surface area, pore radius, and pore volume in the
kinetic model.
The HDS of specific sulfur containing compounds, such as thiophene,
benzothiophene and dibenzothiophene, have been investigated by Lee and
Butt (78), Hargreaves and Ross (79) and Bartsch and Tanielian (80).
Lee and Butt stud.ied the kinetics of the HDS of thiophene. on a
representative Co-Mo-Alumina catalyst. Their kinetic results fit a
second order rate model. The HDS reaction was first order with respect
to each of the reactants, thiophene and hydrogen, and the reaction was
shown to be inhibited by the presence of thiophene and H2S. The
investigation by Hargreaves and Ross (79) was directed towards the
mechanism of the HDS of thiophene over several sulphided Co-Mo..:.Alumina
catalysts. The overall kinetic results were successfully fit to a
second order rate model. From the results of the HDS tests on several
catalysts, Hargreaves and Ross observed that the catalyst activity
increased over four-fold with an increase in the Co-Mo atomic ratio
from 0.29 to 0.81 at 11% by weight of Mo. Bartsch and Tanielian (80)
examined the HDS of benzothiophene and dibenzothi9phene. The overall
kinetic data were successfully fit to a second order reaction rate

model. Bartsch and Tanielian reported the activation energies of the
liDS of bcnzothiophene ranging from 8,820 to 25,200 Btu/mole (4.9 to
14.0 Kcal/molc) and the HDS of dibenzothiophene ranging from 9,540 to
25,400 Btu/mole (5.3 to 14.1 Kcal/mole), respectively.
Bruijn (81) tested the HDS of vacuum gas oil from Kuwait in a
bench scale and a pilot scale plant. Bruijn also tested the effect
43
of diluting the packed bed, in which, the packed bed of large catalyst
particles was mixed with smaller inert particles to improve the liquid
distribution patterns. Most of the HDS activity data sets were shown
to fit rate models ranging in order from 1 to 2 and averaging 1.65.
Bruijn also found that the catalyst activity improved about SO% at
680 F (360 C) because of the dilution of the packed bed. Marooka and
Hamrin (82) studied, in separate experiments, the HDS of thiophene
over Nalco 471 catalyst and low temperature ashes. The activity data
successfully fit a second order rate model. The activation energies
of the liDS reaction were estimated to range from 17,100 to 36,000
Btu/mole (9.5 to 20.0 Kcal/mole) for Nalco 471 catalyst, and from
18,000 to 19,800 Btu/mole (10 to 11 Kcal/mole) for the low temperature
ashes, respectively.
Johnson, et al. (84) investigated the desulfurization mechanism
of a Kuwait feed. When blanketing all the sulfur containing compounds
in a single group, the experimental data fit a second order reaction
rate model more closely than any other model. The grouping of all
the sulfur containing compounds was probably what prompted them to call
it a pseudo-second order reaction. The flexibility of the H-oil process
is that additional desulfurization stages can be included for feedstocks
that are difficult to desulfurize. The experiments by Johnson, et al.

44
were conducted on Kuwait feed at temperatures ranging from 700 F
(371 C) to 800 F (427 C). Hisamitsu and coworkers (85) studied the
HDS of two heavy distillates in a trickle bed reactor over a com
mercially available Co~Mo-Alumina catalyst. The data from the tests
on both the feedstocks fit different rate models at different reaction
temperatures. For both the feedstocks, the data obtained at 644 F
(340 C), 680 F (360 C), and 716 F (380 C) fit 2.1, 1.8, and 1.6 order
of reaction rate models, respectively.
In addition to all these, there are reports that describe a third
order fit of the kinetic data. Frost and Cottingham (58) conducted a
series of experiments on a residual fuel. Their results showed
different kinetic model fit to data at different reaction temperatures,
such as, pseudo-third order fit at 600 F (314 C), pseudo-second order
at 740 F (393 C), and almost first order at 800 F (427 C). Sooter (61)
also found his data to fit second, third, and fourth order kinetic
models equally.
Very limited attempts have been made to represent the HDS reaction
mechanism, and even fewer have verified any of the proposed paths. One
of the two reaction networks is by Owens and Amberg (89), which
desulfurizes thiophene. Satterfield and Roberts (90) used commercial
cobalt-molybdate catalyst (3% Co and 7% Mo) with reaction conditions
of slightly above atmospheric pressure and the reaction temperature
falling between 508 F (264 C) and 538 F (281 C). Their results were
consistent w-ith Owens-Amberg network. The other reaction network is
by Givens and Venuto (91), which starts from benzothiophene. They
show four different paths to be followed in the reaction and, not
surprisingly, hardly any of these are well established paths.

Even with all these diversified kinetic models, certain things
can be derived very clearly. Individual sulfur containing compounds
can be said to follow a first order reaction model and that the
overall HDS reaction can follow varied rate models, .depending upon
the reaction temperature and the concentrations of the various sulfur
containing compounds.
Organic Sulfur Containing Compounds in Feedstocks
The studies of desulfurization have been conducted by different
investigators. Invariably, the feedstocks used for study have also
been different. But, since recent reports state that the rate of the
HDS reaction depends more on the type of sulfur containing compound
than any other factor, a thorough knowledge of the sulfur containing
compounds present in all of these feedstocks is necessary. A few of
the investigators have tried to isolate and identify the sulfur con
taining compounds in oils using high resolution mass spectrometry.
The most complete and thorough identification work has been published
by the U. S. Bureau of Mines (92). This report identified about 200
sulfur containing.compounds in petroleum feedstocks. The primary
building blocks of most of these sulfur containing compounds are
sulfides and dibenzothiophenes. Akhtar and his coworkers (93)
attempted to identify the sulfur containing compounds in two of the
coal derived liquids. These are identified in Table V. Their
desulfurization experiments revealed that dibenzothiophenes were the
most difficult to decompose, followed by benzothiophenes and
naphthobenzothiophenes. Greenwood (94), using mass spectrometry,
attempted to isolate organic and organo-metallic compounds in the
45

46
TABLE V
ORGANIC SULFUR CONTAINING COMPOUNDS IN COAL DERIVED LIQUIDS
Coal Derived Molecular Liquid m/e* Formula Identification
Light oil 134 C3H6S Benzothiophene
98 CsH6S Methyl thiophene
114 C6H10S Diallylsul fide
148 C9H8S Methylbenzothiophene
162 ClOHlOS Dimethylbenzothiophene
Heavy oil 98 CsH6S Methyl thiophene
138 C8H10S Tetrahydrobenzothiophene
174 CllHloS Benzyl thiophene
184 Cl2H8S Dibenzothiophene
198 C13H10S Methyldibenzothiophene
208 Cl4H8S Benzo(def)dibenzothiophene
234 Cl6HlOS Naphthobenzothiophene
248 C17H12S' Methylnaphthobenzothiophene
284 C20Hl2S Dinaphthothiophene
298 C21Hl4S Methyldinaphthothiophene
*equivalent molecular weight

feedstock of the present study, anthracene oil. Among other numerous
compunds, Greenwood identified the presence of benzothiophene,
dibenzothiophene and naphthobenzothiophene in the anthracene ,oil.
Dibenzothiophene was shown to be the most frequently occurring sulfur
containing compound in the anthracene oil. In their-·work on Kuwait
47
gas oil and Venezuelan gas oil, Jewell, et al. (95) isolated
benzothiophenes, dibenzothiophenes, and naphthobenzothiophenes. Many
other researchers have identified these three sulfur containing
compounds in their work on different feedstocks. Hammer (96) reported
that the major sulfur containing compounds in shale oil gasoline were
thiophenes. Similarly, the work done by Qader, Wiser and Hill (76)
indicated that the single most frequent fundamental structure of sulfur
containing compounds found in coal tar was dibenzothiophene. Wilson,
et al. (67) worked with dibenzothiophene in naphtha for their
desulfurization studies. Thus, in spite of the diversity in the feed
stocks, very few of the sulfur containing compounds are present, in a
measurable quantity, in all of the feedstocks put together. This
represents a thin similarity among different desulfurization studies.
However, it must not be overlooked that even within the small group of
sulfur containing compounds, the rate of reaction is likely to vary
appreciably, depending upon the operating conditions.
Selection of Catalysts
There are many catalysts acc;:elerating various chemical reactions.
Checking each one of them for hydroprocessing would become too time
consuming and expensive. In this fast and ever changing world, the
industry can not wait for decades for the results from the research

48
on all the available catalysts. Thus, the selection of the right type
of catalysts for the research purpose is a very important aspect of
an investigation.
Sinfelt (97) summarized the influence of a closely related group
of substances which catalyze different heterogeneous reactions.
Although the factors determining the catalytic specificity were not
well understood for the heterogeneous reactions, the patterns of
variations in the catalytic behavior from one substance to another
were very well established. His review considered such patterns of
variations in the catalyst behavior for hydrogenation, hydrogenolysis,
isomerization, and many other types of reactions.
The hydrogenation reactions reviewed in detail by Sinfelt (97)
were hydrogenations of ethylene, benzene and acetylene. The results
from these and other reactions revealed that the substances in Group
VIII of the Periodic Chart such as rhodium, cobalt, nickel, platinum,
ruthenium, and palladium were relatively more reactive than substances
in the other groups. The higher activity of Group VI II substances
may be explained in terms of the strength of the adsorption of the
reactants on the catalyst surface. However, Sinfelt also mentioned
that the substances in Group VA and VIA such as tantalum, chromium,
molybdenum, and tungsten, have strong adsorption bonds between the
reactants and the catalyst surface.
One of the most thorough and extensive catalyst evaluation
studies was conducted at the Bureau of Mines by Kawa and his coworkers
(98). In their experimental study, they tested 85 different combina
tions of catalysts and supports for the HDS and liquefaction of coal.
The comparison of the activity for liquefaction and desulfurization

49
revealed that a high-surface area silica-promoted catalyst containing
2.4% and 10% Mo on alumina support performed best in the batch study.
From the catalysts with simple components of Mo, Sn, Ni, Co or Fe, the
catalysts with Mo were best for sulfur removal, whereas the catalysts
with Sn were best for coal to oil conversion. Their study also showed
that the sulfur removal rate appeared to increase with the high-surface
area catalysts.
Kushiyama and coworkers (99) studied the effects of chemical
composition of catalysts on the HDS of residual oil. Their results
illustrated that the HDS of Khafji residual oil increased with an
increase in the Co-Mo atom ratio at constant Mo concentration, and the
level of HDS was maximum at the Co-Mo atom ratio of 0.5-0.6:1,
regardless of Mo concentration. Parsons and Ternan (100) tested the
HDS activity of some supported binery metal oxide catalysts. One of
the metal oxides in all catalysts was Mo03. The secondary metal
oxides tested by Parsons and ternan were Ti, V, Cr, Mn, Fe, Co, Ni, Cu
and Zn. Their results showed that promotion with Co at 1:1 atomic
ratio increased the HDS activity more than any other promoter.
Trifiro and coworkers (101) studied the behavior of four com
ponent catalyst containing Mo and Co oxides support~d on alumina and
any one of the Fe, Zn, or Ga as a fourth component in the HDS study of
a Kuwait residual oil. All these catalysts were compared with the
activity of a commercially available Co-Mo-Alumina catalyst. Trifiro
and coworkers found that the commerical catalyst, which had 4% CoO
compared to 2% CoO in their catalysts, performed better than any other
for desulfurization.

50
All these studies of the catalyst components for desulfurization
indicate that Co and Mo probably have greater influence on the removal
of sulfur than the other components. Furthermore, higher catalyst
surface area tends to enhance desulfurization. These HDS studies also
indicate that diffusion of sulfur containing compounds through the
liquid interphases and the catalyst pores is probably the rate con
trolling step in the desulfurization reaction.
Effects of Catalyst Characteristics
The three catalyst characteristics studied after establishing the
chemical components of the catalyst are its pore size, surface area,
and the pellet size. Of these three, the catalyst pore size has
probably been the subject of greatest research. However, it should not
be overlooked that numerous flow characteristics are likely to change
with any changes in catalyst properties, and therefore, research
studies on an isolated catalyst characteristic is very difficult, if
not impossible. Sooter (61) extensively researched the literature on
the effects of catalyst pore size, and therefore, it is only summarized
in the following. Sooter presented a first order reaction model by
Van Zoonen and Douwes incorporating the pore size effects. The
desulfurization reactions were experimentally found to be anything
other than first order reactions and a more complex model reflecting
pore size effects may be desirable. Even then, the Van Zoonen and
Douwes model did give a general idea of how pore size and other physical
characteristics are related.
The experiments by Sooter (61) confirmed one of the well founded
effects of pore si~e, i. e., higher pore size catalyst removed more

51
sulfur containing compounds than the smaller pore size catalyst.
Sooter's experiments were conducted on anthracene oil and Co-Mo-Alumina
catalysts having pore radii ranging from 25 ~ to 33 ~- The larger pore
size catalysts help in dealing with larger sulfur containing organic
molecules. there are numerous U. S. patents which reflect similar
results. One of the patents (102) recommended 60 R as the most fre
quent radius (df) and a spread of at least 10 ~ for more frequent pore
radii (~d). The patent went on to suggest a pore distribution factor
(PD) of at least five was preferable, where PD was defined as
PD = (df) 2 x (~d) x 10-4 (2 .6)
These parameters are estimated from the pore distribution curves which
are obtained from the mercury penetration porosimeter experiments.
Other patents suggest the pore radius be distributed evenly from 0 to
120 ft. The literature on the pore size effects is abundant but almost
all of it falls in the general framework of what has been covered so
far in this section.
The catalyst surface area effects do not appear to be well
established. However, the experiments with changes in the surface
area, as well as some other catalyst characteristics, show that the
catalyst with higher surface area provides higher desulfurization and
vice versa. The experiments with changing catalyst pellet size
demonstrate that smaller pellet size improve the sulfur removal ability
of the catalyst, suggesting that the desulfurization reaction is a
diffustion controlled. But the experiments by Sooter (61) with catalyst
particle size changing from 8-10 mesh to 40-48 mesh did not make any
difference in the sulfur removal ability of the catalyst.

52
The results of the effects of the catalyst characteristics on
desulfurization reaction can be summarized very briefly. Large size
pores are necessary to desulfurize the large organometallic molecules.
In addition, wider pore size distribution is desirable than narrow
more frequent pore size.
ability to remove sulfur.
Increased catalyst surface-area improves its
The experiments with changing pellet size
indicate the desulfurization reaction to be diffusion controlled but
8-10 mesh appears to be the limiting smallest catalyst particle size.
Catalyst Aging Characteristics
The discussion so far has centered around the effects of various
reaction parameters on the activities of different catalysts to remove
sulfur from various feedstocks. All these activities are short lived
and mention very little of how long the catalyst will perform at that
level of activity. In other words, a possible deactivation of the
catalyst can hardly be judged from the results of experiments presented
thus far. The long term effects on the active life of the catalysts
are more important from the commercial standpoint.
Newson (103) developed a model to include several variables
affecting the catalyst deactivation. The model was later compared with
commercial data and showed reasonable agreement. Newson explained that
the organometallic constituents of the feedstock, primarily nickle,
vanadium, and iron containing compounds reacted with hydrogen sulfide
to form solid deposits of the metal sulfides. These metal particles
can be deposited inter or intra-particle. The intra-particle deposits
reduce the effective diffusivity of the catalyst particles by plugging
the catalyst pores. Other authors suggested the pore plugging phenomena

as the primary cause- for catalyst deactivation (84), (104), (105).
Richardson (104) also included the possibility of coke deposits to
explain the deactivation.
The catalyst deactivation model by Newson (103) incorporated the
effects of process conditions and catalyst characteristics. He suc
cessfully compared his model with experimental results. The process
variables studied by Newson were liquid hourly space velocity (LHSV),
percent desulfurization, and the reactor pressure. Only a rise in
LHSV from 0.5 per hour to 1.0 per hour increased the catalyst life
53
from 600 hours to 3,400 hours. Whereas, reducing desulfurization from
75% to 63% increased the catalyst life from 600 hours to about 1,500
hours. The effect of pressure was just the opposite. Reducing the
reactor pressure from 1,500 psig to 800 dropped the catalyst life from
800 hours to 400 hours. As for catalyst characteristics, changing pore
size distribution had very little effect on catalyst life as long as
the average pore diameter was same. Newson demonstrated that by
changing the average pore diameter from 40 R to 65 ~. he could increase
the catalyst life from 400 hours to 1,200 hours. Johnson and his co
workers (84) showed the effect of metallic content in the crude on the
catalyst life. Using a Venezuelan atmospheric residuum having 200 ppm
of vanadium, the weight percent sulfur in the product oil increased
from 0.37% to 1.4% in just 4.0 Bbl of oil per pound of catalyst (about
700 hours). Whereas, using the same feedstock with only 40 ppm of
vanadium, the weight percent sulfur in the product oil increased from
0.3% to only 0.5% in 9.0 Bbl of oil per pound of catalyst (about 1,600
hours).

54
There are two solutions that the hydroprocessing industry has
developed to handle catalyst deactivation. One solution is the off
shoot of the effect just explained - demetallization. The demetalliza
tion process reduces the metal content of the feedstock, thereby
increasing catalyst life. The other solution is to increase the inlet
temperature of the feedstock. Many publications demonstrate very
distinctly the effect of raising inlet temperature over a range of
operation of up to 40 months (70), (71), (106).
The survey of catalyst deactivation illustrates that the process
conditions play a significant role in determining catalyst life. The
LHSV and the metal content in the feedstock appear to have the most
dramatic effects on catalyst life.

CHAPTER III
EQUIPMENT SELECTION AND SET UP
The equipment for this study consisted primarily of a catalytic
reactor and a sulfur analyzer. The coal derived liquid was treated
with hydrogen in the catalytic reactor at the desired reaction con
ditions and the liquid products from the reactor were then examined
for their sulfur content in the analyzer. This chapter will explain
the selection of the type of reactor and related equipment and discuss
the set up of the experiment.
This project was basically an extension of the work started by
Sooter (61). The equipment set up designed and erected by Sooter,
with the necessary modifications, was employed in this project.
This explanation essentially justifies the type of equipment used
by Sooter, and its subsequent adaptation for this project. Most of
the emphasis on the equipment selection is devoted to the reactor
because of its prime importance.
Accurate and reliable laboratory data is, of course, necessary
for the design of an industrial reactor. Laboratory studies which
include both the design and construction of laboratory reactors
and other equipment items, and the subsequent experimental programs
are invariably expensive and time consuming. Therefore, the entire
reaction kinetic study must be carefully planned to minimize expenses
and time and to generate the most useful data possible. A primary
55

concern would be the selection of a suitable reactor for the kinetic
study.
56
The selection of the reactor type is clarified once the goals of
the study are appropriately defined. Generally, the experimental
catalyst work is divided into four major classes. These classes
include comparative performance testing, developing kinetics for the
reactor design, simulation of plant operation, and determining reaction
mechanism. The first three of these are comparatively simple. The
determination of reaction mechanism requires extensive research and is
highly complex. The investigation becomes more detailed when there are
simultaneous reactions coupled with heat and mass transfer effects.
Weekman (107), based on his industrial experience, developed a
concept of comparative suitability for a particular type of reator in
a given reaction. His concept is summarized in Table VI. The types
of reactors covered in Table VI demonstrate certain advantages and
disadvantages of the various operation encountered during an experi
mental study. The fixed bed, stirred-contained, and pulse type
reactors are most convenient for the sampling and analysis of products.
These types of reactors also offer least resistance in the separation
of the catalyst and the sample. But the temperature control in these
reactors becomes inadequate for highly exothermic or endothermic
reactions. Because of thorough mixing, the stirred type reactors and
the recirculating transport type reactors offer better tempera~ure
control, and also provide higher residence-contact time to catalysts
and reactants. Generally'· one addi tiona! i tern of equipment is required
for separating the catalyst and the product samples in these reactors.
The catalyst batch must be changed more frequently for a fast decaying

TABLE VI
COMPARATIVE REACTOR RATING FOR GAS-LIQUID, POWDERED CATALYST, AND NONDECAYING SYSTEM (107)
Reactor Type
Differential
Fixed bed
Stirred batch
Stirred-contained solids
Continuous stirred tank
Straight'-through transport
Recirculating transport
Pulse
ap = Poor F Fair G. Good
Sampling and Analysis
P-Fa
G
F
G
F
F-G
F-G
G
Residence- Selectivity Isothermality Contact Time Disguise-Decay
F-G F G
P-F F G
G G G
G F-G G
G F-G G
P-F F-G G
G G G
F-G p G
Construction Problems
G
G
G
F-G
P-F
F-G
P-F.
G

58
catalyst. The types of reactors offering better leverage against fast
decaying catalyst are the stirred tank and the transport type. The
relative ease of construction is also a significant factor in the
selection of a laboratory reactor. Because of the comparative sim
plicity in design, differential, fixed bed, stirred batch, and pulse
type reactors are relatively easier to construct. The information
presented here clearly indicates that some previous knowledge of the
reaction mechanism is necessary before Table VI can be of much value.
The experimental data from Sooter's (61) work suggested that the
HDS reaction is not highly exothermic. His research also indicated
that the catalyst was not a fast decaying type, especially within the
time duration of his experiments (up to 250 hours).
Some of the reactor types such as differential, stirred batch,
pulse would be eliminated at the first glance because these do not
reasonably simulate the industrial hydroprocessing plant operation.
The cost consideration and construction problems would tend to elimi
nate the rest of the reactor types except fixed bed. Isothermality
in the fixed bed reactor can be maintained by using a long and narrow
reactor with appropriate controls. Thus the'fixed bed type reactor
was selected for the proposed experimental program.
Oil and hydrogen were fed to the fixed bed reactor ftom the top
and were allowed to flow cocurrently downward. The fixed bed reactor
was packed with catalyst and inert particles. The HDS reaction
products were collected in the SS containers. The gaseous product
rates were measured and the gases were scrubbed with NaOH solution
prior to venting to the hood~ The liquid product samples were
periodically transferred to bottles for analysis.

Experimental Equipment
Reactor
The reactor used for the experimental study was a 1/2" 0. D.,
18 BWG, SS 316 tubing. The high quality steel was desirable to
withstand possible corrosion effects due to the presence of hydrogen
sulfide in the heterogeneous reaction mixture. The reaction itself
was conducted at elevated temperatures (up to 800 F or 427 C) and
elevated pressures (up to 1800 psig). The thickness of the reactor
walls must be above the safe limit to sustain the dual load of high
pressure and packing weight. Previous work by Wan (52) was conducted
in a reactor 20" in length. Of these 20", only 10 to 12" of the
reactor were actually available for the catalyst bed. The remainder
of the reactor length was packed with inert particles to minimize
59
any entrance or exit effects. The small reactor would have a larger
scaling factor when designing a pilot plant. A larger reactor,
capable of holding more catalyst and allowing higher liquid and gas
flow rates, was more desirable. The reactor length selected in this
project was 33". The reactor length surrounded by the heating blocks
was 28 to 29". The remainder was used for connections and supports.
This reactor could hold up to 20" of catalyst bed before encountering
possible entrance effects. Figure 6 illustrates the reactor and the
related measurements used in a typical experiment. The catalyst bed
contained a different Co-Mo-Alumina catalyst for each experiment. The
catalysts were received from the vendor and were crushed to desired
size and packed in the reactor. Details concerning the catalyst will
be presented in later chapters. The inert particles were berl saddles

Hydrogen
t "' ! I
I --t- I I
I 4" Inerts
I -t-- -1
I I
I 5"
I I
t-j Catalyst bed ' I
I
I !
10" I
Length of reactor I I
± I 33"
I
--1
5" !
+I Inerts ' i
4" I
+ _l
Figure 6. Trickle Bed Reactor and the Related Measurements
60
Oil

61
crushed to the same size as that of the catalyst particles. Initially,
a fine screen was placed at one end of the reactor. A thermowell
measuring 1/8" 0. D. and 4" longer than the reactor was connected to
the screen. Care was taken to ensure that the thermowell coincided
with the central axis of the reactor during packing. The reactor was
conveniently packed upside down. The reactor was tapped continuously
during packing to ensure settling. The packed bed was finally capped
with another fine screen to hold the packing in place. The parts list
for the reactor and other equipment items is tabulated at the end of
this chapter.
Reactor Heating System
The liDS reactions were conducted at elevated temperatures ranging
600 to 800 F (314 to 427C). The reactor was electrically heated to
maintain these high temperatures. Five separate heating blocks were
employed to achieve and maintain the reactor at the desire tempera
tures. The heaters were square aluminum blocks grooved to hold beaded
resistance wires. Different views of the heating block are shown in
Figure 7. The top view of all heating blocks is identical. Each was
a 4'' square with grooves of 5/8" depth and 3/16" width. These heating
blocks were of three different lengths. Two blocks were 4" long, two
blocks 5" long, and one block was 10" long. Greater heating control
was needed at the entrance and exit of the reactor as well as at the
beginning and end of the catalyst zone. The 10" block was then placed
in the middle, and the 5" and 4" blocks were placed on either sides.
There was a 1/2" diameter hole drilled through the center along t}J.e
length of each of the heating blocks to place the reactor. The heating

4"
1
0. 5''
T
Depth of Grooves = 5/8" Width of Grooves = 3/16"
~:: __ ---· 4 II -----~
(i) Top View of the Heating Block
~--r
u 1-
!I ,_I
I I- I-I I- r-1
~- I
I ~--,
r- 1-l ,_I -
I - r--1
I
I L
/
j ~
1-
I
I
/Grooves
/T I I
4", 5", or 10"
(ii) Side View of the Heating Block
Figure 7. Different Views of the Aluminum Heating Block
62

blocks were split through the center and hinged on one side for con
venient removal.
63
Beaded resistance wires were passed through the grooves of each
heating' block and were then connected to five different electrical
sources. The be.aded resistance wires used in this experimental study
were Marsh beeded heaters each having an output of 400 watts. The
electrical sources employed were of two types. One type was F & M
Scientific 240 temperature programmer supplied by Hewlett Packard, Inc.
The temperature programmers were capable of adjusting the heat load to
their corresponding reactor zone and maintaining the temperature in
that zone at a preset value. (Consult Hewlett Packard manual for
detail mechanism and operational procedure of the temperature pro-·
grarnmer (108)). The other type of heaters were manually operated
variacs. These'variacs were Powerstats, supplied by The Superior
Electric Co., and were capable of handling loads from 0 to 140 volts.
The central 10" heating block was generally connected to the tempera
ture programmer; the four smaller heating blocks were connected to the
variacs. The arrangement of the reactor heating system is illustrated
in Figure 8.
Reactor Insulation
The reactor and the heating blocks would reach high temperature
during the course of any experiment. To preclude heat loss and the
threat of personal injury, the heating blocks were insulated by layers
of asbestos and fiber glass. The asbestos layer was 1/2" thick and
was wrapped around the heaters in two pieces. Three to four metal
straps held the asbestos layers in place. The second insulation layer

Fiber Glass Insulation
Asbestos Belts
Figure 8.
1"
64
-Felt Insulation
.Asbestos Belts to ~Hold Insulation in Place
Heater Blocks
Heater Blocks Showing Insulation (61)

65
was 2" thick fiber glass. This, too, was wrapped around heaters in
two pieces and were held in place with the help of metal straps. The
heating blocks were also covered from top to bottom to minimize heat
loss. The insulation at the top of the reactor was critical since
the operator would be in this area during the measurement of the
reactor temperature.
Tenperature Measurement
An iron-constantan thermocouple was employed to measure the
reactor temperature. The thermocouple was about 36" long and slipp~d
into the thermowell resting along the central axis of the reactor.
The lead wires of the thermocouple were connected to a Numatron
numeric display. The Numatron was calibrated according to the pro
cedure explained in Leeds & Northrup manual (109) to read temperatures
from 0 F to 1000 F (-18 C to 538 C) with an interval of 0.1 F. In the
event of an emergency, such as digital readout malfunction during the
course of an experiment, the lead wires of the thermocouple were then
connected to a millivolt potentiometer. The potentiometer readings
would be in millivolts and those could be converted into F by using
the charts for respective thermocouples provided by the vendors (Leeds
& Northrup Co.).
Pressure Holding and Measurement
The HDS reactions were conducted at reactor pressures ranging
from 500 psig to 1,500 psig. The pressure in the system was held
steady by a 'Mity Mite' pressure regulator. The block diagram of the
reactor system, along with the locations of 'Mity Mite' and pressure

66
guages, is shown in Figure 9. The primary function of the 'Mity Mite'
was to maintain a constant delivery pressure when the inlet pressure
or flow volume fluctuated. The 'Mity Mite' model used in these ex
periments was internally loaded and hence available only for gas
loading. The diaphram in the 'Mity Mite' acted as a balancing tool,
with dome unit, to adjust the inlet flow and maintained constant
downstream pressure. Once the 'Mity Mite' dome was loaded, the system
pressure did not exceed the dome'pressure.
The pressure holdup in the system was assisted l;>y a needle valve
(V-19) at the opposite end of the system. The pressure of the system
was measured by three gauges. The main pressure gauge, called
'Heise', had a range of up to 5,000 psig. The 'Heise' gauge was more
precise because it had subdivisions of up to 5 psi. The 'Heise' guage
possessed a fine needle indicator and mirror along the back panel,
which greatly facilitated accurate measurements. The 'Heise' pressure
gauge primarily recorded the reactor pressure. The other two pressure
indicators were Autoclave gauges and had a range of up to 3,000 psig,
with markings at an interval of 20 psi. One of the Autoclave gauges
(G-Il) was used to measure the oil pump pressure. The oil pump was
always pressurized up to the reactor pressure separately to eliminate
the possibility of gases flooding the pump space during pressurizing.
The other Autoclave gauge (G-Ill) was employed to measure the pressure
of the container in which liquid sample was collected. The operational
sequence for sample collection included separation of the sample con
tainer from the system, depressurization, and, finally, repressuriza
tion.

TI
PI
8 __.,.._
~-
*
I V-18 ' .,
V-21
I Hydrogen I
Temperature Indicator
Pressure Indicator
I
I
J V-3
·~
Sample Bomb l
Sample Bomb 2
H I u·
V-
,-, 1
~ ! Feed Tank
I I ,, ,u
V-4
G-Ill , To Hood
'----~- ___ ....,. __ }'o J:}_()~~eter v- 19 v- 20 and Hood
Pressure Controller. 1Mity Mite'
Valve
Rupture Disc
Check Valve
V-l 3 Nitrogen
Product V~l5---~~
Figure 9. Equipment Setup for the Experimental Program
Pump

68
Sample Collection System
Hydrogen gas and oil flowed cocurrently over the catalyst bed
during the HDS reactions. The liquid product, along with the gases,
went to stainless steel (SS") containers via SS tubing. The containers
were rated up to 5,000 psig at 70 F (21 C). The liquid product was
the only one that was finally transferred into the sample bottles and
analyzed. Therefore, the liquid product had to be separated from the ·
gas-liquid mixture. The separating mechanism is demonstrated in
Figure 10. The gas-liquid mixture came all the way to the bottom of
the container through SS. tubing. The liquid formed a pool at the
bottom of the container and allowed the gases to bubble through it
before escaping to the atmosphere. This mechanism eliminated the
escape of liquid-droplets with the gases by: (1) trapping the droplets
in the pool itself; and (2) decelerating and forcing the droplets to
remain in the large empty space above the liquid pool.
Another feature of the sampling system was the series arrangement
of two sample containers. When a sample needed to be transferred to a
bottle, the container holding the sample oil must be depressurized.
The next sample was then collected in the other container while the
transfer-was taking place.
Oil and Hydrogen Feed Systems
The two feed materials for the HDS experiments were oil and hydro
gen. The sulfur in oil was removed with the help of hydrogen. The oil
was filled in a displacement pump made by Ruska Company. The flow of
oil to the reactor could be regulated by the pump controls. The oil

Swagelok Fitting· Providing Seal
·. Hydrogen and Oil in
Figure 10. Exploded View of Bomb (61)
69
~' to k" Reducer
--.... Hydrogen Out
Oil Left in Bomb

70
was delivered to the top of the reactor via a 1/4" SS tubing.
TI1e hydrogen delivered by various vendors was supplied at varied
cylindor pressure. The hydrogen cylinders were connected to the
systt;m using a manifold, as shown in Figure 11. The manifold was
designed so that three hydrogen cylinders could be connected to it
simultaneously. Empty cylinders could be replaced without appreciably
disturbing the hydrogen flow to the reactor. A regulator at the cap
of the cylinder controlled the hydrogen delivery pressure from the
cylinder. The hydrogen flow rate was controlled by a needle valve
(V-20) at the opposite end of the system.
Material of Construction
The product gas mixture coming from the reactor and a mixture
that was passed through the reactor during pretreatment both contained
ll2S. The experiments were conducted at reactor pressures up to 1, 500
psig. The material of construction for the equipment must be able to
withstand the corrosion effects of H2S and also sustain the elevated
pressures. This material must be readily available at reasonable
prices. To fulfill these requirements, SS 316 was employed for all
the equipment items, delivery tubes, fittings and valves. To preclude
corrosion in the diaphram, 'Mity Mite' must be disconnected during
any pretreatment with H2-H2S mixture.
Safety Measures
The feed materials - oil and hydrogen - required in the experi
ments are highly inflammable. The handling of both required extreme
caution before and during the experiments. Certain safety devices

=B=a=l=l ==~V~l=ve=======l=/=4="=SS tub~~gcc-__ -_ .:=..-::-_-_·--=--------=----- __ -" ]
Regulator
· Hydrogen Cylinder
I I! I 'U_ I !
II I
I .
Forged I I
I I Body . Valve I
'
LJ l_j Figure 11. Hydrogen Manifold System

were employed to minimize the danger. The most important precaution
was the rating of each equipment item during its design. All the I
equipment items, tubes, valves and fittings were rated for more than
3,000 and up to 5,000 psig at 70 F (21 C). This rating was more than
twice the desired reaction pressures.
The system was repeatedly checked for hydrogen leaks prior to
startup of the experiment. The system was pressurized ~ith nitrogen
to the highest desired reaction pressure and checked for leaks with
soap solution. The soap solution was poured liberally on all-the
connections and joints. The soap solution would form bubbles at the
point of leak. Leaky joints were either tightened or the fittings
replaced. The system must be absolutely leak-proof prior to and
during the experiments. Hydrogen in the surrounding atmosphere and
in the laboratory was continuously monitored during the course of the
experiment. The monitoring device gave visual warnings in the event
excessive hydrogen concentrations were present in the atmosphere.
Should the system malfunction and hydrogen surge to the reactor, a
check valve would stop the hydrogen flow immediately. Any drastic
72
fluctuation in the hydrogen flow rate would also shut this check valve.
The check valve could only be opened manually to restore the hydrogen
flow.
The Ruska pump was filled with oil from a storage tank located
above the pump. Any hydrogen gas trapped in the Ruska pump (at high b
pressure levels) will spill oil into the laboratory when the valve
connecting the pump and the storage tank was opened. To prevent such
spillage, a unidirectional valve was placed between the pump and the '
oil storage tank. The oil pump was never pressurized with hydrogen,

as the gas may seep into the pump and disrupt the oil flow rate. To
preclude damage from runaway pressure during the charging stage, a
rupture disc was placed in an SS tube connecting the pump and hood.
The rupture disc would break when the pump pressure became excessive.
The heaters were always checked for short circuits before opera
tion. The resistance of the beaded heating wires from each of the
heating blocks was measured. Normal readings would be between 15 and
50 ohm; the resistance of a short circuited wire would read above
100,000 ohms. If a short circuited wire was not repaired, the
temperature in the section of the reactor that lies within this
heating block would rise from 70 F (21 C) to 1,000 F (538 C) in a
matter of minutes,. as compared to a controlled heat rise of about
100 F (56 C) per hour.
73
As an additional safety measure, an attendant contiua1ly monitored
the equipment during the course of an experiment. In the event of an
emergency, he would depressurize and shut down the system. The labora
tory was equipped with an explosion-proof telephone to immediately
notify the proper authorities of any emergency condition.
Analytical Apparatus
The liquid product from the reactor was examined for sulfur
content in an analyzer. A brief outline of this analytical apparatus
is presented in this chapter. The operational procedure will be
discussed in the next chapter. Refer to the Laboratory Equipment
Company (LECO) manual for detail schematics of the equipment (110).
The basic concept of the LECO method for sulfur analysis was
oxidation of sulfur in the sample oil to sulfur dioxide (S0;2), and

74
titrate so2, using potassium iodate (KI03). The block.diagram of the
analytical apparatus is illustrated in Figure 12. A LECO induction
furnace, designed to evaluate the sulfur content in hydrocarbons, was
employed to warm the sample oil for oxidation. Oxygen gas from cylin-
ders passed through a purifying train before entering the oxidation
zone, thereby removing any suspended impurities and ensuring a
consistent quality of 02 for oxidation. LECO crucibles and covers
were used to place the sample oil in the oxidation zone. The gases
were transferred to the titrator through a glass delivery tube after
oxidation. A resistance wire was spiralled around the glass to warm
the tube and so prevent the partial condensation of gases passing '
through it.
The LECO analyzer used for the titration was an 'automatic' model.
The operator had only to start the titration. The analyzer would
automatically stop the flow of reactants at the end of the process.
The only additional equipment required for the titration was a wide-
mouth hose, which was connected to a blower and extended all the way
to the top of the titrating vessel. This hose vented all product
gases directly to the hood. The equipment items, fittings and parts
required for this experiment and analysis are listed in Table VII.

KI03 1 ,
Solution u HCl Solution~~
~ L: ~
J n ~aNI Sulfur Titrator \,(l ; ~
1
l- LJ _j
~- 1111 ~~~~~~tor U Solution
I
I
- Fl owmeter
,-.(-- --
--:--- . _j Furnace
H20 Trap ( H2S04)
.ll_[-~~~ l ___ _j_ - I I I
CO T ----' 2 r~ L 1
(Ascarite) _j
Figure 12. pparatus for the Schematic n· lagram of A Determinat· 101'1 of Sulfur
/

Equipment
SS tubing
SS tubing
SS tubing
Reactor
TABLE VII
LIST OF EXPERIMENTAL AND ANALYTICAL EQUIPMENT ITEMS
Specifications a Vendor
1/ 8" OD' 18 BWG' 30 I Metal Goods Corp.
1/4" OD, 18 BWG, 30' " 1/2" OD, 18 BWG, 30' "
1/2" OD, 18 BWG, 33" "
Female connector (5)b 1/2", Swagelok " Reducer (9)
Reducing union (3)
Union tee (2)
Union tee (6)
.Union cross (2)
Union cross (3)
Cap (3)
Plug (3)
Union (2)
Union (5)
Union
Elbow union (2)
Male run tee (2)
Male adapter
1/2" to 1/4", Swagelok "
1/4" to 1/8", Swagelok " 1/8", Swagelok "
1/4", Swagelok II
1/211 , Swagelok " 1/4", Swagelok "
1/811 & 1/4", Swagelok II
1/8" & 1/4 11 , Swagelok " 1/811 , Swagelok II'
1/4", Swagelok "
1/2", Swagelok II
1/4", Swagelok " 1/2", Swagelok II
401-A-8-316, Swagelok "
76
Forged body valve (5) 1VS4-316, Vee tip Whitey Res. Tool Co.
Union bonnet valve (3) 3TS4-316, Teflon tip " Micrometering valve (3) 22RS4-316, Needle tip II

Equipment
Ball valve
Lift check valve
Speed valve (6)
Check valve
Pressure gauge (2)
Rupture disc
Pressure regulator (2)
Pressure regulator
Receiving bomb (2)
Feed tank
Pressure regulator (3)
Pressure regulator
Pressure gauge
Positive displacement pump
Thermocouple
77
TABLE VII (Continued)
Specifications a Vendor
43S4 Whitey Res. Tool Co.
5354-316
lOV-4001, straight 2-way
SK-4402, Autoclave
0-3000 psig, P-480
3000 psig
Model 8
Model 11-330, H2S
1000 cc, ss 316
2250 cc, ss 316
Model 105, No. 63-3143
1 Mity Mite', Model 94
" Autoclave Engineers
II
II
II
Matheson Scie, Inc.
II
II
II
II
Grove Valve & Reg. Co.
Heise-Bourdon, Heise Corp. 0-5000 psig
1000 cc, proportionat- Ruska Inst. Co. ing with transmission
J-SS4-G-T3-36 11 Conax Corp. 8ft-lead wire
Numatron numeric display Model 900 Leeds & Northrup Corp.
Temperature progranuner Model 240, 0-1000 C Hewlett-Packard Corp.
Powerstat (5) No. 9-521 Fisher Engineering
Hydrogen detactor Model I-501, wall MSA Inst. Divn. mount dual diffusion head

78
TABLE VII (Continued)
Equipment Specifications a Vendor
Pressure regulator No. Ell-F-NllSG Air Products Inc.
Felt insulation fabric No. 9326PS McMaster-Carr Inc.
Fiberglass insulation No. 9356Ml3 "
Induction furnace Model 521 Laboratory Equip. Co.
Automatic titrator Model 532 II
Purifing train Model 516 II
Crucibles No. 528-036 "
Crucible covers No. 528-042 11
aUnless otherwise specified, the material for the equipment is SS 316.
bThese numbers represent the number of times that identical item is used in the system.

CHAPTER IV
EXPERIMENTAL PROCEDURE
Reactor Operation
The basic principles of the reactor operation are simple. The
coal derived liquid and hydrogen were allowed to flow cocurrently
downward over the packed bed of catalyst at the controlled flow rates.
HDS reactions in this study were carried out at different reaction
conditions. The ratio of the hydrogen flow per barrel of oil fed was
maintained at a constant, preset value. The oil flow was regulated by
appropriately setting the gear box of the Ruska pump. 'The hydrogen
required for the reaction came from the cylinders. After the reaction,
the unreacted hydrogen and hydrogen sulfide produced during the
reaction were scrubbed by sodium hydroxide solution and then vented.
This was a 'once through' operation and thus the unreacted hydrogen
was not recovered for recycling. The liquid products from the
reactor were collected and transferred to the sample bottles at
designated time intervals. These liquid product samples were later
analyzed for sulfur content.
Reactor Preparation
The reactor was first cleaned and dried to remove any deposits
remaining from previous experiments. The catalyst received from the
79

80
vendor was crushed and sized to 8-10 mesh.· A specific amount (usually
about 20 grams) of a fresh batch of catalyst was weighed in prepara
tion for packing the reactor. Berl Saddles (inerts) were also crushed
and sized to 8-10 mesh. A small retaining screen was placed at one
end of the reactor. When the reactor was empty, the thermowell
coincided with the radial axis of the reactor. The thermowell was
held in this position while packing the reactor to ensure that the
thermocouple will accurately measure the catalyst bed temperature.
The inerts were distributed evenly at the top and bottom of the
catalyst bed so as to reduce the end effects of entrance and heat
loss. Another retaining screen was placed at the other end of the
packing to hold the packed bed in place. The reactor was connected to
the system after packing.
The system was then pressure tested overnight and checked for any
pressure losses after 12 hours. Leaks causing pressm:e drops of more
than 5 psi were sealed before any further connections were made.
The HDS reactions were conducted at temperatures ranging from
600 to 800 F (314 to 427 C). To maintain these temperatures, the
reactor was electrically heated. Five separate aluminum heating
blocks were employed to achieve and maintain the reactor at a specified
temperature. All five-heaters were placed around the reactor and
controlled individually using a temperature programmer or a variac.
The electrical connections must be checked for any short circuits
prior to operation. The resistance of the beaded heating wires from
each of the heating blocks was measured using a volt-ohmeter. The
resistance reading of a properly cqnnected heating wire would be
between 15 and 50 ohms, whereas a short circuited wire would be over

100,000 ohms. The short circuited heating wires were fixed prior to
operation. The heating blocks were then doubly insulated with layers
of asbestos and fiber glass. While applying the insulation, care was
taken that the thermocouple wires coming from the temperature pro
grammers were properly placed. The catalyst was now ready for
pretreatment.
Catalyst Pretreatment
The pretreatment stage was comprised of calcining and/sulfiding.
The calcining was performed to remove any moisture trapped in the
packed bed of the reactor. The moisture was vaporized and eventually
carried away by nitrogen. During calcining, the packed bed of
81
catalyst and inert particles was heated to 450 F (233 C). During
pretreatment, the 'Mity Mite' pressure regulator and 'Heise' pressure
gauge were disconnected from the system and the open ends were capped
to preclude corrosion in their diaphrams during sulfiding. The nitro
gen gas entered the system just below the 'Mity Mite', flowed over the
packed bed, passed through containers C-I and C-II, and left the system
through valve V-20, which also maintained the flow rate at about 30
cubic centimeter per minute (cc/min). Such a low nitrogen flow was
sufficient to carry away the moisture trapped in the packed bed. The
valve positions during pretreatment are summarized in Table VIII. The
valve positions presented in Table VIII would ensure desired route of
the nitrogen flow. The catalyst was calcined for about 12 hours.
The other step in the catalyst pretreatment was sulfiding. The
cobalt and molybdenum molecules in the catalyst were partially sul
fided during the HbS reactions. But the fresh batch of catalyst

82
contained interlinked molybdenum, cobalt tetra and octahedra (111).
These interlinking bridges are broken and the open anion vacancies
filled by sulfur during sulfiding. It is also observed that the
substitution of bridging oxides occurs in preference to the terminal
oxides. Thus, sulfiding helps activate the cobalt and molybdenum
molecules in the catalyst and initiate the HDS reactions. After
calcining, the nitrogen flow was stopped and the system was switched
to Hz-HzS mixture (about 5% HzS) for sulfiding. The catalyst bed was
again maintained at 450 F (233 C) and the flow route for the Hz-HzS
mixture during sulfiding was the same as that for nitrogen. The
Hz-HzS mixture flow rate was kept low at about 30 cc/min. The catalyst
was sulfided for about 90 minutes.
TABLE VIII
VALVE POSITIONS DURING CATALYST PRETREATMENT
Valve Number
V-1, 2, 6, 9, 10, 18 , 19 and 20 .
V-3, 4, 5, 7, 8, 11, 12, 13, 14, 15, 16, 17 and 21.
Valve Postion
Open
Closed

83
Reactor Feed Preparation
The two feed materials - oil and hydrogen - must be made available
for the reactor operation. The hydrogen cylinders were connected to
the system via manifold as shown in Figure 11 in the previous chapter . . The 'Mity Mite' regulator and the 'Heise' gauge that were disconnected
during the catalyst pretreatment must be reconnected prior to starting
the hydrogen flow.
Oil to the reactor was supplied from a Ruska pump of 1,000 cc
capacity, The pump itself was filled with oil from storage tank C-III.
Since C-III is filled with more than 1,000 cc of oil, the pump must
be disconnected from the system before the filling procedure was
started to prevent gas backup and oil overflow, as previously discussed
on page 66. Therefore, valve V-4 must be closed and the pump must be
depress uri zed prior to connecting it with C- II I . To depressurize the
pump, the gear stem on the pump was shifted to the "traverse" position
and the "traverse" switch was flipped to the "out" position. Any
slight expansion of the liquid would sharply reduce the pump pressure.
Once the pump pressure reached one atmosphere, the unidirectional valve
between the pump and C-111 was opened. The pump position was brought
all the way out to the "0" cc mark to allow for the inflow of oil.
The pump filled to the 1,000 cc level in less than two minutes, at
which time the unidirectional valve was closed. The pump was then
pressurized by flipping the "traverse" switch to the "in" position.
The pump pressure would rise immediately. The system was ready for
operation when the pump had reached the desired pressure level.
1ndentical procedure was followed for any refilling necessary during

84
the course of the experiment.
Startup Procedure
The steps involved in startup included pressurizing the system to
the desired reaction pressure, establishing hydrogen flow, starting
oil flow, and attaining desired reaction temperature. The HDS reac
tions were conducted at temperatures ranging from 600 F to 800 F
(314 C to 427 C), pressures of 500, 1,000, 1,500 psig and the liquid
volume hourly space times ranging from 0. 3 to 1. 8 hours. The startup
steps were performed in the order they were presented above. As a
precautionary measure, the entire system was not pressurized in a
single step. Instead, successive pressurization of small segments
were performed so that only a small part of the system was checked
for leaks at any time. The hydrogen cylinder was opened and the
discharge pressure at the regulator was set at a level slightly
higher than the desired reaction pressure in order to maintain a steady
flow. The segment of the system pressurized thus far lied between
hydrogen cylinder and the 'Mity Mite' only (as seen in Figure 9, pre
vious chapter). During 'Mity Mite' loading, some hydrogen gas did
escape to the atmosphere and, therefore, the hydrogen monitoring device
must be carefully observed to avert possible hazards. The next segment
pressurized lied between 'Mity Mite', pressure gauge G-1, and valves
V-1, V-3 and V-7. Therefore, valve V-18 was opened and valves V-1,
V-7 were closed. The 'Mity Mite' was now loaded and discharge pressure
was checked by watching G-I. The loading was discontinued after G-1
read the desired reaction pressure. (Consult 'Mity Mite' manual for
its loading technique (112).) Each segment was checked for leaks before

85
proceeding to the next segment. As mentioned earlier, the pump was
pressurized separately and, therefore, V-4 remained closed until the
start of oil flow to the reactor was required. The next segment
pressurized fell between valves V-1, V-3, V-5, V-7, V-9, V-12 and V-13.
This segment included the reactor, containers C-I and C-II, pressure
gauge G-Il and valves V-2, V-8 and V-10. Therefore, valves V-5, V-9,
V-12 and V-13 were closed and V-2, V-8 and V-10 were opened. Valve
V-1 was then opened gradually and the pressure reading on G-Il observed.
V-1 was opened completely once the reading on G-Il matched that on G-I.
At this stage, valves V-6 and V-9 were opened to pressurize the entire
system up to valve V-19.
The next step in the startup procedure was to establish hydrogen
flow. V-19 was opened partially and valve V-20 was maneuvered very
carefully to establish hydrogen flow. The gases coming from V-20
passed through two sodium hydroxide scrubbers in series to trap H2S and
then moved through a buret. The time required for the soap film to
travel the buret length corresponding to 25 cc was measured and was
used as a basis for measuring hydrogen flow rate. The desired hydrogen
flow rate was established by successively maneuvering of V-20.
Generally, the oil flow was not started immediately after estab
lishing hydrogen flow. The reactor temperature at this stage would be
about 450 F (233 C). The settings on the temperature programmer and
all the variacs were now increased to attain a higher reactor tempera
ture. The oil flow was started when the reactor temperature was about
30 F (18 C) below the desired value. The HDS reactions were exothermic
and so once the oil flow was started, the reactor temperature would
automatically move to the desired value. Before starting oil flow, the

86
pump was charged to the reactor pressure using the technique covered
in an earlier section. The gear stem on the pump was shifted to the
"feed" posit ion, the feed switch on the pump was flipped to the "on"
position, and V-4 was opened to establish the oil flow to the reactor.
The reactor had been warming all this time and the exact reactor
temperature was attained by adjusting the settings on the temperature
programmer and/or the variacs.
Normal Operation
The coal derived raw anthracene oil and hydrogen came to the top
of the reactor via 1/4" SS tubing from their respective feed storage
tanks. The oil flowed from the pump through V-4 to the reactor,
whereas, hydrogen flowed from the cylinder through V-21, the 'Mity
Mite', V-18, V-1 and V-2 before reaching the top of the reactor. In
the reactor, sulfur containing compounds in oil reacted with hydrogen
in the presence of a catalyst to form hydrogen sulfide. The hydrogen
flow rate, oil flow rate, reactor temperature, and reactor pressure
were held constant for a certain length of time (ranging from two to
six hours) during normal operation. The fluctuations encountered in
each of these categories will be presented later in this chapter.
The reaction products in liquid and gas phases flowed to con
tainer C-I and on down to container C-II through V-10. The liquid and
gas phases were separated in C-II by the mechanism illustrated in
Figure 10 of the previous chapter. The liquid product collected in
C-II was later transferred to sample bottles and finally analyzed for
sulfur content. The gaseous mixture from C-II flowed through V-9, V-6,
V-19, V-20, hydrogen sulfide scrubbers,· and the flowmeter before

87
it was vented. In large scale industrial operations, the unreacted
hydrogen must be recycled for economic and safety considerations. The
system pressure was held at one end by the 'Mity Mite' regulator and at
the opposite end by V-19. Therefore, the pressure beyond V-19 was
essentially atmospheric. V-20 controlled the hydrogen flow rate.
Some of the valves in the system performed no apparent function.
These valves were present as back-up valves and were used in the event
of lead valve malfunction during the course of an experimental run.
These valves, viz. V-2, V-6, V-8 and V-11 were, therefore, kept open
all the time. The summary of the valve positions during the normal·
operation is presented in Table IX.
TABLE IX
VALVE POSITIONS DURING NORMAL OPERATIONS
Valve Number
V-1, 2, 4, 6, 8 9, 10, 11, 18, 19, 20 and 21.
V-3, S, 7, 12, 13 14, 15, 16 and 17.
Sample Collection
Valve Position
Open
Closed
The most frequent cause of system disturbance was for sample
collection. The liquid was first collected in C-II within the system.

88
This product must now be transferred to sample bottles. There was a
sequence of steps involved in transferring the liquid product. These
steps, along with necessary explanations, are outlined below:
1. Since the system was at an elevated pressure, C-II must be
isolated and depressurized before V-13 and V-15 could be
opened for sample transfer. During the time C-II was
isolated, the next sample was collected in C-I. V-9 and
V-10 were closed to isolate C-II and V-5 was opened to
ensure continuity in gas flow.
2. C- II was brought to atmospheric pressure by gradually
opening V-12 and simultaneously observing pressure in
G-III. V-12 was left open once C-II reached atmospheric
pressure.
3. Invariably, some H2-H2S gas mixture became trapped in the
liquid product. Nitrogen gas was then purged through the
sample to carry away the unwanted trapped gas mixture.
V-15 must be closed before opening V-13. In case of an
error, the entire sample in C-II would drain out on the
floor. Nitrogen flow was started by the partial opening
of V-14. Too high a nitrogen flow would entrain a portion
of the liquid product. The nitrogen flow rate was kept at
about 100 cc/min. The sample was purged with nitrogen for
about 30 minutes.
4. V-12 and V-14 are closed once purging with nitrogen was
stopped. The sample could be transferred from C-II to a
bottle.

89
5. A sample bottle was placed below the opening of V-15 and V-15
was opened. The liquid product from C-II flowed through V-13
and V-15 and was collected in the sample bottle. V-13 and
V-15 were closed when all the product had drained from C-II.
The sample bottle was capped, labelled, and stored for later
analysis.
6. C-II could be reconnected to the system after it was
repressurized to the same level of the system. C-Il
was generally pressurized with hydrogen. V-1 was closed
to avoid any drastic pressure disturbances in the reactor.
If V-7 was opened at this stage, the check valve (V-21)
would become clogged due to the sudden surge of hydrogen
flow .. Therefore, V-21 in the bypass line was partially
opened (just one turn was enough). V-7 was now opened
partially to allow slow build up of pressure in C- II.
Any sudden fluctuations in pressure could damage the
gauge G-II. When C-II reached the system pressure (as
read in G-II), V-7 and V-21 were closed and V-1 was opened
to reestablish the hydrogen flow to the reactor.
7. Thus far the next sample had been collecting in C-I. Since
C-II was back again at the system pressure, the sample
could now be transferred and collected in C-II. Therefore,
V-9 and V-10 were opened and V-5 was closed to allow the
liquid sample collection in C-II. At this stage the flow
situation was identical to that of normal operation.
Generally, it took 40 to 45 minutes to perform steps 1
through 7.

90
Control of Operating Conditions
There are four experimental variables that must be controlled
during the experimental study, viz. reactor temperature, pressure,
hydrogen flow rate; and oil flow rate. In any normal operation, these
four variables must be observed, recorded, and readjusted if necessary.
For a particular set of operating conditions, there would be a fixed
value for each of these variables. Any deviation from these desired
values must be monitored and corrected as quickly as it occurs.
One such operating variable was reactor temperature. Previous
investigations by Sooter (61) and Wan (52) had noted that the effect
of reactor temperature on reaction kinetics was significant. Therefore,
a thorough control of temperature was essential. The temperature in
the inert bed before catalyst zone was kept lower than the desired
value so that the exothermic heat of reaction would be absorbed and
still keep the catalyst zone at the desired reactor temperature. A
typical reactor temperature profile is shown in Figure 13. The
temperature was controlled with the help of five different heat sources.
The reactor bed temperature was measured at least once every hour at
points not more than 1" apart along the length of the reactor. The
supply voltage on variacs and the setting on the temperature programmer
were changed when necessary. Increasing such input would increase bed
temperature and vice versa. It took 10 to 15 minutes for the reactor
temperature to stabilize after any change in setting was made.
Another operating variable was reactor pressure. The observed
effect of pressure on reaction kinetics was not as significant as that
of temperature. Besides, fluctuations in reactor pressure were hardly

Test Series: Nominal Temp: Nominal Press:
0.-------.-------~------.------,--
5
SP 750 F (399 C)
1,000 psig
8 10 --------+----+---+-, --L--= ~
15,---t-<1)
~ 0
N
.jJ If)
>-. ....-t ..c\L.--1-.jJ Cll u
20 l-.. -+----+--tl -- -+---~ I I I i i I _L ~ I I __:y_
25 Fl ~-=--- --- . -- . I I
,_ 1 l I I .
__ j__ .. ____. 30 L-------L---------1--
740 742 744 746 748 750 752 Reactor Temperature, F
Figure 13. A Typical Temperature Profile
91

noticeable. Any sudden change in the hydrogen flow rate would affect
the reactor pressure because of momentary adjustment, but the reactor
pressure remained generally constant.
92
Hydrogen flow rate was one of the most important operating vari
ables. In their experiments, Wan (52) and Sooter (61) observed that
the effect of changing flow rate was negligible for hydrogen flow rates
above 1,500 scf/Bbl, whereas below 1,500 scf/Bbl of oil the effect was
significant. Therefore, the hydrogen flow rate was always maintained
above 1,500 scf/Bbl of oil. The difficulties experienced in control
ling the hydrogen flow rate were enormous and the rate had to be
checked at least every 30 minutes, and sometimes every 15 minutes.
The valve controlling the hydrogen flow rate was replaced more than
any other in the entire system.
The final variable, the oil flow rate, caused the least amount of
problems. The oil flow rate remained at the desired value throughout
the experimental run. Difficulty could only occur if a portion of the
Ruska pump was occupied by hydrogen gas. This problem could be elimi
nated by carefully filling and pressurizing the pump.
An experienced operator would facilitate the control of these
variables. His presence could be extremely helpful when the operating
conditions were changed.
Changing Operating Conditions
Some of the experiments were conducted at only one set of flow
and reactor conditions (i.e. oil and hydrogen flow rates), reactor
temperature, and pressure. Other programs did require these factors
to vary. The reactor temperature or pressure could be changed

independently, whereas oil and hydrogen flow rates had to be changed
simultaneously for a particular space velocity.
The oil flow rate was changed by appropriately setting the gears
on the pump. First the pump was isolated and turned off by closing
93
V-4 and turning the feed switch to the "off" position. The gear stem
was then brought to the "neutral" position before changing gear
settings. (Consult Ruska manual to find appropriate setting correspond
ing to the desired oil flow rate (113) .) TI1e gear stem was returned
to the "feed" position and the feed switch was flipped to the "in"
position. V-4 was opened and the oil flow rate change was complete.
The hydrogen flow rate must also be changed to maintain constant H2/oil
ratio going to the reactor. The hydrogen flow rate was changed by
adjusting V-20. This was a trial and error procedure, making adjust
ments and then checking the measured flow rate. Changing oil and
hydrogen flow rates did not take more than five minutes.
The reactor pressure was changed by operating the regulator at the
outlet of the hydrogen cylinder, the 'Mity Mite' regulator and the pump.
To avoid any hydrogen seeping into the pump, the pump was pressurized
or depressurized separately. Thus, before changing system pressure,
the pump was isolated and turned off by closing V-4 and turning the
feed switch to the "off" position. The outlet pressure of the regulator
at the hydrogen cylinder was then set at a pressure approximately 100
psi higher than the desired reactor pressure. This extra 100 psi acted
as a driving force and ensured smooth flow of hydrogen. The next step
was to adjust the 'Mity Mite'. Prior to this, V-1 was closed so that
the reactor did not receive abrupt pressure variations. (Consult 'Mity
Mite' manual for the procedure of changing reactor pressure (112).)

94
V-1 was opened gradually and the reactor pressure was allowed to reach
the desired value. V-1 was opened completely once the entire system
(except the pump) attained the desired pressure level. The pump
pressure was changed by flipping the feed switch to the "on" position
without opening V-4. The pump pressure increased very slowly and V-4
was opened once it reached system pressure. Hydrogen flow rate was
always checked after changing system pressure which normally took about
10 minutes.
Changing reactor temperature was time consuming but simple. One
needed only change the settings on all the variacs and the progranuner.
The time required to change the reactor temperature by SO F had varied
from four hours to eight hours, depending upon operator skill. The
reactor temperature measurements were more frequent (at least every 30
minutes) during the transition period.
Other adjustments necessary during the course of the experimental
run were refi 11 ing the pump and switching hydrogen cylinders . The
refilling was almost identical to the method explained earlier in this
chapter except that the pump must be isolated and depressurized before
it was ready for refilling. The design of the manifold allowed for
isolating and switching the hydrogen cylinders without appreciably
disturbing the system.
Shutdown Procedure
The duration of the experimental runs on the reactor had ranged
from 100 to 250 hours. Once the experiment was complete, the shutdown
procedure was started inunediately. The steps involved for the shutdown
procedure were as follows:

1. The hydrogen supply was turned off by closing the valve at
the hydrogen cylinder.
2. The oil pump was isolated by closing V-4. Next, the feed
swit~h was turned to the "off" position and over to the
"out" position. Very slight expansion of the oil would
drop the pump pressure down to one atmosphere. Once
depressurized, the feed switch was brought back to the
"off" position.
3. The heat supply to the reactor was cut off by turning the
switches on all the variacs and the temperature programmer
to the "off" position.
4. After the final sample was transferred to a bottle, all
outlets from the system except V-12 were closed. V-12 was
gradually opened and the system was depressurized very
slowly. Some residual pressure, about 100 psig, was left
in the system to sustain and absorb any contraction of
gases due to cooling.
5. The reactor was then allowed to cool. The amount of time
required to cool the reactor from about 700 F (371 C) to
room temperature was approximately 12 hours.
95
The above covers all the major aspects of the reactor operation.
The samples collected were labelled and stored to be analyzed later for
sulfur content. The sulfur analysis of the liquid products was a
measure of performance of the catalyst at the specific reactor con
ditions. Relative performances of the various catalysts could be
studied after all the samples from different experimental runs were
analyzed;

96
Analyzer Operation
Sulfur Analysis
A brief outline of the analytical method is described in the
following. (Consult LECO manual for the detail procedure and schemat
ics of the equipment (110).) The chemicals used during the analysis
are listed at the end of this chapter in Table X.
The basic concept in the sulfur analysis could be summarized in
reactions (4.1) and (4.2).
KI03 + SKI + 6HC1 -- -~ 6KC1 + 312 + 3H20 (4 .1)
( 4. 2)
Potassium iodate (K103) and potassium iodide (KI) would react in the
presence of hydrochloric acid (HCl) to release iodine (I2), reaction
(4.1). 12 would give distinct blue color in presence of. a starch
solution. The sulfur dioxide (S02) gas coming from the oxidizing
sample oil, when passed through this mixture, would react with 12 and
thereby gradually fade the blue color, reaction (4.2). Additional K103
solution would be required to attain the original level of blue colora
tion. This additional amount of K103 was the measure of S02 and, in
turn, the sulfur level in the sample oil.
Some chemicals must be prepared before the analytical procedure
could be performed. The preparation of these chemicals is explained in
the following:
1. The HCl solution was prepared by adding 15 ml of the concen
trated HCl to distilled water to make a one liter solution.
Enough HCl solution could be prepared for one month's use.

97
2. The KI03 solution was prepared by adding 0.111 gm of KI03
powder to one liter of distilled water. The KI03 buret range
could be changed by adding different amounts of KI03 powder
to one liter of distilled water. (Consult LECO manual for
determining the amount of KI03 to be added to a liter of water
corresponding to the sample size and its level of sulfur con
tent.) Enough KI03 solution could be prepared to last for a
month.
3. The starch solution must be fresh daily for consumption.
First, 150 ml of distilled water was brought to boiling.
Then, 2.0 gms of Arrowroot starch, mixed with 50 ml of
distilled water, was added to the boiling water. The
mixture was brought to and allowed to boil for about two
minutes. The mixture was then cooled to room temperature.
6.0 gms of KI was added to the mixture and stirred well to
make the desired starch solution.
The general set up of the LECO furnace and the analyser is as
shown in Figure 12 of the previous chapter. There are certain mainte
nance steps that must be performed prior to the analysis. These are
outlined as follows:
1. The KI03 level in the buret was checked. The KI03 level in
the buret was set at 0.000 after everyday's analytical work.
Thus, when checking, the level should read 0.000. If not,
leak must be located and sealed.
2. The second check was for possible plugging of the gas line.
The oxygen flow was started and the pedestal in the furnace
was raised. If there was sudden rise in the back pressure in

the rotometcr, the gas line was cleaned and rechecked.
3. Another very important item to check was the photocell
alignment. The photocell housing would become dirty due
to blue coloration of the reaction mixture, thereby
increasing the photocell resistance. The photocell
housing was cleaned prior to each day's analytical work
and realigned so that the resistance read between 30,000
and 50,000 ohms.
4. The combustion tube was also cleaned everyday and the
igniter was replaced if necessary.
After all these maintenance and checkup procedures were completed,
the equipment was ready for analysis.
98
The sample should be prepared first for the analysis. The product
oil from the reactor was oxidized in the furnace and the generated
gases were sent to the anayzer for sulfur analysis. The oxidizing
reaction was catalyzed by magnesium oxide (MgO). About 0.282 gm of
MgO was first placed in the crucible. Then between 0.09 and 0.11 gm
of,oil sample was accurately weighed and placed over MgO in the cruci
ble. Another 0. 282 gm of MgO was added to the crucible on top of the
sample. About 1.50 gms of iron chips and 0.77 gm of tin metal were
added to the crucible as catalyst promoters. The crucible was then
covered and was ready for oxidizing.
The furnace and the analyzer needed to be warmed up for the analy
sis. The analytical operation began with turning the power switches on
the furnace and the analyzer to.the "on" position. The analyzer was
preset for a specific level of blue color as the end point. The equip
ment was allowed to warm for about 30 minutes. Oxygen flow was then

99
started at the rate of about 1.2 liters/min and the pedestal was raised
into the combustion zone of the furnace. Simultaneously, the glass
tube connecting the furnace and the analyzer was started to be warmed.
The equipment was ready for analysis after about 15 minutes of oxygen
flow. The titration vessel was then filled with HCl solution to a
specific level. The amount of l!Cl solution used in each analysis must
be same. Next, 5 ml of starch solution was added to the titration
vessel and oxygen was allowed to bubble through the solution for
thorough mixing. After about one minute of mixing, the double throw
switch on the titrator was set to the "end point" position. Once the
end point was established, the double throw switch was brought to the
"neutral" position and the buret was refilled with KI03 solution to the
0.000 mark. The crucible loaded with sample, catalyst, and the pro
moters, was then placed on the pedestal and raised into the combustion
tube. The double throw switch on the analyser was now set on the
"titrate" position and about 0.777 gm of sodium azide was added to the
reaction mixture to inhibit any side reactions due to the presence of
chlorine in the sample oil. Chlorine replaced iodine in the KI, there
by forming more free iodine which, in turn, gave a darker blue color.
The ultimate effect was that less KI03 was required to produce the
preset level of blue color and thereby registering an erroneous lower
value for the sulfur content in the sample oil. Sodium azide had been
found to be successful in sufficiently eliminating the effect of
chlorine. The plate voltage on the furnace rose sharply during the
combustion of the sample oil and retumedto the non-fluctuating
initial value, once the combustion was complete. The reaction time
could be controlled with the help of a timer. The amount of KI03

consumed in the reaction was recorded. The titration vessel was
drained and thoroughly rinsed with distilled water. The analytical
operation could be started all over again for the next sample.
100
All the samples were analyzed at least three times to check the
consistency of the sulfur content. The buret readings and the calcula
tion procedure for estimating sulfur content in the sample oil are
presented in the next chapter. Results of the analysis of all the
samples from the experimental runs are also presented in the next
chapter and are examined for relative performances of the HDS catalysts.

TABLE X
LIST OF CHEMICALS USED IN EXPERIMENTS AND ANALYSIS
Chemical
Hydrogen
Nitrogen
Hz-HzS mixture
Hydrogen
Nitrogen
Potassium iodate
Arrowroot starch
Sodium hydroxide
Potassium iodide
Hydrochloric acid
Sodium azide
Magnesium oxide
Iron chips
Tin metal
Oxygen
Specifications
99.95\, prepurified, 3500 psig
99.997%, prepurified, 3500 psig
S\ hydrogen sulfide, 3500 psig
99.95\, prepurified, 2200 psig
99.997\. prepurified, 2200 psig
ACS Reagent
ACS Reagent
ACS Reagent
"Baker Analyzed" Reagent
37\, ACS Reagent
Practical
ACS Reagent
No. 501-077
No. 501-076
99.S\, 2200 psig
Vendor
Matheson Gas Products
.. "
Union Carbide Corporation
" Fisher Scientific Company
II
" J. T. Baker Chemical Company
DuPont Company
Eastman Kodak Company
MCB Manufacturing Chemists
LECO Corporation
II
Union Carbide Corporation ...... 0 I-'

CHAPTER V
EXPERIMENTAL RESULTS
The HDS experiments conducted on raw anthracene oil had a wide
range of objectives. However, since this project was a continuation
of the research initiated by Sooter (61), some of the objectives in-
vcstigated by him were not explored in this study. The major ones not
considered among those of Sooter were the particle size effects, the
start up effects, the equipment precision, etc. The results of Sooter's
investigations indicated that, for the HDS of raw anthracene oil, the
changes in the particle size range from 8-10 mesh to 48-60 mesh did not
result in any noticeable change in the extent of the sulfur removal.
Consequently, 8-10 mesh was the size selected for both the catalyst and
inert particles in this investigation. Since frequent start ups and
shut downs during an experiment were found to have unfavorable effects
on the catalyst activity, all data collected was from the same run.
Equipment performance for sulfur removal at identical reactor condi-
tions for different runs was found to be quite satisfactory in Sooter's
work. Therefore, the study of the equipment precision was omitted from
this research program. Certain other goals may appear to be overlap-
ping in this work but, in effect, those wer~ the continuation of the !
research project.
The primary goals of the experimental study were to investigate
the effects of (a) reactor temperature, (b) pressure, (c) hydrogen flow
102

103
rate, (d) space time, (e) catalyst wetting, and (f) catalyst aging
characteristics on the rate of HDS reactions. The active life of
various catalysts for HDS was investigated more extensively than any
other factor. The kinetic data from the related runs was then studied
to explain a possible rate model for the HDS reaction.
The results of the experimental runs are presented in this chapter
along with an explanation of the objectivity of the experiment. The
results are presented in a tabular form for each run and are analyzed
for discussion in the next chapter. Since the general objective of
these experiments was to remove sulfur from the feedstock, the results
of the experiments are presented in terms of the ramaining wt % sulfur
in the product oil and also the percent sulfur removal from the feed
oil. Each of these terms is explained as, -
wt % s = wt of S in samEle X 100 (5.1) wt of sample
and % s removal = wt % S in feed - wt % S in Eroduct X 100 (5.2) wt % s in feed
A smooth curve was drawn through the data points to prepare the
figures. The curve fits of the data for comparing rate models were
achieved by applying a least squares technique. The amount of catalyst
used for all the experimental runs was constant, 20 grams. Which meant
that reporting of the space time would be more convenient in liquid
weight hourly space time (LWHST). In keeping with the trend in the
literature, the space times are reported in terms of liquid volume
hourly space time (LVHST). The LVHST was calculated as the volume of
catalyst bed per unit volume of feed oil per hour. The reaction con-
ditions are presented as the nominal temperature and pressure. The
actual reactor temperature was controlled to within~ SF (3 C) of the

104
nominal temperature and the actual temperature of the catalyst zone was
controlled within ~ 2 F (1 C) of the nominal temperature. The actual
pressure was always controlled and adjusted, if necessary, to within
~ 20 psi of the nominal pressure. The liquid flow remained essential
ly constant and, therefore, the LVHST was always considered as having
a constant value. The hydrogen flow rate did fluctuate and, thus, was
monitored very closely and adjusted if necessary.
Analytical Precision
The analytical equipment had been tested earlier in Sooter's work
for precision (61). The feed oil was only analyzed to compare its
analytical precision with Sooter's results and to determine a con-
sistent value for the sulfur content of feed oil. The feed oil was
analyzed eight times for sulfur content. The deviation of the sulfur
concentration in feed oil from the predetermined value (by Sooter) of
0.470% was 0.001 and the standard derviation was calculated to be
0.00903. The detailed calculation steps are presented in :Appendix.A.
In addition to the test of the feed oil, each sample collected
from all the experimental runs was analyzed at least three times for
sulfur content. The imprecision within each sample was estimated
according to the student t-test as presented in Appendix B. The
' details of the analytical results are also included in Appendix B.
The average deviations and the standard deviations from the average
value were then separated according to the mean sulfur content: The
average deviations and the standard deviations from each group were
then compared with the degree of imprecision achieved by Sooter (61).
The results of the comparison are presented in Table XI.

Wt % s
over 0.20
0.15 - 0.20
0.10 - 0.15
0.08 - 0.10
0.06 - 0.08
0.04 - 0.06
0.02 - 0.04
0.00 0.02
TABLE XI
COMPARISON OF THE ANALYTICAL PRECISION OF THE SAMPLES WITH THAT OF THE EQUIPMENT
Std. Deviation, Std. Deviation, Equipment a Sampleb
+ 0.00838 + 0.00588
+ 0.00525 + 0.00738
+ 0.00581 + 0.00705
+ 0.00692 + 0.00591
+ 0.00491 + 0.00493
+ 0.00370 + 0.00540
+ 0.00400 + 0.00629
+ 0.00332
aFrom Sooter's work.
bFrom the present study.
c% based on the average % S of the group.
105
% Deviationc
2.9
4.2
5.6
6.6
7.0
10.8
20.9
33.2
The results presented in Table XI show that the standard devia-
tions of the samples analyzed in the present study were essentially
consistent with those found in Sooter's work. Furthermore, the sulfur
content of about 85% of the product samples collected in the present
s-tudy ranged from 0. 06% to 0 .15%. The percent d.eviation for the samples
having higher sulfur content was relatively lower than those having low
sulfur content.

106
Study of Catalyst Aging Characteristics
The major emphasis during the research program was given to the
determination of the aging characteristics of the catalysts. Five of
the catalysts were studied for their active life. The basic concept
of this study was to determine if there was any activity decay of the
catalyst during the study. Observing the effects from the earlier
studies (52), (61), a continuous experimental run of 200 hours duration
was considered adequate. The reactor operating conditions for all the
runs were kept identical so that a relative performance of the catalysts
could also be made. The reactor conditions were 700 F (371 C) tempera
ture, 1,000 psig pressure, 1,500 scf/Bbl hydrogen flow rate and 40
cc/hr oil flow rate. The amount of catalysts used by weight were the
same in all five cases. Therefore, the LWHST would be the same in all
five runs, but the LVHST would vary. The MCM 1 catalyst having the
least density in the lot had the highest LVHST. The amount of MCM 1
required to fill 20 inches (50.8 em) catalyst bed was used as refer
ence, and then the same amount of each of the other catalyst was
weighed for the respective experimental runs. The results of the
sulfur analyses of Runs 2, 3, 4, 6, and 8 are presented in Tables XII
through XVI and illustrated in Figure 14. The time period of the first
48 hours of each run was considered to be the stabilization period.
Consequently, the samples collected after the initial period were the
only ones included in establishing possible catalyst deactivation.
In addition to the five experimental runs explained above, several
samples were collected during other runs at certain time intervals and
repeat reactor conditons to check possible deactivation. These samples

107
TABLE XII
EXPERIMENTAL RUN 2, MCM 1 CATALYST
Sample Wt % s in Sample Wt % S in Number Product Oil Number Product Oil
ASP 1 0.086 ASP21 0.110 ASP 2 0.114 ASP22 0.135 ASP 3 0.113 ASP23 0.077 ASP 4 0.120 ASP24 0.103 ASP 5 0.098 ASP25 0.054 ASP 6 0.115 ASP26 0.121 ASP 7 0.127 ASP27 0.072 ASP 8 0.116 ASP28 0.15 7 ASP 9 0.064 ASP29 0.124 ASPlO 0.112 ASP30 0.101 ASPll 0.160 ASP31 0.104 ASP12 0.124 ASP32 0.108 ASP13 NA ASP33 0.059 ASP14 0.098 ASP34 0.110 ASP15 0.099 ASP35 0.069 ASP16 0.134 ASP36 0. i30 ASP17 0.108 ASP37 0.112 ASJh8 0.104 ASP38 0.120 ASP19 0.103 ASP39 0.113 ASP20 0.118 ASP40 0.087
Note: The operating conditions during the entire experimental run were as follows.
(a) Nominal temperature = 700 F (371 C) (b) Nominal pressure = 1,000 psig
. (c) Hydrogen flow rate = 1,500 scf/Bbl (d) LWHST = 0.440 per hour (e) LVHST = 0.925 per hour

TABLE XIII
EXPERIMENTAL RUN 3, MCM 2 CATALYST
Sample Wt % S in Sample Wt % S in Number Product Oil Number Product Oil
ANA 1 0.165 ANA21 0.128 ANA 2 0.156 ANA22 0.125 ANA 3 0.142 ANA23 0.111 ANA4 0.155 ANA24 0.109 ANA 5 0.163 ANA25 0.151 ANA 6 0.189 ANA26 0.109 ANA 7 0.180 ANA27 0.137 ANA 8 0.123 ANA28 0.120 ANA9 0.183 ANA29 0.139 ANAlO 0.103 ANA30 0.115 ANAll 0.105 ANA31 0.136 ANA12 0.112 ANA32 0.095 ANA13 0.096 ANA33 0.'135 ANA14 0.126 ANA34 0.115 ANA15 0.110 ANA35 0.107 ANA16 0.101 ANA36 0.125 ANA17 0.102 ANA37 0.141 ANA18 0.110 ANA38 0.117 ANA19 0.137 ANA39 0.106 ANA20 0.122 ANA40 0.097
Note: The operating conditions during the entire experimental run were as follows.
(a) Nominal temperature = 700 F (371 C) (b) Nominal pressure = 1,000 psig (c) Hydrogen flow rate = 1,500 scf/Bbl (d) LWHST = 0.440 per hour (e) LVHST = 0.640 per hour
108

109
TABLE XIV
EXPERIMENTAL RUN 4, MCM 3 CATALYST
Sample Wt % S in Sample Wt % S in Number Product Oil Number Product Oil
NLA 1 0.118 NLA21 0.080 NLA 2 0.119 NLA22 0.074 NLA 3 0.081 NLA23 0.081 NLA 4 0.143 NLA24 0.070 NLA 5 0.084 NLA25 . 0.072 NLA 6 0.110 NLA26 0.101 NLA 7 0.115 NLA27 0.075 NLA 8 0.111 NLA28 0.107 NLA 9 0.107 NLA29 0.087 NLAlO 0.107 NLA30 0.081 NLAll 0.115 NLA31 0.088 NLA12 0.117 NLA32 0.088 NLA13 0.080 NLA33 0.074 NLA14 0.098 NLA34 0.076 NLA15 0.075 NLA35 0.099 NLA16 0.100 NLA36 0.095 NLA17 0.081 NLA37 0.078 NLA18 0.096 NLA38 0.096 NLA19 0.093 NLA39 0.098 NLA20 0.089 NLA40 0.086
NLA41 0.152
Note: The operating conditions during the entire experimental run were as follows.
(a) Nominal temperature = 700 F (371 C) (b) Nominal pressure = 1,000 psig (c) Hydrogen flow rate = 1,500 scf/Bbl (d) LWHST = 0.440 per hour (e) LVHST = 0.616 per hour

110
TABLE XV
EXPERIMENTAL RUN 6, MCH 4 CATALYST
Sample Wt % S in Sample Wt % S in Number Product Oil Number Product Oil
HRW 1 0.177 HRW21 0.131 HRW 2 0.136 HRW22 0 .ISO HRW 3 0.165 HRW23 0.141 HRW 4 0.197 HRW24 0.142 HRW 5 0.182 HRW25 0.133 HRW 6 0.173 HRW26 0.140 HRW 7 0.131 HRlV27 0.135 HRW 8 0.156 HRW28 0.136 HRW9 0.151 HRW29 0.133 ·HRW10 0.155 HRW30 0.135 HRWII 0.145 HRW31 0.128 HRW12 0.149 HRW32 0.121 HRW13 0.153 HRW33 0.127 HRW14 0.148 HRW34 0.128 HRWlS . 0.142 HRW35 0.128 HRW16 0.131 HRW36 0.124 HRW17 0.138 HRW37 0.123 HRW18 0.123 HRW38 0.137 HRW19 0.149 HRW39 0.125 HRW20 0.140 HRW40 0.159
Note: The operating conditions during the entire experimental run were as follows.
(a) Nominal temperature = 700 F (371 C) (b) Nominal pressure = 1,000 psig (c) Hydrogen flow rate = 1,500 scf/Bb1 (d) LWHST = 0.440 per hour (e) LVHST = 0.650 per hour

TABLE XVI
EXPERIMENTAL RUN 8, MCM 5 CATALYST
Sample Wt % S in Sample Wt.% S in Number Product Oil Number Product Oil
NAC 1 0.100 NAC21 0.089 NAC 2 0.077 NAC22 0.086 NAC 3 0.064 NAC23 0.086 NAC 4 0.071 NAC24 0.070 NAC 5 0.077 NAC25 0.083 NAC 6 0.073 NAC26 0.070 NAC 7 0.086 NAC27 0.090 NAC 8 0.108 NAC28 0.075 NAC 9 0.083 NAC29 0.089 NAClO 0.086 NAC30 0.059 NACll 0.081 NAC31 0.053 NAC12 0.072 NAC32 0.059 NAC13 0.128 NAC33 0.053 NAC14 0.073 NAC34 0.060 NAC15 0.078 NAC35 0.065 NAC16 0.078 NAC36 0.054 NAC17 0.083 NAC37 0.096 NAC18 0 .076. NAC38 0.063 NAC19 0.065 NAC39 0.079 NAC20 0.094 NAC40 0.073
Note: The operating conditions during the entire experimental run were as follows.
(a) Nominal temperature = 700 F (371 C) (b) Nominal pressure = 1,000 psig (c) Hydrogen flow rate = 1,500 scf/Bbl (d) LWHST = 0.440 per hour (e) LVHST = 0.740 per hour
111

f..i
cB .-I ;::l
U)
.j...)
a3 u f..i <I>
0..
.j...)
• 2s I I
.20
.15
. 10
~ .OS ·.-i
~
I
. - .. ----- .. ---
. ---. ---. ~ ·-·-
--------
Feedstock: Temperature: Pressure: LWHST:
. ---- .. -- .. ---~ .
--
Raw Anthracene 700 F (371 C) 1,000 psig 0.44 hour HRW ANA ASP NLA NAC
Oil
' i ____,
----~·
-- J i
! -,
I .oo L ______ _j ___ __..L ___ __;_ __ __L ___ __;_ ___ ___L ___ __L_ __ _____j_ ___ _.L_ __ __,
0 20 40 60 80 100 120 140 160 180 200
Hours of Oil-on-Catalyst
Figure 14. Results of the Catalyst Aging Tests

113
were collected at the reactor conditions which were already encountered
during the earlier segment of the respective runs. These samples are
identified later in this chapter.
Pressure Effects
One of the three operating variables studied was the effect of
reactor pressure on the HDS reaction. Run 5 was the only one conducted
to investigate the pressure effect. Run 5 was conducted at pressures
of 500, 1,000 and 1,500 psig. All three pressures were tested at
temperatures of 650, 700 and 750 F (343, 371, and 399 C respectively).
Three different space times were also included at each of these operat
ing conditions. The results of Run 5 are presented in Table XVII.
Figure 15 illustrates a typical pressure effect on the extent of the
sulfur removal from the anthracene feedstock. The effect of pressure
from this table appears to be mixed at different reactor temperatures.
Similar runs on other catalysts were not made since,the effect of
pressure was found to be insignificant when compared to that of
temperature and space time on the HDS reaction rate. From the results
of his work on another catalyst, Sooter (61) observed that the HDS
reaction rate increased as the reactor pressure went up from 500 to
1,000 psig but no effect of any further pressure rise.
Temperature Effects
The other major operating variable investigated during this test
program was the reaction temperature. The concept of high sulfur
rempva~ at higher reaction temperature was almost a maxim.
extent of sulfur removal varies with the type of catalyst.
But the
The

114
TABLE XVII
EXPERIMENTAL RUN 5, MCM 4 CATALYST
Sample Nominal Nominal LVHST Wt % S in Number Tempo, F Press o , psig Hour Product Oil
HSW 1 650 1000 lo300 Ool52 HSW 2 650 1000 lo300 Ool54 HSW 3 650 1000 1.300 Ool28 HSW 4 650 1000 10300 Ool35 HSW 5 650 1000 lo300 Ool74 HSW 6 650 1000 lo300 Ool60 HSW 7 650 1000 1.300 Ool22 HSW 8 650 1000 10300 Ool49 HSW 9 650 1000 lo300 Oo110 HSWlO 650 1000 lo300 Ool27 HSWll 650 1000 1,300 Oo114 HSW12 650 1000 1,300 Ool04 HSW13 650 1000 Oo650 Ool94 HSW14 650 1000 Oo650 Ool57 HSW15 650 1000 Oo325 Ool98 HSW16 650 1000 Oo325 Ool82 HSW17 650 1500 Oo325 Oo205 HSW18 650 1500 Oo325 Ool70 HSW19 650 1500 Oo650 Oo221 HSW20 650 1500 Oo650 Ool56 HSW21 650 1500 lo300 Ool21 HSW22 650 1500 lo300 Ool04 HSW23 650 500 lo300 Ool41 HSW24 650 500 lo300 Oo114 HSW25 650 500 Oo650 Ool75 HSW26 650 500 Oo650 Ool59 HSW27 650 500 Oo325 Oo217 HSW28 650 500 Oo325 Ool92 HSW29 650 1000 lo300 Ool33 HSW30 650 1000 lo300 Ool02 HSW31 700 1000 lo300 Oo089 HSW32 700 1000 lo300 Oo086 HSW33 700 1000 Oo650 Ool40 HSW34 700 1000 Oo650 Oo119 HSW35 700 1000 Oo325 Ool56 HSW36 700 1000 Oo;325 Ool24 HSW37 700 1500 Oo325 Ool75 HSW38 700 1500 Oo325 Oo112 HSW39 700 1500 Oo650 Ooll6 HSW40 700 1500 00650 Oo088 HSW41 700 1500 lo300 Ool60 HSW42 700 1500 lo300 Oo049 HSW43 700 500 lo300 Oo059

ll5
TABLE XVII (Continued)
Sample Nominal Nominal LVHST Wt % S in Number Temp., F Press., psig Hour Product Oil
HSW44 700 500 1.300 0.060 HSW45 700 500 0.650 0.087 HSW46 700 500 0.650 . 0.126 HSW47 700 500 0.325 O.ll6 HSW48 700 500 0.325 0.143 HSW49 700 1000 1.300 0.091 HSW50 700 1000 1.300 0.045 HSW51 750 1000 1.300 0.071 HSW52 750 1000 1.300 0.085 HSW53 750 1000 0.650 0.064 HSW54 750 1000 0.650 0.038 HSW55 750 1000 0.325 0.083 HSW56 750 1000 0.325 0.094 HSW57 750 1500 0.325 0.123 HSW58 750 1500 0.325 0.091 HSW59 750 1500 0.650 O.ll4 HSW60 750 1500 0.650 0.065 HSW61 750 1500 1.300 0.050 HSW62 750 1500 1.300 0.050 HSW63 750 500 1.300 0.064 HSW64 750 500 1.300 0.032 HSW65 750 500 0.650 0.063 HSW66 750 500 0.650 0.057 HSW67 750 500 0.325 NA HSW68 750 500 0.325 NA HSW69 750 1000 1.300 NA HSW70 750 1000 1.300 NA

r-1 •r-i 0
.jJ u ::s "0 0 H
Po
s:: •.-i
H
tB r-1 ::s
tf)
.jJ
s:: 0,) u H 0,)
Po
.jJ
..c:: bO
•.-i 0,)
:==
0.5 • 0 Feed ,
I 0.4 r
I I
I I I
0.3 ! I I
I I I !
0.2 I r-i
0.1 ~
tJ 0
~
I
Test Series: Feedstock: Catalyst: Temperature: Pressure:
c 0 b
HSW Raw Anthracene Oil MCM 4 700 F (371 C) 0 500 psig 0 1,000 psig ~ 1,500 psig
6
0
0
i
1 I --,
J--~-~-~~--~~- j : i -'---------·
0.2 0.4 0.6 0.8 1.0 1.2 1.4 1.6
Liquid Volume Hourly Space Time, Hours (cc Catalyst/cc Oil per Hour)
Figure 15. A Typical Pressure Effect on Sulfur Removal Efficiency

ll7
temperature effects were studied in Runs 1, 5, and 7. The reactor
temperatures studied were any three of 600, 650, 700, and 750 F (314,
343, 371, and 399 C respectively) for a particular experimental run.
The results of Runs 1 and 7 are presented in Tables XVIii and XIX
respectively. The results of Run 5 were included earlier in the
section on pressure effects. The effect of temperature between 600 F
(314 C) and 700 F (371 C) was remarkable for MCM 1, MCM 4, and MCM 5
catalysts, whereas, at 750 F (399 C), the increase in sulfur removal
ability of the catalyst was mostly undetectable due to the limitations
of the analytical equipment. Figure 16 demonstrates a typical tempera
ture effect on the extent of the sulfur removal from the product oil.
A side effect of the reaction temperature is on catal'yst deactivation.
Certain samples collected to examine this effect are listed in Table XX.
The results of these samples were then compared with the results of
samples collected earlier at the same reactor conditions. A very
moderate deactivation was apparent from the samples collected during
the latter part of the experimental run.
Space Time Effects and Rate Equations
Almost all of the experimental reaction kinetic studies include
the effects of space time on the rate of reaction and this study was
no exception. The overall effect of space time was. generally in the
direction of higher conversion for higher space time. But the order
and the rate of a chemical reaction are dependent on numerous process
variables. The reaction rate could be unique for a particular set of
catalyst and reaction conditions. Therefore, the kinetic data were
generally represented in a form of correlation such that the research

Sample Number
SP 1 SP 2 SP 3 SP 4 SP 5 SP 6 SP 7 SP 8 SP 9 SPlO SP11 SP12 SP13 SP14 SP15 SP16 SP17 SP18 SP19 SP20 SP21 SP22 SP23 SP24 SP25 SP26 SP27
TABLE XVIII
EXPERIMENTAL RUN. 1, MCM 1 CATALYST
Nominal LVHST Temp., F Hour
600 2.500 600 2.500 600 2,500 600 2.500 600 2.500 600 1.250 600 1,250 600 0.626 600 0.626 600 2,500 600 2.500 650 2.500 650 2.500 650 1.250 650 1.250 650 0.626 650 0.626 6SO 2.500 650 2.500 750 2.500 750 2.500 750 1.250 750 1.250 750 0.626 750 0.626 750 2.500 750 2.500
118
Wt % S in Product Oil
0.133 0.102 0.072 0.076 0.067 0.082 0.103 0.152 0.177 0.116 0.110 0.062 0.067 0.084 0.100 0.128 0.128 0.080 0.055 0.014 0.013 0.012 0.007 0.047 0.044 0.016 0.017
Note: The nominal reactor pressure at all times was maintained at 1000 psig.

119
TABLE XIX
EXPERIMENTAL RUN 7, MCM 5 CATALYST
Sample Nominal LVHST Wt % S in Nwnber Temp., F H0ur Product Oil
NAL 1 650 1.480 0.152 NAL 2 650 1.480 0.112 NAL 3 650 1.480 0.107 NAL 4 650 1.480 0.109 NAL 5 650 1.480 0.143 NAL 6 650 1.480 0.122 NAL 7 650 1.480 0.134 NAL 8 650 1.480 0.185 NAL 9 650 1.480 0.115 NALlO 650 1.480 0.088 NALll 650 1.480 0.139 NAL12 650 1.480 0.108 NAL13 650 0.740 0.143 NAL14 650 0.740 0.163 NALlS 650 0.740 0.173 NAL16 650 0.370 0.175 NAL17 650 0.370 0.202 NALlS 650 0.370 0.215 NAL19 650 1.480 0.130 NAL20 650 1.480 0.108 NAL21 650 1.480 0.118 NAL22 700 1.480 0.069 NAL23 700 1.480 0.048 NAL24 700 1.480 0.092 NAL25 700 0.740 0.142 NAL26 700 0.740 0.066 NAL27 700 0.740 0.068 NAL28 700 0.370 0.105 NAL29 700 0.370 0.111 NAL30 700 0.370 0.102 NAL31 700 1.480 0.111 NAL32 700 1.480 0.041 NAL33 700 1.480 0.064
. NAL34 750 1.480 0.042 NAL35 750 1.480 0.025 NAL36 750 1.480 0.040 NAL37 750 0.740 0.121 NAL38 750 0.740 0.044 NAL39 750 0.740 0.183 NAL40 750 0.493 0.108 NAL41 750 0.493 0.050 NAL42 750 0.493 0.039 NAL43 750 1.480 0.038

Sample Number
NAL44 NAL45
TABLE XIX (Continued)
Nominal Temp., F
750 750
LVHST Hour
1.480 1.480
120
Wt % S in Product Oil
0.034 0.062
Note: The nominal reactor pressure at all times was maintained at 1000 psig.

·----- -----·---- ·-r-------·-----·---· -----------]
Test Series: NAL 1
Feedstock: Raw Anthracene Oil 1 Catalyst : MCM 5 I Pressure: 1,000 psig
0.4 Temperature: : 650 F (343 C) , ~ 700 F (371 C)
1
\ \ 6 750 F (399 C)
· .. \\
0.3r\ \ ~ \\ ~
\ \ \
0.2 \ 0
0.1 -
~ --------·---------------~
- __ EJ__ __ - ---- ------- --- _f]
---- . - . _&__ - - - -- - -- - - - -- - - - - - -- - -;- - -- - - . --A
0 _____ _j_ _________ ~
0.2 0.4 0.6 0.8 1.0 1.2 1.4 1.6 Liqu~d Volume Hourly Space Time, Hours (cc Catalyst/cc Oil per Hour)
Figure 16. A Typical Temperature Effect on Sulfur Removal Efficiency

122
TABLE XX
LIST OF SAMPLES COLLECTED FOR CATALYST ACTIVITY TESTS
Sample a Hoursb Avg % S in Sarnplea Hoursb Avg % S in Number on Oil Product Oil Number on Oil Product Oil
It SP 4 SPlO SP 5 18 0.071 SPll 31 0.113
SP12 SP18 SP13 37 0.065 SP19 48 0.067
SP20 SP26 SP21 55 0.014 SP27 67 0.017
HSWll HSW29 HSW12 50 0.109 HSW30 98 0.118
HSW31 HSW49 HSW32 108 0.088 HSW50 168 0.068
HSW51 HSW69 HSW52 177 0.078 HSW70 236 NA
NALll NAL20 NAL12 48 0.124 NAL21 63 0.113
NAL23 NAL32 NAL24 71 0.070 NAL33 86 0.053
NAL35 NAL44 NAL36 94 0.033 NAL45 109 0.048
asamples in these two columns were collected at the identical reactor conditions but at different time during the same experimental run.
bTotal hours which the catalyst has been in contact with oil.

123
data could be used for future industrial designs. The general assump-
tions found in the literature (60), (61), (75), (76) are that an
individual compound desulfurization follows a first order reaction
rate, but the overall desulfurization follows a second order reaction.
There are others who believe that the HDS follows a fractional order
reaction. Therefore, five kinetic models with the orders of reaction
of 1.0, 1.5, 2.0, 2.5, and 3.0 were assessed for fit of the experimen-
tal data. The kinetic model used did not incorporate any effects of
liquid distribution or liquid backmixing. These will be considered
in the next chapter. The kinetic model studied was a simple power
order such as:
(5. 3) dt
where Cs = sulfur concentration in the product oil, t = space time,
k = reaction rate constant, and n = order of reaction. Figure 17
illustrates the comparative fit of these power order models on a
typical data set. The set of data for each isotherm from different
pressures and various catalysts were tested for fit of each of the
kinetic models using a computerized least square technique. The
standard deviations for each of the model fit were also calculated.
The sum of the standard deviations for each of the kinetic model gives
an idea of the comparative suitability of the models tested~ The
results of all the kinetic model testing and the respective standard
deviations are listed in Table XXI. For a perfect fit, the standard
deviation would be zero. Hence, the lower the value the better the
model representation.

f.!
cE r-i ;j
Uj
...... s:: (l) (.) f.! (l)
.. 0..
...... -~
·r-1 (l)
;;;:;
0.2
0.1 ~ I
I o. o L _____ _____.__
0.2
Test Series: Feedstock: Catalyst: Pressure: Temperature:
NAL Raw Anthracene MCM 5 1,000 psig 650 F (343 C)
n = n = n = n = n =
1.0 1.5 2.0 2.5 3.0
----------------, , I
I Oil i
I !
-I I
~ I I
------ ----------------~--___ .!__ ___________________ , _______ -~-- l _____ _ J
0.4 0.6 0.8 1.0 1.2 1.4 1.6 Liquid Volume Hourly Space Time, Hr
Figure 17. Comparative Fit of Various Reaction Models to a Typcial Data Set

125
TABLE XXI
RESULTS OF THE RELATIVE FITS OF FIVE KINETIC MODELS
Order of Catalyst Nominal Nominal Standard Run Reaction Type Temp., F Press., psig Deviation
1 1.0 MCM 1 600 1000 0.03400 1 1.0 MCM 1 650 1000 0. 03720 5 1.0 MCM 4 650 1000 0.04660 5 1.0 MCM 4 700 1000 0.04680 5 1.0 MCM 4 750 1000 0.04160 5 1.0 MCM 4 650 500 0.04850 5 1.0 MCM 4 700 500 0.03960 5 1.0 MCM 4 750 500 0.03170 5 1.0 MCM 4 650 1500 0.04850 5 1.0 MCM 4 700 1500 0.05070 5 1.0 MCM 4 750 1500 0.03690 7 1.0 MCM 5 650 1000 0.04180 7 1.0 MCM 5 700 1000 0.02990 7 1.0 MCM 5 750 1000 0.02550
Sum of the Standard Deviations = 0.55930
1 1.5 MCM 1 600 1000 0.01940 1 1.5 MCM 1 650 1000 0.02250 5 1.5 MCM 4 650 1000 0.03160 5 1.5 MCM 4 700 1000 0.03100 5 1.5 MCM 4 750 1000 0.03130 5 1.5 MCM 4 650 500 0.03430 5 1.5 MCM 4 700 500 0.02470 5 1.5 MCM 4 750 500 0.02090 5 1.5 MCM 4 650 1500 0.03350 5 1.5 MCM 4 700 1500 0.03540 5 1.5 MCM 4 750 1500 0.02310 7 1.5 MCM 5 650 1000 0.02750 7 1.5 MCM 5 700 1000 NA 7 1.5 MCM 5 750 1000 NA
Sum of the Standard Deviations = 0.33620
1 2.0 MCM 1 600 1000 0.01070 1 2.0 MCM 1 650 1000 0. 01170 5 2.0 MCM 4 650 1000 0.02030 5 2.0 MCM 4 700 1000 0.01960 5 2.0 MCM 4 750 1000 0.02480 5 2.0 MCM 4 650 500 0.02310 5 2.0 MCM 4 700 500 0.01440 5 2.0 MCM 4 750 500 0.01240 5 2.0 MCM 4 650 150.0 0.02210

126
TABLE XXI (continued)
Order of Catalyst Nominal Nominal Standard Run Reaction Type Temp., F Press., psig Deviation
5 2.0 MCM 4 700 1500 0.02440 5 2.0 MCM 4 750 1500 0.01350 7 2.0 MCM 5 650 1000 0.01660 7 2.0 MCM 5 700 1000 0.00774 7 2.0 MCM 5 750 1000 0.01260
Sum of the Standard Deviations = 0.23394
1 2.5 MCM 1 600 1000 0.00936 1 2.5 MCM 1 650 1000 0.00418 5 2.5 MCM 4 650 1000 0.01200 5 2.5 MCM 4 700 1000 0. 01160 5 2.5 MCM 4 750 1000 0.02010 5 2.5 MCM 4 650 500 0.01450 5 2.5 MCM 4 700 500 0.00847 5 2.5 MCM 4 750 500 0.00668 5 2.5 MCM 4 650 1500 0.01360 5 2.5 MCM 4 700 1500 0.01680 5 2.5 MCM 4 750 1500 0.00783 7 2.5 MCM 5 650 1000 0.00888 7 2.5 MCM 5 700 1000 0.00209 7 2.5 MCM 5 750 1000 0.00857
Sum of the Standard Deviations = 0.14466
1 3.0 MCM 1 600 1000 0.01220 1 3.0 MCM 1 650 1000 0.00159 5 3.0 MCM 4 650 1000 0.00663 5 3.0 MCM 4 700 1000 0.00659 5 3.0 MCM 4 750 1000 0.01730 5 3.0 MCM 4 650 500 0.00800 5 3.0 MCM 4 700 500 0.00714 5 3.0 MCM 4 750 500 0.00290 5 3.0 MCM 4 650 1500 0.00758 5 3.0 MCM 4 700 1500 0.01190 5 3.0 MCM 4 750 1500 0.00610 7 3.0 MCM 5 650 1000 0.00526 7 3.0 MCM 5 700 1000 0.00400 7 3.0 MCM 5 750 1000 NA
Sum of the Standard Deviations = 0.09719

127
The sum of the standard deviations for any particular kinetic
model demonstrates that the first order model was the worst, with
suitability increaseing with complexity. This was probably an indica
tion that the HDS reaction itself is very complex.
Effects of Catalyst Pore Size Distribution
One of the major catalyst properties studied to evaluate the
relative performance of the catalyst was pore size distribution. The
five catalysts investigated for activity decay provided a wide range
of pore size distribution. This varied from a narrow range, low pore
size catalyst to a broad range, higher pore size catalysts with two
peaks in the pore size distribution. All the catalysts, save one have
essentially the same chemical compositions, according to vendor speci
fications. All five activity test runs were conducted at the identical
pre-run preparations and with the same reactor conditions during the
run. The liquid weight hourly space time for each of the run was the
same. The catalysts also had quite a range in their surface areas.
All the available properties of these five catalysts are summarized
in Table XXII. The pore size distributions of the catalysts were
estimated from the results of the mercury penetration porosimetry
performed by the American Instrument Company, Inc. The results
of the experiments by the American Instrument Company, Inc. showed
the amount of mercury that penetrated into the catalyst particle
at a given pressure. The operating pressure on the catalyst particle
corresponded to a certain pore diameter. The plots developed in
Figures 18, 19, 20, 21 and 22 are the plots of ~V/~(ln r) vs r.
These figures provide a picture of the relative frequency at which

TABLE XXII
COMPARISON OF CATALYST CHEMICAL ANALYSES AND PHYSICAL PROPERTIES
Category MCM 1 MCM 2 MCM 3 MCM 4
Chemical Analyses
Mo03, wt % 12.50 12.50 12.50 15.00
CoO, wt % 3.50 3.50 3.50 3.00
Na2o, wt % 0.08 0.08
Fe2o3, wt % 0.03 0.03
Sio2, wt % 1.50 1.50
A1 2o3, wt % 82.39 82.$9
Physical Properties
2 Surface area, m I gm 270.00 270.00 297.70 220.00
Pore volume, cc/gm 0.65 0.51 0.50
Packed density, grn/cc 0.48 0.73 0.73
MCM 5
12.50
3.50
240.00
~
N 00

,..... ... c ..... ....... <l ...... ~
0.60
0.55
0.50
0.45 1-
0.40
0.35
0.30
0.25
0.20
0.15
0.10
0.05
o.oo 10
Pore Radius (r), X
Figure 18. Pore Size Distribution of MCM 1 Catalyst ...... N 1.0

1.2
100 Pore Radius (r), ~
1000
Figure 19. Pore Size Distribution of MCM 2 Catalyst

1.3
0.4-
0.31
0.2
0.1- 0 0
o.o ·-:--o=t--=--==t=o I I
10 100 Pore Radius (r), ~
1000
Figure 20. Pore Size Distribution of MCM 3 Catalyst

1.2
0.9-
0
Pore Radius (r), X
Figure 21. Pore Size Distribution of MCM 4 Catalyst

1.4 ,-., ... s:: .... 1.2 '-' <I ;;;-<I
1.0
0.8
0.6
0.4
0.2
0.0 10 100 1000
Pore Radius (r), ~
Figure 22. Pore Size Distribution of MCM 5 Catalyst

134
certain pore diameter was occurring in a particular catalyst. The term
AV/A (ln r) represents the differential change in the amount of the
penetrating mercury by a change in the exerted pressure divided by the
natural log of the pore radius corresponding to the exerted pressure.
The raw mercury penetration data for all the catalysts and a method for
calculating AV/A (ln r) are presented in the Appendix C. The results
of the activity runs are presented in Tables XII through XVI. The
liquid weight hourly space time during each run was 0.44 hr, but
depending upon respective catalyst densities, the LVHST would vary.
Physical Properties of Feed and Product Oils
One of the major aspects of any research study is the knowledge of
the physical properties of the materials involved. Some portions of
the physical properties data were provided by the supp~ier of the feed
oil and others were generated by Sooter (61) at the earlier stages of
this research project. The primary physical properties that are more
frequently quoted for oil are chemical composition, normal boiling
point data, and density, and kinematic viscosity of its distillation
fractions. The feed oil properties and its normal boiling point data
are listed in Table XXIII.
Table XXIV lists the kinematic viscosity of the distillation
fractions of the feedstock at two different temperatures and also
lists the density of each fraction at the room temperature.
One of the side effects of the desulfurization process is cracking
of some of the higher boiling fractions. This is very well represented
in comparing the distillation fractions of the feedstock and one of the
typical product samples. The comparison of these boiling fractions is

shown in Table XXV.
TABLE XXIII
PHYSICAL PROPERTIES OF FEED OIL
Category
Carbon, wt % Hydrogen Nitrogen Sulfur
. Oxygen Ash API gravity @ 60 F (16 C)
Composition
90.65 5. 76 0.91 0.47 2.21 (difference) Nil
- 7.00
Distillation a
380 F (193 C) Initial 450 F (232 C) 10 val % 570 F (300 C) 30 val % 650 F (343 C) so val % 700 F (371 C) 70 val % 815 F (435 C) 90 val %
· ~e estimate of the normal boiling point data was carried out from ASTM 01160 data taken at a pressure of 50 Hg absolute.
135
The results of the experimental and analytical work were presented
' with some explanation as to why the particular experiment was conducted.
Analysis of the results is presented in the next chapter.

Fraction
1 2 3 4 5 6 7
Fraction
1 2 3 4 5 6 7 8
TABLE XXIV
DENSITY AND KINEMATIC VISCOSITY OF DISTILLATION FRACTIONS OF FEED
136
Density @ 77 F (25 C) g/cc
Kinematic Viscosity, Centistokes @ 100 F (38 C) @ 187.7 F (87 C)
0.959 1.020 1.060 1.075 1.092 1.107 1.122
TABLE XXV
1.71 3.48 6.22
10.57 18.04 31.10 65.93
0.813 1.293 1. 833 2.370 3.060 4.025 5.480
COMPARISON OF WEIGHTS OF DISTILLATION FRACTIONS' OF FEED AND PRODUCT SAMPLES
Feed, wt % Product, wt % % Change
10.75 14.87 + 38.40 11.58 17.28 + 49.30 12.55 11.94 4.85 10.62 12.93 + 21.70 18.05 15.24 - 15.60 8.39 7.35 - 12.40
13.21 9.40 - 29.00 14.85 10.99 - 26.00

CHAPTER VI
DISCUSSION
The results of the desulfurization experiments present an overall
picture of the chemical and physical processes involved in the trickle
bed reactor for the particular feedstock. However, further in-depth
understanding of the reaction mechanism and kinetics is essential for
future application and developments. The subjects discussed in thi~
chapter are presented in the order of increasing influence on the rate
and mechanism of the HDS reactions.
The analysis of the results begins with the test for the precision
of the data to establish the reliability of the experiments. The pre
cision tests are performed for both the process and the analytical
equipment. The subjects discussed next are the liquid distribution
and mass transfer characteristics of the fluid flow situations. These
characteristics have inherent influences of the particle size, which
are discussed jointly as well as separately. Next, the process
parameters are analyzed in much detail because of their greater
influence on the rate of reaction. The system pressure and hydrogen
flow rate are presented first. The system temperature and the space
time deserve close attention because of their dramatic effects on the
rate of reaction. Several kinetic models are investigated to represent
the results of the HDS experiments. The results from previous investi
gations are also tested on these models. The outcome of these tests is
137

138
then compared with established kinetic models. Finally, aging char
acteristics of several catalysts are examined and the influence of
various experimental elements on the active life is discussed. Quite
often the discussion of certain subjects might appear overlapping with
the presentation in other sections, but that is only to emphasize the
significance of any particular aspect of the process.
Consistency Test for Data
The consistent reproduction of the experimental data is a neces
sary and desirable condition to make any meaningful conclusions from
an experiment. There are two different stages at which the precision
of the results can be tested. The first and foremost is the precision
of the equipment operation coupled with the experimental technique.
This test can either be performed by conducting separate identical
runs at identical reactor conditions as done by Sooter (61), or con
ducting separate experimental runs at partially overlapping reactor
conditions. The results of the consistency test for equipment operation
are presented in Table XXVI.
Runs 5 and 6 have certain common reactor conditions, as do Run 7
and 8. Runs 5 and 6 were both conducted on a Harshaw catalyst MCM 4,
each with different experimental goals. The detailed reactor condi
tions for Runs 5 and 6 are presented in Tables XVII and XV respectively
of the Experimental Results Chapter. Run 6 was conducted entirely at
700 F (371 C) temperature, 1,000 psig pressure, and 0.65 liquid volume
hourly space time. Samples HSW 33 and 34 of Run 5 were collected at
identical reactor conditions as in Run 6. Similarly, Runs 7 and 8
were both conducted on a Nalcomo catalyst MCM 5. The overall reactor

139
conditions, as well as the sulfur removal results for Runs 7 and 8, are
presented in Tables XIX and XVI respectively of the Experimental
Results Chapter. .Run 8 was conducted entirely at 700 F (371 C)
temperature, 1,000 psig, and 0.74 liquid volume hourly space time.
The samples NAL 25 through NAL 27 of Run 7 were also collected at the
identical reactor conditons used in Run 8. The results shown in Table
XXVI indicate that the amount of sulfur remaining in the product
samples collected at the overlapping reactor conditions of Runs 5 and
6 were within+ 7.2% of the average and those for Runs 7 and 8 were
within+ 1.7% of the average. These reproducibilities of the experi-
mental results from different runs demonstrate the precision of the
experiment and the experimental technique.
TABLE XXVI
COMPARISON OF RESULTS FOR EQUIPMENT OPERATION CONSISTENCY TESTS
Nominal Nominal Sample %S, Std Dev Run Temp., F (C) Press., psig LVHST Numbers avg %S
5 700 (371) 1000 0.65 HSW 33 0.130 0.0095 HSW 34
6 700 (371) 1000 0.65 HRW 10 through 0.150 0.0088 HRW 40
7 700 (371) 1000 0.74 NAL 25 through 0.092 0.0037 NAL ~7
8 700 (371) 1000 0. 74 NAC 10 'through 0.095 0.0143 NAC 40

140
The second consistency test is for the precision of the analytical
equipment. Each product sample was analyzed at least three times for
sulfur content. The standard deviations of the total sulfur content
of all samples are presented in Appendix B. The average standard
deviations of the samples, grouped together according to their average
total sulfur levels, are summarized in Table XI of Experimental Results
Chapter. The degree of analytical precision attained in the present
study is compared with the level of analytical precision achieved by
Sooter (61) while using the same analytical equipment. The percent
deviations presented in Table XI show that the degree of deviation or
error in the determination of the total sulfur in the high sulfur
samples is comparatively lower than those in the low sulfur _samples.
An extensive analytical technique, as outlined in the Experimental
Procedure Chapter, was employed for the sulfur analysis. The sulfur
content of other materials and chemicals used in the analysis, such as
crucible, cover, MgO, iron chips, tin metal, etc., called "blank", was
determined prior to each day's analytical work. Also a "reference" oil
(anthracene oil) with known sulfur content was analyzed daily to
establish the "furnace factor" which would compensate for any other
factors affecting the sulfur analysis. The daily determinations of
"blank" and "furnace factor" contributed significantly to the precision
of the analytical measurements.
As mentioned earlier, the percent deviation for the samples having
higher sulfur content was found to be relatively lower than those
having low sulfur content. The high sulfur content samples were those
collected at 600 F (314 C) and 650 F (343 C). As the reaction tempera
ture rose, the extent of sulfur removal from the feedstock increased

141
to the point whereby the sulfur in the feedstock could no longer be
analyzed with experimental precision by the LECO sulfur analyzer. The
liquid volume hourly space time (LVHST) also has identical effects,
although of varying degree of sensitivity, on the analytical pre
cision as that of the reactor temperature. The higher LVHST led to
improved sulfur removal and thus lower analytical precision. Table XI
of the Experimental Results Chapter clearly showed that the average
percent deviation in the estimation stayed around 7% for product
samples having sulfur content as low as 0.06%. The percent deviation
increased rather sharply for the product samples having lower sulfur
content, such as about 11% for 0.05% sulfur samples and about 21% for
0.03% sulfur samples. These changes in the analytical precision
present the uncertainties up to which the sulfur level in the product
samples could be confidently analyzed.
Liquid Distribution and Backmixing
Adequate liquid distribution or lack of it is difficult, if not
impossible, to examine visually for the HDS studies under actual
experimental conditions. Therefore, the modes and effects of liquid
distribution are generally analyzed using empirical models developed
for other identical flow conditions. The effects of liquid distribu
tion can principally be divided into two classes, intraparticle and
interparticle.
The intraparticle effects are those of liquid distribution around
an individual catalyst particle, termed catalyst wetting effects.
These effects will be discussed in the next section of this chapter.
The interparticle effects are those based on the liquid distribution

142
patterns among the various particles of the packed reactor bed. The
formation of a third mode of liquid flow situation, wall channeling,
was minimized with the use of fine screens at both ends of the reactor.
The two extremes of liquid flowpatterns are plug flow and com
plete backmixing. The plug flow conditions provide the ideal and most
desirable mode of flow pattern for the constant flow catalyst reactors.
Any deviation from the plug flow condition means increased reactor
volume to attain the same level of chemical reaction at identical
process condition, and complete backmixing is the maximum nonideality
from the plug flow. Therefore, the trickle bed reactors are designed
to minimize the nonideality from the plug flow.
The amount of catalyst used in each of the experimental runs was
identical (20 grams), but the length of the catalyst bed in the experi
ments of the present study differed because of variable catalyst packing
densities. However, the length of the total packed bed of the reactor,
including both catalysts and inerts, was the same during all the
experimental runs.
There are several theoretical and empirical models used to deter
mine the extent of the deviation from the plug flow situation in a
trickle bed reactor. The theoretical models are called Dispersion
model (Levenspiel), Modified Mixing-Cell model (Dean), Time Delay model
(Hockman and Effron) (33). These models are based on a given set of
reaction conditions and are suitable within their defined boundaries.
Special experimental techniques are required, however, to gather data
for determining the extent of deviation. from pl'ug flow .situation.
Mears (43) developed an empirical model which is applicable to any order
of reaction and diverse conversion phenomena. For the reactor length

143
to be increased no more than 5% due to the axial dispersion effects
over a minimum length required.with plug flow, the criteria to be met
is:
(2 .1)
where L = length of the packed bed, dp = particle diameter, n = order
of reaction, Pem = Peclet number, Ci = initial concentration and
Cf = final concentration.
Some desulfurization of anthracene oil over inerts had been
demonstrated in two independent studies by Sooter (61) and Wells (114).
At reactor operating conditions of 600 F (314 C), 1,000 psig and 0.375
LVHST, Sooter observed that about 50% of the sulfur in the feedstock
was removed over the inert bed. Wells conducted his experiments on·
alumina bed using anthracene oil at reactor conditions of 750 F (399 C),
1,500 psig and LVHST up to 1.8 hour. Wells observed about 35% of the
sulfur in the feedstock was removed over the alumina bed. Since some
thermal desulfurization does occur over inert bed, the total bed length
of the reactor including both inerts and catalysts is used to estimate
the quantity L in the above equation. The quantity L for all the
experimental runs was 31 inches (78.74 ems), where the length of the
catalyst bed varied from 13.3 inches (33.78 ems) to 20.0 inches (50.80
ems), depending upon the catalyst packed bed density. The particle
diameter,~· was 8-10 mesh-(0.20 em). The quantity L/dp of the
Equation (2.1) is thus calculated to be 393.7.
It is difficult to estimate the right hand side of the above
equation. The order of the desulfurization reaction has been reported
to be first to third, as discussed in the Literature Review Chapter.

144
And the more general consensus is that the HDS reaction is a pseudo
second order reaction. Therefore, the value chosen for the quantity
n was two. The degree of sulfur removal in various experimental runs
averaged between 75% and 85% at 700 F (371 C) and 1,000 psig, with an
average sulfur removal of 81%.
The Peclet number for the experiments is estimated using the
Hockman-Effron (40) model, which is applicable for the cocurrent flow
in a trickle bed reactor. The detailed calculations for estimating
Peclet number are shown in Appendix G. The Peclet number for most of
the experimental conditions is estimated to be 0.1735. All the esti
mated values are fed into Equation (2.1). Using the value of 0.1735
for Pem and a value of two for the quantity n, with appropriate sulfur
concentrations, the right hand side of Equation (2.1) is 382.9. By
comparison, this value is less than the value for the left hand side
(393.7). Within the errors of estimation, both of these values are
essentially the same. Even then, by definition of Equation (2 .1), the
criteria for restricted (less than 5%) deviation from the plug flow
condition is met. The process conditions used to estimate the Peclet
number are the most frequently occurring reactor conditions and any
deviations from those conditions would result in change in the extent
of deviation from the plug flow conditions. However, the reactor con
ditions used for the test were considerably severe and compare closely
with most sets of reactor conditions. Therefore, axial dispersion does
not seem to effect any significant variation in the rate of the HDS
reactions.

145
Catalyst Wetting and Mass Transfer Effects
The other class of liquid distribution is the intraparticle mass
transfer. These effects are primarily caused by the resistance towards
mass transfer encountered by the reactive molecules in the liquid and
gas phases inside and around a catalyst pellet. There are several mass
transfer steps necessary within and around a catalyst pellet in order
for a heterogeneous chemical reaction to occur. These steps.include
diffusion of reactants in the gas and liquid bulk phases to the liquid
film surrounding the catalyst pellet, diffusion of reactants through
the liquid film, diffusion of reactants through the catalyst pores to
the active sites, adsorption of reactants on the active sites, chemical
reaction between the reactive molecules on the catalyst surface,
desorption of products from the active sites, diffusion of the products
through the catalyst pores, diffusion of products through the liquid
film and, finally, the diffusion of products to the bulk gas and liquid
phases. Any one or a combination of these steps could be the rate
controlling step(s) for a specific reaction. The reactants in the
present case are the sulfur containing compounds in anthracene oil and
hydrogen, and the overall reaction is hydrodesulfurization. The
catalytic phenomenon is characterized by the assumption that, in the
gas-liquid-solid reaction, a fresh batch of anthracene oil almost com
pletely surrounds each and every catalyst pellet, and the hydrogen and
sulfur containing molecules have to diffuse through the liquid film for
the reaction to occur.
The above indicates that any heterogeneous chemical reaction can
hardly be modelled without incorporating catalyst wetting. The

146
phenomenon of an individual catalyst pellet being freshly wetted by the
flowing liquid is defined as catalyst wetting (43). The major design
variables affecting catalyst wetting are liquid flow rate, gas flow
rate, interparticle liquid distribution, physical properties of liquid,
shape and size of the catalyst pellets, reaction temperature, pressure
and length of the packed bed. There are no simple models available in
the literature to estimate catalyst wetting. A complex model requiring
numerous operating conditions is discussed later in this chapter.
Secondly, the visual counting of the freshly wetted catalyst pellets in
a packed bed is impossible under actual experimental conditions. Mears
(43) has developed a kinetic model incorporating catalyst wetting to
represent the HDS reactions for coal liquids. Mears suggests that,
besides other process parameters, the rate of chemical reaction is
directly proportional to the catalyst external surface effectively
wetted by the flowing liquid. However, Sylvester and Pitayagulasarn
(51) claimed that for certain heterogeneous chemical reactions, the
rate of chemical reaction is inversely proportional to the catalyst
external surface effectively wetted by the flowing liquid. The results
of their study demonstrated that for a non-volatile liquid phase,
Mears' concept of direct proportionality holds true. However, for a
volatile liquid phase, the gas phase to liquid phase diffusi vi ty ratio
of the reactants (benzothiophene and dibenzothiophene) determines the
effects of catalyst wetting. Sylvester and Pitayagulasarn illustrated
that, at higher gas phase to liquid phase diffusion ratio of the
reactants, the reaction rate increased as catalyst wetting increases.
And conversely, at lower gas phase to liquid phase diffusion ratio of
the reactants, the reaction rate decreased as catalyst wetting

147
increased. Since the feedstock used in the present study was a non
volatile high molecular weight feedstock, the rate of the HDS reaction
increases as the catalyst wetting increases, and vice versa.
The experiments by Paraskos, Frayer and Shah (115) also support
the influence of catalyst wetting on the rate of HDS reaction. The
effective catalyst wetting as correlated by Mears is shown in Equation
(6 .1):
(6 .1)
where, Aeff = correlation factor for the rate of HDS reaction, L =
length of catalyst bed, C = proportionality constant, y =Mears' con
stand and LHST = liquid hourly space time. The above mentioned
arguments suggest that catalyst wetting would be a contributing factor
in determining the rate of the HDS reaction. The effects of catalyst
wetting will be estimated along with the effects of reactor temperature
and space time later in this chapter. Equation (6.1) will be coupled
with certain kinetic models and tested to represent the results of the
experiments conducted during the present study and those conducted by
Sooter (61).
Particle Size and Effectiveness Factor
There are two sets of physical properties of a catalyst particle -
internal and external - that can contribute to the influence of a cata
lyst on the rate of the HDS reaction. The internal properties are
based upon the catalyst pore size, and these will be evaluated in later
sections. The external propoerties depend primarily on the size of a
catalyst particle. Eyen though both types of properties relat~ to the
same catalyst particle, either the internal or the external properties

of a catalyst can be altered to a certain degree by physical and
chemical techniques without affecting the other.
148
The change in the size of a catalyst particle can have at least
three different effects on the flow characteristics and thereby on the
rate of the HDS reaction. The first among these is an effect on the
interparticle liquid distribution. Referring to Equation (2.1) pre
sented earlier in this chapter, with other quantities held constant,
the catalyst particle size can be changed appropriately to minimize the
occurrence of liquid backmixing in the trickle bed reactor. Plug flow
is the ideal and most desirable mode of flow for the HDS studies.
Therefore, reducing the catalyst particle size can minimize any pre
vailing backmixing effects and approach plug flow more closely.
The second effect of changing particle size is on the packed bed
density. However, the experiments by many researchers (116) including
Sooter (61) in studies directly related to the present work, have
demonstrated conclusively that a reduction in the particle size does
not noticeably increase the packed bed density. Therefore, the poros
ity of the packed bed remains almost identical for particles within a
certain size range. However, a drop in the particle size does reduce
the center-to-center distance between the adjoining particles, which
results in a higher pressure drop across the packed bed at the same
flow rates. On an industrial scale, this can mean an additional
capital investment as well as increased operating costs. At times,
these items do become significant enough to be decisive factors in the
selection or rejection of a particular catalyst for a given process or
a process for a given product.

149
A more direct effect of the catalyst particle size on the HDS
reaction rate is presented by Satterfield (32), and other researchers
before him, who derived the definition of an effectiveness factor (n).
Even though the concentration of a reactant in the catalyst pore would
vary, the average concentration is generally used in formulating the
reaction rate models. The effectiveness factor is defined as the ratio
of the average concentration of a reactant in the catalyst pore to the
maximum possible concentration. The numerical value of n varies from
near 0 to 1.0 for isothermal pellets. The effectiveness factor is
estimated through another variable known as the Thiele modulus ~. n
and ~ are correlated as shown in Equation (6.2) for spherical particles:
n = 1 -----,:-2 (3~ coth 3~ - 1)
3 ~
and ~ is defined as in Equation (6.3):
~ = R k . cm-1 1/2 3 ( D 5 )
eff
(6. 2)
(6. 3)
where, R is the radius of the catalyst particle (the ratio of catalyst
volume to catalyst surface area replaces the term R/3 for non-spherical
particles), k is the reaction rate constant per unit catalyst surface
area, Cs is the concentration of the reactant (sulfur containing com-
pounds), m is the order of reaction, and Deff is the effective diffu
sion coefficient of the reactant (sulfur containing compounds). Figure
23 demonstrates the relationship between n and 4>, as in Equation (6.2).
A lower value of~ would mean a higher n• and vice versa. Equation
(6.3) describes ~ in direct proportionality with the particle size.
Therefore, with other quantities remaining constant in Equation (6.3),

150
1.0 --- ·-·- r ··--·--- ~ . ~ ~ r--- ---T--r
0.8 ·--~
------~-- ~
0.6 - ~~ Spherical· r= Particle ~ .. ~ 1-t 0 ~ 0. 4 --u ~ I l:l..
I !/)
I !/) G)
= G)
> 0.2 "' •.-t - '
~ ~ u ~ ~ w
'· 0.1 j_ __ ·,,
·-·---·-·
0.4 1 2 4 6 8 10
Thiele Modulus, ~
Figure 23. Thiele Modulus vs. E.ffectiveness Factor

151
the catalyst particle size can be adjusted sufficiently to increase
the effectiveness factor. However, the sensitivity of changing
particle size would depend largely upon the other properties included
in Equation (6.3).
Calculations to estimate~ and n are presented in Appendix I.
The predicted values of the physical properties of hydrogen and sulfur
containing compounds, or their equivalent (dibenzothiophene) are
presented in Appendix H. These physical properties and the average of
the second order reaction rate constant are used to estimate ~ and n.
The Thiele modulus for the HDS reactions at 700 F (371 C) and 1,000
psig is computed to be 0.125 and the effectiveness factor is computed
to be 0.99. The estimation of the effectiveness factor to be essen~
tially unity suggests that the rates of diffusion of hydrogen and
sulfur containing compounds through the catalyst pores have an in
significant effect in determining the overall rate of the HDS reactions
for the process conditions and catalysts investigated during the
present study. A similar conclusion was drawn by Sooter (61) in
studies directly related to the present work.
The discussion so far has been focused on the mass transfer and
fluid dynamics of the trickle bed reactor system and their effect on
the HDS reaction rates. The discussion in the following sections is
directed towards process parameters such as concentrations, pressure,
temperature and the space time which are generally known to have a
greater influence on the HDS reaction rate.

152
Hydrogen Rate
Hydrogen is one of the key reactants in the HDS reactions, and
therefore, any variations in the hydrogen flow rate could have multiple
effects on the reaction rate. Theoretically, there are primarily three
effects that changes in the hydrogen flow rate can have on the overall
reaction rate - (a) an effect on the rate of mass transfer of hydrogen
from the bulk gas phase through the liquid film surrounding the cata
lyst pellet because of the hydrogen concentrations in the bulk gas
phase; (b) an effect on the degree of wetted external catalyst surface
because of the film disturbance caused by the mass transfer of hydrogen
through the liquid film surrounding catalyst pellet; and (c) the simple
effect of the law of mass action of hydrogen at the reaction site to
complete the overall HDS reactions .
The diffusional mass transfer of hydrogen through the liquid film
surrounding the catalyst pellet is one of the several major steps in
volved in achieving the HDS reactions. Among others, the major factor
in determining diffusion rate is the difference in the hydrogen con
centrations in the bulk gas phase and the liquid phase and also the
differential hydrogen concentrations in the liquid phase and in the
catalyst pores. The estimation of diffusion rate for individual pores
is beyond the scope of the present study, but the calculations for an
average diffusion rate are presented in Appendix H along with other
physical property estimations of hydrogen and sulfur containing com
pounds. Increasing the hydrogen diffusion rate to liquid phase and
to the catalyst pores would improve the HDS reaction rate only if the
hydrogen transfer is a rate controlling step. The experiments by

153
Wan (52) and Sooter (61) demonstrated that bulk hydrogen flow rates as
low as 1,500 scf per Bbl did not affect the sulfur removal capability
of the catalyst tested for the same feedstock and with identical
experimental conditions. Therefore, the bulk hydrogen flow rate in
the present study was always maintained above 1,500 scf/Bbl.
The bulk hydrogen flow rate also has a bearing on the catalyst
wetting characteristics. Higher bulk flow rate of hydrogen would tend
to disturb the existing liquid film around the catalyst pellet, and
thereby, improve the prospects of formation of fresh liquid film around
catalyst pellet. Thus, an increase in the bulk hydrogen flow rate
would tend to increase the catalyst wetting phenomenon for inGompletely
wetted catalysts. The contribution of the catalyst wetting phenomenon
will be correlated later in this chapter to represent the rates of HDS
reactions.
Foremost of all the concerns is that a sufficient quantity of
hydrogen is supplied to the reaction zone. The gas flow rate in the
present study was measured as the product gas exited from the reactor
at the ambient conditions. The measured gas flow rate corresponded to
the excess or unreacted hydrogen and the gases generated during the
HDS reaction. Brunn, et al. (117) reported that, during their HDS
studies on residual fuels via the Gulf process, the maximum quantity
of the fuel gas vaporized was estimated to be 5%. Chern Systems (118)
reported that during their coal liquefaction studies on a coal sample
from the Pittsburg and Midway Coal Company (PAMCO) at reactor condi-
tions up to 800 F (427 C) and 3,000 psig, the maximum coal extract
vaporized in the cocurrent upflow packed bed reactor was not more than
5 ~ 0. The molecular weight (MW) of the product vapor mixture exiting

the reactor was estimated to be approximately 28.6 by Chern Systems
(ll R).
154
Based on the above observations, the gas produced in the reactor
is estimated to be 238 scf/Bbl of oil fed. Detailed calculations are
presented in Appendix D. Therefore, of a total effluent gas flow rate
of 1,500 scf/Bbl, at least 1,262 scf/Bbl was hydrogen. From the cal
culations shown in Appendix E, about 431 scf/Bbl of hydrogen was
consumed in the various heterogeneous reactions. Therefore, the
hydrogen flow rate at the inlet to the reactor was approximately
1,693 scf/Bbl, an excess of 1,500 scf/Bbl. These calculations, coupled
with the findings of Wan (52) and Sooter (61) regarding no noticeable
increase in the sulfur removal capability with the bulk flow rate of
hydrogen gas in excess of 1,500 scf/Bbl, indicate that sufficient
quantity of hydrogen gas was provided to the system to minimize any
variations in the sulfur removal capabilities of the catalyst because
of the hydrogen supply situations.
Pressure Effects
The primary contribution of the total reactor pressure in the HDS
reaction is its influence on the diffusional mass transfer of hydrogen
gas through the liquid film surrounding the catalyst pellet to the
catalyst pores. Changes in the total reactor pressure almost change
proportionately the hydrogen partial pressure and the hydrogen molar
concentration, which are needed to rnaterilize the diffusion of hydrogen
when the liquid film is not saturated with hydrogen molecules. The
results of previous investigations by Wan (52) and Sooter (61) have
shown that there is an increase in the rate of the HDS reaction with

155
increase in the total reactor pressure from 500 psig to 1,000 psig,
hut relatively little effect when changing the total reactor pressure
from 1,000 psig to 1,500 psig.
One of the goals for conducting Run 5 (HSW series) of this study
was to investigate the effect of change in the total reactor pressure
on the overall HDS reaction rate along with the effects of reactor
temperature and the liquid volume hourly space time. A Harshaw cata
lys~, MCM 4, was used during this experimental run. The results of
Run 5 are presented in Table XVII of the previous chapter, and are
shown in Figures 24, 25, and 26. Each of these figures illustrates the
influence of the total reactor pressure at reactor temperatures of
650 F, 700 F, and 750 F (343 C, 371 C, and 399 C) respectively.
Figures 24, 25, and 26 do not show signs of any distinct trend in
the extent of sulfur removal and consequently in the rate of HDS
reaction, by changing reactor pressure from 500 to 1,000 to 1,500 psig.
These figures indicate that, despite the increase in the total reactor
pressure, the HDS reaction rate has not changed noticeably for this
catalyst, because the liquid is saturated by the hydrogen molecules
and/or all the reaction sites are occupied with the reactive molecules.
The above results are in contrast to the study by Sooter (61) on an
identical feedstock but different catalyst. However, the results of
Run 5 have shown a remarkable consistency of this lack of pressure
effect at the three temperature conditions.
The support material used for the Harshaw catalyst and the Nalco
catalyst used in Sooter's study were similar with the four major
differences. The Harshaw catalyst had the surface area of 220 m2/gm,
15% of Mo03, 3% of CoO, and the pore radius of 50 ~. Whereas, the

O.S fFeed
0.4 ~ i I
0. 3l_
i
0.2 ~ [J
2 I I I !
0.1 f--I
! I I I
0 0.2 0.4
~
--~!
Series: HSW Feed: Anthracene Oil Catalyst: MCM 4 Temperature: 650 F (343 C) Pressure: tl 500 psig
0 1,000 psig B., 1, 500 psig
l~J
~
_l_._· ---L-----~-L--·-·-·-·--_j_, __ _ 0.6 0.8 1.0 1.2
Liquid Volume Hourly Space Time, Hours (Volume of Catalyst/Volume of Oil/Hour)
Figure 24. Effect of Pressure on Sulfur Removal at 650 F
i !
l I
---< I i
1.4

~
'M 0
.jJ u ;:j
"Cl 0 !-l
0...
I=! 'M
!-l ;:j
4-1 ~ ;:j
(/)
.jJ
I=! Q)
u !-l Q)
0...
.jJ
..c: bl)
'M Q)
::;::
0.5~---------,---- l -~~ --~ i
I 0.3! I I I
i 0. 2 r-
I I I
0.1 ~
0
Feed
0 8 0 0
~
0.2 0.4 0.6
Series: HSW Feed: Anthracene Oil Catalyst: MCM 4 Temperature: 700 F (371 C) Pressure: 0 500 psig
0.8
0 1,000 psig &. 1,500 psig
1.0 1.2
8 0
0
.Liquid Volume Hour~y Space Time,· Hours (Vqlume o:f C<J,talyst/Volume of Oi;I./Hour)
Figure 25. Effect of P!'essure on Sulfur Removal at 700 F
1 I I i
i I I
1.4

..-I ·r-1 0
.jJ (.)
.g 0 ~
0..
,::::: ·r-1
~ ::s 4-1 ..-I ::s (/)
.jJ ,::::: Q) (.) ~ Q)
0..
.jJ
fa ·r-1 (])
::s:
0.5r-
f Feed
I 0.4 ~
I
I 0.3 L
I
i
i 0.2 r-
I
0.1 i 6
§
0 0.2 0.4
£.,.
8
0.6
' Series: HSW Feed: Anthracene Oil Catalyst: MCM 4 Temperature: 750 F (399 C) Pressure: 0 500 psig
0.8
0 1,000 psig 6 1,500 psig
1.0 1.2.
0
Liquid Volume Hourly Space Time, Hours (Volume of Catalyst/Volume of Oil/Hour)
Figure 26. Effect of Pressure on Sulfur Removal at 750 F
--j I
I
_j
I I
I
1.4
....... (J'1
00

159
Nalco catalyst had the surface area of 270 m2/gm, 12.5% by weight Mo03,
3.5% by weight CoO, and the pore radius of 33 ~. The greater pore
radius reduces the resistance for the sulfur containing molecules to
reach the reaction sites. The Harshaw catalyst had about 19% less
surface area than the Nalco catalyst. Consequently, the reaction sites
of the Harshaw catalyst could accommodate fewer reactants than the
Nalco catalyst on a unit mass basis. Therefore., the inference from the
above results is that the effects of the total reactor pressure depend
largely upon the catalyst used for the study.
Temperature and Space Time Effects •
The principal gaseous product of the feedstock desulfurization
reaction is H2s. The heat of formation of H2s from its elemental
components is exothermic (119). Two published studies (89), (90) have
attempted to formulate the desulfurization reaction network by working
with two of the most frequently occurring sulfur containing compounds
in the feedstocks, thiophene and methyldihydro-benzothiophene. The
pathways detected in these studies indicate that, even though one of
intermediate steps during the overall desulfurization reaction is
rev~rsible, the H2S forming reaction step is irreversible. A recent
study by Ueda, et al. (120) estimated the heat of HDS reaction of
heavy oil to be -51,700 Btu/mole (-28.7 Kcal/mole). Combining the
observations of irreversibility and heat generation during HzS
formation, the overall HDS reaction appears to be exothermic and
irreversible. Such reacting systems are difficult to study under
isothermal conditions.

160
Because of the exothermic nature of the liDS reaction, the tempera
ture control at the two ends of the catalyst zone in the packed bed
was critical and most of the diversions from the desired isothermal
conditions occurred in those regions. Otherwise, the temperature
profiles along the axial direction of the catalyst bed were almost
flat and isothermal (see Figure 13). The uniform heating of the
reactor from all sides by the specially designed heaters significantly
improved the isothermic condition in the catalyst bed. The thermo
couple of the temperature programmer measured the wall temperature of
the reactor. The thermocouple in the thermowell measured the
temperature along the central axis of the reactor. The temperatures
measured during the present study by these thermocouples showed a
maximum radial deviation of 3 F (1.6 C). These radial temperature
gradients are almost identical to those observed in the axial
direction and amount to less than 0.5% of the desired temperature.
TI1erefore, the reactor, and especially the catalyst zone, will always
be isothermal.
The overall reactor isothermic condition also means negligible
temperature gradient in the catalyst pores. The temperature gradient
in the catalyst pores depends upon the physical and chemical properties
of the reacting fluid and catalysts. The detailed calculations pre
sented in Appendix J indicate that the maximum possible temperature
gradient in the catalyst pores would not exceed 2.3 F (1.3 C). Since
the temperature gradient in the catalyst pores was no more than the
temperature gradient in other parts of the reactor, the overall
temperature in the reactor could be assessed as isothermal.

161
The effects of the reactor temperature and space time on the rate
of the overall desulfurization reaction are incorporated in the rate
model. However, the temperature effects are generally incorporated
indirectly in the determination of the reaction rate constant, k. The
dependence of k on reaction temperture, T, is expressed by the
Arrhenius law as showri in Equation (6.4).
k = A . e ~E/RT (6. 4)
where, A = proportionality constant or frequency factor, ~E = activa
tion energy and R = universal gas constant. The estimated values of k
will be presented later in this section and Equation (6.4) will be used
to determine the activation energies of the various HDS reactions.
The general assumptions found in the literature (59), (60), (83),
(86) state that an individual compound desulfurization follows a first
order reaction, but the overall desulfurization reaction follows a
second order reaction. There are others who believe that the HDS
reaction follows a fractional order reaction (97). Therefore, a simple
nth order reaction rate model as shown in Equation (5.3) was tested to
determine the order of the overall HDS reaction.
n
where, Cs = sulfur concentration in the product oil
t = space time
k = reaction rate constant
and n = order of reaction
(5. 3)
The simple power mod~l shown in Equation (5.3) with varying values
of n ranging from 1.0 to 3.0 at an interval of 0.5, was used to fit the
data collected during the desulfurization experiments. The results

162
of the data fit are presented in Table XXI of the Experimental Results
Chapter, and show that the degree of fit improves as the order of the
reaction is increased. The third order reaction rate model provides
the best fit. This continuing improvement in the data fit suggests
that, if the order of the reation rate model is increased further, the
degree of fit will improve. However, the information available in the
literature overwhelmingly indicates that the order of the HDS reaction
lies between one-half and three (59), (60), (75), (76), (77). This
leads one to infer that the HDS reaction mechanism is not well repre
sented by rate models as simple as Equation (5.3). The overall HDS
reaction mechanism appears to be quite complex and one of the major
factors affecting the HDS reaction could be the fluid flow character
istics of the trickle bed, such as liquid backmixing and catalyst
wetting, In his study on the same feedstock, Sooter (61) developed
a rate model consisting of two parallel first order reactions without
incorporating any flow characteristics. However, the perfect fit
offered by Sooter's model appears to be incomplete and unsupported by
other experiments. The basis for these remarks is discussed later in
this section.
The effects of various flow characteristics were discussed earlier
in this chapter. The discussion demonstrated that the deviations from
the plug flow situations were very negligible (less than 5%) and, con
sequently, would have no significant influence on the rate of the HDS
reaction. The earlier discussion also showed that catalyst wetting
could be playing a role in the rate of the averall HDS reaction. The
influence of catalyst wetting is correlated into the fomulation of the
reaction rate model using Mears' (42) model as shown in Equation (6.1).

163
Based on the literature survey, the Mears' model is often used to
correlate catalyst wetting and liquid holdup. The Mears' constant, y,
represents the fraction of the external catalyst pellet surface not
effectively wetted by the fresh batch of flowing liquid. Physically,
y represents the fraction of the average external catalyst surface,
and thereby the fraction of the catalyst bed, which is not actively
participating in the HDS reaction at one time or another.
Paraskos, Frayer and Shah (115) extensively used the Mears' model
to represent various reactions, including desulfurization, denitro
genation, and demetallization of petroleum feeds. They applied the
Mears' model to first and second order HDS reactions and the results
of t~eir study indicated that the value of 1 - Y varied from 0.532 to
0. 922. Paraskos, et al. (llS) reported that the value of y which
ranges from 0.078 to 0.468 decreased with an increase in the reaction
temperature for most of the reactions, but the value of y did decrease
with an increase in the reaction temperature for a few of the reactions.
This variable change indicates that the Mears' constant, y, stays
between 0.078 and 0.468 but ascends or descends with temperature
depending upon the type of reaction. However, as suggested by Mears,
y stays more closely to and averages about 0.32 at reaction temperatures
from 650 F to 800 F (343 C to 427 C) and pressures from 1,000 psig to
2,000 psig.
The most frequently occurring sulfur containing compounds found in
anthracene oil are thiophene, benzothiophene and dibenzothiophene (94).
The kinetics of HDS of one or more of these compounds from residual
oils have been investigated by several researchers. Hargreaves, et al.
(79) reported that the HDS of thiophene followed a first order reaction.

164
Bartsch and Tanielian (80) studied the HDS of benzothiophene (BT) and
dibenzothiophene (DBT) and reported that both of these compounds follow
a second order reaction rate model. Aboul-Gheit, et al. (77) investi
gated the HDS of thiophene in crude oil and found that thiophene
followed a pseudo-first order reaction. Lee and Butt (78), while
studying the HDS of thiophene, observed that the HDS reaction was first
order with respect to thiophene and hydrogen each, and the overall
reaction rate was a second order. The desulfurization experiments by
Yergey, et al. (86) on ten different coal samples showed that the
organic sulfur containing compounds in these coal samples followed
different orders of reactions ranging from one-half to two. The exper
iments by Cecil, et al. (74) also showed that, in the HDS studies, the
sulfur containing compounds in coal samples followed variable orders
of reactions ranging from one to two. From all the above observations,
the HDS reactions for the coal derived liquids would also follow
one-half to second order of reactions.
The Mears' effective catalyst wetting model can be incorporated
with any of the simple order reaction ~ate models. Because of the
above mentioned findings of variable orders of reactions being followed
by the sulfur containing compounds during the desulfurization experi
ments, the results of this study are correlated into first and second
order reaction rate models. The most appropriate reaction rat~ model
is then selectedbased upon the best of the two fits and the estimated
value of Mears' constant. The fir'st and second order reaction rate
models correlating yare shown in Equations (6.5) and (6.6). No
catalyst wetting problems exist at y = 0 if the real reactions are
first or second order.

165
Pirst order rate model:
(6. 5)
Second order rate model:
(6. 6)
where, co = sulfur concentration at the reactor outlet
Ci = sulfur concentration at the reactor inlet
kl & k2 = modified reaction rate constants
t :: liquid hourly space time
y =Mears' constant
The Equations (6.5) and (6.6) each have two unknowns,k1and Y or k2
andy, respectively. The results of the HDS experiments presented in
the previous chapter are used to estimate these unknowns with the help
of the non-linear regression analysis (121). The value of Ci was
constant at all times because the same feedstock was used during all
of the experimental runs of this study. The values of C were deter-.. 0
mined at the preselected values of 1 for various catalysts. The sets
of data used for the regression analysis are listed in Table XXVII.
More than two sets of data points are required to avoid getting unique
values for k1 andY or k2 andY in the Equations (6.5) and (6.6),
respectively. Therefore, the minimum required three sets of data
points encompassing a wide range of values for C0 and 1 were collected
at various reactor conditions to correlate in Equations (6.5) and (6.6).
The results of non-linear regression analyses are presented in Tables
XXVIII and XXIX. Some of Sooter's (61) data on the same feedstock
using different catalysts were also te~ted to fit both of the above
mentioned models. The results of their fit are also included in

TABLE XXVII
SETS OF DATA USED FOR THE NON-LINEAR REGRESSION ANALYSIS
Nominal Nominal Run Temp., F Press. , psig cl Tl c2 T2 c3 T3
1 600 1000 0.165 0.626 0.090 1. 250 0.075 2.500 1 650 1000 0.130 0.626 0.090 1.250 0.065 2.500 5 650 1000 0.190 0.325 0.157 0.650 0.109 1.300 5 700 1000 0.156 0.325 0.130 0.650 0.088 1.300 5 750 1000 0.089 0.325 0.051 0.650 0.078 1.300 5 650 500 0.205 0.325 0.167 0.650 0.128 1.300 5 700 500 0.130 0.325 0.107 0.650 0.060 1.300 5 750 500 0.082 0.325 0.060 0.650 0.048 1.300 5 650 1500 0.188 0.325 0.156 0.650 0.113 1.300
·5 700 1500 0.144 0.325 0.102 0.650 0.100 1.300 5 750 1500 0.107 0.325 0.089 0.650 0.050 1.300 7 650 1000 0.209 0.370 0.168 0.740 0.112 1.480 7 700 1000 0.106 0.370' 0.067 0.740 0.048 1.480 7 750 1000 0.045 0.370 0.044 0.740 0.033 1.480
Sooter's Data (61) 2 650 1000 0.100 0.375 0.077 0.750 0.049 1.500 2 600 1000 0.182 0.375 0.131 0. 750 0.091 1. 500 3 700 500 0.085 0. 375 0.043 0.750 0.027 1.500 3 650 1000 0.093 0.375 0.078 0. 750 0.042 1.500 3 650 1500 0.104 0.375 0.052 0. 750 0.040 1.500 3 650 500 0.134 0.375 0.095 0. 750 0.062 1 .. 500 3 600 1000 0.166 0.375 0.114 0.750 o·. 082 1.500
10 600 1000 0.089 0.375 0.142 0.750 0.091 1.500 10 650 1000 0.109 0.375 0.083 0. 750 0.051 1.500
f-' 0\ 0\

TABLE XXVIII
RESULTS OF THE NON-LINEAR REGRESSION ANALYSIS OF FIRST ORDER REACTION MODEL
Nominal Nominal Run Catalyst Temp., F (C) Press. , psig · kl y
Present Study
1 MCM 1 600 (314) 1000 1. 341 0.569 1 MCM 1 650 (343) 1000 1. 505 0.684 5 MCM 4 650 (343) 1000 1.311 0.657 5 MCM 4 700 (371) 1000 1. 515 0.702 5 MCM 4 750 (399) 1000 1. 919 0.370 5 MCM 4 650 (343) 500 1.193 0.676 5 MCM 4 700 (371) 500 1.808 0.674 5 MCM 4 750 (399) 500 2.196 0.803 5 MCM 4 650 (343) 1500 1.294 0.682 5 MCM 4 700 (371) 1500 1. 536 0.800 5 MCM 4 750 (399) 1500 1. 991 0. 715 7 MCM 5 650 (343) ' 1000 1.200 0.589 7 MCM 5 700 (371) 1000 2.070 0.682 7 MCM 5 750 (399) 1000 2.515 0.915
Average y = 0.680 Sub total
· Sooter's Study (61)
2* MCM 2 650 (343) 1000 1.996 0.732 2* MCM 2 600 (314) 1000 1.411 0.603 3* MCM 2 700 (371) 500 2.561 0.601 3* MCM 2 650 (343) 1000 2.062 0.730 3* MCM 2 650 (343) 1500 2.269 0.610 3* MCM 2 650 (343). 500 1.763 0.654 3* MCM 2 600 (314) 1000 1.530 0.622
10* MCM 2 600 (314) 1000 1.371 0.577 10* MCM 2 650 (343) 1000 1.934 0.704
Average y = 0.648 Sub total
Overall Average y = 0.668 Gra,.nd total
*The Run numbers are same as in reference (61).
167
Standard Deviation
0.01265 0.00252 0.00384 0.00433 0.01530 0.00032 0.00673 0.00180 0.00285 0.00913 0.00596 0.00375 0.00339 0.00248
= 0.06605
0. 00212 0.00181 0.00375 0.00597 0.00736 0.00020 0.00374 0.00169 0.00250
= 0.02914
= 0.09519

Run
TABLE XXIX
RESULTS OF THE NON-LINEAR REGRESSION ANALYSIS OF SECOND ORDER REACTION MODEL
Nominal Nominal Catalyst Temp., F (C) Press., psig k2 y
Present Study
1 MCM 1 600 (314) 1000 6.163 0.153 1 MCM 1 650 (343) 1000 7.572 0.361 5 MCM 4 650 (343) 1000 5.787 0.431 5 MCM 4 700 (371) 1000 7.563 0.468 5 MCM 4 750 (399) 1000 12.430 0. 853 5 MCM 4 650 (343) 500 4.908 0.479 5 MCM 4 700 (371) 500 10.830 0. 368 5 MCM 4 750 (399) 500 17.078 0.540 5 MCM 4 650 (343) 1500 5. 6.51 0.473 5 MCM 4 700 (371) 1500 7.812 0.618 5 MCM 4 750 (399) 1500 13.422 0.410 7 MCM 5 650 (343) 1000 4.991 0.338 7 MCM 5 700 (371) 1000 14.986 0.292 7 MCM 5 750 (399) 1000 24.187 0. 775
Average y = 0. 468 Sub total =
Sooter's Study (61)
2* MCM 2 650 (343) 1000 13.640 0.420 2* MCM 2 600 (314) 1000 6.700 0.300 3* MCM 2 700 (371) 500 26.010 0.000 3* MCM 2 650 (343) 1000 14.670 0.411 3* MCM 2 650 (343) 1500 19.060 0.080 3* MCM 2 650 (343) 500 10.420 0.312 3* MCM 2 600 (314) 1000 7.829 0.301
10* MCM 2 600 (314) 1000 6.344 0.273 10* MCM 2 650 (343) 1000 12.704 0.378
Average y = 0.275 Sub total =
Overall Average y = 0.392 Grand total ;:;
* The Run numbers arc same as in reference (61).
168
Standard Deviation
0.01083 0.00153 0.00488 0.00517 0.01523 0.00120 0.00776 0.00143 0.00374 0.00873 0.00674 0.00516 0.00241 0.00254
0. 07735
0.00282 0.00035 0.00247 0.00666 0.00598 0.00097 0.00236 0.00331 0.00335
0.02827
0.10562

169
Tables xxvrrr and XXIX.
The Mears' constant is an indicator of the fraction of the exter
nal catalyst surface not surrounded by a fresh batch of flowing liquid,
and consequently, not actively participating in the HDS reaction. The
average values of y are 0.668 by the first order reaction rate model
and 0.392 by the second order reaction rate model. This indicates
that about 39% or 67% of the reactor bed was not actively involved in
the HDS reaction at any given time. The experiments by Mears have
found the value of Y to be averaging 0.32. These results are later
used in this section to determine the appropriate reaction rate model
most suitable for the HDS reaction.
There are four primary conclusions that can be derived from the
results of the regression analysis. The first of these conclusions is
regarding the comparative fit of the reaction rate models presented in
Table XXX and the relative fit of a typical and representative data
set to the reaction rate models is illustrated in Figure 27. Com
paring the overall standard deviations shown in Table XXX, the data
fit of both the models incorporating the effective catalyst wetting
are significantly better than all the simple nth order reaction rate
models. The inclusion of effective catalyst wetting improves the data
fit by 20% to 30% compared to the previous best of the third order rate
model. Despite the fact that a model with two adjustable parameters is
likely to have a better data fit than a one parameter model, the im
provement in the data fit also demonstrates that the HDS reaction is
more complex than just a simple nth order reaction. Therefore, the
results reflect that the effective catalyst wetting is very likely a
significant factor in the HDS reaction rate. A clear cut choice

0.5
0.3
I I
0.2 L I i
0.1 L
Series: NAL Feed: Anthracene Oil Catalyst: MCM 5 Temperature: 700 F (371 C) Pressure: 1,000 psig
n = 1.0 n = 1.5 n = 2.0
---- n = 2.5 ----- n = 3.0 ------ -- n = 1 & 2 with catalyst
wetting
l I
~ i
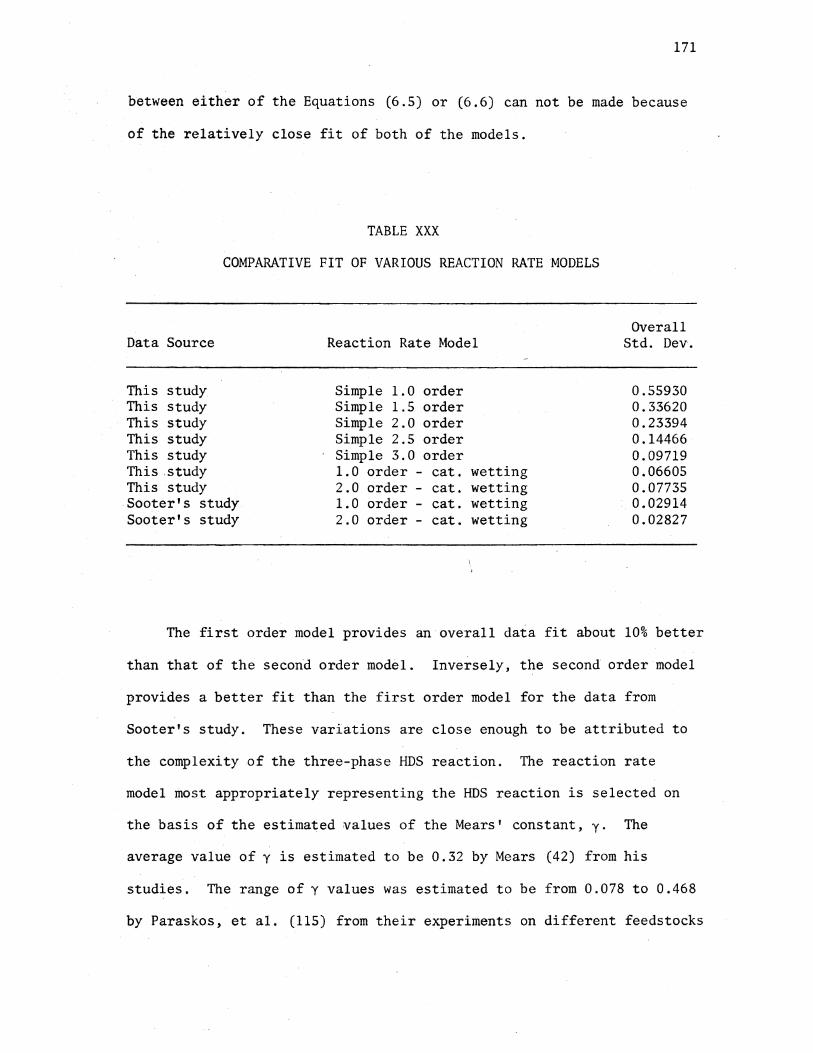
171
between either of the Equations (6.5) or (6.6) can not be made because
of the relatively close fit of both of the models.
TABLE XXX
COMPARATIVE FIT OF VARIOUS REACTION RATE MODELS
Overall Data Source Reaction Rate Model Std. Dev.
This study Simple 1.0 order 0.55930 This study Simple 1.5 order 0.33620 This study Simple 2.0 order 0.23394 This study Simple 2.5 order 0.14466 This study Simple 3.0 order 0. 09719 This study 1.0 order - cat. wetting 0.06605 This study 2.0 order - cat. wetting 0. 07735 Sooter's study 1.0 order - cat. wetting 0.02914 Sooter's study 2.0 order - cat. wetting 0.02827
The first order model provides an overall data fit about 10% better
than that of the second order model. Inversely, the second order model
provides a better fit than the first order model for the data from
Sooter's study. These variations are close enough to be attributed to
the complexity of the three-phase HDS reaction. The reaction rate
model most appropriately representing the HDS reaction is selected on
the basis of the estimated values of the Mears' constant, y. The
average value of y is estimated to be 0.32 by Mears (42) from his
studies. The range of y values was estimated to be from 0.078 to 0.468
by Paraskos, et al. (115) from their experiments on different feedstocks

172
(varying fractions of Kuwait crude). The results presented in
Table XXVIII show that the estimated values of y from the first order
rate model are out of this range for all but one data set and y aver
ages 0.668. However, the results for the second order rate model
presented in Table XXIX show that the Y values stay within the above
mentioned range in three of the four sets of experiments and Y
averages 0.392. Therefore, based on these comparisons, the second
order reaction rate model, i. e. Equation (6.6), is suggested to
represent the overall HDS reaction over other models tested for the
feedstock and conditions studied.
-The k values for all of the catalysts increase with the increase
in the reactor temperature as in the Arrhenius law, but these do not
show any trend with changing reactor pressure. The estimated values
of k, are related to the nominal reactor temperature according to the
Arrhenius law in Equation (6.4). The activation energy according to
Arrhenius law generally does not change with temperature but has been
found to be influenced by the type of catalyst and the reactor pressure
(116) . Therefore, activation energies for the overall HDS reaction
are estimated using Equation (6.4) and the values of k2 for each of the
catalysts at various reactor pressures. The results of the calculations
presented in Appendix K are listed in Table XXXI. As can be seen, the
activation energy values range from 9,627 to 46,807 Btu/mole (5,348 to
26,000 cal/gm mole) depending upon the catalyst and the reactor pres~
sure. These values are in the range of those found in the literature
(56), (61), (67), (69). The results also demonstrate a distinct effect
of pressure on the activation energy.

173
TABLE XXXI
ACTIVATION ENERGIES
Nominal Temp. Nominal Activation Energy Run Catalyst Range, F (C) Press., psig Btu/mole
1 MCM 1 600-650 (314-343) 1000 9,627 5 MCM 4 650-750 (343-399) 500 33,385 5 MCM 4 650-750 (343-399) 1000 20,302 5 MCM 4 650-750 (343-399) 1500 22,989 7 MCM 5 650-750 (343-399) 1000 42,329 2* MCM 2 600-650 (314-343) 1000 33,240 3* MCM 2 650-700 (343-371) 500 46,807 3* MCM 2 600-650 (314-343) 1000 29,363
10* MCM 2 600-650 (314-343) 1000 32,469
*These Run numbers are same as in reference (61).
The next conclusion concerns the effects of process conditions on
the value of y. Puranik and Vogelpohl (SO) have developed a correla-
tion to estimate incomplete contacing in absorbers loaded with varying
packing size and shape. The packing size in their tests ranged from
0.8 em to 3.5 em. Puranik and Vogelpohl further claim that their
correlation can estimate the wetted suface area within a maximum error
of~ 20 percent. An examination of their plot comparing predicted
versus experimental data indicates that the deviation from the experi-
mental value for particle sizes of 0.8 em is close to 20 percent. The
particle sizes used in the present study (0.2 em) were much smaller
than the particle size of 0.8 em. The correlation by Puranik and
Vogelpohl is as shown in Equation (6.7).
l.OS (Re)0.047 (We)O.l35 (cr /cr)-0.206 c
(6. 7)

174
where Re is the particle Reynold's number, We is the particle Weber
number, and acfa relates to the surface tension properties. Equation
(6.7) could not be used to estimate the wetting surface area because
the data gathered during this study was not sufficient to estimate all
the complex items in the equation. No distinct trend was observed in
the value of y when reactor temperature and pressure were varied.
Sooter (61) conducted certain HDS studies on the same feedstock
as in this study, but using different catalysts. His study also
included some experimental runs using the inert materials in place of
the catalyst. The results obtained in Sooter's study coincide with
the results observed by Wells (114) regarding the occurrances of some
desulfurization of the same feedstock on the bed of inerts. Based on
the results of his experiments with inerts only, Sooter concluded that
a fraction of the sulfur containing compounds in the oil reacted
almost instantaneously. This observation, coupled with the results
of the other runs using different catalysts, led him to conclude that
the HDS reaction was a .combination of two first order parallel reac-
tions. Sooter concluded that a fraction of the sulfur containing
compounds in the feedstock followed a first order reaction and reacted
almost instantaneously, whereas the remaining fraction of the sulfur
containing compounds in the feedstock followed another first order
reaction which was relatively slower. Sooter's rate model is shown in
Equation (6. 8).
C /C· = X '. exp ( -k3 • T) + (1 - x) . exp (-k4 • T) (6. 8) 0 1
where, Co = sulfur concentration at the reactor outlet
C· 1 = sulfur concentration at the reactor inlet
x = fraction of sulfur following the fast reaction

k3 = reaction rate constant for the fast reaction
k4 = reaction rate constant for the slow reaction
• = liquid volume hourly space time
175
In Equation (6.8), Ci is a known quantity, and C0 and • are the
experimental data points and x, k3 and k4 are the three parameters to
be determined. Sooter tested Equation (6.8) using his sets of data
and found a perfect fit. That means the standard deviations of all
the sets of data were estimated to be 0.00000. The concept of the
perfect model is most desirable but rather difficult to achieve from
the three phase heterogeneous catalytic reaction.
There are two important points concerning Sooter's rate model
that suggest that Equation (6.8) probably does not completely represent
the overall HDS reaction. Three independent sets of data ofT and C0
were collected at a given set of process conditions. Since Ci is
treated as a known quantity in the above model, the initial condition
of C0 = Ci at • = 0 is not considered as another independent set of
data. The first and foremost point is that there are three unknowns
in Equation (6.8) and only three independent sets of data used in the
regression analysis to estimate these unknowns. Therefore, in all
probability, a perfect fit is inevitable. The results of the present
study, which coincidently have three independent sets of data at any
reaction conditions, were tested to fit Sooter's model, i. e. Equation
(6.8). The overall standard deviation from the non-linear regression
analysis was again 0.00000. Therefore, it is concluded that more than
three independent sets of data are required to test the reaction rate
model shown in Equation (6.8).

176
The second point concerns the relative values of k 3 and k4 . The
right hand side (r.h.s.) of Equation (6.8) is a sum of two first order
reactions, i. e. the sum of two exponential terms. Therefore, the
sensitivity of the regression analysis of these two r.h.s. terms
depends upon their relative magnitudes. The relative magnitudes of
these two terms depend largely upon the values of k3 and k4. · Because
of the composition of Equation (6.8), the relative magnitude of the
first and second terms on the r.h.s. are practically equal to the
(k3-k4) exponent of the difference of k3 and k4 , e . Sooter's study
shows that the difference of k3 and k4 varies from 5.5 to 226 to 3,109
at the reactor temperatures ranging from 600 F (314 C) to 650./F (343 C)
to 700 F (371 C), respectively. Consequently, the relative magnitudes
of the first and second term of the r.h.s. vary at least by a factor
of e5 •5 , or about 245. Such a large factor in·the values of the terms
of any equation such as Equation (6.8) certainly reduces the sensitivity
of the regression analysis.
These two points lead one to conclude that Equation (6.8) although
completely representative of the overall HDS reaction, is not really a
good model. Addi tiona! sets of data (more than three) are requied to
study the applicability of Equation (6.8) The reaction rate model
proposed in this study, Equation (6.6), is free from both of these
limitations and the estimated values of the unknowns are within the
range of those found in previous studies (42), (115).
Effect of Catalyst Pore Size
There are, in general, three diverse factors that have substantive
influence on the phenomena of the HDS reaction. These influences may

177
not, however, be entirely independent of each other. The first factor
consists of the fluid flow characteristics in the trickle bed reactor,
such as axial dispersion and effective catalyst wetting. The second
factor includes the reactor operating conditions, such as reactor bed
temperature, total pressure, hydrogen partial pressure, hydrogen flow
rate, and liquid volume hourly space time. The last factor covers the
characteristics of the basic substances involved in the HDS reaction,
e. g. catalyst and sulfur containing compounds. The first two factors
have already been discussed in the previous sections of this chapter.
The characteristics of the several catalysts tested during the
present study that can contribute to the reaction rate are the most
frequently occurring pore size (sometimes referred to as the average
pore size), df, active surface area, active life of the catalyst,
catalyst support material and active metals in the catalyst, among
others. The effect of the catalyst active life will be discussed in
the next section. The average pore size, the surface area, catalyst
support material and the metal content are generally interlinked and
are therefore treated collectively.
Figure 28 displays the typical most frequently occurring pore size
distributions. The pore size is plotted against the frequency at which
the pore size occurs in the catalyst, as estimated by the mercury
porosimeter. The figures show either one or two peaks in the pore size
frequency. Figure 28a shows a very narrow peak meaning that only a very
short range of sizes is occurring at a high frequency. Figure 28a
obviously has a very narrow pore distribution. Figure 28b has a sharp
peak but the smaller pore sizes are also occurring at a measurable
frequency. This has widened the pore distribution and skewed the

>. ()
~ <I) ;:I 0"' <I) H ..... <I)
H 0
Q.,
I\ _)\_
Pore Radius (a)
/\_ Pore Radius
(c)
Pore Radius (e)
>. ()
~ <I) ;:::1 0"' <l)
H ..... <I)
H 0
Q.,
Pore Radius (b)
r
j Pore Radius
(d)
Figure 28. Typical Pore Size Distributions (61)
178

179
frequency curve to the small pore size side. Figure 28c shows a sharp
peak and a wide pore distribution with the curve skewed to the large
pore size side. The sulfur containing compounds found in various feed
stocks are very complex and thus would come in a wide range of molecu
lar size. Therefore, the wider pore distribution increases the range
of the molecular size of the reactant that can be accommodated by the
catalyst, other things being equal. Figure 28d illustrates a shallow
peak and a very wide pore distribution. This type of catalyst can
accommodate a very wide range of molecules for a chemical· reaction.
Figure 28e shows that the catalyst has two peaks (bidispensed) and
that probably increases the chances of the high rate of reaction.
As mentioned above, the effectiveness of a catalyst in removing
sulfur is also dependent upon the size of the sulfur containing
molecules. Empirical methods were used to estimate the molecular
diameters of the sulfur containing compounds. Sivasubramanian (122)
outlined a simplified procedure to estimate the molecular diameter
which essentially calculates the same value as estimated by a model
available in the literature. The method involves the assumption that
all the atoms in a molecule are planar in configuration and the molecu
lar distances between the atoms can be added to estimate the size of a
molecule. The distance between two carbon atoms connected by a single
bond is 1.54 ~and the same for a double bond is 1.34 ~- Since there
are three alternating single and double bonds each in a benzene ring,
the average distance between the carbon atoms in a benzene ring is
assumed to be 1. 44 ~. Based on this, the longest distance or the
molecular diameter of a benzene ring is 2.88 ~.

0< 00 00
N
180
The same concept is then used to calculate the molecular diameters
of some of the sulfur containing compounds found in anthracene oil.
Benzothiophene Dibenzothiophene
The molecular sieves used for the selective adsorption separate
molecules on the basis of another molecular dimension called critical
diameter. The critical diameter of benzene is 6.7 R. Comparing the
critical diameter of benzene with its molecular diameter calculated
earlier, the critical diameters of benzothiophene and dibenzothiophene
would be 9.8 Rand 15.3 R respectively. The pore radius of the five
catalysts tested ranged from 26 R to 800 R. Obviously, the larger pore
sizes would reduce the resistance for diffusion of larger size sulfur
containing molecules to the active sites and smaller pore sizes would
mean greater resistance for the diffusion of larger size sulfur con-
taining molecules. The effect of pore size on the HDS reaction rate
would be significant if pore diffusion is the rate controlling step,
or offers a substantial part of the overall resistance.

181
In spite of all these classifications of catalysts, one must
recognize that the pore size distribution depends upon the method of
manufacturing the catalyst support material and preparation of the
catalyst. But manufacturing catalysts with consistent pore size dis-
tributions is a significantly difficult task. Another observation is
that the larger pore size, df, tends to reduce the catalyst su~face
area. Thus one can see mixed effects of pore sizes. On one hand,
the larger pores would reduce the resistance for diffusion of the
reactive molecules to the active sites. But, on the other hand, the
larger pore sizes reduce the catalyst surface area available for
reaction. Therefore, differentiation between the effects of pore sizes
and catalyst surface area is difficult. The reaction rate constants
were calculated based on the unit surface area to see the effects of
catalyst surface area on the rate of the HDS reaction. The reaction
rate constant based on unit surface area was calculated using the
relationship shown in Equation (6.9)
ks = k2 x v;s (6. 9)
where, k5 = reaction ra~e constant based on unit surface area
kz = reaction rate constant per unit volume, from Table XXIX
V = volume of the catalyst bed
S = total catalyst surface area
The results in table XXXII indicate that the catalyst surface area could be influencing the rate of reaction at reactor temperature
·Of 650 F (343 C), but no such conclusion can be derived for the reactor temperatures of 700 and 750 F (371 and 399 C respectively).

182
TABLE XXXII
REACTION RATE CONSTANT PER UNIT CATALYST SURFACE AREA
Nominal Run Catalyst Press. , psig k2 ksxlOO
@ 650 F (343 C)
1 MCM 1 1000 7.572 5.834 5 MCM 4 1000 5.787 3.858 5 MCM 4 500 4.900 3. 272 5 MCM 4 1500 5.651 3.767 7 MCM 5 1000 4.991 3.461
@ 700 F (371 C)
5 MCM 4 1000 7.563 5.042 5 MCM 4 500 10.830 7.220 5 MCM 4 1500 7.812 5.208 7 MCM 5 1000 14.986 10.393
@ 750 F (399 C)
5 MCM 4 1000 12.430 8.287 5 MCM 4 500 17.078 11.385 5 MCM 4 1500 13.422 8.948 7 MCM 5 1000 24.187 16.773
Catalyst Aging Characteristics
The active life of a set of catalysts is another major character-
istic investigated in the present study. The active life of a catalyst
is the time a fresh batch of catalyst can be continuously used to
participate in a chemical reaction without a significant loss of
reactivity. The literature review indicated that the most widely tested
factors for the aging of catalyst for the HDS and hydrocracking of the
Middle Eastern and Venezualan crudes are the deposition of the reaction

183
products, metal sulfides, and coke on the catalyst during the reactions
(104). A study by Aoshima and Wise (123) observed that catalyst de
activation was also possible because of the severity of the reactor
conditions which can effect the catalyst surface area and the pore
structure. Aoshima and Wise found that very high reactor temperatures
tend to disintegrate the catalyst pores and thereby reduce the active
catalyst surface area.
There are several experimental parameters that have direct effect
on the catalyst aging. The experiments by Gavalas, et al. (105) and
Newson (103) have illustrated and theoretically demonstrated that, for
the HDS of various crude oils, the reactor temperature, liquid hourly
space velocity (LHSV), pressure, and the metallic contents of the
reactants have direct bearing on the catalyst aging. From the experi
mental data and his model, Newson (103) showed that the active life of
a catalyst for the desulfurization of crude oils jumped almost three
fold when the extent of sulfur removal was reduced from 75% to 63%.
This reduction in sulfur removal could be achieved by adjustment of
three process variables of reactor temperature, pressure, and LHSV.
The rise in reactor pressure from 800 psig. to 1500 psig increased the
catalyst life from 400 hours to 800 hours. Apparently, high temperature
and low pressure promote the tendency for coking. Newson's model
presented a dramatic change in the catalyst life from 400 hours to
1,200 hours by merely increasing the LHSV from 0.5 per hour to 0.7 per
hour and maintaining constant outlet sulfur content by reducing the
catalyst bed height. Since one of the reasons for the deactivation is
the deposition of the metallic sulfides in the pores, it is inferred
that larger catalyst pore size should improve the catalyst life.

184
Newson illustrated that the rise in the pore radius from 20 ~to 32.5 ~
improved the catalyst active life from 400 hours to 1,200 hours. The
other qualitative conclusions from Newson's work include the effect of
active metal content and reactor temperature. Higher reactor tempera
ture would enhance coking and thereby would reduce catalyst life.
Similarly, higher metallic content in the feedstock would promote
deposition of more sulfides and thus lower the catalyst active life.
Johnson and coworkers (84) found that the active life of the catalyst
used in the HDS of residual oils could be increased from 700 hours to
1,600 hours by reducing the metallic content of petroleum residuum from
200 ppm to 40 ppm.
The present study was partially devoted to the determination of
the aging characteristics of different catalysts for the desulfurization
reaction. About 20 grams of each catalyst were packed in the reactor
during five separate experiments. A constant weight of catalyst pro
vided a constant LWHST, but because of the differing densities, the
LVHST varied. Other process conditions were set constant during all
five experiments. The nominal reactor temperature was maintained at
700 F (371 C) and the nominal reactor pressure was maintained at 1,000
psig. The liquid flow rate was set at 40 cc/hr and the hydrogen flow
rate was set at 1,500 scf/Bbl of oil. Each of the five experiments
was conducted for a continuous 200 hours at the above mentioned condi
tions before a planned shutdown. The results of the experiments were
tabulated in Tables XII, XIII, XIV, XV, and XVI in the Experimental
Results Chapter. Those results are plotted here in Figures 29-33.
One can see from these figures that the system stabilized after
about 50 hours of the initial operation. However, it appears qifficult

o. s-. ------i --- ---- ·r-- ------, ~ Feed
0.4
0 (:)
0
60
0
0 (:)
so 100
0
0
0
120
Hours of Oil on Catalyst
0
0
Series: ASP Feed: Anthracene Oil Catalyst: MCM 1 Temperature: 700 F (371 Pressure: 1,000 psig LVHST: 0.925 hour LWHST: 0.440 hour
0
0 oo 0
0 0 0
0 0 0
140 160 180
Figure 29. Results of Catalyst Aging Test Run for MCM 1 Catalyst
C)_~
I -i
0 """' c.; l
I
I
200

r-f ·r-i 0
.j..l u
.e 0
'"" 0...
1=: •r-i
~ r-f ;:l
U)
.j..l
1=: Q) u
'"" Q) 0...
.j..l
o. sr---· -- T (l Feed I
i I I
0. 4~--
i 0. 3(-
1
I 0.2l--
) co oo 8 o
0 ~ ·r-i O.lf-~ l
I -~·----·
20
o 0 ~oo ( O u oooo '---' co :_) . 0
0
____ L __ ____ L ___ . ----- _j ___ ·------------
40 60 80 100 120
Hours of Oil on Catalyst
0 0
0
,-------~----~~ I
Series: ANA Feed: Anthracene Oil Catalyst: MCM 2 Temperature: 700 F (371 C) Pressure: 1,000 psig LVHST: 0.65 hour LWHST: 0.44 hour
~ I
~ I
0 0 o o I r-. 0 0 I 0 0 0~
l 0 c
0
140 160 180 200
Figure 30. Results of Catalyst Aging Test Run for MCM 2 Catalyst

0
0.1 0
0 20
--r~----------·r- --- ·----- -- --l----~-------~----------.----------: ~---~
Series: NLA l
0 c 0 c 0 0
__L~---------'-------L--
40 60 80 100 120
Hours of Oil on Catalyst
Feed: Anthracene Oil Catalyst: MCM 3 Temperature: 700 F (371 C) Pressure: 1,000 psig LVHST: 0.616 hour LWHST: 0.440 hour
0 0 0 0 0-
0 0 0 0 0 0 0
140 160 180 200
Figure 31. Results of Catalyst Aging Test Run for MCM 3 Catalyst

0.4
0.3~
0.2 I-I 0
0.1 ~ I
0
0
0 0 0 0
0 l_ -- __ j - -- --- ~--~-20 40
Series: HRW Feed: Anthracene Oil Catalyst: MCM 4 Temperature: 700 F (371 C) Pressure: 1,000 psig LVHST: 0.65 hour LWHST: 0.44 hour
·--'----- _ _j_ ______ _j_ ___ _L ____ _..L ____ __L __ :---..1.-------' 60 80 100 120 140 160 180 200
Hours of Oil on Catalyst
Figure 32. Results of Catalyst Aging TestRun for MCM 4 Catalyst t-1 00 00

0.5----T-
Feed
0.4 -
0.2 ~ 0
0 ooo
0
Series: NAC Feed: Anthracene Oil Catalyst: MCM 5 i Temperature: 700 F (371 C) ! Pressure: 1,000 psig . ~ LVHST: 0.742 hour I LWHST: 0. 440 hour I
0
ooooooo 0
0
i
l I
~ I
0 L .. -~ ro·-- -- ____ _14_0 ___ 6j_0 ____ 8_0L_ ___ l_jOLO ___ l2_j_O ____ l4j_O::---l-:l6-::-0 ------:1-:8-::-0---2=-o~o
Hours of Oil on Catalyst
Figure 33. Results of Catalyst Aging Test Run for MCM 5 Catalyst ..... 00 \0

190
to judge whether there is any loss of catalyst activity. Therefore,
the results of each experiment after the initial 50 hours of stabiliza-
tion period are anlyzed using a linear regression technique. The
results of the regression analysis are presented in Table XXXIII.
TABLE XXXIII
RESULTS OF THE AGING TESTS
Intercept Std. Dev. Slope Run Catalyst Avg. %S %S %S/hour
2 MCM 1 0.125 0.0241 -0.0001297 3 MCM 2 0.111 0.0148 0.0000524 4 MCM 3 0.098 0.0129 -0.0000851 6 MCM 4 0.150 0.0088 -0.0001059 8 MCM 5 0.095 0.0143 -0.0001518
The results in Table XXXIII show very little noticeable change in
the average sulfur content of the product samples in a given run. This
indicates that there is no loss of catalyst activity during the 200
hours of the continuous operation. One of the reasons for the absence
of deactivation could be the absence of the metallic or other inorganic
species in the feedstock. The other possible reason is the appar~nt
short duration of the continuous operation. The test runs for deter-
mining the catalyst performances at varying reactor pressure, tempera-
ture, and space time were conducted continuously for about 200 hours.
Therefore, the catalyst aging test runs were also conducted for

191
200 hours to see whether catalyst deactivation was an added variable
in the performance tests. The results in Table XXXIII conclusively
show that the catalyst activity had not changed noticeably to add any
extra variables.
As shown in Table XXXIII, various catalysts used in this study
show varying levels of sulf~r removal during the aging tests. The
differences in the degree of sulfur removal at constant process con
ditions must be caused by the catalyst physical and chemical properties.
Catalyst MCM 4 had the lowest surface area and Co-Mo atom ratio of
0.24 as compared to 0.34 for other catalysts tested. These lower
values may have caused the lowest sulfur removal by the MCM 4 catalyst.
During their studies on the HDS of residual oils, Kushiyama, et al.
(99). They observed that the removal of sulfur containing compounds
from Khafji residual oil increased as the Co-Mo atom ratio increased at
constant Mo concentration and the removal was maximum at the Co-Mo
atom ratio of o.S-0.6 : 1, regardless of Mo concentration. All the
other four catalysts had different pore sizes and surface areas but the
same concentration of Co. However, only three of these, i. e. MCM 2,
MCM 3 and MCM 5, have nearly identical levels of sulfur removal. The
intermediate level of sulfur removal by catalyst MCM 1 is rather
confusing. Theoretically, the negative slopes mean that the catalyst
activities were actually improving with time, but the relative
magnitudes of these slopes are too small to be conclusive.
In summary, one can see that the experimental and analytical
techniques employed in the present study have been thorough enough
to generate consistent results. The analysis also demonstrated that
the liquid backmixing does not contribute sign~ficantly to the rate of

192
desulfurization reaction, but the effective catalyst wetting does play
a role in the rate of desulfurization reaction. The effective catalyst
wetting is incorporated into a second order reaction rate model, which
appears to better represent the desulfurization reaction than any
model tested or developed previously. In the catalyst aging tests,
the results indicate no noticeable loss of catalyst activity during
the 2'00 hours of the continuous operation .. The conclusions of this
study and the recommendations for future investigations based on those
conclusions are presented in the next chapter.

CHAPTER VII
CONCLUSIONS AND RECOMMENDATIONS
Conclusions
A trickle bed reactor bed was selected to study the HDS of raw
anthracene oil, a coal derived liquid, over various commercially avail
able Co-Mo-Alumina catalysts. The experimental equipment was designed
for operating conditions ranging from ambient to 850 F .(455 C) and
1,800 psig. The HDS studies were conducted at reactor temperatures of
600, 650, 700, and 750 F (314, 343, 371, and 399 C respectively), at
reactor pressures of 500, 1,000, and 1,500 psig and at liquid volume
hourly space times ranging from 0.325 to 1.480 hours. The hydrotreat
ing catalysts were also studied for their aging characteristics. The
following conclusions are presented:
1. The trickle bed reactor was an excellent tool for studying
HDS of the coal derived liquid. With the choice of the
specially designed heaters, the reactor temperature was
very close to isothermal conditions, and the pressure could
be maintained steady at all times. The liquid distribution
was adequate and backmixing effects were held to a minimum
by appropriately selecting the reactor dimensions.
2. The effective catalyst wetting was an influencing factor in
the rate of HDS of raw anthracene oil.
193

194
3. The results of the HDS of raw anthracene oil were satisfacto
rily correlated to fit a second order model incorporating
partial catalyst wetting. The results demonstrate a better
fit as the order of the simple reaction rate model increases.
4. The fraction of the external catalyst surface not surrounded
by a fresh batch of flowing liquid (or Mears' constant Y) was
found to vary from 0.153 to 0. 853 and averaging 0. 392. A
definite correlation could not be established between the
value of the Mears' constant and the reactor operating
conditions.
5. The catalysts used in the HDS of raw anthracene oil did not
indicate any loss of activity during the 200 hours of
continuous reactor operation.
6. The total available catalyst surface area showed a limited
influence on the rates of the overall HDS reaction.
7. The rates of the overall HDS reaction were not influenced
by the changing catalyst pore radius within the range of
30 to 50 ~. The bidispersed catalyst also did not demonstrate
any noticeable improvement in the sulfur removal capability
over the other monodispersed catalysts.
8. The results suggest a moderate influence of Co-Mo atom
ratio in the the cataklyst on the rates of the overall HDS
reaction. 5#3 the higher Co-Mo atom ratio indicated an
increase in sulfur removal.
9. The results of this study indicate th~t the reactor pressure
does not influence the rate of the overall HDS reaction

in the range from 500 to 1, 500 ps ig.
10. The reproduction of the experimental and analytical
resttlts were consistent, considering the three phase
flow situation in the liDS reactions.
Recommendations
195
The use of coal as an energy supply is increasing. The greater
emphasis on the use of coal in the future has made coal conversion
technology of greater importance. With pollution control regulations
becoming more and more stringent, the hydrotreating of coal derived
liquids will have to be more thoroughly understood. The following test
programs are recommended based on the results collected and the experi
ences encountered during the present study.
1. Catalyst deactivation studies of longer test run time should
be conducted. The longer run time demonstrating deactivation
would provide a more definite time period for continuing
catalyst activity at a steady level.
2. Varying concentrations of metal content in the feedstock
should be tested to evaluate the tolerance level of each of
the catalysts. The results of such a study will help decide
whether a demetallization process is necessary for a particu
lar feedstock prior to the hydrotreating step.
3. Since coking of feedstock is one of the influencing character
istics of catalyst deactivation, a particular catalyst should
be tested against feedstock with varying coking character
istics. Such an information would help in selecting a
catalyst for hydrotreating the corresponding feedstock.

196
4. With confusion and, at times, conflicting observations
regarding the order of the overall HDS reaction, an attempt
should be made to study the HDS of ind1vidual sulfur con
taining compounds and preselected varying combinations of
the sulfur containing compounds. Such a study would provide
more insight into this complex reaction.
5. A greater variation of the physical characteristics of the
catalysts, such as surface area, pore size distribution and
support materials should be tested. The results of such a
study would help in the selection of a catalyst for the
hydrotreating of a feedstock.
6. The presence of certain chemicals, specifically Co and Mo,
in a catalyst were found to have a degree of influence on
the extent of the overall HDS. A wider variety of experiments
should be conducted to evaluate the effects of each of these
components. Furthermore, an additional chemical component
in the catalyst should also be tested to estimate its effects.
In conclusion, the method used to study the HDS in a trickle bed
reactor is excellent and future studies should be continued in a simi
lar reactor.

A SELECTED BIBLIOGRAPHY
1. "Coal's Share of Nation's Energy Rose Slightly," Coal Age, Vol. 80, No. 5, (May 1975), p. 21.
2. Hydrocarbon Processing, Vol. 56, April 1977, p. 15.
3. Bridges, Jack H., "Understanding the National Energy Dilemma," Prepared for the Joint Committee on Atomic Energy, March 1973.
4. "World Shaken by Arab Oil-Export Cuts, Price Hikes," The Oil & Gas J., Vol. 71, Oct. 29, 1973, pp. 49-52.
S. Time Magazine, Vol. 104, Nov. 10, 1974.
6. "The Energy Crisis: Whys and Hows," Mining Engineering, Vol. 27, May 1975, pp. 10-11.
7. Culbertson, LeRoy, "Energy in Engineering," Presented at the Twenty-Fifth Annual Trisectional Meeting of AIChE, Oklahoma State University, Stillwater, Oklahoma, April 23, 1971.
8. American Gas Association, The Oil & Gas J., Vol. 75, Feb. 28, 1977, p. 170.
9. "Project Independence: A Critical Look," Chemical Engineering, Vol. 82, Jan. 6, 1975, pp. 92-105.
10. Htdrocarbon Processing, Vol. 55, Feb. 1976, p. 17.
11. "Newsbreak," Gas, Vol. 47, No.7, 1971, p. 6.
12. "Rush for Riches on the Great Pipeline," Time Magazine, Vol. 105, No. 23, June 2, 1975, pp. 12-20.
13. Wilson, Howard M., "Alyeska Maps Complex System Start-up," The Oil & Gas J., Vol. 75, March 14, 1977, pp. 36-37.
14. Gardner, F. J., "World's Offshore Oil Potential Keeps Growing," The Oil & Gas J,, Vol. 73, May 5, 1975, pp. 175-181.
15. Welt, Ted, "Coal: Future source of oil and gas," The Oil & Gas J., Vol 75, No. 35, August 1977, pp . 5 1 7-5 2 2 .
197

16. "Energy Sources: Coal, Oil and Gas," Power, Vol. 121, No. 9, September, 1977, nn. 4n-S2.
17. Bituminous Coal Research, Inc., Gas Generator Research and Development - Survey and Evaluation, Phase One, Volumes. One and Two, OCR Contract No. 14-01-0001-324, BCR Report No. L-156, Oct. 1965.
198
18. Mehta, D. C., M. S. Thesis, Oklahoma State University, Stillwater, Oklahoma, July 1972.
19. Sapre, Ashok, R., Ph. D. Dissertation, Oklahoma State University, Stillwater, Oklahoma, July 1974.
20. Coal Age, Vol. 80, No. 5, May 1975, p. 20.
21. U. S. Bureau of Mines, News Release, Department of the Interior, Oct. 10, 1974.
22. Balzhiser, Richard E., "Energy Options to the Year 2000," Chemical Engineering, Vol. 84, Jan. 3, 1977, pp. 73-90.
23. Satterfield, Charles N., "Trickle-Bed Reactors," AIChE J., Vol. 21, No. 2, Mar. 1975, pp. 209-228.
24. Baral, William J. and Huffman, Hal C., "Advances in Hydrocracking of Distillates," Eighth World Petroleum Congress -Proceedings, Vo 1 . 4, App 1 ied Science Pub lis hers Ltd. , London, 1971, pp. 119-127.
25. Partington, J. and Parker, F., J. S. C. I., 75, (1919).
26. Scott, A. H., Trans. Inst. Chern. Engr., Vol. 13, p. 211, (1935).
27. Baker, T., Chilton, T. H. and Vernon, H. C., Trans. Am. Inst. Chern. Engr., Vol. 31, p. 296, (1935).
28. Schwartz, C. E. and Smith, J. M., "Flow Distribution in Packed Beds," I & EC, Vol. 45, No. 6, 1953, pp. 1209-1218.
29. Schiesser, W. E. and Lapidus, Leon, "Further Studies of Fluid Flow and Mass Transfer in Trickle Beds," AIChE J., Vol. 7, No.1, 1961, pp. 163-171.
30. Glaser, M. B. and Lichtenstein, Ira, "Interrelation of Packing and Mixed Phase Flow Parameters with Liquid Residence Time Distribution," AIChE J., Vol. 9, 1963, pp. 30-34.
31. Wilhelm, R. H., "Progress Towards the a Priori Design of Chemical Reactors," Pure and Applied Chemistry, Vol. 5, 1962, pp. 403-421.

199
32. Satterfield, C. N., "Mass Transfer in Heterogeneous Catalysis," M. I. T. Press, Cambridge, Mass., 1970.
33. Schwartz, John G. and Roberts, George W., "An Evaluation of Models for Liquid Backmixing in Trickle Bed Reactors," I & EC Process Design and Development, Vol. 12, 1973, pp. 262-271.
34. Levenspiel, Octave and Smith, W. K., "Notes on the Diffusion-Type Model for the Longitudinal Mixing of Fluids in Flow," Chemical Engineering Science, Vol. 6, 1957, pp. 227-233.
35. Dean, H. A., "A Mathematical Model for the Disp~rsion in the Direction of Flow in Porous Media," Society of Petroleum Engineers Journal, Vol. 3, 1963, pp. 49-52.
36. Hoogendoorn, C. J. and Lips, J., "Axial Mixing of Liquid in GasLiquid Flow Through Packed Beds," The Canadian Journal of Chemical Engineering, Vol. 43, 1965, pp. 125-131.
37. Buffham, B. A., Gibilaro, H. G. and Rather, M. N., "A Probabilistic Time Delay Description of Flow in Packed Beds," AIChE J., Vol. 16, 1970, pp. 218-223.
38. Van Swaaij, W. P.M., Charpentier, J. C. and Villermaux, J., "Residence Time Distribution in the Liquid Phase of Trickle Flow in Packed Columns," Chemical Engineering Science, Vol. 24, 1969, pp. 1083-1095.
39. Furzer, I. A. and Mitchell, R. W., "Liquid Phase Dispersion in Packed Beds with Two-Phase Flow," AIChE J., Vol. 16, No. 3, 1970, pp. 380-385.
40. Hockman, Jack M. and Effron, Edward, "Two-Phase Cocurrent Downflow in Packed Beds," I & EC Fundamentals, Vol. 8, No 1, 1969, pp. 63-71.
41. Sater, V. E. and Levenspiel, Octave, "Two-Phase Flow in Packed Beds," I & EC Fundamentals, Vol. 5, No. 1, 1969, pp. 86-92.
42. Mears, D. E., "The Role of Axial Dispersion in Trickle-Flow Laboratory Reactors," Chemical Engineering Science, Vol. 26, 19 71 ' p . 1361.
43. Mears, D. E., "The Role of Liquid Holdup and Effective Wetting in the Performance of Trickle-Bed Reactors," Advances in Chemistry Series, No. 133, 1974, pp. 218-227.
44. Ma, Y. H., Satterfield, C. N. and Sherwood, T. K., "The Effectiveness Factor in a Liquid-Filled Porous Catalyst," Inst. Chern. Engr. Symp. Ser. No. 28, Inst. Chern. Engrs., London, 1968, p. 22.

45. Van Deemter, J. J., "Trickle Hydrodesulfurization- A Case History," Third Equropean Symposium on Chemical Reaction Engineering, 1964, p. 215.
200
46. Adlington, D. and Thompson, E., "Desulfurization in Fixed and Fluidized Bed Catalyst Systems," Third European Symposium on Chemical Reaction Engineering, 1964, p. 203.
4 7. Van Zoonen, D. and Douwes, C., "Effect of Pellet Pore Structure on Catalyst Performance in Hydrodesulfurization of StraightRun Gas Oil," J. Inst. Petroleum, Vol. 49, 1963, p. 383.
48. Henry, H. C. and Gilbert, J. B., "Scale Up of Pilot Plant Data for Catalytic Hydroprocessing," I & EC Process Design and Development, Vol. 12, 1973, p. 328.
49. Sedriks, W. and Kenney, C. N., "Partial Wetting in Trickle Bed Reactors - The Reduction of Cronoaldehyde Over a Palladium Catalyst," Chemical Engineering Science, Vol. 28, 1973, pp. 559-568.
50. Puranik, S. S. and Vogelpohl, A., "Effective Interfacial Area in Irrigated Packed Columns," Chemical Engineering Science, Vol. 29, 1974, p. 501.
51. Sylvester, N. D. and Pitayagulsarn, Punya, "Effect of Catalyst Wetting on Conversion in a Trickle Bed Reactor," The Canadian Journal of Chemical Engineering, Vol. 52, 1974, p. 539.
52. Wan, K. T., M. S. Thesis, Oklahoma State University, Stillwater, Oklahoma, May 1972.
53. Jones, J. and Friedman, "Char Oil Energy Development - Final Report,-" R&D Report No. 56, U. S. Department of the Interior, Office of Coal Research, 1972.
54. Byrns, A. C., Bradley, W. E. and Lee, M. W., "Catalytic Desulfurization of Gasolines by Cobalt Molybdate Process," I & EC, Vol. 35, No. 11, 1953, pp. 1160-1167.
55. Gwin, G. T., Heinrich, R. L., Hoffmann, E. J., Manne, R. S., Meyer, M. W. H., Miller, J. R. and Thorpe, C. L., "Hydrogenation of Asphalt for Fuel Products," I & EC, Vol. 49, No. 4, 1957, pp. 668-672.
56. Berg, C., Bradley, W. E., Stirton, R. I., Fairfield, R. G., Leflert, C. B. and Ballard, J. H., Trans, Am. Inst. Chern. Engr., Vol. 43, 1972, p. 1.
57. Stevenson, D. H. and Heinemann, Heinz, "Residuum Hydrocracking," I & EC, Vol. 49, No. 4, 1957, pp. 664-667.

58. Frost, C. M. and Cottingham, P. L., U. S. Bureau of Mines, Report of Investigation, 7464, (1971).
59. Gregoli, A. A. and Hartos, G. R., "Hydrodesulfurization of Residuals," Advances in Chemistry Series, No. 127, 1973, pp. 98-104.
60. Schmid, B. K. and Beuther, H., Sixth World Petroleum Congress, Section VII, 1963, p. 233.
61. Sooter, M. C., Ph. D. Dissertation, Oklahoma State University, Stillwater, Oklahoma, May 1974.
62. Hoog, H., Klinkert, H. G. and Schaafsma, A., "New Shell Hydrodesulfurization Process Shows," Petroleum Refiner, Vol. 32, No. 5, 1953, pp. 137-141.
201
63. Qader, S. A. and Hill, G. R., "Catalytic Hydrocracking -Hydrocracking of a low Temperature Coal Tar," I & EC Process Design and Development, Vol. 8, No. 4, 1969, pp. 450-455.
64. Qader, S. A. and Hill, G. R., "Catalytic Hdrocracking -Mechanism of Hydrocracking of Low Temperature Coal Tar," I & EC Process Design and Development, Vol. 8, No. 4, 1969, pp. 456-461.
65. Qader, S. A. and Hill, G. R., "Production of Low Sulfur Fuel Oils from Utah Coals," Advances in Chemistry Series, No. 127, 1973, pp. 91-97.
66. U. S. Patent No. 3,686,095.
67. Wilson, W. A., Voreck, W. E. and Malo, R. V., I & EC, Vol. 49, 1957, p. 657.
68. Frost, C. M. and Cottingham, P. L., U. S. Bureau of Mines, Report of Investigations, 7418, (1970).
69. Frye, C. G. and Mosby, J. F., "Kinetics of Hydrodesulfurization," Chemical Engineering Progress, Vol. 63, No. 9, 1967, pp. 66-70.
70. Bridge, A. G., Scott, J. W. and Reed, E. M., "Resid Hydroprocessing Options Multiply with New Technology," The Oil & Gas J., Vol. 73, May 19, 1975, pp. 94-100.
71. Reed, E. M., Tamm, P. W. and Goldstein, R. F., "HDS Goes Deeper into Barrel Bottoms," The Oil & Gas J., Vol. 70, July 17, 1972, pp. 103-108.
72. Karanth, N. G. and Hughes, R., "Temperature and Concentration Gradients in a Catalyst Packed Bed Reactor," Advances in Chemistry Series, No. 133, 1974, pp. 449-462.

2-02
73. McGreavy, C. and Soliman, M. A., "Stability of a Catalyst Particle Under Periodic Variations in Temperature and Concentration," The Chemical Engineering Journal, Vol. 6, 1973, pp. 99-106.
74. Cecil, R. R., Mayer, F. X. and Cart, E. N., "Fuel Oil Hydrodesulfurization Studies in Pilot Plant Reactors," Paper Presented at AIChE Meeting, Los Angeles, 1968.
75. Yitzhaki, Dan and Aharoni, Chain, "Hydrodesulfurization of Gas Oil, Reaction Rates in Narrow Boiling Range Fractions," AIChE J., Vol. 23, No. 3, 1977, pp. 342-346.
76. Qader, S. A., Wiser, W. H. and Hill, G. R., "Kinetics of Hydroremoyal of Sulfur, Oxygen, and Nitrogen from a Low Temperature Coal Tar," I & EC Process Design and Development, Vol. 7, No. 3, 1968, pp. 390-397.
77. Aboul-Gheit, Ahmed K. and Abdou, Ismail K., "Catalytic HDS of Petroleum Distillate Fractions Under Hydrotreating Conditions," Egypt J. of Chemistry, Vol. 18, 1975, pp. 87-97.
78. Lee, H. C. and Butt, J. B., "Kinetics of Desulfurization of Thiophene: Reactions of Thiophene and Butene," J. of Catalysis, Vol. 49, Sept. 1977, pp. 320-331.
79. Hargreaves, Anthony E. and Ross, Julian R; H., "An Investigation of the Mechanism of the Hydrodesulphurization of Thiophene Over Sulphided Co-Mo-Al203 Catalysts. Part I. The Activation of the Catalysts and the Effect of Co-Mo Ratio on the Activity and Selectivity," Proceedings of the Sixth International Congress on Catalysis, Vol. 2, 1976, pp. 937-950.
80. Bartsch, R. and Tanielian, C., "Hydrodesulfurization II. Hydrogenolysis of Benzothiophene and Dibenzothiophene Over Prereduced Fe203-Al203 Catalysts," J. of Catalysis, Vol. SO, Oct. 1977, pp. 35-42.
81. Bruijn, Arie De, "Testing of HDS Catalysts in Small Trickle Phase Reactors," Proceedings of the Sixth International Congress ort Catalysis, Vol. 2, 1976, pp. 951-964.
• 82. · Morooka, S. and Hamrin, Charles E., Jr., "Desulfurization of Model Coal Sulfur Compounds by Coal Mineral Matter and a Cobalt Molybdate Catalyst - Thiophene," Chemical Engineering Science, Vol. 32, 1977, pp. 125-133.
83. Phillipson, J. J., "Kinetics of Hydrodesulfurization of Light and Middle Distillates," Paper Presented at AIChE Meeting, Houston, 1971.

84. Johnson, A. R., Wolk, R. H., Hippeli, R. F. and Nongbri, G., "H-Oil Desulfurization of Heavy Fuels," Advances in Chemistry Series, No. 127, 1973, pp. 105-120.
85. Hisamitsu, T., Shite, Y., Maruyama, F., Yamane, M., Satomi, Y. and Ozaki, H., "Studies on Hydrodesulfurization of Heavy Distillates - Hydrogen Consumption and Reaction Kinetics," Bulletin of Japan Petroleum Institute, Vol. 18, 1976, pp. 146-152.
203
86. Yergey, Alfred L., et al., "Nonisothermal Kinetics Studies of the Hydrodesulfurization of Coal," I & EC Process Design and Development, Vol. 13, No. 3, 1974, pp. 233-240.
87. Hoog, H., J. Inst. Petrol., Vol. 36, p. 738 (1950).
88. Massagutov, R. M., Berg, G. A., Kulinich, G. M. and Kirillov, T. S., Proceedings of Seventh World Petroleum Congress, Vol. 4, 1976, p. 177.
89. Owens, P. J. and Amberg, C. H., "Thiophene Desulfurization by a Microreactor Technique," Advances in Chemistry Series, No. 33, 1961, p. 182.
90. Satterfield, C. N. and Roberts, G. W., "Kinetics of Thiophene Hydrogenolysis on a Cobalt Molybdate Catalyst," AIChE J., Vol. 14, 1968, p. 159.
91. Givens, E. N. and Venuto, P. B., "Hydrogenolysis of Benzo(b)thiophene and Related Intermediates over Cobalt Molybdena Catalyst," ACS, Div. of Petrol. Chern. Preprints, Vol. 15, No. 4, 1970, p. Al83.
92. Rall, H. T., Thompson, C. J., Coleman, H. J. and Hopkins, R. L., U. S. Bureau of Mines, Separation and Identification Section, RP48A, 1970.
93. Akhtar, S., Sharkey, A. G., Jr., Shultz, J. L. and Yavorsky, P.M., "Organic Sulfur Compounds in Coal Hydrogenation Products," ACS, Div. of Fuel Chemistry Preprints, Vol. 19, No. 1, 1974, pp. 207-214.
94. Greenwood, Gil Jay, Ph. D. Dissertation, Oklahoma State University, Stillwater, Oklahoma, 1977.
95. Jewell, D. M., Ruberto, R. G. and Swansiger, J. T., "Sulfur Compounds in Petroleum: Isolation and Characteristics," ACS, Div. of Petroleum Chemistry Preprints, Vol. 20, No. 1, 1975' pp. 19-29.
96. Hammer, C. G. Berti!, "Selective Hydrogenation of Sulphur Compounds from Highly Unsaturated Cracked Gasoline," Third World Petroleum Congress - Proceedings, Section IV, 1951, p. 295.

97. Sinfelt, J. H., "Catalystic Specificity," AIChE J., Vol. 19, No. 4, 1973, pp. 673-683.
98. Kawa, W., Friedman, S., Wu, W. R., Frank, L. V. and Yavorsky, P. M., "Evaluation of Catalysts for Hydrodesulfurization and Liquefaction of Coal," ACS, Div. of Fuel Chemistry, Vol. 19, No. 1, 1974, pp. 192-208.
204
99. Kushiyama, S., Koinuma, Y., Aizawa, R., Kobayashi, S., Nishikata, H., Inoue, K., Simizu, Y. and Egi, K., "HDSof Residual Oil. The Effect of Chemical Composition of Catalyst on Removal of Sulfur, Vanadium, Nickle and Nitrogen," Sekiyu Gakkai Shi, Vol. 19, No. 12, 1976, pp. 1016-1021.
100. Parsons, Basil I. and Ternan, Marten, "The Hydrodesulphurization and Hydrocracking Activity of Some Supported Binary Metal Oxide Catalysts," Proceedings of the Sixth International Congress on Catalysts, Vol. 2, 1976, pp. 965-977.
101. Allessandrini, G., Cairati, L., Forzatti, P., Villa, P. C. and Trifiro, F., "Chemical, Structural and Catalytic Modifications of Pure and Doped Iron (III) Molybdate," J. of Less Common Metals, Vol. 54, No. 2, Aug. 1977, pp. 373-386.
102. U. S. Patent 2,890,162.
103. Newson, Esmond, "Catalyst Deactivation Due to Pore-Plugging by Reaction Products," I & EC Process Design and Development, Vol. 14, No. 1, 1975, pp. 27-33.
104. Richardson, James T., "Experimental Determination of Catalyst Fouling Parameters," I & EC Process Design and Development, Vol. 11, No. 1, 1972, pp. 8-14.
105. Gavalas, G. R., Hsu, G. C. and Sinfeld, J. H., "Estimation of Catalyst Deactivation Parameters from Operating Reactor Data," Chemical Engineering J., Vol. 4, 1972, pp. 77-84.
106. Fowler, Carl, "How Gulfining Works for Daikyo," Hydrocarbon Processing, Vol. 52, Sept. 1973, pp. 131-133.
107. Weekman, Vern W., Jr., "Laboratory Reactors and Their Limi tations," AIChE J., Vol. 20, No. 5, Sept. 1974, pp. 833-840.
108. Instruction Manual for Model 240 Temperature Programmer, Hewlett Packard F & M Scientific Division, Avondale, Pennsylvania, 1971.
109. Instruction Manual for Model 900 Numeric Display, Leeds & Northrup Corp., North Wales, Pennsylvania, 1971.

205
110. LECO Automatic Sulfur Determinator Instruction Manual, Laboratory Equipment Corp., St. Joseph, Michigan, 1970.
lll. Mitchell, P. C. H. and Trifiro, F., "The Effect of Sulfiding on the Structure of a Cobalt-Molybdenum-Alumina Hydrodesulfurization Catalyst," Journal of Catalysis, Vol. 33, 1974', pp. 350-354.
112. Pressure Control - Grove Mity Mite Regulator, Grove Valve & Regulator Co., Bulletin No. G-60, Oakland, California, 1970.
113. Ruska Proportioning Instruction Manual, Ruska Instrument Corp., Houston, Texas, 1971.
114. Wells, J. W., M. S. Thesis, Oklahoma State University, Stillwater, Oklahoma, May 1977.
115. Paraskos, J. A. , Frayer, J. A. and Shah, Y. T., "Effect of Holdup, Incomplete Catalyst Wetting and Backmixing During Hydroprocessing in Trickle Bed Reactors," I & EC Process Design and Development, Vol. 14, No. 3, 1975, pp. 315-322.
ll6. Perry, Robert H. and Chilton, Cecil H., "Chemical Engineers' Handbook," Fifth Edition, McGraw-Hill Book Company, Inc., New York, 1973.
ll7. Brunn, L. W., Montagna, A. A. and Paraskos, J. A., "Clean Residual Fuels from the Gulf HDS Process," Vol. 21, No. 1, 1976, pp.· 173-197.
ll8. Office of Coal Research, "Development of a Process for Producing an Ashless, Low Sulfur Fuel from Coal," Interim Report No. 3, R & D Report No. 53, U. S. Department of the Interior, 1971.
ll9. Smith, J. M. and Van Ness, H. C., "Introduction to Chemical Engineering Thermodynamics," McGraw-Hill Book Company, Inc., New York, 1959.
120. Ueda, S., Shinichi, Y., Tadao, I., Kazuo, M. and Gen, T., "The Heat of Hydrodesulfurization Reaction of Heavy Oil," I & EC Process Design and Development, Vol. 14, No. 4, 1975, pp. 493-499.
121. Erbar, John H., Personal Communications, Aug.-Sept. 1975.
122. Sivasubramanian, R., Ph. D. Dissertation, Oklahoma State University, Stillwater, Oklahoma, May 1977.
123. Aoshima, A. and Wise, H., Journal of Catalyst, Vol. 34, 1974, pp. 145-151

124. Wilke, C. R., Chemical Engineering Progress, Vol. 35, 1949, pp. 218-224.
206

APPENDIX A
ANALYSIS OF FEED OIL FOR SULFUR CONTENT
The standard deviation of analysis was estimated according to the
relationship shown below. The feed oil was analyzed eight times for
sulfur concentration.
(
s = (k-1)
where, S = standard deviation
k = number of data points
ox = deviation of estimated sulfur concentration value from
the predetermined value by Sooter (61)
The results of the analytical work are presented below.
Predetermined %S in feed oil = 0.470
%S, determined ax, deviation %· deviation (ox) 2
(i) 0.474 + 0.004 + 0.85 0.000016 (ii) 0.460 - 0.010 - 2.06 0.000100
(iii) 0.483 + 0. 013 + 2. 71 0.000169 (iv) 0.473 + 0.003 + 0.64 0.000009
(v) 0.467 - 0.003 - 0.64 0.000009 (vi) 0.476 + 0.006 + 1.28 0.000036
(vii) 0.464 - 0.006 - 1. 28 0.000036 (viii) 0.456 - 0.014 - 2.98 0.000196
}.; = 0. 000571
s = jo.ooo571 = + o bo903 (8-1) - .
Therefore, standard deviation= 0.00903
and %S, average = 0.469
207

APPENDIX B
ANALYTICAL DATA
The product samples collected during the experimental runs were
analyzed at least three times for sulfur content. The repeated
analysis of each of the samples was performed to minimize the possi-
bility of measurement errors. The data gathered during the analyses
are presented in Table XXXIV with their averages and the standard
deviations of measurement of each sample. The standard deviation of
each sample was calculated based on the following formula.
2 -2 X. - n . X
1
s = \ n - 1
where, s = standard deviation of measurement
X· = determined sulfur value l
n = number of data points
X = average sulfur content of the sample estimated as,
n E X· l
X = i=n n
A typical calculation is shown on the following page.
208

Sample Number
ASPll
X· l.
0.163 0.167 0.150
Xi = 0.480 x· 2 -1. -
X = 0.480/3 = 0.160
s = 0.00889
209
X· 2 1.
0.026569 0.027889 0.022500
0.076958

210
TABLE XXXIV
ANALYTICAL DATA
Sample Standard Number Weight Percent Sulfur Average Deviation
(i) (ii) (iii)
SP 1 0.130 0.136 0.133 0.133 0.00269 SP 2 0.100 0.102 0.104 0.102 0.00217 SP 3 0. 072 0. 071 0.073 0.072 0.00068 SP 4 0.073 0.078 0.077 0.076 0.00269 SP 5 0.068 0.064 0.071 0. 067 0.00381 SP 6 0.082 0.084 0.080 0.082 0.00196 SP 7 0.076 0.113 0.120 0.103 0.02376 SP 8 0.147 0.166 0.144 0.152 0.01178 SP 9 0.179 0.180 0.171 0.177 0.00454 SPlO 0.123 0.099 0.127 0.116 0.01482 SP11 0.108 0.109 0.114 0.110 0.00328 SP12 0.056 0.071 0.060 0.062 0.00802 SP13 0.062 0.073 0.067 0.067 0.00564 SP14 0.083 0.084 0.086 0.084 0. 00134 SPlS 0.106 0.101 0.093 0.100 0.00675 SP16 0.127 0.137 0.119 0.128 0.00883 SP17 0.132 0.134 0.118 0.128 0.00860 SP18 0.074 0.088 0.077 0.080 0.00743 SP19 0.056 0.056 0.055 0.055 0.00017 SP20 0.011 0.017 0.013 0.014 0.00301 SP21 0.008 0.015 0.017 0.013 0.00456 SP22 0.016 0.011 0.008 0.012 0. 00411 SP23 0.009 0.005 0.008 0.007 0.00166 SP24 0.047 0.042 0.051 0.047 0.00453 SP25 0.049 0.039 0.044 0.044 0.00502 SP26 0.019 0.017 0. 011 0.016 0.00418 SP27 0.018 0.019 0.015 0.017 0.00238
ASP 1 0.086 0.091 0.082 0.086 0.00451 ASP 2 0.123 0.095 0.117 0.112 0.01474 ASP 3 0.115 0.115 0.116 0.115 0.00058 ASP 4 0.115 0.121 0.124 0.120 0.00458 ASP 5 0.102 0.089 0.106 0.099 0.00889 ASP 6 0.121 0.119 0.106 0.115 0.00814 ASP 7 0.150* 0.130 0.124 0.127 0.01361 ASP 8 0.126 0.109 0.114 0.116 0.00874 ASP 9 0. 072 0.055 0.064 0.064 0.00850 ASPlO 0.099 0.122 0.115 0.112 0.01179 ASP11 0.163 0.167 0.150 0.160 0.00889 ASP12 0.122 0.123 0.127 0.124 0.00265 ASP13 NA ASP14 0.101 0.082 0.112 0.098 0.01518

211
TABLE XXXIV (continued)
Sample Standard Number Weight Percent Sulfur Average Deviation
(i) (ii) (iii)
ASP15 0.100 0.097 0. 072 0.099 0.01537 ASP16 0.121 0.143 0.138 0.134 0.01153 ASP17 0.108 0.110 0.106 0.108 0.00200 ASP18 0.111 0.094 0.107 0.104 0.00889 ASP19 0.102 0.103 0.105 0.103 0.00153 ASP20 0.147* 0.122 0.113 0.118 0.01762 ASP21 0.120 0.094 0.115 0.110 0.01380 ASP22 0.155 0.133 0.118 0.135 0.01861 ASP23 0.068 0.082 0.081 0.077 0.00781 ASP24 0.105 0.105 0.099 0.103 0.00346 ASP25 0.055 0.058 0.048 0.054 0.00513 ASP26 0.123 0.119 0.120 0.121 0.00208 ASP27 0.078 0.064 0.073 0.072 0.00709 ASP28 0.154 0.154 0.164 0.157 0.00577 ASP29 0.131 0.122 0.119 0.124 0.00624 ASP30 0.104 0.094 0.106 0.101 0.00643 ASP31 0.106 0.105 0.099 0.104 0.00379 ASP32 0.104 0.107 0.114 0.108 0. 00513 ASP33 0.053 0.068 0.055 0.059 0.00814 ASP34 0.107 0.106 0.118 0.110 0.00666 ASP35 0.072 0.072 0.062 0.069 0.00577 ASP36 0.161* 0.125 0.136 0.130 0.01845 ASP37 0.122 0.098 0.115 0.112 0.01234 ASP38 0.125 0.123 0.112 0.120 0.00700 ASP39 0.116 0.105 0.117 0.113 0.00666 ASP40 0.082 0.087 0.092 0.087 0.00500 NLA 1 0.115 0.117 0.121 0.118 0.00306 NLA 2 0.128 0.119 0.111 0.119 0.00850 NLA 3 0.075 0.084 0.083 0.081 0.00493 NLA 4 0.147 0.146 0.135 0.143 0.00666 NLA 5 0.085 0.083 0.085 0.084 0. 00115 NLA 6 0.107 0.121 0.101 0.110 0.01026 NLA 7 0.111 0.125 0.109 0.115 0.00872 NLA 8 0.114 0.107 0.111 0.111 0.00351 NLA 9 0.108 0.108 0.105 0.107 0.00681 NLAlO . 0.119 0.094 0.109 0.107 0.01258 NLA11 0.116 0.116 0.114 0.115 0. 00115 NLA12 0.122 0.110 0.118 0.117 0.00611 NLA13 0.080 0.082 0.077 0.080 0.00252 NLA14 0.093 0.098 0.102 0.098 0.00451 NLA15 0.074 0.077 0.073 0.075 0.00208 NLA16 0.100 0.103 0.096 0.100 0.00351 NLA17 0. 077 0.090 0.075 0.081 0.00814

212 TABLE XXXIV (continued)
Sample Standard Number Weight Percent Sulfur Average Deviation
(i) (ii) (iii)
NLA18 0.103 0.089 0.095 0.096 0.00702 NLA19 0.092 0.096 0.092 0.093 0.00321 NLA20 0.085 0.094 0.089 0.089 0.00451 NLA21 0.077 0.086 0.077 0.080 0.00520 NLA22 0.076 0.085 0.062 0.074 0. 01159 NLA23 0.087 0.075 0.081 0.081 0.00600 NLA24 0.067 0.074 0.069 0.070 0.00361 NLA25 0.076 0. 072 0.067 0. 072 0.00451 NLA26 0.101 0.098 0.105 0.101 0.00351 NLA27 0.075 0.073 0. 076 0.075 0.00153 NLA28 0.110 0.113 0.099 0.107 0.00737 NLA29 0.091 0.087 0.083 0.087 0.00400 NLA30 0.081 0.083 0.080 0.081 0.00153 NLA31 0.082 0.089 0.093 0.088 0.00557 NLA32 0.094 0.083 0.088 0.088 0.00551 NLA33 0.075 0.075 0.072 0.074 0.00173 NLA34 0.073 0.081 0. 075 0. 076 0.00416 NLA35 0.098 0.100 0.099 0.099 0.00100 NLA36 0.098 0.090 0.098 0.095 0.00462 NLA37 0.082 0. 077 0.076 0.078 0.00321 NLA38 0.098 0.092 0.098 0.096 0.00346 NLA39 0.094 0.103 0.098 0.098 0.00451 NLA40 0.088 0.086 0.085 0.086 0.00153 NLA41 0.062 0.058 0.058 0.059 0.00231 ANA 1 0.179 0.163 0.152 0.165 0. 01358 ANA 2 0.158 0.155 0.156 0.156 0.00153 ANA 3 0.148 0.139 0.138 0.142 0.00551 ANA 4 0.159 0.153 0.154 0.155 0.00321 ANA5 0.181 0.163 0.142 0.163 0.01952 ANA6 0.184 0.186 0.198 0.189 0.00757 ANA 7 0.178 0.174 0.189 0.180 0. 00777 ANA 8 0.124 0.120 0.124 0.123 0.00231 ANA 9 0.090 0.075 0.084 0.083 0.00755 ANAlO 0.113 0.106 0.091 0.103 0.01124 ANA11 0.105 0.102 0.108 0.105 0.00300 ANA12 0.114 0.108 0.113 0.112 0.00321 ANA13 0.103 0.094 0.092 0.096 0.00586 ANA14 0.167* 0.122 0.130 0.126 0.02401 ANA15 0.120 0.110 0.101 0.110 0.00950 ANA16 0.111 0.095 0.097 0.101 0.00872 ANA17 0.107 0.097 0.102 0.102 0.00500 ANA18 0.149 0.105 0.076 0.110 0.03676 ANA19 0.141 0.137 0.133 0.137 0.00400

213
TABLE XXXIV (continued)
Sample Standard Number Weight Percent Sulfur Average Deviation
(i) (ii) (iii)
ANA20 0.133 0.114 0.118 0.122 0.01002 ANA21 0.132 0.125 0.126 0.128 0.00379 ANA22 0.120 0.130 0.126 0.125 0.00503 ANA23 o.n5 O.ll3 0.106 0.111 0.00473 ANA24 O.ll2 0.103 0.111 0.109 0.00493 ANA25 0.161 0.158 0.135 0.151 0.01422 ANA26 0.126 o.no 0.092 0.109 0.01701 ANA27 0.139 0.138 0.135 0.137 0.00208 ANA28 0.123 0.118 0.117 0.120 0.00321 ANA29 0.149 0.140 0.129 0.139 0.01002 ANA30 O.ll4 0.123 0.109 0.115 0.00709 ANA31 0.136 0. 148 0.123 0.136 0.01250 ANA32 0.090 0.096 0.100 0.095 0.00503 ANA33 0.138 0.139 0.129 0.135 0.00551 ANA34 O.ll2 0.111 0.122 0.115 0.00608 ANA35 0.099 0.113 O.llO 0.107 0.00737 ANA36 0.123 0.119 0.133 0.125 0. 00721 ANA37 0.158 0.145 0.121 0.141 0. 01877 ANA38 0.115 0.118 0.117 0.117 0.00153 ANA39 0.117 0.100 0.100 0.106 0.00981 ANA40 0.095 0.095 0.101 0.097 0.00346 HSW 1 0.153 0.155 0.149 0.152 0.00306 HSW 2 0.155 0.153 0.155 0.154 0. 00115 HSW 3 0.129 0.130 0.126 0.128 0.00208 HSW 4 0.134 0.138 0.134 0.135 0.00231 HSW 5 0.105* 0.170 0.177 0.174 0.03970 HSW 6 0.150 0.167 0.163 0.160 0.00889 HSW 7 0.155 0.124 0.127 0.122 0.00624 HSW 8 0.141 0.151 0.156 0.149 0.00764 HSW 9 0.115 0.111 0.105 0.110 0.00503 HSW10 0.132 0.123 0.127 0.127 0.00451 HSWll 0.108 0.121 0.114 0.114 0.00651 HSW12 0.109 0.106 0.098 0.104 0.00569 HSW13 0.195 0.197 0.191 0.194 0.00306 HSW14 0.144 0.158 0.168 0.157 0.01206 HSW15 0.201 0.195 0.198 0.198 0.00300 HSW16 0.181 0.175 0.185 0.182 0.00643 HSW17 0.205 0.203 0.207 0.205 0.00200 HSW18 0.193 0.159 0.157 0.170 0.02023 HSW19 0.220 0.214 0.229 0.221 0.00755 HSW20 0.160 0.154 0.155 0.156 0.00321 HSW21 0.125 0.119 0.119 0.121 0.00346 HSW22 · 0.108 0.102 0.103 0.104 0.00321

214
TABLE XXXIV (continued)
Sample Standard Number Weight Percent Sulfur Average Deviation
(i) (ii) (iii)
HSW23 0.142 0.139 0.143 0.141 0.00208 HSW24 0.119 0.111 0.111 0.114 0.00462 HSW25 0.117 0.180 0.167 0.175 0.00681 HSW26 0.151 0.161 0.165 0.159 0.00721 HSW27 0.209 0.222 0.219 0.217 0.00681 HSW28 0.168 0.207 0.201 0.192 0.02100 HSW29 0.134 0.133 0.132 0.133 0.00100 HSW30 0.099 0.096 0.110 0.102 0.00737 HSW31 0.093 0.091 0.082 0.089 0.00586 HSW32 0.070 0.096 0.092 0.086 0.01400 HSW33 0.133 0.148 0.140 0.140 0.00751 HSW34 0.107 0.130 0.119 0.119 0. 01150 HSW35 0.155 0.162 0.152 0.156 0. 00513 HSW36 0.136 0.117 0.120 0.124 0.01021 HSW37 0.180 0.170 0.174 0.175 0.00503 HSW38 0.101 0.118 0.117 0.112 0.00954 HSW39 0.116 0.113 0.118 0.116 0.00252 HSW40 0.095 0.084 0.084 0.088 0.00635 HSW41 0.159 0.161 0.159 0.160 0.00115 HSW42 0.044 0.047 0.057 0.049 0.00681 HSW43 0.052 0.066 0.059 0.059 0.00700 HSW44 0.054 0.060 0.067 0.060 0.00651 HSW45 0.082 0.085 0.095 0.087 0.00681 HSW46 0.133 0.116 0.130 0.126 0.00907 HSW47 0.112 0.113 0.122 0.116 0.00551 HSW48 0.143 0.143 0.144 0.143 0.00058
. HSW49 0.089 0.091 0.093 0.091 0.00200 HSW50 0.048 0.062 0.024 0.045 0.01922 HSW51 0.079 0.075 0.060 0. 071 0.01002 HSW52 0.083 0.085 0.088 0.085 0.00252 HSW53 0. 072 0.063 0.057 0.064 0.00755 HSW54 0.038 0.046 0.031 0.038 0.00751 HSW55 0.092 0.085 0.082 0.083 0.00513 HSW56 0.085 0.087 0.109 0.094 0.01332 HSW57 0.131 0.119 0.119 0.123 0.00693 HSW58 0.092 0.088 0.095 0.091 0.00351 HSW59 0.110 0.107 0.126 0.114 0.01021 HSW60 0.064 0.065 0.066 0.065 0.00100 HSW61 0.043 0.052 0.054 0.050 0.00586 HSW62 0.054 0.043 0.054 0.050 0.00635 HSW63 0.069 0.066 0.057 0.064 0.00624 HSW64 0.036 0.027 0.033 0.032 0.00458 HSW65 0.069 0.058 0.063 0.063 0.00551

215
TABLE XXXIV (continued)
Sample Standard Number Weight Percent Sulfur Average Deviation
(i) (ii) (iii)
HSW66 0.059 0.053 0.054 0.057 0.00321 HRW 1 0.188 0.171 0.172 0.177 0.00954 HRW 2 0.137 0.137 0.134 0.136 0.00173 HRW 3 0.175 0.154 0.167 0.165 0.01060 HRW 4 0.201 0.192 0.198 0.197 0.00458 HRW 5 0.187 0.181 0.178 0.182 0.00458 HRW 6 0.167 0.175 0.176 0.173 0.00493 HRW 7 0.124 0.153 0.159 0.131 0.00889 HRW 8 0.156 0.153 0.159 0.156 0.00300 HRW 9 0.148 0.147 0.159 0.151 0.00666 HRWlO 0.163 0.145 0.156 0.155 0.00907 HRW11 0.142 0.147 0.146 0.145 0.00265 HRW12 0.159 0.130 0.158 0.149 0.01646 HRW13 0.156 0.150 0.152 0.153 0.00306 HRW14 0.159 0.149 0.135 0.148 0.01206 HRW15 0.135 0.142 0.145 0.142 0.00513 HRW16 0.133 0.132 0.134 0.133 0.00100 HRW17 0.139 0.138 0.137 0.138 0.00100 HRW18 0.119 0.123 0.127 0.123 0.00400 HRW19 0.157 0.133 0.156 0.149 0, 01358 HRW20 0.145 0.125 0.126 0.140 0.00500 HRW21 0.143 0.125 0.126 0.131 0.01012 HRW22 0.145 0.145 0.159 0.150 0.00808 HRW23 0.144 0.147 0.132 0.141 0.00794 HRW24 0.139 0.151 0.136 0.142 0.00794 HRW25 0.144 0.130 0.126 0.133 0.00945 HRW26 0.134 0.131 0.154 0.140 0.01250 HRW27 0.135 0.137 0.134 0.135 0.00153 HRW28 0.141 0.125 0.141 0.135 0.00924 HRW29 0.126 0.145 0.128 0.133 0.01044 HRW30 0.150 0.122 0.132 0.135 0.01419 HRW31 0.127 0.136 0.121 0.128 0.00755 HRW32 0.110 0.133 0.121 0.121 0. 01150 HRW33 0.128 0.126 0.126 0.127 0. 00115 HRW34 0.128 0.127 0.129 0.128 0.00100 HRW35 0.123 0.132 0.122 0.128 0.00551 HRW36 0.118 0.117 0.136 0.123 0.01069 HRW37 0.123 0.123 0.124 0.123 0.00058 HRW38 0.143 0.143 0.124 0.137 0.01097 HRW39 0.135 0.132 0.108 0.125 0.01480 HRW40 0.151 0.167 0.159 0.159 0.00800 NAL 1 0.147 0.155 0.155 0.152 0.00462 NAL 2 0.102 0.117 0.118 0.112 0.00896

216
TABLE XXXIV (continued)
Sample Standard Number Weight Percent Sulfur Average Deviation
(i) (ii) (iii)
NAL 3 0.114 0.100 0.106 0.107 0.00702 NAL 4 0.113 0.108 0.107 0.109 0.00321 NAL 5 0.153 0.128 0.149 0.143 0. 01343 NAL 6 0.120 0.117 0.129 0.122 0.00625 NAL 7 0.150 0.123 0.130 0.134 0.01401 NAL 8 0.188 0.193 0.173 0.185 0.01041 NAL 9 0.117 0.111 0.118 0.115 0.00379 NALlO 0.083 0.090 0.092 0.088 0.00473 NALll 0.142 0.135 0.139 0.139 0.00351 NAL1i 0.099 0.113 0.113 0.108 0.00808 NAL13 0.134 0.145 0.149 0.143 0. 00777 NAL14 · 0.155 0.168 0.165 0.163 0.00681 NALlS 0.174 0.171 0.173 0.173 0.00153 NAL16 0.170 0.182 0.172 0.175 0.00643 NAL17 0.203 0.193 0.210 0.202 0.00854 NALlS 0.215 0.220 0. 211 0.215 0.00451 NAL19 0.124 0.133 0.134 0.130 0.00551 NAL20 · 0.112 0.100 0.112 0.108 0.00693 NAL21 0.112 o; 119 0.124 0.118 0.00603 NAL22 0.074 0.068 0.065 0.069 0.00458 NAL23 0.044 0.057 0.042 0.048 0.00814 NAL24 0.085 0.095 0.097 0.092 0.00643 NAL25 0.138 0.143 0.145 0.142 0.00361 NAL26 0.066 0.065 0.066 0.066 0.00058 NAL27 0.071 0.060 0.073 0.068 0.00700 NAL28 0.105 0.101 0.108 0.105 0.00351 NAL29 0.105 0.119 0.110 0.111 0.00709 NAL30 0.099 0.097 0.109 0.102 0.00643 NAL31 0.094 0.091 0.104 0.096 0. 00681 . NAL32 0.041 0.042 0.039 0.041 0.00153 NAL33 0.060 0.067 0.066 0.064 0.00379 NAL34 0.041 0.044 0.041 0.042 0.00173 NAL35 0.029 0.023 0.022 0.025 0.00379 NAL36 0.037 0.040 0.042 0.040 0.00252 NAL37 0.128 0.113 0.122 0.121 0.00755 NAL38 0.046 0.047 0.040 0.044 0.00379 NAL39 0.180 0.194 0.174 0.183 0. (H026 NAL40 0.106 0.106 0.111 0.108 0.00289 NAL41 0.056 0.047 0.047 0.050 0.00520 NAL42 0.040 0.046 0.032 0.039 0.00702 NAL43 0.03~ 0.037 0.045 0.038 0. 00611 NAL44 0,046. 0.021 0.035 0.034 0.01253 NAL45 0.068 0.055 0.062 0.062 0.00651
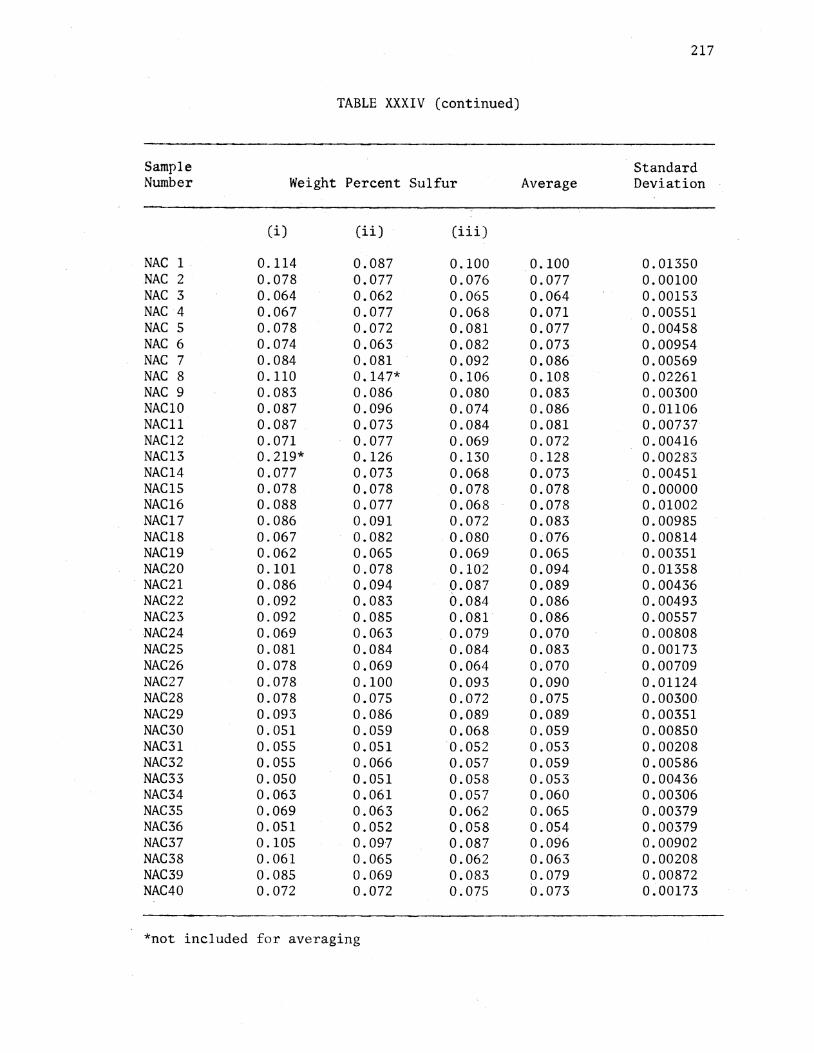
217
TABLE XXXIV (continued)
Sample Standard Number Weight Percent Sulfur Average Deviation
(i) (ii) (iii)
NAC 1. 0.114 0.087 0.100 0.100 0.01350 NAC 2 0.078 0. 077 0.076 0.077 0.00100 NAC 3 0.064 0.062 0.065 0.064 0.00153 NAC 4 0.067 0.077 0.068 0.071 0.00551 NAC 5 0.078 0. 072 0.081 0.077 0.00458 NAC 6 0.074 0.063 0.082 0.073 0.00954 NAC 7 0.084 0.081 0.092 0.086 0.00569 NAC 8 0.110 0.147* 0.106 0.108 0.02261 NAC 9 0.083 0.086 0.080 0.083 0.00300 NAClO 0.087 0.096 0.074 0.086 0. 01106 NACll 0.087 0.073 0.084 0.081 0.00737 NAC12 0.071 0.077 0.069 0.072 0.00416 NAC13 0.219* 0.126 0.130 0.128 0.00283 NAC14 0.077 0.073 0.068 0.073 0.00451 NAC15 0.078 0.078 0.078 0.078 0.00000 NAC16 0.088 0.077 0.068 0.078 0.01002 NAC17 0.086 0.091 0.072 0.083 0.00985 NAC18 0.067 0.082 0.080 0.076 0.00814 NAC19 0.062 0.065 0.069 0.065 0.00351 NAC20 0.101 0.078 0.102 0.094 0.01358 NAC21 0.086 0.094 0.087 0.089 0.00436 NAC22 0.092 0.083 0.084 0.086 0.00493 NAC23 0.092 0.085 0.081 0.086 0.00557 NAC24 0.069 0.063 0.079 0.070 0.00808 NAC25 0.081 0.084 0.084 0.083 0.00173 NAC26 0.078 0.069 0.064 0.070 0.00709 NAC27 0.078 0.100 0.093 0.090 0. 01124 NAC28 0.078 0.075 0. 072 0.075 0.00300 NAC29 0.093 0.086 0.089 0.089 0.00351 NAC30 0.051 0.059 0.068 0.059 0.00850 NAC31 0.055 0.051 0.052 0.053 0.00208 NAC32 0.055 0.066 0.057 0.059 0.00586 NAC33 0.050 0.051 0.058 0.053 0.00436 NAC34 0.063 0.061 0.057 0.060 0.00306 NAC35 0.069 0.063 0.062 0.065 0.00379 NAC36 0.051 0.052 0.058 0.054 0.00379 NAC37 0.105 0.097 0.087 0.096 0.00902 NAC38 0.061 0.065 0.062 0.063 0.00208 NAC39 0.085 0.069 0.083 0.079 0.00872 NAC40 0.072 0.072 0.075 0.073 0.00173
*not included for averaging

APPENDIX C
CALCULATIONS FOR PORE SIZE DISTRIBUTION CURVES
Mercury penetration tests were conducted on each of the five
catalysts used in the HDS studies to estimate pore size distribution.
The mercury penetration tests were performed by American Instrument
Company. The results of their tests are presented in terms of intru
sion versus the exerted pressure as shown in Table XXXV.
The mercury penetration data from Table XXXV were used to
calculate the pore size distribution of the respective catalysts. The
pressure is inversely proportional to the pore radius, and the fre
quency of occurrance of a pore size is directly proportional to the
change in cummulative volume. The cummulative volume at a given
pressure for a catalyst is the difference between the maximum intrusion
for the catalyst and the intrusion at the desired pressure. The sample
calculation steps for pore size distribution are shown in Table XXXVI.
The frequency of pores of a given size (!:::.V/!:::.ln r) was then plotted
against log of pore radius (ln r) for each catalyst to generate
Figures 18-22.
218

TABLE XXXV
MERCURY PENETRATION DATA ......
MCM 1 Catalyst MCM 2 Catalyst MCM 3 Catalyst MCM 4 Catalyst MCM S Catalyst
Absolute Absolute Absolute Absolute Absolute Pressure_ Intrusion Pressure Intrusion Pressure Intrusion Pressure Intrusion Pressure Intrusion
psi a cc/gm psia cc/gm psi a cc/gm psi a cc/gm psi a cc/gm
1.8 o.ooo 1.8 0.000 1.8 o.ooo 1.8 o.ooo 1.8 0.000 9.9 0.000 9.9 O.OQO 9.9 0.005 9.9 0.006 9.9 0.004
250 0.003 49.9 0.004 49.9- 0.009 500 0.006 1000 0.004 500 0.007 250 0.011 159.9 0.019 1500 0.011 3000 0.007 600 0.023 500 0.019 500 0.028 5000 0.011 10000 0.011 800 0.081 1200 0.022 2500 0.033 10000 0.011 15000 0.021
1000 -0.143 2500 0.030 5000 0.038 15000 0.023 19000 0.113 1200 0.196 5000 0.049 10000 0.038 17000 0.074 20000 0.201 1500 0.238 10000 '0.060 15000 0.047 18000 0.130 21000 0.257 2500 0.290 15000 0.078 25000 0.052 20000 0.216 23000 0.331 4000 0.326 20000 0.105 30000 0.075 24000 0.284 25000 0.381 7000 0.371 23000 0.161 32000 0.141 30000 0.346 30000 0.469
10000 0.411 25000 0.213 34000 0.216 35000 0.391 35000 0.511 15000 0.502 27000 0.272 36000 0.291 40000 0 ... 14 40000 0.518 20000 0.609 30000 0.347 38000 0,343 50000 0.431 50000 0.525 24000 0.701 35000 0.418 40000 0.375 60000 0.431 60000 0.525 28000 0.785 40000 0.448 45000 0.418 32000 0.857 50000 0.463 50000 0.432 40000 0.935 60000 0.463 60000 0.441 50000 0.974 60000 0.981
N 1-' \.0

v Cumulative
0.525
0.521
0.521
0.518
0.514
0.504
0.412
0.324
0.268
0.194
0.144
0.056
0.014
0.007
0.000
0.000
TABLE XXXVI
CALCULATIONS FOR PORE SIZE DISTRIBUTION CURVE MCM 5 CATALYST
6V r ln r t:,.ln r
486000 13.09 0.004 1. 70
88400 11.39 0.000 4.60
875 6.79 o. oo·3 1.10
292 5.69 0.004 1. 22
87.5 4.47 0.010 0.41
58.3 4.06 0.092 0.23
46.1 3.83 0.088 0.05
43.7 3.78 0.056 0.05
41.7 3.73 0.074 0.09
38.0 3.64 0.050 0.08
35.0 3.56 0.088 0.18
29.2 3.38 0.042 0.16
25.0 3.22 0.007 0.14
21.9 3.08 0.007 0.22
17.5 2.86 0.000 0.18
14.6 2.68
220
t:,.V 11ln r
0.0024
0.0000
0.0027
0.0033
0.0244
0.4000
1.7600
1.1200
0.8222
0.6250
0.4889
0.2625
0.0500
0.0318
0.0000

APPENDIX D
ESTIMATION OF THE GAS PRODUCED IN THE REACTOR
In this experimental study, the rate of gas going out of the
reactor was measured on a wet test meter. The hydrogen flow rate at
the entrance of the reactor was not measured because of the high
pressure conditions. Therefore, the amount of gas produced from the
gasified oil and the amount of hydrogen consumed in the various
heterogeneous reactions calculated in Appendix E are necessary to
estimate hydrogen entering the reactor. The literature (118) in-
dicates that the assumption of 5% of the feedstock vaporized is
reasonable, and thus, it is used below to estimate the amount of gas
produced.
The maximum oil flow rate employed = 80 cc/hr
Oil flowrate = 80 cc/hr/(1.595 x 105 cc/Bbl) = 5.02 x 10⁻⁴ Bbl/hr
Amount of oil vaporized= 80 cc/hr x 1.13 gm/cc x 0.05 = 4.5 gms/hr
Assuming* the molecular weight of oil to be 28.6
Amount of vapor produced = 4.5 gm/hr/(28.6 gm/mole) = 0.152 gm-mole/hr
= 3.32 x 10⁻⁴ lb-mole/hr = 0.120 scf/hr
-4 = 0.120 scf/hr/(5.02 x 10 Bbl/hr)
= 238 scf/Bbl
221

222
*Gas produced and its molecular weight, from literature (118)
Production Contribution to Average Component Rate, tpd Molecular Weight (MW)
C02 259 2.47
H2S 913 6.73
cl 1903 6.60
cz 830 5.39
c3 483 4.60
c4 224 2.80
4612 Average = 28.59

APPENDIX E
ESTIMATION OF HYDROGEN CONSUMPTION FROM
KNOWN HETEROGENEOUS REACTIONS
There are primarily five reactions during HDS in which the
hydrogen gas is consumed, viz. sulfur removal, nitrogen removal, oxygen
removal, vaporization, and hydrocracking. The hydrogen consumption in
each of these reactions is estimated separately and added together to
obtain the total hydrogen consumption.
(i) Sulfur Removal:
Initial concentration in feed oil = 0.47% by weight
Final concentration in product oil = 0.09% by weight
Sulfur removal = 0.38% by weight
= 0.0038 gm S/gm oil
= 0.000119 gm-mole S/gm oil
= 0.0428 lb-mole S/Bbl oil
H2 consumption rate @ 1 mole H2/mole S removed
= 0.0428 lb-mole/Bbl oil
= 16.2 scf/Bbl
(ii) Nitrogen Removal:
Nitrogen removal = 0.50% = 0.0050 gm N2/gm oil
= 0.000179 gm-mole N2/gm oil
= 0.0644 lb-mole N2/Bbl oil
223

Hz consumption rate @ 3 mole H2/mole N2 removed
= 0.193 lb-mole/Bbl oil
= 73.1 scf/Bbl
(iii) Oxygen Removal:
Oxygen removal (assume 2%) = 0.02 gm o2/gm oil
0.000625 gm-mole 02/gm oil
= 0.225 lb-mole 02/Bbl oil
H2 consumption rate @ 1/2 mole H2/mole 02 removed
= 0.1125 lb-mole/Bbl
= 42.6 scf/Bbl
(iv) Gas Production:
Gas produced = 238 scf/Bbl (from Appendix D)
H2 consumption rate @ 1 mole H2/mole gas produced
= 238 scf/Bbl
(v) Hydrocracking:
224
The experiments by Wan (52) on similar feedstock showed that
about 8 volume % of the 650+ boilers were involved in hydro
cracking.
Amount of oil hydrocracked = 0.08 Bbl/Bbl oil
= 28.8 lbs/Bbl oil
= 0.160 lb-mole/Bbl oil
(© MW = 180)
H2 consumption rate @ 1 mole H2/mole hydrocracked
= 0.160 lb-mole/Bbl
= 60.6 scf/Bbl
Total hydrogen consumption rate = 430.5 scf/Bbl oil fed

APPENDIX F
EXPERIMENTAL DATA
Five different types of catalysts were tested during th~ eight
experimental runs. Numerous samples were collected to study the
effects of the reactor operating conditions. The reactor conditions
selected for each of the samples are listed in Table XXXVII. The
actual reactor temperature was held within~ 3 F (1.8 C) in the
catalyst zone (see Figure 13 for a typical temperature profile, Exper
imental Procedure Chapter). Except for one experimental run, the
actual reactor pressure was held within ~ 20 psi of the desired value.
During one run, the reactor pressure was mistakenly set a 1,060 psig
instead of 1,000 psig. However, the run was not repeated because of
the apparent absence of influence of pressure on the sulfur removal
capability of the catalyst tested in the previous run. The samples
collected are identified by the series name and the order of collection
of a particular sample in that series. The reactor space time is
presented both as volume hourly (volume of catalyst/volume of oil per
hour) and weight hourly (weight of catalyst/weight of oil per hour).
The experimental conditions such as hydrogen rate, catalyst size that
were held constant during all the runs are listed at the end of the
table.
225

226
TABLE XXXVII
EXPERIMENTAL DATA
Sample a b c osd Temp. Press. Hours "6
Number F psig LVHST LWHST on Oil Avg.
SP 1 600 1000 2.500 1.173 4 0.133 SP 2 600 1000 2.500 1.173 8 0.102 SP 3 600 1000 2.500 1.173 12 0.072 SP 4 600 1000 2.500 1.173 16 0.076 SP 5 600 1000 2.500 1.173 18 0.067 SP 6 600 1000 1.250 0.587 20 0.082 SP 7 600 1000 1.250 0.587 21 0.103 SP 8 600 1000 0.625 0.294 24 0.152 SP 9 600 1000 0.625 0.294 25 0.177 SPlO 600 1000 2.500 1.173 29 0.116 SP11 600 1000 2.500 1.173 31 0.110 SP12 650 1000 2.500 1.173 35 0.062 SP13 650 1000 2.500 1.173 37 0.067 SP14 650 1000 1. 250 0.587 40 0.084 SP15 650 1000 1.250 0.587 41 0.100 SP16 650 1000 0.625 0.294 43 0.128 SP17 650 1000 0.625 0.294 44 0.128 SP18 650 1000 2.500 1.173 46 0.080 SP19 650 1000 2.500 1.173 48 0.055 SP20 750 1000 2.500 1.173 53 0.014 SP21 750 1000 2.500 1.173 55 0.013 SP22 750 1000 1. 250 0.587 57 0.012 SP23 750 1000 1.250 0.587 58 0.007 SP24 750 1000 0.625 0.294 60 0.047 SP25 750 1000 0.625 0.294 61 0.044 SP26 750 1000 2.500 1.173 65 0.016 SP27 750 1000 2.500 1.173 67 0.017
ASP 1 700 1000 0.925 0.440 9 0.086 ASP 2 700 1000 0.925 0.440 14 0.112 ASP 3 700 1000 0.925 0.440 19 0.113 ASP 4 700 1000 0.925 0.440 25 0.120 ASP 5 700 1000 0.925 0.440 29 0.098 ASP 6 700 1000 0.925 0.440 34 0.115 ASP 7 700 1000 0.925 0.440 39 0.127 ASP 8 700 1000 0.925 0.440 44 0.116 ASP 9 700 1000 0.925 0.440 49 0.064 ASPlO 700 1000 0.925 0.440 54 0.112 ASPll 700 1000 0.925 0.440 59 0.160 ASP12 700 1000 0.925 0.440 64 0.124 ASP13 700 1000 0.925 0.440 70 NA ASP14 700 1000 0.925 0.440 75 0.098 ASP15 700 1000 0.925 0.440 80 0.099 ASP16 700 1000 0.925 0.440 85 0.134

227
TABLE XXXVII (Continued)
Sample Temp~ Press~ Hoursc %Sd Number F psig LVHST LWHST on Oil Avg.
ASP17 700 1000 0.925 0.440 90 0.108 ASP18 700 1000 0.925 0.440 95 0.104 ASP19 700 1000 0.925 0.440 100 0.103 ASP20 700 1000 0.925 0.440 105 0.118 ASP21 700 1000 0.925 0.440 110 0.110 ASP22 700 1000 0.925 0.440 115 0.135 ASP23 700 1000 0.925 0.440 120 0. 077 ASP24 700 1000 0.925 0.440 125 0.103 ASP25 700 1000 0.925 0.440 130 0.054 ASP26 700 1000 0.925 0.440 135 0.121 ASP27 700 1000 0.925 0.440 140 0.072 ASP28 700 1000 0.925 0.440 145 0.157 ASP29 700 1000 0.925 0.440 150 0.124 ASP30 700 1000 0.925 0.440 155 0.101 ASP31 700 1000 0.925 0.440 160 0.104 ASP32 700 1000 0.925 0.440 165 0.108 ASP33 700 1000 0.925 0.440 170 0.059 ASP34 700 1000 0.925 0.440 175 0.110 ASP35 700 1000 0.925 0.440 180 0.069 ASP36 700 1000 0.925 0.440 185 0.130 ASP37 700 1000 0.925 0.440 190 0.112 ASP38 700 1000 0.925 0.440 195 0.120 ASP39 700 1000 0.925 0.440 200 0.113 ASP40 700 1000 0.925 0.440 205 0.087 ANA 1 700 1000 0.640 0.440 7 0.165 ANA 2 700 1000 0.640 0.440 10 0.156 ANA 3 700 1000 0.640 0.440 15 0.142 ANA 4 700 1000 0.640 0.440 20 0.155 ANAS 700 1000 0.640 0.440 25 0.163 ANA 6 700 1000 0.640 0.440 30 0.189 ANA 7 700 1000 0.640 0.440 35 0.180 ANA 8 700 1000 0.640 0.440 40 0.123 ANA9 700 1000 0.640 0.440 45 0.183 ANA10 700 1000 0.640 0.440 so 0.103 ANA11 700 1000 0.640 0.440 55 0.105 ANA12 700 1000 0.640 0.440 60 0.112 ANA13 700 1000 0.640 0.440 65 0.096 ANA14 700 1000 0.640 0.440 70 0.126 ANA15 700 1000 0.640 0.440 75 0.110 ANA16 700 1000 0.640 0.440 80 0.101 ANA17 700 1000 0.640 0.440 85 0.102 ANA18 700 1000 0.640 0.440 90 0.110 ANA19 700 1000 0.640 0.440 95 0.137 ANA20 700 1000 0.640 0.440 100 0.122 ANA21 700 1000 0.640 0.440 105 6.128

228
TABLE XXXVII (Continued)
Sample Temp~ b Press. Hoursc %Sd Number F psig LVHST LWHST on Oil Avg.
ANA22 700 1000 0.640 0.440 110 0.125 ANA23 700 1000 0.640 0.440 115 0.111 ANA24 700 1000 0.640 0.440 120 0.109 ANA25 700 1000 0.640 0.440 125 0.151 ANA26 700 1000 0.640 0.440 130 0.109 ANA27 700 1000 0.640 0.440 135 0.137 ANA28 700 1000 0.640 0.440 140 0.120 ANA29 700 1000 0.640 0.440 145 0.139 ANA30 700 1000 0.640 0.440 150 0.115 ANA31 700 1000 0.640 0.440 155 0.136 ANA32 700 1000 0.640 0.440 160 0.095 ANA33 700 1000 0.640 0.440 165 0.135 ANA34 700 1000 0.640 0.440 170 0.115 ANA35 700 1000 0.640 0.440 175 0.107 ANA36 700 1000 0.640 0.440 180 0.125 ANA37 700 1000 0.640 0.440 185 0.141 ANA38 700 1000 0.640 0.440 190 0.117 ANA39 700 1000 0.640 0.440 195 0.106 ANA40 700 1000 0.640 0.440 200 0.097 NLA 1 700 1000 0.616 0.440 6 0.118 NLA 2 700 1000 0.616 0.440 10 0.119 NLA 3 700 1000 0.616 0.440 15 0.081 NLA 4 700 1000 0.616 0.440 20 0.143 NLA 5 700 1000 0.616 0.440 25 0.084 NLA 6 700 1000 0.616 0.440 30 0.110 NLA 7 700 1000 0.616 0.440 35 0.115 NLA 8 700 1000 0.616 0.440 40 0.111 NLA 9 700 1000 0.616 0.440 45 0.107 NLA10 700 1000 0.616 0.440 50 0.107 NLAll 700 1000 0.616 0.440 55 0.115 NLA12 700 1000 0.616 0.440 60 0.117 NLA13 700 1000 0.616 0.440 65 0.080 NLA14 700 1000 0.616 0.440 70 0.098 NLA15 700 1000 0.616 0.440 75 0.075 NLA16 700 1000 0.616 0.440 80 0.100 NLA17 700 1000 0.616 0.440 85 0.081 NLA18 700 1000 0.616 0.440 90 0.096 NLA19 700 1000 0.616 0.440 95 0.093 NLA20 700 1000 0.616 0.440 100 0.089 NLA21 700 1000 0.616 0.440 105 0.080 NLA22 700 1000 0.616 0.440 110 0.074 NLA23 700 1000 0.616 0.440 115 0.081 NLA24 700 1000 0.616 0.440 120 0.070 NLA25 700 1000 0.616 0.440 125 0.072 NLA26 700 1000 0.616 0.440 130 0.101

229
TABLE XXXVII (Continued)
Sample Temp~ Press~ Hoursc %Sd Number r psig LVHST LWHST on Oil Avg.
NLA27 700 1000 0.616 0.440 135 0.075 NLA28 700 1000 0.616 0.440 140 0.107 NLA29 700 1000 0.616 0.440 145 0.087 NLA30 700 1000 0.616 0.440 150 0.081 NLA31 700 1000 0.616 0.440 155 0.088 NLA32 700 1000 0.616 0.440 160 0.088 NLA33 700 1000 0.616 0.440 165 0.074 NLA34 700 1000 0.616 0.440 170 0.076 NLA35 700 1000 0.616 0.440 175 0.099 NLA36 700 1000 0.616 0.440 180 0.095 NLA37 700 1000 0.616 0.440 185 0.078 NLA38 700 1000 0.616 0.440 190 0.096 NLA39 700 1000 0.616 0.440 195 0.098 NLA40 700 1000 0.616 0.440 200 0.086 NLA41 700 1000 0.616 0.440 205 0.059 HSW 1 650 1000 1.300 0.880 7 0.152 HSW 2 650 1000 1.300 0.880 10 0.154 HSW 3 650 1000 1.300 0.880 14 0.128 HSW 4 650 1000 1.300 0.880 18 0.135 HSW 5 650 1000 1.300 0.880 22 0.174 HSW 6 650 1000 1.300 0.880 26 0.160 HSW 7 650 1000 1.300 0.880 30 0.122 HSW 8 650 1000 1.300 0.880 34 0.149 HSW 9 650 1000 1.300 0.880 38 0.110 HSW10 650 1000 1.300 0.880 42 0.127 HSW11 650 1000 1.300 0.880 46 0.114 HSW12 650 1000 1.300 0.880 50 0.104 HSW13 650 1000 0.650 0.440 54 0.194 HSW14 650 1000 0.650 0.440 56 0.157 HSW15 650 1000 0.325 0.220 57 0.198 HSW16 650 1000 0.325 0.220 58 0.182 HSW17 650 1500 0.325 0.220 65 0.205 HSW18 650 1500 0.325 0.220 66 0.170 HSW19 650 1500 0.650 0.440 70 0.221 HSW20 650 1500 0.650 0.440 71 0.156 HSW21 650 1500 1.300 0.880 75 0.121 HSW22 650 1~00 1.300 0.880 77 0.104 HSW23 650 500 1.300 0.880 82 0.141
· HSW24 650 500 1.300 0.880 84 0.114 HSW25 650 500 0.650 0.440 87 0.175 HSW26 650 500 0.650 0.440 89 0.159 HSW27 650 500 0.325 0.220 92 0.217 HSW28 650 500 0.325 0.220 93 0.192 HSW29 650 1000 1.300 0.880 96 0.133 HSW30 650 1000 1.300 0.880 98 0.102

230
TABLE XXXVII (Continued)
Sample a
Temp. b
Press. Hours c
%S d
Number F psig LVHST LWHST on Oil Avg.
HSW31 700 1000 1.300 0.880 106 0.089 HSW32 700 1000 1.300 0.880 108 0. 086 HSW33 700 1000 0.650 0.440 114 0.140 HSW34 700 1000 0.650 0.440 116 0.119 HSW35 700 1000 0.325 0.220 121 0.156 HSW36 700 1000 0.325 0.220 122 0.124 HSW37 700 1500 0.325 0.220 127 0.175 HSW38 700 1500 0.325 0.220 128 0.112 HSW39 700 1500 0.650 0.440 135 0.116 HSW40 700 1500 0.650 0.440 137 0.088 HSW41 700 1500 1.300 0.880 144 0.160 HSW42 700 1500 1.300 0.880 146 0.049 HSW43 700 500 1.300 0.880 150 0.059 HSW44 700 500 1.300 0.880 152 0.060 HSW45 700 500 0.650 0.440 155 0.087 HSW46 700 500 0.650 0.440 156 0.126 HSW47 700 500 0.325 0.220 161 0.116 HSW48 700 500 0.325 0.220 162 0.143 HSW49 700 1000 1.300 0.880 166 0.091 HSW50 700 1000 1.300 0.880 168 0.045 HSW51 750 1000 1.300 0.880 175 0.071 HSW52 750 1000 1.300 0.880 177 0.085 HSW53 750 1000 0.650 0.440 181 0.064 HSW54 750 1000 0.650 0.440 183 0.038 HSW55 750 1000 0.325 0.220 186 0.083 HSW56 750 1000 0.325 0.220 187 0.094 HSW57 750 1500 0.325 0.220 194 0.123 HSW58 750 1500 0.325 0.220 195 0.091 HSW59 750 1500 0.650 0.440 199 0.114 HSW60 750 1500 0.650 0.440 201 0.065 HSW61 750 1500 1.300 0.880 208 0.050 HSW62 750 1500 1.300 0.880 210 0.050 HSW63 750 500 1.300 0.880 215 0.064 HSW64 750 500 1.300 0.880 219 0.032 HSW65 750 500 0.650 0.440 223 0.063 HSW66 750 500 0.650 0.440 225 0.057 HSW67 750 500 0.325 0.220 228 NA HSW68 750 500 0.325 0.220 229 NA HSW69 750 1000 1.300 0.880 234 NA HSW70 750 1000 1.300 0.880 236 NA HRW 1 700 1000 0.650 0.440 8 0.177 HRW 2 700 1000 0.650 0.440 15 0.136 HRW 3 700 1000 0.650 0.440 18 0.165 HRW 4 700 1000 0.650 0.440 21 0.197 HRW 5 700 1000 0.650 0.440 25 0.182

231
TABLE XXXVII (Continued)
a b c d Sample Temp. Press. Hours %S Number F psig LVHST LWHST on Oil Avg.
HRW 6 700 1000 0.650 0.440 30 0.173 HRW 7 700 1000 0.650 0.440 35 0.131 HRW 8 700 1000 0.650 0.440 40 0.156 HRW 9 700 1000 0.650 0.440 45 0.151 HRW10 700 1000 0.650 0.440 50 0.155 HRW11 700 1000 0.650 0.440 55 0.145 HRW12 700 1000 0.650 0.440 60 -0.149 HRW13 700 1000 0.650 0.440 65 0.153 HRW14 700 .1000 0.650 0.440 70 0.148 HRW15 700 1000 0.650 0.440 75 0.142 HRW16 700 1000 0.650 0.440 80 0.131 HRW17 700 1000 0.650 0.440 85 0.138 HRW18 700 1000 0.650 0.440 90 0.123 HRW19 700 1000 0.650 0.440 95 0.149 HRW20 700 1000 0.650 0.440 100 0.140 HRW21 700 1000 0.650 0.440 105 0.131 HRW22 700 1000 0.650 0.440 110 0.150 HRW23 700 1000 0.650 0.440 115 0.141 HRW24. 700 1000 0.650 0.440 120 0.142 HRW25 700 1000 0.650 0.440 125 0.133 HRW26 700 1000 0.650 0.440 130 0.140 HRW27 700 1000 0.650 0.440 135 0.135 HRW28 700 1000 0.650 0.440 140 0.136 HRW29 700 1000 0.650 0.440 145 0.133 HRW30 700 1000 0.650 0.440 150 0.135 HRW31 700 1000 0.650 0.440 155 0.128 HRW32 700 1000 0.650 0.440 160 0.121 HRW33 700 1000 0.650 0.440 165 0.127 HRW34 700 1000 0.650 0.440 170 0.128 HRW35 700 1000 0.650 0.440 175 0.128 HRW36 700 1000 0.650 0.440 180 0.124 HRW37 700 1000 0.650 0.440 185 0.123 HRW38 700 1000 0.650 0.440 190 0.137 HRW39 700 1000 0.650 0.440 195 0.125 HRW40 700 1000 0.650 0.440 200 0.159 NAL 1 650 1000 1.480 0.880 7 0.152 NAL 2 650 1000 1.480 0.880 9 0.112 NAL 3 650 1000 1.480 0.880 12 0.107 NAL 4 650 1000 1.480 0.880 16 0.109 NAL 5 650 1000 1. 480 0.880 20 0.143 NAL 6 650 1000 1.480 0.880 24 0.122 NAL 7 650 1000 1.480 0.880 28 0.134 NAL 8 650 1000 1.480 0.880 32 0.185 NAL 9 650 .1000 1.480 0.880 36 0.115 NAL10 650 1000 1.480 0.880 40 0.088

232
TABLE XXXVII (Continued)
Sample a b c o sd Temp. Press. Hours "6
Number F psig LVHST LWHST on Oil Avg.
NALll 650 1000 1. 480 . 0. 880 44 0.139 NAL12 650 1000 1.480 0.880 48 0.108 NAL13 650 1000 0.740 0.440 so 0.143 NAL14 650 1000 0.740 0.440 52 0.163 NALlS 650 1000 0.740 0.440 54 0.173 NAL16 650 1000 0.370 0.220 55 0.175 NAL17 650 1000 0.370 0.220 56 0.202 NAL18 650 1000 0.370 0.220 57 0.215 NAL19 650 1000 1.480 0.880 59 0.130 NAL20 650 1000 1.480 0.880 61 0.108 NAL21 650 1000 1.480 0.880 63 0.118 NAL22 700 1000 1.480 0.880 67 0.069 NAL23 700 1000 1.480 0.880 69 0.048 NAL24 700 1000 1.480 0.880 71 0.092 NAL25 700 1000 0.740 0.440 73 0.142 NAL26 700 1000 0.740 0.440 75 0.066 NAL27 700 1000 0.740 0.440 77 0.068 NAL28 700 1000 0.370 0.440 78 0.105 NAL29 700 1000 0.370 0.440 79 0.111 NAL30 700 1000 0.370 0.440 80 0.102 NAL31 700 1000 1.480 0.880 82. 0.096 NAL32 700 1000 1.480 0.880 84 0.041 NAL33 700 1000 1.480 0.880 86 0.064 NAL34 750 1000 1.480 0.880 90 0.042 NAL35 750 1000 1.480 0.880 92 0.025 NAL36 750 1000 1.480 0.880 94 0.040 NAL37 750 1000 0.740 0.440 96 0.121 NAL38 750 1000 0.740 0.440 98 0.044 NAL39 750 1000 0.740 0.440 100 0;183 NAL40 750 1000 0.493 0.294 101 0.108 NAL41 750 1000 0.493 0.294 102 0.050 NAL42 750 1000 0.493 0.294 103 0.039 NAL43 750 1000 1.480 0.880 105 0.038 NAL44 750 1000 1.480 0.880 107 0.034 NAL45 750 1000 1.480 0.880 109 0.062 NAC 1 700 1000 0.740 0.440 8 0.100 NAC 2 700 1000 0.740 0.440 12 0.077 NAC 3 700 1000 0.740 0.440 15 0.064 NAC 4 700 1000 0.740 0.440 20 0.071 NAC 5 700 1000 0.740 0.440, 25 0.077 NAC 6 700 1000 0.740 0.440 30 0.073 NAC 7 700 1000 0.740 0.440 35 0.086 NAC 8 700 1000 0.740 0.440 40 0.108 NAC 9 700 1000 0.740 0.440 45 0.083 NAClO 700 1000 0.740 0.440 50 0.086

233
TABLE XXXVII (Continued)
a b c o,sd Sample Temp. Press. Hours '0
Number F psig LVHST LWHST on Oil Avg.
NACll 700 1000 0.740 0.440 55 0.081 NAC12 700 1000 0.740 0.440 60 0. 072 NAC13 700 1000 0.740 0.440 65 0.128 NAC14 700 1000 0. 740 0.440 70 0.073 NAC15 700 1000 0.740 0.440 75 0.078 NAC16 700 1000 0.740 0.440 80 0.078 NAC17 700' 1000 0.740 0.440 85 0.083 NAC18 700 1000 0.740 0.440 90 0.076 NAC19 700 1000 0.740 0.440 95 0.065 NAC20 700 1000 0.740 0.440 100 0.094 NAC21 700 1000 0.740 0.440 105 0.089 NAC22 700 1000 0.740 0.440 110 0.086 NAC23 700 1000 0.740 0.440 115 0.086 NAC24 700 1000 0.740 0.440 120 0.070 NAC25 700 1000 0.740 0.440 125 0.083 NAC26 700 1000 0.740 0.440 130 0.070 NAC27 700 1000 0. 740 0.440 135 0.090 NAC28 700 1000 0.740 0.440 140 0.075 NAC29 700 1000 0.740 0.440 145 0.089 NAC30 700 1000 0.740 0.440 150 0.059 NAC31 700 1000 0.740 0.440 155 0.053 NAC32 700 1000 0.740 0.440 160 0.059 NAC33 700 1000 0.740 0. 440 . 165 0.053 NAC34 700 1000 0. 740 0.440 170 0.060 NAC35 700 1000 0.740 0.440 175 0.065 NAC36 700 1000 0.740 0.440 180 0.054 NAC37 700 1000 0.740 0.440 185 0.096 NAC38 700 1000 0.740 0.440 190 0.063 NAC39 700 1000 0.740 0.440 195 0.079 NAC40 700 1000 0.740 0.440 200 0.073
aN . omJ.nal reactor temperatu!e·
bN . omJ.nal reactor pressure.
c Total hours which the catalyst has been in con tact with oil.
d . h Average weJ.g t percent sulfur in the product oil.
The hydrogen flow rate to the reactor was held steady at 1500 SCF/Bbl during all the experimental runs.
The particle sizes of catalyst and inert were 8-10 mesh during all the experimental runs .
•

APPENDIX G
ESTIMATION OF PARTICLE PECLET NUMBER
The particle Peclet number (Pem) for the cocurrent flow in a
trickle bed reactor is estimated using the model developed by Hockman
and Effron (40). The model is applicable to the condition when the
liquid side Reynolds number (ReL) is between 4 and 100. The liquid
side Reynolds number is needed to estimate the Peclet number.
Reynolds number estimation:
=~
for the experiments in this study,
average catalyst particle diameter = 0.2 em = dp
average liquid flow rate = 40 cc/hr
cross-section area available for the flow of liquid = 0.296 cm2
average liquid density = 1.1365 gm/cc PL
average liquid velocity = 135.1 cm/hr = VL
average liquid viscosity = 0.05 cp = 1.8 gm/cm-hr = ~L
These values are then substituted in the above equation to give
0.2 X 135.1 X 1.1365 1.8
17.06
234

235
Peclet number estimation:
The Hockman and Effron model to estimate Peclet number is -
Pem = 0.042 X Re 0 · 5 L
Pem = 0.042 X (17.06) 0 · 5
Pem = 0.1735

APPENDIX H
DIFFUSION COEFFICIENTS OF THE REACTANTS
The principal reactants involved in the HDS reaction were hydrogen
and sulfur containing compounds. Greenwood (94) determined that the
most frequently occurring sulfur containing compound (about 74%) in the
anthracene feedstock was dibenzothiophene. Therefore, dibenzothiophene
is considered here to represent the sulfur containing compounds. The
diffusion coefficients of the reactants are calculated from a correla-
tion developed by Wilke (124) for diffusion in liquids. The correlation
is as follows:
-8 (Ax M) 0 · 5 x T D L = 7 • 4 X 1 0 X -"------''-----:::---:::--
].1 X (Vb)0.6
where, DL = diffusion coefficient of the solute, cm2/sec
A = "association parameter" for solvent
M = molecular weight of the solvent
J.1 = viscosity of the solvent, cp
Vb = molar volume of the solute, cc/gm-mole
T = temperature, K
For the present study, these variables have the magnitudes as shown.
M = 208
J.1 = 0.05 cp (by extrapolation)
T = 644.4 K (700 F)
236

237
A = 1.0
(i) Diffusion coefficient of hydrogen
vb = 14.3
DL 7.4 X 10-8 X (1 X 208) 0 "5 X 644.4 =
0.05 X (14.3) 0 · 6
DL = 2.788 x lo-3 cm2/sec
(ii) Diffusion coefficient of dibenzothiophene
vb = 191.3
DL = 7.4 X 10- 8 X (1 X 208)0.5 X 644.4
0.05 X (191.3) 0 · 6
DL = 5.881 x 10⁻⁴cm2/sec

APPENDIX I
ESTIMATION OF 4l AND n
N -1] q, = ~ 3 f
0.5
where, R = particle diameter, em
k =reaction rate constant, 1/(hr x cone.)
Cs = % S in feed oil
Deff = diffusivity of the sulfur compound, cm2/sec
Therefore,
<1J = 0.2 rlO X 0.47 l0 ·5
3 [3600 X 5.881 X 10 4j
· 4J = 0 · 2 X (2.200) 0 · 5 3
<ll = 0.09933
n = ___ l_ x (34l Coth 34l - 1) 3q, 2
11 = 1 [3 X (0.09933) X Coth (3 X 0.09933) - 1] 3(0.099332
1 11 = ~=~ 0.02960 0.2980 X Coth (0.2980) - 1
1 (0.2980 X 3.4529 1) n = 0.02960 X -
= 1 X (1. 02 8964 - 1) n 0.02966
n = 0.979
238

APPENDIX J
CALCULATION OF TEMPERATURE GRADIENT
IN CATALYST PORES
The temperature in the catalyst pores has a bearing on the diffu-
sion of the reactants, and thereby, on the overall HDS reaction rate.
Drastic deviations of temperature in the catalyst pores could lead to
erroneous temperature effect conclusions. The internal temperature of
the catalyst pores can be calculated from the heat of reaction effects.
Satterfield (90) developed a correlation to estimate the tempera-
ture gradient in the catalyst pores. The correlation is:
where, Lili = heat of reaction = -28,730 cal/mole
= effective diffusivity of sulfur containing compounds = 5.881 x lo-4 cm2/sec
>- = thermal conductivity of alumina = 6.2 x 10⁻⁴ cal/sec em C
Cs = concentration of sulfur at surface = 0.0048 x 10⁻² mole/cc
Cc = concentration of sulfur at center = 0
Substituting all these values in the above equation,
( ) ( -4) 2 28730 5.881 X 10 X (0.0048 X 10- ) 6.2 X 10- 4
= 1.26 C = 2.3 F
239

240
This gradient was no greater than the temperature variations in
the other sections of the reactor. Therefore, the temperature gradient
in the catalyst pores was not considered to have any noticeable effect
on the overall HDS reaction rate.

APPENDIX K
CALCULATION OF ACTIVATION ENERGY
The calculations for a typical case are shown here. The values
fork and Tare from Table XXIX for MCM 4 catalyst at 1,000 psig.
Temp., F k
650
700
750
5.787 (cu ft) 2/mole hr
7.563
12.430
It is assumed that the relation between k and T can be represented
by the Arrhenius expression.
k =A·. e-E/RT
or ln k = ln A - E/RT
The activation energy is computed from the above data and linear
regression technique
E = 20,302 Btu/lb mole
241

?.... VITA
Dhirendra Chhotalal Mehta
Candidate for the Degree of
Doctor of Philosophy
Thesis: CATALYST AGING TESTS AND THE ROLE OF CATALYST WETTING ON HYDRODESULFURIZATION OF A COAL DERIVED LIQUID
Major Field: Chemical Engineering
Biographical:
Personal Data: Born in Bombay, India, on December 2, 1948, to Mangla and Chhotalal Mehta.
Education: Graduated from S. M. C. High School in Poona, India, in 1964; received Bachelor of Science degree in Chemical Engineering from Banaras Hindu University, Varanasi, India in March, 1970; received Master of Science degree in Chemical Engineering from Oklahoma State University, Stillwater, Oklahoma in July, 1972; completed requirements for the Doctor of Philosophy degree at Oklahoma State University in May, 1978.
Professional Experience: Engineering trainee at Excel Industries Ltd., Bombay, India, summer 1969; Graduate Teaching Assistant, Oklahoma State University, Stillwater, Oklahoma, January, 1972 to May, 1973; Graduate Research Assistant, Oklahoma State University, June, 1973 to October, 1975; Employed at Combustion Equipment Associates, Inc., from October, 1975 to present.