Catalan government popularity. An example of economic effects on sub-national government support
33
Catalan Government Popularity. An example of Economic Effects on Sub-national Government Support Aida Díaz & Clara Riba * * Aida Díaz is PhD student at the Universitat Autònoma de Barcelona, Departament de Ciència Política i de Dret Públic. Address: Edifici B, 08193 Bellaterra, Spain. Tel: (34) 93 490 08 73 Fax: (34) 93 581 24 39 E-mail: [email protected] * Clara Riba is lecturer at the Universitat Pompeu Fabra, Departament d’Economia i Empresa. Address: C. Ramon Trias Fargas 25-27, 09005 Barcelona, Spain. Tel: (34) 93 542 27 13 Fax: (34) 93 542 17 46 E-mail: [email protected]
-
Upload
independent -
Category
Documents
-
view
0 -
download
0
Transcript of Catalan government popularity. An example of economic effects on sub-national government support
Catalan Government Popularity. An example of
Economic Effects on Sub-national Government Support
Aida Díaz & Clara Riba ∗∗
∗ Aida Díaz is PhD student at the Universitat Autònoma de Barcelona, Departament deCiència Política i de Dret Públic.Address: Edifici B, 08193 Bellaterra, Spain.Tel: (34) 93 490 08 73Fax: (34) 93 581 24 39E-mail: [email protected]
∗ Clara Riba is lecturer at the Universitat Pompeu Fabra, Departament d’Economia iEmpresa.Address: C. Ramon Trias Fargas 25-27, 09005 Barcelona, Spain.Tel: (34) 93 542 27 13Fax: (34) 93 542 17 46E-mail: [email protected]

Abstract
The aim of this essay is to deal with economic voting in contexts of multilevel
governance and to be a contribution to the debate on attribution of responsibilities in
popularity functions literature. We use aggregate and individual data from Catalonia in
order to analyse the relation between the state of the economy and the support for a sub-
state government. The empirical analysis shows that the responsibility hypothesis works
in regional governments without explicit macroeconomic competencies. We have also
considered the evaluations of government performance on certain specific policies in
order to clarify and determine the factors that drive Catalan government support. The
article considers the implications of the findings for future attempts to model party
support in a context of the European Union.
JEL: D72.
Keywords: Economic vote, popularity functions, attribution of responsabilities, grievance asymmetry.
____________________________________________________________
This paper has been written in the context of a research project on Popularity Functions in Spainsupervised by Professor Josep M. Vallès at the Universitat Autònoma de Barcelona. This research hasbeen funded by the Comité Interministerial de Ciencia y Tecnología (CICYT) and the Institut deCiències Polítiques i Socials (ICPS). LINE-STAFF generously shared the public opinion data this articleis based on. We thank all of these for making this paper possible.
A preliminary version of this work was presented at the 1999 ECPR Joint Sessions of Workshops inManheim. The authors are grateful to all participants in Workshop 12 on “Political Institutions:Intermediates between Economics and Politics” for their useful comments.

1
ECONOMIC CONDITIONS AND GOVERNMENT SUPPORT
In the late 1960s it became a common journalistic assumption that economic factors play
an important role in determining government popularity. In March 1968, Harold Wilson
asserted “All political history shows that the standing of the government depends on the
success of its economic policy” (Heath et al, 1991: 159). As can be seen the notion of
some kind of link between economic conditions and government support is firmly
established within scientific community and the literature dealing with it has grown
considerably, being now very extensive1.
Most popularity functions assume the classical “reward-punishment” model of the type
suggested by V. O. key (1968). It is simple: if economic conditions are good, so the
most common argument goes, the electorate will reward incumbents, while it will punish
them if economic conditions are less than satisfactory. Political actors are usually well
aware of their standing with the mass public, as well as the potential political
consequences of inadequate economic performance. It has been often alleged that
governments, therefore, attempt to influence economic policy outputs by manipulating
the levels of fiscal and monetary policy. The outcomes of such attempted manipulations
(that are the economic conditions attained) serve as guidelines for the electorate’s
evaluations of government performance. The implicit assumption behind this statement is
that the government is directly responsible for economic conditions. Butler and Stokes
had already argued that government responsibility for the economy is a fundamental
assumption of the dialogue between parties and the electorate.
“Modern electorate tend to solve (the) problem of causal reasoning by assumingthat certain causal relationships must exist rather than by discerning what they are.Electors focus their attention primarily on certain conditions, which they valuepositively or negatively and simply assume that past or future governments affectthem. The public can call for a governments dismissal in economic hard times justas it calls for a team manager’s dismissal in a losing season, in each caseconcluding that causal relationships must exist without knowing in detail what theyare” (1976:25).
This hypothesis contrast with the strict notion of rationality that would consider that
voters differentiates between changes attributable to the government and those caused by
other factors. For instance, the rise on the oil price in the seventies affected the major

2
part of Occidental economies, a factor over which many governments had no influence.
In that case, it would be unfair to blame the government for that situation.
The notion of responsibility is of prime importance in this kind of studies and emerges as
a key condition in joining economic grievance to political preferences (Lewis-Beck and
Eulau, 1985). One of the assumptions that lay behind the reward-punishment hypothesis
is that there is a “clarity of responsibilities” in terms of which party (or parties) is (are)
responsible for macroeconomic policy and performance (Powell and Whitten, 1993).
Without clarity of responsibility, there is no reason that there should be any correlation
between party support patterns and the economy. A second assumption behind the
hypothesis, is the existence of a viable and credible opposition to which citizens may
approve or vote if they don’t like the incumbent party‘s performance. As David Sanders
states, if, for whatever reasons, voters believe that the opposition fail to offer a credible
alternative to the incumbent party, then, regardless to the political complexion of the
incumbent, macroeconomic performance need not necessarily damage the government
(1998:8). Therefore, in conditions of non-credible opposition there should be no
correlation between party support and the state of the economy. For instance, this sort of
situation might have existed in England during 1980’s and 1990’s. By this time, the
labour party was immerse in a crisis and had serious problems of credibility. It was not
seen as a potential governing party (Seyd, 1997; King, 1997). However, the lack of a
clear government alternative doesn't seem to be sufficient in order to nullify the effects of
the reward-punishment model. In fact, several studies have showed how the
conservatives were affected by macro-economy (Sanders et al., 1987; Clarke et al.,
1995). In the Spanish case, the lack of a credible alternative has also contributed to the
Socialist hegemony during the eighties (Fraile, 1999).
It turns out that the question of why and how people should attribute economic changes
to the incumbent‘s action remains unclear. It is dubious that the responsible model,
which it is in part based on the British parliamentary system, works in a similar way on
other political contexts where the political control is not in the hands of a single party2.
As Anderson points out "responsibility is frequently shared by competing political actors
though mechanism such as coalition government or simple obscured because of multiple
levels of decision-making and political control" (1999:3).

3
Although the literature on vote and popularity functions is extensive (Norpoth, Lewis-
Beck & Lafay, 1991; Nannestad & Paldam, 1994), the question of assignment of
responsibility hardly ever has been addressed. Powell & Whitten (1993) and Anderson
(1995) consider the structure of credit and blame is filtered by the political context.
Specifically, they use some measures of institutional complexity (single or multi-party
government, bicameral opposition, share of parliamentary power, party strength, number
of parliamentary seats and number of cabinet posts) in order to clarify the attribution of
responsibilities. Other line of research has addressed the issue of clarity of responsibility
in contexts where the political power is shared or divided into several institutions. For
instance, some authors have modelled popularity functions for the French case during the
cohabitation period, with the President and the Prime Minister belonging to different
political parties (Lewis-Beck, 1988; Lafay, 1991). Other, have concentrate their efforts
in the attribution of responsibilities in cases of divided government in the United States
(Leyden & Borrelli, 1994; Alesina & Rosenthal, 1995). However, studies on popularity
functions for sub-national governments in a context of multilevel governance are almost
non-existent.
By using Catalan aggregate and individual data, this paper will focus in two aspects.
First, it will inquire whether, and to what extent, economic variables statistically
correlated with state-governments exhibit the same effect on regional governments
without important explicit competencies in this area. Second, it will try to clarify the
underlying factors that shape government support at the individual level, bringing some
light into the attribution of responsibilities debate.
The paper begins with an overview of Catalan politics. Next, with time series analysis,
we try to find out if economic conditions drive sub-national government support. Then,
individual level data is used to strength the macro results and to discern whether voters
really attribute economic responsibility to this government, using evaluation of policies as
an alternative to elucidate government responsibilities. The conclusion considers the
implications of the findings for future efforts to model party-support in a context of
multilevel governance. This can be the most predictable scenario in the European Union

4
in some year's time when part of the power of the estate-based governments will be
transferred to a European supranational institution.
AN OVERVIEW OF CATALAN POLITICS
Democracy brought a new form of territorial organisation of political power in Spain,
which is known as “Autonomic State” or “State of the Autonomies (self-governing
communities)”. This is undoubtedly one of the Constitution’s main innovations, which
aims to solve the historic necessity to articulate Spain’s national and cultural plurality
into a new political unit. This new form of territorial organisation implies a vertical
distribution of the state power between the central institutions and the territorial ones,
granting to each of them some competencies, bodies and resources (Fossas & Colomé,
1993). Therefore, the Autonomous Communities (AA.CC.) are territorial entities with a
legal-constitutional power3.
The approval of the Catalan Statute of Autonomy in the 1979 referendum made possible
to held the first autonomous elections a few months later, on March 20th 1980,
converting the Generalitat (name given to the Catalan cabinet) in the fundamental basis
and most symbolic expression of the Catalan self-government4. Since then, five elections,
with four completed full term governments, have been held. The autonomous elections
have been the basis for the legitimisation of the Catalan autonomy and for the Spanish
democracy itself. As it was impossible to imagine an autonomy in Catalonia without a
democratic framework in Spain, it is not possible to imagine a stability and a
consolidation of democracy in Spain without a Catalan autonomy based in the elected
nature of its own institutions. The Catalan government is then the fundamental basis and
most symbolic expression of the Catalan self-government, as well as the expression of
Spanish democracy.
This epoch of democratic and autonomous stability constitutes a period long enough to
allow us, with assurance, to depict some features and make some reflections on the
autonomous electoral processes and to study the government support in Catalonia. The
nationalist coalition Convergència i Unió (CiU) has been in power since the first

5
democratic elections and, from 1984 to 1995, with the absolute majority of parliamentary
seats5. The hegemony of CiU in Catalan politics at the electoral level, as well as at the
institutional level, can be explained by a set of factors. Among them, it can be cited: the
strength of the governing coalition and the stable unity of the parties which compose it;
the lack of an effective opposition; the existence of a strong personalisation of the
campaigns; and a "presidentialisation" of Catalan politics (Vallès & Molins, 1990;
Pallarès & Font, 1995)6.
Nevertheless, the support which appears behind CiU’s absolute majority in the
autonomous level, is unique compared to other type of elections in Catalonia. Thus, in
the general elections the winning force has always been the Catalan Socialist Party (PSC)
which is connected with the Spanish Socialist Party (PSOE). In the local elections, the
global triumph is “divided”7. This changes are produced by the phenomena of
“differential abstention” and “dual vote”, that have acquired big significance in Catalan
politics (Montero & Font, 1991; Riba, 1995)8.
Apart from the above phenomena but connected with it, the electoral alignments and the
interplay competition have been structured in the space defined by the interrelation of
two main attitudinal axes. The Left/Right continuum is the main dimension of the
political conflict as it occurs in most of the European party systems, while the axis of
Nationalism (or the subjective national identification) expresses the conflict derived from
the problems related to national integration between Catalonia and Spain. The
government party (CiU) political discourse adopt moderate tones in relation to
nationalism, with irregular emphasis according to the circumstances, while at the socio-
economic level it is located at the centre of the Left/Right axis adopting a liberal point of
view. Its discourse is a really economic one, emphasising the role of businessman and
small and medium-size companies in the development of the country. For instance, this
economic discourse can be seen in the reason given by the nationalist coalition for
supporting the State Government. The pacts reached in 1993 with the socialist party and
from 1996 with the Popular Party have been explained by the necessity of an economic
stability in order to achieve the convergence criteria for the entrance to the European
Currency Unit (EURO)9.

6
THE DYNAMICS OF CATALAN GOVERNING-PARTY APPROVAL
In this section, we shall try to see if we can apply the conventional wisdom that the state
of the economy drives political support to a sub-national government. However, before
starting our specification, it is important to point out one fact: the importance of the
political context on models of political support, as it structures the assignment of credit
and blame. Therefore, Catalan politics have to be placed in the Spanish general political
framework outside which its dynamics cannot be understood. This would lead us to
include in the model variables aggregated at the Catalan level reflecting the Spanish
economic and political situation. Although we have aggregate macroeconomic Spanish
indicators, we do not dispose of survey data on subjective evaluations of Catalan people
for the Spanish economy. So, we will not focus on them. Our aim is to see if we can
apply the hypothesis tested in State governments to regional ones. We don’t want to
suggest economic is a decisive factor but examine whether it influences or not.
The evaluations of the work carried out by the Generalitat are exceptionally positive,
even if we compare it with the evaluation Catalan people make of the central government
(Montero & Font, 1991), or with the evaluations the citizens of other Autonomous
Communities make of their respective autonomous governments (Montero & Torcal,
1992). In addition, this positive evaluations goes beyond the limits of the loyal CiU
electorate and it is high among the dual voters the coalition receives (Canals, Pallarès &
Virós, 1991). One of the factors that help to explain such popularity is the structure of
government responsibilities of the Autonomous Communities. These act mainly as
lending services institutions, not having to participate in collecting taxes, which appears
to be a favourable framework for their popularity being higher than the one of other
administrations with collecting functions.
Data and measures
In order to account for the popularity of the nationalist party during its mandate we use
aggregate monthly data between May 1991 and October 199510. The use of monthly

7
data, instead of quarterly data, carries certain advantages as well as disadvantages. On
the one hand, there is more “noise” with monthly data, which can produce a reduction of
the fit of the model. On the other hand, by aggregating monthly data into quarterly data
we lose information and the number of observations decreases. In this case, we have
considered that the benefits overweigh the inconveniences.
The period of time analysed includes an autonomic election in 1992 and finishes a month
before the 1995 elections were held. From an economic point of view, this period is
characterised by an important economic crisis, which started at the end of 1992 and
touched its bottom in 1994. In the political sphere, it is important to consider the
governmental support given by CiU to the socialist state-government after the 1993
general election and the electoral success of the Popular Party in the European elections
of 1994. This conservative electoral victory finished with the socialist hegemony since
1982 in Spanish politics11. It continued with the “search and destroy operation” (guerra
de “acoso y derribo”) towards the government of Felipe Gonzalez and towards its
nationalist partners, CiU and the PNV (Basque Nationalist Party), which had already
started two years earlier. This period is also characterised by the existence of an
atmosphere of extreme political and social tension, fuelled by political scandals12.
Our dependent variable, which will be used as an indicator of popularity, is the
evaluation of the Catalan Government in a ten-point scale. Figure 1 shows a relatively
high valuation of the “Generalitat” between May 1991 and October 1995, with a mean of
6,19 and a median of 6,37.
As we have already said, the analysis will include Catalan as well as Spanish data
indicators in order to consider the context. Taking into account that media is an
important source of information and that most of the television channels and press are
state-wide, it could be possible that people’s perceptions were more influenced by the
Spanish economic indicators than by the Catalan ones. By introducing this two kind of
aggregated indicators, we wanted to test either people is more influenced by their social
or territorial setting or by the national context.

8
Monthly unemployment, inflation and interest rates, provided by the Instituto Nacional
de Estadística (Spanish Statistic Institute), measure economic effects on government
support. As comparative research shows, unemployment and inflation are by far the most
widely used and the most consistently significant indicators of macroeconomic
performance. Public opinion also shows that they are the economic issues of most
concern to most people and they are highly salient by the press. Apart from introducing
the Catalan and Spanish unemployment rate independently, we have also included their
difference. By this strategy we wanted to see if electors attribute the difference between
these two rates to the economic record of the Catalan government.
An important recent innovation in popularity model specification has been the inclusion
of “subjective economic variables”, that is, public evaluations of national and personal
economic conditions. At this respect, we have included as explanatory variables
measures of economic evaluations in terms of retrospective and prospective, egotropic
and sociotropic perceptions for Catalan and Spanish situation. As regional citizens’
evaluations of the Spanish economic situation could not be found, we have used Spanish
economic evaluations obtained from representative surveys of the whole Spanish
population.
Figure 1: Dynamics of government approval, M ay 1991-
October 1995
4,0
4,5
5,0
5,5
6,0
6,5
7,0
7,5
91M
591
M8
91M
1192
M2
92M
592
M8
92M
1193
M2
93M
593
M8
93M
1194
M2
94M
594
M8
94M
1195
M2
95M
595
M8

9
It would be unreasonable to expect economic variables alone to be sufficiently powerful
to explain changes in aggregate support for the Catalan government. Politics is a crucial
factor that partially determines the dynamics of support (Eulau & Lewis-Beck, 1985).
For that reason, we have included a political component in the model. It consists in a set
of dummies. Three of them signal elections (1992 autonomic, 1993 General and 1994
European elections). Others are several variants of a political scandal affecting the
government (the case Cullell)13. One stands for the Olympic Games held in Barcelona in
1992. Four are alternative specifications of CiU’s support to the Spanish socialist
Government. Finally, there are several variables modelling electoral cycles and
tendencies.
Model specification
The literature of economic voting and popularity functions is not unanimous about the
convenience of using levels of the variable or the changes of those levels as predictors of
government support. Using levels of the variables is full of problems and difficulties
because of the non-stationarity phenomenon14. If the variables are non-stationary
modelling them in level form will produce serious inferences and generate “spurious
regressions” where regression coefficients appear statistically significant even when the
variables are in fact absolute unrelated. To solve the spurious regression, political
scientists have differenced the data. Differencing the data means removing the possible
trends of the data and then, throwing away potentially useful information that may
contain useful proofs of causal relationships between variables. Yet, if the variables are
differenced, a possible evidence of an association is removed. As Sanders et al. point out
it is possible that the trends of two variables reflect a long-term causal relationship,
although the deviations from the trends (the short term fluctuations) are entirely
unrelated (1987: 87). Moreover, from a theoretical perspective, it is reasonable to think
that people knows the ups and downs of the variables rather than the real values.
Consequently, either from the technical or the theoretical point of view, it seems
preferable to use the changes of the variables rather than their levels.
We employ Dickie-Fuller unit root test15 to determine whether the series are stationary
or non-stationary in which case must be differentiated. Analyses covering this period

10
reveal that the unemployment rates and the economic subjective perceptions are non-
stationary but become stationary at their first difference (Table 1).
Table 1: Unit Root Tests for Stationarity (1991M5 - 1995M10)
Original series Differenced series
Government support-3.95 ----
Catalan macroeconomic dataUnemployment -0.24* -4.32Inflation -9.3 ----
Spanish macroeconomic dataUnemployment -0.14* -4.65Inflation -8.25 ----
Catalan economic evaluationsPersonal retrospective -4.03 ----Personal prospective -4.39 ----National retrospective -3.05** -11.06
Spanish economic evaluationsPersonal retrospective -1.49* -12.07Personal prospective -1.88* -13.10National retrospective -0.53* -11.14National prospective -1.83* -12.57
Critical values for Unit Root Testp ≤ 0.05 -2.88p ≤ 0.01 -3.47
* Fails to reject the null hypothesis of unit root, p ≤ 0.05** Fails to reject the null hypothesis of unit root, p ≤ 0.001.Note: All tests were conducted with constant but without trend.
To avoid misspecification, we follow the Hendry methodology for model building
(Hendry & Richard, 1983)16. Model parameters are estimated using OLS procedures. We
have also included the level of support for the government during the previous month
(Govt-1). This specification represents a distributed lag model, using the Koyck
transformation (Harvey, 1981), which has become a standard approach to the analysis of
government popularity. From a technical point of view, this approach is reasonable due
to the inherent interdependence of the observations in a series and the persistent problem
of autocorrelation in time series functions. Time creates dependence not only between
variables but also within them. This idea corresponds to the reality of government
popularity. As far as our opinion today (i.e.: on politicians, economic evaluation)

11
typically is very much like the opinion we had yesterday, apart from something different.
In order to control for lagged effects, the lagged dependent variable is included as a
control measure. This formulation is convenient because it means that only current values
of the independent economic variables need to be included in the model instead of a more
complex lagged model formulation (Anderson, 1995:93). Moreover, the level of
government support during the previous month captures the lagged effects of the
independent variables, which can remain in the future. The smaller of the coefficient for
Govt-1, the shorter the memory of the system (Beck, 1991 ; McKuen, Erikson &
Stimson, 1992).
Empirical results
The model estimated is known as a partial adjustment of an autoregressive distributed lag
specification (ADL-PA):
Govt = β0 + β1 Govt-1 + β2 ∆Caunt-2 + β3 ∆Grett + β4 Cullellt + εt
Where Gov = Nationalist party support; Caun = Catalan unemployment rate; Gret =
Catalan economic retrospection; Cullell = Political scandals; ε = error term ∼ N (0, σ2);
β0 = constant; β1-4 = Regression coefficients.
The results (Table 2) show that the Catalan unemployment rate two months ago and
Catalan general retrospection affect government support. It can also be seen that Spanish
measures of the state of the economy do not appear in the model, neither do the
difference between the Catalan and the Spanish unemployment rate. Only one political
variable (the case Cullell) prove a statistically significant influence on approval17. The
lagged endogenous variable is really small showing a certain instability of the dependent
variable data.
It is well known the instability of the estimated coefficients in these models18. For that
reason, we have also used recursive and rolling regressions in order to check how stable
12
is our relationship19. Both analyses display a strong stability of the coefficients for all
three variables, confirming the robustness of our model.
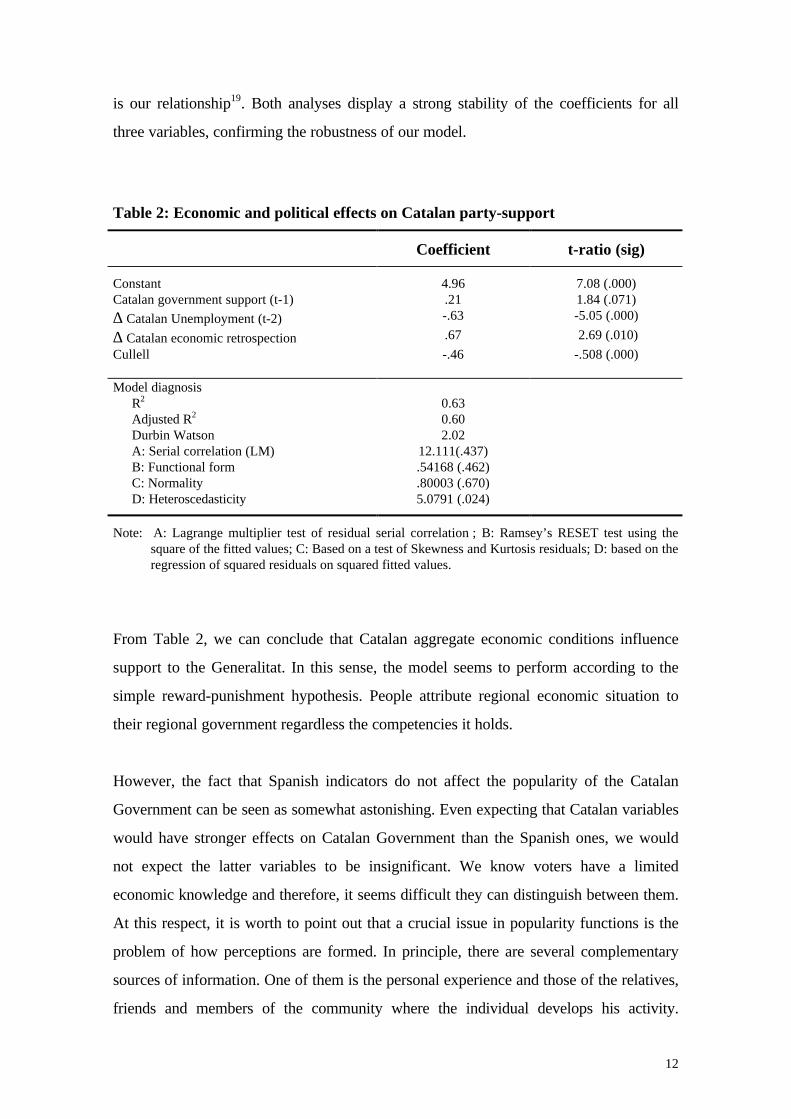
Table 2: Economic and political effects on Catalan party-support
Coefficient t-ratio (sig)
Constant 4.96 7.08 (.000)Catalan government support (t-1) .21 1.84 (.071)
∆ Catalan Unemployment (t-2) -.63 -5.05 (.000)
∆ Catalan economic retrospection .67 2.69 (.010)
Cullell -.46 -.508 (.000)
Model diagnosisR2 0.63Adjusted R2 0.60Durbin Watson 2.02A: Serial correlation (LM) 12.111(.437)B: Functional form .54168 (.462)C: Normality .80003 (.670)D: Heteroscedasticity 5.0791 (.024)
Note: A: Lagrange multiplier test of residual serial correlation ; B: Ramsey’s RESET test using thesquare of the fitted values; C: Based on a test of Skewness and Kurtosis residuals; D: based on theregression of squared residuals on squared fitted values.
From Table 2, we can conclude that Catalan aggregate economic conditions influence
support to the Generalitat. In this sense, the model seems to perform according to the
simple reward-punishment hypothesis. People attribute regional economic situation to
their regional government regardless the competencies it holds.
However, the fact that Spanish indicators do not affect the popularity of the Catalan
Government can be seen as somewhat astonishing. Even expecting that Catalan variables
would have stronger effects on Catalan Government than the Spanish ones, we would
not expect the latter variables to be insignificant. We know voters have a limited
economic knowledge and therefore, it seems difficult they can distinguish between them.
At this respect, it is worth to point out that a crucial issue in popularity functions is the
problem of how perceptions are formed. In principle, there are several complementary
sources of information. One of them is the personal experience and those of the relatives,
friends and members of the community where the individual develops his activity.

13
Another is the information that comes from the media. It has become common to assume
that people may be willing to delegate their expectations’ formation to others “advisers”
such as the media. However, Weatherford (1983:161) has maintained that there is “no
question that citizens have realistic, but firmly grounded impressions of their own
personal financial condition, so that media influence might be confined to national
economic conditions". Following the Weatherford's argument, probably the media
influence more people' perceptions of the Spanish economy than the personal ones, and,
for extension, that those of the Catalonia. The results of our analysis conform to the
above thesis: in the Catalan case, people surroundings are more important than mass
media in the generation of economic perceptions.
The fact that 'Catalan' retrospection outweighed the influence of 'personal' retrospection
would easily located Catalan voters in the sociotropic group. In a temporal dimension the
Catalan 'retrospection' locate them in the retrospective side. Although we recognise the
theoretical appeal of the questions contended in those debates, we think that the
interrelation between the four dimensions (general versus personal and retrospective
versus prospective) is so strong that being one or another the variable which affects the
support may be an accidental question. In this sense, Clarke et al. (1995) analysing
competing models, find that personal expectations variants generally do well in the
British case, although they do not outperform one or more alternatives incorporating
other types of economic evaluations.
POPULAR SUPPORT WITH INDIVIDUAL DATA
The above results suggest that the economy influence sub-national governments. But are
these aggregate findings compatible with the individual voter calculus of the naive
reward-punishment theory? It is an ecological fallacy being committed? Maybe citizens
don’t perceive where the real economic power is. Maybe, they don’t distinguish between
the Spanish and Catalan economic government management. Maybe, they see the
Generalitat as a central political economic authority. Moreover, many studies compare
the variation on governmental approval over time with the rise and fall of a set of
possible explanatory variables, assuming that people evaluate the government in terms of

14
its performance regarding economic issues. But is this the case? Why people evaluate the
government as they do?
In order to respond to these questions, micro-level analysis is especially important
because they allow us to test the causal relations associated with aggregate popularity
models and, consequently, validate our results. We must remind that popularity functions
are basically descriptive. The models themselves serve for discover the factors that affect
government popularity, but they do not really serve us to know what is the inherent
process that generates the individual perceptions leading to this support. For that reason,
the two bodies of research are intimately related to one another and they need each other
in order to validate our hypothesis in a more conclusive way. We argument that the use
of individual data can help us to strength the macro results. Hence, we are going to work
now with individual level data with the objective to enlighten what are the factors that
people take into account when they evaluate the government and to discern if Catalan
voters really attribute economic responsibility to the autonomous government.
In our micro analysis we use a group of twelve questions about evaluation of specific
policies carried out by the Generalitat, such as education, health, occupation,
environmental policies and so on20. These questions provide us with more detailed
information about the judgement citizens make of the different aspects of the
governmental task and show the degree of salience the Catalan people give to this issues.
We will use these items in order to explore the hidden factors in the attribution of
responsibilities for government performance.
Factors underlying evaluations of specific policies
Evaluations of the government policies, where attribution of responsibilities look clear,
can be a good method to validate our aggregate findings. Let us now turn to the set of
variables that contains the citizens’ perceptions about how well the different departments
of Catalan government are ruling their competencies. We are interested in knowing what
is the relationship between the general government approval and the evaluation of
policies related to specific issues. Our hypothesis is that the opinions that citizens have of
specific policies determine their evaluation of government performance. Looking at the

15
values of the twelve issue-variables, we realise that they are fairly correlated. Hence, in
this case, it seems sensible to assume that policies' evaluations are particular
consequences of more general perceptions about how the government is doing in some
main hidden aspects they consider important. That is, we hypothesise that there are some
common latent factors underlying policies' evaluations and we are interested in highlight
them. If we were capable to determine these factors, they could be used as predictors of
the evaluation of government performance in a more parsimonious and accurate way
than using the values of the initial policy-variables.
For the above-explained purposes, we have used the Factor Analysis technique. It
permits to extract a group of uncorrelated factors that contain most of the variance of
the original variables and eliminate the noisy on the data. An initial exploratory factor
analysis of the twelve variables recording policy evaluations has determined the existence
of three factors. One of them weights heavily in the “culture”, “Catalan language” and
“education” policy variables. As a result, we can recognise it as a cultural factor. The
variables with more important weights on the second factor are “financial aid to firms”,
“occupation”, “housing” and “public works”. It seems clear that this is an economic
factor. Finally, the third factor is strongly correlated with the “health” and “welfare”
policy variables, which are related with social policies. Therefore, We will identify it as a
social factor. The rest of the variables, "youth", "law and order" and "environmental
policies", are somewhat correlated with the three factors related above, but they are less
well explained by them. In consequence, we have decided no to include the last variables
in a second confirmatory factor analysis. The three factors we found explain conjointly
more than 65% of the total variance in policies' evaluation, being the percentage of
variance explained for each factor quite similar: 25% the economic factor; 21% the
cultural factor; and 19% the social factor.
Hence, we can conclude that the evaluations that citizens give to specific policies carried
out by the departments of the government are mainly concretions of more general
evaluations based on its perceptions on cultural, economic and social governmental
performance.

16
The economic factor is the most important of the three. From an external point of view,
it can sound somewhat strange that citizens give importance to economic policies in the
evaluation of a government with important competencies in other issues but with almost
no power in economic matters. However, this fact is consistent with our results at the
aggregate level that show the significance of Catalan unemployment and economic
retrospection on regional-government support. The importance that Catalan citizens
assign to economic issues is perfectly reflected in their statements. When asked in an
open question of the same survey about what is the more important problem in the
country, 64% of citizens say unemployment and 12% mention other economic issues as
economic situation, housing or taxes. That is more than three quarters of respondents
(76%) considers that the main problems of the country are of economic nature. On the
other hand, when asked about the problems that worried them at a personal or familiar
level, the unemployment concerns descent until 19%. However, there is a 17% of
respondents that considers the instability of jobs as problem and 15% more that are
preoccupied for the rest of the economic issues. In all, more than half of surveyed (51%)
is worried about economic issues at their personal or familiar level.
0.65
0.69
0.86
0.78
0.75
0.73
Figure 2. Factors underlying evaluation of policies
Financial aid to firms
Occupation
Housing
Public works
Culture
Catalan language
Education
Health
Welfare
0.76
Social Factor
0.73
0.78
Cultural Factor
Economic Factor

17
Another aspect to point out is that, when asked about what is the most important action
carried out by the Generalitat during the last few months, there are 60% of non-
respondents. However, more than half of those who give some answer cite actions
related with the economy (45% say public works and 6% other issues as incentives to
creating jobs or aids to create new enterprises).
In sum, Catalan community has a greater concern about economic issues. Three quarters
of people considers them as the most important problems that have to face our country
and half is preoccupied for economic aspects affecting his familiar life. Finally, half of
those who are capable to indicate an important achievement of the Generalitat, report
public works or economic policies. In consequence, is coherent that, when evaluating the
results of specific policies, they take into account the underlying economic factor.
The existence of a cultural factor in policy evaluations is coherent with the reality of
politics in Catalonia. In fact, the nationalists parties and, in particular, CiU claim for a
greater level of autonomy, due to the so called “differential fact” of the region based on
the historic and linguistic Catalan characteristics. It is quite normal that such a sub-
national government emphasises all the cultural policies oriented to increase citizens’
“national” identity. By strengthening Catalan identification, its support for negotiating
with the Spanish government the transference of more power increases. In such a
circumstances, cultural policies acquire great importance and people recognise it when
consider them as one of the main aspect of government evaluation. For example, there
has been recently a great debate in Catalonia concerning the politics of language due to
the discussion of a new Language Law in the Catalan Parliament. In contrast to the 1983
Linguistic Normalisation Law that was reached by consensus, there were opposite views
between parties about the necessity and the content of the 1998 Linguistic Policy Law.
Once the ancient law succeeds in that almost all people understand Catalan, the new one
intends to increase its use among people and institutions. And this goal was seen as a
threat for an important sector of Spanish speakers living and working in Catalonia. The
supporters and opposing to this aim have different views about the Generalitat record on
cultural aspects and, consequently, will report different positions in the evaluation of
language policies.

18
Finally, it is also quite coherent the presence of a social factor as Catalonia is one of the
autonomous communities in Spain with a higher level of competencies, among them
health and some welfare policies. On the one hand, health policy is very important not
only because its impact on dairy life of people and the great volume of resources devoted
to it but also because the innovation in the lending of service introduced by the
Generalitat. In fact, Catalonia was the pioneer in Spain in introducing some aspects of
private management in the service of public health. This initiative has been somewhat
controversial because while for some people it enhances the service for others is a way of
privatisation one of the pillars of the welfare state. On the other hand, welfare policies
are important not because of the resources devoted to it (somewhat scarce) but for the
symbolic and propagandistic use of them. There is a Department of Social Welfare that
carries out some social policies and, specially, it distributes financial aids among
institutions, associations and non-governmental organisations that works in favour of the
needed. The character of the mainly beneficence of these policies and the lack of
transparency in the distribution of the subsidies has generated some criticisms. As a
result, there are different opinions about the goodness of social policies carried out by
the Generalitat and this social aspect of the government record is taken into account by
citizens when evaluate its policies.
Once we have found three underlying factors of citizens’ policies evaluations, the
question is are they related with the attitudinal axes that structure the political conflict in
Catalonia? The answer is yes. As we have already said, there are two independent
political dimensions in Spain. The first is the well-known Left/Right dimension that
embodies different cleavages, such as economic, social or defence (Budge & Farlie,
1983; Padró-Solanet, 1993). The second is the nationalist dimension related with the
process of political decentralisation. While the economic and social factors are related to
the Left/Right dimension, the cultural factor is associated with the latter21.
Influence of policy evaluations on governing party support
In this section, we use the three factors underlying evaluations on government
performance in order to predict governmental approval. In addition to them, we use as a

19
control variables leadership (measured by presidential evaluation) and reported vote for
CiU in the last autonomous elections22.
Table 3 shows the results of the estimation of a logistic regression predicting
governmental approval from the values of the cited variables. The model is highly
significant and predicts correctly 90% of the cases. All factors are significant at the 0,001
level and its coefficients are positive. It means that the higher the evaluation in economic,
cultural and social policies, the higher the probability to approve the government.
Similarly, the leadership's coefficient is highly significant and positive, meaning that the
higher the President’s evaluation, the higher the probability to approve the government.
Table 3: Logistic regression for governmental approval
Coefficient Wald (sig)
Evaluation of government performanceEconomic factor .8822 *** 34.49 (.000)Cultural factor .9991 *** 40.99 (.000)Social factor .5473 *** 13.75 (.000)
Leadership .3190 *** 17.51 (.000)Vote for CiU in 1995 .6840 * 4.40 (.036)Constant .0580 .02 (.902)
Model diagnosisN 622Model Chi-Square 213.51 ***Overall correct prediction 89.55%R2
LA * 100 37.30%
*** Significant at 0.001 level; * significant at 0.05 level
The reported vote in the 1995 elections is also significant at the 0,05 level indicating that,
other things being equal, people who voted for CIU has a higher probability to approve
the government than people who voted for other parties. This fact seems to insinuate the
existence of a reciprocal effect between government approval and vote intention: people
who approve the government tends to vote for the incumbent party and people who
voted last time for the party now in office tends to approve its record.

20
Due to the fact that the logistic model is not lineal it is difficult to grasp what are the
variables that have a major impact in governmental approval, because it is something that
varies depending on the other variable values. For example, one typical citizen, with
middle perceptions about government record in economic, cultural and social policies,
that gives an evaluation to the President equal to the mean, and that voted for CiU in
1995, has a probability to approve the government of 0.95.23. In contrast, if he did not
vote for CiU, the probability descents until 0.90. Then, for this moderate citizen there is
only a difference of 5% in the approval probability depending on his vote in the last
autonomous election. However, this difference is not always the same. For a more
pessimistic individual, with a negative evaluation of economic, cultural and social policies
and also with a negative evaluation of the president (for example, -1 in each factor and 4
for leadership) the difference is bigger. He has a probability of 0.40 to approve the
government if he had voted for CIU in the previous election and 0.15 if he had not.
The best way to decode the information provided by the model is displaying graphically
the conditioned effects of each variable subject to specific values of the rest of variables.
Figure 3 represents the conditioned effects of economic policy evaluations on
government approval subject to leadership for those who do not voted for the incumbent
(being the rest of the variables fixed to the mean). It shows a clear asymmetry with
respect to the mean. Concretely, the effects of an increase of one unity in the value of the
economic evaluation are bigger when the citizen has a negative perception of them than
when he has a positive one. It also shows that, when economic policy evaluations are
negative, the effect of an increase of leadership is very important while it is far smaller
when policy evaluations are positive.
Figure 4 show the impact of economic perceptions conditioned to reported vote. It can
be observed that even though the probability to approve the government record is higher
for those voted the incumbent in the last autonomous elections, the impact of the
economy is bigger for those who voted other parties.
Figure 5 display the impact of the economy on government approval conditioned to
social policy evaluations for people did not support the government party in 1995
elections. As it can be seen, the probability to approve the government when the

21
evaluation of economic policies is low depends on the perceptions on how well the
government is doing with respect to social policies. For instance, when the economic
evaluation is -2 the probability to support the incumbent ranges from 0.15 to 0.89
depending on the social factor values. Instead, when the economic evaluation is 2, it runs
from 0.85 to 0.99. That is, the effect of the perception of social policy performance is
approximately five times bigger at the left side of the graph (when there is a bad
perception of the economy) than at the right side (when the economy is seen as good).
The last figure, Figure 6, exhibits also the effects of the economy but this time
conditioned by the cultural factor. At a first glance, we can grasp that the pattern of the
graph is quite different from the previous. The asymmetry is lower in this case, as the
lines are disposed covering all the four quarters of the diagram, though it is still present.
In sum, from all of the figures we can deduce that opinions on government responsibility
differ depending on citizen's perceptions of the state of a particular group of policies. For
instance, those who perceive the economic situation as deteriorating are more likely to
hold the government responsible for it than those who consider the economic situation
positive. Therefore, voters are disposed to give more weight to negative information and
consequently, tend to punish in a heavily way the incumbent when things go bad rather
than reward him when they go well. These results conform Bloom and Price (1975)
findings in the sense that economic downturns hurt congressional candidates of the in-
party but upturns do not help them24. There is also a theoretical support for this bias. Lau
(1982, 1985) draws upon the literature in cognitive psychology to provide both empirical
evidence and theoretical justification for negativity bias operating at the level of
attitudes25. In our case, the patterns of the graphs enlighten the existence of the
grievance asymmetry.

22
Figure 3: Effects of economic evaluation on government approval conditionned to leadership
0,00
0,50
1,00
-5 -4 -3 -2 -1 0 1 2 3 4
Economic factor
Leadership = 1
Leadership = 10
Cultural factor = 0
Social factor = 0
Vote for CIU in 1995 = 0
Figure 4: Effects of economic evaluation on government approval conditionned to reported vote
0,00
0,50
1,00
-5 -4 -3 -2 -1 0 1 2 3 4
Economic factor
Voted for CiU in 1995
Did not voted for CiU in 1995
Cultural factor = 0
Social factor = 0
Leadership = 6.67

23
Figure 5: Effects of economic evaluation on government approval conditionned to social evaluation
0,00
0,50
1,00
-5 -4 -3 -2 -1 0 1 2 3 4
Economic factor
Cultural factor = 0
Leadership = 6.67
Vote for CIU in 1995 = 0
Social factor = -4
Social factor = 0
Social factor = 3
Figure 6: Effects of economic evaluation on government approval conditionned to cultural evaluation
0,00
0,50
1,00
-5 -4 -3 -2 -1 0 1 2 3 4
Economic factor
Social factor = 0
Leadership = 6.67
Vote for CIU in 1995 = 0
Cultural factor = 3
Cultural factor = 0
Cultural factor = -4

24
CONCLUSION
In this paper we have examined if economic variables influence popular support for sub-
national governments. In a first stage, using the classical political-economic aggregate
model, we have estimated a model with macroeconomic indicators and variables about
economic perceptions. In this function, we have also introduced variables measuring
specific political events in order to control the previous results. Secondly, we have
validated our aggregate findings using a micro-level approach, and we have also tried to
bring some light into the attribution of responsibility debate. At this respect, we have
considered the evaluations of government performance on certain issues in order to
clarify the factors that drive government support.
The empirical results contained in this study clearly shows the following points:
• The responsibility hypothesis works in political institutions without explicit
macroeconomic competencies. In consequence, it seems that the relation between
responsibility and economic power is no so straightforward as it could be thought.
The foundations of the traditional reward-punishment hypothesis remain unclear. An
alternative way to see if people attribute economic changes to the incumbent may be
to use evaluations of the policies, where the attribution of responsibilities looks clear.
Our analysis has showed that, in the Catalan case, there are three factors underlying
policy evaluations: the economic, the cultural and the social, being the first the most
important of them. All affects Catalan government approval, even when some
variables of control are introduced.
• Support to sub-national governments appears to be influenced by regional economic
indicators and not by the national ones. The research has shown that Spanish
economic indicators are not significant, even though they are more enlightened by the
media than Catalan data. Therefore, it seems that there are different economic
perceptions among the regions composing a country. The reason could be that,
although mass media plays an important role, citizens’ perceptions are mainly
coloured by their experiences and nearby context (i.e., social, political, etc).

25
• The grievance asymmetry hypothesis is empirically grounded. Our results provide an
empirical support for a negativity disposition on government popularity. An economy
in slump harms the incumbent's support but an economy that is improving does not
benefit the government popularity in the same way. The graphical displays presented
in this paper visualise clearly these findings.
• In contexts of multilevel governance, the attribution of responsibility is diffused.
The Catalan popularity function represents a good example of model party support in
a situation of subsidiary and, there, we have found that the state of the regional
economy affects the support for the regional government despite its scarce economic
competencies. The European Union is undergoing a period of fundamental change
and the patterns and factors underlying the Catalan government support could be
extrapolated to the future situation in Europe. Although most of macroeconomic
competencies would be centralised in a supranational institution, with the existence
of an unique Unit Currency and an European Central Bank, our study suggest that
the most probable situation is that in each European country citizens would continue
attributing responsibilities to their State government.

26
References
Alesina, A. & Rosenthal, H. (1995). Partisan politics, divided government, and theeconomy. Cambridge, Cambridge University Press.
Anderson, C. (1995). Blaming the government. Citizens and the economy in fiveEuropean democracies. London, M.E.Sharpe.
Anderson, C.(1999). Economic voting and political context: a comparative perspective.Forthcoming in Political Studies.
Bellucci, P. (1991). Italian economic voting: a deviant case or making a case for a bettertheory?. In Lewis-Beck (eds.), Economics and politics : the calculus ofsupport. Ann Arbour, University of Michigan Press.
Bellucci, P. (1999). Economic issues and economic voting in a democratic transition:the 1994 and 1996 Italian national elections. ECPR Joint Sessions ofWorkshops, Mannheim, Germany.
Beck, N. (1991). Comparing dynamic sophistication: the case of presidential approval,Political Analysis 3: 37-51.
Bloom, H. & Price, H. (1975). Voter Response to Short-run Economic Conditions,American Political Science Review 69:124-54.
Budge, I. & Farlie, D. (1983). Explaining and predicting elections: issue effects andparty strategies in twenty-three democracies. London, George Allen andUrwin.
Butler, D. & Stokes, D. (1976). Political Change in Britain. New York, St Martin’sPress.
Canals, R. M., Pallarès, F. & Virós, R. (1991). Els catalans davant la consulta electoral.In Equip de Sociologia Electoral (eds.), Estudis electorals/10. L’electoratcatalà a les eleccions autonòmiques de 1988: opinions, actituds icomportaments. Barcelona, Publicacions de la Fundació Jaume Bofill.
Clarke, H. D. & Mariane C. S.(1995). Economic evaluations, prime ministerial approvaland governing party support: rival models reconsidered, British Journal ofPolitical Science 25: 145-170.
Clarke, H.D & Stewart, M. (1996). Economists and Electorates: The SubjectiveEconomy of Governing party Support in Canada, European Journal ofPolitical Science 29:191-214.
27
Eulau, H. & Lewis-Beck, M. S. (eds.) (1985). Economic conditions and electoraloutcomes in the United States and western Europe. New York, AgathonPress.
Fossas, E. & Colomé, G. (1993). Political parties and institutions in Catalonia.Barcelona, Institut de Ciències Polítiques i Socials.
Fraile, M. (1999). Explaining 14 years of social-democratic power: economicperformance, electoral support and political context in democratic Spain(1982-1996). ECPR Joint Sessions of Workshops, Mannheim, Germany.
Harvey, A. C. (1981) The econometric analysis of time series. Oxford, Philip Allan.
Heath, A., Jowell, R., Evans, G., Fields, J. & Witherspoon, S. (1991). UnderstandingPolitical Change: The British Voter 1964-1983. Oxford. Pergamon.
Hendry, David S. & J.F. Richard (1983) “The econometric analysis of economic timeseries (with discussion)”, International Statistics Review, 51:11-63.
Key, Jr. V. O. (1968). The responsible electorate: Rationality in presidential voting,1936-1960. New York, Vintage Books.
King, A. (1997). Why Labour won, at last. In King, A. (eds), New Labour triumphs:britain at the polls. London, Chatham House.
Lafay, J.D. (1991). Political Dyarchy and popularity functions : lessons from the 1986French experience. In Norpoth, H., Lewis-Beck, M. S. & Lafay, L.D (eds.),Economics and politics: the calculus of support. Ann Arbour, University ofMichigan Press, 123-140.
Lau, R. (1982). Negativity in political perceptions, Political Behaviour 4:353-78.
Lau, R. (1985). Two explanations for negativity effects in political behaviour, AmericanJournal of Political Science 29:119-38.
Lewis-Beck, M. S. & Eulau, H. (1985). Economic conditions and electoral outcomes inthe United States and Western Europe. New York, Agathon.
Lewis-Beck, M. S. (1988). Economics and elections: the major western democracies.Ann Arbor, Michigan University Press.
Leyden, K. M. & Borrelli, S. A. (1995). The Effect of State Economic Conditions onGubernatorial Elections: Does Unified Government Make a Difference?,Political Research Quarterly 48(2): 253-274.
Mckuen, M., Erikson, R. & Stimson, J. (1992). Peasants or bankers? The Americanelectorate and the U.S. economy, American Political Science Review 86:597-611.

28
Mills, T. C. (1990). Time series techniques for economists. Cambridge, CambridgeUniversity Press.
Montero, J. R. & Font, J. (1991). El voto dual: lealtad y transferencias de votos en laselecciones autonómicas. In Equip de Sociologia Electoral (eds.), Estudiselectorals/10. L’electorat català a les eleccions autonòmiques de 1988:opinions, actituds i comportaments. Barcelona, Publicacions de la FundacióJaume Bofill.
Montero, J. R. & Torcal, M. (1992). Política y cambio cultural en España: una notasobre la dimensión postmaterialista, Revista Internacional de Sociología1 :61-99.
Mueller, J. E. (1970). The presidential popularity from Truman to Johnson, AmericanPolitical Science Review 64: 18-39.
Nannestad, P. & Paldam, M. (1994). The VP-function: a survey of the literature on voteand popularity functions after 25 years, Public Choice 79: 213-245.
Nannestad, P. & Paldam, M. (1997). The grievance asymmetry revisited: A microestudyof economic voting in Denmark, 1986-92, European Journal of politicalEconomy 13: 81-99.
Norpoth, H., Lewis-Beck, M. S. & Lafay, L.D. (1991). Economics and politics : thecalculus of support. Ann Arbour, University of Michigan Press.
Padró-Solanet, A. (1993). Spatial models and campaign issues. The case of Spain. ECPRJoint Sessions of Workshops, Leiden, Holland.
Paldam, M. (1991). How robust is the vote function? A study of seventeen nations overfour decades. In Norpoth, H., Lewis-Beck, M. S. & Lafay, L.D (eds.),Economics and politics: the calculus of support. Ann Arbour, University ofMichigan Press, 9-31.
Pallarès, F.& Font, J. (1995). The Autonomous elections in Catalonia (1980-1990).Barcelona. Institut de Cienciès Polítiques i Socials.
Powell, G. B. & Whitten, G. (1993). A cross-national analysis of economic voting:taking account of the political context, American Journal of PoliticalScience 37: 314-334.
Riba, C. (1995). Vot dual i abstenció diferencial. Doctoral Thesis presented at theDepartament de Ciència Política i de Dret Públic de la Universitat Autònomade Barcelona. Bellaterra, Publicacions de la Universitat Autònoma deBarcelona (microfiche).
Sanders, D., Marsh, D. & Ward, H. (1987). Governmental popularity and the Falklandswar: A reassessment, British Journal of Political Science 17: 281-313.

29
Sanders, D. (1998). The Real Economy and the Perceived Economy in PopularityFunctions: How Much do Voters Need to Know? A Study of British Data,1974-97. Paper presented at the Barcelona Conference on Vote andPopularity Functions.
Seyd, P. (1997). Tony Blair and New Labour. In King, A. (eds.), New Labour triumphs:Britain at the polls. London, Chatham House.
Sφrensen, R. J. (1987). Macroeconomic policy and government popularity in Norway,1963-1986, Scandinavian Political Studies 10:301-21.
Vallès, J. M. & Molins, J. M. (1990). La vida electoral a Catalunya : eleccions ireferèndum entre 1982 i 1988. In Equip de sociologia electoral (eds.),Estudis Electorals/9. Atlas Electoral de Catalunya 1982-1988. Barcelona.Publicacions de la Fundació Jaume Bofill.
Weatherford, M. S. (1983). Economic voting and the symbolic politics argument: areinterpretation and synthesis, American Political Science Review 73: 158-174.

30
Notes
1 For overviews, see Lewis-Beck (1988) and Nannestad & Paldam (1994).2 In this sense, Sφrensen (1987) finds weak and contradictory effects in the Norwegian case; Lewis-Beck(1988) points out that economic vote diminishes when the complexity of the coalition governmentincreases; for the Italian case, Bellucci (1991) shows that the traditional reward-punishment pattern hasnot been working during the pentapartito government period; however, it seems to work in the newlyinstitutional context set in the nineties (Bellucci,1999).3 The Catalan government, named Generalitat, has assumed competencies in issues such as culture,research, tourism, mountains, fishing, publicity, sport, public works, guardianships of minors,foundations and associations. On other issues, it only assumes the execution of the state legislation:penitentiary, labour, international exhibitions (Fossas & Colomé, 1993: 21). In relevant issues such asindustry, agriculture and trade, education, media, health or police force, the Catalan government hasruling powers but within the state laws. It can be seen that issues directly related with sovereignty(nationality, international affairs, armed forces, and monetary system), certain branches of law(commercial, penal and labour) or issues related to macroeconomic policies or to the general planning ofthe economic activity correspond to the State.4 The Statute of Autonomy has a double nature: on one side, it is a Law of the Parliament, and on theother, “the essential institutional rule of each AA.CC.” as the Spanish Constitution itself states (art.147.1) (Fossas & Colomé, 1993).5 Convergencia i Unió (CiU) is a pre-electoral coalition, composed by two parties: ConvergenciaDemocràtica de Catalunya (CDC), near to liberal ideology, and Unió Democràtica de Catalunya (UDC)that is a Christian-democratic party.6 The CiU’s mandate has been defined on the basis of the ratification of Jordi Pujol as the President ofthe Generalitat as a guarantee for the continuity of government action (through his actions, his policiesand his image). Furthermore, the access to institutional resources has allowed CiU to strengthen itsorganisational structure and widen its electoral “appeal” (in resources, utility and image).7 In industrialised areas the left forces receive the major support while in the rural areas the nationalistcoalition get better results.8 It is known as differential abstention the electoral behaviour consisting in voting in the generalelections and to abstain in the autonomous ones. Dual vote means to vote for different parties in differenttype of elections.9 We want to remind that European Union issues have a lot of importance in Spanish politics. After along period of dictatorship, the entrance in the European Community in 1996 was understood as the endof Spanish isolation.10 Our first purpose was to estimate a function that covered the whole period of nationalist government(from 1980 until today), but we came across the problem of data frequency. While during the 80s, surveydata related to the Catalan government and subjective economic perceptions was almost non-existent,from 1996 to 1998 the frequency of this data is really irregular. Therefore, our choice has been to use aunique source of data with a monthly periodicity. The data analysed come from LINE STAFF electionsurveys.11 The 1994 European Elections in the Spanish case were seen for some analysts as an opportunity forcitizens to show their satisfaction or dissatisfaction with the current incumbent. In 1996, the PopularParty won the General elections.12 They start with Filesa, a case of irregular financing of the socialist party, followed by other corruptioncases involving highly-placed officers of public institutions (the cases Roldan, Rubio, Banesto etc.)13 Although we have called Cullell to a political scandal, it is worth mention that this case not standsonly for a specific event. During 1994, several cases of corruption damaged the image of the Catalangovernment in a Spanish context of political and social tension. We have created several dummies inorder to capture the effects of these damaging events, ranging from one to 8 months (between May 1994and November 1994).14 A series is weakly stationary if its mean and variance are time invariant and its auto-covariances oflags i and j depend only of the length of the time lag separating i and j. See Terence C Mills (1990:64).15 Dickie- Fuller test is a simple t-ratio, but with non-standard critical values, which vary dependingupon whether one includes a constant or deterministic trend in the regression analysis that generates the
31
unit-root test statistic (Clarke et al., 1996 :20). The null hypothesis is that series has a unit root. Therejection of this hypothesis implies that the series is stationary.16 It basically consists on trying to estimate a general and unrestricted specification (greatest number ofvariables, lags) that exhaust much of the information we need. As may be expected the resultant modelincludes regression coefficients statistically non-significant. Accordingly, the independent variablesassociated with those coefficients are excluded from the model and a new shorter model is re-estimate,until we find the appropriate one. In addition to this method, we devised a complementary routine thatfollowed a variable to variable basis. Each of the previous independent variables and their lags wereintroduced as a single estimator in the model, generating a list of variables which influences popularsupport in an autonomous manner. This routine did not change the previous model, but it has beenuseful in guaranteeing that our model is well specified.17 We are conscious about the problem of heteroscedasticity of our model. After having checked what isthe problem in model specification, we consider that heteroscedasticity may be produced by the politicalvariable. This dummy variable takes value 1 between May 1994 and November 1994, which constitutesa long period for a dummy variable. We have estimated a different dummy for each month separatelyand we have seen that some of them were not working. Because of parsimonious specification, we decideto leave our first choice. Cullell taking 1 between-November 1994.18 As Paldam points out, the VP-function is a function that is on the one hand unstable and, on the otherhand, often highly significant (1991:28).19 Recursive regressions involve basically estimating the whole model with successive periods ofestimation which grow longer in each estimation. On the other hand, rolling regression involvessuccessively re-estimating the model for established periods of, say 25 points. First, we estimate a modelfor the first 25 points, then, from 2 to 26 and successively until the last point.20 The data proceeds from a Line Staff study (Ref. 6576-3) commissioned by the Generalitat of Cataloniaand conducted in November 1998.21 To test empirically the association between the factors and the dimensions of the Catalan politicalspace, the best strategy would be to calculate the Pearson correlation among the three factors we foundand some variables that express the individual positions of citizens in this political space. Unfortunately,there is not a question in the survey about self-location in the Left/Right scale. Neither is in thenationalist scale. There is only one question about the perception that citizens have of the Left/Rightposition of the governing coalition CIU. This can be used in some sense as a rough proxy for the self-placement in the Left/Right dimension. We can understand than those who consider CIU as a rightpolitical force are the leftist, than those who consider it as a centre force are the centrists, and than thosewho consider the coalition as a left force are the rightists. The correlation between this approximate self-placement and the economic and social factors is very significant, though small. Their sign tell us thatleft-wing people evaluate badly the economic and social task of the government than right-wing peopledo.22 Because we do not have questions about party identification, party preference or feeling thermometersin our sample, we used a dummy, the recorded vote for CiU, as a proxi for party identification. As amore accurate indicator of it, we also used another dummy recording the citizens who express theintention to vote for the same party they voted in the last elections. However, in our analysis the resultsobtained with both proxies were quite similar.23 The economic, cultural and social variables are standardised. As a result, its mean is zero and itsstandard deviation 1. Negative values correspond to evaluations below the mean and positive values overthe mean. The president evaluation variable ranges from 1 to 10, being the mean 6.67.24 Before Bloom & Price, Mueller (1970) looked at a different type of assymetry. Mueller's grievance ofassymetry implies that voters react to an economic variable when the variable rates above or below acertain level.25 Some assumptions about the theoretical support of the grievance asymmetry and the way how it can bemodelled are discussed by Nannestad & Paldam (1997).