Cassia tora: Significance of low value NTFP in Adivasi ...
313
1 Cassia tora: Significance of low value NTFP in Adivasi livelihoods in Central India INTERNSHIP REPORT By Kavya Mohan MA in Environment and Development School of Human Ecology Ambedkar University, Delhi 2018
-
Upload
khangminh22 -
Category
Documents
-
view
3 -
download
0
Transcript of Cassia tora: Significance of low value NTFP in Adivasi ...

1
Cassia tora: Significance of low value NTFP in Adivasi livelihoods in Central India
INTERNSHIP REPORT
By Kavya Mohan
MA in Environment and Development
School of Human Ecology
Ambedkar University, Delhi
2018
Amol Padwad

2
ACKNOWLEDGEMENT
I would like to express my heartfelt gratitude to my supervisor Prof. Asmita Kabra for guiding me through the entire dissertation. I would also like to extend my gratitude to Dr. Budhaditya Das who helped me to shape my internship report to its current form. I am also thankful to Sonam Mahalwal (PhD Scholar, SHE) who extended her help for my dissertation.
I would like to thank the people of Agara, the field assistants and Samrakshan staff who helped me to gather information. Last but not the least, I would like to thank my family and friends who have always provided me unflinching support in all my endeavours
Amol Padwad
3
CONTENTS Pg no.
1) Introduction 4
1.1) Ecology and Botany of Cassia tora 5
2) Research questions and obectives 7
3) Study area 8
4) Methodology 11
5) Findings 12
6) Discussion 18
7) Conclusion 19
8) References 20
Amol Padwad

4
1. INTRODUCTION
Drylands evoke images of hardy people surviving in rough terrains and suffering terribly
during droughts (Dar, 2012). With farmlands shrinking due to factors like ‘variable rainfall’
and ‘reduced soil fertility’, earning a livelihood becomes a vital point to ponder for millions
of poor farmers who practice subsistence agriculture in such fragile environments (Prabhu,
2008) (Singh, 2016). For those who depend on livestock, long periods of dry spell induce
them to decide whether to sell animals, move elsewhere, or watch them perish (Mortimore,
1998). Adversely affecting the lives and livelihood of billions of people, desertification ranks
among the biggest environmental challenges today, and has become a major inhibition to
meeting basic human needs (Dar, 2012). However, dryland householders choose to become
more than farmers for survival, rather than being mere victims.
The rural people in the drylands can be seen embracing a range of occupation in a year. One
may find them chiseling stones in the forest, whereas at times one may find them as an
artisan. Since, all these works are mostly temporary in nature, the people usually experience
long intervals in which there is no source available for earning a livelihood. This and the
changing agrarian context influences the role of products from natural and non-cultivated
environments, especially NTFP’s in rural livelihood (Shakleton et al, 2015) (Angelsen, 2014).
The term NTFP was coined by De Beer and Mc Demott in 1989, and refers to anything
obtained from forest other than timber and might refer to a range of products (Shakleton et
al, 2015). NTFP’s form a major part of common property resources (CPR’s). It plays a
significant role in the livelihood of dryland tribal communities, especially the one’s living
near or in the forests such that, if their abundance or supply is threatened, it can have a
measureable impact on their well-being (Shakleton et al, 2015). NTFP’s not only provide for
household income (cash/non-cash), but it is also used for self-consumption as food, fodder
and medicines. It allows cash saving, supports current consumption, allows income
generation and act as safety nets in response to shocks and gap-filling of seasonal shortfalls
(Shakleton et al, 2015) (Angelsen, 2014). Unlike other labour-intensive activities or
occupations, anyone from a child to a senior citizen can participate in NTFP collection and
contribute to the overall household income. Women, efficiently participate in the collection
and put more labour as compared to their male counterparts. When it comes to trading
NTFP, the aggregators are fully dependent on these rural tribal since they have an extensive
5
knowledge of forests and forest products thereby creating a sense of mutual empowerment
and co-dependency (Grivins, 2018). Apparently, it helps the rural tribal not only in earning a
livelihood but also in their struggle against ‘exclusion’ both gender-wise and caste-wise
(Grivins, 2018). However, gaining rights over NTFP’s for survival wasn’t easy.
The role of NTFPs in the livelihoods of rural communities can be traced back to the time
when the sporadic protest by the tribal communities against exploitative or revenue-
oriented state policies occurred (Liard, 2010). Before independence, there was a great
intervention in the forestry by the British government with the prime motive of
maximization of state revenues. It included reserving large chunks of forest for exclusive
state use and declaring valuable products off-limits to local users. However, the pressure
from the protests resulted in more proactive state policy on NTFP (Liard, 2010). Similarly,
back then, the trading of NTFP involved middlemen, acting as a threat to the primary
collectors. However, Nationalisation of NTFPs was introduced with the intention of reducing
middlemen influence in NTFP trade (Kurup, 2018). MP became the first state to nationalise
Tendu leaves with the intended mission to reduce middleman interference in trades and to
maximise benefits to primary collectors. Slowly, NTFPs like Harra, Sal seed and Gums
followed in the nationalised sector (Kurup, 2018).
The present study is also conducted in MP and it focuses on an NTFP, Cassia Tora and its
relevance in the livelihood of people living in semi-arid regions, mainly the Sahariya tribes.
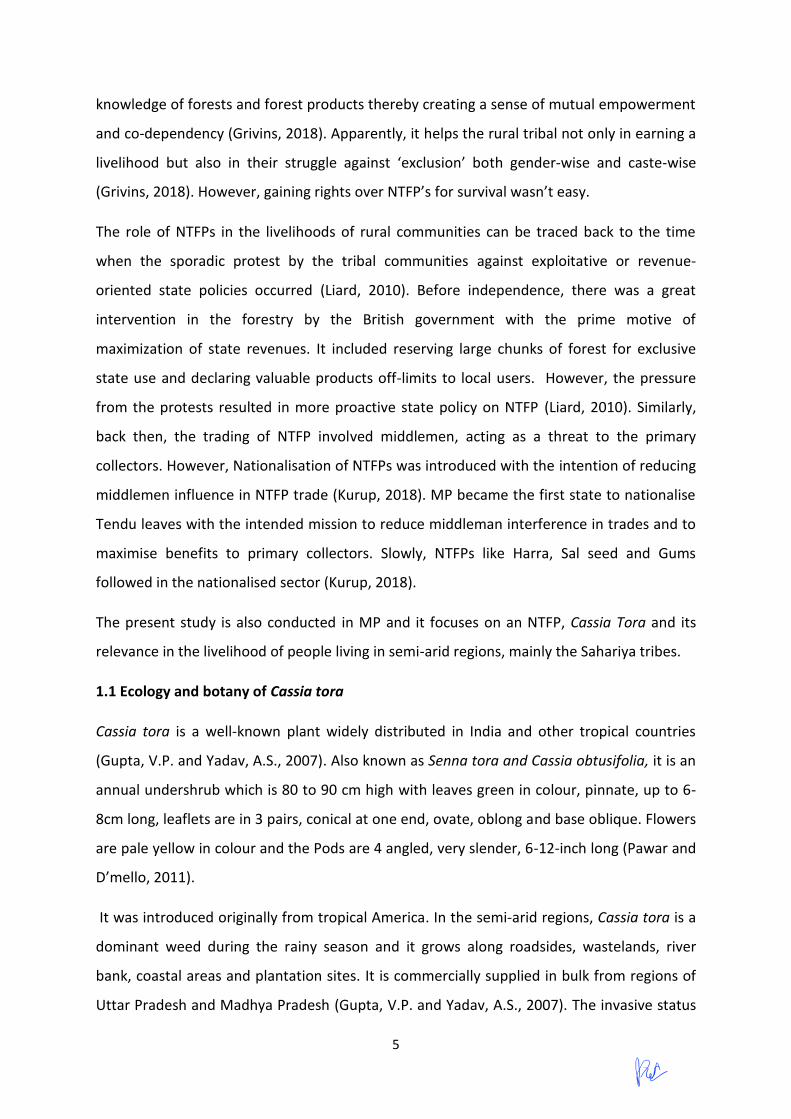
1.1 Ecology and botany of Cassia tora
Cassia tora is a well-known plant widely distributed in India and other tropical countries
(Gupta, V.P. and Yadav, A.S., 2007). Also known as Senna tora and Cassia obtusifolia, it is an
annual undershrub which is 80 to 90 cm high with leaves green in colour, pinnate, up to 6-
8cm long, leaflets are in 3 pairs, conical at one end, ovate, oblong and base oblique. Flowers
are pale yellow in colour and the Pods are 4 angled, very slender, 6-12-inch long (Pawar and
D’mello, 2011).
It was introduced originally from tropical America. In the semi-arid regions, Cassia tora is a
dominant weed during the rainy season and it grows along roadsides, wastelands, river
bank, coastal areas and plantation sites. It is commercially supplied in bulk from regions of
Uttar Pradesh and Madhya Pradesh (Gupta, V.P. and Yadav, A.S., 2007). The invasive status

6
of the plant is not clear though a few scholars agree that it is an ‘obnoxious weed. The plant
can grow in any place where a little bit of moisture is present and this accounts for its
spread across the country.
Seed germination commences in the month of June with the arrival of pre-monsoon rains.
The vegetative growth continues till July. Flowering initiation occurs in first week of August
and extends till the end of August (Gupta, V.P. and Yadav, A.S., 2007). Fruit initiation occurs
in the end of August and extends till September. Senescence occurs during the months of
October and November and the pods are mature by October. Dehiscence of pods occurs
slowly in next summer season. Seed collection occurs during the months from October to
December (Gupta, V.P. and Yadav, A.S., 2007).
Different parts of the plant (Leaves, seed, and root) are reputed for their medicinal value. It
is well recognized traditional medicine as laxative and is useful for treatment of leprosy,
ringworm infection, ophthalmic, skin diseases and liver disorders (Pawar and D’mello, 2011).
The root is used in snakebite. The seeds of Cassia tora, is a highly valued ancient Chinese
herb. The dried and fresh leaves are used in northern Nigeria in the treatment of ulcers, ring
worm and other parasitic skin diseases. During the course of the study it was known that in
India, the rural tribal usually act as primary collectors who sell the seeds of the plant and
consume the leaves in the form of food.
Cassia tora seeds and sickle pods Image source: Field site
Cassia tora: Seed germination Image source: Field site

7
2.RESEARCH QUESTIONS AND OBJECTIVES
Objective
x To study the importance of Cassia tora in the lives of Saharia Tribes of semi-arid
landscapes
Research questions
1) What is the relevance of Dhauli or Cassia tora in the Sahariya diet?
2) To what extent did Cassia tora contribute to Sahariya household income in 2014 and
2017?
3.STUDY AREA
The study was conducted in the village Jakhoda which is under Vijaypur tehsil, Sheopur
district, Madhya Pradesh. Sheopur district is situated in the western part of the state and
lies in the Gwalior revenue commission division and is the 19th largest district of the state.
The district is surrounded by Rajasthan’s Sawai-Madhopur in the west, Kota in the south-
west and Bara in the south whereas Shivpuri and Morena in the east and the north
respectively. The southern and the south-eastern parts of the district lie on the great
Vindhyan plateau whereas the northern part and the north western belt along the Chambal
valley. Major rivers that drain the region include Chambal, Parbati, Kuno, Kunwari, Sip and
Asan. The district comprises of 582 villages spread across five tehsils, of which 516 are
inhabited and the rest are uninhabited.
Forests have a vital role in the economy of the district. It contributes in maintaining
ecological balance, conservation of soil erosion and forest based industries. The forests here
are regarded as ‘Dry Tropical Forests’ which consists of a range of products, viz. tendu leaf,
timberwood, Mahua, Harra lac, gum and other several herbal and medicinal products. Main
wild animals are tiger, panther, bear, chital and sambar etc. Major part of the rural
population here, are depend on agriculture. The principal kharif crops traditionally grown in
the district are Jowar, Bajra, Soyabean and Tur. To some extent rice is also grown. Main rabi
crops are wheat, barley, gram, mustard and groundnut.

8
My study area Jakhoda, is one among many other villages which were displaced from the
Kuno Wildlife Sanctuary by the Madhya Pradesh Forest Department as part of ‘Lion
Reintroduction Project’ initiated in there as per the recommendation of the Wildlife
Institute of India. The idea was to provide an alternative habitat for the Asiatic lions which
are currently restricted to Gir Forests in Gujarat. The MPFD resettled the displaced family in
four protected forest blocks namely, Agara, Chentikheda, Umrikalan and Dudrikalan.
Jakhoda has a total of 50 households and consists of an entire population of Sahariya tribes
The climate of the area is usually hot and dry during summer months from March to June.
Winters begin around December following monsoon till February. The major occupation
here is agriculture and labour. However, with government allotted agricultural land which
has reduced soil fertility, is it very difficult to grow anything other than kharif crops like
Bajra or Tilli. Hence, when there is no alternative occupation, people of Jakhoda highly
depends on the forest products, mainly NTFP’s.
FIELD SITE MAP

9
4.METHODOLOGY
1. Literature review
Certain literatures were studied to get an idea about the themes related to the field and the
species. The themes included:
- Nature of the landscape and rural livelihood pattern
- NTFP collection and its importance in the rural livelihoods
- Ecology and botany of Cassia Tora and its global market demand
- Main methodologies and techniques to be used in a research
2. Preliminary research
A preliminary research was conducted to know about the nature of field site, no. of
households, possession of agricultural fields, NTFP collection pattern etc. For this, the main
methods adopted were ‘natural observation’ and ‘FGD’.
2.1 Observation
The observational aspect used in the field was mostly naturalistic one. This method involves
direct observation of the field site as well as the behaviour and interaction of the people
within the site without much of direct involvement in their activities. The first two days of
the research were spent on the same to see and observe things as they are without much
manipulation. It helped me to get a general idea about Cassia tora collection and its uses in
that village and to know the suitable timings for conducting interviews. However, after a
certain point of time, participant observation method was also used to get an ‘insiders
perspective’. This method involved participating in the lives and cultures of people who are
being studied to get an idea of the day to day activities and internal structure of the
household. It helped in judging people’s behaviour, their occupation on the basis of age and
gender, the role of NTFP’s in their lives and so on.
Image source: Google Earth

10
2.2 Focus Group Discussion
The participatory observation method paved way for conducting focus group discussions,
gender dimension was maintained in this. This method provided an insight into how people
think and on what basis do they agree or disagree about a particular issue. FGD was
conducted as a part of preliminary research which allowed me to judge if Jakhoda was an
apt site to conduct the research. It also helped to modify the research questions and to have
a straight goal. Below is the picture taken when FGD was conducted.
Image source: Field site
3. Household data
Total no. of households in Jakhoda 50
No. of households interviewed 44
No. of households collecting NTFP 41
No. of households not collecting NTFP 3
No. of Households collecting Cassia tora 41
No. of households only collecting Cassia tora 00

11
4. Interview
Semi-structured interviews were used to extract information from the primary collectors as
well as the traders. The study was conducted for a period of 16 days from 7th June to 22th
June in the village Jakhoda in Vijaypur Tehsil, Sheopur district, Madhya Pradesh. Both
quantitative and qualitative methods were used. The households were interviewed on the
basis of census method. The interviews of around 44 households were conducted out of a
total of 50 households. The research questions focused on comparison between two years
2014 and 2017. The year was chosen on the basis of rainfall variation in both years and
exports.
Both quantitative and qualitative data were collected using an interview guide. The
quantitative aspect was related to collection of Cassia tora, labour effort (distance, days
spent, people went) put for the collection, income and price. The qualitative questions
focused on finding out the reasons behind the variations in quantitative data if any.
4.1 Summary of respondents interviewed
Total
respondents
interviewed
Female
Respondents
(Primary
collectors)
Male
respondents
(Primary
collectors)
Traders Samrakshan
Staff
Field
assistants
64 28 22 9 2 3
5. The quantitative data collected was analysed using boxplots generated through R-
studio
The difference of data in both the years were analysed using the below features of
boxplots:
x The median is the central value of the data defined by the horizontal line in the middle of the boxplots.
x The whiskers are the two extended line towards the upper and lower value of the box indicating the maximum and minimum value.

12
x The outliers are the small circle away from the boxplot and whiskers which shows exceptional values in the data.
5. FINDINGS
RQ 1) What is the relevance of Dhauli in the sahariya diet?
The leaf part of the plant Cassia tora is consumed mostly by the rural tribal in India. My
study area, Jakhoda consists of an entire population of Sahariya tribes however, even
among them, the households consisting of elderly people who are aware about its medicinal
properties consume it the most. The collection period of Cassia tora leaves is from June to
August, this is exactly the time when the people of Jakhoda works on their agricultural field
to sow bajra. While they remove the obnoxious weeds and grasses from the field, they get
home with Cassia tora leaves instead of throwing it away along with other weeds and
grasses. The leaves after this period reaches a maturity level and becomes bitter in taste to
consume hence, they are consumed only in the three months of monsoon and that too once
or twice in 20 days. Another NTFP’s which is alternatively available to consume in those
months in Cissampelos pareira, a type climber for which, the people of Jakhoda specially
travel till the forest to collect and consume. Cassia tora sometimes acts just as an additive
when this particular climber is cooked. Dhauli is cooked alone as well as bhaji and sag. It has
cooling property because of which some households even store Cassia tora for the next year
summers. Also, it helps people in dealing with a range of problem like lung infection,
breathing problem and menstrual cramps. Just like Cassia tora, there are various other
NTFP’s which the people of Jakhoda consume throughout the year like ZIziphus, Momordica
dioca, Chenopodium album etc.
The consumption of various NTFP shows the level of dependency of the rural tribal on the
forest products. As shown in the study area map also, Jakhoda is 7-8 km away from the main
market and only 3 km away from the forest which tells that, they cannot frequently visit the
market every time they run out of vegetables but can visit the forest. Hence, NTFP does act
as safety net for food. In case of Cassia tora, the collection and consumption is done by
choice sometimes and is considered not more than any other seasonal crop by the people.
Sometimes, the people consume it when they are out of the reach of any other vegetables
or NTFP. Therefore, it could be said that Cassia tora as a food is of peripheral importance.

13
RQ2) To what extent did Cassia tora contribute to the Sahariya household income in the
year 2014 and 2017?
Both the years, 2014 and 2017 has been chosen on the basis of difference in the price and
rainfall in both the years. As per the local traders, the low-value NTFP Cassia tora, is usually
traded for price at the range of 15-20Rs, however, in 2014 it was as high as 30Rs for the
primary collectors and 60Rs for the traders whereas, it fell as low as 12 Rs for the primary
collectors and 15Rs for the traders in 2017. As far as the rainfall is concerned, both the years
2014 as well as 2017 were drought years however, 2014 had a relatively high amount of
rainfall (690mm) as compared to 2017(436mm). This difference of 254mm is significant for
the spread of Cassia tora. Both these factors affected the livelihood of traders as well as the
collectors. For the traders, a rise in the price of Cassia tora in 2014 stimulated them to
hoard the seeds for the next consecutive years with an expectation of more rise in the price
however, they ended up being left with stocks of Cassia tora of 3 years (2015, 2016, 2017).
The Sahariya tribes who are the primary collectors of Cassia tora seeds, collect it during the
months of October and November. The income from Cassia tora depends mainly on its
abundance as well as its price. Given below are the factors affecting income in both the
years. The factors include, quantity of Cassia tora collected, distance travelled for collection
and the final income received in both the years by 44 households of Jakhoda. On the basis
of these factors an attempt has been made to find out the difference in the Cassia tora
contribution in both the years.
Amol Padwad

14
The quantity of Cassia tora collected by 44 households in 2014 and 2017
Median
Collection of Cassia tora is greater in the year 2014 compared to 2017. There is difference of
14 Kgs in the median of daily collection in both the years, it was 22 Kg in 2014 whereas it
was only 8 kg in 2017.
Inter-quartile range
The inter-quartile difference for the year 2014 is 6 and it is 4 for the year 2017. In 2014, 50%
of the collection by 44 households lies between 20-26kg in 2014 whereas in 2017, 50 % of
the collection lies within the range of 6-10 Kg showing greater variability in the daily
collection for that year.
Skewness and variability
The data is slightly skewed towards the right in the year 2014 indicating that majority of
Cassia tora collected by 44 households lies within the range of 20-22kg which is 25% just
below the median line and as we move above the median line, there is a variability between
22- 26 kg in the collection.
The data for 2017 is skewed towards the left indicating that 25% of collection below the
median line, on the whiskers is from 0-7Kg however, the distance from lower to upper
quartile is symmetrical showing that majority of collection was done between 6-10 kgs.
Outliers
In the year 2014, there has been a lot of variation in the collection of Cassia tora, people

15
were collecting as high as 40 Kg and as low as 5 kg. There is a possibility that since rainfall as
well as price was higher is that year, people were actively participating in the collection.
However, people collecting lower quantity in that year would be the one with other
alternative occupation.
The distance travelled by 44 households for Collecting Cassia tora in 2014
and 2017
Median
Distance travelled by 44 households for the collection of Cassia tora is greater in the year
2017 compared to 2014. There is difference of 12 Km in the median of distance travelled in
both the years, it was 3 Km in 2014 whereas it was 15 km in 2017.
Inter-quartile range
The inter-quartile difference is the same for both the years, which is 5 km. However, there is
a huge difference in the inter-quartile range, in 2014, 50% distance travelled by 44
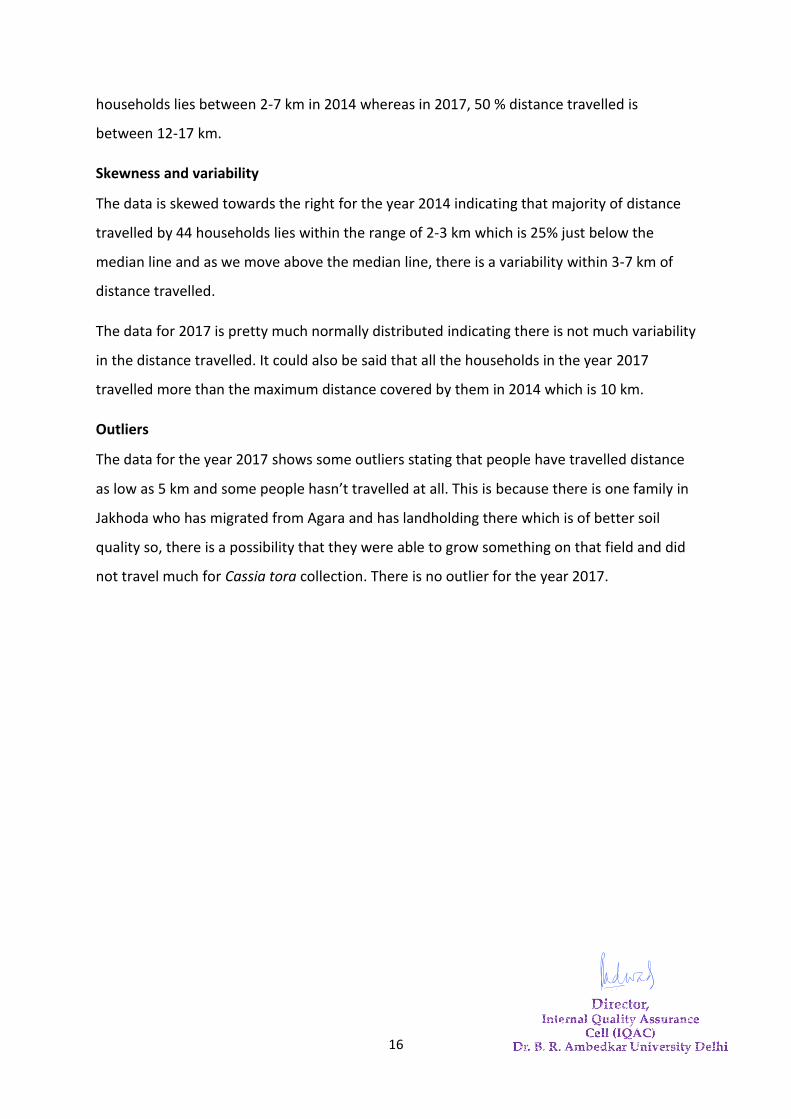
16
households lies between 2-7 km in 2014 whereas in 2017, 50 % distance travelled is
between 12-17 km.
Skewness and variability
The data is skewed towards the right for the year 2014 indicating that majority of distance
travelled by 44 households lies within the range of 2-3 km which is 25% just below the
median line and as we move above the median line, there is a variability within 3-7 km of
distance travelled.
The data for 2017 is pretty much normally distributed indicating there is not much variability
in the distance travelled. It could also be said that all the households in the year 2017
travelled more than the maximum distance covered by them in 2014 which is 10 km.
Outliers
The data for the year 2017 shows some outliers stating that people have travelled distance
as low as 5 km and some people hasn’t travelled at all. This is because there is one family in
Jakhoda who has migrated from Agara and has landholding there which is of better soil
quality so, there is a possibility that they were able to grow something on that field and did
not travel much for Cassia tora collection. There is no outlier for the year 2017.
Amol Padwad

17
The income received from the collection in of Cassia tora in 2014 and 2017
Median
Income derived by 44 households from the collection of Cassia tora is higher in the year
2014 compared to 2017. There is difference of 564Rs in the median of income received. It
was 660 Rs in the year 2014 and 96 Rs in the year 2017.
Inter-quartile range
The inter-quartile difference is 188 Rs in 2014 and 48 Rs in 2017 showing a greater
variability in the income earned by the households in 2014. There is a huge difference in the
inter-quartile range, in 2014, 50% income received is between 592 to 780 Rs and in 2017 it is
between 72-120 Rs.
Skewness and variability

18
The data is skewed towards the right for the year 2014 indicating that majority of income
earned by 44 households lies within the range of 592 to 660 Rs which is 25% just below the
median line and as we move above the median line, there is a variability in the income
earned within the range of 660 to 780 Rs.
The data for 2017 is skewed towards the left indicating that majority of income earned was
within the range of 96 to 120 Rs and as we move below the median there is a greater
variability indicating there is not much variability if we look at the whiskers.
Outliers
The data for the year 2014 shows outliers indicating greater variability in the income
collection of that year. The people have received as high as high as 1400 Rs and as low as
200 Rs. This totally depends on the collection of that year, if we look at the daily collection
of 2014, people who collected more as a result of price rise received more income and
people who didn’t go collection received less. No outliers can be spotted for the year 2017
indicating that there was not much variability the income received in that year.
6. DISCUSSION
YEAR 2014 2017
Rainfall 690mm 436mm
Price 30Rs 12Rs
Quantity collected by 44
households (Average)
20Kg 7Kg
Distance travelled by 44
households (Average)
4km 13km
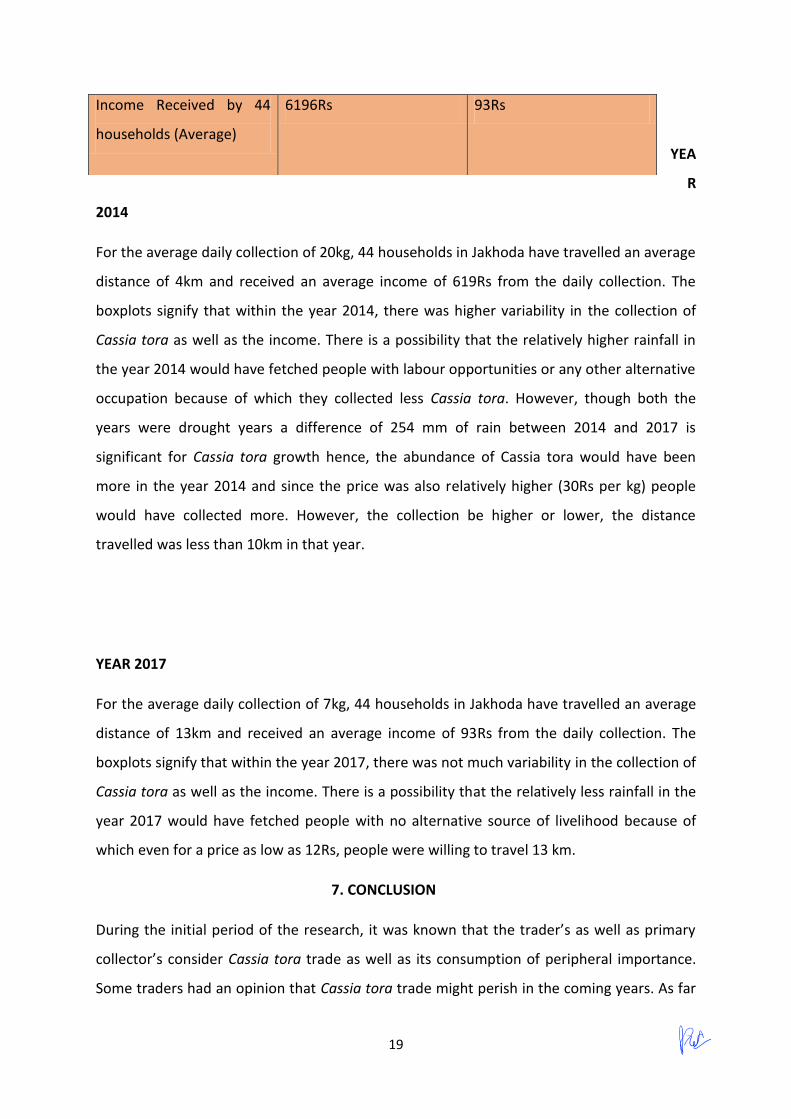
19
YEA
R
2014
For the average daily collection of 20kg, 44 households in Jakhoda have travelled an average
distance of 4km and received an average income of 619Rs from the daily collection. The
boxplots signify that within the year 2014, there was higher variability in the collection of
Cassia tora as well as the income. There is a possibility that the relatively higher rainfall in
the year 2014 would have fetched people with labour opportunities or any other alternative
occupation because of which they collected less Cassia tora. However, though both the
years were drought years a difference of 254 mm of rain between 2014 and 2017 is
significant for Cassia tora growth hence, the abundance of Cassia tora would have been
more in the year 2014 and since the price was also relatively higher (30Rs per kg) people
would have collected more. However, the collection be higher or lower, the distance
travelled was less than 10km in that year.
YEAR 2017
For the average daily collection of 7kg, 44 households in Jakhoda have travelled an average
distance of 13km and received an average income of 93Rs from the daily collection. The
boxplots signify that within the year 2017, there was not much variability in the collection of
Cassia tora as well as the income. There is a possibility that the relatively less rainfall in the
year 2017 would have fetched people with no alternative source of livelihood because of
which even for a price as low as 12Rs, people were willing to travel 13 km.
7. CONCLUSION
During the initial period of the research, it was known that the trader’s as well as primary
collector’s consider Cassia tora trade as well as its consumption of peripheral importance.
Some traders had an opinion that Cassia tora trade might perish in the coming years. As far
Income Received by 44
households (Average)
6196Rs 93Rs

20
as primary collectors are concerned, they were more interested in talking about high value
NTFP’s like Boswellia serrata and Asparagus racemosus. However, when the income from
Cassia tora of two years 2014 as well as 2017 were compared it was known that, be it a
good occupational opportunity year or not Cassia tora is collected by the Adivasi
community. This is because of the additional benefit that NTFP’s provide. As mentioned by
Shakleton “the direct use of NTFPs as a daily net offers more to households and livelihoods
than simply the consumptive or replacement value of the product”. The collection of NTFP’s
does not require any additional cost hence it allows the poor household to save cash and
use NTFP income for daily household needs (Shakleton et al, 2015). Similarly, it acts as
safety nets at the times of misfortune or household stress (Shakleton et al, 2015). The year
2014 is speculated to be a good occupational year due to relatively higher rainfall and so,
Cassia tora might have contributed to cash saving whereas in 2017 it kind of acted as a
safety net for the people. At a price as low as 12 Rs per kg in the year 2017, people were
willing to travel as far as 17-20 Km to collect only up to 7 kg of Cassia tora showing their
immediate need for money. The reason why Cassia tora can compete other high valued
NTFP is that it requires a lot of labour effort for its collection. NTFP’s like Boswellia serrata is
not open-access and involves some property rights which majority of people in the resettled
village don’t have. Cassia tora is an open-access resource and doesn’t require much of
labour effort. Since, less labour effort is required, every one ranging from male-female,
child-senior citizen can go for collecting it promoting inclusive participation and creating a
sense of unity within the community. Even the traders are highly depending on the Adivasi
community since, only they know the forest well. This helps thenm in their fight against
exclusion. Cassia tora is not just a mere low value NTFP, but the one which can be collected
with much comfort and with complete participation.
References Angelson, A. (2014). Environmental Income and Rural Livelihoods: A Global-Comparative Analysis.
Grivinsa, M. (2018). Benefitting from the global, protecting the local: The nested markets of wild product trade . Journal of Rural Studies, 1-8.
Gupta, V. (2007). Ecology of Cassia tora L. in the Sariska Reserve Forest in Rajasthan. 265-269.
Gupta, V. P. (265-269). Ecology of Cassia tor L. in the Sariska Tiger Reserve Forest in Rjasthan. 2007.
Kabra, A. (2013). Impact of conservation-induced displacement an host community livelihoods: complicating the DIDR narratives. 217-224.

21
Kurup, H. (2018). Household Labour Decisions during Droughts: The Contribution of Cassia tora to Environmental Incomes of the Sahariya .
Mortimore, M. (1998). Roots in the African Dust. 1-75.
Pawar, H. A. (2011). CASSIA TORA LINN.: AN OVERVIEW. International Journals of Pharmaceutical sciences and research, 2286-2291.
Saini, S. (2016). NTFPS VALUE CHAIN DEVELOPMENT FOR RURAL COMMUNITIES OF MADHYA PRADESH, INDIA- A CASE STUDY OF CHAKODA (CASSIA TORA L.) . 19-30.
Shakleton, C. M. (2015). Ecological Sustainability for Non-timber Forest Products .
Amol Padwad
1
ASocialandSpatialAnalysisofIndianFrankincensearoundtheKunoWLS
Submitted By- Chhavi Bathla School of Human Ecology Dr. B. R. Ambedkar University, Delhi

2
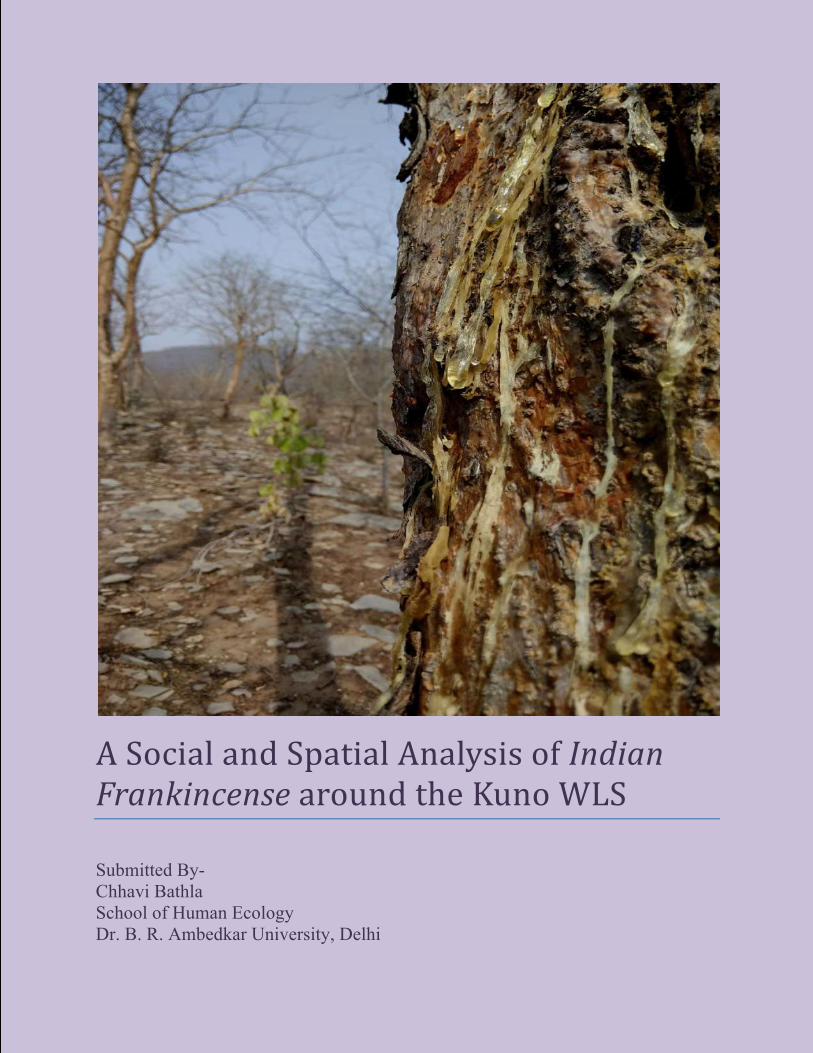
A Social and Spatial Analysis of Indian Frankincense around the Kuno WLS
SUMMER INTERNSHIP
By
Chhavi Bathla
M.A. in Environment and Development
School of Human Ecology
Dr.B.R.Ambedkar University, Delhi
2018
Amol Padwad

3
Section 1
1. Introduction
1.1 NTFP dependence
The research & management of Non-Timber Forest Products (NTFP) creates a nexus between ecology and
social sciences and hence NTFPs has incurred a wide array of definitions, terms and synonyms. Secondary
resources, non-wood products, minor forest products were such names that were used for NTFPs few decades
back. According to the definition coined by Beer and McDermott (1996) NTFPs are defined as ‘all biological
materials other than commercial timber extracted from forests for human use’. Albeit this definition has given
the core doctrine for the NTFPs but still the definition was expanded as the following (Shackleton et al.2011):
• Biological products- this include products which have aesthetic uses and have recreation potential such as
seeds, resins, mushrooms, bark, grass, thatch etc. Also contrary to the FAO’s use of the term non-wood
products, NTFPs includes wood-products such as fire wood, timber for carving, chewing sticks etc for
domestic and small-scale trade.
• Consumptive and non-consumptive uses- consumptive uses includes the direct consumption of NTFPs for
household and small trades while non-consumptive uses includes cultural uses of NTFPs.
• Local use and benefit- this creates an inter-relation between the domains of ecology and social sciences.
Due to the intervention of large commercial enterprises, there is no or limited flow of incentives procured
after extraction of NTFPs to the local communities. This will eliminate the sustainable use or conservation
of the NTFPs for the habitats in which they are located.
• All habitats- NTFPs can be extracted from a wide range of habitats and ecosystems including wetlands,
forests, grasslands, savannas and so on. They can also be sourced from transformed systems such as
agricultural or urban landscapes.
• Self-replicating wild species- when a NTFP is propagated largely, it loses its identity of being a NTFP and
becomes a crop or livestock. Hence species that are indigenous, natural or alien & have property to self-
replicate and are still important to local livelihood are NTFPs.
With the multiplicity in the terms and definitions related to NTFPs, they have multiplicity in the roles and
values that they offer to the local livelihoods. A significant number of people from urban to rural poor are
dependent on a large number of NTFPs for their daily needs such as food, shelter, medicinal etc. The other
benefit of procuring these NTFPs is their low cost of collection and harvesting tool, making their collection
4
cost-effective. Furthermore, all of these NTFPs are not used within the household, but are also sold in markets.
The vending of these NTFPs is dependent upon magnitude and nature of trade chain per NTFP and the interest
and income resulting along the chain. These NTFPs are not just a source of income but can also be used as
contingency strategy at the times of misfortune such as drought or flood, loss of crops or livestock, death of
breadwinner etc. Except providing livelihood options to locals, NTFPs plays a major role in providing
supporting or regulating services (Shackleton in press) such as habitat, food or nesting to other important
species both NTFPs and non-NTFP species. For example, the fruit tree Sclerocarya birrea subsp. caffra has
multiple direct and cultural uses among local communities (Hall et al. 2002). Also Phragmites is a community
dominant (even invasive in some locations) that provides most of the litter and detritus to the base of aquatic
food webs, which in turn provide fish for local consumption (Weis and Weis 2003). With the essentiality of
NTFPs in daily lives, they also add-up aesthetic pleasure to the local landscape and the presence of healthy
environment. Sometimes these cultural values also generate income opportunities for locals through sale of
artefacts, foods and drinks derived from NTFPs or through ecotourism enterprises to observe traditional
harvesting & crafting techniques or attendance at local ceremonies (Cocks and Dold 2006, Cocks et al. 2011).
In order to enjoy the benefits from these NTFPs for a long haul their harvesting needed to be done in a
sustainable way. But the variability in the evidences for and against the sustainable harvesting makes it difficult
to get to a conclusion. The reports of overharvest of NTFPs are common in literature (Ticktin 2004, and
Schmidt et al. 2011) and according to a report by IUCN, the major threat to plant diversity is overharvesting
(Schmidt et al. 2011). While in contrary to this, the results of Stanley et al. (2012) shows that two-thirds of the
studies reviewed showed that NTFPs are harvested sustainably. These variations in the study of NTFP
sustainability is may be due to differences in the methodology and scrutiny, and also biological and ecological
diversity of area studied.
Given the importance of NTFPs in livelihoods, I shall now describe the area which I cultured to understand the
role of NTFP (Boswellia serrata).
1.2 Study Area
India has vast area of over 32, 86,959 km2, 19.39% of which is under forest cover and of this nearly 28.91% of
its forest falls under tropical dry deciduous forest type (FSI 2000). Madhya Pradesh (M.P) is centrally located
and the largest state of India with highest forest covers in the country of 95,690 km2 (IFSR 2011). Agara is a
small village in Sheopur District, located in the north-western part of state of M.P, bordering states of Rajasthan

5
and Uttar Pradesh. The forests that are found in this division are mostly of Northern Tropical Dry Deciduous
Type and are home to large number of NTFP bearing species. An estimated 80% of the species in the forest
bear NTFPs of commercial importance to the local people (Bhattacharya and Hayat, 2004).
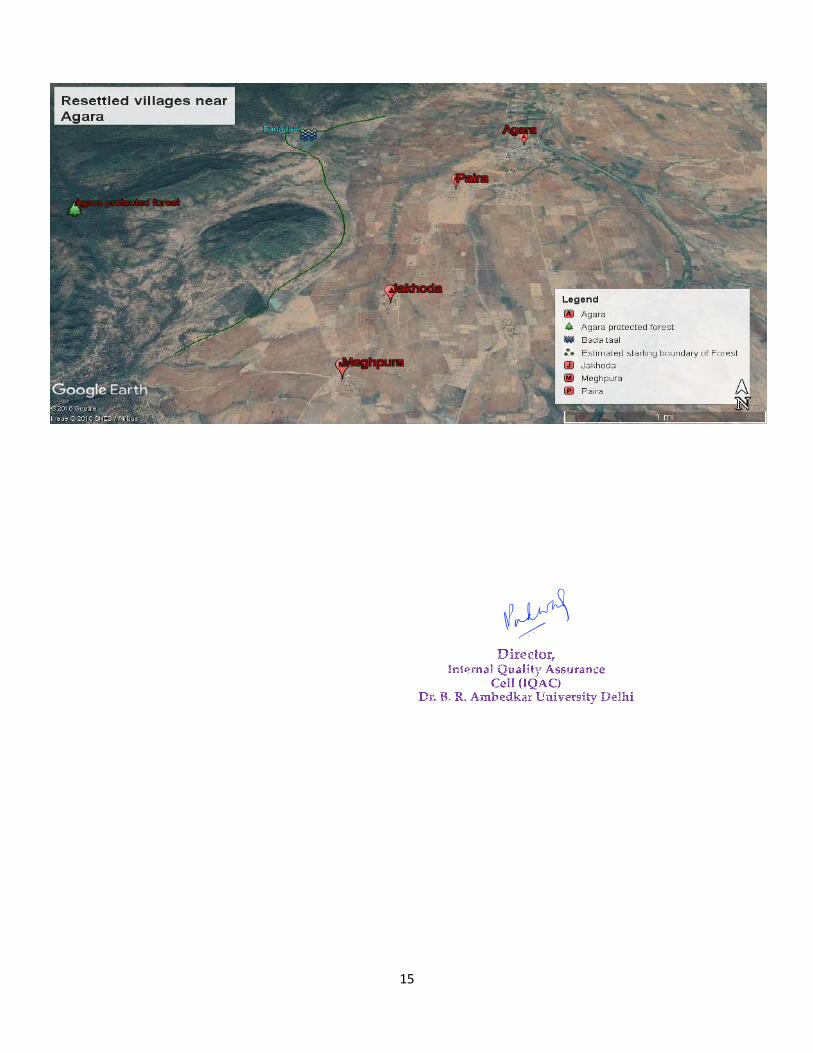
Agara is one of such six villages who become an involuntary ‘hosts’ to the Kuno resettlers (Kabra and
Mahalwal, 2014). Over 80% of the host population consisted of the Sahariya, an Adivasi community recognized
by the Government of India as a Particularly Vulnerable Tribal Group, the poorest and most vulnerable of the
Scheduled Tribes of India (MoTA, 2014).
Apart from the crops such as Bajra & Jawar (millet), tilli (Sesame), gehu (wheat), sarso (mustard seeds), chana
(chickpea), soybean (bens), urad (Split Black gram) or moong daal(Split Green gram) gum extraction from
Salai trees (local name of Boswellia serrata), is another kind of activity which is mainly performed by advises
for their subsistence.
Section 2
2. Research Methodology
2.1 Research question
What are the norms of division of Boswellia serrata trees in the forest near Agara village?
2.2 Data Collection
1. Family tree- Each adivasi household in Agara was interviewed. After finding the marital and kinship
relations family tree was made.
Definition of Household according to census of India 2011
A 'household' is usually a group of persons who normally live together and take their meals from a common
kitchen unless the exigencies of work prevent any of them from doing so. The persons in a household may be
related or unrelated or a mix of both. However, if a group of unrelated persons live in a Census house but do not
take their meals from the common kitchen, then they will not collectively constitute a household. Each such
person should be treated as a separate household. The important link in finding out whether it is a household or
not is a common kitchen.
2. Interview schedule for individual households (semi-structured questionnaire) - In order to get a
comprehensive knowledge of the fundamental norms of division of trees each household was interviewed with
some elementary set of questions. These questions were asked in Hindi language but with the help of an

6
informant it was also tried to convert them in their local dialect. To get the detailed knowledge from every
aspect further questions were added to the elementary set of questionnaire depending on the information they
provide.
3. Focus group discussions- To conform the information collected earlier group discussions were motivated
and also to understand if there is any difference in the norms of division and claiming of trees within
households, they could be better understand this way.
4. Geospatial metadata-Geo-tagging of the patches of some of the households was done, so that the tenurial
rights can be understood better.
No. of respondents 55
No. of households covered 47
No. of patches geo-tagged 23
No. of days spent in the field 20
Table 1 A brief summary of land and household surveyed
Section 3
3. Ecology of Boswellia serrata
Local names
Arabic kuurdur
Bemba kundur
Bengali luban, salai
English Indian frankincense tree, Indian olibanum tree
Gujarati gugal, saleda, dhup
Hindi madi, salai, saler, salga, salhe, Sali
Sanskrit sallaki, kunduru
Tamil parangisambrani, kungli, kundrikam, gugulu, morada
Trade name salai
Boswellia serrata can be spot easily by its peeling, papery bark. This is a distinctive tree even when it is
completely leafless and tends to dominate arid, rocky slopes where few other trees can survive. Apart from its
7
ability to tolerate drought, it is helped by immunity from browsing and resistance to ground fires. It is an
important tree in dry, hot, stony habitats and has enormous potential for reforestation and alleviating degraded
wastelands.
Biology
In India, the white flowers appear in stout racemes at the ends of branches from the end of January to March-
April; sometimes flowers may appear before the fall of old leaves or after the appearance of new leaves.
The drupes ripen in May-June. The leaves turn yellowish to light brown before they nearly all fall in December;
the new leaves appear in May-June.
Ecology
B. serrata is a species characteristic of the tropical dry deciduous forests and occurs in very dry teak forests or in
dry mixed deciduous forests in association with species such as Terminalia spp., Anogeissus latifolia and
Acacia leucophloea. It is characteristically found on the slopes and ridges of hills, as well as on flat terrain,
attaining a larger size on fertile soils. It is resistant to drought and resists fire better than other species in its zone
of occurrence. The tree is also frost hardy and serves as a nurse tree for other species.
Products
Fodder: It is not readily browsed by cattle, although in India, it is considered a substitute fodder for buffaloes.
Fuel: The wood is a good fuel.
Timber: It is used in cheap furniture, it is use to make doors of the houses in Agara.
Gum or resin: The tree yields a yellowish-green gum-oleoresin known as ‘salai guggal’ or ‘Indian frankincense’
from wounds in the bark. The resin is also widely used as a household fumigant and fragnance.
Medicine: It has been used for centuries in Ayurveda to treat osteoarthritis, fibrositis, asthma and as a general
health support. While in modern pharmacology it is used as an alternative to steroidal drugs in the treatment of a
wide range of inflammatory conditions.
Pests and diseases

8
The bark of the felled log has the property of maintaining its green and healthy condition for some months.
During this period, there is little liability to insect attack; but when decay sets in, larvae of the beetle
Atractocerus reversus bore the wood. The alternative is to de-bark the logs and free them from attack by
Atractocerus, but the peeled logs are freely attacked by Platypus and Xyleborus spp. while the surface is moist
and by powder post beetle when the surface has dried slightly. White spongy sap rot is known to attack trees in
avenues and forests. The tree is also subject to attack by other fungi that cause spongy heart rot, mottled sap rot,
spongy root and butt rot, and white fibrous rot.
Section4
4. Result and discussion
4.1 Ownership and access to forest/resin
The forest in the vicinity of Agara is a reserved forest under the forest department of Madhya Pradesh. Since
eternity the indigenous of Agara are using this forest for a variety of purposes such as livestock grazing and
collection of forest produce for sale and household use. From all the NTFPs collected from this forest Indian
frankincense resin is a high value NTFP which is extracted from Boswellia serrata trees and is a main source
for the subsistence of denizens of Agara. Hence the access to the forest and forest produce is of utmost
importance for the livelihood of people in this region.
Discussion- Following Ostrom (1990), Bromley (1992), and Feeny et al. (1990), common-property (common-
pool) resources can be placed under the four basic property-rights regimes i.e. 1. Open-access where there is no
property right or the access is free & open to all. 2. Private property where the property is owned by an
individual or corporation and they have right to exclude and regulate the use of resource. 3. State property or
state government property where the right to control access and regulation of resource is vested to the
government. 4. Common or communal property where an identifiable community held the rights to exclude and
regulate the use of resources. Hence according to the above discussed property regimes the trees of Boswellia
serrata that the denizens of Agara are using for their subsistence are a common-property resource that comes
under the state property and the state has right to access and control the extraction of resin from the trees.
Because the indigenous of Agara are using this resource and are generating revenues out of that this means that
they have access to the forest. But according to Elinor Ostrom (1992) the most relevant operational-level
property rules relevant to common-property resources are “access” and “withdrawal”, where “access” means the

9
right to enter a defined physical property while “withdrawal” means the right to obtain the “products” of a
resource.
So, from the above discourse we can conclude that the reserved forest of Agara comes under the state property
and according to Schlager and Ostrom’s framework (1992) the Forest Department of Madhya Pradesh exercises
management, exclusion and alienation rights over Boswellia serrata trees. But because the denizens are
extracting resin from these trees this concludes that they have “withdrawal” right of a common-property
resource.
4.2 Norms of division
Despite the fact that this forest in Agara cannot be individually owned, the villagers have worked out a
system of informal ownership or customary laws & have divided the trees in such a way that no other person
can extract resin from someone else’s trees. Also this informal ownership or customary right to extract
Boswellia resin is usually inherited from father to sons (patrilineal) in the family, but in some circumstances
this pattern of inheritance can be changed.
Patterns of inheritance
1. Inheritance (Patrilineal inheritance) (No. of family tree-12)
In usual circumstances, whenever an adult son gets married and set up a separate household with his wife, he
also receives his share of Boswellia trees i.e. he is now responsible for resin extraction from those trees and
will get the revenues from it.

10
Member of
Family
Name of
ancestor
Estimated no. of
trees of
ancestors
Name of
descendent
Estimated no. of
inherited trees
as by
respondents
Patch size in
Hectares
Family 1 Chetu 7000 Kissali 1000 2.1
Family 2 Mangi Sarupi 1500 Ganga Ram 1500 3.43
Family 4 Buddhu 6000 Laxman 4000* 1.1*
Puran 2000* 4.21*
Family 8 Mulli 4000 Anup 1000 1.39
Family 10 Punna 600 Charnu 600* 5.56*
Family 11 Shukua 1200 Harcharan 1200 2.25
Family 12 Shankar 7000
Munna 2500* 2.65*
Shreenivas 2500* 3.45*
Ram Gopal 2500* 1.41*
Table 1 Families with geo-tagged patches and inherited trees
*The difference between the estimated no. of trees and patch size is may be because a) the no. of trees is an estimate
number b) due to the difference in density of trees in each patch
Figure 1 Patches of Inherited claimants

11
Inheritance by daughter/female member of the family (No. of household-1)
Sometimes in families when there is no son the trees get inherited to the daughters. In this case the extraction
of resin was done by son-in-law.
Case study
Jagram has three daughters. His elder daughter is married. But she and her husband are living with Jagram.
Jagram’s son-in-law goes to procure resin. When asked about the staying of their son-in-law with them they
said he is staying here with the consent of both the families. Jagram’s daughter is married since last 10 years
but she had shifted here last year only. So, when asked if his second son-in-law also wanted to live with them
will he divide his trees among both of them? He said he will definitely divide his trees but they both have to
take care of Jagram’s expenses also i.e. “Jo hame khana degi ham usey ped de denge”. His son-in-law also
does labour work (drives tractor) and helps in farming.
2. Direct claims (No. of households-24)
There are many families in Agara in which the first claimant still have his trees and no further division has
taken place. But there are some cases also in which the son has directly claimed for more trees because he
did not get trees from his father.
It is not necessary that every son will get the trees or even equal number of trees from his father’s
endowments. It depends on the willingness of the father that how he wants to divide and how much. If the
father does not have enough trees then he keeps the trees for himself only. In this case to prevent resource
crunch or conflicts within the family the child can claim for trees deep in the forest or else can do labor work.

12
Member of
Households &
Family Name of member
Estimated no. of
trees as by
respondents
Patch size in
Hectares
Household 3 Jagan 2000 2.33
Household 4 Parshu 2500 6.28
Household 7 Nakhatu 1000 2.32
Household 11 Dassa 1000 2.38
Household 20 Madanu 3000 1.27
Household 21 Ratanu 1000 3.56
Household 22 Murari 400 0.89
Family 5 Mukandi 1000* 2.14
Family 6 Hiralal 800* 2.69
Family 8 Mulli 4000* 3.1
Family 8 Bishu 1000 1.19
Table 2 Households & families with geo-tagged patches and direct claims
*Respondents who are the first claimants in their families
Figure 2 Patches of Direct claimants

13
3. Both inherited and direct claims
In Agara when there is division of trees the father strives to divide them equally among the son’s. But if
the family is large or if the father has less number of trees, in these circumstances son tries to claim for
more trees in order to generate more revenue. Hence in these cases the descendent has both inherited as
well as their own claimed trees.
Member
of Family
Name of
ancestor
Estimated no.
of trees of
ancestors
Name of
descendent
Estimated no. of
inherited trees
as by
respondents
(descendent)
Estimated no.
of trees
claimed by
respondents
(descendent)
Patch
size in
Hectares
Family 1 Chetu 7000 Ramhit 1000 1000 2.87
Family 3 Bullan 1000 Ram Singh 100 1900 3.82
Table 3 Families with geo-tagged patches and both inherited & direct claims
Figure 3 Inherited patches of both Inherited and direct claimants

14
4.3 Claiming of trees by other villages
The trees of Boswellia serrata in the reserved forest near Agara are a crucial source of livelihood for the
denizens there, but there is other nearby resettled villages that surround the forest area and have access
to the trees. Albeit there is no such law due to which these villagers cannot extract the resin but due to
the customary laws made by the Agara villagers other villagers have less access to these trees. But
because Indian frankincense it is a high value NTFP and help them to generate high revenues they try to
claim for trees. Denizens mostly from Paira, Jakhoda and Meghpura were suspected for these activities.
Discussion
Under the development induced displacement and resettlement (DIDR) plans, in 1999 with the arrival of Kuno
resettlers Agara become an involuntary ‘host’ for the resettlers. To provide habitation and farming land for
resettler households villagers of Agara lost access to a vast area of forests and commons which they had hitherto
used extensively for agriculture, livestock grazing and collection of forest produce for use and sale, but this was
compensated by the increase in extraction of resin from Boswellia serrata from the Agara Reserve Forest (Kabra
and Mahalwal, 2014). This resettlement has given a new option of livelihood to the Agara villagers i.e.
extraction of resin from Boswellia trees. Over a period of time this NTFP is proved as a wholesome alternative
to earn a high amount of revenue and also indigenous of Agara has created customary laws to divide these trees
among themselves.
But because of the generation of high revenues through this NTFP the denizens of resettled villages also try to
claim for trees or try to collect the extracted resin from the already claimed trees of villagers of Agara. This
creates a coercive situation between the denizens of Agara and nearby villages. But in order to get a better
livelihood option or generate more revenues, resettled villager’s wants to have claim over this resource.
15
Amol Padwad

All well on the Farm? A Study of Private Irrigation for Adivasi Households in Central India
In Partnership with Samrakshan Trust, Village Agara, District Sheopur, Madhya Pradesh
Pooja Verma, MA Environment & Development [Email address]
Abstract Dug wells (open wells) are a critical source of irrigation and poverty alleviation among farming households in semi-arid landscapes. This project intends to map the irrigation potential of existing dug wells and their contribution to agriculture in a water-scarce village in central India. Dug wells in this village were a part of the rehabilitation package for conservation refugees from the Kuno WLS, and the project intends to map their current use and importance in Adivasi livelihoods fifteen years after resettlement. The data generated by this project is expected to help raise resources to improve water security and increase well-being for one of the poorest communities of central India.


All well on the Farm? A Study of Private Irrigation for Adivasis Households in Central India
Introduction
Being a drought prone area envisaging water scarcity is very obvious thought that comes in
mind due to low rainfall and high evaporation. Water is required for everything including
domestic, industrial, agricultural uses as its basic need as well as it is required for
development in all sectors of economy. Acting oblivious about the conditions in these regions
won’t help. Therefore it is significant to become aware about the available resources and
opportunities. Change in methods to extract water will indirectly show the
degradation/decreased level of resource or any other kind of discrepency that is why the
change was required and had happened.
To maximize the efficient use of available water resources, a water conservation strategy is
compulsory. Some of the water management strategies in such areas are conjunctive use of
surface and groundwater, reusing the effluent, artificial aquifer recharge, using sand storage
dams which are suited to semi- arid areas in the world. The strategies can be based upon
legal, social, financial, economical, technical and participatory nature but are mainly
determined by the nature of the prevailing hydroclimate.
Blue Grabbing
Change in water use doesn’t occur only due to physical constraints but many a times resource
grabbing played pivotal role. Natural resource grabbing ,which is being practiced from many
years but it has grabbed the attention since 2009 over the global land grab which is the
framework to find out the large scale transnational commercial land transactions for
production, sale, and export of food and biofuels (Borras and Franco, 2010). So in that
context “water grabbing” is also controversial as it involves dispossession, exclusion from
rights as the land and water are then assumed as the property of state and because of that the
rural people who are accustomed to the rights neither have to change it but also have to
displace from their lands in many cases. For example the river privatisation in Turkey that

created the issues of ownership, rights to water and community life due to reallocation of
access over rivers that not even marginalised the rural communities but also destructed the
forests. It also created serious ecological and social impacts. In Turkey due to the neoliberal
reforms, private sectors took rights to rivers on lease for 49 years in the name of electricity
production in 2001, dismissing rights of people and transferring the rights to private
companies. Government thought it as one of the progressive solution for securing its
geopolitical position as an energy corridor between Europe and Asia (Coskun, 2011) rather
leaving the water to just flow and “which is in vain”, should be used . According to them
water is the cheapest and renewable resource for boosting Turkish competitiveness (Uzlu et
al., 2011). It would lead them to remove their dependency for energy on other countries.
Government their allowed private companies to take control in rush as they wanted to be all
self-dependent by utilising all domestic renewable energy resources by 2023 which is their
100th anniversary of republic.More than 10,000 km of Turkish river systems were being
diverted into hydraulic structures used for electricity production without sufficient flow being
released to the river bed because of these policies (RHDSN, 2011; Sekercioglu et al., 2011).
This diversion resulted in forest destruction, loss of biodiversity and limited livelihood
opportunities and even displacement of people (IPCC, 2011). Area where the downstream
and upstream part were connected being blocked affecting the river ecosystems, impeding
fish migrations and ultimately the livelihoods of people living along rivers (Sekercioglu et al.,
2011). The private control for accessing river water for almost half of the century raises in
itself an issue of accountability, responsibility, social injustice. States hegemony to redefine
the legitimate water use and access and then favouring the private sector is quite prominent in
this case study. The kind of arbitrary laws and ambiguous EIA processes allowed
construction on reserved and protected areas, urgent expropriation shows the negotiation in
legal rights benefiting the private sector investors. Even legal routes are being created to
facilitate water grabbing. For example: undemocratic and unfair transfer of rights to use the
water of three dams of Mahrashtra (Gangapur dam project, Amba dam project and Upper
Wardha dam project) which was prior assigned for agricultural and irrigational benefits to
farmers. In this case the initial victims were rural people who got displaced and then due to
the sectoral reforms (associated with the privatisation of the electricity sector, the promotion
of Special Economic Zones, and water sector reforms) the very beneficiaries of these projects

that is farmers became the victims. These sectoral reforms are being used as a mechanism to
legalise and legitimise the process of water grabbing.
Unlike land water is exclusive commodity for the rural people as it is difficult to capture,
mobile, reusable, vary with respect to time, space and quality. Controlling access to water can
change political, socio-economic and ecological relations around land and water. Therefore it
becomes vital to look how legal frameworks of using resources are created, negotiated,
contested and ignored at various levels in the decision-making processes. More inclusive
approach to study the interests of people who shares the same resources and whose lives are
dependent on river and their associated ecologies can help to improve the future economic
returns and the environmental and social impacts of proposed projects (Bakker, 1999). One
should analyse if these projects are opportunity or destruction first and then allow them to
continue their projects.
The process of resource grabbing displaces communities, grabbing their lands and resources
associated with the lands. And this not only impacts the resettlers but also the host
communities. Both undergo an acute change in using the resources, from what they were
accustomed in their former areas to what they now have allotted.
Study Objectives and Questions
A. What are the various available resources of water (green and blue)? 1. To determine the various sources through which people get water. 2. To find out the change in the methods to extract water.
B. Access of groundwater to different classes/castes/groups 1. Allocation of water resources and customary laws behind it. 2. Quantity and quality each household is getting. 3. Political, socio-economic and ecological relations around water.
C. Sustainable local strategies to use ground water to fulfill their need 1. Traditional strategies to reduce their water related problems. 2. Other water conservation strategies.
D .Re-allocation of water using norms due to resettlement

1.How the allocation of water has changed over a period due to resettlement( for host and resettler communities)
E. Agricultural transition due to the groundwater availability
1. Change in crops due to availability or agrarian growth. 2. Intensive solutions to maintain irrigation capacities.
Summary and Conclusions
Dug wells (open wells) are a critical source of irrigation and poverty alleviation among
farming households in semi-arid landscapes. This project intends to map the irrigation
potential of existing dug wells and their contribution to agriculture in a water-scarce village
in central India. Dug wells in this village were a part of the rehabilitation package for
conservation refugees from the Kuno WLS, and the project intends to map their current use
and importance in Adivasi livelihoods fifteen years after resettlement. The data generated by
this project is expected to help raise resources to improve water security and increase well-
being for one of the poorest communities of central India.
Amol Padwad

Personal hygiene practices and challenges of the low-income families in East Delhi, India
SUMMER INTERNSHIP REPORT
PRESENTED IN PARTIAL FULFILMENT OF THE
REQUIREMENTS FOR THE DEGREE MASTER OF ARTS IN
THE SCHOOL OF HUMAN ECOLOGY
BY
Suraj Pratap Singh Bhati
S183B0036
MA IN ENVIRONMENT AND DEVELOPMENT
SCHOOL OF HUMAN ECOLOGY
AMBEDKAR UNIVERSITY DELHI (2019)

Contents
1. Introduction 2. Literature review 3. Research objective 4. Research question 5. Methodology 6. Study area 7. Findings & Analysis 8. Conclusion 9. References
Amol Padwad

Acknowledgement
I must take this opportunity to place on record my deep sense of respect and gratitude to Dr.Oinam Hemlata Devi, for her valuable advice, resourceful guidance, active supervision and constant encouragement without which it would not have been possible to give this report such a shape in time. My study was partially funded by Ambedkar University, Delhi.
I also want to express my gratitude towards SEEDS organisation and their volunteers for proper field assistance. I also thankfully acknowledge the assistance received from my key respondents for giving their precious time and by providing valuable information’s.
Last but not the least; I am so grateful to my parents and my friends for their love, understanding and support during my fieldwork and post field work.

Introduction
With the rapid development in the 21st century, limited urban spaces are being crowded and there is a surge of rural to urban migration. Due to this, smaller and smaller localities are holding larger populations. Developing countries are on the receiving end of this with countries like India, Pakistan and Japan having overcrowded capitals. While some countries end up managing this surge in good ways, others are not so fortunate. Delhi, the capital of India is home to such populations. Being the capital and having highest per capita income in the country has its own attraction.
With the rise in population and limited spaces certain problems related to the common demands rise, and are solved on the basis of economic pull of the concerned people. In this study, we try to study one such low-income community based area, and take a look at the problems they face on their daily basis, and its impacts on their lives. on the basis of available infrastructure related to hygiene practices, we try to understand the problems faced by them on a daily basis.
Availability of basic hygiene facilities is one of those impacts. According to the WHO, "Hygiene refers to conditions and practices that help to maintain health and prevent the spread of diseases." To keep up with these practices has its own challenges in these low income households. We are looking at the same in East Delhi, into regions namely Trilokpuri, Chander Vihar, Shastri Nagar, Ganesh Nagar and New Ashok Nagar.
These households were selected on the basis of having a child enrolled in nearest EDMC School, and were preferably below or in 5th standard.
The foundation of health is laid down by the hygiene practices followed by a household. Lack of awareness and resources remains the major cause of spread of diseases. Benefits of personal hygiene are often ignored or lost into the social problems faced by low income communities. Living situations and socio-economic conditions further add to it. To study these practices among school children gives a chance to understand hygiene habits and importance given to the same in any individual’s lifestyle. Further, children have a higher vulnerability to diseases, given their weaker immune systems, and are dependent upon practices followed
by the adults in the family. Thereby, mothers have a deep impact on hygiene practices of their children. At the same time water remains a major issue as well.
According to the World Health Organization’s 2017 report, safe drinking-water is water that "does not represent any significant risk to health over a lifetime of consumption, including different sensitivities that may occur between life stages". Availability of safe water is a major concern in these locations. While supply water is available, there are doubts regarding the health impacts of this water. Thereby, different methods are in practice to get hold of better water availability, ranging from tankers, ground water and packaged bottles. These practices revolve around the economic conditions of these families and locality. The same has been a distant dream in these localities, and schools are no exception.
While environment around the home plays an important role in determining these factors, schools are also important. We tried to analyze the availalbity of toilets in these schools and their condition. Children spend more than 6 hours daily in school, and their habits develop around the same. Availability of soaps and hygienic toilets is a major boost to the health of students. According to the existing literature, the physical condition of such infrastructure has its toll on these practices.
In circumstances of poverty, safe water, hygiene remains matters which are of secondary concern. In the households where “kam chal jata h bhaiya” say all about their living conditions, we cannot totally expect things like hygiene to be primary. Thereby rises the need to study the actual conditions of available resources which can help them in reality. While 6 families share a single toilet, and are subject to queues on a daily basis, merely granting soaps or awareness won’t solve the cause. The need remains of a policy, a chain of actions or at least a ground-based effort to realize what exactly is the problem with the available resources. In terms of school at least, better facilities can be ensured by using the allocated budget for the purpose of bettering the available infrastructure. This study is one such effort to highlight the actual scenario and things apart from merely perceptions about hygiene which play a role in their daily lives.
Research question
What are the problems faced by children of low-income communities in maintain hygiene?
Research objective
1. To highlight the challenges faces by low income families in maintaining personal
hygiene.
(a) To evaluate available hygiene infrastructure and its conditions in households.
(b) To evaluate the availability and conditions of infrastructure in school like toilet
and taps.

Literature Review According to UNICEF with data on Ghana, Hand washing with soap alone could reduce diarrhoea by up 50% and pneumonia by 25%. Thereby, the importance of hand washing is highlighted by many scholars with respective observations and results. Certain authors have tried to find dimensions of the process by looking at it in various ways. For the subject of this paper we look at the broad judgement and argument they offer.
“Clean hands play an important role in preventing infectious disease transmission. The physical quality of any toilet and hand washing facilities is an important determinant of whether and how it is used, especially for school children.”
While it is understood that the availability of hygiene resources would have a direct impact on the frequency and way people are using them. However, Reeves looks into it in a different manner and tries to prove it. According to Reeves, the physical quality of any toilet and hand washing facilities is an important determinant of whether and how it is used, especially for school children. He concludes, “In developed countries, almost all children spend a significant part of their time at school, where provision of toilets and hand washing facilities is the norm. However, the way in which children use the facilities, and in some cases whether they use them at all, can depend on their physical quality; for example, whether they are fully functional and inviting”. To conclude this, reeves goes into consideration of his study based in New Zealand and judges the available infrastructure and how has the same had an impact on practices followed by the children. The case study was carried out in months of winter, to analyze the precluding factor of cold water in washing hands. Reeves argues that merely providing warm water for washing hands would be a big contributor in improving hand hygiene in schools based in colder regions. It comes with the argument that due to reduced funding; the infrastructure cannot be invested upon. According to Reeves, “Children initially learn about personal hygiene at home and in pre-school education settings. Their experiences with school facilities can affect their attitudes and hand hygiene behaviors and their health, and could presumably influence adult hygiene behavior, which is known to be suboptimal”. (Reeves,2012)

Lundblad believes that schools play an important role in shaping hygiene practices of children. The perceptions around school toilets shape the hygiene habits of the students. In his study conducted in the age group of 6 to 16 years, he considers that these habits are developed in school. Actually, be brings out that the irregular toilet habits developing in children is basically due to schools. Similarly, Barnes tries to create a dataset with the help of a questionnaire to determine the conditions of school toilets. His survey basically revolves around questions which determine the standard of the available hygiene infrastructure in the schools, which plays a big role in this study as well. Understanding the abstract of his idea study, “Children generally based their perceptions of school toilets on physical appearance, offensive smell, and feelings of insecurity. Children's perceptions affected their toilet habits and would rather endure physical discomfort than the psychological and social discomfort of using the school toilet. Children already suffering from urinary tract or intestinal problems face particular difficulties without regular toilet visits during the day.” (Lundblad,2005) Quintero in his study, based in Colombia tries to access hand-washing behaviors and understand the barriers in adoption of proper hygiene practices. Scarcity of adequate facilities in most schools in Bogotá prevents children from adopting proper hygienic behaviour and thwarts health promotion efforts. The current renovation program of public schools in Bogotá provides a unique opportunity to meet the challenges of providing a supportive environment for adoption of healthy behaviours. An outbound result presented by his study can be concluded as; “Hand-washing promotion can be incorporated into the school curriculum, and other stakeholders (e.g., soap manufacturers) can be invited to participate in these educational activities. The paramount contextual-level barrier facing this population, however, is the scarcity of adequate facilities for hand washing in most schools. This not only prevents children from adopting proper hygienic behaviour but also thwarts school-based educational and health-promotion efforts. Indeed, many students expressed a lack of coherence between the messages provided by teachers

regarding hygiene and the daily reality of their school environments.”(Quintero,2009) From what Barnes concludes in New Zealand, Schmidt tries to study in Kenya. He comes with the role played by various other factors which are usually ignored, or considered too subjective to study. Media exposure, poverty and infrastructure according to him play a considerable role. Poverty, being one of the biggest reasons, causes the lack of resources and in turn the infrastructure as well. Of what we observed in the field, most of the families seemed to suffer the same. He tries to explore the role of structural constraints such as lack of proper water supply, sanitation facilities, and educational and other socio‐economic factors in limiting the proper adoption of better hygiene facilities. In his study based in Kenya, he tries to identify potential water access, social, economic and behavioural determinants of hand washing. Also, while concluding, Schmidt mentions: “The results underscore that structural constraints can limit hygiene practices in the very disadvantaged sections of a population, thus jeopardizing the potential success of hygiene promotion campaigns in those most at risk of disease. Nevertheless, the strong association of hand washing with media ownership and exposure supports the view that mass media can play a role in hygiene promotion.” (Schmidt, 2009) Yet, unable to bring the local aspect out the studies mentioned above apart from Reeves, could have been more through. Questionnaire process used by Barnes, could not bring out the subjectivity involved in their answers and also, the minute ground based social differences which are better understood with the help of in-depth interviews. However, it acts as good reference point and dataset to understand and conclude for further research in the matter.

Methodology
TYPE METHODS JUSTIFICATION advantages
PRIMARY 1. In-depth interview
In depth interviews were taken in all 30 households, it helped us to understand the situation in more detail. For disease like diarrhoea, which has association with personal and domestic hygiene practices needs to be studied in detail and data can be only extracted if the time spend with respondent in a particular setting is long.
1. In this kind of data where hygiene behaviour is an important factor, in-depth interview is a key tool. It was necessary to build a relation with the family members to extract the data.
2. Interviewers can establish rapport with participants to make them feel more comfortable, which can generate more insightful responses – especially regarding sensitive topics.
3. There is a higher quality of sampling compared to some other data collection methods. In-depth interviews can be full of information and hence it becomes easy to identify highly

valuable findings quickly.
2.
Observation
Observation method includes looking or listening without making it obvious to the respondent, with some specific objectives in the mind. In our study, the variables which need to be studied can be done easily through observation and hence reporting becomes easy.
1. Important method as it gives us information which can be supplemented with the data which is collected by other means.
2. Exact behaviour of the respondent can be observed and hence evaluated and used in the study.
Secondary Existing literature, data from UNICEF, WHO
Data available on prevalence of diarrhoea in children under age of five has been used in the study as background information. It was extracted from UNICEF, WHO Site. Existing literature on diarrhoea has been studied to understand the
Literature has its own importance in the research work. Topic on which research has to be done is often derived from the

overall scenario and to fulfil all the steps of research and report writing
existing literature, and to explain the contrasting outcomes, it is necessary to have proper knowledge of existing literature.
Table 1: Methods used
Study area
East Delhi is bounded by river Yamuna on the west, Ghaziabad from the east and Gautam Buddha Nagar to the south. The study is based upon 5 locations in East Delhi, namely- Trilokpuri, Chander Vihar, Shastri Nagar, Ganesh Nagar and New Ashok Nagar. The area is

heavily populated and home to migrants from rural areas. Most of the households here are on rent, and home to low income communities.
METHOD OF SELECTING STUDY POPULATION:
The houses were already selected by the SEEDS organisation. It was a school
based intervention study undertaken by SEEDS from Delhi govt. East Delhi was
selected as it was one of the districts which have got good number Of MCD
schools and the level of education performance rate were found to be
comparatively less than the other school in different parts of Delhi. Houses have
selected based on school records as part of intervention. Thirty houses were
selected for our study based on the baseline survey carried out in five different
localities of East Delhi, also particularly those households which has got past
experience of diarrhoea and respiratory tract infection.

Data is analysed on SPSS and excel.
Field Insight
For the collection of data, we had selected five locations of east Delhi, namely-
Trilokpuri, New Ashoka Nagar, Chander Vihar, Mandavali, Shastri nagar. Total
population in the studied 30 households is 180 and there is 9 households with
diarrhoea cases. Average household size is 6, and 4 is the average children per
household. Male members of these households are mostly occupied in wage
labour and workers in private company, and female members are mostly in the
house help.
The field area is basically a cluster of rented households, owned by some local.
Most of the respondents are migrants from UP and Bihar. Coming from a rural
background, there have been significant changes in their lifestyles, since arriving
to Delhi. While having informal conversations with these families, certain things
became clear. Apart from merely touching out research objectives, we touched
upon their daily lives and problems. Social problems they base on a daily basis,
revolve around poverty. From standing in queues at the Mohalla Clinics, to being
unable to send money to their families back home on Eid, to not being able to
send their daughters to school due to absence of birth certificates. Among all
these problems, they live their daily lives. An average time table of a family where
both the parents works starts at 6, when they make gol gappas till 11 and then
leave for working as a house-help. The children are left home or at school, until
the mother arrives. In households with housewives, the male member has to
work harder, sometimes more than 10 hours daily to sustain. Yet, on the name of

saving for troubled times, they have nothing. They seem to have accepted this
life, and the only hope they carry is on their children. Most of the families sent
their children for private tuitions under the umbrella of the school they study in.
The level of education in the school was questioned by every family who found
the seriousness in the school, not up to the mark. “Sarkari school hai, kahe ki
padhai” was what we heard from every other household. The issues of hygiene
and safe water become secondary under such problems. With respect to their
religion, both Hindu and Muslim families were on the same scale in the localities.
One prominent feature that we observed was strong religious beliefs towards
washing and bathing from pooja or namaz respectively. There was somewhat
harmonious nature among the people who shared the same 100sq yard floor with
8 households on the same. The conditions around the households tell the story of
rapid urban surge which has led to over population in smaller and smaller regions.
These households have been made for the sole purpose of being rented and act
as income sources. These houses have been made with no respect to safety in
terms of natural disasters, let alone hygiene. With improper ventilation and
supply water, which in itself is a big problem, in regions like New Ashok Nagar
people have to fetch water from tankers around 1km away. Smaller variables like
these are usually ignored in the study and do not form a part of most theses,
however the level of impacts these have is certain unavoidable and cannot be
measured.

Findings & Analysis
There has not been any notable surveys or studies based upon the quality and availability of infrastructure related to hygiene practices in schools and households. While there have been significant efforts to spread awareness and studies upon other problems rising due to lack hygiene, the basic reach to these infrastructures, remains a distant challenge. We have used the following graphs which denote the findings-
Households-
Toilet Availability
Toilets were available on a shared basis in 14 households while 16 had personal toilets. In the basis of shared toilets, they were cleaned by a sweeper on a weekly basis.
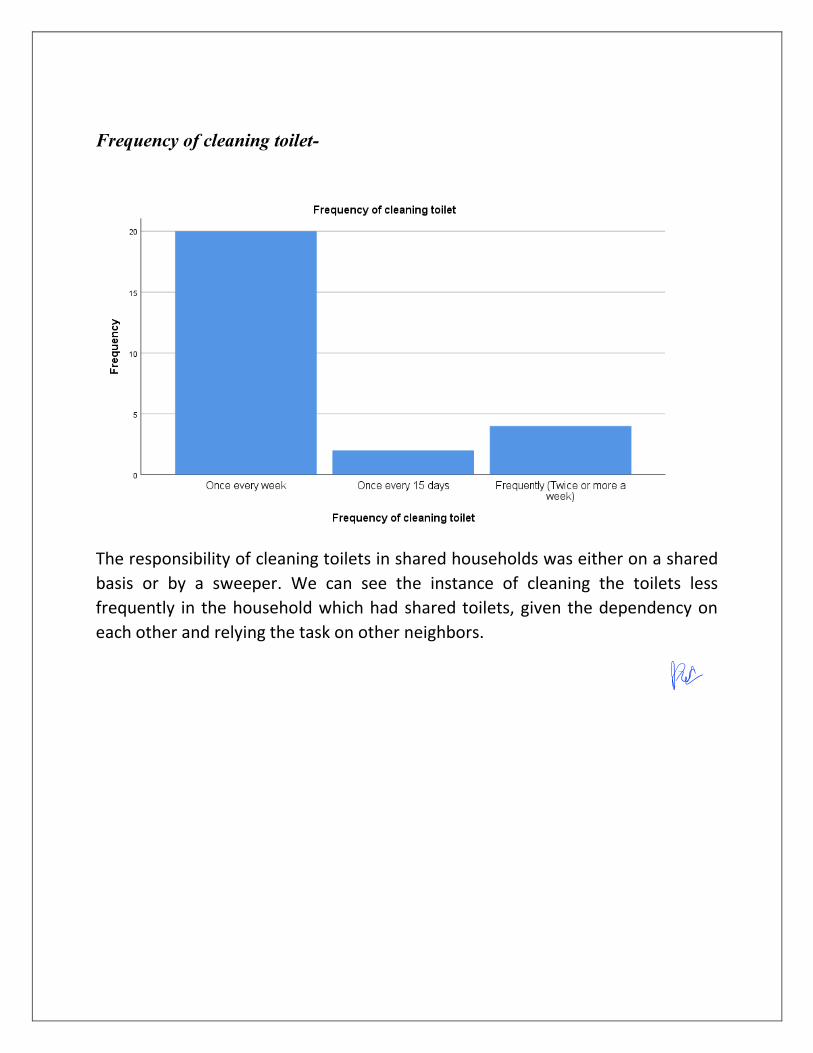
Frequency of cleaning toilet-
The responsibility of cleaning toilets in shared households was either on a shared basis or by a sweeper. We can see the instance of cleaning the toilets less frequently in the household which had shared toilets, given the dependency on each other and relying the task on other neighbors.

Sink for washing utensils-
Sinks were observed first hand, and then questioned about. In the instances where the families did not have any sinks, the balcony or the drain were used for washing utensils. This in itself could cause serious hygiene issues. Also, with no proper place to keep utensils, the instances of bacteria or pathogens are likely to be higher.
Based on our observation, certain households were washing the utensils in open, outside the house or in the corridor between the rental households. With no proper drain system, this was leading to water collecting at certain places, or in some instances flowing in open. Gradually, the 8 households that had wash basins were economically better of the rest and were personal households. Those on rent did not have any such facility available.

Washbasin available-
Washbasins were available in only 9 households. While the method of hand washing was known to the students, there weren’t enough resources for that. In the absence of wash basin, there was a dependency on other members of the family to help while washing their hands. The other way was to use one hand to pour water, which in turn was an improper method considering that it would not be suitable enough to clean the hands properly.

Schools- Condition of toilets.
While asking students about the conditions of toilet certain things came clear. To further emphasize on the conditions, each of schools were used by us first hand. The results were quite contradictory to what students had said. While in regions where students considered the toilet clean enough, on checking the toilets on our own, I found there was foul smell and black stains all around the walls. Visibly, in the area the definition of “clean and hygienic” differs from what we consider as clean. Whatever the case is, the washrooms looked home to diseases. The graph depicts the toilet availability-
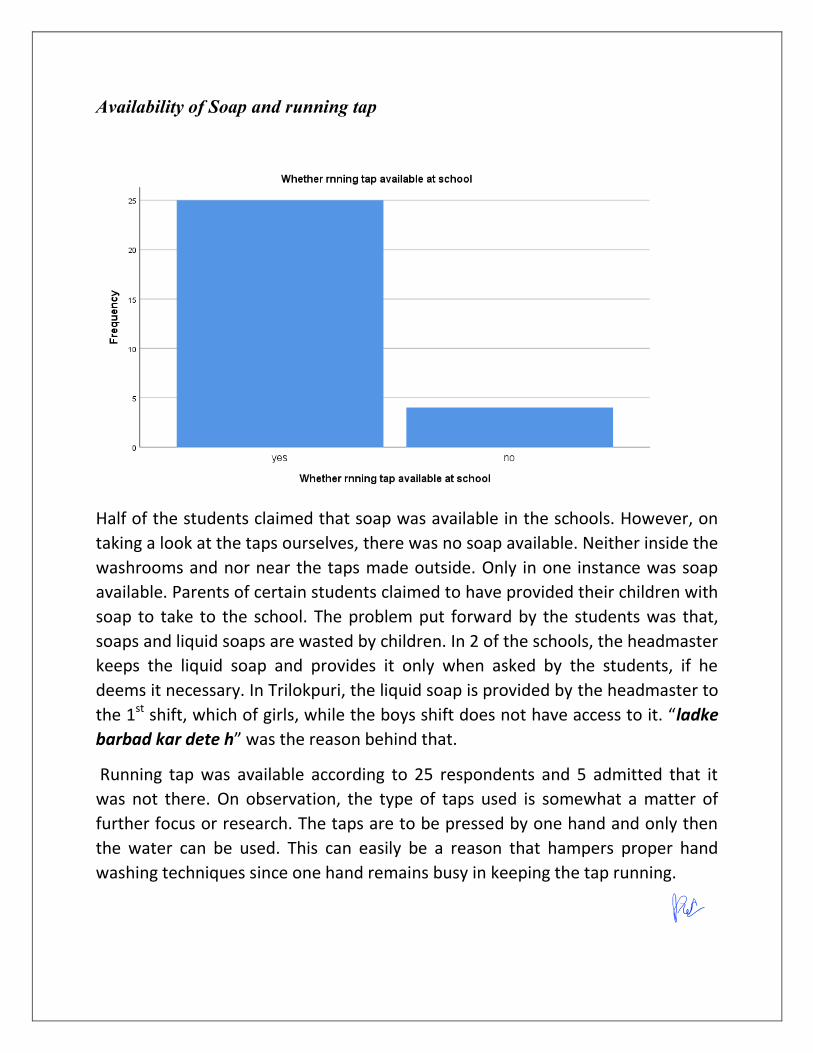
Availability of Soap and running tap
Half of the students claimed that soap was available in the schools. However, on taking a look at the taps ourselves, there was no soap available. Neither inside the washrooms and nor near the taps made outside. Only in one instance was soap available. Parents of certain students claimed to have provided their children with soap to take to the school. The problem put forward by the students was that, soaps and liquid soaps are wasted by children. In 2 of the schools, the headmaster keeps the liquid soap and provides it only when asked by the students, if he deems it necessary. In Trilokpuri, the liquid soap is provided by the headmaster to the 1st shift, which of girls, while the boys shift does not have access to it. “ladke barbad kar dete h” was the reason behind that.
Running tap was available according to 25 respondents and 5 admitted that it was not there. On observation, the type of taps used is somewhat a matter of further focus or research. The taps are to be pressed by one hand and only then the water can be used. This can easily be a reason that hampers proper hand washing techniques since one hand remains busy in keeping the tap running.

Quality of drinking water in school
Based merely upon the answers of the students, and their mothers, the water available in the school for drinking was unsatisfactory. 17 respondents claimed the water to be of poor quality, while 11 considered it satisfactory. Some mothers preferred water sent from home as a better alternative and, had commanded their children not to consume the school water. Looking at the conditions of tanks in the school, most of the seemed difficult to be reached and cleaned. However, it is difficult to comment further on the matter without proper long-time observation.

Quality of Mid-day meals
Though not a part of the research, 25 students along with their mothers, complained about the quality of mid-day-meal. Instances of hairs present in the food were shared, and most mothers preferred giving them homemade food while going to the school as lunch. This can be looked at in future research and could be useful for judging the required changes or interventions in mid-day meal schemes. Although there were differential observations, as some students believed that teachers themselves first taste the food, before providing the same to the students.
The idea of mid-day meal is to provide nutritional food to students from families who cannot afford the same. However, given the perceptions around the same, it needs to be looked into so that the actual purpose of the program could be attained.

Conclusion
Reeves put an argument based upon the condition of the infrastructure deciding the inviting nature of toilets. Basically, the physical condition of toilets decides how often the students are going to use them. In his study, children from New Zealand avoided using toilets which were not in good condition. Accordingly, the children would only use such toilets when extremely necessary or uncontrollable. This goes along with the findings of my study. The physical situation of the hygiene infrastructure in the places we visited could help in explaining the lack of hygiene. The lack of taps, proper sewage system, even smaller number of rooms can play a role in it.
To determine these conditions, we tried to look at the availability of toilets, taps, drinking water, mid-day meals among other things in school. While views of students were taken regarding these infrastructures, one thing became clear. The discourse of cleanliness in these societies is different than we are accustomed to. Gradually, the toilets were declared clean by the students, but first hand inspection told otherwise. What is actually clean and does not have a negative effect on their health is a different matter altogether.
Schools have played an important role in determining the health and hygiene practises of these students. The schools having better toilet facilities like Chander Vihar, had better participation and seemingly more satisfied parents.
Smaller aspects like number of rooms, did highlight certain things. Families having average size of 6, were living in rooms, as small as 8*8 ft, which could explain the impact these small households may have in maintaining privacy.
We can conclude that while efforts have been made by the government to determine better hygiene practises and certain studies have been conducted on its effectiveness, the impacts of psychology of the participants could be studies in a better way. Smaller aspects like the type of tap available, the condition of infrastructure, can play a big role in shaping these practices, which would turn

into habits for these children at the adult age, when it would be difficult to alter. Schools, which have a outline to have one toilet for 20 students, has got 1 for about 100, which while not going with the outline also has its own impacts on students. There have been many intervention programmes regarding the habits and perceptions, which actually has played a positive role.
However, in terms of the physical availability of these infrastructures, a lot more can, and should be done. Government schemes could provide certain small-scale object like wash-basins, sinks, on a subsidised basis to the lower-income groups. Also, rental households could be clutched under a tighter legal regime, so that the conditions can be improved. There were situations where people shared a toilet for 12 households, and lived in unhygienic situations.
Certain instances pointed out smaller variables which played their own role. Religious practices, environment, locality all had their own say in the same. Undoubtedly, this issue of grave concern can only be looked at from various angles to come to a proper outcome. Judging on the basis of perception or awareness is merely a part of it.
Such people cannot merely be helped by programmes based on habits and perceptions. To have the opportunity they need the resources which are yet, not in their grasp. At the end it all related to what “Naniji” from a household quoted, “garib ka kya zindgi h beta,kon puchta h hamka”.

References 1) Barnes, P. M., & Maddocks, A. (2002). Standards in school toilets–a questionnaire survey. Journal of Public Health, 24(2), 85-87.
2) Lopez-Quintero, C., Freeman, P., & Neumark, Y. (2009). Hand washing among school children in Bogota, Colombia. American Journal of Public Health, 99(1), 94-101.
3) Lundblad, B., & Hellström, A. L. (2005). Perceptions of school toilets as a cause for irregular toilet habits among schoolchildren aged 6 to 16 years. Journal of School Health, 75(4), 125-128.
4) Reeves, L. M., Priest, P. C., & Poore, M. R. (2012). School toilets: facilitating hand hygiene? A review of primary school hygiene facilities in a developed country. Journal of public health, 34(4), 483-488.
5) Schmidt, W. P., Aunger, R., Coombes, Y., Maina, P. M., Matiko, C. N., Biran, A., & Curtis, V. (2009). Determinants of handwashing practices in Kenya: the role of media exposure, poverty and infrastructure. Tropical Medicine & International Health, 14(12), 1534-1541.
Amol Padwad
Children‘s attitude towards the environment: A study in
East Delhi
INTERNSHIP REPORT SUBMITTED TO
AMBEDKAR UNIVERSITY, DELHI
SCHOOL OF HUMAN ECOLOGY
M.A. ENVIRONMENT & DEVELOPMENT
2019
BY - APOORVA TYAGI
S183B0007
SUPERVISOR – DR. OINAM HEMLATA DEVI
Amol Padwad
ACKNOWLEDGEMENTS
I must take this opportunity to place on record my deep sense of respect and gratitude to
Dr.Oinam Hemlata Devi, for her valuable advice, resourceful guidance, active supervision and
constant encouragement without which it would not have been possible to give this report such
a shape in time. My study was partially funded by Ambedkar University, Delhi.
I also want to express my gratitude towards Mr. Naveen Shukla, the Programme Manager of
SEEDS for helping us throughout the internship.
I would like to thank Dr. Urfat Anjum Mir, school of liberal studies for his valuable
suggestions.
I also thank all the SEEDS members and volunteers for helping us at different locations
without their support it was not possible to fulfil my internship.
I also thankfully acknowledge the assistance received from my key respondents and their
parents for giving their precious time and by providing valuable information’s.
Last but not the least; I am so grateful to my parents and my friends for their love,
understanding and support during my fieldwork and post field work.

CONTENT
1. Introduction
2. Significance of the study
3. Research question and objectives
4. Study area
5. Study population
6. Methodology
7. Findings and discussion
8. Limitations
9. Conclusion
10. Bibliography

Children’s attitude towards the environment
Introduction:
From the past two decades there has been significant rise in the environmental problems such as pollution, global warming, biodiversity loss, ozone depletion, etc. It is believed that human actions and attitude towards the environment played a vital role in the creation of these problems. With the increase in concern about the environment, there has been a significant growth in demand of promoting environmental learning among the children and teaching them at a very young age to preserve their environment. Schools and colleges had included environment in their curriculum. But there have been debates about the extent of learning and aim of environmental teaching. Moyer (1975) stated that ‘cognitive understanding does not automatically lead to strong attitudes about the issues.’ Making environmental learning mandatory will solely not solve these issues. As there is no universal definition of nature as each and every individual has its own perception and level of concern for nature.
According to Stern and Dietz (1994), there are three different value orientation spheres of concern- egoistic, social- altruistic and biospheric. In egoistic concern is limited to self and value orientation is limited to individual. The person who holds egoistic value orientation has concern about environment only because he/she is directly being affected by the environmental issues. In social-altruistic concern is there for other people. People who hold social-altruistic value orientation are concerned about the environmental problems due to its impact on other human beings. Lastly, individuals who hold biospheric value orientation have concern for all the living things which includes plants and animals. The individual has concern for environmental issues because of its adverse impact on not only humans but plants and animals alike.
This value orientation of people influences their perception and attitude towards the nature and it is most likely to have an impact on their children. It is possible for two individuals to have concern for environment but for two entirely different reasons. (Schultz and Zelezny 1999) Socialization process (upbringing) of a child in a culture/society influences their ideas and knowledge about the nature. The cultural and religious beliefs of the family influences children’s knowledge and ideology. The beliefs and attitudes vary according to different cultures. The parents with more environmental friendly approach will have children following the same approach. (Ahmed,deCamprieu & Hope , 1981 )
Schools on the other hand also play a vital role in shaping personalities and ideologies of children. The rationale of promoting environmental education at early childhood level is based

on two premises. First, children’s learning and experience with nature at an early age enhances their learning ability and promotes value formation at a very young age. Secondly, early childhood years are very critical in shaping attitude towards nature and environment. The attitude and learning developed in early childhood years has a lifelong impact on children. (Wilson, 1996).
There has been significant researches on the attitude of children towards the nature and it is believed that natural environment of the children is directly associated with child’s wellbeing and helps in shaping their personalities. Many studies suggest that disconnecting children from nature poses threat not only to their health but to the society. (Aaron&Witt, 2011)
It is noted that the children’s access to natural green spaces has been diminishing significantly in the post industrialization urban society. (Faber Taylor and Kuo 2006) The rate of urbanization from the last decade is highest among the history. Currently 55 % of the world population resides in urban area (UN Report, 2018). The rate of urbanization is quite high in India too with 31.16% population residing in urban area (Census of India, 2011). According to World Bank report, 2017 the number increased to 34 %.
Due to rapid urbanization in India, people are moving from rural areas towards the cities like Delhi for jobs, education ,better infrastructure ,etc. which resulted in removal of children from natural environment and confining them to congested urban spaces. As there is rapid urbanization, the pressure on urban areas is increasing. Lack of housing space is resulting in congestion in low income group localities and diminishing green spaces. With the urban planning failures people’s access to green spaces has been limited to parks which were also not maintained properly. The idea and definition of environment of children of low income communities has changed over time. Now children’s knowledge of the environment is limited to their surroundings and school teachings. Their encounter with nature has been limited to parks, school grounds and their native village. These children are more prone to risks associated with environmental issues. Their knowledge of the environment is rather bookish than being practical. This lack of encounter with nature influences their behavior towards the nature and environment was seen as an object rather than a relational connection. This study examines the level of level of knowledge about nature and environment and how nature is perceived by the children of primary school from low income group communities and what are the various factors that influence their behavior and attitude towards nature.
Significance of the study:
Environmental learning among children is promoted for developing environmental awareness and sensitivity. Many educators and research scholars repeatedly point out the promotion of

environmental learning to solve environmental crisis and that it should be included in education systems. Many countries including India added environmental education in its education system at both school and university level. National Policy of Education, 1986 (modified in 1992), in which 'Protection of the Environment' is stated as a common core around which a National Curriculum Framework (NCF), 2005.
Many studies has been found that deals with children’s perception and level of knowledge but most of the studies deals with secondary or senior secondary school children. Level of knowledge and attitude of children at primary level has not been studied properly yet. This study will help in finding the contribution of schools as well as others factors that influences children’s idea and behavior towards the environment.
Research questions:
1. What is the level of knowledge among primary school children about the environment?
2. How environment is perceived by children?
Research objectives:
1. To assess the level of knowledge and attitude of Government school children towards the environment.
2. To identify various factors that influences children’s perception of the environment?
3. To understand whether there is any significant relationship between the sources and their attitude towards environment.
Study area:
The District of East, Delhi also known as Trans-Yamuna area is an administrative district of Delhi NCR. It is bounded by the Yamuna river on the west, North East Delhi to the north, Ghaziabad District of UP to the east, and Noida city of Gautam Buddha Nagar District of UP to the south.
The administration of East Delhi is divided into three subdivisions: Gandhi Nagar, Preet Vihar, and Vivek Vihar.
East Delhi has a population of 1,709,346. It occupies the sixth position as it shares 10.2 % of population of the State. The district occupies the fifth place in terms of area as it shares 4.2 per cent of the total area of the State. The district has a population density of 27,132 inhabitants per square kilometre. Population growth rate from 2001-2011 is 16.8%. East Delhi has a sex
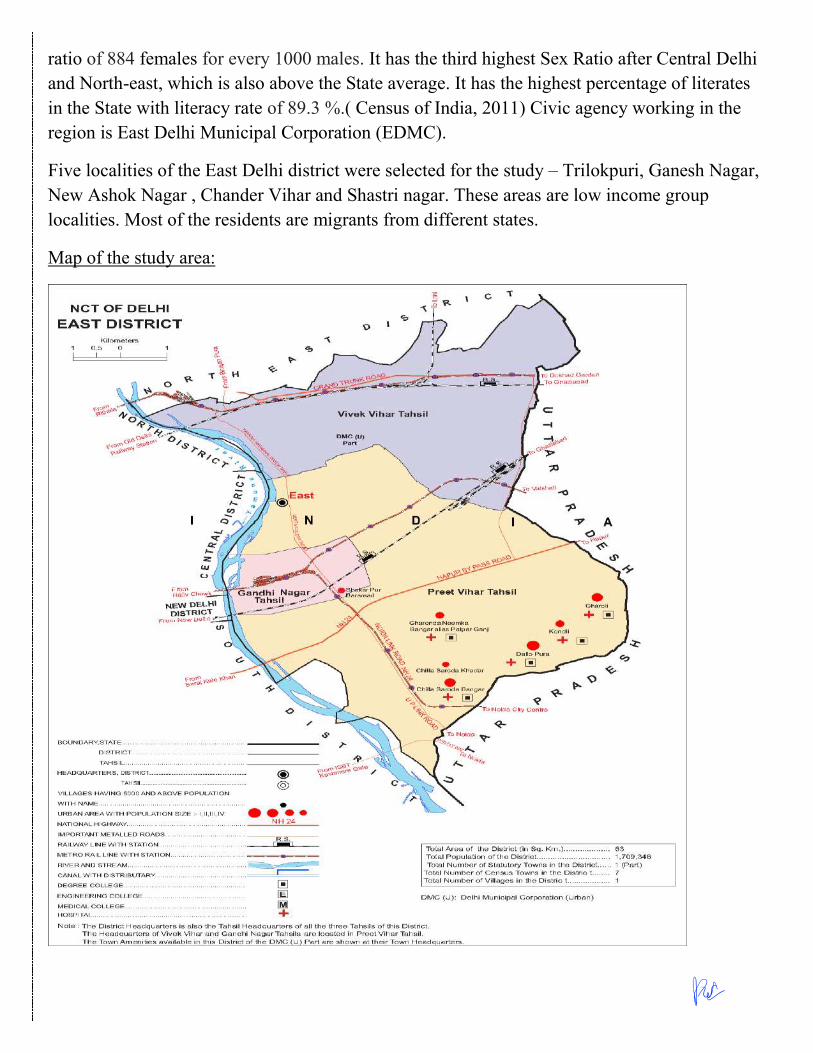
ratio of 884 females for every 1000 males. It has the third highest Sex Ratio after Central Delhi and North-east, which is also above the State average. It has the highest percentage of literates in the State with literacy rate of 89.3 %.( Census of India, 2011) Civic agency working in the region is East Delhi Municipal Corporation (EDMC).
Five localities of the East Delhi district were selected for the study – Trilokpuri, Ganesh Nagar, New Ashok Nagar , Chander Vihar and Shastri nagar. These areas are low income group localities. Most of the residents are migrants from different states.
Map of the study area:

Study population:
Children of the age group of 7- 13 of EDMC primary schools of East Delhi were selected for the study. Students from 2nd to 5th class were randomly selected for the study. The children are from low income group households and were migrants from any state of India. The study was conducted in order to understand the level of knowledge about the environment among government school children and their common understanding of the environment.
Methodology:
The study was conducted in order to understand the level of knowledge of children about environment and how it is perceived by them. What are the common sources of their knowledge and how these factors and sources influences their behavior towards the environment? The methodological approach of the study was qualitative approach. Qualitative research generates non numerical, textual data and promotes in-depth exploration.
Two research methods had been used in the study- structured and visual.
1. Structured- Survey, personal interview and collecting data was done under structured research.
2. Visual- observation of the locality and analysis of children’s drawing was done in visual research.
Total 30 children from all five localities were randomly selected for survey and interviewed with the help of SEEDS volunteers. Total 31 drawings were collected from children for visual analysis.
Following research techniques were used for data collection and data analysis:
� Observation: Schools and houses of the children were visited and level of observed green spaces, pots and gardens were noted. Nearest park was also visited in order to understand the availability of green spaces. Various games like ‘chidiya udd’ were also played with children in order to understand their knowledge and attitude towards animals. Identification games of different trees and animals were also played with children.
� Semi structured interview: Semi structured interview was conducted. Structured questions were asked but more open ended questions were asked from the children in order to acquire quality data. Structured questionnaire is formed based on NCERT textbooks to get information about the knowledge, beliefs, attitudes and practices. Questionnaire was formed around three themes: personal information, level of environmental knowledge and awareness and lastly source of the knowledge. The

questions were framed to understand level of knowledge, general cultural beliefs, behavioral pattern that influences the attitude towards the environment and identifying sources of the knowledge and attitude towards nature.Enquiries were diverted from structural format of questions to avoid biased answers by children in presence of their friends and family members. Open ended and situational questions were also asked according to the physical setting of the place of interview.
� Analyzing children’s drawing: Children who were not comfortable in talking much were asked to draw their idea about nature and what are the things that they believe is part of the environment. Their relationship attitude and understanding of nature was analyzed through their drawings. Analysis of the drawing is done on the basis of interpretation in book by Joseph H. Di Leo, ‘Interpreting children's drawings’ (1983) and Psychological tools used by Masoumeh Farokhi & Masoud Hashemi(2011) to interpret individual personality and behavioural patterns of the children.
Findings and discussion:
1. Level of knowledge :
Awareness level
All the kids were aware at least about deforestation and pollution, which includes both air and water pollution and explained the various factors such as industries, crackers as a major source of air pollution and waste dumping in rivers as a source of water pollution. Increase in human settlement and hunting activities are believed to be factors responsible for cutting down of trees
0
5
10
15
20
25
30
35
Deforestation Pollution(Airand water)
Biodiversityloss
Plastic waste Climatechange
Globalwarming
Soildegradation
No.
of s
tude
nts
Environmental issues
Awareness about environmental issues

and forests. Very few (about 53%) talked about plastic waste in oceans and rivers apart from pollution. 40% of the children were aware about biodiversity loss as well and talked about the importance of conservation of wild animals. They mentioned the need of conservation of animals in order to maintain ecosystem and the loss of habitat of wild animals will result in movement of wild animals from forests to settlement which will pose threat to human life. About 23 % of the students were aware about global warming. The various causes such as burning of garbage, carbon emission from vehicles and industries and deforestation is considered as major factors responsible for global warming. Only 2 children were aware about climate change but stated only deforestation as a factor of climate change. Only 1 kid talked about soil degradation apart from pollution and deforestation.
As all the kids talked about environmental issues all of them believed that human activities are responsible for the creation of environmental issues and our actions towards the nature influences environment. Upon asking whether they support cutting down of trees or not, all the kids answered that they do not support cutting down of trees as we get many benefits from trees such as oxygen. Apart from oxygen kids also talked about other benefits such as food, medicine and wood that we obtain from trees.
The role of teachers and family income played a vital role in children’s knowledge about the issues. The children who were taking tuitions apart from attending classes are found to be more aware about the issues. Children with elder siblings were aware about few issues apart from pollution and deforestation.
Awareness about recycling
Frequency Percentage Yes 3 10 No 2 7 Partially 25 83 Total 30 100
About 83% of children were partially aware about recycling. By partial awareness here means that they practice recycling of plastic bags and many items at home but were not aware about the term ‘recycling’. 10% of the kids were aware about the term recycling and 7% of the children were not aware about recycling and also do not practice it.
Common daily items which were recycled by children were polythene bags, broken toys, used toys of elder sibling, plastic cold drink bottles, food packaging boxes and old newspapers. Few kids (mostly girls) used old CDs and wedding cards to make decorative items. Kids were

recycling household items without really understanding its environmental benefits. The influence of family members and economic status played a major role in it. As the resources are limited for them they try to obtain maximum benefit from any item for which they paid for.
Green and blue dustbin
Frequency Percentage Aware 10 33 Not aware 8 27 Partial knowledge 12 40 Total 30 100
All the school we visited for the study had green and blue dustbin installed. Very few children were aware about the difference of green and blue dustbins and about dry and wet waste. Only 10 students answered correctly about what kind of garbage goes in which type of dustbin. 12 students had partial knowledge about the two dustbins, they were ware which item goes in which dustbin but the reason behind the separation of two kinds of waste was not known to them. They were throwing food items and peels in green one only because their teachers instructed them to do so. They were also not aware about the term dry and wet waste. 8 students were not at all aware about the difference between green and blue dustbins and what dry and wet waste is. They use those dustbins as normal dustbins and do not separate the garbage.
Factors of pollution in Delhi
0
10
20
30
40
50
60
70
80
90
Industries Crackers Vehicles Agriculture
Factors responsible for smog in Delhi
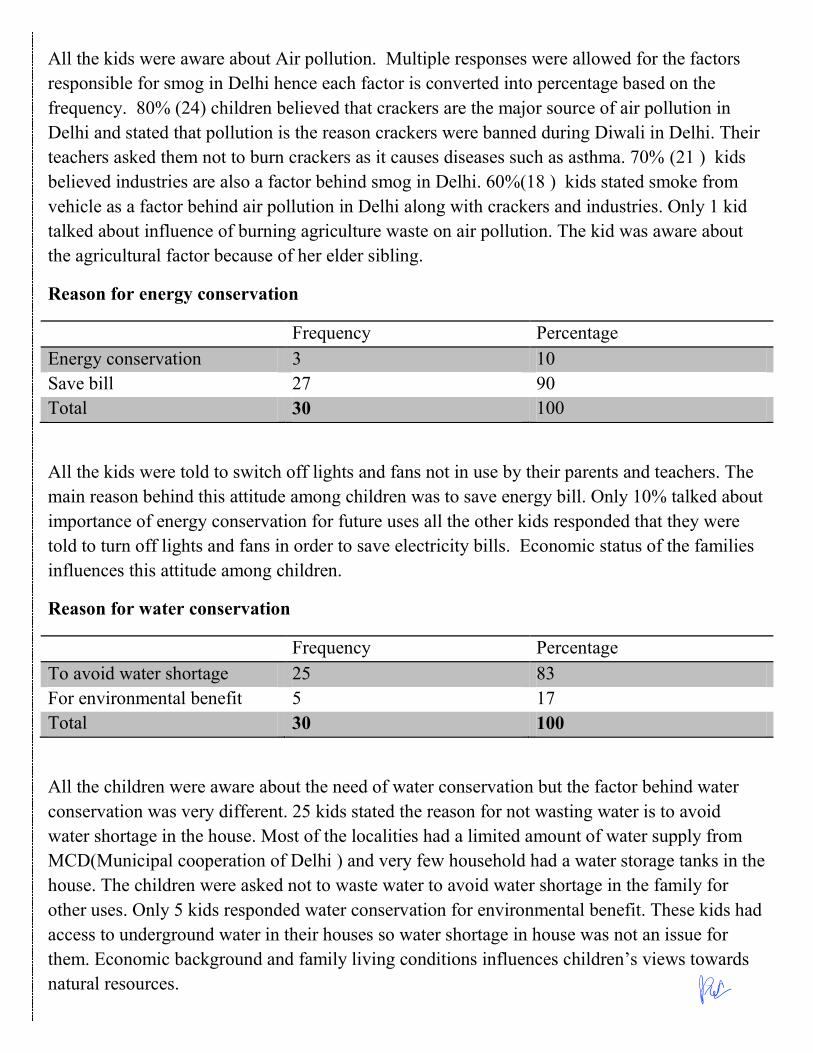
All the kids were aware about Air pollution. Multiple responses were allowed for the factors responsible for smog in Delhi hence each factor is converted into percentage based on the frequency. 80% (24) children believed that crackers are the major source of air pollution in Delhi and stated that pollution is the reason crackers were banned during Diwali in Delhi. Their teachers asked them not to burn crackers as it causes diseases such as asthma. 70% (21 ) kids believed industries are also a factor behind smog in Delhi. 60%(18 ) kids stated smoke from vehicle as a factor behind air pollution in Delhi along with crackers and industries. Only 1 kid talked about influence of burning agriculture waste on air pollution. The kid was aware about the agricultural factor because of her elder sibling.
Reason for energy conservation
Frequency Percentage Energy conservation 3 10 Save bill 27 90 Total 30 100
All the kids were told to switch off lights and fans not in use by their parents and teachers. The main reason behind this attitude among children was to save energy bill. Only 10% talked about importance of energy conservation for future uses all the other kids responded that they were told to turn off lights and fans in order to save electricity bills. Economic status of the families influences this attitude among children.
Reason for water conservation
Frequency Percentage To avoid water shortage 25 83 For environmental benefit 5 17 Total 30 100
All the children were aware about the need of water conservation but the factor behind water conservation was very different. 25 kids stated the reason for not wasting water is to avoid water shortage in the house. Most of the localities had a limited amount of water supply from MCD(Municipal cooperation of Delhi ) and very few household had a water storage tanks in the house. The children were asked not to waste water to avoid water shortage in the family for other uses. Only 5 kids responded water conservation for environmental benefit. These kids had access to underground water in their houses so water shortage in house was not an issue for them. Economic background and family living conditions influences children’s views towards natural resources.
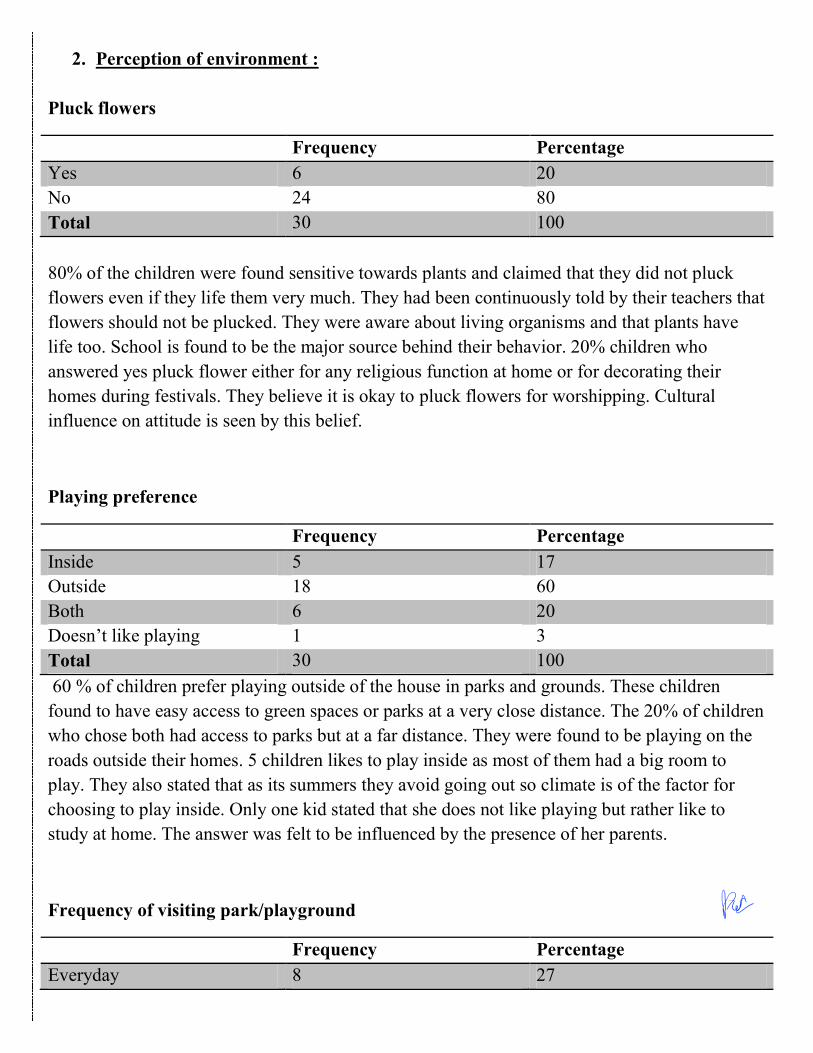
2. Perception of environment :
Pluck flowers
Frequency Percentage Yes 6 20 No 24 80 Total 30 100
80% of the children were found sensitive towards plants and claimed that they did not pluck flowers even if they life them very much. They had been continuously told by their teachers that flowers should not be plucked. They were aware about living organisms and that plants have life too. School is found to be the major source behind their behavior. 20% children who answered yes pluck flower either for any religious function at home or for decorating their homes during festivals. They believe it is okay to pluck flowers for worshipping. Cultural influence on attitude is seen by this belief.
Playing preference
Frequency Percentage Inside 5 17 Outside 18 60 Both 6 20 Doesn’t like playing 1 3 Total 30 100 60 % of children prefer playing outside of the house in parks and grounds. These children found to have easy access to green spaces or parks at a very close distance. The 20% of children who chose both had access to parks but at a far distance. They were found to be playing on the roads outside their homes. 5 children likes to play inside as most of them had a big room to play. They also stated that as its summers they avoid going out so climate is of the factor for choosing to play inside. Only one kid stated that she does not like playing but rather like to study at home. The answer was felt to be influenced by the presence of her parents.
Frequency of visiting park/playground
Frequency Percentage Everyday 8 27

Few times a week 11 36 Once a week 5 17 During vacations 3 10 Don’t visit 3 10 Total 30 100 Very few numbers of kids used to visit parks every day. Most of them were boys as they visit parks and grounds in the evening. The parks which were situated a far distance is visited by children few times a week but not every day. Few children mostly girls visit parks once a week with their parents usually on Sundays. Few children visit parks only during vacations as they had to attend tuitions during school days. Few children do no visit parks at all either because they are not allowed or because they don’t like playing outside. Girls from Muslim families were not allowed to visit parks much as old boys plays there. Family beleifs and distance from the house influences frequency of visiting parks of children.
Common activities in parks / school garden
Activities Frequency Percentage Playing with friends 17 56 Jogging 2 7 Swings 9 30 Nothing 2 7 Total 30 100
About 56% of children are engaged in games in parks with friends. Children are found to be playing games which include a large number of kids. The sense of inclusiveness of everybody is found in children. 30% of children likes to visit parks for swings and other park facilities. Only 2 children like to visit park for running and jogging. Children’s friend circle influences their activities in parks. Children with more friends found to be engaged in games whereas children with few friends visit park for swings and children with very less number of friends were involved in running and jogging.

Idea of wild animals
70% of the children found wild animals dangerous but believed that they should not be killed. 30% of children found wild animals beautiful. They had or wanted to visit zoo for wild animals. The social construct of wild animals in stories and cartoons had influenced views of the children. Children who found wild animals dangerous did not supported killing of wild animals. The view that wild animals are equally important has been found among children. School teaching is the major factor behind this attitude.
Idea of forests
Views Frequency Beautiful 2 Dangerous 21 Both 7 Total 30
Almost 90% of the children were never seen a real forest but seen forest in movies and cartoons. 21 children found forest dangerous. Forest according to them includes trees and wild animals. Only 2 children found forest beautiful. The views regarding the forests have been influenced by stories and their understanding of the forest through teachers and family.
Common birds and animals known: Most of the children were aware about lion, elephant,fox,tiger,snakes,etc as wild animals. Dogs, cats, squirrel, rats are common animals they see around them. Crows, pigeons, peacock, sparrow are the common bird’s species known to them. This shows their idea of inclusiveness of all the animals in the environment.
01020304050607080
Beautiful Dangerous
% o
f chi
ldre
n
View
Idea of wild animals

Idea of the environment:
55% of children look at nature as something which is in need of our protection and believes that it is our duty to conserve and protect. There is no relational behavior towards the environment, environmental protection is a task given by teachers and their family members. As environmental risks pose threat to human life the protection of nature is important by them. On the other hand 40% of children look at environment as a friend. They enjoy playing outside with trees and animals. They believe to have relationship with the environment as nature provides them freedom and various opportunities to play with. Children enjoy their contact with nature and it helps in influencing their personalities and behavior. Accessibility to green spaces had led to this behavior of children. 5% of children looked at environment as an object which is just part of their syllabus which needed to be studied. The lack of contact with nature is the reason behind this attitude.
Sensitivity towards animals
Frequency Percentage Very sensitive 3 10 Sensitive 16 53 Neutral 6 20 Less sensitive 3 10 Not sensitive 2 7 Total 30 100
40%
55%
5%
Idea of environment
Friend
Something that needsprotection
Object

53% of children were found sensitive towards animals. Five scales were calculated on the basis of situational questions asked from children and reason of their answer was asked. Questions included whether they help injured bird, do they like animals, etc were asked and their level of sensitivity was analyzed. Sensitivity towards animals was influenced by child’s own nature, influence of religion and culture and school teachings.
3. Factors responsible for children’s attitude towards the environment.
Family income
The study area belonged to low income group communities. Most of the workers were in private jobs or work as street vendor. Both the parents of most of the kids were working. There were very few children without working mother. Fathers were mostly employed in private jobs or were working as street vendors. Mothers usually found working as household help. Education level among people was not so bad. Primary level education was completed by all of them. Few families had graduate male members. Education level of the family and economic conditions of the families influences children’s perception about the environment. Children from lower income group communities are found to more aware about sustainable uses of resources. The parents’ attitude towards the environment shapes their ideas of environment. Families with income above 20 thousand were living in a better condition than families earning less than 10 thousand. Children from households earning more than 25 thousand are also found to be taking tuitions which helped in enhancing their level of knowledge. The living conditions of the family also influenced children’s playing preferences and frequency of visiting parks. Children of small congested rooms were found to be spending more time outside of the home in parks and grounds rather than staying inside. With direct contact of the nature they found to be more connected with the nature.
02468
101214
5-10thousand
10-15thousand
15-20thousand
20-25thousand
25- 30thousand
Monthly family income
No. of families

Migrants
Name of the state Number of children Bihar 8 UP 17 Jharkhand 2 Punjab 1 Orissa 1 West Bengal 1 All the respondents were migrants from different states. Maximum number of children belongs to UP and Bihar. Migrant children usually visit their native village during vacation, which allows them to have accessibility to green spaces. Migrant children preferred village more than Delhi to live due to various reasons like, village has more open space and more pollution. About 81% of children believed that village is a better place to live. Some children stated that there is less pollution in village. The children stated that they get more freedom in village; there were fewer restrictions in village. 19% of kids who preferred Delhi over village have more friends in Delhi. They stated that they like visiting villages but will live in Delhi. Rural areas has more freedom and less security issues hence there are fewer restrictions upon children in rural areas on the other hand urban areas has higher crime rates resulting in restrictions upon children. Children’s correlation of nature with freedom influences their attitudes towards the environment and children develop emotional connection with nature which influences their sensitivity towards the environment.
Ownership of the house:
All the respondents were migrants and from low income group communities. Most of the children live in rented houses. The family of 4-5 members were living in one room and there was not enough space for any pot or garden. Even the people who owed the houses owe one room set only. There were no balconies or accessibility to terrace in most of the houses. Very few houses which had accessibility to terrace had small garden or pots at home. Most of the households had only tulsi plant which shows the religious influence on parents and kids. Tulsi was preferred to be planted in houses due to its religious significance. Muslim household did not have any garden or pots at home due to large family size.
Green spaces in school playground
School name Playground EDMC, SECTOR-7 , TRILOKPURI Partially green
EDMC, GANESH NAGAR Partially green

EDMC, NEW ASHOK NAGAR Cemented
EDMC,SHASTRI NAGAR Partially green EDMC, CHANDER VIHAR Green Green spaces in school playground influences children’s attitude towards the environment. Schools play a major role in forming children’s ideologies and ideas. Children of EDMC school , Chander Vihar are found to be more sensitive towards plants and animals, they were more aware about different types of plant species. The children of EDMC school , new ashok nagar lacks green playground. The children were found be less sensitive towards plants and animals. Children from partially green playgrounds were also found sensitive towards the nature. Lack of proper green space influences children’s ability to connect with nature.
Plantation drive/planted any tree: 18 children are found to be planted any plant or participated in plantation drive. Children who had planted any tree found to be developed bond with the plant planted by them. The children who planted any plant at their home take care of that plant more than other plants. Whereas, in school it was found that teachers take care of the plants and trees. Emotional bond of children and plants plays a major role in determining their attitude towards the nature.
Contribution of various sources in environmental learning
Impact of each source of environmental learning was calculated individually. Schools and teachers are found to influence all the children’s understanding and perception of the nature.
Various school activities that influences children environmental learning were :
100
30 40 40
10 0
20
40
60
80
100
120
School Parents Grandparents siblings friends
% of contribution of sources in environmental learning

Cultural activities in school – 54% of children had seen or participated in cultural activities related to environment in school. Plays and skits on conservation of water and forest was found common among all. 46 % of children haven’t seen or participated in any cultural activity related to environment.
Workshops in school – 60% of the children haven’t attended any workshop or intervention programs for environmental learning. Only 40% of the children had attended any workshop organized by their school to promote environmental awareness among children.
Charts/projects: only 33 % had made charts or project related to environment in schools.
Influence of teachers and initiative of the school in order to promote environmental awareness among school children is high. Teachers with concern value orientations towards the environment had influenced children’s environmental value orientations. More children from school which had organized workshops and plays are found to be sensitive towards the environment as compared to children from schools where intervention methods are not been taken.
Parents – Parents influenced environmental learning and attitudes towards the nature culturally. Upbringing of the child and parent’s own views of the environment are found to be influencing factors behind children’s behavior and attitude.
Grandparents – grandparents teaching about the religious significance of the animals and trees and stories told by them had influenced children’s views about natural environment. As all of the children are migrants the stories about village, forest and wild animals helps in shaping children’s ideas of the nature.
Siblings – children who had elder siblings elder with high sensitivity towards the environment had influence on them through their by teaching them and by learning about various things they learnt. Children who had younger siblings had learnt caring and sharing at a very young age. This influenced their positive attitude towards the nature as well.
Friends: Friends from private schools also influences children’s understanding and knowledge of the environment. As it was found private schools were more active in promoting environmental awareness among the children. These children from private school directly or indirectly share their learning with the children from government school and helps in enhancing children’s knowledge towards the environment.
Cultural influence: 24 children had full or partial influence of their culture on their attitude towards the nature. Moral teachings of the family, food habits, norms and customs of the family and kind of stories taught in stories were seen to find out the influence of culture on children.

Religious influence: 22 children are found to have religious influence on their behavior and attitude towards plants and animals. Religious practices in the family, portraits of gods in home and religious teachings are the influencing factors of children’s attitude.
ANALYSIS OF CHILDREN’S DRAWINGS :
Children were asked to draw their idea of environment and what is their understanding of the word ‘environment’. Following analysis can be made from children’s drawing based on analysis by Farokhi & Hashemi(2011):
Almost all the children first drew trees before drawing anything else which shows their belief of trees as a major element of the nature.
Very few children included animals and human beings as a part of environment. It is also possible that this was influenced by their drawing skills.
Most of the children drew natural landscape or any poster related to environmental awareness which they had drawn before in school which shows influence of schools even upon their idea of the environment.
Many students had drawn a house/hut along with trees and animals which depicts the coexistence of nature with human being in children’s mind. Children who drew just houses

along with mountain, sun, trees, flowers and rivers has comparatively low intellectual level from the kids who tried creating a more creative and different sketch of nature.
Nature is found to be a very happy and peaceful place according to the drawings of the children. This shows children association of freedom and peace with nature.
Discussion:
x Children’s social construct has been influenced by school majorly. x Gender did not play any major role in influencing their attitude towards the environment. x Children with higher anthropocentric attitudes found to have positive attitude towards the
environment. Anthropocentric attitudes mean that the person believes that we should save the environment because of the benefits we get from it.
x Children’s attitude and knowledge towards the environment varies with the level of environmental teachings in schools. The schools with higher level of environmental awareness found to have children with higher level of positive attitude towards the environment.
x Socio- cultural factors played a major role in influencing children’s attitude towards the environment but not their knowledge. Schools played a major role in influencing children’s knowledge towards the environment.
Limitations:
1. Sample size is very small. 2. Baseline data and selection of houses were based on survey by SEEDS organization. 3. My own understanding of environment might have influenced the study. 4. Few answers of children were felt to be influenced by the presence of their parents or
their friends.
Conclusion:
Environmental learning among school should be promoted in order to spread awareness among children. Government’s goals set for children in order to teach environment with subjects are not being fulfilled properly. Primary government school children’s knowledge is found to be significantly low as compared to private school children. More intervention programs should be promoted in schools and children at a very young should be involved with green spaces in order to influence young children’s mind towards a positive attitude towards the nature.

Bibliography:
Chu, H., et.al. 2007. Korean year 3 children’s environmental literacy: A prerequisite for a Korean environmental curriculum. International Journal of Science Education 29: 731–46.
Flynn, J., Slovic, P. and Mertz, C.K. 1994. Gender, race, and perception of environmental health risks. Risk Analysis 14: 1101–8.
Huang, H., and Yore, L.. 2003. A comparative study of Canadian and Taiwanese grade 5 children’s environmental behaviors, attitudes, concerns, emotional dispositions, and knowledge. International Journal of Science and Mathematics Education 1: 419–48.
Riechard, D.E., and Peterson, S.J. . 1998. Perception of environmental risk related to gender, community socioeconomic setting, age, and locus of control. The Journal of Environmental Education 30: 11–9
Schahn, J., and E. Holzer. 1990. Studies of individual environmental concern: The role knowledge, gender, and background variables. Environment and Behavior 22: 767–86.
Stern, P.C., and T. Dietz. 1994. The value basis of environmental concern. Journal of Social Issues 50: 65–84.
Loughland,T.et.al.(2003) Factors Influencing Young People's Conceptions of Environment, Environmental Education Research, 9:1, 3-19
Onur,A.et.al. (2012) An investigation on value orientations, attitudes and concern towards the environment: the case of Turkish elementary school students, Environmental Education Research, 18:2, 271-297
Farokhi & Hashemi, (2011). The Analysis of Children's Drawings: Social, Emotional, Physical, and Psychological aspects. Procedia - Social and Behavioral Sciences. 30. 2219-2224.
Dietz, T., L. Kalof, and P.C. Stern. 2002. Gender, values, and environmentalism. Social Science Quarterly 83: 353–64.
Schultz, P.W., and L. Zelezny. 1999. Values as predictors of environmental attitudes: Evidence for consistency across 14 countries. Journal of Environmental Psychology 28: 255–65.
Palmer, J. (1998). Environmental education in the 21st century: theory, practice, progress and promise. New York: Routledge.
Amol Padwad

1
Determinants of safe drinking water at household level consumption: a study
among the low income families of East Delhi, India
Submitted by Ishani Rajkhowa (S183B0013)
Right to safe water and sanitation is a human right according to United Nations General
Assembly 2010. It is not explicitly stated in the Indian constitution but has been included
under Article 21 Right to protection of life and personal liberty in many judgments of the
Supreme Court and High courts of India.
The World Health Organization's (WHO) 2017 report defines safe drinking-water as water
that "does not represent any significant risk to health over a lifetime of consumption,
including different sensitivities that may occur between life stages."
However, the safety of our water is not easily detectable when we consume it. Despite
numerous interventions by researchers, the government and Non Governmental Organisations
(NGOs) over the years to educate communities in different sections of the world in safe water
practices so as to curb and prevent the recurrence of diseases consequent of consumption of
poor water quality, there seems to be some reason restraining those interventions from
delivering fruitful results and translating into the desired changes in the safe water practices
of the respective target populations.
Existing literature suggests that people’s understanding of the quality of the water accessible
to them and the quality acceptable to make it fit for consumption is a major determinant of
how they will respond to interventions and also how they generally go about their day to day
water consumption practices. Even in developed countries where every household
theoretically receives potable quality water directly to their taps, in practice there may be
contamination of the water between the point of source and the point of use or at the storage
facility of the governing body or at the house. Such contamination is not easily visible and so
the consumers of municipally supplied water globally rely on organoleptic properties like the
colour and visible content, smell and taste of the water received at the point of use to judge if
it is fit for drinking and/or other forms of consumption. Such parameters are inadequate to
assess the microbial presence in the water. They might choose a method of filtration that they
think is required considering the organoleptic properties of the water. They may even choose
not to filter if they have blind trust in the government supplying their water or are unaware of
2
the possibility of contamination due to the non existence or rare existence of warnings and
proclamations from the governing body.
People from developing or under-developed countries where only a certain section of the
population receive piped supply water from the government and hence rely mainly on
traditional sources of water like boring, hand pumps or open water sources are at an even
greater risk of misjudging the safety of their water. Since the industrial revolution, ground
water, in addition to becoming scarce due to the growing population and consequent dropping
of ground water levels, is also likely to be contaminated by industrial by-products and
effluents.
The practice of filtration and the method thereby used also depends on the financial status of
the household; one will use only that method which is financially feasible to the household.
People who can afford the higher prices of bottled water are increasing their consumption of
it as it is marketed as more safe and secure.
Misjudging the quality of potable water can lead to a host of diseases ranging from minor to
life threatening in nature. Diarrhoea, the most common one, is the reason for almost 10% of
the deaths of all children under the age of 5 across the world according to a UNICEF report
of 2018. Moreover, many diseases spread due to lack of proper hand washing – washing of
hands with soap and clean, running water. Germs like Salmonella, E.coli and Norovirus
which cause diarrhoea spread to humans from the faeces of people and animals. These germs
can get onto the hands of people who touch any object that has the germs on it because
someone coughed or sneezed around it or if it came into contact with some other
contaminated object. Without clean water, bathing and laundering practices are also
compromised which can lead to hygiene-related diseases such as scabies, ringworm,
trachoma, conjunctivitis and louse-borne typhus. Trachoma seems to be the most dangerous
one as it can lead to permanent blindness.
Looking at the literature available on the topic, I have tried to answer the question of what are
the determinants of safe drinking water practices among the low income families of
East Delhi, India. The objective of my study is to find the conceptual understanding
behind the determinants of safe water from the people’s point of view and the
association of those determinants with heath problems suffered amongst them.

3
I visited 30 low income families from five different slums in East Delhi, India which were selected
through the NGO SEEDS due to a high number of disease related student absence in the East Delhi
Municipal Corporation (EDMC) schools of these areas. The localities are Trilokpuri, Ganesh Nagar/
Mandawali, New Ashok Nagar, Shashtri Nagar and Chander Vihar. The families are migrants from
the states of Bihar, Jharkhand, Orissa and Uttar Pradesh with a maximum of 47% from Uttar Pradesh
followed by 37% from Bihar. There is provision for piped municipal water supply in all these
localities and each of the household surveyed in these localities had at least one child studying in the
EDMC School of the area meaning that SEEDS had been attempting to educate them on safe water
consumption practices through school interventions and water sample tests.
Literature Review
A way to ensure that one is consuming clean water with a good taste and sometimes even added
minerals seems to be to drink bottled water. There are a whole lot of companies producing bottled
water under different brand names. Some even claim that the water in the bottle has been sourced
directly from mountains. Such surety, however, comes at a price as these brands sell their bottles at
prices ranging from cheap to expensive depending on the packaging of the bottle, the claims made on
it and the power of the brand. It is a concern for many authorities that increase in the consumption of
bottled water may lead to erosion of public tap water revenues and consequently their financial
capability to improve the existing public water supply infrastructure.
United Arab Emirates (UAE) was among the top six countries worldwide with highest annual per
capita bottled water consumption consistently from 2009 to 2013. Hence, Maraqa and Ghoudi (2015)
set out to “ascertain the perception of people in the country regarding bottled and tap water quality.”
Their study found that a large fraction of the consumers of bottled drinking water in the UAE bought
the bottled water even though they considered their tap water to be of good or excellent quality. The
authors infer that this could be attributed to the high living standard in the country which makes the
cost of bottled water “cheap” or “reasonable” in the respondents’ own words. The respondents’ belief
that bottled water had a superior taste and quality to tap water also played a role in their choice.
Hu, Morton and Mahler (2011) studied the “demographic and social factors associated with bottled
water users in the U.S. and the relationship between bottled water use and perceptions of the quality
of local water supply”. The study found that municipal supply water users and rural water source
users were more likely to consume bottled water rather than private water supply users. They found
that people were increasingly opting for bottled water when they were unsure of the quality of the
water that they received at their tap; though no such significant relationship could be found between
opting for bottled water and people’s perception towards the surface water quality. Moreover,
youngsters and females have been found to be the more likely consumers of bottled water. There have
been differences in the consumption rates of bottled water across regions suggesting the impact of

4
actual water quality, culture and media coverage in influencing their water consumption practices.
There has been no significant association found between the use of bottled water and environmental
concerns like that of the disposal or recyclability of the bottles.
Crampton and Ragusa (2016) discovered that respondents from Australia and New Zealand had a high
level of trust in their authorities and hence assumed that the latter would have taken care of all
possible issues before the water is supplied to their taps. The authors were examining “factors
influencing consumers’ beliefs, prioritizations and responses to perceived drinking water risks while
taking socio-environmental issues into account”. Respondents using local water depend on
organoleptic properties to detect changes in the water and take risk preventive measures accordingly.
Overall, most participants/respondents did not believe that the media influenced their practices but the
proportions differed across regions depending on whether the region has had some water related one
off controversial episode in the past that the media sensationalised. In such a scenario, people are
more likely to cite the media as a factor. In terms of the methods of filtration used, they found that
people used more than one method and mostly sought to eliminate chemical contaminants
(predominantly through boiling) rather than change organoleptic characteristics. The authors have
also cited a literature review by Wachinger et al. which suggests that some people use trust in
authorities as an excuse to avoid taking risk preventive measures on their own.
Workman (2019) attempted a perception analysis in Lesotho, Africa where the study found that a
sizeable proportion of the study population did not have access to municipal tap water or other
improved water sources but still did not consider filtering their drinking water. They also found that
the respondents depended highly on visual characteristics of the water to determine if it is clean.
Those having access to improved sources for drinking water did not consider the chances of
contamination between the point of source or storage facility and the point of use. Diarrhoea was seen
as a common disease and not necessarily caused by the consumption of unsafe drinking water. What
is alarming is that half of the study population seemed to believe that there are no negative
consequences of drinking unclean water. This suggests that they must have a different understanding
of what causes diseases like diarrhoea.
Wright, Yang and Gundry (2012) conducted a cross sectional study to “provide representative
estimates of household characteristics at national and provincial level” in South Africa regarding
public perception of drinking water safety. The study found that South Africans were predominantly
using organoleptic signs, mostly clarity and taste, to judge the quality of their drinking water.
Socioeconomic factors did not influence the perceptions of drinking water safety despite high income
inequality within the country. Having a sense of control over the source of water also seemed to
enhance the perception of it being safe. There was an increase in number of piped water users who

5
considered their water unsafe during the period of study. This was attributed, by the authors, to the
negative organoleptic changes in the water during the same period.
The understanding of clean, safe water and therefore the associated practices are likely to differ in
rural and urban areas due to the difference in the surrounding environments. A news article
specifically about urban South Africa states that, according to a Water Research Commission Study in
2015, 88% of urban South Africans believed their tap water to be safe for drinking. The percentage
was 81 in 2011. The areas where people had lower confidence in their drinking water quality were the
ones which experienced interruptions in their water supply once a month or even more frequently.
The study found top six reasons from the people as to why they considered their water to be safe. The
reasons being – visibly clean, no diseases, good taste, good smell, hearsay, trust in the municipality to
clean the water. The study also found that people with high income were consuming bottled drinking
water irrespective of whether they thought their tap water to be safe or not.
There was a report published in 2013 on two communities in Kandal Province, Cambodia by
researchers Orgill, Shaheed, Brown and Jeuland have studied the demand for improved water quality
among the two communities to test the hypothesis that “household water treatment practices (WTP)
for improved water quality depends in part on individual perceptions of the safety and acceptability of
existing drinking water sources”. Improved water sources are stated to consist of household
connections to private piped water network or household level rainwater harvesting and storage.
Majority of the study population had a source of water supply at their house. The effect of perception
was found to be strong among participants who preferred the taste of their current water supply to
three treated water samples (one sample was from commercial bottled water and other two samples
treated with chlorine disinfectants) offered to them. Those participants believed their current water to
be safer than the samples. The average cost of WTP was found to be 18% lower among this group
than that in the group which preferred one of the samples. Lastly but importantly, there was very low
or negative correlations between perceptions towards the water safety and actual E.Coli counts in the
water samples taken from the households’ water supply sources and water storage containers.
A study on community perception towards safe drinking water and adaptation to it scarcity in south
western coastal regions of Bangladesh by Anwarul, Habiba and Shaw (2014) shows that 96% of
respondents from severe water scarcity areas and 92% from moderate water scarcity regions perceive
salinity to be the top hazard causing scarcity of safe drinking water. 77 and 66% of respondents from
the respective categories blamed extensive shrimp cultivation as a human activity causing drinking
water scarcity in addition to the construction of Farakka Barrage which again is said to cause salinity
of the water and other water related problems. After salinity, the next widely perceived source of
contamination was arsenic but this was pointed out only by the educated respondents. Majority of the
respondents in severe water scarcity areas were engaged in agricultural daily wage labour while that

6
in moderate water scarcity areas were engaged in both agricultural and business sectors. About two-
thirds of the population in severe water scarcity areas were below the poverty line.
Researchers Francis et al conducted a research to understand parental perceptions about the effects of
unsafe drinking water supply and practices on health. This study, conducted in rural Vellore in South
India, was part of a yearlong intervention where each family in the study was daily provided up to 25
litre of drinking water filtered through a source based membrane filter. The results suggest that
parents in the study area linked not the cleanliness of the water but the temperature of the water to
diarrhoea as well as other illnesses like fever cold and cough. They preferred to give warm instead of
hot or cold water to their children as they associated both hot and cold beverages as the cause of
illnesses. This is said to be a widespread belief in rural India. Boiling, considered expensive due to the
requirement of fuel wood, was used as a method of filtration of drinking water only for young
children and sick adults. Another common method of filtration was using a cloth at the source of use.
Locally sourced water was trusted more than water bought from outside despite the fact that high
levels of fecal coliform contamination has been consistently found in public drinking water samples
from both urban and rural areas of Vellore. Some parents seemed to prefer the taste of untreated water
as they described the taste of the water filtered under the intervention as lacking taste or even bitter.
This must be read in the context of the fact that the membrane does not alter the physical of water
drastically.
Thus, from my review of literature on perceptions towards safe drinking water and associated
practices from across the world, I can understand that people, in the absence of visibility of pathogens
in their water, depend on organoleptic characteristics to judge the quality of their water. They have a
particular taste that they are used to and any deviation from that taste leads them to look for methods
of filtration. Any smell from the water or visible objects floating in it or a change in its colour also
acts as reasons for filtration. However, the method of filtration in majority of the areas is still boiling
or usage of a cloth rather than the use of advanced devices like Reverse Osmosis Water Purifiers.
People who can afford bottled drinking water in developed nations like U.S and UAE seem to have a
preference for it irrespective of the quality of their local water, however, people in rural south India
have been found to prefer their local water over bottled water. Most people who receive piped
municipal supply water do not filter their water either due to trust in the authorities or as an excuse to
avoid the responsibility of risk prevention practices. They are not aware of possible contamination
between point of source and point of use. Some people do not consider a direct link between drinking
unclean water and episodes of diarrhoea. They consider diarrhoea as one of the other common
ailments like cold, cough and fever.
Methodology

7
EDMC School students from each of the five localities mentioned earlier, who had cases of water
related disease in their respective families, were selected through Sustainable Environment and
Ecological Development Society (SEEDS). There was an independent revisit to one locality, New
Ashok Nagar, on the last day and on that visit snowball sampling method was used to find the
households to be interviewed. 30 households were selected in total throughout the course of study to
conduct in depth interviews with the respondents.
I used Statistical Package for Social Sciences (SPSS) and Microsoft Excel to analyse the data
collected.
Limitations
My study could not capture the income of the responding families which could have been directly
used to understand their financial status. This led me to make certain assumptions in my study to get a
sense of their financial status.
Moreover, due to shortage of time and resources, I could not conduct water sample tests from the
study localities to find scientific evidence of the accuracy of the respondents’ judgement of the safety
of their water and its link to the diseases suffered. Results disclosing the count of pathogens in the
water from such tests could have provided stronger conclusions to my study.
Findings and analysis
The sources of drinking water used by the families in my study are -Bisleri, Municipal water supply to their taps and tankers. Each respondent referred to the 20 litre packaged drinking water that they buy as Bisleri, however, the bottles seen at their houses did not have any label on them. The local shops were seen selling such unlabelled, unsealed 20 litre packs. This suggests that the bottled/packaged water they are consuming is actually some local water being filled in those bottles/packs at the shops. Source of drinking water used would depend on the monetary cost of accessing the source as well as other hidden costs like that of waiting in long queues to wait for a tanker when they could be out earning livelihood in that time. Hence, it is important to check if there is any association found in the study site between financial status and the source of drinking water used. Since I do not have income details, I have tried to use the occupation of the respondents and the rent they pay for accommodation as two measures of their financial status and tried to link them to the sources of water consumed and the diseases suffered in the family. The first assumption here is that people working as maids, cooks, vegetable or pani puri vendors, labourers and those unemployed earn less than the ones working private jobs like that of electricians and workers in manufacturing unit or who are self employed. This information is depicted in the following table where water borne diseases have been highlighted as well. The second assumption is that those who have their own house are financially the most well off and those who pay a higher rent are more financially well off than those who pay lesser rent than them.

8
Locality Respondent's
occupation Spouse's
occupation Room Rent
Source of drinking water Diseases
Ashok Nagar Housewife Private company 2400 Bisleri Kidney Stones, Gall Stones, Sinus, Allergy, Boil, Anaemia, Eye infection, joint pain
Ashok Nagar Private company Private company 3500 Tanker & Bisleri Kidney Stones, Gall Stones, Sinus, Allergy, Boil, Anaemia, Eye infection, joint pain
Ashok Nagar Housewife Self employed - Bisleri Pneumonia Trilokpuri Housewife Self employed - Bisleri -
Chander Vihar Housewife NA Own house Municipal Water Supply None
Chander Vihar Housewife Private company 5000 Municipal Water Supply Diarrhoea, Seasonal and others
Ashok Nagar Housewife Self employed 4500 Tanker & Bisleri Kidney Stones, Gall Stones, Sinus, Allergy, Boil, Anaemia, Eye infection, joint pain
Shashtri Nagar House help Self employed Own house Municipal Water Supply
Kidney Stones, Gall Stones, Sinus, Allergy, Boil, Anaemia, Eye infection, joint pain
Chander Vihar House help Private company - Municipal Water Supply Boil, Eye infection and Others
Chander Vihar House help Private company 6000 Municipal Water Supply Diarrhoea, Seasonal and others
Ashok Nagar House help Self employed - Tanker Tuberculosis
Ganesh Nagar Self employed Private company - Municipal Water Supply Seasonal diseases
Ashok Nagar Housewife Private company - Bisleri Typhoid, boil and seasonal Ashok Nagar Housewife Private company 2500 Tanker Diarrhoea, Seasonal and others
Ashok Nagar House help Private company 2400 Tanker Kidney Stones, Gall Stones, Sinus, Allergy, Boil, Anaemia, Eye infection, joint pain
Trilokpuri Housewife Private company 8000 Tanker Diarrhoea, Seasonal and others Chander Vihar Housewife Self employed 7500 Bisleri Diarrhoea
Chander Vihar Housewife Private company 3000 Municipal Water Supply Diarrhoea, Seasonal and others
Chander Vihar Private company Self employed - Municipal Water Supply Diarrhoea, Seasonal and others

9
Chander Vihar Housewife Private company - Municipal Water Supply Seasonal diseases
Ashok Nagar Housewife Self employed 2300 Tanker Diarrhoea, Seasonal and others
Trilokpuri House help Private company - Municipal Water Supply Skin Problem
Shashtri Nagar Housewife Self employed - Bisleri Seasonal diseases Ashok Nagar Housewife Private company - Bisleri Seasonal diseases
Ganesh Nagar Housewife Self employed 2500 Municipal Water Supply Headache,dizziness,migraine
Ganesh Nagar Housewife NA 3000 Bisleri Headache,dizziness,migraine
Trilokpuri House help Private company NA Municipal Water Supply None
Ashok Nagar Housewife Self employed 2600 Bisleri Seasonal diseases Ganesh Nagar Self employed Daily wage labourer 2500 Bisleri Typhoid
Ganesh Nagar Housewife Self employed 2200 Municipal Water Supply Boil, Eye infection and Others
Two families out of the 30 had their own house, both use municipal water supply and have no diseases in the family. 5 cases of water borne diseases have
been found in Chander Vihar, 1 such case in Ganesh Nagar/Mandavali, 3 cases in Ashok Nagar and 1 case from Trilokpuri.
It can be noted that one respondent who and her husband both work private jobs admitted that her husband brings 6 litres of RO water every day from his
place of work and 12 litres when he has a night shift. This suggests that they do have a preference for RO filtered water but are unwilling to install one at
home due to the expenses of installation and maintenance.
There is no correlation found of the financial status to the source of drinking water used and diseases suffered when using occupation and rent as parameters
of financial status.
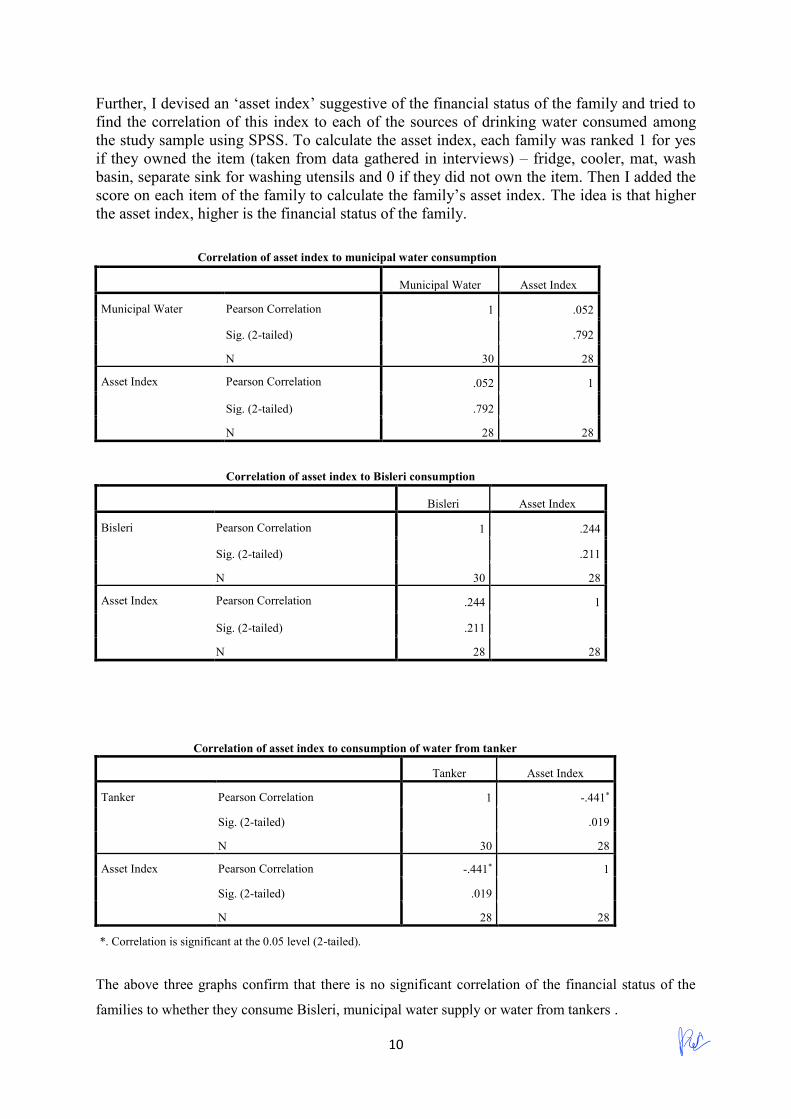
10
Further, I devised an ‘asset index’ suggestive of the financial status of the family and tried to find the correlation of this index to each of the sources of drinking water consumed among the study sample using SPSS. To calculate the asset index, each family was ranked 1 for yes if they owned the item (taken from data gathered in interviews) – fridge, cooler, mat, wash basin, separate sink for washing utensils and 0 if they did not own the item. Then I added the score on each item of the family to calculate the family’s asset index. The idea is that higher the asset index, higher is the financial status of the family.
Correlation of asset index to municipal water consumption
Municipal Water Asset Index
Municipal Water Pearson Correlation 1 .052
Sig. (2-tailed) .792
N 30 28
Asset Index Pearson Correlation .052 1
Sig. (2-tailed) .792
N 28 28
Correlation of asset index to Bisleri consumption
Bisleri Asset Index
Bisleri Pearson Correlation 1 .244
Sig. (2-tailed) .211
N 30 28
Asset Index Pearson Correlation .244 1
Sig. (2-tailed) .211
N 28 28
Correlation of asset index to consumption of water from tanker
Tanker Asset Index
Tanker Pearson Correlation 1 -.441*
Sig. (2-tailed) .019
N 30 28
Asset Index Pearson Correlation -.441* 1
Sig. (2-tailed) .019
N 28 28
*. Correlation is significant at the 0.05 level (2-tailed).
The above three graphs confirm that there is no significant correlation of the financial status of the
families to whether they consume Bisleri, municipal water supply or water from tankers .

11
The above graph shows the number of families consuming each source of drinking water. 12 families
consume Bisleri, 7 consume water from tanker and 13 consume municipal water from their taps.
However, among these there are two families who consume both Bisleri and water from tanker.
The graph above shows the number of families depending on the different organoleptic characteristic
to judge the safety of their water. It was found that 29 families depend on the clarity of the water i.e.
avoiding consumption if the water looked yellow/brown or had any visible material present in it.
None of the families from my sample depended on the taste of their water. 22 families depended on
whether there was any foul smell in their water. As depicted in the figure below, 21 families among
the numbers mentioned above, depend on both clarity and smell.
13
7
12
0 2 4 6 8 10 12 14
Municipal Supply Water
Tanker
Bisleri
Number of families using each source of water
29
0
22
0 5 10 15 20 25 30 35
Clarity
Taste
Smell
Number of families relying on each organoleptic characteristic

12
Venn diagram to show the overlapping of responses regarding organoleptic characteristics
10%7%
7%
30%10%
3%
3%
3%
27%
Cause of disease according to respondentFood Water Food and water
Food and superstition Superstition Pollution
Reaction to medicine Seasonal changes Do not know

13
This pie chart shows the percentage distribution of the causes that the respondents believe to have
been associated with the diseases seen in their respective families. This was asked to see their
understanding of what causes the diseases, their awareness of what diseases can be caused by the
consumption of unclean water and to see if they considered the possibility of their water being
contaminated. Majority (30%) linked unhealthy food and superstitious beliefs (like being cursed by
some person or something supernatural) to diseases and only 7% linked them to the consumption of
contaminated water. The least common causes stated were seasonal changes, pollution and reaction to
medicines (3% each).
Since there was more than one response per family, the graph below has been used to depict which
cause was mentioned by how many families.
14
4
9
12
1
1
1
8
0 2 4 6 8 10 12 14 16
Food
Water
Food and superstition
Superstition
Pollution
Reaction to medicine
Seasonal changes
Do not know
No. of familes per cause

14
Conclusion
My study found that the low income families of East Delhi, India determined the safety of their water
by using clarity and smell as parameters. Furthermore, I did not find any significant correlation of
their source of drinking water with their financial status. Neither did I find any significant association
of their drinking water practices to the diseases suffered in their family. Also, most of the families did
not seem to link diseases like diarrhoea and typhoid to unsafe water consumption.
References:
1. Hu, Z., Morton, L.W., & Mahler, R.L. (2011). Bottled water: united states consumers and their perceptions of water quality. International journal of environmental research and public health,8, 565-578. doi:10.3390/ijerph8020565
2. Crampton, A. & Ragusa, A.T. (2016). Exploring perceptions and behaviours about drinking water in australia and new zealand: is it risky to drink water, when and why?. Hydrology,3(8).
3. Maraqa, M.A., & Ghoudi,K.(2015).Survey of public attitude towards bottled and tap water quality in the uae. Globalnest,17.
4. Workman, C.L. (2019). Perceptions of drinking water cleanliness and health-seeking behaviours: a qualitative assessment of household water safety in lesotho, africa. Global Public Health, DOI: 10.1080/17441692.2019.1566483
5. Wright, J.A., Yang, H., Rivett, U., & Gundry, S.W. (2012). Public perception of drinking water safety in south Africa 2002-2009: a repeated cross sectional study. BMC Public Health, 12(556).
6. Bega, S. (2016, March 5). What urban s Africans think of tap water. IOL. Retrieved from https://www.iol.co.za/news/south-africa/what-urban-s-africans-think-of-tap-water-1993895
7. Abedin, M.A., Habiba,U., & Shaw, R. (2014). Community perception and adaptation to safe drinking water scarcity: salinity, arsenic, and drought risks in coastal bangladesh. International journal of disaster risk science, 5, 110-124.
8. Orgill, J., Shaheed, A., Brown, J., & Jeuland, M. (2013). Water quality perceptions and willingness to pay in peri-urban cambodian communities. Journal of water and health, 11(3).
9. Francis, M.R., Nagarajan, G., Sarkar, R., Mohan, V.R., Kang, G., & Balraj, V. (2015). Perception of drinking water safety and factors influencing acceptance and sustainability of a water quality intervention in rural southern india. BMC Public Health, 15(731).
10. Chakravarty I, Bhattacharya A, Das SK. (2017)Water, sanitation and hygiene: The unfinished agenda in the World Health Organization South-East Asia Region. WHO South-East Asia journal of public health,6(2):22-33.
11. Freeman MC, Clasen T. Assessing the impact of a school-based safe water intervention on household adoption of point-of-use water treatment practices in southern India. The American journal of tropical medicine and hygiene. 2011;84(3):370-378.
12. Reddy BV, Kusuma YS, Pandav CS, Goswami AK, Krishnan A. (2017).Water and Sanitation Hygiene Practices for Under-Five Children among Households of Sugali Tribe of Chittoor District, Andhra Pradesh, India. Journal of environmental and public health,2017:7517414.
13. Shreyaskar, P.K.P. (2016). Contours of access to water and sanitation in india: drawing on the right to live with human dignity. Economic and political weekly
Amol Padwad

15
1
Status of Wash Practices in East Delhi and its
Linkages with the incidences of Diarrhoea
INTERNSHIP REPORT SUBMITTED TO
AMBEDKAR UNIVERSITY, DELHI
SCHOOL OF HUMAN ECOLOGY
M.A ENVIRONMENT & DEVELOPMENT
2019
By
SHIVANI
ENROLLEMENT NO – S183B0031
SUPERVISOR – DR. OINAM HEMLATA DEVI
Amol Padwad

2
CONTENTS
1. INTRODUCTION
1.1 Historical Background of Diarrhoea
1.2 Statement of problem
1.3 Research Objectives
2. LITERATURE REVIEW
3. METHODOLOGY
4. FINDINGS & ANALYSIS
5. CONCLUSION AND DISCUSSION
6. REFERENCES
3
ACKNOWLEDGEMENTS
I must take this opportunity to place on record my deep sense of respect and
gratitude to Dr.Oinam Hemlata Devi, for her valuable advice, resourceful
guidance, active supervision and constant encouragement without which it
would not have been possible to give this report such a shape in time. My
study was partially funded by Ambedkar University, Delhi.
I also want to express my gratitude towards SEEDS organisation and their
volunteers for proper field assistance. I also thankfully acknowledge the
assistance received from my key respondents for giving their precious time and
by providing valuable information’s.
Last but not the least; I am so grateful to my parents and my friends for their
love, understanding and support during my fieldwork and post field work.

4
INTRODUCTION:
Diarrhoea is said to be happen when there is unusual loose or watery stools, usually at least three times in a 24 hour period (WHO, 2014). Across the world, there are 1.7 billion cases of childhood diarrhoea every year.
It is the second leading cause of child morbidity and mortality worldwide, especially in developing countries or low-income countries (UNDP, 2014). First leading cause of death is respiratory diseases. Each year around 525000 children (under 5 years of age) die because of diarrhoea. 88% of the diarrhoeal incidence is the result of inadequate sanitation facilities, unsafe water and poor hygiene practices (WHO, 2004). Other than WaSH practices, other factors that determine the prevalence of diarrhoea are housing conditions, level of maternal education, household economic status, place of residence, feeding practices, and the general level of hygiene and the awareness in the home (Teran, 1991; Diame et al., 1990; Timaeus and Lush, 1995).
Diarrhoea results from the intestinal infection, caused by a variety of bacteria, viral and parasitic organism which spread through contaminated food, water and directly from person to person because of poor hygiene behaviour. Diarrhoeal germs find their way from someone’s stool to someone’s mouth and are usually spread through contaminated food, water or objects. Diarrhoea diseases are pervasive among households with low-economic background living in poor personal and domestic hygiene conditions (McGranahan et al., 1999)
Rotavirus is the major cause of acute diarrhoea and responsible for 40% of the hospitalisation due to diarrhoea among children below the age of 5. It is the outcome of reduced body fluid leading to exhaustive diarrhoea. Diarrhoea can have a pernicious impact on children’s overall growth and cognitive development. Children who are under-nourished or suffer from immunity loss or have HIV positive are at the maximum risk of getting diarrhoea. Diarrhoea could be a life-taking disease as it leaves the body without water and salt which is necessary for the survival. Looking at the past, for most of the people fluid loss and severe dehydration were the main causes of diarrhoea related deaths (WHO).
Drinking water, sanitation and hygiene behaviour - WaSH practices are known to be the main determinants of diarrhoeal diseases (UNICEF). Most of the countries have now shifted their focus to WaSH practices to reduce the incidences of diarrhoea. Many of the researchers, medical practitioner, and academician believe that diarrhoeal incidences can be pull down to minimum by keeping human excreta away from the living spaces and blocking the infection route with improved hygiene practices (JICA 2012).
Pathogens reach human host via vectors that use faeces as a medium. Pathogens from faeces reach human body through poor hygiene practices or through other mediums like flies, plants, fish, water, animals, soil etc. Pathogen’s transmission can be controlled and
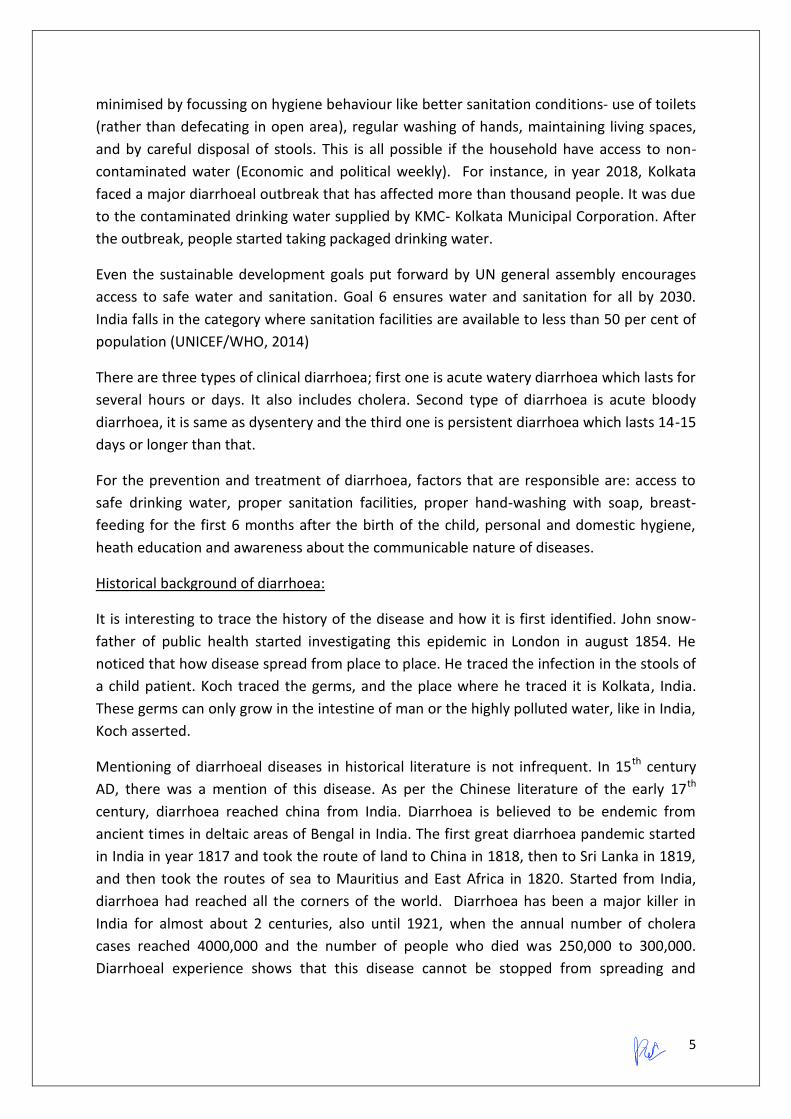
5
minimised by focussing on hygiene behaviour like better sanitation conditions- use of toilets (rather than defecating in open area), regular washing of hands, maintaining living spaces, and by careful disposal of stools. This is all possible if the household have access to non-contaminated water (Economic and political weekly). For instance, in year 2018, Kolkata faced a major diarrhoeal outbreak that has affected more than thousand people. It was due to the contaminated drinking water supplied by KMC- Kolkata Municipal Corporation. After the outbreak, people started taking packaged drinking water.
Even the sustainable development goals put forward by UN general assembly encourages access to safe water and sanitation. Goal 6 ensures water and sanitation for all by 2030. India falls in the category where sanitation facilities are available to less than 50 per cent of population (UNICEF/WHO, 2014)
There are three types of clinical diarrhoea; first one is acute watery diarrhoea which lasts for several hours or days. It also includes cholera. Second type of diarrhoea is acute bloody diarrhoea, it is same as dysentery and the third one is persistent diarrhoea which lasts 14-15 days or longer than that.
For the prevention and treatment of diarrhoea, factors that are responsible are: access to safe drinking water, proper sanitation facilities, proper hand-washing with soap, breast-feeding for the first 6 months after the birth of the child, personal and domestic hygiene, heath education and awareness about the communicable nature of diseases.
Historical background of diarrhoea:
It is interesting to trace the history of the disease and how it is first identified. John snow- father of public health started investigating this epidemic in London in august 1854. He noticed that how disease spread from place to place. He traced the infection in the stools of a child patient. Koch traced the germs, and the place where he traced it is Kolkata, India. These germs can only grow in the intestine of man or the highly polluted water, like in India, Koch asserted.
Mentioning of diarrhoeal diseases in historical literature is not infrequent. In 15th century AD, there was a mention of this disease. As per the Chinese literature of the early 17th century, diarrhoea reached china from India. Diarrhoea is believed to be endemic from ancient times in deltaic areas of Bengal in India. The first great diarrhoea pandemic started in India in year 1817 and took the route of land to China in 1818, then to Sri Lanka in 1819, and then took the routes of sea to Mauritius and East Africa in 1820. Started from India, diarrhoea had reached all the corners of the world. Diarrhoea has been a major killer in India for almost about 2 centuries, also until 1921, when the annual number of cholera cases reached 4000,000 and the number of people who died was 250,000 to 300,000. Diarrhoeal experience shows that this disease cannot be stopped from spreading and

6
moving place to place. This can surely be managed with proper sanitation, safe drinking water and hygiene behaviour.
Diarrhoeal diseases needs to be treated with ORS- oral rehydration solution, or/and a solution of clean and safe drinking water, sugar and salt. Also, it needs to be supplemented with 20 mg zinc tablets for 10-14 days that helps in shortening the duration of diarrhoea and improves outcome- as it reduces the stool volume by 30 per cent (WHO).
Table 1: Estimates of child cause of death, Diarrhoea 2018 (UNICEF)
NND: Total Neonatal deaths
Country code
country year NND PND Neo3 POST3 UFIVE3 RNEO3 RPOST3 RUFIVE3 FNEO3 FPOST3 FU FIVE3
IND India 2000 12,53,857
12,67,834
17,790
3,22,147
3,39,937
1 12 12 1% 25% 13%
IND India 2001 12,15,043
12,28,817
17,089
3,01,755
3,18,844
1 11 11 1% 25% 13%
IND India 2002 11,75,465
11,60,962
16,323
2,83,031
2,99,354
1 10 11 1% 24% 13%
IND India 2003 11,35,040
11,14,763
15,497
2,65,168
2,80,665
1 10 10 1% 24% 12%
IND India 2004 10,96,413
10,72,965
14,651
2,47,576
2,62,227
1 9 9 1% 23% 12%
IND India 2005 10,56,348
9,79,474
13,746
2,30,742
2,44,487
1 8 9 1% 24% 12%
IND India 2006 10,17,141
9,53,009
12,816
2,14,814
2,27,630
0 8 8 1% 23% 12%
IND India 2007 9,73,379
8,80,523
11,809
1,99,351
2,11,161
0 7 8 1% 23% 11%
IND India 2008 9,30,987
8,29,036
10,814
1,84,247
1,95,061
0 7 7 1% 22% 11%
IND India 2009 8,87,858
7,90,936
9,817
1,69,967
1,79,784
0 6 7 1% 21% 11%
IND India 2010 8,44,966
7,13,296
8,839
1,55,433
1,64,272
0 6 6 1% 22% 11%
IND India 2011 8,03,346
6,62,311
7,893
1,42,883
1,50,776
0 5 6 1% 22% 10%
IND India 2012 7,66,308
5,94,745
7,013
1,30,195
1,37,208
0 5 5 1% 22% 10%
IND India 2013 7,29,051
5,44,754
6,164
1,20,656
1,26,820
0 5 5 1% 22% 10%
IND India 2014 6,96,675
5,16,542
5,409
1,10,458
1,15,867
0 4 5 1% 21% 10%
IND India 2015 6,66,286
4,80,401
4,753
1,05,279
1,10,031
0 4 4 1% 22% 10%
IND India 2016 6,39,826
4,43,167
4,564
98,249
1,02,813
0 4 4 1% 22% 9%

7
PND: Total Post-Neonatal deaths
Neo3: Neonatal deaths due to diarrhoea
POST3: Post neonatal deaths due to diarrhoea
Ufive3: Under five deaths due to diarrhoea
Rneo3: neonatal death rate from diarrhoea (per 1000 live births)
Rpost3: post neonatal death rate from diarrhoea (per 1000 live births)
Rufive3: under five death rates from diarrhoea (per 1000 live births)
Fneo3: % neonatal deaths due to diarrhoea
Fpost3: % post-neonatal deaths due to diarrhoea
Fufive3: % under five deaths due to diarrhoea
The diarrhoeal rates have been continuously declining from the year 2000. This shows how policies and other intervention have helped in reducing the numbers. It is still high and needs to be looked upon seriously. However, intervention like effective practice of WaSH has reduced the number, and also it is cost effective. The social change that it has brought in the people across the world, earlier people did not pay much head to the hygiene practices, now there is a shift; shift in ideas and practice, people are adopting better health and hygiene practices. Hygiene problems carry a strong causation effect with diarrhoea. With rapid urbanization and development, these aspects are now being put into play. Gradually, with so many scholars claiming that hand washing can help in reducing diarrhoea (cite some scholars), even the government has put its efforts towards the same. With these efforts coming into play at household level and at industrial levels, change can be visibly seen in the survey conducted by WHO. Certainly in the last 20 years, there has been a change in society as well. With the welcoming of western culture and better lifestyles, hygiene is becoming an important part of the society. The rising social value of hygiene in cities, and the country going towards cities, faster than ever, this is welcome change to some aspect. The number of deaths has been reduced, partly due to better medical facilities, but smaller changes in society have played a role too. This social change that has occurred is a matter of further study though. Yet, rising above the issues of caste and religion, issues which actually carry importance are coming forward on better rate. The reduced no of deaths here, is one such positive.

8
STATEMENT OF PROBLEM:
The data is available on prevalence of diarrhoeal cases in children under five from the literature. Data collected till the date focuses on the specific population (children under five). The attempt is to understand the gap and to aim specific households with past history of diarrhoea or other diseases, irrespective of the particular age group. The aim is to study the status of WaSH practices- Water, sanitation and hygiene in low- income families of a particular area and to link the WaSH practices with disease occurrence for each household. It is important to understand why the children under five are more prone to such diseases and the steps taken by various institutions in this regard. Also, other than WaSH practices it is equally important to identify other variables that are important for understanding diarrhoeal prevalence.
OBJECTIVES:
1. To study the status of WaSH practices- water, sanitation and hygiene in low income families of East Delhi.
2. To identify the other possible variables associated with diarrhoeal cases at family level.
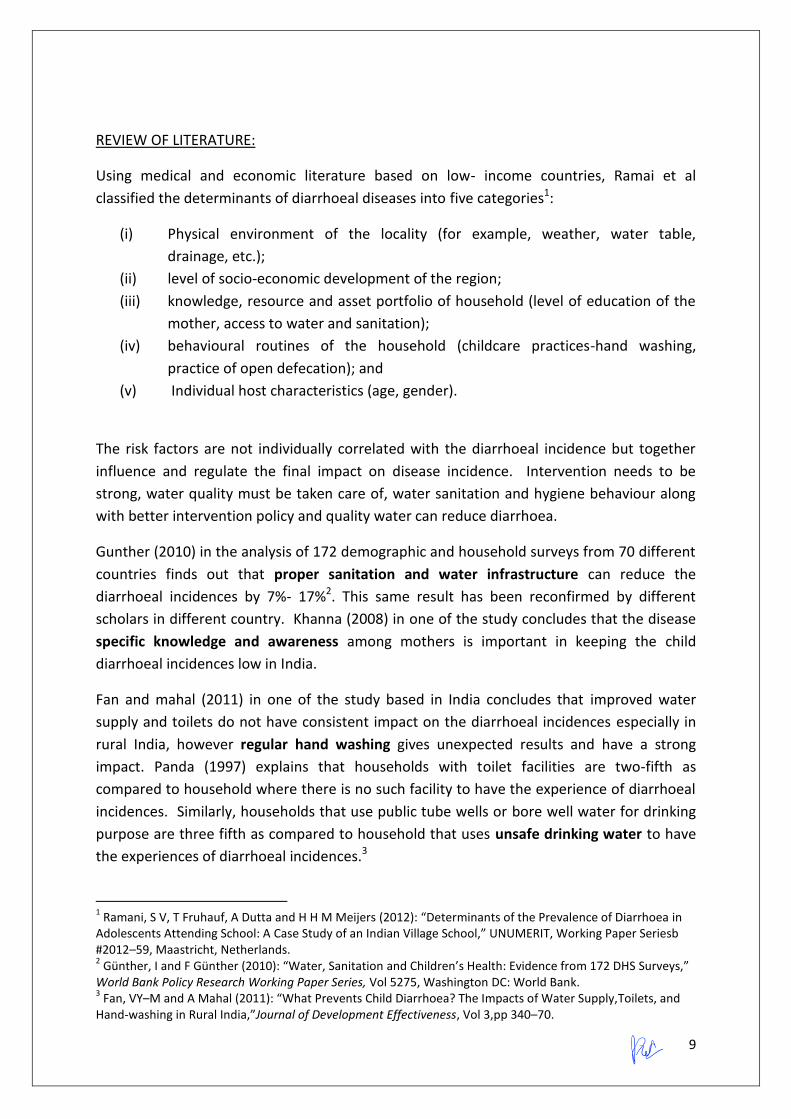
9
REVIEW OF LITERATURE:
Using medical and economic literature based on low- income countries, Ramai et al classified the determinants of diarrhoeal diseases into five categories1:
(i) Physical environment of the locality (for example, weather, water table, drainage, etc.);
(ii) level of socio-economic development of the region; (iii) knowledge, resource and asset portfolio of household (level of education of the
mother, access to water and sanitation); (iv) behavioural routines of the household (childcare practices-hand washing,
practice of open defecation); and (v) Individual host characteristics (age, gender).
The risk factors are not individually correlated with the diarrhoeal incidence but together influence and regulate the final impact on disease incidence. Intervention needs to be strong, water quality must be taken care of, water sanitation and hygiene behaviour along with better intervention policy and quality water can reduce diarrhoea.
Gunther (2010) in the analysis of 172 demographic and household surveys from 70 different countries finds out that proper sanitation and water infrastructure can reduce the diarrhoeal incidences by 7%- 17%2. This same result has been reconfirmed by different scholars in different country. Khanna (2008) in one of the study concludes that the disease specific knowledge and awareness among mothers is important in keeping the child diarrhoeal incidences low in India.
Fan and mahal (2011) in one of the study based in India concludes that improved water supply and toilets do not have consistent impact on the diarrhoeal incidences especially in rural India, however regular hand washing gives unexpected results and have a strong impact. Panda (1997) explains that households with toilet facilities are two-fifth as compared to household where there is no such facility to have the experience of diarrhoeal incidences. Similarly, households that use public tube wells or bore well water for drinking purpose are three fifth as compared to household that uses unsafe drinking water to have the experiences of diarrhoeal incidences.3
1 Ramani, S V, T Fruhauf, A Dutta and H H M Meijers (2012): “Determinants of the Prevalence of Diarrhoea in Adolescents Attending School: A Case Study of an Indian Village School,” UNUMERIT, Working Paper Seriesb #2012–59, Maastricht, Netherlands. 2 Günther, I and F Günther (2010): “Water, Sanitation and Children’s Health: Evidence from 172 DHS Surveys,” World Bank Policy Research Working Paper Series, Vol 5275, Washington DC: World Bank. 3 Fan, VY–M and A Mahal (2011): “What Prevents Child Diarrhoea? The Impacts of Water Supply,Toilets, and Hand-washing in Rural India,”Journal of Development Effectiveness, Vol 3,pp 340–70.

10
Booraah(2014) in one of the study claims that the inadequate toilet facilities can increase the chances of diarrhoea by 5 %, in a similar way, safe water supply reduces the chances by 5%.4
Jalan and ravallian (2003) in their study find that the incidence of diarrhoea and its duration is less seen among children less than five years of age where families get piped water and it is significantly higher in case of households where piped water is not available. Such similar results are found in other studies as well, like Quinn’s study in year 2014 based on Ghana. 5
In case of Uganda, a scholar named Kasirye finds that piped water and access to private covered pit latrines had significantly reduced diarrhoeal incidences. In another such study, it was concluded that health benefits are more in case of families that have access to flush toilet than pit latrines (Fuentes et al, 2006)
The existing literatures are consistent in portraying mothers as an important element in reduction of diarrhoeal occurrence and effective management during the period of illness. Gender is an important factor here; usually females themselves feel more responsible towards maintenance and hygiene of the family.
STATE EFFORTS TO INCREASE SANITATION COVERAGE TO TACKLE DIARREHOEAL INCIDENCES IN INDIA:
In order to increase and enhance the sanitation coverage in low and medium income countries, various policy interventions have been suggested from time to time. One of the interventions includes the mixture of two types of programmes, - one is the top-down approach and another is the bottom-up approach.6
In top-down approach state provides funds in order to facilitate households with better sanitation infrastructure, assuming that its availability will lead to maximum usage and hence minimum disease (diarrheal) occurrence. Under the second type of approach, sanitation facilities increases widely with the help of steady, bottom-up demand driven approach, whereby intermediary organisation get associated with different households to invest in or use sanitation infrastructure.
Bangladesh is the best example of second type of approach, where microfinance institutions came forward to support and invest in the toilet and sanitation infrastructure, and the
4 Borooah, V (2004): “On the Incidence of Diarrhoea among Young Indian Children,” Economics and Human Biology, Vol 2, pp 119–38 5 Jalan, J and M Ravallion (2003): “Does Piped Water Reduce Diarrhea for Children in Rural India?,” Journal of Econometrics, 112, 153–73. 6 Ramani, S V and S SadreGhazi (2014): “Where Is the Toilet Please? The Sanitation Sectoral Innovation System in Rural India,” Innovatio in India, Ramani S V (ed), New Delhi: Cambridge University Press.

11
involvement of NGOs helped in creating awareness about the hygiene behaviour that has resulted into increased usage of toilets (latrines).7
In India, to increase the sanitation coverage central government invested in Central Rural Sanitation Program (CRSP), initiated by Ministry of Rural Development in 1986. This program followed the top-down approach, where money was invested in order to facilitate household with better sanitation infrastructure, with the assumption that free or subsidized toilet will lead to increased usage of the toilets and hence would reduce open defecation. More than 6 billion had been spent on the construction of over 9 million toilets in rural areas, but the census conducted in 2001 found that only 22 per cent household had access to toilets.8This programme failed in India because of poor implementation; also it failed to change the mind-set people carry of not using toilet and defecating in open areas. In the similar way, central government adopted the second kind of approach, where the role shifted from just being the supplier of toilets to financer of public-private partnership involving NGO, microfinance countries and other social enterprises that interact closely with the target beneficiaries in order to make them aware about the hygiene behaviour and healthy lifestyle)9. It was also said that- information, education and communication is necessary before any programme to ensure better implementation and behavioural change. This was proposed under total sanitation campaign launched in 1999.
Despite of all the efforts put in by the government, India still needs to work more to make sanitation facilities available to all the population. According to census of year 2011, of 247 million households in India, only 47% have access to toilets in their home, and only 3 per cent had access to public toilets. Rest 50% of the population have no choice but defecating in an open area. It was observed that the poor are getting nothing, as the 20% section of the poor cannot afford to invest their limited money on the toilets and later wait for the reimbursement under TSC- total sanitation campaign (JMP WHO/UNICEF 2012). It is important to focus on the poor section by providing them free toilets to make them shift from open defecation to personal toilets. According to the World Bank data (2011), total economic cost of improper sanitation in India, amounts to a loss of $48 or Rs 2180 per person. India holds the highest position in South-east Asia for child mortality or morbidity due to diarrhoea (WHO, 2014). Also, the disability adjusted life year due to diarrhoea is still prevalent in India. Hence, improving sanitation is not enough in order to reduce the chances of diarrhoea.
7 Hadi, A (2000): “A Participatory Approach to Sanitation:Experience of Bangladeshi NGOs,”Health Policy and Planning, 15, 332–37. 8 GOI (2008): “Report of Ministry of Drinking Water and Sanitation of the Government of India,” Government of India, New Delhi, available at: www.mdws.nic.in. 9 Ramani, S V and S SadreGhazi (2014): “Where Is the Toilet Please? The Sanitation Sectoral Innovation System in Rural India,” Innovation in India, Ramani S V (ed), New Delhi: Cambridge University Press.

12
METHODOLOGY:
TYPE METHODS JUSTIFICATION advantages
PRIMARY 1. In-depth interview
In depth interviews were taken in all 30 households, it helped us to understand the situation in more detail. For disease like diarrhoea, which has association with personal and domestic hygiene practices needs to be studied in detail and data can be only extracted if the time spend with respondent in a particular setting is long.
1. In this kind of data where hygiene behaviour is an important factor, in-depth interview is a key tool. It was necessary to build a relation with the family members to extract the data. 2. Interviewers can establish rapport with participants to make them feel more comfortable, which can generate more insightful responses – especially regarding sensitive topics. 3. There is a higher quality of sampling compared to some other data collection methods. In-depth interviews can be full of information and hence it becomes easy to identify highly valuable findings quickly.

13
2. Observation
Observation method includes looking or listening without making it obvious to the respondent, with some specific objectives in the mind. In our study, the variables which need to be studied can be done easily through observation and hence reporting becomes easy.
1. Important method as it gives us information which can be supplemented with the data which is collected by other means. 2. Exact behaviour of the respondent can be observed and hence evaluated and used in the study.
Secondary Existing literature, data from UNICEF, WHO
Data available on prevalence of diarrhoea in children under age of five has been used in the study as background information. It was extracted from UNICEF, WHO Site. Existing literature on diarrhoea has been studied to understand the overall scenario and to fulfil all the steps of research and report writing
Literature has its own importance in the research work. Topic on which research has to be done is often derived from the existing literature, and to explain the contrasting outcomes, it is necessary to have proper knowledge of existing literature.
Table 2: Methods used in the study
These qualitative techniques are used for the study for few reasons. Firstly, this method allows one to build a relation with participants, in our case mothers and families which is a critical element of in-depth interview and household visits in a particular social setting. Also, these qualitative methods (in-depth interview and observation) ensure micro-level information and experiences to be incorporated in the study, especially the knowledge of mothers. This would not have been possible without using qualitative techniques. Information extracted with the help of these methods represents the ground-level information, which is difficult to extract from any other means.

14
Area of Study:
Figure 1: Delhi

15
Figure 2: East Delhi
METHOD OF SELECTING STUDY POPULATION:
The houses were already selected by the SEEDS organisation. It was a school based intervention study undertaken by SEEDS from Delhi govt. East Delhi was selected as it was one of the districts which have got good number Of MCD schools and the level of education performance rate were found to be comparatively less than the other school in different parts of Delhi. Houses have selected based on school records as part of intervention. Thirty houses were selected for our study based on the baseline survey carried out in five different localities of East Delhi, also particularly those households which has got past experience of diarrhoea and respiratory tract infection.
Data is analysed on SPSS and excel.
For the collection of data, we had selected five locations of east Delhi, namely- Trilokpuri, New Ashoka Nagar, Chander Vihar, Mandavali, Shastri nagar. Total population in the studied 30 households is 180 and there is 9 households with diarrhoea cases. Average household size is 6, and 4 is the average children per household. Male members of these households are mostly occupied in wage labour and workers in private company, and female members are mostly in the house help.
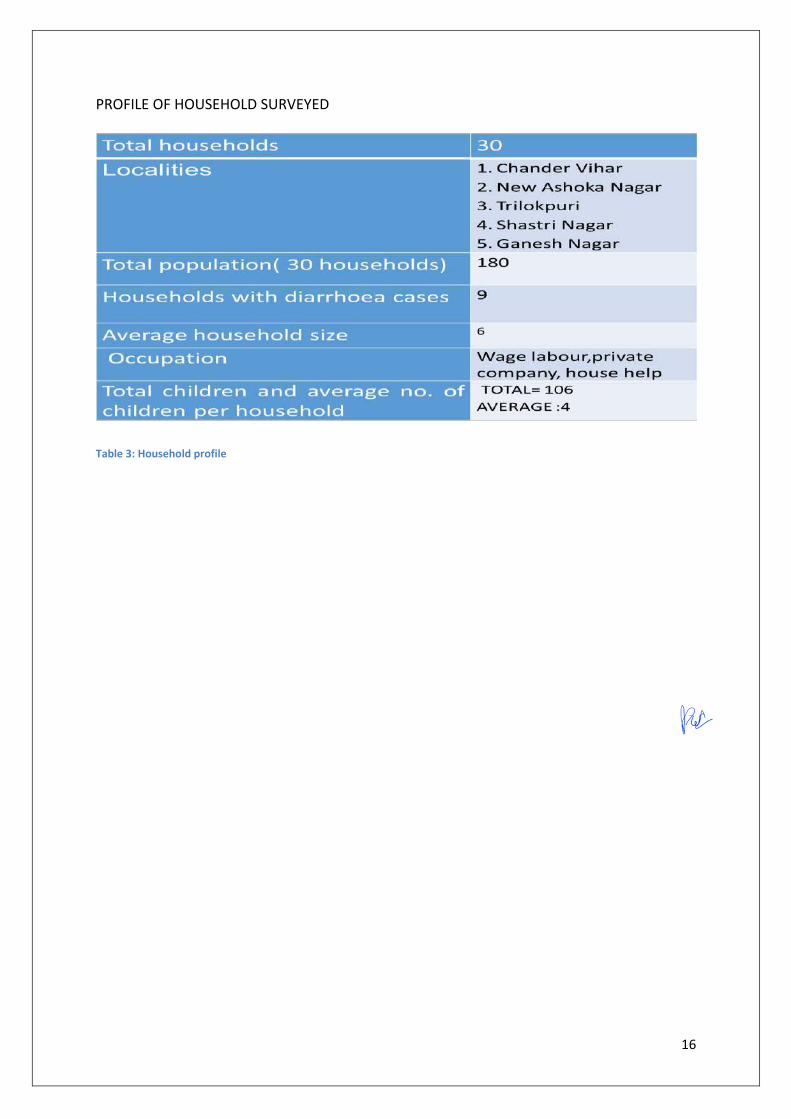
16
PROFILE OF HOUSEHOLD SURVEYED
Table 3: Household profile

17
FINDINGS AND ANALYSIS
Number of houses we visited in each locality.
Out of 30 households, 9 households have a past history of diarrhoea. 5 diarrhoeal cases were reported from Chander Vihar and rest 4 are from New Ashoka Nagar. Households from other localities do not report diarrhoeal incidences, but other diseases like typhoid, jaundice, respiratory disorders, allergies etc. Diarrhoeal cases are reported in all the age groups and not particularly one age group.

18
In 30 households, only 2 women were secondary school pass out, others were primary school dropouts or never attended school; uneducated. Diarrhoeal incidence is reported in one of the household, where the mother was well educated and was better than rest of mothers we interviewed. Also, looking at the family wealth, the family seemed well off, but they did complaint about the quality of water they receive, and they chose to buy bisleri water after the diarrhoeal incidence in the family. Conditions were comparatively better in these two households in terms of personal and domestic hygiene. Since the sample size is small, we cannot include the exceptional case that is one of the household reported diarrhoeal incidences but the mother is educated and ensures better hygiene practices. She breast feeds her child and is very careful about the child care practices.

19
Number of family members
Frequency Percent Valid Percent
Cumulative Percent
Valid 4 5 16.7 16.7 16.7 5 7 23.3 23.3 40.0 6 10 33.3 33.3 73.3 7 4 13.3 13.3 86.7 8 2 6.7 6.7 93.3 9 1 3.3 3.3 96.7 10 1 3.3 3.3 100.0 Total 30 100.0 100.0
The average family size is 6. The overall data we collected, diarrhoeal cases were more prevalent in the houses where family size was more. Four households with maximum family size suffered diarrhoea in recent times. With such limited data, we cannot derive conclusions, but it might be possible that family size has a direct relation with the incidence of diseases. Existing literature suggests that family size determine the incidence rate of diarrhoea.
Number of children in the family
Frequency Percent Valid Percent
Cumulative Percent
Valid 2 6 20.0 20.0 20.0 3 8 26.7 26.7 46.7 4 12 40.0 40.0 86.7 5 2 6.7 6.7 93.3 6 2 6.7 6.7 100.0 Total 30 100.0 100.0
Existing literature shows that no. of children determines the probability of occurrence of diseases. If the family has more children, it is highly likely they get very less attention and hence become easy targets for disease causing pathogens through various sources, like contaminated food and water and also because of poor hygiene practices in the absence of care.

20
Respondents are the women of the family, and we interviewed mothers. Out of all the respondents, 19 were the housewives, 2 works in a private company, mainly stitching and cloth factories, 2 were self-employed, and they make maala using the flowers or vegetable vendors, and rest 7 works in different families to earn a living. Occupation of mother and father plays an important role in determining the prevalence of disease. How much time they devote to their children is an important factor in determining the occurrence of the disease. Out of all the 9 households where diarrhoea was reported, two of the mothers work as a house help in families, and rest all were housewife.
General Information_Respondent's occupation
Frequency Percent Valid Percent
Cumulative Percent
Valid Housewife 19 63.3 63.3 63.3 Private company
2 6.7 6.7 70.0
Self employed 2 6.7 6.7 76.7 Househelp 7 23.3 23.3 100.0 Total 30 100.0 100.0

21
Most of the male members work in private company, they are either daily paid workers in factories, or some work as electrician. One of them works as a guard in a private company. It was all kept under the category of private company because all of them are working under someone.
Almost equal numbers of people (12) in our survey are self- employed. Mostly were vegetable vendors. One of them irons clothes. Such similar nature of works is kept under this category. In one household, a person does not work anywhere due to poor health. One among them works as a labour.
Out of 9 diarrhoea cases reported, 6 people works in a private company, two of them are self-employed, they are vegetable vendors or shopkeeper, one of the respondents stays at home and does nothing because of health problem. They work for like 10-12 hours a day and do not get enough time for taking care of the family. Women alone do not go to hospitals, and male members hardly get time, and most of the disease lasts long due to lack of attention and immediate medication and care.

22
Occupation of spouse
Frequency Percent Valid Percent
Cumulative Percent
Valid Private Company
15 50.0 51.7 51.7
Self-Employment
12 40.0 41.4 93.1
Not Applicable 1 3.3 3.4 96.6 Labour 1 3.3 3.4 100.0 Total 29 96.7 100.0
Missing 99 1 3.3 Total 30 100.0
High incidence of diarrheal morbidity and mortality associated with untreated water among young children in northern Ghana is studied by Shier et al in 1996.

23
20 out of 30 households receive supply water and even make use of it for drinking purpose. 2 use tanker water for household chores. Most of the household use tanker water as drinking water and nobody uses groundwater for drinking purpose because of its taste. Most of the households complained about the quality of water, they say the supply water they store turns yellow in two-three days and cannot be used for drinking or cooking food. Despite this fact most of the people use supply water for drinking purpose because of low affordability. 3 use underground water and rest two households use both supply water and boring. Recently, in year 2018, Kolkata faced a major outbreak of diarrhoeal diseases in most of the areas because of the supply of contaminated water from Kolkata Municipal Corporation. Water is an important element in determining the occurrence of disease. It works as a medium for pathogens to spread.
Out of 30 households, 13 use supply water for drinking and cooking purpose, six find tanker water good for cooking and drinking, 10 take bisleri water and one of the household take both tanker and bisleri.
Nine houses that reported diarrhoea, out of those 9, four use supply water for drinking purpose, only one use cloth for filtration and boil water before drinking, rest drink it without filtering it. They store the water in buckets, jars and bottles. Two of them buy bisleri bottles and two uses tanker water for drinking. Last one household uses both tanker and bisleri. It was noticed that mothers education do play a major role, one of the educated respondent said that it is better to buy bisleri water than to spend lots of money on treatment of the disease. It shows they have some sort of idea about how water can be a good medium for pathogens to grow and spread and cause a disease.
Only 2 households which take supply water, filter the water before drinking. One of the households has RO in their home. 10 take bisleri bottles (packaged filtered water)- still two
Source of drinking water in Delhi
Frequency Percent
Valid Percent
Cumulative Percent
Valid Supply Water 13 43.3 43.3 43.3 Tanker 6 20.0 20.0 63.3 Bisleri 10 33.3 33.3 96.7 Tanker and bisleri
1 3.3 3.3 100.0
Total 30 100.0 100.0

24
diarrhoeal cases are reported from these households, five households use tanker water for consumption; two diarrhoeal cases are reported from these households. 11 use supply water, 4 diarrhoeal cases are reported from these households; remaining one household uses both tanker and bisleri bottles, and also reported diarrhoeal occurrence.
It is important to understand where do they store drinking water and in on how many days do they clean it. 9 households use plastic bottles, 5 use covered buckets, 3 use jars and rest use all of the mentioned storage vessels. 6 of the respondents said they wash the storage vessel on a daily basis, 4 said they wash it once in two days, 6 reported once in three days , one washes once a week and one takes a huge gap, and washes once in 11-12 days. The risk of contamination of water could be because of poor handling and storage (Boadi, K.O; kuitunen,M.(2005))

25
6 respondents said they judge the quality of water by just looking at it, i.e. how clean it looks, one judge the water on the basis of it taste, as most of the respondents complaint about the brackish taste of water. Twenty three respondents judge the water on the basis of transparency and smell. This data gives an insight of how people judge the water and decide whether it is suitable for drinking or not. Due to limited income and resources, they cannot afford filters and R.O but they can definitely go for other manual methods, but still they choose to drink water that comes from their tap or they use tanker water.

26
Total 16 households use personal toilets and rest 14 share toilets with other building members. 6 households that have reported diarrhoea have personal toilets in their home, rest 3 households share toilet with others. It is difficult to come at a particular conclusion in this case. Existing literature claims that people with shared toilet have high chances of diarrhoeal occurrence but in this case, data says otherwise. The household access to personal toilet facilities reduces the chances of diarrhoeal occurrence as high sharing of toilets leads to unsanitary conditions which enables the pathogens to grow and spread which also increases the probability of transmitting pathogens from one household to another and hence creates an unsanitary surrounding environment (Songsore and McGranahan (1993).
In this particular study most of the diarrhoeal cases are reported from these households which further question this query and hence opens the gate for other queries and variables which are actually playing a role in occurrence of the diseases.
Toilet availability
Frequency Percent Valid Percent Cumulative Percent
Valid Personal 16 53.3 53.3 53.3 Shared 14 46.7 46.7 100.0 Total 30 100.0 100.0

27
Hand washing data is necessary to determine the probability of disease. It has been already established by the existing literature that disease occurrence can be controlled and managed just by hand washing. Especially in case of diarrhoea, a lot of studies have already been conducted to determine how hand wash affects the occurrence of diarrhoea.
In this study, most of the people say they use soap for washing their hands. 8 use soap, 6 use both soap and liquid soap, only 1 household denied washing hands with soaps and only

28
washes hands with water, 14 said they use soap but sometimes only water is enough for cleaning hands.
Hand washing frequency is also determined by whether they have access to washbasin or not. 21 households did not have washbasin in their house.
In those 9 houses (reported past history of diarrhoea), 3 claimed that they wash their hands with soap; rest 3 said they wash it with soap but sometimes only water is enough.

29
Conclusion and Discussion:
The household socio-economic variables of wealth and education of mother is one of the important factors which are responsible for morbidity and mortality due to diarrhoea. Children or adults living in poor conditions have higher chances of getting diarrhoea in comparison to households living in better conditions; this could be due to inadequate access to environmental facilities and unsanitary environment in the home. The household socio-economic characteristics and the linkage with diarrhoeal occurrence have been explained in most of the literature (Martines et al., 1993; Alam, 1995; Ketema and Lulseged, 1997; Timaeus and Lush, 1995). Lower level of maternal education significantly impacts diarrhoeal occurrence. The rate of occurrence reduces with secondary or higher level of maternal education (Tagoe, 1995). Educated mother gives proper care and attention to the personal and domestic hygiene, takes proper care of the children, breast feeds new born babies all of which increases child’s immunity and resistance towards disease causing pathogens. Poor neighbourhood and surrounding sanitation conditions affects the health. Even the households with better domestic hygiene suffer if the surrounding environmental conditions are unhygienic and poor. These are the other factors that are responsible apart from WaSH practices.
It is the need to provide potable water and sanitation facilities to the needy or the poor.
30
References: [1] Fan, VY–M and A Mahal (2011): “What Prevents Child Diarrhoea? The Impacts of Water
Supply,Toilets, and Hand-washing in Rural India,”Journal of Development Effectiveness, Vol
3,pp 340–70.
[2] Fuentes, Ricardo, Tobias Pfütze and Papa Seck(2006): “A Logistic Analysis of Diarrhea
Incidence and Access to Water and Sanitation,” No.HDOCPA–2006–05, Human Development
ReportOffice (HDRO), United Nations Development Programme.
[3] Günther, I and F Günther (2010): “Water, Sanitation and Children’s Health: Evidence
from 172DHS Surveys,” World Bank Policy Research Working Paper Series, Vol 5275,
Washington DC: World Bank
[4] Panda, P K (1997): “The Effect of Safe Drinking Water and Sanitation on Diarrheal
Diseases among Children in Rural Orissa,” Working Paper Series: Centre For Development
Studies, Thiruvananthapuram.
[5] WHO/UNICEF (2014): “Joint Water Supply, Sanitation Monitoring Programme and World
Health Organization Progress on Drinking Water and Sanitation,” 2014 update.
[6] Ramani, S V, T Fruhauf, A Dutta and H H M Meijers (2012): “Determinants of the
Prevalence of Diarrhoea in Adolescents Attending School: A Case Study of an Indian Village
School,” UNUMERIT, Working Paper Series #2012–59, Maastricht, Netherlands.
[7] Kumar, S and S Vollmer (2013): “Does Access to Improved Sanitation Reduce Childhood
Diarrhoea in Rural India?” Health Economics, 22, 410–27.
[8] Bentley, M.E., 1988. Household management of childhood diarrhoea in rural North India.
Social Science and Medicine 27, 107–116.
Amol Padwad

Children’s awareness and engagement of the green spaces.
Summer internship report
Presented in Partial Fulfilment of the Masters Degree in the School of Human Ecology under the guidance of
Dr.Oinam Hemlata
by
Shahnaz Parveen MA in Environment and Development
School oh Human Ecology
Ambedkar University Delhi
2018-2020
Amol Padwad
Contents
x Introduction x Research Questions x Objectives x Study area and Methodology x Findings and Analysis x Gallery x Discussion x Conclusion x References

INTRODUCTION
The fact about the changing climate is not a secret anymore. Its presence can be seen in the daily lives of the inhabitants of this planet. All over the world many initiatives have been taken up by concerned citizens; governments and other bodies and also at individual levels. “Environmental responsibility means to possess a mental image of oneself as an important factor in the prevention and solution of environmental problems. To become responsible citizens, students must learn that people are an integral part of the biosphere, and that they respond to changes” (Wahlstrom,1998). It is often said that what is nurtured in a child at the young age stays with the child for life. And if this is true, then the children of today must be instilled with the ideas of sustaining the planet for tomorrow. They must be taught about the importance of the natural environment around us and how to build such an environment. According to culture and personality school of anthropology, character formation or personality development of an individual begins before the onset of the stage of adolescence where, it is mainly determined by environment, heredity, culture and peculiar experiences (Upadhyay and Pandey, 1993). Exposing a child to outdoor environmental activities will exhibit environmental safety habits and it will lead to a child becoming more aware about the environment. (Khawaja, 2003). The creeping in of concrete cover all around us has reduced the green cover in residential areas of big cities like Delhi, where green spaces has been reduced to only the parks manicured by gardeners and sometimes totally deserted parks with no green cover but few tools for playing are found. As such we often come across children whose engagement with the natural environment are totally cut down by the four walls of their house and with no knowledge of the true friends of men i.e., nature. It is then necessary to uphold the culture of engaging with nature. “In reference to Isaacs intellectual growth, points out the fact that children learn from physical contact in this world and that interest is strengthened when they grow curious and begin to ask questions about things and events of the of natural world. (Khawaja, 2003) However, how much of it is possible in the given space and the hectic lives of urban dwellers is the question.
This concern exists not only in one place but all around the world with the advent of urbanization. “…many children across the world, particularly within developing countries are confronted with the challenge of limited access to safe natural environments. In South Africa, for example, children are still burdened by the sociopolitical legacy of disenfranchisement ,… essentially denying them their right to engage in safe, child-friendly natural spaces” (Savahl & Adams ,2017).

“Environmental problems are not at all new phenomena. New however is the exponential growth of ecological problems after the Second World War, and this has broadly run parallel with the population explosion in developing countries and the development of technology and affluence in industrialized societies”. (Schleicher, 1989). Despite the significance and urgency shown towards environmental concerns all over the world, the burden of social inequality and deprivation for many populations, including children, often outweighs this and takes precedence (United Nations Children‟s Fund, 2013). It is estimated by 2050, impacts of climate change on mortality are projected to be greatest in south Asia. (The Hindu, 19 February 2017). And given that Asia hosts two of the most populous countries of the world it is further necessary to take measures starting right now. Taking a closer back at home, India has a large percentage of youth consisting it demography. And as such it becomes one of the prime concern that they are instilled with environmental knowledge. With this, concerns came up regarding how we address such issues of environment at local / regional and national level so that the roots of such problem are managed carefully. How do institutions engage on it? What should be made available at the school level in terms of infrastructure and curriculum when children are at their best level of perceiving and learning knowledge, a formative stage of their character and temperament which will be manifested in their life span at maximum? How do we create an environment conscious society through schooling? Though initiatives like free and compulsory education among children aged 6 to 14 years in the government schools have been taken up, it is yet to see how effective it has been in being inclusive of environmental education.
Keeping these thoughts in mind, I venture into the world of the children of primary school of east Delhi under the Government of Delhi and find out about their engagement with the available green spaces and facilities. The study further tries to get a grip on the amount of environmental awareness a child in primary level possess. The study seeks to analyze how the government school in east Delhi are maintaining greenery in their school and do they engage the little ones to engage in small but important activities such as planting a sapling and taking care of them. It also seeks the awareness among the students regarding segregation of waste disposal and other environmental basics. Therefore, as the children of today will take over the important decisions of tomorrow it necessary for them to be accustomed to environmental basics. “Childhood is an age when the gain of
knowledge is of critical importance. Younger children between the ages of 8 and 11 especially have very little knowledge of the environment. At this age, they are less likely to have well-established environmentally harmful behaviors to "unlearn" (Leeming et al. 1997), making them wonderful prospects for creating a more environmentally aware generation” (Khawaja,2003). This makes the study relevant to be conducted among the primary school students.
Research Questions:
1. What do these students know about or how much are they aware about the natural environment around them?
2. What is the level of participation and engagement with the green spaces among the students of primary classes in the government school of east Delhi?
Objectives:
1. To find out the level of awareness among children in primary school students.
2. To find out how the children of primary classes of the Delhi government schools of east Delhi utilize the green spaces and the available facilities around them to learn about the environment/nature.
Methodology and Study Area:
The study is qualitative in nature and includes review of secondary data as well as semi structured interview of thirty students of primary school. The location selected for the studying the research topic are few areas of East Delhi namely Trilokpuri, New Ashok Nagar, Shastri Park, Ganesh Nagar and Chander Vihar.The study is a product of the findings from the interviews conducted in the mentioned areas with the students from the primary sections. The study areas consisted of clustered housing facilities with very little space for any gardening. Moreover, since the houses were rental houses therefore, gardening was a luxury that these families could not afford. Some of the areas

have very poor drainage system and dilapidated roads that flooded during rainy season often leading to over flowing of the sewage system. The schools that were visited as a part of the field survey had green spaces in partial, however one of them is well maintained with ample amount of trees and plants and clean surroundings, others were poorly maintained with low level of hygiene as well as green spaces. Data collection was done through a list of questions which was prepared in mind the research question and objectives and the students that were interviewed. Some interviews were conducted in the school itself where the students were gathered with the help of SEEDS volunteers (an organization that is helping low income families intervening in the matters of hygiene through the students who study in the EDMC schools). Rest of the interviews were conducted by visiting the house of the students as it was the time of summer vacation for these schools. The data analysis has been done through discourse analysis method and using the Software Package for Social Sciences (SPSS). The field diary with extended notes for each interviewer has been maintained. Further with the help of the software analysis has been done to compare and see the data among different variables using graphs and other indicators.
Literature Review:
This section is an attempt in explaining and understanding the already existing literature on the selected topic and bring out what is their relevance in understanding the research questions along with the objectives. The literature has been used to understand the research topic for different perspectives forwarded by different scholars on the same or similar topic. These have also been used for creating the questionnaire for interviewing the students according to their mental capability to answer and understand the questions.
The paper „Geographies of environmental learning‟, concentrates on how school grounds can effectively help children learn and built their relationship with the environment. The importance of school playground in shaping a child‟s personality is brought out to light. The researchers have extensively used mapping of the physical features in the trying to find out the environmental learning opportunities. Exposure of games with the environment helped to build co-operative rather than
competitive play within the children groups. Another finding suggests that children exposed to nature are less likely to be of aggressive nature. The research however is confined to only two schools. an insight of a larger number if suggests the same results would be fruitful. Also a dire need of green spaces would be required for a school. (Tranter & Malone,2004)
The paper „Grounds for health: the intersection of green school grounds and health‐ promoting schools.‟ highlights the mounting importance of green school playgrounds in enhancing various dimensions of child‟s school life. The direct link of green spaces to the health of the children indicates the necessity of boosting availability of green grounds in school. Exposure to the natural world however concerns to the safety of the children. In order to take both green grounds and safety parallely, a framework design must be put into effect. ( Bell & Dyment ,2008)
The study on „Young Children‟s representation of the environment‟ deals with a child‟s perception of its environment which includes surroundings that a child lives in daily. It tries to focus on the spatial awareness of a child about its environment through maps and other tools. The methods used in the study includes sampling and selectively choosing schools for comparison among various factors. The results found through this indicated that most of the children are well aware of its surroundings and are able to memories even the complex of routes. This in turn can be used to understand their cognitive map skills and further improve their performance level. ( Matthews, 1985)
The article titled „Investigating Children's Play Preferences and Safety in New Zealand Playgrounds‟ ventures into the risks and challenges posed by the playgrounds for children and the possible safety standards necessary for the same. Using observation as a tool the study was carried out in 56 different schools in New Zealand. Difference in the presence in playgrounds on the basis of gender was visible with the older children population being mostly unsupervised and the vice versa for the younger ones.With swings as the most popular tool to play with, the accident frequency (which was very less) has been also observed. The need of the hour is to build children friendly playgrounds in more and more schools which will pave the way for a healthier generation who indulges in interactions with the environment. (. Sargisson & McLean, 2013)
“Environmental responsibility means to possess a mental image of oneself as an important factor in the prevention and solution of environmental problems. To become responsible citizens, students must learn that people are an integral part of the biosphere, and that they respond to changes” (Wahlstrom,1998). Here the author focuses on the responsibility of each one of us as an individual towards our environment and how it becomes necessary to visualize ourselves as significant carriers of this responsibility. And therefore it is important that this mentality be instilled in the children of today to build a better tomorrow.
Khawaja in his paper on „Measuring the environmental attitudes of children in grade 4: A study in Clark County‟ writes “exposing a child to outdoor environmental activities will exhibit environmental safety habits and it will also lead to the child becoming more aware about the environment” indicating clearly the necessity to make children accustomed with its natural environment. He adds further “in reference to Isaacs intellectual growth, points out the fact that children learn from physical contact in this world and that interest is strengthened when they grow curious and begin to ask questions about things and events of the of natural world.” and also says that “Childhood is an age when the gain of knowledge is of critical importance. Younger children between the ages of 8 and 11 especially have very little knowledge of the environment. At this age, they are less likely to have well-established environmentally harmful behaviors to "unlearn" (Leeming et al. 1997), making them wonderful prospects for creating a more environmentally aware generation.”
Findings and analysis:
Objective 1:
Awareness among students of primary sections about the environment.
The importance of environmental awareness can be seen in the fact that most of the students of the study group answered one benefit in common that we get from trees and that is oxygen. This shows the fact that students are aware at the least about oxygen coming to us from trees and hence their importance in our lives. Therefore „ecological literacy‟- a term that involves a developed affinity and includes the basic principles of ecology such as water, forests, soil, earth and life Out of all the students most 5th grade students could state the maximum number of
benefits that we get from trees such as water, shadow, fruits, vegetables, pages, wood/timber, furniture. However, it is seen that 50% of the students had no knowledge about how plants grow and the rest of the students answered that they grow taking in water, sunlight. As almost all students were well informed about the importance of trees therefore in accordance to that they replied that trees should be cut down, when asked about the reason for saying so they went back to the benefits that we acquire from trees.
Moving away from the mere importance about the presence of trees and plants on this earth, the study ventured into the awareness about sustainability and the daily practices involved to achieve it. This was analyzed by asking few questions regarding segregation of waste. While it is seen that five students did not answer regarding the availability of dustbins, (Biodegradable and non-biodegradable ones) the students from EDMC school Shastri Nagar reported that they did have the segregated dustbins, it was there before but since sometime they have been missing from the school premises. 17 students out of all could identify the purpose for segregating the dustbins according to their color as shown in the cross tabulation laid out in the following section. Students described the dustbins mostly as green and blue in color and the students from 2nd grade mostly described the dustbins found inside their class and red, yellow and other colors. One of the most important finds through this study is the segregation of waste and throwing them into their allotted dustbins. The concept of dry and wet waste is known to the students however, when they were asked to identify they seemed really confused regarding which waste would go into which dustbin. It can be seen that only 9 students out of all could reply correctly regarding throwing of dry waste into the blue dustbins. And interestingly the students who answered correctly belonged to 4th and 5th standard showing that the students from lower sections were not well accustomed to dry and wet waste. Further not all students from 4th and 5th standard could identify segregation of waste correctly, this shows the need to put them into more rigorous practice among them regarding the same.
Objective 2:
Utilization of green spaces and facilities available
The study areas chosen for the study of this research topic has one or the other park available nearby all the respondents‟ house. They are used extensively by some students and rarely by others for various reasons that are included in the sections that‟s follows. Availability of park is one major component for students being able

to engage themselves and utilize the green spaces as in the cities there are already very less green spaces left. In schools too, the availability of different trees and plants can help the growth and learning of students for they give fresh air secondly availability of green spaces makes the students accustomed to the uses of it. Among the thirty students that were interviewed about 93% reported of parks being available near their houses. Out of 27 seven students that responded, for 23 of them the parks were nearby and for the others it was a little far away or very far from home. All of the students have basic idea about what a forest is and what are the things found there but not all of them have visited or ever come across a chance to visit a forest. A few of the students have been to the zoo with their parents or their teachers.
The parks are mostly used for playing by the students. Other than that the students play with the tools installed for public for exercising in the park. Many girls like to play with the swings however, in one of the study area (New Ashok Nagar) it was reported that the park hardly had any green covered and therefore the turnout of students especially girls visiting that park was less in number and only the boys used the park for playing cricket and swings. The frequency of visit to the parks varied from daily for a few and sometimes in a week for most of them and a few of them said they never go to the park.
If we take a look at the number of children who has experience of planting plant and tree saplings, almost 53.3 percent have at some point or the other had the experience. others children have not yet engaged themselves with planting. According to 17 students who had answered taking caring of plants can be done by watering them. And most of the students were unable to answer to this question. Laying out a reflection of the findings from the study it can be seen that the engagement to the green spaces in case of these students is mostly restricted to the available parks nearby their houses whom they use for playing with friends and sometimes with the available gym tools. The engagement is seen more in case of the boys who extensively uses these space to play cricket. And among the girls few of them play with the swings and other local games. Students are also not fully active with plantation as can been seen in the data.

Gallery:
A collections of snapshots collected during field visit has been included in the following section:
1. EDMC school Chander Vihar 2. EDMC school Trilokpuri

3.Drying up pots in EDMC school New 4. Initiatives taken in EDMC school
Ashok Nagar Shastri Nagar for spreading awareness.
Discussion:
Average number of students were found to have common knowledge about the benefits of trees and its availability. The study by Ayodeji Ifegbesan, suggests that environmental education introduced in the schools can equip students in gaining environmental awareness and their knowledge on sustainability. In the schools that were looked into in the survey, initiatives to spread awareness through pictures in the classroom walls and the school building had been taken,

however, some practical involvement would always be better because children can remember them for longer period.
Awareness regarding segregation of waste exists but not properly as purpose for segregation of dry and wet waste could not be identified by maximum of the study sample. Segregation of waste can be beneficial at various levels in our quest to tackle with environmental problems, the mammoth problem of educating about it in populous countries like India can be reduced to great levels if the students are involved in it, for they can then become the campaigner of it in their homes and at any public spaces.The study by Chintan also shows the inability of identifying categories of waste and segregation of it into different colored dustbins. This could be because of the information provided at the primary level of school or no curriculum on it. Looking at the study it is clear that the existing awareness regarding the environment is not adequate among children studying in primary sections. As pointed out by Leeming and others children aged between 8 to 11 have great ability of grasping knowledge, hence increasing the acute amount of knowledge regarding among this group is highly recommended. Students‟ engagement with the environment is poor, apart from playing certain games in the park in the evening many avoided going to the park because of safety reasons, the importance of building safe playgrounds for children was emphasized by Sargisson & McLean, 2013 .
Conclusion:
Environmental awareness and engagement is a critical aspect for survival, its significances will have to be incorporated in the present world in different forms whether at home or school. Our children know more about cell phones at young age than the natural environment, thus it‟s the high time for all of us to become aware and engage with the environment. All the initiatives taken everywhere in the country will have no meaning if cannot be continued and to continue them the

habitants of then (children of today) must know the way. Therefore, elevating the necessity to educate them today. As shown in Wang Min that elevation of environmental awareness will in turn promote environmental protection. Engagement with the natural environment is the need of the hour. Ensuring this will further need detailed and structured plan to be carried out among the children. Few ways to incorporate engagement and awareness could be to organize workshops and games especially designed for environmental learning and segregating waste by students. Organizing short trips to the zoo or botanical garden to indulge the students and getting them attracted to the natural environment. Attitude of parents at home also plays an important role in ensuring the task.
Biodegradable and non-biodegradable dustbins at
EDMC school Chander Vihar
References:
x Anne C. Bell & Janet E. Dyment. (2008). Grounds for health:
the intersection of green school grounds and health promoting schools. Environmental Education Research.
x Rebecca J. Sargisson and Ian G. McLean. (2013). Investigating Children's Play Preferences and Safety in New

Zealand Playgrounds. Children, Youth and Environments. University of Cincinnati.
x Khawaja, A. (2003). Measuring the environmental attitudes of children in grade 4: A study in Clark County .
x Matthews, M. H. (1985). YOUNG CHILDREN'S REPRESENTATIONS OF THE ENVIRONMENT: A COMPARISON OF TECHNIQUES. journal of Environmental Psychology.
x Min, W. (1996). Environmental awareness in primary and middle schools in China - A research report . Internationale Schulbuchforschung, Vol. 18, No. 2 , pp. 135-162 . Berghahn Books.
x Sabirah Adams & Shazly Savahl. (2017). Nature as children's space: A systematic review. The Journal of Environmental Education.
x Schleicher, K. (1989). Beyond Environmental Education: The Need for Ecological Awareness . International Review of Education Vol. 35, No. 3x, pp. 257-281 . Springer.
x Susan Edwards, Helen Skouteris, Amy Cutter-Mackenzie, Leonie Rutherford, Mandy O‟Conner, Ana Mantilla, Heather Morris & Sue Elliot. (2015). Young children learning about well-being and environmental education in the early years: a funds of knowledge approach. An International Research Journal.
x Wahlstrom, R. (1998). A HOLISTIC APPROACH TO ENVIRONMENTAL EDUCATION .
Amol Padwad
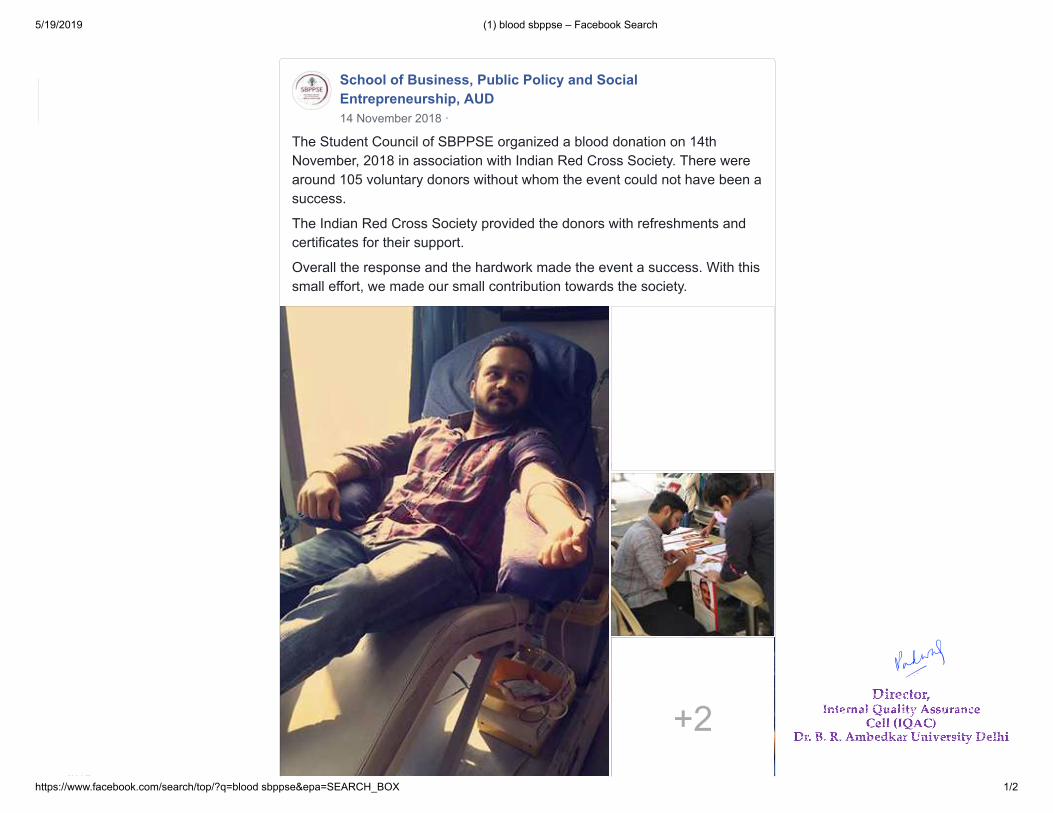
5/19/2019 (1) blood sbppse – Facebook Search
https://www.facebook.com/search/top/?q=blood sbppse&epa=SEARCH_BOX 1/2
Filter results
POSTS FROM
Anyone
You
Your friends
Your groups and Pages
Public
Choose a source...
POST TYPE
All posts
Posts you've seen
POSTED IN GROUP
Any group
Your groups
Choose a group...
TAGGED LOCATION
Anywhere
New Delhi, India
Lucknow, Uttar Pradesh
Choose a location...
DATE POSTED
Any date
2019
2018
School of Business, Public Policy and Social Entrepreneurship,AUD17K like this · Delhi, India · College & University
14 Nov 2018 · · The Student Council of SBPPSE organizeda blood donation on 14th November, 2018 in associationwith Indian Red Cross Society. There were around 105voluntary donors without whom the event could not havebeen a success. The Indian Red Cross Society provided…
9Gurjeet Singh, Keshav Bhatia and 7 others
School of Business, Public Policy and Social Entrepreneurship,AUD17K like this · Delhi, India · College & University
11 Oct 2017 · · SBPPSE organised a Blood Donation Campat the Kashmere Gate campus in association with IndianRed Cross Society on October 10, 2017. Several volunteerscame forward to donate for the noble cause. There was aSweet Spirit throughout the day as we served together…
41Nitin Sharma, Manasa Narayan and 39 others
School of Business, Public Policy and Social Entrepreneurship,AUD17K like this · Delhi, India · College & University
29 Mar 2017 · · …a life by what we give! Students ofSBPPSE got an opportunity to reach out to the communityat Ambedkar University Delhi, where they did their bit byhelping and giving recognition to the Guards, Kitchen Staffand Sulabh Workers.Students put up Blood Donation…
15Aman Deep Singh, Subathra Venkat and 13 others 2 shares
Privacy · Terms · Advertising · ·Cookies · MoreFacebook © 2019
English (UK) · English (US) · �ह�द� · ਪੰਜਾਬੀ · اردو
AdChoices
All Posts People Photos Videos Pages Places Groups Apps Events Links
Chat (77)
Kritika Home Create 1blood sbppseSchool of Business, Public Policy and SocialEntrepreneurship, AUD
The Student Council of SBPPSE organized a blood donation on 14thNovember, 2018 in association with Indian Red Cross Society. There werearound 105 voluntary donors without whom the event could not have been asuccess.
The Indian Red Cross Society provided the donors with refreshments andcertificates for their support.
Overall the response and the hardwork made the event a success. With thissmall effort, we made our small contribution towards the society.
14 November 2018 ·
+2
Amol Padwad

5/19/2019 (1) blood sbppse – Facebook Search
https://www.facebook.com/search/top/?q=blood sbppse&epa=SEARCH_BOX 2/2
2018
2017
Choose a date...
Filter results
POSTS FROM
Anyone
You
Your friends
Your groups and Pages
Public
Choose a source...
POST TYPE
All posts
Posts you've seen
POSTED IN GROUP
Any group
Your groups
Choose a group...
TAGGED LOCATION
Anywhere
New Delhi, India
Lucknow, Uttar Pradesh
Choose a location...
DATE POSTED
Any date
2019
2018
School of Business, Public Policy and Social Entrepreneurship,AUD17K like this · Delhi, India · College & University
14 Nov 2018 · · The Student Council of SBPPSE organizeda blood donation on 14th November, 2018 in associationwith Indian Red Cross Society. There were around 105voluntary donors without whom the event could not havebeen a success. The Indian Red Cross Society provided…
9Gurjeet Singh, Keshav Bhatia and 7 others
School of Business, Public Policy and Social Entrepreneurship,AUD17K like this · Delhi, India · College & University
11 Oct 2017 · · SBPPSE organised a Blood Donation Campat the Kashmere Gate campus in association with IndianRed Cross Society on October 10, 2017. Several volunteerscame forward to donate for the noble cause. There was aSweet Spirit throughout the day as we served together…
41Nitin Sharma, Manasa Narayan and 39 others
School of Business, Public Policy and Social Entrepreneurship,AUD17K like this · Delhi, India · College & University
29 Mar 2017 · · …a life by what we give! Students ofSBPPSE got an opportunity to reach out to the communityat Ambedkar University Delhi, where they did their bit byhelping and giving recognition to the Guards, Kitchen Staffand Sulabh Workers.Students put up Blood Donation…
15Aman Deep Singh, Subathra Venkat and 13 others 2 shares
Photos See all
SBPPSE Events, AUD369 like this · Delhi, India · College & University · Pankaj Prasad and 3 others…
21 Feb 2016 · · SBPPSE Events, AUD added a new photo.
6You, Shivam Kaushik, Pankaj Prasad and 3 others 1 share
Kritika Mathur shared School of Business, Public Policy andSocial Entrepreneurship, AUD's postAssistant Professor at School of Business, Public Policy and Social Entrepren…
25 Oct 2018 · · SBPPSE Corporate Brochure JPG File PDFVersion available athttp://aud.ac.in/upload/2018/student/sbppse/Corporate-B h SBPPSE2018 19 14k df
Privacy · Terms · Advertising · ·Cookies · MoreFacebook © 2019
English (UK) · English (US) · �ह�द� · ਪੰਜਾਬੀ · اردو
AdChoices
All Posts People Photos Videos Pages Places Groups Apps Events Links
Chat (77)
Kritika Home Create 1blood sbppse
;
234People reached
34Engagements
Boost Post
9Keshav Bhatia, Sumedha Rawat and 7 others
Comment ShareLike
Amol Padwad

Rural Study Module From the 13th of September and 25th September, 2015.
Led by Venugopal Maddipati and Under Mango Tree Architects. A rural study was conducted with the 1st year studens of the MDes Social Design program by Dr. Venugopal Maddipati with help of the organization Under Mango Tree. About Under Mango Tree Architects: The organization is a Delhi-based multi-disciplinary architecture practice with a global reach. The organization works closely with clients and communities across the fields of architecture, urbanism and design. In 2014, Under Mango Tree Architects were selected for the Design X Design exhibition by the Alliance Francaise which featured the work of twenty young and exciting designers and practices. About the Rural Study in Bathara Village. The students of MA Social Design pursued a fieldwork based internship project in the village of Bathara in the Shimla District in Himachal Pradesh. In this project students mapped out both, socio-economic and cultural constructions of the village, and continuing transformations in the village. Students documented the manner in which knowledge systems and practices in the village were changing or evolving over time, so as to understand the roles that societies and communities have in shaping their environments, and vice versa. Students took both, a microscopic view towards the village communities in their own right, and also a macroscopic view towards the ways in which these communities were enmeshed in a wider spatial net comprising other nearby villages and urban centres. Students also mapped out transformations in traditional knowledge systems to learn how vernacular forms of thinking about objects evolve to keep pace with evolving economic and cultural contexts. The village of Bathara is located near the pilgrimage site of Sarahan. The region around Sarahan has undergone a significant transformation with the creation of a large thermal power plant on the adjoining Sutlej river. Moreover, the tourism industry centred in nearby Kinnaur has had a significant impact on the economic profile of the village. In this regard, the rural study explored the peculiar ways in which the physical, material and artisanal practices and the social and economic order of Bathara have been changing. 14 students left from New Delhi on the 13th of September 2015 and arrive at the village by 15th of September 2015. They were hosted by the Sarpanch of the village at a local hotel and travelled to adjoining villages using mostly public modes of transportation or rented vehicles when required.
Amol Padwad

Rural Study Trip - Jatan Sansthan A fieldtrip comprising a total of 28 students of MDes Social Design was organised from 23rd to 29th of September 2018 with the help of Jatan Sansthan and Vikalp design, located close to Udaipur, Rajasthan. JATAN SANSTHAN is a grassroots not-for-profit organization working with rural and resource poor communities the state of Rajasthan, India in the districts of Rajsamand, Udaipur and Bhilwada. Jatan has its presence in more than 250 villages across these areas, which have traditionally had poor social indicators. Since its establishment in 2001, Jatan has designed and implemented various initiatives geared towards improving social and demographic indicators by working with youth groups. In the last decade, Jatan has worked on programs related to children, young people and women in the areas of health and education. Vikalp design, since 1988, has designed visuals, sensitive to cultural and societal norms for non-literate and low literate audiences. Through interactive communication, Vikalp design seeks to encourage individual action and empower young women and men to share their knowledge with others in the community. Workshop objectives were based on extensive work done by Jatan Sansthan towards:
• Understanding the basics of gender and its role in Society • Role of design in development • Understanding migration • Reproductive health session • Understanding the domestic violence act • Pittrasatta and its role in society • How are Anganwadis run?
16 students from third semester led by their course faculty Ms. Divya Chopra critically looked at the interface between the rural and urban beyond the obvious dichotomies in terms of interdependence, issues, conflicts and contestations as part of the contemporary rural-urban debate. Ms. Khushbu Dublish as part of the Design Process studio accompanied 12 first semester students along with Dr. Venugopal Maddipati who joined the extended part of the trip in Udaipur.

Rural Study Trip - Sambhaavnaa The students of MDes Social Design participated in Rural Studies fieldwork from 1st to 8th October 2017 as part of their third semester course: Examining Rural and Urban. For the purpose of this field visit, students and faculty members were hosted by Sambhaavnaa Institute, which is situated close to Kandbari village, Palampur, Himachal Pradesh. Sambhaavnaa Institute is an alternative learning and living space for those concerned with social and political change. Founded under aegis of the Kumud Bhushan Education Society in 2004 Sambhaavnaa’s main mission has been to nurture value-based leadership by encouraging individuals, especially the youth; to discuss and develop a critical perspective on the ideals and ideas that define a just society. It has emerged as a platform to engage and reflect on processes of transformation. Sambhaavnaa offers an appropriate setting for the students of Social Design Program to engage with as they map out the rural settlement through multiple perspectives towards creating a holistic understanding of unique ecologies that characterize its complex dynamics. A total of 12 students led by course faculty Ms. Divya Chopra attended the weeklong workshop, which focussed on the idea of development and related aspects of water (jaal), forest (jungle) and land (zameen). The workshop involved structured discussion on each of the themes along with field visits. Students primarily researched based on site observations, reference to key points in notes, discussions and interaction with local resource persons. Objective of the study was:
• To understand the system of land use and farming in the village • To understand the forest systems and the dependence on forests for
livelihoods • To understand the water systems in the village and dependence on these
for lives and livelihoods Outcome of the course was multi-layered mapping of the identified themes and issues within the rural settlement, focussing on urban – rural flows be it material, human, financial, technological etc. that significantly characterize the dynamic conditions of interchange and interdependence using various tools, methods and mediums.
Amol Padwad

Understanding Intersectionality: Winter Semester, January to April 2017.
The Course titled “Understanding Intersectionality” was taught in the winter semester that began in January 2017, in a collaborative manner between ActionAid India and the School of Design, Ambedkar University. ActionAid India is an organization in India, since 2006, that is part of a global federation and a full affiliate of ActionAid International that has presence in over 40 countries worldwide.
About Intersectionality: Intersectionality emerged as a theme in social science and humanities thinking in response to normative conceptions of social justice in identity politics. If, traditionally, race, gender, caste, and class were presented as normative axes along which exclusion and marginalization manifested itself in societies, the intersectional approach towards exclusion and marginalization entailed taking into account intra-group differences. Intersectionality took into account the manner in which exclusion and marginalization were also embedded within identity categories, particularly in the manner in which specific identities were themselves always already riven and co-instituted by their cross-correspondence with other identity categories. Given how Social Design as a field approaches social inclusion as a way of expanding the domain of service-oriented, systems-oriented and infrastructure-oriented design-thinking, taking an intersectional approach towards recognizing patterns of exclusion becomes vital for the Social Designer. Since Design presents itself as a language of solutions to complex social problems, relying on an intersectional approach enables Social Designers to recognize the complex, layered and interconnected social circumstances which give rise to problems in the first place. Approaching problems parametrically, that is, by viewing how different parameters converge or intersect differently in different circumstances to disempower people, designers can also think of solutions to problems parametrically, by emphasizing the sheer diversity of ways in which people can be empowered.
The course was offered in multiple sessions, with field-based experts being brought in to deliver key lectures. The session plans were organized as follows.
No Topic Resource persons
1 Historical context of intersectionality: Origin of
universe and looking at the various inequities Structure of various societies: Primitive, slave, feudal, colonial, post-colonial, capitalist
Sarika Sinha
Dr. Sanjay Kumar
2
Understanding injustice, inequality and exclusions based on caste, class, religion, gender, ethnicity, race, geographic location, sexuality,
Dr. Kshithij Urs
Prabhakar
3 Unpacking inequity of Religion/minority Zakia
4 Unpacking gender/Sexuality inequity Sarika
Sinha
5 Looking at various movements to further unpack
intersectionality: Indu
6
Looking at the phenomenon of intersectionality in the contemporary world from the framework of law, policy and politics
Kshithij Urs
Sandeep Chachra
Amol Padwad

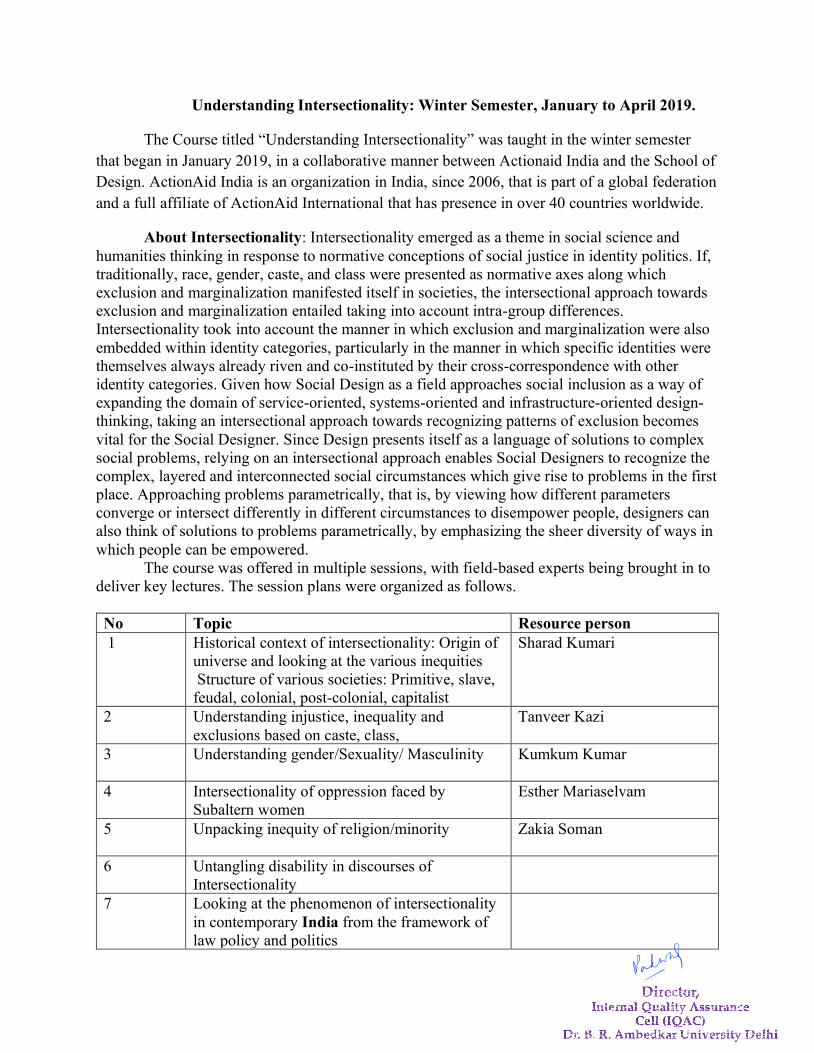
Understanding Intersectionality: Winter Semester, January to April 2019.
The Course titled “Understanding Intersectionality” was taught in the winter semester that began in January 2019, in a collaborative manner between Actionaid India and the School of Design. ActionAid India is an organization in India, since 2006, that is part of a global federation and a full affiliate of ActionAid International that has presence in over 40 countries worldwide.
About Intersectionality: Intersectionality emerged as a theme in social science and humanities thinking in response to normative conceptions of social justice in identity politics. If, traditionally, race, gender, caste, and class were presented as normative axes along which exclusion and marginalization manifested itself in societies, the intersectional approach towards exclusion and marginalization entailed taking into account intra-group differences. Intersectionality took into account the manner in which exclusion and marginalization were also embedded within identity categories, particularly in the manner in which specific identities were themselves always already riven and co-instituted by their cross-correspondence with other identity categories. Given how Social Design as a field approaches social inclusion as a way of expanding the domain of service-oriented, systems-oriented and infrastructure-oriented design-thinking, taking an intersectional approach towards recognizing patterns of exclusion becomes vital for the Social Designer. Since Design presents itself as a language of solutions to complex social problems, relying on an intersectional approach enables Social Designers to recognize the complex, layered and interconnected social circumstances which give rise to problems in the first place. Approaching problems parametrically, that is, by viewing how different parameters converge or intersect differently in different circumstances to disempower people, designers can also think of solutions to problems parametrically, by emphasizing the sheer diversity of ways in which people can be empowered.
The course was offered in multiple sessions, with field-based experts being brought in to deliver key lectures. The session plans were organized as follows.
No Topic Resource person 1 Historical context of intersectionality: Origin of
universe and looking at the various inequities Structure of various societies: Primitive, slave, feudal, colonial, post-colonial, capitalist
Sharad Kumari
2 Understanding injustice, inequality and exclusions based on caste, class,
Tanveer Kazi
3
Understanding gender/Sexuality/ Masculinity Kumkum Kumar
4
Intersectionality of oppression faced by Subaltern women
Esther Mariaselvam
5
Unpacking inequity of religion/minority Zakia Soman
6
Untangling disability in discourses of Intersectionality
7
Looking at the phenomenon of intersectionality in contemporary India from the framework of law policy and politics
Amol Padwad


1
Report: Medical Camp by MBA students of SBPPSE
A medical camp was set up by the students of MBA Programme (2016-18) of SBPPSE in March 2017 as a part of their course on Business Ethics and Corporate Social Responsibility. The course instructor was Dr. K. Valentina.
The medical camp was organised in collaboration with Dr. Dinesh of Sunrise Labs. The following facilities were provided to the Guards, House Keeping Staff and Staff of the Canteen of AUD:
1. Blood Pressure Check
2. Blood Sugar Check
3. BMI Evaluation
The funds for the camp had been generated by the students through their initiative in a course on Leadership and Change during the same semester of MBA Programme. Approximately 40 persons got their medical check up conducted at the camp.
The details of the beneficiaries and the pictures are given below:
Amol Padwad

2

3

4

5
Amol Padwad

5/19/2019 (1) sbppse raahgiri – Facebook Search
https://www.facebook.com/search/top/?q=sbppse raahgiri&epa=SEARCH_BOX 1/1
Filter results
POSTS FROM
Anyone
You
Your friends
Your groups and Pages
Public
Choose a source...
POST TYPE
All posts
Posts you've seen
POSTED IN GROUP
Any group
Your groups
Choose a group...
TAGGED LOCATION
Anywhere
New Delhi, India
Lucknow, Uttar Pradesh
Choose a location...
DATE POSTED
Any date
2019
2018
2017
Choose a date...
School of Business, Public Policy and Social Entrepreneurship,AUD17K like this · Delhi, India · College & University
14 Dec 2014 · · #SBPPSE at #Raahgiri. Colourcoordinated, we were all over the place. We loved it, theyloved us! :) Be a part of this young and vibrant university:http://aud.ac.in/mba2015 #Throwback #MBAadmissions#AUD
19Mayank Sharma, Prerna Mehta Rai and 17 others 1 share
School of Business, Public Policy and Social Entrepreneurship,AUD17K like this · Delhi, India · College & University
17 Oct 2016 · · The students of SBPPSE participated inPink Raahgiri to support Breast Cancer Awareness. Thestudents engaged the crowd through their danceperformances, JAM Session, and Nukkad Natak (StreetPlay). We would like to thank YesToLife for giving us the…
28Nitin Sharma, Aditya Gupta and 26 others
School of Business, Public Policy and Social Entrepreneurship,AUD17K like this · Delhi, India · College & University
16 Oct 2016 · · The students of SBPPSE are participating inPink Raahgiri Day! Look out for more updates#pledgetoconquercancer
7Pankaj Prasad, RisHabh JaIn and 5 others
Photos See all
PrivaCookFace
Englاردو
All Posts People Photos Videos Pages Places Groups Apps Even
Chat (77)
Kritika Home Create 1sbppse raahgiri
;
School of Business, Public Policy and SocialEntrepreneurship, AUD
The students of SBPPSE participated in Pink Raahgiri to support BreastCancer Awareness. The students engaged the crowd through their danceperformances, JAM Session, and Nukkad Natak (Street Play). We wouldlike to thank YesToLife for giving us the opportunity to create awarenessabout the cause and interact with champions who have defeated BreastCancer.
17 October 2016 ·
+3
Boost Post
28Mansi Saini, Astha Sabharwal and 26 others
Comment ShareLike
Amol Padwad

Draft Report 10 Nov 2016
1
Need Assessment on Demand for Tertiary Education in NCT Area of Delhi
Draft Report (04.11.2016)
Project Team
Prof. Chandan Mukherjee Dr. Nakkeeran Nanjappan
Dr. Gunjan Sharma Akha Kaihrii Mao
Shamshad Ali Laxmi Kumari
Ambedkar University Delhi (AUD) Lothian Road, Kashmere Gate, Delhi -110006
Amol Padwad

Draft Report 10 Nov 2016
2
ACKNOWLEDGEMENT
ACKNOWLEDGEMENT
We wish to express our sincere gratitude to Directorate of Education (DOE), Government of Delhi for permitting us to undertake this study in Government schools under DOE. We would like the thank Smt. Punya Salila Srivastava, IAS, Secretary (Education), Government of Delhi and Smt. Padmini Singla IAS, the then Director (Education), Government of Delhi, Directorate of Education for formally approving the study and extending necessary support to successfully conduct this study.
We would like to express our sincere gratitude to the Ambedkar University Delhi (AUD) for a liberal grant with a great degree of freedom. We specially thank Prof. Shyam Menon, Vice Chancellor of AUD, for constant support and guidance all through the work. We also thank our colleagues at AUD for their valuable inputs provided during several internal consultations.
Our sincere thanks to Prof. A. B. L. Srivastava, Chief Consultant, Research at Sarva Shiksha Abhiyan, Prof. Sitanshu Jena Chairman, National Institute of Open Schooling, NOIDA, India, and Prof. Venita Kaul, Dean of School of Education Studies, AUD for the guidance in the formulation of the study.
Our deepest appreciations are extended to School of Education, AUD for the support it extended in many fronts including allowing students of MA (Education) to take part in the study.
We would like to thank our study participants including students, parents for their time, consent and enthusiastic participation in the study. We also thank all the students, teachers and principals from the schools that were studied for helping us to complete the study.
Our special thanks to students of M.A Education (2015-17) of AUD and Ms. Ashima Jain, Anjali Sharma, Ms. Harsha and Ms. Vaishali, students of M.A Education (2014-16) AUD who diligently collected and entered the data for this study.
We would like to thank Mr Shamshad Ali and Ms. Laxmi Kumari, Research Assistant at Centre for social science Research Method (CSSRM), AUD for their participation and constant support throughout the study.
N. Nakkeeran Prof. Chandan Mukherjee Associate Professor Director CSSRM CSSRM AUD AUD

Draft Report 10 Nov 2016
3
CONTENTS
Page no.
Acknowledgement ii
Content iii
Glossary iv
Chapter I: Introduction 1-2
Chapter II: Methodology 3-6
Chapter III: Profile of Schools 7-19
Chapter IV: Profile of Students 20-73
Chapter V: Scope for Entry- level tertiary education in NCT area 74-77
Chapter VI: Summery 78-87
Chapter VII: Conclusion 88-92
Annexure 93-109
Reference 110

Draft Report 10 Nov 2016
4
GLOSSARY AICTE All India Council for Technical Education ANM Auxiliary Nursing and Midwifery CD Central Delhi CGPA Cumulative Grade Point Average COM+M Commerce with maths COM-M Commerce without maths D.El.Ed Diploma in Elementary Education DIET District institute of education and training. DISE District Information System for Education DoE Directorate of Education ECCE Early Childhood Care Education ED East Delhi FGD Focus Group Discussion GBSSS Government Boys Senior Secondary School GGSSS Government Girls Senior Secondary School GNM General Nursing and Midwifery GSSS Government Senior Secondary School IDI In-Depth Interview IELTS International English Language Testing System IGDTUW Indira Gandhi Delhi Technical University for Women IGNOU Indira Gandhi National Open University ITI Industrial training Institute JNU Jawaharlal Nehru University NCERT National council for educational research and training NCT National Capital Territory NCVT National council for vocational training ND New Delhi NED North East Delhi NEUPA National University of Education Planning and Administration North D North Delhi NWD North West Delhi PCB Science with physics, chemistry and biology PCM Science with physics, chemistry and maths PCMB Science with physics, chemistry, maths and biology PG Post Graduation RPVV (Co- Ed) Rajkiya Pratibha Vikash Vidyalaya (Co- Education) SBV Sarvodya Bal Vidyalaya SCERT State council for educational research and training SCVT State council of vocational training SD South Delhi SKV Sarvodya Kanya Vidyalaya SSSS Sarvodya Senior Secondary School SWD South West Delhi TOEFL Test Of English as a Foreign Language UG Under graduation UGC University Grant Commission WD West Delhi
Draft Report 10 Nov 2016
5
CHAPTER 1 INTRODUCTION
Background
Government of Delhi has articulated concerns around expanding and increasing demand for
higher education especially at the post-secondary level and challenges in meeting these
demands. Ambedkar University Delhi (AUD) has felt a need for creating an empirical base
on quantum and composition of demand for tertiary education that could inform the
Government of Delhi in its policy on tertiary and higher education for NCT.
About 2.37 lakh students successfully complete class XII in Delhi and are eligible to access
post-senior secondary education. These students pass out largely from Delhi government’s
Directorate of Education schools (62%) private unaided schools (28%) and private aided
schools (6%). Among them, over 54% pass out from Arts stream, 24% from commerce
stream, 18% from science stream and 3.6% from the vocational stream. (State Report -
Secondary Education Report Card 2014-15, Delhi, http://udise.in/SRC-New/; DISE Flash
Statistics, 2015). In addition, a proportion of students who had enrolled in vocational
courses after Class-X as well as who had drop-out may also add to these numbers who
aspire for tertiary education through different modes of delivery.
There are 29 universities and 188 colleges in Delhi with a ratio of 9 colleges per lakh
population and a total enrolment in regular mode of 267630. The enrolment in ITIs and
Polytechnics in Delhi was 28628 in 2013-14, which has recorded a growth of 30% in five
years (Economic Survey of Delhi, 2014). An idea on intake capacity in institutes of tertiary
education at the entry level however does not help much due to a large influx of students
from outside Delhi seeking admission in colleges in Delhi and likewise a proportion of
students from Delhi seeking admissions in colleges outside Delhi. Further, it does not give
idea on extent to which existing intake capacities meet the aspirations in terms of streams
and modes of delivery preferred.
Given this situation, there is a need to study the scenario of demand for tertiary education
among students coming out from different streams of the schools in Delhi in terms of
quantum, composition, and the geographical spread across NCT. It is also important to

Draft Report 10 Nov 2016
6
understand the institutional capacities available to meet the demand for tertiary education in
terms of numbers and composition. This study was carried out with this background.
The study aimed to bring out composition of the sampled schools representing different
types of DOE government senior secondary schools in terms of streams offered, levels of
schooling available, gender composition of students and distribution across educational
districts. At the level of students, the report aimed to bring out composition of students
across streams in senior secondary level, factors that shape choice of streams, difficulties
faced during senior secondary schooling and implications of these aspects on decision
regarding tertiary education and future aspiration. These aspects are studied across different
types of government senior secondary schools, gender composition of students, streams
chosen in school and parents’ occupational and educational levels.

Draft Report 10 Nov 2016
7
CHAPTER II METHODOLOGY
This study was initiated with the broad aim of assessing the demand for tertiary education in
NCT area of Delhi. It was conceived as a multi-phase study to assess the demand for tertiary
education from students passing out from schools as well those enrolled in institutes of
tertiary education, with the following as the objectives
Objectives of the study
1. To assess the demand for tertiary education among students passing out of government
and selected private schools in NCT area
2. To find out the composition of demand for tertiary education in terms of
i. Streams (regular subjects vis-a-vis vocational) and
ii. Mode of delivery (regular, evening, distance-learning etc)
3. To find out from students enrolled in schools and in institutes of tertiary education
including post-secondary colleges, poly-techniques and ITI in NCT
i. Their expectations from tertiary education
ii. The extent to which these expectations are felt to be fulfilled by tertiary
education
iii. Their future plans after they complete tertiary education, alternatives available
iv. Barriers they face in enrolling and completing tertiary education
4. To map the existing institutions for tertiary education and to assess their actual and
potential capacities of intake across different streams.
This report analyses and presents data pertaining to the First Phase of this study. This phase
aimed to bring out demand for tertiary education from students passing out from government
senior secondary schools alone and largely addressing the objectives 1, 2, and to limited
extent Objectives 3 and 4.
Commented [N1]: Shouldwetakeintoaccounttheseaspectsinthearticle?

Draft Report 10 Nov 2016
8
Methodology:
The study involved the following components:
1. Literature Review: Review of existing relevant literature and data on schools,
enrolments, outputs; demand for tertiary education from government and other sources.
2. Consultative meeting with officials: A consultative meeting with experts from the field
of education was conducted to get their feedback on the study design and the survey
tools.
3. Survey among students towards completion of secondary education: A survey among
students towards completion of secondary education in 103 government schools in
NCT area was conducted to get students perceptions on various aspects related to
school education as well as on their aspirations on tertiary education.
4. Qualitative components: A limited number of in-depth interviews and Focus group
discussions were conducted with students in 12th class, teachers, parents and current
/past students in ITI/ diploma.
Table 2.1 Data source matrix
Method Respondents Data to be collected / Purpose Literature Review
-- To map facilities, to have estimates of demand, enrolment etc., concerns
Consultative meetings
Experts from the field of education
Feedback on study design and tool
Survey Students in 12th class from Govt. DOE senior secondary schools in NCT area
Perceptions on aspects related to school education as well as on their aspirations on tertiary education
Qualitative components – FGD, IDI
Students in 12th class, teachers, parents and current /past students in ITI/ diploma
Educational and employment aspirations, expectations from tertiary education, perceptions on available alternatives, future plans and barriers faced in enrolling and completing secondary and post-secondary education
Draft Report 10 Nov 2016
9
Selection of schools and study participants
Sampling of schools for survey
A list of all schools from Govt Senior Secondary Schools under DOE was identified. From
this list only those with senior secondary class were selected. This came to 882 schools. The
list was further divided into schools as per educational districts. From each educational
district 10% of schools were selected as follows. The educational district wise list was
arranged as per school code number. The first school in the list was identified randomly using
a random table. The total in each list was divided by 10, and the quotient was used as the
interval for selection of schools randomly after the first school was selected as mentioned.
Two additional schools from each district were selected using the same procedure to be used
if any sampled school refused consent. A total of 118 schools were finally selected as the
sample.
Selection of students as participants for survey
From each selected school about 30 students per school were selected. Efforts were made to select
students randomly from a combined list of all 12th students so that there is a proportionate
represent from all streams, gender etc. However this was not allowed /possible in all the
schools. From 103 schools a total of 3026 students were interviewed.
Selection of schools and participants for qualitative components
From the sampled school five school with representation of one school each from GBSSS,
GGSSS, SBV, SKV and others (co-ed) were purposively indentified such that the
heterogeneity of population in terms of social, religious and economic differentiation gets
represented.
In the areas in vicinity of these five schools, FGDs or in-depth interviews (IDIs) with
students in 12th class, teachers, parents and current /past students in ITI/ diploma were
conducted. A total of 4 FGDs with students, 5 group interviews with teachers, 15 parents of
students in class 12th, 2 students doing ITI and 2 parents of students in ITI.
Research team
Students who were currently pursuing MA in Education at AUD were trained as investigators
and these students undertook the survey. A team of two investigators visited a school every

Draft Report 10 Nov 2016
10
day to complete the survey. These investigators were by supervised two research assistants
and three faculty members from AUD. The research team was trained by AUD team on basic
elements of survey, on the survey instrument etc with a customised training for about five
days that will also include mock administering of the tool.
Two research assistants attached with the project on regular basis were trained to conduct FGDs and
IDIs. They were supported by one of the faculty members. This same team also processed
and analysed both survey data and qualitative data.
Tools Tool for the survey was prepared in a consultative process involving AUD team, experts from other
institutes and representative from government department. The tool was pilot tested in two
schools and revised further based on inputs received from the piloting process.
Similarly, interview and discussion guides were prepared for FGDs and IDIs through a consultative
process by the three faculty members involved. These tools however were used more as
guides for FGD/IDIs. Educational aspirations, expectations from tertiary education,
employment aspirations, barriers faced in enrolling and completing secondary / post-
secondary education, school profile were the key domains of data collection in qualitative
components.

Draft Report 10 Nov 2016
11
CHAPTER III PROFILE OF SCHOOLS
I. Introduction
This chapter describes the profile of the sampled schools that were part of the survey. As per
DOE website there are 1662 government schools in the NCT area. Of this, 882 schools (53
%) have senior secondary sections. These schools are distributed across nine educational
districts. Almost one-fourth of these schools (24%) are located in NWD district, 16% in SD,
and 14% each in WD and SWD districts. These four educational districts, together account
for close to 70% of senior secondary schools. About 11.5% of schools each are in ED and
NED. North Delhi, New Delhi and Central Delhi districts account for less than 10% of these
schools.
From this list of 882 schools a sample of 103 (12 %) schools were randomly selected.
II. Comparison of profile of sampled DOE schools with profile of all DOE schools –
Quality of sampling
In the first set of three tables, the profile of sampled schools is compared with the profile of
all government senior secondary schools given in the original list. This comparison gives a
picture of the quality of sampling and extent to which the sample represents the original list
of schools from which the sample was drawn. Details on schools in the original list of
schools were taken from the website and details on the sampled schools were verified at the
time of survey and accordingly revised.
The table (3.1) has given below compares the distribution of both sets of schools across the
9 educational districts of the NCT area. As the table indicates the distribution of sampled
schools across the 9 districts match to a great extent with the corresponding distribution of
all DOE senior secondary schools.
Commented [N2]: Relevantforarticle.

Draft Report 10 Nov 2016
12
Table 3.1 Comparison of distribution of sampled and total senior secondary DOE schools across educational districts of NCT
Districts All DOE Govt. Se. Sec schools Sampled DOE Govt.
Se. Sec schools Numbers % Numbers %
CD 32 3.63 4 3.88 ED 101 11.45 12 11.65 ND 5 0.57 1 0.97 NED 102 11.56 12 11.65 North D 50 5.67 6 5.83 NWD 209 23.70 23 22.33 SD 141 15.99 18 17.47 SWD 119 13.49 14 13.59 WD 123 13.95 13 12.62 Total 882 100 103 100
Similarly, the following table (3.2) highlights the match between in the total list and the
sampled schools across type of schools. Except the substantial difference in the case of
GSSS type of school, in all other type of schools there is a fairly good match between the
sampled schools and the total list of schools.
Table 3.2 Comparison of distribution of sampled and total senior secondary DOE schools across educational type of schools
Types of school All DOE Govt. Se. Sec schools Sampled DOE Govt.
Se. Sec schools Total % Total %
GBSSS 252 29 31 30 GGSSS 148 17 21 20 GSSS 82 9 4 3 PVV 19 2 2 2 SBV 108 12 14 13 SKV 193 22 23 22 SSSS 74 8 8 7 Others (SMS, GMS, RSV) 6 1 0
0
Total 882 100 103 100
The third table (3.3) has given below compares the distribution of sample schools and total
schools across gender profile of schools viz. Girls-only, boys-only and co-ed schools. Here
the match is not really convincing. It is possible that this due to some discrepancies in the
details given in the DOE database in the list of co-ed schools.
Commented [N3]: Canbeused

Draft Report 10 Nov 2016
13
A number of schools that were listed as co-ed were found to be not ones. The list had shown
36 SBV schools as co-ed school. However it was found that in the sampled schools there
were no SBV schools that were co-ed. All SBV schools were boys-only schools. Similarly
five GGSSS schools were also given as co-ed schools in the original list, but they found to
be girls-only schools.
As a result of this discrepancy the proportions of girls-only schools and boys-only schools
too do not match with the proportions found in total list of DOE schools.
Table 3.3 Comparison of distribution of sampled and total senior secondary DOE schools across gender composition of students in Class XI & XII
Gender composition of students
All DOE Govt. Se. Sec schools Sampled DOE Govt. Se. Sec schools
Total % Total % Girls only 246 27.89 42 40.78 Boys only 326 36.96 45 43.69 CO-ED 310 35.15 16 15.53 Total 882 100 103 100
III. Typology of DOE senior secondary schools
The table (3.4) given below represent DOE school can be classified along two key
dimensions namely type of management i.e. Sarvodaya schools, Government senior
secondary schools and Pratiba Vikas Vidyalayas and across gender composition of students
in schools Viz., Boys-only, girls-only and Co-ed schools.
Table 3.4 Distribution of DOE schools by type of schools and gender composition
Type of management\ Gender composition Boys only Girls Only Co-ed Sarvodaya SBV SKV SSSS Govt SSS GBSSS GGSSS GSSS PVV -- -- PVV
A number of other dimensions of classification like shift (morning or afternoon), levels
available in school (Only SSS, Middle to SSS, Primary to SSS), composition of streams
offered etc get largely shaped along these two dimensions. Thus these two dimensions
assume importance when we want to discuss the quality of schools, quality of teaching-
Commented [N4]: Thesampledcomponentcanbeused

Draft Report 10 Nov 2016
14
learning environment and the profile of students they respectively attract. The dimension of
gender composition of students and its role will be discussed later in the report. In this
section we will discuss the influence of dimension of type of management.
The three types of government schools by management viz., Sarvodaya, Government senior
secondary schools and Pratiba Vikas Vidyalayas roughly forms a sort of three tiers of
schools with difference is quality of schools, facilities, teachers availability etc. Apart from
these three types of schools there are a few other types of schools by management such as
SMS, GMS, RSV, but together they constitute less than 1% among; hence these are not
discussed here.
Pratibha Vikas Vidyalaya: There are 17 PVV schools in Delhi. These are sort of premium
schools receiving greater attention and support administratively. These schools have from
the middle schools to senior secondary level. Students are admitted on the basis of a
selection test and admissions are usually done in VI or IX class. Students should have
studied in any government or government-aided schools during the last two years and
should have secured a minimum of 60% marks in the previous academic year. Number of
students in each class is usually restricted to 35. These schools have exemption from the
‘vicinity’ criteria (the rule that children from a locality should have primacy in admission in
the school in that locality).
These schools have relatively better infrastructure.
One of the PVV schools visited has good infrastructure with a gated perimeter wall. The school is housed in a multi-storey building that looks well maintained, with good flooring and walls, a waiting area and reception, a principal’s room fitted with AC. Class-rooms are large-sized, well ventilated and with good furniture. There are separate rooms for educational & vocational guidance, games equipments, watching television, computers, library and medical rooms for girls and boys separately. The school also has CCTV facility. There is a large auditorium. The school is equipped with all necessary laboratory facilities. Laboratories were found well equipped, large in size and well furnished and ventilated. In addition to science labs, the school has labs for language, social science and mathematics. Students practice for IELETS and TOEFL examinations in the school.
These schools generally have all qualified regular teachers for the respective subjects and
all the sanctioned posts usually get filled. In the school that was visited a group of teacher
who were interviewed said:
Commented [N5]: Shouldwetalkaboutthesedimension?
Commented [N6]: Thismighthaveimpactontheaspirationsofstudents–atleastintermsofgreaterawareness

Draft Report 10 Nov 2016
15
Teachers have autonomy in choosing and planning their own teaching sessions and pedagogy.
Generally these schools offer all streams including science, commerce and arts except
vocational stream in senior secondary classes. On an average these schools provide
relatively more number of options for streams compared to other types of schools.
The school offers Science, Commerce and Arts streams in 11th and 12th class. There is no vocational stream. There are two section of science scream (70 students) one is Science with Biology and science without Biology, one commerce section (35 students) and one Arts stream (35 students). A greater number of students prefer to opt for science stream. Choice of subject is based on merit and students own interest. Some students opt for arts in order to prepare for competitive exams including civil services
Results in board exams (X & XII) are very good, almost comparable to private
schools.
The front entrance and front-side wall of the school that was visited were lined with information boards proudly displaying recent years’ results in 10th and 12th standard examinations. In the latest edition of 10th standard examination 34 students had secured 95% in 10th standard exams. Inside the principal’s room two cub-boards were filled with trophies and shields won by students in sports and extra-curricular activities.
One of the teachers said that there are various merit scholarships available for students in government schools and a good number of them are taken away by students from PVV schools. For instance Chief-Minister’s scholarship is given to 250 students every year. Of this, barring 19 scholarships which went to children from Govt. models schools, the rest were secured by students from RPVV schools this year.
Parents of two students currently studying in a PVV schools were clearly of the
opinion that in all respect the PVV schools are better schools compared to the other
government schools. In fact in both these households other siblings too had made
attempts to secure admission in the same school but they couldn’t.
Certainly there are bound to be difference across individual PVV schools depending
up on location and other factors. Nevertheless there is a perceptible difference
between these schools and other types of schools.

Draft Report 10 Nov 2016
16
Sarvodaya schools: There are senior secondary schools for boys-only (SBV), girls-only
(SKV) and co-ed (SSSS) schools under the Sarvodaya family of schools. These schools
usually have primary to senior secondary school level, barring a few exemptions. Once a
child joins a school the child can study in the same school till completing 12th class.
Admission to these schools are direct, without any entrance test and these schools follow
the ‘vicinity norms’ i.e. preference for children from the immediate vicinity of schools.
Depending number of applications and available seats a lottery system may be followed to
award admissions.
Building of one of the schools visited for in-depth interviews was under renovation. Compared to the PVV schools, there were not many charts, posters etc displayed. Classrooms looked a little congested. The other school visited had two multi-storey buildings with a large playground behind the school building, the entire complex enclosed within a perimeter wall. Classrooms are large and well ventilated. Stairs are also wide and spacious. The school has library, laboratory and computer facilities. At the time of our visit here too renovation was on.
Number of streams offered in 11th and 12th is on an average more than the Govt.SSS
schools, but less than PVV schools. Vocational streams are offered in SKV and SBV but
not in Sarvodaya co-ed schools.
Government Senior Secondary Schools: These include GBSSS, GGSSS and GSSSS
schools. These constitute the largest proportion of DOE run senior secondary schools.
Admission to these schools is direct, without any screening tests. These schools also give
preference in admission to children from the immediate vicinity.
Three-fourth of them has sections from middle to senior secondary level. Only about 16%
of them have from primary to senior secondary. Therefore they receive children from a
number of types of primary schools including municipal run ones. One of the problems
pointed out in this regard was a number of students come from schools having only
primary sections and often in Hindi medium. When these students come and join in 6th
class, it becomes difficult to teach English at that level. This problem is not faced by
Sarvodaya schools as they get their own students from primary section in to higher classes.
Commented [N7]: Demographicdetailsandlanguage

Draft Report 10 Nov 2016
17
In terms of infrastructure and facilities these schools and Sarvodaya schools are almost on
par. Number of students in a class may go up to or even more than 50.
Some of these schools face problems of regular teacher’s posts being vacant and are
replaced by teachers in contract employment. This, however, also depends on location of the
schools.
One of these schools visited is located on the periphery of Delhi. It is around 6 to 7 km far from the nearest bus stand and around 10km far from the nearest Metro station. It is surrounded by fields. As the connectivity is poor the school finds difficult to attract and retain good teachers. Out of 18 teachers in the school only four or five are on regular basis. There are no regular PG teachers. Many teachers are on temporary positions (guest teachers) and they receive remuneration on day basis and it come to a relatively small amount and therefore low motivation.
In another school of Govt.SSS type, but well connected, has 24 regular teachers.
In 11th standard the average number of streams offered is least in this type of schools
compared to PVV and Sarvodaya schools. Especially, the proportion of schools offering
science streams is less, more so in the case of GGSSS schools. Both boys and girls schools
in this type often offer vocational streams, which is not the case in co-ed schools. Among
the three Govt.SSS schools Co-ed schools are relatively better compared to boys-only and
girls-only schools. A few bright students from these school shift to nearby schools in
search of stream of their choice.
One of the schools visited offers arts and vocational streams. Earlier it had commerce stream but was withdrawn recently as there were less takers. Students who wish to study Commerce and science get enrolled in a nearby sarvodaya school 2.5km away. There are less number of students who opt for commerce and science.
Arts and commerce (with and without maths) are the two streams being offered in another school that was visited. One of the teachers expressed that a few bright students leave the school to join others schools. For instance this year two students secured admission for 9th class in RPVV schools. Some students, who achieve good grades and want science stream go to Laxmi Nagar School.
One of the teachers rightly summarised the difference between the three types of
schools in the following words:
Commented [N8]: Teachers
Commented [N9]: Streamsoffered

Draft Report 10 Nov 2016
18
“I had earlier taught in Pratibha School and now working in Sarvodaya School. Pratibha schools are better than the Sarvodaya schools; Pupil-Teacher ratio is small and those schools have better facilities. On other hand in other government schools the condition is totally opposite: facilities are poor and student-teacher ratio is high. In Pratibha schools, students are admitted on the basis of a competitive examination. Apart from this, infrastructure and staff are good; that is why cream among the students joins these schools.
“GBSSS schools are more similar to SBV schools. The only difference is that GBSSS schools have sections starting from 6th standard and has up to class 12th. Sarvodaya Schools on other hand have from 1st to 12th standard”. The teacher nevertheless added that “quality of a school will also depends upon the locality where the school is located and the kind of students it is able to attract”.
III. Detailed profile of sample DOE schools
A total of 103 DOE schools with senior secondary sections were selected as the samples
schools. They were drawn from all 9 educational districts of NCT area. These schools
represented different types of Government school Viz., GBSSS, SKV, GGSSS, SBV, SSSS,
GSSS, and PVV. Of the 103 schools 45 schools were boys’ schools, 42 were girls’ schools
and 16 co-ed. 68 schools had morning shift and 35 afternoon shift. All afternoon shift
schools were boys’ schools.
The following set of four tables (3.5, 3.6, 3.7 and 3.8) gives profile of the sampled schools.
Table 3.5 gives distribution of sampled schools by type of schools across educational
districts. As the numbers in individual sub-categories are small, it does not reveal a
significant pattern in geographical distribution of type of schools. Within an educational
district the proportion of SBV and SKV are more compared to other type of schools in
Central Delhi, East Delhi and north Delhi. The proportion of GBSSS is more in South west
and North east Delhi and GGSSS is more in North East and North West Delhi.
Commented [N10]: Relevant
Draft Report 10 Nov 2016
19
Table 3.5 Distribution of sampled schools by type of schools across educational districts
Districts GBSSS GGSSS GSSSS PVV SBV SKV SSSS Total CD 1 (25.0) 0.0 0.0 0.0 1 (25.0) 2 (50.0) 0.0 4(100) ED 2 (16.7) 1 (8.3) 0.0 0.0 5 (41.7) 4 (33.3) 0.0 12 (100) ND 0.0 0.0 0.0 0.0 0.0 0.0 1 (100.0) 1 (100) NED 5 (41.7) 5 (41.7) 0.0 0.0 1 (8.3) 1 (8.3) 0.0 12 (100) North D 2 (33.3) 0.0 0.0 0.0 1 (16.7) 3 (50.0) 0.0 6 (100) NWD 6 (26.10 7 (30.4) 2 (8.7) 1 (4.3) 1 (4.3) 5 (21.7) 1 (4.3) 23 (100) SD 6 (33.3) 5 (27.8) 0.0 1 (5.6) 3 (16.7) 2 (11.1) 1 (5.6) 18 (100) SWD 6 (42.9) 2 (14.3) 0.0 0.0 0.0 3 (21.4) 3 (21.4) 14 (100) WD 3 (23.1) 1 (7.7) 2 (15.4) 0.0 2 (15.4) 3 (23.1) 2 (15.4) 13 (100) Total 31 (30.10) 21 (20.39) 4 (3.88) 2 (1.94) 14 (13.59) 23 (22.33) 8 (7.77) 103 (100)
Table 3.6 Distribution of sampled school by Standard of schools
Type of schools Primary to SSS Middle to SSS SS-SSS Only SSS Total GBSSS 4 (12.9) 22 (71) 2 (6.5) 3 (9.7) 31 (100) GGSSS 3 (14.3) 16 (76.2) 2 (9.5) 21 (100) GSSS 2 (50) 2 (50) 4 (100) PVV 2 (100) 2 (100) SBV 14 (100) 14 (100) SKV 22 (95.7) 1 (4.3) 23 (100) SSSS 6 (75) 2 (25) 8 (100) Total 51 (50) 44 (43) 4 (4) 4 (4) 103 (100)
Above table 3.6 gives distribution of sampled schools by levels available. Invariably all
Sarvodaya schools (SSSS, SBV and SKV) have primary to senior secondary level. On the
other hand all PVV schools and a majority of GBSSS (71%) and GGSSS (76%) schools
have only from middle to senior secondary levels.
The below table (3.7) gave distribution of schools by gender composition of students (boys only,
girls only and co-ed). SKV schools are girls-only schools; however they admit boys in the
primary sections and no new admission of boys are done after the fifth class, although boys
who were admitted before the fifth class are allowed to continue studying in the same school
beyond fifth standard too.

Draft Report 10 Nov 2016
20
Table 3.7 Distribution of Sampled school by boys, girls and co-ed
Type of schools Girls-only Boys-only CO-ED Total GBSSS 31 (100) 31 (100) GGSSS 21 (100) 21 (100) GSSSS 4 (100) 4 (100) PVV 2 (100) 2 (100) SBV 14 (100) 14 (100) SKV 21 (91.3) 2 (8.7) 23 (100) SSSS 8 (100) 8 (100) Total 42(41) 45(44) 16(16) 103 (100)
The table (3.8) has given below shows the distribution of schools by morning or afternoon shifts
across. Out of the total schools 66% schools have morning shift and the rest have after noon
shift. Invariably all girls-only and co-ed schools have morning shifts and 78% of boys
schools have after noon shift.
Table 3.8 Distribution of sampled schools by morning and afternoon shift by gender of students
G/B/CO-ED Morning Afternoon Total Girls only 42 (100) 42 (100) Boys only 10 (22) 35 (78) 45 (100) CO-ED 16 (100) 16 (100) Total 68 (66) 35 (34) 103
The following table (3.9) gives information on availability of different streams in senior
secondary level across different type of schools. All PVV schools have all streams except
vocational streams. The proportion of schools having science stream is highest in the PVV
schools followed by SBV and GBSSS. The proportion of schools with commerce streams is
highest among PVV followed by GSSS, SSSS and SKV schools. All schools have Art
streams. Vocational streams are offered proportionately more in SKV, GGSSS and SBV.
The type of streams made available seems to have a relationship not with the type of schools
but also on the basis of whether the school is boys-only or girls-only schools.
Commented [N11]: Relevant
Commented [N12]: Considered

Draft Report 10 Nov 2016
21
Table 3.9 Distribution of streams across different type of schools
Type PCM/PCMB PCB COM+
M COM-M Arts Vocati
onal
Total number of streams
Number of Schools
Number of Streams per school
GBSSS 9 (29)* 8 (26) 14 (45) 12 (39) 31(100) 4 (13) 78 31 2.5 GGSSS 1 (5) 1 (5) 9 (43) 9 (43) 21(100) 6 (29) 47 21 2.2 GSSSS (0) 0 (0) 3 (75) 3 (75) 4 (100) 0 (0) 10 4 2.5 PVV 2 (100) 2 (100) 2 (100) 1 (100) 2 (100) 0 (0) 9 2 4.5 SBV 9 (64) 6 (43) 10 (71) 10 (71) 14(100) 4 (29) 53 14 3.8 SKV 5 (22) 4 (17) 17 (74) 17 (74) 23(100) 9 (39) 75 23 3.3 SSSS 2 (25) 2 (25) 6 (75) 6 (75) 8 (100) 0 (0) 24 8 3.0 Total 28 (27) 23 (22) 61 (59) 58 (56) 103(100) 23 (22) 296 103 2.9 No. of Students$ 485 246 951 1146 8517 511 11856
No. of students per stream per school
17.32 10.7 15.59 19.76 82.69 22.22 40.05
* Figure in parentheses gives percentage of respective type of schools having the specific stream (e.g. 9*100/31=29)
$ - This figure is total students enrolled in different streams in sampled schools.
The last column in the above table (3.9) gives average number of streams per school. This
figure is highest for PVV schools followed by SBV and SKV. This figure is least for
GGSSS and the followed by GBSSS and SSSS.
The last two rows give data on ‘total number of students enrolled in each stream’ and
‘number of students per stream per school’ respectively. A total 11856 students are enrolled
in 103 schools in different streams. The average number of students per stream and per
schools is highest in arts with more than 82 students in a section. While in all other streams
this figure is low, in the range of 10 to 22. The figure is lowest in science stream (PCB).
Concerns around gender dimensions: The fact that whether a school is girls-only, boys-only
or co-educational was found to be one of the important dimensions along which a number of
key aspects get aligned.
Commented [N13]: Important

Draft Report 10 Nov 2016
22
GGSSS and SKV are usually girls-only schools; GBSSS and SBV are boys-only schools;
and RPVV, SSSS and GSSS are Co-ed schools. This is the usual pattern, barring a few SKV
which allow admission of boys in junior classes.
A common perception among teachers, parents and students is that SKV schools are better
than GGSSS and SBV schools are better than GBSSS. In the overall list of government
schools, if we look at the ratio between these pairs of schools, for every GBSSS school there
are 0.43 SBV schools and for every GGSSS schools there are 1.3 SKV schools. Government
has, thus, focussed on developing proportionately more Sarvodaya schools than Govt.SSS
schools for girls compared to the relative proportion of Sarvodaya schools created for boys.
As Sarvodaya schools more often have from primary to 12th class it is seen as advantageous
for girls who could continue their education without the need for shifting schools in
between.
Likewise, all girls-only and co-ed schools invariably have morning shifts. All after-noon
shifts schools are boys-only schools. Over three-fourth of boys schools have after-noon
shifts. This proportion is 4/5th among the GBSSS and 2/3rd among SBV schools.
While these points to the sensitivity to concerns of girl students, we also note that in a
number of ways girls students stand in disadvantageous position in terms streams made
available in girls schools vis-à-vis boys-only and co-ed schools.
Table 3.10 Distribution of stream across sampled schools by gender composition
Gender Composition
PCM/PCMB
PCB COM+M
COM-M
Arts Vocational
Total No.
of streams
No. of Schools
No. of
Streams per
school
Girls only 5 (12) 4 (10) 25 (60) 25
(60) 42 (100) 15 (36) 116 42 2.8
Boys Only 18 (40) 14 (31) 24 (53) 22
(49) 45 (100) 8 (18) 131 45 2.9
Co-Ed 5 (31) 5 (31) 12 (75) 11
(69) 16 (100) 0 (0) 49 16 3.1 Figure in parentheses gives percentage of respective category of schools having the specific stream (e.g. 5*100/42=12)
Commented [N14]: Important
Draft Report 10 Nov 2016
23
The above table (3.10) gives distribution of streams across gender composition in schools. A pattern
in terms of distribution of streams along gender lines is perceptible. Availability of science
streams is proportionally more among boys-only schools followed by co-ed schools and is
the least among girls-only schools. Commerce streams are available proportionately highest
among co-ed schools, followed by girls-only schools and are least among boys-only schools.
Vocational streams are available proportionately the highest among girls-only schools and
followed by boys-only schools.
The last column shows that the number of streams available per schools is highest among Co-ed
schools followed by Boys-only schools and is least among girls-only schools. One may say
that choices available in terms of streams are marginally less for students in girls-only
schools compared to the rest. As shown in the previous table, this choice is much lower for
girls in the GGSSS schools.
Summary:
This chapter thus brings out differences across the types of Govt. DOE schools by
administration, especially across the three major types namely RPVV, Sarvodaya type of
schools and Government senior secondary schools. We find sharp distinctions among them
in terms streams available, infrastructure and overall quality across these three types. We
also note differentials emerging between girls-only and other schools. The chapter also
brings out distribution of types of schools across the different educational districts.

Draft Report 10 Nov 2016
24
CHAPTER IV
PROFILE OF STUDENTS
This chapter describes the profile of students who were part of the survey done in the 103
schools. It discusses general profile of sampled students, streams chosen, reason for
choosing respective streams, difficulties faced in class 11th& 12th, students’ plan after
completing 12th class, factors that shape their future aspirations etc. across type of school,
gender, streams chosen, parents educational qualification and occupation.
I. General Profile of students
The two tables (4.1 and 4.2) below gives the (frequency) profile of the students in terms of
key background variables such as gender, socio-economic background, father’s educational
qualification, type of school, educational districts, streams opted etc. These tables help to get
a picture on the sampling done.
Table 4.1 represents a total of 3026 students were interviewed. Of this, 49% are girls and
51% boys. Over 65% are from ‘other’ groups in terms of community. About 15% students
belong to ‘scheduled caste’ communities, and over 12% are from ‘religious minority’
groups. Representation form ‘scheduled tribe’ communities are less than 1%.
A majority of the students’ father are engaged in private jobs (46.68%) viz. driver, security
guard, salesman, worker in factory or company etc. This is followed by self employed
(36.87%) i.e. vegetable vendor, fruit seller, tailor, E-Rickshaw driver, washer man, welding
shop, barber etc. Very less number of students’ father having business as occupation. Only
2.18% are professional and 6.78% are in government job viz. Clerk, School teacher, defence
services, Delhi Jal Board, MCD worker, NDMC worker etc.
There are 75% students whose father’s educational qualification is lower or equal to senior
secondary class i.e. 12th. Most of them are either up to 10th (28.59%) or up to 12th (20.29%).
Close to 10% of students’ fathers have educational qualification till undergraduate degree
and only 1.90% students’ fathers have Post graduate degree. Among the total students,
11.60% students’ fathers are not attended school at any level.
Commented [N15]: Thiscouldbeanimportantaspectofdiscussion

Draft Report 10 Nov 2016
25
Table 4.1 General profile of sampled students
S. No. Background factors Attributes No. of students % of students
1 Gender Female 1472 48.7 Male 1553 51.3
2 SC/ST/OBC/RM community
SC 453 15.0 ST 13 0.4 OBC 201 6.6 RM 377 12.5 Others 1982 65.5
3 Father’s occupation
Business 4 0.1 Government Job 193 6.8 Other 156 5.5 Professional 62 2.2 Private Job 1328 46.7 Retired 16 0.6 Self Employed 1049 36.9 Unemployed 37 1.3
4 Father’s qualification
Not attended school 330 11.6 Up to Primary 298 10.5 Up to Elementary 446 15.7 Up to 10th 813 28.6 Up to 12th 577 20.3 Dip/Cert 17 0.6 UG 275 9.7 PG 54 1.9 Others 34 1.2
The following table (4.2) gives an idea on distribution of sampled students across different
type of schools, educational districts and streams chosen. Close to 30% of students in the
sample are from GBSSS schools, about one-fifth students have been drawn from GGSSS
and SKV respectively. Co-ed schools namely SSSS, GSSSS, and PVV are represented by
about 8%, 4% and 2% respectively.
Across educational districts over 22% of students are drawn from NWD. Educational
districts of SD, SWD, NED and ED get represented by a range between 16% and 12%.
North Delhi and CD are represented by about 6% and 4% respectively. New Delhi and SED
are represented by less than 1% of sampled students.
Across different streams students who have chosen Arts get represented by over 70%;
followed by Commerce without maths and commerce with maths respectively by 11% and
8% respectively. Students who opted for PCM and PCMB are about 4% and 3%
respectively and less than 1% of students in the sample have opted for PCB.
Commented [N16]: Couldbeused;canwealsorepresentmother’seducationandwork

Draft Report 10 Nov 2016
26
Table 4.2 Distribution of sampled students across type of schools, educational districts and streams opted.
S. No. Factors Attributes No. of students
% of students
No. of schools
1 Type of schools
GBSSS 905 29.9 31 GGSSS 632 20.9 21 GSSSS 120 4.0 4 PVV 59 2.0 2 SBV 402 13.3 14 SKV 675 22.3 23 SSSS 233 7.7 8
2
Educational district
CD 107 3.5 4 ED 350 11.6 12 ND 30 1.0 1 NED 362 12.0 12 North Delhi 180 6.0 6 NWD 683 22.6 23 SD 529 17.5 18 SWD 411 13.6 14 WD 374 12.4 13
3 Stream chosen
Arts 2115 70.3 103 COM+M 234 7.8 61 COM-M 335 11.1 58 PCB 27 0.9 23 PCM 116 3.9 23 PCMB 91 3.0 5 Vocational 92 3.1 23
6 Medium of instruction
Hindi 2112 70.0 -- English 393 13.0 -- Hindi +English
479 15.9
--
Urdu 34 1.1 --
Close to 70% of students have Hindi as their medium of instruction and another 16%
students have Hindi and English as the languages of instruction. Only 13% of children have
English as medium of instruction and a little over 1% of children are getting educated in
Urdu medium.
II. Type of schools
The table (4.3) below gives distribution of students by streams opted across type of schools.
A key point that emerges here is that the proportion of students who have opted or who have
had the option of choosing science streams (PCB+PCM+PCMB) is on the whole less than
8%. However, across the school types it is over 44% among the PVV schools followed by
Draft Report 10 Nov 2016
27
17% among SBV and over 10% among the GBSSS. Among the rest of the schools this
figure is about 5% or less.
On the other hand around 70% of students have opted for Arts stream. This figure is highest
among GGSSS, SKVS, SSSS, GBSSS schools and is low among SBV schools (58%) and
PVV schools (25%). Vocational stream is not available in any of the co-ed schools and is
highest in both girls-only schools viz., GGSSS and SKV. Distribution of students who have
opted for commerce stream (with and without maths) ranges between 32% and 11%.
The above observations however have to be read along with a set of limitations faced during
the survey. In some of the type of schools students from certain streams have not
participated in the survey. This had happened as in some of the schools the school
administration did not permit students from some streams like sciences to participate in the
survey as they didn’t want those children to waste time, instead they had send students from
arts or other streams and they felt it is okay if these students ‘get disturbed’. It is also
possible that in some of the type of schools certain streams were not available at all like
vocational streams in PVV schools. This is captured better in tables in previous chapter
where we have discussed distribution of streams at the school level.
Table 4.3 Distribution of students by streams opted across type of schools
Type of schools
Arts COM+M
COM-M
PCB
PCM
PCMB
PCB+PCM +PCMB
VOC
Total
GBSSS 624 69 95 15 58 18 91 12 891 70 7.7 10.7 1.7 6.5 2 10.2 1.4 100
GGSSS 518 21 48 4 7 11 33 631 82.1 3.3 7.6 0.0 0.6 1.1 1.7 5.2 100
GSSSS 82 17 21 0 120 68.3 14.2 17.5 0.0 0.0 0.0 0.0 0.0 100
PVV 15 18 22 4 26 59 25.4 30.5 0.0 0.0 37.3 6.8 44.1 0.0 100
SBV 231 34 59 6 24 40 70 7 401 57.6 8.5 14.7 1.5 6.0 10 17.5 1.8 100
SKV 472 57 82 3 5 16 24 40 675 69.9 8.4 12.2 0.4 0.7 2.4 3.6 5.9 100
SSSS 173 18 30 3 3 6 12 233 74.3 7.7 12.9 1.3 1.3 2.6 5.2 0.0 100
Total 2115 234 335 27 116 91 234 92 3010 70.3 7.8 11.1 0.9 3.9 3.0 7.8 3.1 100

Draft Report 10 Nov 2016
28
As the table (4.4) below shows, maximum proportion of students have said that they chose
the specific stream out of their ‘own interest’ (47%). As most students interviewed were in
12th standard and stream selection happens in the beginning of 11th class, it is difficult to
verify this data showing that majority had opted streams out of their interest. It is possible
that some of them had to choose these streams due to poor marks or because other streams
of their choice were not there and these students have developed their interest in the
currently chosen streams subsequently. Close to 25% of students have said that they chose
the stream keeping in mind of future prospects that may accrue to them on pursuing further
schooling in a particular stream. Over 21% have said their 10th class marks determined the
stream they had to choose. About 11% had opted streams that were primarily easy.
An important point that emerges from this table is that about 6% of students have said the
particular school they joined did not offer their stream of choice. This proportion is
relatively more among SSSS, followed by GGSSS and GBSSS. This figure is the least in
PVV (0%) followed by GSSSS, SBV and SKV.
Table 4.4 Distribution of students by reason for choosing respective streams across type of schools
Reason
Class 10th marks
Interest
Parents
Peers
Future Prospects
Not got other option
Stream not offered
Good teachers
Easy
Others
No. of responses
Total students
GBSSS
236 345 41 14 212 82 66 3 74 29 1102 905
26.1 38.1 4.5 1.6 23.4 9.1 7.3 0.3 8.2 3.2 121.
8 100
GGSSS
101 342 41 2 124 45 53 16 64 15 803 632
16.0 54.1 6.5 0.3 19.6 7.1 8.4 2.5 10.1 2.4 127.
1 100
GSSSS
13 45 14 5 39 4 4 0 17 2 143 120
10.8 37.5 11.7 4.2 32.5 3.3 3.3 0.0 14.2 1.7 119.
2 100
PVV
4 35 1 2 39 1 0 2 3 3 90 59
6.8 59.3 1.7 3.4 66.1 1.7 0.0 3.4 5.1 5.1 152.
5 100
SBV
85 205 17 15 103 34 15 1 47 9 531 402
21.1 51.0 4.2 3.7 25.6 8.5 3.7 0.3 11.7 2.2 132.
1 100
SKV
124 364 27 12 162 36 29 9 91 17 871 675
18.4 53.9 4.0 1.8 24.0 5.3 4.3 1.3 13.5 2.5 129.
0 100
SSSS 61 98 13 7 64 15 23 1 34 7 323 233
26.2 42.1 5.6 3.0 27.5 6.4 9.9 0.4 14.6 3.0 138. 100
Commented [N17]: Important

Draft Report 10 Nov 2016
29
6
Total
624 143
4 154 57 743 217 190 32 330 82 3863 3026
20.6 47.4 5.1 1.9 24.6 7.2 6.3 1.1 10.9 2.7 127.
7 100
Table 4.5 Distribution of students by proportions preparing for competitive exams across type of schools
Type of School Yes
GBSSS 113 12.8
GGSSS 19 3.0
GSSSS 11 9.3
PVV 26 44.8
SBV 71 18.0
SKV 29 4.4
SSSS 28 12.3
Total 297 10
The above table (4.5) gives proportion of students who had said they are preparing for any
competitive examinations. This proportion is 45 among the students from PVV schools,
which is way high compared to students from other schools. This proportion is low among
the two types of girls-only schools viz., GGSSS and SKV.
The below table (4.6) captures students’ responses on their plan after they complete 12th
standard across different type of schools. It is important to note that 91% of students have
said that they want to study further. Nine percent of students have given plans other than
studying further or lack of a clear plan in their mind at the time of the survey. Among other
plans indicated by students the largest proportion (5%) has indicated their plan to take up
paid work. It is however important to highlight that 9% of students not willing to study
further and about 5% wanting to take up paid work may not be small figures keeping in
mind that we are discussing Delhi NCT area.

Draft Report 10 Nov 2016
30
Table 4.6 Distribution of students by their proposed plans after completion of 12th standard across type of schools
Type of School
At Home
Break
Don't Know/Thinking
Family Business
Marriage
Others
Paid Work
Study Further
Total
GBSSS 6 20 5 27 58 785 901 0.0 0.7 2.2 0.6 0.0 3.0 6.4 87.1 100
GGSSS 3 3 3 3 8 37 572 629 0.5 0.5 0.5 0.0 0.5 1.3 5.9 90.9 10
GSSSS 6 7 106 119 0.0 0.0 5.0 0.0 0.0 0.0 5.9 89.1 100
PVV 3 2 5 49 59 0.0 0.0 5.1 0.0 0.0 3.4 8.5 83.1 100
SBV 1 7 6 7 377 398 0.0 0.3 1.8 0.0 0.0 1.5 1.8 94.7 100
SKV 1 1 8 1 6 14 636 667 0.2 0.2 1.2 0.2 0.0 0.9 2.1 95.4 100
SSSS 4 1 4 16 207 232 0.0 0.0 1.7 0.4 0.0 1.7 6.9 89.2 100
Total 4 11 51 7 3 53 144 2732 3005 0.1 0.4 1.7 0.2 0.1 1.8 4.8 90.9 100
The below table (4.7) represent, close to 77% of students have reported that their proposed
choice in tertiary education after completion of 12th standard is that of their own choice and
not compelled by any other factors. Over 11% of students have said that their choice will be
based on employability after completion of education. This proportion is highest among
students from PVV schools (34%). Interestingly less than 2% of children have said that their
choice was influenced by their teachers and over 2% have said their choice was dictated by
financial constraints faced.
Commented [N18]: Canprobablybeaccountedintermsofgirlsandboysratherthantypeofschools
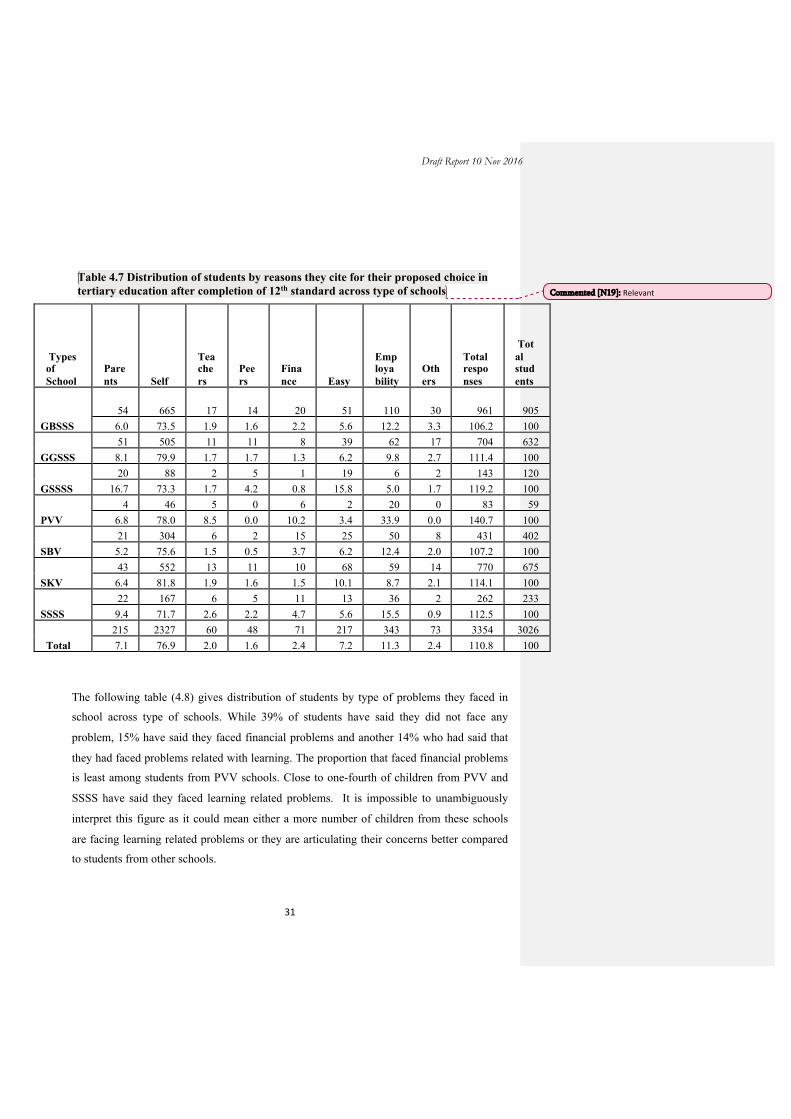
Draft Report 10 Nov 2016
31
Table 4.7 Distribution of students by reasons they cite for their proposed choice in tertiary education after completion of 12th standard across type of schools
Types of School
Parents Self
Teachers
Peers
Finance Easy
Employability
Others
Total responses
Total students
GBSSS 54 665 17 14 20 51 110 30 961 905
6.0 73.5 1.9 1.6 2.2 5.6 12.2 3.3 106.2 100
GGSSS 51 505 11 11 8 39 62 17 704 632
8.1 79.9 1.7 1.7 1.3 6.2 9.8 2.7 111.4 100
GSSSS 20 88 2 5 1 19 6 2 143 120
16.7 73.3 1.7 4.2 0.8 15.8 5.0 1.7 119.2 100
PVV 4 46 5 0 6 2 20 0 83 59
6.8 78.0 8.5 0.0 10.2 3.4 33.9 0.0 140.7 100
SBV 21 304 6 2 15 25 50 8 431 402
5.2 75.6 1.5 0.5 3.7 6.2 12.4 2.0 107.2 100
SKV 43 552 13 11 10 68 59 14 770 675
6.4 81.8 1.9 1.6 1.5 10.1 8.7 2.1 114.1 100
SSSS 22 167 6 5 11 13 36 2 262 233
9.4 71.7 2.6 2.2 4.7 5.6 15.5 0.9 112.5 100
Total 215 2327 60 48 71 217 343 73 3354 3026 7.1 76.9 2.0 1.6 2.4 7.2 11.3 2.4 110.8 100
The following table (4.8) gives distribution of students by type of problems they faced in
school across type of schools. While 39% of students have said they did not face any
problem, 15% have said they faced financial problems and another 14% who had said that
they had faced problems related with learning. The proportion that faced financial problems
is least among students from PVV schools. Close to one-fourth of children from PVV and
SSSS have said they faced learning related problems. It is impossible to unambiguously
interpret this figure as it could mean either a more number of children from these schools
are facing learning related problems or they are articulating their concerns better compared
to students from other schools.
Commented [N19]: Relevant

Draft Report 10 Nov 2016
32
Table 4.8 Distribution of students by type of problems they faced in class 11th and 12th across type of schools.
Types of School
Financial
Learning
Familial
Health
Migration
Not got sub. of choice None
Others
Total
No. of students
GBSSS 134 133 58 90 8 44 362 3 832 905
14.8 14.7 6.4 9.9 0.9 4.9 40.0 0.3 91.9 100
GGSSS
101 78 34 70 6 26 285 0 600 632 16.0 12.3 5.4 11.1 1.0 4.1 45.1 0.0 94.9 100
GSSSS 17 22 11 18 0 9 37 0 114 120
14.2 18.3 9.2 15.0 0.0 7.5 30.8 0.0 95.0 100
PVV 5 14 7 2 0 5 24 0 57 59
8.5 23.7 11.9 3.4 0.0 8.5 40.7 0.0 96.6 100
SBV 48 44 22 34 0 34 166 1 349 402
11.9 11.0 5.5 8.5 0.0 8.5 41.3 0.3 86.8 100
SKV 105 78 52 93 2 30 263 2 625 675
15.6 11.6 7.7 13.8 0.3 4.4 39.0 0.3 92.6 100
SSSS 34 43 18 17 5 8 55 6 186 233
14.6 18.5 7.7 7.3 2.2 3.4 23.6 2.6 79.8 100
Total 444 412 202 324 21 156 1192 12 2763 3026
14.7 13.6 6.7 10.7 0.7 5.2 39.4 0.4 91.3 100
The table (4.9) given below is distribution of proportion of students by medium of
instructions across type of schools. On the whole we find that 70% of students are studying
with Hindi as their medium of instructions. Only 13% study in English medium. Another
16% with both Hindi and English as language of instructions, which essentially means some
subjects, are taught in Hindi and rest in English.
Across different types of schools there is a distinct difference between PVV on the one hand
and the rest of the schools on the other. In PVV schools 39% of students have English as
the medium of instructions plus another 56% with both Hindi and English as language of
instructions.

Draft Report 10 Nov 2016
33
Next to PVV schools, in SBV and GBSSS, both the boys-only type of schools the
proportion of students in English medium is moderate (21% & 17% respectively). This
figure is low in other type of schools and the least in GGSSS (2%).
Conversely, the proportion of students studying in Hindi medium is the highest in the three
Govt. co-ed, boys and girls schools. The three Sarvodaya schools too have high proportion
of students in Hindi medium, but marginally lower than the former set of schools. In PVV
schools only 5% of students have Hindi as the medium of instructions.
Table 4.9 Distribution of students by Medium of instructions across type of school
Type of school English Hindi + English Hindi Urdu Total GBSSS 158 (17) 93 (10) 654 (72) 905 (100) GGSSS 12 (2) 120 (19) 498 (79) 630 (100) GSSSS 14 (12) 9 (8) 97 (81) 120 (100) PVV 23 (39) 33 (56) 3 (5) 59 (100) SBV 85 (21) 75 (19) 235 (59) 4 (1) 399 (100) SKV 83 (12) 100 (15) 459 (68) 30 (4) 672 (100) SSSS 18 (8) 49 (21) 166 (71) 233 (100) Total 393 (13) 479 (16) 2112 (70) 34 (1) 3018 (100)
To summarise this brief discussion of differences in various aspects across the type of
schools one may point out two key observations. Firstly, in most of the aspects discussed
above one sees more or less a pattern in terms of gradation of type schools with PVV
schools faring better in almost all aspects discussed, followed by Sarvodaya schools –
especially co-ed or boys schools. The three government co-ed, govt boys and govt girl’s
schools are placed poorly on most of the indicators. Secondly the gender dimension
mediates with the type of schools. Thus we find that on some indicators students in both the
girls-only (SKV &GGSSS) schools are poorly placed compared to other co-ed and boy-only
schools. For instance, the proportion of students preparing for competitive exams or
proportion of students in English medium is low among students in girl-only schools.
III. Gender
In the following pages a set of tables are presented to describe differentials between girl and boys in
terms of streams they have currently chosen and their aspirations.
Commented [N20]: Thisimpactcanbeexplored
Commented [N21]: Canbenimportantdimension

Draft Report 10 Nov 2016
34
Table 4.10A. Distribution of students by type of schools across gender
Gender GBSSS SBV GGSSS SKV GSSSS PVV SSSS Total
Female 632 668 49 19 104 1472
0.0 0.0 42.9 45.4 3.3 1.3 7.1 100
Male 905 402 7 71 40 128 1553 58.3 25.9 0.0 0.5 4.6 2.6 8.2 100
Total 905 402 632 675 120 59 232 3025 29.9 13.3 20.9 22.3 4.0 2.0 7.7 100
Above table 4.10A. shows distribution of girls and boys across different types of schools
gets determined to a great extent on the basis of whether a school is boys-only or girls-only
school. About 88% of girls and 85% of boys study in girls-only and boys-only schools
respectively. This also means proportion of boys who get enrolled in co-ed schools are
marginally higher compared to the proportion of girls who get enrolled in these schools.
Table 4.10B. Distribution of students by streams opted across gender
Gender Arts COM+M COM-M PCB PCM PCMB VOC Total
Female 1111 91 148 3 18 27 73 1471 75.5 6.2 10.1 0.2 1.2 1.8 5.0 100
Male 1003 143 187 24 98 64 19 1538 65.2 9.3 12.2 1.6 6.4 4.2 1.2 100
Total 2114 234 335 27 116 91 92 3009 70.3 7.8 11.1 0.9 3.9 3.0 3.1 100
The table 4.10B. represents a greater proportion of girl students are enrolled in Arts stream
(76%) compared to boys (65%). Proportion of boys in all Science streams put together is
about 12% compared to only 3% among girls. On the other hand in the case of vocational
streams close to 5% of girls are in these streams vocational compare to only a little over
1% among the boys. Thus, there is a clear gender based differentials in streams opted /
secured.
Commented [N22]: Relevant

Draft Report 10 Nov 2016
35
Table 4.10C. Distribution of students by reason for choosing respective streams across gender
Reason
Class 10th marks
Interest
Parents
Peers
Future Prospects
Not got other option
Stream not offered
Good teachers
Easy
Others
Total
Total Students
Female
255 775 77 19 338 92 98 25 181 37 1897 1472
17.3 52.7 5.2 1.3
23.0 6.3 6.7
1.7
12.3
2.5
128.9 100
Male
369 658 77 38 405 125 92 7 149 45 1965 1553
23.8 42.4 5.0 2.5
26.1 8.1 5.9
0.5 9.6
2.9
126.5 100
Total
624 1433 154 57 743 217
190 32 330 82 3862
3025
16.2 37.1 4.0 1.5
19.2 5.6 4.9
0.8 8.5
2.1 100 100
Above table 4.10C. shows more than 52% of girl student have said that they chose their
streams out of their own choice. This proportion is only about 42% in boys. The proportion
of students who decided their stream based on parental suggestion is more or less equal
among boys and girls; so is the proportion who decided on streams keeping in mind future
prospects. Decision made due to influence from peer group is more among boys, but the
figures are too small for any meaningful inference. About 24% of boys have said that their
choice of stream was decided by the marks secured in 10th class; among girls this
proportion is little over 17%.
As table 4.10D. has given below represent, it is important and encouraging to note that the
proportion of students who had said they would like to study further after the 12th class is
marginally more among girls compared to boys. More or less equal proportions of girls and
boys have said they would like to take up paid work after completion of 12th class. Equally
encouraging is note that the proportions of girls who have said they will get married or stay
back home are very small.
Commented [N23]: Important

Draft Report 10 Nov 2016
36
Table 4.10D. Distribution of students by their proposed plans after completion of 12th standard across gender
Gender At Home
Break
Don't Know/Thinking
Family Business
Marriage
Others
Paid Work
Study Further
Total
Female 4 4 16 2 3 16 62 1354 1461
0.3 0.3 1.1 0.1 0.2 1.1 4.2 92.7 100
Male 0 7 35 5 0 37 82 1377 1543
0 0.5 2.3 0.32 0 2.4 5.3 89.2 100
Total 4 11 51 7 3 53 144 2731 3004
0.1 0.4 1.7 0.2 0.1 1.8 4.8 90.9 100
Table 4.10E. Distribution of students by the highest qualification they aspire to have across gender
Gender 12th Certificate Diploma UG PG Research Others Total
Female 55 27 86 692 384 87 101 1432
3.8 1.9 6.0 48.3 26.8 6.1 7.1 100
Male 68 39 94 761 350 80 88 1480
4.6 2.6 6.4 51.4 23.7 5.4 6.0 100
Total 123 66 180 1453 734 167 189 2912 4.2 2.3 6.2 49.9 25.2 5.7 6.5 100
In continuation with the above table (4.10E.); we note that the proportion of girls who wish
to study till PG (27%) and even above (6.1%) is more than the corresponding proportions of
boys (24% & 5.4%). The proportions who wish to stop at 12th class, or go for certificate
courses or diploma programs are marginally more among boys than girls.
The table (4.10F.) given below represent the proportion of boys who said they are preparing
for any competitive exams is more than three times the proportion of girls who said they are
preparing for examinations. Though numbers are small this indicates more concrete
differences between boys and girls in terms of aspirations and support received among a
small section.
Commented [N24]: Important
Commented [N25]: Relevant

Draft Report 10 Nov 2016
37
Table 4.10F. Distribution of students by proportions preparing for competitive exams gender
Gender Yes
Female 67
4.6
Male 230 15.1
Total 297 9.9
Table 4.10G. Gender vs. Medium of Instruction
Gender English Hin+Eng Hindi Urdu Total Female 110 (7.50) 248 (16.91) 1079 (73.55) 30 (2.04) 1467 (100) Male 283 (18.26) 231 (14.90) 1032 (66.58) 4 (0.26) 1550 (100) Total 393 (13.03) 479 (15.88) 2111 (69.97) 34 (1.13) 3017 (100)
Above table (4.10G.) the proportion of girls who are studying with Hindi as medium of
instruction is comparatively high than boys. On the other hand the proportions of students
with English as medium of instructions is more than twice among boys (18%) compared to
girls (8%).
Table 4.10H. Gender vs. reason for future aspirations
Gender
Parents Self
Teachers
Peers
Finance
Easy
Employability
Others Total
Total number of students
Female 117 1183 28 23 24 125 144 32 1676 1472 8.0 80.4 1.9 1.6 1.6 8.5 9.8 2.2 113.9 100
Male 98 1143 32 25 47 92 199 41 1677 1553
6.3 73.6 2.1 1.6 3.0 5.9 12.8 2.6 108.0 100
Total 215 2326 60 48 71 217 343 73 3353 3025 7.1 76.9 2.0 1.6 2.4 7.2 11.3 2.4 110.8 100
In above table (4.10H.) a majority of students (77%) responded that the decision on tertiary
education will be of their own based on their interest. This proportion is over 80% among
Commented [N26]: Relevant
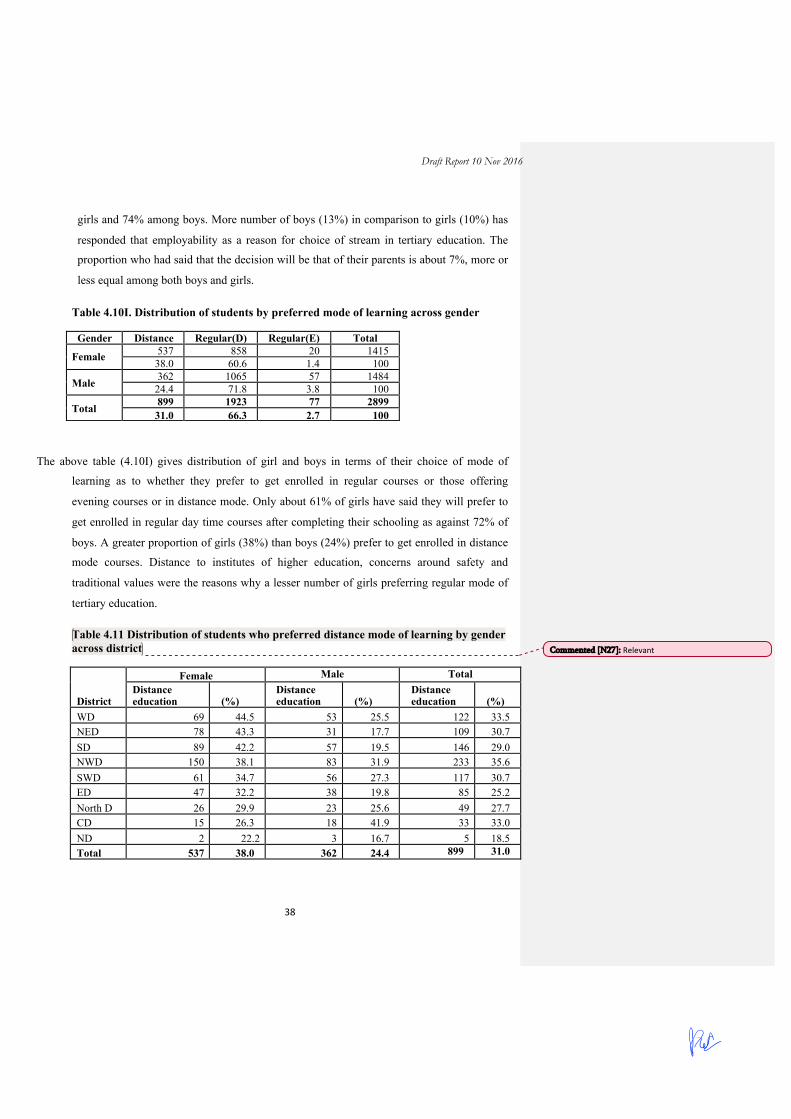
Draft Report 10 Nov 2016
38
girls and 74% among boys. More number of boys (13%) in comparison to girls (10%) has
responded that employability as a reason for choice of stream in tertiary education. The
proportion who had said that the decision will be that of their parents is about 7%, more or
less equal among both boys and girls.
Table 4.10I. Distribution of students by preferred mode of learning across gender
Gender Distance Regular(D) Regular(E) Total
Female 537 858 20 1415 38.0 60.6 1.4 100
Male 362 1065 57 1484 24.4 71.8 3.8 100
Total 899 1923 77 2899 31.0 66.3 2.7 100
The above table (4.10I) gives distribution of girl and boys in terms of their choice of mode of
learning as to whether they prefer to get enrolled in regular courses or those offering
evening courses or in distance mode. Only about 61% of girls have said they will prefer to
get enrolled in regular day time courses after completing their schooling as against 72% of
boys. A greater proportion of girls (38%) than boys (24%) prefer to get enrolled in distance
mode courses. Distance to institutes of higher education, concerns around safety and
traditional values were the reasons why a lesser number of girls preferring regular mode of
tertiary education.
Table 4.11 Distribution of students who preferred distance mode of learning by gender across district
District
Female Male Total Distance education (%)
Distance education
(%)
Distance education
(%)
WD 69 44.5 53 25.5 122 33.5 NED 78 43.3 31 17.7 109 30.7 SD 89 42.2 57 19.5 146 29.0 NWD 150 38.1 83 31.9 233 35.6 SWD 61 34.7 56 27.3 117 30.7 ED 47 32.2 38 19.8 85 25.2 North D 26 29.9 23 25.6 49 27.7 CD 15 26.3 18 41.9 33 33.0 ND 2 22.2 3 16.7 5 18.5 Total 537 38.0 362 24.4 899 31.0
Commented [N27]: Relevant

Draft Report 10 Nov 2016
39
As seen in the above table (4.11) ( in NWD, WD, CD, NED and SWD the proportion of
students opting who said they will opt for distance mode in tertiary education is high
compared to those in other districts. Looking specifically at girl students across educational
districts we find that girls in WD, NED and SD say that they will opt for distance mode in
higher proportions. On comparing proportion of girls with boys across districts we find this
difference is more in WD, NED, SD and ED. This could probably relate to remoteness of
localities, concerns of safety and transport connectivity.
Table 4.12 Distribution of students by their preferred career across gender
Gender
Govt Job
Professional
Pvt. Job
Business
Self Employed
Not take any employment
Other
Total
Female 878 321 99 35 56 4 49 1442 60.9 22.3 6.9 2.4 3.9 0.3 3.4 100
Male 916 197 120 147 99 1 43 1523 60.1 12.9 7.9 9.7 6.5 0.1 2.8 100
Total 1794 518 219 182 155 5 92 2965 60.5 17.5 7.4 6.1 5.2 0.2 3.1 100
The above table (4.12) shows Government job is the first preference as vocation or
profession for students. 60% of the students among both genders, i.e. females and males,
are aspiring for government jobs. This is followed by those willing to become
professionals: 22% among girls and 13% among boys. Around 16% of male students want
to be either self employed or do business in future. This proportion is smaller among girls
(6%).
The below table (4.13) represent 23% of boys and 19% of girls have undergone some form
of training in vocational skills – either formal or informal.
Commented [N28]: Relevant

Draft Report 10 Nov 2016
40
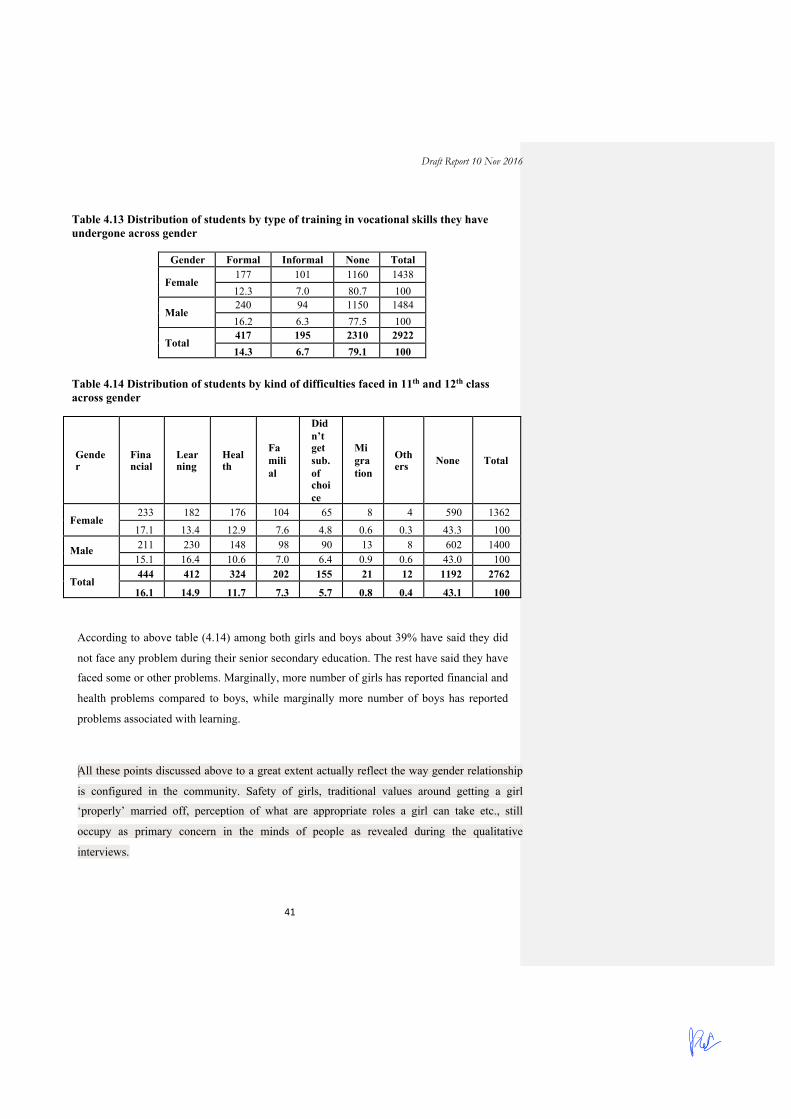
Draft Report 10 Nov 2016
41
Table 4.13 Distribution of students by type of training in vocational skills they have undergone across gender
Gender Formal Informal None Total
Female 177 101 1160 1438 12.3 7.0 80.7 100
Male 240 94 1150 1484 16.2 6.3 77.5 100
Total 417 195 2310 2922 14.3 6.7 79.1 100
Table 4.14 Distribution of students by kind of difficulties faced in 11th and 12th class across gender
Gender
Financial
Learning
Health
Familial
Didn’t get sub. of choice
Migration
Others None Total
Female 233 182 176 104 65 8 4 590 1362 17.1 13.4 12.9 7.6 4.8 0.6 0.3 43.3 100
Male 211 230 148 98 90 13 8 602 1400 15.1 16.4 10.6 7.0 6.4 0.9 0.6 43.0 100
Total 444 412 324 202 155 21 12 1192 2762
16.1 14.9 11.7 7.3 5.7 0.8 0.4 43.1 100
According to above table (4.14) among both girls and boys about 39% have said they did
not face any problem during their senior secondary education. The rest have said they have
faced some or other problems. Marginally, more number of girls has reported financial and
health problems compared to boys, while marginally more number of boys has reported
problems associated with learning.
All these points discussed above to a great extent actually reflect the way gender relationship
is configured in the community. Safety of girls, traditional values around getting a girl
‘properly’ married off, perception of what are appropriate roles a girl can take etc., still
occupy as primary concern in the minds of people as revealed during the qualitative
interviews.

Draft Report 10 Nov 2016
42
For instance, from the communities’ point of view the factors that influence the decision on
selection of stream after 12th among girls especially from the area of the two girls-only
schools are distance and safety: distance to schools, distance to tuition centres which have
become almost a must in the case of science streams and distance to institutes of tertiary
education where a girl has to travel if she completes 12th with science stream. With
distance safety automatically gets appended as a concern. Girls have to either leave home
very early, or come back late, walk through unsafe paths etc are very practical concerns of
parents.
One of the girls who had finished her schooling last year from a GGSSS school had secured her admission in a nearby college through sports quota and she was asked to take part in regular training in a sport. This required travelling back late from college or staying back for training. This was not acceptable to parents and the girl had to discontinue from this course within a few months of joining. Now she has to join some other course in a nearby college in the next academic year.
This reflects that the concern may be slightly different from mere safety; perhaps related to
the need to get a daughter married properly, without any blot to the honour of the family.
One of the parents of a girl student did mention that it becomes difficult to find an equally
educated groom of a girl studies more. As a result girl students pushed in to courses like
vocational courses and teacher training courses. Most girls students enrolled in vocational
streams like tailoring and fashion designing end up opting for home-based work like
setting up their own ‘boutique’ or getting involved in family trade like tailoring etc.
If this is what the community conveys accordingly schools system also gets compelled to
respond with greater scope for streams that are ‘appropriate’ for girls and it becomes a
vicious cycle of less takers hence lesser options and vice-versa. This scenario may also
affect motivation of girl students from early classes onwards.
For instance in one of the GGSSS in peripheral-rural part of Delhi the school earlier had science as well as commerce streams but these streams were withdrawn in due course as there were less takers. Now the school offers only humanities and vocation stream. The vocational stream offered is cutting and tailoring.
Now those few students who wish to study commerce or science get enrolled in a sarvodaya school located 2.5km away from the village. Four students from this school had got enrolled in science stream there this year, but later two of them switched to commerce stream.

Draft Report 10 Nov 2016
43
One of the mothers expressed as follows: Will make her (daughter) study up to graduation, through distance mode. The locality is not safe here. Mostly she (daughter) will choose commerce in 11th class, if she manages to score good marks. But she has to educate her daughter as education is their only wealth and her daughter should be able to find a good job with good salary so that she is able to be financially independent. (Mother of a girl studying in 10th class in a GGSSS school)
IV. Streams
In the following pages a set of tables are presented to describe differentials among students across
different streams in senior secondary classes their aspirations and related aspects.
Table 4.15 Streams chosen in senior secondary level
Stream DOE, Pvt. aided and unaided*
Sampled schools
Sampled students
Science 18 6.2 7.8 Commerce 24 17.6 18.9 Arts 54 71.6 70.3 Vocational 3.6 4.6 3.1
* - DISE report
The following set of tables captures students’ aspiration and related aspects across streams
chosen by the students at senior secondary level.
The below table (4.16) shows proportion of students who said that their choice of stream in
senior secondary school was dictated by marks scored in 10th class is maximum among
those in vocational stream (30%) followed by those in arts stream (24%) and then those in
COM-M i.e., commerce stream without maths (18%). In other streams this proportion is
quite less.
The proportion who said they chose their stream out of their own interest is high in all
streams (about to 47%) except in arts stream and COM-M. This proportion is high among
science students ranging between 64 to 70%. In-depth interviews conducted with teachers
and to some extent the FGDs had with students revealed this proportion of students who had
to opt for a stream on the basis of tenth marks could be higher than the figure arrived here.
Commented [N29]: Relevant
Commented [N30]: Relevant

Draft Report 10 Nov 2016
44
One of the explanations could be that students when interviewed alone do not feel easy to
share that they got low marks in 10th class.
Students who said they chose the stream keeping in mind future prospects in mind is high in
all science streams and in COM+M stream; this proportion is least in vocational, arts and
Com-M in that order.
14% of arts have said they chose the stream as they felt it will be easy to study. During
interviews with teachers, some of them had said that those students who have problem with
English as a subject get enrolled in vocational stream to avoid English.
Table 4.16 Distribution of students by reasons for choosing a stream across streams chosen
Reason
Class 10th marks
Interest
Parents
Peers
Future Prospects
Not got other option
Stream not offered
Good teachers
Easy
Others
Total
No. of Students
Arts
512 921 98 33 415 185
170 27 294 70 2725
2115
24.2 43.6 4.6
1.6
19.6 8.8 8.0
1.3
13.9
3.3
128.8 100
COM+M
17 144 13 7 94 5 3 1 6 3 293 234
7.3 61.5 5.6 3.0
40.2 2.1 1.3
0.4 2.6
1.3
125.2 100
COM-M
59 161 32 10 104 22 12 1 21 3 425 335 17.
6 48.1 9.6 3.0
31.0 6.6 3.6
0.3 6.3
0.9
126.9 100
PCB
1 19 0 0 12 1 0 0 0 1 34 27
3.7 70.4 0.0 0.0
44.4 3.7 0.0
0.0 0.0
3.7
125.9 100
PCM
2 74 5 2 64 1 0 1 1 1 151 116
1.7 63.8 4.3 1.7
55.2 0.9 0.0
0.9 0.9
0.9
130.2 100
PCMB 4 58 3 2 44 0 0 2 5 0 118 91
4.4 63.7 3.3 2.2
48.4 0.0 0.0
2.2 5.5
0.0
129.7 100
VOC
28 53 2 3 10 3 5 0 0 4 108 92 30.
4 57.6 2.2 3.3
10.9 3.3 5.4
0.0 0.0
4.4
117.4 100
Total
623 143
0 153 57 743
217
190 32 327 82 3854
3010
20.7 47.5 5.1
1.9
24.7 7.2 6.3
1.1
10.9
2.7
128.0 100
Commented [N31]: Relevant

Draft Report 10 Nov 2016
45
In below table (4.17) a vast majority of students (91%) across all streams have said that they
wish to study further. Close to 5% of students have said they wish to take up paid work.
This proportion is more among students in vocational, arts and Com+M streams.
It is interesting to note that a small number of student want to take a break after 12th class.
This proportion is 11% among science students. Qualitative interviewing and FGD has
revealed that some of the science students want to take break in order to prepare for
common entrance tests.
Table 4.17 Distribution of students by their plan after 12th standard across streams chosen
Stream
At Home
Break
Don't Know/Thinking
Family Business
Marriage
Paid Work
Study Further
Others
Total
Arts 3 5 35 6 3 112 1895 40 2099 0.1 0.2 1.7 0.3 0.1 5.3 90.3 1.9 100
COM+M
1 5 10 214 4 234 0.4 2.1 4.3 91.5 1.7 100
COM-M 6 1 10 313 4 334 1.8 0.3 2.99 93.71 1.2 100
PCB 3 1 23 27 11.1 3.7 85.2 100
PCM 2 1 3 108 114 1.8 0.9 2.6 94.7 100
PCMB 3 85 3 91 3.3 93.4 3.3 100
VOC 1 7 82 2 92 1.1 7.6 89.1 2.2 100
Total 4 11 51 7 3 142 2720 53 2991 0.1 0.4 1.7 0.2 0.1 4.8 90.9 1.8 100
Table 4.18 Distribution of students by choice of future line of education after 12th standard across streams chosen
Stream Arts Commerce
Engineering
Law
Medicine
Science Voc Oth
ers Total
Arts 1380 30 56 109 9 25 36 324 1969 70.1 1.5 2.8 5.5 0.5 1.3 1.8 16.5 100
Commented [N32]: Relevant

Draft Report 10 Nov 2016
46
COM+M 9 205 2 1 9 226 4.0 90.7 0.9 0.4 4.0 100
COM-M 7 273 3 7 2 1 34 327 2.1 83.5 0.9 2.1 0.6 0.3 10.4 100
PCB 2 18 6 26 7.7 0.0 69.2 23.1 0.0 0.0 100
PCM 3 3 71 8 22 6 113 2.7 2.7 62.8 0.0 7.1 19.5 0.0 5.3 100
PCMB 1 19 1 44 20 1 5 91 1.1 20.9 1.1 48.4 22.0 1.1 5.5 100
VOC 39 1 2 3 1 2 12 12 72 54.2 1.4 2.8 4.2 1.4 2.8 16.7 16.7 100
Total 1438 513 153 122 80 77 51 390 2824 50.9 18.2 5.4 4.3 2.8 2.7 1.8 13.8 100
The above table (4.18) gives distribution of students in terms of the line of education
students wish to pursue after 12th standard across different streams they are currently
enrolled in. A choice of a vast majority is being dictated by the stream they have chosen
currently in senior secondary level. For instance choice of 90% of students in Com+M
stream, 83% of students in Com-M, about 70% of students in PCB and PCMB and 63% of
those in PCM streams are decided by the stream they are currently in. The only exemption is
students who are currently in vocational stream; 54% of them want to join arts stream after
their 12th class. This is because many of these students have arts as subjects in 11th and 12th
in addition to vocational subjects.
The data beyond this is of interest to us. For PCB, PCM and PCMB students studying
science therefore becomes a good second choice, for students currently in arts stream law is
being seen as an alternative choice.
Data also a certain degree of discrepancy where, it has been recorded that those who are
practically not eligible to enrol in medicine or engineering have indicated that they wish to
join in these respective courses. It could probably mean they may get enrolled in
unrecognised courses or in polytechnics in the field like nursing, lab-technician or private
computer courses, mobile repairing courses etc.
Table 4.19 Distribution of students in diverse courses or vocations
Course No. of students Teaching 120 Hotel Management 22 Police 20 Vocational 20

Draft Report 10 Nov 2016
47
Certificate 18 Defence 18 Computer 24 BA languages 16 Arts 16 Civil services 14 Nursing 11 Polytechnic 12 Performing arts 9 Law 7 Sports 6 Journalism 5 Management 5 Physical Education 3 Maths 2 Railways 2 Others 5 Don’t know 48
In order to bring out the diversity in interest that students have the option of ‘others’ was
further disaggregated. The following table (4.19) gives distribution of students in these
diverse courses or vocations they want to pursue after 12th class. The proportions are
smaller; however our interest is to highlight the diversity of interests.
Table 4.20 Distribution of reason for this future choice of line of education after 12th standard across streams chosen
Stream Parents Self
Teachers
Peers
Finance
Easy
Employability
Others Total
No. of Students
Arts 151 1621 34 26 33 189 206 56 2316 2115 7.1 76.6 1.6 1.2 1.6 8.9 9.7 2.7 109.5 100
COM+M 13 190 10 6 11 7 39 1 277 234
5.6 81.2 4.3 2.6 4.7 3.0 16.7 0.4 118.4 100 COM-M 27 234 11 11 16 13 56 13 381 335
Commented [N33]: Relevant

Draft Report 10 Nov 2016
48
8.1 69.9 3.3 3.3 4.8 3.9 16.7 3.9 113.7 100
PCB 0 24 0 0 2 0 6 0 32 27
0.00 88.9 0.0 0.0 7.4 0.0 22.2 0.0 118.5 100
PCM 6 96 2 0 6 2 18 0 130 116
5.2 82.8 1.7 0.0 5.2 1.7 15.5 0.0 112.1 100
PCMB 12 83 2 2 1 1 5 0 106 91
13.2 91.2 2.2 2.2 1.1 1.1 5.5 0.0 116.5 100
VOC 4 69 1 2 2 4 11 2 95 92
4.4 75.0 1.1 2.2 2.2 4.4 12.0 2.2 103.3 100
Total 213 2317 60 47 71 216 341 72 3337 3010 7.1 77.0 2.0 1.6 2.4 7.2 11.3 2.4 110.9 100
From the above table (4.20) 77% of students have responded that their choice of line of
education they will choose will be decided by themselves. This proportion is marginally
lower among students who are currently in vocational and Com-M streams compared to
those in science and vocational streams. Over 11% of students have said that their choice of
line of education will depend on employability. This proportion is highest among those
doing PCB and then followed by those currently pursuing commerce streams. This
proportion is least among those in PCMB stream, which could be explained by the fact that
in PCMB over 91% of students have declared their choice will be on the basis of their
interest. The proportion is also low among student currently in arts stream
Table 4.21 Distribution of students preparing for any competitive examination across streams chosen
Streams No Yes Total
Arts 1932 137 2069 93.4 6.6 100.0
COM+M 211 20 231 91.3 8.7 100.0
COM-M 301 28 329 91.5 8.5 100.0
PCB 17 10 27 63.0 37.0 100.0
PCM 50 66 116 43.1 56.9 100.0
PCMB 67 24 91 73.6 26.4 100.0
VOC 81 11 92 88.0 12.0 100.0
Total 2659 296 2955 90.0 10.0 100.0

Draft Report 10 Nov 2016
49
In the above table (4.21), the proportion of students who had said that they are preparing for
any competitive exams is high among those who are currently pursuing science stream
especially those pursuing PCM stream followed by PCB and PCMB in that order. This
proportion is least among those pursuing arts and commerce streams.
The table below (4.22) shows the proportion of students who have responded that they
would like to continue in regular mode of learning after their schooling is high among those
pursuing science streams followed by commerce streams. This proportion is least among
those pursuing arts and vocational streams. Conversely, More than 36% of students in arts
streams and close to 0ne-fourth in commerce streams have said they will prefer to continue
their education in distance mode. The proportion who would prefer regular but evening
courses is less than 3%.
Table 4.22 Distribution of students by their choice of mode of learning across streams chosen
Stream Distance Regular(D) Regular(E) Total
Arts 730 1234 56 2020 36.1 61.1 2.8 100
COM+M 55 168 1 224 24.6 75.0 0.5 100
COM-M 77 240 12 329 23.4 73.0 3.7 100
PCB 27 27 0.0 100 0.0 100
PCM 6 102 5 113 5.3 90.3 4.4 100
PCMB 3 85 2 90 3.3 94.4 2.2 100
VOC 27 56 1 84 32.1 66.7 1.2 100
Total 898 1912 77 2887 31.1 66.2 2.7 100.0
Table 4.23 Distribution of students by highest qualification that they wish to attain across streams chosen Commented [N34]: Canbeconsidered

Draft Report 10 Nov 2016
50
Stream 12th
Certificate
Diploma
UG PG Research
UG+PG+R Oth
ers Total
Arts 91 50 142 1060 457 96 1613 134 2030
4.5 2.5 7.0 52.2 22.5 4.7 79.0 6.6 100
COM+M 10 5 5 112 69 11 192 16 228
4.4 2.2 2.2 49.1 30.3 4.8 84.0 7.0 100
COM-M 10 7 17 145 105 21 271 21 326
3.1 2.2 5.2 44.5 32.2 6.4 83.0 6.4 100
PCB 1 10 7 6 23 3 27
3.7 0.0 0.0 37.0 25.9 22.2 85.0 11.1 100
PCM 2 5 51 28 21 100 1 108
1.9 0.0 4.6 47.2 25.9 19.4 93.0 0.9 100
PCMB 1 2 22 49 11 82 4 89
0.00 1.1 2.3 24.7 55.1 12.4 92.0 4.5 100
VOC 5 3 9 50 17 1 68 5 90
5.6 3.3 10.0 55.6 18.9 1.1 76.0 5.6 100
Total 119 66 180 1450 732 167 2349 184 2898 4.1 2.3 6.2 50.0 25.3 5.8 81.0 6.4 100
From the above table (4.23) over 50% of students have said they wish to continue their
education up to graduation. This proportion is highest among those pursuing vocational and
arts streams followed by those pursuing commerce streams and those with PCM streams.
Among those who are pursuing PCB and PCMB, who have the potential to join in medical
education this proportion is low as many have said they wish to continue post graduate
education or even higher. Thus if we see the sum of proportions who want to study up to UG
or beyond till research (UG + PG + Research) it is highest among those pursuing PCM,
PCMB science streams followed by PCB, COM+M, Com-M, arts and vocational in that
order.
Table 4.24 Distribution of students by their choice of future vocation / profession across streams chosen
Stream Business
Govt Job
Other
Professional
Pvt. Job
Self Employed
Not looking for employment
Total
Arts 111 1297 70 347 132 113 4 2074 5.4 62.5 3.4 16.7 6.4 5.5 0.2 100.

Draft Report 10 Nov 2016
51
COM+M 16 136 2 43 23 10 230 7.0 59.1 0.9 18.7 10.0 4.4 0.0 100
COM-M 36 188 10 49 36 11 1 331 10.9 56.8 3.0 14.8 10.9 3.3 0.3 100
PCB 14 1 8 2 25 0.0 56 4 32 0.0 8 0.0 100
PCM 11 50 5 28 12 7 113 9.7 44.3 4.4 24.8 10.6 6.2 0.0 100
PCMB 4 53 3 16 7 7 90 4.4 58.9 3.3 17.8 7.8 7.8 0.0 100
VOC 4 48 1 23 8 5 89 4.5 53.9 1.1 25.8 9.0 5.6 0.0 100
Total 182 1786 92 514 218 155 5 2952 6.2 60.5 3.1 17.4 7.4 5.3 0.2 100
In terms of future vocation of employment students aspire, above table (4.24) represent
over 60% wish to take up government employment. This proportion is highest among those
pursuing arts stream and lest among those in PCM stream. Over 17% want to become
professionals. This proportion is highest among those pursuing PCB, PCM and vocation
streams and least among students pursuing commerce, arts and PCMB stream. The
proportion who wishes to enter in to private employment is high among those pursuing
commerce streams and PCM stream. The proportion who wishes to take up self-
employment is on the whole low, but is relatively more among all those pursuing science
streams and surprisingly low among those pursuing commerce, vocational and arts streams.
The following table (4.25) captures the diversity in vocation / jobs that students aspire at.
Though numbers are smaller in each category, the table aims to capture the diversity in
interest.
Table 4.25 distribution/ diversity in vocation / jobs that students aspire at
Vocation / Job No. of students Police 13 Teaching 11 Performing arts 9 Sports 7 Defence 6 Fashion designer 4 CA 3 Civil service 3 Banking 2
Commented [N35]: Canhaveinterestinguse
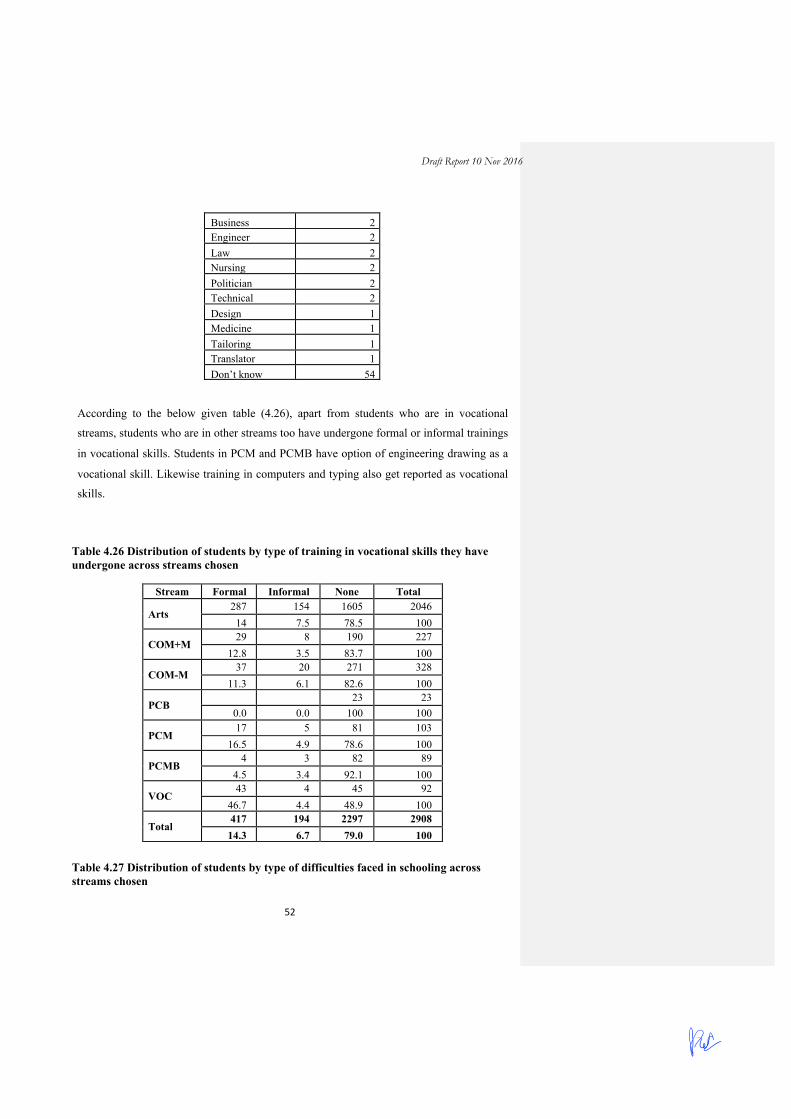
Draft Report 10 Nov 2016
52
Business 2 Engineer 2 Law 2 Nursing 2 Politician 2 Technical 2 Design 1 Medicine 1 Tailoring 1 Translator 1 Don’t know 54
According to the below given table (4.26), apart from students who are in vocational
streams, students who are in other streams too have undergone formal or informal trainings
in vocational skills. Students in PCM and PCMB have option of engineering drawing as a
vocational skill. Likewise training in computers and typing also get reported as vocational
skills.
Table 4.26 Distribution of students by type of training in vocational skills they have undergone across streams chosen
Stream Formal Informal None Total
Arts 287 154 1605 2046 14 7.5 78.5 100
COM+M 29 8 190 227
12.8 3.5 83.7 100
COM-M 37 20 271 328
11.3 6.1 82.6 100
PCB 23 23
0.0 0.0 100 100
PCM 17 5 81 103
16.5 4.9 78.6 100
PCMB 4 3 82 89
4.5 3.4 92.1 100
VOC 43 4 45 92
46.7 4.4 48.9 100
Total 417 194 2297 2908
14.3 6.7 79.0 100
Table 4.27 Distribution of students by type of difficulties faced in schooling across streams chosen

Draft Report 10 Nov 2016
53
Stream
Financial
Learning
Familial
Health
Migration
Not got sub. of choice
None
Others Total
No. of students
Arts
274 276 152 233 12 106 872 8 1933 211
5
13 13.1 7.2 11.0 0.6 5.0 41.2 0.4 91.4 100
COM+M
48 30 14 27 1 5 86 0 211 234 20.
5 12.8 6.0 11.5 0.4 2.1 36.8 0.0 90.2 100
COM-M
55 53 19 30 4 28 119 1 309 335 16.
4 15.8 5.7 9.0 1.2 8.4 35.5 0.3 92.2 100
PCB
6 3 1 2 0 0 12 0 24 27 22.
2 11.1 3.7 7.4 0.0 0.0 44.4 0.0 88.9 100
PCM
29 25 8 15 2 8 34 0 121 116
25 21.6 6.9 12.9 1.7 6.9 29.3 0.0 104.3 100
PCMB
20 13 5 10 1 1 32 3 85 91
22 14.3 5.5 11 1.1 1.1 35.2 3.3 93.4 100
VOC
11 11 3 7 1 7 37 0 77 92
12 12.0 3.3 7.6 1.1 7.6 40.2 0.0 83.7 100
Total
443 411 202 324 21 155 1192 12 2760 301
0 14.
7 13.7 6.7 10.8 0.7 5.2 39.6 0.4 91.7 100
The above table (4.27) relatively higher proportion of students in science streams have
expressed that they face financial difficulties compared to students in other streams. In-
depth interviews with parents and FGDs with students revealed that most students in science
streams get enrolled in private tuitions with very high fees. In fact one of the reasons give by
some students for not opting science streams despite having scored adequate marks was the
need for getting enrolled in private tuitions and problems in meeting this cost. A good
proportion of students doing commerce with maths too have expressed that they face
financial difficulties. Students who said they faced problems in learning are more or less
uniform across all streams except for marginally higher proportion by students in PCM
stream. About 8% of students in vocational and Com-M streams have said they did not have
the stream of their choice and that has been articulated as a problem by them.

Draft Report 10 Nov 2016
54
Table 4.28A. Distribution of students enrolled in science streams the proportion who said they liked the respective subject
Stream
Total students
Biology
Chemistry
Physics
Maths
Computer Science
English
PCB 27 9 10 4
11.5 33.3 37 14.8 0.0
PCM 116 6 23 31 65 7 9
49.6 5.2 19.8 26.7 56 6 7.8
PCMB 91 38 11 22 35 8
38.9 41.8 12.1 24.2 38.5 8.8
Total 234 53 44 57 100 7 17 100 22.7 18.8 24.4 48.3 6 7.3
Table 4.28B. Distribution of students enrolled in science streams the proportion who found respective subject difficult
Stream
Total students
Biology
Chemistry
Physics
Computer Science
Maths
English
PCB 27 1 5 13 -- -- 1
11.5 3.7 18.5 48.2 -- -- 3.7
PCM 116 2 37 33 0 12 4 49.6 1.7 31.9 28.5 -- 10.3 3.5
PCMB 91 8 19 35 -- 9 2
38.9 8.8 20.9 38.5 -- 9.9 2.2 Total 234 11 61 81 0 21 7

Draft Report 10 Nov 2016
55
100 4.7 26.1 34.6 0.0 10.1 3.0
The below tables (4.28A and 4.28B), looking at difficulties faced by students with respect to
learning, we find that among the students in science stream over one-third of them (35%)
have said that they find physics as a subject difficult followed by Chemistry found to be
difficult by about one-fourth of them (26%). Only about 10% found Mathematics difficult.
Correspondingly, close to half of students from science stream have said they like
mathematics as a subject, followed by one-fourth of them (24%) saying they like physics;
23% have said they like biology and 19% like Chemistry.
Below tables (4.29A and 4.29B.) gives distribution of students among commerce stream
34% found mathematics difficult followed by 20% finding Business studies difficult and
15% find the subject of Accounts difficult. Among these students 53% said they liked
Accounts and 33% liked mathematics.
Table 4.29A. Distribution of students enrolled in commerce streams the proportion who said they liked the respective subject
Stream
Total students
Accounts
Business Studies
Economics Maths
English
COM+M 234 122 17 24 77 31
41.1 52.1 7.3 10.3 32.9 13.3
COM-M 335 179 57 33 58
58.9 53.4 17.0 9.9 17.3
Total 569 301 74 57 77 89 100 52.9 13.0 10.0 32.9 15.6
Table 4.29B. distribution of students enrolled in commerce streams the proportion who found respective subject difficult
Stream
Total students
Accounts
Business Studies
Economics Maths
English
COM+M 234 20 41 33 79 18
41.1 8.6 17.5 14.1 33.8 7.7
COM-M 335 67 72 91 19
58.9 20.0 21.5 27.2 5.7
Total 569 87 113 124 79 37 100 15.3 19.9 21.8 33.8 6.5

Draft Report 10 Nov 2016
56
From below table (4.30), among students in arts stream the proportions who said they found
respective subjects difficult ranged between about 1% (sociology) to 7% (Political science).
The proportion who said they liked the respective subjects too was ranging between 3%
(Economics) to 9% (Political science)
Table 4.30 Distribution of students enrolled in arts streams the proportion who found respective subject difficult or they liked.
Subjects Found difficult Liked Economics 3.4 2.5 History 5.7 5.4 Political Science 6.9 9.3 Sociology 1.2 3.7
In the below table (4.31), across streams we find that about 2 to 4% of students in science
stream find English as a subject difficult. This proportion is about 6-7% among commerce
students, 16% among vocational stream students and over 25% among arts students. At the
same time, about 27% of students in arts stream, 13-18% of students in commerce stream
and 7-8% students in PCM&PCMB streams have said they like English as a subject.
Table 4.31 Proportion of students who find difficult and who liked English as a subject across streams
Stream Total students Find it difficult Liked it Arts 2115 532 25.2 586 27.7 COM+M 234 18 7.7 31 13.3 COM-M 335 19 5.7 58 17.3 PCB 27 1 3.7 0 0.0 PCM 116 4 3.5 9 7.8 PCMB 91 2 2.2 8 8.8 VOC 92 15 16.3 17 18.5 Total 3010 591 19.6 709 23.6
In below table (4.32), surprisingly we also find about 20% of students from arts stream and
17.39% of students from vocational stream find Hindi difficult.
Table 4.32 Proportion of students who find difficult and who liked Hindi as a subject across streams
Stream Total Students Found it difficult Liked it Arts 2115 420 19.9 33 1.6 COM+M 234 2 0.9 COM-M 335 23 6.9 7 2.1

Draft Report 10 Nov 2016
57
PCB 27 1 3.7 PCM 116 1 0.9 PCMB 91 Voc 92 16 17.4 Total 3010 463 15.4 40 1.3
V. Parent’s educational qualification
The following tables (4.33 to 4.43) represents Educational qualification of parents, mother
and father separately and respective association with students’ choice of streams,
distribution in different types of schools etc are discussed in this section.
The below two tables (4.33 A and 4.33 B) shows that the proportion of students who have
taken arts stream is very high among those whose parents have no education or studied up to
primary school. As the level of parents’ education increases this proportion of children in
arts stream roughly comes down. Similar is the situation in the case of vocational stream;
barring the fact that children of parents who have diploma or certificate qualification (i.e.
vocational qualification) are over represented. The situation is reverse in the case of
commerce and science streams: as the level of parents’ education increases the proportion
enrolled in respective streams increases. As numbers are small in PCB stream no pattern is
visible.
Table No 4.33A. Distributions of students by stream across mother’s educational qualification
Mother’s education Arts COM+
M COM-M PCB
PCM
PCMB
VOC Total
Not attended school
779 67 70 11 22 19 44 1012 77.0 6.6 6.9 1.1 2.2 1.9 4.4 100
Up to Primary
329 20 31 1 12 7 14 414 79.5 4.8 7.5 0.2 2.9 1.7 3.4 100
Up to Elementary
328 28 53 3 24 11 11 458 71.6 6.1 11.6 0.7 5.2 2.4 2.4 100
Commented [N36]: Canbeanimportantdimension

Draft Report 10 Nov 2016
58
Up to 10th 350 48 77 5 28 17 11 536 65.3 9.0 14.4 0.9 5.2 3.2 2.1 100
Up to 12th 177 37 62 5 16 20 8 325 54.5 11.4 19.1 1.5 4.9 6.2 2.5 100
Diploma/ Certificate
5 1 1 7 71.4 14.3 0.0 0.0 0.0 14.3 0.0 100
UG 60 19 27 1 12 11 4 134
44.8 14.2 20.2 0.8 9.0 8.2 3.0 100
PG 6 3 3 1 1 2 16
37.5 18.8 18.8 6.3 6.3 12.5 0.0 100
Others 18 4 2 24 75 16.7 8.3 0.0 0.0 0.0 0.0 100
Total 205
2 227 325 27 115 88 92 2926
70.1 7.8 11.1 0.9 3.9 3.0 3.1 100
Table 4.33B. Distribution of students by stream across father’s educational qualification
Father’s education Arts COM+M COM-
M PCB PCM PCMB VOC Total
Not attended school 269 14 22 3 8 4 10 330
81.5 4.2 6.7 0.9 2.4 1.2 3.0 100
Up to Primary 248 8 17 4 4 4 13 298
83.2 2.7 5.7 1.3 1.3 1.3 4.4 100
Up to Elementary 349 27 34 2 11 4 17 444
78.6 6.08 7.7 0.5 2.5 0.9 3.8 100 Up to 10th 569 59 96 8 40 17 21 810

Draft Report 10 Nov 2016
59
70.3 7.3 11.9 1.0 4.9 2.1 2.6 100
Up to 12th 340 71 82 4 30 25 19 571
59.5 12.4 14.4 0.7 5.3 4.4 3.3 100
Diploma/Certificate 6 2 2 1 4 2 17
35.3 11.8 11.8 0.0 5.9 23.5 11.8 100
UG 144 35 52 5 15 20 3 274
52.6 12.8 19.0 1.8 5.5 7.3 1.1 100
PG 25 7 6 1 4 11 54
46.3 13 11.1 1.9 7.4 20.4 0.0 100
Others 24 3 5 2 34
70.6 8.8 14.7 0.0 0.0 0.0 5.9 100
Total 1974 226 316 27 113 89 87 2832 69.7 8.0 11.2 1.0 4.0 3.1 3.1 100
The above two tables (4.33A. and 4.33B.) shows that the proportion of students who have
taken arts stream is very high among those whose parents have no education or studied up
to primary school. As the level of parents’ education increases this proportion of children
in arts stream roughly comes down. Similar is the situation in the case of vocational
stream; barring the fact that children of parents who have diploma or certificate
qualification (i.e. vocational qualification) are over represented. The situation is reverse in
the case of commerce and science streams: as the level of parents’ education increases the
proportion enrolled in respective streams increases. As numbers are small in PCB stream
no pattern is visible.

Draft Report 10 Nov 2016
60
Table 4.34A. Mother educational qualification Vs Reason for stream*
Mother’s education
Class 10th Marks
Interest
Parents
Peers
Future prospects
Not got other option
Stream not offered
Good teacher
Easy
Other
No. of responses
Total students
Not attended school
220 462 44 21 206 84 75 12 108 44 1232 1013 21.7 45.6 4.3 2.1 20.3 8.3 7.4 1.2 10.7 4.3 121.6 100
Up to Primary
100 188 21 8 104 31 30 4 50 7 543 414 24.2 45.4 5.1 1.9 25.1 7.5 7.3 1.0 12.1 1.7 131.2 100
Up to Elementary
110 199 26 10 118 33 30 6 61 10 603 458 24.0 43.5 5.7 2.2 25.8 7.2 6.6 1.3 13.3 2.2 131.7 100
Up to 10th 87 277 33 7 140 30 24 5 56 9 668 536 16.2 51.7 6.2 1.3 26.1 5.6 4.5 0.9 10.5 1.7 124.6 100
Up to 12th 54 177 18 5 91 18 11 3 31 6 414 325 16.6 54.5 5.5 1.5 28.0 5.5 3.4 0.9 9.5 1.9 127.4 100
Diploma/ Certificate
2 3 0 0 3 0 1 0 1 0 10 7 28.6 42.9 0.0 0.0 42.9 0.0 14.3 0.0 14.3 0.0 142.9 100
UG 22 76 6 2 45 8 8 2 8 2 179 134 16.4 56.7 4.5 1.5 33.6 6.0 6.0 1.5 6.0 1.5 133.6 100
PG 1 11 2 6 0 20 16 6.3 68.8 12.5 0.0 37.5 0.0 0.0 0.0 0.0 0.0 125.0 100
Others 7 6 1 7 2 3 3 0 29 24 29.2 25.0 4.2 0.0 29.2 8.3 12.5 0.0 12.5 0.0 120.8 100
Total 603 1399 151 53 720 206 182 32 318 78 3742 2927 20.6 47.8 5.2 1.8 24.6 7.0 6.2 1.1 10.9 2.7 127.8 100
* The table gives information form an item that elicited multiple responses. Hence the total number of response is more than number of students who were interviewed

Draft Report 10 Nov 2016
61
Table 4.34B. Father’s Qualification vs. reason for stream*
Father’s education
Class 10th marks
Interest
Parents
Peers
Future Prospects
Not got other option
Stream not offered
Good teachers
Easy
Others
No. of responses
Total students
Not attended school
68 166 14 4 56 32 16 5 37 16 414 330 20.
6 50.3 4.2 1.2
17.0 9.7 4.9
1.5
11.2
4.9
125.5 100
Up to Primary
59 133 15 9 60 21 25 3 32 11 368 298 19.
8 44.6 5.0 3.0
20.1 7.1 8.4
1.0
10.7
3.7
123.5 100
Up to Elementary
102 191 24 3 107 27 31 3 59 7 554 446 22.
9 42.8 5.4 0.7
24.0 6.1 7.0
0.7
13.2
1.6
124.2 100
Up to 10th 168 380 37 13 215 67 57 9 87 25 1058 813 20.
7 46.7 4.6 1.6
26.5 8.2 7.0
1.1
10.7
3.1
130.1 100
Up to 12th 126 271 33 17 154 34 28 3 66 15 747 577 21.
8 47.0 5.7 3.0
26.7 5.9 4.9
0.5
11.4
2.6
129.5 100
Diploma/ Certificate
3 11 1 1 3 1 0 0 1 0 21 17 17.
7 64.7 5.9 5.9
17.7 5.9 0.0
0.0 5.9
0.0
123.5 100
UG 51 144 23 4 84 13 13 8 24 2 366 275 18.
6 52.4 8.4 1.5
30.6 4.7 4.7
2.9 8.7
0.7
133.1 100
PG 5 32 3 1 18 2 2 0 3 1 67 54
9.3 59.3 5.6 1.9
33.3 3.7 3.7
0.0 5.6
1.9
124.1 100
Others 5 16 0 1 6 2 2 0 5 0 37 34
14.7 47.1 0.0
2.9
17.7 5.9 5.9
0.0
14.7
0.0
108.8 100
Total 587 134
4 150 53 703 19
9 174 31 314 77 3632 284
4 20.
6 47.3 5.3 1.9
24.7 7.0 6.1
1.1
11.0
2.7
127.7 100
* The table gives information form an item that elicited multiple responses. Hence the total number of response is more than number of students who were interviewed
The tables 4.34A and 4.34B gives distribution students by reasons they have given for choosing stream in 11th and 12th class across mothers’ educational level and fathers’ educational level respectively. No sharp pattern is emerging between parents’ education and reasons for choosing stream. Children of parents with PG or diploma/certificate qualifications show a sharp distinction with a majority of them opting for stream on the basis of children’s their own interest and their choice least determined by 10th standard examination in this category. Likewise one also notes the proportion of students who said their choice was shaped by consideration of future prospects was highest among those whose mothers had educational qualification of Diploma / certificate followed by PG. There is decrease in proportion of students whose choice were influenced by 10th marks as one moves from parents’ qualification of “Not attended school” to PG and a reverse trend in the parameter of ‘students own interest’.

Draft Report 10 Nov 2016
62
Table 4.35A. Distribution of students by type of schools across Mother’s educational qualification
Mother’s education
GBSSS GGSSS GSSSS PVV SBV SKV SSSS Total
Not attended school
356 239 41 14 128 163 72 1013
35.1 23.6 4.1 1.4 12.6 16.1 7.1 100 Up to Primary
123 112 21 5 46 73 34 414
29.7 27.1 5.1 1.2 11.1 17.6 8.2 100 Up to Elementary
140 92 19 5 57 113 32 458
30.6 20.1 4.2 1.1 12.5 24.7 7.0 100
Up to 10th 129 107 21 18 69 147 45 536
24.1 20.0 3.9 3.4 12.9 27.4 8.4 100
Up to 12th 70 40 10 10 63 97 35 325
21.5 12.3 3.1 3.1 19.4 29.9 10.8 100 Diploma/ Certificate
1 1 1 3 1 7
14.3 14.3 14.3 0.0 0.0 42.9 14.3 100
UG 31 22 4 23 49 5 134
23.1 16.4 0.0 3.0 17.2 36.6 3.7 100
PG 5 1 1 9 16
31.3 6.3 0.0 6.3 0.0 56.3 0.0 100
Others 14 6 1 1 1 1 24
58.3 25.0 0.0 4.2 4.2 4.2 4.2 100
Total 869 620 113 58 387 655 225 2927
29.7 21.2 3.9 2.0 13.2 22.4 7.7 100

Draft Report 10 Nov 2016
63
Table 4.35B Distribution of students by type of schools across father’s educational qualification
Father’s education GBSSS GGSSS GSSSS PVV SBV SKV SSSS Total
Not attended school 114 82 15 3 46 60 10 330 34.6 24.9 4.6 0.9 13.9 18.2 3.0 100
Up to Primary 103 72 11 3 37 45 27 298 34.6 24.2 3.7 1.0 12.4 15.1 9.1 100
Up to Elementary 154 89 23 4 46 102 28 446 34.5 20.0 5.2 0.9 10.3 22.9 6.3 100
Up to 10th 238 185 27 16 110 164 73 813 29.3 22.8 3.3 2.0 13.5 20.2 9.0 100
Up to 12th 146 101 26 23 72 154 55 577 25.3 17.5 4.5 4.0 12.5 26.7 9.5 100
Diploma/Certificate 5 2 1 6 3 17 29.4 11.8 5.9 0.0 0.0 35.3 17.7 100
UG 75 49 4 6 46 73 22 275 27.3 17.8 1.5 2.2 16.7 26.6 8.0 100
PG 9 11 2 14 16 2 54 16.7 20.4 0.0 3.7 25.9 29.6 3.7 100
Others 13 6 4 10 1 34 38.2 17.7 0.0 0.0 11.8 29.4 2.9 100
Total 857 597 107 57 375 630 221 2844 30.1 21.0 3.8 2.0 13.2 22.2 7.8 100
In the above two tables (4.35A. and 4.35B), one notes roughly a pattern of children of
parents’ with relatively higher level of education are able to get enrolled in to relatively
better government schools like PVV, SBV and SKV proportionately large numbers and in
GGSSS, GBSSS, GSSSS schools children of parents’ with lower level of education is
represented proportionately higher. This relationship with type of school is more consistent
across level of father’s education than across the level mother’s education.

Draft Report 10 Nov 2016
64

Draft Report 10 Nov 2016
65
Table 36A. Table Distribution of students by Medium of instructions across mother’s educational qualification
Mother’s education English Hin+Eng Hindi Urdu Total
Not attended school 62 141 803 7 1013
6.1 13.9 79.3 0.7 100
Up to Primary 26 59 320 7 412
6.3 14.3 77.7 1.7 100
Up to Elementary 51 76 323 6 456
11.2 16.7 70.8 1.3 100
Up to 10th 90 99 339 6 534
16.9 18.5 63.5 1.1 100
Up to 12th 84 66 170 5 325
25.9 20.3 52.3 1.5 100
Diploma/ Certificate 1 2 4 7
14.3 28.6 57.1 0.0 100
UG 58 20 56 134
43.3 14.9 41.8 0.0 100
PG 9 2 5 16
56.3 12.5 31.3 0.0 100
Others 6 4 14 24
25 16.7 58.3 0.0 100
Total 387 469 2034 31 2921
13.3 16.1 69.6 1.1 100
Table 4.36B Distribution of students by Medium of instructions across father’s educational qualification

Draft Report 10 Nov 2016
66
Father’s education English Hin+Eng Hindi Urdu Total Not attended school 23 43 257 7 330
7.0 13.0 77.9 2.1 100 Up to Primary 14 39 238 6 297
4.7 13.1 80.1 2.0 100 Up to Elementary 35 56 345 7 443
7.9 12.6 77.9 1.6 100 Up to 10th 92 128 588 5 813
11.3 15.7 72.3 0.6 100 Up to 12th 106 126 341 3 576
18.4 21.9 59.2 0.5 100 Diploma/Certificate 6 3 8 17
35.3 17.7 47.1 0.0 100 UG 69 48 156 273
25.3 17.6 57.1 0.0 100 PG 22 7 24 1 54
40.7 13.0 44.4 1.9 100 Others 6 7 21 34
17.7 20.6 61.8 0.0 100 Total 373 457 1978 29 2837
From table (4.36A. and 4.36B.), across both mother’s and father’s education, as the level of
education increases the proportion of their children studying with English as medium of
instructions increases and those with Hindi as medium of instruction decreases and vice
versa.
Table 4.37A. Mother Education qualification Vs difficulties in class 11th & 12th
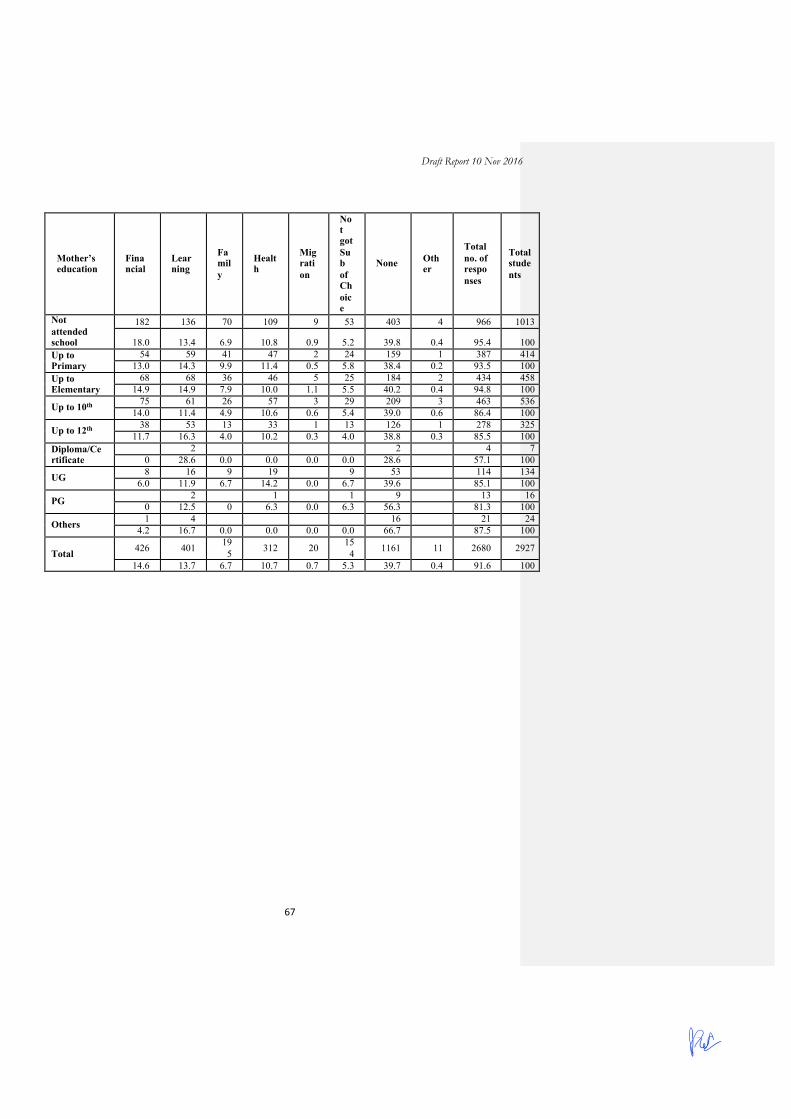
Draft Report 10 Nov 2016
67
Mother’s education
Financial
Learning
Family
Health
Migration
Not got Sub of Choice
None Other
Total no. of responses
Total students
Not attended school
182 136 70 109 9 53 403 4 966 1013
18.0 13.4 6.9 10.8 0.9 5.2 39.8 0.4 95.4 100 Up to Primary
54 59 41 47 2 24 159 1 387 414 13.0 14.3 9.9 11.4 0.5 5.8 38.4 0.2 93.5 100
Up to Elementary
68 68 36 46 5 25 184 2 434 458 14.9 14.9 7.9 10.0 1.1 5.5 40.2 0.4 94.8 100
Up to 10th 75 61 26 57 3 29 209 3 463 536 14.0 11.4 4.9 10.6 0.6 5.4 39.0 0.6 86.4 100
Up to 12th 38 53 13 33 1 13 126 1 278 325 11.7 16.3 4.0 10.2 0.3 4.0 38.8 0.3 85.5 100
Diploma/Certificate
2 2 4 7 0 28.6 0.0 0.0 0.0 0.0 28.6 57.1 100
UG 8 16 9 19 9 53 114 134 6.0 11.9 6.7 14.2 0.0 6.7 39.6 85.1 100
PG 2 1 1 9 13 16 0 12.5 0 6.3 0.0 6.3 56.3 81.3 100
Others 1 4 16 21 24 4.2 16.7 0.0 0.0 0.0 0.0 66.7 87.5 100
Total 426 401 195 312 20 15
4 1161 11 2680 2927
14.6 13.7 6.7 10.7 0.7 5.3 39.7 0.4 91.6 100

Draft Report 10 Nov 2016
68
Table 4.37B. Father educational qualification Vs difficulties at class 11th & 12th
Father’s education
Financial
Learning
Family
Health
Migration
Not got Sub of Choice
None
Other
No. of responses
Total students
Not attended school 63 44 28 45 4 27 127 338 330
19.1 13.3 8.5 13.6 1.2 8.2 38.5 0.0 102.4 100
Up to Primary 54 33 25 30 12 122 276 298
18.1 11.1 8.4 10.1 0.0 4.0 40.9 92.6 100
Up to Elementary 67 69 33 52 4 21 182 3 431 446
15.0 15.5 7.4 11.7 0.9 4.7 40.8 0.7 96.6 100
Up to 10th 137 105 52 85 6 39 332 3 759 813
16.9 12.9 6.4 10.5 0.7 4.8 40.8 0.4 93.4 100
Up to 12th 59 80 29 51 2 33 220 3 477 577
10.2 13.9 5.0 8.8 0.4 5.7 38.1 0.5 82.7 100
Diploma/Certificate 2 5 1 3 1 1 4 1 18 17
11.8 29.4 5.9 17.7 5.9 5.9 23.5 5.9 105.9 100
UG 25 38 12 30 1 17 103 1 227 275 9.1 13.8 4.4 10.9 0.4 6.2 37.5 0.4 82.6 100
PG 2 5 2 8 1 1 22 41 54
3.7 9.3 3.7 14.8 1.9 1.9 40.7 75.9 100
Others 4 2 2 1 1 17 27 34
11.8 5.9 5.9 2.9 0.0 2.9 50.0 79.4 100
Total 413 381 184 305 19 152 1129 11 2594 2844
14.5 13.4 6.5 10.7 0.7 5.3 39.7 0.4 91.2 100
According to table (4.37A and 4.37B), across mother’s educational qualification, more
than 12% students whose mothers have education till school level are facing financial
difficulty currently and this proportion is highest among the students whose mothers have
not attended schools (18%). Similarly, across father’s educational qualification, only about
10% of students whose fathers have education till diploma/certificate face financial
difficulty currently and this proportion is highest among the students whose fathers have
not attended schools and studied up to Primary level (19% & 18% respectively).
Learning as a difficulty at senior secondary classes is highest among students with parents
studied till diploma or certificate level (28%)

Draft Report 10 Nov 2016
69
Close to 40% students have said they don’t face problem during the senior secondary
classes and this proportion is highest among the students with mother’s qualification till
PG (56%) and father’s (50%) qualification till PG.
Table 4.38 Distribution of students preparing for competitive examinations across level of parents education qualification
Level of education qualification Mother Father
Not attended school 73 19 7.3 5.9
Up to Primary 34 22 8.3 7.5
Up to Elementary 39 34 8.5 7.7
Up to 10th 60 79 11.3 9.9
Up to 12th 49 62 15.5 11.0
Diploma/ Certificate 4 0 23.5
UG 33 47 24.8 17.4
PG 3 16 18.8 29.6
Others 1 1 4.2 2.9
Total 292 284 10.1 10.2
The above table (4.38) shows that as parents educational qualification increases the
proportion of students preparing for competitive exams increases.

Draft Report 10 Nov 2016
70
Table 4.39A. Mother Education qualification vs. Plan after 12th
Mother‘s education At Home
Break
Don't Know/Thinking
Family Business
Marriage
Others
Paid Work
Study Further
Total
Not attended school 3 4 18 3 3 24 53 899 1007 0.3 0.4 1.8 0.3 0.3 2.4 5.3 89.3 100
Up to Primary 1 6 3 10 19 371 410 0.2 0.0 1.5 0.7 0.0 2.4 4.6 90.5 100
Up to Elementary 3 11 5 23 416 458 0 0.7 2.4 0.0 0.0 1.1 5.0 90.8 100
Up to 10th 2 4 3 15 505 529 0 0.4 0.8 0.0 0.0 0.6 2.8 95.5 100
Up to 12th 1 8 1 8 7 298 323 0 0.3 2.5 0.3 0.0 2.5 2.2 92.3 100
Diploma/ Certificate 1 6 7 0 0 0 0 0 0 14.3 85.7 100
UG 1 1 2 5 125 134 0 0.8 0.8 0.0 0.0 1.5 3.7 93.3 100
PG 16 16 0 0 0 0 0 0 0 100 100
Others 3 21 24 0 0 0 0 0 0 12.5 87.5 100
Total 4 11 48 7 3 52 126 2657 2908 0.14 0.38 1.65 0.24 0.10 1.79 4.33 91.37 100.00

Draft Report 10 Nov 2016
71
Table 4.39B Father Education qualification vs. Plan after 12th
Father’s education
At Home
Break
Don't Know/Thinking
Family Business
Marriage
Others
Paid Work
Study Further
Total
Not attended school
2 2 4 2 8 19 288 325 0.6 0.6 1.2 0.0 0.6 2.5 5.9 88.6 100
Up to Primary 0 0 6 1 0 6 22 261 296 0 0 2.0 0.3 0.0 2.0 7.4 88.2 100
Up to Elementary 1 1 11 1 11 19 401 445 0.2 0.2 2.5 0.2 0.0 2.5 4.3 90.1 100
Up to 10th 1 4 11 1 1 12 38 742 810 0.1 0.5 1.4 0.1 0.1 1.5 4.7 91.6 100
Up to 12th 0 1 11 2 0 7 15 536 572 0 0.2 1.9 0.4 0.0 1.2 2.6 93.7 100
Diploma/ Certificate
0 0 0 0 0 0 0 17 17 0 0 0 0 0 0 0 100 100
UG 0 1 1 2 0 5 18 247 274 0 0.4 0.4 0.7 0.0 1.8 6.6 90.2 100
PG 0 0 1 0 0 1 1 50 53 0 0 1.9 0.0 0.0 1.9 1.9 94.3 100
Others 0 0 2 0 0 3 2 27 34 0 0 5.9 0.0 0.0 8.8 5.9 79.4 100
Total 4 9 47 7 3 53 134 2569 2826 0.1 0.3 1.7 0.3 0.1 1.9 4.7 90.9 100
Above tables (4.39A and 4.39B) represents more than 90% of students want to study further
after 12th class. Hence the table does not provide much scope for inferring across parent’s
educational qualification.
About 4-5% of students want to take up paid employment; this proportion is more among
those children whose parents’ educational qualification low, except for an anomaly among
those whose parents have qualification till UG.

Draft Report 10 Nov 2016
72
Table 4.40A. Mother education Vs reason for future aspiration
Mother’s education Parent Self
Teachers
Peers
Finance
Easy
Employability
Other
No. of responses
Total students
Not attended school 60 757 23 11 26 77 121 24 1099 1013 5.9 74.7 2.3 1.1 2.6 7.6 11.9 2.4 108.5 100
Up to Primary 29 316 5 6 9 30 49 10 454 414 7 76.3 1.2 1.5 2.2 7.3 11.8 2.4 109.7 100
Up to Elementary 32 353 11 9 19 29 59 15 527 458 7.0 77.1 2.4 2.0 4.2 6.3 12.9 3.3 115.1 100
Up to 10th 44 428 8 10 9 37 58 13 607 536 8.2 79.9 1.5 1.9 1.7 6.9 10.8 2.4 113.3 100
Up to 12th 35 252 8 6 4 26 30 6 367 325 10.8 77.5 2.5 1.9 1.2 8.0 9.2 1.9 112.9 100
Diploma/Certificate 2 5 7 7 28.6 71.4 0.0 0.0 0.0 0.0 0.0 0.0 100.0 100
UG 6 111 2 3 2 8 17 3 152 134 4.5 82.8 1.5 2.2 1.5 6.0 12.7 2.2 113.4 100
PG 16 16 16 0 100 0 0 0 0 0 0 100 100
Others 3 15 2 3 1 24 24 12.5 62.5 8.3 0.0 0.0 12.5 0.0 4.2 100.0 100
Total 211 2253 59 45 69 210 334 72 3253 2927 7.2 77.0 2.0 1.5 2.4 7.2 11.4 2.5 111.1 100

Draft Report 10 Nov 2016
73
Table 4.40B. Distribution of students by reason for their decision on future plans across father’s educational qualification
Father’s education
Parents Self
Teachers
Peers
Finance
Easy
Employability
Others
Total responses
Total students
Not attended school
13 249 8 3 5 29 37 11 355 330
3.9 75.5 2.4 0.9 1.5 8.8 11.2 3.3 107.6 100 Up to Primary
24 228 9 4 9 20 23 4 321 298 8.1 76.5 3.0 1.3 3.0 6.7 7.7 1.3 107.7 100
Up to Elementary
33 340 6 5 12 29 56 14 495 446
7.4 76.2 1.4 1.1 2.7 6.5 12.6 3.1 111.0 100
Up to 10th 53 620 12 10 15 68 104 24 906 813 6.5 76.3 1.5 1.2 1.9 8.4 12.8 3.0 111.4 100
Up to 12th 50 449 16 19 13 39 66 10 662 577 8.7 77.8 2.8 3.3 2.3 6.8 11.4 1.7 114.7 100
Diploma/ Certificate
2 13 0 1 0 1 2 0 19 17 11.8 76.5 0.0 5.9 0.0 5.9 11.8 0.0 111.8 100
UG 20 219 3 3 8 15 28 5 301 275 7.3 79.6 1.1 1.1 2.9 5.5 10.2 1.8 109.5 100
PG 4 45 0 1 0 3 4 2 59 54
7.4 83.3 0.0 1.9 0.0 5.6 7.4 3.7 109.3 100
Others 1 26 0 0 0 4 2 1 34 34
2.9 76.5 0.0 0.0 0.0 11.8 5.9 2.9 100.0 100
Total 200 2189 54 46 62 208 322 71 3152 2844 7.0 77.0 1.9 1.6 2.2 7.3 11.3 2.5 110.8 100
Above tables (4.40A and 4.40B) shows, the proportion of students who said they will
decide about their plan after 12th standard on the basis employability and financial reasons
are more among those whose parents’ educational levels are low and this proportion is
more among those children whose parents have relatively higher level of education. This
patter however gets broken among children whose mothers or fathers have educational
qualification till UG (13% & 10% respectively).
One also observes that the proportion of children who said their choice will be as per the
advice given by their teachers too is higher among those whose parents’ have lower levels
of education; however numbers are small in this attribute.

Draft Report 10 Nov 2016
74
Table 4.41A. Mother’s Education qualification vs. Mode of learning
Mother’s education Distance Regular(D) Regular(E) Total
Not attended school 334 617 21 972 34.4 63.5 2.2 100
Up to Primary 143 242 9 394 36.3 61.4 2.3 100
Up to Elementary 139 289 15 443 31.4 65.2 3.4 100
Up to 10th 141 365 13 519 27.2 70.3 2.5 100
Up to 12th 71 231 11 313 22.7 73.8 3.5 100
Diploma/ Certificate 1 5 6 16.7 83.3 0.0 100
UG 23 104 3 130 17.7 80.0 2.3 100
PG 6 10 16 37.5 62.5 0 100
Others 9 12 1 22 40.9 54.6 4.6 100
Total 867 1875 73 2815 30.8 66.6 2.6 100

Draft Report 10 Nov 2016
75
Table 4.41B. Father’s Education qualification vs. Mode of learning
Father’s education Distance Regular(D) Regular(E) Total
Not attended school 124 177 12 313 39.6 56.6 3.8 100
Up to Primary 97 185 3 285 34.0 64.9 1.1 100
Up to Elementary 140 270 18 428 32.7 63.1 4.2 100
Up to 10th 256 510 12 778 32.9 65.6 1.5 100
Up to 12th 146 395 12 553 26.4 71.4 2.2 100
Diploma/Certificate 7 9 16 43.8 56.3 0.0 100
UG 50 204 13 267 18.7 76.4 4.9 100
PG 6 46 52 11.5 88.5 0.0 100
Others 8 22 2 32 25 68.8 6.3 100
Total 834 1818 72 2724 30.6 66.7 2.6 100
From above tables (4.41A and 4,41B), most of the students prefer to study through regular
mode. Within the set of students who had suggested that they would prefer to continue with
distance mode of education, the proportion is more among children whose parents have
lower levels of educational qualification and is least among those whose fathers have post-
graduate or graduate level of education. This proportion was found surprisingly high
among children with mother having education till PG.
Numbers being small for mothers having higher level of education, as a variable level of
mother’s education is less responsive than level of father’s education on a number of
factors.

Draft Report 10 Nov 2016
76
Table 4.42A. Mother’s Education Vs highest qualification before job
Mother’s education
12th Certificate Diploma UG PG Research Others Total
Not attended school 49 23 66 505 222 40 60 965 5.1 2.4 6.8 52.3 23.0 4.2 6.2 100
Up to Primary 17 9 19 220 89 17 29 400 4.3 2.3 4.8 55.0 22.3 4.3 7.3 100
Up to Elementary 16 10 25 227 115 27 22 442 3.6 2.3 5.7 51.4 26.0 6.1 5.0 100
Up to 10th 19 12 32 273 117 38 35 526 3.6 2.3 6.1 51.9 22.2 7.2 6.7 100
Up to 12th 7 8 24 129 99 26 22 315 2.2 2.5 7.6 41.0 31.4 8.3 7.0 100
Diploma/ Certificate
2 2 3 7 0 28.6 0.0 28.6 42.9 0.0 0.0 100
UG 3 4 55 46 12 12 132 2.3 0.0 3.0 41.7 34.9 9.1 9.1 100
PG 1 3 8 2 2 16 0 0 6.3 18.8 50.0 12.5 12.5 100
Others 1 3 10 5 1 2 22 4.6 0.0 13.6 45.5 22.7 4.6 9.1 100
Total 112 64 174 1424 704 163 184 2825 4.0 2.3 6.2 50.4 24.9 5.8 6.5 100

Draft Report 10 Nov 2016
77
Table 4.42B Father’s Education Vs highest qualification before job
Father’s education 12th Certificate Diploma UG PG Research Others Total
Not attended school 15 5 22 179 58 8 28 315 4.8 1.6 7.0 56.8 18.4 2.5 8.9 100
Up to Primary 15 6 16 145 76 12 19 289 5.2 2.1 5.5 50.2 26.3 4.2 6.6 100
Up to Elementary 22 11 28 229 96 18 22 426 5.2 2.6 6.6 53.8 22.5 4.2 5.2 100
Up to 10th
33 20 44 411 184 50 42 784 4.2 2.6 5.6 52.4 23.5 6.4 5.4 100
Up to 12th 19 13 38 258 157 37 38 560 3.4 2.3 6.8 46.1 28.0 6.6 6.8 100
Diploma/Certificate 0 3 1 7 3 1 2 17 0 17.7 5.9 41.2 17.7 5.9 11.8 100
UG 9 2 10 116 84 23 21 265 3.4 0.8 3.8 43.8 31.7 8.7 7.9 100
PG 1 1 2 12 24 8 5 53 1.9 1.9 3.8 22.6 45.3 15.1 9.4 100
Others 1 2 16 8 1 3 31 3.2 0.0 6.5 51.6 25.8 3.2 9.7 100
Total 115 61 163 1373 690 158 180 2740 4.2 2.2 6.0 50.1 25.2 5.8 6.6 100
According to above tables (4.42A and 4.42B), as expected, one notes that the highest
educational qualification that students aspire to have before taking up a job is higher
among children of parents whose educational qualifications are higher and vice versa. For
instance about 45% and 50% of children whose fathers’ and mothers’ education are up to
PG, respectively, aspire to get educated till PG. This proportion is low among children
whose fathers have not attended school and those with diploma or certificate level
education. It is interesting to see that 43% of students whose mother’s education
qualification is up to diploma/certificate also aspire for education till the PG, second
highest in this category.

Draft Report 10 Nov 2016
78
Table 4.43A. Mother education qualification Vs future Vocation/Profession
Mother’s education
Business
Govt Job
Professional
Pvt. Job
Self Employed
Not to take up employment
Other
Total
Not attended school 66 575 187 71 59 2 30 990 6.7 58.1 18.9 7.2 6.0 0.2 3.0 100
Up to Primary 27 236 63 36 27 19 408 6.6 57.8 15.4 8.8 6.6 0.0 4.7 100
Up to Elementary 25 300 79 22 18 10 454 5.5 66.1 17.4 4.9 4.0 0.0 2.2 100
Up to 10th 27 334 85 39 25 1 11 522 5.2 64.0 16.3 7.5 4.8 0.2 2.1 100
Up to 12th 19 189 65 29 10 1 6 319 6.0 59.3 20.4 9.1 3.1 0.3 1.9 100
Diploma/Certificate 4 2 1 7 0 57.1 28.6 14.3 0.0 0.0 0.0 100
UG 9 71 22 15 7 10 134 6.7 53.0 16.4 11.2 5.2 0.0 7.5 100
PG 3 6 6 1 16 18.8 37.5 37.5 0.0 0.0 0.0 6.3 100
Others 2 15 1 3 2 1 24 8.3 62.5 4.2 12.5 8.3 0.0 4.2 100
Total 178 1730 510 216 148 4 88 2874 6.2 60.2 17.8 7.5 5.2 0.1 3.1 100

Draft Report 10 Nov 2016
79
Table 4.43B. Distribution of students by vocation/profession they want to pursue in future across father’s educational qualification
Father’s education Business
Govt Job
Professional
Pvt. Job
Self Employed
Not to take up employment
Other
Total
Not attended school 20 188 67 22 15 1 10 323 6.2 58.2 20.7 6.8 4.6 0.3 3.1 100
Up to Primary 20 169 51 20 17 16 293 6.8 57.7 17.4 6.8 5.8 0.0 5.5 100
Up to Elementary 33 267 60 32 33 1 10 436 7.6 61.2 13.8 7.3 7.6 0.2 2.3 100
Up to 10th 40 502 140 54 42 1 19 798 5.0 62.9 17.5 6.8 5.3 0.1 2.4 100
Up to 12th 34 346 104 42 22 2 16 566 6.0 61.1 18.4 7.4 3.9 0.4 2.8 100
Diploma/ Certificate 2 10 2 2 16 12.5 62.5 12.5 12.5 0.0 0.0 0.0 100
UG 23 160 52 15 14 7 271 8.5 59.0 19.2 5.5 5.2 0.0 2.6 100
PG 1 34 9 4 2 3 53 1.9 64.2 17.0 7.6 3.8 0.0 5.7 100
Others 2 19 5 4 2 2 34 5.9 55.9 14.7 11.8 5.9 0.0 5.9 100
Total 175 1695 490 195 147 5 83 2790 6.3 60.8 17.6 7.0 5.3 0.2 3.0 100
Above tables (4.43A and 4.43B), there is no major difference in terms of aspirations of
students in terms of the kind of employment they want to enter across the level of parent’s
educational qualification. A large proportion of students want to enter into government job
after completion of their studies and this is more or less uniform across different level of
parent’s education – in the case of both mother and father - except students whose mother’s
qualification is up to PG, in which case the proportion is relatively low (38%). Students
those who want to become professional are highest among students whose mothers have
education qualification up to PG level (38%).

Draft Report 10 Nov 2016
80
Summary
This chapter captures profile of students from sampled schools. Starting with a general
profile given as a set of frequency tables the chapter further goes on to discuss the
distribution of students in terms of streams chosen, reason for choosing respective streams,
medium of instruction, desired mode of learning, highest educational level aspired before
taking up employment, difficulties faced in senior secondary class, proportion of students
preparing for competitive exams, students’ plan after completing 12th standard, vocation the
aspire for and factors that shape these decisions. Distributions students on aspects are
discussed across variables like type of school, gender, stream chosen in senior secondary
level, parents’ level of education. In addition there is also a short discussion on distribution
of students in terms of subjects they liked and those they find the most difficult in different
streams.

Draft Report 10 Nov 2016
81
CHAPTER V SCOPE FOR ENTRY-LEVEL TERTIARY EDUCATION IN
NCT AREA
Scope for Entry-level tertiary education in Universities in Delhi
There are 29 government run /funded Universities in and around Delhi catering to students
in Delhi NCR. These are inclusive of Central, State and Deemed Universities. Many of these
universities are specialised ones providing education in specific area like
Technology/Engineering, Medicine, Law, Languages, Social sciences and Humanities /
Arts. Some are general ones offering programs not necessarily restricted to an area.
In terms of intake, Delhi University is the largest with 67 affiliated colleges having a total
intake capacity of 54000 at the under graduate level. Guru Govind Singh Indarpratha
University offers 4360 seats in different under graduation programme and Jamia Millia
Islamia University provides about 2435 UG seats. Delhi Technical University provides 1979
seats at the UG level. The following table gives a list of universities in Delhi and intake
capacities therein. Of these, 12 universities do not have entry at the level of under-
graduation. All together there are over 65307 seats available at the level of under-graduation
across all specialisation in these universities.
[UG level seats in JNU, Jamia Hamdard and IGNOU have not been added to this list. JNU
offers undergraduate programs in languages and Jamia Hamdard offers 2 under graduation
programme. IGNOU offers 6 under graduation programme, 19 diploma and 47 certificate
courses]
Having described about the available seats in these universities, it is however important
underline the point that there is a large influx of students from outside Delhi seeking
admission at under-graduate level in colleges of Delhi and perhaps a relatively smaller
proportion of students from Delhi moving out to seek admissions in colleges outside Delhi.
Commented [N37]: Shouldwegointothisaspect?

Draft Report 10 Nov 2016
82
Table 5.1 List of universities in Delhi
S.No University Specialization Seats 1 Indian Agricultural Research Institute Agriculture N.A 2 TERI University Applied sciences N.A 3 NUEPA Education admin N.A 4 National Institute of Fashion
Technology1 Fashion technology 210
5 Indian Institute of Foreign Trade Foreign trade N.A 6 Guru Gobind Singh Indraprastha
University2 General 4360
7 Jamia Hamdard General Capacity not mentioned
8 Jamia Millia Islamia3 General 2435 9 Jawaharlal Nehru University General Capacity not
mentioned 10 South Asian University General N.A 11 University of Delhi4 General 54000 12 Indira Gandhi National Open University General Capacity not
mentioned 13 Indian Institute of Mass Communication Journalism N.A 14 Rashtriya Sanskrit Sansthan Language N.A 15 Shri Lal Bahadur Shastri Rashtriya
Sanskrit Vidyapeetha5 Language 185
16 Indian Law Institute Legal N.A 17 National Law University, Delhi Legal 81 18 Indian Statistical Institute6 Mathematics &
statistics N.A
19 All India Institute of Medical Sciences7* Medicine 72 20 Institute of Liver and Biliary Sciences Medicine N.A 21 National School of Drama Performing Arts N.A 22 Bharat Ratna Dr. B. R. Ambedkar
University8 Arts 245
23 National Museum Institute of History of Art, Conservation and Musicology
Arts N.A
24 Delhi Technological University9 Technology 1979
25 IGDTU10 Technology 407 26 Indian Institute of Technology, Delhi 11 Technology 851 27 National Institute of Technology,
Delhi12 Technology 90
1ihttp://www.nift.ac.in/Downloads/admission_prospectus2016_21dec.pdf2http://entrance.icbse.com/ipucet/seats3 http://jmi.ac.in/upload/admission/prospectus2016.pdf 4http://indianexpress.com/article/cities/delhi/54000-seats-70-colleges-race-for-du-starts-today/5http://www.slbsrsv.ac.in/documents/Prospectus16-17.pdf6http://www.nludelhi.ac.in/adm-ba.aspx 7 https://www.aiimsexams.org/pdf/Prospectus%20MBBS2016%20actual%20prospectus_opt.pdf
8 http://aud.ac.in/ 9 http://jacdelhi.nic.in/publicinfo/Handler/FileHandler.ashx?i=File&ii=11&iii=Y 10 http://jacdelhi.nic.in/publicinfo/Handler/FileHandler.ashx?i=File&ii=11&iii=Y
11 http://www.thehindu.com/news/cities/Hyderabad/9885-seats-available-in-17-iits-results-on-june-23/article4834329.ece

Draft Report 10 Nov 2016
83
28 School of Planning and Architecture13 Technology 141 29 Indraprastha Institute of Information
Technology14 Technology (IT) 251
Total 65307
Private universities in Delhi
There are three private universities located in and around Delhi catering to students in NCT
area. These include Shiv Nadar University, Ashoka University and Apeejay Stya Univesity
and Amity University. All of them offer undergraduate level programs.
Shiv Nadar University offers undergraduate programs in engineering, science, management
and humanities &social sciences with a total intake of 257 in the recent academic year.
Ashoka University offers 16 undergraduate programmes in social sciences, humanities and
computers. Apeejay Stya University offers undergraduate courses in engineering,
journalism, design, bio-sciences, pharmaceutical, legal studies and education. Amity
University has two campuses in around Delhi and offers a range on UG courses.
However entry into these programs is prohibitively expensive keeping in mind students
coming out from government schools in Delhi.
Scope for diploma and certificate programs in Delhi
Enrolling in to diploma or certificate programs in ITIs, polytechnics and teacher education
institutes has been an equally important alternative to undergraduate college education.
Delhi NCT area offers a number of such opportunities for students passing out from schools
after 12th standard as well as after 10th class.
Diploma programs are offered by polytechnics and DIET institutes. Certificate courses are
made available through ITI, and other institutes offering courses in languages etc.
Polytechnics are approved by AICTE and ITIs are approved by NCVT and SCVT. Diploma
12http://indiacollegefinder.org/courses/engineering/AIEEE/nits_seats.php13http://spa.ac.in/writereaddata/InformationBrochure.pdf14http://jacdelhi.nic.in/publicinfo/Handler/FileHandler.ashx?i=File&ii=11&iii=Y

Draft Report 10 Nov 2016
84
and certificate courses offer by ‘Jamia Millia Islamia University’ approved by UGC and
AICTE.
ITIs offer maximum number of seats amounting to 9242, which can be pursued after 8th, 10th
or 12th class. Polytechnics in Delhi offers 5413 seat for students after 10th, 12th class or after
completing a course from ITI. In addition there are 9 Government DIET institutes, 23 self
financed D.EL.Ed institute and 28 ECCE self financed institute providing about 4150 seats
for student after 12th class. There are about 910 seats in recognised nursing courses (GNM &
ANM) in government, municipal, defence, missionary, trust and private institutes in Delhi.
The following table gives a summary of seats available under various diploma and
certificate programs.
Apart from these recognised courses, a number of unrecognised courses are available for
students completing 10th or 12th in technical, para-medical, computers and fashion courses,
which is not taken up for discussion here.
Table 5.2 Distribution of seats in various Certificate and Diploma courses in Delhi
S. No
Diploma/ Certificate Seats
1. Polytechnic 5413 2. Polytechnic after ITI 400 3. Govt. DIETs for D. El. Ed. Course 1040 4. Self Financed Institutes for D. El. Ed. Course 1400 5. Self Financed Institutes for ECCE course 1710 6. ITI (Govt.) 9242 7. Jamia Millia Islamia Diploma Programme15 1080 8. Jamia Millia Islamia Certificate programme 605 9 GNM & ANM training (Govt.)16 220 10 GNM & ANM training (Pvt) 690 Total 21800
Taking together undergraduate college, diploma and certificate programs there are about
over 87000 seats available in institutes in Delhi. This comes to a mere 32% of required
seats when we consider that about 2.7 lakh students were registered in 12th standard in the
15http://jmi.ac.in/upload/admission/prospectus2016.pdf 16http://www.delhinursingcouncil.com/recognized-nursing-school.asp

Draft Report 10 Nov 2016
85
year 201517 and this proportion does not take in to consideration the fact that a good
proportion of seats in reputed universities are taken up students from outside Delhi.
17http://indianexpress.com/article/education/cbse-class-10th-and-12th-exams-starts-today-over-25-lakh-students-to-appear/

Draft Report 10 Nov 2016
86
CHAPTER VI
SUMMARY
Introduction
The study involved collection of data from a total of 103 Govt. DOE senior secondary
schools. From these schools, 3026 students were interviewed in the survey. In addition to
the survey, In-depth interviews and focus group discussions were conducted with students,
teachers and parents from 5 schools selected purposively.
School profile
Govt. DOE Senior Sec. Schools can be classified along two key dimensions viz., schools by
type of administration and gender composition of students. The following table captures
these two dimensions of classifications.
Type of administration \ Gender composition Girls Only Boys only Co-ed Govt SSS GGSSS GBSSS GSSS Sarvodaya SKV* SBV SSSS PVV -- -- PVV
A number of other dimensions of classification like shift, levels a school has etc., get
aligned along these two dimensions. Even quality in terms of infrastructure, teacher’s
availability etc to an extent gets aligned along these two dimensions.
The survey and the qualitative component of the study revealed that there is difference in
terms of quality, infrastructure and availability of teachers across the three types of DoE
government schools. There are only 17 RPVV schools. These schools are treated with
greater privilege and support across most of the attributes. They are located in locations with
better connectivity and facilities. These schools have limited seats in each class, i.e. 35, and
admissions in these schools are on the basis of written exam without any restrictions based
on the condition of vicinity. All RPVV schools have science streams, no vocational streams;
they have better teacher-pupil ratio. They usually have better qualified teachers and with all
posts including PG qualified positions filled. Students from RPVV participate in various
competitive exams and win more scholarships in greater proportions.

Draft Report 10 Nov 2016
87
Sarvodaya family of schools, i.e. SKV, SBV and SSS, usually has from nursery to 12th class
and often with science streams. In these schools, English is often introduced from nursery
class. On other hand Government senior secondary schools (GGSSS, GBSSS and GSSSS)
have usually from VI std. onwards. Availability of English medium is less frequent that in
previous two types of schools and relatively fewer schools have science streams. These
schools have direct admission with no limitation in number of seats or sections in each class.
Teachers’ vacancies are reportedly more in these schools compared to RPVV schools. For
instance in one of the sampled school it was noted that out of 18 teachers only 4-5 were on
regular basis and there were no regular PG teacher.
The composition and number of streams made available have a relationship with the type of
school by administration and whether a school is boys-only, girls-only or co-ed schools.
Science streams are available in all RPVV (2/2) and the proportion is low in GGSSS (2/21)
and GSSSS (0/4). Only 9 out of 42 girls-only schools as against 32 out of 45 boys-only
schools and 10 out of 16 co-ed schools have science streams. Availability of vocational
stream is high among girls-only schools i.e. 15 out of 42 Girls-only schools, compared to 8
out of 45 Boys-only schools. None of the co-ed schools in the sample have vocational
streams.
One also notes a relationship between the educational qualification of parents and the
enrolment of students in different types of schools. The relationship between level of
parents’ education and proportion of students enrolled in GBSSS, GGSSS and GSSSS
schools is inverse and in the case of RPVV, SKV and SBV the relationship is direct.
Student’s profile
From these schools, 3026 students were interviewed in the survey. Of this, 48.65% were
girls and 51.32% were boys. Students profile was analyzed across types of school, streams
chosen in 11&12th, gender, parents’ education and occupation.
Distribution of students across different streams in 12th class
Among the sampled students 8% are in science streams, 19% in commerce, 70% in arts and
3% with vocational subject.

Draft Report 10 Nov 2016
88
Proportion of students in science stream is skewed more towards RPVV schools. A total
44% of RPVV, 17% of SBV, 10% of GBSSS students are in Science stream; 5% or less in
the case of rest of type of schools. A total 32% of GSSSS; 31% of RPVV; 11% of GGSSS
students are in Commerce stream. In RPVV commerce streams with maths and in all other
schools proportion without maths is higher. There is total 6% of SKV and 5% of GGSSS
students in vocational stream; and 82% of GGSSS as compared to 70% of SKV, 70% of
GBSSS compared to 58% of SBV and 25% of RPVV students in Arts stream.
Similarly one also notes greater proportion of boys in science stream than girls. Proportion
of girls in science streams is 3% compared to 12% among boys. On the other hand 76% of
girls are in arts stream compared to 65% of boys. Likewise, the proportion of girls in
vocational streams is about 5% compared to 1% among boys.
To put in a different manner, out of 100 students in science stream 80 of them are boys and
only 20 are girls. On other hand the ratio is reverse if we see the proportion in vocational
stream (20 boys and 80 girls).
Distribution of students across various streams shows a relationship with level of parents’
education. The proportion of students enrolled in arts streams decreases as the educational
level of father increases, as 82 & 83% among children with fathers had ‘no schooling’ or ‘up
to primary’ and 46% among with fathers with PG are in arts stream. The situation is more or
less the reverse in the case of science streams. Higher the father’s education higher is the
proportion of children, as 4% among children with fathers having ‘no schooling’ or ‘up to
primary’ and 30% among those with PG are in science stream. Highest proportions of
children who opt for vocational are those with fathers having certificate or diploma
education. This pattern is observed more or less similar in case of mother’s educational
qualification.
Reason for choice of stream in 11th & 12th class
Choice and selection of stream in class 11th is given as per DOE norms i.e. choice of streams
is clearly prescribed as per a scale of CGPA and grades. In other words marks in 10th class
examination becomes the single most important factor in deciding in which stream a student
joins in 11th class . This was reiterated by teachers in interviews with them.

Draft Report 10 Nov 2016
89
Students’ responses however differed substantially from this perception. 47% students
responded that they chose stream out of their own interest. These responses include 53% of
Girls and 42% of Boys across the gender, 64-70% of Science students and 44% of Arts
students across the streams and 59% of RPVV, 54% SKV & GGSSS and 38% of GBSSS
across types of schools.
Future prospects as a reason for the stream was chosen by 25% which comprises of 23%
Girls and 26% boys, 44-55% Science students and 11%Vocational students and 66% RPVV
and 19% GGSSS.
Only 21% of total students chosen class 10th marks as the reason for choice. It includes 17%
Girls and 24% Boys, 2-5% Science students and 30% Vocational students and7% RPVV
and 26% GBSSS school students.
Findings from qualitative component of the study: Through the qualitative component of the
study it was found that there are various other factors which are also playing an important
role in the choice of stream in 11th and 12th. These factors include availability of affordable
tuitions for subjects in respective streams in the vicinity. English language competency,
knowledge of maths and science were others factors that influenced decision on streams in
11th and 12th class. Both students as well as parents have expressed that either tuitions are
expensive or not available in nearby locations; this was especially mentioned by those from
schools in periphery. This concern was acute for girl students from these areas.
Distance & safety is a key concern when it comes to joining a better school, a better place
for tuition, or a better institution for tertiary education. Parents do not aspire high for girls’
education, they are not ambitious with respect to girls. Distance mode of learning, options
like teaching, other vocational streams viz. beautician, fashion designing, tailoring, typing
and stenography are expressed as a convenient options for girls. Cultural values also act as
constraints for girls’ education as one of the parents said that if a girl studied more, then,
finding a groom of appropriate to her educational qualification will become difficult.
English as a medium of instruction is playing a vital role in the choice of streams. As one of
the teachers responded “this year, four students from our school got enrolled in science
stream at X school but later two of them switched to commerce stream because of difficulty
with English as medium of instruction and poor educational background of their families.”
Poor foundation in mathematics and science from junior classes is an important reason why
Draft Report 10 Nov 2016
90
students are not able to score good marks in 10th class and therefore they are pushed to take
up arts streams. Even if someone manages to enter into science stream s/he finds it difficult
to cope with these subjects. In one of the FGDs, students pointed to the rule of passing
everyone till 8th class as a reason for poor aptitude for mathematics and science.
Students from arts stream had expressed a sense of bias against them compared to those in
science stream displayed by teachers.
Medium of instruction
Largely Hindi is the medium of instruction in DoE government schools (70%) and is
followed by Hindi + English (16%). English as a medium of instruction is only in 13% of
schools.
Proportion of students under English as medium of instruction is higher among RPVV
schools (39%), followed by SBV (21%) & GBSSS (17%) schools. This proportion is least
among students in the girls-only schools i.e. SKV (12%) & GGSSS (2%). 18% of boys are
under English as medium of instruction as against 8% of girls.
Even the proportion of students with Hindi+English as languages of instructions is high
among students in RPVV schools (56%).
Difficulties faced in 11th and 12th class
15% students have said they are facing financial problems which comprise of 16% Girls and
14% Boys; 24% students from science, 18% from commerce, 12% from vocational and 13%
students from arts streams have said they face financial problems.
Learning related problems are faced by 14% of total students which include 12% of Girls &
15% of Boys; 18% of science stream, 15% of commerce, 13% of arts and 12% of
Vocational students across streams have said they face learning related difficulties; 24%
students from RPVV schools have said they face learning difficulties.
Total 11% of students have reported health problems as one of the difficulties they face in
senior secondary classes. This proportion is 12% among girls.

Draft Report 10 Nov 2016
91
Students preparing for competitive examinations
10% of students have said they are preparing for some or other competitive examinations.
These were largely for medical, engineering or other entrance examination for under-
graduate courses. Some had also responded that they are preparing for job related
examinations like staff-selection commission. This comprises of 45% of RPVV students,
18% of SBV, 13% of GBSSS, 4.36% of SKV, 3% of GGSSS across types of school; 15% of
Boys and 5% of Girls; 56% of PCM, 37% of PCB, 26% of PCMB and only 7% of Arts
students across streams.
It was also found that the proportion of students preparing for competitive examinations was
proportional to the level of both fathers’ as well as mothers’ educational qualification i.e. as
the parents’ educational qualification increases the proportion of students preparing for
competitive exams are also increases.
Proportion of students planning to further
91% of students wish to study further. This proportion is 93% among Girls and 89% boys.
Across the different type of schools this proportion is 95% in SKV, 91% in GGSSS, 95% in
SBV and 87% in GBSSS. Across streams, we note that 93% in science and commerce
streams, 90% in arts and 89% in vocational stream want to study further. About 13% of
students from science streams wish to take a break after 12th class. Only 5% of students
want to take paid work which is in higher proportion among students from GBSSS &
GGSSS (6%) schools and those are in Vocational (8%) and Arts (5%) streams.
Mode of learning
Close to one third of sampled students (31%) have said they wish to continue their education
through distance mode of learning and less than 3% of said they would like to continue their
tertiary education by regular evening programs. When seen across the stream they are
enrolled 36% of students in Arts stream, 32% in vocational stream, 24% from commerce
stream and 4% in science stream wish to opt for distance mode for tertiary education. This
proportion is 24% among bboys and 38% among Girls. This proportion is comparatively higher
among students whose parents’ educational qualification at low level.
Vocation training undergone
Draft Report 10 Nov 2016
92
21% of students responded that they have undergone either formal or informal training on
vocational skills for employment. This included students enrolled in vocational stream as
well as others. It is important to note that only 51% of students enrolled in vocational stream
have said they have undergone any vocational training.
Choice of course in tertiary education
Among students enrolled in commerce streams 86% of them wanted to continue with
commerce in tertiary education. Likewise 70% of students currently in science stream
wanted to continue with either engineering or medicine and 70% students in arts wished to
join in arts stream in their tertiary education. Among students in vocational stream a
majority (54%) wanted to join in arts stream; only 17% want to pursue vocational education
after completing 12th class.
Core science is being seen as an option by 21% of students from science stream. Likewise
law is seen as an option by 6% of students in arts stream and 4% of students in vocational
stream.
Reasons for / influence on choice of tertiary education
Choice of stream that students prefer in tertiary education is predominantly dictated by the
stream that they are currently enrolled in 12th class. However when individually asked
students had articulated this differently.
77% students said they will decide on their own and it will be their own decision. This
proportion was 80% among Girls and 74% among Boys. This proportion was also high
among students in science (87%) and arts stream (77%) students.
11% of students had said their choice will depend on employability of course with 13%
among Girls and 10% among Boys. Across the streams 17% of students from commerce
stream and 12% students from science and vocational streams had said they will decide on
the basis of employability.
Students’ awareness on and expectation from tertiary education
In-depth interviews and focus group discussion revealed marked differences between
students in different types of schools in terms of their awareness on tertiary education,

Draft Report 10 Nov 2016
93
courses they aspire to join, institutes for tertiary education and their expectations from
tertiary education.
Students from RPVV schools were aware of better options for their future choice of tertiary
education. The choices given by them were more thought out responses possibly revealing
that they have been reflecting about their future plans. For instance some of them clearly
mentioned they will take a break for a year and prepare for medical entrance; or join in a
specific stream in social sciences and continue further in that line to become a professor in
that discipline. Students from SBV and SKV on other hand had named colleges in their
immediate vicinity that included coaching institutions for competitive exams. Students from
GBSSS & GGSSS were least aware about higher education institutions; some currently in
arts stream mentioned about joining in IIT or wanted to do ‘mobile engineering’, ‘motor
engineering’ courses. These students did not display a sense of preparedness for making a
right or informed choice in deciding about tertiary education.
When asked about their expectations in institute of tertiary education responses were varied
touching up on a number of dimensions such as quality, proximity, safety, and friendliness,
economical and supporting in securing jobs. The following are some of the responses
received in in-depth interviews and FGD: better teaching; good mentoring; experienced and
friendly teachers; ‘good secular teachers’, no discrimination of any type; well equipped labs,
library etc; located in clean and hygienic environment; good discipline being maintained;
low fees; not very far; no ragging; smart classes; only morning shift; with placement
support; ‘it has to be exactly just like their school’.
Highest educational qualification aspired
About 8% students currently in 12th class want to do either a certificate or diploma program
rather than entering into regular under-graduate courses and this proportion is high among
the students from vocational stream (13%). Over 50% of students want to study till under
graduation and not above that. This proportion too is high among those from vocational
(56%) and arts (52%) streams. Over 31% of students want to study till PG or beyond. This
proportion is high among students from RPVV (53%) and students currently in science
streams.
Draft Report 10 Nov 2016
94
One also notes a relationship between the parents’ education qualification and the level of
aspired education qualification of students before entering into job. Level of parents’
education qualification shows a positive relationship with level of education that children
aspire to have. For instance, 57% students with their respective fathers having ‘no
schooling’ are aspiring to have education till UG and 20% of them aspire to have education
till PG. These proportions are 23% and 60% respectively among students with their fathers
having education till PG. This pattern also gets repeated when we consider mothers’
educational levels.
Preferred choice of vocation / profession in future
A majority of the students are aspiring for govt job (61%) and is in higher proportions
among Arts students (63%) and low among students in science stream (51%). This is
followed by those who want to become professionals (17%) which is more among girls than
boys (22% & 13%) and more or less uniform across streams except marginally high among
students from vocational (26%) and science streams (23%). The proportion which wants to
do business or self-employment is 11%, which is more among boys than girls (17% & 6%).
Only 7% of students want to go for private jobs.
Expectations of Diploma/Certificate students from tertiary education
As part of qualitative component a limited number of students enrolled in diploma or
certificate programs were interviewed.
Their expectations from their diploma or certificate level education were (a) quality in
education (b) placement facility (c) suitable timing (d) better infrastructure such as well
equipped laboratories (e) taking inputs from students on needs of students (f) Ensuring
better and strict discipline in terms of attendance and regularity.
Scope for Entry-level tertiary education in Universities in Delhi
There are a total of 87000 seats available together in various certificate, diploma and
undergraduate programs in institutions located in and around Delhi. Of this 21800 seats are
in certificate and diploma programs in different fields including engineering, nursing, and
teacher education etc., and 65307 seats are available at the level of under-graduate
education. Total available seats in certificate, diploma and undergraduate programs comes to

Draft Report 10 Nov 2016
95
a mere 32% of required seats when we consider that about 2.7 lakh students were registered
in 12th standard in the year 201518 and this proportion does not take in to consideration the
fact that a good proportion of seats in reputed universities are taken up students from outside
Delhi.
18http://indianexpress.com/article/education/cbse-class-10th-and-12th-exams-starts-today-over-25-lakh-students-to-appear/

Draft Report 10 Nov 2016
96
CHAPTER VII CONCLUSION
This study was initiated with the broad aim of assessing the demand for tertiary education in
NCT area of Delhi. It was conceived as a multi-phase study to assess the demand for tertiary
education from students passing out form schools as well those enrolled in institutes of
tertiary education.
This report presents findings from the First Phase of this study. This phase aimed to bring out
demand for tertiary education from students passing out form government senior secondary
schools alone. The following were the specific objectifies of this phase of the study
1. To assess the demand for tertiary education among students passing out of
government and selected private schools in NCT area
2. To find out the composition of demand for tertiary education in terms of
a. Streams (regular subjects vis-a-vis vocational) and
i. Mode of delivery (regular, evening, distance-learning etc)
3. To map the existing institutions for tertiary education and to assess their actual and
potential capacities of intake.
The study involved collection of data from a total of 103 Govt. DOE senior secondary
schools with proportional representation from all educational districts and different types of
Govt. schools viz., GBSSS (31), SKV (23), GGSSS (21), SBV, SSSS, GSSS, and RPVV.
Greatest proportion of schools were from GBSSS (31), SKV (23), and GGSSS (21) type of
schools. Across education districts, greater number of schools was from North-west Delhi
(23) and south Delhi (18). Out of total sampled schools 45 were boys-only schools, 42 girls-
only schools and 16 co-ed schools.
From these schools, 3026 students were interviewed in the survey. Of this, 48.65% were
girls and 51.32% were boys. 30% of them were from GBSSS schools, 22% from SKV
schools 21% from GGSSS, 13% from SBV and the rest from other government school.
In addition to the survey, In-depth interviews and focus group discussions were conducted
with students, teachers and parents from 5 schools selected purposively.

Draft Report 10 Nov 2016
97
Demand for tertiary education
Stream wise composition of students in 12th class
The sample of students revealed that over 70% of students were enrolled in Arts stream in
12th class, 19% in commerce stream, 8% in science stream and 3% in vocational streams.
The survey had also found total number of students enrolled in these 103 schools across
different streams. As per this estimate 72% of students in these schools are in Arts stream,
18% in commerce streams, 6% in science streams and 5% in vocational stream.
This distribution largely holds good for students coming in government senior secondary
schools. However if we consider composition of students in private schools across streams
this proportions get altered. Across all schools including government, aided and private
schools the proportion of students in arts stream in 12th class is 54%, those in commerce
stream 24%, 18% in science stream and close to 4% in vocational stream.
The below table also give proportion of girls and boys across streams. Girls represented
more in Arts and vocational streams than boys; boys represented more in science and
commerce streams.
Stream Sampled students in sampled
Govt DOE schools All 12th class students in sampled Govt DOE schools (%)
DOE, Pvt. aided and unaided*(%)
Girls (%)
Boys (%) Total (%)
Arts 76 65 70.3 71.6 54.0 Commerce 16 21 18.9 17.6 24.0 Science 3 12 7.8 6.2 18.0 Vocational 5 1 3.1 4.6 3.6
* State Report - Secondary Education Report Card 2014-15, Delhi, http://udise.in/SRC-New/; DISE Flash Statistics, 2015
This proportion of students in different streams in 12th class provides us with base figure to
estimate demand for tertiary education. This composition of students across streams is quite
different when government schools alone are considered as against the proportions when all
schools including aided and private schools are considered.
Proportion of students in government schools aspiring to continue their education after 12th
class

Draft Report 10 Nov 2016
98
From the study we note that 91% of sampled students want to study further and this figure is
more or less similar across different streams that student are currently in.
In other words 9% of students currently in 12th standard do not aim to immediately register
for any tertiary education. This proportion is more among boys (11%) than girls (7%).
Choice of course in tertiary education
Choice of stream that students prefer in tertiary education is predominantly dictated by the
stream that they are currently enrolled in 12th class. Among students enrolled in arts stream
in 12th class, 70% have said they would like to join in arts stream in their tertiary education.
Law is being seen as an alternative option by 6% of students currently in arts stream.
Among the students enrolled in vocational stream 17% want to pursue vocational education
after completing 12th class and 54% of them wanted to pursue tertiary education in arts
stream; 4% of these students look at Law as their option
Among students currently enrolled in commerce stream 86% of them wanted to continue
with commerce in tertiary education; 2% of them want to take up law after schooling.
In case of students in science stream 70% of them wanted to continue with either
engineering or medicine. Among them 21% wants to pursue tertiary education in core
science stream.
Composition of demand for tertiary education in terms of mode of education
Close to one third of sampled students (31%) have said they wish to continue their education
through distance mode of learning and less than 3% of said they would like to continue their
tertiary education by regular evening programs. When seen across the stream they are
enrolled 36% of students in Arts stream, 32% in vocational stream, 24% from commerce
stream and 4% in science stream wish to opt for distance mode for tertiary education. This
proportion is 24% among bboys and 38% among Girls.

Draft Report 10 Nov 2016
99
Demand from govt sr. Sec schools as per streams
Stream % Arts 50.9 Commerce 18.2 Engineering 5.4 Law 4.3 Medicine 2.8 Science 2.7 Vocational 1.8 Others 13.8 Total 100.0
Highest educational qualification aspired
About 8% students currently in 12th class want to either do a certificate or diploma program
rather than entering in to regular under-graduate courses. Over 50% of students want to
study till under graduation and not above that. This proportion is high among those with
vocational and arts streams. Over 31% of students want to study till PG or beyond. This
proportion is high among students currently in science streams.
Scope for Entry-level tertiary education in Universities in Delhi
Scope for diploma and certificate programs in Delhi
There are about 21800 seats in different recognised certificate and diploma programs in
different fields including engineering, nursing, teacher education etc. This includes 9242
seats in ITIs, 5413 seats in polytechnics, 4150 in DIETs and 910 seats in recognised nursing
courses (GNM & ANM) in government, municipal, defence, missionary, trust and private
institutes in Delhi. This however does not include unrecognised courses in technical, Para-
medical, computers and fashion related fields.
Scope for under-graduate programs in Delhi
There are 29 government run /funded universities in and around Delhi catering to students in
Delhi NCR. These are inclusive of Central, State and Deemed Universities. Many of these
universities are specialised ones providing education in specific area like
Technology/Engineering, Medicine, Law, Languages, Social sciences and Humanities /
Arts. Some are general ones offering programs not necessarily restricted to an area.

Draft Report 10 Nov 2016
100
Of these, 12 universities do not have entry at the level of under-graduation. All together
there are over 65307 seats available at the level of under-graduation across all specialisation
in these universities.
There are four private universities located in and around Delhi catering to students in NCT
area offering undergraduate level programs. However entry into these programs may be
prohibitively expensive for students coming out from government schools in Delhi.
Taking together undergraduate college, diploma and certificate programs there are about
over 87000 seats available in institutes in Delhi. This comes to a mere 32% of required seats
when we consider that about 2.7 lakh students were registered in 12th standard in the year
201519 and this proportion does not take in to consideration the fact that a good proportion
of seats in reputed universities are taken up students from outside Delhi.
19http://indianexpress.com/article/education/cbse-class-10th-and-12th-exams-starts-today-over-25-lakh-students-to-appear/
Amol Padwad

Draft Report 10 Nov 2016
101
Annexure
Annexure – 1
Instrument – 1
(Draft)
Need Assessment on Demand for Tertiary Education in NCT Area of Delhi
Interview schedule for survey among school students
[Will be modified after inputs from piloting]
Respondents: Students towards completion of secondary education in government, and aided
private schools in NCT area.
Key purpose: To find out the demand for tertiary education and the composition of this demand in
terms of academic/vocational streams and modes of delivery.
Survey sites: School premises
Sections:
I. Profile of the school
II. Profile of the student
III. Student’s plan after completion of schooling (Demand for tertiary education)
IV. Expectations from tertiary education
V. Educational and employment aspirations
VI. Perceptions on available alternatives and future plans (Composition of demand – streams &
mode of delivery)
VII. Perceived barriers faced in completing secondary education
VIII. Barriers envisaged in enrolling in tertiary education

Draft Report 10 Nov 2016
102
Need Assessment on Demand for Tertiary Education in NCT Area of Delhi
Interview schedule for survey among school students
Name of the investigator(s): ____________________________________________________
Date: ________________ Start time: _________________________________
Survey site code: ________________________________
Sect
ion
No
Q.
N
o
Question Response Instruc
tions /
skip
I Profile of the school
1 Educational District (code)
2 Block (Code)
3 School Code
4 Name of the School
5 Type of school by management a. Sarvodaya
b. GBSSS
c. GGSSS
d. Pratibha Vikas Vidyalaya
e. Aided private school
f. Others ____________
6 Type of school by standards a. Primary to SSS
b. Middle to SSS
c. SS to SSS
d. Only SSS
School shifts a. Morning
b. Afternoon
7 School Address
8 Name and Phone no. of the contact
Person
II Profile of the student
Name (Optional) Persona
l
identifi

Draft Report 10 Nov 2016
103
ers. To be kept
confide
ntial
and
encrypt
ed
Age in completed years
Class enrolled in
Gender a. Male
b. Female
c. Other
School subjects chosen (stream) a.
___________________
b.
c.
d.
e.
f.
Total members in the household
Total earning members
Total household income
Whether belong to SC/ST community To be
collecte
d from
school
records
Have you received / receiving any
scholarship / financial aid
Name of the scholarship / financial
aid received
Periodicity a. Monthly
b. Three-monthly
c. Six-monthly
d. Annual
e. One-time payment

Draft Report 10 Nov 2016
104
f. Other ____________
If yes, for how many years
From (class then enrolled)
To (class enrolled)
Have you received any other support
in cash or kind?
If yes, describe
Whether any fee paid to the school in
class XII
a. Yes
b. No
c. Don’t know
If yes, what is the fee?
What other expenditure you incur
for education
Travel (daily) Yes
No
If yes, amount / day
Private tuition Yes
No
If yes, amount Indicate
if it is
monthl
y,
annual
or other
type
Learning material Yes
No
If yes, amount Indicate
if it is
monthl
y,
annual
or other
type
Other _______ Yes
No

Draft Report 10 Nov 2016
105
If yes, amount Indicate if it is
monthl
y,
annual
or other
type
Distance from home to school in Kms
How do you commute daily to
school?
a. Walk
b. Cycle
c. Personal motor vehicle
d. Cycle-rickshaw
e. Bus
f. Metro
g. Shared auto/taxi
h. Others
What is the medium of instructions in
your class
a. Hindi
b. English
c. Urdu d. Others________
Subjects that you find difficult a.
b.
c.
d.
Subjects that you like a.
b.
c.
d.
How much did you score in Class X? _______ (% /
CGPA)
Tick
the
suitable
one
How much did you score in Class XI? _______ (% /
CGPA)
Tick
the
suitable
one

Draft Report 10 Nov 2016
106
III Educational and employment aspirations
What do you plan to do immediately
after you complete XII class? Give all
your choices in your order of
preference
Study further
Enter into paid work
Family business
May get married
Will take a break
Will be at home
Others __________
Don’t know / still
thinking
Are you preparing for any
competitive exams?
Yes
No
If yes please name. Write
the
complet
e name
If you want to study further, in what
stream?
Under graduation
a. Engineering
b. Medicine
c. Commerce
d. Science
e. Arts
f. Law
g. Others
Vocational
a.
b.
c.
What are the reasons for this choice a. Parental
b. Self aspired
c. Teachers suggested
d. Peers
e. Financial
f. Easy
g. Employability

Draft Report 10 Nov 2016
107
h. Others
What mode of learning you will
prefer
a. Regular (day)
b. Regular (evening)
c. Distance mode
For how many more years after class
XII you wish to study
Till which level you think will be
able to study
If wants to enter into paid work
Why do you want to take up work /
employment?
a. Financial reasons
b. Not good in studies
c. More interested in
work
d. Work till I get
married
e. Others ___________
What kind of work you think you
want to take up?
Have you undergone formal or
informal training in any vocational
skills for employment?
a. Yes
b. No
If yes, whether formal or informal a. Formal
b. Informal
Do you think acquiring any specific
skill will help you to get this work /
excel in this work
a. Yes
b. No
c. Don’t know
If yes, please enlist
If there are courses offering training
in these skills will you join
a. Yes
b. No
c. Don’t know
IV Perceptions on available
alternatives
Apart from what you have mentioned
above, can you list what are the other
alternatives possible / available in
terms of courses (including
vocational)

Draft Report 10 Nov 2016
108
Please list
V Difficulties / barriers faced in
completing higher secondary school
What difficulties you faced during your XI and XII class? Please enlist
(Descriptive response)
VI Perceived difficulties / barriers in
enrolling in tertiary education
What difficulties you think you will face in enrolling in tertiary education.
Please enlist
(Descriptive response)
VII In sum, can you briefly describe what kind of higher education do you want?
(Descriptive response)
End time:
Amol Padwad

Draft Report 10 Nov 2016
109
Annexure – 2
Instrument -2
(Draft)
Need Assessment on Demand for Tertiary Education in NCT Area of Delhi
Discussion Guide for Focus Group Discussion
With Students enrolled in VII & X classes, post-secondary courses, poly-techniques and ITI in
NCT
[Will be modified after inputs from piloting]
Respondents: With Students enrolled in VII & X classes, post-secondary courses, poly-techniques
and ITI in NCT
Key purpose: To find out the educational and employment aspirations, expectations from tertiary
education, and perceptions on available alternatives, future plans and barriers faced in enrolling and
completing secondary and post-secondary education
Discussion sites: School premises / Community
Key domains of data collection:
I. Educational aspirations
II. Expectations from tertiary education
III. Employment aspirations IV. Barriers faced in enrolling and completing secondary / post-secondary education

Draft Report 10 Nov 2016
110
Need Assessment on Demand for Tertiary Education in NCT Area of Delhi
Discussion Guide for Focus Group Discussion
Section 120
Objective: Introduce the researcher and the study.
Introduction of
Researcher:
Logistics:
Recording:
My name is _____ and I am a part of a research team from Ambedkar
University Delhi, located in Kashmere Gate conducting a study on Need
Assessment on Demand for Tertiary Education in National Capital Territory
Area of Delhi
The purpose of this group discussion is to get your opinion and perspective
on your (your children’s) educational and employment aspirations,
expectations from tertiary education and related aspects
The discussion should take approximately one hour. I will ask you several
questions that I have prepared in advance to guide our conversation. There
is no right or wrong answer to these questions. If a question is unclear,
kindly let me know and I will rephrase it. I would like to record this
discussion in order to make sure that we capture everything that you say
here today the way that you said it
Before we get started, do you have any questions or clarifications?
Section 2
Objective: Getting to know you…
Introduction of
participants:
Fill the demographics
sheet for all participants
Let us go around and introduce ourselves
Student: Names, currently enrolled in which standard, stream if applicable,
type of school
● [If a majority are in art streams, then proceed] why a huge number of
students have opted for Arts stream?
● Which types of government schools are better? Why
Section 3
20Ground rules – As much as possible participants are encouraged to speak one at a time so that we are able to record properly. A participant may speak after the previous participant has completed her/his point.

Draft Report 10 Nov 2016
111
Objective: To bring out educational aspirations of students /children
Note-taker may prepare
a list on a chart paper
Note-taker may add this
to the list already made
● What do you plan to do after you complete this year schooling? Please list
all choices
● Up to what level you wish to study?
● What are the different courses (streams) that you all can potentially join to
study further? Can you list them?
● Which program you wish to join? Please list all choices. Why? Any specific
reasons?
● Can you name institutions where these courses can be pursued?
● Do you know how one can secure admission to these programs? Can you
please describe

Draft Report 10 Nov 2016
112
● How do you want to study? In regular colleges or other forms like evening
college, distance education etc. Probe further to ask why a particular mode of
learning?
● Is anyone preparing /planning to prepare for any competitive examinations
for securing admission in a program? If yes, can please enlist them
Section 4
Objective: To bring out the expectations of students / children from tertiary education
● Why should one attend / study tertiary education? Other than degrees what
do you expect to achieve by attending an institute of tertiary education
● Other than the essential subjects, what do you expect to learn from such
institution (probe for hard and soft skills, life skills, knowledge, awareness)
● What are facilities you expect in such institutes to enable you to complete /
excel (Probe for infrastructure, technology, concessions, aid, institutional
norms, timing, mode of delivery)
Section 5
Objective: To bring out employment aspirations of students /children
● What is your aspiration in life regarding employment? What do you want to
become? Why these choices? (probe for income, satisfaction, status,
compatibility with life anticipated etc)
● Who will decide as to what you will become?

Draft Report 10 Nov 2016
113
● How did you get /from whom you got this idea?
● Do you know what education one has to complete to become what you want
to become. Please describe / enlist.
● Do you think any specific skill is required for to get the job you wish to take
up / Career you wish to develop? Please enlist.
● How do you think these skills can acquire? From where?
Section 6
Objective: To bring out the barriers faced by students / children in enrolling and
completing secondary / post-secondary education
● What are the problems you face in your current level of studies? Is there
anything that affects your studies currently? Please enlist and elaborate
● Did any of your close friends /neighbours have discontinued her/his studies?
If yes, what do you think were the reasons?
● What barriers you may face to continue your education further?
● What barriers you may face to continue your tertiary education?
● Will your family support you for your education / allow you to study in a

Draft Report 10 Nov 2016
114
college / tertiary education? Please elaborate.
Amol Padwad

Draft Report 10 Nov 2016
115
FGD Demographic / Summary Sheet
1. FGD Type (Tick the right one)
(a) Students enrolled in VII & X classes
(b) Students enrolled in post-secondary courses, poly-techniques and ITI in NCT
(c) Parents
(d) Any other type ________________
2. File name (in computer):_______________
3. Education district______________________ 4. Block________________________
5. Village__________________ 6. Hamlets (if any) (1) ___________ (2) ________________
7. Date of conducting FGD: ____________
8. Starting time__________________ 9. Ending Time_______________
10. Write a brief description about the location where the FGD was conducted /from where
participants were drawn from (Give description of the location in terms of housing, streets, main
occupation, public transport available, schools available, distance to higher level educational
institutions, distance from a nearby urban location
11. Demographic information
S.No Name Gender Age School /
Institutions
Criteria for
choosing
Any other
attribute________
1
2
3
4
5
6
7
8
9
10
11
12
12. Moderators / Recorder:
1. ____________________________________________
2. ____________________________________________

Draft Report 10 Nov 2016
116
Debriefing
(To be filled by the moderator and note-taker immediately after each FGD)
How did this FGD differ from what you expected?
Any significant differences from earlier focus groups?
What were the key important themes or ideas discussed
What quotes should be remembered and possibly included in the report?
Did you note any unexpected or unanticipated findings?

Draft Report 10 Nov 2016
117
Are there any important points that have to be taken forward to subsequent FGDs?
Any other points to be registered?
Amol Padwad

Draft Report 10 Nov 2016
118

�2
Annexure 1
Dheerpur Wetland Park:
Restoring the Wetlands of Dheerpurto Augment Urban Ecosystem Services
Centre for Urban Ecology and Sustainability
Progress Report 2016-17

�3
Annexure 1Centre for Urban Ecology and Sustainability
Dheerpur Wetland Park:
Restoring the Wetlands of Dheerpurto Augment Urban Ecosystem Services
Progress Report 2016-17
Submitted by: Dr. Suresh Babu
Director (CUES) & Associate Professor,
School of Human Ecology Ambedkar University Delhi
Amol Padwad

Table of Contents Background (Page 6)
Survey and Baseline Data Collection (Page 8-15)
• 1.1. Survey of experimental site for baseline data collection
• 1.2. GPS based survey of experimental site
• 1.3. Physico-chemical property of soil and water
• 1.4. Survey of vegetation .
• 1.5. Survey of fauna
Site preparation (Page 16-19)
• 1.6. Earthwork
• 1.7. Civil and Other infrastructure
Introduction of Wetland Species and Biological inputs (Page 20-25)
• 1.8. Creation of Short Grassland: list of species introduced and their location
• 1.9. Creation of Medium and Tall Grassland
• 1.10. Creation of woodland.
• 1.11. Creation of greenways and avenues
On-field challenges (Page 25-26)
Appendix - I Soil data of Dheerpur Wetland
Appendix – II Water data of Dheerpur Wetland
�4Annexure 1 | Dheerpur Wetland Park | Progress Report (2016-2017) | CUES
List of Figures
• FIGURE 1 MAP SHOWING THE LAYOUT OF THE DHEERPUR WETLAND PARK FIGURE 2 MAP SHOWING THE PROPOSED DEVELOPMENT OF THE DHEERPUR WETLAND PARK
• FIGURE 3 AERIAL VIEW OF THE DHEERPUR WETLAND PARK. AS CAN BE SEEN, ACCUMULATION OF
• STORM WATER HAS LED TO THE CREATION OF SEASONAL RESERVOIRS
• FIGURE 4 (CLOCKWISE FROM LEFT) SUAEDA FRUTICOSA, SCIRPUS MARITIMUS, ZIZIPHUS
• FIGURE 5 NUMBER OF TREE SPECIES PRESENT AT DWP SITE
• FIGURE 6 SHOWING NUMBER OF TREE SPECIES IN DIFFERENT GBH CLASS.
• FIGURE 7 VEGETATION COVER IN DIFFERENT LOCATIONS OF DHEERPUR WETLAND PARK
• FIGURE 9 MINOR EARTHWORK BEING CARRIED OUT IN THE WRC POND AREA
• FIGURE 10 TEMPORARY FIELD STATION AT THE WETLAND SITE
• FIGURE 11 MAINTENANCE AND MULTIPLICATION OF SAPLINGS AT THE WETLAND NURSERY
• FIGURE 12 GRASSES AND SEDGES BEING INTRODUCED IN THE WRC POND AREA. THE SEEDS
• WERE COLLECTED AND DRIED DURING LAST SUMMER.
• FIGURE 13 SCIRPUS MARITIMUS PATCH IN DEEP WETLAND AREA
• FIGURE 14 PLANTATION ACTIVITIES AT DWP SITE
• FIGURE 15 MONITORING OF STORM WATER .
List of Tables
• TABLE 1 AVI-FAUNA INVENTORY • TABLE 2 SEED QUANTITY OF DIFFERENT GRASS SPECIES AVAILABLE IN
NURSERY • TABLE 3 LIST OF TREES PLANTED AT THE WETLAND SITE • TABLE 4 NUMBER OF PLANT SAPLINGS AVAILABLE IN DHEERPUR NURSERY
�5Annexure 1 | Dheerpur Wetland Park | Progress Report (2016-2017) | CUES

�6
Background
In pursuance of the joint commitment of AUD and DDA to conserve and restore wetlands of Dheerpur, vide the Management Agreement with DDA (Dated 17 February 2015), the Vice- Chancellor of AUD constituted an Interim Committee for setting up a Centre for conservation of wetlands, and also to facilitate the creation of a formal management structure for the restoration of Dheerpur wetlands. It was decided that the newly created Centre for Urban Ecology and Sustainability would provide overall coordination and technical guidance to the Dheerpur Project. The CUES was asked to submit a start-up grant to initiate preparatory activities of the Centre, and also to initiate work on its first major project – Restoration of Wetlands at Dheerpur. The University approved this proposal for the start-up grant on 30 March 2015 in project mode.
The Dheerpur Wetland Park (DWP) was formally inaugurated on 19 June 2015 by Shri Balvinder Kumar, Vice-Chairman, Delhi Development Authority (DDA). The event was also graced by Prof Shyam B. Menon (Vice-Chancellor, AUD), Prof Vijaya S. Varma (Advisor, Planning Division, AUD) and Eminent scientist and ecologist - Prof C.R. Babu (Professor Emeritus, University of Delhi). The team of officials from DDA directly associated with the project - Chief Engineer (North), Commissioner and Director (Horticulture Division), Executive Engineer (ND 9), Superintendent Engineer (Dheerpur Area), Dr. Achala Singh (DHE) and Junior Engineers were among those present. The DWP project is now in its second year, this report contains progress achieved in the year 2016-17.
Annexure 1 | Dheerpur Wetland Park | Progress Report (2016-2017) | CUES

�7Annexure 1 | Dheerpur Wetland Park | Progress Report (2016-2017) | CUES
FIGURE 2 MAP SHOWING THE PROPOSED DEVELOPMENT OF THE DHEERPUR WETLAND PARK
FIGURE 1 MAP SHOWING THE LAYOUT OF THE DHEERPUR WETLAND PARK

�8Annexure 1 | Dheerpur Wetland Park | Progress Report (2016-2017) | CUES
As per the schedule of work proposed in the project proposal submitted to DDA, the objectives for the Phase I of the Dheerpur Wetland Park restoration project were as follows:
Survey and Baseline Data Collection
1.1. Survey of experimental site for baseline data collection The wetland site was surveyed for flora, fauna, soil and water. Various indices related to each of these variables were studied as a means to collect baselines. An aerial survey of the wetland was also carried out using a drone in order to get a sense of the accumulated stormwater in the wetland.
1.2. GPS based survey of experimental site This year the site was again surveyed using a handheld GPS unit, coordinates of which were later transferred onto a GIS based platform. The resultant map was used to mark the DWP area under contestation from different stakeholder. The issue was further communicated to D.D.A.
1.3. Physico-chemical property of soil and water Soil samples were collected from various points of the DWP site. The points
FIGURE 3 AERIAL VIEW OF THE DHEERPUR WETLAND PARK. AS CAN BE SEEN, ACCUMULATION OF STORM WATER HAS LED TO THE CREATION OF SEASONAL RESERVOIRS

�9Annexure 1 | Dheerpur Wetland Park | Progress Report (2016-2017) | CUES
represent the current variation in landforms, as well as future variation in the land structure such as deep and shallow wetland or woodland. For the purpose of standardisation of sampling, the site was divided into 50 x 50 m square grids and 3 soil/sediment samples each were collected from 10 such grids (out of a total of 100). The samples were later analyzed for pH, TDS (Total Dissolved Solids), salinity, conductivity and resistivity (Annexure I). Water samples were collected during the monsoon, and the collected data represents the storm water properties in the wetland. However, the use of sewage water for cropping has affected the storm water properties at certain locations.
The quality of the storm water was studied in different parts of the DWP in September 2016. The data collected is valuable to understand possible interventions. The locations roughly correspond to the locations where storm water naturally accumulates, and detailed desilting and earthwork is proposed. There is considerable variation in the physicochemical properties of water samples and soils. Although the overall values of salinity is quite high. The large reservoir consisting of storm water, consistently had high DO levels, until its rapid drying out in 3rd week of October (Annexure II).
1.4. Survey of vegetation A baseline survey was conducted for both grasses as well as trees. Vegetation cover was recorded using systematic point count sampling technique. Points were taken after specific interval, and species that were found on that particular point were recorded. This can help determine the area covered by herbaceous plants in each section of DWP. Three areas were covered in the sampling process - Deep wetland area, WRC pond, and Visitors pond area. For trees, GBH (Girth at Breast Height) of each individual greater than 20 cm GBH was recorded at the height of 1.37 m. The geo-coordinates of each tree were recorded using a GPS, and was subsequently numbered. Data on physiological characteristics such as fruiting and flowering were also recorded to monitor plant health, and preparing seasonal vegetation charts. This survey helped in preparing an inventory of trees, grasses and sedge species present at the Dheerpur wetland site.
A thorough survey of the trees and grasses of the DWP site was carried out in a systematic manner. The present survey also indicates that the wetland site does not have many big trees. A majority of the trees are in the size class of 20-40 cm girth. Wetland plant species such as Tamarix aphylla and Salix alba

�10
are also found to be thriving in the area. Being native wetland species, these species are currently being multiplied at the field nursery for the next round of plantation. Species such as Paspalum, Cyperus rotundus, and Scirpus maritimus currently located in the Visitors Pond area, WRC Pond area and Deep Wetland area respectively have been found to be fairly abundant (Figure 7). Most of the species that are found in the Deep Wetland and the Visitors Pond area are native to the Dheerpur wetland region.
Similar surveys will be conducted each year to monitor temporal changes in different vegetation strata present at the site.
Annexure 1 | Dheerpur Wetland Park | Progress Report (2016-2017) | CUES
FIGURE 4 (CLOCKWISE FROM LEFT) SUAEDA FRUTICOSA, SCIRPUS MARITIMUS, ZIZIPHUS MAURITIANA, TAMARIX APHYLLA

�11Annexure 1 | Dheerpur Wetland Park | Progress Report (2016-2017) | CUES
FIGURE 6 SHOWING NUMBER OF TREE SPECIES IN DIFFERENT GBH CLASS
FIGURE 5 NUMBER OF TREE SPECIES PRESENT AT DWP SITE

�12Annexure 1 | Dheerpur Wetland Park | Progress Report (2016-2017) | CUES
FIGURE 7 VEGETATION COVER IN DIFFERENT LOCATIONS OF DHEERPUR WETLAND PARK

�13Annexure 1 | Dheerpur Wetland Park | Progress Report (2016-2017) | CUES
1.5. Survey of fauna A preliminary bird survey was conducted in Dheerpur to identify and document avi- fauna of the region. A species list of both wetland and tree dwelling birds was generated through personal observation method. A team of students and researchers from AUD and CUES systematically surveyed the wetland in the early hours of the day using simple surveying instruments such as binoculars and spotting scopes. In all, 49 bird species were identified and recorded. A more robust methodology is being developed for conducting faunal and avi-faunal surveys in an effort to study species distribution, abundance and annual change in the DWP area. The long-term objective of such surveys will be to generate data on animals, birds, insects, amphibians and reptiles, and aggregate this data in a repository.
S. No Species 1 Ashy Prinia2 Asian Pied Starling3 Barn Swallow4 Black Drongo
5 Black Kite
6 Black-winged Stilt 7 Bluethroat8 Citrine Wagtail 9 Common Chiffchaff 10 Common Greenshank 11 Common Myna 12 Common Redshank 13 Common Tailorbird 14 Coppersmith Barbet 15 Eurasian Collared-Dove 16 Eurasian Moorhen 17 European Starling 18 Gray-headed Swamphen
Table 1 Avi-fauna Inventory
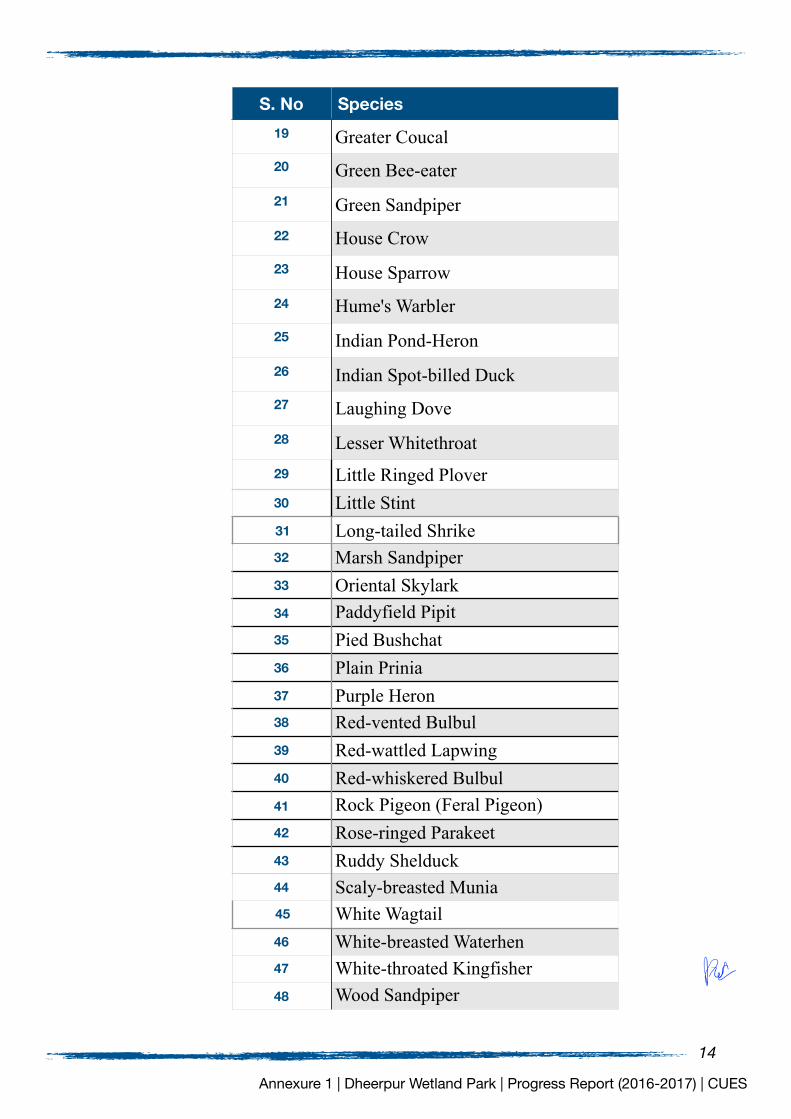
�14Annexure 1 | Dheerpur Wetland Park | Progress Report (2016-2017) | CUES
S. No Species19 Greater Coucal20 Green Bee-eater21 Green Sandpiper22 House Crow23 House Sparrow24 Hume's Warbler25 Indian Pond-Heron26 Indian Spot-billed Duck27 Laughing Dove28 Lesser Whitethroat 29 Little Ringed Plover30 Little Stint31 Long-tailed Shrike32 Marsh Sandpiper33 Oriental Skylark34 Paddyfield Pipit35 Pied Bushchat36 Plain Prinia37 Purple Heron38 Red-vented Bulbul39 Red-wattled Lapwing40 Red-whiskered Bulbul41 Rock Pigeon (Feral Pigeon)42 Rose-ringed Parakeet43 Ruddy Shelduck44 Scaly-breasted Munia45 White Wagtail46 White-breasted Waterhen 47 White-throated Kingfisher 48 Wood Sandpiper
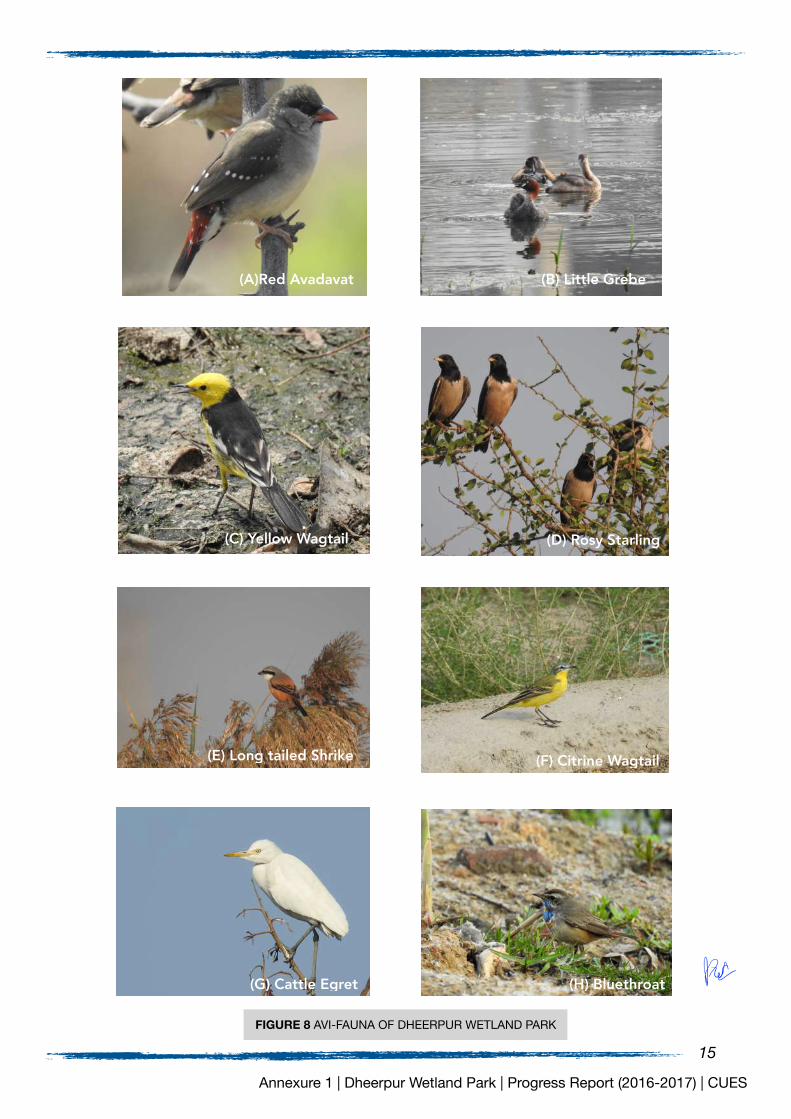
�15Annexure 1 | Dheerpur Wetland Park | Progress Report (2016-2017) | CUES
FIGURE 8 AVI-FAUNA OF DHEERPUR WETLAND PARK
(A)Red Avadavat (B) Little Grebe
(D) Rosy Starling(C) Yellow Wagtail
(E) Long tailed Shrike (F) Citrine Wagtail
(H) Bluethroat(G) Cattle Egret

�16
Site preparation
1.6. Earthwork (i) Partial desilting of a portion of the wetland was undertaken in order to
initiate the collection of stormwater.
(ii) Minor earthwork was undertaken before the monsoon wherein several areas that formerly served as dumping grounds were cleared and overlaid with soil. Plantation has been initiated on these newly created soil beds.
(iii) Repair work of bund for stormwater reservoir: While this issue was discussed with Executive Engineer (North), DDA during the previous wetland board meeting, the tendering process was not complete before the rainy season. However, minor work was initiated by CUES to prevent receding of stormwater from the wetland. Large scale civil work by DDA is to be initiated urgently.
1.7. Civil and Other infrastructure
(i) There is an urgent need to protect the wetland area from encroachment and trespassing. For this, DDA has been asked to construct gates at the two entrances to the wetland. Boundary wall construction is ongoing, although no work has been initiated on the Gandhi Vihar side of the wetland. This was discussed in the previous wetland board meeting, and continues to be a major concern.
(ii) A temporary field station has been set up at the site to store tools and various other field materials. This temporary set-up is also used to conduct basic field based research. A detailed proposal for installation of Porta Cabin at site is also approved. The porta-cabin will be useful for conducting experiments and regular ecological monitoring of the site.
Annexure 1 | Dheerpur Wetland Park | Progress Report (2016-2017) | CUES

�17Annexure 1 | Dheerpur Wetland Park | Progress Report (2016-2017) | CUES
FIGURE 9 MINOR EARTHWORK BEING CARRIED OUT IN THE WRC POND AREA

�18Annexure 1 | Dheerpur Wetland Park | Progress Report (2016-2017) | CUES
FIGURE 10 TEMPORARY FIELD STATION AT THE WETLAND SITE

�19Annexure 1 | Dheerpur Wetland Park | Progress Report (2016-2017) | CUES
FIGURE 11 MAINTENANCE AND MULTIPLICATION OF SAPLINGS AT THE WETLAND

�20
Introduction of Wetland Species and Biological inputs
1.8. Creation of Short Grassland: list of species introduced and their
location
Several Grass species were collected from areas in and around the wetland, and introduced around the WRC pond. The main objective of this grass introduction programme was to maintain a seed bank of grasses that are intrinsic to the Dheerpur wetland region. Some of the grass species that were introduced were Panicum antidotale, Panicum maximum, Cenchrus ciliaris, Chrysopogon fulvus, and Phragmites karka.
Annexure 1 | Dheerpur Wetland Park | Progress Report (2016-2017) | CUES
FIGURE 12 GRASSES AND SEDGES BEING INTRODUCED IN THE WRC POND AREA. THE SEEDS WERE COLLECTED
AND DRIED DURING LAST SUMMER

�21
1.9. Creation of Medium and Tall Grassland
Seeds of medium and tall grasses were collected and stored in the nursery for future plantation activity. (Annexure IV ) The presently existing patches of grasses and sedges are been closely monitored and maintained. Propagules from these patches will be used to develop a tall and medium grassland at a later stage.
Annexure 1 | Dheerpur Wetland Park | Progress Report (2016-2017) | CUES
Table 9
Species Quantity SourcePanicum antidotale 5 Kilogram
Panicum maximum 5 KilogramCenchrus ciliaris 5 Kilogram
Chrysopogon falvus 5 Kilogram
Panicum antidotale 6 Kilograms
DelhiPhragmites karka 12 Kilograms
Heteropogon contortus 4 kilograms
Themeda
Apluda mutica 5 kilograms
Schoenefeldia 4 kilograms
Jhansi, Uttar Pradesh
�
�5 kilograms
�
Sheopur, Madhya Pradesh
� �
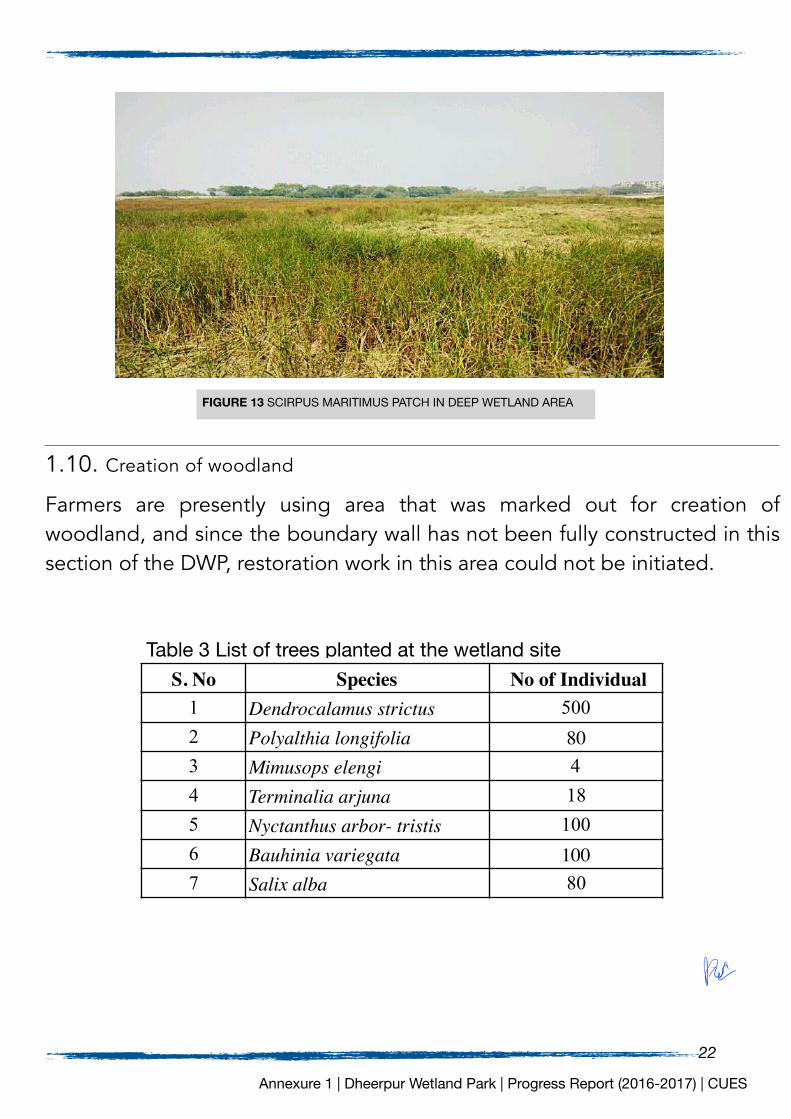
�22Annexure 1 | Dheerpur Wetland Park | Progress Report (2016-2017) | CUES
1.10. Creation of woodland
Farmers are presently using area that was marked out for creation of woodland, and since the boundary wall has not been fully constructed in this section of the DWP, restoration work in this area could not be initiated.
FIGURE 13 SCIRPUS MARITIMUS PATCH IN DEEP WETLAND AREA
S. No Species No of Individual 1 Dendrocalamus strictus 5002 Polyalthia longifolia 803 Mimusops elengi 44 Terminalia arjuna 185 Nyctanthus arbor- tristis 1006 Bauhinia variegata 1007 Salix alba 80
Table 3 List of trees planted at the wetland site

�23
1.11. Creation of greenways and avenues
Although earthwork is pending, plantation work has been initiated with the introduction of several tree species in the wetland. All avenues within the wetland have been planted with species such as Bamboo (Dendrocalamus strictus), Ashok (Polyalthia longifolia), Maulsari (Mimusops elengi), Arjun (Terminalia arjuna), Harshringar (Nyctanthes arbor-tristis), Kachnar (Bauhinia variegata) and White Willow(Salix alba).
Annexure 1 | Dheerpur Wetland Park | Progress Report (2016-2017) | CUES
S.no. Species
1 Gardenia turgida 202 Stereospermum suaveolens 203 Dalbergia latifolia 204 Syzygium cumini 505 Terminalia arjuna 506 Dendrocalamus strictus 5007 Polyalthia longifolia 100
�No. of Individuals
Table 4 Number of plant saplings available in Dheerpur nursery

�24Annexure 1 | Dheerpur Wetland Park | Progress Report (2016-2017) | CUES
FIGURE 14 PLANTATION ACTIVITIES AT DWP SITE
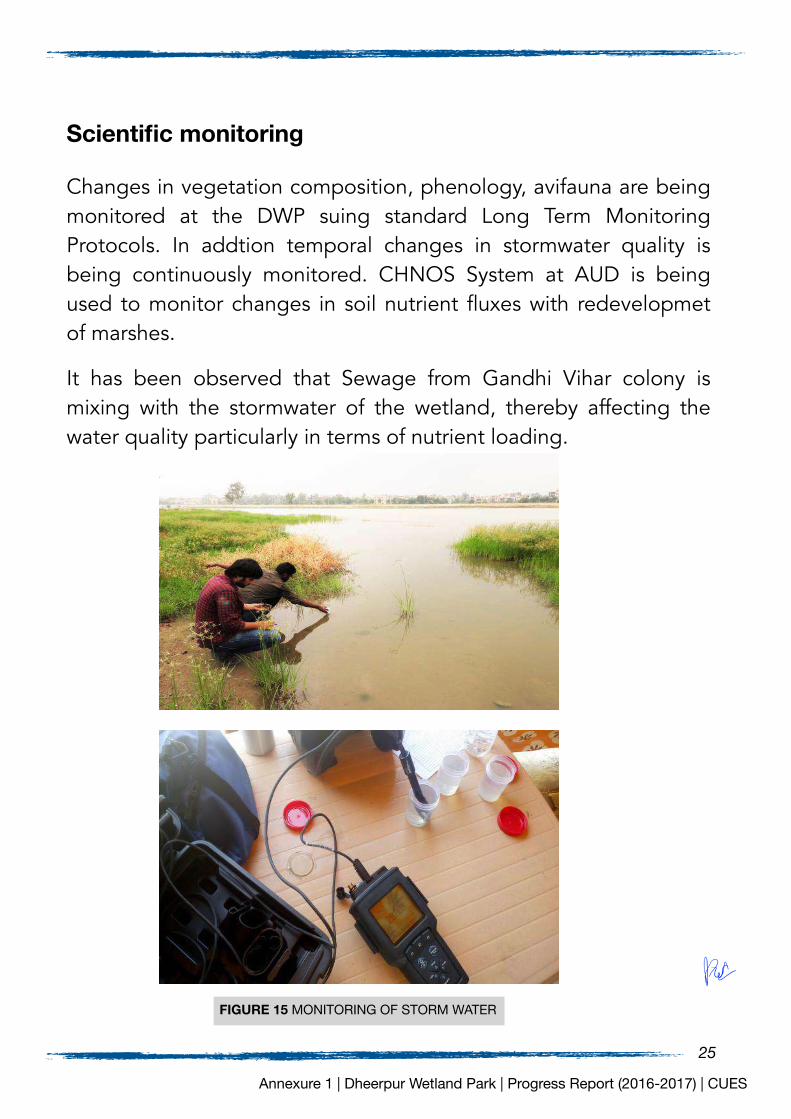
�25
Scientific monitoring
Changes in vegetation composition, phenology, avifauna are being monitored at the DWP suing standard Long Term Monitoring Protocols. In addtion temporal changes in stormwater quality is being continuously monitored. CHNOS System at AUD is being used to monitor changes in soil nutrient fluxes with redevelopmet of marshes.
It has been observed that Sewage from Gandhi Vihar colony is mixing with the stormwater of the wetland, thereby affecting the water quality particularly in terms of nutrient loading.
Annexure 1 | Dheerpur Wetland Park | Progress Report (2016-2017) | CUES
FIGURE 15 MONITORING OF STORM WATER

�26
On-field challenges
Annexure 1 | Dheerpur Wetland Park | Progress Report (2016-2017) | CUES
FIGURE 17 (CLOCKWISE FROM TOP LEFT): (I) CONTINUOUS DUMPING OF DEBRIS, (II) COWS DESTROY THE PLANTATION AT THE SITE ((VI) LEVELING OF WETLAND AREA BY NIRANKARI VOLUNTEERS, (VIII) AGRICULTURAL ACTIVITIES AT THE SITE AND
STRONG PROTEST BY THE CLAIMANT FARMERS, (IX) TREATMENT OF SHALLOW WETLAND WITH LARVICIDES, AND (X) TREATMENT OF DEEP WETLAND WITH LARVIVOROUS GAMBUSIA FISH.

�27Annexure 1 | Dheerpur Wetland Park | Progress Report (2016-2017) | CUES
Table 5 Major ActivitiesPhase I Status Phase II StatusBaseline Survey and Collection of Ecological Data
Completed (CUES)
Creation of Remaining Water Bodies and Mounds
Installation of Bore Wells
Under Process (DDA) Creation of Trails
Construction of Boundary Wall and Installation of Iron Gates
Under Process (DDA)
Construction of Wetland Resource Centre (WRC)
Creation of Field Nursery
Ongoing (CUES)
Construction of Visitor Facilities
Earthwork and Desilting of 3 Waterbodies
To Be Taken Up (DDA)
Installation of Pump House (Semi-Permanent)
Creation of Island To Be Taken Up (DDA)
To Be Taken Up in 2018 –
2019
(DDA)
�

�28Annexure 1 | Dheerpur Wetland Park | Progress Report (2016-2017) | CUES
S. No. Location pH TDS Salinity Conductivity Resisitivity
(in ppm) (in PSU) (in μS/cm) (Ohm-1 cm)
1Deep Wetland Point A
8.77±0 .28
825.767±652. 965
0.912±0. 712
1684.567±133 3.115 868.9±556.4
2Deep Wetland Point B
8.11±0 .07
1506.767±59 6.757
1.657±0. 667
3073.667±121 7.545
370.5±173.886
3 Shallow Wetland
8.41±0 .38
436.567±135. 993
0.488±0. 142 889.8±277.5 1190.133±32
1.8 92
4Tall Grassland
8.05±0 .17
431.033±169. 27
0.474±0. 189
860.2±373.04 9
1346.3±654.939
5Treatment Wetland 3
8.42±0 .1
356.5±42.887
0.404±0. 044
726.567±87.5 65
1390.667±179.8 34
6 Visitor's Pond
6.88±0 .36
4407±1502.9 23
5.091±1. 854
8987.667±306 9.709
119.103±34.578
7Woodland 2 Point A
8.07±0 .25
268.733±114. 195
0.317±0. 114
547.433±233. 553
2174.667±1227. 487
8Woodland 2 Point B
7.69±0 .21
493.033±413. 397
0.553±0. 435
1005.467±844 .184
1542±1057.283
9Woodland 2 Point C
7.67±0 .2
424.667±233. 569
0.509±0. 208
860.867±468. 701
1392.367±1195 62768
10 WRC Pond
8.27±0 .37
121.167±14.9 91
0.169±0. 015 246.3±30.583
4107.667±509.2 7
Appendix - I
Soil data of Deeper Wetland
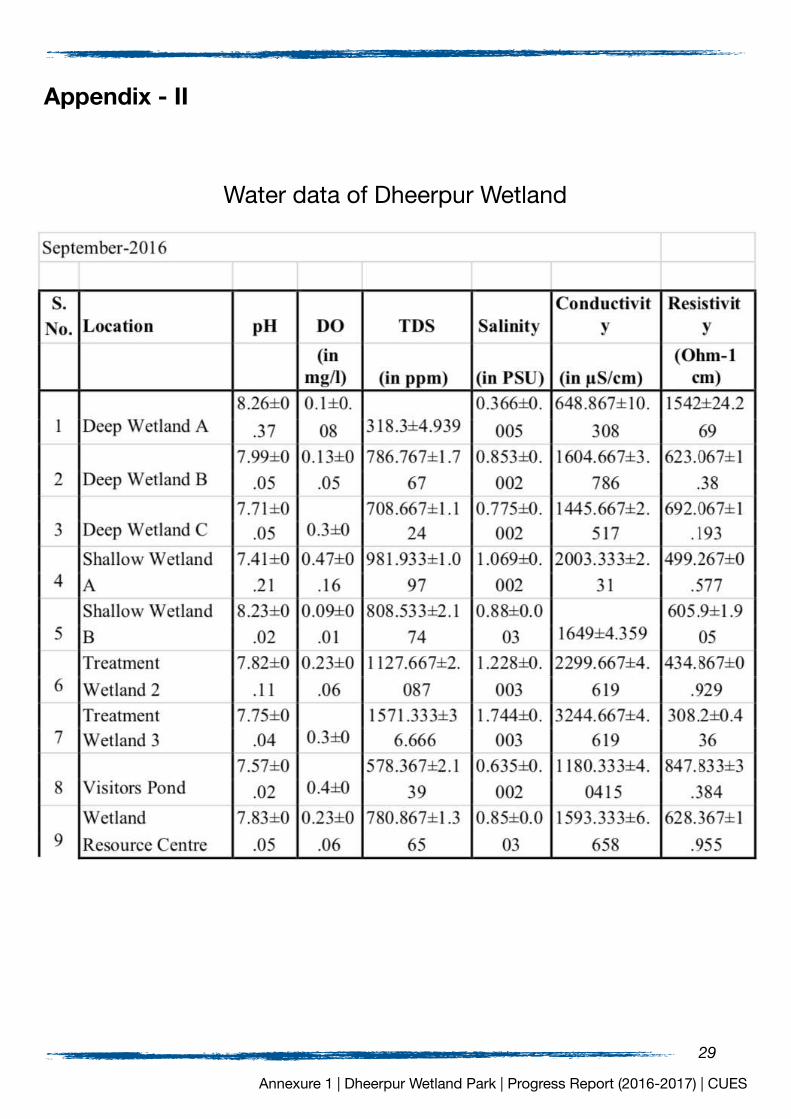
�29Annexure 1 | Dheerpur Wetland Park | Progress Report (2016-2017) | CUES
Appendix - II
Water data of Dheerpur Wetland

�30Annexure 1 | Dheerpur Wetland Park | Progress Report (2016-2017) | CUES
Research Team
Dr. Suresh Babu (Director, CUES)
Ajay Immanueal Gonji
Amit Kaushik
Shashank Bhardwaj
Sonali Chauhan
Vijaylakshmi Suman
Amol Padwad