CASIMOD’N: An agro-hydrological distributed model of catchment-scale nitrogen dynamics integrating...
11
CASIMOD’N: An agro-hydrological distributed model of catchment-scale nitrogen dynamics integrating farming system decisions Pierre Moreau a,b , Laurent Ruiz a,b , Françoise Vertès a,b , Christine Baratte b,c , Luc Delaby b,c , Philippe Faverdin b,c , Chantal Gascuel-Odoux a,b , Benoit Piquemal b,c , Eric Ramat d , Jordy Salmon-Monviola a,b , Patrick Durand a,b,⇑ a INRA, UMR1069, Sol Agro et hydrosystème Spatialisation, F-35000 Rennes, France b Agrocampus Ouest, F-35000 Rennes, France c INRA, UMR1348, Physiologie, Environnement et Génétique pour l’animal et les systèmes d’élevage, F-35590 Saint-Gilles, France d ULCO, UPRES EA 4029 Laboratoire d’Informatique du Littoral, F-62228 Calais, France article info Article history: Received 10 February 2012 Received in revised form 13 February 2013 Accepted 20 February 2013 Available online 9 April 2013 Keywords: Farming system Diffuse pollution Nitrogen Agro-hydrological modelling abstract This work presents the new integrative model CASIMOD’N (Catchment and Agricultural Systems Inte- grated MODel for Nitrogen), which assesses effects of farming systems on nitrogen (N) dynamics at the catchment level. Its main innovation is the consideration of the level of the farming system through production strategies, farmer decisions and the expression of decisions as management practices, along with the link between these farming systems, their practices and water pollution. CASIMOD’N integrates farming systems at the farm level and N transfers and transformations at the field, farm and catchment levels. It was built by adapting and combining three models: the catchment-scale biophysical model TNT2 and two farm-scale models, TOURNESOL and FUMIGENE, for the allocation of land use and manure, respectively. The intrinsic logic behind farming system design and function was represented by ensuring agreement between livestock-feeding and manure-management strategies under specific farm con- straints (land fragmentation, distance between fields and farmyards) and agronomic rules. The model is able to simulate management practices (crop, manure and mineral fertiliser allocation). An assessment of the farming system modelling was performed by comparing the management prac- tices simulated with CASIMOD’N with (i) observed data from a livestock-oriented catchment and (ii) a reference dataset of management practices reconstructed with a Markov chain and Knapsack-based algo- rithm. Then, the spatial distributions of the main N fluxes at the sub-catchment scale simulated with CASIMOD’N and based on the reconstructed management practices are discussed. Simulations of the two options had few differences in spatial distribution of the main N compartments, organic and mineral fertilisation and N flux at the outlets both at catchment and sub-catchment levels. However, CASIMOD’N was more accurate for simulating farming systems than the reconstructed refer- ence dataset of management practices. This suggests that CASIMOD’N can be used to conceive, imple- ment and assess prospective scenarios involving farming system redesign. Ó 2013 Elsevier Ltd. All rights reserved. 1. Introduction Increases in nitrogen (N) emissions in ground and surface waters due to intensive agriculture have been widely reported (Bil- len et al., 2005; Cinnirella et al., 2005) and are often associated with eutrophication (Jarvie et al., 2005) and health issues (Koo and O’Connell, 2006). The European Union (EU) stated that all water bodies shall recover a ‘‘good and non-deteriorating’’ ecolog- ical status by 2015 (Water Framework Directive (EC, 2000)), which requires thorough understanding of the causal chain linking farm- ing activities to water pollution. To encompass the entire chain and find ways to adapt farming systems to new environmental objectives, it is essential to consider both anthropogenic and biophysical systems and their interac- tions. A farming system is defined as an anthropogenic decision system in interaction with a biotechnical system (Gibon et al., 1999; Gouttenoire et al., 2010). Farmers’ decisions are driven by their production objectives, and production strategies aim to sat- isfy these objectives. The set of farmer decisions is expressed as management practices (Dedieu et al., 2008): crop allocation (crop succession and spatial distribution), manure allocation (waste type, rates, spreading dates and receiving crops) and mineral fertiliser allocations (rates, spreading dates and receiving crops). 0308-521X/$ - see front matter Ó 2013 Elsevier Ltd. All rights reserved. http://dx.doi.org/10.1016/j.agsy.2013.02.007 ⇑ Corresponding author. Address: INRA, UMR1069, Sol Agro et hydrosystème Spatialisation, 65 rue de Saint Brieuc – CS 84215, 35042 Rennes Cedex, France. Tel.: +33 (0) 2 23 48 54 27; fax: +33 (0) 2 23 48 54 30. E-mail address: [email protected] (P. Durand). Agricultural Systems 118 (2013) 41–51 Contents lists available at SciVerse ScienceDirect Agricultural Systems journal homepage: www.elsevier.com/locate/agsy
-
Upload
independent -
Category
Documents
-
view
0 -
download
0
Transcript of CASIMOD’N: An agro-hydrological distributed model of catchment-scale nitrogen dynamics integrating...

Agricultural Systems 118 (2013) 41–51
Contents lists available at SciVerse ScienceDi rect
Agricultur al System s
journal homepage: www.elsevier .com/locate /agsy
CASIMOD’N: An agro-hydrological distributed model of catchment-scale nitrogen dynamics integrating farming system decisions
0308-521X/$ - see front matter � 2013 Elsevier Ltd. All rights reserved. http://dx.doi.org/10.1016/j.agsy.2013.02.007
⇑ Corresponding author. Address: INRA, UMR1069, Sol Agro et hydrosystèmeSpatialisation, 65 rue de Saint Brieuc – CS 84215, 35042 Rennes Cedex, France. Tel.: +33 (0) 2 23 48 54 27; fax: +33 (0) 2 23 48 54 30.
E-mail address: [email protected] (P. Durand).
Pierre Moreau a,b, Laurent Ruiz a,b, Françoise Vertès a,b, Christine Baratte b,c, Luc Delaby b,c,Philippe Faverdin b,c, Chantal Gascuel-Odoux a,b, Benoit Piquemal b,c, Eric Ramat d,Jordy Salmon-Monviola a,b, Patrick Durand a,b,⇑a INRA, UMR1069, Sol Agro et hydrosystème Spatialisation, F-35000 Rennes, France b Agrocampus Ouest, F-35000 Rennes, France c INRA, UMR1348, Physiologie, Environnement et Génétique pour l’animal et les systèmes d’élevage, F-35590 Saint-Gilles, France d ULCO, UPRES EA 4029 Laboratoire d’Informatique du Littoral, F-62228 Calais, France
a r t i c l e i n f o a b s t r a c t
Article history: Received 10 February 2012 Received in revised form 13 February 2013 Accepted 20 February 2013 Available online 9 April 2013
Keywords:Farming system Diffuse pollution NitrogenAgro-hydrological modelling
This work presents the new integrative model CASIMOD’N (Catchment and Agricultural Systems Inte- grated MODel for Nitrogen), which assesses effects of farming systems on nitrogen (N) dynamics at the catchment level. Its main innovation is the consideration of the level of the farming system through production strategies, farmer decisions and the expression of decisions as management practices, along with the link between these farming systems, their practices and water pollution. CASIMOD’N integrates farming systems at the farm level and N transfers and transformations at the field, farm and catchment levels. It was built by adapting and combining three models: the catchment-scal e biophysical model TNT2 and two farm-scale models, TOURNESOL and FUMIGENE, for the allocation of land use and manure, respectively. The intrinsic logic behind farming system design and function was represented by ensuring agreement between livestock-feedin g and manure-manageme nt strategies under specific farm con- straints (land fragmentation, distance between fields and farmyards) and agronomic rules. The model is able to simulate management practices (crop, manure and mineral fertiliser allocation).
An asses sment of the farming system modelling was performed by comparing the management prac- tices simulated with CASIMOD’N with (i) observed data from a livestock-oriented catchment and (ii) areference dataset of management practices reconstructed with a Markov chain and Knapsack-based algo- rithm. Then, the spatial distributions of the main N fluxes at the sub-catchment scale simulated with CASIMOD’N and based on the reconstructed management practices are discussed.
Simulations of the two options had few differences in spatial distribution of the main N compartments, organic and mineral fertilisation and N flux at the outlets both at catchment and sub-catchment levels. However, CASIMOD’N was more accurate for simulating farming systems than the reconstructed refer- ence dataset of management practices. This suggests that CASIMOD’N can be used to conceive, imple- ment and assess prospective scenarios involving fa rming system redesign.
� 2013 Elsevier Ltd. All rights reserved.
1. Introduction requires thorough understa nding of the causal chain linking farm-
Increases in nitrogen (N) emissions in ground and surface waters due to intensive agriculture have been widely reported (Bil-len et al., 2005; Cinnirella et al., 2005 ) and are often associated with eutrophicati on (Jarvie et al., 2005 ) and health issues (Kooand O’Connell, 2006 ). The European Union (EU) stated that all water bodies shall recover a ‘‘good and non-deterio rating’’ ecolog- ical status by 2015 (Water Framework Directive (EC, 2000 )), which
ing activities to water pollution. To encompas s the entire chain and find ways to adapt farming
systems to new environm ental objectives, it is essential to consider both anthropoge nic and biophysical systems and their interac- tions. A farming system is defined as an anthropoge nic decision system in interactio n with a biotechnica l system (Gibon et al., 1999; Gouttenoire et al., 2010 ). Farmers’ decisions are driven by their production objectives, and production strategie s aim to sat- isfy these objectives. The set of farmer decisions is expresse d as managemen t practices (Dedieu et al., 2008 ): crop allocation (cropsuccession and spatial distribut ion), manure allocation (wastetype, rates, spreading dates and receiving crops) and mineral fertiliser allocation s (rates, spreading dates and receiving crops).

42 P. Moreau et al. / Agricultural Systems 118 (2013) 41–51
Systemic integrati on requires paying specific attention to interac- tions between decisions and biophysi cal systems (Gouttenoireet al., 2010 ), making the farming system a ‘‘finalised biophysical and managed’’ system (Dedieu et al., 2008 ).
When the regional scale is adapted to assess the effects of macro-econom ic drivers, the catchment, sometimes referred to as a mesoscale (Breuer et al., 2008 ), is a relevant scale for addressing water-quali ty-management issues (Gourbesville, 2008 ). Both the catchment and farm scales include the field scale, where manage- ment practices from farmer decisions drive and interact with bio- physical and biogeochemica l processes. At the catchmen t scale, it is crucial to consider the spatial distribution of managemen t prac- tices and interactions between farming systems and environm en- tal resources and constraints (Sorel et al., 2010 ).
Models are powerful tools for understand ing the effect of man- agement practices at the catchment scale by simulating scenarios (Cugier et al., 2005; Servais et al., 2007 ) and are used to support decision (Horn et al., 2004; Gascuel-Odoux et al., 2009 ), to assess options of mitigations (Wilkinson and Eidinow, 2008 ; Salmon-Monviola et al., 2011 ) and/or to share common understanding (Sterk et al., 2011 ).
Many biophysical models, such as SWAT (Arnold et al., 1998 ),SHETRAN (Birkinshaw and Ewen, 2000 ), TNT2 (Beaujouan et al., 2001, 2002; Oehler et al., 2009 ), and DNMT (Liu et al., 2005 ) oper- ate at the catchment scale and aim to simulating the effect of man- agement practices, considered as input variables of the models on N transfers and transformation s. In these models, farming systems and in particular farmer decisions are not explicitly represented .Several models simulate farming systems, such as IFSM (Corsonet al., 2007; Rotz et al., 2011 ), WFM (Wastney et al., 2002 ), FASSET (Jacobsen et al., 1998; Hutching s et al., 2007 ), LSM and WFM (Mat-thews et al., 2006a,b ), but they generally predict N losses at the field scale (1-D model) and do not consider the effect of spatial characterist ics in an agricultural region, such as field location and distribution of soil properties. Ignoring interactions between the farmer decision system and biotechn ical systems may oversimplify descriptions of farming systems. In areas with high livestock pro- duction density generating high nutrient fluxes, many farmer deci- sions concern livestock-feedi ng and manure managemen t(Chardon, 2008 ); therefore, the influence of farm spatial structure on farmer decisions is important. Consequently, it is essential to integrate explicitly farming system functioning and N transfers and transformation s at the catchment scale. Few attempts to de- velop models in this direction have been performed. One model, LANAS (Theobald et al., 2004 ), integrates farm modelling into an agro-hydrol ogical model at the catchment scale (INCA, Whiteheadet al., 1998 ) but remains semi-distribut ed. The NITROSCAPE project (Duretz et al., 2011 ) also aims to combine farm and catchment sys- tems, but farming practices are defined at the field scale and only avirtual catchment has been assessed so far. Most recently, the CSAM (Cropping Systems Allocation Model) was developed to con- struct data base of managemen t practices at field scale for produc- ing environm ental results at catchment scale (Salmon-Monviol aet al., 2012 ). This database constitutes a reference set of manage- ment practices reconstru cted with a Markov chain and Knapsack -based algorithm.
The objective of this paper is to present a new integrative mod- el, CASIMOD’N (Catchment and Agricultural Systems Integrated MODel for Nitrogen) that aims to quantify ex ante the effect of agricultural policy on N fluxes, while explicitly considering the faming-syst em level. CASIMOD’N combines farming system mod- elling (via production strategies, farmer decisions and their expres- sion as management practices) and N fluxes at the catchmen t scale. To evaluate the accuracy of CASIMOD’N , we compare d its predic- tions of management practices with either (i) managemen tpractices observed from surveys or (ii) managemen t practices sta-
tistical reconstructed with CSAM. The spatial distribution of the main N fluxes obtained with managemen t practices issued from CSAM and CASIMOD’N in several sub-catchm ents was then assessed .
2. Material and methods
2.1. Descriptio n of CASIMOD’N
CASIMOD ’N simulates N transfers and transformat ions at the catchmen t scale while ensuring farming system consisten cy by integrati ng farmers’ production strategie s and their subsequent managemen t practices. CASIMOD’N results from adapting and combinin g three models: the agro-hydrologi cal model TNT2, which simulates all N fluxes at the catchmen t scale (Beaujoua n et al., 2002), and two decision- making models that simulate farming sys- tem managemen t at the farm scale, TOURNESOL (Garcia et al., 2005) and FUMIGEN E (Chardon et al., 2008 ).
TNT2 is process-b ased and spatially distribut ed to account for potential spatial interactions such as nitrate leached upslope and its effect on lowland uptake or bottomland denitrification (Oehleret al., 2009 ). It represents crop growth and nitrogen transformat ion based on the plant-soil model STICS (Brisson et al., 1998 ). In TNT2, field managemen t practices are input data.
TOURNESO L and FUMIGENE introduce the farming system level into CASIMOD ’N. They have already been applied independently with detailed datasets to two farms (Chardon et al., 2008 ) and to one experimental farm (Garcia et al., 2005 ), respectively. Both models are planning models by optimisation and determine, once a year, the managemen t practices to apply to each field in the com- ing year. TOURNESOL produces a crop allocation plan and FUMI- GENE a manure allocation plan to fulfil the objectives of each farming system, given farmer constraints. These plans ensure con- sistency between expected livestock-feed requiremen ts and man- ure and crop production under a set of agronomic rules (effect of crop successions, minimum and maximum durations for perennia lcrops, and prioritisation of crop-manure pairs) and a set of con- straints. The constraints concern farmland structure (land frag- mentation, field distance from the farmstead and for each field,the possibility of being grazed by dairy cows or of receiving man- ure), machiner y (minimum and maximum application rates), fields(soil agronomic potential ) and regulations (prohibitions on loca- tions or periods of manure spreadin g).
TOURNESO L inputs include expected livestock-feed require- ments as a function of dairy or suckler production and livestock- feeding strategy. Livestock-fe ed requiremen ts (e.g. silage or grazed grass, maize and straw) are determined (t of dry matter) for differ- ent animal types (milking cows, sucklers and heifers) (Table 1).Next, positive fictive prices are given to surpluses, and negative ones to deficits, of each livestock feed. The fictive prices prevent optimisa tion only on an economic basis and are used to represent farmer priorities . For instance, if a farmer aims for forage self-suf- ficiency, fictive prices exceed the market price for forage deficits,whereas if forage self-sufficiency is not a priority, fictive prices equal observed market prices (Chardon et al., 2007 ). The crop-allo -cation plan integrates livestock-feed requiremen ts and farmers’ priorities . The objective function considers the sum of the values of all livestock feeds’ surpluses or deficits and is maximised during the optimisa tion procedure. The optimisatio n procedure is based on a genetic algorithm: an initial population of several crop-allo ca- tion plans is randomly generated, and characteri stics of plans with the highest scores of the objective function are selected to generate the next set of crop-allo cation plans, until the algorithm converge sto an optimal crop-allocation plan. Thus, a crop-allocati on plan is selected that satisfies expected livestock-feed requiremen ts and farmers’ priorities and ensures that potential crop requiremen ts

Table 1Farm inputs for CASIM OD’N.
Input category
Data required
General strategy
Type(s) of livestock production (dairy, suckler, pig, poultry)Herd characteristics (size, breed, productivity, animals per age class)Livestock requirements for silage maize Livestock requirements for silage and grazed grass Livestock requirements for straw Cash crops (types, production)Fictive prices associated with surpluses and deficits of livestock feeds according to livestock-feed requirements
Manure Type (cattle manure, cattle slurry, pig slurry, poultry manure)Nitrogen content Prohibition on spreading periods (priority from 0 to 1)Prohibition on spreading locations Maximum number of applications per crop Prioritisation of crop-manure pairs (priority from 0 to 1)Minimum and maximum manure rates by application
Crop Crop type Potential yield Minimum and maximum durations in years for perennial crops Minimum return period
Field Spatial distribution Area Farmstead location Accessibility for dairy cows Maximum distance for manure spreading (priority from 0 to 1)Soil agronomic potential
P. Moreau et al. / Agricultural Systems 118 (2013) 41–51 43
for organic N are consistent with the expected amount of manure to be spread.
While TOURNESOL checks for general consistency between the crop-allocati on plan and the amount of manure produced, FUMI- GENE performs the specific planned allocation of organic manure and mineral fertiliser (Chardon et al., 2008 ). TOURNESOL and FUMIGENE are therefore used in sequence .
FUMIGENE annually simulates the manure allocation plan at the beginning of each cultivation year by consideri ng the agro- nomic potential of each field, crop requiremen ts and manure- spreading rules. Estimation of crop requiremen ts integrates ex- pected yields and the field history (mineralisation of soil organic matter or previously applied manure, mineralisation following grassland ploughing). Manure allocation is performed with a lin- ear programming procedure that aims to match the production strategy and farmer decisions by respecting the set of agronomi crules and constraints. Farmer decisions are input as a set of pri- orities to select a solution among the infinity of possible quanti- tative options. Priority values range from 0 to 1 (with 1 = high priority) for each field to indicate the acceptab ility of a manure application on the field, based on the distance between each field and the farmstea d and on the ban on spreading locations. Priority values from 0 to 1 are also given to each crop-manure pair. Crop allocation is simulated by TOURNESO L: a priority va- lue for each field-manure pair can be calculated by multiplyi ng the priority values for field and crop-manure. The solution to the linear programming problem should maximise accordance with this set of priorities , i.e. maximise the priority at which each unit (t or m3) of waste is applied (Chardon et al., 2008 ).Finally, the difference between crop requirements and the quan- tity of N applied in manure, if any, is complemen ted by mineral fertiliser applicati on. Thus, FUMIGENE annually attributes to every field the type, rate and timing of manure spreading and the rate and timing of mineral fertiliser spreading. Further details on FUMIGENE and its applicati on can be found in Chardon et al. (2008).
The VLE (Virtual Laboratory Environment) framework (Ques-nel et al., 2009 ) was chosen to combine TNT2, TOURNESOL and FUMIGEN E within the RECORD platform (Bergez et al., 2009 ).This framewor k, based on discrete event systems specifications(DEVS) formalism (Zeigler et al., 2000 ), provides a complete software environment for modelling, simulating and analysing complex systems by adapting and combining pre-existi ng mod- els. In this specific case, the VLE framework facilitated the impleme ntation, hierarchical organisation and multiplication of atomic components (the farms) of the system. TNT2 was encap- sulated so that modelling the distributed processes remained unchanged. VLE was used to handle the different temporal res- olutions of the combined models by building temporal loops accordin g to DEVS concepts (Fig. 1). An intermediate module (ITK Scheduler ) converts the TOURNESOL- FUMIGENE outputs into managemen t-practice events, input daily to each TNT2 fieldunit. This step associates TOURNESOL-FUM IGENE outputs with generic annual sets of managemen t practices with fixed dates and varying fertilisation rates. The modularity of the coupling architecture makes it possible to use different component mod- els, if required.
2.2. Case study and data for assessing CASIMOD’N
2.2.1. Study site CASIMOD ’N was tested on the Yar catchment, Brittany (western
France), which is devoted mainly to livestock production (Moreauet al., 2012a ). Of its 60 km 2, 64% is agricultural area (AA), 28% is woods and 8% is urban. The climate is humid temperate with mean annual temperature of 11.7 �C and mean annual rainfall of 950 mm. The Yar is the largest catchment of five coastal catch- ments (120 km 2 total area) feeding the Lieue de Grève Bay. The Yar catchment accounts for 51% of the total area and 59% of N–NO3 loads into the bay (SCE, 2010 ) and comprises 10 sub-catch- ments (Fig. 2). Despite moderate nitrate concentr ations in coastal streams (approximately 6.7 mg N–NO3 l�1), this bay has been se- verely affected by ‘‘green tides’’ (blooms of macroalgae Ulva sp.)since the 1970s, and health concerns have been raised from the H2S produced following accumulation and decompositi on of algae on the shore (Briand and Morand, 1997 ). Algae proliferation was identified as being controlle d by N loads (Menesguen and Piriou, 1995), and the nitrate concentration necessary at the outlet of the Yar to halve algal bloom frequency was estimated at approxi- mately 1.9 mg N–NO3 l�1 (Menesguen, 1999 ). In this context, deci- sion-mak ers and farmers have been asked to define innovative farming systems, which encourages development of models for ex ante evaluation of agricultural policy encompassing both farm and catchment scales.
2.2.2. Observed and reconstructed management practices To provide input data and assess model predictions, three data-
sets were used:
– Data on farming systems and their managemen t practices from extensive farm surveys.
– Land use for 1996–2006 from remote sensing data. – A reference dataset of managemen t practices reconstru cted
with CSAM.
Survey data on the farming systems themselv es were used as input data, while the observed dataset (survey data on the man- agement practices, remote sensing data) and the reconstru cted dataset were used to assess CASIMOD’N predictions.
The farm survey was conducted in 2006 on 110 of the 194 farms operating in the five Lieue de Grève catchments (120 km 2), con- cerning 77.5 km 2 of AA (91% of total AA). Among these 110 farms,

Fig. 1. Diagram of the CASIMOD’N model and its implementation in the Virtual Laboratory Environment (VLE).
Fig. 2. Map of the Yar hydrographic network and location of its 10 sub-catchments.
44 P. Moreau et al. / Agricultural Systems 118 (2013) 41–51
57 have at least one field in the Yar catchment, thus the surveyed area was 62% of the Yar’s AA. Fifty-four of the 57 farms were cattle farms, 4 were mixed systems (2 each of pig and poultry production), while the remaining 3 specialised in arable crops or
vegetable s. Grasslands occupied 50% of the AA, followed by winter cereals (22% of AA) and maize (18% of AA), while other crops (rape-seed, potatoes) were marginal. The declared duration for tempo- rary grasslands ranged from 3 to 8 years.
Input data on the farming systems from the surveys were (i)production type; (ii) herd characterist ics (number of animal, breed, productivi ty, animals per age class) and herd managemen t (age of first calving, pasture managemen t); (iii) feeding strategy and live- stock-fee d requiremen ts and (iv) buildings, crop yields, field distri- bution and field accessibility. Data from the survey concerning managemen t practices were (i) rate of mineral fertilisers used, (ii) rates and types of manure and receiving crops and (iii) crop dis- tribution in 2006.
The potential crop production for each field was determined from a soil map (BDAT, 2011 ), as was the proportion of poorly drained soil in each field (Aurousseau and Squividant, 1996 ). Re- mote sensing identified a total of 4620 field units (a field or portion of one with a unique crop succession) from 1996 to 2007 (Corgne,2004). A field divided into two or more parts with different crops in a given year was thus considered as two or more field units. This definition of field units considers the flexibility of farmer decisions when developing a crop-allo cation plan.
With data from surveys and remote sensing observations com- bined, the number of field units identified as belonging to a partic- ular farm decrease d to 2241, which constituted the observed dataset on crop allocations. This dataset was supplem ented by additional remote sensing data of summer and winter images of 1996–2006 that allowed us to assign the observed successions of three main crop categories to each field unit: grasslands (perma-nent and temporary), spring crops (maize, potatoes, beets and peas) and winter crops (wheat, barley, oat, triticale and rapeseed).Thus, the observed input dataset comprised crop areas and

P. Moreau et al. / Agricultural Systems 118 (2013) 41–51 45
managemen t practices (2006) and crop successions (1996–2006)at farm and field scales.
A second dataset of the crop succession and managemen t prac- tices was used as a reference dataset to assess CASIMOD’N. This dataset was reconstructed with CSAM, which has been extensive ly used in previous TNT2 modelling applicati ons (Durand et al., 2006, 2008; Moreau et al., 2012a,b ). CSAM is designed for cases when ob- served data on management practices are scarce or unavailable at the field scale. First, crop successions are reconstructed at the fieldscale with a first-order Markov-chain approach, represented by atransition matrix (Cox and Miller, 1965 ). On each field, the proba- bility of a given crop occurrence for a given year depends only on the type of crop present during the previous year. The transition matrix can be built from an observed rotation dataset by convert- ing the observed transition frequenc y into a probability (Weng,2002). The transition matrix used with CSAM is adjusted so that crop areas are constant over the years and farm crop areas within and outside catchment limits are respected. Second, the manage- ment practices concerning the N-fertiliser applications and their allocation are reconstructed at the field scale with a Knapsack- based algorithm (Salmon-Monvi ola et al., 2012 ). From information on managemen t practices per crop and on the percentage of each crop type required to apportion the rates of organic and mineral N available on the farms, management practices are assigned to every field. Thus, allocations of managemen t practices are recon- structed on each field for each year. More detail on CSAM is avail- able in Salmon-Monvi ola et al. (2012). The reconstru cted dataset in the present study refers to the adjusted Markov-chai n approach (AMC) when crop allocations are assessed or to CSAM when man- agement practices are considered.
2.3. Comparison criteria
CASIMOD’N simulates N transfers in the catchment while accounting for (i) managemen t practices, especiall y the reproduc- tion of allocation plans for crops, manure and mineral fertiliser and (ii) the farming system and production strategies, especially livestock-feed ing strategies. To assess the results of CASIMOD’N ,especially for modelling of the farming systems, predictions of sim- ulations for 1996–2006 were compared to both observed and reconstructed datasets.
2.3.1. Crop and manure allocation Three indicators were selected to assess the model’s ability to
predict crop allocation. First, the predicted mean area per crop and per farm were cal-
culated for the 10-year simulation period and compared to the ob- served area per crop. The standard deviation of each predicted crop area per farm was calculated over this 10-year period.
Second, a crop-allocation criterion (CAC) was used to assess the model’s ability to predict crop successions in time and space for each field. We adapted the criterion of Pontius et al. (2004) to as- sess the spatial distribution of predicted crop successions by including the temporal scale. The CAC allowed also comparing AMC and CASIMOD’N’s ability to simulate crop allocation. The CAC is calculated by comparing predicted crop-allocati on maps to observed ones. The score ranges from 0 to 1, 1 being an exact reproduction of the observed map. The CAC is calculated as follows:
CAC ¼PN
n¼1Wn½PJ
j¼1�minðOnj; PnjÞPN
n¼1Wnð1Þ
where j is the type of crop, J the number of crop types, n the fieldunit index, N the total number of field units, Wn the field unit area,
and Onj and Pnj the frequen cy of crop j in the field unit n in the ob- served and predicted maps, respective ly.
In the present work, CAC scores obtained with models (CACm)are denoted (CACm-Cas) when using CASIMOD ’N and (CACm-Mar)when using AMC. To assess the model’s ability to predict crop allo- cation, CAC m scores were compared to those obtained with a ran- dom model (CACr), which randomly allocated crops among fieldunits. For CAC r, Pnj was calculated randomly with a
PSnj = 1 for
each field unit. Given that randomness had already been produced by distributing crop frequenc y, replicates were not performed. Amodel is considered to provide additional predictive power when CACm > CAC r.
Third, a transition matrix was calculated from predicted crop allocation s with CASIMOD ’N. This transition matrix and the transi- tion matrix from AMC were compare d to that observed to evaluate predicted crop allocation, not only crop frequency per field but also two-year crop successions.
For manure allocation, the predicted rates and locations of spread manure were assessed for each farm by comparing simu- lated and observed proportions of the total AA receiving manure. The predicted rates of mineral fertiliser were also compared to those observed.
2.3.2. Production strategy In CASIMOD’N, the production strategy of each farm was de-
fined accordin g to the farmer’s objectives for milk production and herd characteristics. To reach them, the model attempted to satisfy livestock requirements for forage and straw and considered farmer priorities , especiall y regarding distances from livestock buildings to fields, which influences pasture and manure manage- ment. Cereal areas were considered to cover some of the straw requiremen ts and to provide income (cash crops). To assess consis- tency between the production strategy and managemen t practices, the satisfaction of livestock-feed requiremen ts (input) by produc- tion from predicted crop allocation was assessed. Under- or overes- timating livestock-feed requiremen ts would reveal inaccurate representat ion of the production strategy in the farm portion of CASIMOD ’N.
Predicted potential production (t of dry matter per farm) was calculated as the product of potential yields and their correspond- ing areas in the farm portion of CASIMOD’N (not by the yields pre- dicted by TNT2 crop modelling) and grouped into four types: grass production (silage and grazed), maize silage production, straw pro- duction from cereals, and cumulative grain production from cere- als, rapeseed and maize to address cash crops.
Assessment of the planning of manure spreading consisted of ensuring that the plan was effectively simulated for each farm based on its sets of agronomic rules and constraints for every year of the simulatio n period. In case of a mismatch between the rates of manure to be managed, the crop-allocati on plan, or the sets of agronomi c rules and constraints, a flag was raised in the model and the manure- allocation plan was not simulated . This flag indi- cated there was no possible solution satisfying the production strategy and farmer decisions.
Thus, consistency of the simulated farming systems can be as- sessed through (i) reproduction of managemen t practices (cropallocation s, manure and mineral-fertiliser allocation), defined as the expression of the production strategy and farmer decisions, (ii) the satisfaction of livestock-feed requirements by predicted fodder-cr op allocation and production and (iii) the ability to simu- late manure allocation to crops every year for every farm.
2.3.3. Catchment N transfers Simulation of N transformation and transfer with CSAM-TNT2
and CASIMOD’N were compared for the Yar catchment and its 10 sub-catchment s (Fig. 2). CASIMOD ’N predictions of farming

a
b
46 P. Moreau et al. / Agricultural Systems 118 (2013) 41–51
systems and strategies were compare d to those of TNT2, in which managemen t practices were reconstructed with CSAM. The Ntransformat ion and transfer model was the same in both models. In a previous study (Moreau et al., 2012b ), TNT2 calibration was performed mainly for parameters related to soil physical proper- ties and evaluated with observed discharge and N fluxes at the out- let. The soil parameter dataset remained identical for both models to focus on the spatial distribution of major N pools and fluxes in sub-catchment s of the Yar and on N fluxes at the main outlet and the 10 sub-catchment outlets.
In addition to usual model outputs such as N export by crops and N flux in the stream, soil N balances at the catchment scale were calculated for both CSAM-TNT2 and CASIMOD ’N:
Soil N balance ¼ ðN fertilisation þ N dejection in pasture þ N deposition þ N fixation Þ � ðN export in crops þ N immobilisation in wood þ N denitrification þ N volatilisation Þ þ Dsoil N ð2Þ
Fig. 3. Comparison of observed areas from 2006 surveys and mean areas predicted with CASIMOD’N over the 10-year simulation period for (a) spring and winter crops and (b) temporary and permanent grassland. Vertical bars are standard deviations of predicted areas.
Fig. 4. Crop allocation criteria (CAC) per farm obtained with the adjusted Markov- chain approach (CACm-Mar) and CASIMOD’N (CACm-Cas) versus CAC obtained with random crop allocation (CACr).
3. Results
3.1. Assessment of predicted managemen t practices
3.1.1. Crop areas The observed and predicted areas occupied by the four main
crop types (permanent and temporary grasslands, spring and win- ter crops) were compared for the 57 farms in the Yar catchment (Fig. 3).
Predicted mean areas were similar to those observed for both permanent (r2 = 0.99) and temporary grasslands (r2 = 0.94), while those of spring crops were slightly overestimat ed (r2 = 0.87) and those of winter crops slightly underestimate d (r2 = 0.92). The farm with the highest spring and winter crop areas, a specialised crop farm without livestock production (few grasslands), had the high- est standard deviation and least accurate predictions of temporary grassland and winter crop areas. This highlights that most farmer decision rules were designed for livestock farms. The areas of the four crop types varied greatly among farms, but less than they did for each farm among the 10 years simulated. For temporary grasslands, standard deviation slightly increased with farm AA. The low standard deviation of predicted areas was consisten t with the observed stability of the catchment’s land uses.
3.1.2. Crop allocation Crop allocations predicted with CASIMOD’N were evaluated
first with the CAC, then with the transition matrix. At the catchment scale, the CAC obtained either with CASI-
MOD’N (CACm-Cas) or with AMC (CACm-Mar) reached 0.71 and 0.65, respectivel y, versus only 0.47 for the random crop allocation CACr (Fig. 4). The results per farm indicated that both the AMC and CASIMOD’N performed better than a random model, except for 1and 3 farms, respectively (Fig. 4). The CAC m-Cas and CAC m-Mar ran-ged from 0.4 to 0.8, and 76% of farms had a higher CAC with AMC than with CASIMOD’N .
For the crop transition matrix, differences between predicted and observed values ranged from 5% to 15%, and 1% to 12% for AMC and CASIMOD’N , respectively (Fig. 5). Transition rates of winter crops following spring crops were over-predic ted, while transition rates of grassland following spring crops were under- predicted more with AMC than with CASIMOD’N . The differenc es between observed and predicted transition rates of a winter crop following a winter crop were higher for AMC than for CASIMOD’N. For the 6 other transition types, the transitions predicted with AMC
were closer to the observed rates than those predicted with CASIMOD ’N.
3.1.3. Manure and mineral fertiliser allocation Mineral N fertiliser rates were adjusted to meet crop require-
ments based on the soil N supply and organic fertiliser spreading since crop yields were known for each farm in the study (from sur- veys). Except for farms applying little mineral fertiliser, predicted rates were close to those observed (i.e. declared) (Fig. 6a). Here

Fig. 5. Differences between predicted and observed main transitions (s: spring crop, w: winter crop, g: grassland, ?: following).
P. Moreau et al. / Agricultural Systems 118 (2013) 41–51 47
again, the specialised crop farm without livestock production was not predicted well, with mineral N use greatly under-pr edicted, due either to under-predicte d potential crop yields or over-pre- dicted soil N supply.
The predicted percentage of agricultural area receiving organic manure (29%) was slightly lower than that observed (33%)(Fig. 6b), particularly on spring and winter crops, while predicted area grassland spread with organic fertiliser was slightly over-pre- dicted. This was probably due to decision rules linked to field size: the fixed minimum fertiliser application rate for organic manure
a
b
Fig. 6. Nitrogen management: (a) mineral N fertiliser per farm observed and predicted with CASIMOD’N and (b) distribution of organic fertiliser over the crop in the entire catchment observed and predicted with CASIMOD’N.
combined with consideration of spatial units smaller than existing fields prevents spreading on small field units in the simulation, while in reality this is possible in the case of adjacent fields with the same crop.
The rate of manure spreading was an input at the farm scale (i.e.observed ), while CASIMOD’N simulated only the fields inside the catchmen t. The differenc e between observed organic N rate con- sidering all farms’ agricultural area and that predicted considering only their fields within the catchment was small (Fig. 7a). How- ever, comparing organic N fertilisation at the farm scale computed with CSAM and that predicted with CASIMOD’N showed low vari- ability in organic fertilisation rate when the farm scale was not explicitly considered (Fig. 7b).
3.2. Predicted production strategy
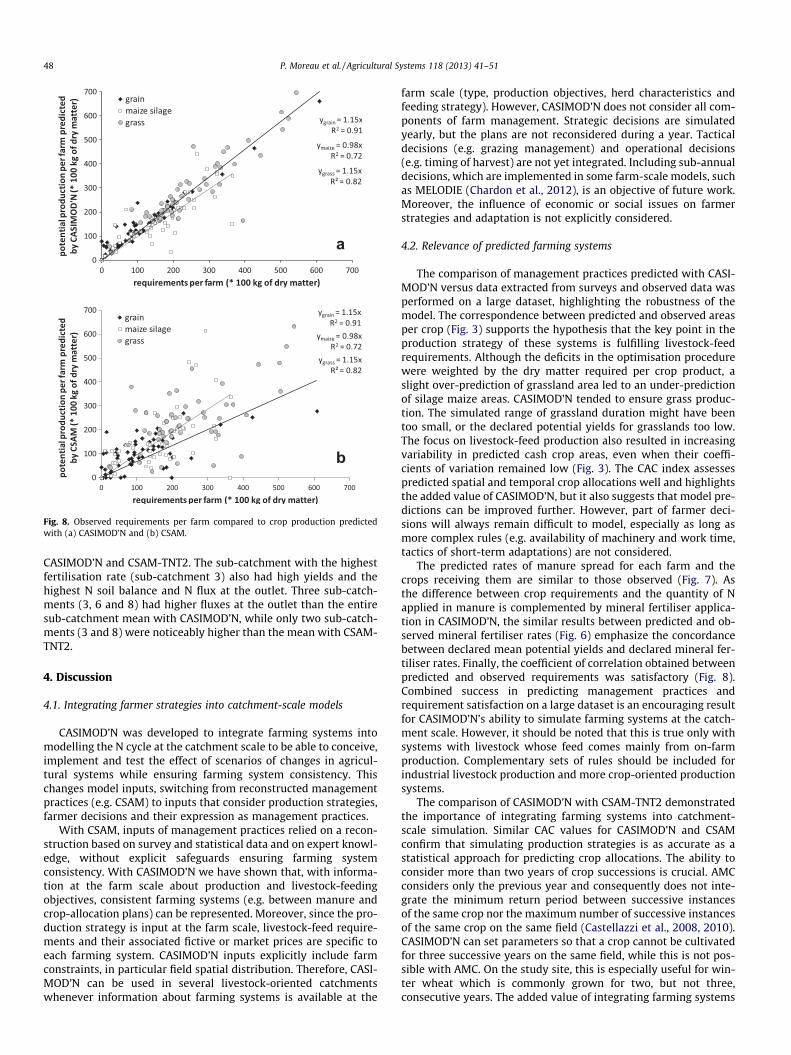
The production predicted with CASIMOD’N matched livestock- feed requiremen ts (Fig. 8a), with r2 ranging from 0.72 to 0.91, while the correlation between predicted production and live- stock-fee d requiremen ts was weak with CSAM (Fig. 8b), with r2
from 0.02 to 0.41. Except for a slight deficit of maize silage, live- stock-fee d requiremen ts were satisfied with CASIMOD’N but not with CSAM, with some farms not producing maize silage or grain.
3.3. Predicted N pools and fluxes at catchmen t and sub-catchm ent scales
Spatial differences between CASIMOD ’N and CSAM-TNT2 pre- dictions of main N pools and fluxes between the sub-catchm ents were quantified as percentage differences from the entire catch- ment mean (Fig. 9). These percentage differenc es were similar for
a
b
Fig. 7. Per-farm rates of organic N fertilisation (a) observed (i.e. declared) and predicted with CASIMOD’N and (b) reconstructed with CSAM and predicted with CASIMOD’N.
a
b
Fig. 8. Observed requirements per farm compared to crop production predicted with (a) CASIMOD’N and (b) CSAM.
48 P. Moreau et al. / Agricultural Systems 118 (2013) 41–51
CASIMOD’N and CSAM-TNT2. The sub-catchment with the highest fertilisation rate (sub-catchment 3) also had high yields and the highest N soil balance and N flux at the outlet. Three sub-catch- ments (3, 6 and 8) had higher fluxes at the outlet than the entire sub-catchment mean with CASIMOD’N , while only two sub-catch- ments (3 and 8) were noticeably higher than the mean with CSAM- TNT2.
4. Discussion
4.1. Integrating farmer strategies into catchment-sc ale models
CASIMOD’N was developed to integrate farming systems into modelling the N cycle at the catchment scale to be able to conceive ,implement and test the effect of scenarios of changes in agricul- tural systems while ensuring farming system consistency . This changes model inputs, switching from reconstructed managemen tpractices (e.g. CSAM) to inputs that consider production strategies, farmer decisions and their expression as managemen t practices.
With CSAM, inputs of management practices relied on a recon- struction based on survey and statistical data and on expert knowl- edge, without explicit safeguard s ensuring farming system consistency . With CASIMOD’N we have shown that, with informa- tion at the farm scale about production and livestock-feedi ng objectives, consistent farming systems (e.g. between manure and crop-allocati on plans) can be represented. Moreover, since the pro- duction strategy is input at the farm scale, livestock-feed require- ments and their associate d fictive or market prices are specific to each farming system. CASIMOD’N inputs explicitly include farm constraints, in particular field spatial distribut ion. Therefore, CASI- MOD’N can be used in several livestock- oriented catchments whenever information about farming systems is available at the
farm scale (type, production objectives, herd characteristics and feeding strategy). However, CASIMOD’N does not consider all com- ponents of farm managemen t. Strategic decisions are simulated yearly, but the plans are not reconsider ed during a year. Tactical decisions (e.g. grazing management) and operational decisions (e.g. timing of harvest) are not yet integrated. Including sub-annual decisions , which are implemented in some farm-scal e models, such as MELODIE (Chardon et al., 2012 ), is an objective of future work. Moreove r, the influence of economic or social issues on farmer strategie s and adaptation is not explicitly considered.
4.2. Relevance of predicted farming systems
The comparison of management practices predicted with CASI- MOD’N versus data extracted from surveys and observed data was performed on a large dataset, highlighting the robustness of the model. The correspondenc e between predicted and observed areas per crop (Fig. 3) supports the hypothesis that the key point in the production strategy of these systems is fulfilling livestock-feed requiremen ts. Although the deficits in the optimisa tion procedure were weighted by the dry matter required per crop product, aslight over-prediction of grassland area led to an under-pr ediction of silage maize areas. CASIMOD’N tended to ensure grass produc- tion. The simulated range of grassland duration might have been too small, or the declared potential yields for grassland s too low. The focus on livestock-feed production also resulted in increasing variabilit y in predicted cash crop areas, even when their coeffi-cients of variation remained low (Fig. 3). The CAC index assesses predicted spatial and temporal crop allocation s well and highlight sthe added value of CASIMOD’N, but it also suggests that model pre- dictions can be improved further. However, part of farmer deci- sions will always remain difficult to model, especiall y as long as more complex rules (e.g. availability of machinery and work time, tactics of short-term adaptations) are not considered.
The predicted rates of manure spread for each farm and the crops receiving them are similar to those observed (Fig. 7). As the differenc e between crop requiremen ts and the quantity of Napplied in manure is complemen ted by mineral fertiliser applica- tion in CASIMOD’N , the similar results between predicted and ob- served mineral fertiliser rates (Fig. 6) emphasize the concordance between declared mean potential yields and declared mineral fer- tiliser rates. Finally, the coefficient of correlation obtained between predicted and observed requiremen ts was satisfactory (Fig. 8).Combined success in predicting managemen t practices and requiremen t satisfaction on a large dataset is an encourag ing result for CASIMOD ’N’s ability to simulate farming systems at the catch- ment scale. However , it should be noted that this is true only with systems with livestock whose feed comes mainly from on-farm production. Complemen tary sets of rules should be included for industria l livestock production and more crop-oriented production systems.
The comparison of CASIMOD’N with CSAM-TN T2 demonstrat ed the importance of integrating farming systems into catchment- scale simulation. Similar CAC values for CASIMOD’N and CSAM confirm that simulatin g production strategies is as accurate as astatistical approach for predictin g crop allocation s. The ability to consider more than two years of crop successions is crucial. AMC considers only the previous year and conseque ntly does not inte- grate the minimum return period between successive instances of the same crop nor the maximum number of successive instances of the same crop on the same field (Castellaz zi et al., 2008, 2010 ).CASIMOD ’N can set paramete rs so that a crop cannot be cultivated for three successive years on the same field, while this is not pos- sible with AMC. On the study site, this is especially useful for win- ter wheat which is commonl y grown for two, but not three, consecut ive years. The added value of integrating farming systems
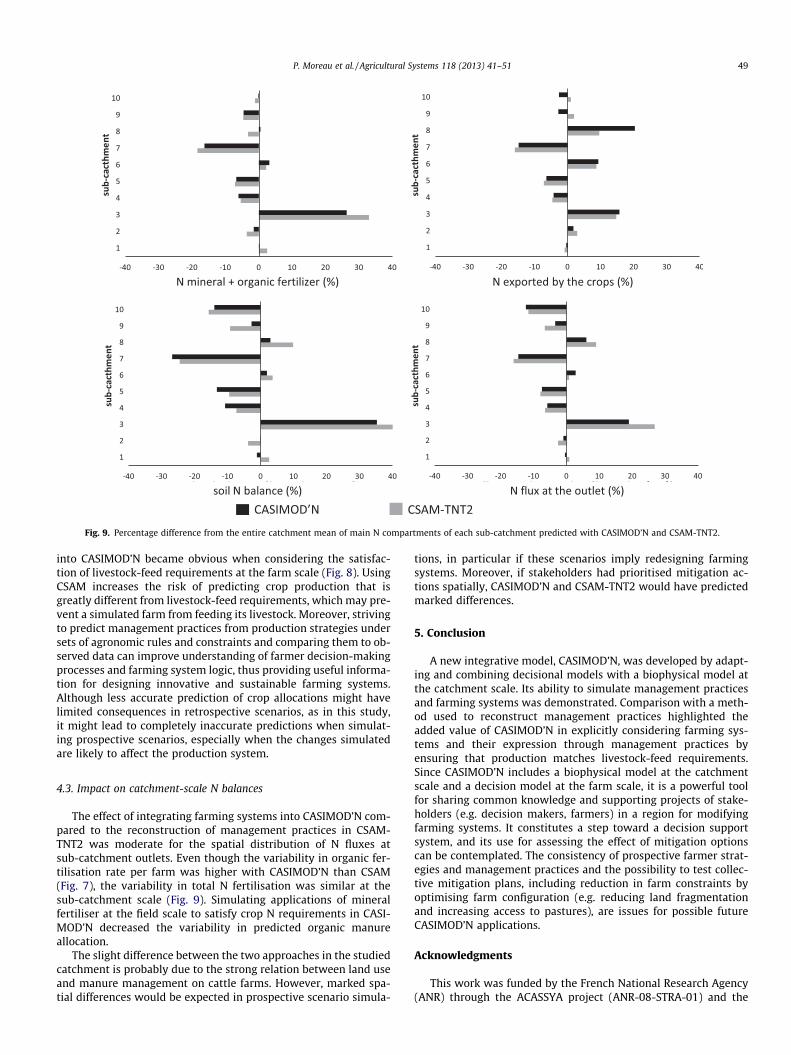
Fig. 9. Percentage difference from the entire catchment mean of main N compartments of each sub-catchment predicted with CASIMOD’N and CSAM-TNT2.
P. Moreau et al. / Agricultural Systems 118 (2013) 41–51 49
into CASIMOD’N became obvious when considering the satisfac- tion of livestock-feed requiremen ts at the farm scale (Fig. 8). Using CSAM increases the risk of predicting crop production that is greatly different from livestock-feed requiremen ts, which may pre- vent a simulated farm from feeding its livestock. Moreover, striving to predict managemen t practices from production strategies under sets of agronomi c rules and constrain ts and comparing them to ob- served data can improve understanding of farmer decision-ma king processes and farming system logic, thus providing useful informa- tion for designing innovative and sustainable farming systems. Although less accurate prediction of crop allocations might have limited conseque nces in retrospective scenarios, as in this study, it might lead to completely inaccurate predictions when simulat- ing prospective scenarios, especially when the changes simulated are likely to affect the production system.
4.3. Impact on catchment-scal e N balances
The effect of integrating farming systems into CASIMOD ’N com- pared to the reconstruction of management practices in CSAM- TNT2 was moderate for the spatial distribut ion of N fluxes at sub-catchment outlets. Even though the variability in organic fer- tilisation rate per farm was higher with CASIMOD’N than CSAM (Fig. 7), the variabilit y in total N fertilisation was similar at the sub-catchment scale (Fig. 9). Simulating applications of mineral fertiliser at the field scale to satisfy crop N requirements in CASI- MOD’N decreased the variability in predicted organic manure allocation.
The slight difference between the two approach es in the studied catchment is probably due to the strong relation between land use and manure managemen t on cattle farms. However, marked spa- tial differences would be expected in prospective scenario simula-
tions, in particular if these scenarios imply redesigni ng farming systems. Moreove r, if stakeholders had prioritised mitigation ac- tions spatially, CASIMOD’N and CSAM-TN T2 would have predicted marked differences.
5. Conclusion
A new integrative model, CASIMOD’N , was developed by adapt- ing and combining decisional models with a biophysical model at the catchment scale. Its ability to simulate managemen t practices and farming systems was demonstrated. Comparison with a meth- od used to reconstruct management practices highlighted the added value of CASIMOD’N in explicitly considering farming sys- tems and their expression through managemen t practices by ensuring that production matches livestock-feed requirements. Since CASIMOD’N includes a biophysi cal model at the catchment scale and a decision model at the farm scale, it is a powerful tool for sharing common knowledge and supporting projects of stake- holders (e.g. decision makers, farmers) in a region for modifying farming systems. It constitutes a step toward a decision support system, and its use for assessing the effect of mitigation options can be contemplated . The consisten cy of prospective farmer strat- egies and management practices and the possibility to test collec- tive mitigation plans, including reduction in farm constrain ts by optimising farm configuration (e.g. reducing land fragmentation and increasing access to pastures), are issues for possible future CASIMOD ’N applications .
Acknowled gments
This work was funded by the French National Research Agency (ANR) through the ACASSYA project (ANR-08-STRA-01) and the

50 P. Moreau et al. / Agricultural Systems 118 (2013) 41–51
Lannion-Trégor District Council. The authors would like to thank all the farmers involved in the study as well as local authoriti es for their constructive cooperation in the project.
References
Arnold, J.G., Srinivasan, R., Muttiah, R.S., Williams, J.R., 1998. Large area hydrologic modeling and assessment – Part 1: Model development. J. Am. Water Resour. Assoc. 34, 73–89.
Aurousseau, P., Squividant, H., 1996. Use of Tree Graph Structures for Computation Modeling of Derived Variables in Digital Elevation Model software. <http://viviane.roazhon.inra.fr/spanum/publica/dem/dem2.ht m>.
BDAT, 2011. Base de Données Analyse des Terres. <http://www.gissol.fr/programme/bdat/bdat.php>.
Beaujouan, V., Durand, P., Ruiz, L., 2001. Modelling the effect of the spatial distribution of agricultural practices on nitrogen fluxes in rural catchments. Ecol. Model. 137, 93–105.
Beaujouan, V., Durand, P., Ruiz, L., Aurousseau, P., Cotteret, G., 2002. A hydrological model dedicated to topography-based simulation of nitrogen transfer and transformation: rationale and application to the geomorphology-denitrificationrelationship. Hydrol. Process. 16, 493–507.
Bergez, J.E., Chabrier, P., Garcia, F., Gary, C.D.M., Quesnel, G., Ramat, E., Raynal, H., Rousse, N., Wallach, D., 2009. RECORD: A New Software Platform to Model and Simulate Cropping Systems. Farming System Design, Monterey, CA.
Billen, G., Garnier, J., Rousseau, V., 2005. Nutrient fluxes and water quality in the drainage network of the Scheldt basin over the last 50 years. Hydrobiologia 540, 47–67.
Birkinshaw, S.J., Ewen, J., 2000. Nitrogen transformation component for SHETRAN catchment nitrate transport modelling. J. Hydrol. 230, 1–17.
Breuer, L., Vache, K.B., Julich, S., Frede, H.-G., 2008. Current concepts in nitrogen dynamics for mesoscale catchments. Hydrol. Sci. J. – J. Sci. Hydrol. 53, 1059–1074.
Briand, X., Morand, P., 1997. Anaerobic digestion of Ulva sp. 1. Relationship between Ulva composition and methanisation. J. Appl. Phycol. 9, 511–524.
Brisson, N., Mary, B., Ripoche, D., Jeuffroy, M.H., Ruget, F., Nicoullaud, B., Gate, P., Devienne-Barret, F., Antonioletti, R., Durr, C., Richard, G., Beaudoin, N., Recous, S., Tayot, X., Plenet, D., Cellier, P., Machet, J.M., Meynard, J.M., Delecolle, R., 1998. STICS: a generic model for the simulation of crops and their water and nitrogen balances. I. Theory and parameterization applied to wheat and corn. Agronomie 18, 311–346.
Castellazzi, M.S., Wood, G.A., Burgess, P.J., Morris, J., Conrad, K.F., Perry, J.N., 2008. Asystematic representation of crop rotations. Agric. Syst. 97, 26–33.
Castellazzi, M.S., Matthews, J., Angevin, F., Sausse, C., Wood, G.A., Burgess, P.J., Brown, I., Conrad, K.F., Perry, J.N., 2010. Simulation scenarios of spatio-temporal arrangement of crops at the landscape scale. Environ. Modell. Softw. 25, 1881–1889.
Chardon, X., 2008. Evaluation environnementale des exploitations laitières par modélisation dynamique de leur fonctionnement et des flux de matière:développement et application du simulateur MELODIE. PhD thesis. AgroParisTech. 282pp.
Chardon, X., Rigolot, C., Baratte, C., Le Gall, A., Espagnol, S., Martin-Clouaire, R., Rellier, J.P., Raison, C., Poupa, J.C., Faverdin, P., 2007. MELODIE: a whole-farm model to study the dynamics of nutrients in integrated dairy and pig farms. In: Oxley, L., Kulasiri, D. (Eds.), MODSIM 2007 International Congress on Modelling and Simulation. Modelling and Simulation Society of Australia, New Zealand, pp. 1638–1645.
Chardon, X., Raison, C., Le Gall, A., Morvan, T., Faverdin, P., 2008. Fumigene: a model to study the impact of management rules and constraints on agricultural waste allocation at the farm level. J. Agric. Sci. 146, 521–539.
Chardon, X., Rigolot, C., Baratte, C., Espagnol, S., Raison, C., MartinClouaire, R., Rellier, J.P., Le Gall, A., Dourmad, J.Y., Piquemal, B., Leterme, P., Paillat, J.M., Delaby, L., Garcia, F., Peyraud, J.L., Poupa, J.C., Morvan, T., Faverdin, P., 2012. MELODIE: a whole-farm model to study the dynamics of nutrients in dairy and pig farms with crops. Animal 6, 1711–1721.
Cinnirella, S., Buttafuoco, G., Pirrone, N., 2005. Stochastic analysis to assess the spatial distribution of groundwater nitrate concentrations in the Po catchment (Italy). Environ. Pollut. 133, 569–580.
Corgne, S., 2004. Modélisation prédictive de l’occupation des sols en contexte agricole intensif: application à la couverture hivernale des sols en Bretagne. PhD thesis. Unviversité de Rennes 2 – Haute Bretagne. Rennes. France. 230pp.
Corson, M.S., Alan Rotz, C., Howard Skinner, R., Sanderson, M.A., 2007. Adaptation and evaluation of the integrated farm system model to simulate temperate multiple-species pastures. Agric. Syst. 94, 502–508.
Cox, D.R., Miller, H.D., 1965. The Theory of Stochastic Processes. Chapman and Hall, London.
Cugier, P., Billen, G., Guillaud, J.F., Garnier, J., Menesguen, A., 2005. Modelling the eutrophication of the Seine Bight (France) under historical, present and future riverine nutrient loading. J. Hydrol. 304, 381–396.
Dedieu, B., Faverdin, P., Dourmad, J.Y., Gibon, A., 2008. Livestock Farming System, aconcept when considering breeding transformations. INRA Prod. Anim. 21, 45–57.
Durand, P., Ferchaud, F., Salmon-Monviola, J., Goestschel, F., Martin, C., 2006. Etude sur l’évolution des paramètres nitrates dans les eaux brutes des bassins versants Bretagne Eau Pure et des autres bassins versants bretons.
Durand, P., Ferchaud, F., Baudhuin, P., Gibon, C., Moreau, P., Perez Escobar, A., Raimbault, T., Salmon-Monviola, J., 2008. Etude sur les bassins versants en contentieux ‘Nitrates Eaux Brutes’. Rapport INRA (in French). <http://www.observatoire-eau-bretagne.fr/Media/Documentation/Bibliographies/Rapport-Inra-BRGM-Etude-sur-les-bassins-versants-encontentieux-nitrates-eaux-brutes>.
Duretz, S., Drouet, J.L., Durand, P., Hutchings, N.J., Theobald, M.R., Salmon-Monviola, J., Dragosits, U., Maury, O., Sutton, M.A., Cellier, P., 2011. NitroScape: a model to integrate nitrogen transfers and transformations in rural landscapes. Environ. Pollut. 159, 3161–3169.
EC, 2000. Directive 2000/60/EC of the European parliament and of the council of 23 October 2000 establishing a framework for the community action in the field of water policy. Off. J. Eur. Commiss. L 327, 1–72.
Garcia, F., Faverdin, P., Delaby, L., Peyraud, J.L., 2005. Tournesol: a model to simulate cropping plans in dairy production systems. Renc. Rech. Rum. 12, 195–198.
Gascuel-Odoux, C., Aurousseau, P., Cordier, M.-O., Durand, P., Garcia, F., Masson, V., Salmon-Monviola, J., Tortrat, F., Trepos, R., 2009. A decision-oriented model to evaluate the effect of land use and agricultural management on herbicide contamination in stream water. Environ. Model. Softw. 24, 1433–1446.
Gibon, A., Sibbald, A.R., Flamant, J.C., Lhoste, P., Revilla, R., Rubino, R., Sorensen, J.T., 1999. Livestock fanning systems research in Europe and its potential contribution for managing towards sustainability in livestock farming. Livest. Prod. Sci. 61, 121–137.
Gourbesville, P., 2008. Integrated river basin management, ICT and DSS: challenges and needs. Phys. Chem. Earth 33, 312–321.
Gouttenoire, L., Fiorelli, J.L., Trommenschlager, J.M., Coquil, X., Cournut, S., 2010. Understanding the reproductive performance of a dairy cattle herd by using both analytical and systemic approaches: a case study based on a system experiment. Animal 4, 827–841.
Horn, A.L., Rueda, F.J., Hormann, G., Fohrer, N., 2004. Implementing river water quality modelling issues in mesoscale watershed models for water policy demands – an overview on current concepts, deficits, and future tasks. Phys. Chem. Earth 29, 725–737.
Hutchings, N.J., Olesen, J.E., Petersen, B.M., Berntsen, J., 2007. Modelling spatial heterogeneity in grazed grassland and its effects on nitrogen cycling and greenhouse gas emissions. Agric. Ecosyst. Environ. 121, 153–163.
Jacobsen, B.H., Boye, C., Petersen, B.M., Berntsen, J., Srensen, C.G., Sgaard, H.T., Hansen, J.P., 1998. An Integrated Economic and Environmental Farm Simulation Model (FASSET). Rapport – Statens Jordbrugs- og Fiskeriokonomiske Institut.
Jarvie, H.P., Neal, C., Withers, P.J.A., Wescott, C., Acornley, R.A., 2005. Nutrient hydrochemistry for a groundwater-dominated patchment: The Hampshire Avon, UK. Sci. Total Environ. 344, 143–158.
Koo, B.K., O’Connell, P.E., 2006. An integrated modelling and multicriteria analysis approach to managing nitrate diffuse pollution: 2. A case study for a chalk catchment in England. Sci. Total Environ. 358, 1–20.
Liu, S., Tucker, P., Mansell, M., Hursthouse, A., 2005. Development and application of a catchment scale diffuse nitrate modelling tool. Hydrol. Process. 19, 2625–2639.
Matthews, K.B., Buchan, K., Sibbald, A.R., Craw, S., 2006a. Combining deliberative and computer-based methods for multi-objective land-use planning. Agric. Syst. 87, 18–37.
Matthews, K.B., Wright, I.A., Buchan, K., Davies, D.A., Schwarz, G., 2006b. Assessing the options for upland livestock systems under CAP reform: developing and applying a livestock systems model within whole-farm systems analysis. Agric. Syst. 90, 32–61.
Menesguen, A., 1999. L’utilisation de modèles écologiques dans la lutte contre l’eutrophisation des eaux côtières françaises, IFREMER, Colloque ‘‘Pollutions diffuses: du bassin versant au littoral’’, Ploufragran, France, 17pp. <http://archimer.ifremer.fr/doc/1999/rapport-144.pdf>.
Menesguen, A., Piriou, J.Y., 1995. Nitrogen loadings and macroalgal (Ulva sp.) mass accumulation in Brittany (France). Ophelia 42, 227–237.
Moreau, P., Ruiz, L., Mabon, F., Raimbault, T., Durand, P., Delaby, L., Devienne, S., Vertès, F., 2012a. Reconciling technical, economic and environmental efficiencyof farming systems in vulnerable areas. Agric. Ecosyst. Environ. 147, 89–99.
Moreau, P., Ruiz, L., Raimbault, T., Vertès, F., Cordier, M.O., Gascuel-Odoux, C., Masson, V., Salmon-Monviola, J., Durand, P., 2012b. Modeling the potential benefits of catch-crop introduction in fodder crop rotations in a Western Europe landscape. Sci. Total Environ. 437, 276–284.
Oehler, F., Durand, P., Bordenave, P., Saadi, Z., Salmon-Monviola, J., 2009. Modelling denitrification at the catchment scale. Sci. Total Environ. 407, 1726–1737.
Pontius, R.G., Huffaker, D., Denman, K., 2004. Useful techniques of validation for spatially explicit land-change models. Ecol. Model. 179, 445–461.
Quesnel, G., Duboz, R., Ramat, E., 2009. The Virtual Laboratory Environment – an operational framework for multi-modelling, simulation and analysis of complex dynamical systems. Simul. Model. Pract. Theory 17, 641–653.
Rotz, C.A., Corson, M.S., Chianese, D.S., Montes, F., Hafner, S.D., Jarvis, R., Coiner, C.U., 2011. The Integrated Farm System Model Reference Manual. <http://www.ars.usda.gov/Main/docs.htm?docid=8519>.
Salmon-Monviola, J., Gascuel-Odoux, C., Garcia, F., Tortrat, F., Cordier, M.-O., Masson, V., Trépos, R., 2011. Simulating the effect of technical and environmental constraints on the spatio-temporal distribution of herbicide applications and stream losses. Agric. Ecosyst. Environ. 140, 382–394.
Salmon-Monviola, J., Durand, P., Ferchaud, F., Oehler, F., Sorel, L., 2012. Modelling spatial dynamics of cropping systems to assess agricultural practices at the catchment scale. Comput. Electron. Agric. 81, 1–13.

P. Moreau et al. / Agricultural Systems 118 (2013) 41–51 51
SCE, 2010. Diagnostic territorial des bassins versants de la Lieue de Grève. Lannion Trégor Agglomération, Lannion, France, 137pp.
Servais, P., Billen, G., Goncalves, A., Garcia-Armisen, T., 2007. Modelling microbiological water quality in the Seine river drainage network: past, present and future situations. Hydrol. Earth Syst. Sci. 11, 1581–1592.
Sorel, L., Viaud, V., Durand, P., Walter, C., 2010. Modeling spatio-temporal crop allocation patterns by a stochastic decision tree method, considering agronomic driving factors. Agric. Syst. 103, 647–655.
Sterk, B., van Ittersum, M.K., Leeuwis, C., 2011. How, when, and for what reasons does land use modelling contribute to societal problem solving? Environ. Model. Softw. 26, 310–316.
Theobald, M.R., Dragosits, U., Place, C.J., Smith, J.U., Sozanska, M., Brown, L., Scholefield, D., del Prado, A., Webb, J., Whitehead, P.G., Angus, A., Hodge, I.D., Fowler, D., Sutton, M.A., 2004. Modelling nitrogen fluxes at the landscape scale. Water Air Soil Pollut. 4, 135–142.
Wastney, M.E., Palliser, C.C., Lile, J.A., Macdonald, K.A., Penno, J.W., Bright, K.P., 2002. A whole-farm model applied to a dairy system. Proc. NZ Soc. Anim. Prod. 62, 120–123.
Weng, Q.H., 2002. Land use change analysis in the Zhujiang Delta of China using satellite remote sensing, GIS and stochastic modelling. J. Environ. Manage. 64, 273–284.
Whitehead, P.G., Wilson, E.J., Butterfield, D., Seed, K., 1998. A semi-distributed integrated flow and nitrogen model for multiple source assessment in catchments (INCA): Part II – application to large river basins in south Wales and eastern England. Sci. Total Environ. 210, 559–583.
Wilkinson, A., Eidinow, E., 2008. Evolving practices in environmental scenarios: anew scenario typology. Environ. Res. Lett. 3, 45017.
Zeigler, B.P., Kim, T.G., Praehofer, H., 2000. Theory of Modeling and Simulation: Integrating Discrete Event and Continuous Complex Dynamic Systems. Academic Press.