Case study: Satisfaction of customers of Fitness Center X with ...
69
Case study: Satisfaction of customers of Fitness Center X with services provided during the Covid-19 pandemic Sara Wrang Degree Thesis International Business 2022
-
Upload
khangminh22 -
Category
Documents
-
view
2 -
download
0
Transcript of Case study: Satisfaction of customers of Fitness Center X with ...

Case study: Satisfaction of customers of
Fitness Center X with services provided during
the Covid-19 pandemic
Sara Wrang
Degree Thesis
International Business
2022

DEGREE THESIS
Arcada
Degree Program: International business
Identification number: 8650
Author: Sara Wrang
Title: Case study: Satisfaction of customers of Fitness Center X
with services provided during the Covid-19 pandemic
Supervisor (Arcada): Susanna Fabricius
Commissioned by: -
Abstract:
This quantitative study, conducted as an online questionnaire, investigated the satisfaction of the Fitness
Center X´s members during the covid-19 pandemic. Three research questions were addressed in this study:
The first question investigated, what are the most important factors of services for gym members? The re-
spondents were given statements, which they were asked to evaluate on a Likert scale from 1-to 5. The second
research question investigated, are there potential differences among consumer segments such as age, gender,
or work hours, when comparing to the meeting of their preferences? Those three consumer segments were
compared to one another to evaluate if and how large the differences were. Due to the Covid-19 pandemic, fitness centers have been forced to modify their service offerings: how successfully have the modified ser-
vices met the consumer preferences? Additionally, investigated was to see if the Fitness Center X had man-
aged to keep the consumer voice in mind when conducting the modifications. The study was supported with
an analysis of what impacts customer satisfaction and how it can be measured most efficiently. Value percept
disparity theory functioned as a model implied in the analysis and development of the study together with the
service quality model. The simplified RATER model is widely applied by organizations and its dimensions
were also noticeable in the results of the study. The results of the study show that overall, most members who
participated in the study were very satisfied with the service offering by the fitness center X. The differences
between segment groups were all rather minor, biggest dispersions could be found within the workhour seg-
ment. This indicated that members working office work hours were less satisfied than those having other
work hours. Only a small decrease in the satisfaction from the old services towards the modified services
could be identified, indicating that Fitness Center X managed well to offer substitutive services during the pandemic.
Keywords: Customer satisfaction, preferences, services, Fitness center
Number of pages: 57
Language: English
Date of acceptance:

OPINNÄYTE
Arcada
Koulutusohjelma: International business
Tunnistenumero: 8650
Tekijä: Sara Wrang
Työn nimi: Tapaustutkimus: Kuntosali X:n asiakkaiden tyytyväisyys
palvelutarjontaan korona pandemian aikana
Työn ohjaaja (Arcada): Susanna Fabricius
Toimeksiantaja: -
Tiivistelmä:
Tämä kvantitatiivinen tutkielma suoritettiin online-kyselynä, tavoitteena selvittää Fitness Center X:n jäsenten tyytyväisyyttä Covid-19 pandemian aikana. Tutkielmassa keskityttiin kolmeen kysymykseen: ensimmäinen
kysymys selvitti mitkä ovat tärkeimmät osa-alueet salin jäsenille? Vastaajille annettiin toteamuksia, joita
heidän tuli arvioida Likertin skaalassa arvoilla 1-5. Toinen kysymys selvitti, onko mahdollisia eroavaisuuksia
kuluttaja segmenttien välillä, esimerkiksi ikä, sukupuoli tai työssäkäynti, kun vertaillaan käyttäjien
mieltymyksiä. Näitä kolmea segmenttiä vertailtiin keskenään ja arvioitiin, miten suuria eroavaisuuksia löytyi.
Covid-19 pandemian vuoksi kuntokeskusten on ollut pakko muokata palvelutarjontaansa: kuinka
onnistuneesti muokatut palvelut ovat vastanneet kuluttajien mieltymyksiä? Lisäksi tutkittiin oliko Fitness
Center X onnistunut pitämään kuluttajien toiveet mielessään muutoksia toteutettaessa. Tutkielman tukena
tarkasteltiin analyysi, mikä vaikuttaa kuluttajien tyytyväisyyteen ja kuinka sitä voidaan tutkia tehokkaimmin.
’Value percept disparity’- teoriaa sisällytettin analyysiin ja tutkielman kehittämiseen yhdessä palvelun
laatumallin kanssa. Tutkielman tuloksissa huomiotiin ulottuvuuksineen myös yksinkertaistettu RATER
malli, jota käytetään laajasti yritysten keskuudessa. Tutkielman lopputulokset osoittavat, että yleisesti tutkimukseen osallistuvat jäsenet olivat erittäin tyytyväisiä Fitness Center X:n palveluihin. Eroavaisuudet
eri segmenttien kesken olivat melko pieniä, suurinta hajontaa löytyi työaikasgementistä. Tämä osoitti, että
toimistoaikaa tekevät jäsenet olivat tyytymättömämpiä kuin jäsenet, joilla oli erilainen työaika. Oli
havaittavissa vain pieni lasku tyytyväisyydessä vanhojen palvelujen ja uuden palvelutarjonnan kesken, mikä
osoitti että Fitness Center X oli hyvin onnistunut tarjoamaan korvaavia palveluja pandemian aikana.
Avainsanat: Asiakastyytyväisyys, mieltymykset, palvelut, kuntosali
Sivumäärä: 57
Kieli: Englanti
Hyväksymispäivämäärä:

CONTENTS
1 INTRODUCTION ................................................................................................... 6
1.1 PROBLEM STATEMENT ........................................................................................... 7
1.2 AIM OF THE STUDY ................................................................................................. 8
1.3 DEMARCATION ........................................................................................................ 8
1.4 DEFINITIONS ............................................................................................................ 9
1.5 PRESENTATION OF THE COMPANY....................................................................... 9
2 THEORY.............................................................................................................. 10
2.1 COVID-19 ................................................................................................................ 10
2.2 CONSUMER BEHAVIOR ......................................................................................... 12
2.3 CUSTOMER SATISFACTION .................................................................................. 12
2.3.1 Value percept disparity theory .......................................................................... 14
2.4 CUSTOMER DISSATISFACTION ............................................................................ 14
2.4.1 The service quality gap .................................................................................... 15
2.5 MEASURING SATISFACTION................................................................................. 15
2.5.1 Service quality model ....................................................................................... 16
2.6 SERVICE DEVELOPMENT ..................................................................................... 17
2.6.1 Consumer´s voice ............................................................................................ 18
2.7 SUMMARY .............................................................................................................. 19
3 METHOD ............................................................................................................. 20
3.1 QUANTITATIVE RESEARCH .................................................................................. 20
3.2 CHOICE OF RESPONDENTS ................................................................................. 22
3.3 DATA COLLECTION- QUESTIONNAIRE................................................................. 23
3.4 RESEARCH APPROACH/ DATA USED IN THE STUDY ......................................... 25
3.5 ANALYSIS OF THE DATA /STATISTICAL ANALYSES ............................................ 27
3.6 VALIDITY AND RELIABILITY .................................................................................. 28
4 RESULTS ............................................................................................................ 29
4.1 SERVICES .............................................................................................................. 29
4.2 CONSUMER PREFERENCES................................................................................. 33
4.3 OVERALL SATISFACTION...................................................................................... 36
4.4 DIFFERENCES BETWEEN SEGMENTS ................................................................. 37
4.4.1 Age .................................................................................................................. 37
4.4.2 Gender............................................................................................................. 40
4.4.3 Work hours ...................................................................................................... 41

5 Discussion ......................................................................................................... 44
5.1 SERVICES .............................................................................................................. 44
5.2 PREFERENCES ...................................................................................................... 46
5.3 OVERALL SATISFACTION...................................................................................... 49
5.4 DIFFERENCES BETWEEN SEGMENTS ................................................................. 51
5.4.1 Age .................................................................................................................. 51
5.4.2 Gender............................................................................................................. 52
5.4.3 Workhours ....................................................................................................... 53
5.5 DISCUSSION OF METHOD .................................................................................... 54
6 CONCLUSIONS .................................................................................................. 56
6.1 LIMITATIONS OF THE STUDY................................................................................ 58
6.2 SUGGESTIONS FOR FURTHER STUDIES ............................................................ 58
References ................................................................................................................ 60
Table of Figures ........................................................................................................ 64
Appendix A - Questionnaire ..................................................................................... 65

6
1 INTRODUCTION
Exercising can be considered as one of the most efficient as well as most pleasant ways
of maintaining physical health and body functions. (Huttunen, 2018) It does not only
maintain physical health but also brings positive mental health benefits. It, for instance,
relieves stress and lifts individuals’ self-esteem. (Liikkumisen vaikutukset - UKK-in-
stituutti, 2021)
According to a study conducted by FinTerveys in 2017 39% of Finnish males over the
age of 18 years and over 34% of women follow the exercise suggestions. The younger
generation is more likely to follow exercise recommendations than persons above 40
years of age. The exercise recommendations given include 150 minutes of exercise a
week divided into three days if possible. Strength training and fitness centers were named
as one of the popular exercise choices of consumers. (Liikunnan harrastaminen Su-
omessa, 2020)
During the Covid-19 pandemic, most fitness facilities have been closed at times due to
restrictions by the authorities. Fitness centers have done their best to offer new and mod-
ified services that work along the restrictions given. Exercising should not be neglected,
as poor endurance condition has been identified as a risk factor for catching the severe
variation of the virus. (Burtscher et al., 2020) Research indicates that a good physical
condition works as a shelter from getting severe symptoms. (Brawner et al., 2021) This
is the main message that fitness centers are promoting to their customers, trying to con-
vince them to keep their memberships active.
The World Health Organization announced the Covid-19 as a pandemic on the 11th of
March 2020. (Boseley, 2020) Following this statement many countries, including Fin-
land, took action to try to limit the spread of the virus by introducing different lock-down
measurements and restrictions pointed towards a variety of everyday activities. With ex-
ploring new, even more contagious variants of the virus Finland has gone into “lock-
down” several times to minimize the spread and mitigate the impact on the medical sys-
tem. (Current restrictions, 2022)

7
This topic was chosen as it is current and there has been a considerable amount of discus-
sion around the effects of the Covid-19 pandemic in different industries. Lately, espe-
cially the effects of the pandemic on the fitness industry have been much discussed. Fit-
ness centers are mainly visited physically to exercise. What if that is not an option at the
given moment? The author aims to investigate how successfully Fitness Center X has
managed to meet consumers' demand during the Covid-19 pandemic. How successful has
the offering of new services been?
The results of this study will provide Fitness Center X with information regarding their
consumer’s satisfaction with the newly developed services during the Covid-19 pandemic
compared to the already existing offering. Furthermore, the results will benefit Fitness
Center X as it provides data on consumer satisfaction with the modifications of the ser-
vices. Also, possible suggestions for new ideas for expanding services based on consumer
preferences will be discussed. In addition, the results will be a valuable guide for Fitness
Center X in case new pandemics occur in the future.
1.1 Problem statement
Fitness Center X is interested to know what their customers think about the variety of
services offered, what factors their consumers value in the services they use. This type of
questionnaire has not been done since the outbreak of the Covid-19 pandemic and is now
conducted to find out how the consumers perceived the fitness centers’ services, espe-
cially during the pandemic.
Research questions that are being answered with this research are as follows:
- From the consumer’s perspective, what are the most important factors of services
for gym customers?
- Are there differences in customer preferences among different consumer seg-
ments?
- How successfully have new services met the customer preferences?

8
1.2 Aim of the study
This study aimed to investigate how Fitness Center X managed to meet its customer’s
preferences. In addition, this research also investigates what are the most important fac-
tors of the services from the consumer’s point of view and if there are differences in those
preferences among different segment groups. Different segments that are compared are
age groups, gender, and whether the participants have been working or studying during
office hours or if they are working outside the regular office hours.
1.3 Demarcation
This research focuses on investigating how satisfied members have been during the
Covid-19 pandemic with the perceived services and factors related to the service offering
such as the atmosphere or cleanliness at the fitness center. This research is conducted as
a case study and focuses on investigating how one specific fitness center has managed to
meet the consumer’s preferences therefore the target group of the research are the perma-
nent members of Fitness Center X.
Since the study was conducted for Fitness Center X and includes the responses of their
members, the results of this study cannot be generalized to cover the satisfaction of mem-
bers going to a different fitness facility. Among fitness centers, there has also been vari-
ability in the developed services and this research covers only Fitness Center X´s service
development, which is another reason why this research cannot be generalized.
The geographic area on which the research focused was in the capital area of Finland,
where Fitness Center X is located. This geographic area is thought to provide the most
informative results due to being in the worst pandemic area within the country. Therefore,
the results of the research will indicate how Fitness Center X has managed to fulfill the
consumer’s satisfaction while being in a unique situation in the middle of the worst pan-
demic area within the country and with many restrictions in place for a long period.

9
1.4 Definitions
Lara Penin defined a service in a working definition the following way:” Service occurs
when there is a value exchange between parties”. One party act as the service provider
and offers some service or activity that the other party, which the receiving party values.
(Pen-in, 2018, 20) Another way to define a service is to examine it from the perspective
of it being” something that helps someone to do something” as Lou Downe (2020, 6)
stated in his book.
Consumer preferences are shaped by individuals’ taste, culture, education, or almost any
other factor of individuals’ lives. Individual preferences can also form through the inter-
action of social pressure with others such as friends or co-workers. For organizations, it
is important to understand consumer preferences as they will reflect and indicate potential
consumer demand. (Lohrey, 2019)
1.5 Presentation of the company
This thesis is conducted as a type of customer satisfaction research for the privately
owned Fitness Center X located in Vantaa, Finland. The fitness center belongs to a fran-
chising organization that has multiple fitness centers under them, each of which has its
independent entrepreneur running the center.
Fitness Center X was founded in 2018 and has been growing its customer base ever since.
Since it is a franchising organization, the entrepreneur has access to resources offered by
the organization under which the fitness center operates. In addition, the entrepreneur gets
full support when it comes to finding and building new business premises as well as con-
tinuous support in the marketing field. Even though the organization offers its support
and gives access to various order channels and platforms to ease the workload, the entre-
preneur makes the final decisions. They have the right to choose where to place orders
and how to develop the fitness center, the organization only offers suggestions which can
then either be approved or rejected.

10
Various services are offered in addition to the basic gym membership. The basic gym
membership gives the members access to the weight and cardio area of the fitness center.
In addition, the fitness center offers instructed group exercise hours as well as virtual
lessons, which members can access while being physically at the gym through a flat tv in
their own time. Personal training sessions are also available to purchase, where members
get to train with a professional instructor individually. In addition, Fitness center X offers
massage services to members and non-members to take care of the recovery side of their
physical well-being.
2 THEORY
The following chapter will cover the theoretical framework needed for this research, i.e
what has been written about this thesis topic in the past. For the theoretical background,
a wide variety of sources was processed to collect information. The background infor-
mation is collected from various literature sources including articles, books as well as
journals and reports.
First, the COVID-19 pandemic is explained and discussed. The next topic is consumer
behavior, which is shortly addressed in general, followed by the consumer satisfaction
section on which this theoretical framework focuses. That section includes theories re-
lated to consumer satisfaction as well as the discussion of consumer dissatisfaction and a
model related to it. It is discussed how consumer satisfaction can be measured, and a
service quality model is explained to support the measuring of consumer satisfaction.
2.1 COVID-19
COVID-19 is a unique, unexpected situation across the world and a unique time during
the lifetime of many individuals. The pandemic has had an incredible global impact across
different sectors and individuals’ lives. The pandemic has led to many casualties and
struggles in many business industries as well as in the healthcare sectors in all countries
across the world. Numerous healthcare organizations are working towards the same goal,
managing the health impacts as well as the disease itself. The impacts on the healthcare,
economy and supply chain are examples of areas where the pandemic has left a

11
devastating track. After the pandemic passes, there might be some permanent changes
visible such as increased home-officing or people avoiding crowded places, with the fear
of still catching something. (Vankatesh, 2020)
The COVID-19 outbreak has also forced many businesses to close either temporarily or
even permanently, often due to financial loss led by the pandemic. Many countries have
closed their borders, as they are trying to limit travelling in and out of the country. This
is hoped to minimize the infections when no unnecessary people are traveling through. In
addition, there were restrictions in place regarding the general movement of individuals.
In some cases, citizens have been confined to quarantine within their four walls at home,
forbidden to leave the apartment for a certain period. (Donthy and Gustafsson, 2020)
It is very likely that in many industries a large number of businesses are facing bank-
ruptcy, as consumers are confined to stay at home and restrictions are in place, preventing
the usage of services. (Tucker, 2020) Many sports events and large gatherings are forbid-
den due to the risks it brings. Personal services were also not accessible, and the lockdown
led to the standstill of individually used services such as hairdressers and gyms. Many
companies and organizations were not prepared, or poorly prepared for handling issues
of this extent. Many businesses are struggling, yet some organizations are thriving due to
the pan-demic. Nevertheless, all businesses have realized that there is a need for prepara-
tion for the most unexpected situations if the organization wishes to succeed in the long
term. (Rapoza, 2020)
During and because of the Covid-19 pandemic Fitness Center X had to modify its service
offering according to the restrictions imposed by the government. During some periods
between the beginning of 2020 and the beginning of 2022, there have been restrictions in
place regarding the number of individuals allowed at a time to the fitness center. Twice
the fitness center has been forced to close completely. Having the benefit of being a rel-
atively small fitness center the owner had the possibility to keep the fitness center open
through a booking system at times where this was allowed. There has been a time period
where fitness facilities were given the order of closing completely for a while. The book-
ing system means that customers were able to book individual training slots online and
only one person was allowed to train at that time. At some point it was allowed to bring

12
family and other close members so that the workout capacity was up to 10 persons. Other
options given were the borrowing equipment to take home, which many took advantage
of, and continuing group classes which were moved to Instagram where they were live
streamed by the instructor.
The pandemic has opened a new era of distance working as many organizations were
forced or it was highly recommended that all employees that have tasks that can be con-
ducted remotely will be working from home for an unknown period. The respondents to
research that was conducted in September-October 2020 said that home officing has in-
creased a lot during the Covid-19 pandemic. Almost half of all respondents (47%) men-
tioned that working from home has become a regular choice. Males reported the growth
of home officing more than females, this might also be related to the field where individ-
uals work. (Kestilä, Härmä and Rissanen, 2020)
2.2 Consumer behavior
Consumer behavior can be identified as a study of consumers´ choices. It includes the
search, evaluation, purchase as well as usage of products and services that individual con-
sumers find will satisfy their needs. Consumer behavior is the explanation of how indi-
viduals decide to spend their available money, time, and efforts on purchasing products
offered by marketers. The unfulfilled or only partly met needs of consumers are tried to
be discovered by the marketers to be able to develop the offerings meeting their custom-
ers’ needs. (Schiffman and Wiesenblit, 2022, 32)
2.3 Customer satisfaction
Customer satisfaction originates from an organizations and consumers’ interaction and
can simply be described as the fulfilling or unfulfilling of consumer expectations. Satis-
fied consumers are often more committed and for the organization, it is in most cases
cost-efficient to try to keep the member than having to try to acquire new customers con-
stantly. When customers are pleased with a service, they are more likely to recommend it
to others, possibly leading to bringing new members with them. Customer satisfaction

13
statistics are often also used to assist the prediction of the growth of the organization.
(Huttunen, 2020)
It is often talked about creating value for consumers, to gain and keep them as a customer,
but what does it mean to create value for the customers? Value can be compared to terms
such as quality or excellence, the meaning of it differs from consumer to consumer. On
the other hand, it can also be described as a concept that has worth for the consumer and
or is desirable. Art Weinstein (2018, 13) described well that ”value is the satisfaction of
customer requirements at the lowest total cost of acquisition, ownership, and use”
Consumers are often facing a wide range of products and services from which they have
the freedom to choose, what satisfies their needs in the best way. (Kotler and Armstrong,
2020, 30) The perceived extra value by the consumers is what differentiates products on
the market. (Villanen, 2016, 186) Satisfied customers are more likely to forward the word
of a good experience and service to others than those not satisfied. This is something to
keep in mind during the complete product development process. (Kotler and Armstrong,
2020, 30)
According to Art Weinstein (2018) ”Superior customer value means to continually create
business experiences that exceed customer expectations”. Consumers are the ones defin-
ing the value; therefore, it is of importance for companies to offer services and value
which is outstanding from the wide variety of other offers on the market. This way or-
ganizations might gain customers for a lifetime. From the customer’s perspective seen,
the value might also be a compromise between sacrifices made and the benefits gained in
exchange. What consumers see as sacrifice varies among individuals but entails stress,
used time, and money spent. (Weinstein, 2018, 13)
In addition, it cannot be denied that satisfied customers are more likely to purchase more
than those not so satisfied with the offered product or service. When considering a highly
competitive market, with a wide range of offerings from different organizations, customer
satisfaction is the cornerstone of building strong and long-lasting relationships between
consumers and the organizations. The importance of measurement of consumer

14
satisfaction has therefore become a fundamental concern of many organizations, to reach
their full market power. (Mohammad, 2012)
2.3.1 Value percept disparity theory
The value percept theory is a consumer satisfaction measurement method according to
which consumer satisfaction can be held as an emotional response that is being triggered
by a so-called cognitive evaluation process. During the cognitive process, the perceived
offer is compared to the individuals’ values, wants as well as needs and potential desires.
The growing discrepancy between an individual’s perceptions and values is an indicator
of increasing dissatisfaction with a service or product. (Westbrook & Reilly, 1983).
According to Westbrook and Reilly (1983), this specific theory can be defined through
the extent to which the product or service serves the characteristics acquired or desired
by the consumer. This can be assessed by asking the consumers on a differential scale
how well the service provides compared to the needs of individuals.
This model was identified to fit well for this research as the research focuses on customer
satisfaction and one research question focuses on how well new services invented during
the covid-19 pandemic have met Fitness Center X´s consumer preferences. This precisely
is what is being investigated by a scale as suggested in this research regarding consumer
satisfaction measurements, providing statements to which consumers pick the best fitting
alternative of “not important at all” to “very important”. As preferences vary among con-
sumers, the characteristics searched in services will differ and this study will be providing
information regarding the division of the satisfaction level.
2.4 Customer dissatisfaction
Customers often become customers for life when they are particularly satisfied with a
certain service or product, purchasing the products over and over while also encouraging
others to do the same. Whereas if consumers are extremely unsatisfied or do not have an
opinion towards the service, they are likely to change to a competitor’s product or service
without delay. Another option consumers might consider is to wait until they get a better,

15
often less expensive option from a competitor for a similar product or service. Commonly,
highly unsatisfied customers spread the negative word forwards, often highly exaggerated
compared to what the actual situation would have been. (Schiffman and Wiesenblit, 2022,
45)
2.4.1 The service quality gap
Customer dissatisfaction can be identified to be the fundamental reason behind customer
decay. Many researchers have undertaken this topic and come up with the theory of sat-
isfaction gaps. The service quality gap can be identified as differences between the ex-
pectations of customers towards service and the perception of the actual service offered
by an organization. Often the dissatisfaction has arisen from one of the five previous gaps.
The promotional gap indicates that the description of the service does not align with the
service that was delivered. Next, the understanding cap might arise in case the managers
of organizations have accurate information regarding the priorities and needs of the con-
sumers. The procedural gap occurs in case the customer´s expectations are not turned into
suitable operating systems to meet the expectations. The behavioral gap takes place if the
delivered service differs from the give’s specification of the service. Fifth, the perception
gap indicated that the perceived service is different than the provided service of the or-
ganization. (Hill and Alexander, 2017)
2.5 Measuring satisfaction
Measuring customer satisfaction has become a crucial task for many organizations. It is
also considered as a key performance indicator for organizations while helping to main-
tain the already existing consumer relationships and increasing the revenue of the organ-
ization. Organizations that can ensure commitment to the consumers will grow the level
of customer loyalty. (Khadka et al, 2014)
There are multiple ways to measure customer satisfaction. Commonly it is however meas-
ured through a customer satisfaction survey. Overall satisfaction is often measured with
a five-point scale from not satisfied at all to very satisfied or similar options. The five-

16
point scale works well in questionnaires as it gives the consumer a wider answer options
range and the researcher more information than just “yes” or “no” answers would provide.
(Nedelcu, Dumitrascu and Cristea, 2010)
The customer satisfaction score (CSAT) is a standard, commonly used measure for cus-
tomer satisfaction that is based on the service quality, and it is of importance as it reflects
the perceptions of customers. In general, the data is gathered through feedback directly
from the consumers which can be gathered using different styles of questions. In surveys
for instance the information is gathered on a numerical level by asking the participants to
evaluate their perception of the perceived service on a given scale. The questions could
for instance be “how satisfied were you with the overall service?” and the respondents
would answer anything from 1 very unsatisfied to 5 which stands for very satisfied. The
gained data is later transferred into statistical data, usually presented in percentages on a
scale. (Qualtrics, n.d.)
2.5.1 Service quality model
The consumer satisfaction level can be identified as being related to the performance of
the services offered. The service quality model is also known as the SERVQUAL model
is a research instrument with which consumer expectations, as well as consumer percep-
tions of services, can be measured and analyzed. (Bhasin, 2021) It is also recognized as
the most functional scale for measuring the level of service quality. In a nutshell, one can
say that the model measured the gap arising between consumer expectations in contrast
to the experience gained. (Lewlyn & Rodrigues 2013, 1-2.)
Originally the model consisted of 22 questions, however, there are also existing a ten-
dimension model and a simplified five-dimension model also called the RATER model.
(Bhasin, 2021) The RATER version of the model including five stages is widely adopted
by organizations. The model consists of the following dimensions:
• Empathy: Adapted approach depending on consumers’ preferences
and needs, and attention is given to consumers.

17
• Responsiveness: The willingness and ability of organizations to pro-
vide service to consumers.
• Reliability: How well does the organization live up to the promises
made to consumers regarding the delivery of services.
• Assurance: A combination of knowledge and politeness from the em-
ployee towards the consumers to create trust.
• Tangibles: The physical appearance of the organization including the
equipment, employees as well as facilities where services are pro-
vided. (Lewlyn & Rodrigues 2013, 11; Bhasin, 2021)
2.6 Service development
Services might occur even somewhere in the background so that they get forgotten about
until something happens, either good or bad which brings the service more visible to con-
sumers. However, one thing all services have in common is the goal of assisting individ-
uals to reach something. (Downe, 2020, 6) The user of the service sees value in the out-
come of the activity, which they are either willing to pay for, or are willing to exchange
for something of comparable value. (Penin, 2018, 20)
In today’s situation, the services are a series of tasks that together combined to compose
a service. The person behind the decision of what a service is an individual in the demand
of achieving a set goal. (Downe, 2020, 6) The potential service users are the only ones
capable of defining what service truly is. (Penin, 2018, 20) However, it is hard, if not
impossible to develop services that the users have defined with their needs. For this spe-
cific reason, it is important to be able to break down service into small proportions. De-
signing all small pieces in the context makes it become a whole service. (Downe, 2020,
23)
The developed service must be beneficial for the entire organization as well as sustainable
enough to have a positive impact instead of a negative one. This is of importance to be
able to supply long-term value to the service users. A better planned and developed ser-
vice for the customers is often at the same time a better service for the supply organization
too. (Downe, 2020, 14) Most organizations consider their services as a range of

18
individual actions which must be completed according to a predetermined order. Whereas
the users only see it as an activity which is needed to be completed. (Downe, 2020, 23)
There are some basic requirements set for services, which most consumers are seeking in
all the services they are interacting with and can therefore be quite generalized. Most
individuals are seeking clear services, meaning that there is no left space for speculation
about the purpose of the service. A good service can be generalized to some extent and
described to be easy to access, does not require prior knowledge to use, and should be
capable of responding to changes quickly. (Downe, 2020, 14)
2.6.1 Consumer´s voice
Voice of Consumer (VOC) means the information collected directly from the consumers
regarding their preferences and needs. To have success, it should be brought in already in
the early product development phases and kept along through the process until the product
launch. Consumer voice can be held as one of the cornerstones for the success of any
newly developed product or service. (Assimakopoulos, 2022)
Often product developers aim to estimate the dependency that takes place in the intention
of purchasing, certain product features, or in what ways the products are used. Consumers
play an important factor when it is to understand what to focus on regarding the target
market as well as possible improvement ideas during the development process. (Arboretti,
De Dominicis, Jones and Salmaso, 2020) Research indicates that many organizations
have never reached great market success or their full potential on the market due to failure
of listening and meeting consumer needs. Even though the product or service idea would
be exceptional, it needs to meet the consumer’s needs to grow and be successful. (As-
simakopoulos, 2022)
Consumer voice can be measured through various alternatives that are representing con-
sumers’ opinions and preferences. Those are often measured on scales; either on an ordi-
nary or binary scale and answers can be for instance satisfied/unsatisfied. Consumer’s
voice is something that can often be seen asked consumers to improve products or ser-
vices of businesses. (Arboretti, De Dominicis, Jones and Salmaso, 2020) This thesis aims

19
to find out what the consumer’s voice is regarding the preferences towards fitness centers
serviced used.
2.7 Summary
The time of the existence of the Covid-19 pandemic, the time that humankind has been
conscious of the pandemic, will leave its mark after the pandemic is someday defeated.
By now it can be seen that especially the healthcare sector and economy have been hit
hard by the effects of Covid-19. Many businesses have not had a chance of survival and
have had to close their doors temporarily or permanently due to financial problems.
Fitness centers have suffered from the pandemic especially when the government in-
structed all “unnecessary” service providers to close temporarily with the hope of getting
the spread of the virus in control. Once the situation turned for the better places were
allowed to open for a certain amount of people, still trying to minimize the spread of the
virus.
Consumer behavior varies among individuals and therefore people spend their money and
time differently depending on what they see as valuable and important for themselves.
Once consumers find a product or service that satisfies their needs or over exceeds their
expectations, they are likely to recommend it forwards and possibly bring new customers.
Since the market has a wide variety of options for similar products and services, the con-
sumers often go with the option that gives some extra value. The only person who can
determine what a service is as well as its value of it, are the ones using them, meaning the
consumers. The better service is planned and developed, the more the customers benefit
from it as well as the entire supply organization.
Some aspects of services can be generalized as requirements as those are always sought
for in services. Clear services, with no space for speculation regarding the purpose of the
service. It should also be easy to access the service and should not require any prior
knowledge on how to use it. Consumer´s voice is important to have in mind throughout
the entire development process, to avoid the failure of success due to not meeting the
needs of the consumers.

20
Consumer satisfaction can be held as the key performance indicator for organizations. It
is easy to measure satisfaction through customer satisfaction surveys and evaluate the
responses through questions regarding the value gained from service in comparison with
the individual´s needs. A five-point scale provides the researcher with more information
than just yes/no answers and therefore those are favored in the survey design. Another
measurement instrument is the SERVIQUAL -model which measures the gap between
expectations and actual experiences gained, consisting of 22 questions or only five di-
mensions if using the simplified RATERATER model
3 METHOD
This chapter describes the empirical research part conducted for this thesis and how it
was executed. First, the chosen method will be discussed and evaluated. The objective of
this study was to determine what consumers value in their services and if consumer pref-
erences vary between different segments. Also, how the Fitness center X has met those
later identified; important perceptions of their members will be discussed. Given the pur-
pose of this study, a quantitative data collection method was adopted and identified to fit
best the nature of the research. Quantitative research includes the collection of numerical
data and often in often large amounts. Measurements enable the identification of the
smallest differences between individuals, such as satisfaction with a service. (Bryman and
Bell, 2018, 76-77) The author chose a self-completion questionnaire as a research ap-
proach since the thesis focuses on investigating the consumer preferences of a rather large
population. It is common to use a self-completion questionnaire rather than structured
interviews due to it being faster to administer and oversee when having a large participant
group. (Bryman, 2012, 233)
3.1 Quantitative research
Quantitative research is not commonly as linear nor as straight forward as Figure 1 im-
plies. The figure however only aims to show the main steps included in a quantitative
research approach and an indicator of the possible interconnections between the steps of
the process. (Bryman, 2012, 161)

21
This research conducted for this study follows quite well the structure of quantitative
research (see Figure 1), only since this is not experimental research, there is no hypothe-
sis. (Bryman, 2012, 46) The research design could be identified as a descriptive research
design, as the study is aiming to find similar behavior or characteristics among the par-
ticipants. (Bairagi and Munot, 2019) Since this study is a case study, the population used
are the members of the case study, in this case, the members of the fitness center X, and
this is determined during the next step in the process. The respondents should be chosen
wisely so that they can provide the data needed for the completion of the study. This
research is not experimental but cross-functional and therefore the data collection would
take place either through interviews or through the distribution of a self-completion ques-
tionnaire.
In quantitative research after the data is collected, it needs to be transformed into data that
can later be quantified. For this research, the data was collected through a questionnaire
after which the data was processed using various data analysis methods. The last step of
the process is completed with the assistance of different data analyzing techniques. What
is mainly done is the sorting of the data, what of it is informative to the research, and are
there for instance connections between variables and to form the data so that others can
understand the results as well in addition to the researcher. During the process of analyz-
ing the gathered data, findings will be made for which the researcher then searches for
possible connections? Are the findings supported by the theoretical framework of the
study? (Bryman, 2012, 161-162)

22
Figure 1. An outline of the main steps of quantitative research. (Bryman, 2012, 161)
3.2 Choice of respondents
This research focused on investigating consumer preferences of Fitness Center X´s mem-
bers regarding services and how well the services now and during the Covid-19 pandemic
have met the consumer’s demand. What are the most important factors for customers
regarding the fitness center services and are there differences in preferences among dif-
ferent segment groups? As the research focuses on investigating the fitness center X´s
members’ preferences, are the members of fitness center X the participants, the popula-
tion for this study. The members of the fitness center are the only ones able to provide the
required data for customer satisfaction research since they are the ones using the services
of the fitness center.
Different segment groups that are compared are the remote workers and non-remote
workers, the differences among age groups as well as potential differences between gen-
der. Those are variables to which this research is aiming to provide an answer through
analyzing the data gained from the members who took the distributed survey. According
to the Fitness center´s owner the member letter was sent out to 850 members of which 57

23
responded to the survey giving it the percentage answer rate of 6,7%. The representative-
ness is relatively small with only 57 responses, yet it still gives enough data which can be
analyzed. It however won´t necessarily be possible to generalize the results later to certain
segments for instance if there have only been a few responses to a certain segment group.
3.3 Data collection- Questionnaire
The self-questionnaire is a commonly used data gathering method in quantitative re-
search. It however requires the participant to be able to answer the questions by them-
selves as the researcher won´t be present explaining the questions. The questions were
developed based on the theoretical framework of the study while having the research
questions in mind along the way. The survey included some questions that were rather
irrelevant for this case study, but which the beneficiary requested to add as it is valuable
data for the organization.
The first objective when developing a questionnaire is to determine the information that
is acquired to be collected and what questions would provide those answers. This is a
combination of the research objectives as well as the used survey design. (Brace, 2018,
6) Questions asked in the questionnaire need to be worded according to the everyday
vocabulary of the respondents and straightforward so that they are not misunderstood.
(Brace, 2018, 9) The researcher aimed to formulate the questions so that no confusion
would arise among the participants regarding the phrasing of the questions. Yes or no
answer options leave a spectrum of positive and negative answer responses. Those ques-
tions should be formulated differently using for instance “How” questions and response
options to that. (Surveymonkey, n.d.) This adjustment provides a better idea of what the
needs towards something are, in this research case the needs towards the provided ser-
vices. Therefore, also the questionnaire invented for this research did not include “yes”
or “no” answer options to the questions asked.
Also, own opinions (the researchers) should be left out of the questions, to let the re-
spondents be objective towards the questions. To give the respondents more freedom
when answering while also hoping to get a good response rate, not every question is
marked as mandatory if it might not concern all participants and the participants may

24
therefore skip certain questions. Questions not mandatory in this research was the speci-
fying question regarding the online group training service during the COVID-19 pan-
demic as well as the open-ended feedback question at the end of the questionnaire. (Sur-
veymonkey, n.d.)
Open-ended questions are questions where the respondents can reply to whatever they
desire whereas closed-ended questions have a set of fixed answer alternatives from which
to choose. (Bryman, 2012, 246) Self-completion questionnaires have fewer open-ended
questions than structured interviews would have since closed questions are easier to an-
swer. (Bryman, 2012, 233) When developing the questions, the researcher invested not
only in the question formulation but also in the answer options. The researcher ensured
that there were no own opinions included.
The questions were developed based on the purpose of this research and the aim of an-
swering the research questions earlier stated. Therefore, the gathered data can be later
used to answer the research questions and to draw conclusions. The research question-
naire was conducted only electronically online and did not have the option to fill in a
paper version. In today’s modern time, the online questionnaire seemed more accurate
than a paper to fill. In addition, since everything is online, it is less time-consuming, and
effort is taken to the participants to complete and later also for the author to analyze.
The questionnaire was sent out to all the members that have a permanent membership or
a 10-time individual purchased gym card to the fitness center X. It is expected that the
population will consist of individuals belonging to different segment groups such as stu-
dents, working people, elderly people, or some other segment. The distribution of the
questionnaire took place through an electronic member letter sent out by the owner of the
fitness center X. The sent email consisted of a short cover letter explaining the purpose
of the questionnaire and by whom it was conducted. It also included a short description
of how it benefits the customers themselves, as it provides fitness center X with valuable
customer service data and helps the fitness center improve its services. The questionnaire
itself was developed with google forms and a link to access the questionnaire was attached
to the member letter which was sent out. Due to the survey itself being answered online,

25
the responses will automatically be gathered to google forms, from where the researcher
has the possibility of taking a closer look at the individual responses given.
3.4 Research approach/ Data used in the study
The participants were provided with an electronic link through which they could access
the questionnaire with a total of 20 questions. Some of the questions included multiple,
to each other related questions or rather statements regarding consumer preferences to-
wards the different aspects of services. Since this research was focused on consumer pref-
erences and finding out what possible differences there are among individuals, a Likert
scale was used as a responding method to 14/20 of the questions. The Likert scale is
named after its inventor, Rensis Likert. The scale essentially measures the intensity or
preferences related to a specific area.
The Likert scale composes of several statements, for which each responder is asked to
evaluate their agreement with the statements on a five-point scale. The five-point scale is
the most used, even though other variations are possible as well, such as the sometimes
seen seven-point scale. The scale often goes from “strongly disagree” to “strongly agree”
or similar answer options where two opposites are provided at the ends and a neutral
response option in the middle. (Bryman, 2012, 166) A five-point Likert scale is a com-
monly used format when measuring attitudes towards something. (Bryman and Bell,
2018) Each respondent answers to all the statements in the questionnaire after which the
given answers are scored. All scores are then calculated together to form an overall score
of all the gathered results. (Bryman, 2012, 166)
Personal factual questions asked in the questionnaire consisted of age, gender, occupa-
tion, and how long the participants have been members of the fitness center. Those ques-
tions were answered with multiple choice answer options. Forage, different age gaps were
given, and the participant chose the one they fit in according to their age. For gender,
there were the options of female, male, not wishing to reply, or something else. As this
research is conducted for Fitness Center X, it was thought of being relevant to also know
how long the members have been members of this specific fitness center. It was also
asked how often the respondents exercise in general every week, followed by a question

26
regarding how many times a week the member visits the gym for exercise. Both questions
had the options of 1-2, 2-3. 3-4 or the 5 or more times.
To collect data regarding consumers’ possible behavior changes, the consumers were
asked to think 6 months back and one month ahead, did they recognize development in
either direction, of exercising more or on the contrary less than before? Concerning this
thesis and the consumer preferences, participants were given a list of statements where
they had to evaluate how important each statement is, followed by the question of how
well fitness center X fulfills those preferences. Both questions had multiple aspects in
which consumers were asked to provide the best fitting alternative out of the given five-
point scale. They were answered on a five-step Likert scale to get an overall view of the
deviation of the responses.
Questions asked in the questionnaire where the Likert scale was used (see appendix) were
also “How important are the following serviced to you?” after which came to a list of the
various services that were offered and the participants were asked to rate those from 1-5,
from” not important at all” to” very important”. Also, the question “How important were
the following services to you during the pandemic?” was answered on a Likert scale and
the respondents were asked to provide the best fitting alternative from the answer scale
from ”not important” to ”very important” with the numbers varying from 1-5. Likert scale
was used for most of the questions as it provides a better understanding of consumers’
views and preferences than regular multiple-choice answer options. The answer options
were slightly different depending on how the question itself has formulated yet all answer
options in this survey used a Likert scale from 1-to 5. It is important to keep the answer
options in a balance between the positive and negative response options. The five-point
Likert scale fulfills this as the response range has a neutral response in the middle and
two positive and two negative response options towards the sides. (Bryman and Bell,
2018)
As previously mentioned, one of the research questions is to compare differences between
consumer segments. One of the segments to compare was the remote workers/students
and nonremote workers/students. To be able to make conclusions regarding differences
in the preferences between segments, the Questionnaire had a question regarding the

27
respondent’s work or study patterns, depending on their occupation. To enlarge the ana-
lyzing possibilities the participants were asked whether or not they are working regular
work hours. An additional question was regarding the number of online studies or dis-
tance working of the participants, “how much did you work/study remotely during the
COVID-19 pandemic?”.
3.5 Analysis of the data /statistical analyses
The statistical analysis IBM SPSS statistics (SPSS) is a commonly used tool for generat-
ing frequency tables. It indicates the number as well as the percentage of the whole sam-
ple, belonging to certain groups. Also, for this data analysis, it was found beneficial and
therefore taken into use. With the frequency tables, different variables can be presented,
such as age. (Bryman and Bell, 2018, 177) In this case, study, how often individuals ex-
ercise generally in a week and how many of the participants were working remotely dur-
ing the COVID-19 pandemic, were presented through tables.
Various charts and diagrams of the results were created to visualize the analyzed data
results better. The research questionnaire included questions regarding consumer prefer-
ences towards a fitness center in general and for example the helpfulness and knowledge
of their members. Followed by the question of how well Fitness Center X fulfills those
perceptions. The possible differences in the results of those two questions can be visual-
ized better through diagrams where the differences can be recognized clearer.
Important measurements of the data are also the mode, median, and mean. Mode is called
the value which appears most frequently in the results, such as what did the participants
lay the highest priority on, cleanliness at the gym or the overall environment? This is of
importance to this research as the research questions are investigating consumer prefer-
ences and possible differences in them. The median on the other hand points to the mid-
point of the complete distribution of scores. For instance, the average age of the partici-
pants of this research can be calculated by putting all ages in a line and flinging the age
in the middle, in case there are two middle ages would the mean be calculated by taking
the mean of those two middle numbers. The mean on the other hand indicates the average.
How old are the participants on average? Or how often do the members visit the fitness

28
center in a week on average? The amount of dispersion was calculated by calculating the
standard deviation, which can be named the amount of variation around the previously
calculated mean. This research indicates how much the answer we are interested in devi-
ated from the mean.
3.6 Validity and reliability
Even though the questionnaire was sent to all members having a permanent membership,
it won´t necessarily reach everyone due to the possibility of ending up in the spam mail-
box. Others might not have their contact information up to date, resulting in not receiving
the member letter with the survey included at all. In addition, some members are expected
not to want to respond nor have the time for taking the survey.
Another barrier could potentially be the language of the questionnaire, which is Finnish.
It cannot be ensured that everyone speaks Finnish, and this might be some of the barriers
why not take the survey. To take the survey, it is needed to have some knowledge of
Finnish. Previously sent member letters of the fitness center X were also only available
in Finnish and therefore this survey is also conducted only in Finnish.
The questions of the questionnaire were tried to develop using regular, everyday vocab-
ulary without any fanciful terminology. This is a method whit which it is tried to ensure
that the possible errors leading from unfamiliar vocabulary are minimized. Yet there is
the possibility of someone still not understanding the nature of the questions or the re-
sponse options of the Likert scale. The scale used was defined and over each point on the
scale was written what it stands for, to try to assist the respondents to understand the
answer options as well as how the questions should be responded to.
The reliability is partly ensured by only sending the questionnaire to the members of Fit-
ness Center X, who are the users of the services and therefore eligible to respond to the
questions stated in the questionnaire. Since the research focuses on evaluating the cus-
tomer satisfaction of Fitness Center X´s members, the results cannot be generalized to
cover also the satisfaction of other fitness facilities. This is due to the varying environ-
ment at the fitness centers and differences in the offered services.

29
4 RESULTS
This chapter presents the results gathered from the customer survey conducted for Fitness
Center X regarding their service offering and consumers´ preferences. Only questions and
results important for this study are presented and analyzed in this chapter, but the entire
data can be found in the attached appendix. The questions chosen to be presented in the
results chapter revolve around preferences, service offering before and during the pan-
demic.
The questions presented are concerning the old and new services of the fitness center, the
consumers overall preferences as well as how Fitness Center X has managed to meet
those preferences. In addition, also the answers to the question regarding the members’
work hours, whether they have office work hours, were analyzed. The comparison of
segment groups is conducted by reducing the gathered data to only show the relevant
findings since for some segments the number of respondents was too low to be reliably
considered. Segment groups will be analyzed through comparing the results of prefer-
ences are age, gender, and work hours.
The results are analyzed based on the methods described in the Chapter 4 methods previ-
ously described in the methodology which were, for instance, calculating the mean, me-
dian, and mode. In addition, the statistical analysis IBM SPSS statistics (SPSS) was used
for some questions to calculate frequency tables of which some also include the percent-
ages of the results. Other questions were transformed with the help of excel, to create
graphs with which, for instance, it was possible to compare and analyze different seg-
ments.
4.1 Services
One of the research questions of this study was, how the newly developed services, ser-
vices that have come to exist during the pandemic and have been affected by the re-
strictions in place, have met the consumer’s preferences. The survey asked the respond-
ents on a Likert scale how important they find the services offered by Fitness Center X,
the gym access, group classes, and the personal training services. Those were services

30
offered before the pandemic. During the pandemic Fitness Center X´s gym was only pos-
sible to access by booking a one-hour timeslot via the booking system. For this hour the
gym was reserved only to that member who made the booking. The group classes were
held through the Instagram live function, and weights were rented out for members, giv-
ing them the opportunity to exercise at home. If none of those options suited the members,
there was the option of freezing the membership, for that time period the member fees
were put on hold. However, in case the members had a 112-monthcontract, the end date
of their contract was pushed back so that they had the same number of chargeable months
as initially planned. Below are the responses of the members, regarding how important
the services before the pandemic (Figure 2) and the services during the pandemic (Figure
3) were for them.
The results show, that before the pandemic the fitness center was mainly visited to do
weight training, which also continued throughout the pandemic, just in the form of using
the booking system and training for max one hour at a time. Before the pandemic 39
respondents said that gym exercise is very important for them, 14 thought it is quite im-
portant, one person had a neutral opinion, one found it a little important and for two per-
sons the fitness centers weight training didn´t have importance at all. The mean answer
was 4,5 which indicates that the gym was between quite important and highly important
for the majority of the respondents. Group classes and personal training services were not
considered as important by most of the respondents (Figure 2). Of the total of 57 respond-
ents, 33 chose the answer option ”not important at all” when asking about the importance
of the group class service. 39 respondents chose the same answer alternative to the ques-
tion regarding the importance of personal training services, which makes the ”not im-
portant at all” the mode for both questions. The mean answer towards the importance of
group classes was 2,0 which represents the ”slightly important” answer option and the
mean for personal training services was 1,6 which is between ”not important at all” and
”slightly important”.

31
Figure 2. Services before the Covid-19 pandemic
For the question regarding the importance of the gym booking system during the pan-
demic, the answers were more distributed, indicating that when the members had free
access and unlimited training time, it was valued more. Of all the members answering the
survey, 32 respondents evaluated the booking system as highly important for them, 11 as
quite important, 6 chose the neutral answer option, 3 did not find it that important and 5
did not think it was important at all (Figure 3. Those responses together give an average
of 4,0, indicating that the booking system was on average ”quite important” to the re-
spondents. The renting of equipment was a completely new service and got quite big of
distribution with the average importance of 2,1 and therefore it was on average not found
”very important”. By percentage, the most often response was also given to the answer
option ”not important at all”. Instagram live group classes have the mode of ”not im-
portant at all”, meaning that this answer alternative was chosen the most. With an average
of 1,2 which is close to 1, which on the other hand stands for ”not important at all”, this
service was not relevant for 34 of the respondents.
0
5
10
15
20
25
30
35
40
Kuntosali(Gym) PT-palvelut
(Personal Trainerservice)
Ryhmäliikunta(Group exercise)
1. Ei tärkeä (Not important)
2. Hieman tärkeä (Somewhat important)
3. Neutraali (Netural)
4. Melko tärkeä (Quite important)
5. Erittäin tärkeä (Very important)

32
Figure 3. Services during the Covid-19 pandemic
The services offered have been modified relatively much due to the pandemic which has
lasted now for already over two years, from the beginning of 2020 to almost mid-2022.
Therefore, the researcher found it important and interesting to ask how satisfied the con-
sumers have been with the service offering over the past two years as this indicated how
satisfied the members have been with the new service offering. The majority evaluated
their satisfaction with the number 5 (35,1%) or the number 4 (47,4%). A few persons
responded with 1 and 2 answers (3,5% for both) and a total of 3 chose to respond neutrally
to the given question (Figure 4).
0
5
10
15
20
25
30
35
40
IG-live ryhmäliikunnat(Instagram live group
exercise)
Kuntosalinvarausjärjestelmä
(Gym booking system)
Välineiden vuokrauskotiin (Borrowing gymequipment for home)
Ei tärkeä (Not important)
Hieman tärkeä (Somewhat important)
3. Neutraali (Neutral)
4. Melko tärkeä (Quite important)
5. Erittäin tärkeä (Very important)

33
Figure 4. How satisfied have members been with Fitness Center X´s services in terms of given covid-19 restrictions, in
the past two years on a scale from 1 (very dissatisfied) to 5 (very satisfied)
4.2 Consumer preferences
Another area of research of this study is what factors of services do the members of Fit-
ness Center X value regarding the services? The customers were given questions regard-
ing the fitness centers employee’s knowledge and helpfulness, opening hours of the gym,
overall atmosphere, and cleanliness of the fitness center, how important are those factors
for the members on a general level? They were asked to rate their preferences on a scale
from 1-5 (Figure 5). The next question asked the participants, how well had Fitness Center
X managed to fulfil those preferences of theirs? (Figure 6)
Overall the most important aspect was the cleanliness of the fitness centers, which got 40
responses of ”very important” and through that a high average of 4,7. The wide opening
hours with 40 responses of ”very important” was another preference that was evaluated
as an important preference with an average answer response of 4,6. The overall atmos-
phere was important or quite important for a total of 51 respondents and got the answer
average of 4,4. The least important preference for the members was the web shop func-
tionality with an average of 3,2 together with the music played out loud at the gym with
the average of 3,0. During the Covid-19 pandemic also the equipment used was by Fitness
0
5
10
15
20
25
30
1
2
3
4
5

34
Center X required to be disinfected after usage. Even though disinfecting the equipment
is required on the behalf of the fitness center, for the members taking this survey, this
aspect was overall rated as ”quite important” with an average of 3,9.
The members’ preferences towards the staff were aimed to find out with giving three
statements regarding traits consumers prefer in the staff and asking to evaluate those on
a scale of 1-5, how important are those factors to the members. How important is it for
members that the employees have knowledge, are eager to help and in general are avail-
able at the fitness center during the opening hours? Out of those statements, the helpful-
ness of the staff was rated as most important and the availability of the staff during the
opening hours as least important. The average answer rates to the questions had a rela-
tively large variation. The knowledge of the employees got the average 3,3, the helpful-
ness got 4,1 and the availability of the employees got an average of 2,8 on the Likert scale
from to 1 to 5.
Figure 5. How important are the following preferences to you? on a scale from 1-5.
Above was shown (Figure 5) how important various preferences are to the members on a
general level. The researcher found it interesting and relevant to find out how those

35
preferences of the members are met by Fitness Center X. In order to find this out, the
same questions were stated, giving the same Likert scale from 1-5, just with changing the
question layout to how have those preferences just evaluated been met by Fitness Center
X? (Figure 6)
The difference between the questions was that the other question asked to evaluate pref-
erences on a general level whereas the other question asked how Fitness Center X has
managed those preferences of the members. Therefore, the second question also included
those previously described three sub statements related to the employees of the fitness
center. The respondents rated the helpfulness of the staff members of Fitness Center X
with an average of 4,4 of the full five of the scale. The knowledge of the employee got an
average of 4,2 and the availability of the staff an average of 3,6.
All the statement of the statements were focused on Fitness Center X´s abilities to fulfil
the preferences of its members. The overall cleanliness of the gym was evaluated with an
average of 3,8, leaning towards the “quite satisfied” answer option. The atmosphere at
the fitness center and the possibility of disinfecting the used equipment, both gained an
average of 4,2. The opening hours of the fitness center reached an average of 4,8 which
is close to fully satisfying the customers’ preferences in regard to when the members have
the option of working out. The lowest answers, and through that the lowest average, was
given to the music played out loud at the gym with an average of 3,4. The functionality
of the web shop where memberships can be bought and modified was rated an average of
3.7 out of 5.

36
Figure 6. How do you feel do the Fitness Center X´s services meet your preferences? on a scale from 1-to 5.
4.3 Overall satisfaction
An indication of overall satisfaction can for instance be found out by how likely the mem-
bers would recommend the services they use to others such as friends and family. In this
consumer satisfaction research, the researcher placed a question at the end of the ques-
tionnaire asking, “how likely the respondents would recommend Fitness Center X to oth-
ers?” The question was even so answered on a scale from 1-to 5 (Figure 7)
Of the total of 57 responses 40 said that they would very likely recommend Fitness Center
X to others. Quite likely, 12 people would recommend it and 4 chose to be neutral towards
the given question. Only one respondent chose the option of not very likely, indicating
that this individual might not be so satisfied with the service and therefore would not
recommend the Fitness Center X to others. When looking and calculating the average,
which is 4,6 and indicated that it is very likely that the current members would recom-
mend the Fitness Center X to others.

37
Figure 7. How likely would you recommend the fitness center to others (1 (very unlikely) - 5 (very likely))?
4.4 Differences between segments
Segments that were previously mentioned that are being discussed are the age, gender
and whether the members have had regular working hours or not. What is tried to be
found out is that has, for instance, age or gender affected the preferences individuals have
towards services? In order to answer this research question of the study the researcher
calculated the averages of all the gained responses and transferred those onto an excel
sheet with new charts by using the averages calculated of the answers of each segment
group, to support the analyzing.
4.4.1 Age
Figure 8 shows the age distribution of the respondents using relatively wide age group.
The mode for the first question of the survey, the age, was the age group 41-60- years
which gathered 30 responses (52,6%) out of all the gathered answers. This shows that
more than half of the respondents were over 41 years yet under 60 years old. The second-
largest group was the respondents of age 26-40-years with 15 responses (26,3%). The
remaining answers were divided evenly among the three other age groups which were the
under 18-years, 18-25- years, and 26-40- years old, giving all age groups 4 responses
0
5
10
15
20
25
30
35
40
2
3
4
5

38
(7%). The median age-group of the respondents of the study was the age group marked
green on the pie chart, the 41-60-year-old members.
Figure 8 Age distribution of respondents
Looking at the graph comparing the age to how well everyone’s preferences are met (Er-
ror! Reference source not found.), it is noticeable that the younger generations, meaning
participants under 25 years of age, preferences seem to have been met overall slightly
better than the of the respondent of age 26 years and over. With the age groups “under
18” and “18-25 years” the results were nearly all the time of the average 4 or 5, indicating
that the preferences are met “quite well” or “very well”. How the preferences of the age
group in the middle with 26-40 year´s old, has been met fluctuates a bit more, not reaching
the completely satisfied level, yet always being over the average of neutral, more towards
“quite satisfied”. On the other hand, when looking at the respondents of the age 41 years
and above, the overall level of meeting the preferences seems to decrease. In Error! Ref-
erence source not found. can be seen that for the age groups 41 and above the given
responses are remarkable lower in nearly all categories compared to responses given by
younger people.
When looking at the overall score of how preferences are met, the age group under 18 has
an average of 4,3, the age group 18-25 years has the average 4,7, 26-40 years got 4,1.
7 %7 %
26 %
53 %
7 %
Alle 18-vuotta (under 18 years)
18-25-vuotta (18-25 years)
26-40-vuotta (25-40 years)
41-60-vuotta (41-60 years)
yli 61-vuotta (over 61 years)

39
Respondents of the age 41-60 years reached an average of 4,0 and the members of age of
61 and over years gained an average of 3,8. The overall preferences of the 18-25 year old
members are met the best and the ones of the age 61 and over the least, yet only with an
0,5 decimals maximum difference between age groups.
Figure 9. How are preferences met depending on age groups
The age groups 26-40 years with 15 responses and 41-60 years with 30 responses got the
most responses as all the other age groups each only gained 4 responses. This makes a
overall comparison partly difficult as the percentage of answers is very unevenly distrib-
uted. Therefore, only the two largest age groups are used for further discussion to show
possible differences clearer, with eliminating the relatively lesser answers (Figure 10).
Among those two age groups the younger age group has shown more satisfaction in all
statements compared to the older age group yet keeping the differences relatively small.
Both age groups agreed that their preference has been met best with the wide opening
hours, with an 4,9 average for the younger and 4,8 average for the older age group. The
lowest score on the other hand was given the music played at the fitness center, both age
groups giving the service a 3,3, average answer. The largest difference in the given an-
swers occurs in the statements concerning the cleanliness and overall atmosphere of Fit-
ness Center X. The older age group rated those two aspects lower than what the younger

40
age group average answers are indicating. The overall meeting of preferences when cal-
culating the responses given to all statements, has been evaluated as quite well with the
average of 4,1 and 4,0.
Figure 10. Comparison of the largest age groups in regard to their preferences
4.4.2 Gender
Of the respondents 39 were female, 17 male and one wished not to respond to this precise
question (Figure 11). As there was only one response on not wishing to choose female or
male, it is statistically not significant, and the result will therefore not be covered in this
analysis. The male and female responses align quite well with one another and are not
varying much for another (Figure 12). The statement regarding the satisfaction with the
music is the only statement which has a large difference between genders with women
having a score of 3,7 and male with 2,6. Looking at the overall score the preferences of
women are met by an average of 4,1 and the preferences of men by 3,9. Overall seen the
figure indicates the small differences between gender in terms of service preferences and
how those have been met.

41
Figure 11. Age distribution
Figure 12. Comparison of preferences between genders
4.4.3 Work hours
The researcher found it relevant to find out, how many of the respondents have regular
work hours. This can potentially influence the overall satisfaction as well as preferences
of the members as it also limits the possibilities of the members regarding, for example,
times of when to train. Studying and working according to office hours often limits the
hours available for exercising towards the evening, which is often also seen as the rush
hour at fitness centers. The answer options to the question “Do you work during office
hours” were “yes”, “no”, “I don´t work” and “I wish not to answer”. The majority with
40 responses answered “yes”, so they have regular office work hours. This also indicates
that the mode and median is the option yes. Twelve respondents have irregular work hours
68 %
30 %
2 %Nainen (Female)
Mies (Male)
En halua vastata(I do not want toanswer)

42
or work outside of the regular office hours, whereas two wished not to respond to the
given question regarding their worktimes and three were according to responses not work-
ing at the time (Figure 13).
Figure 13. Work hours of the participants
When looking at the graph with the average satisfaction towards consumer preferences it
can be noticed that those working outside office hours or are not working at the moment
have overall been more satisfied than those who work office hours or have not responded
whether or not they were working (Figure 14). The overall satisfaction score is for those
who have regular office workhours 4,0, for those having other workhours 4,3, not work-
ing 4,3 and those not wishing to pick any of those options 3,6. The options of not working
or not preferring to answer both only got 4 responses. Those two are left out of further
discussion as they got so few answers that they are not completely comparable.
70 %
21 %
5 %4 %
Regular office hours
No regular office hours
Does not work
Did not want to answer
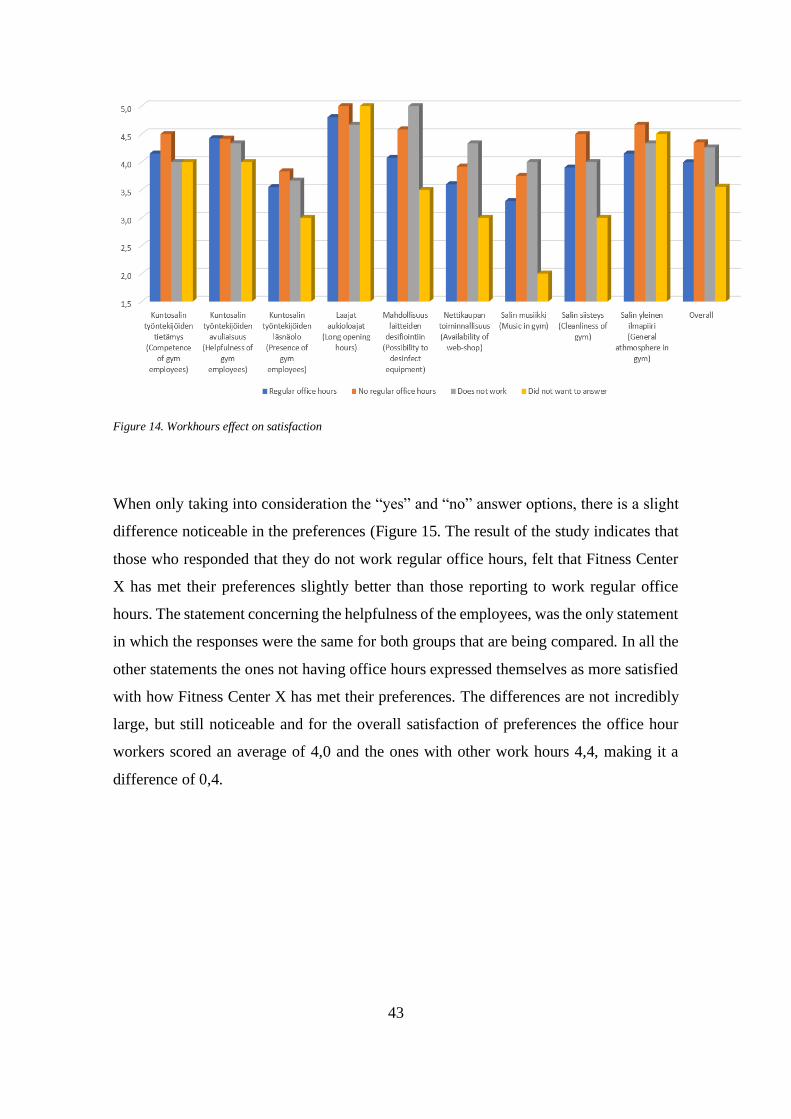
43
Figure 14. Workhours effect on satisfaction
When only taking into consideration the “yes” and “no” answer options, there is a slight
difference noticeable in the preferences (Figure 15. The result of the study indicates that
those who responded that they do not work regular office hours, felt that Fitness Center
X has met their preferences slightly better than those reporting to work regular office
hours. The statement concerning the helpfulness of the employees, was the only statement
in which the responses were the same for both groups that are being compared. In all the
other statements the ones not having office hours expressed themselves as more satisfied
with how Fitness Center X has met their preferences. The differences are not incredibly
large, but still noticeable and for the overall satisfaction of preferences the office hour
workers scored an average of 4,0 and the ones with other work hours 4,4, making it a
difference of 0,4.

44
Figure 15. Comparison of preferences depending on workhours
5 DISCUSSION
In this chapter the results of the conducted study are analyzed and compared, having the
research questions of the study in mind. The analysis is done through the theoretical
framework which was earlier explained in the study. The first part of this chapter consists
of the gathered results of the customer satisfaction survey which then are discussed. The
segment groups earlier identified are compared and possible differences mentioned, ex-
plained, and analyzed. Also, possible explanations for differences are discussed. The used
data gathering method will be discussed and analyzed in this same chapter, under its own
subheading.
5.1 Services
Fitness Center X tried their best to provide compensating services during the Covid pan-
demic to all services that had been available before the pandemic. With this, the customers
were aimed to offer as similar services as possible to also ensure that members stay mem-
bers and would not quit their memberships due to restrictions or modifications in the
services. According to Art Weinstein (2018), superior customer value means creating ex-
periences that in the best case exceed customer expectations. Being on the smaller end of

45
fitness centers when it comes to the size of the facilities in the industry, Fitness Center X
faced some challenges by only having limited space and options on what services to pro-
vide and how to modify those to get the full potential out of the compensating services.
Even if Fitness Center X faces some difficulties the research has shown that they managed
to respond well to the extraordinary circumstances which is shown by the positive rating
in the customers' answers.
Before the pandemic, Fitness Center X members valued most the possibility to train phys-
ically at the gym, which was not possible to the same extent during the pandemic. The
Personal Training services and group classes did not gain the same accreditation from the
customers before the pandemic. Those services were not held at Fitness Center X, but
only through live streaming. Even though the pandemic threw the whole fitness industry
upside down and services had to be modified, partly very much, the value of working out
at the gym stayed high also during the special time and circumstances of the Covid-19
pandemic.
When asking the members in the survey, how they would rate the importance of the av-
erage of appreciation. This indicates that working out physically at the fitness center was
the most important service for most members during the pandemic. It can be concluded
that the booking system did not reach the same value among members as what the possi-
bility of being freely able to access the fitness center whenever the members wanted. The
booking system service also had a negative side due to not being able to guarantee that
there were enough timeslots for everyone as only one person was allowed to train at once
and the hours in a day are limited. On the positive side, once one got a training slot, they
had the entire gym for themselves and did not for instance have to wait for a machine to
be available.
Borrowing equipment was also rated as at least somewhat important by more than half of
the respondents. The borrowing enabled training at home whenever one wanted. The
types of workouts one could do were more limited. The intensity was not necessarily on
the same level when working out in your living room or yard as when physically visiting
the fitness center’s facilities. Not everyone was guaranteed a timeslot in the booking sys-
tem, so this service allowed the possibility to include some weight training in the workout

46
routines. It is known that the motivation for working out at home is often not the greatest
since the whole surrounding environment at the fitness center works as a motivator. Lack
of space at home, where to exercise might be another reason why not all members did
find this service of importance to them. In addition, individuals only had the opportunity
to take one set of dumbbells or a weight bar, which also limits the movements one can
conduct in case the weights were too heavy or light. On the other hand, the Instagram live
stream group classes did not reach great success during the pandemic when looking at
how the members evaluated the importance of this service. The group exercise classes
were not of high priority for most members before the pandemic, but the importance de-
creased, even more, when the classes had to be moved to the live streaming solution.
Partially the decrease might have occurred due to not everyone having Instagram or the
knowledge of how to use the application. Members might also not have had enough space
at home to complete the workouts at home since some might require relatively much
space.
The guidelines given by the government were what affected the offer of the services of
the fitness center the most. Keeping the consumer voice in mind throughout the entire
process of developing the modified compensating services most likely supported the sat-
isfaction of the members. According to Assimakopoulos (2022) this precisely is the cor-
nerstone for the success of newly developed services, listening to the consumers. Services
such as the booking system for Fitness Center X were developed to provide the option of
continuing to work out at the physical fitness center, which according to this study, has
been identified as the most important service for members as well before as also during
the Covid pandemic. None of the services offered during the pandemic existed in that
form before, as there had not been the need for it earlier on. The consumer´s voice was
applied and for instance, the physical training at the fitness center continued throughout
the pandemic, following the given guidelines.
5.2 Preferences
Westbrook and Reilly (1983) have discussed that the value percept disparity theory can
best be defined according to which extent the services are obtained by the consumers, in
other words how well they meet the consumer’s desires. This theory was widely applied

47
to the study since this can be assessed through different scales where consumers evaluate
how the service has met their needs. As also previously discussed in the theory chapter,
the preferences of consumers can be measured best by asking the consumers to rate on a
scale, preferably on a Likert scale, how well a service for instance has met their needs.
Questions were given values on a Likert scale, depending on how well the preferences
are met. Answers given to the value 1 or 2 indicate that the consumers have not been very
satisfied whit that specific fulfilment of preference and there might be room for improve-
ment. High values such as 4 and 5 on the other hand indicate that the consumer’s prefer-
ences have been well met. When services fulfill consumer expectations and preferences,
it has a positive correlation with consumer satisfaction. The value percept disparity theory
was in the theory chapter identified as a method of measuring satisfaction. Gathering the
Fitness Center X´s members’ evaluation on how well preferences are met assesses exactly
what this theory aims for, how well does the service provider compare to the individual
needs.
When getting into the statistics it can be noted that by far the most important factors in
services to the members were the cleanliness of the fitness center, the overall atmosphere
together with the wide opening hours. The cleanliness might also have got more weight
due to the pandemic and the discussions of the possibility Covid being contagious also
over surfaces. Another factor might potentially be that it feels nicer to train when the
environment looks clean and not like a complete mess. The possibility to disinfect the
used equipment was also a statement in the survey which on a general level was valued
high by the members. Some dispersion could be found since some responses gave the
impression that this additional service factor might not at all be of importance to others.
The differences in this service factor could potentially have been affected by factors such
as the different health conditions of members as well as their age. If you are generally
healthy and do not have any long-term illnesses, you might not lay much value on disin-
fecting the equipment as one might think that in case the virus hits them, it will not do
any harm. Those individuals on the other hand who are belonging to the risk groups might
fear the virus more as it could be fatal for them. Age, on the other hand, might affect this
statement by the fact, that elderly people can often be seen as more careful and responsible
compared to those who for instance are just entering adulthood. Many of the respondents

48
were belonging to the older age groups and might therefore lay more value on the im-
portance of cleanliness, including the disinfection possibility.
People have different life situations which might have an impact on when they have the
time and possibility to exercise. Often working out on a flexible schedule when it suits
them the best is what consumers prefer the most. Fitness Center X is open around the
clock for its members who all should have a key with which to get through the gates. The
times when the members have time to work out also depend on their occupation. Students
and office hours workers generally seen, will not necessarily have the possibility to
workout at any other time than in the evenings. Elderly people and members with other
day schedules on the other hand might prefer working out in the mornings or throughout
the day, to keep a daily rhythm and potentially also to avoid the rush hours of the eve-
nings. Since Fitness Center X is a rather small fitness center, in the fitness industry, there
are often the same groups of people working out at similar times throughout the week.
When the overall atmosphere is open and positive it is for everyone nicer to exercise, and
no one has to have the fear of being judged by how they work out.
The importance regarding the knowledge, presence, and helpfulness of the staff was on a
general level mostly evaluated high, yet also having responses indicating that those as-
pects were not of importance for all. When comparing the overall preferences and the
responses of how well Fitness Center X´s staff meets them, the outcome is very positive.
Most members believed the staff is either somewhat or very helpful and has the
knowledge needed. When it comes to the presence of the staff, a few responded that this
preference is only weakly fulfilled or not at all. The staff is usually only present for a few
hours in the evenings and a few hours on Saturday mornings. This might be inconvenient
for those who are working out in the mornings and during the daytime, as staff will not
be present during those times, and they will not have the possibility to have face-to-face
guidance from the employees.
The music played out loud at the gym got an overall importance score of 3,0 which indi-
cates that for some it was of importance whereas, for others, who perhaps have their head-
phones, it was not seen as important and potentially even annoying. The average of how
the music at Fitness Center X meets the preferences was 3,4. It is hard to tell what it is

49
that the customers seek in the music or if they would potentially have preferred that it is
completely turned off. Perhaps the music is not in everyone’s genre taste, they have heard
the played songs too often or it is so quiet that it is more irritating than enjoyable. On the
other hand, it might be exactly someone’s genre taste or someone’s favorite songs that
are being played which they would have listened to even through their headphones.
5.3 Overall satisfaction
The overall preferences showed what members truly value in their services and those
responses the author compared to how well Fitness Center X meets them. This question
provided the possibility to measure how satisfied the members of the fitness center are on
an overall level. As discussed earlier in the report, the satisfaction score is a customer
satisfaction measure. The question regarding the overall service satisfaction was reflected
in the customer satisfaction score which was 4,6. The score implies that even though some
respondents did not give full points to how Fitness Center X meets their preferences, on
an overall level the members are still very satisfied with how their preferences are taken
into consideration and met. According to Mohammad (2012) the importance of measuring
the satisfaction of consumers has almost become a fundamental concern for most organ-
izations. This was also of interest to Fitness Center X and the main reason for conducting
this research, as the satisfaction during the pandemic time might differ a lot from the old
normal.
It can also be noted that Fitness Center X has well adapted the simplified service quality
model to their organization. Bhasin (2021) had listed characteristics such as empathy,
responsiveness, and assurance to belonging to the RATER model. According to the re-
sults of this research it can be concluded that Fitness Center X has managed well to meet
those dimensions by giving attention to consumers and adapting the approaches and ser-
vices according to their preferences. It can also be noted that the organization is willing
to do everything to provide the best possible service to its consumers as they consider
development suggestions and have stayed open whenever possible during the pandemic,
whereas some places have remained closed as they have not seen it profitable to remain
open when for instance only one person at a time was allowed to train.

50
The majority of the respondents rated the service offering of the past two Covid years as
either good or very good. Naturally, there are a few respondents who were not completely
satisfied with the services but almost never everyone can be pleased when change occurs.
Consumers are the ones defining the value of the services and therefore it was a success
that Fitness Center X has managed to fulfil customers’ needs and offer them an adequate
equivalent for their membership fees. The results also indicate that the overall satisfaction
during the pandemic years has been at a relatively good level and the modification done
in services has been conducted, as far as possible, according to consumers’ preferences.
According to Huttunen (2020) customers are more likely to recommend services to others
when they themselves are satisfied with the service. Therefore, how likely members
would recommend Fitness Center X to others also works as a consumer satisfaction meas-
urement. The results of this study show that more than two-thirds of the respondents
would very likely recommend the fitness center from which can be concluded that the
existing consumers’ preferences have been well taken into consideration and those mem-
bers are getting in the services the preferences they seek.
When looking at results, the first thought of the author was that the members seem overall
quite satisfied with the service. Yet they do not meet the overall preferences as well as
they potentially could, so there is still room for improvement. The opening hours meet
the preferences well, yet what wider opening hours could the fitness center have, than
around the clock, which they now got. With an average of 3,8 on cleanliness, the Fitness
Center X is still meeting the preference quite well, yet there is space to improve the clean-
liness for instance adding cleaning shifts or providing additional guidelines to the mem-
bers for returning all used equipment after usage. This is something that not every mem-
ber takes into consideration, perhaps due to laziness.
The overall atmosphere was rated high by the members and this Fitness Center X has
managed to keep up with. Regarding the employees, the members seem all in all very
satisfied. Only the presence of the employees has also got responses of not satisfied and
could be improved with, for instance, widening the hours of their presence. One option
would be the distribution of attendance to different hours of the day or to different days.
Perhaps this could also be rotated between weeks, so that the staff would be present at
different times throughout the week. This however needs to be clearly communicated to

51
everyone, so that all members are aware when the employees are present. The schedule
logic should not be too complex and not changed frequently on short notice.
There could potentially be some service quality gaps which could explain the poor ratings
of preferences by some members. Hill and Alexander (2017) have listed five gaps of dis-
satisfaction and the results of this research could have been affected by any of those. In
case the service descriptions indicated differently than what the actual services were, or
the descriptions were unclear, and the consumer was therefore unsatisfied, could have
resulted in a lower evaluation of how the preferences are met. Since the researcher did
not further ask follow-up questions of why, what could have been improved or what af-
fected the evaluation, this question remains unanswered and can only be speculated on
what might have resulted in the gaps in satisfaction.
5.4 Differences between segments
Analyzed segmentations were age, gender, and whether members have office hours or
not. Those were by the researcher identified as potential factors affecting the preferences
of consumers. When comparing those segments to the meeting of their preferences it be-
comes clearer if there are differences and in case so, what differences can there be found.
5.4.1 Age
When analyzing the results of all five age groups, the age groups under 18 years and 18-
25 years have evaluated nearly all preferences higher than the older age groups of the
study. Therefore, it could be concluded that the younger generation of members is overall
more satisfied with the services offered. Yet it is to notice that the two age groups just
mentioned, we’re both in proportion to only 7% of the gathered responses. Younger indi-
viduals might have lower standards and needs and have therefore evaluated the meeting
of their preferences higher. The participants of the study were mainly belonging to the
age groups 26-40 years and 41-60 years old. Older members might, for instance, do more
comparisons between fitness centers and pay more attention to their surroundings and
overall environment, which might reflect in a lower evaluation of meeting their prefer-
ences. The oldest age group of over 61 years was on average the least satisfied group.

52
Affecting the satisfaction, elderly people might also resist change and prefer to have em-
ployees there to help if they need it. If members have previously visited a different fitness
center, they will compare the services of Fitness Center X to those of the other fitness
centers. Larger-sized fitness centers naturally have more space and often access to larger
resources as well.
The satisfaction is quite much on the same level when comparing the two largest age
groups. There is only a slight difference visible as the younger age group of 26-40 years
has evaluated nearly every preference slightly higher than the age group 41-60 years. The
age groups are defined relatively wide and therefore it is hard to tell what exact age the
most satisfied customers have. The only statement which got the same evaluation from
both age groups with 4,2 is the statement regarding the knowledge of the employees. On
behalf of the results, it can be noted that younger members might have fewer expectations
towards services or be satisfied with less, whereas the older people might expect more of
the services and therefore often be harder to please. Cleanliness for instance had one of
the largest dispersions, indicating that the younger age group finds that the fitness center
has managed to meet their preferences towards cleanliness better than the older age group
opinion was. It might be that the preferences of the younger members have been set lower
and therefore met better. Both age groups evaluated the statements regarding the staff
similarly, it can be noticed that they would appreciate it if the staff was more present.
Knowledge and helpfulness were seen on a quite good level, having only a small space
for improvement.
5.4.2 Gender
Two-thirds of the respondents, according to the gathered data were female. This might
indicate that the female individuals are more interested in having an impact on the ser-
vices. The survey was conducted to find out what are factors that can be improved, what
is the fitness center doing well now, and what do the members see, could be improved,
enhance the consumer satisfaction. Overall seen, the female respondents can be seen as
slightly more satisfied with the services. The biggest difference in meeting preferences is
in the music played at the gym where there is a 1,1 difference in the averages. The music
is often pop-gendered music, which might not be to everyone’s taste. Male members

53
might for instance prefer harder rock music instead of the hits of the current days which
the playlist mostly consists of, which could explain the difference. Perhaps either one of
the genders would prefer not to have music on at all and rather train in the noises coming
from others training or by listening to their music.
Another statement that got somewhat dispersion was the availability of disinfecting sup-
plies at the fitness center. Male members evaluated the availability as lower than what
female respondents did. For some part it might be that one of the genders cleans the
equipment less often than the other, if female members would not clean the equipment
regularly, they probably would not know where the supplies are located. On the other
hand, men might acquire even wider cleaning possibilities and therefore rate the possibil-
ity of cleaning lower. The cleanliness of the fitness center was to both genders rated as
relatively good and the overall atmosphere was even slightly above the margin of being
relatively satisfied.
5.4.3 Workhours
Workhours is the third and potentially also the segment which affects the satisfaction of
the members on the services the most. Individuals who are in the work-life only have a
limited leisure time to do what they wish which includes going to the fitness center. In
the study the question regarding work hours was investigating whether the respondents
have office work hours, usually meaning work hours from 8 anywhere until 5 p.m. In
general, students also spend this timeframe at school, and therefore also their training
time is affected by their occupation, even though this was not further investigated in the
study. Over 70% of the respondents were working office hours whereas 21% are working
other hours, also having a few respondents who currently are not in the work-life.
As previously in the theory chapter discussed, the Covid-19 has had a large impact on the
individual’s way of working. Many workplaces have offered their staff the option of
working from home in case the tasks are possible to be carried out remotely. On the other
hand, this has also opened the individual new doors and the possibility to modify their
day schedules if they so wished. The workhour results can be affected also by the factor
of people having office work hours, but more flexibility in them. Employees might have

54
flexible work times where they can start and end their workdays relatively flexibly. One
could for instance have the option of taking a few hours off during lunch which some
might use for taking a break and getting their daily exercise in.
When only comparing those working office hours and other work hours to the meeting of
preferences, it can be noticed that those working outside the office hours have evaluated
their satisfaction higher. This might perhaps be related to having more flexibility to
choose when to work out and can through that also avoid the rush hours if they prefer so
and go during the day when they might have the whole fitness center for themselves.
Those members who have fixed office hours often also have less flexibility in terms of
when to get their workouts done. The overall atmosphere and cleanliness had the largest
variety in satisfaction with approximately 0,5-0,7 difference in answers. The differences
could for instance be explained if the members not working office hours workout during
the day, there most likely are fewer people than in the evenings and through that, there is
less noise and more space. Also, the cleaning service cleans at the fitness center in the
mornings, so in case the members go to the center in the evenings it might not come over
as clean as it would have in the morning or throughout the day. In addition, there might
be fewer disinfection supplies available due to them being used already and no one has
been there to refill the supplies.
5.5 Discussion of method
Measuring consumer satisfaction is a cornerstone for a business that aims to keep up with
the competitive markets. The so-called value percept disparity theory was widely held in
mind when developing the survey questions and the response alternatives. This was to
ensure that the research aim, and purpose can be answered with the data gathered. As
known, there are many paths how to measure consumer satisfaction, but a survey way
was identified as one of the most effective ones. For this specific research a quantitative
questionnaire that was sent out to the members of the fitness center X, was identified as
the best fitting data gathering method. Also now, after the research has been conducted,
the author is convinced that the right method was chosen. The survey provided all the
data needed from Fitness center X´s members to be able to evaluate their level of satis-
faction and preferences towards the provided services.

55
Beforehand it was hard to evaluate how many members would take the time to participate
in the research as the questionnaire was sent out to all permanent members of the Fitness
center X. Afterwards seen other potential data collection methods could have been inter-
views or focus groups with the members. Both methods are qualitative and are not nec-
essarily possible to transform into graphs and tables, whereas the user survey is a quali-
tative data gathering method and can relatively smoothly be transformed into the acquired
graphs and tables. Difficulties with both methods could have arisen due to the relatively
large target group and therefore those methods could have been rather difficult to apply.
The survey was the best alternative data gathering method when evaluating the purpose
of this survey. Gathering the responses on a scale assisted in the comprehensive analysis
of the results and the modifications with the graphs, to better analyze the differences
among segment groups. With focus groups, the data gathered would perhaps not have
been as accurate through other members’ opinions possibly subconsciously affecting the
participant’s answers. Yet both, interviews and focus groups could have provided more
detailed information and the researcher could after the responses have asked specified
follow up questions to get more detailed responses.
The author did not face any specific difficulties in applying the chosen method. Yet Fit-
ness center X´s owner faced some technical difficulties when trying to attach the by the
researcher composed questionnaire to the member letter. This however got solved within
a few days and did not further affect the distribution of the survey nor any other factors
of the research. All technical aspects of the survey seemed to function as planned and the
questionnaire was pretested by the researcher before the distribution, to try to minimize
the possibility of participants not responding due to technical dysfunctions.
The reliability was well met by only inviting permanent members of the fitness center to
participate in the research. Only having the permanent members as respondents, ensured
that the gathered data only included answers from permanent members whose satisfaction
the survey aimed to find out. However, as previously mentioned, there are fitness centers
of different sized and types and the satisfaction of Fitness Center X´s members cannot be
generalized to also apply to other fitness facilities. Not even towards fitness centers of the

56
same size or purpose as the staff, equipment, as well as a service offering, differs between
each service provider.
As earlier discusses there are many potential factors affecting the validity of the research.
It was foreseen that not all members are going to participate on behalf of different reasons,
and this was the case since only a bit less than 10% of the permanent members partici-
pated. There was no feedback given on the layout or wording of the questions indicating
that there potentially were no difficulties in understanding the questions or answer alter-
natives. The Likert scale only had a scale up to five and according to the responses, which
were divided throughout all answer alternatives, the response alternatives seemed clear
to the respondents. In case there would have been language barriers or technical difficul-
ties, those could have been significant to the study as it could have resulted in fewer an-
swers or false answering in case not understanding the given answers.
6 CONCLUSIONS
This study was conducted as a case study for Fitness Center X, to investigate how the
fitness center is currently meeting its member’s preferences, which has an impact on the
overall satisfaction of the members. Additionally, the research investigated which factors
members value in their services the most and are there potential differences in preferences
depending on the age, gender, or if they work office hours or not. The third research
question the study aimed to answer was how successful the new, during the pandemic
invented services, met customer preferences.
Based on the results of the study, it can be concluded that overall, the members of Fitness
Center X have been on average satisfied or very satisfied with the services offered. The
most important factors of the services for the members are the overall cleanliness and
atmosphere at the fitness center as well as the long opening hours, which enable more
freedom for the members to choose when to workout. Regarding the employees of the
fitness center, for the members the most important trait in the employees was their help-
fulness in general. The fitness center has managed well to meet the preferences regarding
the long opening hours and helpfulness of the staff. Yet according to the members’

57
evaluations, they have space for improvements in the categories of cleanliness as well as
the overall atmosphere, which members evaluated as very important.
Overall seen, the differences between all three segment groups are relatively minor with
not much dispersion within the answers. The largest differences, however, were found in
the workhour segment group. Members working regular office hours rated all but one
preference notably lower than those having other work hours. The researcher could not
identify any specific reasons for those results and would suggest further research in the
field. When evaluating the differences in preferences between gender, dispersion is visi-
ble, yet only approximately in half of the statements. This indicates that the differences
in preferences between the gender is not that great except for some areas.
The comparison of different age groups showed that the preferences are evaluated lower
by the older age group than the younger ones. Yet again the differences are not remarka-
bly large and overall, the preferences are rated high. To conclude, there are differences in
how preferences are met among all three segment groups. Younger members are more
satisfied with the services than the older age group seems according to their evaluation of
preferences. Members working outside the regular office hours appear more satisfied with
how their preferences are met than regular office hours workers. When comparing the
meeting of preferences by gender, female members seem preferences seem to be met bet-
ter as the results indicate that they are more satisfied with the factors of services which
also are meeting their preferences better than the male members.
The services have decently met the customer’s preferences. The services developed were
substitutes for the services offered before, which were not possible to offer during the
pandemic. The importance of the services remained mostly on the same level during the
pandemic as it had been before. Only a small decrease in the satisfaction with the new
services compared to the old ones can be identified. The physical training at the fitness
center met the consumer´s preferences by far the best. Followed by the renting of equip-
ment, which already got differing opinions on how it has met the preferences. The data
gathered on the Instagram live service indicated that this service was for most members
not of importance and did not reach great success.

58
6.1 Limitations of the study
During the data gathering process the author realized that the analysis of the results will
not be completely reliable as the answers are unevenly spread and could therefore provide
unreliable overall results. For the author it was impossible to gain a large enough number
of respondents from all segment groups and therefore the individuals in some segments
had a too large impact on the rating by the segment. Certain age groups for instance only
gathered a few responses whereas other age groups got over twenty. Therefore, the eval-
uation of the results is not as reliable as it could be. Thinking back to the development
phase of the study and the questionnaire, the author could for instance have developed
additional age groups to get a better idea of the actual age of the participants as the age
frame in this study was quite wide. But this would have required a larger number of re-
spondents in order to have a sufficient amount for a statistical analysis.
Another limitation in the study is that on a Likert scale can only be measured how satisfied
customers are, at least this was how it was done in this study. Interesting and relevant
could have been to add follow-up questions on why some members preferences were not
met and would the members potentially have had ideas for improvement towards those
preferences? Those aspect would have provided Fitness Center X valuable information
and improvement ideas as not only the information of what can and should be improved
was captured but also how.
6.2 Suggestions for further studies
The study conducted was a rather small scale customer service research, to investigate
the level of the Fitness Center X´s members satisfaction during the Covid-19 pandemic.
Further research in the field could include a broader customer service satisfaction research
of Fitness Center X where other factors affecting the preferences could be covered. Po-
tentially a follow up survey, now that restrictions have been lifted, could provide valuable
insight how preferences have changed being back to normal. Adding more follow up
questions and open-ended questions to the survey could provide additional value to Fit-
ness Center X and give a more detailed analysis for instance of why something is meeting

59
the consumers preferences or why not, what are the factors affecting the fulfillment of the
preferences?
To gain the biggest benefit of the customer satisfaction research, it would be beneficial to
conduct a consumer satisfaction survey every half a year or so, to see if there have been
changes in the level of satisfaction. As pointed out in the theory chapter (Chapter 2),
constancy is a key in the field of measuring customer satisfaction and to reaching a better
satisfaction score. There is a risk that having questionnaires too often will lower the will-
ingness to respond. This needs to be balanced and the scope, and hence length, of possible
future questionnaires needs to be adjusted based on the number and quality of responses
received.

60
REFERENCES
Arboretti, R., De Dominicis, M., Jones, C. and Salmaso, L., 2020. End-to-end data ana-
lytics for product development. Wiley, p.12.
Assimakopoulos, G., 2022. Voice of Consumer Should Lead Product Innovation - Metric
Centric. [online] Metric Centric. Available at: https://www.metric-centric.com/in-
sights/voice-of-consumer-should-lead-product-innovation. Accessed: 10.2.2022
Bairagi, V. and Munot, M., 2019. Research methodology- A practical and scientific ap-
proach. 1st ed. CRC Press, p.10.
Bhasin, H., 2021. The Servqual Model - Definition, Dimensions, Gaps, and Advantages.
[online] Marketing91. Available at: <https://www.marketing91.com/servqual/. Accessed:
26.3.2022.
Boseley, S., 2020. WHO declares coronavirus pandemic [online] the Guardian. Available
at: https://www.theguardian.com/world/2020/mar/11/who-declares-coronavirus-pan-
demic. Accessed 27.1.2022.
Brace, I., 2018. Questionnaire design- how to plan, structure, and write survey material
for effective market research. 4th ed. Kogan Page, pp.6, 9.
Brawner, C. A., Ehrman, J. K., Bole, S., Kerrigan, D. J., Parikh, S. S., Lewis, B. K., Gindi,
R. M., Keteyian, C., Abdul-Nour, K. & Keteyian, S. J. 2021. Inverse Relationship of
Maximal Exercise Capacity to Hospitalization Secondary to Coronavirus Disease 2019.
Mayo Clin Proc, 96, 32–39. Accessed: 24.01.2022
Bryman, A., 2012. Social research methods. 4th ed. Oxford University Press, pp.46, 161-
162, 166, 233, 246.
Burtscher, J., Millet, G. P. & Burtscher, M. 2020. Low cardiorespiratory and mitochon-
drial fitness as risk factors in viral infections: implications for COVID-19. Br J Sports
Med. Accessed: 24.01.2022

61
Donthy, N. and Gustafsson, A., 2020. Effects of COVID-19 on business and research.
Journal of business research, Elsevier (117), pp.284-286. Qualtrics n.d. What is CSAT
and how do you measure it. [online] Accessed: 29.3.2022. Available at https://www.qual-
trics.com/experience-management/customer/what-is-csat/ acc
Downe, L., 2020. Good services- How to design services that work. 1st ed. BIS Publish-
ers, pp.6, 14, 23.
Hill, N. and Alexander, J., 2017. The handbook of customer satisfaction and loyalty meas-
urement. 3rd ed. Taylor & Francis Group, p.9.
Huttunen, J., 2018. Terveysliikunta – kuntoa, terveyttä ja elämänlaatua. [online] Duo-
decim Terveyskirjasto. Available at: https://www.terveyskirjasto.fi/dlk00934. Accessed:
23.1.2022UKK-instituutti. 2021. Liikkumisen vaikutukset - UKK-instituutti. [online]
Available at: https://ukkinstituutti.fi/liikkuminen/liikkumisen-vaikutukset/. Accessed:
26.1.2022.
Huttunen, K., 2020. Asiakastyytyväisyys ja sen mittaaminen (CES, CSTA ja NPS).
[online] Zoner. Available at: https://www.zoner.fi/digitaalinen-markki-
nointi/asiakastyytyvaisyys. Accessed: 30.3.2022.
Kestilä, L., Härmä, V. and Rissanen, P., 2020. Covid-19-epidemian vaikutukset
hyvinvointiin, palvelujärjestelmään ja kansantalouteen. Asiantuntia-arvio, syksy 2020.
[online] Terveyden ja hyvinvoinnin laitos. Available at:
https://www.julkari.fi/bitstream/handle/10024/140661/URN_ISBN_978-952-343-578-
0.pdf?sequence=1. Accessed: 28.3.2022.
Khazaei, A., Manjiri, H., Samiey, E., & Najafi, H. (2014) The effect of service conven-
ience on customer satisfaction and behavioral responses in the bank industry. Interna-
tional journal of basic science & applied research, 3 (1), 16-23.
Kotler, P. and Armstrong, G., 2020. Principles of marketing. 18th ed. Pearson, p.30.
Lewlyn, L. & Rodrigues, R. 2013. Service Quality Measurement: Issues and Perspectives.
Diplomica Verlag, pp. 1-2, 11

62
Lohrey, J., 2019. Advantages & Disadvantages of the Triangle Test for a Sensory Panel.
[online] Bizfluent. Available at: https://bizfluent.com/info-12168167-advantages-disad-
vantages-triangle-test-sensory-panel.html. Accessed: 29.3.2022.
Mohammad, S.A. (2012), "An application of the American Customer Satisfaction Index
(ACSI) in the Jordanian mobile phone sector", The TQM Journal, Vol. 24 No. 6, pp. 529-
541
Nedelcu, A., Dumitrascu, A. and Cristea, L., 2010. The method used for measuring cus-
tomers satisfaction. University of Brasov, p.199.
Penin, L., 2018. An introduction to service design. 1st ed. Bloomsbury Publishing, p.20.
Rapoza, K., 2020. Watch Out for China Buying Spree, NATO Warns. [online] Forbes.
Available at: https://www.forbes.com/sites/kenrapoza/2020/04/18/watch-out-for-china-
buying-spree-nato-warns/#623eada31758 Google Scholar. Accessed: 1.3.2022.
Schiffman, L. and Wiesenblit, J., 2022. Consumer behavior. 12th ed. Pearson, pp.32, 45.
SurveyMonkey. n.d. Customer Satisfaction Survey Questions - SurveyMonkey. [online]
Available at: https://www.surveymonkey.com/mp/customer-satisfaction-survey-ques-
tions/. Accessed: 12.3.2022.
Terveyden ja hyvinvoinnin laitos. 2020. Liikunnan harrastaminen Suomessa. [online]
Available at: https://thl.fi/fi/web/elintavat-ja-ravitsemus/liikunta/liikunnan-
harrastaminen-suomessa. Accessed: 28.3.2022.
Tucker, H., 2020. Coronavirus Bankruptcy Tracker: These Major Companies Are Failing
Amid The Shutdown. [online] Forbes. Available at:
https://www.forbes.com/sites/hanktucker/2020/05/03/coronavirus-bankruptcy-tracker-
these-major-companies-are-failing-amid-the-shutdown/#5649f95d3425. Accessed:
1.3.2022.
Venkatesh, V., 2020. Impacts of COVID-19: A research agenda to support people in their
fight. International Journal of Information management, Elsevier (55), pp.1-4.
Villanen, J., 2016. Tuotteista tähtituotteita. Kauppakamari, pp.19,105-108, 115-116, 118,
138-140, 186. MITKÄ SIVUT

63
Weinstein, A., 2018. Superior customer value- finding and keeping customers in the new
economy. 4th ed. Taylor and Francis, p.13.
Westbrook, R. A & Reilly, M. D (1983). Value-Percept Disparity: an Alternative to the
Disconfirmation of Expectations Theory of Consumer Satisfaction, in Bagozzi, P. R., and
Tybouts, A. M (eds) Advances in Consumer Research, Association for Consumer Re-
search, 10th ed, pp. 256-61.

64
TABLE OF FIGURES
Figure 1. An outline of the main steps of quantitative research. (Bryman, 2012, 161) .. 22
Figure 2. Services before the Covid-19 pandemic ........................................................ 31
Figure 3. Services during the Covid-19 pandemic ....................................................... 32
Figure 4. How satisfied have members been with Fitness Center X´s services in terms of
given covid-19 restrictions, in the past two years on a scale from 1 (very dissatisfied) to
5 (very satisfied) ......................................................................................................... 33
Figure 5. How important are the following preferences to you? on a scale from 1-5. ... 34
Figure 6. How do you feel do the Fitness Center X´s services meet your preferences? on
a scale from 1-to 5....................................................................................................... 36
Figure 7. How likely would you recommend the fitness center to others (1 (very unlikely)
- 5 (very likely))? ........................................................................................................ 37
Figure 8 Age distribution of respondents ..................................................................... 38
Figure 9. How are preferences met depending on age groups ...................................... 39
Figure 11. Comparison of the largest age groups in regard to their preferences ............ 40
Figure 12. Age distribution ......................................................................................... 41
Figure 13. Comparison of preferences between genders .............................................. 41
Figure 14. Work hours of the participants.................................................................... 42
Figure 15. Workhours effect on satisfaction ................................................................ 43
Figure 16. Comparison of preferences depending on workhours .................................. 44

APPENDIX A - QUESTIONNAIRE
The full consumer satisfaction survey of Fitness Center X