Copy of 2022-2023 EPG Final Doc - Grand Junction High School
Upload
khangminh22Category
view
3download
0
1
2
3
4
5
6
7
8
9
10
11
12
13
14
15
16
17
18
19
20
21
22
23
24
25
26
27
28
IN THE UNITED STATES DISTRICT COURT FOR THE EASTERN DISTRICT OF CALIFORNIA
SACRAMENTO DIVISION
CENTER FOR BIOLOGICAL DIVERSITY and EARTH ISLAND INSTITUTE, Plaintiffs,
v. DEAN GOULD, Sierra National Forest Supervisor, and THE UNITED STATES FOREST SERVICE, Defendants, and SIERRA FOREST PRODUCTS, Intervenor-Movant..
No. 1:15-cv-1329-WBS-EPG Judge William B. Shubb DECLARATION OF SUSAN
BURKINDINE Hearing Date: November 30, 2015 Time: 2:00 p.m. Location: 5, 14th Floor
Case 1:15-cv-01329-WBS-EPG Document 34-4 Filed 10/30/15 Page 1 of 147

DECL. OF BURKINDINE Ctr. for Biological Diversity v. Gould, No. 1:15-cv-1329-WBS-EPG 2
1
2
3
4
5
6
7
8
9
10
11
12
13
14
15
16
17
18
19
20
21
22
23
24
25
26
27
28
I, Susan Burkindine, declare as follows:
1. I am the Forest Assistant Recreation Officer for the Sierra National Forest (the
Forest) in Clovis, California, and I oversee and guide outdoor recreation like motorized and non-
motorized trails and wilderness management. I received my Bachelor of Science in Park
Administration from Sacramento State University, California, in 1986. I have worked for 28
years in public services and recreation, and in various recreation-related positions for the Forest
as a permanent employee for 23 years. Among my current duties, I am serving as the Forest
interdisciplinary team (IDT) leader for the Forest’s effort to identify a Potential Wilderness
Inventory (the Inventory) through the Early Adopters process for Forest Plan Revision.
2. I have reviewed Conservation Congress’s memorandum in support of its motion
for summary judgment and the attached declarations. That memorandum and those declarations
misrepresent or misunderstand the process the Forest has undertaken so far to complete its
Inventory. To be clear, the Forest is currently revising its Forest Plan, and as part of that process,
it sought to compile an inventory of lands that may be suitable for inclusion in the National
Wilderness Preservation System (NWPS) under the Wilderness Act.
3. Three early adopter forests in the Forest Service’s Pacific Southwest Region (the
Region), including the Forest, followed wilderness Inventory protocol. The Forest Service has
described the steps in the inventorying process on the Forest Service’s website since June 6,
2014. Initially, under the direction of Forest Service wilderness experts, Geographic Information
System (GIS) and mapping experts from the Region started with a database of roads to produce
the most recent version of the Forest’s Motorized Use Vehicle Map. Once the GIS experts
identified the roads to analyze, they generated a one-half mile buffer around them in the GIS
layer, and used these road buffers to bound areas into polygons that could be considered for
potential wilderness values.
4. But the Forest did not just use roads to bound potential wilderness areas. It also
used other linear features, such as transmission and power line corridors, to identify and to
remove, from the Inventory, areas of land that did not have wilderness characteristics. The Forest
relied on local knowledge to interpret linear features and to locate them. Some of those linear
Case 1:15-cv-01329-WBS-EPG Document 34-4 Filed 10/30/15 Page 2 of 147

DECL. OF BURKINDINE Ctr. for Biological Diversity v. Gould, No. 1:15-cv-1329-WBS-EPG 3
1
2
3
4
5
6
7
8
9
10
11
12
13
14
15
16
17
18
19
20
21
22
23
24
25
26
27
28
features, like utility lines that utility companies maintain, preclude wilderness character because
the utility company may need to develop an access road in the future.
5. After the Forest identified the relevant linear features, the GIS experts created
one-half mile buffers around each linear feature and removed those areas from the Inventory for
lacking wilderness character. The Region relied on Forest Service Washington, D.C., Office
Wilderness staff and other regions’ wilderness specialists to develop and consistently apply that
one-half-mile buffer. Those Forest Service experts concluded that people within one-half mile
could likely see and hear signs of human mechanized activities, and those sights and sounds
would degrade the wilderness experience.
6. In addition to this buffer, the Forest Service also excluded from the Inventory
narrow strips of land between roads. Forest Supervisor Dean Gould in a March 31, 2014, memo
stated that the Forest completed its review “based upon the assumption that areas with narrow
distances between road projections create ‘pinch points’ that result in areas within the polygon
that would not exhibit wilderness character. The area between the road projections will be
eliminated from the inventory.” Ex. 1 (a true and correct copy of the March 31, 2014, memo);
see also Admin. R. at 2218, also available online at
http://www.fs.usda.gov/Internet/FSE_DOCUMENTS/stelprd3803609.pdf.
7. After the Wilderness staff and GIS experts developed the first set of polygons that
could potentially qualify as wilderness areas, each forest refined the polygons using
interdisciplinary teams and their site-specific knowledge. The Forest identified two polygons in
the area of the French Project: Polygon 819 on its east end and Polygon 646 on its northwest end.
See Ex. 2 (a true and correct copy of the Motorized Trails Wilderness Inventory Map, originally
presented at the June 16, 2014 public meeting as discussed below, with French Fire Perimeter
overlain). Stump Springs Road bounds Polygon 819 on the east, and an aqueduct bounds it on
the west. Some of that penstock runs on the surface and some runs underground. The Forest
eliminated areas around watershed improvements like the aqueduct from the Inventory unless the
treatment areas were not substantially noticeable or unless appropriate management actions
could maintain or restore the wilderness character. The Forest team reasonably anticipated that
Case 1:15-cv-01329-WBS-EPG Document 34-4 Filed 10/30/15 Page 3 of 147

DECL. OF BURKINDINE Ctr. for Biological Diversity v. Gould, No. 1:15-cv-1329-WBS-EPG 4
1
2
3
4
5
6
7
8
9
10
11
12
13
14
15
16
17
18
19
20
21
22
23
24
25
26
27
28
the utility company would likely request mechanical access to the aqueduct on the western edge
of Polygon 819 if it needed repair. Some of those repairs, for example, could require major earth
moving and construction activities that would be substantially noticeable and would be certain to
degrade the area’s primeval character and influence. For that reason, the Forest removed the
aqueduct from the Inventory.
8. At the northwest corner of the French Project, roads bound Polygon 646 and
create multiple “pinch points” at its southeast corner. These narrow strips of land were excluded
from the polygon as they would not be manageable as wilderness, and the polygon boundary was
drawn to eliminate these pinch points. See Admin. R. 2211. The Forest team also eliminated the
area east of one of these pinch points because (1) with the pinch point removed, it did not meet
the criteria for inclusion of being greater than 5,000 acres, or contiguous with existing wilderness
and (2) the Forest IDT team determined that the Forest would have difficulty managing it to
preserve wilderness character because it was so small, it had an irregular shape, it remained
isolated from other protected areas, and adjacent land uses affected it.
9. The Regional Office and the Forest involved the public in developing the final
Inventory. They developed a preliminary Inventory map and posted it on the Region’s website
on June 4, 2014. Two days later, the Forest emailed stakeholders to announce the map becoming
available and to invite stakeholders to participate in a June 16, 2014, public meeting in Fresno.
Ex. 3 (true and correct copy of the June 6, 2014, email). Among the stakeholders, the Region and
the Forest emailed Chad Hanson. Ex. 4 (true and correct copy of the stakeholder mailing list).
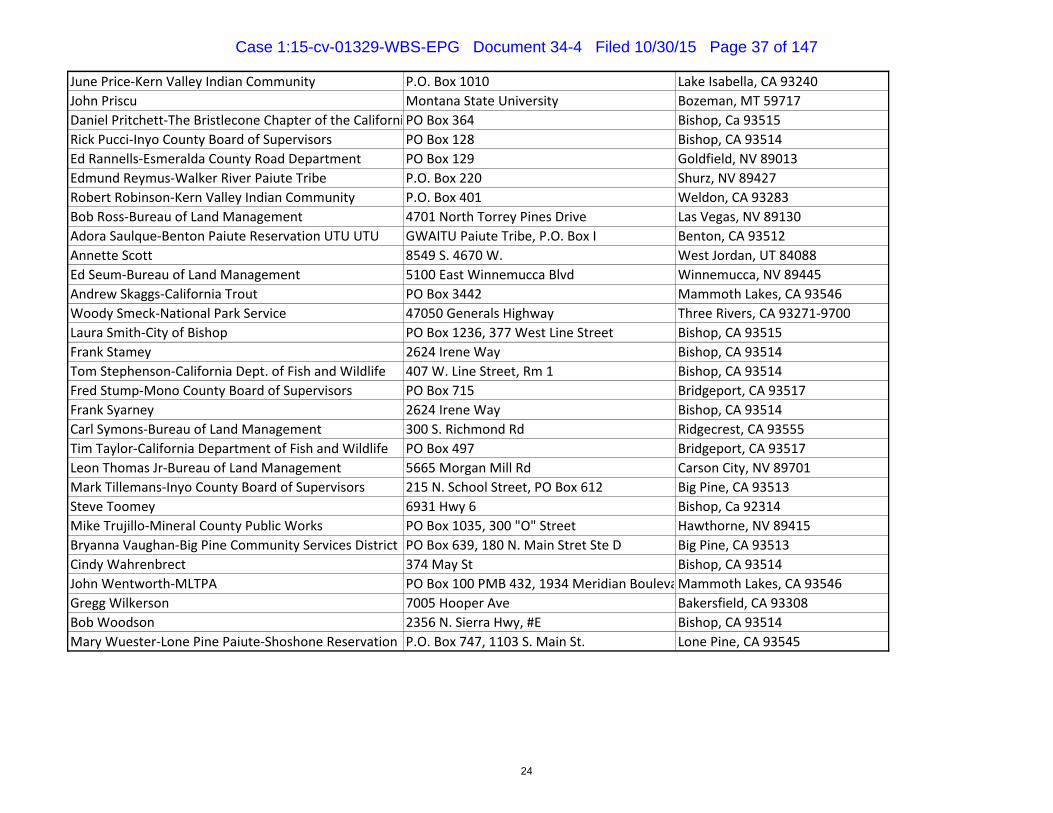
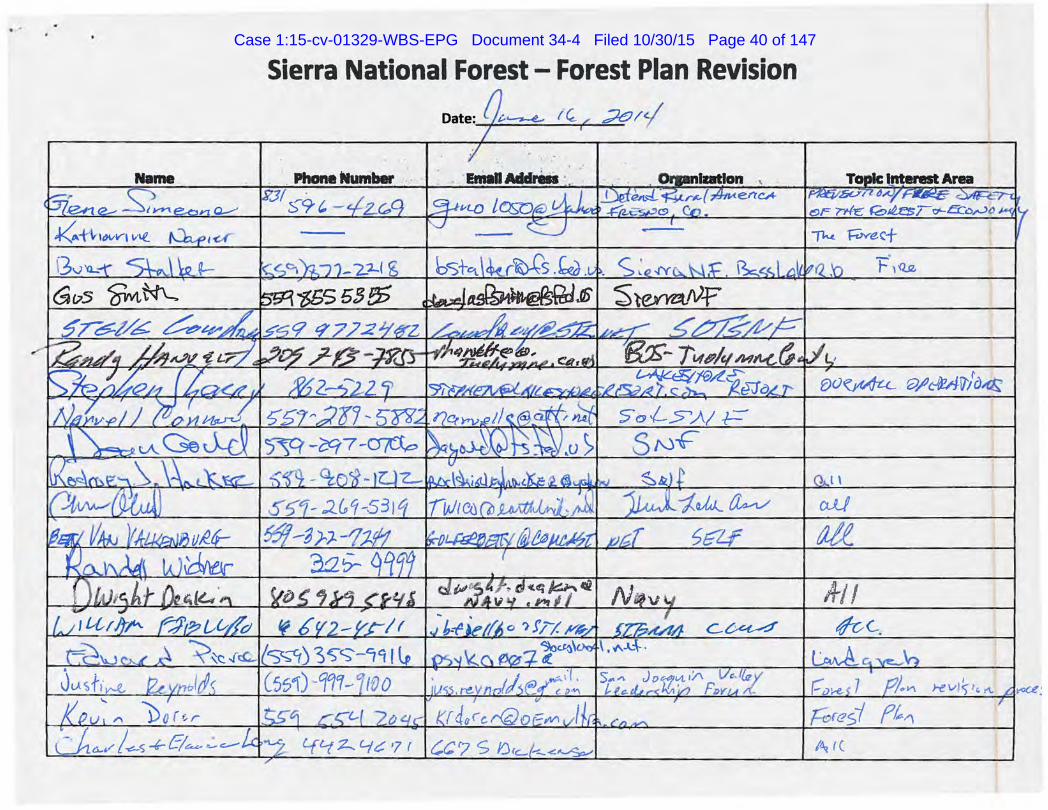
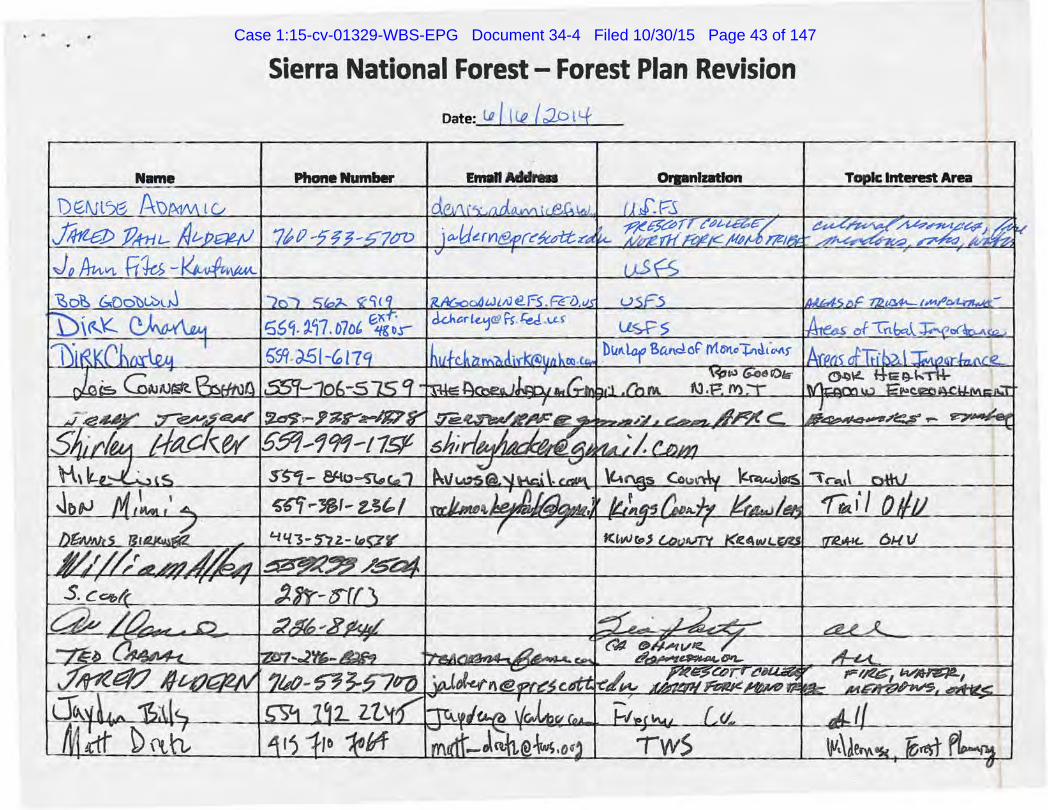
10. At the June 16, 2014, public meeting, I answered questions or concerns related to
the preliminary Inventory. I do not recall meeting with or discussing any concerns with Chad
Hanson or any members of any plaintiff organization. No Plaintiff member signed-in to the
meeting. Ex. 5 (a true and accurate copy of the sign-in sheet for the June 16, 2014, meeting). At
the public meeting we invited comment on the preliminary Inventory map and informed the
public that the comment period on that map would close on June 30, 2014. The Forest did not
receive comments from any Plaintiff member on the preliminary Inventory map or other
roadless-related issues during this period.
Case 1:15-cv-01329-WBS-EPG Document 34-4 Filed 10/30/15 Page 4 of 147

1 11. The Forest team and I considered the comments it received during this comment
2 period and refined the preliminary Inventory map. On Sept~ber 5, 2014, th~ Forest emailed the
3 stakeholders (1) to notify them that it would post the final Inventory maps to the Forest Service's
4 website and (2) to request input on those areas' wilderness character by September 22, 2014. Ex.
5 6 (true and correQt copy of the September 5, 2014, email). Later, the Forest extended the period
6 to September 25, 2014. The Forest team reviewed the comments it received, but a~ain no
7 plaintiff member commented on the final Inventory map during this period. The Forest held
8 another public meeting in Fresno ~ September 16, 2014, to provide the public a :further
9 opportunity to meet with Forest staff about the Inventory. No Plaintiff member attended or
10 submitted any comments. Plaintiffs commented on other aspects"-of Forest Plan Revision on June
11 30, 2014, July 11, 2014, September 29, 2014, and Octobi:r 3, 2014, but not on the Inventory or
12 other roadless-related issues. Ex. 7· (true and correct copies of those comment letters).
13
14
15
16
17
18
12. I reviewed Mr. Bradley's declaration. To reach his conclusion that the French
Project affects over 1,000 acres of''roadless" area, he uses a different road dataset, uses a
different buffer from the roads (100 meters instead of one-half mile), :fitlls to account for other
linear features like watershed improvements and power lines that require maintenance, and
declines to eliminate the "pinch points" based upon the criteria. Mr. Bradley does not explain
why he made those choices in generating his data. The Forest Service, on the other hand, relied 19
on criteria that its wilderness experts· use consistently across the United States. 20
21
22 Under 28 U.S.C. § 1746, I declare under penalty.of perjury under the laws of the United States o
23 America that the foregoing is true and correct.
24
25
26
27
28
Executed on October 29, 2015.
/SUSANBURKil{IDINE Forest Assistant Recreation Officer
DECL. OF BURKJNDINE Ctr. for Biological Diversity v. Gould, No. 1: 15-cv-1329-WBS-EPG
Case 1:15-cv-01329-WBS-EPG Document 34-4 Filed 10/30/15 Page 5 of 147

EXHIBIT 1
Case 1:15-cv-01329-WBS-EPG Document 34-4 Filed 10/30/15 Page 6 of 147

Forest Service
File Code: 2320/1900
Sierra National Forest
1600 Tollhouse Rd Clovis, CA 93611 (559) 297-0706 (559) 294-4809 FAX (559) 322-0425 TTY CA Relay Service 711
Date: March 31, 2014
Subject: Documentation for Wilderness Inventory Process for Forest Plan Revision
To: Project File
This memo is in response to direction provided to follow steps to finalize Potential Wilderness Inventory based upon the current draft process utilizing Wilderness Inventory Maps identifying polygons less than 5,000 acres, polygons greater than 5,000 and polygons contiguous to wilderness.
l. In reviewing the provided maps, it is affirmed there are not any Level 2 roads that do not meet the criteria in 71.22a(s)(c).
2. In reviewing the provided maps, it is affirmed there are not any Level 2 roads, or Level 3, 4, 5 roads that are anticipated to be divested to a Level 2, that do not contain at least one of the unsuitable factors listed in 71.22a(3).
3. In reviewing the provided maps, a review was completed; there are no Potential Wilderness Inventory polygons contiguous with Yosemite National Park. Refer attached.
4. In reviewing the provided maps, it is affirmed there are not any polygons less than 5,000 acres are sufficient in size to make practical its preservation and use in unimpaired condition that meet the criteria listed in 71.21(2).
5. In reviewing the provided maps, a review was completed based upon the assumption that areas with narrow distances between road projections create "pinch points" that result in areas within the polygon that would not exhibit wilderness character. The area between the road projections will be eliminated from the inventory. The result will be separate polygons on either side of the projections that will be moved forward in the process.
6. In reviewing the provided maps, a review was completed; there are two areas that are less than 5,000 acres and contiguous with existing designated wilderness will be included in the inventory.
7. In reviewing the provided maps, a review was completed related to identify if and where there are "power lines with cleared right-...,-of--,-ways, pipelines, and other permanently installed linear right-,-of-...,-way structures." These were documented and exclude them from the inventory meeting the criteria listed in 71.22 (b) (9).
Based upon these steps, the Sierra National Forest developed the Wilderness Inventory Process for Forest Plan Revision.
Caring for the Land and Serving People "rinted on Recyc!ed Paper U
Case 1:15-cv-01329-WBS-EPG Document 34-4 Filed 10/30/15 Page 7 of 147

EXHIBIT 2
Case 1:15-cv-01329-WBS-EPG Document 34-4 Filed 10/30/15 Page 8 of 147

1378.1
772.1
819.4
315
227
539.1
330
577
441539.7
646.1
304
1378.4
539.3
586
357
772.2
822.1
688.1
821.1
819.1
646.2
557.1
539.6
646.3
539.8
822.2
539.4
1378.2
820
821.3
797
781.1
815.4
795
821.5
539.10
821.2
772.3
539.5
815.1
1378.3
772.4
785.3
821.4821.7
819.2815.3
557.2
772.5
819.3
822.3
815.2
821.6
539.2
785.1
688.2
781.2781.3
781.4
539.12
539.11
557.4
785.2
539.9
688.3
557.3
AdministrativeForestWildernessFrench Fire 2014
PrevalentMotorizedNoYes
Motorized Trails Wilderness Inventory
0 8 164 Miles
´
Case 1:15-cv-01329-WBS-EPG Document 34-4 Filed 10/30/15 Page 9 of 147

EXHIBIT 3
Case 1:15-cv-01329-WBS-EPG Document 34-4 Filed 10/30/15 Page 10 of 147

Tapia. Judith E -FS·
From: Charley, Dirk -FS Sent: Friday, June 06, 2014 3:25 PM Subject: FW: Reminder: Forest Plan Revision Public Workshops & more materials posted
Hello Everyone,
Please see'traillhg email message and important website link regarding the upcoming Forest Plan Revision public meetings and materiaJs posted. ·
Please share with others!
Respectfully yours',
/s(·~~~. DIRK CHARLEY . Acting Public Affairs Officer- Sierra National Forest Sequoia and Sierra NF - Tribal Relations Program Manager
Sierra National Forest 1600 Tollhouse Road Clovis, CA 93611-0532 (55~) 297-0706, Extension 4805 {559) 294-4861 {fax) {559) 288-3529 {cell) [email protected]
From: Whltall, Debra R -FS sent: Friday, June 06, 20141:43 PM Subject: Reminder: Forest Plan Revision Public Workshops & more materials posted
Dear Sierra Cascades Dialogue (SCD) Participants,
This Is a reminder, that the U.S. Forest Service will host a series of public workshops for forest plan revisions on the Sierra, Sequoia and Inyo National Forests. Each workshop will be held from 5- 8 p.m. with presentations by Forest Service staff. You are welcome at any of the workshops:
• Monday, June 16, 2014-Slerra NF, Holiday Inn Fresno Airport, 5090 E. Clinton Way, Fresno, CA • Tuesday, June 17, 2014-Sequola NF, Woodrow W. Wallace Elementary School, 3240 Erskine Creek· Rd., Lake
Isabella, CA • Thursday, June 19, 2014-lnyo NF, Cerro Coso Community College, Eastern Sierra College Center, 4090 W.
Line Street Bishop, CA
The Forest Service has posted 3 additional documents for the upcoming meetings. These document are the "Updated Need to Change - Supplement," the "Draft
1
Case 1:15-cv-01329-WBS-EPG Document 34-4 Filed 10/30/15 Page 11 of 147

Desired Conditions," and "Wilderness Inventory and Eval1:Jation." Visit the "What will be discussed" section on our website to learn .more: http:Uwww.fs.usda.gov/detail/r5/landmanagement/planning/?cid=STELPRD3800763
We hope you will consider joining us at one qf these upc<?ming workshops.
Sincerely, Debra
Debra Whtt;all, Ph.D. Regional Social Scientist
USDA Forest Service Pacific Southwest Region· 1323 Club Drive Vallejo, CA 94592
Ph, 707-562-8823 [email protected]~us
2
Case 1:15-cv-01329-WBS-EPG Document 34-4 Filed 10/30/15 Page 12 of 147

EXHIBIT 4
Case 1:15-cv-01329-WBS-EPG Document 34-4 Filed 10/30/15 Page 13 of 147

Inyo National Forest Notes
Stakeholders
1
Case 1:15-cv-01329-WBS-EPG Document 34-4 Filed 10/30/15 Page 14 of 147

2
Case 1:15-cv-01329-WBS-EPG Document 34-4 Filed 10/30/15 Page 15 of 147

3
Case 1:15-cv-01329-WBS-EPG Document 34-4 Filed 10/30/15 Page 16 of 147

4
Case 1:15-cv-01329-WBS-EPG Document 34-4 Filed 10/30/15 Page 17 of 147

5
Case 1:15-cv-01329-WBS-EPG Document 34-4 Filed 10/30/15 Page 18 of 147

6
Case 1:15-cv-01329-WBS-EPG Document 34-4 Filed 10/30/15 Page 19 of 147

7
Case 1:15-cv-01329-WBS-EPG Document 34-4 Filed 10/30/15 Page 20 of 147

8
Case 1:15-cv-01329-WBS-EPG Document 34-4 Filed 10/30/15 Page 21 of 147

9
Case 1:15-cv-01329-WBS-EPG Document 34-4 Filed 10/30/15 Page 22 of 147

10
Case 1:15-cv-01329-WBS-EPG Document 34-4 Filed 10/30/15 Page 23 of 147

11
Case 1:15-cv-01329-WBS-EPG Document 34-4 Filed 10/30/15 Page 24 of 147

12
Case 1:15-cv-01329-WBS-EPG Document 34-4 Filed 10/30/15 Page 25 of 147

Sierra National Forest Notes
[email protected]@[email protected]@[email protected]@[email protected]@[email protected]@[email protected]@[email protected]@[email protected]@[email protected]@[email protected]@[email protected]@[email protected]@yahoo.com
13
Case 1:15-cv-01329-WBS-EPG Document 34-4 Filed 10/30/15 Page 26 of 147

[email protected]@[email protected]@[email protected]@[email protected]@[email protected]@[email protected]@[email protected]@[email protected]@[email protected]@[email protected]@[email protected]@[email protected][email protected]@[email protected]@[email protected]@[email protected]@[email protected]@gmail.com
14
Case 1:15-cv-01329-WBS-EPG Document 34-4 Filed 10/30/15 Page 27 of 147

[email protected]@[email protected]@[email protected]@gmail.com; [email protected][email protected]@[email protected]@[email protected]@[email protected]@[email protected]@[email protected][email protected]@[email protected][email protected]@[email protected]@[email protected]@[email protected]@[email protected]@[email protected]@[email protected]
15
Case 1:15-cv-01329-WBS-EPG Document 34-4 Filed 10/30/15 Page 28 of 147

[email protected][email protected]@[email protected]@[email protected]
[email protected] Fire
[email protected] Fire
[email protected] Fire
[email protected] Fire
[email protected] Fire
[email protected] Fire
[email protected] Fire
[email protected] Fire
[email protected] Fire
[email protected] Fire
[email protected] Fire
[email protected] Fire
[email protected] Fire
[email protected] Fire
[email protected] Fire
[email protected] Fire
[email protected] Fire
[email protected] Fire
[email protected] Fire
[email protected] Elected Officials/Staffers
[email protected] Elected Officials/Staffers
[email protected] Elected Officials/Staffers
[email protected] Elected Officials/Staffers
[email protected] Elected Officials/Staffers
[email protected] Elected Officials/Staffers
[email protected] Elected Officials/Staffers
16
Case 1:15-cv-01329-WBS-EPG Document 34-4 Filed 10/30/15 Page 29 of 147

[email protected] Elected Officials/Staffers
[email protected] Elected Officials/Staffers
[email protected] Elected Officials/Staffers
[email protected] Community
[email protected] Community
[email protected] Community
[email protected] Community
[email protected] Community
[email protected] Community
[email protected]; Community
[email protected] Community
[email protected] Community
[email protected] Community
[email protected] Community
[email protected] Community
[email protected] Community
[email protected] Internal
[email protected] Internal
[email protected] Internal
[email protected] Internal
[email protected] Internal
[email protected] Internal
[email protected] Internal
[email protected] Internal
[email protected] Internal
[email protected] Internal
[email protected] Internal
[email protected] Internal
[email protected] Internal
[email protected] Internal
[email protected] Internal
[email protected] Internal
[email protected] Internal
[email protected] Internal
17
Case 1:15-cv-01329-WBS-EPG Document 34-4 Filed 10/30/15 Page 30 of 147

[email protected] Internal
[email protected] Internal
[email protected] Internal
Sequoia National Forest
[email protected] (Bishop Tribal)
18
Case 1:15-cv-01329-WBS-EPG Document 34-4 Filed 10/30/15 Page 31 of 147

19
Case 1:15-cv-01329-WBS-EPG Document 34-4 Filed 10/30/15 Page 32 of 147

Physical Mailing Contact Lists
Inyo National Forest
Madera County Board of Supervisors 200 W. 4th St. Madera, CA 93637
Mono County Board of Supervisors 278 Main Street, 2nd Floor PO Box 715 Bridgeport, CA 93517
Inyo County Board or Supervisors 224 N. Edwards Street, PO Box N Independence, CA 93526
Nevada Division of Environmental Protection 901 S. Stewart St., Ste 4001 Carson City, NV 89701
Pacific Crest Trail Association 1331 Garden Highway Sacramento, CA 95833
Inyo County Agricultural Commissioner 207 W. South St. Bishop, CA 93514
Mammoth Lakes Chamber of Commerce PO Box 3268 Mammoth Lakes, CA 93546
Mono County Environmental Health 221 Twin Lakes Road Bridgeport, CA 93517
Mono County Public Works Department PO Box 457 Bridgeport, CA 93517
June Lake - Chambers of Commerce PO Box 2 June Lake, CA 93529
Sequoia and Kings Canyon National Parks 47050 Generals Highway Three Rivers, CA 93271
Lone Pine - Chamber of Commerce PO Box 749 Lone Pine, CA 93514
Ridgecrest - Visitor Centers, Federal Highway Administration12300 Dakota Avenue Lakewood, CA 80228
CARMA P.O. Box 968 Big Pine, CA 93513-0968
Los Angeles Department of Water and Power 300 Mandich Lane Bishop, CA 93514
Rolling Green Utilities 139 Elmcrest Dr Big Pine, CA 93513
Lee Vining Public Utility District 40 Paoha Drive Lee Vining, CA 93541
June Lake Public Utility District 2380 Highway 158 June Lake, CA 93529
Mineral County Commissioners P.O. Box 1450, 105 South A St., Ste. 1 Hawthorne, NV 89415-0400
20
Case 1:15-cv-01329-WBS-EPG Document 34-4 Filed 10/30/15 Page 33 of 147

Ridgecrest Chamber of Commerce 125-B East California Ave. Ridgecrest, CA 93555
CA Regional Water Quality Control Board 1440 Civic Drive, Suite 200 Victorville, CA 92392
Town of Mammoth Lakes PO Box 1609 Mammoth Lakes, CA 93564
CA Regional Water Quality Control Board 2501 Lake Tahoe Blvd South Lake Tahoe, CA 96150
Death Valley National Park P.O. Box 579 Death Valley, CA 92328
Tulare County Board of Supervisors Admin. Bldg. 2800 West Burrel Ave. Visalia, CA 93291
Esmeralda County Commissioners PO Box 517 Goldfield, NV 89013
Marine Corps Mountain Warfare Training Center HC 83 Bldg. 1036 Bridgeport, CA 93517
Inyo County Public Works Department PO Box Q Independence, CA 93526
China Lake Naval Air Warfare Center 1 Administration Circle China Lake, CA 93555-6100
Eastern Sierra Audubon Society P.O. Box 624 Bishop, CA 93515
Fresno County Board of Supervisors 2281 Tulare Street, #301 Hall of Records Fresno, CA 93721
Independence - Chamber of Commerce PO Box 397 Independence, CA 93514
Inyo County Environmental Health PO Box 427 Independence, CA 93526
Humboldt-Toiyabe National Forest-Bridgeport District HC 62 Box 1000 Bridgeport, CA 93517
Humboldt-Toiyabe National Forest-Supervisor's Office 1200 Franklin Way Sparks, Nevada 89431
Town of Mammoth Lakes Recreation Dept. 437 Old Mammoth Road, PO Box 1609 Mammoth Lakes, CA 93546
City of Bishop - Chambers of Commerce 690 North Main Street Bishop, CA 93514
White Mountain Research Center 3000 E. Line St. Bishop, CA 93514
Administrator-Ft. Independence Community of Paiute IndiansP.O. Box 67 Independence, CA 93526
Apple Valley Town Hall-US Congress 14955 Dale Evans Pkwy Apple Valley, CA 92307
Field Manager-Bureau of Land Management 5665 Morgan Mill Road Carson City, NV 89701
Field Manager-Bureau of Land Management 4701 North Torrey Pines Drive Las Vegas, NV 89130
Office Manager-Bridgeport Paiute Indian Colony P.O. Box 37 Bridgeport, CA 93517
Office of Planning and Compliance-Yosemite National ParkP.O. Box 577 Yosemite, CA 95389
Brian Adkins-Bishop Paiute Indian Tribal Council 50 Tu Su Lane Bishop, CA 93514
Ruby Allen-Rainbow Pack Outfitters PO Box 1791 Bishop, CA 93515
Tim Alpers-Mono County Board of Supervisors PO Box 263 Lee Vining, CA 93541
Pete Anderson-Nevada Division of Forestry 2478 Fairview Drive Carson City, NV 89701
Jim & Annette Andrews PO Box 62 Dyer, NV 89010
Raymond Andrews-Mono Lake Kutzadika Indian Community Cultural Preservation AssociationP.O. Box 591 Bishop, CA 93515
Raymond Andrews-Bishop Paiute Indian Tribal Council 50 Tu Su Lane Bishop, CA 93514
Raymond Andrews-Mono Lake Kutzadika Tribe P.O. Box 591 Bishop, CA 93515
Linda Arcularius-Inyo County Board of Supervisors 225 N. Round Valley Rd Bishop, CA 93514
21
Case 1:15-cv-01329-WBS-EPG Document 34-4 Filed 10/30/15 Page 34 of 147

Donna Begay-Tubatulabals of Kern Valley P.O. Box 226 Lake Isabella, CA 93240
Carl Benz-U.S. Fish and Wildlife Service 2493 Portola Rd., Ste. B Ventura, CA 93003
James Bottorff 4008 Shawn Street Bakersfield, CA 93312
Linda Brown-Big Pine Tribe of Owens Valley 841 S. Main, PO Box 700 Big Pine, CA 93513
Pat Brown --Brown-Berry Biological Consulting 134 Eagle Vista Bishop, CA 93514
Scott Burns-Mono County Local Transportation CommissionPO Box 347 Mammoth Lakes, CA 93546
John Carroll PO Box 350 Dyer, NV 89010
Paul Cook-US Congress 1222 Longworth House Office Building Washington, DC 20515
Chad Delgado-Bishop Paiute Indian Tribal Council 50 Tu Su Lane Bishop, CA 93514
Dominick DellaSala-Geos Institute 84 Fourth Street Ashland, OR 97520
John Deymonaz PO Box 145 Dyer, NV 89010
Deanna Dulen-National Park Service PO Box 3999 Mammoth Lakes, CA 93546
Barbara Durham-Timbisha Shoshone of Death Valley P.O. Box 358 Death Valley, CA 92328-358
James A. Essenpreis-Mineral County Board of CommissionersPO Box 1450, 105 South A St., Ste 1 Hawthorne, NV 89415-0400
Tim Fesko-Mono County Board of Supervisors 110437 US Highway 395 Coleville, CA 96107
Drew Foster-Friends of the Inyo 819 N. Barlow Ln Bishop, CA 93514
Timothy Fox-NAWS China Lake 1 Administration Circle China Lake, CA 93555
Mark Freese-Nevada Department of Wildlife 1100 Valley Road Reno, NV 89512
Noe Gadea-Sierra Reader 236 N. Warren St Bishop, CA 93514
Suzanna Garatta-Mammoth Times PO Box 3929 Mammoth Lakes, 93514
George Gholson-Timbisha Shoshone Tribe (Bishop) 621 W. Line Suite 109 Bishop, CA 93514
John Glazier-Bridgeport Paiute Indian Colony P.O. Box 37 Bridgeport, CA 93517
Bob Glennen PO Box 23 Goldfield, NV 89103
Jeff Griffiths-Inyo County Board of Supervisors 387 Willows Street Bishop, CA 93514
Tom Hallenbeck-Caltrans District 9 500 S. Main St. Bishop, CA 93514-3423
Eric Hamrey-Mineral County Public Works Dept. 300 "O" Street, PO Box 1035 Hawthorne, NV 89415
Kris Hanhy PO Box 44 Dyer, NV 89010
Chad Hanson-John Muir Project PO Box 897 Big Bear City, CA 92314
Brad Hardenbrook-Nevada Department of Wildlife 4747 Vegas Drive Las Vegas, NV 89108
Bob Harrington-Inyo County Water Department 135 S. Jackson St., PO Box 337 Independence, CA 93526
Josh Hart-Inyo County Planning Department P.O. Drawer L, 168 N. Edwards St. Independence, CA 93526
Rich Harvey-Nevada Divison of Forestry 2478 Fairview Drive Carson City, NV 89701
John Helm-Eastern Sierra Transit Authority PO BOX 1357 Bishop, CA 93515
Olin Helm 3267 North Westlawn Ave Fresno, CA 93723
22
Case 1:15-cv-01329-WBS-EPG Document 34-4 Filed 10/30/15 Page 35 of 147

Bill Helmer-Big Pine Tribe of Owns Valley 841 S. Main, P.O. Box 700 Big Pine, CA 93513
David Hulse-NAVFAC Southwest 1220 Pacific Highway San Diego, CA 92132
Byng Hunt-Mono County Board of Supervisors PO Box 2608 Mammoth Lakes, CA 93546
Raymond Jarvis-Town of Mammoth Lakes Public Works PO Box 1609 Mammoth Lakes, CA 93546
Larry Johnston-Mono County Board of Supervisors PO Box 1903 Mammoth Lakes, CA 93546
Lloyd W Kehus 301 Apollo Circle Bishop, CA 93514
Joe Kennedy-Timbisha Shoshone of Death Valley P.O. Box 206 Death Valley, CA 92328-0206
Matt Kingsley-Inyo County Board of Supervisors 210 Lasky Lane, PO Box 110 Lone Pine, CA 93545
Ceal Klingler 940 Starlite Dr Bishop, CA 93514
Teresa Knutson-Bureau of Land Management 5665 Morgan Mill Rd Carson City, NV 89701
Rick Lach-Recreational Aviation Foundation PO Box 378 Kernville, CA 93238
Charlotte Lange-Mono Lake Kutzadika Tribe P.O. Box 237 Lee Vining, CA 93541
Lanny Lehigh 108 Jeffrey Cir Bishop, Ca 92314
Larry Lehigh 108 Jeffrey Cir Bishop, Ca 92314
Lester Lehigh 108 Jeffrey Cir Bishop, Ca 92314
Lester Lee Lehigh 108 Jeffrey Cir Bishop, Ca 92314
Bernadette Lovato-Bureau of Land Management 351 Pacu Lane, Ste 100 Bishop, CA 93514
Sally Manning-Big Pine Tribe of Owns Valley 841 S. Main, P.O. Box 700 Big Pine, CA 93513
Randy Marten 2773 Sunset Rd Bishop, CA 93514
Tim McClelland-CalFire 3800 N. Sierra Way San Bernardino, CA 92405
Ron McCoy 787 Rome Dr Bishop, CA 93514
Steve McLaughlin PO Box 819 Big Pine, CA 93513
Sally Miller-The Wilderness Society PO Box 442 Lee Vining, CA 93541
David Moose-Big Pine Tribe of Owns Valley 841 S. Main, P.O. Box 700 Big Pine, CA 93513
Mike Morrison-California Dept. of Fish and Wildlife 407 W. Line Street, Rm 1 Bishop, CA 93514
Steve Most 78 Pinon Hills Rd Mammoth Lakes, CA 91436
Israel Naylor-Ft. Independence Community of Paiute IndiansP.O. Box 67 Independence, CA 93526
Don L. Neubacher-National Park Service PO BOX 577 Yosemite, CA 95389
Greg Norby-Mammoth Community Water District PO Box 597, 1315 Meridian Blvd Mammoth Lakes, CA 93546
Franklin G Nyholt PO Box 85 Independence, CA 93526
Lucy Parker-California Indian Basketweavers Assoc. P.O. Box 157 Lee Vining, CA 93541
SP Parker-IFMGA/AMGA Certified Mountain Guide PO Box 95 Bishop, CA 93515
Rob Pearce-Natural Resource Conservation Service 270 See Vee Lane Bishop, CA 93514
Burt Peters PO Box 162 Dyer, NV 89010
23
Case 1:15-cv-01329-WBS-EPG Document 34-4 Filed 10/30/15 Page 36 of 147
June Price-Kern Valley Indian Community P.O. Box 1010 Lake Isabella, CA 93240
John Priscu Montana State University Bozeman, MT 59717
Daniel Pritchett-The Bristlecone Chapter of the California Native Plant SocietyPO Box 364 Bishop, Ca 93515
Rick Pucci-Inyo County Board of Supervisors PO Box 128 Bishop, CA 93514
Ed Rannells-Esmeralda County Road Department PO Box 129 Goldfield, NV 89013
Edmund Reymus-Walker River Paiute Tribe P.O. Box 220 Shurz, NV 89427
Robert Robinson-Kern Valley Indian Community P.O. Box 401 Weldon, CA 93283
Bob Ross-Bureau of Land Management 4701 North Torrey Pines Drive Las Vegas, NV 89130
Adora Saulque-Benton Paiute Reservation UTU UTU GWAITU Paiute Tribe, P.O. Box I Benton, CA 93512
Annette Scott 8549 S. 4670 W. West Jordan, UT 84088
Ed Seum-Bureau of Land Management 5100 East Winnemucca Blvd Winnemucca, NV 89445
Andrew Skaggs-California Trout PO Box 3442 Mammoth Lakes, CA 93546
Woody Smeck-National Park Service 47050 Generals Highway Three Rivers, CA 93271-9700
Laura Smith-City of Bishop PO Box 1236, 377 West Line Street Bishop, CA 93515
Frank Stamey 2624 Irene Way Bishop, CA 93514
Tom Stephenson-California Dept. of Fish and Wildlife 407 W. Line Street, Rm 1 Bishop, CA 93514
Fred Stump-Mono County Board of Supervisors PO Box 715 Bridgeport, CA 93517
Frank Syarney 2624 Irene Way Bishop, CA 93514
Carl Symons-Bureau of Land Management 300 S. Richmond Rd Ridgecrest, CA 93555
Tim Taylor-California Department of Fish and Wildlife PO Box 497 Bridgeport, CA 93517
Leon Thomas Jr-Bureau of Land Management 5665 Morgan Mill Rd Carson City, NV 89701
Mark Tillemans-Inyo County Board of Supervisors 215 N. School Street, PO Box 612 Big Pine, CA 93513
Steve Toomey 6931 Hwy 6 Bishop, Ca 92314
Mike Trujillo-Mineral County Public Works PO Box 1035, 300 "O" Street Hawthorne, NV 89415
Bryanna Vaughan-Big Pine Community Services District PO Box 639, 180 N. Main Stret Ste D Big Pine, CA 93513
Cindy Wahrenbrect 374 May St Bishop, CA 93514
John Wentworth-MLTPA PO Box 100 PMB 432, 1934 Meridian BoulevardMammoth Lakes, CA 93546
Gregg Wilkerson 7005 Hooper Ave Bakersfield, CA 93308
Bob Woodson 2356 N. Sierra Hwy, #E Bishop, CA 93514
Mary Wuester-Lone Pine Paiute-Shoshone Reservation P.O. Box 747, 1103 S. Main St. Lone Pine, CA 93545
24
Case 1:15-cv-01329-WBS-EPG Document 34-4 Filed 10/30/15 Page 37 of 147

EXHIBIT 5
Case 1:15-cv-01329-WBS-EPG Document 34-4 Filed 10/30/15 Page 38 of 147

-Sierra National Forest - Forest Plan Revision
Date: ) l ! J(\..L. ) ~ .~ 0 /~ I ,
· Enillft Adcha ·. · .. I Oranlzatlon
351~ ]/#ft3
977-£/5/ z z r- l(JJ
'!v loYlf tt
F/!1ZilErJ1t4 1<c~.
Case 1:15-cv-01329-WBS-EPG Document 34-4 Filed 10/30/15 Page 39 of 147
. -
Sierra National Forest - Forest Plan Revision
- ;;;i&I'<-
. . Phone Number . . I · .. · EmllD Adclrta : :. -· ¥'.JI ~Crt. -4-2-~'
F ,'Q.Jz.
Bue~ @/Jd'i!A~!o~
...!..!_
oJ-1
5ar I ate ff//
-c...~ I #v<-.
~
.... - I I l uv55 n.di ~e~ I {. .t.CS. ~ ld. I r-Di.-e- 5 7 pJ .. "' >-e vi~ 1, !'\. ..a~:
I " . ' Fores-/ f£."' I~ f(
Case 1:15-cv-01329-WBS-EPG Document 34-4 Filed 10/30/15 Page 40 of 147

~
C-J!.,,,.
Sierra National Forest - Forest Plan Revision
D•te-:#YLL I le I?.. 0 ( ~ . --·-·
Phone Number . . I . .. Emall.Addr.w
~r- ~37>-tt1 7 I Jflt..J;~r;J/'llholl,~i
u~~
g.. ~x_' ,....__,
Toole Interest Ara
c~P/11,A ..
-"II:!!--~~
Case 1:15-cv-01329-WBS-EPG Document 34-4 Filed 10/30/15 Page 41 of 147

c ZJ 0 ~ ·-
~ "' -\}, () ·- I ~ ~ ~ ~ a: ._
F u7 .... I ~ c
ra µ. VJ lL - ~
t/} u. \{'\ ll D. 't :J ~
\{) J \/')
t; & ~ ~ s;: cu ' ..
J)
0 ........ "S LL. (;)
I ~ . I l
t; ~ 1 \ cu -~ .1 .. 0 Qj Ill
LL. .. l'D - c
ra c '\)-.. 0 \}.,, ~ ~ ·- I ~ .... :.I]
m ~ .:t-- er
z I ~ ~
~ K ~ m J '9 f'. 3 .. {'-.. ~ \(') .. I cu ~ r- I
~ 0 ·- 0 l r "' ') r- "'>
Case 1:15-cv-01329-WBS-EPG Document 34-4 Filed 10/30/15 Page 42 of 147
...
Sierra National Forest - Forest Plan Revision
Date: lu J I lR { c2.b l 'f
Name Phone Number E11111D ,...,_ nlzatlon TDDlc Interest Area
D~l\JL~ A\> J !hta> PA-H L-
Jn~vi. ri+a-AGoo.dtJUil e.Fs. l-€D,v
J.c.h,;;rf~@ ~-~ .u:..f
s-~ - 8'to-Sl.e
-r;6'j' ... '581- z.~~ I
<L
Case 1:15-cv-01329-WBS-EPG Document 34-4 Filed 10/30/15 Page 43 of 147

Name .
Sierra National Forest - Forest Plan Revision
Date: ~\AL Ila l J.. D } Lf
Phan• Number ... _ EnillD AddNll ·
55°l. l( ( 7 S-6'5 sS? 'r(o ~o
~'J-i:t ...-sot-??2-3
~alV
I I
ff c~rk111 c»..fJ ~ti
L...VTP I A-z,_,"'
- v~~
v-C{S"~ ~~s-efl tr- I M5111t11;, 1M#J1Jfr 4-3 ~o.i/,d: .. ~ ~4 UJ
Case 1:15-cv-01329-WBS-EPG Document 34-4 Filed 10/30/15 Page 44 of 147

.. •
Sierra National Forest - Forest Plan Revision
Phaae .........
2t./-D~
I
· / I >< • => ' 1 ~ J 2 () Ji l!lllall Addrea
f70 vcJ~f::lou~rr
' ·~
Taalc lntsestAra '
?lee""
//
?~ I I
Case 1:15-cv-01329-WBS-EPG Document 34-4 Filed 10/30/15 Page 45 of 147

c 0 ·-.,, ·-~ a: c ra -a. t; cu ... 0
LI. --I ... t; ~
~ ~b u. ~ - c ra c 0 ·-.... ns z ns ... ... cu ·-"'
l r I I
1 . I
1 •
I I
I I
I
I
I
I
I
I
I
I I
I
I I
1 I
I I
I I
1 I I I
l l r --, I '
I
___ 1-r--41-L-
I
I
I -
I
-"--.--1--_J
I
I I I
Case 1:15-cv-01329-WBS-EPG Document 34-4 Filed 10/30/15 Page 46 of 147

Sierra National Forest - Forest Plan Revision A
• tyr~ I ~ i < \-I 14
ToDlc:·lnterest Area
'b 13-0~17_ .
ss9 -'i;Y. 9 - j '1-0 \ I \\~~ t1 e50\a.t l.c.cn-i
.'Zoct 7'(z. ~ ~() .. r~s·I t.f"fW.~
\(.
-
Case 1:15-cv-01329-WBS-EPG Document 34-4 Filed 10/30/15 Page 47 of 147

EXHIBIT 6
Case 1:15-cv-01329-WBS-EPG Document 34-4 Filed 10/30/15 Page 48 of 147

HTML Version
Date: 09/05/2014 06:00 PM EDTTo: USDA Forest Service <[email protected]>From: USDA Forest Service <[email protected]>Subject: Wilderness EvaluationContent-Type: text/html; charset=UTF-8
Dear Stakeholder:
Thank you for your interest and participation in the plan revision process for the Inyo, Sequoia, and Sierra National Forests!
As part of plan revision, the responsible official is required to identify and evaluate lands that may be suitable for inclusion in the National Wilderness Preservation System and determine whether to recommend any such lands for wilderness designations. We have finalized the inventory, using feedback received from the public. We are now moving into the evaluation phase of the process. It is important that we hear from you during the evaluation phase and encourage you to get involved.
More information on the wilderness inventory and evaluation process, including maps and instructions for providing input, can be found online at http://www.fs.usda.gov/goto/r5/FPRWilderness. Your input on the wilderness evaluation is most effective and appreciated if received before 8am Pacific Time, Monday, September 22, 2014.
We look forward to hearing from you!
Sincerely,
EDWARD E. ARMENTA KEVIN B. ELLIOTT DEAN A. GOULD Forest Supervisor Inyo National Forest
Forest Supervisor Sequoia National Forest
Forest Supervisor Sierra National Forest
Update your subscriptions, modify your password or email address, or stop subscriptions at any time on your Subscriber Preferences Page. You will need to use your email address to log in. If you have questions or problems with the subscription service, please contact MLM Support.
This service is provided to you at no charge by US Forest Service.
This email was sent to Email Address using GovDelivery, on behalf of: USDA Forest Service · 1400 Independence Ave., SW · Washington, DC 20250-0003 · 1-800-832-1355
Text Version
Page 1 of 3
6/5/2015https://admin.govdelivery.com/accounts/USDAFS/bulletins/13484951/preview_from_list
Case 1:15-cv-01329-WBS-EPG Document 34-4 Filed 10/30/15 Page 49 of 147

Date: 09/05/2014 06:00 PM EDT To: USDA Forest Service <[email protected]> From: USDA Forest Service <[email protected]> Subject: Wilderness Evaluation Content-Type: text/plain; charset=UTF-8 Dear Stakeholder:
Thank you for your interest and participation in the plan revision process for the Inyo,Forests!
As part of plan revision, the responsible official is required to identify and evaluate inclusion in the National Wilderness Preservation System and determine whether to recommwilderness designations. We have finalized the inventory, using feedback received from tinto the evaluation phase of the process. It is important that we hear from you during tencourage you to get involved.
More information on the wilderness inventory and evaluation process, including maps and input, can be found online at http://www.fs.usda.gov/goto/r5/FPRWilderness.* Your input most effective and appreciated if received before 8am Pacific Time, Monday, September 22
We look forward to hearing from you!
Sincerely,
EDWARD E. ARMENTA
KEVIN B. ELLIOTT
DEAN A. GOULD
Forest Supervisor
Inyo National Forest
Page 2 of 3
6/5/2015https://admin.govdelivery.com/accounts/USDAFS/bulletins/13484951/preview_from_list
Case 1:15-cv-01329-WBS-EPG Document 34-4 Filed 10/30/15 Page 50 of 147

Forest Supervisor
Sequoia National Forest
Forest Supervisor
Sierra National Forest
________________________________________________________________________
Update your subscriptions, modify your password or email address, or stop subscriptions Preferences Page [ https://public.govdelivery.com/accounts/USDAFS/subscriber/new?prefereuse your email address to log in. If you have questions or problems with the subscriptioSupport <[email protected]>.
This service is provided to you at no charge by US Forest Service [ http://www.fs.fed.us
________________________________________________________________________
This email was sent to Email Address using GovDelivery, on behalf of: USDA Forest ServicWashington, DC 20250-0003 · 1-800-832-1355 Powered by GovDelivery [ http://www.govdelive
Page 3 of 3
6/5/2015https://admin.govdelivery.com/accounts/USDAFS/bulletins/13484951/preview_from_list
Case 1:15-cv-01329-WBS-EPG Document 34-4 Filed 10/30/15 Page 51 of 147

EXHIBIT 7
Case 1:15-cv-01329-WBS-EPG Document 34-4 Filed 10/30/15 Page 52 of 147

1
June 30, 2014
Mike Dietle Land Management Plan Revision USDA Forest Service Ecosystem Planning Staff 1323 Club Drive Vallejo, CA 94592 Sent to: [email protected]
Re: Comments on Need for Change Analysis Dear Mr. Dietle: On behalf of the John Muir Project of Earth Island Institute (JMP) and the Center for Biological Diversity (CBD), we submit the following comments on the revised “need for change” documents recently released by Region 5 of the Forest Service (May 22 and June 5 documents). Our organizations have been participating in the plan revision process for over a year now, including the submission of extensive written comments regarding the Science Synthesis, the Bio-regional Assessment, the Natural Range of Variation reports, as well as each Forest-specific Assessment (Inyo, Sequoia, and Sierra National Forests). Our comments were detailed and contained numerous scientific citations that directly pertain to the Sierra Nevada ecosystem, especially as to wildlife conservation and fire. The Final Assessments released by the Forest Service do not reflect the important and highly relevant scientific knowledge we submitted. In the revised, need for change documents, we appreciate, for example, the explicit reference to “complex early seral forest.” However, we wish to reemphasize that important and relevant science continues to be ignored and is not being incorporated into the plan revision as of yet. As described below, we have significant concerns about both the content and scope of the revised need for change documents, and these issues must be addressed going forward. May Document The May document refers to the desire to “[d]evelop plan components to manage for resilient ecosystems to withstand fires.” The word choice – “withstand” – should be changed because it represents a one-sided view of both fire and resilience. This is not just a technicality. It is
CENTER for B IOLOGICAL DIVERSITY
Case 1:15-cv-01329-WBS-EPG Document 34-4 Filed 10/30/15 Page 53 of 147

2
actually quite important because word choice impacts how the public perceives fire. If the Forest Service is projecting a need for “withstand[ing]” fire, then the public will be unlikely to embrace what is actually called for – i.e., more fire on the landscape. We therefore believe it is absolutely necessary to use a more appropriate word than “withstand,” such as: “[d]evelop plan components that incorporate the ecological importance of fires.” Furthermore, resilience should not be equated with engineering. Resilience requires reestablishing the ecological disturbances that forests and wildlife evolved with. For example, wildlife evolved with fire, and therefore resilience is achieved through management that seeks to allow fire back on the landscape and to conserve post-fire wildlife habitat. The May document further states:
“Add desired conditions for post-fire management, addressing ecological integrity; Update desired conditions to specifically address old forest components and function, such as large tree densities, heterogeneity, understory vegetation, snags, logs, and connectivity at multiple spatial scales; Revise current management direction to encourage restoration and maintenance of old forests to a resilient state by emphasizing desired conditions and strategies.”
Generally speaking, we appreciate and agree with this approach. The details, however, are important because in the past the Forest Service has used similar language to argue for eliminating post-fire early seral areas under the guise of more quickly returning the areas to “old forest.” That approach is not scientifically sound as it does not acknowledge that the journey is just as important as the destination in regard to forest succession (e.g., Donato et al. 2012). Old forest derives from early forest in the sense that important components, like snags, downed wood, shrubs, and natural heterogeneity (from natural regeneration) derive, in large part, from complex early seral forest (e.g., Swanson et al. 2011). Put another way, it does not make sense to achieve ecological integrity by destroying complex early seral forest to more quickly achieve old forest – instead, both are damaged ecologically in such an effort. The May document further states: “Update management direction that incorporates the new Federal Wildland Fire Management Policy and the National Cohesive Wildland Fire Management Strategy to increase the pace and scale of restoration and maintenance, and the effectiveness and efficiency of restoration and maintenance.” Such a statement is entirely dependent on context. Increasing pace and scale has thus far caused significant harm to owl habitat, fisher habitat, and woodpecker habitat, and therefore, from a wildlife perspective, increasing pace and scale could be extremely detrimental. Thus, and as explained further below, it is crucial that the Forest Service establish explicit standards and guidelines that conserves wildlife habitat, especially a) dense, closed-canopy, complex green forest and b) high snag density, complex, post-fire forest.
Case 1:15-cv-01329-WBS-EPG Document 34-4 Filed 10/30/15 Page 54 of 147

3
June Document The document argues that:
“Vegetation density remains high and uniform, perpetuating uncharacteristic fire. Biodiversity (e.g., birds, mammals) associated with patchy vegetation (heterogeneity) has declined and continuous to decline. Understory plants dependent on or enhanced by recurrent low and moderate intensity fire continue to decline. Old forest structure continues to decline with large-scale high intensity fire.”
This statement lacks scientific rigor/integrity. It may reflect the view of silviculturalists or others within the Forest Service, but does not reflect the breadth of science in regard to fire ecology and wildlife biology. First, the blanket assertion that “[v]egetation density remains high and uniform, perpetuating uncharacteristic fire” has no basis in meaningful evidence. Where exactly is this “uncharacteristic” fire? Is the Forest Service referring to the Angora Fire, the Storrie Fire, the Moonlight Fire, the McNally Fire, the Chips Fire, the Reading Fire, the Rim Fire? If so, then it is important to acknowledge that the fires that have actually been studied – e.g., the Angora, the Storrie, the Moonlight, the McNally – have all been shown to contain exceptionally important wildlife habitat in the places that burned severely. There is actual evidence for this, namely, Bond et al. 2009, 2013; Buchalski et al. 2013; Burnett et al. 2010, 2012; Hanson and North 2007; Hanson 2013; Malison and Baxter 2010; Manley and Tarbill 2012; Roberts 2008, 2011; Seavey et al. 2012; Siegel et al. 2011, 2013. In other words, the places that the Forest Service is seeking to condemn and avoid are the places that wildlife needs and thrives upon because wildlife has evolved to depend on severely burned forest. The statement that “[b]iodiversity (e.g., birds, mammals) associated with patchy vegetation (heterogeneity) has declined and continuous to decline” is accurate. However, this includes species associated with severely burned forest such as the extremely rare black-backed woodpecker. Thus, any implied message that there is too much severe fire is false, and moreover, no effort has been made to account for the devastating ecological impacts of post-fire salvage logging. For example, the comparison of biodiversity in unlogged versus logged burned forest in Burnett et a. 2010, 2012, shows how dramatic things are in regard to salvage logged landscapes. Likewise, Lee et al. 2012 shows that it is post-fire salvage logging that is likely harming spotted owls and their habitat, while unlogged severely burned forest can enhance owl habitat (Bond et al. 2009). The statement “[u]nderstory plants dependent on or enhanced by recurrent low and moderate intensity fire continue to decline” likewise reflects an unsubstantiated bias against severe fire. The post-fire vegetation associated with severe burns – e.g., shrubs and nitrogen fixers and oaks – is extremely important and rare as well—see, e.g., Nagel and Taylor 2005, Cocking et al. 2014, Burnett et al, 2010, 2012, Siegel et al. 2011, Bond et al. 2009, Manley and Tarbill 2012. The statement that “[o]ld forest structure continues to decline with large-scale high intensity fire” cannot be taken seriously unless what was meant to be said is that salvage logging after high
Case 1:15-cv-01329-WBS-EPG Document 34-4 Filed 10/30/15 Page 55 of 147

4
intensity fire is what is causing harm to old forest structure. Moreover, no mention is made of the severe harm to old forest structure from mechanical treatments via loss of understory vegetation as well as the logging of small, medium, and even mature trees. Thus, the statement should read “[o]ld forest structure continues to be harmed by widespread mechanical treatments and intensive post-fire salvage logging after large-scale high intensity fire. Mechanical treatments reduce forest complexity by removing snags, small and medium sized trees (and sometimes even mature trees), understory vegetation, and downed wood. Salvage logging does the same by removing and/or damaging snags, future downed wood, downed wood, and natural conifer and vegetation regeneration.” Also neglected is the fact that conifer forests of the Sierra Nevada rely on fire of all severities to maintain ecosystem integrity, but currently, Sierra forests are in an extreme fire deficit of all severities. (See, e.g., Miller et al. 2012, Odion and Hanson 2013, Mallek et al. 2013, Hanson and Odion 2014, Odion et al. 2014.) This fire deficit means that, generally speaking, when fires do occur in the Sierras, they are restorative events because they return fire and its ecological value to the landscape, providing, for example, essential (and very rare) wildlife habitat (see, e.g., Bond et al. 2009, 2013; Buchalski et al. 2013; Burnett et al. 2010, 2012; Hanson and North 2007; Malison and Baxter 2010; Manley and Tarbill 2012; Roberts 2008; Seavey et al. 2012; Siegel et al. 2011, 2013). In addition, because they burn in a mosaic of severities, fires increase forest heterogeneity at multiple scales (stand, watershed, and landscape scales, for example), an outcome that the Forest Service often states it desires (and thus should welcome). And, contrary to assumptions, large, high-severity fire patches are not homogenous—rather, they contain stand level heterogeneity because they vary in size and importantly, contain within them high levels of variation in regard to post-fire vegetation and snags. Miller et al. (2012) found that the current high-intensity fire rotation in Sierra Nevada montane conifer forests is 801 years; thus, within any 20-year period, for instance, only about 2.5% of the landscape is snag forest habitat even if none of it is subjected to post-fire salvage logging and artificial replanting. The authors recommended increasing high-severity fire amounts [i.e., decreasing rotation intervals] in the Cascades-Modoc region and on the western slope of the Sierra Nevada (which together comprise most of the forest in the Sierra Nevada management region), where the current high-severity fire rotation is 859 to 4650 years [Table 3]. The authors noted that “high-severity rotations may be too long in most Cascade-Modoc and westside NF locations, especially in comparison to Yosemite…” Moreover, even when the 2012 and 2013 fires are integrated into the analysis (including the Rim fire), the high-severity fire rotation interval (in the slightly longer time period than that analyzed in Miller et al. 2012) is still slightly above 800 years, using the same approach as that used in Miller et al. (2012). Historical high-severity fire rotation intervals in mixed-conifer forests of the Sierra Nevada were generally in the range of 200 to 300 years, indicating that we now have much less habitat created by high-severity fire now than we had historically—even before habitat removal from post-fire logging is taken into account (e.g., Odion et al. 2013, Hanson and Odion 2014, Odion et al. 2014). An additional study from the Forest Service, Mallek et al. (2013, Table 3), also found in its results that we now have less low, moderate, and high-severity fire than we did historically in the
Case 1:15-cv-01329-WBS-EPG Document 34-4 Filed 10/30/15 Page 56 of 147

5
Sierra Nevada, and estimated that we have a little over half as much high-severity fire now compared to historical levels in the following forest types: oak woodlands, dry mixed conifer, moist mixed conifer, yellow pine, and red fir (8,693 hectares annually now versus 15,569 hectares historically (see AAHS = annual area of high-severity fire, Table 3 of Mallek et al. 2013)). However, it is important to note that Mallek et al. was based upon a modeling assumption of only 6% high-severity fire effects in historical mixed-conifer and yellow pine forests, borrowing from a similar modeling assumption in Stephens et al. (2007). The empirical studies that Mallek et al. (2013, Table 2) used for all other historical fire parameters, such as Beaty and Taylor (2001) and Bekker and Taylor (2001), concluded that historical high-severity fire percentages in these forest types were generally in the range of 20-35% (and often higher). Thus, while even Mallek et al. (2013) found significant deficits of all severities of fire, it greatly underestimates the magnitude of the current deficit of high-severity fire. The fire deficit has resulted in a deficit of post-fire wildlife habitat. In other words, even setting aside salvage logging for the moment, there is already a substantial deficit of post-fire wildlife habitat in the Sierras due to the lack of all severities of fire on the landscape. There is no basis, therefore, for the assertion that fire/burned forest is the threat to old forest when in fact there is an extreme deficit of fire/burned forest and when it does occur, the Forest Service logs substantial portions of it. Also unsubstantiated (in this document or any previous document such as the Science Synthesis or Assessments) is the statement that “emphasiz[ing] closed canopied conditions [] contribute[s] to reduced fire resilience and [is] inconsistent with new science on forest heterogeneity.” This “new” science is not provided nor cited, and the best available wildlife science shows that closed canopy conditions provide essential habitat to, e.g., spotted owls, fishers, and martens, and, when such closed canopy areas burn severely, provides habitat to many avian species such as the black-backed and white-headed woodpeckers. Again, it may be that silviculturalists desire a dearth of severe fire on the landscape, but that is irreconcilable with the best available science showing the essential nature of closed canopy, both in its pre-fire and post-fire state, to Sierra wildlife (we have already provided the numerous citations in our previous comments such as the literature regarding spotted owls, regarding fishers, and regarding woodpeckers and other avian species—e.g., Bond et al. 2009, 2013; Buchalski et al. 2013; Burnett et al. 2010, 2012; Hanson and North 2007; Hanson 2013; Malison and Baxter 2010; Manley and Tarbill 2012; Roberts 2008, 2011; Seavey et al. 2012; Siegel et al. 2011, 2013). The following attacks on severe fire are also troubling given that they are unsubstantiated and do not reflect reality:
“There is a lack of widespread within-patch and landscape heterogeneity to provide landscape connectivity of these habitat types.” “Large-scale fires and other factors are resulting in fragmentation of habitat for wide-ranging species.”
The June document (any previous document such as the Science Synthesis or Assessments) fails to substantiate its attack on large patches of severely burned forest and does not mention that
Case 1:15-cv-01329-WBS-EPG Document 34-4 Filed 10/30/15 Page 57 of 147

6
salvage logging is widespread in severely burned areas and therefore associated with any “lack of widespread within-patch and landscape heterogeneity” cannot be attributed to fire, but must address that salvage logging is the real issue. Current salvage logging and reforestation practices contribute to the degradation and loss of complexity and heterogeneity. Likewise, the other statement, at best, should instead read: “Large-scale salvage logging and other factors are resulting in fragmentation of habitat for wide-ranging species.” The June document goes on to state that the “current plan direction was developed specifically to try to reduce the rate of loss of old forests and California spotted owl habitat from wildfire while protecting key habitat areas and key habitat elements. However, for a variety of reasons, the pace and scale of fuels reducing activities has not been sufficient to reduce the wildfire threats to habitat.” Again, this is unsubstantiated and erroneous. There is an entire body of data that shows that mechanical treatments that reduce forest canopy cover are a primary driver of the California spotted owl declines that have been observed on all Forest Service-managed lands in the Sierra Nevada over the past 20+ years. Therefore, increasing the pace and scale of mechanical fuels treatments would also increase the pace and scale of the spotted owl decline. Likewise, current data indicates that California spotted owls use burned areas of all severities for foraging and/or nesting, but do not use areas that burned and were subsequently salvage logged. The adverse effects of reducing canopy cover and forest complexity, and the adverse effects of salvage logging, must be acknowledged and properly addressed. Based on the declines in spotted owl populations on Forest Service lands and the correlation of the decline to fuels treatments and salvage logging (despite the protections afforded to the species through the existing forest plans in the form of Protected Activity Centers and Home Range Core Areas), it is clear that the Forest Service should take this opportunity to change the current plan components to better protect spotted owls from the adverse effects of fuels treatments and salvage logging. In the central Sierra Nevada, Seamans and Gutierrez (2007), for example, found that altering mature forest within California spotted owl territories negatively affected colonization and increased the likelihood of breeding dispersal within 0.7 mile of a territory center. And Lee et al. (2012) reported that mixed-severity fire, averaging 32% high-severity fire effects, did not reduce occupancy of California spotted owls in the Sierra Nevada and, in fact, occupancy in mixed-severity fire areas was slightly higher than in unburned mature forest, and even most territories with >50% high-severity fire remained occupied (at levels of occupancy comparable to unburned forests). This, however, was not the case in salvage logged sites, as every site that was salvage logged lost occupancy, even though they were occupied after the fire but before the salvage logging (Lee et al. 2012). Specifically, salvage logging occurred on eight of the 41 burned sites; seven of the eight sites were occupied immediately after the fire but none were occupied after salvage logging. Further, California spotted owls have been found to preferentially select unlogged high-severity fire areas in mature conifer forest for foraging habitat (Bond et al. 2009). The June document also argues that the “current plan direction provides general direction for providing for post- fire complex early-seral habitat.” This is not accurate. Rather, the current plan direction has promoted salvage logging, with no limitations (other than LOPs and minimal retention [e.g. 4-6 snags per acre]) in complex early-seral habitat, to the detriment of owls, woodpeckers and myriad other species found, post-fire, over time, in severely burned areas. For example, Siegel et al. (2011) explains that not only black-backed woodpeckers, but many other species, are utilizing complex early seral forest left unlogged: “Many more species occur at high
Case 1:15-cv-01329-WBS-EPG Document 34-4 Filed 10/30/15 Page 58 of 147

7
burn severity sites starting several years post-fire, however, and these include the majority of ground and shrub nesters as well as many cavity nesters. Secondary cavity nesters, such as swallows, bluebirds, and wrens, are particularly associated with severe burns, but only after nest cavities have been created, presumably by the pioneering cavity-excavating species such as the Black-backed Woodpecker. Consequently, fires that create preferred conditions for Black-backed Woodpeckers in the early post-fire years will likely result in increased nesting sites for secondary cavity nesters in successive years.” Similarly, Burnett et al. (2012_ found that “while some snag associated species (e.g. black-backed woodpecker) decline five or six years after a fire [and move on to find more recent fire areas], [species] associated with understory plant communities take [the woodpeckers’] place resulting in similar avian diversity three and eleven years after fire (e.g. Moonlight and Storrie).” Burnett et al. (2012) also noted that “there is a five year lag before dense shrub habitats form that maximize densities of species such as Fox Sparrow, Dusky Flycatcher, and MacGillivray’s Warbler. These species have shown substantial increases in abundance in the Moonlight fire each year since 2009 but shrub nesting species are still more abundant in the eleven year post-burn Storrie fire. This suggests early successional shrub habitats in burned areas provide high quality habitat for shrub dependent species well beyond a decade after fire.” And Manley and Tarbill (2012) found, in the post-fire area of the Angora fire, that woodpeckers play a keystone role that can only be accomplished when post-fire habitat is maintained, not logged:
Although woodpecker species differed in their influence on recovery of birds and small mammals, all three species observed in our study played an important role in supporting the cavity-dependent community through habitat creation for nesting, resting, denning, and roosting. The Black-backed Woodpecker was a significant contributor to the establishment of bird and small mammal species and communities in areas with high burn intensities, and it appeared to have a more narrow range of suitable habitat conditions for nest site selection compared to the Hairy Woodpecker. Thus, the habitat requirements of the Black-backed Woodpecker serve as a useful threshold for managing burned sites for wildlife recovery.
It is therefore imperative that Plans, as required, establish plan components, including standards or guidelines, to conserve the ecological integrity of post-fire, complex early seral habitat, especially the key characteristics, such as high snag density, extensive shrub cover, downed wood, and natural conifer regeneration. The June document only appears to refer to desired conditions, which is inadequate legally. Moreover, the last year of salvage logging proposals from the Forest Service – for the American, Aspen, and Rim Fires – demonstrates that current plan direction is contrary to complex early seral forest conservation and that therefore forest plans absolutely need meaningful additional plan components, including objectives, standards and guidelines, that address salvage logging and reforestation practices. The current atmosphere, in which the ecological benefit of burned trees is lost to a significant degree, and the development of complex early seral forest prevented via intensive post-fire planting and herbicide use needs to be addressed in the forest plan. These actions are in direct conflict with the development of this important ecological condition. Further, as already noted, the belief that “acceleration” of tree growth is necessary to develop
Case 1:15-cv-01329-WBS-EPG Document 34-4 Filed 10/30/15 Page 59 of 147

8
large trees in other seral stages needs to be addressed and avoided where ecological integrity is the goal. The June document goes on to express internal “concern with the impacts of large fires.” However, one would hope that there is also internal concern about the fire deficit, the rarity of complex early seral forest, and the ecological importance of complex early seral forest for many wildlife species. Finally, the statement that “herbicide use is currently well regulated, and a need to change current plan direction was not identified,” misses the point that herbicide use is a problem because of its impact to complex early seral forest via shrub destruction. That needs to be addressed in the Plan revisions. We reiterate comments already submitted below:
A. The Forest Assessments and the “Need for Change” Forest planning includes developing plans that promote “ecosystems and watersheds with ecological integrity and diverse plant and animal communities.” 36 CFR 219.1. That is why our organizations, over the past year, took the time and effort to extensively comment on the available literature as to wildlife conservation in the Sierra Nevada’s forests – biological diversity/ecological integrity is one of most important aspects of the forest revision process and we wanted to ensure that the new Forest Plans meaningfully incorporated the large body of literature that has accumulated over the past two decades. The NFMA regulations state that in developing a new plan the responsible official “shall review relevant information from the assessment and monitoring to identify a preliminary need to change the existing plan and to inform the development of plan components and other plan content.” 36 CFR 219.7(c)(2)(i). The assessments and the need for change statement are therefore obviously related—the “need for change” flows directly from the assessments. Yet, because our comments as to the assessments were largely unaddressed in the Final Assessments, our comments are thereby not being incorporated into the “need for change” document. As we pointed out in our comment letters (which are attached to, and incorporated into, this letter), significant information was omitted from the forest assessments (as well as from the Science Synthesis and NRVs). Furthermore, information on the effectiveness of the current forest plans was not presented in the forest assessments. For example, there was no discussion of the effectiveness of the current plans as to post-fire specialists such as the black-backed woodpecker. Thus, the “need for change” document is significantly flawed because information necessary to complete one has either a) been ignored, or b) not been divulged. We respectfully request more be done to address all the necessary issues. To do otherwise will fail to incorporate important and substantial information which will lead to flawed, inadequate, and illegal forest plans, which in turn will lead to habitat loss and serious harm to wildlife in the Sierras—the very opposite of ecological integrity.
Case 1:15-cv-01329-WBS-EPG Document 34-4 Filed 10/30/15 Page 60 of 147

9
B. Wildlife Conservation
Wildlife conservation should be its own emphasis area, as it meets the vast majority of the “criteria for emphasis areas to focus on immediately.” It is “important to many people, and provides many benefits to people.” “There is a threat to losing [these] benefits if the Forest Service doesn't act within the near future.” This is especially so for post-fire specialists, as well as wildlife that focuses on dense unburned forest (like the fisher and spotted owl), given the extent of salvage logging that has been proposed for the 2012 and 2013 Fires, and the extent of thinning projects in the Sierras. “[E]cological sustainability [is] at risk in the mid- and long-terms.” For example, a Conservation Strategy for the Black-backed Woodpecker has identified this to be true, as does current data for the spotted owl (e.g., Connor et al. 2013). “Current management direction as described and implemented does not provide benefits sustainably.” Again, this is very true for post-fire wildlife given that current management allows and seeks extensive salvage logging, and is true for species like the spotted owl, whose habitat is targeted for thinning projects. “There is substantial controversy over current management and general agreement among most people on approaches to improve aspects of current direction.” Again, this is very true as to salvage logging and post-fire management in general, as well as in regard to forest thinning of mature forest habitat. “Forest plans have the ability to do something substantial about the condition in the next ten years” – true again as to wildlife that relies on post-fire habitat, as well as wildlife that prefers dense forest habitat. And, “[a]lternatives and plan components can be developed within the plan revision timeline (April to May 2014).” For the wildlife just described, the scientific foundations now exist to address their needs in the plan revision timeline. Wildlife conservation is of course central to the National Forest Management Act. The conservation of wildlife therefore needs to be an emphasis area because so many species are negatively affected by current management objectives (e.g., thinning and salvage logging), and other human activities (e.g., OHV use, grazing, recreation). Wildlife conservation should also be its own emphasis area in light of the magnitude of the situation. Each forest has a high number of species identified as at risk, and the 2012 planning rule requires “maintaining the diversity of plant and animal communities and the persistence of native species in the plan area.” 36 CFR 219.9. Moreover, there is significant controversy as to wildlife issues, which is yet another reason to make it its owns emphasis area. For example, the Final Assessments continue to misstate the relevant science as to spotted owls and continue to largely ignore the condition of species like the black-backed woodpecker, olive-sided flycatcher, sooty grouse, mountain bluebird, fringed myotis, lazuli bunting, western wood pewee, hairy woodpecker, white-headed woodpecker, pallid bat, fox sparrow and mountain quail. Further, because the information provided in the forest assessments is so incomplete, it remains extremely unclear what the real intent is as to wildlife in the forest planning process. Wildlife issues have, for decades now, most often been treated as subordinate to other objectives, such as logging. By making wildlife its own emphasis area, the Forest Service can begin to end its past trend, and can instead treat wildlife as something that, per NFMA, deserves its own focus. Finally, in combining wildlife with other issues, the Forest Service has wrongly conflated
Case 1:15-cv-01329-WBS-EPG Document 34-4 Filed 10/30/15 Page 61 of 147

10
generalized fire impacts with how fire impacts wildlife. For example, the document generically states that “[l]arge, intense fires are impacting beneficial uses at an increasing rate,” and that a “single large fire, such as the Rim Fire, can have major impacts.” For wildlife, though, such large, intense fires can be critical to maintaining habitat; indeed, the Rim Fire created important habitat for the black-backed woodpecker and many other species, and therefore, should not be cast as somehow being only a negative when in fact it was restorative. By giving wildlife its own emphasis area, this important issue can be much better addressed because then the issue of impacts from fire can focus on its interactions with wildlife. Moreover, pursuant to the way wildlife is currently being handled, the public is completely left in the dark as to the importance of wildfire – including large, intense wildfire – to wildlife. And, by only referring to what the Forest Service claims is a limited “pace and scale of restoration”, the Forest Service entirely ignores how this so-called “restoration” harms wildlife habitat, and further, ignores important issues like salvage logging that can and must be addressed in the forest plan revisions. The same is true as to insects. We are not aware of any data to support the assertion of harm or adverse impact on wildlife from insects; rather, insects help create snags, an important wildlife feature, and provide food to wildlife. Nor has any information been provided in the assessment to show that current insect conditions are somehow outside the range of what it natural. It is crucial that wildlife be prioritized and treated appropriately. The current approach does n to achieve that for all the reasons just described and we therefore respectfully request that the Forest Service change its approach and instead give wildlife conservation the due consideration it needs and deserves.
C. Fire, the WUI, and Post-fire Management Fire, and how to protect human communities from fire, is another one of the most important issues at stake in the forest plan revision process. We submitted numerous comments and scientific citations on this issue that have been largely ignored or wrongly dismissed – in other words, the information has been made available to the Forest Service, but it is not being incorporated. New literature continues to demonstrate our points, such as the restorative value of all severities of fire. For example, Crotteau et al. 2013 notes that “the Storrie Fire generated diverse vegetative responses, potentially aiding in the reintroduction of the diverse landscape mosaic homogenized by a century of landscape-scale fire exclusion.” Cocking et al. 2014 similarly notes that its “results indicate that high-severity fire promotes persistence and restoration of ecosystems containing resprouting species, such as California black oak, that are increasingly rare due to widespread fire exclusion in landscapes that historically experienced more frequent fire.” These results, and the many others we have presented, should not be brushed aside – they are directly relevant to the issues at stake and go to the heart of the how to plan for the future. It is therefore imperative that the Forest Service not continue to arbitrarily pick and choose what to incorporate into the plan revision process. Doing do is illegal, but just as importantly, it violates the integrity of the process and the ability of the public to understand fully the situation and what is at stake.
Case 1:15-cv-01329-WBS-EPG Document 34-4 Filed 10/30/15 Page 62 of 147

11
Fire, including higher-severity fire (i.e., greater than 50% basal mortality), is essential to Sierra Nevada ecosystems. Presently, there is a significant deficit of all fire severities in the Sierra Nevada, and yet this reality continues to largely be dismissed. For example, higher-severity fire continues to be treated as though it must be eradicated when in fact it needs to be restored. In addition, the science surrounding post-fire management has changed vastly since the last forest plan and currently there is almost no meaningful direction in the forest plans on managing landscapes that have been affected by wildfire. Given the desire for “ecological restoration,” explicit direction in the forest plans is needed to protect post-fire wildlife habitat and to identify that post-fire logging is extremely harmful to the landscape. There is absolutely no reason at all for the forest plan revision not to address post-fire management, especially salvage logging. In light of the fact that most of our comments have not been incorporated or addressed in the final assessments and the need for change, we reiterate some of them here again:
In order to achieve more fire on the Sierra landscape, the Forest Service can do the following:
o Identify constraints on prescribed fire and managed wildland fire (e.g., air quality;
personnel availability; monetary resources; weather windows);
o Set guidelines to assist in avoiding the identified constraints;
o Remove all currently existing Plan restrictions (e.g., restrictions on the use of managed wildland fire outside of Wilderness) that prohibit or inhibit managed wildland fire or prescribed fire and instead set guidelines for how to achieve more prescribed fire and managed wildland fire;
o Increase education regarding effective home protection from fire and, in regard to
protecting human communities from fire, focus resources on making homes and structures fire resilient;
In order to maintain the ecological value of fire:
o It is essential that you address the current lack of protection for post-fire habitat. For example, the recommendations from the completed, “A Conservation Strategy for the Black-backed Woodpecker” (Bond et al. 2012), must be incorporated into the upcoming forest plan revision in order to protect wildlife that relies on burned forest habitat;
o You should change the current inadequate standard/guideline (which protects only 10% of burned forest [note that this 10% is not specific to moderate/high severity burned areas and therefore 100% of such areas can potentially be salvaged logged under current guidelines/standards]) to protect 100% of burned forest (except for hazard tree felling - i.e., human safety exemptions would be allowed). There does not exist any ecological basis for salvage logging and this is especially so in light of the deficit of such habitat on the landscape, especially the specific kind of
Case 1:15-cv-01329-WBS-EPG Document 34-4 Filed 10/30/15 Page 63 of 147

12
habitat that some species rely on (e.g., post-moderate/high severity burned forest that pre-fire was CWHR 4D or above);
o Do not use a desire for old forest conditions to drive post-fire actions – post-fire areas are complex and ecologically rich themselves, and should therefore not be seen as competition for old forest conditions. They should be allowed to regenerate on their own, especially since such areas can themselves offer the types of values associated with late seral conditions (e.g., DellaSala et al. 2013; Donato et al. 2012);
o In addition to prohibiting salvage logging (except for safety reasons), the Forest Service should acknowledge and promote the importance of natural regeneration. Post-fire areas that are manipulated by salvage logging and/or by reforestation efforts are, from an ecological perspective, no longer as valuable as post-fire areas; rather, post-fire salvage logging and reforestation substantially reduce, and often locally eliminate, wildlife species strongly associated with the forest habitat created by moderate and high-severity fire patches (Hanson and North 2008, Hutto 2008, Burnett et al. 2011, 2012, Seavy et al. 2012, Siegel et al. 2012, 2013). Time since fire also provides important insights into the need to protect post-fire areas from manipulation. There is a continuum of use of post-fire areas over time by different species. Black-backed woodpeckers, for example, are well known to require areas with very high snag densities immediately post-fire – i.e., mature forest that has very recently experienced higher-severity fire, and has not been salvage logged (Hanson and North 2008, Hutto 2008, Saab et al. 2009, Seavy et al. 2012, Siegel et al. 2010, 2011, 2012, 2013). However, “while some snag associated species (e.g. black-backed woodpecker) decline five or six years after a fire [and move on to find more recent fire areas], [species] associated with understory plant communities take [the woodpeckers’] place resulting in similar avian diversity three and eleven years after fire (e.g. Moonlight and Storrie).” (Burnett et al. 2012). Burnett et al. (2012) also noted that “there is a five year lag before dense shrub habitats form that maximize densities of species such as Fox Sparrow, Dusky Flycatcher, and MacGillivray’s Warbler. These species have shown substantial increases in abundance in the Moonlight fire each year since 2009 but shrub nesting species are still more abundant in the eleven year post-burn Storrie fire. This suggests early successional shrub habitats in burned areas provide high quality habitat for shrub dependent species well beyond a decade after fire.” (Burnett et al. 2012). Raphael et al. (1987) found that at 25 years after high-severity fire, total bird abundance was slightly higher in snag forest than in unburned old forest in eastside mixed-conifer forest of the northern Sierra Nevada; and bird species richness was 40% higher in snag forest habitat. In earlier post-fire years, woodpeckers were more abundant in snag forest, but were similar to unburned forest by 25 years post-fire, while flycatchers and species associated with shrubs continued to increase to 25 years post-fire (Raphael et al. 1987). In ponderosa pine and Douglas-fir forests of Idaho at 5-10 years post-fire, levels of aquatic insects emerging from streams were two and a half times greater in high-severity fire areas than in unburned mature/old forest, and bats were nearly 5
Case 1:15-cv-01329-WBS-EPG Document 34-4 Filed 10/30/15 Page 64 of 147

13
times more abundant in riparian areas with high-severity fire than in unburned mature/old forest (Malison and Baxter 2010). Schieck and Song (2006) found that bird species richness increased up to 30 years after high-severity fire, then decreased in mid-successional forest [31-75 years old], and increased again in late-successional forest [>75 years]).
o It is imperative that “salvage” logging not be equated with ecological restoration, or forest management objectives other than economically-motivated multiple use. Noss and others (2006b: 485-86) caution that post-fire logging is counter to resilience of fire-adapted forest ecosystems for six reasons: “Our key findings on post-fire management are as follows. First, post-burn landscapes have substantial capacity for natural recovery. Re-establishment of forest following stand-replacement fire occurs at widely varying rates; this allows ecologically critical, early-successional habitat to persist for various periods of time. Second, post-fire (salvage) logging does not contribute to ecological recovery; rather, it negatively affects recovery processes, with the intensity of impacts depending upon the nature of the logging activity (Lindenmayer et al. 2004). Post-fire logging in naturally disturbed forest landscapes generally has no direct ecological benefits and many potential negative impacts (Beschta et al. 2004; Donato et al. 2006; Lindenmayer and Noss 2006). Trees that survive fire for even a short time are critical as seed sources and as habitat that sustains biodiversity both above- and belowground. Dead wood, including large snags and logs, rivals live trees in ecological importance. Removal of structural legacies, both living and dead, is inconsistent with scientific understanding of natural disturbance regimes and short- and long-term regeneration processes. Third, in forests subjected to severe fire and post-fire logging, streams and other aquatic ecosystems will take longer to return to historical conditions or may switch to a different (and often less desirable) state altogether (Karr et al. 2004). Following a severe fire, the biggest impacts on aquatic ecosystems are often excessive sedimentation, caused by runoff from roads, which may continue for years. Fourth, post-fire seeding of non-native plants is often ineffective at reducing soil erosion and generally damages natural ecological values, for example by reducing tree regeneration and the recovery of native plant cover and biodiversity (Beyers 2004). Non-native plants typically compete with native species, reducing both native plant diversity and cover (Keeley et al. 2006). Fifth, the ecological importance of biological legacies and of uncommon, structurally complex early-successional stands argues against actions to achieve rapid and complete reforestation. Re-establishing fully stocked stands on sites characterized by low severity fire may actually increase the severity of fire because of fuel loadings outside the historical range of variability. Finally, species dependent on habitat conditions created by high severity fire, with abundant standing dead trees, require substantial areas to be protected from post-fire logging (Hutto 1995).”
It is not appropriate to generalize and frame current forest conditions as “forests are now too dense.” Density is not the problem, the lack of fire and its associated heterogeneity is the problem. Moreover, not only is density not to be considered a generic problem, it is
Case 1:15-cv-01329-WBS-EPG Document 34-4 Filed 10/30/15 Page 65 of 147

14
instead important to recognize that dense forest habitat, especially dense mature forest habitat, is critical habitat for rare species (i.e, what the literature shows they preferentially select) like the California spotted owl, Pacific fisher, and black-backed woodpecker (e.g., Zielinski et al. 2006, Purcell et al. 2009, Underwood et al. 2010). Therefore, for rare species like the owl and fisher, it is critical to acknowledge the importance of dense habitat and ensure its protection.
Post-fire landscapes, especially post-moderate/high severity fire landscapes, must be
acknowledged as creating high bio-diversity and essential habitat for many species (e.g., Raphael et al. 1987, Burnett et al. 2010, Burnett et al. 2012, Hanson and North 2008, Hutto 2008, Saab et al. 2009, Swanson et al. 2011, Seavy et al. 2012, Buchalski et al. 2013, Siegel et al. 2010, 2011, 2012, 2013). For example, in the Moonlight Fire area, researchers explained that “[i]t is clear from our first year of monitoring three burned areas [Cub, Moonlight and Storrie Fires] that post-fire habitat, especially high severity areas, are an important component of the Sierra Nevada ecosystem.” (Burnett et al. 2010). They also found that “[o]nce the amount of the plot that was high severity was over 60% the density of cavity nests increased substantially,” and that “more total species were detected in the Moonlight fire which covers a much smaller geographic area and had far fewer sampling locations than the [unburned] green forest.” (Burnett et al. 2010);
The available wildlife science regarding post-fire bio-diversity shows that the mixed-severity fires that are occurring, such as the McNally Fire, are critical habitat for many rare species. In regard to the McNally Fire, for example, one study (Buchalski et al. 2013) found that most phonic groups of bats showed higher activity in areas burned with moderate to high-severity (see also Malison and Baxter 2010, finding greater bat activity was observed in high-severity burned riparian habitat within mixed-conifer forest than at unburned areas of similar habitat in central Idaho). Similarly, in the McNally area, California spotted owls were found to be preferentially selecting high-severity fire areas for foraging (Bond et al. 2009). And recent research indicates that Pacific fishers may benefit from mixed-severity fire (e.g., Hanson 2013—this is the only study to date that examines fisher response to an actual wildfire event).
In regard to Bond et al. 2009, the Forest Service continues to wrongly state the following: “One study in a single high severity burned patch of the McNally fire (2002) showed that California spotted owls foraged at higher frequency in high severity burned areas. However, results of this study were limited (four territories) in a single high severity burned patch (Bond et al. 2009). Nesting habitat was not evaluated and may be more limiting for the 34 California spotted owl in the Sierra (Verner 1999, Keane 2013).”
These statements, written in an attempt to minimize the Bond study, are highly
misleading and mischaracterize the existing science on California spotted owls and fire, and therefore must be corrected. First, the sampling unit of a foraging resource selection study is the individual owl, not the territory, because male and females in a pair forage independently and represent a unique dataset of foraging habitat selection. Thus, the true sample size is 7 owls, not 4 territories. Second, according to the Forest Service’s own survey data from local biologists, there
Case 1:15-cv-01329-WBS-EPG Document 34-4 Filed 10/30/15 Page 66 of 147

15
were 9 spotted owl territories within and adjacent to the McNally Fire. Four of the 9 territories did not have a sufficient road network for effective radio-telemetry and Bond et al. were unable to detect owls at another territory. Thus, the 4 territories where Bond et al. (2009) collected data represented all the available territories where radio-telemetry was feasible to track owls with the high degree of precision and efficient accumulation of a large data set on foraging locations that is required for a foraging resource selection study (30 – 50 foraging locations per owl). The study included 44% of all the known spotted owl territories affected by the McNally Fire and this sample included widely dispersed locations in both the Greenhorn Mountains and the Kern Plateau (a distance of ~ 13 km). The Bond et al. (2009) study included 7 independently foraging owls in 4 territories that encompassed a mosaic of hundreds of patches consisting of unburned, low-, moderate-, and high-severity burned stands over more than 1,000 hectares of forest land. Bond et al. (2009) represents the best available science on resource selection of foraging and roosting California spotted owls in burned landscapes of the Sierra Nevada. The results show that radio-marked owls foraged in many stands burned by high-severity fire over the course of the breeding season, not in “a single high severity burned patch” as the Forest Service has claimed. The results clearly indicate that California spotted owls exhibited a strong preference for foraging in high-severity burned forest patches. Furthermore, the Forest Service claims that “nesting habitat was not evaluated,” when in fact, Bond et al (2009) did quantify the characteristics of the nest tree and the burn severity of the nest stand as well as of dozens of roosting locations. Additionally, a comprehensive analysis of nesting habitat and fire was done in Lee et al. (2012). That study used 11 years of nesting-site survey data from 41 California Spotted Owl territories burned in six forest fires (including the McNally fire) and 145 territories in unburned areas from throughout the Sierra Nevada, California, to compare probabilities of occupancy between burned and unburned nesting sites. Lee et al. (2012) found no significant effects of fire, suggesting that even fire that burns on average 32% of suitable forested habitat at high severity within a California Spotted Owl nest site, does not threaten the persistence of the subspecies on the landscape. Finally, Verner (1999) is not an appropriate citation. Verner (1999) is not a published study, and is a 14-year old response in a status report that was found online, and has no bearing on the statement that “nesting habitat may be more limiting for the 34 California spotted owl [sic] in the Sierra.” If the Forest Service intended to cite Verner (1992), this is a general account of spotted owl biology from 20 years ago that makes a single statement that is unsupported by data or citation: “Sometimes adult birds are displaced from established territories by loss of habitat through fire, logging, or other major disturbances.” Keane (2013) refers to the document “California Spotted Owl: Scientific Considerations for Forest Planning.” This citation provides a summary of the current literature regarding fire and spotted owls and concludes that owls can persist in areas affected by mixed-severity fire at least within a decade or so after fire. However, similar to Verner (1999), this document does not evaluate nesting habitat for 34 California spotted owls in the Sierra Nevada.
Case 1:15-cv-01329-WBS-EPG Document 34-4 Filed 10/30/15 Page 67 of 147

16
Regarding fire size and fire intensity trends in the Sierras, Hanson and Odion (2013)
conducted the first comprehensive assessment of fire intensity since 1984 in the Sierra Nevada using 100% of available fire intensity data, and using Mann-Kendall trend tests (a common approach for environmental time series data – one which has similar or greater statistical power than parametric analyses when using non-parametric data sets, such as fire data). They found no increasing trend in terms of high-intensity fire proportion, area, mean patch size, or maximum patch size. Hanson and Odion checked for serial autocorrelation in the data, and found none, and used pre-1984 vegetation data (1977 Cal Veg) in order to completely include any conifer forest experiencing high-intensity fire in all time periods since 1984 (the accuracy of this data at the forest strata scale used in the analysis was 85-88%). Hanson and Odion also checked the results of Miller et al. (2009) and Miller and Safford (2012) for bias, due to the use of vegetation layers that post-date the fires being analyzed in those studies. Hanson and Odion found that there is a statistically significant bias in both studies (p = 0.025 and p = 0.021, respectively), the effect of which is to exclude relatively more conifer forest experiencing high-intensity fire in the earlier years of the time series, thus creating the false appearance of an increasing trend in fire severity. Miller et al. (2012a), acknowledged the potential bias that can result from using a vegetation classification data set that post-dates the time series. In that study, conducted in the Klamath region of California, Miller et al. used a vegetation layer that preceded the time series, and found no trend of increasing fire severity. Miller et al. (2009) and Miller and Safford (2012) did not, however, follow this same approach. Hanson and Odion also found that the regional fire severity data set used by Miller et al. (2009) and Miller and Safford (2012) disproportionately excluded fires in the earlier years of the time series, relative to the standard national fire severity data set (www.mtbs.gov) used in other fire severity trend studies, resulting in an additional bias which created, once again, the inaccurate appearance of relatively less high-severity fire in the earlier years, and relatively more in more recent years.
Resilience requires reestablishing the ecological disturbances that forests and wildlife evolved with. For example, wildlife evolved with fire, not mechanical treatments, and therefore resilience is achieved through management that seeks to put fire back on the landscape such as via prescribed fire and managed wildland fire. Mechanical thinning, on the other hand, does not mimic natural wildlfire and can eliminate or reduce the value of mature forest habitat by eliminating or reducing structural complexity (which many rare wildlife species preferentially selects for). Structural complexity is key for species like the California spotted owl, Pacific fisher, and black-backed woodpecker, and therefore, mechanical thinning, when used in dense mature forest habitat, can eliminate or reduce the value of that habitat for these species, and reduce ecological resilience (see, e.g., Zielinski et al. 2006, Purcell et al. 2009, Bond et al. 2009, Hanson 2013).
The following citations from our previous comments are examples of science that was presented but has not been incorporated: Bekker, M. F. and Taylor, A. H. 2010. Fire disturbance, forest structure, and stand dynamics in
montane forest of the southern Cascades, Thousand Lakes Wilderness, California, USA. Ecoscience 17: 59-72. (In mixed-conifer forests of the southern Cascades in the Sierra
Case 1:15-cv-01329-WBS-EPG Document 34-4 Filed 10/30/15 Page 68 of 147

17
Nevada management region, reconstructed fire severity within the study area was dominated by high-severity fire effects, including high-severity fire patches over 2,000 acres in size [Tables I and II]).
Beaty, R.M., and A.H. Taylor. 2001. Spatial and temporal variation of fire regimes in a mixed
conifer forest landscape, Southern Cascades, USA. Journal of Biogeography 28: 955–966. (On the western slope of the southern Cascades in California, historic fire severity in mixed-conifer forests was predominantly moderate- and high-severity, except in mesic canyon bottoms, where moderate- and high-severity fire comprised 40.4% of fire effects [Table 7].)
Buchalski, M.R., J.B. Fontaine, P.A. Heady III, J.P. Hayes, and W.F. Frick. 2013. Bat response
to differing fire severity in mixed-conifer forest, California, USA. PLOS ONE 8: e57884. (In mixed-conifer forests of the southern Sierra Nevada, rare myotis bats were found at greater levels in unmanaged high-severity fire areas of the McNally fire than in lower fire severity areas or unburned forest.)
Burnett, R.D., P. Taillie, and N. Seavy. 2010. Plumas Lassen Study 2009 Annual Report. U.S.
Forest Service, Pacific Southwest Region, Vallejo, CA. (Bird species richness was approximately the same between high-severity fire areas and unburned mature/old forest at 8 years post-fire in the Storrie fire, and total bird abundance was greatest in the high-severity fire areas of the Storrie fire [Figure 4]. Nest density of cavity-nesting species increased with higher proportions of high-severity fire, and was highest at 100% [Figure
8]. The authors noted that “[o]nce the amount of the plot that was high severity was over 60% the density of cavity nests increased substantially”, and concluded that “more total species were detected in the Moonlight fire which covers a much smaller geographic area and had far fewer sampling locations than the [unburned] green forest.”) Burnett, R.D., P. Taillie, and N. Seavy. 2011. Plumas Lassen Study 2010 Annual Report. U.S. Forest Service, Pacific Southwest Region, Vallejo, CA. (Black-backed Woodpecker nesting
was eliminated by post-fire salvage. See Figure 11 [showing nest density on national forest lands not yet subjected to salvage logging versus private lands that had been salvage logged.)
Burnett, R.D., M. Preston, and N. Seavy. 2012. Plumas Lassen Study 2011 Annual Report. U.S. Forest Service, Pacific Southwest Region, Vallejo, CA. (Black-backed Woodpecker potential occupancy rapidly approaches zero when less than 40-80 snags per acre occur, or are retained (Burnett et al. 2012, Fig. 8 [occupancy dropping towards zero when there are fewer than 4-8 snags per 11.3-meter radius plot—i.e., less than 4-8 snags per 1/10th-acre, or less than 40-80 snags per acre.) Hanson, C. T. and M. P. North. 2008. Postfire woodpecker foraging in salvage-logged and
unlogged forests of the Sierra Nevada. Condor 110: 777–782. (Black-backed woodpeckers depend upon dense, mature/old forest that has recently experienced higher-severity fire, and has not been salvage logged; Black-backed Woodpeckers selected dense, old forests that experienced high-severity fire, and avoided salvage logged areas [see Tables 1 and 2].)
Case 1:15-cv-01329-WBS-EPG Document 34-4 Filed 10/30/15 Page 69 of 147

18
Hanson, C.T., and D.C. Odion. 2013. Is fire severity increasing in the Sierra Nevada mountains,
California, USA? International Journal of Wildland Fire: dx.doi.org/10.1071/WF13016 (published online September 10, 2013). (Hanson and Odion (2013) conducted the first comprehensive assessment of fire intensity since 1984 in the Sierra Nevada using 100% of available fire intensity data, and, using Mann-Kendall trend tests (a common approach for environmental time series data—one which has similar or greater statistical power than parametric analyses when using non-parametric data sets, such as fire data), found no increasing trend in terms of high-intensity fire proportion, area, mean patch size, or maximum patch size. Hanson and Odion (2013) checked for serial autocorrelation in the data, and found none, and used pre-1984 vegetation data (1977 Cal-Veg) in order to completely include any conifer forest experiencing high-intensity fire in all time periods since 1984 (the accuracy of this data at the forest strata scale used in the analysis was 85-88%). Hanson and Odion (2013) also checked the results of Miller et al. (2009) and Miller and Safford (2012) for bias, due to the use of vegetation layers that post-date the fires being analyzed in those studies. Hanson and Odion (2013) found that there is a statistically significant bias in both studies (p = 0.025 and p = 0.021, respectively), the effect of which is to exclude relatively more conifer forest experiencing high-intensity fire in the earlier years of the time series, thus creating the false appearance of an increasing trend in fire severity. Interestingly, Miller et al. (2012a), acknowledged the potential bias that can result from using a vegetation classification data set that post-dates the time series. In that study, conducted in the Klamath region of California, Miller et al. used a vegetation layer that preceded the time series, and found no trend of increasing fire severity. Miller et al. (2009) and Miller and Safford (2012) did not, however, follow this same approach. Hanson and Odion (2013) also found that the regional fire severity data set used by Miller et al. (2009) and Miller and Safford (2012) disproportionately excluded fires in the earlier years of the time series, relative to the standard national fire severity data set (www.mtbs.gov) used in other fire severity trend studies, resulting in an additional bias which created, once again, the inaccurate appearance of relatively less high-severity fire in the earlier years, and relatively more in more recent years. The results of Hanson and Odion (2013) are consistent with all other recent studies of fire intensity trends in California’s forests that have used all available fire intensity data, including Collins et al. (2009) in a portion of Yosemite National Park, Schwind (2008) regarding all vegetation in California, Hanson et al. (2009) and Miller et al. (2012a) regarding conifer forests in the Klamath and southern Cascades regions of California, and Dillon et al. (2011) regarding forests of the Pacific (south to the northernmost portion of California) and Northwest.)
Hodge, W.C. 1906. Forest conditions in the Sierras, 1906. U.S. Forest Service. Eldorado
National Forest, Supervisor’s Office, Placerville, CA. (Historically in mixed-conifer and ponderosa pine forests of the western Sierra Nevada, density ranged generally from about 100 to 1000 trees per acre, and stands were often comprised mostly of white fir and incense-cedar, and were dominated by smaller trees.)
Hutto, R. L. 2008. The ecological importance of severe wildfires: Some like it hot. Ecological Applications 18:1827–1834. (Figure 4a, showing about 50% loss of Black-backed Woodpecker post-fire occupancy due to moderate pre-fire logging [consistent with
Case 1:15-cv-01329-WBS-EPG Document 34-4 Filed 10/30/15 Page 70 of 147

19
mechanical thinning] in areas that later experienced wildland fire.) Lee, D.E., M.L. Bond, and R.B. Siegel. 2012. Dynamics of breeding-season site occupancy of
the California spotted owl in burned forests. The Condor 114: 792-802. (Mixed-severity wildland fire, averaging 32% high-severity fire effects, did not decrease California spotted owl territory occupancy, but post-fire logged sites experienced a loss of occupancy.)
Leiberg, J. B. 1902. Forest conditions in the northern Sierra Nevada, California. USDI
Geological Survey, Professional Paper No. 8. U.S. Government Printing Office, Washington, D.C. (High-severity fire patches over 5,000 acres in size mapped in mixed-conifer forest
that had not been logged previously during the 19th century, prior to fire suppression. In the 19th century, prior to fire suppression, composition of mixed-conifer forests in the central and northern Sierra Nevada was quantified in unlogged areas for several watersheds, and in dozens of specific locations within watersheds. The study reported that, while some of these areas were open and parklike stands dominated by ponderosa pine, Jeffrey pine, and sugar pine, the majority were dominated by white fir, incense-cedar, and Douglas-fir, especially on north-facing slopes and on lower slopes of subwatersheds; such areas were predominantly described as dense, often with “heavy underbrush” from past mixed-severity fire. Natural heterogeneity, resulting from fire, often involved dense stands of old forest adjacent to snag forest patches of standing fire-killed trees and montane chaparral with regenerating young conifers: “All the slopes of Duncan Canyon from its head down show the same marks of fire—dead timber, dense undergrowth, stretches of chaparral, thin lines of trees or small groups rising out of the brush, and heavy blocks of forest surrounded by chaparral.” [p. 171])
Miller, J.D., B.M. Collins, J.A. Lutz, S.L. Stephens, J.W. van Wagtendonk, and D.A. Yasuda.
2012b. Differences in wildfires among ecoregions and land management agencies in the Sierra Nevada region, California, USA. Ecosphere 3: Article 80. (Current high-severity fire rotation interval in the Sierra Nevada management region overall is over 800 years. The authors recommended increasing high-severity fire amounts [i.e., decreasing rotation intervals] in the Cascades-Modoc region and on the western slope of the Sierra Nevada (which together comprise most of the forest in the Sierra Nevada management region), where the current high-severity fire rotation is 859 to 4650 years [Table 3]. The authors noted that “high-severity rotations may be too long in most Cascade-Modoc and westside NF locations, especially in comparison to Yosemite…” These areas, in which the authors concluded that there is far too little high-severity fire, comprise 75% of the forests in the Sierra Nevada management region [Table 3].)
Nagel, T.A. and Taylor, A.H. 2005. Fire and persistence of montane chaparral in mixed conifer forest landscapes in the northern Sierra Nevada, Lake Tahoe Basin, California, USA. J. Torrey Bot. Soc.132: 442-457. (The authors found that large high-severity fire patches were a natural part of 19th century fire regimes in mixed-conifer and eastside pine forests of the Lake Tahoe Basin, and montane chaparral created by high-severity fire has declined by 62% since the 19th century due to reduced high-severity fire occurrence. The authors expressed concern about harm to biodiversity due to loss of ecologically rich montane chaparral.)
Case 1:15-cv-01329-WBS-EPG Document 34-4 Filed 10/30/15 Page 71 of 147

20
Powers, E.M., J.D. Marshall, J. Zhang, and L. Wei. 2013. Post-fire management regimes affect carbon sequestration and storage in a Sierra Nevada mixed conifer forest. Forest Ecology and Management 291: 268-277. (In Sierra Nevada mixed conifer forests, the highest total aboveground carbon storage was found to occur in mature/old forest that experienced 100% tree mortality in wildland fire, and was not salvage logged or artificially replanted, relative to lightly burned old forest and salvage logged areas [Fig. 1b]). Saab, V.A., R.E. Russell, and J.G. Dudley. 2009. Nest-site selection by cavity-nesting birds in relation to postfire salvage logging. Forest Ecology and Management 257:151–159. (Black- backed Woodpeckers select areas with about 325 medium and large snags per hectare [about 132 per acre], and nest-site occupancy potential dropped to near zero when snag density was below about 270 per hectare, or about 109 per acre [see Fig. 2A, showing 270 snags per hectare as the lower boundary of the 95% confidence interval].) Seavy, N.E., R.D. Burnett, and P.J. Taille. 2012. Black-backed woodpecker nest-tree preference in burned forests of the Sierra Nevada, California. Wildlife Society Bulletin 36: 722-728. (Black-backed Woodpeckers selected sites with an average of 13.3 snags per 11.3-meter radius plot [i.e., 0.1-acre plot], or about 133 snags per acre.) Show, S.B. and Kotok, E.I. 1924. The role of fire in California pine forests. United States
Department of Agriculture Bulletin 1294, Washington, D.C. (Historically, within ponderosa pine and mixed-conifer/pine forests of the Sierra Nevada, high-severity crown fires, though infrequent on any particular area, “may extend over a few hundred acres” in patches [p. 31; see also Plate V, Fig. 2, Plate VII, Fig. 2, Plate VIII, Plate IX, Figs. 1 and 2, and Plate X, Fig. 1], with some early-successional areas, resulting from high-severity fire patches, covering 5,000 acres in size or more [pp. 42-43]. The authors distinguished high-severity fire patches of this size from more “extensive” patches occurring in the northern Rocky Mountains [p. 31], where high-severity fire patches occasionally reach tens of thousands, or hundreds of thousands, of acres in size, and noted that patches of such enormous size were “almost” unknown in Sierra Nevada ponderosa pine and mixed-conifer forests. Within unlogged areas, the authors noted many large early-successional habitat patches, dominated by montane chaparral and young, regenerating conifer forest, and explained that such areas were the result of past severe fire because: a) patches of mature/old forest and individual surviving trees were found interspersed within these areas, and were found adjacent to these areas, indicating past forest; b) snags and stumps of fallen snags, as well as downed logs from fallen snags, were abundant in these areas; c) the species of chaparral found growing in these areas are known to sprout abundantly following severe fire; and d) natural conifer regeneration was found on most of the area [p. 42], often growing through complete chaparral cover [p. 43].)
Show, S.B. and Kotok, E.I. 1925. Fire and the forest (California pine region). United States
Department of Agriculture Department Circular 358, Washington, D.C. (Historically, within the ponderosa pine and mixed-conifer/pine belt of the Sierra Nevada, 1 acre out of every 7 on average was dominated by montane chaparral and young regenerating conifer forest
Case 1:15-cv-01329-WBS-EPG Document 34-4 Filed 10/30/15 Page 72 of 147

21
following high-severity fire [Footnote 2, and Figs. 4 and 5]; on one national forest 215,000 acres out of 660,000 was early-successional habitat from severe fire [p. 17].)
Siegel, R.B., M.W. Tingley, R.L. Wilkerson, M.L. Bond, and C.A. Howell. 2013. Assessing
home range size and habitat needs of Black-backed Woodpeckers in California: Report for the 2011 and 2012 field seasons. Institute for Bird Populations. (Black-backed woodpeckers strongly select large patches of higher-severity fire with high densities of medium and large snags, generally at least 100 to 200 hectares (roughly 250 to 500 acres) per pair, and post-fire salvage logging eliminates Black-backed woodpecker foraging habitat [see Fig. 13, showing almost complete avoidance of salvage logged areas]. Suitable foraging habitat was found to have more than 17-20 square meters per hectare of recent snag basal area [pp. 45, 68-70], and suitable nesting habitat was found to average 43 square meters per hectare of recent snag basal area and range from 18 to 85 square meters to hectare [p. 59, Table 13].)
Stephens, S.L., R.E. Martin, and N.E. Clinton. 2007. Prehistoric fire area and emissions from
California’s forests, woodlands, shrublands, and grasslands. Forest Ecology and Management 251:205–216. (Estimated high-severity fire proportion and frequency indicate historic high-severity fire rotation intervals of approximately 250 to 400 years in historic ponderosa pine and mixed-conifer forests in California.)
Swanson, M.E., J.F. Franklin, R.L. Beschta, C.M. Crisafulli, D.A. DellaSala, R.L. Hutto, D.
Lindenmayer, and F.J. Swanson. 2010. The forgotten stage of forest succession: early- successional ecosystems on forest sites. Frontiers Ecology & Environment 9: 117-125. (A literature review concluding that some of the highest levels of native biodiversity found in temperate conifer forest types occur in complex early successional habitat created by stand-initiating [high-severity] fire.)
USFS (United States Forest Service). 1910-1912. Timber Survey Field Notes, 1910-1912, U.S. Forest Service, Stanislaus National Forest. Record Number 095-93-045, National Archives and Records Administration—Pacific Region, San Bruno, California, USA. (Surveys were conducted within unlogged forest to evaluate timber production potential in 16.2-ha (40- acre) plots within each 259.1-ha (640-acre) section in ponderosa pine and mixed-conifer forest on the westside of the Stanislaus National Forest, using one or more 1.62-ha transect per plot. Surveyors noted that surveys for individual tree size, density and species were not conducted in areas that had experienced high-severity fire sufficiently recently such that the regenerating areas did not yet contain significant merchantable sawtimber. Surveyors noted that the dominant vegetation cover across the majority of many 259.1-ha sections was montane chaparral and young conifer regeneration following high-severity fire. For example (from a typical township in the data set): a) T1S, R18E, Section 9 (“Severe fire went through [this section] years ago and killed most of the trees and land was reverted to brush”, noting “several large dense sapling stands” and noting that merchantable timber existed on only four of sixteen 16.2-ha plots in the section); b) T1S, R18E, Section 14 (“Fires have killed most of timber and most of section has reverted to brush”); c) T1S, R18E, Section 15 (same); d) T1S, R18E, Section 23 (“Most of timber on section has been killed by fires which occurred many years ago”); T1S, R18E, Section 21 (“Old fires killed most of timber on this section and most of area is now brushland”.
Case 1:15-cv-01329-WBS-EPG Document 34-4 Filed 10/30/15 Page 73 of 147

22
Moreover, with regard to understory density, the USFS 1911 Stanislaus data set (USFS 1910-1912) recorded average sapling density on 72 ponderosa pine forest sections (and some mixedconifer) (each section one square mile in size), with an average density of 102 saplings per acre (252 per hectare) in sections noted as having no previous logging. This is not consistent with the assumption of very low densities of saplings historically. In addition, the 1911 Stanislaus data set also recorded percent shrub cover on 57 sections (each one square mile) in ponderosa pine forests (and some mixed-conifer), with an average of 28% shrub cover in unlogged sections within forested areas with merchantable timber. In a total of 35 sections, surveyors recorded the proportion of the one-square-mile section comprised by montane chaparral areas (which often included natural conifer regeneration in the seedling, sapling, and/or pole-sized successional stage) with no merchantable timber. These montane chaparral areas represented 12,200 acres out of a total of 22,400 acres, or about 54%. As discussed above, in many of these montane chaparral areas, the visible signs of past high-severity fire were still evident, and surveyors specifically recorded large high- severity fire patches. The total area covered by the surveys was vastly larger than the small subset analyzed in Scholl and Taylor 2010 and Collins et al. 2011.) (This report constitutes new information under NEPA because it was not discovered/revealed until recently). As to the WUI, we have pointed out that it is most efficient and productive to focus on a small defense zone. For example,
Cohen, J.D., and R.D. Stratton. 2008. Home destruction examination: Grass Valley Fire. U.S. Forest Service Technical Paper R5-TP-026b. U.S. Forest Service, Region 5, Vallejo, CA. (The vast majority of homes burned in wildland fires are burned by slow-moving, low-severity fire, and defensible space within 100-200 feet of individual homes [reducing brush and small trees, and limbing up larger trees, while also reducing the combustibility of the home itself] effectively protects homes from fires, even when they are more intense)
Gibbons, P. et al. 2012. Land management practices associated with house loss in
wildfires. PLoS ONE 7: e29212. (Defensible space work within 40 meters [about 131 feet] of individual homes effectively protects homes from wildland fire. The authors concluded that the current management practice of thinning broad zones in wildland areas hundreds, or thousands, of meters away from homes is ineffective and diverts resources away from actual home protection, which must be focused immediately adjacent to individual structures in order to protect them.)
Moreover, not only has the size of the WUI never been justified, the need for change document does not provide information to support it as an emphasis area. Even more problematic is the need for change document’s claim that there needs to be an “[i]ncreased pace and scale of restoration of resilience in the surrounding, larger landscape.” This assertion is baseless and no meaningful explanation is provided for it. Rather, the WUI should be drastically reduced in size in order to make effective use of resources and achieve the desired outcome—i.e., protection of humans and human structures.
Case 1:15-cv-01329-WBS-EPG Document 34-4 Filed 10/30/15 Page 74 of 147

23
Thank you for your time, and we look forward to achieving a forest plan revision process that addresses all the necessary issues and incorporates the data and science we have presented. Sincerely, Chad Hanson, Ph.D., Director Justin Augustine, Attorney John Muir Project of Earth Island Institute Center for Biological Diversity P.O. Box 697 351 California St., Suite 600 Cedar Ridge, CA 95924 San Francisco, CA 94104 530-273-9290 415-436-9682, ext. 302 [email protected] [email protected]
Case 1:15-cv-01329-WBS-EPG Document 34-4 Filed 10/30/15 Page 75 of 147

1
July 11, 2014 Mike Dietle Land Management Plan Revision USDA Forest Service Ecosystem Planning Staff 1323 Club Drive Vallejo, CA 94592
Sent to: [email protected]
Re: Comments on Desired Conditions Analysis
Dear Mr. Dietle:
On behalf of the John Muir Project of Earth Island Institute (JMP) and the Center for Biological Diversity (CBD), we submit the following comments on the “Draft Desired Conditions” document recently released by Region 5 of the Forest Service.
Our organizations have been participating in the plan revision process for well over a year now, including the submission of extensive written comments regarding the Science Synthesis, the Bio-regional Assessment, the Natural Range of Variation reports, and the Need for Change document, as well as each Forest-specific Assessment (Inyo, Sequoia, and Sierra National Forests). Our comments were detailed and contained numerous scientific citations that directly pertain to the Sierra Nevada ecosystem, especially as to wildlife conservation and fire. The Final Assessments released by the Forest Service do not reflect the important and highly relevant scientific knowledge we submitted.
We appreciate the opportunity to comment, but as described below, we have significant concerns about both the content and scope of the Draft Desired Conditions (DDC) document, and these issues must be addressed going forward. The citations in the following text can be found in our previous submissions (NRV, Need for Change, Science Synthesis, Bio-regional Assessment, and forest-specific Assessments).
CENTER for BIO LO GIC AL D IVERS ITY
Case 1:15-cv-01329-WBS-EPG Document 34-4 Filed 10/30/15 Page 76 of 147

2
Assertions Regarding “Undesirable Wildfire” and the Failure to Include Complex Early Seral Forest (CESF) and Associated Wildlife
On page 1, with regard to Landscape objective #8, the DDC states the following: “The composition, density, structure, and condition of vegetation help reduce the threat of undesirable
wildfires to local communities, ecosystems, and scenic character.” (emphasis added).
Similarly, on page 1, with regard to Landscape objective #10, the DDC states the following: “The landscape contains a mosaic of vegetation types and structures that provide habitat, movement, and connectivity for a variety of species, including wide-ranging generalists such as bear, mountain lion, and deer; more localized, semi-specialist such as ground-nesting, shrub nesting, cavity nesting birds, and various bats; and specialists such as old forest-associated goshawk, spotted owl, fisher, and marten, or sagebrush-dependent greater sage grouse.”
On page 2, with regard to Landscape objective #16, the DDC states: “Vegetation conditions support the long term sustainability of these benefits to people by reducing the risk of
undesirable fire effects, disease and mortality, which interrupt and eliminate forest benefits.” (emphasis added).
The first and third quoted passages appears to state an objective to further reduce and eliminate complex early seral forest (CESF) created by high-intensity fire, and the second quoted objective does not include CESF created by high-intensity fire and the many plant and animal species primarily associated with this habitat, while explicitly including old forest and species associated with old forest. The 2012 NFMA Planning Rule, at 36 CFR 219.9(a)(2), states that the revised forest plans “must include” provisions to “maintain or restore” the “[k]ey characteristics” associated with terrestrial ecosystem types and “[r]are…terrestrial plant and animal communities”. The current science shows that CESF, created by high-intensity fire, is even rarer than old forest, is comparable in biodiversity and wildlife abundance to unburned old forest, and has grown far more scarce than it was naturally/historically, due to fire suppression and post-fire management (salvage logging, shrub eradication, and artificial plantation establishment) (Burnett et al. 2010, Odion and Hanson 2013, Swanson et al. 2011, DellaSala et al. 2014), and the most comprehensive analysis of current trends indicates that fire intensity is not increasing in the Sierra Nevada (Hanson and Odion 2014).
By stating that high-intensity fire patches that create pockets of high or complete mortality in the forest “interrupt and eliminate forest benefits”, the Forest Service is not incorporating the current state of scientific knowledge on this subject, which shows that these patches create important ecological benefits. That needs to be corrected in order to effectively address ecological integrity.
Wildlife Improperly Excluded from Key Objective
On page 2, regarding Landscape objective #13, the DDC states that products, including wood products, would be removed from the forest in “sustainable” amounts, “without adverse effects on soil and water productivity.” The objective neglects to include native wildlife species— including threatened/endangered species, Sensitive Species, Species of Conservation Concern, and focal species—here. This is a major omission, and these groups of wildlife species must be
Case 1:15-cv-01329-WBS-EPG Document 34-4 Filed 10/30/15 Page 77 of 147

3
included in this objective in order to comply with the 2012 NFMA Planning Rule. 36 CFR 219.11(d)(3) (removal of timber can only occur to the extent that it is consistent with protection of wildlife).
Scientifically Outdated Treatment of High-Severity Fire Areas Over 1,000 Acres
On page 2, with regard to high-severity fires over 1,000 acres, the DDC states the following:
“1. Native vegetation types occur in a mosaic that ensures their long term viability and reduces the potential for vegetation type conversion. Long term seed sources of desired species are present.
2. Vegetation in the landscape is well-adapted to natural disturbance regimes and can respond to changes in climate and fire regimes.
3. Snags, logs, and live trees are distributed throughout large patches (greater than 100 acres) of high severity (greater than 80 percent top kill) in the burned area, consistent with other resource objectives (e.g., strategic fuel treatment locations or wildland urban interface).
4. Surface dead wood (fuel) levels are sufficient to provide for legacy soil microbial populations. Shrub, aspen and oak sprouts are well distributed in areas where they occur.”
However, as discussed above, once again there are no provisions to promote the protection of the unique CESF habitat created by high-intensity fire as part of the desired condition. The first listed provision improperly implies that the montane-chaparral-dominated stage of natural post- fire succession is to be avoided through artificial planting—again failing to recognize the ecological value of this habitat—and also incorrectly implies that natural conifer regeneration does not occur after high-intensity fire when live conifer seed sources are not close by, which is incorrect (animals disperse seeds deep into high-intensity fire patches—seeds are not only carried by wind) (see, e.g., Shatford et al. 2007, Donato et al. 2009, Crotteau et al. 2013). The third listed provision would not protect CESF, and would allow standard post-fire salvage logging, including current regressive post-fire logging practices that inappropriately apply unburned forest snag retention standards (4 large/acre) to CESF, which is a scientifically outdated approach (Hutto 2006).
Scientifically Unsupported Goals Regarding Eastside Jeffrey Pine
On page 4, with regard to eastside Jeffrey pine forests, the DDC improperly states that less than 10% of the forest should have canopy cover over 40%, and the remaining 90% should be “open” forest. The DDC provides no scientific basis for this extremely aggressive goal, and provides no acknowledgement of the severe adverse impacts that this would have to Sensitive Species that depend upon closed-canopy forest conditions, particularly on the eastside, such as the Northern Goshawk, as well as adverse impacts to species like the Black-backed Woodpecker that depend upon high-intensity fire patches occurring in dense, mature/old forest, and are harmed by pre-fire logging that reduces potential post-fire snag density (Hutto 2008).
Also on page 4, with regard to eastside Jeffrey pine forests, the DDC states that eastside forests would have “up to” 2 snags per acre. As we have already pointed out repeatedly (e.g., in our NRV comments on yellow pine and mixed-conifer forests), the scientific data do not support the
Case 1:15-cv-01329-WBS-EPG Document 34-4 Filed 10/30/15 Page 78 of 147

4
assumption that the natural snag density in these forests is only 2 per acre (especially a maximum
of 2/acre). Moreover, the DDC does not acknowledge the enormous adverse impacts that this would have for imperiled species, such as Black-backed Woodpeckers, that depend upon much higher snag densities (Siegel et al. 2013).
On page 4, the DDC seems to suggest that up to 40% of the forest could be devoid of old trees, snags, and downed logs. This, of course, would have enormous adverse impacts to myriad imperiled species. Is this what the Forest Service truly intends to say here?
On page 5, with regard to eastside Jeffrey pine forests, the DDC claims that it is a desired condition for up to 70% of eastside forest area to be comprised of “gaps”—i.e., no trees. This appears to be a prescription for large-scale application of group selection cutting in mature/old eastside pine forests, especially given the repeated statements in the DDC about further suppressing and preventing CESF. The DDC provides no scientific basis for this suggestion.
Scientifically Unsound Proposals for Dry Mixed-Conifer Forest
On pages 6 and 13, regarding dry mixed-conifer, the DDC claims that over 70% of these forests should have low canopy cover (under 40%), providing no scientific basis for this proposal, and failing to divulge the huge adverse impacts that this would have for imperiled species, like the California spotted owl and Pacific fisher, that depend upon dense, closed forests for nesting/roosting and denning/resting, respectively. Moreover, this proposal ignores the most comprehensive analysis of historical forest conditions, which found that this forest type was dominated historically by stands of medium to high density (Baker 2014, in press). Moreover, this provision misrepresents the concept of ecological resilience, confusing it with resistance. Resilience, ecologically, does not refer to stasis, or maintaining structural conditions that suppress natural disturbance and prevent significant change in forest structure. Rather, ecological resilience is all about dynamic natural processes, including high-intensity fire, and the maintenance of the natural successional stages associated with those processes, in order to maintain the full suite of native biodiversity (Thompson et al. 2009) (The same problem applies to the use of “resilience” on pages 8, 11, 14, and 16-17 regarding other forest types).
On pages 6 and 15, the DDC accepts dense forest as a desired condition in spotted owl, goshawk, and fisher nest/den sites, but fails to recognize that these species cannot maintain viable populations with only their nest/den sites (e.g., Verner et al. 1992), and fails to recognize that they are also associated with a mix of dense forest and CESF in their home ranges (Bond et al. 2009, Bond et al. 2013, Hanson 2013). The DDC provides no scientific basis for the apparent assumption that nest/den cores are sufficient in and of themselves to maintain viable populations.
Also on pages 13 and 15, the DDC states that these forests would have “up to” 2 snags per acre. As we have already pointed out repeatedly (e.g., in our NRV comments on yellow pine and mixed-conifer forests), the scientific data do not support the assumption that the natural snag density in these forests is only 2 per acre (or, especially, a maximum of 2/acre). Moreover, the DDC does not acknowledge the enormous adverse impacts that this would have for imperiled species, such as Pacific fishers, Spotted owls, and Black-backed Woodpeckers, that depend upon much higher snag densities (Verner et al. 1992, Zielinski et al. 2006, Purcell et al. 2009, Siegel et al. 2013).
Case 1:15-cv-01329-WBS-EPG Document 34-4 Filed 10/30/15 Page 79 of 147
5
On page 13, the DDC claims that “openings” should comprise up to 50% of any 100-acre area, but fails to provide scientific support for this, and fails to explain whether this envisions CESF, or patch-cut logging. This suggestion appears, again, geared toward large-scale application of group selection cutting in mature/old dry mixed-conifer.
On page 13, the DDC states that “fuel loads” cannot exceed 10 tons/acre in this forest type, which would completely preclude maintenance of CESF on the landscape, and effectively promotes intensive post-fire logging and clearcutting.
Montane Forests
On page 9, the DDC seems to suggest that up to 60% of the forest could be devoid of large trees, snags, and downed logs. This, of course, would have enormous adverse impacts to myriad imperiled species. Is this what the Forest Service truly intends to say here?
Ponderosa Pine
On page 11, the DDC improperly states that as much as 90% should be “open” forest with low canopy cover. In the next paragraph, the DDC states that closed-canopy forest can be reduced to as little as 5% of the forest. The DDC provides no scientific basis for this extremely aggressive approach, and provides no acknowledgement of the severe adverse impacts that this would have to Sensitive Species that depend upon closed-canopy forest conditions, particularly on the eastside, such as the Northern Goshawk, as well as adverse impacts to species like the Black- backed Woodpecker that depend upon high-intensity fire patches occurring in dense, mature/old forest, and are harmed by pre-fire logging that reduces potential post-fire snag density (Hutto 2008). Moreover, this proposal ignores the most comprehensive analysis of historical forest conditions, which found that this forest type was dominated historically by stands of medium to high density (Baker 2014, in press).
Also on page 4, with regard to eastside Jeffrey pine forests, the DDC states that eastside forests would have “up to” 2 snags per acre. As we have already pointed out repeatedly (e.g., in our NRV comments on yellow pine and mixed-conifer forests), the scientific data do not support the assumption that the natural snag density in these forests is only 2 per acre (or, especially, a maximum of 2/acre). Moreover, the DDC does not acknowledge the enormous adverse impacts that this would have for imperiled species, such as Pacific fishers, Spotted owls, and Black- backed Woodpeckers, that depend upon much higher snag densities (Verner et al. 1992, Zielinski et al. 2006, Purcell et al. 2009, Siegel et al. 2013).
On page 4, the DDC seems to suggest that up to 40% of the forest could be devoid of old trees, snags, and downed logs. This, of course, would have enormous adverse impacts to myriad imperiled species. Is this what the Forest Service truly intends to say here?
On page 5, the DDC claims that it is a desired condition for up to 70% of forest area to be comprised of “gaps”—i.e., no trees. This appears to be a prescription for large-scale application of group selection cutting in mature/old forests. The DDC provides no scientific basis for this suggestion.
Case 1:15-cv-01329-WBS-EPG Document 34-4 Filed 10/30/15 Page 80 of 147

6
Moist Mixed-Conifer
The language regarding high-severity fire at the top of page 16 is an improvement that we appreciate, but it is severely undermined by other language in the document, as described above and below. Moreover, this same language should be included for dry mixed-conifer, and the upper bound of high-severity fire patch sizes and proportions should be increased (Baker 2014).
On page 16, the DDC improperly states that as much as 80% should be open forest with canopy cover under 50%. The DDC provides no scientific basis for this extremely aggressive goal, and provides no acknowledgement of the severe adverse impacts that this would have to Sensitive Species that depend upon closed-canopy forest conditions, particularly on the eastside, such as the Northern Goshawk, as well as adverse impacts to species like the Black-backed Woodpecker that depend upon high-intensity fire patches occurring in dense, mature/old forest, and are harmed by pre-fire logging that reduces potential post-fire snag density (Hutto 2008). Moreover, this proposal ignores the most comprehensive analysis of historical forest conditions, which found that this forest type was dominated historically by stands of medium to high density (Baker 2014, in press).
On page 16, the DDC accepts dense forest as a desired condition in spotted owl, goshawk, and fisher nest/den sites, but fails to recognize that these species cannot maintain viable populations with only their nest/den sites (e.g., Verner et al. 1992), and fails to recognize that they are also associated with a mix of dense forest and CESF in their home ranges (Bond et al. 2009, Bond et al. 2013, Hanson 2013). The DDC provides no scientific basis for the apparent assumption that nest/den cores are sufficient in and of themselves to maintain viable populations.
On page 16, the DDC states that eastside forests would have “up to” 4 snags per acre. As we have already pointed out repeatedly (e.g., in our NRV comments on yellow pine and mixed- conifer forests), the scientific data do not support the assumption that the natural snag density in these forests is only 4 per acre (or, especially, a maximum of 4/acre). Moreover, the DDC does not acknowledge the enormous adverse impacts that this would have for imperiled species, such as Pacific fishers, Spotted owls, and Black-backed Woodpeckers, that depend upon much higher snag densities (Verner et al. 1992, Zielinski et al. 2006, Purcell et al. 2009, Siegel et al. 2013).
On page 16, the DDC states that “fuel loads” cannot exceed 10 tons/acre in this forest type, which would completely preclude maintenance of CESF on the landscape, and effectively promotes intensive post-fire logging and clearcutting.
No definition of “moist” mixed-conifer is provided.
Upper Montane Forests
On page 17, the DDC suggests that forest cover could be eliminated on over 50% of the landscape, and indicates that as little as 20% of the forest would be closed-canopy. The DDC provides no scientific basis for this.
On page 19, the DDC states that, for red fir, there would be a maximum of four large snags per acre, and a maximum of 5 tons per acre of downed logs, and for Jeffrey pine, there would be a maximum of 2 snags/acre—none of which is supported by any scientific citations. Moreover, the DDC does not acknowledge the enormous adverse impacts that this would have for imperiled
Case 1:15-cv-01329-WBS-EPG Document 34-4 Filed 10/30/15 Page 81 of 147

7
species, such as Pacific fishers, Spotted owls, and Black-backed Woodpeckers, that depend upon much higher snag densities (Verner et al. 1992, Zielinski et al. 2006, Purcell et al. 2009, Siegel et al. 2013).
On page 21, the DDC seems to suggest that up to 70% of the lodgepole pine forest could be devoid of old trees, snags, and downed logs. This, of course, would have enormous adverse impacts to myriad imperiled species. Is this what the Forest Service truly intends to say here?
On page 21, the DDC claims that it is a desired condition for up to 70% of any given 10-acre area to be comprised of “gaps”—i.e., no trees. This appears to be a prescription for large-scale application of group selection cutting. The DDC provides no scientific basis for this suggestion.
Wildland Fire Management
With regard to the top of page 23 of the DDC, we thank you for supporting mixed-intensity wildland fire, and for allowing wildland fire use (letting wildland fires burn, rather than always suppressing them).
Home Protection
On page 23, the DDC states that it is a desired condition for “wildland landscapes” to be in a condition that would only allow lower-intensity fire behavior, ostensibly to protect homes. This is inconsistent with current science, which shows that it is the zone within generally a couple of hundred feet (or less) from individual structures that is effective and relevant with regard to home protection (Gibbons et al. 2012)—home protection is not a “wildland” fuel/fire management issue, and treating it as such will not only lead to unnecessary degradation of forests, but will also put homes at greater risk by diverting scarce resources away from true home protection and toward misguided logging projects in the wildlands.
Wilderness
On page 30, the DDC mentions a desire to “enhance[]” designated wilderness areas. What does this mean?
Overall, while we appreciate the improvements we described above, there is still a serious and critical disconnect between the desired conditions and wildlife viability, whether that be wildlife that relies on dense mature forest or wildlife that relies on CESF. The DDC’s emphasis on maintaining predominantly open forest and very low snags is not compatible with maintaining viable populations of the many imperiled species that call the southern Sierras home, and the DCs must therefore be greatly changed to ensure wildlife conservation.
Thank you for your time, and we look forward to achieving a forest plan revision process that addresses all the necessary issues and incorporates the data and science we have presented.
Sincerely,
Chad Hanson, Ph.D., Director Justin Augustine, Attorney
Case 1:15-cv-01329-WBS-EPG Document 34-4 Filed 10/30/15 Page 82 of 147

8
John Muir Project of Earth Island Institute Center for Biological Diversity P.O. Box 697 351 California St., Suite 600 Cedar Ridge, CA 95924 San Francisco, CA 94104 530-273-9290 415-436-9682, ext. 302 [email protected] [email protected]
Case 1:15-cv-01329-WBS-EPG Document 34-4 Filed 10/30/15 Page 83 of 147

1
September 29, 2014
Maria Ulloa Forest Plan Revision 1839 So. Newcomb Street Porterville, CA 93257 Mike Dietle Land Management Plan Revision USDA Forest Service Ecosystem Planning Staff 1323 Club Drive Vallejo, CA 94592 Sent to: [email protected]
Re: Forest Plan Revision Literature Cited re Wildlife Diversity and Conservation Baker, W.L. 2014. Historical forest structure and fire in Sierran mixed-conifer forests
reconstructed from General Land Office survey data. Ecosphere 5: Article 79 Beaty, R.M., and A.H. Taylor. 2001. Spatial and temporal variation of fire regimes in a mixed
conifer forest landscape, Southern Cascades, USA. Journal of Biogeography 28: 955–966. Bekker, M. F. and Taylor, A. H. 2001. Gradient analysis of fire regimes in montane forests of the
southern Cascade Range, Thousand Lakes Wilderness, California, USA. Plant Ecology 155: 15-28.
Bekker, M. F. and Taylor, A. H. 2010. Fire disturbance, forest structure, and stand dynamics in
montane forest of the southern Cascades, Thousand Lakes Wilderness, California, USA. Ecoscience 17: 59-72.
Beschta, R.L., J.J. Rhodes, J.B. Kauffman, R.E., Gresswell, G.W. Minshall, J.R. Karr, D.A.
Perry, E.R. Hauer and C.A. Frissell. 2004. Postfire management on forested public lands of the western United States. Conservation Biology 18:957-967.
CENTER for B IOLOGICAL DIVERSITY
Case 1:15-cv-01329-WBS-EPG Document 34-4 Filed 10/30/15 Page 84 of 147

2
Bias, MA, and RJ Gutiérrez. 1992. Habitat associations of California spotted owls in the central Sierra Nevada. Journal of Wildlife Management 56:584-595.
Blakesley , JA, BR Noon, and DR Anderson. 2005. Site occupancy, apparent survival, and
reproduction of California spotted owls in relation to forest stand characteristics. Journal of Wildlife Management 69:1554-1564.
Bond, ML, ME Seamans, and RJ Gutiérrez. 2004. Modeling nesting habitat selection of
California spotted owls (Strix occidentalis occidentalis) in the Central Sierra Nevada using standard forest inventory metrics. Forest Science 50:773-780.
Bond, ML, RJ Gutiérrez, AB Franklin, WS LaHaye, CA May, and ME Seamans. 2002. Short-
term effects of wildfires on spotted owl survival, site fidelity, mate fidelity, and reproductive success. Wildlife Society Bulletin 30:1022-1028.
Bond, ML, DE Lee, RB Siegel, and MW Tingley. 2013. Diet and home-range size of California
spotted owls in a burned forest. Western Birds 44:114-126. Bond, M. L., D. E. Lee, R. B. Siegel, & J. P. Ward, Jr. 2009. Habitat use and selection by California Spotted Owls in a postfire landscape. Journal of Wildlife Management 73: 1116- 1124 Bond, M. L., R. B. Siegel, and D. L. Craig, editors. 2012. A Conservation Strategy for the Black-
backed Woodpecker (Picoides arcticus) in California. Version 1.0. The Institute for Bird Populations and California Partners in Flight. Point Reyes Station, California.
Bond ML, DE Lee, and RB Siegel. 2010. Winter movements by California spotted owls in a
burned landscape. Western Birds 41:174-180. Buchalski, M.R., J.B. Fontaine, P.A. Heady III, J.P. Hayes, and W.F. Frick. 2013. Bat response
to differing fire severity in mixed-conifer forest, California, USA. PLOS ONE 8: e57884. Burnett, R.D., P. Taillie, and N. Seavy. 2010. Plumas Lassen Study 2009 Annual Report. U.S.
Forest Service, Pacific Southwest Region, Vallejo, CA. Burnett, R.D., P. Taillie, and N. Seavy. 2011. Plumas Lassen Study 2010 Annual Report. U.S. Forest Service, Pacific Southwest Region, Vallejo, CA. Burnett, R.D., M. Preston, and N. Seavy. 2012. Plumas Lassen Study 2011 Annual Report. U.S. Forest Service, Pacific Southwest Region, Vallejo, CA. Call, DR, RJ Gutiérrez, and J. Verner. 1992. Foraging habitat and home-range characteristics of
California spotted owls in the Sierra Nevada. The Condor 94:880-888.
Case 1:15-cv-01329-WBS-EPG Document 34-4 Filed 10/30/15 Page 85 of 147

3
Clark, DA, RG Anthony, and LS Andrews. 2013. Relationship between wildfire, salvage logging, and occupancy of nesting territories by northern spotted owls. Journal of Wildlife Management 77:672-688.
Cocking MI, Varner JM, Knapp EE. 2014. Long-term effects of fire severity on oak-conifer
dynamics in the southern Cascades. Ecological Applications 24: 94-107. Cohen, J.D. 2000. Preventing disaster: home ignitability in the Wildland-Urban Interface. Journal of Forestry 98: 15-21. Cohen, J.D., and R.D. Stratton. 2008. Home destruction examination: Grass Valley Fire. U.S.
Forest Service Technical Paper R5-TP-026b. U.S. Forest Service, Region 5, Vallejo, CA. Conner MM, JJ Keane, CV Gallagher, G Jehle, TE Munton, PA Shaklee, RA Gerrard. 2013.
Realized population change for long-term monitoring: California spotted owls case study. Journal of Wildlife Management.
Crotteau, J.S., J.M. Varner III, and M.W. Ritchie. 2013. Post-fire regeneration across a fire
severity gradient in the southern Cascades. Forest Ecology and Management 287: 103-112. DellaSala, D.A., M.L. Bond, C.T. Hanson, R.L. Hutto, and D.C. Odion. 2014. Complex early
seral forests of the Sierra Nevada: what are they and how can they be managed for ecological integrity? Natural Areas Journal 34: 310-324.
Donato, D.C., Fontaine, J.B., Campbell, J. L., Robinson, W.D., Kauffman, J.B., and Law, B.E.,
2006. Post-wildfire logging hinders regeneration and increases fire risk. Science, 311: 352 Donato, D.C., J.B. Fontaine, W.D. Robinson, J.B. Kauffman, and B.E. Law. 2009. Vegetation
response to a short interval between high-severity wildfires in a mixed-evergreen forest. Journal of Ecology 97: 142-154.
Donato, D.C., J. L. Campbell, and J. F. Franklin. 2012. Multiple successional pathways and
precocity in forest development: can some forests be born complex? Journal of Vegetation Science 23: 576–584.
Donato, D.C., Fontaine, J. B., Kauffman, J.B., Robinson, W.D., and Law, B.E., 2013. Fuel mass
and forest structure following stand-replacement fire and post-fire logging in a mixed-evergreen forest. Internat. J. Wildland Fire. 22: 652-666 http://dx.doi.org/10.1071/WF12109
Garner, J.D. (2013). Selection of disturbed habitat by fishers (Martes pennanti) in the Sierra National Forest. Master’s Thesis, Humboldt State University. Gibbons, P. et al. 2012. Land
management practices associated with house loss in wildfires. PLoS ONE 7: e29212. Hanson, C.T. 2014. Conservation concerns for Sierra Nevada birds associated with high-
severity fire. Western Birds (in press).
Case 1:15-cv-01329-WBS-EPG Document 34-4 Filed 10/30/15 Page 86 of 147

4
Hanson, C.T. 2013. Pacific fisher habitat use of a heterogeneous post-fire and unburned landscape in the southern Sierra Nevada, California, USA. The Open Forest Science Journal 6: 24-30. Hanson, C. T. and M. P. North. 2008. Postfire woodpecker foraging in salvage-logged and
unlogged forests of the Sierra Nevada. Condor 110: 777–782. Hanson, C.T., D.C. Odion, D.A. DellaSala, and W.L. Baker. 2010. More-comprehensive
recovery actions for Northern Spotted Owls in dry forests: Reply to Spies et al. Conservation Biology 24:334–337.
Hanson, C.T., and D.C. Odion. 2014. Is fire severity increasing in the Sierra Nevada, California,
USA? International Journal of Wildland Fire 23: 1–8 Hodge, W.C. 1906. Forest conditions in the Sierras, 1906. U.S. Forest Service report, Eldorado
National Forest, Supervisor's Office, Placerville, CA. Hutto, R. L. 1995. Composition of bird communities following stand-replacement fires in
Northern Rocky Mountain (U.S.A.) conifer forests. Conservation Biology 9: 1041–1058. Hutto, R. L. 2006. Toward meaningful snag-management guidelines for postfire salvage logging
in North American conifer forests. Conservation Biology 20: 984–993. Hutto, R. L. 2008. The ecological importance of severe wildfires: Some like it hot. Ecological
Applications 18:1827–1834. Karr, J. R., J. J. Rhodes, G. W. Minshall, F. R. Hauer, R. L. Beschta, C. A. Frissell, and D. A.
Perry. 2004. The effects of postfire salvage logging on aquatic ecosystems in the American West. BioScience 54:1029-1033.
Kotliar, N.B., S.J. Hejl, R.L. Hutto, V.A. Saab, C.P. Melcher, and M.E. McFadzen. 2002.
Effects of fire and post-fire salvage logging on avian communities in conifer-dominated forests of the western United States. Studies in Avian Biology 25: 49-64.
Lee, D.E., M.L. Bond, and R.B. Siegel. 2012. Dynamics of breeding-season site occupancy of
the California spotted owl in burned forests. The Condor 114: 792-802. Leiberg, J. B. 1902. Forest conditions in the northern Sierra Nevada, California. USDI
Geological Survey, Professional Paper No. 8. U.S. Government Printing Office, Washington, D.C.
Malison, R.L., and C.V. Baxter. 2010. The fire pulse: wildfire stimulates flux of aquatic prey to
terrestrial habitats driving increases in riparian consumers. Canadian Journal of Fisheries and Aquatic Sciences 67: 570-579.
Case 1:15-cv-01329-WBS-EPG Document 34-4 Filed 10/30/15 Page 87 of 147

5
Mallek, Chris, Hugh Safford, Joshua Viers, and Jay Miller. 2013. Modern departures in fire severity and area vary by forest type, Sierra Nevada and southern Cascades, California, USA. Ecosphere art153
Manley, Patricia N., and Gina Tarbill. 2012. Ecological succession in the Angora fire: The role
of woodpeckers as keystone species. Final Report to the South Nevada Public Lands Management Act. U.S. Forest Service.
Miller, J.D., E.E. Knapp, C.H. Key, C.N. Skinner, C.J. Isbell, R.M. Creasy, and J.W. Sherlock.
2009. Calibration and validation of the relative differenced Normalized Burn Ratio (RdNBR) to three measures of fire severity in the Sierra Nevada and Klamath Mountains, California, USA. Remote Sensing of Environment 113: 645-656.
Miller, J.D., B.M. Collins, J.A. Lutz, S.L. Stephens, J.W. van Wagtendonk, and D.A. Yasuda. 2012. Differences in wildfires among ecoregions and land management agencies in the Sierra Nevada region, California, USA. Ecosphere 3: Article 80.
Miller, J.D., and H.D. Safford. 2008. Sierra Nevada fire severity monitoring, 1984-2004. U.S.
Forest Service, Pacific Southwest Research Station, Technical Paper R5-TP-027. Vallejo, CA.
Moen, CA and RJ Gutiérrez. 1997. California spotted owl habitat selection in the central Sierra
Nevada. Journal of Wildlife Management 61:1281-1287. Nagel, T.A. and Taylor, A.H. 2005. Fire and persistence of montane chaparral in mixed conifer
forest landscapes in the northern Sierra Nevada, Lake Tahoe Basin, California, USA. J. Torrey Bot. Soc.132: 442-457.
Odion, D.C., E.J. Frost, J.R. Strittholt, H. Jiang, D.A. DellaSala, and M.A. Moritz. 2004.
Patterns of ire severity and forest conditions in the Klamath Mountains, northwestern California. Conservation Biology 18: 927-936.
Odion, D.C., and C.T. Hanson. 2006. Fire severity in conifer forests of the Sierra Nevada,
California. Ecosystems 9: 1177-1189. Odion, D.C., and C.T. Hanson. 2008. Fire severity in the Sierra Nevada revisited: conclusions
robust to further analysis. Ecosystems 11: 12-15.
Odion, D. C., M. A. Moritz, and D. A. DellaSala. 2010. Alternative community states maintained by fire in the Klamath Mountains, USA. Journal of Ecology, doi: 10.1111/j.1365-2745.2009.01597.x.
Odion, D.C., and Hanson, C.T. 2013. Projecting impacts of fire management on a biodiversity indicator in the Sierra Nevada and Cascades, USA: the Black-backed Woodpecker. The Open Forest Science Journal 6: 14-23.
Case 1:15-cv-01329-WBS-EPG Document 34-4 Filed 10/30/15 Page 88 of 147

6
Odion DC, Hanson CT, Arsenault A, Baker WL, DellaSala DA, et al. 2014. Examining Historical and Current Mixed-Severity Fire Regimes in Ponderosa Pine and Mixed-Conifer Forests of Western North America. PLoS ONE 9(2): e87852.
Powers, E.M., J.D. Marshall, J. Zhang, and L. Wei. 2013. Post-fire management regimes affect carbon sequestration and storage in a Sierra Nevada mixed conifer forest. Forest Ecology and Management 291: 268-277. Raphael, M.G., M.L. Morrison, and M.P. Yoder-Williams. 1987. Breeding bird populations during twenty-five years of postfire succession in the Sierra Nevada. The Condor 89: 614- 626 Rota, C.T. et al. 2014. Space-use and habitat associations of Black-backed Woodpeckers
(Picoides arcticus) occupying recently disturbed forests in the Black Hills, South Dakota. Forest Ecology and Management 313: 161–168
Rota CT, Millspaugh JJ, Rumble MA, Lehman CP, Kesler DC. 2014. The Role of Wildfire,
Prescribed Fire, and Mountain Pine Beetle Infestations on the Population Dynamics of Black-Backed Woodpeckers in the Black Hills, South Dakota. PLoS ONE 9(4): e94700.
Saab, V.A., R.E. Russell, and J.G. Dudley. 2009. Nest-site selection by cavity-nesting birds in relation to postfire salvage logging. Forest Ecology and Management 257:151–159. Seamans, M.E., and R.J. Gutiérrez. 2007. Habitat selection in a changing environment: the relationship between habitat alteration and spotted owl territory occupancy and breeding dispersal. The Condor 109: 566-576. Seavy, N.E., R.D. Burnett, and P.J. Taille. 2012. Black-backed woodpecker nest-tree preference in burned forests of the Sierra Nevada, California. Wildlife Society Bulletin 36: 722-728. Schieck, J., and S.J. Song. 2006. Changes in bird communities throughout succession following
fire and harvest in boreal forests of western North America: literature review and meta-analyses. Canadian Journal of Forest Research 36: 1299-1318.
Sestrich, C.M., T.E. McMahon, and M.K. Young. 2011. Influence of fire on native and
nonnative salmonid populations and habitat in a western Montana basin. Transactions of the American Fisheries Society 140: 136-146.
Shatford, J.P.A., D.E. Hibbs, and K.J. Puettmann. 2007. Conifer regeneration after forest fire in
the Klamath-Siskiyous: how much, how soon? Journal of Forestry April/May 2007, pp. 139-146.
Show, S.B. and Kotok, E.I. 1924. The role of fire in California pine forests. United States
Department of Agriculture Bulletin 1294, Washington, D.C.
Case 1:15-cv-01329-WBS-EPG Document 34-4 Filed 10/30/15 Page 89 of 147

7
Show, S.B. and Kotok, E.I. 1925. Fire and the forest (California pine region). United States Department of Agriculture Department Circular 358, Washington, D.C.
Siegel, R. B., R. L. Wilkerson, and D. L. Mauer. 2008. Black-backed Woodpecker (Picoides
arcticus) surveys on Sierra Nevada national forests: 2008 pilot study. The Institute for Bird Populations, Point Reyes, CA.
Siegel, R.B., J.F. Saracco, and R.L. Wilkerson. 2010. Management Indicator Species (MIS)
surveys on Sierra Nevada national forests: Black-backed Woodpecker. 2009 Annual Report. The Institute for Bird Populations, Point Reyes, CA.
Siegel, R.B., M.W. Tingley, and R.L. Wilkerson. 2011. Black-backed Woodpecker MIS
surveys on Sierra Nevada national forests: 2010 Annual Report. A report in fulfillment of U.S. Forest Service Agreement No. 08-CS-11052005-201, Modification #2; U.S. Forest Service Pacific Southwest Region, Vallejo, CA.
Siegel, R.B., M.W. Tingley, R.L. Wilkerson, M.L. Bond, and C.A. Howell. 2013. Assessing
home range size and habitat needs of Black-backed Woodpeckers in California: Report for the 2011 and 2012 field seasons. Institute for Bird Populations.
Siegel, R. B., M. W. Tingley, and R. L. Wilkerson. 2014a (July). Black-backed Woodpecker
MIS Surveys on Sierra Nevada National Forests: 2013 Annual Report. Report to USFS Pacific Southwest Region. The Institute for Bird Populations, Point Reyes Station, CA.
Siegel, R. B., M. W. Tingley, and R. L. Wilkerson. 2014b (July). Assessing home-range size and
habitat needs of Black-backed Woodpeckers in California: Report for the 2013 field season. Report to USFS Pacific Southwest Region. The Institute for Bird Populations, Point Reyes Station, CA.
Stephens, S.L., R.E. Martin, and N.E. Clinton. 2007. Prehistoric fire area and emissions from
California’s forests, woodlands, shrublands, and grasslands. Forest Ecology and Management 251:205–216.
Stephens, S.L., S.W. Bigelow, R.D. Burnett, B.M. Collins, C.V. Gallagher, J. Keane, D.A. Kelt,
M.P. North, L.J. Roberts, P.A. Stine, and D.H. Van Vuren. 2014. California Spotted Owl, songbird, and small mammal responses to landscape fuel treatments. BioScience (in press)
Swanson, M.E., J.F. Franklin, R.L. Beschta, C.M. Crisafulli, D.A. DellaSala, R.L. Hutto, D.
Lindenmayer, and F.J. Swanson. 2011. The forgotten stage of forest succession: early successional ecosystems on forest sites. Frontiers Ecology & Environment 9: 117-125.
Tempel, DJ. 2014. California spotted owl population dynamics in the central Sierra Nevada: an
assessment using multiple types of data. PhD Dissertation, University of Minnesota, St. Paul, MN.
Case 1:15-cv-01329-WBS-EPG Document 34-4 Filed 10/30/15 Page 90 of 147
8
Tempel DJ and RJ Gutiérrez. 2013. Relation between occupancy and abundance for a territorial species, the California spotted owl. Conservation Biology 27:1087-1095.
Tempel, D.J., R.J. Guiterrez, S. Whitmore, M. Reetz, R. Stoelting, W. Berigan, M.E. Seamans,
and M.Z. Peery. In Press. Effects of fire management on California spotted owls: implications for reducing wildfire risk in fire-prone forests. Ecological Applications http://dx.doi.org/10.1890/13-2192.1
Tempel, D. J., Peery, M. Z., & Gutiérrez, R. J. 2014. Using integrated population models to
improve conservation monitoring: California spotted owls as a case study. Ecological Modelling, 289: 86-95.
Tingley, M. W., R. L. Wilkerson, M. L. Bond, C. A. Howell, and R. B. Siegel. 2014. Variation in
home range size of Black-backed Woodpeckers (Picoides arcticus). The Condor: Ornithological Applications. 116:325–340. DOI: 10.1650/CONDOR-13-140.1
Thompson, Jonathan R. Thomas A. Spies, and Lisa M. Ganio. 2007. Reburn severity in
managed and unmanaged egetation in a large wildfire. PNAS 104: 10743-10748 USDA. 2004a. Sierra Nevada Forest Plan Amendment, Final Environmental Impact Statement
and Record of Decision. U.S. Forest Service, Pacific Southwest Region, Vallejo, CA. Underwood, E.C., J.H. Viers, J.F. Quinn, and M. North. 2010. Using topography to meet wildlife and fuels treatment objectives in fire-suppressed landscapes. Environmental Management 46: 809-819. Verner, J.; McKelvey, K.S.; Noon, B.R.; Gutiérrez, R.J.; Gould, G.I., Jr.; Beck, T.W. 1992.
Assessment of the current status of the California spotted owl, with recommendations for management. Chapter 1 in: Verner, Jared; McKelvey, Kevin S.; Noon, Barry R.; Gutierrez, R. J.; Gould, Gordon I. Jr.; Beck, Thomas W., Technical Coordinators. 1992. The California spotted owl: a technical assessment of its current status. Gen. Tech. Rep. PSW-GTR-133. Albany, CA: Pacific Southwest Research Station, Forest Service, U.S. Department of Agriculture; pp. 3-26.
Williams PJ, RJ Gutiérrez, and SA Whitmore. 2011. Home range and habitat selection of
spotted owls in the central Sierra Nevada. Journal of Wildlife Management 75:333-343. Zielinski, W.J., R.L. Truex, J.R. Dunk, and T. Gaman. 2006. Using forest inventory data to assess fisher resting habitat suitability in California. Ecological Applications 16: 1010-1025. Zielinski, W.J., J.A. Baldwin, R.L. Truex, J.M. Tucker, and P.A. Flebbe. 2013. Estimating trend in occupancy for the southern Sierra fisher (Martes pennanti) population. Journal of Fish and Wildlife Management 4: 1-17.
Case 1:15-cv-01329-WBS-EPG Document 34-4 Filed 10/30/15 Page 91 of 147

9
Literature Cited re Riparian and Aquatic Areas Bar Massada, A., Radeloff, V. C., Stewart, S. I., & Hawbaker, T. J. 2009. Wildfire risk in the
wildland–urban interface: a simulation study in northwestern Wisconsin. Forest Ecology and Management 258(9):1990-1999. Online at: http://www.oranim-spatialecology.org/uploads/1/9/8/4/19845265/bar-massada_2009_forecol_wildfire_risk_in_the_wildlandurban_interface_a_simulation_study_in_northern_wisconsin.pdf
Benda, L., D. Miller,., P. Bigelow, , and K. Andras, 2003. Effects of post-wildfire erosion on
channel environments, Boise River, Idaho. Forest Ecology and Management, 178(1):105-119.
Beschta, R.L., Donahue, D.L., DellaSala, D.A., Rhodes, J.J., Karr, J.R., O’Brien, M.H.,
Fleischner, T.L., and Deacon-Williams, C. 2012. Adapting to Climate Change on Western Public Lands: Addressing the Ecological Effects of Domestic, Wild, and Feral Ungulates. Env. Manage. DOI 10.1007/s00267-012-9964-9
Beschta, ,R.L., J. J. Rhodes, J.B. Kauffman, R.E. Gresswell, G.W. Minshall, J. R. Karr, D.A.
Perry, F.R. Hauer, C. A. Frissell. 2004. Postfire Management on Forested Public Lands of the Western United States. Conservation Biology 18: 957–967. http://www.researchgate.net/publication/227654964_Postfire_Management_on_Forested_Public_Lands_of_the_Western_United_States?ev=prf_pub
Bisson, P. A., Rieman, B. E., Luce, C., Hessburg, P. F., Lee, D. C., Kershner, J. L., ... &
Gresswell, R. E. 2003. Fire and aquatic ecosystems of the western USA: current knowledge and key questions. Forest Ecology and Management 178(1):213-229.
Black, S.H., D. Kulakowski, B.R. Noon, and D. DellaSala. 2013. Do bark beetle outbreaks
increase wildfire risks in the Central U.S. Rocky Mountains: Implications from recent research? Natural Areas Journal 33:59-65.
Bryce, S.A., G.A. Lomnicky, and P.R. Kaufmann. 2010. Protecting sediment-sensitive aquatic
species in mountain streams through the application of biologically based streambed sediment criteria. Journal of the North American Benthological Society 29:657-672.
Carroll, C., D.C. Odion, C.A. Frissell, D.A. Dellasala, B.R. Noon, and R. Noss. 2009.
Conservation implications of coarse-scale versus fine-scale management of forest ecosystems: are reserves still relevant? Report for Klamath Center for Conservation Research. http://www.klamathconservation.org/docs/ForestPolicyReport.pdf
CWWR (Centers for Water and Wildland Resources), 1996. Sierra Nevada Ecosystem Project
Report. Wildland Resources Center Report No. 39, University of California, Davis.
Case 1:15-cv-01329-WBS-EPG Document 34-4 Filed 10/30/15 Page 92 of 147

10
DellaSala, D. A., R.G. Anthony, M.L. Bond, Monica, E.S. Fernandez, C.A. Frissell, Chris, C.T. Hanson, and R. Spivak. 2014. Alternative Views of a Restoration Framework for Federal Forests in the Pacific Northwest. Journal of Forestry 111(6):420-429.
Doerr, S.H., Woods, S.W., Martin, D.A., and Casimiro, M., 2009. ‘Natural background’soil
water repellency in conifer forests of the north-western USA: Its prediction and relationship to wildfire occurrence. J. Hydrol. 371: 12-21.
Donato, D.C., J.B. Fontaine, J.L. Campbell, W.D. Robinson, J.B. Kauffman, and B.E. Law.
2006. Post-wildfire logging hinders regeneration and increases fire risk. Science 311: 352. Dwire, K.A., C.C. Rhodes, and M.K. Young. 2010. Potential effects of fuel management
activities on riparian areas. In: Elliot, W. J. I.S. Miller, and L. Audin, eds. Cumulative watershed effects of fuel management in the western United States. Gen. Tech. Rep. RMRS-GTR-231. Fort Collins, CO: U.S. Department of Agriculture, Forest Service, Rocky Mountain Research Station. p. 175-205. Online at: http://www.treesearch.fs.fed.us/pubs/34315
Erman, D.C., Erman, N.A., Costick, L., and Beckwitt, S. 1996. Appendix 3. Management and
land use buffers. Sierra Nevada Ecosystem Project Final Report to Congress, Vol. III, pp. 270-273. Wildland Resources Center Report No. 39, University of California, Davis.
Foltz, R.B., Rhee, H., Yanosek, K.A., 2007. Inltration, erosion, and vegetation recovery
following road obliteration. Trans. ASABE 50: 1937-1943. Frissell, C.A. 2013. Evaluating proposed reductions of riparian reserve protections in the
Northwest Forest Plan: Potential consequence for clean water, streams, and fish. Report prepared for the Coast Range Association, Corvallis, OR, 19 August 2012. 39pp. Online at: https://www.researchgate.net/profile/Christopher_Frissell/publication/266137611_Evaluating_proposed_reductions_of_riparian_reserve_protections_in_the_Northwest_Forest_Plan_Potential_consequence_for_clean_water_streams_and_fish/links/5425bef20cf2e4ce94069d78?origin=publication_detail
Frissell, C.A., R.J. Baker, D.A. DellaSala, R.M. Hughes, J.R. Karr, D. A. McCullough, R.K.
Nawa, J. Rhodes, M.C. Scurlock, and R.C. Wissmar. 2014. Conservation of Aquatic and Fishery Resources in the Pacific Northwest: Implications of New Science for the Aquatic Conservation Strategy of the Northwest Forest Plan. Report prepared for the Coast Range Association, Corvallis, OR. 35 pp. Online at: http://coastrange.org
Gomi, T., R. D. Moore, and M. A. Hassan. (2005). Suspended sediment dynamics in small
forest streams of the Pacific Northwest. Journal of the American Water Resources Association 41(4):877-898.
Gresswell, R.E. 1999. Fire and aquatic ecosystems in forested biomes of North America.
Transactions of the American Fisheries Association 128:193–221.
Case 1:15-cv-01329-WBS-EPG Document 34-4 Filed 10/30/15 Page 93 of 147

11
Gucinski, H., M. J. Furniss, R. R. Ziemer, and M. H. Brookes. 2001. Forest roads: a synthesis of scientific information. Gen. Tech. Rep. PNWGTR-509. U.S.Department of Agriculture, Forest Service, Pacific Northwest Research Station, Portland, OR. Online at: http://www.fs.fed.us/pnw/pubs/gtr509.pdf
Hicks B.J., R.L. Beschta, and R.D. Harr. 1991. Long-term changes in streamflow following
logging in western Oregon and associated fisheries implications. Water Resources Bulletin 27(2): 217- 226.
Howard, J. K. 2010. Sensitive freshwater mussel surveys in the Pacific Southwest region: an
assessment of conservation status. Final report. Prepared by the Nature Conservancy for USDA Forest Service Pacific Southwest Region Regional Office, Vallejo, CA. Online at: http://swrcb2.swrcb.ca.gov/water_issues/programs/swamp/docs/cwt/guidance/4452.pdf
Karr, J.R., J.J. Rhodes, G.W. Minshall, F.R. Hauer, R.L. Beschta, C.A. Frissell, and D.A. Perry.
2004. The effects of postfire salvage logging on aquatic ecosystems in the American West. BioScience 54:1029-1033.
Kauffman, J.B, 2004. Death rides the forest: perceptions of fire, land use, and ecological
restoration of western forests. Cons. Biol. 18: 878-882. Keppeler, E.T. 2012. Sediment production in a coastal watershed: legacy, land use, recovery,
and rehabilitation. Pp. 69-77 in Standiford, R.B., and others (technical coordinators) Proceedings of Coast Redwood Forests in a Changing California: A Symposium for Scientists and Managers. General Technical Report PSW-GTR-238, Pacific Southwest Research Station, USDA Forest Service, Albany, CA. Onlien at: http://www.r5.fs.fed.us/psw/publications/documents/psw_gtr238/psw_gtr238_069.pdf
Klein, R.D., Lewis, J., Buffleben, M.S. Logging and turbidity in the coastal watersheds of
northern California. Geomorphology 139–140, 15 February 2012:136-144. ISSN 0169-555X, 10.1016/j.geomorph.2011.10.011. Online at: ftp://165.235.69.100/pub/incoming/IMMP/Forestry%20and%20Water%20Quality%20Information/Klein%20et%20al%202011%20Logging%20and%20Turbidity.pdf
Lindenmayer, D.B., D.R. Foster, , J.F. Franklin, , M.L Hunter,., R.F. Noss,., F.A. Schmiegelow, and D. Perry, 2004. Salvage harvesting policies after natural disturbance. Science (Washington) 303(5662):303.
Likens GE, and F.H. Bormann. 1974. Linkages between terrestrial and aquatic ecosystems.
BioScience 24:447–456. Lowe, W.H., and G.E. Likens. 2005. Moving Headwater Streams to the Head of the Class.
BioScience 55(3):196-197. Luce, C.H., B.E. Rieman, J.L. Dunham, J.G. King, & T.A. Black, 2001. Incorporating aquatic
ecology into decisions on prioritization of road decommissioning. Water Resources Impact 3(3):8-14.
Case 1:15-cv-01329-WBS-EPG Document 34-4 Filed 10/30/15 Page 94 of 147

12
Martinson, E.J. and P.N. Omi. 2013. Fuels treatments and fire severity: A meta-analysis. Research Paper RMRS-RP-103WWW. USDA Forest Service, Fort Collins, CO. 38 pp. http://www.fs.fed.us/rm/pubs/rmrs_rp103.pdf
MacDonald, L. H., D.B. Coe, and S.E. Litschert. 2004. Assessing cumulative watershed effects
in the Central Sierra Nevada: hillslope measurements and catchment-scale modeling. In Murphy, D. D. and P. A. Stine (eds.), Proceedings of the Sierra Nevada Science Symposium. USDA Forest Service Gen. Tech. Rep. PSW-GTR-193. Albany, CA. 287 p. http://warnercnr.colostate.edu/~leemac/publications/AssessingCWEintheCentralSierraNevada.pdf
McCaffery, M., Switalski, T. A., & Eby, L. 2007. Effects of road decommissioning on stream
habitat characteristics in the South Fork Flathead River, Montana. Transactions of the American Fisheries Society 136(3):553-561. Online at: http://www.wildlandscpr.org/files/McCaffery%20et%20al.%202007.%20Effects%20of%20road%20decommissioning%20on%20stream%20habitat.pdf
Malison, R. L., & Baxter, C. V. 2010. The fire pulse: wildfire stimulates flux of aquatic prey to
terrestrial habitats driving increases in riparian consumers. Canadian Journal of Fisheries and Aquatic Sciences 67(3):570-579.
Mehlhop, P., & Vaughn, C. C. 1994. Threats to and sustainability of ecosystems for freshwater
mollusks. Sustainable ecological systems: Implementing an ecological approach to land management. General Technical Report RM-247, US Forest Service, Rocky Mountain Range and Forest Experiment Station, Fort Collins, CO, 68-77. Online at: http://www.fs.fed.us/rm/boise/AWAE/labs/awae_flagstaff/Hot_Topics/ripthreatbib/mehlhop_vaughn_threatssusteco.pdf
Minshall, W. 2003. Responses of stream benthic macroinvertebrates to fire. Forest Ecology and
Management 178:155-161. Minshall, G.W., C.T. Robinson, and D.E. Lawrence. 1997. Postfire response of lotic ecosystems
in Yellowstone National Park U.S.A. Canadian Journal of Fisheries and Aquatic Sciences 54:2509-2525
Moore, R.D. and S.M. Wondzell. 2005. Physical hydrology and the effects of forest harvesting in
the Pacific Northwest: A review. Journal of the American Water Resources Association 41(4):763-784. DOI: 10.1111/j.1752-1688.2005.tb03770.x
Moyle, P. B., L.R. Brown, and R. Quinones. 2010. Status and conservation of lampreys in
California. Pages 279-292 in L.R. Brown et al., eds. Biology, Management, and Conservation, of Lampreys in North America. American Fisheries Society Symposium 72, Bethesda MD.
Moyle, P.B., J. V. E. Katz and R. M. Quiñones. 2011. Rapid decline of California's native inland
fishes: a status assessment. Biological Conservation 144: 2414-2423
Case 1:15-cv-01329-WBS-EPG Document 34-4 Filed 10/30/15 Page 95 of 147

13
Moyle, P.B., J. D. Kiernan, P. K. Crain, and R. M. Quiñones. 2013. Climate change vulnerability of native and alien freshwater fishes of California: a systematic assessment approach. PLoS One. May 22, 2013. DOI: 10.1371/journal.pone.0063883; http://www.plosone.org/article/info:doi%2F10.1371%2Fjournal.pone.0063883
Moyle, P. B., P. J. Randall, and R. M. Yoshiyama. 1996. Potential aquatic diversity management
areas of the Sierra Nevada. Pages 409-478 in Sierra Nevada Ecosystem Project: Final report to Congress, Vol. III, assessments, commissioned reports, and background information. Davis: University of California, Centers for Water and Wildland Resources. http://pubs.usgs.gov/dds/dds-43/VOL_II/VII_C57.PDF
Narayanaraj, G., & Wimberly, M. C. 2013. Influences of forest roads and their edge effects on
the spatial pattern of burn severity. International Journal of Applied Earth Observation and Geoinformation 23:62-70. Online at: http://www.oeb.harvard.edu/faculty/pringle/jc/2013_Narayanaraj.pdf
Newcombe, C.P., and MacDonald, D.D. 1991. Effects of Suspended Sediments on Aquatic
Ecosystems. North American Journal of Fisheries Management 11:72-82. Nedeau, E.J., et al., 2009. Freshwater Mussels of the Pacific Northwest, The Xerces Society,
Portland, OR. Noss, R.F., J.F. Franklin, W.L. Baker, T. Schoennagel, and P.B. Moyle. 2006. Managing fire-
prone forests in the western United States. Frontiers in Ecology and the Environment 4:481-487.
Olson, D.H., P.D. Anderson, C.A. Frissell, H. H. Welsh, Jr., and D. F. Bradford. 2007.
Biodiversity management approaches for stream-riparian areas: perspectives for Pacific Northwest headwater forests, microclimates, and amphibians. Forest Ecology and Management 246(1): 81-107.
Pollock, M.M. and T.J. Beechie. 2014. Does riparian forest thinning enhance biodiversity? The
ecological importance of large wood. Journal of the American Water Resources Association 50(3):543-559. DOI: 10.1111/jawr.12206
Pollock, M.M., T.J. Beechie, M. Liermann, and R.E. Bigley. 2009. Stream temperature
relationships to forest harvest in western Washington. Journal of the American Water Resources Association 45(1):141-156.
Pollock, M.M., T.J. Beechie, and H. Imaki. 2012. Using reference conditions in ecosystem
restoration: an example for riparian conifer forests in the Pacific Northwest. Ecosphere 3(11) Article 98: 1-23. http://dx.doi.org/10.1890/ES12-00175.1
PRC (Pacific Rivers Council). 2012. Conservation of Freshwater Ecosystems on Sierra Nevada
National Forests: Policy Analysis and Recommendations for the Future. Pacific Rivers Council, Portland Oregon, report prepared for Sierra Forest Legacy. 156pp.
Case 1:15-cv-01329-WBS-EPG Document 34-4 Filed 10/30/15 Page 96 of 147

14
http://www.sierraforestlegacy.org/Resources/Conservation/Biodiversity/Conservation%20of%20Freshwater%20Ecosystems%20on%20Sierra%20Nevada%20Forests%202012%20PRC.pdf
PRC (Pacific Rivers Council). 2010. Roads and Rivers II: An Assessment of National Forest
Roads Analyses. Report for the Pacific Rivers Council, Portland, OR. http://pacificrivers.org/science-research/resources-publications/roads-and-rivers-ii/download
Rashin, E.B., C.J. Clishe, A.T. Loch, and J.M. Bell. 2006. Effectiveness of timber harvest
practices for controlling sediment. Journal of the American Water Resources Association 42:1307-1347. Online at: https://test-fortress.wa.gov/ecy/publications/publications/0603046.pdf
Reeves, G.H., Benda, L.E., Burnett, K.M., Bisson, P.A., Sedell, J.R., 1995. A disturbance-based
ecosystem approach to maintaining and restoring freshwater habitats of evolutionarily significant units of anadromous salmonids in the Pacific Northwest. In: Nielsen, J. (Ed.), Evolution and the Aquatic Ecosystem, Proceedings of the 17th Symposium of the American Fisheries Society, Bethesda, MD, pp. 334–349.
Reid, L.M., N.J. Dewey, T.E.; Lisle, and S. Hilton. 2010. The incidence and role of
gullies after logging in a coastal redwood forest. Geomorphology 117: 155-169. http://naldc.nal.usda.gov/download/40745/PDF
Rhodes, J.J. 2007. The watershed impacts of forest treatments to reduce fuels and modify fire
behavior. Report prepared fore the Pacific Rivers Council, Eugene (now Portland), OR. 94pp. Online at: http://pacificrivers.org/science-research/resources-publications/the-watershed-impacts-of-forest-treatments-to-reduce-fuels-and-modify-fire-behavior/download
Rhodes, J. J., & Baker, W. L. 2008. Fire probability, fuel treatment effectiveness and ecological
tradeoffs in western US public forests. The Open Forest Science Journal 1(1):1-7. Online at: http://benthamopen.com/tofscij/articles/V001/1TOFSCIJ.pdf
Rhodes, J.J. and M. Purser. 1998. Thinning for increased water yield in the Sierra Nevada.
Report prepared for the Pacific Rivers Council, Eugene (now Portland) OR. 25pp. Online at: http://pacificrivers.org/science-research/resources-publications/thinning-for-increased-water-yield-in-the-sierra-nevada/download
Rhodes, J.J., McCullough, D.A., and Espinosa Jr., F.A., 1994. A Coarse Screening Process for
Evaluation of the Effects of Land Management Activities on Salmon Spawning and Rearing Habitat in ESA Consultations. CRITFC Tech. Rept. 94-4, Portland, OR.
Romero-Calcerrada, R., Novillo, C. J., Millington, J. D. A., & Gomez-Jimenez, I. 2008. GIS
analysis of spatial patterns of human-caused wildfire ignition risk in the SW of Madrid (Central Spain). Landscape Ecology 23(3):341-354. Online at : http://chans-net.org/sites/chans-net.org/files/millington30jan08.pdf
Case 1:15-cv-01329-WBS-EPG Document 34-4 Filed 10/30/15 Page 97 of 147

15
Schuett-Hames, D., A. Roorbach, and R. Conrad. 2011. Results of the Westside Type N Buffer Characteristics, Integrity and Function Study Final Report. Cooperative Monitoring Evaluation and Research Report, CMER 12-1201. Washington Department of Natural Resources, Olympia, WA. http://www.dnr.wa.gov/Publications/fp_cmer_12_1201.pdf
Sedell, J.R., P.A. Bisson, , F.J. Swanson, , and S.V. Gregory, (1988).What we know about large
trees that fall into streams and rivers. Pp. 83-112 In From the forest to the sea, a story of fallen trees, Maser, C., Tarrant, R.F., Trappe, J.M., and Franklin, J.F., tech eds. USDA Forest Service General Technical Report GTR-PNW-229, Pacific Northwest Res. Sta., Portland, OR. http://andrewsforest.oregonstate.edu/pubs/pdf/pub871.pdf
Six, D. L., Biber, E., & Long, E. 2014. Management for Mountain Pine Beetle Outbreak
Suppression: Does Relevant Science Support Current Policy?.Forests 5(1):103-133. Spies, T., M. Pollock, G. Reeves, and T. Beechie. 2013. Effects of riparian thinning on wood
recruitment: A scientific synthesis. Science Review Team, Wood Recruitment Subgroup, Forestry Sciences Laboratory, Corvallis, OR, and Northwest Fisheries Science Center, Seattle, WA. 28 January 2013. 46pp. http://www.mediate.com/DSConsulting/docs/FINAL%20wood%20recruitment%20document.pdf
Swanston, D.N., G.W. Lienkaemper, R.C Mersereau, and A.B. Levno. 1988. Timber harvest and
progressive deformation of slopes in southwestern Oregon. Association of Engineering Geologists Bulletin 25(3): 371-381. http://andrewsforest.oregonstate.edu/pubs/pdf/pub867.pdf
Switalski, T. A., Bissonette, J. A., DeLuca, T. H., Luce, C. H., & Madej, M. A. 2004. Benefits
and impacts of road removal. Frontiers in Ecology and the Environment 2(1):21-28. Syphard, A. D., Radeloff, V. C., Keeley, J. E., Hawbaker, T. J., Clayton, M. K., Stewart, S. I., &
Hammer, R. B. (2007). Human influence on California fire regimes. Ecological Applications 17(5):1388-1402. Online at: http://userwww.sfsu.edu/parker/bio821/14April09/Syphardetal2007.pdf
Trombulak, S.C., and C.A. Frissell. 2000. Review of ecological effects of roads on terrestrial and
aquatic communities. Conservation Biology 14:18-30. US Fish and Wildlife Service. 2014. Endangered and Threatened Wildlife and Plants;
Endangered Species Status for Sierra Nevada Yellow-Legged Frog and Northern Distinct Population Segment of the Mountain Yellow-Legged Frog, and Threatened Species Status for Yosemite Toad; Final Rule. Federal Register 79(82) April 29,2014 Part IV:24256-24310. Online at: http://www.fws.gov/sacramento/outreach/Public-Advisories/SierraAmphibian_Proposals/docs/3SA-FinalListingRule-FR-2014apr29.pdf
Case 1:15-cv-01329-WBS-EPG Document 34-4 Filed 10/30/15 Page 98 of 147

16
USFS and USBLM, 1997. The Assessment of Ecosystem Components in the Interior Columbia Basin and Portions of the Klamath and Great Basins, Volumes I-IV. PNW-GTR-405, USFS, Walla Walla Washington.
Wemple B.C., J.A. Jones, and G.R. Grant. 1996. Channel network extension by logging in two
basins, western Cascades, Oregon. Water Resources Bulletin 32:1195-1207. Williams, J. D., Warren Jr, M. L., Cummings, K. S., Harris, J. L., & Neves, R. J. 1993.
Conservation status of freshwater mussels of the United States and Canada. Fisheries18(9), 6-22. Online at: http://www.researchgate.net/publication/239794675_Conservation_Status_of_Freshwater_Mussels_of_the_United_States_and_Canada/file/5046351ffe594331ea.pdf
Williams, J. E., R. N. Williams, R. F. Thurow, L. Elwell, D. P. Philipp, F. A. Harris, J. L.
Kershner, P. J. Martinez, D. Miller, G. H. Reeves, C. A. Frissell, and J. R. Sedell. 2011. Native Fish Conservation Areas: a vision for large-scale conservation of native fish communities. Fisheries 36:267-277. http://www.tu.org/sites/www.tu.org/files/documents/Williams%20et%20al.%202011%20Fisheries%20NFCA.pdf
Williams, M.A., and W.L. Baker. 2012. Spatially extensive reconstructions show variable-
severity fire and heterogeneous structure in historical western United States dry forests. Global Ecology and Biogeography 21:1042-1052. http://forestpolicypub.com/wp-content/uploads/2012/02/12williamsbaker_preprint.pdf
Wondzell, S. M., & King, J. G. 2003. Postfire erosional processes in the Pacific Northwest and
Rocky Mountain regions. Forest Ecology and Management178(1):75-87. Online at: http://www.fsl.orst.edu/ltep/Biscuit/Biscuit_files/Refs/Wondzell%20FEM2003%20fire%20erosion.pdf
Literature Cited re Grazing Anderson, J.W., Beschta, R.L., Boehne, P.L., Bryson, D., Gill, R., McIntosh, B.A., Purser, M.D.,
Rhodes, J.J., and Zakel, J., 1993. A comprehensive approach to restoring habitat conditions needed to protect threatened salmon species in a severely degraded river -- The Upper Grande Ronde River Anadromous Fish Habitat Protection, Restoration and Monitoring Plan. Riparian Management: Common Threads and Shared Interests, pp. 175-179, USFS Gen. Tech. Rept. RM-226, Fort Collins, Co.
Bartholow, J.M., 2000. Estimating cumulative effects of clearcutting on stream temperatures,
Rivers, 7: 284-297. Belsky, A.J., Matzke, A., and Uselman, S., 1999. Survey of livestock influences on stream and
riparian ecosystems in the western United States. J. of Soil and Water Cons., 54: 419-431.
Case 1:15-cv-01329-WBS-EPG Document 34-4 Filed 10/30/15 Page 99 of 147

17
Beschta, R.L., Donahue, D.L., DellaSala, D.A., Rhodes, J.J., Karr, J.R., O’Brien, M.H., Fleischner, T.L., and Deacon-Williams, C. 2012. Adapting to Climate Change on Western Public Lands: Addressing the Ecological Effects of Domestic, Wild, and Feral Ungulates. Env. Manage. DOI 10.1007/s00267-012-9964-9
Beschta, R.L., Rhodes, J.J., Kauffman, J.B., Gresswell, R.E, Minshall, G.W., Karr, J.R, Perry,
D.A., Hauer, F.R., and Frissell, C.A., 2004. Postfire management on forested public lands of the western USA. Cons. Bio., 18: 957-967.
Beschta, R. L., Kauffman, J. B., Dobkin, D. S., & Ellsworth, L. M. 2014. Long-term livestock
grazing alters aspen age structure in the northwestern Great Basin. Forest Ecology and Management, 329, 30-36.
Bock, C. E., Bock, J. H. and Smith, H. M. (1993), Proposal for a system of federal livestock
exclosures on public rangelands in the western United States. Cons. Bio., 7: 731–733. Buffington, J.M. and Montgomery, D.R., 1999. Effects of sediment supply on surface textures of
gravel-bed rivers. Water Resour. Res., 35: 3523–3530. Campbell, J.L., Harmon, M.E., and Mitchell, S.R., 2011. Can fuel-reduction treatments really
increase forest carbon storage in the western US by reducing future fire emissions? Frontiers in Ecol. and the Environ., 10: 83-90.
CCSP (Climate Change Science Program) (2008) The effects of climate change on agriculture,
land resources, water resources, and biodiversity. A report by the US Climate Change Science Program and the Subcommittee on Global Change Research. P. Backlund, A. Janetos, D. Schimel, and 34 others. US Environmental Protection Agency, Washington, DC, http://www.climatescience.gov/Library/sap/sap4-3/final-report/default.htm
Clary, W.P. and Webster, B.F., 1989. Managing Grazing of Riparian Areas in the Intermountain
Region. USFS Gen. Tech. Rept. INT-263, Ogden, Utah. Coles-Ritchie, M.C., Roberts, D.W., Kershner, J.L. and Henderson, R.C., 2007. Use of a wetland
index to evaluate changes in riparian vegetation after livestock exclusion. J. Amer. Water Resour. Assoc., 43: 731-743.
(CWWR) Centers for Water and Wildland Resources, 1996. Sierra Nevada Ecosystem Project
Report, Summary and Final Report to Congress, Summary and Vol. I-III. Wildland Resources Center Report No. 39, University of California, Davis.
Cover, M.R., C.L. May, W.E. Dietrich, and V.H. Resh. 2008. Quantitative linkages among
sediment supply, streambed fine sediment, and benthic macroinvertebrates in northern California streams. J. N. Amer. Benthological Soc., 27:135-149.
Cowley, E.R., 2002. Monitoring Current Year Streambank Alteration. Bureau of Land
Management, Idaho State Office, Boise, ID
Case 1:15-cv-01329-WBS-EPG Document 34-4 Filed 10/30/15 Page 100 of 147
18
Derlet, R.W, Ger, K.A., Richards, JR, and Carlson, A.E., 2008. Risk factors for coliform bacteria in backcountry lakes and streams in the Sierra Nevada mountains: A 5-year study. Wilderness Environ. Med., 19:82–90.
Derlet, R.W., C.R. Goldman, and M.J. Connor. 2010. Reducing the impact of summer cattle
grazing on water quality in the Sierra Nevada Mountains of California: a proposal. Journal of Water and Health 8:326-333.
Derlet, R.W., Richards, J.R., Tanaka, L.L. et al., 2012. Impact of summer cattle grazing on the
Sierra Nevada watershed: Aquatic algae and bacteria. J. Environ. and Public Health. Elmore, W., 1992. Riparian responses to grazing practices. Watershed management: Balancing
sustainability and environmental change, pp. 442-457, Springer Verlag, New York. Elmore, W., and B. Kauffman. 1994. Riparian and watershed systems: degradation and restoration,
pp. 212-231. In: M. Vavra, W.A. Laycock, and R.D. Pieper (eds.), Ecological implications of livestock herbivory in the West. Soc. Range Management, Denver, CO.
Fleischner, T.L., 1994. Ecological costs of livestock grazing in western North America. Cons.
Biol., 629-644. Herbst, D.B., Bogan, M.T., Roll, S.K., Safford, H.D., 2012. Effects of livestock exclusion on in-
stream habitat and benthic invertebrate assemblages in montane streams. Freshwater Biol 57:204–217.
Hough-Snee, N., Roper, B.B., Wheaton, J.M., Budy, P., and Lokteff, R.L., 2013. Riparian
vegetation communities change rapidly following passive restoration at a northern Utah stream. Ecological Engineering, 58, 371-377.
Hughes, R., 2014. Livestock grazing in the West: Sacred cows at the public trough revisited.
Fisheries, 39: 338, 388. Kappesser, G.B., 2002. A riffle stability index to evaluate sediment loading to streams. J. Amer.
Water Resour. Assoc., 38: 1069-1080. Karr, J.R., Rhodes, J.J., Minshall, G.W., Hauer, F.R., Beschta, R.L., Frissell,C.A., and Perry, D.A,
2004. Postfire salvage logging's effects on aquatic ecosystems in the American West. BioScience, 54: 1029-1033.
Kauffman, J.B., Bayley, P., Li, H., McDowell, P., and Beschta, R.L., 2002. Research/Evaluate
Restoration of NE Oregon Streams: Effects of livestock exclosures (corridor fencing) on riparian vegetation, stream geomorphic features, and fish populations. Final Report to the Bonneville Power Administration, Portland, OR
Case 1:15-cv-01329-WBS-EPG Document 34-4 Filed 10/30/15 Page 101 of 147

19
Kauffman, J.B., A. S. Thorpe, J. Brookshire, and L. Ellingson. 2004. Livestock exclusion and belowground ecosystem responses in riparian meadows of eastern Oregon. Ecological Applications 14:1671-1679.
Kattelmann, R., 1996. Hydrology and water resources. Sierra Nevada Ecosystem Project: Final
report to Congress, Vol. II, Ch. 30. Wildland Resources Center Report No. 39, University of California, Davis.
Knapp, R.A., and Matthews, K.R., 1996. Livestock grazing, golden trout, and streams in the
Golden Trout Wilderness, California: Impacts and management implications. N. Amer. J. Fish. Management. 16:805-820.
Kondolf, G. M., R. Kattelmann, M. Embury, and D. C. Erman. 1996. Status of riparian habitat.
Sierra Nevada Ecosystem Project Report, Summary and Final Report to Congress, Summary and Vol. II, Ch. 36. Wildland Resources Center Report No. 39, University of California, Davis.
Kovalchik, B.L. and Elmore, W., 1991. Effects of cattle grazing systems on willow dominated
plant associations in central Oregon. In: Symposium on ecology and management of riparian shrub communities. May 29-31, 1991.Sun Valley, ID. p. 111-119.
Leonard, S., Kinch, G., Elsbernd, V., Borman, M., and Swanson, S., 1997. Riparian Area
Management: Grazing Management for Riparian-Wetland Areas. BLM and USFS, TR 1737-14, BLM, Denver, CO.
Luce, C.H., 1997. Effectiveness of road ripping in restoring infiltration capacity of forest roads.
Restoration Ecology, 5: 265-270 McCullough, D.A., 1999. A review and synthesis of effects of alterations to the water
temperature regime on freshwater life stages of salmonids, with special reference to chinook salmon, USEPA Technical Report EPA 910-R-99-010. USEPA, Seattle, WA.
Magilligan, F.J., and McDowell, P.F., 1997. Stream channel adjustments following elimination
of cattle grazing. J. Amer. Water Resour. Assoc., 33: 471-478. McDowell, P.F. and Magilligan, F.J., 1997. Response of stream channels to removal of cattle
grazing disturbance: Overview of western US exclosure studies. Management of Landscapes Disturbed by Channel Incision, 469-475.
Menning, K., Erman, D.C., Johnson, K.N., Sessions, J. 1996. Modeling aquatic and riparian
systems, assessing cumulative watershed effects and limiting watershed disturbance. Sierra Nevada Ecosystem Project Final Report to Congress, Addendum, pp. 33-52. Wildland Resources Center Report No. 39, University of California, Davis.
MHNF, 2013. Environmental Assessment Jazz Thinning, Clackamas River Ranger District, Mt.
Hood National Forest, Estacada OR.
Case 1:15-cv-01329-WBS-EPG Document 34-4 Filed 10/30/15 Page 102 of 147

20
Murray, E., Hovekamp, S., and Liverman, M., 2004. HCD Online Guidance Livestock Grazing on Federal Lands. NOAA Fisheries (NMFS), Northwest Region.
Myers, L., and Kane, J, 2011. The impact of summer cattle grazing on surface water quality in
high elevation mountain meadows. Water Quality, Exposure and Health 3: 51-62. Myers, L., and Whited. B., 2012. The impact of cattle grazing in high elevation Sierra Nevada
mountain meadows over widely variable annual climatic conditions. J. Environ. Protection Ponce, V.M. and Lindquist, D.S., 1990. Management of baseflow augmentation: A review. Water
Resour. Bull., 26: 259-268. Nagle, G.N., and Clifton, C.F., 2003. Channel changes over 12 years on grazed and ungrazed
reaches of Wickiup Creek in eastern Oregon. Phys. Geog., 24: 77-95. National Research Council, 2002, p. 336 in Riparian Areas: Functions and Strategies for
Management, National Academy Press, Washington, D.C National Riparian Service Team, 1999. PFC (Proper Functioning Condition) What It Is and What
It Isn't. National Riparian Service Team, USBLM, Prineville, OR. Ohmart, R.D., and Anderson, B.W., 1986. Riparian habitat. Inventory and Monitoring of
Wildlife Habitat, pp. 169-199, USBLM Service Center, Denver, Co. Platts, W.S., 1991. Livestock grazing. Influences of Forest and Rangeland Management on
Salmonid Fishes and Their Habitats, pp. 389-424. Am. Fish. Soc. Special Publ. 19. Pollock, M.M. and Beechie, T.J., 2014. Does riparian forest restoration thinning enhance
biodiversity? The ecological importance of large wood. J. Amer. Water Resour. Assoc., 50: 543-559. DOI: 10.1111/jawr.12206
Reeves, G.H., Hall, J.D., Roelofs, T.D., Hickman, T.L., and Baker, C.O., 1991. Rehabilitating and
modifying stream habitats. Influences of Forest and Rangeland Management on Salmonid Fishes and Their Habitats, Am. Fish. Soc. Special Publ. 19: 519-557
Reid, L.M., 1993. Research and cumulative watershed effects. Pacific SouthwestResearch Station
General Technical Report PSW-GTR-141. Albany, CA. Reid, L.M., 1999. Forest Practice Rules and cumulative watershed impacts in California.
Unpublished response to an inquiry from Assembleyman Fred Keeley. USDA Forest Service, Pacific Southwest Research Station, Redwood Sciences Laboratory, Arcata, California.
Reisner, M.D., Grace, J.B., Pyke, D.A., and Doescher, P.S., 2013. Conditions favouring Bromus
tectorum dominance of endangered sagebrush steppe ecosystems. J Appl Ecol. doi:10.1111/1365-2664.12097
Case 1:15-cv-01329-WBS-EPG Document 34-4 Filed 10/30/15 Page 103 of 147

21
Rhodes, J.J., 2007. The watershed impacts of forest treatments to reduce fuels and modify fire behavior. Prepared for: Pacific Rivers Council. Eugene, Or
Rhodes, J.J., McCullough, D.A., and Espinosa Jr., F.A., 1994. A Coarse Screening Process for
Evaluation of the Effects of Land Management Activities on Salmon Spawning and Rearing Habitat in ESA Consultations. CRITFC Tech. Rept. 94-4, Portland, Or. http://www.critfc.org/text/tech_rep.htm
Rhodes, J.J. and Baker, W.L., 2008. Fire probability, fuel treatment effectiveness and ecological
tradeoffs in western U.S. public forests. Open Forest Science Journal, 1: 1-7. http://www.bentham.org/open/tofscij/openaccess2.htm
Sedell, J., Lee, D., Reiman, D., Thurow, R, and Williams, J., 1997. Chapter 3, Effects of
proposed alternatives on aquatic habitats and native fishes, in Evaluation of EIS Alternatives by the Science Integration Team. Vol. I PNW-GTR-406, USFS and USBLM, Portland, OR.
Sikes, K., Cooper, D., Weis, S. et al., 2013. Fen conservation and vegetation assessment in the
National Forests of the Sierra Nevada and adjacent mountains, California. Unpublished report to the United States Forest Service, Region, 5.
Spence, B.C., Lomnicky, G.A., Hughes, R.M., Novitzki, R.P., 1996. An ecosystem approach to
and salmonid conservation. TR-4501-96-6057. ManTech Environmental Research Services Corp., Corvallis, OR. (Available from the National Marine Fisheries Service, Portland, Oregon.)
Stevens, L.E, Stacey, P., Duff, D., et al., 2002. Riparian ecosystem evaluation: A review and test
of BLM’s proper functioning condition assessment guidelines. A Final Report Submitted To The National Riparian Service Team, USDI.
Stewart, I.T., Cayan, D.R., and Dettinger, M.D., 2005. Changes toward earlier streamflow timing
across western North America. J. Climate, 18: 1136-1155. Thompson, L., Escobar, M., Mosser, C., Purkey, D., Yates, D., and Moyle, P., 2012. Water
management adaptations to prevent loss of spring-run Chinook salmon in California under climate change. J. Water Resour. Plann. Manage., 138: 465–478.
USFS, NMFS, USBLM, USFWS, USNPS, USEPA, 1993. Forest Ecosystem Management: An
Ecological, Economic, and Social Assessment. USFS PNW Region, Portland, OR. USFS, 2000. Sierra Nevada Forest Plan Amendment DEIS, USFS PSW Region, San Francisco,
Ca. USFS and USBLM, 1995a. "PACFISH" – Decision Notice and Environmental Assessment for
Interim Strategies for Managing Anadromous Fish-producing Watersheds in Eastern Oregon and Washington, Idaho, and Portions of California. USFS and USBLM, Wash. D.C.
Case 1:15-cv-01329-WBS-EPG Document 34-4 Filed 10/30/15 Page 104 of 147

22
USFS and USBLM, 1995b. “INFISH” -- Decision Notice and Environmental Assessment for Inland Native Strategies for Managing Fish-producing Watersheds in Eastern Oregon and Washington, Idaho, Western Montana, and Portions of Nevada. USFS and USBLM, Wash., D.C.
USFS and USBLM, 1997. The Assessment of Ecosystem Components in the Interior Columbia
Basin and Portions of the Klamath and Great Basins, Volumes I-IV. PNW-GTR-405, USFS, Walla Walla Washington.
Viers, J.H., Purdy, S.E., Peek, R.A. et al., 2013. Montane Meadows in the Sierra Nevada:
Changing Hydroclimatic Conditions and Concepts for Vulnerability Assessment. Center for Watershed Sciences Technical Report (CWS-2013-01), University of California, Davis.
Wondzell, S.M. and King, J., 2003. Postfire erosional processes in the Pacific Northwest and
Rocky Mountain regions. For. Ecol. Manage. 178 (1–2), 75–87.
Case 1:15-cv-01329-WBS-EPG Document 34-4 Filed 10/30/15 Page 105 of 147

1
October 3, 2014
Maria Ulloa Forest Plan Revision 1839 So. Newcomb Street Porterville, CA 93257
Mike Dietle Land Management Plan Revision USDA Forest Service Ecosystem Planning Staff 1323 Club Drive Vallejo, CA 94592
Sent to: [email protected]
Re: Forest Plan Revision
Dear Forest Plan Revision Team:
On behalf of the Center for Biological Diversity and John Muir Project of Earth Island Institute, we submit the following comments regarding the “Detailed Proposed Action in Support of the Need to Change Items in the Notice of Intent for Forest Plan Revision for the Inyo, Sequoia and Sierra National Forests.”
Our organizations have been participating in the plan revision process, including the submission of extensive written comments regarding the Science Synthesis, the Bio-regional Assessment, the Natural Range of Variation reports, each Forest-specific Assessment (Inyo, Sequoia, and Sierra National Forests), the Need to Change, and the Draft Desire Conditions. Our comments were detailed and contained numerous scientific citations that directly pertain to the Sierra Nevada ecosystem, especially as to wildlife conservation. Those comments are attached with these comments and incorporated by reference because they must be addressed (and have not yet been) by the Forest Service if the agency is to meet its obligations to adhere to the best available science.
The Proposed Action does not contain the type of detail necessary to protect wildlife on the Sierra, Sequoia, and Inyo National Forests. This is especially true of wildlife associated with dense, mature conifer forest and/or post-fire dense mature conifer forest, as well as wildlife associated with aquatic and riparian areas. Likewise, wildlife impacts from grazing are not yet adequately addressed. As described below, we have significant concerns about both the content
CENTER for BIO LO GIC AL D IVERS ITY
Case 1:15-cv-01329-WBS-EPG Document 34-4 Filed 10/30/15 Page 106 of 147
2
and scope of the Proposed Action, and these issues must be addressed going forward.
A. Wildlife Diversity and Conservation
In addition to the best available science standard (219.3), section 219.9 of the 2012 Planning Rule, titled “Diversity of plant and animal communities,” states that a Plan must contain “components, including standards or guidelines, to maintain or restore the ecological integrity of terrestrial and aquatic ecosystems and watersheds in the plan area, including plan components to maintain or restore their structure, function, composition, and connectivity.” Similarly, the Plan must include “components, including standards or guidelines, to maintain or restore the diversity of ecosystems and habitat types throughout the plan area. In doing so, the plan must include plan components to maintain or restore: (i) Key characteristics associated with terrestrial and aquatic ecosystem types; (ii) Rare aquatic and terrestrial plant and animal communities; and (iii) The diversity of native tree species similar to that existing in the plan area.” The Forest Service must “determine whether or not the plan components . . . provide the ecological conditions necessary to: contribute to the recovery of federally listed threatened and endangered species, conserve proposed and candidate species, and maintain a viable population of each species of conservation concern within the plan area.” If not, “then additional, species-specific plan components, including standards or guidelines, must be included in the plan to provide such ecological conditions in the plan area.” Finally, if “it is beyond the authority of the Forest Service or not within the inherent capability of the plan area to maintain or restore the ecological conditions to maintain a viable population of a species of conservation concern in the plan area, then the responsible official shall: (i) Document the basis for that determination (§ 219.14(a)); and (ii) Include plan components, including standards or guidelines, to maintain or restore ecological conditions within the plan area to contribute to maintaining a viable population of the species within its range.”
In regard to aquatic ecosystems, the 2012 Rule further requires Plans “to identify priority watersheds for maintenance or restoration.” In addition, Plan components are “required for the maintenance and restoration of the ecological integrity of riparian areas,” especially “land and vegetation within approximately 100 feet of all perennial streams and lakes.”
The management direction in the existing forest plans has not resulted in a reversal of declining trends (population and/or habitat) for a variety of at-risk species, including California spotted owl, fisher, Yosemite toad, Sierra yellow-legged frogs, and post-fire specialists such as the black-backed woodpecker and olive-sided flycatcher. Ecosystem components that are critical to species like owls and fishers – such as snags (especially large snags), mistletoe, and dense canopy – have been neglected and/or intentionally reduced. Moreover, rare species like the black-backed woodpecker are themselves of particular importance in creating/maintaining ecosystem components and their crucial roles in the ecosystem have not yet been adequately acknowledged and addressed (e.g., BBWOs create cavities that other species rely upon because those species cannot create cavities themselves).
The treatment of at-risk species in the Proposed Action does almost nothing to change the problems of the past, such as logging in mature conifer forest, especially in owl, fisher, and woodpecker habitat, both pre fire and post fire. The habitat needs and life requirements for
Case 1:15-cv-01329-WBS-EPG Document 34-4 Filed 10/30/15 Page 107 of 147

3
species are not integrated into plan components that address terrestrial and aquatic ecosystems. As a result, the PA does not identify the proper suite of plan components to “provide the ecological conditions necessary to: contribute to the recovery of federally listed threatened and endangered species, conserve proposed and candidate species, and maintain a viable population of each species of conservation concern within the plan area.” 36 CFR 219.9. Furthermore, there is substantial contradiction currently between the PA and wildlife needs. For example, the plan components for Fire Management conflict with providing ecosystem integrity and species viability – based on a GIS analysis, the Community and General WPZs significantly overlap with the range of the spotted owl and fisher, as well as the ponderosa pine and mixed conifer forest types. For instance, of the 216 spotted owl Protected Activity Centers (PAC) on the Sierra National Forest, 144 (67 percent) have more than 25 percent of their PAC area within one of these two zones, and approximately 50 percent of the mixed conifer and 70 percent of the ponderosa pine vegetation types are within these zones. If wildlife conservation obligations are to be met, specific standards and guidelines will be necessary to ensure protection of dense mature conifer forest (e.g., canopy cover, snags, downed wood, understory, shrubs, small, medium and large trees) from logging activities, including post-fire.
Dense, Mature, Conifer Forest (both Unburned and Burned)
Rare, declining, and imperiled species – such as the California spotted owl, Pacific fisher, pine marten, northern goshawk, black-backed woodpecker, and olive-sided flycatcher – are all associated with dense, mature conifer forest. The Proposed Action, however, contains no standards or guidelines to adequately protect the wildlife associated with this forest type, whether it be unburned or burned (i.e., burned forest that pre-fire was dense mature conifer forest). This must be corrected going forward in order to comply with the wildlife aspects of the 2012 Rule.
Mature forests contain specific characteristics/complexity that must be provided for such as downed wood, snags, canopy cover, shrubs, and understory. It is also essential to explicitly recognize the importance of mature forest after it has burned – at all severities – to species like spotted owls, fishers, and black-backed woodpeckers. Otherwise, we risk repeating the same mistakes of the past in which unburned forest is mechanically treated in ways it shouldn’t be and burned forest is salvaged logged.
California Spotted Owl
The Forest Service considers suitable California spotted owl habitat as forest stands represented by CWHR classes 4M, 4D, 5M, 5D, and 6 in mixed conifer, red fir, ponderosa pine/ hardwood, foothill riparian/hardwood, and east-side pine forests. The last time the Forest Service formally adopted a definition of suitable habitat for spotted owls was in 2004, as part of the 2004 SNFPA. The SFNPA states the following as to suitable habitat:
California spotted owl protected activity centers (PACs) are delineated surrounding each territorial owl activity center detected on National Forest System lands since 1986. Owl activity centers are designated for all territorial owls based on: (1) the most recent documented nest site, (2) the most recent known roost site when a nest location remains unknown, and (3) a central point
Case 1:15-cv-01329-WBS-EPG Document 34-4 Filed 10/30/15 Page 108 of 147

4
based on repeated daytime detections when neither nest or roost locations are known. PACs are delineated to: (1) include known and suspected nest stands and (2) encompass the best available 300 acres of habitat in as compact a unit as possible. The best available habitat is selected for California spotted owl PACs to include: (1) two or more tree canopy layers; (2) trees in the dominant and co-dominant crown classes averaging 24 inches dbh or greater; (3) at least 70 percent tree canopy cover (including hardwoods); and (4) in descending order of priority, CWHR classes 6, 5D, 5M, 4D, and 4M and other stands with at least 50 percent canopy cover (including hardwoods). Aerial photography interpretation and field verification are used as needed to delineate PACs.
Desired Conditions
Stands in each PAC have: (1) at least two tree canopy layers; (2) dominant and co-dominant trees with average diameters of at least 24 inches dbh; (3) at least 60 to70 percent canopy cover; (4) some very large snags (greater than 45 inches dbh); and (5) snag and down woody material levels that are higher than average.
…
A home range core area is established surrounding each territorial spotted owl activity center detected after 1986. The core area amounts to 20 percent of the area described by the sum of the average breeding pair home range plus one standard error. Home range core area sizes are as follows: 2,400 acres on the Hat Creek and Eagle Lake Ranger Districts of the Lassen National Forest, 1,000 acres on the Modoc, Inyo, Humboldt-Toiyabe, Plumas, Tahoe, Eldorado, Lake Tahoe Basin Management Unit and Stanislaus National Forests and on the Almanor Ranger District of Lassen National Forest, and 600 acres of the Sequoia and Sierra National Forests. Aerial photography is used to delineate the core area. Acreage for the entire core area is identified on national forest lands. Core areas encompass the best available California spotted owl habitat in the closest proximity to the owl activity center. The best available contiguous habitat is selected to incorporate, in descending order of priority, CWHR classes 6, 5D, 5M, 4D and 4M and other stands with at least 50 percent tree canopy cover (including hardwoods). The acreage in the 300- acre PAC counts toward the total home range core area. Core areas are delineated within 1.5 miles of the activity center.
When activities are planned adjacent to non-national forest lands, circular core areas are delineated around California spotted owl activity centers on non-national forest lands. Using the best available habitat as described above, any part of the circular core area that lies on national forest lands is designated and managed as a California spotted owl home range core area. HRCAs consist of large habitat blocks that have: (1) at least two tree canopy layers; (2) at least 24 inches dbh in dominant and co-dominant trees; (3) a number of very large (greater than 45 inches dbh) old trees; (4) at least 50 to 70 percent
Case 1:15-cv-01329-WBS-EPG Document 34-4 Filed 10/30/15 Page 109 of 147

5
canopy cover; and (5) higher than average levels of snags and down woody material.
Because the Forest Service relies on the 2004 SNFPA for its management direction, the U.S. Forest Service has never recognized the foraging habitat suitability of severely burned (and not salvage logged) forest stands for spotted owls and, in fact, regularly re-draws Protected Activity Centers (PACs), or even removes them from the PAC system, after severe fire to exclude these areas. The 2004 SNFPA facilitates this due to two key factors 1) its definition of suitable habitat and 2) because it explicitly states: “PACs are maintained regardless of California spotted owl occupancy status. However, after a stand-replacing event, evaluate habitat conditions within a 1.5-mile radius around the activity center to identify opportunities for re-mapping the PAC. If there is insufficient suitable habitat for designating a PAC within the 1.5-mile radius, the PAC may be removed from the network.” The result is a lack of protection for suitable burned foraging habitat close to nests/roosts, which in turn allows this suitable foraging habitat to be open to post-fire salvage logging, which in turn may adversely affect occupancy. This is a major issue, given that a disproportionately large amount of foraging occurs within a 1500-meter radius of nest/roost trees (Bond et al. 2009, Fig. 1). As we have pointed out to the Forest Service many times, Bond et al. 2009, Bond et al. 2010, Bond et al. 2013, Lee et al. 2012, and Clark et al. 2013 all show the importance of protecting owls from salvage logging and yet this science continues to be ignored because it does not fit the Forest Service’s desire to log in dense mature post-fire forest. At the very least, standards, such as precluding salvage logging within 1.5 km of spotted owl core sites (Bond et al. 2009), and protecting burned (of all severities) CWHR 4M, 4D, 5M, 5D, and 6 conifer forest, are necessary to protect post-fire owl habitat.
Bond et al. (2009) quantified habitat selection, which is how much owls used forest that burned at a particular severity compared with the availability of that burn severity. The authors banded and radio-marked 7 California spotted owls occupying the McNally Fire in the Sequoia National Forest four years after fire, and radio tracked them throughout the breeding season. Males and females forage independently, and analyses compared each bird’s foraging locations with random locations within their own foraging ranges. Furthermore, all owls had unburned, low, moderate and highly burned patches of forest in their foraging ranges from which to choose, so the authors could quantify whether owls selected or avoided any of these burn intensities. This is the first study to specifically examine foraging habitat selection by spotted owls in burned forests that were not subjected to substantial post-fire logging. Spotted owls used all burn severities for foraging, but the probability of an owl using a site for foraging was strongest in severely burned forests, after accounting for distance from nest (see Figure 1below). Selection for a particular burn class occurred within 1.5 km from the nest.
Case 1:15-cv-01329-WBS-EPG Document 34-4 Filed 10/30/15 Page 110 of 147
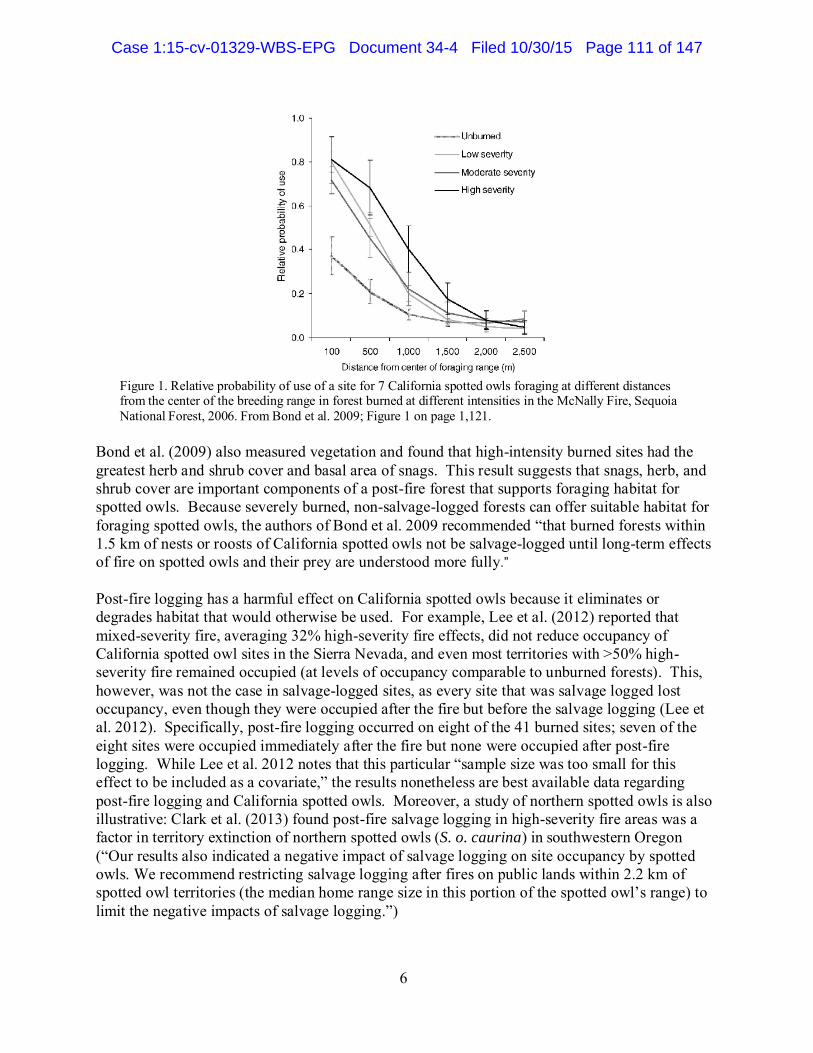
6
Figure 1. Relative probability of use of a site for 7 California spotted owls foraging at different distances from the center of the breeding range in forest burned at different intensities in the McNally Fire, Sequoia National Forest, 2006. From Bond et al. 2009; Figure 1 on page 1,121.
Bond et al. (2009) also measured vegetation and found that high-intensity burned sites had the greatest herb and shrub cover and basal area of snags. This result suggests that snags, herb, and shrub cover are important components of a post-fire forest that supports foraging habitat for spotted owls. Because severely burned, non-salvage-logged forests can offer suitable habitat for foraging spotted owls, the authors of Bond et al. 2009 recommended “that burned forests within 1.5 km of nests or roosts of California spotted owls not be salvage-logged until long-term effects of fire on spotted owls and their prey are understood more fully.”
Post-fire logging has a harmful effect on California spotted owls because it eliminates or degrades habitat that would otherwise be used. For example, Lee et al. (2012) reported that mixed-severity fire, averaging 32% high-severity fire effects, did not reduce occupancy of California spotted owl sites in the Sierra Nevada, and even most territories with >50% high- severity fire remained occupied (at levels of occupancy comparable to unburned forests). This, however, was not the case in salvage-logged sites, as every site that was salvage logged lost occupancy, even though they were occupied after the fire but before the salvage logging (Lee et al. 2012). Specifically, post-fire logging occurred on eight of the 41 burned sites; seven of the eight sites were occupied immediately after the fire but none were occupied after post-fire logging. While Lee et al. 2012 notes that this particular “sample size was too small for this effect to be included as a covariate,” the results nonetheless are best available data regarding post-fire logging and California spotted owls. Moreover, a study of northern spotted owls is also illustrative: Clark et al. (2013) found post-fire salvage logging in high-severity fire areas was a factor in territory extinction of northern spotted owls (S. o. caurina) in southwestern Oregon (“Our results also indicated a negative impact of salvage logging on site occupancy by spotted owls. We recommend restricting salvage logging after fires on public lands within 2.2 km of spotted owl territories (the median home range size in this portion of the spotted owl’s range) to limit the negative impacts of salvage logging.”)
Case 1:15-cv-01329-WBS-EPG Document 34-4 Filed 10/30/15 Page 111 of 147

7
The Plan revision must also keep in mind that California spotted owls are in a steep decline and therefore their viability is at extreme risk and clearly past management has failed. While this is just one reason that dense mature conifer forest needs detailed protections – both in its unburned and burned (all severities – low, moderate, and high) form – with specific standards/guidelines, it is an extremely important one. Now outdated studies of California spotted owls strongly suggested population declines, but statistical power was too low to provide solid evidence. Recent scientific studies, however, using additional data and robust statistical methodology have very clearly demonstrated that California spotted owl populations are declining throughout the range of the subspecies (Connor et al. 2013; Tempel and Gutierrez 2013). The new science also shows that the declines are associated with areas characterized by past and ongoing extensive mechanical thinning and post-fire logging. Over the past 18 years, a spotted owl population in the logged Lassen National Forest declined by 22% and another population in the logged Sierra National Forest declined by 16% (Conner et al. 2013). By contrast, in the same 18-year period a population in the unlogged national parks of Sequoia and Kings Canyon increased by 22%. In the logged Eldorado National Forest, the number of territories occupied by spotted owls declined over 18 years to less than 70% occupancy as compared to over 90% at the beginning of the study (Tempel and Gutiérrez 2013). None of these demography study areas experienced significant levels of fire during the study periods, thus fire could not be implicated as a factor in the population declines. These studies demonstrate that the California spotted owl is currently on a trajectory towards extinction on our public forest lands in the Sierra Nevada. Current regulatory mechanisms on public forest lands have permitted harmful forest management practices, such as mechanical treatments and salvage logging in owl habitat, and have proven inadequate to stabilize or reverse the population declines. The data therefore indicate that the California spotted owl is imperiled throughout most of its range, and logging in National Forest lands is an example of why local populations are threatened with extirpation and the entire subspecies may be on a trajectory towards range-wide extinction. Thus, standards and guidelines that explicitly protect spotted owl habitat are plainly needed to reverse the current downward trend, especially standards that protect post-fire owl habitat.
Moreover, this issue is especially urgent in light of recent logging projects in the Sierras such as the Rim Project, the Aspen Project, and the Big Hope Project, all of which promoted logging of post-fire CSO habitat. An analysis of the 2014 Rim fire survey forms shows that 33 spotted owl pairs, and 6 spotted owl singles, were detected by the Forest Service during the spring and summer of 2014 within the Rim Fire area, demonstrating that the Rim Fire area, and post-fire landscapes in general, need explicit standards/guidelines in order to protect these extensively occupied areas from logging. Again, the best available published science (Bond et al. 2009) regarding California spotted owl use of burned forest landscapes shows that the owls not only use unlogged burned forest within 1.5 km of their nests/roosts, they preferentially select it. This is why Bond et al. 2009 states that post-fire logging should not occur within 1.5 km of owl core- use sites. Moreover, because is it known that spotted owls rely on much more than Protected Activity Centers (PACs) for their life needs (nesting, roosting and foraging), it is necessary for the Forest Service to not only protect PACs and HRCAs from logging, but to also protect owl home ranges, including severely burned forest in home ranges. Therefore, the Plan revisions must address this fact and ensure protection of all owl habitat, not just some, in order to maintain viability. Further, most home-range estimates and studies of foraging habitat selection are from the breeding season only. Some California spotted owls are known to expand their movements
Case 1:15-cv-01329-WBS-EPG Document 34-4 Filed 10/30/15 Page 112 of 147

8
during the winter (Bond et al. 2010), which represents the most energetically costly and dangerous time for owl survival. Thus, the protection of potentially important habitat should extend to habitat used during the overwinter season as well.
The California spotted owl uses or selects, for nesting and roosting, conifer and mixed conifer- hardwood forested habitats that have structural components of old forests, including large trees >61 cm diameter at breast height (Call et al. 1992, Gutiérrez et al. 1992, Moen and Gutiérrez 1997, Bond et al. 2004, Blakesley et al. 2005, Seamans 2005); multi-layered canopy/complex structure (Gutiérrez et al. 1992, Moen and Gutiérrez 1997); high canopy cover (> 40 percent and mostly > 70 percent; Bias and Gutiérrez 1992, Gutiérrez et al. 1992, Moen and Gutiérrez 1997, Bond et al. 2004, Blakesley et al. 2005, Seamans 2005); abundant snags (Bias and Gutiérrez 1992, Gutiérrez et al. 1992, Bond et al. 2004); and downed logs (Gutiérrez et al. 1992). Logging older forest is a threat to California spotted owl occupancy. For example, in a long-term demography study of color-banded California spotted owls in the central Sierra Nevada, Seamans and Gutiérrez (2007) found that the probability of territory colonization decreased significantly with as little as 20 hectares of logging, and territory occupancy was significantly decreased with as little as 20 hectares of logging. Further, the probability of breeding dispersal away from a territory was related to the area of mature conifer forest in a territory and increased when >20 hectares of this habitat was altered by logging. Moreover, in a very recent paper, Stephens et al. 2014 (in press), titled “California spotted owl, songbird, and small mammal responses to landscape fuel treatments,” the owl analysis found a 43% loss of California spotted owl occupancy, as well as colonization by barred owls (Strix varia) (which are larger and more aggressive, and strongly tend to lead to further extirpations of spotted owls), within just several years after mechanical thinning and group selection logging occurred on the Plumas National Forest. This study further highlights the need for explicit standards/guidelines to protect California spotted owl habitat from mechanical treatments. Tempel et al. (2014) also provides evidence that mechanical thinning is significantly harming California spotted owls. The authors found that the amount of mature forest with high canopy cover (70-100%) was a critical variable for California spotted owl viability (survival, territory extinction rates, and territory colonization rates), and determined that “medium-intensity” logging significantly adversely affects California spotted owls at all spatial scales by targeting dense, mature forests with high canopy cover, degrading the quality of such habitat by reducing it to moderate canopy cover. This is adversely affecting California spotted owl reproduction (Tempel et al. 2014). The authors noted specifically that
only 42.8% of medium-intensity harvests occurred in high-canopy forests; thus, over half of these harvests occurred in habitats that might be less important to spotted owls (Fig. 5c). When medium-intensity harvests were implemented within high-canopy forests, they reduced the canopy sufficiently for mapped polygons to be reclassified into a lower-canopy vegetation class in 90.1% of these treated areas (Fig. 5d). … such changes were associated with reductions in survival and territory colonization rates, as well as increases in territory extinction rates. As a result, we believe the most appropriate inference about the influence of medium- intensity harvesting practices is that they appear to reduce reproductive potential, and when implemented in high-canopy forests, likely reduce survival and territory occupancy as well.
Case 1:15-cv-01329-WBS-EPG Document 34-4 Filed 10/30/15 Page 113 of 147

9
Tempel et al. (2014) found no effect of wildland fire on spotted owl reproduction, survival, occupancy, or territory extinction. They did report an adverse effect of fire on territory colonization and, based upon this fact, the authors predicted (using modeling assumptions) that if fire doubled, it would adversely affect occupancy. However, the fire covariate was “unestimable” due to very small sample size, meaning that no result can be determined, statistically. The authors noted that territory colonization was low in fire-affected areas for two reasons: 1) in the largest fire that accounted for most of the fire-affected territories, 5 of the 9 territories remained occupied in every single year after the fire, thus “colonization could not occur by definition”; and 2) the authors noted that the main reason that the “effect of wildfire on territory colonization was strongly negative” was “due to a high-severity fire that occurred on our study area in 2001 and completely burned two territories, which were subsequently never colonized by owls”, and two other territories had very low post-fire occupancy and colonization. Though the study hinted at the fact that intensive post-fire logging had occurred in these burned territories, the modeling result of the study did not account for the fact that the permanent loss of occupancy (and no colonization) in the two “completely burned” territories, and the two other territories with very low post-fire occupancy/colonization, was associated with intensive logging after the fire (see, e.g., Sierra Club v. Eubanks, 335 F.Supp.2d 1070, 1075 (E.D. Cal. 2004) [noting that all of the heavily burned forest in the Star fire of 2001 had been subjected to post- fire logging on public and private lands outside of the Duncan Canyon Inventoried Roadless Area, which is the portion of the Star fire that is outside of the Tempel et al. 2014 study area]). Google Earth imagery also clearly shows heavy post-fire logging within 1.5 kilometers (and much closer) of the two territories that completely lost occupancy (PLA055 and PLA075) and the two with near-complete loss of occupancy and colonization post-fire (PLA016 and PLA099) (see Appendix A). Tempel et al. 2014 further demonstrates the need for Plan revisions that protect owls from mechanical treatments and from salvage logging.
To provide adequate protections for this rare and declining raptor, it is necessary to recognize that standards/guidelines must be established that a) account for the importance of both burned and unburned mature conifer forest, b) protect owls from mechanical treatments (which not only do not mimic fire, there is an entire body of data that shows that mechanical treatments are a primary driver of the California spotted owl declines that have been observed on all Forest Service-managed lands in the Sierra Nevada over the past 20+ years), and c) protect owls from salvage logging (which generally targets their preferred foraging habitat in a post-fire landscape and has been documented as contributing to owl habitat loss and only occurs in places where owls are declining).
Based on the declines in spotted owl populations on Forest Service lands and the correlation of the decline to fuels treatments and salvage logging (despite the protections afforded to the species through the existing forest plans in the form of Protected Activity Centers and Home Range Core Areas), it is clear that the Forest Service should take this opportunity to change the current plan components to protect spotted owls from the adverse effects of mechanical treatments and salvage logging.
Case 1:15-cv-01329-WBS-EPG Document 34-4 Filed 10/30/15 Page 114 of 147

10
Pacific fisher
Like with the CSO, the 2004 Framework FEIS (pp. S-15, 138, 243, and 246) assumed that mixed-severity fire, including higher-severity fire patches, was a primary threat to Pacific fishers, and the Framework FEIS (p. 242) did not include density of small/medium-sized trees among the important factors in its assessment of impacts to fishers. Thus, the Plan revisions must provide standards/guidelines that recognize and protect a) unburned dense mature conifer forest, and b) burned dense mature conifer forest (i.e., burned areas that pre-fire consisted of dense mature conifer forest).
The data indicate that one of the top factors predicting fisher occupancy is a very high density of small/medium-sized trees, including areas dominated by fir and cedar, and that Pacific fishers may benefit from mixed-severity fire. For example, Underwood et al. 2010’s results show that fishers are selecting the densest forest, dominated by fir and cedar, with the highest densities of small and medium-sized trees, and the highest snag levels. Hanson 2013 found that Pacific fishers are using pre-fire mature conifer forest that experienced moderate/high-severity fire at about the same levels as they are using unburned mature conifer forest. Moreover, Hanson 2013 found that when fishers are near fire perimeters, they strongly select the burned side of the fire edge. More recently, Hanson (see attached Powerpoint) has also found documented fisher use of large patches of high-severity fire (up to thousands of hectares in size). Garner 2013 found that fishers actively avoided mechanically thinned areas when the scale of observation was sufficiently precise to determine stand-scale patterns of selection and avoidance—generally less than 200 meters. Zielinski et al. 2006 found that the two most important factors associated with fisher rest sites are high canopy cover and high densities of small and medium-sized trees less than 50 cm in diameter [Tables 1 and 3]. And Zielinski et al. 2013 investigated fisher occupancy in three subpopulations of the southern Sierra Nevada fisher population: the western slope of Sierra National Forest; the Greenhorn mountains area of southwestern Sequoia National Forest; and the Kern Plateau of southeastern Sequoia National Forest area, using baited track- plate stations. The Kern Plateau area is predominantly post-fire habitat [mostly unaffected by salvage logging] from several large fires occurring since 2000, including the Manter fire of 2000 and the McNally fire of 2002. The baited track-plate stations used for the study included these fire areas [Fig. 2]. Mean annual fisher occupancy at detection stations was lower on Sierra National Forest than on the Kern Plateau. Occupancy was trending downward on Sierra National Forest, and upward on the Kern Plateau, though neither was statistically significant, possibly due to a small data set.
Together, this data makes plain that in order to protect the fisher and its habitat, standards/guidelines are necessary to protect both burned and unburned dense mature conifer forest, including dense mature conifer that is severely burned forest (greater than 50% basal are mortality).
Black-backed woodpecker
The black-backed woodpecker is a potential species of conservation concern due to being highly associated with severely burned forest and its avoidance of salvaged logged areas as described below. Moreover, it is a keystone species providing, for example, cavities that other wildlife
Case 1:15-cv-01329-WBS-EPG Document 34-4 Filed 10/30/15 Page 115 of 147

11
relies upon for nesting, resting, or denning. We of course, believe that the BBWO must be designated as a SCC as it is extremely rare and not only is its habitat largely unprotected from logging, the Forest Service currently seeks to reduce BBWO habitat on the landscape via mechanical treatments and salvage logging. Furthermore, the importance of the BBWO as a keystone species is yet another reason to monitor and protect it as a species of conservation concern.
Ecological Conditions Necessary for Persistence and Viability:
High post-fire snag density (which generally correlates with areas that a) were pre-fire
dense, mature conifer forest, and b) burned at moderate to high intensity [greater than 50% basal area mortality]): “As snag basal area increased, home-range sizes exponentially decreased” (Tingley et al. 2014); “an average snag basal area > 17 meters squared per hectare may represent a benchmark for minimum habitat needs in postfire stands” (Tingley et al. 2014); “Our results, in combination with studies that have shown that black-backed woodpeckers are extremely sensitive to salvage logging (Hutto 2008, Saab et al. 2009), suggest that currently the best strategy for protecting black-backed woodpecker habitat is to maintain large patches of high snag densities (Dudley and Saab 2007, Russell et al. 2007)” (Tingley et al. 2014); “The average snag density of points with Black-backed Woodpeckers (30 m2/ha) was the highest of all species” (Siegel et al. (July 22) 2014); “The strength of the association of Black-backed Woodpeckers with unlogged postfire snag conditions makes it a useful indicator species for wildlife associated with this habitat.” (Hanson and North 2008)
Elevation is also an important consideration: “Elevation and snag density remain the
strongest two predictors of Black-backed Woodpecker occurrence at the point level” (Siegel et al. (July 22) 2014).
Foraging habitat/Roosting habitat: “Our past findings (Siegel et al. 2013) show that
Black-backed Woodpeckers in burned forests of California preferentially select larger, dead trees in more severely burned areas for foraging; our findings here extend those same habitat selection criteria to another aspect of Black-backed Woodpecker habitat selection: roosting habitat.” (Siegel et al. (July 16) 2014).
Food: “Black-backed Woodpeckers foraging in burned forests feed primarily on wood-
boring beetle larvae (Villard and Beninger 1993, Murphy and Lehnhausen1998, Powell 2000), although some studies have also reported or inferred foraging on bark beetle larvae (Lester 1980, Goggans et al. 1988). Bark beetles and wood-boring beetles share important life-history characteristics (both spend a prolonged portion of their life-cycle as larvae inside dead or dying trees) but also exhibit differences that may be important in their ecological interactions with Black-backed Woodpeckers. Bark beetles are small (generally <6 mm in length), numerous, often able to attack live trees, and generally remain as larvae in bark less than a year before emerging as adults (Powell 2000). In contrast, wood-boring beetles have much larger larvae (up to 50 mm long), are less numerous, and can remain as larvae in dead wood for up to three years (Powell 2000).
Case 1:15-cv-01329-WBS-EPG Document 34-4 Filed 10/30/15 Page 116 of 147

12
Additionally, most wood-boring beetles are unable to attack living trees, and concentrate heavily in fire-killed wood . . . .” (Siegel et al. (July 22) 2014).
Nesting habitat: “For the 31 nests, the mean number of snags/plot was 13.3 (SD ¼ 7.6,
range ¼ 1–29 snags/plot), whereas the mean number of snags on plots at randomly selected trees was 5.0 (SD ¼ 5.2, range ¼ 0–35 snags/plot). In both the Cub Fire and Moonlight Fire sites, black-backed woodpeckers preferred nest trees located in areas with high snag densities (Fig. 3).” (Seavy et al. 2012); “None of the cavities were re-used between years and each appeared to have been freshly excavated in the year of its use.” (Seavy et al. 2012); “For the 31 nest trees measured, the mean dbh was 33 cm (SD ¼ 7, range ¼ 18–50)” (Seavy et al. 2012);
Important Factors:
Colonization and extinction: “The average probability of colonization by Black-backed
Woodpeckers at a previously unoccupied point in any given year was modeled to be 6.5%, while the average probability that an occupied site would go extinct in any given year was 72%. The probability of extinction had no clear covariate relationships, with moderate support for negative relationships with increased burn severity – extinction occurred less frequently at survey points with greater burn severity. Colonization, however, had very strong relationships to two covariates. Colonization was more likely at early post-fire points and at points with higher densities of snags. The strong support for fire age as a covariate of colonization but not extinction implies a fundamentally different dynamic governing Black-backed Woodpecker occupancy than previously considered: Black-backed Woodpeckers do not necessarily abandon sites because they are too old, but that old sites are less likely to be colonized by constantly shifting woodpecker populations.” (Siegel et al. (July 22) 2014)
Home Range size: “we found that home-range size varied by an order of magnitude,
from 24.1 to 304.1 ha, as measured by movement-based kernel estimation” (Tingley et al. 2014); “Black-backed Woodpecker home ranges within our 3 fires varied by approximately an order of magnitude, and this variation was explained in large part by a single resource characteristic: mean snag basal area” (Tingley et al. 2014); “However, size appears to vary with habitat type and time since fire (Dudley and Saab 2007, Rota et al. 2014). As populations of wood-boring beetle larvae decrease during the years after fire (McCullough et al. 1998), it is believed that Black-backed Woodpeckers enlarge their home ranges before eventually abandoning individual burned areas altogether (Dudley and Saab 2007, Rota et al. 2014).” (Tingley et al. 2014)
Habitat Connectivity: There exists a large area in the central Sierra without significant
BBWO presence. (See maps at page 23-24 of Siegel et al. (July) 2014). This is relevant to the Sierra NF especially as it represents a potential serious gap in the range of the species.
Case 1:15-cv-01329-WBS-EPG Document 34-4 Filed 10/30/15 Page 117 of 147

13
CSO, Fisher and BBWO
These three species are collectively assessed in light of their association with dense mature conifer forest and their declining or rare status.
Trend of Habitat Condition: In light of the lack of fire on the landscape in this region,
the substantial salvage logging that still occurs on Forest Service and private land, the current desire by the Forest Service to avoid moderate and high severity fire (via mechanical treatments in unburned dense mature conifer forest), habitat conditions will likely deteriorate further.
Significant Stressors Leading to Trend: Reductions in stand density/canopy
cover/forest complexity/snags from mechanical treatments in unburned forest, fire suppression, and salvage logging.
None of the standards or guidelines in the Proposed Action would ensure that the ecological conditions necessary for persistence and viability of these species would be provided (and Strategies do not have any regulatory significance). To address the problem, proposed standards/guidelines are as follows:
1. Except where such trees pose an imminent hazard to publicly-maintained roads or
human structures, maintain large snags (15 inches dbh or greater) wherever they occur as they provide essential habitat.
2. When vegetation management occurs in CWHR 4M, 4D, 5M, 5D, or 6 conifer forest, canopy cover shall not be reduced by more than 10% and trees over 12 inches dbh shall not be removed. Hand thinning of trees up to 16 inches in diameter within 300 feet of homes or administrative structures is allowed, and elsewhere prioritize prescribed fire, managed wildland fire, active snag and downed log creation (via girdling and felling, e.g.), and logging road decommissioning/revegetation.
3. Maintain as unlogged (other than for hazard tree felling on ML 3,4, and 5 roads) at least 90% of the post-fire landscape that was pre-fire CWHR 4M, 4D, 5M, 5D, or 6 conifer forest, including at least 90% retention of pre-fire CWHR 4M, 4D, 5M, 5D, 6 conifer forest that experienced 50-100% basal area mortality in the fire (i.e., complex early seral forest). This 90% shall prioritize maintaining areas with the highest snag density. In addition, other than for hazard tree felling on ML 3,4, and 5 roads, 100% retention of pre-fire CWHR 4M, 4D, 5M, 5D, 6 conifer forest that experienced 50- 100% basal area mortality in the fire (i.e., complex early seral forest) shall be maintained within at least 1.5 km of California spotted owl core sites.
Additional Comments Regarding Old Forest, CESF, Fire, Ecological Integrity, and At-risk Species
The lack of specificity and precision as to old forests and complex early seral forest in the Proposed Action will only lead to confusion and likely harm to wildlife. The details are important because in the past the Forest Service has used general/generic language to argue, for
Case 1:15-cv-01329-WBS-EPG Document 34-4 Filed 10/30/15 Page 118 of 147

14
example, for logging post-fire early seral areas under the guise of more quickly returning the areas to “old forest.” That approach is not scientifically sound as it does not acknowledge that the journey is just as important as the destination in regard to forest succession (e.g., Donato et al. 2012). Old forest derives from early forest in the sense that important components, like snags, downed wood, shrubs, and natural heterogeneity (from natural regeneration) derive, in large part, from complex early seral forest (e.g., Swanson et al. 2011, DellaSala et al. 2014). Put another way, it does not make sense to achieve ecological integrity by destroying complex early seral forest to more quickly achieve old forest – instead, both are damaged ecologically in such an effort.
Similarly, the desired conditions and creation of broad fire zones within which to achieve these desired conditions are not in sync with conservation of wildlife that relies on mature conifer forest (burned and unburned). Thus, it is crucial that the Forest Service establish explicit standards and guidelines that conserve wildlife habitat, especially a) dense, closed-canopy, complex green forest and b) high snag density, complex, post-fire forest. Again, examples of such standards/guidelines are ones that explain how both unburned and burned conifer forest that is/was CWHR 4M, 4D, 5M, 5D, or 6 will be protected for species like owls, fisher, and woodpeckers.
Unfortunately, there also continues to be a generic argument that severe fire is to blame for loss of old forest. There is no basis for this argument as severe fire is currently in a deficit in the Sierras and is especially lacking on the Sierra, Sequoia, and Inyo Forests. Severe fire is also not an either/or. For many species, while severe fire changes their landscape, it can nonetheless continue to provide key habitat, albeit in a different form. For example, California spotted owls have been found, on the Sequoia National Forest after the McNally Fire, to preferentially select the mature conifer forest that burned severely for their foraging needs. Similarly, fishers have been found on the Sequoia National Forest to use severely burned mature conifer forest (Hanson 2013). And, of course, many species, such as the black-backed woodpecker, rely on these severely burned forests for high quality habitat, and are keystone species in that they create cavities for other birds and animals to use down the line (Manley and Tarbill 2012, Tingley et al. 2014, Siegel et al. 2014a, 2014b). In fact, many of the fires that the Forest Service points to as being uncharacteristic are fires that have been found to support great biodiversity, except in or near to areas where salvage logging has occurred – e.g., the Angora, the Storrie, the Moonlight, the McNally. There is strong evidence for this, namely, Bond et al. 2009, 2013; Buchalski et al. 2013; Burnett et al. 2010, 2012; Hanson and North 2008; Hanson 2013; Malison and Baxter 2010; Manley and Tarbill 2012; Seavey et al. 2012; Siegel et al. 2011, 2013, 2014a, 2014b. Thus, again, it is essential, in order to meet NFMA’s best available science standard, in order to meet NFMA’s ecological integrity standard, in order to ensure viability per NFMA, in order to protect at-rick species per NFMA, that standards and guidelines be set forth that protect both unburned and burned mature conifer forest such as what we have proposed.
Also neglected is the fact that conifer forests of the Sierra Nevada rely on fire of all severities to maintain ecosystem integrity and wildlife diversity, but currently, Sierra forests are in an extreme fire deficit of all severities. (See, e.g., Miller et al. 2012, Odion and Hanson 2013, Mallek et al. 2013, Hanson and Odion 2014, Odion et al. 2014, Baker 2014.) This fire deficit means that, generally speaking, when fires do occur in the Sierras, they are restorative events because they
Case 1:15-cv-01329-WBS-EPG Document 34-4 Filed 10/30/15 Page 119 of 147

15
return fire and its ecological value to the landscape, providing, for example, essential (and very rare) wildlife habitat (see, e.g., Bond et al. 2009, 2013; Buchalski et al. 2013; Burnett et al. 2010, 2012; Hanson and North 2008; Malison and Baxter 2010; Manley and Tarbill 2012; Seavey et al. 2012; Siegel et al. 2011, 2013, 2014a, 2014b, Tingley et al. 2014). In addition, because they burn in a mosaic of severities, fires increase forest heterogeneity at multiple scales (stand, watershed, and landscape scales, for example), an outcome that the Forest Service often states it desires (and thus should welcome). And, contrary to assumptions, large, high-severity fire patches are not homogenous—rather, they can contain stand level heterogeneity because they vary in size and importantly, contain within them high levels of variation in regard to post-fire vegetation and snags.
Mallek et al. (2013, Table 3), found in its results that we now have less low, moderate, and high- severity fire than we did historically in the Sierra Nevada, and estimated that we have a little over half as much high-severity fire now compared to historical levels in the following forest types: oak woodlands, dry mixed conifer, moist mixed conifer, yellow pine, and red fir (8,693 hectares annually now versus 15,569 hectares historically (see AAHS = annual area of high- severity fire, Table 3 of Mallek et al. 2013)). However, it is important to note that Mallek et al. was based upon a modeling assumption of only 6% high-severity fire effects in historical mixed- conifer and yellow pine forests, borrowing from a similar modeling assumption in Stephens et al. (2007). The empirical studies that Mallek et al. (2013, Table 2) used for all other historical fire parameters, such as Beaty and Taylor (2001) and Bekker and Taylor (2001), concluded that historical high-severity fire percentages in these forest types were generally in the range of 20- 35% (and often higher). Thus, while even Mallek et al. (2013) found significant deficits of all severities of fire, it greatly underestimates the magnitude of the current deficit of high-severity fire (see also Baker 2014, Odion et al. 2014).
The fire deficit has resulted in a deficit of post-fire wildlife habitat. In other words, even setting aside salvage logging for the moment, there is already a substantial deficit of post-fire wildlife habitat in the Sierras due to the lack of all severities of fire on the landscape. There is no basis, therefore, for the assertion that fire/burned forest is the threat to old forest when in fact there is an extreme deficit of fire/burned forest and when it does occur, the Forest Service logs substantial portions of it.
Current plan direction has promoted salvage logging, with no limitations (other than LOPs and minimal retention [e.g. 4-6 snags per acre]) in complex early-seral habitat, to the detriment of owls, woodpeckers and myriad other species found, post-fire, over time, in severely burned areas. For example, Siegel et al. (2011) explains that not only black-backed woodpeckers, but many other species, are utilizing complex early seral forest left unlogged: “Many more species occur at high burn severity sites starting several years post-fire, however, and these include the majority of ground and shrub nesters as well as many cavity nesters. Secondary cavity nesters, such as swallows, bluebirds, and wrens, are particularly associated with severe burns, but only after nest cavities have been created, presumably by the pioneering cavity-excavating species such as the Black-backed Woodpecker. Consequently, fires that create preferred conditions for Black-backed Woodpeckers in the early post-fire years will likely result in increased nesting sites for secondary cavity nesters in successive years.” Similarly, Burnett et al. (2012) found that “while some snag associated species (e.g. black-backed woodpecker) decline five or six years
Case 1:15-cv-01329-WBS-EPG Document 34-4 Filed 10/30/15 Page 120 of 147

16
after a fire [and move on to find more recent fire areas], [species] associated with understory plant communities take [the woodpeckers’] place resulting in similar avian diversity three and eleven years after fire (e.g. Moonlight and Storrie).” Burnett et al. (2012) also noted that “there is a five year lag before dense shrub habitats form that maximize densities of species such as Fox Sparrow, Dusky Flycatcher, and MacGillivray’s Warbler. These species have shown substantial increases in abundance in the Moonlight fire each year since 2009 but shrub nesting species are still more abundant in the eleven year post-burn Storrie fire. This suggests early successional shrub habitats in burned areas provide high quality habitat for shrub dependent species well beyond a decade after fire.” And Manley and Tarbill (2012) found, in the post-fire area of the Angora fire, that woodpeckers play a keystone role that can only be accomplished when post-fire habitat is maintained, not logged:
Although woodpecker species differed in their influence on recovery of birds and small mammals, all three species observed in our study played an important role in supporting the cavity-dependent community through habitat creation for nesting, resting, denning, and roosting. The Black-backed Woodpecker was a significant contributor to the establishment of bird and small mammal species and communities in areas with high burn intensities, and it appeared to have a more narrow range of suitable habitat conditions for nest site selection compared to the Hairy Woodpecker. Thus, the habitat requirements of the Black-backed Woodpecker serve as a useful threshold for managing burned sites for wildlife recovery.
It is therefore imperative that Plans, as required, establish plan components, including standards or guidelines, to conserve the ecological integrity of post-fire, complex early seral habitat, especially the key characteristics, such as high snag density, extensive shrub cover, downed wood, and natural conifer regeneration.
New literature continues to demonstrate our points. Baker 2014 – “Historical forest structure and fire in Sierran mixed-conifer forests reconstructed from General Land Office survey data” – using a large historical U.S. government field data set, and employing an extensively accuracy- checked method to infer past fire intensity patterns from forest structure in this field data from the mid/late-1800s, combined with extensive additional cross-checking against spatially-explicit U.S. government fire intensity mapping from the late 1800s, determined the following: a) historical ponderosa pine and mixed-conifer forests had far more variability in forest density and composition than has previously been assumed based upon spatially-limited data sets, and most forests were denser than previously assumed; b) the historical fire regime was mixed-intensity, with an average of 31-39% high-intensity fire effects, and 13-26% low-intensity fire (with the remainder mixed); c) high-intensity fire rotation intervals were 281-354 years in these forests (much shorter than current rotation intervals); and d) high-intensity fire patches over 200 hectares were common in historical ponderosa pine and mixed-conifer forests of the western Sierra Nevada, with a number of patches over 1,000 hectares, and some as large as approximately 8,000 to 9,000 hectares. This new paper demonstrates further that the Forest Service’s generic assumptions about historical forest density and fire severity, and appropriate current forest density and fire severity, are misinformed and must be revisted especially in light of the importance of dense mature conifer forest to wildlife.
Case 1:15-cv-01329-WBS-EPG Document 34-4 Filed 10/30/15 Page 121 of 147

17
In Hanson 2014, “Conservation concerns for Sierra Nevada birds associated with high-severity fire,” the analysis found that all of the native Sierra Nevada birds positively associated, in the published scientific literature, with post-fire habitat created by high-intensity fire, and which have statistically significant population trends (Breeding Bird Survey), are experiencing persistent and ongoing declines. These declines of high-intensity fire associates are affecting all nesting guilds, including cavity nesters, canopy nesters, and shrub/ground nesters, the latter of which comprised the largest number of declining species. The study identified post-fire logging, and subsequent removal/eradication of native shrubs (through mechanical means and spraying of toxic herbicides) and artificial conifer plantation establishment, as well as ongoing fire suppression and mechanical thinning designed to further suppress fire, as serious threats and recommended a major change in current management direction to conserve these species and their habitat. This new published science shows that in addition to the black-backed woodpecker, which is slated to become a Species of Conservation Concern, additional species that rely on post-fire habitat should also be designated Species of Conservation Concern.
In DellaSala et al. 2014. “Complex early seral forests of the Sierra Nevada: what are they and how can they be managed for ecological integrity?” the authors synthesized and summarized the existing scientific literature, and recommended that “Complex Early Seral Forest” (CESF) be recognized as an ecologically distinct forest habitat type, and that CESF should be mapped and monitored, and protected from post-fire logging. The authors also found that the Black-backed Woodpecker should be designated as a Species of Conservation Concern under the revised forest plans, due to its extreme rarity and vulnerability to further fire suppression and post-fire logging operations. Additionally, the authors recommended an expansion of mixed-intensity managed wildland fire to restore CESF on the landscape, given that the current science shows CESF to be in a substantial deficit relative to historical levels. This study provides important guidance for the Forest Service as to CESF.
This new science, and the many studies we have presented already, should not be brushed aside – they are directly relevant to the issues at stake and go to the heart of how to plan for the future. It is therefore imperative that the Forest Service not continue to arbitrarily pick and choose what to incorporate into the plan revision process. Doing do is illegal, but just as importantly, it violates the integrity of the process and the ability of the public to understand fully the situation and what is at stake.
In light of the fact that most of our comments have not been incorporated or addressed thus far, we reiterate some of them here again:
In order to achieve more fire on the Sierra landscape, the Forest Service can do the
following:
o Identify constraints on prescribed fire and managed wildland fire (e.g., air quality; personnel availability; monetary resources; weather windows);
o Set guidelines to assist in avoiding the identified constraints;
Case 1:15-cv-01329-WBS-EPG Document 34-4 Filed 10/30/15 Page 122 of 147

18
o Remove all currently existing Plan restrictions (e.g., restrictions on the use of managed wildland fire outside of Wilderness) that prohibit or inhibit managed wildland fire or prescribed fire and instead set guidelines for how to achieve more prescribed fire and managed wildland fire;
o Increase education regarding effective home protection from fire and, in regard to
protecting human communities from fire, focus resources on making homes and structures fire resilient; For example, Gibbons et al. 2012 found that defensible space work within 40 meters [about 131 feet] of individual homes effectively protects homes from wildland fire. The authors concluded that the current management practice of thinning broad zones in wildland areas hundreds, or thousands, of meters away from homes is ineffective and diverts resources away from actual home protection, which must be focused immediately adjacent to individual structures in order to protect them.
In order to maintain the ecological value of fire:
o In addition to prohibiting salvage logging as described above, the Forest Service
should acknowledge and promote the importance of natural regeneration. Post- fire areas that are manipulated by salvage logging and/or by reforestation efforts are, from an ecological perspective, no longer as valuable as post-fire areas; rather, post-fire salvage logging and reforestation substantially reduce, and often locally eliminate, wildlife species strongly associated with the forest habitat created by moderate and high-severity fire patches (Hanson and North 2008, Hutto 2008, Burnett et al. 2011, 2012, Seavy et al. 2012, Siegel et al. 2012, 2013). Time since fire also provides important insights into the need to protect post-fire areas from manipulation. There is a continuum of use of post-fire areas over time by different species. Black-backed woodpeckers, for example, are well known to require areas with very high snag densities immediately post-fire – i.e., mature forest that has very recently experienced higher-severity fire, and has not been salvage logged (Hanson and North 2008, Hutto 2008, Saab et al. 2009, Seavy et al. 2012, Siegel et al. 2010, 2011, 2012, 2013). However, “while some snag associated species (e.g. black-backed woodpecker) decline five or six years after a fire [and move on to find more recent fire areas], [species] associated with understory plant communities take [the woodpeckers’] place resulting in similar avian diversity three and eleven years after fire (e.g. Moonlight and Storrie).” (Burnett et al. 2012). Burnett et al. (2012) also noted that “there is a five year lag before dense shrub habitats form that maximize densities of species such as Fox Sparrow, Dusky Flycatcher, and MacGillivray’s Warbler. These species have shown substantial increases in abundance in the Moonlight fire each year since 2009 but shrub nesting species are still more abundant in the eleven year post- burn Storrie fire. This suggests early successional shrub habitats in burned areas provide high quality habitat for shrub dependent species well beyond a decade after fire.” (Burnett et al. 2012). Raphael et al. (1987) found that at 25 years after high-severity fire, total bird abundance was slightly higher in snag forest than in unburned old forest in eastside mixed-conifer forest of the northern Sierra
Case 1:15-cv-01329-WBS-EPG Document 34-4 Filed 10/30/15 Page 123 of 147

19
Nevada; and bird species richness was 40% higher in snag forest habitat. In earlier post-fire years, woodpeckers were more abundant in snag forest, but were similar to unburned forest by 25 years post-fire, while flycatchers and species associated with shrubs continued to increase to 25 years post-fire (Raphael et al. 1987). In ponderosa pine and Douglas-fir forests of Idaho at 5-10 years post-fire, levels of aquatic insects emerging from streams were two and a half times greater in high- severity fire areas than in unburned mature/old forest, and bats were nearly 5 times more abundant in riparian areas with high-severity fire than in unburned mature/old forest (Malison and Baxter 2010). Schieck and Song (2006) found that bird species richness increased up to 30 years after high-severity fire, then decreased in mid-successional forest [31-75 years old], and increased again in late-successional forest [>75 years]).
o It is imperative that “salvage” logging not be equated with ecological restoration,
or forest management objectives other than economically-motivated multiple use. Post-fire landscapes, especially post-moderate/high severity fire landscapes, must be
acknowledged as creating high bio-diversity and essential habitat for many species (e.g., Raphael et al. 1987, Burnett et al. 2010, Burnett et al. 2012, Hanson and North 2008, Hutto 2008, Saab et al. 2009, Swanson et al. 2011, Seavy et al. 2012, Buchalski et al. 2013, Siegel et al. 2010, 2011, 2012, 2013, 2014). For example, in the Moonlight Fire area, researchers explained that “[i]t is clear from our first year of monitoring three burned areas [Cub, Moonlight and Storrie Fires] that post-fire habitat, especially high severity areas, are an important component of the Sierra Nevada ecosystem.” (Burnett et al. 2010). They also found that “[o]nce the amount of the plot that was high severity was over 60% the density of cavity nests increased substantially,” and that “more total species were detected in the Moonlight fire which covers a much smaller geographic area and had far fewer sampling locations than the [unburned] green forest.” (Burnett et al. 2010);
Regarding fire size and fire intensity trends in the Sierras, Hanson and Odion (2014)
conducted the first comprehensive assessment of fire intensity since 1984 in the Sierra Nevada using 100% of available fire intensity data, and using Mann-Kendall trend tests (a common approach for environmental time series data – one which has similar or greater statistical power than parametric analyses when using non-parametric data sets, such as fire data). They found no increasing trend in terms of high-intensity fire proportion, area, mean patch size, or maximum patch size. Hanson and Odion checked for serial autocorrelation in the data, and found none, and used pre-1984 vegetation data (1977 Cal Veg) in order to completely include any conifer forest experiencing high- intensity fire in all time periods since 1984 (the accuracy of this data at the forest strata scale used in the analysis was 85-88%). Hanson and Odion also checked the results of Miller et al. (2009) and Miller and Safford (2012) for bias, due to the use of vegetation layers that post-date the fires being analyzed in those studies. Hanson and Odion found that there is a statistically significant bias in both studies (p = 0.025 and p = 0.021, respectively), the effect of which is to exclude relatively more conifer forest experiencing high-intensity fire in the earlier years of the time series, thus creating the false appearance of an increasing trend in fire severity. Miller et al. (2012a), acknowledged the potential
Case 1:15-cv-01329-WBS-EPG Document 34-4 Filed 10/30/15 Page 124 of 147

20
bias that can result from using a vegetation classification data set that post-dates the time series. In that study, conducted in the Klamath region of California, Miller et al. used a vegetation layer that preceded the time series, and found no trend of increasing fire severity. Miller et al. (2009) and Miller and Safford (2012) did not, however, follow this same approach. Hanson and Odion also found that the regional fire severity data set used by Miller et al. (2009) and Miller and Safford (2012) disproportionately excluded fires in the earlier years of the time series, relative to the standard national fire severity data set (www.mtbs.gov) used in other fire severity trend studies, resulting in an additional bias which created, once again, the inaccurate appearance of relatively less high-severity fire in the earlier years, and relatively more in more recent years.
Resilience requires reestablishing the ecological disturbances that forests and wildlife
evolved with. For example, wildlife evolved with fire, not mechanical treatments, and therefore resilience is achieved through management that seeks to put fire back on the landscape such as via prescribed fire and managed wildland fire. Mechanical thinning, on the other hand, does not mimic natural wildlfire and can eliminate or reduce the value of mature forest habitat by eliminating or reducing structural complexity (which many rare wildlife species preferentially selects for). Structural complexity is key for species like the California spotted owl, Pacific fisher, and black-backed woodpecker, and therefore, mechanical thinning, when used in dense mature forest habitat, can eliminate or reduce the value of that habitat for these species, and reduce ecological resilience (see, e.g., Zielinski et al. 2006, Purcell et al. 2009, Bond et al. 2009, Hanson 2013).
B. Riparian and Aquatic Areas
It is essential that riparian areas receive utmost attention and protection in the Plan revision process in light of the many species associated with it, including rare and imperiled frogs, toads, and fish.
Even where wildfire burns in riparian areas with sometimes high severity—a completely natural occurrence in the Sierra Nevada (Frissell et al. 2012) – it is fully compatible with ecological restoration and aquatic species recovery. Roads on the other hand intrinsically bring a host of harms to water quality and wildlife habitat (e.g., Trombulak and Frissell 2000, Gucinski et al. 2001), hence reconfiguration of existing forest road networks has been long recognized by the Forest Service and the scientific community as absolutely central for restoration and recovery of a broad range of ecosystem values and species (Pacific Rivers Council 2010, and sources therein, Switalski et al. 2004). If the Proposed Action passively affirms existing roads as, e.g., essential for wildfire management, without meaningful consideration of and accounting for the multitude of harms those roads cause by virtue of location, design, condition, and management, this is not a defensible action. It is critical for the Forest Service to recognize that many existing roads are highly undesirable both with regard to the many environmental consequences, and with regard to allowing wildfire to “burn in its characteristic pattern” on the landscape (Morrison 2007). Alternative road locations and lower-density, better-managed road networks can serve environmental and watershed restoration, wildfire management, and forest restoration purposes far better than existing roads (Pacific Rivers Council 2010, McCaffrey et al. 2007, Switalski et al. 2004). This needs to be front and center in forest plans for the Sierra Nevada, and because the
Case 1:15-cv-01329-WBS-EPG Document 34-4 Filed 10/30/15 Page 125 of 147

21
environmental consequences of roads are so manifest, it must be recognized and operationalized in planning. The Forest Service needs to aggressively seek out opportunities for realigning and downsizing existing road networks to better serve all affected purposes and needs—not just fire management, or any other single action (Pacific Rivers Council 2012). Furthermore, after large wildfires, reconfiguration of the road system, including decommissioning and drainage improvement, are among the most urgent and effective of post-fire management actions (Beschta et al. 2004)
The Forest Service, at Standard 1 (p. 45), prescribes using “creeks” as fire control lines. This is a bad idea that poses high risks to water quality and aquatic resources. If managing fire control lines includes the usual suite of actions, including cutting snags, removing understory vegetation, scraping soil surfaces to reduce ground fuel continuity, digging firelines, and applying fire retardant, this standard is highly likely to result in severe, direct impact to riparian and near- stream vegetation and soils, with resultant adverse impacts to aquatic habitat and biota. This level of disturbance, particularly of soils but also of vegetation from fire suppression actions often exceeds the intensity and persistence of impacts caused by fire alone (Beschta et al. 2004). The manipulation of vegetation and soils in streamside areas, wetlands, and “creeks” for fire control purposes would prevent these important habitats from achieving their ecological outcomes. Slopes, riparian vegetation, seasonal wetlands within 100 m of surface channels, ponds, wetlands, and lakes should not be actively managed as fire control boundaries. However, passive reliance on streams, lakes and wetlands as fire control zones, without direct manipulation of soils and vegetation to control fire activity, is certainly acceptable.
Recognizing recharge areas for segments of designated and eligible wild and scenic rivers is good step forward from existing policy. Per number 5, conservation of biological diversity and recovery of native species should be recognized among the vital ecosystem services of watersheds. This will better integrate protection of watershed functions and water quality with the biological elements of the Aquatic/Riparian Ecosystems and Streams criteria.
Monitoring is absolutely necessary to attain most of the goals identified in this section of the document, yet there is no reference to monitoring of watershed and water quality conditions here. The scope and objectives of monitoring need to be identified relative to assuring that desired conditions are being attained and standards are being met, but it is equally important to identify triggering criteria that tie monitoring results to decisions on agency actions. The feedback loop from monitoring results to action decisions must essentially recognize the intrinsic time lags and potentially irreversible harms can result from some actions and conditions, and therefore they should be specifically structured to avoid the accrual of time-lagged and catchment-wide cumulative impacts.
While flooding and drought are of course important (and it’s excellent that flooding is specifically recognized here), natural forest disturbances, including fire, insects and disease outbreaks, and windthrow are also expected and key elements shaping ecosystem and habitat dynamics in watersheds, riparian, and streams. Disturbances of vegetation, soils, and hydrologic processes, whether they are expressed as fine-grained, smaller scale dynamics, or as coarse- grained influences at larger scales of the landscape, are known to be vital in contributing to and sustaining the long-term structural and functional complexity of physical and biological systems
Case 1:15-cv-01329-WBS-EPG Document 34-4 Filed 10/30/15 Page 126 of 147
22
in riparian areas and streams (PRC 2012, Malison and Baxter 2010, Rhodes 2007, Bisson et al. 2003, Minshall et al. 1997, Reeves et al. 1995). Hence it is a critical oversight to not include maintaining and restoring the natural role of fire and other disturbances in sustaining riparian and stream ecosystem conditions and functions. This should be rectified. It is also important to recognize that many, perhaps most of these habitats are moderately to severely degraded by past multiple forest uses including grazing, mining, logging, roads, changes in wildlife and associated herbivory and trophic influences, and in some cases, fire suppression. Therefore “retention” of their present values and functions is far from sufficient; management must be designed to passively and, where needed, actively restore these values and functions.
Frissell et al. (2014) offers a wide range of argument and scientific citation to support the need to increase the spatial extent of riparian management and conservation areas, and narrow the range of actions allowed within these areas, so that persistence and restoration of natural processes that produce passive restoration of aquatic and riparian functions and values can be ensured.
Strategy 6 appears designed to facilitate harmful practices in sensitive riparian areas, with the assumption that such practices will occur and that their adverse effects should be “considered.” This strategy offers no real protection for streams and aquatic ecosystems, and in fact undermines some protections that are extant under current plans.
Mechanized treatments in riparian areas can disturb vegetation and soils in close proximity to surface waters, where the risk of sediment delivery and other impacts is demonstrably high (Rashin et al. 2006, Dwire et al. 2010). Logging activity that disturbs soils within riparian buffers can also reduce the buffer’s effectiveness to retain sediment and nutrients delivered from upslope sources. Thinning or other disturbance of coniferous or deciduous trees and shrubs within riparian and wetland areas can cause decades of diminished summer low flows (after an initial few years during which low flows may increase), as a consequence of increased water demand by rapidly re-growing vegetation (Hicks et al. 1991, Moore and Wondzell 2005). In addition, thinning and yarding of logs from near-stream areas requires or encourages the construction of roads in close vicinity to streams, where the likelihood of sediment delivery and other impact from roads is increased (Luce et al. 2001).
Mechanized thinning and fuels operations usually require higher-density road access to be feasibly implemented (Rhodes 2007). Mechanical treatments for fuels reduction are particularly problematic because recurring entries at roughly 10-year intervals are necessary to sustain the desired conditions (Martinson and Omi 2013); such a forest management regime strongly favors, if not requires, a permanent, high-density road network. Many thinning projects involve road and landing construction and reconstruction, as well as elevated haul and other use of existing roads, all of which significantly contribute to watershed and aquatic degradation. Even if constructed roads and landings are deemed “temporary,” their consequent impacts to watersheds and water bodies are long lasting or permanent. The hydrological and ecological disruptions of road systems and their use (Jones et al. 2000, Trombulak and Frissell 2000, Gucinski et al. 2001, Black et al. 2013), exacerbated by other effects of vehicle traffic, will likely outweigh any presumed restorative benefit to streams and wetlands accruing from thinning and fuels reduction. In recent years, the prospect of future thinning or fuels reduction projects often has become the basis for the USFS or BLM to avoid or delay decommissioning environmentally harmful roads,
Case 1:15-cv-01329-WBS-EPG Document 34-4 Filed 10/30/15 Page 127 of 147

23
even when fiscal resources were available for the work. Prescribed fire without extensive mechanical treatment is of much less concern, as it is more feasible to apply in sparsely-roaded wildlands, entails far less soil disturbance, and if conducted in proper times and places it can more adequately mimic the ecological effects of natural wildfire.
Strategy 8 (p.5) for meadows is very weakly formulated. It mentions prioritization and use of best available science, but says nothing that describes the existing condition of meadows or mandates how and why they should be restored. Without a recognition of their current condition, threats, and restoration needs and opportunities, language about prioritization is disembodied, uninformed, and unlikely to lead to material benefit to meadow-dependent natural resources. PRC (2012) provides active and specific strategic language to address meadow protection and restoration in the Sierra Nevada.
Strategy 13 (p.52) states “consider opportunities to manage vegetation in upland areas to restore and maintain water tables. Consider the latest science.” Does this strategy refer to ongoing research primarily by UC Merced into the hypothesis that stream flows might increase in response to aggressive forest thinning? The Forest Service needs to recognize the long history of scientific inquiry into this hypothesis, and the fact that science has rejected this hypothesis as a feasible means of increasing water supply through forest management (Rhodes and Purser 1998, Rhodes 2007). Claims of increased water yield from forest harvesting are always complicated by several generally recognized hydrologic factors, including that partial vegetation removal results in increased water use (and growth) by remaining vegetation, transient benefits of increase base flow that is lost or reversed as forests rapidly regrow after thinning, the fact that most increased flow is realized under peak flow conditions where it is more likely to contribute to flooding than to sustained streamflow or water supply, and that increased erosion and sediment caused by the vegetation reduction actions and road networks and road use necessary to sustain them pollutes the resulting streamflows, and this pollution often far outlasts any flow benefit. It is grossly insufficient to consider “that latest science,” when a large body of extant science illuminates the problems with the notion that logging can produce streamflow or “water table” benefits. The “best available scientific information” must be considered.
Standard 1 (p.52) establishes some dimensions for riparian management areas to provide protection of streams and other surface waters from upslope management actions. Frissell (2014) provides a recent review of available literature pertaining to riparian forest buffer distances needed to mitigate the effects of various upslope disturbances. The proposed distances are inadequate for protection of seasonally flowing streams. Moreover, the inner gorge slope break should not itself be the boundary of the protection zone. Uncertainty as to the exact topographic slope break location, and vulnerability of this convex slope location to erosion and slope failure means that the inner gorge slope break should itself be buffered by an additional 150 to 300 feet. This is a necessity to guard against erosion increases in this highly sensitive part of the landscape, where any erosion stands a high chance of contributing sediment or blockages to streams.
The freshwater fauna of California has been severely affected by water and land use, as well as fish stocking and introduction and invasion by nonnative species. Numerous species are recognized as in states of decline, endangerment, or increased vulnerability to future
Case 1:15-cv-01329-WBS-EPG Document 34-4 Filed 10/30/15 Page 128 of 147

24
endangerment as a result of past actions and ecosystem changes. Public lands will play a crucial role in determining the future of many of these species, even some that historically occurred predominantly in lower-elevation lands and waters in non-federal ownership. To fulfill the mandates of the National Forest Management Act, Endangered Species Act, and/or Clean Water Act, forest plans should establish a framework and standards for forest and rangeland management that by design ensures protection and recovery of endangered, threatened, sensitive aquatic and riparian species. Deferral of strategic conservation actions to consultations and recovery planning for individual species and locations is unwise and costly, ineffective then previous or ongoing programmatic determinations cause repeated or widespread conflict with conservation needs, and can lead to actions that harm one sensitive species with the intent of benefitting another. Because the fate of aquatic species is determined by the status and condition of aquatic habitats, and in turn aquatic habitats are strongly determined by conditions and actions of land and water use across the whole watershed, aquatic species conversation begins and is very strongly determined by programmatic decisions about land use, water use, and transportation systems across the national forests, and on other ownerships in a watershed.
PRC (2012) summarized the presence of known endangered, threatened, special concern, and sensitive fishes and amphibians in Sierra Nevada national forests. It is disconcerting that few of these species are mentioned or even generally considered in the Detailed Proposed Action document as warranting special or specific attention in forest plans. The Yosemite toad and yellow-legged frog received brief mention in the Scoping document, but the remaining some two dozen fish and amphibian species were not mentioned either specifically or in aggregate. The PRC document offers the following information about the occurrence of fish and amphibian species in the three forests included in this Scoping:
Inyo National Forest:
Owens pupfish Cyprinodon radiosus Owens speckled dace Rhinichthys osculus ssp. Owens tui chub Gila bicolor snyderi Owens Valley web-toed salamander Hydromantes sp. Kern Plateau salamander Batrachoseps robusts
Inyo Mountains salamander Batrachoseps campi
Yosemite toad Bufo canorus Mountain yellow-legged frog Rana muscosa
Sierra Nevada yellow-legged frog Rana sierrae
Yosemite toad Anaxyrus canorus (Bufo canorus)
Sequoia National Forest:
Little Kern golden trout Oncorhyncus mykiss whitei
Kern River rainbow trout Oncorhynchus mykiss gilberti
Kern brook lamprey Lampetra hubbsi Pacific lamprey Lampetra tridentate tridentate Riffle sculpin Cottus gulosus Sacramento hitch Lavinia exilicauda exilcauda
Case 1:15-cv-01329-WBS-EPG Document 34-4 Filed 10/30/15 Page 129 of 147

25
Sacramento tule perch Hysterocarpus traski traski San Joaquin roach Lavinia symmetricus spp. Kern Plateau salamander Batrachoseps robusts Kern Canyon slender salamander Batrachoseps simatus Inyo Mountains salamander Batrachoseps campi (uncertain presence?) Breckenridge Mt. slender salamander Batrachoseps spp. (possibly extinct) Tehachapi slender salamander Batrachoseps stebbinsi Mountain yellow-legged frog Rana muscosa
Sierra National Forest:
Kern brook lamprey Lampetra hubbsi Pacific lamprey Lampetra tridentate tridentate Riffle sculpin Cottus gulosus Sacramento hitch Lavinia exilicauda exilcauda
Sacramento tule perch Hysterocarpus traski traski
San Joaquin roach Lavinia symmetricus spp. Limestone salamander Hydromantes brunus
Sierra Nevada yellow-legged frog Rana sierrae
Yosemite toad Anaxyrus canorus (Bufo canorus)
On p. 28 of the Detailed Proposed Action document the Forest Service states with regard to the federally listed Yosemite toad, mountain yellow-legged frog, and Sierra yellow-legged frog that “Current forest plan direction specific to these species will be retained.” Considering that inadequacy of current forest plan direction and past national forest management and monitoring actions for conservation of these two species on national forests lands were identified by the US Fish and Wildlife Service as factors threatening the species (USFWS 2014, identified threats include grazing, logging, mining, dams and diversions, fuels and fire management, and inadequate monitoring on national forest lands), this is inadequate. Forest plans should by design incorporate goals, strategies, and standards necessary to ensure conservation and promote recovery of listed species, in keeping with the best available scientific information pertinent to these.
In addition to the species identified above, the most widespread fish species of concern in streams and rivers throughout the three forests is the native rainbow (Moyle et al. 2011 and references therein). Its status remains uncertain because of the lack of genetic surveys and a partly unknown history of fish stocking and possible introductions of non-native rainbow trout stocks in the project area. However, in general, like other salmonids, rainbow trout are highly likely to be adversely affected by post-fire logging and road construction/road operations (Beschta et al. 2004, Karr et al. 2004). Forest plans must explicitly account for the potential effects of salvage logging and road construction on retention and future formation of near-surface groundwater and channel and valley conditions conducive to hyporhic flows. Conversely, true active restoration measures that reduce impacts of existing roads and stream crossings could prioritize these locations and benefit trout and other coldwater species in the post-fire environment.
Case 1:15-cv-01329-WBS-EPG Document 34-4 Filed 10/30/15 Page 130 of 147

26
In addition to vertebrates, there is information about historical and present day occurrence of aquatic invertebrates such as mussels (PRC 2012 p.59, Howard 2010, Nedeau et al. 2009, Lydeard et al. 2009, Mehlhop and Vaughan 1994, Williams et al. 1993). Scientific information not only indicates large and lasting declines from historical distribution and abundance of mussel species, but helps point out where relict populations remain that clearly must be prioritized for conservation if declines are to be stemmed and reversed. Forest plans should at least identify general criteria and standards for protection and restoration that will apply in the areas where known populations remain.
Although not specifically cited in the Scoping documents as a basis for actions, in the Sierra Nevada Forests hydrophobicity of soils is commonly cited as a justification for post-fire logging. Because it is routinely cited to justify risky post-fire salvage logging in the face of scientific literature that advises against such actions, this subject should be addressed in the forest plans.
Any assessment of existing or potential future occurrence of hydrophobic (aka water repellant) soils must do so within the framework of six critical contexts. First, fire, even when it is of high severity, does not consistently cause hydrophobicity (Beschta et al. 2004). Second, field evidence demonstrates that hydrophobicity in forest soils occurrence is commonly unrelated to fire (Doerr et al. 2009). Regarding the occurrence of these soils, Doerr et al. (2009) noted:
[H]igh levels of repellency have also been reported under vegetation types not affected by fire, and the question arises to what degree the water repellency observed at burnt sites actually results from fire…‘Natural background’ water repellency… was detected…at 75% of all sites examined irrespective of dominant tree species (Pinus ponderosa,Pinus contorta, Picea engelmanii and Pseudotsuga menziesii). These findings demonstrate that the soil water repellency commonly observed in these forest types following burning is not necessarily the result of recent fire but can instead be a natural characteristic. The notion of a low background water repellency being typical for long unburnt conifer forest soils of the north-western USA is therefore incorrect. It follows that, where pre-fire water repellency levels are not known or highly variable, post-fire soil water repellency conditions are an unreliable indicator in classifying soil burn severity.
These findings indicate that burn severity is an unreliable predictor of hydrophobic soils and that the existence of hydrophobic soils after fire cannot be reliably ascribed to fire impacts.
Third, post-fire hydrophobic soil conditions are transient, abating once soils are wetted, sometimes lasting only a few months, and seldom lasting more than two years. Hydrophobicity declines with time and moisture content.
Fourth, in contrast to hydrophobic soils, reductions in infiltration rates due to compaction on roads and landings are highly persistent, never recovering for as long as roads and landings exist. Even several years after subsoiling, infiltration rates remain severely reduced relative to undisturbed soils (Foltz et al, 2007). Reductions in infiltration rates due to compaction by grazing are also highly persistent (CWWR, 1996; USFS and USBLM, 1997; Beschta et al., 2004; 2012). Infiltration rates are unlikely to begin to recover until grazing is ceased.
Case 1:15-cv-01329-WBS-EPG Document 34-4 Filed 10/30/15 Page 131 of 147

27
Fifth, available data indicate that grazing and roads not only reduce infiltration rates more persistently than fire sometimes might, but that grazing and roads cause far larger reductions in infiltration rates than do hydrophobic soils. Severe fire can temporarily reduce infiltration rates by about 50% if hydrophobic soils develop in response to fire (Wondzell and King, 2003). In contrast, grazing and roads persistently reduce infiltration rates by about 85% and 95-99%, respectively. Due to the extremely low infiltration rates on roads, they generate surface erosion and runoff in response to frequent, low-intensity rainfall and snowmelt events, for as long as the road exists, resulting in persistent and chronic degradation of water quality and aquatic habitats. This is not the consistent case when fire causes hydrophobic soils to develop temporarily (Wondzell and King, 2003) and fire does not always cause hydrophobic soils (Wondzell and King, 2003; Beschta et al., 2004; Doerr et al., 2009).
Sixth, hydrophobicity does not reduce available water storage and infiltration rates in soils via compaction, as grazing (Kauffman et al., 2004), landings, and roads do. Full recovery from soil compaction typically requires 50-80 years after the complete cessation of impacts (USFS and USBLM, 1997a; Beschta et al., 2004). It is likely that infiltration rate and soil water storage capacity reductions related to compaction require a similar time period for full recovery.
As noted in Beschta et al. (2004) and Karr et al. (2004), measures can include aggressive efforts to reduce existing management-induced impacts, such as eliminating/curtailing livestock grazing, obliterating and decommissioning roads, rehabilitating firelines, removing stream crossings and other obstructions to the connectivity of aquatic populations, while avoiding: ground based logging, all logging in riparian areas and on steep slopes and areas burned at higher severity, planting, and construction or reconstruction of landings and roads.
Roads may be highly correlated with watershed condition, but it is important to recognize that such a correlation does not necessarily mean that “fixing” roads will alleviate all of the correlated effects. Road density integrates at least two major and separate categories of phenomena that contribute to erosion and sediment delivery (Trombulak and Frissell 2000). The first is erosion and sediment that is generated by the road itself and operations on it, and runs off into surface waters. In this category we can include secondary hydrophysical effects of roads, including landsides and gullies that initiate because roads disturbed natural drainage pattern, and maintenance-related runoff. This first category is targeted by road remediation and mitigation measures that reduce erosion or sediment delivery to streams from roadways. The second category is indirect: the erosion and sedimentation that are generated by land use actions and practices that are either supported by or incidental to the road network. Those phenomena in the second category that pertain to dispersed erosion and sediment delivery in forested watersheds are the subject of this memo: primarily, they are direct ground disturbance from felling and yarding, accelerated windthrow around cutting unit margins, and channel extension, gullying, and bank erosion initiating as a consequence of catchment-wide vegetation removal. These erosion and sediment sources are not mitigated by road management measures.
The Aquatic Conservation Strategy of the Northwest Forest Plan is a unique, comprehensive, and integrated management and planning strategy designed by the Forest Ecosystem Management Assessment Team (FEMAT), a multidisciplinary team of scientists and resource specialists from the agencies and universities. Since FEMAT was convened in 1993-94, there has been no
Case 1:15-cv-01329-WBS-EPG Document 34-4 Filed 10/30/15 Page 132 of 147

28
equivalent major scientific synthesis leading to adoption of a specific planning and management framework for conservation and management of riparian areas, watersheds, and aquatic ecosystems on federal lands. FEMAT and the Aquatic Conservation Strategy of the NW Forest Plan have withstood many tests and trials, and still stand among multiple federal agencies as the accepted benchmark for species recovery, biodiversity protection watershed restoration, and compliance with clean water mandates and goals.
The Sierra Nevada Ecosystem Project reviewed science relevant to the Sierra Nevada national forests and its recommendations echoed many of the key elements of the Northwest Forest Plan. However, SNEP recommended some departures from the Northwest Forest Plan Aquatic Conservation Strategy largely with respect to expanded protection for headwater streams, recognizing both the increased importance and increased vulnerability of such headwaters to disturbance in steeper lands of the Sierra Nevada (Appendix 3. Management and land use buffers. Sierra Nevada Ecosystem Project Final Report to Congress, Vol. III, pp. 270-273. Wildland Resources Center Report No. 39, University of California, Davis.). The primary results and recommendations of SNEP pertaining to aquatic and riparian resource conservation were recently re-examined and largely affirmed in a scientific workshop sponsored by the Pacific Rivers Council at UC Davis in 2011 (Frissell, C.A., M. Scurlock, and R. Kattelmann. 2012. SNEP Plus 15 Years: Ecological & Conservation Science for Freshwater Resource Protection & Federal Land Management in the Sierra Nevada. Pacific Rivers Council Science Publication 12- 1. Portland, Oregon, USA. 39 pp. http://www.sierraforestlegacy.org/Resources/Conservation/FireForestEcology/ThreatenedHabitat s/Aquatic/RETROSNEP_PRC_Report_2012.pdf). Further, the Pacific Rivers Council (2012) made a comprehensive slate of specific recommendations for objectives, standards, and guidelines to more closely align existing Sierra Nevada forest plan elements, the recommendations in SNEP and widely accepted elements of the NW Forest Plan Aquatic Conservation Strategy, and with new and emerging science. Finally, a recent science panel review of new science pertaining to the NW Forest Plan Aquatic Conservation Strategy echoed the SNEP recommendations in calling for increased protection of smaller headwater streams (Frissell, C.A., R.J. Baker, D.A. DellaSala, R.M. Hughes, J.R. Karr, D. A. McCullough, R.K. Nawa, J. Rhodes, M.C. Scurlock, and R.C. Wissmar. 2014; Conservation of Aquatic and Fishery Resources in the Pacific Northwest: Implications of New Science for the Aquatic Conservation Strategy of the Northwest Forest Plan. Report prepared for the Coast Range Association, Corvallis, OR. 35 pp, http://coastrange.org/documents/ACS-Finalreport-44pp-0808.pdf).
Therefore, the Forest Service should recognize its own history, and adopt the Northwest Forest Plan Aquatic Conservation Strategy, revised with respect to the findings and recommendations of the SNEP project, as a rational and scientifically and technically defensible benchmark for aquatic and riparian, and watershed protection and restoration in the three Sierra Nevada Forest Plans. We request that the agency explicitly adopt the NW Forest Plan Aquatic Conservation Strategy and relevant SNEP recommendations as a principal benchmark of its NEPA analysis. In so doing the Forest Service should identify and document with citations to scientific papers or published reports and explain the reasoned basis for each departure from this benchmark proposed in the Sierra Nevada forest plans. In this way, the Forest Service’s proposal for forest plans and its implications for aquatic, riparian, and watershed resources can be clearly
Case 1:15-cv-01329-WBS-EPG Document 34-4 Filed 10/30/15 Page 133 of 147

29
understood by the interested scientific and resource conservation professional community and by the public.
C. Grazing
The Forest Plan revision must address livestock grazing for several key reasons. First, livestock grazing is pervasive on Sierra Nevada national forests, conveying numerous adverse impacts on ecosystems at a large scale (Kondolf et al., 1996; Kattelmann, 1996; Rhodes, 2007; Beschta et al., 2013). All three of the national forests proposed for plan revision are extensively grazed by livestock. Second, grazing and related impacts are particularly concentrated in riparian areas along streams, as legions of studies and assessments have documented (e.g., Kattelmann, 1996; Kondolf et al., 1996; Belsky et al., 1999: Beschta et al., 2013). The resulting grazing impacts on riparian area conditions are significant because riparian area conditions strongly affect stream conditions, including water quality and fish habitats (Rhodes et al., 1994; CWWR, 1996), as the USFS has repeatedly acknowledged (USFS et al., 1993; USFS and USBLM, 1997a: b). As a result, livestock grazing causes numerous types of havoc for riparian-dependent and aquatic species, streams, water quality, and downstream beneficial uses.
Grazing damages stream banks via reduced vigor and cover of deep-rooted vegetation and trampling of shearing of streambanks (Kattelmann, 1996; Kondolf et al., 1996; Belsky et al., 1999: Beschta et al., 2013). Bank damage from trampling and vegetation loss reduces bank stability by leaving remaining banks oversteepened, devegetated, and highly vulnerable to additional erosion and loss by streamflow (Kondolf et al., 1996). As a BLM publication (Cowley, 2002) on bank alteration by livestock noted,
It is well documented that large herbivores such as cattle, horses, sheep, bison, elk, and moose can alter the physical dimensions (e.g., increasing the bankfull width) of stream channels by bank trampling and shearing…Increasing the bankfull width makes the stream shallower, increases sediment, decreases the floodplain, increases temperature, and increases the adverse [effects on] the physical functioning of a stream, its associated riparian area, and aquatic habitat.
Bank damage from livestock trampling also destroys overhanging banks, reducing their extent and frequency in an irretrievable manner. This is a significant negative impact because overhanging banks are important to the survival of adult and juvenile salmonids (Kondolf et al., 1996, Beschta et al., 2013). The loss of bank stability caused by trampling and the loss of deep- rooted vegetation also cause the direct loss of stable overhanging banks, an important component of salmonid habitat, and thwarts their development (Platts, 1991; Fleischner, 1994; Rhodes et al., 1994; Kondolf et al., 1996; Beschta et al., 2013).
The loss of riparian vegetation and bank stability caused by grazing often leads to gullying and elevated stream erosion, which contributes to significant increases in downstream sediment delivery. Grazing also significantly elevates soil erosion and sediment delivery by reducing vegetative cover and compacting soils, causing increased surface runoff (Kondolf et al., 1996; Beschta et al., 2013).
Case 1:15-cv-01329-WBS-EPG Document 34-4 Filed 10/30/15 Page 134 of 147

30
These grazing impacts significantly increase soil erosion and sediment delivery, which degrades water quality by increasing suspended sediment, turbidity, and fine sediment levels in streams (Kattelmann, 1996; Kondolf et al., 1996; Belsky et al., 1999: Beschta et al., 2013). The degraded water quality by sediment from grazing adversely affect fish and water use, including downstream reservoirs, as a USFS researcher has acknowledged (Reid, 1999).
The increases in sediment delivery from grazing contribute to the adverse modification of stream channels via sedimentation, which reduces the frequency, depth, and quality of pools which are important to many aquatic biota, and increases the width/depth of streams, contributing to elevated temperatures. As USFS and USBLM (1997) noted:
Grazing is a major nonpoint source of channel sedimentation (Dunne and Leopold 1978; MacDonald and others 1991; Meehan 1991; Platts 1991). Grazed watersheds typically have higher stream sediment levels than ungrazed watersheds (Lusby 1970; Platts 1991; Rich and others 1992; Scully and Petrosky 1991). Increased sedimentation is the result of grazing effects on soils (compaction), vegetation (elimination), hydrology (channel incision, overland flow), and bank erosion (sloughing) (Kauffman and others 1983; MacDonald and others 1991; Parsons 1965; Platts 1981a; 1981b; Rhodes and others 1994). Sediment loads that exceed natural background levels can fill pools, silt spawning gravels, decrease channel stability, modify channel morphology, and reduce survival of emerging salmon fry (Burton and others 1993; Everest and others 1987; MacDonald and others 1991; Meehan 1991; Rhodes and others 1994).
The increased delivery of sediments to streams caused by grazing, including that from increased surface erosion on bare, compacted soils and accelerated bank and channel erosion, has many negative impacts on aquatic systems. Notably, elevated sediment delivery is the one of the most widespread water quality problems in the streams draining Sierra Nevada national forests (Centers for Water and Wildland Resources (CWWR), 1996).
Livestock grazing also degrades water quality by increasing water temperatures in several ways. It elevates water temperature via the loss and suppression of riparian vegetation that provides stream shade increases (Kondolf et al., 1996; Kattelmann, 1996; Beschta et al., 2013). Livestock grazing also widens channels due to bank damage from trampling and sedimentation, which also contributes to water temperature increases (Bartholow, 2000; Kondolf et al., 1996; Kattelmann, 1996; Cowley, 2002; Beschta et al., 2013), even in the absence of shade loss (Rhodes et al., 1994; Bartholow, 2000). This is a serious impact because elevated water temperature adversely affects numerous aquatic stenotherms, particularly salmonids (McCullough, 1999). These effects on water temperatures are significant because elevated water temperature is a widespread water quality problem in many streams draining USFS lands in California.
Livestock grazing also degrades water quality by elevating coliform levels (Kattelmann, 1996), as studies on USFS lands in the Sierra Nevada have repeatedly documented (Derlet et al., 2008; 2010; 2012; Myers and Kane, 2011 Myers and Brenda, 2012). Grazing also contributes to biological water contamination by Giardia (Kattelmann, 1996). This biological pollution of drinking water supplies by widespread grazing on these three national forests poses a significant threat to human health.
Case 1:15-cv-01329-WBS-EPG Document 34-4 Filed 10/30/15 Page 135 of 147

31
Livestock grazing also reduces water quality by elevating nutrients levels due to animal wastes deposited or washed in to streams (Derlet et al., 2010). This degradation of water quality contributes to the eutrophication of affected water bodies (Derlet et al., 2010), which is likely to accelerate with on-going climate change (CCSP, 2008). Eutrophication is a significant concern for drinking water because algal blooms also pose a health hazard (Derlet et al., 2012).
Grazing also adversely impacts local and downstream hydrology in several ways. The loss of bank-stabilizing vegetation and bank stability causes stream incisement, especially in meadows (Kondolf et al., 1996). Stream incisement cause drops in water tables, desiccating meadows. Viers et al. (2013) noted that lowered water tables in Sierra Nevada meadows contribute to additional stream incisement and the loss of meadow functionality. The reduction in base flow contributions to streams due to lowered water tables adds additional stress to imperiled aquatic biota, including salmonids and amphibians (Viers et al., 2013; Beschta et al., 2013).
The hydrologic alteration of ecologically important wet meadows, such as fens, by grazing, adversely impacts their functionality (Sikes et al., 2013). Grazing of fens is a major cause of their degradation in the Sierra Nevada and fen meadows in poor condition that are subject to stock grazing are likely to be further damaged or prevented from recovering. Sikes et al. (2013) noted regarding fen meadows in the Sierra Nevada that “it is likely that even relatively light grazing will maintain degraded sites in a degraded condition for many decades.”
Grazing extensively and profoundly alters the ability of soils to absorb, store, and release water, cumulatively affecting water quantity, especially during summer low flows. Trampling by livestock inevitably compacts soils and damages ground vegetation. This is because the hoof of a 1,000 pound cow exerts more than five times the pressure on soils than does an extremely large bulldozer that weighs about 50 tons (Cowley, 2002).
The loss of the ability of soils compacted by grazing to store and ultimately release water is highly significant, because it reduces low streamflows which harms fish. Kauffman et al. (2004) estimated that soils compacted by grazing lost the ability to store about 121,000 liters of water per hectare (or about 13,000 gallons per acre) in just the top four inches of soil in riparian meadows. This is an extremely significant impact, because water stored in soils is an important source of the water for plants and the generation of streamflow during dry periods. These effects of soil compaction from livestock are likely some of the reasons that cessation of livestock grazing in riparian areas has been shown to increase summer streamflow (Ponce and Lindquist, 1991, Reeves et al., 1991, Rhodes et al., 1994). Cessation of livestock grazing is one of the most promising means for increasing/restoring low flows in streams (Ponce and Lindquist, 1991; Rhodes et al. 1994; Beschta et al., 2013). Continued livestock grazing inevitably contributes in multiple ways to reductions in summer streamflows. These reductions contribute to elevated water temperatures (Rhodes et al., 1994) which, in turn, contribute to reductions in the survival and production of trout, and other aquatic stenotherms.
Importantly, the soil compaction inexorably caused by grazing is extremely persistent, requiring several decades for full recovery (USFS and USBLM, 1997). Thus, soil compaction from livestock grazing is highly cumulative over time and persistently contributes to the loss of plant growth and summer streamflow which adversely affects fish. Soil compaction also persistently
Case 1:15-cv-01329-WBS-EPG Document 34-4 Filed 10/30/15 Page 136 of 147

32
reduces soil productivity (USFS and USBLM). Notably, soil compaction and its resultant adverse ecological impacts are pervasive problems in the Sierra Nevada, particularly in areas subjected to livestock grazing (CWWR, 1996).
Third, grazing impacts must be thoroughly examined and curbed in the proposed Forest Plan revision because these impacts profoundly impact aquatic species and the beneficial uses of water. Numerous studies have repeatedly shown that elevated sediment delivery caused by grazing reduces the survival and production of salmonids in several ways, including by infilling pools, widening streams, and elevating fine sediment levels and water temperature (Platts, 1991; USFS et al., 1993; Rhodes et al., 1994; Kondolf et al., 1996; USFS and USBLM, 1997; Buffington and Montgomery, 1999; Kappesser, 2002; Beschta et al., 2013). Additionally, livestock also trample amphibians (Kondolf et al., 1997). Therefore, adequate protection of aquatic species requires curbing the pervasive harms caused by existing livestock grazing on the three forests. Protecting and restoring water quality and the beneficial uses of water also requires diminution of many extensive impairments of water quality caused by the three forests’ grazing pogroms. Similarly, proper assessment of the proposed revised plan’s cumulative impacts on aquatic systems, including water quality, riparian areas, fish, amphibians, water quantity, stream conditions, and beneficial uses of water requires an in-depth adequate analysis of grazing impacts on the three forests.
Fourth, grazing impacts must be fully assessed and made known because these impacts combine with those from existing roads and will combine with any logging as well to cumulatively affect aquatic conditions. Grazing has numerous impacts that combine with the impacts of roads, logging, and landings on watershed and aquatic resources (Reid, 1993; Rhodes et al., 1994; Henjum et al., 1994). For instance, reasonable assessment of cumulative soil impacts requires examination of those from livestock impacts, logging, and roads because all of these activities persistently afflict soils in several ways. Grazing, logging, landings, and roads all severely compact soils (Platts, 1991; Rhodes et al., 1994; CWWR, 1996; USFS and USBLM, 1997; Kauffman et al., 2004). This cumulative soil compaction reduces soil productivity and profoundly alters the hydrologic properties of soils. In particular, compaction severely reduces the ability of soils to absorb and store water which serves as an important source of summer streamflows.
Livestock grazing, logging, landings, and roads also severely degrade soil productivity by greatly elevating soil erosion (Platts, 1991; USFS and USBLM, 1997; Rhodes et al., 1994). Loss of topsoil due to erosion causes permanent loss of soil productivity (Karr et al., 2004; Beschta et al., 2004). This loss of productivity is cumulatively affected by all causes of soil loss (USFS and USBLM, 1997). Thus, the credible evaluation of cumulative effects on soil, which is a keystone element of ecosystems, requires the assessment of the combined impacts that will accrue from the three forests’ grazing activities combined with the immoderate logging and road activities associated with proposed logging. The existing and on-going grazing impacts on soil erosion must be assessed and disclosed, together with those from roads, landings, and logging, in order to reasonably disclose the cumulative impacts of the alternatives on soil erosion and soil productivity. Otherwise, the three forests will have failed to reasonably make known the cumulative effects of Plan revision on soils.
Case 1:15-cv-01329-WBS-EPG Document 34-4 Filed 10/30/15 Page 137 of 147

33
Similarly, prodigious elevated sediment delivery caused by grazing combines with that from logging, roads, and landings to cumulative a host of sediment related conditions in streams, including channel form, pool conditions, fine sediment levels, fish habitats, turbidity, suspended sediment and the downstream sedimentation of reservoirs. Therefore, the cumulative effects of proposed road, landing, logging, and grazing actions on sediment delivery at the scale of watersheds must be fully assessed in order to reasonably examine impacts on sediment-related aquatic conditions and beneficial uses.
Roads and landings in riparian areas significantly degrade riparian areas and their functions, as does grazing. Further, the proposed changes to existing anemic riparian protections under the SNFPA are plainly aimed at allowing greater riparian degradation via logging under the rubric of fuel treatments. Therefore, grazing, roads, landings, and logging will cumulatively degrade riparian areas, which are essential to important aquatic functions. This means the combined impacts of logging, grazing, landings, and roads must be assessed under the Plan revision and made known in order to reasonably determine cumulative impacts on aquatic systems, including water quality, channel form, and fish habitats.
Grazing impacts on water temperature also combine with the impacts of logging, roads, and landings in riparian areas on water temperature, cumulatively affecting aquatic stenotherms, such as salmonids. These combined impacts from these activities include those due to the loss of stream shade and channel widening from cumulative sediment delivery and decreased bank stability. For these reasons, it is essential that the three forests properly assess and make known the cumulative effects of grazing, logging, landings, and roads on water temperatures under the revised Plan.
Other impacts of grazing that combine with those of roads and logging on watershed conditions and functions include weed spread and increased peak flows. Therefore, these combined impacts must also be properly assessed.
Importantly, the Equivalent Roaded Area (ERA) method used by many national forests in USFS Region 5 as a surrogate for credible cumulative effects assessment of management-induced watershed damage is inadequate with respect to accounting for the pervasive and significant cumulative watershed damage caused by livestock grazing. The ERA method does not incorporate the cumulative watershed impacts caused by livestock grazing in estimating ERA levels (Reid, 1993; Menning et al., 1996). Therefore, the ERA cannot be used to assess the combined impacts of grazing, logging, landings, and roads on watershed and aquatic resources. The three forests must, instead, use credible methods to assess the combined impacts of logging, roads, and grazing on soils, erosion, sediment delivery, water temperature, stream conditions, and sediment-related water quality impacts.
Last, addressing grazing is necessary to achieve several of the avowed Desired Conditions in the NOI, such as:
Aspen and oak sprouts are well distributed in areas where they occur. (NOI, p. 6) Aspen is successfully regenerating and growing into larger trees. (NOI, p. 8)
Case 1:15-cv-01329-WBS-EPG Document 34-4 Filed 10/30/15 Page 138 of 147

34
Sagebrush ecosystems are resilient to fire, disturbances (e.g., grazing, recreation), invasive species (including cheatgrass) and climate change. (NOI, p. 24)
Pinyon-juniper types have a mosaic of trees and open areas that provide wildlife habitat, contribute to functional soils, and are resilient to disturbances such as fire, invasive species and climate change. (NOI, p. 24)
Adequate quantity and timing of water flows support ecological functions, including aquatic species and riparian vegetation consistent with existing water rights and claims. Affects to quantity and timing from climate change, such as changes in runoff timing and patterns, should be taken into account…Water quality is sustained at a level that retains the biological, physical and chemical integrity of aquatic systems and benefits the survival, growth, reproduction and migration of native aquatic and riparian species. Water quality meets or exceeds…water quality standards, and supports designated beneficial uses in light of atmospheric deposition of nitrogen…Watersheds with recharge areas for segments of designated and eligible wild and scenic rivers retain water quality and recharge to those segments…Groundwater quantity and quality in aquifers are sustained…Watersheds are fully functioning, are resilient and recover rapidly from natural and human disturbances, and have a high degree of hydrologic connectivity laterally across the floodplain and valley bottom, and vertically between surface and subsurface flows. Physical (geomorphic, hydrologic) connectivity and associated surface processes, such as runoff, flood-pulse, in-stream flow regime, erosion and sedimentation are maintained…Watersheds provide important ecosystem services such as high quality water, recharge of streams and aquifers, maintenance of riparian communities, moderation of climate change and atmospheric deposition. Watersheds maintain long term soil productivity…Soil and vegetation functions in upland and riparian settings are retained or enhanced. Resilient landscapes provide forage for browsing and grazing animals, timber production and recreation opportunities without adversely affecting soil and water productivity. (NOI, pp. 47-48)
Stream ecosystems, riparian corridors and associated stream courses are functioning properly and are resilient to natural disturbances (e.g., flooding) and climate change, promote the natural movement of water, sediment and woody debris and provide habitat for native aquatic species….Stream ecosystems, including ephemeral watercourses, exhibit full connectivity where appropriate to maintain aquatic species diversity…Ephemeral watercourses provide for dispersal, access to new habitats, and perpetuation of genetic diversity, as well as nesting and foraging for special status species…Flooding is the primary disturbance. Streams and rivers maintain a natural hydrograph, or water flow, over time, including periodic flooding, which promotes natural movement of water, sediment, nutrients and woody debris. Flooding creates a mix of stream substrates for fish habitat, including clean gravels for fish spawning, large wood structures and sites for germination and establishment of riparian vegetation…Where possible, native fish, amphibians and other native aquatic species are present within their historic distribution, and habitat conditions support self-sustaining populations. Fish aquatic species habitat includes deep pools and overhanging banks, structure provided by large wood, off channel areas and cover. Woody and herbaceous overstory and understory regulate stream temperatures…Species composition and structural diversity of plant and animal communities in riparian areas, wetlands and meadows provide habitat and promote ecological processes…Wetlands and groundwater-
Case 1:15-cv-01329-WBS-EPG Document 34-4 Filed 10/30/15 Page 139 of 147

35
dependent ecosystems, including springs, seeps, fens, wet meadows, and associated wetlands or riparian systems support stable herbaceous and woody vegetative communities that are resilient to drought, climate change and other stressors. Root masses stabilize stream channels, shorelines and soil surfaces. The natural hydrologic, hydraulic and geomorphic processes in these ecosystems function at a level that allows retention of their unique functions and biological diversity…Native riparian vegetation is diverse, provides the structure and composition to function within their natural potential and provides food and cover for wildlife...Soil function is sustained to infiltrate and disperse water properly, withstand accelerated erosion and cycle nutrients. Associated water tables support riparian vegetation and restrict non-riparian vegetation…Meadows have ground cover and species composition as represented by condition class (e.g., good to excellent), species richness and diversity...Fens and meadows are in proper functioning condition or improving. Fens and meadows are resilient to climate change and disturbances. Development of fens continues. Necessary soil, hydrologic regime, vegetation, and soil and water characteristics sustain that system’s ability to support unique physical and biological attributes…Springs provide sufficient water to maintain healthy habitats for native riparian and aquatic species … Springs are resilient to natural disturbances and changing climate conditions and function within their type and capability. Soil, water and vegetation attributes sustain healthy springs. Water flow, recharge rates…are similar to historic levels and persist over time. (NOI, pp. 49-50)
As previously discussed, livestock grazing interferes with the attainment of most of the foregoing desired conditions. Grazing severely damages soils, soil productivity and soil hydrologic functions. Soil compaction by grazing reduces infiltration and subsequent water recharge to watersheds (Kauffman et al., 2004; Beschta et al., 2014). These impacts also compound drought stress and contribute to reductions in low flows. Grazing elevates water temperatures in many ways and impedes the recovery of healthy riparian vegetation (Platts, 1991; Kondolf et al., 1996; Belsky et al., 1999; Beschta et al., 2013). Grazing impacts contribute significantly to reductions in the survival and production of salmonids. Grazing has been shown to be a major cause in the loss of aspen recruitment (Beschta et al., 2013). Grazing is a major threat to ecologically important fen meadow systems in the Sierra Nevada (Sikes et al., 2010). Grazing is a major cause of cheatgrass spread and establishment in sagebrush ecosystems (Beschta et al., 2013; Reisner et al., 2013). Grazing compounds the adverse impacts of climate change and renders ecosystems less resilient to climate-driven impacts (Beschta et al., 2013; Hughes, 2014). Therefore, a major reduction in grazing impacts is a vital step towards attainment of the avowed “Desired Conditions” in the NOI.
As just discussed, livestock grazing damages a host of watershed and aquatic elements and processes in ways that combine with impacts of roads, logging, and climate change to cumulatively harm aquatic populations, water quality, and water quantity. For these reasons, the forthcoming environmental analyses must reasonably assess and make known the existing conditions1 and likely future impacts on these elements processes under the grazing pogrom allowed under the Plan revision.
1 As other USFS environmental analyses (e.g., MHNF, 2013) have noted: “In order to understand the contribution of past actions to the cumulative effects of the proposed action and alternatives, this analysis relies on current environmental conditions as a proxy for the impacts of past actions. This is because existing conditions reflect the
Case 1:15-cv-01329-WBS-EPG Document 34-4 Filed 10/30/15 Page 140 of 147

36
The following basic attributes of grazing must be assessed and made known both at the scale of the forests and watersheds:
number, location, and area of allotments; total number and area of allotments; stocking levels and season of grazing in each allotment; time since last revision of allotment management plan;
The environmental analyses must examine and make known that existing conditions have been affected by grazing and cumulatively affect aquatic systems and water quality in combination with impacts from logging, roads, and climate change. These existing conditions include the following for all grazing-affected streams and watersheds:
riparian conditions, including seral state, and stream shade; bank stability; extent of overhanging banks; width/depth ratio; pool frequency; fine sediment levels and fine sediment storage in pools (V*) in streams (V*) turbidity watershed sediment delivery; location and extent soil compaction2 and attendant loss of soil productivity, soil moisture
storage, and low flow; location and extent of bare soils; elevation of peak flows; the location and extent of xerified meadows due to stream incisement; miles of streams affected by grazing at the watershed scale; nutrient loading and concentrations; biological contamination (e.g., coliform, Giardia, etc.) loading and concentrations; locations of lotic and lentic algal blooms; water temperatures; status of beneficial uses affected by the foregoing, including those downstream.
Since grazing under the revised Plan will continue to affect the foregoing processes and elements, the environmental analyses for the Plan revision must also credibly estimate the effect of grazing management on these elements and processes, together with the effects of climate change and proposed logging, landing, and road activities.
As part of the assessment of grazing-related impacts, the environmental analyses must disclose that elimination of grazing would result in the rapid improvement of many conditions damaged
aggregate impact of all prior human actions and natural events that have affected the environment and might contribute to cumulative effects.”
2 The area exposed to grazing provides an index of soil compaction, because it is likely that the entire area exposed to grazing is compacted due to the pressure exerted by livestock hooves and the persistent nature of soil compaction.
Case 1:15-cv-01329-WBS-EPG Document 34-4 Filed 10/30/15 Page 141 of 147

37
by grazing, including most of the aforementioned processes and element, as has been repeatedly documented in numerous assessments (Platts, 1991; Rhodes et al., 1994; Fleischner, 1994; Knapp and Matthews, 1996; Magilligan and McDowell, 1997; McDowell, and Magilligan, 1997; Belsky et al., 1999; Kauffman et al., 2002; Nagle and Clifton, 2003; Kauffman et al., 2004; Coles-Ritchie et al., 2007; Hough-Snee et al., 2012; Beschta et al., 2013; Beschta et al., 2014). These studies have documented that in riparian areas and streams that have not been subjected to grazing for several years have narrower channel width, higher streambank stability, higher levels of overhanging streambanks, less bare ground, less compacted soils with higher infiltration rates, more wet-site vegetation, better water quality, and higher levels of canopy cover from desirable, deep-rooted vegetation than comparable areas that continue to be grazed. These beneficial effects have also been repeatedly documented on the Inyo National Forest (Knapp and Matthews, 1996; Herbst et al., 2012).
Even in the case of soil compaction, which recovers slowly in the absence of impacts, research has shown that the elimination of grazing results in considerable recovery over the course of a couple decades in comparison with areas that are continued to be grazed (Kauffman et al., 2004). This recovery from compaction in the absence of grazing results in profoundly improved ability of soils to absorb, store, and release water during low flow periods (Kauffman et al., 2004; Beschta et al., 2013). A no-grazing approach is the only type of grazing management that is compatible with the protection and restoration of aquatic systems (Platts et al., 1991). The elimination of livestock grazing is crucial step in increasing the resilience of public land ecosystems to ongoing climate change effects (Beschta et al., 2013). The foregoing beneficial effects of grazing elimination on public land ecosystems must be assessed and made known in the environmental assessment for the Plan revision.
In order to provide the public with a reasonable context regarding the efficacy, costs, and benefits of proposed management under the Plan revisions, the environmental analyses for the Plan revision must also make known the following:
grazing has no beneficial effects on watersheds and aquatic resources; in contrast, wildfire has numerous ecological benefits for watersheds and aquatic
systems; Logging to reduce fuels, especially in riparian areas, has numerous inevitable adverse
impacts on watersheds and aquatic systems; the elimination of grazing is consistently highly effective in restoring watershed and
aquatic systems and confers no adverse ecological impacts; the elimination of grazing not only has low fiscal costs to taxpayers, but would result in
net savings to the public.
The three forests must curb the pervasive damage to the public’s watershed and aquatic resources by grazing. Therefore, environmental analyses for the proposed revision must include at least one alternative for detailed analysis that has standards that ensure that grazing damage is consistently reduced on the three forests.
Scientific assessments, including those of the USFS, have repeatedly noted that a key method for reducing grazing damage is to require grazing suspension for many years in following areas
Case 1:15-cv-01329-WBS-EPG Document 34-4 Filed 10/30/15 Page 142 of 147

38
where grazing prevents ecological recovery and/or will inevitable cause significant watershed and aquatic damage. Most widely used grazing management practices are incompatible with the recovery of degraded riparian areas (Platts, 1991; Belsky et al., 1999). The recovery of degraded riparian areas, which is essential to reducing water quality impacts, is highly unlikely without significant reductions in the number of livestock and duration of grazing (Ohmart and Andersen, 1986). In ecologically important fen meadows, even relatively light grazing prevents ecological recovery (Sikes et al., 2010). Grazing in wet areas inevitably causes considerable damage because wet soils are particularly susceptible to compaction. Further, wet areas are often hydrologically connected to streams, which results in a high degree of nutrient and biological contamination of streams and downstream water bodies.
The suspension of livestock grazing is the only grazing management strategy that is completely compatible with protection and restoration of riparian areas and water quality, as many assessments of grazing impacts have repeatedly concluded (e.g. Anderson et al., 1993; Platts, 1991; Rhodes et al., 1994; Spence et al., 1996; Belsky et al., 1999). Elmore and Kauffman (1994) noted, regarding available information on the effect of grazing on riparian recovery, which is essential to restoration of water quality, “livestock exclusion has consistently resulted in the most dramatic and rapid rates of ecosystem recovery.”
Numerous assessments have repeatedly recommended the temporary or permanent elimination of grazing in order to restore degraded riparian areas and thereby reduce water quality impacts from livestock grazing (Clary and Webster, 1989; Platts et al., 1991; Beschta et al., 1991; Anderson et al., 1993; Henjum et al., 1994; Rhodes et al., 1994; Leonard et al., 1997; Beschta et al., 2004; Karr et al., 2004; Spence et al., 1996; Beschta et al., 2013; Hughes, 2014). For example, a USFS and USBLM publication (Leonard et al., 1997) states (emphasis added):
Livestock grazing in riparian areas, however, may not always be entirely compatible with other resource uses or values. Where soils in riparian areas are unstable, the vegetation complex is fragile, threatened and endangered plants and/or animals are affected, aquatic or recreation values are high, municipal watersheds are involved, etc., special livestock management prescriptions must be applied. In some cases, excluding livestock grazing may be the most logical and responsible course of action (at least for a time sufficient to achieve a level of recovery and stability that can support grazing in the context of the management objectives).
The conditions under which a no-grazing BMP is necessary to protect and restore water quality are well documented and include:
degraded watersheds, streams and riparian areas, such as those with low levels of stream
shade and vegetation, degraded bank stability, widened channels, elevated water temperatures, depressed pool frequency, elevated fine sediment levels, elevated turbidity, elevated biological contamination, elevated algal blooms, incised channels, degraded meadows, and/or elevated nutrient levels, (Clary and Webster, 1989; Platts et al., 1991; Beschta et al., 1991; Anderson et al., 1993; Henjum et al., 1994; Rhodes et al., 1994; Leonard et al., 1997; Spence et al., 1996; Beschta et al., 2013);
Fragile streams and wetlands that cannot be grazed without incurring damage that
Case 1:15-cv-01329-WBS-EPG Document 34-4 Filed 10/30/15 Page 143 of 147

39
elevates water pollution (Rhodes et al., 1994; Beschta et al., 2013); such vulnerable areas include perennially-saturated riparian areas and streams with banks comprised of cohesionless soils lacking deep-rooted vegetation (Rhodes et al., 1994; USFS 2000; Beschta et al., 2013) and fens (Sikes et al., 2010);
Recently burned landscapes (Beschta et al., 2004; Karr et al., 2004; Beschta et al., 2013); Areas where the condition of watersheds, riparian zones, water quality, and the effects of
grazing upon them have not been adequately assessed (Henjum et al., 1994; Rhodes et al., 1994).
Watersheds and other large areas containing a variety of ecotypes to capture the significant benefits of more resilient and healthy ecosystems in the face of climate change (Beschta et al, 2013)
Areas where grazing extend beyond the immediate site (e.g., wetlands and riparian areas impact many wildlife species and ecosystem services with cascading implications beyond the area grazed) (Beschta et al., 2013)
Rare ecosystem types (e.g., perched wetlands) or locations with imperiled species (e.g., aspen stands and understory plant communities, endemic species with limited range), including fish and wildlife species adversely affected by grazing and at-risk and/or listed under the ESA (Rhodes et al., 1994; Beschta et al., 2013);
numerous representative exclosures for the purposes of monitoring recovery in the absence of grazing in comparison to conditions and trends in comparable grazed areas (Bock et al., 1993; Anderson et al., 1993; Rhodes et al., 1994; Coles-Ritchie et al., 2007; Beschta et al., 2013)
For these reasons, the environmental analyses for the proposed plan revision must include at least one alternative that requires grazing elimination in the foregoing areas. This is not only necessary to curb the extensive and significant impairment of watershed and aquatic processes and resources, but also to provide a reasonable range of alternatives. Further, such an alternative is necessary to provide a valid comparison between responsible land management and the three forests irresponsible current grazing management.
The environmental analyses for the Plan revisions must also include an alternative that prohibits late-season grazing because such grazing is incompatible with riparian protection and restoration Numerous evaluations, including those by land management agencies, of grazing impacts on riparian, watershed, and aquatic systems, have repeatedly noted that late season grazing is particularly incompatible with the protection and restoration of aquatic ecosystems. Late-season (summer and fall) grazing is damaging because cattle and their impacts tend to be particularly concentrated in riparian areas during the late summer and fall, as many assessments have noted, including those of the USFS (Platts et al., 1991), BLM (Leonard et al., 1997), and National Marine Fishery Service (Murray et al., 2004). Thus, late-season livestock grazing allowed under the 2004 SNFPA thwarts or impedes the recovery of streambanks and riparian and stream conditions amenable to fish survival (Platts et al., 1991; Kovalchik and Elmore, 1991; Elmore, 1992; Leonard et al., 1997). For similar reasons, season-long grazing is also incompatible with the recovery of riparian and stream conditions amenable to unimpaired fish survival (Platts et al., 1991; Kovalchik and Elmore, 1991; Elmore, 1992; Leonard et al., 1997). Therefore, it is clear that the S&Gs for the 2004 SNFPA related to grazing are inadequate to ensure that livestock
Case 1:15-cv-01329-WBS-EPG Document 34-4 Filed 10/30/15 Page 144 of 147

40
grazing does not harm aquatic systems, fish habitats, and fish populations in an irreparable manner.
Scientific assessments of public land management have repeatedly stressed the need to properly assess the impacts of grazing on water quality prior to the continuation of grazing (Henjum et al., 1994; Rhodes et al., 1994). Key attributes that must be monitored in order to assess grazing effects on water quality and the effectiveness of grazing BMPs include the condition of riparian areas, stream shade, channel width and depth, bank stability, bank damage from trampling, the extent of overhanging banks, water temperature, and fine sediment levels in streams (Rhodes et al., 1994; USFS and USBLM, 1995a; b; Coles-Ritchie et al., 2007; Burton et al., 2008; Beschta et al., 2013). Adequate monitoring of grazing impacts is requisite, if management is to be credible. Therefore, at least one alternative must require annual monitoring of key attributes affected by grazing in order for grazing to occur.
Credible monitoring of grazing impacts requires the establishment of well-distributed grazing exclosures in all areas with active grazing. The establishment and monitoring of such exclosures are critical for several reasons. First, in many ecotypes, it is unlikely that there are sizable watersheds and streams that are completely unaffected by livestock grazing. Exclosures at least provide some sort of reference for comparison of the effects of grazing versus no-grazing on reach-level conditions that affect water quality, such as bank conditions, channel width, soil properties, and riparian vegetation (Bock et al., 1993; Anderson et al., 1993; Rhodes et al., 1994; Kondolf et al., 1996; Knapp and Matthews, 1996; Magilligan and McDowell, 1997; Kauffman et al., 2002; Kauffman et al., 2004; Coles-Ritchie et al., 2007).
Second, monitoring in and outside of exclosure provides means of assessing the effectiveness of grazing BMPs for reach-level conditions that affect water quality. This is a critical need, because many of the grazing BMPs are ineffective in many situations.
Third, monitoring conditions and trends in and outside of exclosures is critical to assessing if grazing complies with USFS standards and objectives related to grazing, which USFS (2011) acknowledges are part of the BMP approach for grazing. For instance, standards in PACFISH and INFISH (USFS and USBLM1995a; b), the Northwest Forest Plan (USFS et al., 1994), the forest plans for several other national forests, such as the Klamath and Mendocino National Forest, require the elimination or modification of livestock grazing that retards attainment of plan standards for water quality and aquatic systems. Assessment of compliance with these standards requires the assessment of differences in trends, with and without grazing, in conditions that affect plan standards for water quality, such as streambanks, soils, vegetation, and stream attributes. This is necessary because even when livestock grazing does not continue to worsen conditions that affect water quality, it prevents or seriously impedes the recovery of attributes that affect water quality and related standards. Data and studies have repeatedly demonstrated that in comparison to comparable riparian areas that have not been grazed for several years, areas with continued livestock grazing have wider streams, lower levels of streambank stability, lower levels of overhanging streambanks, more bare ground, more compacted soils, less wet-site vegetation, and lower levels of canopy cover from desirable, deep-rooted vegetation (Platts, 1991; Rhodes et al., 1994; Fleischner, 1994; Knapp and Matthews, 1996; Magilligan and McDowell, 1997; Kauffman et al., 2002; Kauffman et al., 2004; Coles-Ritchie et al., 2007)
Case 1:15-cv-01329-WBS-EPG Document 34-4 Filed 10/30/15 Page 145 of 147

41
indicating that continued grazing prevents or retards recovery of these attributes that affect water quality and beneficial uses. Scientific assessments have repeatedly recommended establishing exclosures and monitoring conditions in and outside of them in order to assess differences in the trends between grazed and ungrazed areas (Bock et al., 1993; Anderson et al., 1993; Rhodes et al., 1994; Kauffman et al., 2002; Coles-Ritchie et al., 2007). For these reasons, the environmental analyses for the Plan revision must include an alternative that requires the establishment and monitoring of well-distributed representative exclosures in all areas with active grazing.
Importantly, if any of the alternatives in the environmental analyses rely on the “proper functioning condition” (PFC) assessment method for assessing grazed areas, the environmental analyses must make known that PFC is inadequate to assess riparian conditions and water quality impacts from grazing. There are several reasons why PFC is not adequate to credibly assess riparian conditions and water quality impacts from livestock grazing.
First, PFC lacks scientific rigor and is highly subjective, rendering it prone to error and abuse. The National Research Council (2002) noted that the PFC approach “…is qualitative, PFC is vulnerable to subjective application…” Aquatic experts from the USFS and USBLM concluded that PFC is poorly defined (Sedell et al., 1997). The PFC method involves no measurement of any stream or riparian attribute.
This assessment that PFC is qualitative is not confined to external evaluations of it. The National Riparian Service Team (NRST, 1999), which developed and provides training in PFC, states (emphasis added) that “PFC is: A qualitative assessment based on quantitative science.” NRST (1999) also notes that “PFC is not: A replacement for quantitative inventory or monitoring protocols.”
Independent evaluations (Stevens et al., 2002) of the PFC method documented several deficiencies and flaws in the method. These defects include the failure to consider and incorporate water quality and the inability of the method to provide a means to quantitatively assess trends or reliably compare conditions among locations (Stevens et al., 2002). For these combined reasons, the PFC is not at an adequate surrogate for properly assessing water quality and riparian conditions affected by grazing.
D. Alternatives to Consider in DEIS
At the very least, the Forest Service should develop an alternative to the PA that addresses the issues we have identified as necessary for wildlife conservation, for protecting riparian areas, and for addressing the impacts of grazing. Again, however, standards and guidelines for owls, fishers, woodpeckers, and the myriad other species that rely on dense, mature, conifer forest (both pre-fire and post-fire) are absolutely necessary in any Final Plan in order to ensure ecological integrity and the conditions necessary for wildlife viability.
We appreciate the opportunity to comment on the NOI and supporting package. If you have questions about these comments or would like to discuss them in more detail, please contact us. Thank you for your time, and we look forward to achieving a forest plan revision process that addresses all the necessary issues and incorporates the data and science we have presented.
Case 1:15-cv-01329-WBS-EPG Document 34-4 Filed 10/30/15 Page 146 of 147

42
Sincerely,
Justin Augustine Center for Biological Diversity 351 California St., Suite 600 San Francisco, CA 94104 503-910-9214 [email protected]
Chad Hanson, Ph.D., Ecologist John Muir Project P.O. Box 697 Cedar Ridge, CA 95924 (530) 273-9290 [email protected]
Case 1:15-cv-01329-WBS-EPG Document 34-4 Filed 10/30/15 Page 147 of 147
Copyright © 2022 FDOKUMEN