Cardiac motion analysis of a rat model for myocardial infarction using high-frame-rate stereo images
6
Abstract— By capturing three-dimensional motions of small markers on the heart of a small laboratory animal with 1000 fps stereo images, we realized a cardiac motion analysis sys- tem to quantify the rate of change in the myocardial area of its heart, which indicates the myocardium’s activity for a rhythmic expansion/contraction motion in a local area. Using this cardiac motion capture system, we analyzed the three- dimensional motion distributions in the heart of a rat model for myocardial infarction, which had heart rate of 4 times/s or greater. In the analysis, the characteristic cardiac motion in ischemic heart diseases was spatiotemporally quantified and it was seen that the infarction area on the heart of the rat caused by ischemia was spread around its left ventricle. I. INTRODUCTION EART disease is the leading cause of death in Europe and the U.S., killing six hundred thousand persons or more in the U.S. in 2006 [1]. In response to these statistics, many types of new drugs for heart disease have been vigorously developed, such as blockers [2] to decrease cardiac work- load and control heart rate and HMG CoA reductase inhibi- tors [3] to lower blood cholesterol levels. In the development of such new drugs, animal testing is inevitable for ensuring drug efficacy and safety quantitatively as a final screening test before human tests and clinical trials. In particularly, in the case of drugs for heart disease, in vivo quantification of the cardiac motions in laboratory animals leads to a more objective drug efficacy evaluation, because the degree of heart disease is directly reflected in cardiac motion. For the early diagnosis and treatment of human heart dis- ease, many types of noninvasive monitoring devices and methods for determining cardiac function have been intro- duced at numerous clinical sites, including electrocardio- graphy [4], echocardiography [5], coronary catheterization [6], and radioisotope scintigraphy [7]. These noninvasive monitoring methods have also been applied to cardiac func- tion analysis for small animal models of heart disease and many studies have already been conducted in order to quan- tify the area of myocardial infarction in laboratory rats by I. Ishii, T. Okuda, Y. Nie, and T. Takaki are with Hiroshima University, Hiroshima 739-8527, Japan (corresponding author: Idaku Ishii; phone: +81-82-424-7692; e-mail: [email protected]). K. Orito is with Azabu University, Kanagawa 229-8501, Japan A. Tanaka and H. Matsuda are with Tokyo University of Agriculture and Technology, Tokyo 183-0057, Japan. using echocardiogram [8] and SPECT imaging [9]. However, most of these conventional monitoring technologies are not always suitable to capture the cardiac motion distribution by assessing the local myocardial motions at multiple points on a heart, because there are few surface patterns on a heart, making it difficult to extract feature points accurately; further, it is difficult to attach a large number of markers to a heart without invasion. Compared to cardiac function monitoring in humans, noninvasiveness is not as severe a requirement in small laboratory animals. Often, in animal testing for heart disease, the chests of small animals are opened to generate heart disease artificially. Therefore, there is little problem with assessing their cardiac motions by opening their chests and observing their hearts directly using video cameras. In this study, we develop a cardiac motion capture system for the open chest of a small laboratory animal. This system can capture the three-dimensional (3D) motions of small markers on the heart using high-frame-rate stereo video cameras. As a quantification index for ischemic heart disease, the rate of change in myocardial area (RCMA) is introduced on the basis of the 3D cardiac motions at multiple points on a heart. To verify the performance of our cardiac motion cap- ture system, the cardiac motion of a rat model for myocardial infarction is actually quantified as the myocardium’s activity and the time-varying infarction distribution on its heart is visualized using an RCMA map. II. CARDIAC MOTION CAPTURE SYSTEM A. System Concept To quantify the spatial distribution of the local myocardial motions at multiple points on the heart of an open-chest small laboratory animal, a cardiac motion capture system is de- veloped on the basis of the following concepts. 1) Video capturing at a high frame rate Generally, the heart rate of a mature laboratory rat is 4~5 beats per second, which is 4 times that of a human. In the case of standard video capturing at 30 fps for such cardiac motion, only 6 points or slightly more are sampled per beat cycle, making it difficult to accurately analyze the waveforms for cardiac motion. Therefore, we capture the cardiac motion in a small laboratory animal by using stereo video cameras with a frame rate of 1000 fps, which is the same level as the sam- pling rate for an electrocardiogram signal. 2) Attachment of small markers on a heart Since the surface of a heart has few characteristic patterns, Cardiac Motion Analysis of a Rat Model for Myocardial Infarction Using High-Frame-Rate Stereo Images Idaku Ishii, Toshikazu Okuda, Yuman Nie, Takeshi Takaki Kensuke Orito, Akane Tanaka, and Hiroshi Matsuda H 6th annual IEEE Conference on Automation Science and Engineering Marriott Eaton Centre Hotel Toronto, Ontario, Canada, August 21-24, 2010 TuA1.3 978-1-4244-5448-8/10/$26.00 ©2010 IEEE 780
Transcript of Cardiac motion analysis of a rat model for myocardial infarction using high-frame-rate stereo images

Abstract— By capturing three-dimensional motions of small
markers on the heart of a small laboratory animal with 1000
fps stereo images, we realized a cardiac motion analysis sys-
tem to quantify the rate of change in the myocardial area of
its heart, which indicates the myocardium’s activity for a
rhythmic expansion/contraction motion in a local area. Using
this cardiac motion capture system, we analyzed the three- dimensional motion distributions in the heart of a rat model
for myocardial infarction, which had heart rate of 4 times/s or
greater. In the analysis, the characteristic cardiac motion in
ischemic heart diseases was spatiotemporally quantified and
it was seen that the infarction area on the heart of the rat
caused by ischemia was spread around its left ventricle.
I. INTRODUCTION
EART disease is the leading cause of death in Europe and
the U.S., killing six hundred thousand persons or more in
the U.S. in 2006 [1]. In response to these statistics, many
types of new drugs for heart disease have been vigorously
developed, such as � blockers [2] to decrease cardiac work-
load and control heart rate and HMG CoA reductase inhibi-
tors [3] to lower blood cholesterol levels. In the development
of such new drugs, animal testing is inevitable for ensuring
drug efficacy and safety quantitatively as a final screening
test before human tests and clinical trials. In particularly, in
the case of drugs for heart disease, in vivo quantification of
the cardiac motions in laboratory animals leads to a more
objective drug efficacy evaluation, because the degree of
heart disease is directly reflected in cardiac motion.
For the early diagnosis and treatment of human heart dis-
ease, many types of noninvasive monitoring devices and
methods for determining cardiac function have been intro-
duced at numerous clinical sites, including electrocardio-
graphy [4], echocardiography [5], coronary catheterization
[6], and radioisotope scintigraphy [7]. These noninvasive
monitoring methods have also been applied to cardiac func-
tion analysis for small animal models of heart disease and
many studies have already been conducted in order to quan-
tify the area of myocardial infarction in laboratory rats by
I. Ishii, T. Okuda, Y. Nie, and T. Takaki are with Hiroshima University,
Hiroshima 739-8527, Japan (corresponding author: Idaku Ishii; phone:
+81-82-424-7692; e-mail: [email protected]). K. Orito is with Azabu University, Kanagawa 229-8501, Japan
A. Tanaka and H. Matsuda are with Tokyo University of Agriculture and
Technology, Tokyo 183-0057, Japan.
using echocardiogram [8] and SPECT imaging [9]. However,
most of these conventional monitoring technologies are not
always suitable to capture the cardiac motion distribution by
assessing the local myocardial motions at multiple points on a
heart, because there are few surface patterns on a heart,
making it difficult to extract feature points accurately; further,
it is difficult to attach a large number of markers to a heart
without invasion. Compared to cardiac function monitoring
in humans, noninvasiveness is not as severe a requirement in
small laboratory animals. Often, in animal testing for heart
disease, the chests of small animals are opened to generate
heart disease artificially. Therefore, there is little problem
with assessing their cardiac motions by opening their chests
and observing their hearts directly using video cameras.
In this study, we develop a cardiac motion capture system
for the open chest of a small laboratory animal. This system
can capture the three-dimensional (3D) motions of small
markers on the heart using high-frame-rate stereo video
cameras. As a quantification index for ischemic heart disease,
the rate of change in myocardial area (RCMA) is introduced
on the basis of the 3D cardiac motions at multiple points on a
heart. To verify the performance of our cardiac motion cap-
ture system, the cardiac motion of a rat model for myocardial
infarction is actually quantified as the myocardium’s activity
and the time-varying infarction distribution on its heart is
visualized using an RCMA map.
II. CARDIAC MOTION CAPTURE SYSTEM
A. System Concept
To quantify the spatial distribution of the local myocardial
motions at multiple points on the heart of an open-chest small
laboratory animal, a cardiac motion capture system is de-
veloped on the basis of the following concepts.
1) Video capturing at a high frame rate
Generally, the heart rate of a mature laboratory rat is 4~5
beats per second, which is 4 times that of a human. In the case
of standard video capturing at 30 fps for such cardiac motion,
only 6 points or slightly more are sampled per beat cycle,
making it difficult to accurately analyze the waveforms for
cardiac motion. Therefore, we capture the cardiac motion in a
small laboratory animal by using stereo video cameras with a
frame rate of 1000 fps, which is the same level as the sam-
pling rate for an electrocardiogram signal.
2) Attachment of small markers on a heart
Since the surface of a heart has few characteristic patterns,
Cardiac Motion Analysis of a Rat Model for Myocardial Infarction
Using High-Frame-Rate Stereo Images
Idaku Ishii, Toshikazu Okuda, Yuman Nie, Takeshi Takaki
Kensuke Orito, Akane Tanaka, and Hiroshi Matsuda
H
6th annual IEEE Conference on Automation Science andEngineeringMarriott Eaton Centre HotelToronto, Ontario, Canada, August 21-24, 2010
TuA1.3
978-1-4244-5448-8/10/$26.00 ©2010 IEEE 780

the positions of local points on the surface cannot always be
identified accurately in the captured stereo videos using im-
age processing techniques such as feature point tracking.
Moreover, a heart is not suitable for image measurement with
active pattern projection from a projector, because of the
glossy mucus on the heart surface. In many cases of cardiac
function analysis in laboratory animals, there is no problem
with attaching markers to a heart directly, unless the markers
affect the cardiac motion. In order to clearly ascertain the
local points on a heart, we attach small, lightweight markers
to its surface, which have a color that is distinctly different
from that of the heart. Therefore, the 3D motions of the
markers can be accurately captured using the stereo video
images.
3) Area calculation for triangular regions
The 3D positions of the markers attached to a heart change
not only with the beating of the heart but also with body
movement when breathing; the breathing frequency of a la-
boratory rat is 1~2 times per second in a normal state. To
remove such motion artifacts of body movement, we intro-
duce the areas for triangular regions surrounded by neigh-
boring markers. These triangular areas are calculated by using
the 3D positions of the markers and are independent of the
normal vectors on the surface. As a result, we can quantify the
local myocardial expansion/contraction motions at multiple
points on the surface of a heart as its cardiac motions.
B. Configuration
In our cardiac motion capture system, the 3D positions of
small markers attached to the surface of the heart of an
open-chest laboratory animal are captured by using two
high-speed video cameras, as shown in Fig. 1(a).
As the high-speed video camera, FASTCAM MH4-10K of
Photron Limited was used, which simultaneously captures
8-bit color 512 × 512 pixel images at 1000 fps from two
camera heads. The locations of the two camera heads and the
measuring area for the heart of a small laboratory animal are
illustrated in Fig. 1(b). The two camera heads use the same
focal distance lens. The angles from their optical axes to the
vertical direction are 8° and -8°, respectively, and the distance
between the optical centers of their lenses is set to 118 mm.
The origin of the ��� coordinate system in 3D space is 334
mm below the midpoint between the optical centers. The
�-axis is vertical, the �-axis is parallel to the line determined
by the two optical centers, and the �-axis is perpendicular to
both the �-axis and the �-axis. In the experiment, the body of
a laboratory animal is set along the �-axis with its heart near
the origin. The measurement area in the �� space is 31 mm ×
31 mm at � = 0, which is close to the heart. The spatial res-
olutions at the origin are 0.061 mm in all the directions.
Fig. 2(a) shows blue-painted styrene foam spheres with
diameters of 0.50~0.75 mm, the color of which is obviously
different from that of a heart. The markers are attached to a
heart of a small laboratory animal, as shown in Fig. 2(b). On
the sticky surface covered with mucus, the markers remain
fixed at the same places on a heart without slipping even
when the heart is-beating, because the markers are very light.
In this study, we obtained the 3D positions of the markers
by executing the following image processing: 1) hue-based
color extraction to identify marker regions in the images, 2)
labeling to obtain 2D positions of the markers in the images,
3) triangulation to obtain the 3D positions of the markers on
the basis of the parallax between the left and right images.
After calculating these 3D positions, a triangular region is
assigned by selecting three neighboring markers. Let
�(= 1, ⋯ , �) be the number of a triangular region, and let the
3D coordinates of the three markers for the triangular region
� be ���(�), ���(�) , and ���(�) at time � . � denotes the
number of triangular regions to be assigned. The area ��(�) at
time � for triangular region � is calculated to quantify the
local myocardial expansion/contraction motion as
��(�) = 12 ����(�) − ���(�)�����(�) − ���(�)� . (1)
III. QUANTIFICATION INDEX FOR ISCHEMIC HEART DISEASE
In this paper, we introduce a quantification index to indi-
cate how myocardial necrotic regions spatiotemporally transit
on the surface of a heart in the case of ischemic heart disease
such as myocardial infarction. Here, we use the index based
on the abovementioned triangular areas, which can express
local expansion/contraction motion as cardiac motion without
motion artifacts from body movement, because there is no
local motion around a necrotic myocardium.
Fig. 1. Cardiac motion capture system for laboratory animal
illuminator
right high-speed
camera
lefthigh-speed
camera
laboratory animal
heart
334 mm
Z
XY
118 mm
8˚‒8˚
open-chest laboratory animal
heart
(a) overview (b) camera location
Fig. 2. Small markers for capturing cardiac motion
(a) small markers (b) heart with small markers
978-1-4244-5448-8/10/$26.00 ©2010 IEEE 781

[Cardiac motion signal]
Generally, the triangular area ��(�) in Eq. (1) is not uni-
form, because it is difficult to arrange all the markers on a
heart at regular intervals. Therefore, we define the following
normalized area ��(�) as a cardiac motion signal at time � to
indicate myocardial motion at triangular region � on a heart:
��(�) = ��(�)1
� � ��(�)���� !"���
, (� = 1, ⋯ , �). (2)
Here, � = �#$ is assumed as a standard time for normalization.
Divided by the moving average of triangular area ��(�) for
� = �#$ ~ �#$ + �, cardiac motion signal ��(�) is so norma-
lized that the moving average of ��(�) in every triangular
region is set to 1 around the standard time of � = �#$.
[Rate of change in myocardial area (RCMA)]
On the basis of the cardiac motion signal ��(�), RCMA at
time �, '�(�), is defined as a quantification index to indicate
local myocardial expansion/contraction motion in the trian-
gular region � on a heart,
'�(�) = �( �(�) − �) �(�)�̅�(�) , (� = 1, ⋯ , �). (3)
Here, �̅�(�), �( �(�), and �) �(�) are the average, maximum,
and minimum, respectively, of ��(�) for � = � ~ � + �,
�̅�(�) = 1Δ� , ��(-)�-
�!"�
�, (4)
�( �(�) = max23� ~ �!"� ��(-) , (5)
�) �(�) = min23� ~ �!"� ��(-) . (6)
When the local myocardial motion is large, that is, the
difference between the myocardial area in expansion and that
in contraction is large, '�(�) has a positive large value. When
there is no local myocardial motion, such as with necrosis,
'�(�) is approximately zero. Therefore, RCMA can quantify
the local activity of the myocardium to show time-varying
myocardial necrotic regions on a heart spatially in the case of
ischemic heart disease.
IV. EXPERIMENTAL EVALUATION
A. Experimental Settings
To evaluate our cardiac motion capture system, the cardiac
motion of a rat model for myocardial infarction, whose car-
diac function was lowered by ischemia, was spatiotemporally
quantified using RCMA.
In the experiment, we used a rat model for myocardial in-
farction [10], with a silk thread used for the ligation of the left
anterior descending coronary artery, which is often infarcted
in many cases of human myocardial infarction. The labora-
tory rat we used was a 14-month-old SD (Sprague-Dawley)
male rat, whose length and weight were 24 cm (not counting
its tail) and 600 g, respectively. The lengths of the major and
minor axes of its heart were 21 mm and 17 mm, respectively.
To prolong the life of the open-chest rat, the rat was ventilated
with isoflurane anesthesia using a small animal anesthetizer
(MK-V100/R, Muromachi Kikai Co., Ltd.).
Small blue markers were attached to the surface of the
heart as shown in Fig. 3(a), which shows an image captured
by the left-side camera. Seventy-two triangular regions were
used to calculate the cardiac motion signals and RCMAs.
These triangular regions were assigned numbers, as shown in
Fig. 3(b). In Fig. 3(a), the locations of the left ventricle, right
ventricle, and right atrium are indicated, whereas the left
atrium is hidden by the left ventricle in the captured images.
Several triangular regions were sometimes unobservable in
the case of occlusions in the images.
In the experiment, � = 0 min was the ligation time of the
left anterior descending coronary artery, and stereo images in
2.685 s were captured at 1000 fps in ten tests using � = 1, 4, 7,
10, 13, 16, 19, 22, 26, and 30 min. An RCMA map of the
heart was quantified offline by calculating the cardiac motion
signals for the triangular regions on the heart on the basis of
the stereo images. After this, the triangular area ��(�) was
calculated using its 20-ms interval moving average for noise
reduction. For a cardiac motion signal ��(�), the standard
time �#$ was set to � = 1 min, which is the nearest time to the
ligation time, and the interval Δ� used to calculate the average,
maximum, and minimum of ��(�) was set to 2.685 s, ex-
cluding irregular pulses.
B. Captured 3D Cardiac Motions
Fig. 4 shows a polygon display sequence for the 3D shape
of the heart of the rat taken at intervals of 0.085 s, which was
generated by the 3D positions of the markers at � = 1 min.
You can see that our cardiac motion capture system can ob-
serve and visualize the change in the three dimensional shape
of the heart while beating, which cannot be observed in detail
using only the naked eyes.
Fig. 5 shows the 3D position �89:(�) and area �9:(�) of a
triangular region on the right ventricle (� = 47 in Fig. 3(b))
for 2.685 s at � = 1 min. Here, the 3D position �89:(�) was
calculated as the average position of the three neighboring
markers for the triangular region (� = 47). For both the 3D
position and the area, periodical changes at a frequency of
approximately 4 Hz can be observed, corresponding to the
heartbeat of the rat. While the � and � coordinates changed
Fig. 3. Heart of a rat model for myocardial infarction
(b) labeled triangle regions(a) markers
left ventricle
right ventricle
right atrium
ligation point p = 8
p = 47
p = 57
978-1-4244-5448-8/10/$26.00 ©2010 IEEE 782

slightly by body movement from breathing, the triangular
area �9:(�) could be used to extract just the local myocardial
motion during expansion/contraction without motion artifacts
from body movement.
C. Cardiac Motion Signals
Fig. 6 shows the cardiac motion signals �;(�), �9:(�), and
�<:(�) for triangular regions on the left ventricle (� = 8), right
ventricle (� = 47), and right atrium (� = 57) for 2.685 s in the
case of capture at � = 1, 10, and 19 min, respectively. Fig. 7
shows the time-varying transitions of the average �̅�(�) ,
maximum �( �(�), and minimum �) �(�) of the cardiac mo-
tion signals for the triangular regions (� = 8, 47, 57). For all
the cardiac motion signals, periodical changes caused by the
beating of the heart can be observed, although the frequency
decreased slightly over time. After the ligation of the left
Fig. 4. Captured 3D shape of heart of a rat
Fig. 5. 3D position and area for a triangular region on the right ventricle
(� = 47) at � = 1 min.
Z17 mm
XY
17 mm
-17 mm-17 mm
17 mm
-17[mm]
0.085 s
Z17 mm
XY
17 mm
-17 mm-17 mm
17 mm
-17[mm]
0.170 s Z17 mm
XY
17 mm
-17 mm-17 mm
17 mm
-17[mm]
0.255 s
Z17 mm
XY
17 mm
-17 mm-17 mm
17 mm
-17[mm]
0.000 s
(a) � = 1 min
(b) � = 10 min
(c) � = 19 min
Fig. 6. Cardiac motion signals at � = 1 min, 10 min, and 19 min
978-1-4244-5448-8/10/$26.00 ©2010 IEEE 783

anterior descending coronary artery, the amplitude of the
vibration in the cardiac motion signal �;(�) for the left ven-
tricle decreased greatly. At � = 19 min, its maximum �( ;(�)
almost matched its minimum �) ;(�); that is, there was little
local expansion/contraction motion, and the average of the
myocardial area was almost the same as that at � = 1 min. The
amplitudes and waveforms of the vibrations in the cardiac
motion signals for the right ventricle, �9:(�), and right atrium,
�<:(�), were almost unchanged, except for irregular pulses,
which were often observed after � = 19 min, whereas their
averages became slightly lower than 1.
D. RCMA Map for Myocardial Infarction
Finally, an RCMA map for all the triangular regions was
quantified to visualize the spatiotemporal transition of the
infarction on the heart after the ligation of the left anterior
descending coronary artery. Fig. 8 shows the time-varying
transitions of the RCMAs, ';(�), '9:(�), and '<:(�), for the
left ventricle (� = 8), right ventricle (� = 47), and right atrium
(� = 57) at � = 1, 4, 7, 10, 13, 16, 19, 22, 26, and 30 min. Fig.
9 shows a sequence of RCMA maps for all the triangular
regions on the heart. Here, the RCMA maps were created by
mapping RCMA '�(�) on the corresponding triangular region
� of the heart in Fig. 3(b). The white regions in Fig. 9 had
strong local myocardial motion, whereas the black ones were
inactive myocardia. The regions marked with “x” had no
measurements.
(a) left ventricle (� = 8)
(b) right ventricle (� = 47)
(c) right atrium (� = 57)
Fig. 7. Temporal transitions of average, maximum, and minimum for
cardiac motion signals
Fig. 8. Temporal transitions of the RCMAs.
Fig. 9. RCMA maps for rat model of myocardial infarction
t = 30 min
0.0
t = 1 min t = 4 min
t = 7 min t = 10 min
t = 13 min t = 16 min
t = 19 min t = 22 min
t = 26 min t = 30 min
0.5
0.0
0.5
978-1-4244-5448-8/10/$26.00 ©2010 IEEE 784
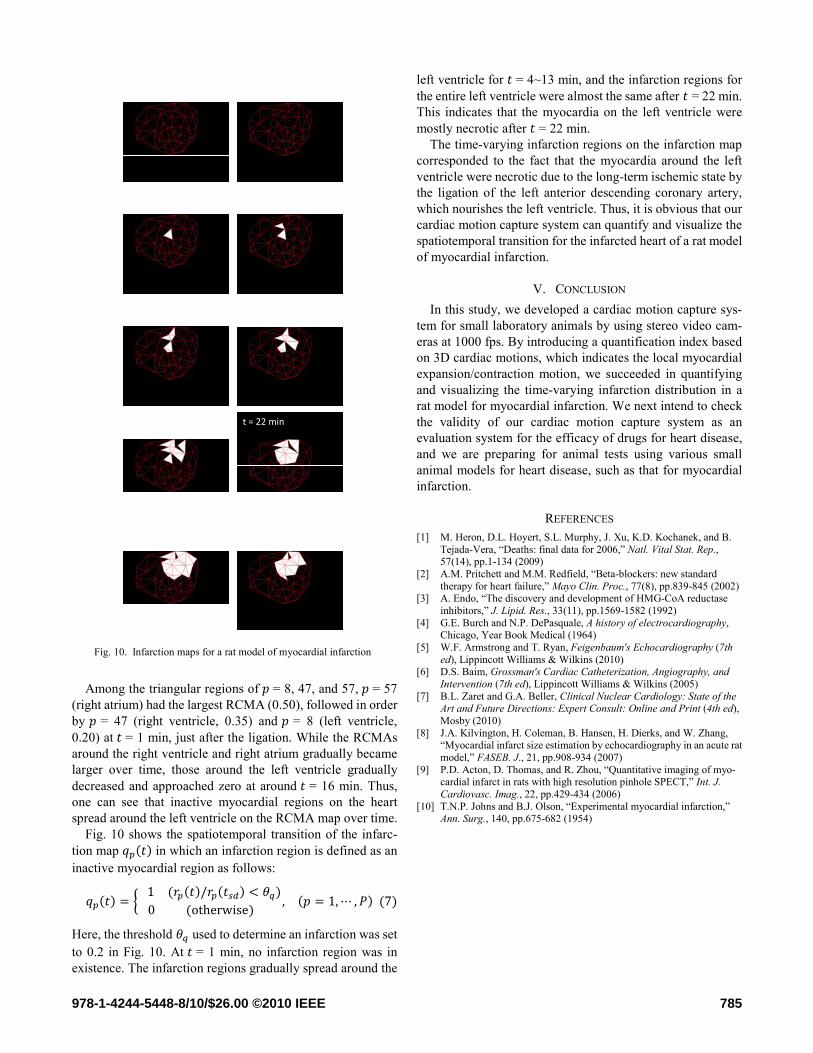
Among the triangular regions of � = 8, 47, and 57, � = 57
(right atrium) had the largest RCMA (0.50), followed in order
by � = 47 (right ventricle, 0.35) and � = 8 (left ventricle,
0.20) at � = 1 min, just after the ligation. While the RCMAs
around the right ventricle and right atrium gradually became
larger over time, those around the left ventricle gradually
decreased and approached zero at around � = 16 min. Thus,
one can see that inactive myocardial regions on the heart
spread around the left ventricle on the RCMA map over time.
Fig. 10 shows the spatiotemporal transition of the infarc-
tion map =�(�) in which an infarction region is defined as an
inactive myocardial region as follows:
=�(�) = > 1 ('�(�)/'�(�#$) < AB) 0 (otherwise) K , (� = 1, ⋯ , �) (7)
Here, the threshold AB used to determine an infarction was set
to 0.2 in Fig. 10. At � = 1 min, no infarction region was in
existence. The infarction regions gradually spread around the
left ventricle for � = 4~13 min, and the infarction regions for
the entire left ventricle were almost the same after � = 22 min.
This indicates that the myocardia on the left ventricle were
mostly necrotic after � = 22 min.
The time-varying infarction regions on the infarction map
corresponded to the fact that the myocardia around the left
ventricle were necrotic due to the long-term ischemic state by
the ligation of the left anterior descending coronary artery,
which nourishes the left ventricle. Thus, it is obvious that our
cardiac motion capture system can quantify and visualize the
spatiotemporal transition for the infarcted heart of a rat model
of myocardial infarction.
V. CONCLUSION
In this study, we developed a cardiac motion capture sys-
tem for small laboratory animals by using stereo video cam-
eras at 1000 fps. By introducing a quantification index based
on 3D cardiac motions, which indicates the local myocardial
expansion/contraction motion, we succeeded in quantifying
and visualizing the time-varying infarction distribution in a
rat model for myocardial infarction. We next intend to check
the validity of our cardiac motion capture system as an
evaluation system for the efficacy of drugs for heart disease,
and we are preparing for animal tests using various small
animal models for heart disease, such as that for myocardial
infarction.
REFERENCES
[1] M. Heron, D.L. Hoyert, S.L. Murphy, J. Xu, K.D. Kochanek, and B.
Tejada-Vera, “Deaths: final data for 2006,” Natl. Vital Stat. Rep., 57(14), pp.1-134 (2009)
[2] A.M. Pritchett and M.M. Redfield, “Beta-blockers: new standard
therapy for heart failure,” Mayo Clin. Proc., 77(8), pp.839-845 (2002) [3] A. Endo, “The discovery and development of HMG-CoA reductase
inhibitors,” J. Lipid. Res., 33(11), pp.1569-1582 (1992)
[4] G.E. Burch and N.P. DePasquale, A history of electrocardiography, Chicago, Year Book Medical (1964)
[5] W.F. Armstrong and T. Ryan, Feigenbaum's Echocardiography (7th
ed), Lippincott Williams & Wilkins (2010) [6] D.S. Baim, Grossman's Cardiac Catheterization, Angiography, and
Intervention (7th ed), Lippincott Williams & Wilkins (2005)
[7] B.L. Zaret and G.A. Beller, Clinical Nuclear Cardiology: State of the Art and Future Directions: Expert Consult: Online and Print (4th ed),
Mosby (2010)
[8] J.A. Kilvington, H. Coleman, B. Hansen, H. Dierks, and W. Zhang, “Myocardial infarct size estimation by echocardiography in an acute rat
model,” FASEB. J., 21, pp.908-934 (2007)
[9] P.D. Acton, D. Thomas, and R. Zhou, “Quantitative imaging of myo-cardial infarct in rats with high resolution pinhole SPECT,” Int. J.
Cardiovasc. Imag., 22, pp.429-434 (2006)
[10] T.N.P. Johns and B.J. Olson, “Experimental myocardial infarction,” Ann. Surg., 140, pp.675-682 (1954)
Fig. 10. Infarction maps for a rat model of myocardial infarction
t = 1 min t = 4 min
t = 7 min t = 10 min
t = 13 min t = 16 min
t = 19 min t = 22 min
t = 26 min t = 30 min
978-1-4244-5448-8/10/$26.00 ©2010 IEEE 785