Immunomodulatory properties of stem cells from human exfoliated deciduous teeth
Upload
univ-lorraineCategory
view
1download
0
ORIGINAL PAPER
Carbon isotopic signature of CO2 emitted by plantcompartments and soil in two temperate deciduous forests
Florence Maunoury-Danger & Nicolas Chemidlin Prevost Boure &
Jérôme Ngao &Daniel Berveiller &Claude Brechet & Eric Dufrene &Daniel Epron &
Jean-Christophe Lata & Bernard Longdoz & Caroline Lelarge-Trouverie &
Jean-Yves Pontailler & Kamel Soudani & Claire Damesin
Received: 28 July 2012 /Accepted: 29 October 2012# INRA and Springer-Verlag France 2012
Abstract& Context The carbon isotope composition of the CO2 efflux(δ13CE) from ecosystem components is widely used to in-vestigate carbon cycles and budgets at different ecosystemscales. δ13CE, was considered constant but is now known to
vary along seasons. The seasonal variations have rarely beencompared among different ecosystem components.& Aims We aimed to characterise simultaneously the season-al dynamics of δ13CE in different compartments of twotemperate broadleaved forest ecosystems.
Handling Editor: Erwin Dreyer
Contribution of the co-authors Florence Maunoury-Danger NicolasChemidlin Prevost Boure, Jérôme Ngao, Daniel Berveiller, ClaudeBrechet, Eric Dufrene, Daniel Epron, Jean-Christophe Lata, BernardLongdoz, Caroline Lelarge Trouverie, Jean-Yves Pontailler, KamelSoudani, Claire Damesin: performing practical work, field sampling,phenological and climatic measurements and isotopic analysis fromBarbeau and Hesse sites.Florence Maunoury-Danger Nicolas Chemidlin Prevost Boure, JérômeNgao, Bernard Longdoz, Daniel Epron, Claire Damesin: data analysesClaire Damesin: designing the experiment and coordinating theresearch projects ‘Ministère délégué à la recherche-ACI JeunesChercheurs’ (no. JC10009) and ‘Programme National ACI/FNS ECCOPNBC’ (convention no. 0429 FNS)Florence Maunoury-Danger: writing the paper
F. Maunoury-Danger (*) :N. Chemidlin Prevost Boure :K. Soudani :C. DamesinAgroPariTech, Ecologie Systématique et Evolution,UMR 8079, CNRS, Univ. Paris-Sud,Orsay 91405, Francee-mail: [email protected]
D. Berveiller : E. Dufrene : J.-Y. PontaillerCNRS, UMR 8079, Ecologie Systématique et Evolution,Orsay 91405, France
J. Ngao :C. Brechet : B. LongdozINRA, Écologie et Écophysiologie Forestières, UMR 1137,Champenoux 54280, France
D. EpronÉcologie et Écophysiologie Forestières, UMR 1137,Université de Lorraine,Vandoeuvre 54506, France
J.-C. LataUMR 7618, Ecole Normale Supérieure, UPMC-Bioemco,46 Rue d’Ulm,75230 Paris Cedex 05, France
C. Lelarge-TrouverieUMR 8618, Institut de Biotechnologie des Plantes,Univ. Paris-Sud,Orsay 91405, France
Present Address:F. Maunoury-DangerUniversité de Lorraine, LIEBE, CNRS, UMR 7146,Metz 57070, France
Present Address:J. NgaoINRA, Clermont Université Blaise Pascal, UMR 547 PIAF,63100 Clermont-Ferrand, France
Annals of Forest ScienceDOI 10.1007/s13595-012-0249-5
& Methods Using manual chambers and isotope ratio massspectrometry, we recorded simultaneously δ13CE and δ13Cof organic matter in sun leaves, current-year twigs, trunkbases and soil in an oak and a beech forest during 1 year.& Results In the two forests, δ13CE displayed a larger vari-ability in the tree components than in the soil. During theleafy period, a pronounced vertical zonation of δ13CE wasobserved between the top (sun leaves and twigs with highervalues) and bottom (trunk and soil with lower values) of theecosystem. No correlation was found between δ13CE andδ13C of organic matter. Causes for these seasonal variationsand the vertical zonation in isotope signature are discussed.& Conclusion Our study shows clear differences in values aswell as seasonal dynamics of δ13CE among different com-ponents in the two ecosystems. The temporal and localvariation of δ13CE cannot be inferred from organic mattersignature or CO2 emission rates.
Keywords Carbon isotopic composition . CO2 efflux . Oakforest . Beech forest
AbbreviationsET Trunk CO2 effluxES Soil CO2 effluxEECO Ecosystem CO2 effluxδ13C Carbon isotope compositionδ13CE Carbon isotope composition of CO2 effluxδ13CEECO δ13CE of ecosystemδ13CEL δ13CE of leavesδ13CETG δ13CE of twigsδ13CET δ13CE of trunkδ13CES δ13CE of soilδ13COM δ13C of total organic matterδ13COM δ13COM of leafδ13COMT δ13COM of twigδ13COMT δ13COM of trunkδ13COMS δ13C of soil total organic matterDoy Day of year
1 Introduction
The carbon isotope composition (δ13C) of CO2 is nowcommonly used at the ecosystem level as a natural tracerto investigate carbon processes and their responses to envi-ronmental conditions. Approaches coupling isotopic andmass balance are used to partition ecosystem CO2 efflux(EECO) and photosynthetic fluxes (Zobitz et al. 2007). Theδ13C of EECO (δ13CEECO) is used to infer ecosystem orregional C sink strength by inversion modelling. Largeuncertainties are remaining about the interpretation ofδ13CEECO, mainly due to the multi-source nature of EECO,and the temporal variability of δ13C values of EECO
components and their contributions to EECO (Bowling etal. 2002; Hemming et al. 2005). Until recently, δ13CE valuesused to interpret δ13CEECO were considered to be similaramong different ecosystem components (i.e., soil, roots,trunk, twigs and leaves) (Kodama et al. 2008).
So far, few studies have examined δ13CE of severalcomponents concurrently: between leaf and soil (Mortazaviet al. 2005), trunk and soil (Kodama et al. 2008) or differentplant organs (Eglin et al. 2009; Kuptz et al. 2011); theyshowed significant differences in δ13CE among the targetedcomponents. Moreover, the δ13CE for a given component canexhibit a high seasonal or diurnal variability, up to 10‰ forleaves (Hymus et al. 2005; Prater et al. 2005), 4‰ for twigs(Damesin and Lelarge 2003), 3–5.5‰ for trunks(Maunoury et al. 2007; Ubierna et al. 2009) and 4.2‰for soil (Ngao et al. 2005, Marron et al. 2009). However,only a few of these studies included wintertime measure-ments (Damesin and Lelarge 2003; Maunoury et al. 2007;Kuptz et al. 2011).
Seasonal variations in δ13CE have been related to severalfactors such as environmental conditions several days beforemeasurements (Bowling et al. 2002; Ekblad et al. 2005),canopy stomatal conductance (Mc Dowell et al. 2004), thenature and/or δ13C of respiratory substrates (Damesin andLelarge 2003; Kuptz et al. 2011) or to other metabolicprocesses, such as variations in respiratory pathways(Tcherkez et al. 2003; Kuptz et al. 2011). Recently, a com-prehensive study concluded that seasonal δ13CE patterns inone ecosystem were similar for the different components ofbeech and spruce and between both species (Kuptz et al.2011), also showing maximal differences for the trunk be-tween summer and winter. The question now arising is howrecurrent are seasonal patterns (1) for a given species atdifferent environmental conditions and (2) between closelyrelated species depending on leaf phenology.
In this context, we focused on the spatio-temporal δ13CE
dynamics of the main tree components (leaves, twigs andtrunks) and soil in two temperate broadleaved forest ecosys-tems. The main objectives of this study were (1) to quantifydifferences in δ13CE among components and (2) to charac-terize their seasonal variation, in particular between the twomain phenological periods (i.e. leafy and winter period), andtheir potential link with environmental parameters (air andsoil temperature, relative humidity, vapour pressure deficit),CO2 efflux rates and the respective total organic matterδ13C. Synchronous in situ measurements of CO2 efflux ratesand δ13CE were performed throughout 1 year in an oak(Quercus petraea L.) and a beech (Fagus sylvatica L.) forestusing isotope mass spectrometry measurements. In order tovalidate CO2 field-sampling methods adapted to leaf andtwig components (Prater et al. 2005; Werner et al. 2007), wecompared two methods of tissue incubation, with CO2-freeair or N2 flushes usable under field conditions.
F. Maunoury-Danger et al.
2 Materials and methods
2.1 Study sites and experimental setup
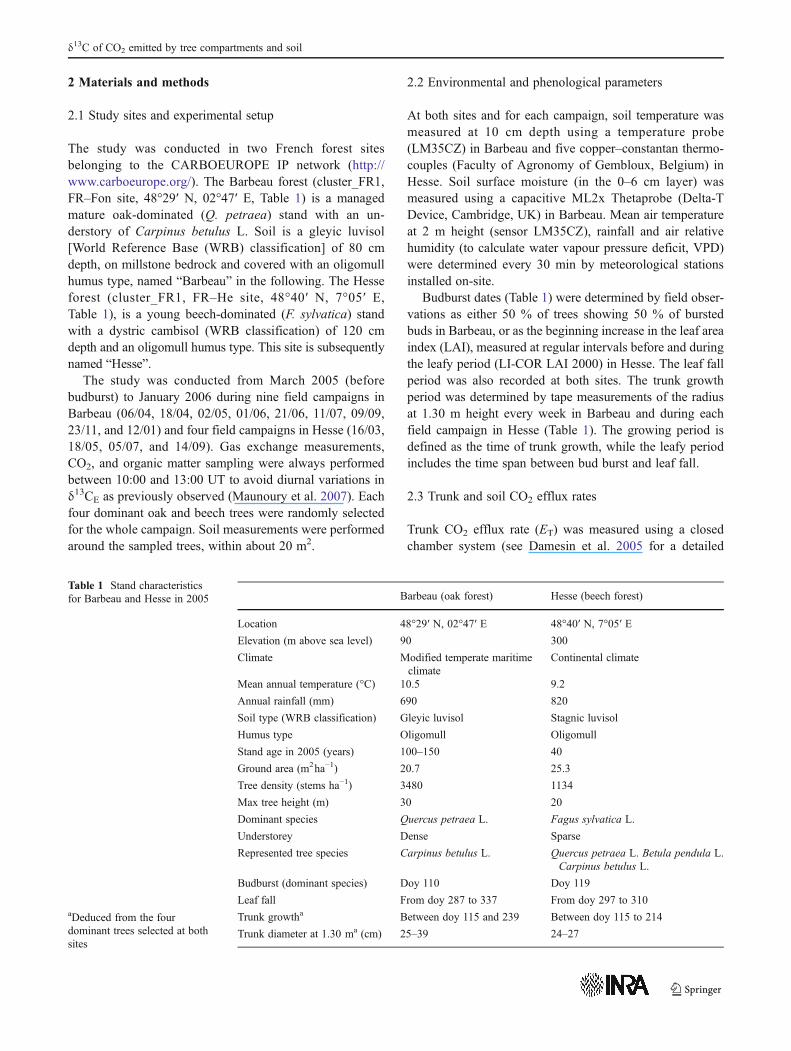
The study was conducted in two French forest sitesbelonging to the CARBOEUROPE IP network (http://www.carboeurope.org/). The Barbeau forest (cluster_FR1,FR–Fon site, 48°29′ N, 02°47′ E, Table 1) is a managedmature oak-dominated (Q. petraea) stand with an un-derstory of Carpinus betulus L. Soil is a gleyic luvisol[World Reference Base (WRB) classification] of 80 cmdepth, on millstone bedrock and covered with an oligomullhumus type, named “Barbeau” in the following. The Hesseforest (cluster_FR1, FR–He site, 48°40′ N, 7°05′ E,Table 1), is a young beech-dominated (F. sylvatica) standwith a dystric cambisol (WRB classification) of 120 cmdepth and an oligomull humus type. This site is subsequentlynamed “Hesse”.
The study was conducted from March 2005 (beforebudburst) to January 2006 during nine field campaigns inBarbeau (06/04, 18/04, 02/05, 01/06, 21/06, 11/07, 09/09,23/11, and 12/01) and four field campaigns in Hesse (16/03,18/05, 05/07, and 14/09). Gas exchange measurements,CO2, and organic matter sampling were always performedbetween 10:00 and 13:00 UT to avoid diurnal variations inδ13CE as previously observed (Maunoury et al. 2007). Eachfour dominant oak and beech trees were randomly selectedfor the whole campaign. Soil measurements were performedaround the sampled trees, within about 20 m2.
2.2 Environmental and phenological parameters
At both sites and for each campaign, soil temperature wasmeasured at 10 cm depth using a temperature probe(LM35CZ) in Barbeau and five copper–constantan thermo-couples (Faculty of Agronomy of Gembloux, Belgium) inHesse. Soil surface moisture (in the 0–6 cm layer) wasmeasured using a capacitive ML2x Thetaprobe (Delta-TDevice, Cambridge, UK) in Barbeau. Mean air temperatureat 2 m height (sensor LM35CZ), rainfall and air relativehumidity (to calculate water vapour pressure deficit, VPD)were determined every 30 min by meteorological stationsinstalled on-site.
Budburst dates (Table 1) were determined by field obser-vations as either 50 % of trees showing 50 % of burstedbuds in Barbeau, or as the beginning increase in the leaf areaindex (LAI), measured at regular intervals before and duringthe leafy period (LI-COR LAI 2000) in Hesse. The leaf fallperiod was also recorded at both sites. The trunk growthperiod was determined by tape measurements of the radiusat 1.30 m height every week in Barbeau and during eachfield campaign in Hesse (Table 1). The growing period isdefined as the time of trunk growth, while the leafy periodincludes the time span between bud burst and leaf fall.
2.3 Trunk and soil CO2 efflux rates
Trunk CO2 efflux rate (ET) was measured using a closedchamber system (see Damesin et al. 2005 for a detailed
Table 1 Stand characteristicsfor Barbeau and Hesse in 2005
aDeduced from the fourdominant trees selected at bothsites
Barbeau (oak forest) Hesse (beech forest)
Location 48°29′ N, 02°47′ E 48°40′ N, 7°05′ E
Elevation (m above sea level) 90 300
Climate Modified temperate maritimeclimate
Continental climate
Mean annual temperature (°C) 10.5 9.2
Annual rainfall (mm) 690 820
Soil type (WRB classification) Gleyic luvisol Stagnic luvisol
Humus type Oligomull Oligomull
Stand age in 2005 (years) 100–150 40
Ground area (m2ha−1) 20.7 25.3
Tree density (stems ha−1) 3480 1134
Max tree height (m) 30 20
Dominant species Quercus petraea L. Fagus sylvatica L.
Understorey Dense Sparse
Represented tree species Carpinus betulus L. Quercus petraea L. Betula pendula L.Carpinus betulus L.
Budburst (dominant species) Doy 110 Doy 119
Leaf fall From doy 287 to 337 From doy 297 to 310
Trunk growtha Between doy 115 and 239 Between doy 115 to 214
Trunk diameter at 1.30 ma (cm) 25–39 24–27
δ13C of CO2 emitted by tree compartments and soil
description). Briefly, a cylindrical polymethyl methacrylate(PMMA) chamber was temporarily fixed on the trunk,cleaned of mosses and lichens, with a rubber sealant(Terosta-7, Teroson, Ludwigsburg, Germany) and connectedto an infrared gas analyser (IRGA, EGM4, PPSystems,Hitchin, UK). The installation was considered to be leak-free if blowing air along the seals caused no increase in theCO2 level inside the chamber. A fan provided air mixingwithin the chamber. Once tightly fixed to the trunk, thechamber was purged from accumulated CO2 by opening a5-cm diameter lid. Once back to ambient CO2 concentra-tions, the lid was closed to allow CO2 accumulation. Threeto four ET measurements of 2 min during linear CO2 in-crease were performed each time. The ET values were de-termined from the slope of CO2 concentration increase andexpressed per unit volume of living tissue (i.e., phloem andsapwood; in μmolm−3 living tissues−1). For beech, thewhole trunk volume was considered because living cellsoccur all along the trunk radius (Ceschia et al. 2002). Foreach oak tree, the living tissue cross-section was determinedfrom a trunk core collected near the chamber at the end ofthe campaign. The chambers were reinstalled at the sameplace during each campaign.
Soil CO2 efflux (ES) was measured using two differentclosed dynamic systems (Ngao et al. 2006; ChemidlinPrévost-Bouré et al. 2009): In Barbeau, an EGM4 wasconnected to a homemade PMMA chamber (25.4 L,12 cm height), while in Hesse, a Li-6200 (LI-COR Inc.,Lincoln, NE, USA) IRGA was used with the Li-6000-9chamber. In both cases, the soil chamber was put on collarspreviously inserted into the soil under the canopy (500 and110 mm diameter in Barbeau and Hesse respectively,inserted 2–3 cm deep) at the beginning of the year, allowingmeasurements at the same place during field sessions. Twocollars were installed at Barbeau and three at Hesse. ES
values were calculated from the slope of CO2 increase andexpressed per surface area (in μmolm−2 soils−1).
2.4 CO2 sampling for isotopic analysis
2.4.1 Incubation tests
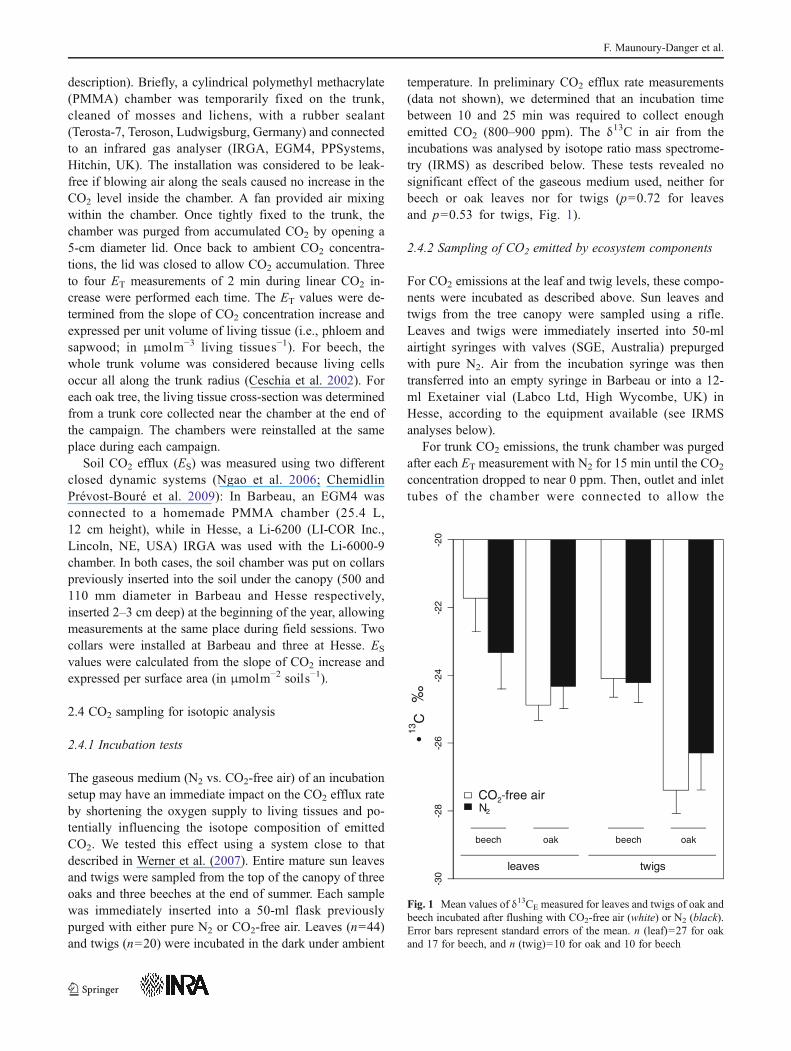
The gaseous medium (N2 vs. CO2-free air) of an incubationsetup may have an immediate impact on the CO2 efflux rateby shortening the oxygen supply to living tissues and po-tentially influencing the isotope composition of emittedCO2. We tested this effect using a system close to thatdescribed in Werner et al. (2007). Entire mature sun leavesand twigs were sampled from the top of the canopy of threeoaks and three beeches at the end of summer. Each samplewas immediately inserted into a 50-ml flask previouslypurged with either pure N2 or CO2-free air. Leaves (n044)and twigs (n020) were incubated in the dark under ambient
temperature. In preliminary CO2 efflux rate measurements(data not shown), we determined that an incubation timebetween 10 and 25 min was required to collect enoughemitted CO2 (800–900 ppm). The δ13C in air from theincubations was analysed by isotope ratio mass spectrome-try (IRMS) as described below. These tests revealed nosignificant effect of the gaseous medium used, neither forbeech or oak leaves nor for twigs (p00.72 for leavesand p00.53 for twigs, Fig. 1).
2.4.2 Sampling of CO2 emitted by ecosystem components
For CO2 emissions at the leaf and twig levels, these compo-nents were incubated as described above. Sun leaves andtwigs from the tree canopy were sampled using a rifle.Leaves and twigs were immediately inserted into 50-mlairtight syringes with valves (SGE, Australia) prepurgedwith pure N2. Air from the incubation syringe was thentransferred into an empty syringe in Barbeau or into a 12-ml Exetainer vial (Labco Ltd, High Wycombe, UK) inHesse, according to the equipment available (see IRMSanalyses below).
For trunk CO2 emissions, the trunk chamber was purgedafter each ET measurement with N2 for 15 min until the CO2
concentration dropped to near 0 ppm. Then, outlet and inlettubes of the chamber were connected to allow the
•13C
beech oak beech oak
leaves twigs
N2
‰
Fig. 1 Mean values of δ13CE measured for leaves and twigs of oak andbeech incubated after flushing with CO2-free air (white) or N2 (black).Error bars represent standard errors of the mean. n (leaf)027 for oakand 17 for beech, and n (twig)010 for oak and 10 for beech
F. Maunoury-Danger et al.
accumulation of CO2 emitted by the trunk. After an increaseof 700–800 ppm (during approximately 10 min in summerand 90 min in winter), the air in the chamber headspace,containing CO2 originating only from ET, was sampledusing a 50-ml syringe and analysed by IRMS. Again, thisN2 flushing approach gave the same results as that using aCO2 free-air flush or estimating the δ13C of emitted CO2
with the Keeling plot method (Damesin et al. 2005).For CO2 emitted by soil, the Keeling plot method
(Keeling 1958) was applied to determine the δ13CE of ES
(Chemidlin Prévost-Bouré et al. 2009). The sampling setupconsisted of 50-ml airtight syringes in Barbeau, or a home-made sampling device by-passing the Li-6200 air circuit(see Ngao et al. 2005 for details) in Hesse. After each ES
measurement, CO2 concentration was allowed to increaseagain within the closed system. During this increase, five airsamples were taken at steps of 50–100 ppm within a 400–1000 ppm range inside Exetainer vials or 50-ml syringe andanalysed by IRMS. From the Keeling plots, the δ13CES foreach collar was estimated using the ordinary least squareregression model (Zobitz et al. 2007). δ13CES was deter-mined as the intercept of the linear regression between theinverse of the CO2 concentration and the δ13C of the airsamples. δ13CES values having a standard error >5 % of theestimated value were discarded.
2.5 Sampling of plant and soil material for isotopic analysis
At both sites and for each campaign, trunk phloem samplesof the four trees were taken using a core borer (0.5 cmdiameter) at the chamber level or up to 30 cm above.Leaves and twigs used for the incubations and phloemsamples were lyophilised and powdered using a ball mill(Type MM200, Retsch, Haan, Germany). Four soil cores(0–15 cm depth and 1.2 cm diameter) were sampledabout 15 cm away from each collar. Soil samples didnot include litter or roots.
2.6 IRMS analyses
To maintain airtight conditions, gas-filled syringes wereprocessed within 12 h by laboratories close to the sites.Gas samples from the Barbeau were analysed with a NA-1500 elemental analyser (Carlo Erba, Milan, Italy) coupledto a VG Optima IRMS (Fison, Villeurbanne, France), asdescribed by Maunoury et al. (2007). Those from Hessewere injected into a gas purification device (Gas–Bench II,ThermoFinnigan, Bremen, Germany) coupled to a Delta SIRMS (ThermoFinnigan, Bremen, Germany). All solidsamples were analysed with the NA-1500/IRMS setup.
All δ13C values were expressed relative to the Vienna PeeDee Belemnite international standard. Different laboratoryworking standards (glutamic acid, –28.06‰ for organic
matter samples; air with 500 μmolmol−1 of CO2, –53.10‰for air samples) were measured after each group of 12 samplesto correct for any offset of the IRMS. The precision forisotopic measurements was ±0.2‰, based on repeatedmeasurements of the laboratory working standards. BothIRMS systems were inter-calibrated for gas analyses usingthe same reference gas as above, revealing a discrepancy of0.7‰ that was removed to the values measured at Hesse tohave comparable values between both sites.
2.7 Statistical analysis
Pearson’s correlation coefficients were calculated betweenδ13CE of each component and climatic data or CO2 effluxrates solely at Barbeau where measurements were morefrequent. All climatic variables from the measurement dayand the day before were tested.
Pearson correlations were also established between δ13CE
of different components. Non-parametric Kruskal–Wallisrank sum tests should reveal differences among componentsat each site, and during the two main phenological periods,followed by Mann–Whitney tests to compare one compo-nent to another.
A one-way ANOVA was applied to compare δ13CE
measurements in the incubation tests with N2 or CO2-freeair flushings.
All analyses were performed using Statistica (version7, Statsoft Inc., USA) and R 2.11.1 (R developmentcore team 2010).
3 Results
3.1 CO2 efflux rates
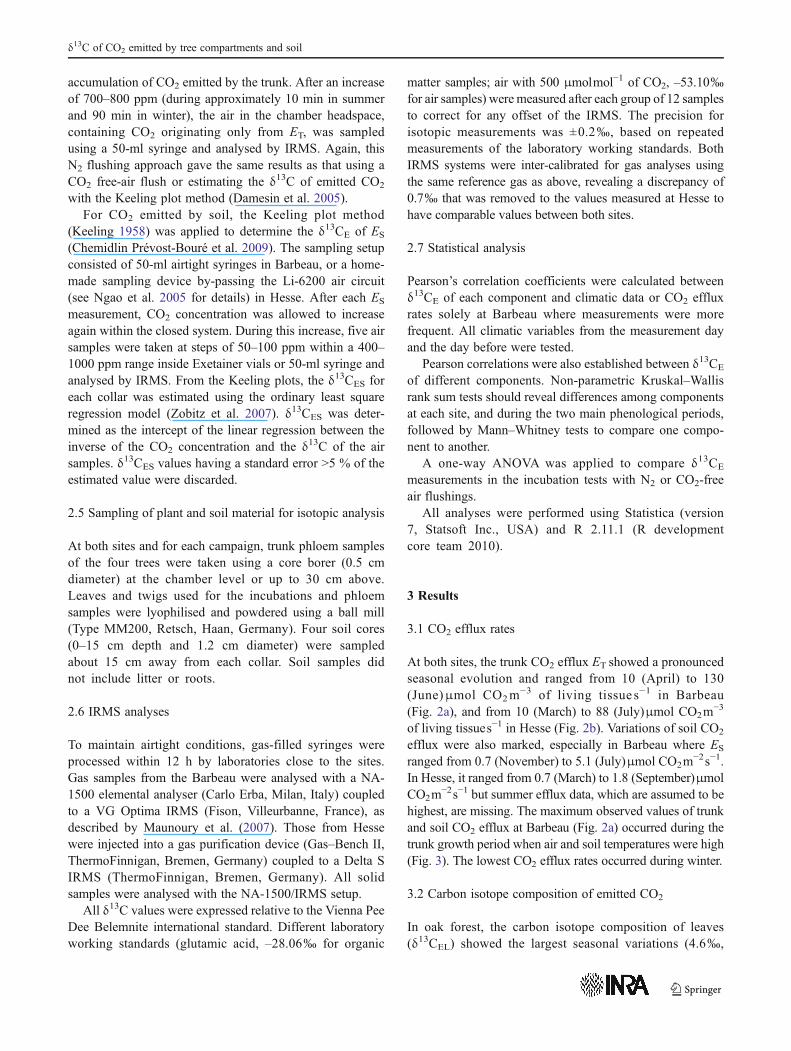
At both sites, the trunk CO2 efflux ET showed a pronouncedseasonal evolution and ranged from 10 (April) to 130(June)μmol CO2m
−3 of living tissue s−1 in Barbeau(Fig. 2a), and from 10 (March) to 88 (July)μmol CO2m
−3
of living tissues−1 in Hesse (Fig. 2b). Variations of soil CO2
efflux were also marked, especially in Barbeau where ES
ranged from 0.7 (November) to 5.1 (July)μmol CO2m−2s−1.
In Hesse, it ranged from 0.7 (March) to 1.8 (September)μmolCO2m
−2s−1 but summer efflux data, which are assumed to behighest, are missing. The maximum observed values of trunkand soil CO2 efflux at Barbeau (Fig. 2a) occurred during thetrunk growth period when air and soil temperatures were high(Fig. 3). The lowest CO2 efflux rates occurred during winter.
3.2 Carbon isotope composition of emitted CO2
In oak forest, the carbon isotope composition of leaves(δ13CEL) showed the largest seasonal variations (4.6‰,
δ13C of CO2 emitted by tree compartments and soil
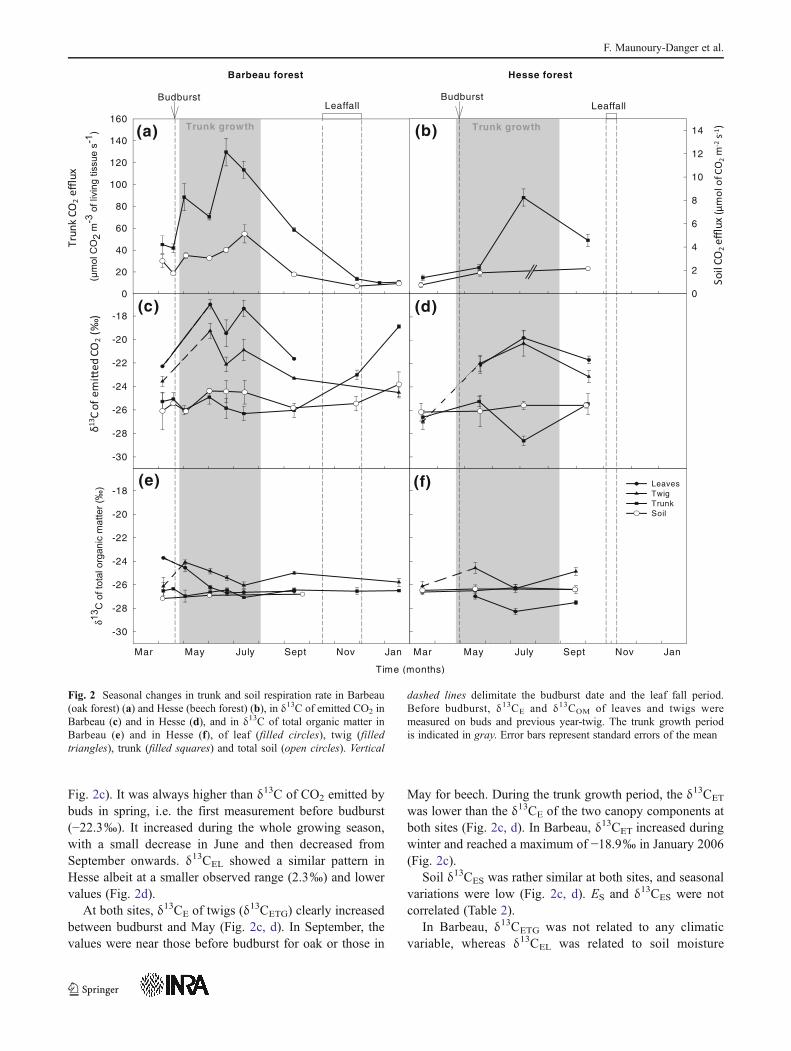
Fig. 2c). It was always higher than δ13C of CO2 emitted bybuds in spring, i.e. the first measurement before budburst(−22.3‰). It increased during the whole growing season,with a small decrease in June and then decreased fromSeptember onwards. δ13CEL showed a similar pattern inHesse albeit at a smaller observed range (2.3‰) and lowervalues (Fig. 2d).
At both sites, δ13CE of twigs (δ13CETG) clearly increasedbetween budburst and May (Fig. 2c, d). In September, thevalues were near those before budburst for oak or those in
May for beech. During the trunk growth period, the δ13CET
was lower than the δ13CE of the two canopy components atboth sites (Fig. 2c, d). In Barbeau, δ13CET increased duringwinter and reached a maximum of −18.9‰ in January 2006(Fig. 2c).
Soil δ13CES was rather similar at both sites, and seasonalvariations were low (Fig. 2c, d). ES and δ13CES were notcorrelated (Table 2).
In Barbeau, δ13CETG was not related to any climaticvariable, whereas δ13CEL was related to soil moisture
Time (months)
-30
-28
-26
-24
-22
-20
-18
LeavesTwigTrunkSoil
0
20
40
60
80
100
120
140
160
-30
-28
-26
-24
-22
-20
-18
(c) (d)
(a) (b)
(f)
BudburstLeaffall
Mar May July Sept Nov JanMar May July Sept Nov Jan
(e)
LeaffallBudburst
Hesse forestBarbeau forest
Trunk growth Trunk growth
0
2
4
6
8
10
12
14
Fig. 2 Seasonal changes in trunk and soil respiration rate in Barbeau(oak forest) (a) and Hesse (beech forest) (b), in δ13C of emitted CO2 inBarbeau (c) and in Hesse (d), and in δ13C of total organic matter inBarbeau (e) and in Hesse (f), of leaf (filled circles), twig (filledtriangles), trunk (filled squares) and total soil (open circles). Vertical
dashed lines delimitate the budburst date and the leaf fall period.Before budburst, δ13CE and δ13COM of leaves and twigs weremeasured on buds and previous year-twig. The trunk growth periodis indicated in gray. Error bars represent standard errors of the mean
F. Maunoury-Danger et al.
(p00.041, Table 2) and δ13CET was related to air and soiltemperature (p00.011 and p00.012, Table 2) and vapourpressure deficit (p00.033). δ13CES values were only relatedto soil moisture (p00.006). Moreover, δ13CET wasnegatively related to ET and to ES (r0−0.715; p00.030and r0−0.667; p00.050, respectively, Table 2). If only thevalues from the leafy period were kept, correlations betweenδ13CEL and δ13CETG (r00.955; p00.011), δ13CES (r00.917;p00.029) and soil moisture (r00.960; p00.041), andbetween δ13CES and soil moisture (r00.966; p00.034) wereremaining.
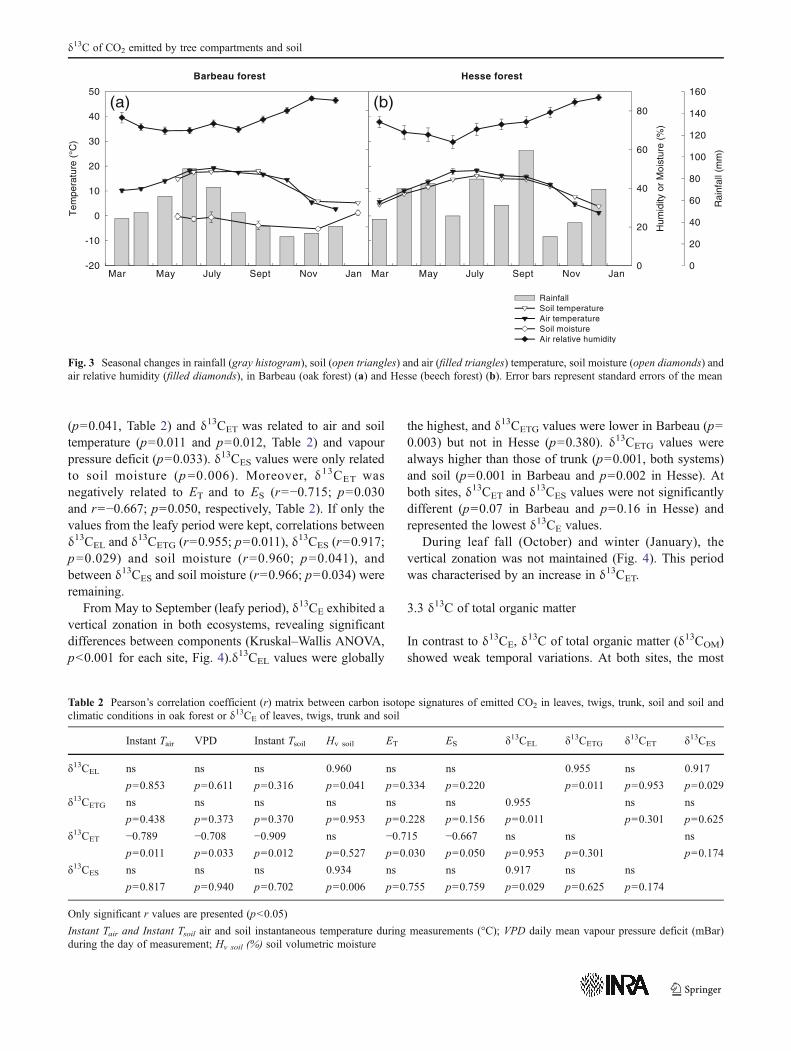
From May to September (leafy period), δ13CE exhibited avertical zonation in both ecosystems, revealing significantdifferences between components (Kruskal–Wallis ANOVA,p<0.001 for each site, Fig. 4).δ13CEL values were globally
the highest, and δ13CETG values were lower in Barbeau (p00.003) but not in Hesse (p00.380). δ13CETG values werealways higher than those of trunk (p00.001, both systems)and soil (p00.001 in Barbeau and p00.002 in Hesse). Atboth sites, δ13CET and δ13CES values were not significantlydifferent (p00.07 in Barbeau and p00.16 in Hesse) andrepresented the lowest δ13CE values.
During leaf fall (October) and winter (January), thevertical zonation was not maintained (Fig. 4). This periodwas characterised by an increase in δ13CET.
3.3 δ13C of total organic matter
In contrast to δ13CE, δ13C of total organic matter (δ13COM)
showed weak temporal variations. At both sites, the mostH
umid
ity o
r M
oist
ure
(%)
0
20
40
60
80
Rai
nfal
l (m
m)
0
20
40
60
80
100
120
140
160
May July Sept Nov JanMarMay July Sept Nov JanMar
tserof esseHtserof uaebraBT
empe
ratu
re (
°C)
-20
-10
0
10
20
30
40
50
RainfallSoil temperatureAir temperatureSoil moistureAir relative humidity
(a) (b)
Fig. 3 Seasonal changes in rainfall (gray histogram), soil (open triangles) and air (filled triangles) temperature, soil moisture (open diamonds) andair relative humidity (filled diamonds), in Barbeau (oak forest) (a) and Hesse (beech forest) (b). Error bars represent standard errors of the mean
Table 2 Pearson’s correlation coefficient (r) matrix between carbon isotope signatures of emitted CO2 in leaves, twigs, trunk, soil and soil andclimatic conditions in oak forest or δ13CE of leaves, twigs, trunk and soil
Instant Tair VPD Instant Tsoil Hv soil ET ES δ13CEL δ13CETG δ13CET δ13CES
δ13CEL ns ns ns 0.960 ns ns 0.955 ns 0.917
p00.853 p00.611 p00.316 p00.041 p00.334 p00.220 p00.011 p00.953 p00.029
δ13CETG ns ns ns ns ns ns 0.955 ns ns
p00.438 p00.373 p00.370 p00.953 p00.228 p00.156 p00.011 p00.301 p00.625
δ13CET −0.789 −0.708 −0.909 ns −0.715 −0.667 ns ns ns
p00.011 p00.033 p00.012 p00.527 p00.030 p00.050 p00.953 p00.301 p00.174
δ13CES ns ns ns 0.934 ns ns 0.917 ns ns
p00.817 p00.940 p00.702 p00.006 p00.755 p00.759 p00.029 p00.625 p00.174
Only significant r values are presented (p<0.05)
Instant Tair and Instant Tsoil air and soil instantaneous temperature during measurements (°C); VPD daily mean vapour pressure deficit (mBar)during the day of measurement; Hv soil (%) soil volumetric moisture
δ13C of CO2 emitted by tree compartments and soil
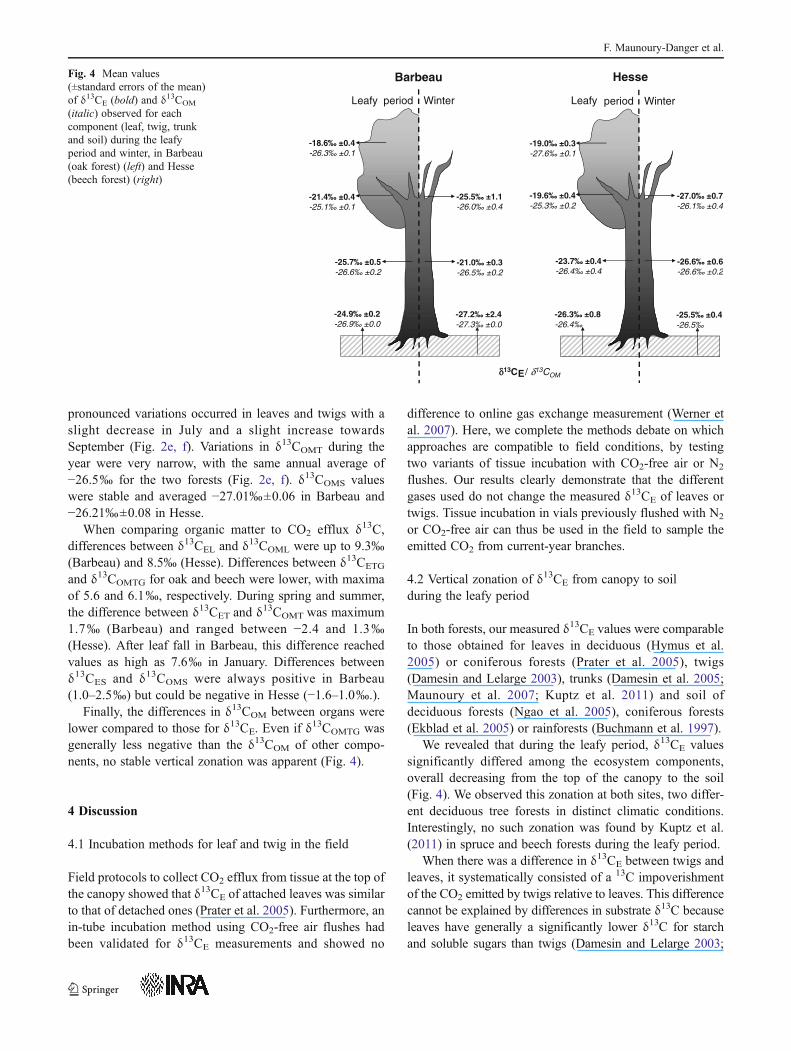
pronounced variations occurred in leaves and twigs with aslight decrease in July and a slight increase towardsSeptember (Fig. 2e, f). Variations in δ13COMT during theyear were very narrow, with the same annual average of−26.5‰ for the two forests (Fig. 2e, f). δ13COMS valueswere stable and averaged −27.01‰±0.06 in Barbeau and−26.21‰±0.08 in Hesse.
When comparing organic matter to CO2 efflux δ13C,differences between δ13CEL and δ13COML were up to 9.3‰(Barbeau) and 8.5‰ (Hesse). Differences between δ13CETG
and δ13COMTG for oak and beech were lower, with maximaof 5.6 and 6.1‰, respectively. During spring and summer,the difference between δ13CET and δ13COMT was maximum1.7‰ (Barbeau) and ranged between −2.4 and 1.3‰(Hesse). After leaf fall in Barbeau, this difference reachedvalues as high as 7.6‰ in January. Differences betweenδ13CES and δ13COMS were always positive in Barbeau(1.0–2.5‰) but could be negative in Hesse (−1.6–1.0‰.).
Finally, the differences in δ13COM between organs werelower compared to those for δ13CE. Even if δ13COMTG wasgenerally less negative than the δ13COM of other compo-nents, no stable vertical zonation was apparent (Fig. 4).
4 Discussion
4.1 Incubation methods for leaf and twig in the field
Field protocols to collect CO2 efflux from tissue at the top ofthe canopy showed that δ13CE of attached leaves was similarto that of detached ones (Prater et al. 2005). Furthermore, anin-tube incubation method using CO2-free air flushes hadbeen validated for δ13CE measurements and showed no
difference to online gas exchange measurement (Werner etal. 2007). Here, we complete the methods debate on whichapproaches are compatible to field conditions, by testingtwo variants of tissue incubation with CO2-free air or N2
flushes. Our results clearly demonstrate that the differentgases used do not change the measured δ13CE of leaves ortwigs. Tissue incubation in vials previously flushed with N2
or CO2-free air can thus be used in the field to sample theemitted CO2 from current-year branches.
4.2 Vertical zonation of δ13CE from canopy to soilduring the leafy period
In both forests, our measured δ13CE values were comparableto those obtained for leaves in deciduous (Hymus et al.2005) or coniferous forests (Prater et al. 2005), twigs(Damesin and Lelarge 2003), trunks (Damesin et al. 2005;Maunoury et al. 2007; Kuptz et al. 2011) and soil ofdeciduous forests (Ngao et al. 2005), coniferous forests(Ekblad et al. 2005) or rainforests (Buchmann et al. 1997).
We revealed that during the leafy period, δ13CE valuessignificantly differed among the ecosystem components,overall decreasing from the top of the canopy to the soil(Fig. 4). We observed this zonation at both sites, two differ-ent deciduous tree forests in distinct climatic conditions.Interestingly, no such zonation was found by Kuptz et al.(2011) in spruce and beech forests during the leafy period.
When there was a difference in δ13CE between twigs andleaves, it systematically consisted of a 13C impoverishmentof the CO2 emitted by twigs relative to leaves. This differencecannot be explained by differences in substrate δ13C becauseleaves have generally a significantly lower δ13C for starchand soluble sugars than twigs (Damesin and Lelarge 2003;
Leafy Leafyperiod Winter
Barbeau Hesse
-25.7‰ ±0.5-26.6‰ ±0.2
-24.9‰ ±0.2-26.9‰ ±0.0
-25.5‰ ±1.1-26.0‰ ±0.4
-21.0‰ ±0.3-26.5‰ ±0.2
-27.2‰ ±2.4-27.3‰ ±0.0
period Winter
-23.7‰ ±0.4-26.4‰ ±0.4
-26.3‰ ±0.8-26.4‰
-27.0‰ ±0.7-26.1‰ ±0.4
-26.6‰ ±0.6-26.6‰ ±0.2
-25.5‰ ±0.4-26.5‰
-19.0‰ ±0.3-27.6‰ ±0.1
-19.6‰ ±0.4-25.3‰ ±0.2
-18.6‰ ±0.4-26.3‰ ±0.1
-21.4‰ ±0.4-25.1‰ ±0.1
Fig. 4 Mean values(±standard errors of the mean)of δ13CE (bold) and δ13COM
(italic) observed for eachcomponent (leaf, twig, trunkand soil) during the leafyperiod and winter, in Barbeau(oak forest) (left) and Hesse(beech forest) (right)
F. Maunoury-Danger et al.
Eglin et al. 2009). The gap between δ13CEL and δ13CETG
might be related to a difference in the balance of CO2
released by either pyruvate decarboxylation (resulting in13C-enriched CO2) or by the Krebs cycle (resulting in 13C-depleted CO2, Tcherkez et al. 2003; Gessler et al. 2009).
The main hypotheses explaining differences in δ13CE
between twigs and trunks are (1) an isotope discriminationduring the assimilate transport in the phloem along twigsand trunk (Damesin and Lelarge 2003; Gessler et al. 2007),(2) changes in PEPc activity (Gessler et al. 2009; Kuptz etal. 2011), known to discriminate against 12C during carbonfixation (Cernusak et al. 2009), (3) or a substantial contri-bution of belowground-evolved CO2 brought by the xylemsap stream to the upper part of the tree, i.e., in the trunk(Aubrey and Teskey 2009; Grossiord et al. 2012). Otherprocesses may contribute to the 13C impoverishment intrunk compared to twigs, especially the progressive mixingalong metabolite translocation from sun and shade leavesvia twigs to trunk (Eglin et al. 2010). It will be interesting toaddress in future studies in more detail the reasons for thedifferential isotope discrimination in twigs and trunk foundin our study.
Comparable values of isotope composition of CO2 effluxin trunk and soil may be explained by the coupling of bothcomponents via C assimilates. Carbon substrates are rapidlytransferred in broadleaved species from trunk to roots andvia root exudates also to soil microorganisms (Dannoura etal. 2011; Epron et al. 2011). The comparable values fortrunk and soil also suggest that contrary to substratetranslocations from leaves to twigs, there is no apparentisotope discrimination during carbon translocation fromtrunk to soil.
4.3 Seasonal variations in δ13CE
Seasonal ranges of emitted CO2 δ13C were in agreementwith ranges previously observed for beech leaves (Eglin etal. 2009), beech twigs (Damesin and Lelarge 2003), oaktrunks (Maunoury et al. 2007) and hardwood forest soil(Mortazavi et al. 2005; Marron et al. 2009). Our maximumδ13CE values of leaves and twigs have been obtained duringsummer, in agreement with δ13CE of a coniferous forestecosystem (Bowling et al. 2002; Mortazavi et al. 2005)but oppositely to δ13CE of a deciduous forest ecosystem(Mortazavi et al. 2005).
δ13CE seasonal variations in leaves might be related tochanges in respiratory substrate δ13C due to variable 13Cdiscrimination during C assimilation. The latter is itselflinked to environmental conditions like soil moisture(Mortazavi et al. 2005). The correlation between δ13CEL
and δ13CETG (Table 2) suggests that δ13CETG variability islinked to the same mechanisms as that of δ13CEL. Theincrease in δ13CET in winter might be explained by a switch
of respiratory substrates from photosynthesis-derived sugars(lower δ13C) during the leafy period to stored carbohy-drates, i.e. starch with higher δ13C, in the dormancy periodas suggested before (Maunoury et al. 2007; Kuptz et al.2011). Another explanation for these winter values is that,during winter time, transpiration is null and δ13CET was nomore influenced by a possible contribution of belowground-evolved CO2. Surprisingly, we did not observe any increasein δ13CE for twigs, which, like trunks, probably use starch asmain respiratory substrate. This unexpected difference be-tween trunk and twig δ13CE may be explained by a meta-bolic discrepancy such as, e.g. differences in PEPc activity,during winter. Correlations between δ13CET and ET or airtemperature have already been observed by Maunoury et al.(2007) in the same oak forest, with comparable correlationcoefficients, suggesting that the respiration rate, which isinfluenced by air temperature, affects δ13CET.
During the leafy period, respiratory substrates are partiallyderived from C recently assimilated by leaves and trans-ported by the phloem towards the trunk base and roots(Dannoura et al. 2011; Epron et al. 2011) and may finallyend up via root exudates as organic matter in the soil. Such asubstrate similarity between trunk and soil may result inδ13CES values close to those measured for trunk during theleafy period. In contrast, during winter, a lack C assimilationlowers dramatically this recent C source for soil respiration,while trunk stored compounds with higher δ13C valuessupply substrates for ET. Furthermore, carbon supplies tothe soil via root exudates are much lower or nil duringwinter. In addition, the heterotrophic component, i.e. micro-bial respiration, contributes more to the soil CO2 efflux andto δ13CES than during the leafy period (Epron et al. 2001).This decoupling between trunk and soil respiratory substratepools therefore may explain the significant differences inδ13CE of both components in winter.
At the soil and ecosystem level, temporal variations ofδ13CE have been explained by environmental conditionswith or without time lag (from 1 to 10 days) before mea-surement (e.g. Bowling et al. 2002; Ekblad et al. 2005;Marron et al. 2009). The present study showed a differentialimpact of environmental conditions on the δ13CE of thedifferent components studied., Specifically, in contrast toother studies, we found no correlation between δ13CEL orδ13CETG and climate (Mc Dowell et al. 2004; Mortazavi etal. 2005), which might be explained by the lower measure-ment frequency in our study. Yet, we found several correla-tions of environmental factors with δ13CET, suggesting thatthe trunk data integrate the overall climate effect on the tree.This argument can be supported by the facts that (1) a time lagexists for substrate transport in phloem from leaves to soil(Barnard et al. 2007) and (2) a progressive mixing of severaldifferent substrates (e.g. recent vs. stored compounds, top vs.bottom of tree canopy) along this C translocation.
δ13C of CO2 emitted by tree compartments and soil
Lastly, the general enrichment of δ13CE in comparisonwith δ13COM has been classically highlighted in previousstudies (Damesin and Lelarge 2003; Klumpp et al. 2005;Maunoury et al. 2007). Our results show a mismatchbetween the δ13CE of each component and δ13COM of themature leaf, but these discrepancies were not stable through-out the year. Thus, our results invalidate the hypothesis ofBowling et al. (2008) that bulk leaf δ13C can be used as areference value to predict differences between δ13CE andδ13COM of plant components and ecosystem.
5 Conclusion
Our study highlights isotopic differences of CO2 emitted bythe top (sun leaves and twigs) and the bottom of the forest(trunk base and soil) both with regard to higher δ13C valuesduring the leafy period (higher at the top) and of seasonaldynamics (higher at the top). Variations in substrate δ13C(via the use of stored compounds or a mixing effect) mightbe the major—but not the only—explanation for these dif-ferences. Our study confirmed that δ13C of CO2 emitted bythe forest components cannot be deduced from the δ13C ofthe total organic matter of the component, or from CO2
efflux intensity. Nowadays, high frequency measurementsby tunable diode laser spectroscopy allow the analysis oftemporal dynamics in δ13CE (Marron et al. 2009), especiallyduring winter time, and offer thus better possibilities tounderstand inherent variability its link to metabolicprocesses.
Acknowledgements The authors are grateful to the Office Nationaldes Forêts, especially M. Bénard, for facilitating experimental work atBarbeau. We acknowledge N. Bréda (INRA Nancy, France) for trunkgrowth measurements at Hesse. The platform Métabolisme-Métabolomeof the IFR87 is acknowledged for the isotope measurements. We aregrateful to M. Danger and X. Raynaud for valuable discussions on themanuscript and to E. M. Gross for revising the manuscript. We thank twoanonymous reviewers and the editor for their helpful comments andimprovements to the manuscript.
Funding This research was funded by the French projects ‘Ministèredélégué à la recherche-ACI Jeunes Chercheurs’ (no. JC10009) and‘Programme National ACI/FNS ECCO, PNBC’ (convention no. 0429FNS) and by the ESE laboratory thanks to funds from Paris-SudUniversity and CNRS.
References
Aubrey DP, Teskey RO (2009) Root-derived CO2 efflux via xylemstream rivals soil CO2 efflux. New Phytol 184:35–40
Barnard RL, Salmon Y, Kodama N, Sörgel K, Holst J, Rennenberg H,Gessler A, Buchmann N (2007) Evaporative enrichment and timelags between δ18O of leaf water and organic pools in a pine stand.Plant Cell Environ 30:539–550
Bowling D, Mc Dowell N, Bond B, Law B, Ehleringer J (2002) 13Ccontent of ecosystem respiration is linked to precipitation andvapor pressure deficit. Oecologia 131:113–124
Bowling D, Pataki D, Randerson J (2008) Carbon isotopes in terrestrialecosystem pools and CO2 fluxes. New Phytol 178:24–40
Buchmann N, Guel JM, Barigah TS, Ehleringer JR (1997) Interseasonalcomparison of CO2 concentrations, isotopic composition and car-bon dynamics in an Amazonian rainforest (French Guiana).Oecologia 110:120–131
Cernusak LA, Tcherkez G, Keitel C, Cornwell WK, Santiago LS,Knohl A, Barbour MM, Williams DG, Reich PB, Ellsworth DS,Dawson TE, Griffiths HG, Farquhar GD, Wright IJ (2009) Whyare non-photosynthetic tissues generally 13C enriched comparedwith leaves in C3 plants? Review and synthesis of currenthypotheses. Funct Plant Biol 36:199–213
Ceschia E, Damesin C, Lebaube S, Pontailler J, Dufrene E (2002)Spatial and seasonal variations in stem respiration of beech trees(Fagus sylvatica). Ann For Sci 59:801–812
Chemidlin Prévost-Bouré N, Ngao J, Berveiller D, Bonal D, Damesin C,Dufrêne E, Lata JC, Le Dantec V, Longdoz B, Ponton S, Soudani K,Epron D (2009) Root exclusion through trenching does not affectthe isotopic composition of soil CO2 efflux. Plant Soil 319:1–13
Damesin C, Lelarge C (2003) Carbon isotope composition of current-year shoots from Fagus sylvatica in relation to growth, respirationand use of reserves. Plant Cell Environ 26:207–219
Damesin C, Barbaroux C, Berveiller D, Lelarge C, Chaves M, MaguasC, Maia R, Pontailler JY (2005) The carbon isotope compositionof CO2 respired by trunks: comparison of four sampling methods.Rapid Commun Mass Spectrom 19:369–374
Dannoura M, Maillard P, Fresneau C, Plain C, Berveiller D, Gerant D,Chipeaux C, Bosc A, Ngao J, Damesin C, Loustau D, Epron D(2011) In situ assessment of the velocity of carbon transfer bytracing 13C in trunk CO2 efflux after pulse labelling: variationsamong tree species and seasons. New Phytol 190:181–192
Eglin T, Francois C, Michelot A, Delpierre N, Damesin C (2010)Linking intra-seasonal variations in climate and tree-ring δ13C:A functional modelling approach. Ecol Model 221:1779–1797
Eglin T, Fresneau C, Lelarge-Trouverie C, François C, Damesin C(2009) Leaf and twig δ13C during growth in relation to biochem-ical composition and respired CO2. Tree Physiol 29:777–788
Ekblad A, Bostrom B, Holm A, Comstedt D (2005) Forest soilrespiration rate and δ13C is regulated by recent above groundweather conditions. Oecologia 143:136–142
Epron D, Le Dantec V, Dufrene E, Granier A (2001) Seasonal dynamicsof soil carbon dioxide efflux and stimulated rhizosphere respirationin a beech forest. Tree Physiol 21:145–152
Epron D, Ngao J, Dannoura M, Bakker MR, Zeller B, Bazot S, Bosc A,Plain C, Lata JC, Priault P, Barthes L, Loustau D (2011) Seasonalvariations of belowground carbon transfer assessed by in situ13CO2 pulse labelling of trees. Biogeosciences 8:1153–1168
Gessler A, Keitel C, Kodama N, Weston C, Winters AJ, Keith H, GriceK, Leuning R, Farquhar GD (2007) δ13C of organic mattertransported from the leaves to the roots in Eucalyptus delegatensis:short-term variations and relation to respired CO2. Funct Plant Biol34:692–706
Gessler A, Tcherkez G, Karyanto O, Keitel C, Ferrio JP, Ghashghaie J,Kreuzwieser J, Farquhar GD (2009) On the metabolic originof the carbon isotope composition of CO2 evolved fromdarkened light-adapted leaves in Ricinus communis. NewPhytol 181:374–386
Grossiord C, Mareschal L, Epron D (2012) Transpiration alters thecontribution of autotrophic and heterotrophic components of soilCO2 efflux. New Phytol 194:647–653. doi:10.1111/j.1469-8137.2012.04102.x
Hemming D et al (2005) Pan-European δ13C values of air and organicmatter from forest ecosystems. Glob Chang Biol 11:1065–1093
F. Maunoury-Danger et al.
Hymus G, Maseyk K, Valentini R, Yakir D (2005) Large daily varia-tion in 13C enrichment of leaf respired CO2 in two Quercus forestcanopies. New Phytol 167:377–384
Keeling CD (1958) The concentration and isotopic abundances ofatmospheric carbon dioxide in rural areas. Geochim CosmochimAc 13:322–334
Klumpp K, Schaufele R, Lotscher M, Lattanzi F, Feneis W, SchnyderH (2005) C-isotope composition of CO2 respired by shoots androots: fractionation during dark respiration? Plant Cell Environ28:241–250
Kodama N et al (2008) Temporal dynamics of the carbon isotopecomposition in a Pinus sylvestris stand: from newly assimilatedorganic carbon to respired carbon dioxide. Oecologia 156:737–750
Kuptz D, Matyssek R, Grams TEE (2011) Seasonal dynamics in thestable carbon isotope composition (δ13C) from non-leafy branch,trunk and coarse root CO2 efflux of adult deciduous (Fagussylvatica) and evergreen (Picea abies) trees. Plant Cell Environ34:363–373
Marron N, Plain C, Longdoz B, Epron D (2009) Seasonal and dailytime course of the 13C composition in soil CO2 efflux recordedwith a tunable diode laser spectrophotometer (TDLS). Plant Soil318:137–151
Maunoury F, Berveiller D, Lelarge C, Pontailler J, Vanbostal L,Damesin C (2007) Seasonal, daily and diurnal variations in thestable carbon isotope composition of carbon dioxide respired bytree trunks in a deciduous oak forest. Oecologia 151:268–279
Mc Dowell N, Bowling DR, Bond BJ, Irvine J, Law BE, Anthoni P,Ehleringer JR (2004) Response of the carbon isotopic content ofecosystem, leaf, and soil respiration to meteorological and
physiological driving factors in a Pinus ponderosa ecosystem.Global biogeochem cy 18:1–12
Mortazavi B, Chanton J, Prater J, Oishi A, Oren R, Katul G (2005)Temporal variability in 13C of respired CO2 in a pine and ahardwood forest subject to similar climatic conditions.Oecologia 142:57–69
Ngao J, Epron D, Brechet C, Granier A (2005) Estimating the contri-bution of leaf litter decomposition to soil CO2 efflux in a beechforest using 13C-depleted litter. Glob Chang Biol 11:1768–1776
Ngao J, Longdoz B, Perrin D, Vincent G, Epron D, Le Dantec V,Soudani K, Aubinet M, Willm F, Granier A (2006) Cross-calibration functions for soil CO2 efflux measurment systems.Ann For Sci 63:477–484
Prater J, Mortazavi B, Chanton J (2005) Diurnal variation of the δ13Cof pine needle respired CO2 evolved in darkness. Plant CellEnviron 29:202–211
Tcherkez G, Nogues S, Bleton J, Cornic G, Badeck F, Ghashghaie J(2003) Metabolic origin of carbon isotope composition of leafdark-respired co2 in french bean. Plant Physiol 131:237–244
Ubierna N, Marshall JD, Cernusak LA (2009) A new method tomeasure carbon isotope composition of CO2 respired by trees:stem CO2 equilibration. Funct Ecol 23:1050–1058
Werner C, Hasenbein N, Maia R, Beyschlag W, Maguas C (2007)Evaluating high time-resolved changes in carbon isotope ratio ofrespired CO2 by a rapid in-tube incubation technique. RapidCommun Mass Spectrom 21:1352–1360
Zobitz J, Burns S, Ogee J, Reichstein M, Bowling D (2007)Partitioning net ecosystem exchange of CO2: a comparison of aBayesian/isotope approach to environmental regression methods.J Geophys Res 112:G03013
δ13C of CO2 emitted by tree compartments and soil
Copyright © 2022 FDOKUMEN