Microtaphofacies: Exploring the Potential for Taphonomic Analysis in Carbonates
Upload
unipartenopCategory
view
0download
0
This article appeared in a journal published by Elsevier. The attachedcopy is furnished to the author for internal non-commercial researchand education use, including for instruction at the authors institution
and sharing with colleagues.
Other uses, including reproduction and distribution, or selling orlicensing copies, or posting to personal, institutional or third party
websites are prohibited.
In most cases authors are permitted to post their version of thearticle (e.g. in Word or Tex form) to their personal website orinstitutional repository. Authors requiring further information
regarding Elsevier’s archiving and manuscript policies areencouraged to visit:
http://www.elsevier.com/copyright
Author's personal copy
Carbon-isotope stratigraphy and cyclostratigraphy of shallow-marinecarbonates: the case of San Lorenzello, Lower Cretaceous of southern Italy
Sabrina Amodio a,c,*, Vittoria Ferreri b,c, Bruno D’Argenio b,c, Helmut Weissert d, Mario Sprovieri c
a DiSAm, Dipartimento di Scienze Ambientali, Universita degli Studi ‘‘Parthenope’’, Centro Direzionale, isola C4, 80143 Naples, Italyb Dipartimento di Scienze della Terra, Universita degli Studi ‘‘Federico II’’, 80138 Naples, Italyc IAMC, Istituto per l’Ambiente Marino Costiero, CNR, 80133, Naples, Italyd Geological Institute, ETH, 8092 Zurich, Switzerland
a r t i c l e i n f o
Article history:Received 16 February 2006Accepted in revised form 4 May 2008Available online 19 June 2008
Keywords:Valanginian-HauterivianC-isotopesCarbonate platformSouthern ApenninesSea-level oscillationsLong-distance correlation
a b s t r a c t
A high-resolution (cm-scale) carbon-isotope stratigraphic study has been carried out at San Lorenzello(Matese Mountains, southern Apennines, Italy) on a shallow marine carbonate section previouslycorrelated with coeval sections by using a combination of biostratigraphic, cyclostratigraphic, andsequence-stratigraphic criteria. This succession, deposited along the southern margin of the AlpineTethys, is late Valanginiandearly Hauterivian in age; it consists of a hierarchy of shallowing-upwardcycles (elementary cycles, bundles, and superbundles) linked to Earth’s orbital oscillations.We estimate that the influence of the depositional environment and diagenesis on the d13C signal isnegligible and that the carbon-isotope composition of bulk carbonate, as well as of the individual grains,indicate a similar response to an original climate-ocean forcing. However, no clear relationship emergesbetween the d13C variations and the sea-level changes.The long-term d13C oscillations have been correlated with the coeval curves from the hemipelagic LaCharce (Vocontian Basin, France) and from the pelagic Capriolo (southern Alps, northern Italy) sections.This comparison suggests that the C-isotope signature is well preserved at San Lorenzello, where onlythe upper part of the global Valanginian carbon isotope excursion is recorded in the outcrop. Theavailable data allowed us to: (a) relate the shallow-marine stratigraphic record with the ammonite andnannofossil biozonation and the magnetostratigraphy; (b) locate, in the shallow-marine deposits studied,the Valanginian-Hauterivian boundary on the basis of the high-resolution carbon-isotope correlationwith the La Charce and Capriolo sections; (c) compare the time duration of about 2.9 my, estimated bySan Lorenzello orbital chronostratigraphy, with the� 3 my reported for the same stratigraphic interval inChannell et al. (1995) and Gradstein et al. (2004).
� 2008 Elsevier Ltd. All rights reserved.
1. Introduction
The Early Cretaceous C-isotope record is punctuated by severalhigh-amplitude positive d13C excursions (Jenkyns, 1995; Weissertet al., 1998; Erba et al., 1999; Herrle et al., 2004; Weissert andErba, 2004; Wissler et al., 2004). One of the most prominentexcursions, spanning the upper Valanginiandlower Hauterivian,is documented in several marine sections in the Tethyan, Atlantic,and Pacific domains (Lini et al., 1992; Follmi et al., 1994; Henniget al., 1999; Schootbrugge van de et al., 2000; Bersezio et al.,2002; Erba et al., 2004) as well as in fossil wood records (Grockeet al., 1999; Robinson and Hesselbo, 2004). The above perturba-tions are accompanied by sparse occurrence of carbon-rich blackshales and coeval decline in nannoconid abundance (Channell
et al., 1993; Bersezio et al., 2002; Erba et al., 2004). These changeshave been associated with significant volcanic events inducinghigh CO2 levels in the atmosphere (Lini et al., 1992; Renne et al.,1996; Weissert et al., 1998). This was also a time of carbonateplatform drowning in the northern Tethyan and central Atlanticrealms (Schlager, 1981; Follmi et al., 1994). In this frame,high-resolution studies combining lithostratigraphy and bio-stratigraphy with magneto- and isotope-stratigraphy, have evi-denced relationships between C-cycle and global-scale tectonic,paleoceanographic, climatic, and biotic changes. It also haveallowed to correlate basinal domains and continental settingswith their shallow-water equivalents (Lini et al., 1992; Channellet al., 1993; Follmi et al., 1994; Hennig et al., 1999; Melinte andMutterlose, 2001; Price and Mutterlose, 2004; Weissert and Erba,2004; Grocke et al., 2005).
In the above context, we have carried out a cm-scale carbon-isotope study on the upper Valanginiandlower Hauterivian San
* Corresponding author.E-mail address: [email protected] (S. Amodio).
Contents lists available at ScienceDirect
Cretaceous Research
journal homepage: www.elsevier .com/locate/CretRes
0195-6671/$ – see front matter � 2008 Elsevier Ltd. All rights reserved.doi:10.1016/j.cretres.2008.05.022
Cretaceous Research 29 (2008) 803–813
Author's personal copy
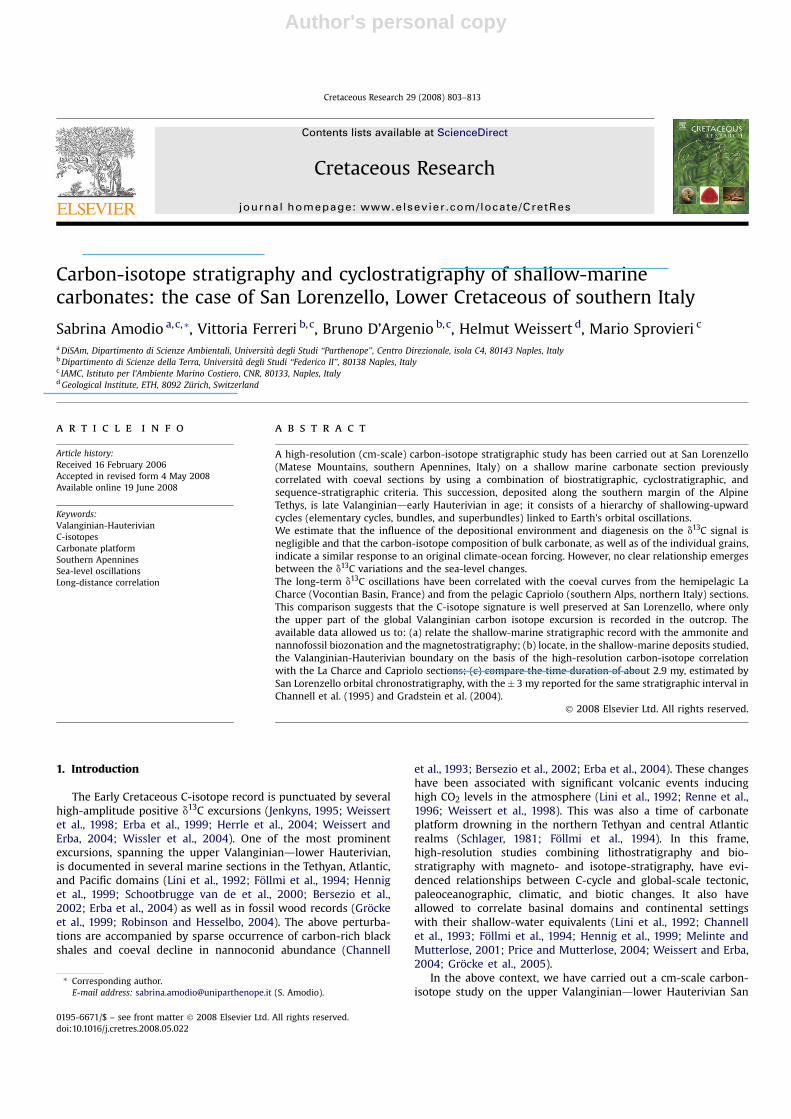
Lorenzello section (Matese Mountains, southern Apennines, Fig. 1).This succession, deposited as a part of the southern margin of theAlpine Tethys (Abruzzi-Campania Carbonate Platform, D’Argenioet al., 1975; Channell et al., 1979), consists of shallow-marine car-bonates exhibiting a shallowing-upward cycle hierarchy linked toEarth’s orbital oscillations (D’Argenio et al., 1997; Amodio, 2000,2006). This succession has also been sedimentologically analyzed atthe cm scale and correlated with coeval sections by combiningbiostratigraphic, cyclostratigraphic and sequence-stratigraphiccriteria (Amodio, 2000; Ferreri et al., 2004).
The main goals of the present study are: (a) the measurement ofC-isotope composition of both bulk carbonate and individualgrains, (b) the study of local to regional bearing of depositionalenvironment and diagenesis on the d13C signal, (c) the investigationof relationships between the d13C curve and sea-level changes (d)the analysis of the response of the Apenninic carbonate platformsto the global C-isotope Valanginian event and (e) the comparison ofthe d13C stratigraphy of San Lorenzello with that of La Charce(Vocontian Basin, Hennig et al., 1999) and Capriolo (southern Alps,Lini et al., 1992; Channell et al., 1995). We have chosen these twosections, already correlated to each other (Hennig et al., 1999),because they are constrained by ‘‘a’’ precise biozonation (ammo-nites and nannofossils, respectively) as well as by magneto-stratigraphy (Capriolo). Moreover, the La Charce section has beenproposed as a candidate for the Valanginian-Hauterivian boundaryGlobal Stratotype Section and Point (GSSP) (Gradstein et al., 2004).The long-distance correlation among the above coeval sections,pertaining to different paleoenvironmental and paleogeographicdomains, also aims at the recognition, via C-isotope stratigraphy, ofa correlation point in the San Lorenzello section falling within theLa Charce and Capriolo Valanginian-Hauterivian boundary.
2. The San Lorenzello section
The section discussed is 87 m thick and Valanginiand
Hauterivian in age (D’Argenio et al., 1997; Ferreri et al., 2004;Amodio, 2006). It is well exposed along a roadcut on the southernslope of the Monte Monaco di Gioia (Matese Mountains), near SanLorenzello village, north of Naples (Fig. 1). Monte Monaco di Gioia ispart of the Southern Apennines thrust and fold belt and derivesfrom the late Tertiary deformation of a tropical carbonate platform,typical of the pre-Miocene paleogeography of the Southern Tethysmargin (D’Argenio et al., 1975; Channell et al., 1979). During EarlyCretaceous times, this sector, belonging to the Abruzzi-CampaniaCarbonate Platform (D’Argenio et al., 1975), was part of the Adriadomain. According to existing paleogeographic restorations, Adriawas either a microplate, separated from the African craton by basinareas (e.g. Stampfli and Mosar, 1999) or a northern promontory ofthe African plate since the Paleozoic (cf. Channell et al., 1979;Wortmann et al., 2001; Stampfli and Borel, 2004).
The San Lorenzello deposits consist of well-bedded greylimestones and whitish to grey dolomitic limestones (wackestone,wackestone-packstone and packstone) with benthonic foraminif-era, green algae, and molluskcs (subtidal deposits). Levels ofmudstone and loferitic mudstone-wackestone (peritidal deposits)are subordinate. Graded, dark-grey packstone-grainstone, andgrainstone with intraclasts and bioclasts occur locally; they rest onerosional bases and form episodic intercalations (tempestites)within the succession studied.
The age of this section is constrained by benthic associationsincluding the green algae Salpingoporella annulata Carozzi, Cly-peina? solkani Conrad & Radoicic, Clypeina parasolkani Farinacci &Radoicic, Actinoporella podolica (Alth), and the foraminiferaPraecrhysalidina infracretacea Luperto-Sinni, Haplophragmoidesjoukowsyi Charollais et al., Montsalevia salevensis Charollais, Bron-nimann and Zaninetti, and primitive forms of Vercorsella. Moreover,at San Lorenzello, Orbitolinopsis capuensis (De Castro), a typicalforaminifer of late Hauteriviandearly Barremian age, is absentwhile Montsalevia salevensis disappears in the uppermost 20 m ofthe San Lorenzello. This allows to distinguish the biostratigraphicboundary within a range of about 10 m (between 60 and 70 m fromthe base, D’Argenio et al., 1997; Amodio, 2006).
It is worth noting that our biostratigraphic datation fits wellwith the Tethyan biochronostratigraphy of Hardenbol et al.(1998). These authors in their sequence-stratigraphy studies onEuropean basins indicate the coeval last occurrence of P. salevensis(now belonging to the genus Montsalevia) right at theValanginiandHauterivian boundary (132.03 Ma according toGradstein et al., 1995).
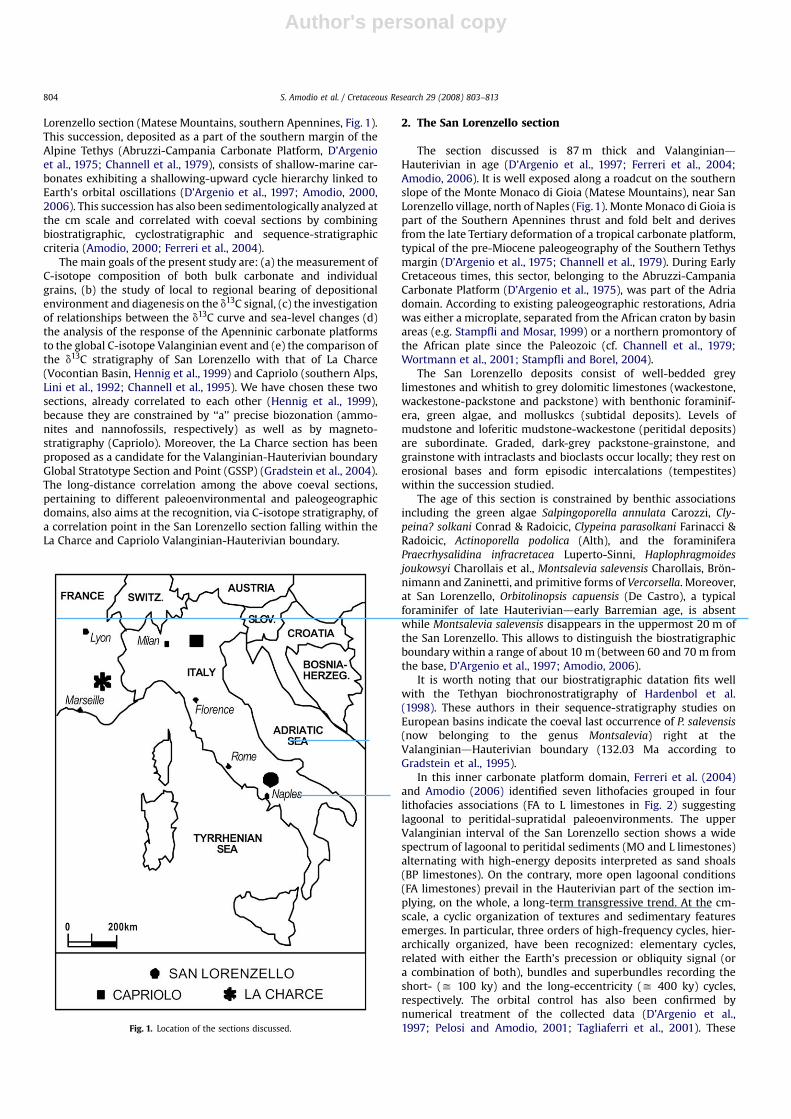
In this inner carbonate platform domain, Ferreri et al. (2004)and Amodio (2006) identified seven lithofacies grouped in fourlithofacies associations (FA to L limestones in Fig. 2) suggestinglagoonal to peritidal-supratidal paleoenvironments. The upperValanginian interval of the San Lorenzello section shows a widespectrum of lagoonal to peritidal sediments (MO and L limestones)alternating with high-energy deposits interpreted as sand shoals(BP limestones). On the contrary, more open lagoonal conditions(FA limestones) prevail in the Hauterivian part of the section im-plying, on the whole, a long-term transgressive trend. At the cm-scale, a cyclic organization of textures and sedimentary featuresemerges. In particular, three orders of high-frequency cycles, hier-archically organized, have been recognized: elementary cycles,related with either the Earth’s precession or obliquity signal (ora combination of both), bundles and superbundles recording theshort- (y 100 ky) and the long-eccentricity (y 400 ky) cycles,respectively. The orbital control has also been confirmed bynumerical treatment of the collected data (D’Argenio et al.,1997; Pelosi and Amodio, 2001; Tagliaferri et al., 2001). TheseFig. 1. Location of the sections discussed.
S. Amodio et al. / Cretaceous Research 29 (2008) 803–813804

Author's personal copy
high-frequency cycles appear to be superimposed on lower-frequency (�800 ka) Transgressive/Regressive Facies Trends(T/RFTs, Fig. 3), the latter used for global correlation with the 3rdorder sequences of Haq et al. (1987) and Hardenbol et al. (1998).Ferreri et al. (2004) suggested that the second regressive peak(RFT2 in Fig. 3) corresponds to the boundary between thedepositional sequences LZB-2.2 and LZB-2.3 of Haq et al. (1987) andto the sequence boundary Va7 of Hardenbol et al., (1998). Moreover,the third T/RFT (SL5 to SL7 superbundles in Fig. 3) matches both thedepositional sequences LZB-2.3 of Haq et al. (1987) and Va7 ofHardenbol et al. (1998) (see also Fig. 8, p. 163, of Ferreri et al., 2004).
3. Materials and methods
Samples collected for sedimentological analysis were also usedto obtain stable isotope data (d13C and d18O) excluding thoseaffected by dolomitization and evident meteoric diagenesis,although some diagenetic alteration in shallow-marine carbonatescannot be totally avoided. On the whole, a total of 272 samples,collected bed by bed from the carbonate matrix, were measured.They were obtained using a micro-driller from polished rock sur-faces, under a binocular microscope, in areas where the matrix wasfree from evident recrystallization. Where possible, several d13Cand d18O measurements were performed from the same sample inorder to compare the isotopic composition of well-preservedmolluscan shells with that of the matrix, as well as the isotopiccomposition of different grains of grain-supported textures (BPlimestones and tempestites).
All the samples were measured by automated continuous flowcarbonate preparation GasBenchII device (Spotl and Vennemann,2003) and ThermoElectron Delta Plus XP mass spectrometer at theIAMC-CNR (Naples) isotope geochemistry laboratory. Acidificationof samples was performed at 50 �C. For every 6 samples, an internalstandard (Carrara Marble with d 18O¼�2.43& vs. VPDB andd 13C¼ 2.43& vs. VPDB) was run, and for every 30 samples, theNBS19 international standard was measured. Standard deviationsof carbon and oxygen isotope measures were estimated to be 0.1and 0.08&, respectively, on the basis of ~200 samples measured intriple.
The entire calibration is based directly on standard materialsthat are part of each run (in our case the homogeneous and certifiedCarrara Marble carbonate with isotopic composition determined byconventional offline dual-inlet techniques), rather than solvingfractionation equations for the acid-based reaction. In other words,there is no need to know the stable isotopic composition of the CO2
reference gas a priori, nor the acid fractionation factor at the giventemperature of the reaction (Spotl and Vennemann, 2003). All theisotope data are reported in per mil versus VPDB.
4. Stable isotope results
The d13C values range, on the whole, from þ1.0& to þ2.6&,while values of the d18O in the San Lorenzello section are alwaysnegative with a predominant range from �4& to �1&.
Considering the d13C variations plotted against lithofacies andtheir cyclic organization, the curve starts with values around
Fig. 2. Lithofacies, lithofacies associations, and related environmental interpretations. Note the discontinuous sand shoals separating peritidal and lagoonal domains (from Ferreriet al., 2004, modified).
S. Amodio et al. / Cretaceous Research 29 (2008) 803–813 805

Author's personal copy
þ2.0&, followed by the most remarkable positive values (aroundþ2.6& in the superbundle 1, Fig. 3), which tend to decrease until toabout �0.3& at 65 m from the base of the section (superbundle 6).In particular, this long-negative C-isotope trend shows four positiveexcursions at about 5 m, 17 m, 35 m, and 60 m from the base andfour negative spikes at about 14 m, 33 m, 57 m, and 65 m from thebase of the section (Fig. 3). While in the first and last oscillation thed13C values rapidly increase (bundles 1 and 18) and then slowlydecrease (bundles 2 to 4 and bundle 19), in the second and thirdoscillation a plateau of d13C values (around þ2.0&) is registered(bundles 5 to 8 and bundles 11 to 15, respectively). These plateausare gradually replaced by two negative trends (bundles 9 to 10 andbundles 16 to 17, respectively).
In the interval from 65 to 78 m (bundles 20 to 23) a new trendtowards more positive values of about þ2.1&, is recorded. Finally,in the uppermost 6 m of the section, after an isolated rapid oscil-lation (value dispersion of about 2.5& registered within the bundle24), the d13C values gradually decrease from about þ2.2& to aboutþ1.2&.
5. Environmental and diagenetic influenceon isotope signature
In the samples analyzed from the San Lorenzello section theenvironmental influence and the diagenetic effects on the isotopicsignature have also been investigated in order to understandwhether they reflect the primary environmental signal (Allan andMatthews, 1982; Patterson and Walter, 1994; Grotsch et al., 1998;Panchuk et al., 2005). Shallow-marine limestones are composed ofa variety of skeletal and non-skeletal grains and of a more or lessabundant matrix. Moreover marine or meteoric cements are earlyto late diagenetic products; as a consequence, the bulk carbonate isa mixture of all these elements. Although absence of covariancebetween d18O and d13C (Fig. 4) suggests a limited influence of dia-genesis on the isotope records (Hudson and Anderson, 1989; Glu-mac and Walker, 1998), we prefer to restrict our discussion to thecarbon-isotope signal that shows absolute values and generaltrends very similar to those previously recorded by the coeval bulkd13C curves. We note that the two most negative values (þ0.6& and�0.33&) occur at about 15 m (top of bundle 4) and 65 m (top ofbundle 19), respectively, (Fig. 3). In both cases they are associatedwith subaerial exposure surfaces, testified by calcrete crusts whichsuggest more arid climatic conditions (Amodio, 2006). More de-pleted d13C values, also beneath these subaerial exposures, mayindicate diagenetic alteration of the underlying carbonates duringmore humid climatic conditions (Allan and Matthews, 1982).
As shown in Fig. 5, in all measured samples there is nosystematic variation of the carbon-isotope values (usually spanningfrom about þ1& to about þ2.5&) within the four lithofacies as-sociations and the tempestites.
Considering the sampling strategy of the measured matrix (seeabove), the meteoric influence on the d13C signature appears muchreduced, even if we cannot totally exclude such a control, becauseof the subaerial emersion (normally cycle by cycle) of the platform.Moreover, some local environmental parameters (e.g. temperature,salinity, water circulation, mineralogy) may have influenced thed13C changes with respect to the long-term isotope trends. Forexample, mineralogical, geochemical and biotic parameters mayhave caused some local 13C enrichments in the matrix composition(McKenzie, 1981; Romanek et al., 1992; Patterson and Walter, 1994;Immenhauser et al., 2003; Swart and Eberli, 2005).
Isotope values from well-preserved macrofossils (mollusks)were also measured on some selected samples to compare themwith the composition of the matrix (micritic bulk, Fig. 6a). Thesmall differences of the d13C values (� 0.3&) between shells andmicritic bulk suggest a similar fractionation process from the sea
water. Moreover, multiple measurements of some bioclasticsamples from BP limestones (Fig. 2) allowed to compare theisotope composition of the component grains with that of theirmatrix (bioclastic bulk, Fig. 6b). The d13C values from molluscanshell fragments appear either more or less positive (maximumdifference of 0.4&) than the bioclastic bulk. This is probably dueto environmental and/or vital factors that cause a slightly dif-ferent fractionation of the C-isotopes. Grains in tempestite sam-ples also give values similar to the matrix, even if individualgrains were formed at different places before they werereworked (Fig. 6c). Only one intraclast exhibits a d13C value lower(0.3&) than the bulk material. The results of this study indicatethat calcite of the most abundant rock-forming component(skeletal and non skeletal) essentially precipitated at or nearcarbon isotopic equilibrium with sea water.
6. Sea level and d13C
As to the d13C oscillations identified along the section studied,we discuss now the relations with climatically-controlled sea leveland/or oceanographic changes. These have been often debated inthe last few years by different authors. Arthur et al. (1988) andFollmi et al. (1994) have generally associated rising of sea level withpositive carbon-isotope excursions and vice versa. On the contrary,other authors (e.g. Grocke et al., 1999; Schootbrugge van de et al.,2000; Price and Mutterlose, 2004) show that there is no clearrelationship between sea level and carbon-isotope changes.Moreover, it has been revealed that the original paleoceanographiccarbon-isotope signal is also recorded in shallow-marine deposits(e.g. Jenkyns, 1995; Grotsch et al., 1998; Wissler et al., 2003;D’Argenio et al., 2004) and actually the data shown in Fig. 5 suggestan overall independence of the d13C signal from the sedimentarycontrol. Moreover, the comparison of the vertical changes oflithofacies and related early diagenetic features with the C-isotopecurve shows that the most positive values do not always corre-spond with a maximum rise of sea level at the scale of the higher-frequency cycles (see e.g. bundles n.6, 13 and 19; superbundles n.1and 6 in Fig. 3). On the contrary, positive d13C values occur at bundleand superbundle limits, recording more prolonged sea-level falls(e.g. top of bundles n.18 and 24; top of suberbundle n.7 in Fig. 3). Inaddition, many higher-frequency oscillations of the d13C, rangingwithin 0.5&, cannot be considered significant, at least at the bundlescale.
Finally, looking at longer d13C trends, and also taking intoaccount the sequence-stratigraphic interpretation of the lower-frequency cycles, T/RTFs, we note that no relationship seems toexist between d13C and sea level trends (Fig. 3). In fact, during thefirst transgressive trend, the d13C values increase and then decreasetowards the maximum flooding, while no significant variationsoccur in the regressive trend. Also during the second T/RFT almostno change in d13C values occurs. During the last T/RFT two oppositetrends emerge: a decrease of the C-isotope values towards themaximum flooding and an increase during the regressive trend.
In conclusion, our data demonstrate that neither the higher- northe lower-frequency eustatic changes, documented by the cyclicorganization of textures and sedimentary features, are reliablyreflected in the d13C oscillations, the latter being a composite signalresulting from a complex combination of local, regional and globaleffects.
7. C-isotope stratigraphy and global correlation
In order to test the hypothesis that the Valanginian–Hauterivianshallow-marine carbonates of San Lorenzello register the globald13C signal, we considered the long-term trends of the d13C curveand compared it with the pelagic d13C profiles of La Charce
S. Amodio et al. / Cretaceous Research 29 (2008) 803–813806

Author's personal copy
Fig. 3. San Lorenzello section, cm-scale C-isotope stratigraphy and corresponding cyclic organization of the carbonate sediments. The C-isotope curve, constructed by connecting allmeasured points (this study), has been plotted against lithology, cyclostratigraphy, and the sequence-stratigraphy of Ferreri et al. (2004) and Amodio (2006). On the left side thelithofacies histogram indicates the cyclic organization of the sediments and their early diagenetic features. Em1 and Em2 cycle boundaries indicate emersion-related surfaces whosefeatures are microkarst and/or weak pedogenesis for the Em1 type and thicker vadose caps, pervasive paleokarstic features and/or paleosols (calcrete or thin clayey levels) for theEm2 type. On the right side the different orders of cycles: bundles, superbundles and T/RFTs (Transgressive/Regressive Facies Trends) are indicated together with the systems tractsresulting from the sequence-stratigraphic interpretation of the superbundles. TR: Transgressive system tract; HS: Highstand system tract; MFS: maximum flooding surface; SB:sequence boundary. Key for lithofacies associations in Fig. 2.
S. Amodio et al. / Cretaceous Research 29 (2008) 803–813 807

Author's personal copy
(Vocontian Basin, Hennig et al., 1999) and Capriolo (southern Alps,Lini et al., 1992) sections, (Fig. 7).
The La Charce section (Fig. 1) part of the Vocontian domain(northern Tethyan margin), is composed of hemipelagic marl-limestones alternations and includes the ValanginiandHauterivianboundary. This boundary, located at the base of the Acanthodiscusradiatus ammonite Zone (Bulot et al., 1992), has been proposed asglobal boundary stratotype for the base of the Hauterivian Stage(Gradstein et al., 2004). Here the C-isotope excursion, with anamplitude of þ1.5&, is well calibrated with a precise ammonitebiostratigraphy. It starts in the Busnardoites campylotoxus ammo-nite Zone, reaches its peak values in the Saynoceras verrucosumZone and ends at the boundary between the A. radiatus and Crio-ceratites loryi Zones (Hennig et al., 1999; Kuhn et al., 2005).
An analogous d13C pattern is recorded in the pelagic Capriolosection (Fig. 1), belonging to the Lombardian basin (southernTethyan margin), where Lower Cretaceous carbonates belonging tothe Maiolica Formation were deposited (Lini et al., 1992). The nan-nofossil biostratigraphy and the magnetostratigraphy (Channellet al., 1987, 1993) allowed the C-isotope excursion to be calibrated. Itbegins within the Calcicalathina oblongata nannofossil Zone duringmagnetochron Zone CM12, reaches the maximum positive valueswithin CM11 magnetochron Zone and then moves back to pre-ex-cursion values within the Lithraphidites bollii nannofossil Zone be-tween CM10 N and CM8 magnetochron Zones (Channell et al., 1993).
The San Lorenzello d13C curve starts in the upper Valanginianshowing the most positive values (>þ 2.5&) at about 3–5 m fromthe base, which appear to record the uppermost part of the Val-anginian positive excursion, right near the biostratigraphicboundary between the S. verrucosum and the Crioceratites trino-dosum Zones (in turn correlated with the uppermost part of theCM11 magnetochron Zone). From here, the d13C profile of SanLorenzello shows a long-term trend towards more depleted 13Cvalues (d13C about þ1& in the upper part of superbundle n.6,Fig. 7), like in the La Charce and Capriolo sections. Finally, in thelower Hauterivian, a positive excursion of about þ1& amplitudewithin the superbundle n.7 occurs. This excursion appears to cor-relate with the La Charce stratigraphic interval, including the up-permost part of the A. radiatus and the lowermost part of the C. loryiammonite Zones, and in turn may correspond with the less pro-nounced positive trend of the Capriolo section (at the base of CM9magnetochron Zone).
The above correlation (Fig. 7), where the shaded areas highlighttime-equivalent intervals with similar d13C patterns, suggests thatalso the long C-isotope trend of San Lorenzello records the upperpart of the oceanic Valanginian excursion well, although the ab-solute d13C values from the shallow-marine deposits differ on av-erage by 0.3& from those of the deeper realms. It is worth notingthat this correlation is largely based on Hennig et al. (1999). Theseauthors have correlated the ammonite zones of the La Charce
0 2 3
Fig. 4. d13C versus d18O values measured on samples of carbonate matrix of the San Lorenzello section. They do not evidence any covariance. The four lithofacies associations areindicated by different symbols. FA: For-Algal limestones; BP: Bio-Peloidal limestones; MO: Mili-Ostracod limestones; L: Laminated limestones.
Fig. 5. Range of the d13C values from different lithofacies associations of the San Lorenzello section. The C-isotope signature appears to be independent from the originaldepositional environments. (FA) For-Algal limestones; (BP) Bio-Peloidal limestones; (MO) Mili-Ostracod limestones; (L) Laminated limestones; (T) Tempestites.
S. Amodio et al. / Cretaceous Research 29 (2008) 803–813808

Author's personal copy
section with the nannofossil and magnetochron zones of the Cap-riolo section and have proposed a time relationship between theabove ammonite chronostratigraphy and the magneto-chronostratigraphy which differs from that reported in Channellet al. (1995) and Gradstein et al. (2004). In particular, Hennig et al.(1999) traced, via C-isotope correlation, the base of the A. radiatusZone, recorded in the d13C plateau of La Charce (between 80 m and100 m from its base), within the normal magnetic polarity of theCM10 magnetochron Zone of the Capriolo section.
Looking at Fig. 7, we note that there is no precisecorrespondence between the Valanginian-Hauterivian boundariesbiostratigraphically individuated in the sections compared. In fact,each of them pertains to a different paleoenvironmental domainand therefore is characterized by different fossil associations (greenalgae and benthic foraminifers at San Lorenzello, ammonites atLa Charce and nannofossils at Capriolo). To avoid the abovediscrepancies, we have used an integrated (biostratigraphic andC-isotope) approach, taking into account the location of theValanginiandHauterivian boundary at La Charce and Capriolo(Hennig et al., 1999). Via C-isotope correlation, we recognize a time-equivalent level in our succession (see horizontal line in Fig. 7).
A further support to the correlation shown in Fig. 7 emerges ifwe also take into account that the ratio between the accumulationrates from the San Lorenzello and La Charce sections changesthroughout the upper Valanginiandlower Hauterivian. We notethat the lowermost time-equivalent interval (lower shaded area) ischaracterized by the same accumulation rates in both sections.Moreover the next interval (upper grey area) shows higher accu-mulation rates at San Lorenzello than at La Charce. On the whole,this variation is in agreement with the late Valanginian regressiondocumented in San Lorenzello by a sedimentary gap at the base ofsuperbundle n.5 (RFT2 in Figs. 3 and 7) and correlated with thesequence boundary Va7 of Hardenbol et al. (1998) and with theboundary between the depositional sequences LZB-2.2 and LZB-2.3of Haq et al. (1987, see also Fig. 7, p.167, and Fig. 8, p.168, in Ferreriet al., 2004). In this time interval, stratigraphic gaps also occur inthe Jura and Provence carbonate platforms, while high terrigenousinput is documented in the Vocontian and Helvetic basins (Hennig,2003). Subsequently, the latest Valanginiandearliest Hauteriviantransgression (TFT3 in Figs. 3 and 7) is characterized by flooding ofthe carbonate platform and by a higher sedimentation rate (Fig. 7).The time-equivalent interval of the La Charce section records con-densed and phosphate-rich marly deposits probably related to veryreduced carbonate supply from the shelves. This low sedimentationrate is documented in the slope as well as in the basin facies of theVocontian Basin until the earliest Hauterivian, and before the newspread of normal pelagic sediments (Bulot et al., 1992; Hennig et al.,1999; Hennig, 2003).
In other words, the discussed correlation represents the best fitof different data (sedimentology, biostratigraphy, isotope stratig-raphy and magnetostratigraphy) collected from different environ-mental and paleoceanographic domains. Fig. 7 shows that,although the shallow-marine values are more scattered than thepelagic ones, the long-term trends of the d13C can be correlatedfrom the southern to the northern margins of the Tethys suggestingthat the same oceanic C-isotope signal is preserved at SanLorenzello.
The long-distance C-isotope correlation among the SanLorenzello, La Charce, and Capriolo sections here proposedallowed us to calibrate our orbital time scale, based on short- andlong-eccentricity cycles with the ammonite biozonation (Bulotet al., 1992) and the magnetostratigraphy (Lini et al., 1992;Channell et al., 1995; Hennig et al., 1999). In Fig. 8 the d13C pro-files (San Lorenzello, La Charce, and Capriolo) are plotted againstthe chronostratigraphic representation of the San Lorenzellosection (bundle by bundle) for the best expression of the time
Fig. 6. A, Isotope composition of molluscan shells (open symbols) compared withsurrounding micritic matrix (filled symbols). B, Isotope composition of molluscanfragments (open symbols) compared with surrounding bioclastic matrix (filledsymbols). C, Selected samples showing isotope composition of grains (open symbols)from different parts of the lagoon compared with related fine grained matrix (bulkmaterial, filled symbols) of the San Lorenzello section.
S. Amodio et al. / Cretaceous Research 29 (2008) 803–813 809

Author's personal copy
Fig. 7. Correlation of the San Lorenzello d13C curve with the pelagic sections of La Charce (Hennig et al., 1999) and Capriolo (Lini et al., 1992). The thick grey line represents a smoothed curve resulting from 15-point running average filter(very large positive and negative values have been excluded). The shaded areas highlight time-equivalent intervals characterized by analogous d13C patterns; the horizontal squared-line indicates the precise location of the La CharceValanginian-Hauterivian boundary and its time equivalent at San Lorenzello and Capriolo as suggested by the C-isotope correlation; the dashed-line above the former evidences the uppermost isochronous C-isotope correlation points.Although the shallow-marine values are more scattered than the pelagic ones, the long-term trends of the d13C can be correlated from the southern to the northern margins of the Tethys suggesting that the oceanic d13C signal is alsopreserved at San Lorenzello. This correlation corroborates the main results of Hennig et al. (1999) which proposed a correlation between the ammonite zones and the magnetochron zones that differs from that of Channell et al. (1995) andGradstein et al. (2004). In fact, the base of A. radiatus Zone, proposed as base of the Hauterivian stage (Gradstein et al., 2004) and recorded in the d13C plateau of La Charce (between 80 m and 100 m from its base), seems here to fall withinthe normal magnetic polarity of the CM10 magnetochron Zone.
S.Am
odioet
al./Cretaceous
Research29
(2008)803–813
810

Author's personal copy
location of the restored orbital cycles and Transgressive/Re-gressive Facies Trends (T/RFTs), including the stratigraphic omis-sions. Now, if compared with the hemipelagic and pelagic curves,the C-isotope record of the San Lorenzello section appears to bemore similar to that of La Charce, even if in the latter the d13Cvalues are usually more negative than those of the platform. Thismay be due to a more intense terrigenous input occurring in theVocontian basin, testified by marl-limestone alternations in the LaCharce section. Moreover, the Capriolo section shows more posi-tive values than San Lorenzello ones (Fig. 8), even though,sometimes, along the section the reverse occurs. In these cir-cumstances the higher values may arise from aragonite pre-cipitated on the platform tops (e.g. Robbins et al., 1997;Thompson, 2000). Photosynthesis also preferentially removes 12Ccausing the waters to become enriched in the heavier isotope, 13C(Swart and Eberli, 2005). Hence carbonates originated in theshallow waters, regardless of whether they are precipitated
organically or inorganically, would tend to have higher d 13Cvalues than in carbonates precipitated in the open ocean.
However, differences in the pattern of fluctuations and in theabsolute C-isotope values evidenced in the three curves may beattributed not only to different resolution of the d13C measure-ments, but also to a combination of variable sedimentation rates,unrecognized sedimentary gaps and different environmental anddiagenetic conditions controlling regional Dissolved InorganicCarbon (DIC) isotope composition.
In addition, our C-isotope correlation suggests that at SanLorenzello the ValanginiandHauterivian boundary corresponds tothe base of superbundle n.5. The location of this limit is about400ky older than that individuated by Ferreri et al. (2004), basedsolely on biostratigraphy, cyclostratigraphy and sequence-stratigraphy.
Finally, it is worth noting that both the Channell et al. (1995)and Gradstein et al. (2004) time scales report a time duration of
Fig. 8. Chronostratigraphic correlation among the San Lorenzello, La Charce, and Capriolo sections. The three d13C profiles and the pelagic biozonations (ammonites and nan-nofossils, Channell et al., 1987; Bulot et al., 1992; Lini et al., 1992; Hennig et al., 1999) are plotted against biostratigraphy and orbital chronostratigraphy of San Lorenzello, that isbased on bundles (100 ky) and superbundles (400 ky) cycles (Ferreri et al., 2004). Note that the San Lorenzello curve has been discontinued at sedimentary gaps (missing bundles atthe base of the SL3 and SL5 superbundles). The curves have been plotted bundle by bundle to have the best expression of the time location of the restored orbital cycles and T/RFTs,taking into account the time equivalent intervals shown in Fig. 7. From this correlation good similarities among the d13C curves of different paleogeographic and paleoenvironmentaldomains emerge, confirming the usefulness of the C-isotope stratigraphy for global correlations.
S. Amodio et al. / Cretaceous Research 29 (2008) 803–813 811
Author's personal copy
about 3 my from the top of CM11 magnetochron Zone to the topof CM9 magnetochron Zone. This numerical value fits well withthe 2.9 my, previously estimated by orbital chronostratigraphyfor the coeval interval of San Lorenzello (Figs. 7 and 8; see alsoFerreri et al., 2004).
7. Conclusions
The San Lorenzello section records the evolution ofa carbonate platform belonging to the Adria paleogeographicdomain at a time of global decrease of carbon isotope values. Thisevent followed the Valanginian positive C-isotope anomaly,marked by reduced calcification, as a result of an increase in pCO2
(Erba et al., 2004; Erba and Tremolada, 2004). The upper Val-anginian carbonate sedimentation of San Lorenzello is charac-terized by well documented sedimentary gaps occurring duringa third order global sea-level fall (Haq et al., 1987; see also Fig. 8,p.163, in Ferreri et al., 2004); this appears consistent with thecooling event hypothesized by some authors in the late Val-anginian times (Price et al., 2000; Schootbrugge van de et al.,2000; Erba et al., 2004; Weissert and Erba, 2004). On the con-trary, since the ValanginiandHauterivian transition, more openand deep lagoonal facies evidence in San Lorenzello a third ordertransgression trend also documented at global scale (Haq et al.,1987; Hardenbol et al., 1998; Hennig, 2003; Ferreri et al., 2004).We note that, unlike several coeval northern Tethyan carbonateplatforms (see e.g. Follmi et al., 1994; Schootbrugge van de et al.,2000), no drowning event is recorded at San Lorenzello, or in thelarger paleogeographic domain to which this section belongs(D’Argenio et al., 1975; Channell et al., 1979).
Considering the relationships between the d13C changes andhigh-frequency sea-level oscillations, it is worth noting that thesuperposition of complex local and regional effects on the long-termglobal carbon cycle does not allow to recognize at San Lorenzelloa clear C-isotope cyclicity, driven by orbital and eustatic control.
In conclusion, despite the local and regional influences of bothdepositional environments and diagenesis, the C-isotope correla-tion of the San Lorenzello shallow-marine strata with the La Charceand Capriolo open-marine sections has allowed us to: (1) evidencethe preservation of the original oceanic d13C signal in the shallow-marine carbonates of San Lorenzello; (2) calibrate the platformsection using the ammonite biozonation of the La Charce section(Bulot et al., 1992) and the magnetostratigraphy of the Capriolosection (Channell et al., 1993) regardless of the sampling densityused for the discussed sections; (3) propose at San Lorenzelloa precise location of the ValanginiandHauterivian boundary assuggested by the high-resolution C-isotope correlation with the LaCharce and Capriolo sections.
Acknowledgements
This work was supported by the Istituto per l’Ambiente MarinoCostiero - IAMC, Naples, Italy and by the Dipartimento di Scienzedella Terra, ‘‘Federico II’’ University, Naples, Italy. We wish to thankF. Baudin and an anonymous reviewer for their useful commentswhich improved our work and K. Follmi and T. Adatte for their kindassistance in the process of upgrading the quality of this paper.Patricia Sclafani is also gratefully acknowledged for her help in theprocess of improving the English.
References
Allan, J.R., Matthews, R.K., 1982. Isotope signatures associated with early meteoricdiagenesis. Sedimentology 29, 797–817.
Amodio, S., 2000. Applicazione dei criteri della stratigrafia sequenziale ai sistemicarbonatici neritici. Studi di micro e biostratigrafia nel Cretacico inferiore
dell’Appennino Centro-Meridionale. Unpublished PhD thesis, Federico IIUniversity, Naples, 136 pp.
Amodio, S., 2006. Foraminifera diversity changes and paleoenvironmental analysis:the lower Cretaceous shallow-water carbonates of San Lorenzello, CampanianApennines, southern Italy. Facies 52, 53–67.
Arthur, M.A., Dean, W.E., Pratt, L.M., 1988. Geochemical and climatic effects ofincreased marine organic carbon burial at the Cenomanian/Turonian boundary.Nature 335, 714–717.
Bersezio, R., Erba, E., Gorza, M., Riva, A., 2002. Berrasian-Aptian black shales of theMaiolica formation (Lombardian Basin, Southern Alps, Northern Italy): local toglobal events. Palaeogeography, Palaeoclimatology, Palaeoecology 180, 253–275.
Bulot, L.G., Thieuloy, J.-P., Blanc, E., Klein, J., 1992. Le cadre stratigraphique duValanginien superieur et de l’Hauterivien du Sud-Est de la France: Definitiondes biochronozones et caracterisation de nouveaux biohorizons. GeologieAlpine 68, 13–56.
Channell, J.E.T., Bralower, T.J., Grandesso, P., 1987. Biostratigraphic correlation ofMesozoic polarity chrons CM1 to CM23 at Capriolo and Xausa (southern Alps,Italy). Earth and Planetary Science Letters 85, 203–221.
Channell, J.E.T., D’Argenio, B., Horvath, F., 1979. Adria, the African promontory inMesozoic Mediterranean palaeogeography. Earth Science Review 15, 213–292.
Channell, J.E.T., Erba, E., Lini, A., 1993. Magnetostratigraphic calibration of the LateValanginian carbon isotope event in pelagic limestones from Northern Italy andSwitzerland. Earth and Planetary Science Letters 118, 145–166.
Channell, J.E.T., Erba, E., Nakanishi, M., Tamaki, K., 1995. Late Jurassic-EarlyCretaceous time scale and oceanic magnetic anomaly block. In: Berggren, W.A.,Kent, D.V., Aubry, M.P., Hardenbol, J. (Eds.), Geochronology, time scale andglobal stratigraphic correlation. SEPM Society for Sedimentary Geology, Tulsa,Special Publication 54, 51–64.
D’Argenio, B., Ferreri, V., Amodio, S., Pelosi, N., 1997. Hierarchy of high-frequencyorbital cycles in Cretaceous carbonate platform strata. Sedimentary Geology113, 169–193.
D’Argenio, B., Ferreri, V., Weissert, H., Amodio, S., Buonocunto, F.P., Wissler, L., 2004.A multidisciplinary approach to global correlation and geochronology. TheCretaceous shallow-water carbonates of southern Apennines, Italy. In:D’Argenio, B., Fischer, A.G., Premoli Silva, I., Weissert, H., Ferreri, V. (Eds.),Cyclostratigraphy. Approaches and case histories. SEPM Society for SedimentaryGeology, Tulsa, Special Publication 81, 103–122.
D’Argenio, B., Pescatore, T., Scandone, P., 1975. Structural pattern of the Campania-Lucania Apennines. CNR, Quaderni de ‘‘La Ricerca Scientifica’’ 90, 17.
Erba, E., Bartolini, A., Larson, R.L., 2004. Valanginian Weissert oceanic anoxic event.Geology 32, 149–152.
Erba, E., Channell, J.E.T., Claps, M., Jones, C., Larson, R., Opdyke, B., Premoli Silva, I.,Riva, A., Salvini, G., Torricelli, S., 1999. Integrated stratigraphy of the CismonApticore (Southern Alps, Italy): a ‘‘reference section’’ for the Barremian-Aptianinterval at low latitude. Journal of Foraminiferal Research 29, 371–391.
Erba, E., Tremolada, F., 2004. Nannofossil carbonate fluxes during the EarlyCretaceous: phytoplankton response to nutrification episodes, atmospheric CO2and anoxia. Paleoceanography 19. doi:10.1029/2003PA000884 PA1008.
Ferreri, V., D’Argenio, B., Amodio, S., Sandulli, R., 2004. Orbital chronostratigraphy ofthe Valanginian-Hauterivian boundary. A cyclostratigraphic approach. In:D’Argenio, B., Fischer, A.G., Premoli Silva, I., Weissert, H., Ferreri, V. (Eds.),Cyclostratigraphy. Approaches and case histories. SEPM Society for SedimentaryGeology, Tulsa, Special Publication 81, 153–166.
Follmi, K.B., Weissert, H., Bisping, M., Funk, H., 1994. Phosphogenesis, carbon-isotopestratigraphy, and carbonate-platform evolution along the lower Cretaceousnorthern Tethyan margin. Geological Society of America Bulletin 106, 729–746.
Glumac, B., Walker, K.R., 1998. A Late Cambrian positive carbon-isotope excursion inthe southern Appalachians: relation to biostratigraphy, sequence stratigraphy,environments of deposition, and diagenesis. Journal of Sedimentary Research68, 1212–1222.
Gradstein, F.M., Agterberg, F.P., Ogg, J.G., Hardenbol, J., van Veen, P., Thierry, J.,Huang, Z., 1995. A Triassic, Jurassic and Cretaceous time scale. In: Berggren, W.A.,Kent, D.V., Aubry, M.P., Hardenbol, J. (Eds.), Geochronology, time scales andglobal stratigraphic correlation. SEPM Society for Sedimentary Geology SpecialPublication 54, 95–126.
Gradstein, F.M., Ogg, J.G., Smith, A.G., 2004. A Geologic Time Scale 2004. CambridgeUniversity Press, Cambridge, 384 pp.
Grocke, D.R., Hesselbo, S., Jenkyns, H.C., 1999. Carbon-isotope composition of lowerCretaceous fossil wood: ocean-atmosphere chemistry and relation to sea-levelchange. Geology 27, 155–158.
Grocke, D.R., Price, G.D., Robison, S.A., Baraboshkin, E.Y., Mutterlose, J., Ruffell, A.H.,2005. The Upper Valanginian (Early Cretaceous) positive carbon-isotope eventrecorded in the terrestrial plants.Earth and Planetary Science Letters 240, 495–509.
Grotsch, J., Billing, I., Vahrenkamp, V., 1998. Carbon-isotope stratigraphy in shallow-water carbonates: implications for Cretaceous black-shale deposition.Sedimentology 45, 623–634.
Haq, B.U., Hardenbol, J., Vail, P.R., 1987. Chronology of fluctuating sea levels since theTriassic. Science 237, 1156–1167.
Hardenbol, J., Thierry, J., Farley, M.B., Jacquin, T., Graciansky de, P.C., Vail, P.R., 1998.Cretaceous sequence chronostratigraphy. In: Graciansky de, P.C., Hardenbol, J.,Jacquin, T., Vail, P.R., Farley, M.B. (Eds.), Mesozoic and Cenozoic sequence stra-tigraphy of European basins. SEPM Society for Sedimentary Geology, Tulsa,Special Publication 60, charts.
Hennig, S., 2003. Geochemical and sedimentological evidence for environmentalchanges in the Valanginian (Early Cretaceous) of the Tethys region. UnpublishedPhD thesis, Swiss Federal Institute of Technology, Zurich, 267 pp.
S. Amodio et al. / Cretaceous Research 29 (2008) 803–813812

Author's personal copy
Hennig, S., Weissert, H., Bulot, L., 1999. C-isotope stratigraphy, a calibration toolbetween ammonite- and magnetostratigraphy: the Valanginian-Hauteriviantransition. Geologica Carpatica 50, 91–96.
Herrle, J.O., Kobler, P., Friedrich, O., Erlenkeuser, H., Hemleben, C., 2004. High-resolution carbon isotope records of the Aptian to lower Albian from SE Franceand the Mazagan Plateau (DSDP Site 545): a stratigraphic tool for paleo-ceanographic and paleobiologic reconstruction. Earth and Planetary ScienceLetters 218, 149–161.
Hudson, J.D., Anderson, T.F., 1989. Ocean temperatures and isotopic compositionsthrough time. Royal Society of Edinburgh transactions. Earth Science 80,183–192.
Immenhauser, A., Della Porta, G., Kenter, J.A.M., Bahamonde, J.R., 2003. Analternative model for positive shifts in shallow-marine carbonate d13C and d18O.Sedimentology 50, 953–959.
Jenkyns, H.C., 1995. Carbon-isotope stratigraphy and paleoceanographicsignificance of the lower Cretaceous shallow-water carbonates of resolutionGuyot, Mid Pacific Mountains. Proceedings Oceanic Drilling Program ScientificReports 143, 99–104.
Kuhn, O., Weissert, H., Follmi, K.B., Hennig, S., 2005. Altered carbon cycling andtrace-metal enrichment during the late Valanginian and early Hauterivian.Eclogae Geologicae Helvethiae 98, 333–344.
Lini, A., Weissert, H., Erba, E., 1992. The Valanginian carbon-isotope event: a firstepisode of greenhouse climate conditions during the Cretaceous. Terra Nova 4,374–384.
Melinte, M., Mutterlose, J., 2001. A Valanginian (Early Cretaceous) ‘‘Borealnannoplankton excursion’’ in sections from Romania. MarineMicropaleontology 43, 1–25.
McKenzie, J.A., 1981. Holocene dolomitization of calcium-carbonate sediments fromthe coastal sabkhas of Abu Dhabi, UAE – a stable isotope study. Journal ofGeology 89, 185–198.
Panchuk, K.M., Holmden, C., Kump, L.R., 2005. Sensitivity of the epeiric sea carbonisotope record to local-scale carbon cycle processes: tales from Mohawkian sea.Palaeogeography, Palaeoclimatology, Palaeoecology 228, 320–337.
Patterson, W.P., Walter, L.M., 1994. Depletion of 13C in seawater SCO2 on moderncarbonate platforms: significance for the carbon isotopic record of carbonates.Geology 22, 885–888.
Pelosi, N., Amodio, S., 2001. Wavelet application to cyclostratigraphy signals. TheSan Lorenzello section, lower Cretaceous, Italy. SEPM (Society for SedimentaryGeology), International Workshop, Sorrento, Abstract Volume, 39–40.
Price, G.D., Mutterlose, J., 2004. Isotopic signals from Late Jurassic-Early Cretaceous(Volgian-Valanginian) sub-Artic belemnites, Yatria River, Western Siberia.Journal of Geological Society of London 161, 959–968.
Price, G.D., Ruffell, A.H., Jones, C.E., Kalin, R.M., Mutterlose, J., 2000. Isotopicevidence for temperature variation during the Early Cretaceous (LateRyazanian-mid-Hauterivian). Journal of Geological Society of London 157,335–343.
Renne, P.R., Glen, J.M., Milner, S.C., Duncan, A.R., 1996. Age of Etendeka flood vol-canism and associated intrusions in southwestern Africa. Geology 24, 659–662.
Robbins, L., Tao, Y., Evans, C.A., 1997. Temporal and spatial distribution of whitingson Great Bahama Bank and a new lime mud budget. Geology 25, 947–950.
Robinson, S.A., Hesselbo, S., 2004. Fossil-wood carbon-isotope stratigraphy of thenon-marine Wealden group (Lower Cretaceous, southern England). Journal ofGeological Society of London 161, 133–145.
Romanek, C.S., Grossmann, E.L., Morse, J.W., 1992. Carbon isotopic fractionation insynthetic aragonite and calcite: effects of temperature and precipitation rate.Geochimica et Cosmochimica Acta 45, 589–594.
Schlager, W., 1981. The paradox of the drowned reefs and carbonate platforms.Geological Society of America Bulletin 92, 197–211.
Schootbrugge van de, B., Follmi, K.B., Bulot, L.G., Burns, S.J., 2000. Paleoceanographicchanges during the Early Cretaceous (Valanginian-Hauterivian): evidence fromoxygen and carbon stable isotopes. Earth and Planetary Science Letters 181,15–31.
Spotl, C., Vennemann, T.W., 2003. Continuous-flow isotope ratio massspectrometric analysis of carbonate minerals. Rapid Communications in MassSpectrometry 17, 1004–1006.
Stampfli, G.M., Mosar, J., 1999. The making and becoming of Apulia. Memorie diScienze Geologiche 51, 141–154. Padova University.
Stampfli, G.M., Borel, G.D., 2004. The TRANSMED transects in space and time:constraints on the Paleotectonic evolution of the Mediterranean domain. In:Cavazza, W., Roure, F.M., Spakman, W., Stampfli, G.M., Ziegler, P.A. (Eds.), TheTRANSMED Atlas. The Mediterranean Region From Crust to Mantle. Springer,Berlin Heidelberg, pp. 53–80.
Swart, P.K., Eberli, G., 2005. The nature of the d13C of periplatform sediments:Implications for stratigraphy and the global carbon cycle. Sedimentary Geology175, 115–129.
Tagliaferri, R., Pelosi, N., Ciaramella, A., Longo, N., Milano, M., Barone, F., 2001. Softcomputing methodologies for spectral analysis in cyclostratigraphy. Computerand Geoscience 27, 535–548.
Thompson, J.B., 2000. Microbial whiting. In: Riding, R., Awramik, S.M. (Eds.),Microbial Sediments. Springer, Heidelberg, pp. 250–260.
Weissert, H., Erba, E., 2004. Volcanism, CO2 and palaeoclimate: a Late Jurassic-EarlyCretaceous carbon and oxygen isotope record. Journal of Geological Society ofLondon 161, 695–702.
Weissert, H., Lini, A., Follmi, K.B., Kuhn, O., 1998. Correlation of Early Cretaceouscarbon isotope stratigraphy and platform drowning events: a possible link?Palaeogeography, Palaeoclimatology, Palaeoecology 137, 189–203.
Wissler, L., Funk, H., Weissert, H., 2003. Response of Early Cretaceous carbonateplatforms to changes in atmospheric carbon dioxide levels. Palaeogeography,Palaeoclimatology, Palaeoecology 200, 187–205.
Wissler, L., Weissert, H., Buonocunto, F.P., Ferreri, V., D’Argenio, B., 2004. Calibrationof the Early Cretaceous time scale: a combined chemostratigraphic andcyclostratigraphic approach to the Barremian-Aptian interval. In: D’Argenio, B.,Fischer, A.G., Premoli Silva, I., Weissert, H., Ferreri, V. (Eds.), Cyclostratigraphy.Approaches and case histories. SEPM Society for Sedimentary Geology, Tulsa,Special Publication 81, 123–134.
Wortmann, U.G., Weissert, H., Funk, H., Hauck, J., 2001. Alpine plate kinematicsrevisited: the Adria problem. Tectonics 20, 134–147.
S. Amodio et al. / Cretaceous Research 29 (2008) 803–813 813
Copyright © 2022 FDOKUMEN