Carbon dioxide degassing flux from two geothermal fields in Tibet, China
11
© The Author(s) 2011. This article is published with open access at Springerlink.com csb.scichina.com www.springer.com/scp Article Geochemistry SPECIAL TOPIC: Geological Processes in Carbon Cycle doi: 10.1007/s11434-011-4352-z Carbon dioxide degassing flux from two geothermal fields in Tibet, China SHEN LiCheng 1* , WU KunYu 1 , XIAO Qiong 1 & YUAN DaoXian 1,2 1 Key Laboratory of Eco-environments in Three Gorges Reservoir Region, Ministry of Education; School of Geographical Science; Institute of Karst Environment and Rock Desertification Control; Southwest University, Chongqing 400715, China; 2 Karst Dynamics Laboratory, Ministry of Land and Resources, Guilin 541004, China Received October 9, 2010; accepted December 10, 2010 Over geological time scales, Earth degassing has a significant impact on atmospheric carbon dioxide (CO 2 ) concentrations, which are an important component of global carbon cycle models. In Tibet, structural conditions and associated widespread geothermal systems lead to carbon dioxide degassing during geothermal water migration. We characterized the hydrochemical conditions of two geothermal fields on the Tibetan Plateau. The chemical composition of geothermal waters was controlled by K-feldspar and albite. Geothermal waters in the Langjiu geothermal field were sodium chloride type and those of the Dagejia geothermal field were sodium bicarbonate type. Simulations of CO 2 partial pressure within the two hydrogeothermal systems showed that CO 2 degassing occurs during hot water migration from the aquifer to the surface. Carbon dioxide degassing flux from the Langjiu geothermal field was estimated to be ~3.6×10 6 kg km –2 a –1 , and that from Dagejia was ~3.3×10 6 kg km –2 a –1 . Carbon dioxide degassing, geothermal, Langjiu, Dagejia, Tibetan Plateau Citation: Shen L C, Wu K Y, Xiao Q, et al. Carbon dioxide degassing flux from two geothermal fields in Tibet, China. Chinese Sci Bull, 2011, 56: 1−11, doi: 10.1007/s11434-011-4352-z The natural carbon cycle includes the conversion and mi- gration of lithospheric, atmospheric, hydrospheric and bio- spheric carbon, primarily in the forms of carbon dioxide (CO 2 ), carbonate (CO 3 2– ), bicarbonate (HCO 3 – ), methane (CH 4 ), and formaldehyde (CH 2 O) [1]. CO 2 is the most abundant atmospheric greenhouse trace gas, and in recent years research has shown that the deep crust is a large CO 2 source [2–4]. Hydrogeothermal systems play a key role in mediating crustal CO 2 outgassing to the atmosphere [4,5]. American geologist T. C. Chamberlin (1843–1928) hy- pothesized the regulation of atmospheric CO 2 concentra- tions through dynamic lithospheric interaction with the hy- drosphere and atmosphere, which lead to alternating cold and warm periods typified by the Permian and Quaternary glacial-interglacial oscillations [6]. Modern research is in- creasingly focusing on regional- and global-scale CO 2 de- *Corresponding author ([email protected]; [email protected]) gassing from the deep crust [2–16], and over the past dec- ade a large number of studies have shown that CO 2 release from both volcanic eruptions and non-eruptive systems af- fects global atmospheric composition. These non-eruptive systems include geomagnetic anomaly zones, shallow earthquake zones, gravity anomalies and high heat flow zones [17–27]. Processes assumed to be common among these settings are the migration of magmatic fluids from the deep to the upper crust and then the surface, which results in both significant CO 2 outgassing and associated changes in the chemical composition of shallow groundwater. Researchers have applied δ D, δ 13 C, 3 He/ 4 He and other isotopic tracers to study crustal CO 2 outgassing in the west- ern Cordillera region of USA [28,29], the Himalayas [3,4,30], Italy [17–20, 22–27,31], southeastern France [32], eastern China [33,34] and southwest China [16,35–40]. However, there are few studies of the processes and magni- tude of non-volcanic CO 2 degassing, especially fault deep
Transcript of Carbon dioxide degassing flux from two geothermal fields in Tibet, China
© The Author(s) 2011. This article is published with open access at Springerlink.com csb.scichina.com www.springer.com/scp
Article
Geochemistry SPECIAL TOPIC: Geological Processes in Carbon Cycle doi: 10.1007/s11434-011-4352-z
Carbon dioxide degassing flux from two geothermal fields in Tibet, China
SHEN LiCheng1*, WU KunYu1, XIAO Qiong1 & YUAN DaoXian1,2
1 Key Laboratory of Eco-environments in Three Gorges Reservoir Region, Ministry of Education; School of Geographical Science; Institute of Karst Environment and Rock Desertification Control; Southwest University, Chongqing 400715, China;
2 Karst Dynamics Laboratory, Ministry of Land and Resources, Guilin 541004, China
Received October 9, 2010; accepted December 10, 2010
Over geological time scales, Earth degassing has a significant impact on atmospheric carbon dioxide (CO2) concentrations, which are an important component of global carbon cycle models. In Tibet, structural conditions and associated widespread geothermal systems lead to carbon dioxide degassing during geothermal water migration. We characterized the hydrochemical conditions of two geothermal fields on the Tibetan Plateau. The chemical composition of geothermal waters was controlled by K-feldspar and albite. Geothermal waters in the Langjiu geothermal field were sodium chloride type and those of the Dagejia geothermal field were sodium bicarbonate type. Simulations of CO2 partial pressure within the two hydrogeothermal systems showed that CO2 degassing occurs during hot water migration from the aquifer to the surface. Carbon dioxide degassing flux from the Langjiu geothermal field was estimated to be ~3.6×10⁶ kg km–2 a–1, and that from Dagejia was ~3.3×10⁶ kg km–2 a–1.
Carbon dioxide degassing, geothermal, Langjiu, Dagejia, Tibetan Plateau
Citation: Shen L C, Wu K Y, Xiao Q, et al. Carbon dioxide degassing flux from two geothermal fields in Tibet, China. Chinese Sci Bull, 2011, 56: 1−11, doi: 10.1007/s11434-011-4352-z
The natural carbon cycle includes the conversion and mi-gration of lithospheric, atmospheric, hydrospheric and bio-spheric carbon, primarily in the forms of carbon dioxide (CO2), carbonate (CO3
2–), bicarbonate (HCO3–), methane
(CH4), and formaldehyde (CH2O) [1]. CO2 is the most abundant atmospheric greenhouse trace gas, and in recent years research has shown that the deep crust is a large CO2 source [2–4]. Hydrogeothermal systems play a key role in mediating crustal CO2 outgassing to the atmosphere [4,5].
American geologist T. C. Chamberlin (1843–1928) hy-pothesized the regulation of atmospheric CO2 concentra-tions through dynamic lithospheric interaction with the hy-drosphere and atmosphere, which lead to alternating cold and warm periods typified by the Permian and Quaternary glacial-interglacial oscillations [6]. Modern research is in-creasingly focusing on regional- and global-scale CO2 de- *Corresponding author ([email protected]; [email protected])
gassing from the deep crust [2–16], and over the past dec-ade a large number of studies have shown that CO2 release from both volcanic eruptions and non-eruptive systems af-fects global atmospheric composition. These non-eruptive systems include geomagnetic anomaly zones, shallow earthquake zones, gravity anomalies and high heat flow zones [17–27]. Processes assumed to be common among these settings are the migration of magmatic fluids from the deep to the upper crust and then the surface, which results in both significant CO2 outgassing and associated changes in the chemical composition of shallow groundwater.
Researchers have applied δ D, δ 13C, 3He/4He and other
isotopic tracers to study crustal CO2 outgassing in the west-ern Cordillera region of USA [28,29], the Himalayas [3,4,30], Italy [17–20, 22–27,31], southeastern France [32], eastern China [33,34] and southwest China [16,35–40]. However, there are few studies of the processes and magni-tude of non-volcanic CO2 degassing, especially fault deep
2
fault zones and geothermal anomalies. Currently, there are three main approaches to assessing CO2 degassing flux: (1) through changes in CO2 molar concentrations or enthalpy that occur during the migration of geothermal fluid between deep aquifers and the surface [25]; (2) measuring CO2 con-centrations directly at particular grid sampling densities to calculate CO2 flux [26]; and (3) applying infrared remote sensing techniques to measure and calculate CO2 flux at regional scales [41].
Tibet is one of the most tectonically active regions in the world, and its structural conditions and associated wide-spread geothermal systems lead to CO2 degassing during geothermal water migration. In this study we characterized the hydrochemical features of geothermal waters in the Langjiu geothermal field, Gar County, and the Dagejia geothermal field in Ngamring County, western Tibet Auto- nomous Region, China, and calculated CO2 degassing flux in these two areas.
1 Regional geological setting
On the Tibetan Plateau there are two large-scale EW trend-ing suture zones (Indian River-Yarlung-Zanbo suture (IYS) and Bangong Lake-Nujiang suture (BNS)), which are im-portant geological and geomorphological boundaries divide the plateau into three tectonic blocks: north, central and south (Figure 1(a)). Large-scale uplift of the Tibetan Plateau has been occurring since the Miocene, and east-west exten-sion occurred subsequently,the age range from 18.3±2.7 to 13.3±0.8 Ma B P [42], which formed a series of normal fault systems that bisect the IYS and BNS, some of which have developed into rift and grabens [43–46]. The grabens are well-known locations of Himalayan geothermal zones [47].
Geothermal waters on the Tibetan Plateau contain char-acteristic signatures, in particular dissolved gasses, reflect-ing the regional processes of collision and uplift, and the nature and spatial distribution of source rocks and in both the upper crust and the mantle. The geothermal gases in Tibet are subdivided into a dominant CO2-type and less common N2-type [39].
Here, we assigned geothermal anomaly districts on the Tibetan Plateau into one of the two types based on accord-ing to the occurrence of the geothermal deposits sediments travertine and silica sinter. The Langjiu geothermal field is typical travertine type and the Dagejia geothermal field is silica sinter type.
1.1 Langjiu geothermal field
The Langjiu geothermal field is located in Gar County (80°21′40″E, 32°21′48″N) at 4500 m above sea level (a.s.l.) on the northwest margin of the Gangdise-Nyainqentanglha microplate, which is bounded by the Shiquanhe-Namco fault to the north and the Yarlung-Zanbo suture in the south (Figure 1(a)). The local geology is dominantly travertine. In the 1970s, a geothermal survey was conducted at the site by the Tibetan Plateau Comprehensive Scientific Expedition Team [48]. In the 1980s the local government built a geo-thermal power plant at the site, but it was abandoned soon after completion due to it not meeting local energy needs [49]. In 1987, a team from the Chengdu Institute of Geology
completed a detailed geological map (1:5000) of the re-gion1,2). Subsequently, detailed studies of the geothermal areas were conducted by Tong et al. [49] and Liao et al. [50].
The main stratigraphic units exposed in the region1,2,3)
[51] are: the Oligocene-Miocene Rigongla group (E3N1r) comprising purple-brown-red sandstones and conglomerates and calcareous mudstones; the Early Cretaceous Langjiu group (K1l) comprising trachytes, basalts, rhyolites and bio-clastic limestones; the Early Cretaceous Duoai group (K1d) comprising basalts, tuffs, dacites, andesites and bioclastic limestones; the Early Cretaceous Tuocheng group (K1t) comprising biotite dacites, rhyolites and tuffs; the Triassic Tongtangna group (T1-2t) comprising dark gray-yellow dolomites and ~2 m thick silicified limestone breccias at the base; and the Late Permian Xiala group (P3x) comprising limestones and purple-red cherts.
The geothermal reservoirs in the Langjiu field are frac-tured granites, the roof rocks of which are not developed fully [48,49]. This enables the geothermal waters to mix with cold waters, which promotes the formation of a geo-chemical barrier. At present geothermal issues from a waste pipe at the former power plant (Figure 2(a)) enabling its geochemical analysis, with only changes in temperature and pressure.
1.2 Dagejia geothermal field
The Dagejia geothermal field is located in Ngamring County, Xigazê Region Tibet Autonomous Region (85°44′45″E, 29°36′00″–29°36′20″), at 5100 m a.s.l. It is situated in the middle of the Indian River-Yarlung-Zanbo suture and the southern margin of the Gangdise continental margin mag-matic arc [54] (Figure 1(a)). The main kind of thermal spring in this region is geysers, and the hydrogeothermal height reaches ~2 m. There are also several smaller intermittent
1) Chengdu Institute of Geology Scientific Expedition Team to Ali, Scientific Investigation Report of Langjiu Geothermal Fields in Ali, Tibet, 1988, Internal data. 2) Chengdu Institute of Geology Scientific Expedition Team to Langjiu, reconsideration of development prospects of Langjiu geothermal field, 1989, Internal data. 3) 1:250000 Geological Map for Shiquanhe.
3
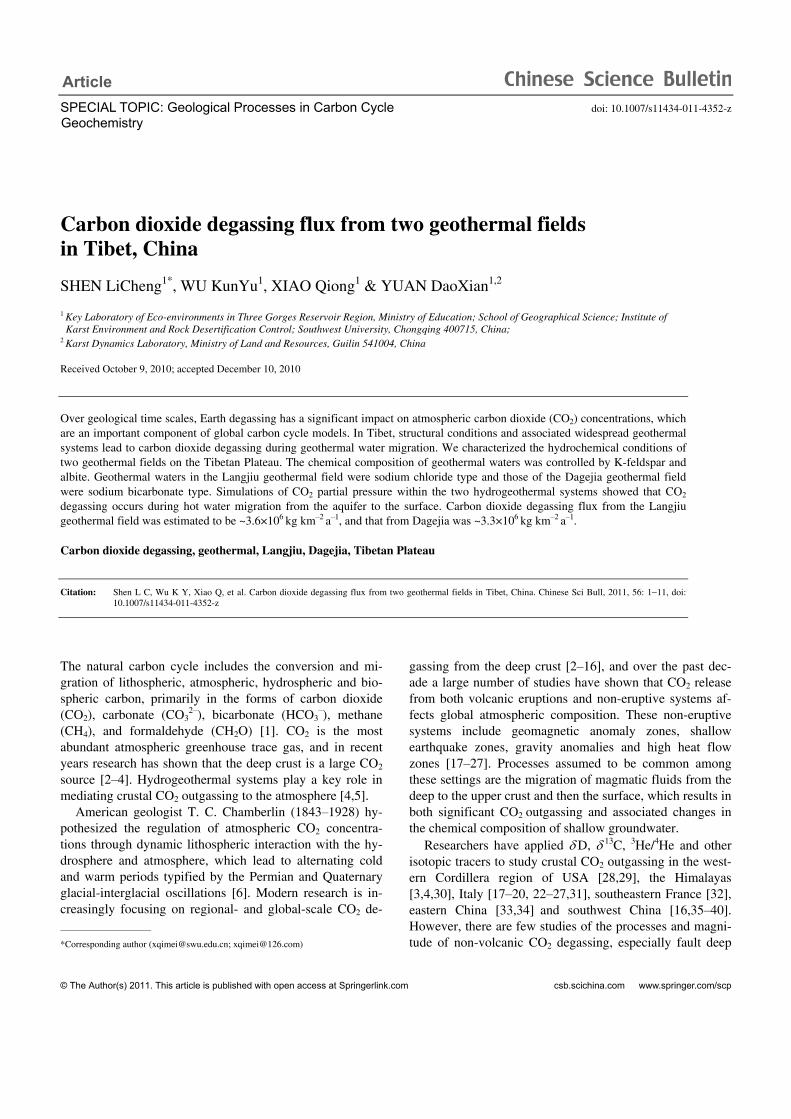
Figure 1 Structural units of the Tibetan Plateau [52,53] and geology of the Langjiu and Dagejia geothermal fields4,5). 1, Quaternary sediments; 2, Oligo-ceneearly Miocene Rgongla group; 3, Paleogene Dazhuka group; 4, Paleogene Dianzhong Group sec; 5, Cretaceous Angren Group; 6, Early Cretaceous Duoai Group; 7, Early Cretaceous Tuocheng Group; 8, Early Cretaceous Langjiu Group; 9, Triassic Tongtangna Group; 10, Late Permian Xiala Group; 11, sampling locations; 12, monzogranites; 13, granodiorites; 14, gangdise magmatic arc; 15, geothermal field; 16, stratigraphic boundary; 17, observed/inferred faults; 18, inferred transtensional faults; 19, observed reverse faults/normal faults; 20, sutures: IYS, Indian River-Yarlung-Zanbo Suture; BNS, Bangong Lake-Nujiang River Suture. 4) See footnote 3) on Page 2. 5) 1:250000 Geological Map for Sangsang.
4
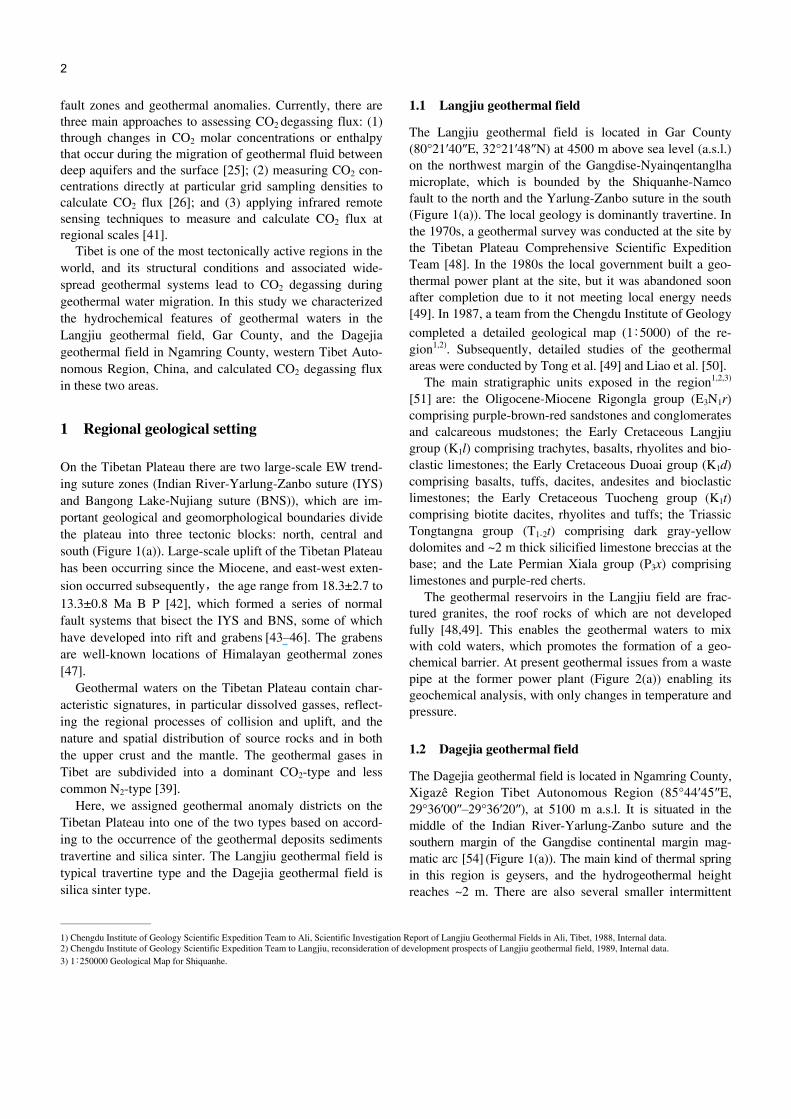
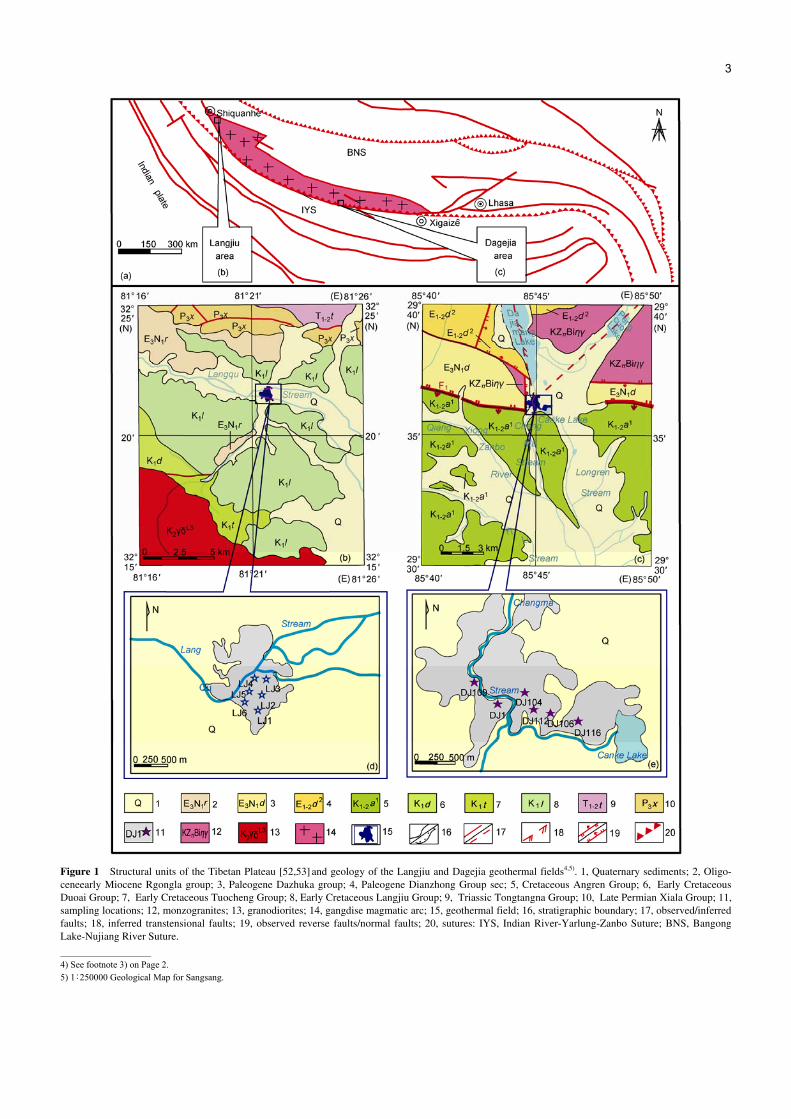
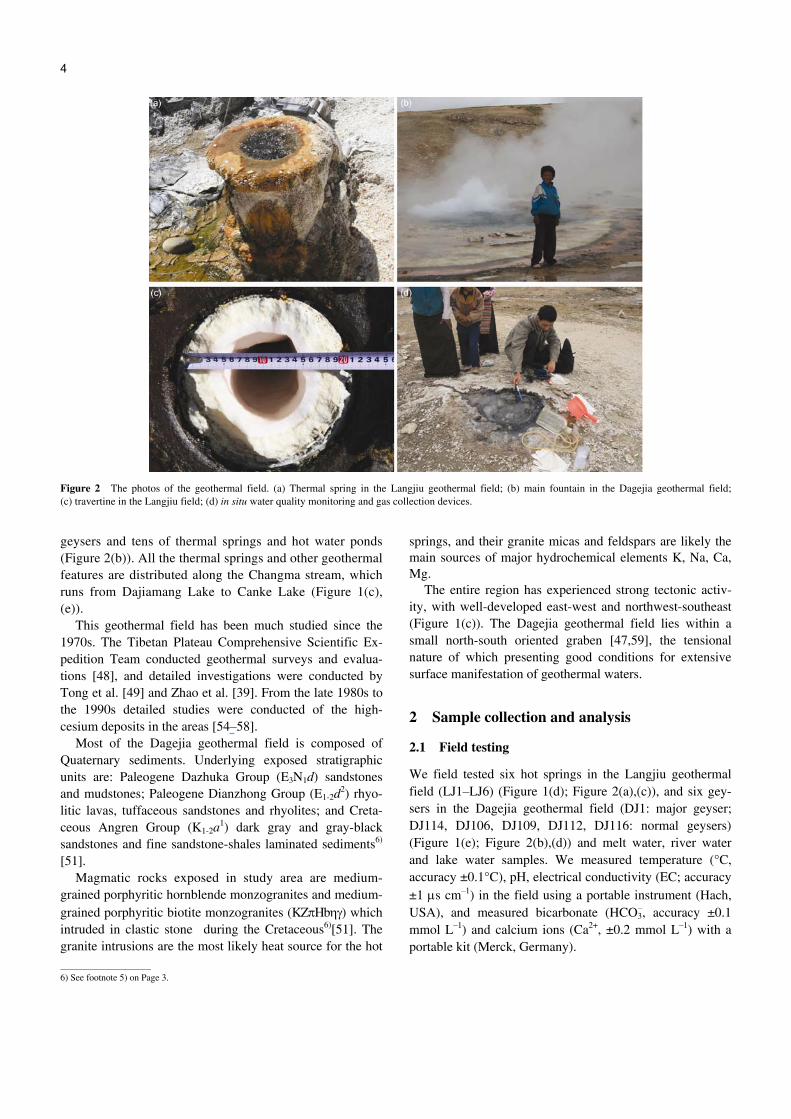
Figure 2 The photos of the geothermal field. (a) Thermal spring in the Langjiu geothermal field; (b) main fountain in the Dagejia geothermal field; (c) travertine in the Langjiu field; (d) in situ water quality monitoring and gas collection devices.
geysers and tens of thermal springs and hot water ponds (Figure 2(b)). All the thermal springs and other geothermal features are distributed along the Changma stream, which runs from Dajiamang Lake to Canke Lake (Figure 1(c), (e)).
This geothermal field has been much studied since the 1970s. The Tibetan Plateau Comprehensive Scientific Ex-pedition Team conducted geothermal surveys and evalua-tions [48], and detailed investigations were conducted by Tong et al. [49] and Zhao et al. [39]. From the late 1980s to the 1990s detailed studies were conducted of the high- cesium deposits in the areas [54–58].
Most of the Dagejia geothermal field is composed of Quaternary sediments. Underlying exposed stratigraphic units are: Paleogene Dazhuka Group (E3N1d) sandstones and mudstones; Paleogene Dianzhong Group (E1-2d
2) rhyo-litic lavas, tuffaceous sandstones and rhyolites; and Creta-ceous Angren Group (K1-2a
1) dark gray and gray-black sandstones and fine sandstone-shales laminated sediments6)
[51]. Magmatic rocks exposed in study area are medium-
grained porphyritic hornblende monzogranites and medium- grained porphyritic biotite monzogranites (KZπHbηγ) which intruded in clastic stone during the Cretaceous6)[51]. The granite intrusions are the most likely heat source for the hot
springs, and their granite micas and feldspars are likely the main sources of major hydrochemical elements K, Na, Ca, Mg.
The entire region has experienced strong tectonic activ-ity, with well-developed east-west and northwest-southeast (Figure 1(c)). The Dagejia geothermal field lies within a small north-south oriented graben [47,59], the tensional nature of which presenting good conditions for extensive surface manifestation of geothermal waters.
2 Sample collection and analysis
2.1 Field testing
We field tested six hot springs in the Langjiu geothermal field (LJ1–LJ6) (Figure 1(d); Figure 2(a),(c)), and six gey-sers in the Dagejia geothermal field (DJ1: major geyser; DJ114, DJ106, DJ109, DJ112, DJ116: normal geysers) (Figure 1(e); Figure 2(b),(d)) and melt water, river water and lake water samples. We measured temperature (°C, accuracy ±0.1°C), pH, electrical conductivity (EC; accuracy ±1 μs cm–1) in the field using a portable instrument (Hach, USA), and measured bicarbonate (HCO3
–, accuracy ±0.1 mmol L–1) and calcium ions (Ca2+, ±0.2 mmol L–1) with a portable kit (Merck, Germany).
6) See footnote 5) on Page 3.
5
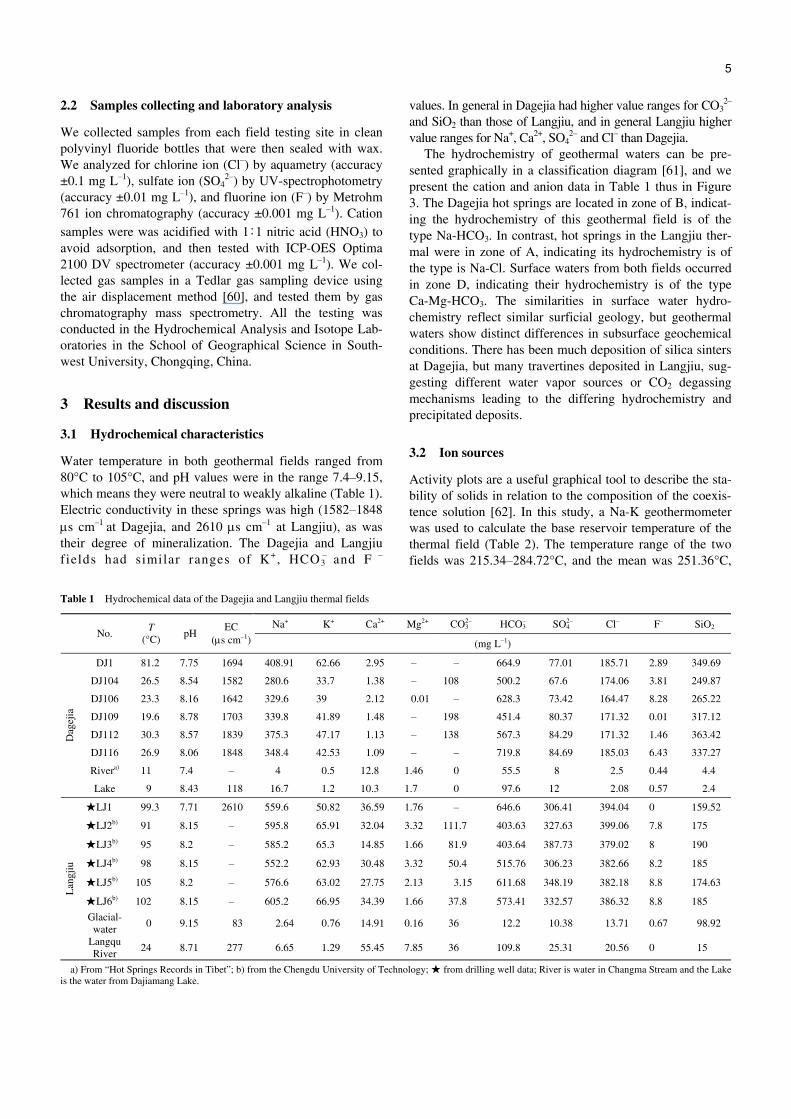
2.2 Samples collecting and laboratory analysis
We collected samples from each field testing site in clean polyvinyl fluoride bottles that were then sealed with wax. We analyzed for chlorine ion (Cl–) by aquametry (accuracy ±0.1 mg L–1), sulfate ion (SO4
2–) by UV-spectrophotometry (accuracy ±0.01 mg L–1), and fluorine ion (F–) by Metrohm 761 ion chromatography (accuracy ±0.001 mg L–1). Cation samples were was acidified with 1:1 nitric acid (HNO3) to avoid adsorption, and then tested with ICP-OES Optima 2100 DV spectrometer (accuracy ±0.001 mg L–1). We col-lected gas samples in a Tedlar gas sampling device using the air displacement method [60], and tested them by gas chromatography mass spectrometry. All the testing was conducted in the Hydrochemical Analysis and Isotope Lab- oratories in the School of Geographical Science in South-west University, Chongqing, China.
3 Results and discussion
3.1 Hydrochemical characteristics
Water temperature in both geothermal fields ranged from 80°C to 105°C, and pH values were in the range 7.4–9.15, which means they were neutral to weakly alkaline (Table 1). Electric conductivity in these springs was high (1582–1848 μs cm–1 at Dagejia, and 2610 μs cm–1 at Langjiu), as was their degree of mineralization. The Dagejia and Langjiu f ields had similar ranges of K+, HCO3
– and F –
values. In general in Dagejia had higher value ranges for CO32–
and SiO2 than those of Langjiu, and in general Langjiu higher value ranges for Na+, Ca2+, SO4
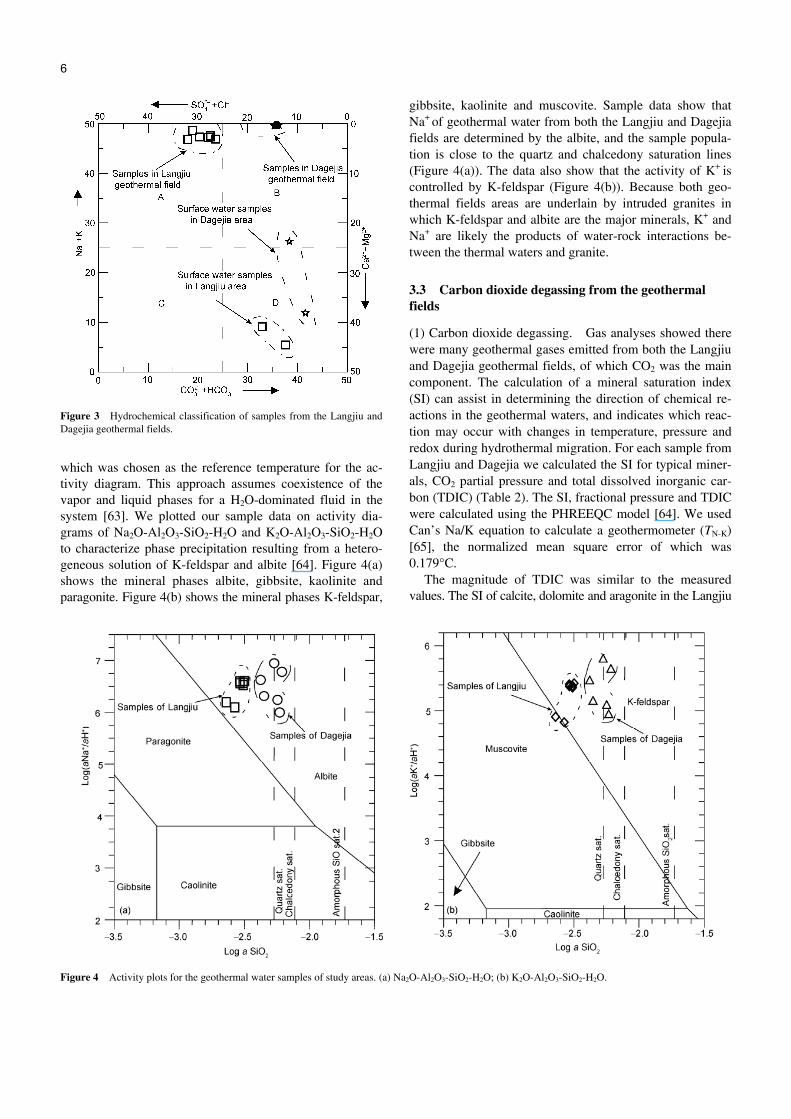
2– and Cl– than Dagejia. The hydrochemistry of geothermal waters can be pre-
sented graphically in a classification diagram [61], and we present the cation and anion data in Table 1 thus in Figure 3. The Dagejia hot springs are located in zone of B, indicat-ing the hydrochemistry of this geothermal field is of the type Na-HCO3. In contrast, hot springs in the Langjiu ther-mal were in zone of A, indicating its hydrochemistry is of the type is Na-Cl. Surface waters from both fields occurred in zone D, indicating their hydrochemistry is of the type Ca-Mg-HCO3. The similarities in surface water hydro-chemistry reflect similar surficial geology, but geothermal waters show distinct differences in subsurface geochemical conditions. There has been much deposition of silica sinters at Dagejia, but many travertines deposited in Langjiu, sug-gesting different water vapor sources or CO2 degassing mechanisms leading to the differing hydrochemistry and precipitated deposits.
3.2 Ion sources
Activity plots are a useful graphical tool to describe the sta-bility of solids in relation to the composition of the coexis-tence solution [62]. In this study, a Na-K geothermometer was used to calculate the base reservoir temperature of the thermal field (Table 2). The temperature range of the two fields was 215.34–284.72°C, and the mean was 251.36°C,
Table 1 Hydrochemical data of the Dagejia and Langjiu thermal fields
Na+ K+ Ca2+ Mg2+ CO32– HCO3
– SO42– Cl– F– SiO2 No.
T (°C)
pH EC
(μs cm–1) (mg L–1)
DJ1 81.2 7.75 1694 408.91 62.66 2.95 – – 664.9 77.01 185.71 2.89 349.69
DJ104 26.5 8.54 1582 280.6 33.7 1.38 – 108 500.2 67.6 174.06 3.81 249.87
DJ106 23.3 8.16 1642 329.6 39 2.12 0.01 – 628.3 73.42 164.47 8.28 265.22
DJ109 19.6 8.78 1703 339.8 41.89 1.48 – 198 451.4 80.37 171.32 0.01 317.12
DJ112 30.3 8.57 1839 375.3 47.17 1.13 – 138 567.3 84.29 171.32 1.46 363.42
DJ116 26.9 8.06 1848 348.4 42.53 1.09 – – 719.8 84.69 185.03 6.43 337.27
Rivera) 11 7.4 – 4 0.5 12.8 1.46 0 55.5 8 2.5 0.44 4.4
Dag
ejia
Lake 9 8.43 118 16.7 1.2 10.3 1.7 0 97.6 12 2.08 0.57 2.4
★LJ1 99.3 7.71 2610 559.6 50.82 36.59 1.76 – 646.6 306.41 394.04 0 159.52
★LJ2b) 91 8.15 – 595.8 65.91 32.04 3.32 111.7 403.63 327.63 399.06 7.8 175
★LJ3b) 95 8.2 – 585.2 65.3 14.85 1.66 81.9 403.64 387.73 379.02 8 190
★LJ4b) 98 8.15 – 552.2 62.93 30.48 3.32 50.4 515.76 306.23 382.66 8.2 185
★LJ5b) 105 8.2 – 576.6 63.02 27.75 2.13 3.15 611.68 348.19 382.18 8.8 174.63
★LJ6b) 102 8.15 – 605.2 66.95 34.39 1.66 37.8 573.41 332.57 386.32 8.8 185
Glacial- water
0 9.15 83 2.64 0.76 14.91 0.16 36 12.2 10.38 13.71 0.67 98.92
Lan
gjiu
Langqu River
24 8.71 277 6.65 1.29 55.45 7.85 36 109.8 25.31 20.56 0 15
a) From “Hot Springs Records in Tibet”; b) from the Chengdu University of Technology; ★ from drilling well data; River is water in Changma Stream and the Lake is the water from Dajiamang Lake.
6
Figure 3 Hydrochemical classification of samples from the Langjiu and Dagejia geothermal fields.
which was chosen as the reference temperature for the ac-tivity diagram. This approach assumes coexistence of the vapor and liquid phases for a H2O-dominated fluid in the system [63]. We plotted our sample data on activity dia-grams of Na2O-Al2O3-SiO2-H2O and K2O-Al2O3-SiO2-H2O to characterize phase precipitation resulting from a hetero-geneous solution of K-feldspar and albite [64]. Figure 4(a) shows the mineral phases albite, gibbsite, kaolinite and paragonite. Figure 4(b) shows the mineral phases K-feldspar,
gibbsite, kaolinite and muscovite. Sample data show that Na+ of geothermal water from both the Langjiu and Dagejia fields are determined by the albite, and the sample popula-tion is close to the quartz and chalcedony saturation lines (Figure 4(a)). The data also show that the activity of K+ is
controlled by K-feldspar (Figure 4(b)). Because both geo-thermal fields areas are underlain by intruded granites in which K-feldspar and albite are the major minerals, K+ and Na+ are likely the products of water-rock interactions be-tween the thermal waters and granite.
3.3 Carbon dioxide degassing from the geothermal fields
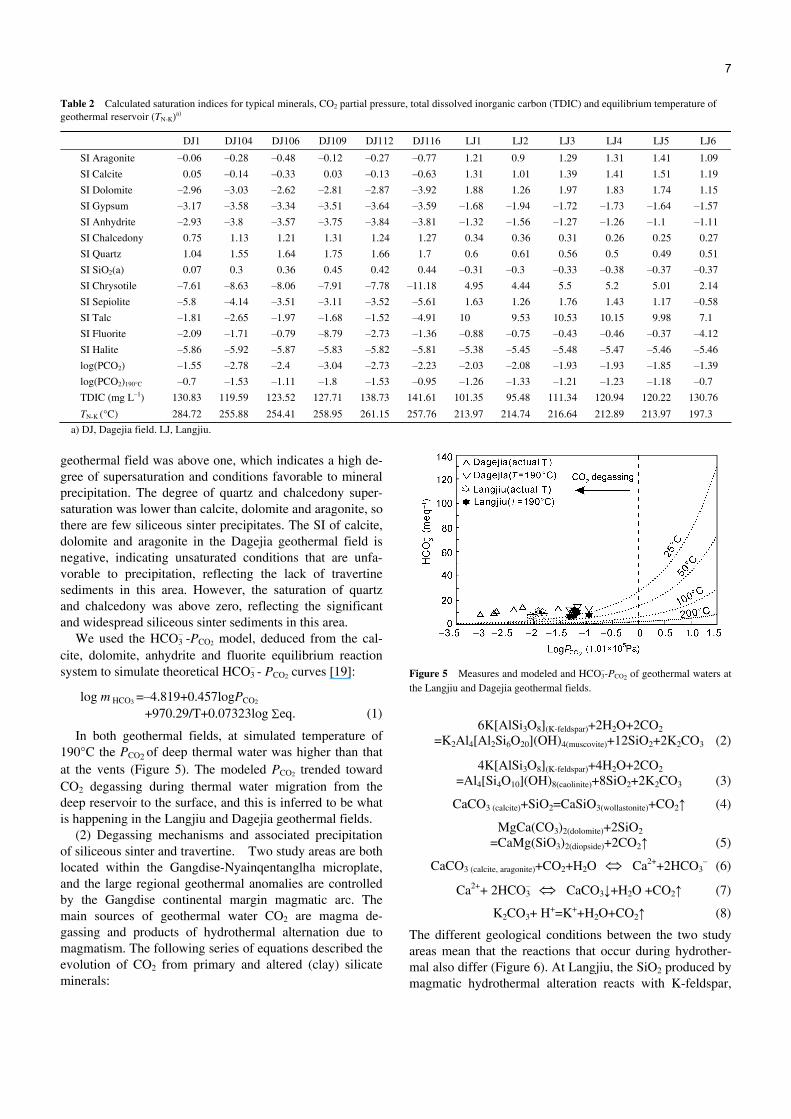
(1) Carbon dioxide degassing. Gas analyses showed there were many geothermal gases emitted from both the Langjiu and Dagejia geothermal fields, of which CO2 was the main component. The calculation of a mineral saturation index (SI) can assist in determining the direction of chemical re-actions in the geothermal waters, and indicates which reac-tion may occur with changes in temperature, pressure and redox during hydrothermal migration. For each sample from Langjiu and Dagejia we calculated the SI for typical miner-als, CO2 partial pressure and total dissolved inorganic car-bon (TDIC) (Table 2). The SI, fractional pressure and TDIC were calculated using the PHREEQC model [64]. We used Can’s Na/K equation to calculate a geothermometer (TN-K) [65], the normalized mean square error of which was 0.179°C.
The magnitude of TDIC was similar to the measured values. The SI of calcite, dolomite and aragonite in the Langjiu
Figure 4 Activity plots for the geothermal water samples of study areas. (a) Na2O-Al2O3-SiO2-H2O; (b) K2O-Al2O3-SiO2-H2O.
7
Table 2 Calculated saturation indices for typical minerals, CO2 partial pressure, total dissolved inorganic carbon (TDIC) and equilibrium temperature of geothermal reservoir (TN-K)a)
DJ1 DJ104 DJ106 DJ109 DJ112 DJ116 LJ1 LJ2 LJ3 LJ4 LJ5 LJ6
SI Aragonite –0.06 –0.28 –0.48 –0.12 –0.27 –0.77 1.21 0.9 1.29 1.31 1.41 1.09
SI Calcite 0.05 –0.14 –0.33 0.03 –0.13 –0.63 1.31 1.01 1.39 1.41 1.51 1.19
SI Dolomite –2.96 –3.03 –2.62 –2.81 –2.87 –3.92 1.88 1.26 1.97 1.83 1.74 1.15
SI Gypsum –3.17 –3.58 –3.34 –3.51 –3.64 –3.59 –1.68 –1.94 –1.72 –1.73 –1.64 –1.57
SI Anhydrite –2.93 –3.8 –3.57 –3.75 –3.84 –3.81 –1.32 –1.56 –1.27 –1.26 –1.1 –1.11
SI Chalcedony 0.75 1.13 1.21 1.31 1.24 1.27 0.34 0.36 0.31 0.26 0.25 0.27
SI Quartz 1.04 1.55 1.64 1.75 1.66 1.7 0.6 0.61 0.56 0.5 0.49 0.51
SI SiO2(a) 0.07 0.3 0.36 0.45 0.42 0.44 –0.31 –0.3 –0.33 –0.38 –0.37 –0.37
SI Chrysotile –7.61 –8.63 –8.06 –7.91 –7.78 –11.18 4.95 4.44 5.5 5.2 5.01 2.14
SI Sepiolite –5.8 –4.14 –3.51 –3.11 –3.52 –5.61 1.63 1.26 1.76 1.43 1.17 –0.58
SI Talc –1.81 –2.65 –1.97 –1.68 –1.52 –4.91 10 9.53 10.53 10.15 9.98 7.1
SI Fluorite –2.09 –1.71 –0.79 –8.79 –2.73 –1.36 –0.88 –0.75 –0.43 –0.46 –0.37 –4.12
SI Halite –5.86 –5.92 –5.87 –5.83 –5.82 –5.81 –5.38 –5.45 –5.48 –5.47 –5.46 –5.46
log(PCO2) –1.55 –2.78 –2.4 –3.04 –2.73 –2.23 –2.03 –2.08 –1.93 –1.93 –1.85 –1.39
log(PCO2)190°C –0.7 –1.53 –1.11 –1.8 –1.53 –0.95 –1.26 –1.33 –1.21 –1.23 –1.18 –0.7
TDIC (mg L–1) 130.83 119.59 123.52 127.71 138.73 141.61 101.35 95.48 111.34 120.94 120.22 130.76
TN-K (°C) 284.72 255.88 254.41 258.95 261.15 257.76 213.97 214.74 216.64 212.89 213.97 197.3
a) DJ, Dagejia field. LJ, Langjiu.
geothermal field was above one, which indicates a high de-gree of supersaturation and conditions favorable to mineral precipitation. The degree of quartz and chalcedony super-saturation was lower than calcite, dolomite and aragonite, so there are few siliceous sinter precipitates. The SI of calcite, dolomite and aragonite in the Dagejia geothermal field is negative, indicating unsaturated conditions that are unfa-vorable to precipitation, reflecting the lack of travertine sediments in this area. However, the saturation of quartz and chalcedony was above zero, reflecting the significant and widespread siliceous sinter sediments in this area.
We used the HCO3– -PCO2 model, deduced from the cal-
cite, dolomite, anhydrite and fluorite equilibrium reaction system to simulate theoretical HCO3
– - PCO2 curves [19]:
log m HCO3 =–4.819+0.457logPCO2
+970.29/T+0.07323log Σeq. (1)
In both geothermal fields, at simulated temperature of 190°C the PCO2 of deep thermal water was higher than that at the vents (Figure 5). The modeled PCO2 trended toward CO2 degassing during thermal water migration from the deep reservoir to the surface, and this is inferred to be what is happening in the Langjiu and Dagejia geothermal fields.
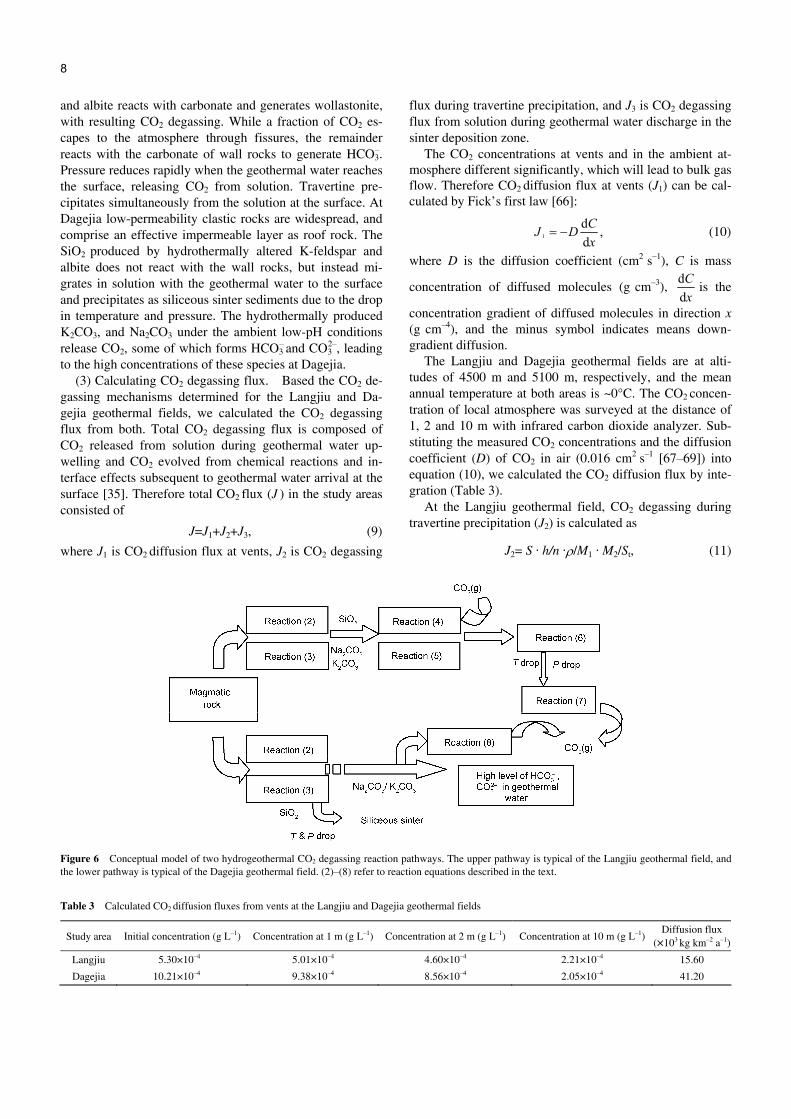
(2) Degassing mechanisms and associated precipitation of siliceous sinter and travertine. Two study areas are both located within the Gangdise-Nyainqentanglha microplate, and the large regional geothermal anomalies are controlled by the Gangdise continental margin magmatic arc. The main sources of geothermal water CO2 are magma de-gassing and products of hydrothermal alternation due to magmatism. The following series of equations described the evolution of CO2 from primary and altered (clay) silicate minerals:
Figure 5 Measures and modeled and HCO3–-PCO2 of geothermal waters at
the Langjiu and Dagejia geothermal fields.
6K[AlSi3O8](K-feldspar)+2H2O+2CO2
=K2Al4[Al2Si6O20](OH)4(muscovite)+12SiO2+2K2CO3 (2)
4K[AlSi3O8](K-feldspar)+4H2O+2CO2
=Al4[Si4O10](OH)8(caolinite)+8SiO2+2K2CO3 (3)
CaCO3 (calcite)+SiO2=CaSiO3(wollastonite)+CO2↑ (4)
MgCa(CO3)2(dolomite)+2SiO2
=CaMg(SiO3)2(diopside)+2CO2↑ (5)
CaCO3 (calcite, aragonite)+CO2+H2O ⇔ Ca2++2HCO3– (6)
Ca2++ 2HCO3– ⇔ CaCO3↓+H2O +CO2↑ (7)
K2CO3+ H+=K++H2O+CO2↑ (8)
The different geological conditions between the two study areas mean that the reactions that occur during hydrother-mal also differ (Figure 6). At Langjiu, the SiO2 produced by magmatic hydrothermal alteration reacts with K-feldspar,
8
and albite reacts with carbonate and generates wollastonite, with resulting CO2 degassing. While a fraction of CO2 es-capes to the atmosphere through fissures, the remainder reacts with the carbonate of wall rocks to generate HCO3
–. Pressure reduces rapidly when the geothermal water reaches the surface, releasing CO2 from solution. Travertine pre-cipitates simultaneously from the solution at the surface. At Dagejia low-permeability clastic rocks are widespread, and comprise an effective impermeable layer as roof rock. The SiO2 produced by hydrothermally altered K-feldspar and albite does not react with the wall rocks, but instead mi-grates in solution with the geothermal water to the surface and precipitates as siliceous sinter sediments due to the drop in temperature and pressure. The hydrothermally produced K2CO3, and Na2CO3 under the ambient low-pH conditions release CO2, some of which forms HCO3
– and CO32–, leading
to the high concentrations of these species at Dagejia. (3) Calculating CO2 degassing flux. Based the CO2 de-
gassing mechanisms determined for the Langjiu and Da- gejia geothermal fields, we calculated the CO2 degassing flux from both. Total CO2 degassing flux is composed of CO2 released from solution during geothermal water up-welling and CO2 evolved from chemical reactions and in-terface effects subsequent to geothermal water arrival at the surface [35]. Therefore total CO2 flux (J ) in the study areas consisted of
J=J1+J2+J3, (9)
where J1 is CO2 diffusion flux at vents, J2 is CO2 degassing
flux during travertine precipitation, and J3 is CO2 degassing flux from solution during geothermal water discharge in the sinter deposition zone.
The CO2 concentrations at vents and in the ambient at-mosphere different significantly, which will lead to bulk gas flow. Therefore CO2 diffusion flux at vents (J1) can be cal-culated by Fick’s first law [66]:
1
d ,dCJ Dx
= − (10)
where D is the diffusion coefficient (cm2 s–1), C is mass
concentration of diffused molecules (g cm–3), ddCx
is the
concentration gradient of diffused molecules in direction x (g cm–4), and the minus symbol indicates means down- gradient diffusion.
The Langjiu and Dagejia geothermal fields are at alti-tudes of 4500 m and 5100 m, respectively, and the mean annual temperature at both areas is ~0°C. The CO2 concen-tration of local atmosphere was surveyed at the distance of 1, 2 and 10 m with infrared carbon dioxide analyzer. Sub-stituting the measured CO2 concentrations and the diffusion coefficient (D) of CO2 in air (0.016 cm2 s–1 [67–69]) into equation (10), we calculated the CO2 diffusion flux by inte-gration (Table 3).
At the Langjiu geothermal field, CO2 degassing during travertine precipitation (J2) is calculated as
J2= S · h/n ·ρ/M1 · M2/St, (11)
Figure 6 Conceptual model of two hydrogeothermal CO2 degassing reaction pathways. The upper pathway is typical of the Langjiu geothermal field, and the lower pathway is typical of the Dagejia geothermal field. (2)–(8) refer to reaction equations described in the text.
Table 3 Calculated CO2 diffusion fluxes from vents at the Langjiu and Dagejia geothermal fields
Study area Initial concentration (g L–1) Concentration at 1 m (g L–1) Concentration at 2 m (g L–1) Concentration at 10 m (g L–1) Diffusion flux
(×103 kg km–2 a–1)
Langjiu 5.30×10⁻⁴ 5.01×10⁻⁴ 4.60×10⁻⁴ 2.21×10⁻⁴ 15.60
Dagejia 10.21×10⁻⁴ 9.38×10⁻⁴ 8.56×10⁻⁴ 2.05×10⁻⁴ 41.20
9
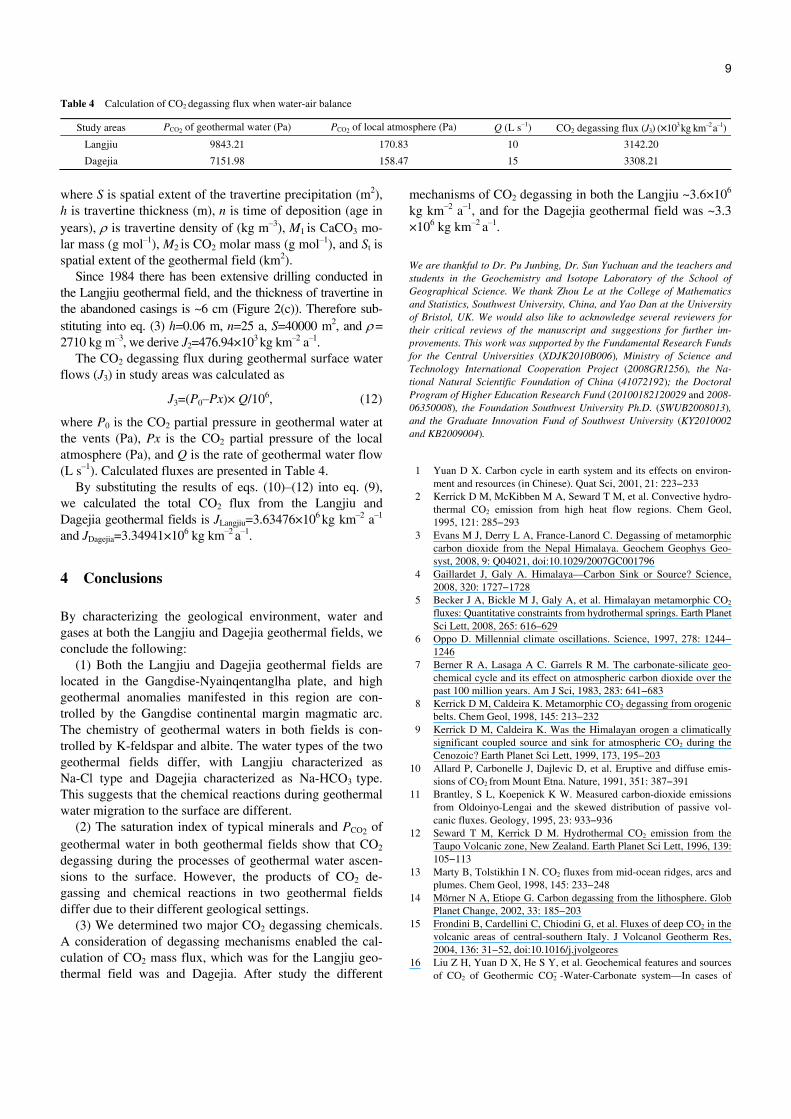
Table 4 Calculation of CO2 degassing flux when water-air balance
Study areas PCO2 of geothermal water (Pa) PCO2 of local atmosphere (Pa) Q (L s–1) CO2 degassing flux (J3) (×103 kg km–2 a–1)
Langjiu 9843.21 170.83 10 3142.20
Dagejia 7151.98 158.47 15 3308.21
where S is spatial extent of the travertine precipitation (m2), h is travertine thickness (m), n is time of deposition (age in years), ρ is travertine density of (kg m–3), M1 is CaCO3 mo-lar mass (g mol–1), M2 is CO2 molar mass (g mol–1), and St is spatial extent of the geothermal field (km2).
Since 1984 there has been extensive drilling conducted in the Langjiu geothermal field, and the thickness of travertine in the abandoned casings is ~6 cm (Figure 2(c)). Therefore sub-stituting into eq. (3) h=0.06 m, n=25 a, S=40000 m2, and ρ = 2710 kg m–3, we derive J2=476.94×10³ kg km–2 a–1.
The CO2 degassing flux during geothermal surface water flows (J3) in study areas was calculated as
J3=(P0–Px)× Q/106, (12)
where P0 is the CO2 partial pressure in geothermal water at the vents (Pa), Px is the CO2 partial pressure of the local atmosphere (Pa), and Q is the rate of geothermal water flow (L s–1). Calculated fluxes are presented in Table 4.
By substituting the results of eqs. (10)–(12) into eq. (9), we calculated the total CO2 flux from the Langjiu and Dagejia geothermal fields is JLangjiu=3.63476×10⁶ kg km–2 a–1 and JDagejia=3.34941×10⁶ kg km–2 a–1.
4 Conclusions
By characterizing the geological environment, water and gases at both the Langjiu and Dagejia geothermal fields, we conclude the following:
(1) Both the Langjiu and Dagejia geothermal fields are located in the Gangdise-Nyainqentanglha plate, and high geothermal anomalies manifested in this region are con-trolled by the Gangdise continental margin magmatic arc. The chemistry of geothermal waters in both fields is con-trolled by K-feldspar and albite. The water types of the two geothermal fields differ, with Langjiu characterized as Na-Cl type and Dagejia characterized as Na-HCO3 type. This suggests that the chemical reactions during geothermal water migration to the surface are different.
(2) The saturation index of typical minerals and PCO2 of geothermal water in both geothermal fields show that CO2 degassing during the processes of geothermal water ascen-sions to the surface. However, the products of CO2 de-gassing and chemical reactions in two geothermal fields differ due to their different geological settings.
(3) We determined two major CO2 degassing chemicals. A consideration of degassing mechanisms enabled the cal-culation of CO2 mass flux, which was for the Langjiu geo-thermal field was and Dagejia. After study the different
mechanisms of CO2 degassing in both the Langjiu ~3.6×10⁶
kg km–2 a–1, and for the Dagejia geothermal field was ~3.3 ×10⁶ kg km–2 a–1.
We are thankful to Dr. Pu Junbing, Dr. Sun Yuchuan and the teachers and students in the Geochemistry and Isotope Laboratory of the School of Geographical Science. We thank Zhou Le at the College of Mathematics and Statistics, Southwest University, China, and Yao Dan at the University of Bristol, UK. We would also like to acknowledge several reviewers for their critical reviews of the manuscript and suggestions for further im-provements. This work was supported by the Fundamental Research Funds for the Central Universities (XDJK2010B006), Ministry of Science and Technology International Cooperation Project (2008GR1256), the Na-tional Natural Scientific Foundation of China (41072192); the Doctoral Program of Higher Education Research Fund (20100182120029 and 2008- 06350008), the Foundation Southwest University Ph.D. (SWUB2008013), and the Graduate Innovation Fund of Southwest University (KY2010002 and KB2009004).
1 Yuan D X. Carbon cycle in earth system and its effects on environ-ment and resources (in Chinese). Quat Sci, 2001, 21: 223−233
2 Kerrick D M, McKibben M A, Seward T M, et al. Convective hydro-thermal CO2 emission from high heat flow regions. Chem Geol, 1995, 121: 285−293
3 Evans M J, Derry L A, France-Lanord C. Degassing of metamorphic carbon dioxide from the Nepal Himalaya. Geochem Geophys Geo-syst, 2008, 9: Q04021, doi:10.1029/2007GC001796
4 Gaillardet J, Galy A. Himalaya—Carbon Sink or Source? Science, 2008, 320: 1727−1728
5 Becker J A, Bickle M J, Galy A, et al. Himalayan metamorphic CO2 fluxes: Quantitative constraints from hydrothermal springs. Earth Planet Sci Lett, 2008, 265: 616–629
6 Oppo D. Millennial climate oscillations. Science, 1997, 278: 1244− 1246
7 Berner R A, Lasaga A C. Garrels R M. The carbonate-silicate geo-chemical cycle and its effect on atmospheric carbon dioxide over the past 100 million years. Am J Sci, 1983, 283: 641−683
8 Kerrick D M, Caldeira K. Metamorphic CO2 degassing from orogenic belts. Chem Geol, 1998, 145: 213−232
9 Kerrick D M, Caldeira K. Was the Himalayan orogen a climatically significant coupled source and sink for atmospheric CO2 during the Cenozoic? Earth Planet Sci Lett, 1999, 173, 195−203
10 Allard P, Carbonelle J, Dajlevic D, et al. Eruptive and diffuse emis-sions of CO2 from Mount Etna. Nature, 1991, 351: 387−391
11 Brantley, S L, Koepenick K W. Measured carbon-dioxide emissions from Oldoinyo-Lengai and the skewed distribution of passive vol-canic fluxes. Geology, 1995, 23: 933−936
12 Seward T M, Kerrick D M. Hydrothermal CO2 emission from the Taupo Volcanic zone, New Zealand. Earth Planet Sci Lett, 1996, 139: 105−113
13 Marty B, Tolstikhin I N. CO2 fluxes from mid-ocean ridges, arcs and plumes. Chem Geol, 1998, 145: 233−248
14 Mörner N A, Etiope G. Carbon degassing from the lithosphere. Glob Planet Change, 2002, 33: 185−203
15 Frondini B, Cardellini C, Chiodini G, et al. Fluxes of deep CO2 in the volcanic areas of central-southern Italy. J Volcanol Geotherm Res, 2004, 136: 31−52, doi:10.1016/j.jvolgeores
16 Liu Z H, Yuan D X, He S Y, et al. Geochemical features and sources of CO2 of Geothermic CO2
− -Water-Carbonate system—In cases of
10
Huanglong Valley, Kangding, Sichuan and Zhongdian, Xiagei, Yun-nan (in Chinese). Sci China Ser D-Earth Sci, 2000, 30: 209−214
17 Chiodini G. Temperature, pressure and redox conditions governing the composition of the cold CO2 gases discharged in North Latium (Italy). Appl Geochem, 1994, 9: 287−295
18 Chiodini G, Frondini F. Carbon dioxide degassing from the Albani Hills volcanic region, central Italy. Chem Geol, 2001, 177: 67−83
19 Chiodini G, Frondini F, Marini L. Theoretical geothermometers and PCO2 indicators for aqueous solutions coming from hydrothermal sys-tems of medium-low temperature hosted in carbonate-evaporite rocks. Applications to the thermal springs of the Etruscan Swell, It-aly. Appl Geochem, 1995, 10: 337−346
20 Chiodini G, Frondini F, Ponziani F. Deep structures and carbon di-oxide degassing in central Italy. Geothermics, 1995, 24: 81−94
21 Chiodini G, Cioni R, Guidi M, et al. Soil CO2 flux measurements in volcanic and geothermal areas. Appl Geochem, 1998, 13: 543−552
22 Chiodini G, Frondini F, Kerrick D M, et al. Quantification of deep CO2 fluxes from central Italy. Examples of carbon balance for regional aq-uifers and of soil diffuse degassing. Chem Geol, 1999, 159: 205−222
23 Chiodini G, Frondini F, Cardellini C, et al. Rate of diffuse carbon dioxide earth degassing estimated from carbon balance of regional aquifers: The case of central Apennine, Italy. J Geophys Res, 2000, 105: 8423−8434
24 Chiodini G, Cardellini C, Amato A, et al. Carbon dioxide Earth de-gassing and seismogenesis in central and southern Italy. Geophys Res Lett, 2004, 31, doi:10.1029/2004GL019480
25 Allard P. A CO2-rich gas trigger of explosive paroxysms as Stromboli basaltic volcano, Italy. J Volcanol Geoth Res, 2010, 189: 343−374
26 Frondini F, Caliro S, Cardellini C, et al. Carbon dioxide degassing and thermal energy release in the Monte Amiata volcanic-geothermal area (Italy). Appl Geochem, 2009, 24: 860−875
27 Prondini F, Caliro S, Carrdellini C, et al. Carbon dioxide degassing from Tuscany and Northern Latium (Italy). Glob Planet Change. 2008, 61: 89−102
28 Mayo A L, Muller A B. Low temperature diagenetic-metamorphic and magmatic contributions of external CO2
gas to a shallow
groundwater system. J Hydrol, 1997, 194: 286−304 29 Nesbitt B E, Mendoza C A, Kerrick D M. Surface fluid convection
during Cordilleran extension and the generation of metamorphic CO2
contributions to Cenozoic atmosphere. Geology, 1995, 23: 99−101 30 Kerrick D M, Caldeira K. Metamorphic CO2 degassing and Early
Cenozoic paleoclimate. GSA Today, 1994, 4: 57−65 31 Pentecost A. Geochemistry of carbon dioxide in six Travertine-
depositing. waters of Italy. J Hydrol, 1995, 167: 263−278 32 Arthaud F, Dazy J, Grillot J C. Distribution of deep carbon dioxide in
relation to the structure and tectonic evolution of South-East France. Geodin Acta, 1994, 7: 86−102
33 Dai J X, Dai C S, Song Y. Geochemical characteristics and compo-nents of carbon and helium isotope of hot spring natural gases in some parts of China (in Chinese). Sci Chin Ser B, 1994, 24: 426−433
34 Dai J X, Song Y, Dai C S. Abiogenic Gas and Conditions of Its Gas Reservoir Formation in Eastern China (in Chinese). Beijing: Science Press, 1995, 1−212
35 Liu Z H, Dreybrodt W. Dissolutional kinetics of calcium carbonate minerals in H2O-CO2 solutions in turbulent now: The role of the dif-fusion boundary layer and the slow reaction H2O+CO2=H++ HCO3
–. Geochim Cosmochim Acta, 1997, 61: 2879−2889
36 Shangguan Z G, Liu G F, Gao S S. The CO2 discharges and sources in the area of the boundary faults of the Sichuan—Yunnan block (in Chinese). EQ Res Chin, 1993, 9: 146−153
37 Shangguan Z G, Huo W G. δD values of escaped H2 from hot springs at the Tengchong Rehai geothermal area and its origin (in Chinese). Chinese Sci Bull, 2002, 47: 146–149
38 Shangguan Z G, Bai C H, Sun M L. Mantle-derived magmatic gas releasing features at the Rehai area, Tengchong County, Yunnan Province, China (in Chinese). Sci Chin Ser D-Earth Sci, 2000, 43: 132−140
39 Zhao P, Xie E J, Duo J, et al. Geochemical characteristics of geo-thermal gases and their geological implications in Tibet (in Chinese).
Acta Petrol Sin, 2002, 18: 539−550 40 Shen L C, Yuan D X, Ding T P, et al. Distributing inhomogeneity of
helium isotope of CO2 degasification point and its geotectogenesis in Southwest of China (in Chinese). Acta Geol Sin, 2007, 81: 475− 487
41 Tank V, Pfanz H, Kick H. New remote sensing techniques for the detection and quantification of earth surface CO2 degassing. J Vol-canol Geoth Res, 2008, 177: 515−524
42 Williams H, Turner S, Kelley S, et al. Age and composition of dikes in Southern Tibet: New constraints on the timing of east-west exten-sion and it’s relationship to post-collisional volcanism. Geology, 2001, 29: 339−342
43 Blisniuk P M, Hacker B R, Glodny J, et al. Normal faulting in central Tibet since at least 13.5 Myr ago. Nature, 2001, 412: 628–632
44 Coleman M, Hodges K. Evidence for Tibetan plateau up lift before 14 Myr ago from a new minimum age for east-west extension. Na-ture, 1995, 374: 49−52
45 Bllsnluk P M, Hacker B, Glodny J, et al. Normal faulting in central Tibet since at least 13.5 Myr ago. Nature, 2001, 412: 628−632
46 Zhang J, Ma Z J. East-West segmentation of the Tibetan Plateau and its implication (in Chinese). Acta Geol Sin, 2004, 78: 218−227
47 Li Z Q, Hou Z Q, Nie F J, et al. Characteristic and distribution of the partial melting layers in the upper crust: Evidence from active hydro-thermal fluid in the south Tibet (in Chinese). Acta Geol Sin, 2005, 79: 68−77
48 Tibetan Plateau Comprehensive Scientific Expedition Team (CAS), Geothermal in Tibet (in Chinese). Beijing: Science Press, 1981. 130− 140
49 Tong W, Liao Z J, Liu S B, et al. Tibetan Hotspring Blog (in Chi-nese). Beijing: Science Press, 2000. 4−49
50 Liao Z L, Liao G Y, Pan G T, et al. Distribution and utilization of geothermal resources in Tibet Ngari (in Chinese). Chin Min Mag, 2005, 14: 43−46
51 Tibet Bureau of Geology and Mineral Resources. Regional Geology Log of Tibet Autonomous Region. Geological Report of Ministry of Geology and Mineral Resources of People’s Republic of China, NO.31 (in Chinese). Beijing: Geological Publishing House, 1993. 7−477
52 Pan G T, Ding J, Wang L Q, et al. Instructions of 1:1500000 Geo-logical Map of Qinghai-Tibet Plateau and Adjacent Areas (in Chi-nese). Chengdu: Chengdu Cartograph Publishing House, 2004
53 Zhu D C, Mo X X, Wang L Q, et al. Petrogenesis of highly fraction-ated I-type granites in the Zayu area of eastern Gangdese, Tibet: Con-straints from zircon U-Pb geochronology, geochemistry and Sr-Nd-Hf isotopes. Sci Chin Ser D-Earth Sci, 2009, 52: 1223–1239
54 Zhao Y Y, Nie F J, Hou Z Q, et al. Geological characteristics and formation age of hot spring cesium deposit in Targejia area, Tibet (in Chinese). Mineral Deposits, 2006, 25: 281−291
55 Zhao Y Y, Nie F J, Hou Z Q, et al. Isotope characteristics and forma-tion process of hot spring type cesium deposit in Targejia, Tibet (in Chinese). Miner Deposits, 2006, 25: 613−619
56 Zhao Y Y, Zhao X T, Ma Z B. Study on Chronology for hot spring typed Cs-deposit of Targejia, Tibet (in Chinese). Acta Petrol Sin, 2006, 22: 717−724
57 Zhao Y Y, Nie F J, Hou Z Q, et al. Geochemistry of Targrjia hot spring type cesium deposit in Tibet (in Chinese). Miner Deposits, 2007, 25: 163−174
58 Zheng M P, Wang Q X, Duo J, et al. New Types of Hydrothermal Mineralization—Cesium Silicon Sinter Deposits in Tibet (in Chi-nese). Beijing: Geological Publishing House, 1995. 1−110
59 Hou Z Q, Li Z Q. Possible Location for Underthrusting Front of the Indus Continent: Constraints from Helium Isotope of the Geothermal Gas in Southern Tibet and Eastern Tibet (in Chinese). Acta Geol Sin, 2004, 78: 482−493
60 Gupta H, Roy S. Geothermal Energy: An Alternative Resource for the 21st Century. Elsevier, 2007. 121-164
61 Fytikas M, Kavouridis T, Leonis C, et al. Geochemical exploration of the three most significant geothermal areas of Lesbos Island, Greece. Geothermics, 1989, 18: 465–475
62 Bowers T S, Jackson K J, Helgeson H C. Equilibrium Activity Dia-grams: For Coexisting Minerals and Aqueous Solutions at Pressures

11
and Temperatures to 5 kb and 600°C. Berlin: Springer, 1984. 1–397 63 Marini L, Fung A Y, Sanchez E. Use of reaction path modeling to
identify the processes governing the generation of neutral Na-Cl and acidic Na-Cl-SO4 deep geothermal liquids at Miravalles geothermal system, Costa Rica. J Volcanol Geoth Res, 2003, 128: 363–387
64 Parkhurst D L, Appelo C A J. User guide to PHREEQC (version 2) – a computer program for speciation, batch-reaction, one-dimensional transport, and inverse geochemical calculations. US Geol Surv Water- Resour Invest Rep, 1999. 99–4259
65 Can I. A new improved Na/K geothermometer by artificial neural
networks. Geothermics, 2002, 31: 751–760 66 He L Q, Lin J C, Shi B. Fick’s Law and the Diffusion’s Thermody-
namics Theory (in Chinese). J Anqing Teach Coll (Nat Sci ed.), 2006, 12: 38−39
67 Berg H C. Random Walks in Biology, Princeton: PUP, 1993. 1–164 68 Feynman R P, Leighton R B, Sands M. The Feynman Lectures on
Physics. The Definitive and Extended Edition, 2/E. New York: Ad-dison-Wesley Publishing Co, 2006. 422−620
69 Crank J. The Mathematics of Diffusion. 2nd ed. New York: OUP, 1980. 1–424
Open Access This article is distributed under the terms of the Creative Commons Attribution License which permits any use, distribution, and reproduction
in any medium, provided the original author(s) and source are credited.