Cortical Thickness Is Influenced by Regionally Specific Genetic Factors

Author's personal copy
Carbon dioxide and water vapour exchange in a tropical dry forestas influenced by the North American Monsoon System (NAMS)
Eli Rafael Perez-Ruiz a, Jaime Garatuza-Payan a,*, Christopher J. Watts b, Julio Cesar Rodrıguez c,Enrico A. Yepez a, Russell L. Scott d
a Departamento de Ciencias del Agua y del Medio Ambiente, Instituto Tecnologico de Sonora, 5de Febrero #818 Sur, Ciudad Obregon, Sonora 85000, Mexicob Departamento de Fisica, Universidad de Sonora, Hermosillo, Sonora 83000, Mexicoc Departamento de Agricultura y Ganaderia, Universidad de Sonora, Hermosillo, Sonora 83000, Mexicod Southwest Watershed Research Center, USDA, Agricultural Research Service, Tucson, AZ 85719, USA
a r t i c l e i n f o
Article history:Received 4 February 2009Received in revised form22 September 2009Accepted 23 September 2009Available online 21 October 2009
Keywords:Canopy gas exchangeEcosystem water use efficiencyEddy covarianceNorth-western MexicoSeasonally dry ecosystem
a b s t r a c t
To better understand the effects and relationship between precipitation, net ecosystem carbon dioxide(NEE) and water vapor exchange (ET), we report a study conducted in the tropical dry forest (TDF) in thenorthwest of Mexico. Ecosystem gas exchange was measured using the eddy correlation techniqueduring the presence of North American Monsoon System (NAMS) in 2006. Patterns in NEE and ET weredifferent in wet and dry periods. Three markedly defined periods were found during the six-month studyperiod. A pre-monsoon period, where gas exchange was close to zero. A monsoon period, divided in twostages: 1) early monsoon: a strong increase in the respiratory rate marked by a peak of positive values,with a maximum of 22 g CO2 m�2 day�1, and, 2) late monsoon: an assimilation period occurred in thepeak of the monsoon period, with sustained values around �20 g CO2 m�2 day�1. The final was a post-monsoon period, where ecosystems returned to dormancy. NEE and ET trends in the TDF were similar toother seasonally dry ecosystems influenced by the NAMS. During the study period the TDF of NorthwestMexico acted as a sink capturing 374 g CO2 m2 with an ecosystem water use efficiency (-NEE/ET)comparable to other ecosystems in the region. Mechanistic information about biological and environ-mental variables controlling gas exchange dynamics is still necessary to predict how seasonally dryecosystems would respond to climate change.
� 2009 Elsevier Ltd. All rights reserved.
1. Introduction
The North American Monsoon System (NAMS) is a pronouncedincrease in rainfall from a dry period, mainly in May and June, toa rainy period, from July to September, over large areas in thesouthwest of the United States and the north-western Mexico(Adams and Comrie, 1997). This system confers seasonally dry andwet periods to most ecosystems in the region (Douglas et al., 1993;Gochis et al., 2006; Vivoni et al., 2007). In seasonally dry ecosys-tems, precipitation and soil moisture are the primary controls ofbiological activity (Huxman et al., 2004a; Kurc and Small, 2007).During the dry season, the biological activity in the ecosystem isalmost null and the ecosystems remain dormant during this period,but with the onset of the NAMS, the input of precipitation into drysoil immediately stimulates gas exchange dynamics of the systemin several ways. First, a marked CO2 efflux from respiration and
physical displacement of CO2 from organic and inorganic C sourcesis apparent (Emmerich, 2003; Huxman et al., 2004a,b). Then, a CO2
assimilation period occurs along with the canopy development;however this activity is not significant in the ecosystem carbonaccumulation until sometime later, when the full canopy devel-opment occurs (Huxman et al., 2004a; Yepez et al., 2007). Thus, inthe NAMS regions we can distinguish these periods as the pre-monsoon or dry season, when vegetation is dormant and biologicalactivity is low, but temperatures are optimal for growth andmoisture starts to increase in the atmosphere. A monsoon period orgrowing season, that has two stages: 1) a rapid activation of bio-logical processes as moisture becomes available 2) a stage ofmaximum activity at the peak of the monsoon. A post-monsoonperiod that is characterized by the sudden drop of leaves and theecosystem returns to its dormancy as moisture becomes scarce andtemperatures drop. There is evidence that this conceptual modelapplies well in arid and semi-arid pulse driven ecosystems underthe influence of the NAMS but we want to test if this same modelapplies to the TDF in Sonora which represents the northern limit of
* Corresponding author. Tel.: þ526444100900x2123.E-mail address: [email protected] (J. Garatuza-Payan).
Contents lists available at ScienceDirect
Journal of Arid Environments
journal homepage: www.elsevier .com/locate/ jar idenv
0140-1963/$ – see front matter � 2009 Elsevier Ltd. All rights reserved.doi:10.1016/j.jaridenv.2009.09.029
Journal of Arid Environments 74 (2010) 556–563

Author's personal copy
these tropical ecosystems in America and is highly influenced bythe NAMS.
The tropical dry forest (TDF) distribution covers large areas in thedry, markedly seasonal, tropical regions of the world (Murphy andLugo,1986; Becerra and Venable, 2008). In Mexico it is one of the fourmost extensive types of vegetation (Rzedowski, 1978). In its naturalstate, it is a dense community dominated by small to medium sizedtrees that lose their leaves and remain dormant during the dryseason. This ecosystem extends from Central America, to thenorthern state of Sonora, Mexico and covers a great extension alongthe pacific coast (Martınez-Yrızar et al., 2000). In Sonora, the TDFappears, mainly, in the foothills of the Sierra Madre Occidental andoccurs at elevations between 250 and 1200 m (Burquez and Marti-nez-Yrizar, 2004). The mean annual temperature is 24 �C and themean annual precipitation 712 mm, with the rainfall being mainlyseasonal and approximately 80% of the precipitation occurringduring the NAMS (July to October) (Alvarez-Yepiz et al., 2008).
In this paper, we report the results of a study conducted over themonsoon season in the TDF of north-western Mexico, to betterunderstand the relationship and effects of the precipitation in thenet ecosystem of carbon dioxide and water vapor exchange. Wespecifically address the flux variation that occurs during pre-, peakand post-monsoon periods during a single growing season.
2. Materials and methods
2.1. Site description
The study site was located in the south of Sonora, Mexico atEjido La Estrella (27�50040.700N, 109�1705200W), at 460 m of eleva-tion, in the foothills of the Sierra Madre Occidental (Fig. 1). Thelocation is 7.5 km east of the town of Rosario de Tesopaco andapproximately 85 km from Ciudad Obregon. The climate of thezone is warm, semiarid according to Koppen’s Classification (INEGI,2007). The mean annual temperature is 22.1 �C and precipitation of712 mm (Rosario Tesopaco Climatological Station No. 00026100,Comision Nacional del Agua), with most of the rainfall (80%) fallingduring the monsoon from June to October. A second, highly vari-able, rainy season occurs between December and March. The soil in
this area is loamy-clay with 1.3 bulk density and very high rockcontent.
The main type of vegetation is tropical dry forest, dominated byleguminous trees. Some of the dominant species are Lysilomadivaricatum, Ipomea arborecens, Acacia cochliacantha, Haematoxylumbrasiletto, Celtis reticulata and others (Sanchez-Mejıa et al., 2007;Sanchez-Mejia et al., 2009). The forest canopy height is about9–10 m. The vegetation cover is closed (MODIS LAI 1 km maximumestimated¼ 6.6) and most of the species lose their leaves in the dryseason (From October to June). The vegetation cover rapidlyincreases with the presence of precipitation in late June or early July.
2.2. Meteorological measurements
A 13 m tower was installed in the TDF to make long-termmeteorological and eddy covariance measurements above thecanopy. The tower was positioned in the center of a homogeneousterrain ensuring the same coverage in at least 1 km in any direction.From the top of the tower, near-continuous measurements of watervapour, sensible heat and carbon dioxide fluxes, were made over the2006 TDF growing season. Net radiation (NR) was measured witha four-component radiometer (CNR1, Kipp & Zonen, Delft, TheNetherlands) attached to a horizontal boom extending 4 m from thetower. Air temperature (AT) and relative humidity (RH) weremeasured with a humidity and temperature probe (HMP45D,Vaisala, Helsinki, Finland). Wind direction and speed weremeasured with a wind vane/anemometer (Wind Monitor, R.M.Young, Traverse City, MI, USA). Four soil heat flux plates (HFT-1,Campbell Scientific, Logan, UT, USA) were used to measure soil heatflux (G). Soil moisture (SM) was measured with 3 time domainreflectometers all at 10 cm depth (CS615, Campbell Scientific, Logan,UT, USA), Soil Temperature data (ST) was obtained with a tempera-ture probe (107-L, Campbell Scientific, Logan, UT, USA) and precip-itation was measured with a tipping bucket rain gauge (TR-525USW,Texas Electronic, Dallas, TX, USA). Data were averaged over 30 minintervals, except for precipitation (half-hour sums), and were loggedusing a data logger (CR-23X, Campbell Scientific, Logan, UT, USA).
Net ecosystem water vapour and carbon dioxide gas exchange(ET and NEE, respectively), latent (LE) and sensible (H) heat andmomentum fluxes were measured with the eddy correlationtechnique (Baldocchi et al., 2001; Baldocchi, 2003) in the 13 mtower. The eddy correlation system consisted of a 3-D SonicAnemometer (CSAT3, Campbell Scientific, Logan, UTAH, EUA) andan open path gas analyzer (LI-7500, LI-COR, Lincoln, Nebraska, EUA)controlled by a data logger (CR5000, Campbell Scientific, Logan,UTAH, EUA). The eddy correlation system was approximately 3 mabove the forest canopy. The measurements were made at 10 Hz,storing and averaging data every 30 min, using Reynolds averaging.The study period was from May 1st to October 31st 2006 (Day ofYear – DOY-121 to 304).
Fluxes were later calculated off-line after performing coordinaterotations, accounting for density fluctuations following Webb et al.(1980), and applying a correction for using the sonic temperatureinstead of air temperature in the sensible heat flux calculationsfollowing Liu et al. (2001). System performance was assessed byexamining the closure of the surface energy balance (NR-G¼ LEþH, where y¼ 1.3337x – 1.5114, r2¼ 0.84). The sum of half-hourlymeasurements of LE and H were regressed against the subtractionof G to NR. Previous to all the analysis, the nighttime fluxes werefiltered using an initial rejection criteria of a friction velocity (u*)value of 0.15 m s�1, resulting in a rejection of about 75% of thenighttime data. Critical value of u* was determined as the pointwhere an increase in the u* values had little effect on NEE estimates(Xu and Baldocchi, 2004). Missed values were replaced using thegap filling strategies described by Falge et al. (2001) and Reichstein
Fig. 1. Localization of the micrometeorological tower in Sonora, Mexico. The countylimits for Rosario de Tesopaco are shown.
E.R. Perez-Ruiz et al. / Journal of Arid Environments 74 (2010) 556–563 557

Author's personal copy
et al. (2005). Due to this constraint, carbon and water budget datashould be treated with caution.
2.3. Ecosystem greenness
Ecosystem greenness was obtained from measurements ofNormalized Difference Vegetation Index (NDVI) obtained fromMODIS Terra (Salinas-Zavala et al., 2002; Barbosa et al., 2006). Valueswere from 16-day composite satellite images, which were interpo-lated to obtain daily values of NDVI. NDVI is the normalized ratio ofthe quantity of electromagnetic radiation reflected in the NearInfrared (NIR, 0.841–0.876 mm) and the Red (R, 0.620–0.670 mm), andis calculated as:
NDVI ¼ NIR � RNIR þ R
(1)
NDVI takes values from �1 to 1. Positives values (NIR> R) indicategreen vegetation and surfaces with green vegetation cover. A higherNDVI value indicates an increase in green vegetation cover and viceversa. Several studies relate NDVI values to diverse biophysicalvariables like area and vegetation cover, primary productivity,chlorophyll density, as well as phenology (Salinas-Zavala et al.,2002; Weiss et al., 2004; Mendez-Barroso and Vivoni, 2010).
3. Results
3.1. Environmental conditions
Total precipitation measured at the tower in the experiment was491 mm during the growing season. The rainy season started in June20th, and concluded in early October. Twenty four days of the seasonhad at least 5 mm of precipitation (13% of days). Monthly averagevalues of air and soil temperature (Fig. 2a) varied in a range of about10 �C from DOY121 to DOY171, with values from 24 to 33 �C of AT andfrom 32 to 43 �C of ST, but after DOY172 values were similar until theend of the experiment, with a range of 24–31 �C. The maximumvalues of AT (37 �C) were found during June. A difference of 5 �C wastypically found in the daily trend of the AT from the maximum andminimum values. NR varied from approximately 15 W m�2 in cloudydays to more than 300 W m�2 (Fig. 2a). Maximum values of NR werefound from D186 to D255, with a great fluctuation with cloudy andsunny days. The positive values of NR began approximately at 7:00 h,increasing rapidly until midday, when maximum values were found,NR then rapidly decreased. Daily behaviour of NR was similar duringall months. Low average values of relative humidity (RH) wereobserved during the pre-monsoon period (Fig. 2b), but soon after thebeginning of the monsoon period, the values increased to more than40% in some cases. Similar to RH, soil moisture in the pre-monsoonperiod was very low with values less than 0.09 cm3 cm�3 (Fig. 4b),but with the beginning of the precipitation, values increased rapidly,with maximum values at around 0.6 cm3 cm�3 probably due to thehigh rocky content of this soil. SM decreased to minimum values of0.15 cm3 cm�3 in the post-monsoon. Vapor pressure deficit (VPD)daily behaviour was similar in all months, with minimum valuesearly in the morning and a rapid increase between 7:00 and 15:00 h,followed by a decrease at dusk. The range of values was from 1.8 to5 kPa in May,1.5 to 4.8 kPa in June, 0.6 to 3.3 kPa in July, 0.3 to 2.3 kPain August, 0.5 to 2.7 kPa in September and 0.7 to 3.2 kPa in October.
3.2. Seasonal trends of NEE and ET
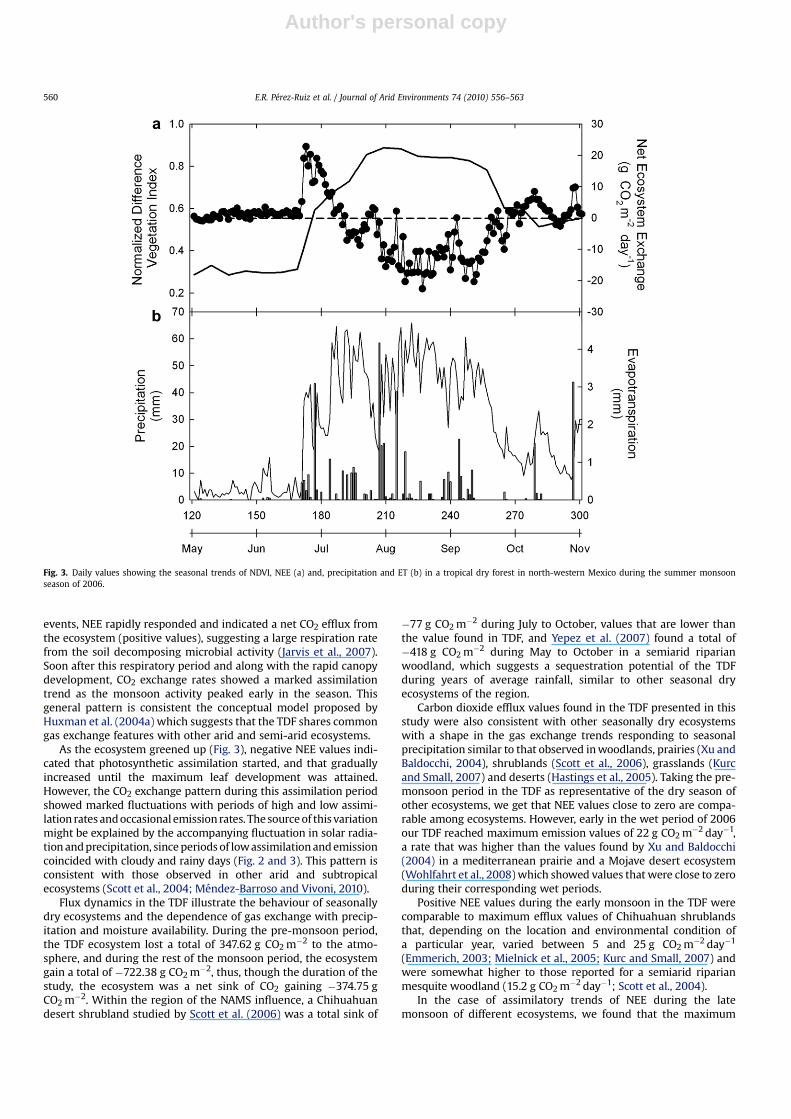
During the pre-monsoon period, values of ET were close to zero(Fig. 3b) except for day of year (DOY) 156, when a small precipi-tation event occurred. With the onset of monsoonal rains, in mid
June, ET rapidly increased following precipitation. During themonsoon period, the ET ranged between 1.2 and 4.6 mm day�1.Maximum values of ET occurred in days following precipitationevents (Fig. 3b).
During the months of May and June, NEE showed values close tozero, similar to ET, coinciding with the driest period studied(Fig. 3a). Following the onset of rainfall, (on DOY171) we observeda rapid CO2 release to the atmosphere that reached a maximum of22 g CO2 m�2 day�1 and gradually decreased towards DOY190when the NEE values started to show a negative trend. MaximumCO2 assimilation rates were found during the peak of the monsoon(between DOY213 and DOY265) when the ecosystem assimilatedup to 20 g CO2 m�2 day�1 but showed a marked fluctuation. AfterDOY265, with the end of the monsoon period, we can see a gradualdecrease in the NEE values, showing fluctuations between assimi-lation and emission in the range of 5 to �22 g CO2 m�2 day�1, untilthe end of the study period, when values were close to zero. In thesame way, values of ET decrease with the post-monsoon, witha range of values between 0.5 and 2 mm day�1.
Values of NEE and ET close to zero in the pre-monsoon periodcoincided with low values of NDVI (Fig. 3a). In the pre-monsoonperiod NDVI values were constant and close to 0.30, but rapidlyincreased with the presence of precipitation until values of 0.88 atthe middle of the monsoon period were reached, approximatelybetween DOY205 and DOY235. Peak NDVI coincided with theperiod with the highest gas exchange rate (Fig. 3a). Similarly, thepost-monsoon NDVI values gradually decreased until a minimumof 0.55 was registered towards the end of the study period. Similarto the findings of Vivoni et al. (2008), from several monsoon-dominated ecosystems, the ET varied with time depending onvegetation greening since low (high) values of ET coincided withminimum (maximum) NDVI.
3.3. Differences in diurnal trends of NEE and ET
To illustrate the variation of the diurnal trends of NEE and ET,Fig. 4 shows the half-hour average values of NEE and ET in everymonth of the study. May shows the typical behaviour of the pre-monsoon. During this month values of ET and NEE were close tozero, with ET traces recorded during the hours close to midday.During the monsoon period, assimilation values of NEE in the daybegan approximately at 7:00 h, and sustained a rapid increase until10:00 h, when the maximum values were found in all months. Arapid decrease in the assimilatory CO2 trend (towards negativevalues) occurred at the onset of dark. In all cases and periods,nighttime values where positive. Diurnal behaviour of ET duringthe monsoon period follows the NR pattern. Water exchangetypically started at 7:00 h, with a constant increase until midday(12:00 and 13:00) when maximum values of ET were observed.Following the peak, ET decreased until 19:00 h when the values ofET were close to zero.
In June, with the beginning of precipitation, values of ET duringthe day were between 0 and 3.2 mm, and we found only positivevalues of NEE, between 0.05 and 0.2 mg CO2 m�2 s�1. During July,August and September, daily gas exchange trends typically showedpositive values of NEE during the nighttime and a range of negativevalues during the day. The range of values of ET and NEE were from0 to 9.23 mm and from 0 to �0.47 mg CO2 m�2 s�1 in July, from 0 to11.5 mm and 0 to �1 mg CO2 m�2 s�1 in August, and from 0 to7.6 mm and 0 to �0.55 mg CO2 m�2 s�1 in September. In the post-monsoon period (October), ET and NEE dropped and there wasa marked difference in the range of values compared to themonsoon period. The range of values during this period wasbetween 0 and 4.9 mm of ET and 0 to �0.15 mg CO2 m�2 s�1.
E.R. Perez-Ruiz et al. / Journal of Arid Environments 74 (2010) 556–563558

Author's personal copy
The relationship between and NEE and ET was generally weakbut there were clear distinctions on each monsoonal period (Fig. 5).Notably, the late monsoon stage showed a stronger negativerelationship.
3.4. Monthly carbon balance
Monthly carbon balance in the months of July, August andSeptember indicated a sink of CO2 and matched the maximummonthly values of ET, while in May, June and October, when theecosystem was a source of carbon, we found the lowest monthly ETvalues. Maximum values of carbon assimilation were observedduring the peak of the monsoon, when there was a significantamount of accumulated precipitation (Table 1). There was not anintraseasonal correspondence between the total monthly precipi-tation and the monthly carbon balance.
3.5. Ecosystem water use efficiency
We estimated the ecosystem water use efficiency (EWUE) usingthe formula used by Scott et al. (2006) and Emmerich (2007), whichdefines EWUE as:
EWUE ¼ �P
NEEP
ET
The EWUE is defined as the net carbon uptake per amount of waterlost from the ecosystem and is a useful measure of the functionalityof the seasonally dry ecosystems (Emmerich, 2007). Negatives valuesof EWUE were observed during the pre- and post-monsoon periods
(Table 1). In May we found a EWUE of�3.27 g CO2 mm H2O�1, in June�6.84 g CO2 mm H2O�1 and in October �2.01 g CO2 mm H2O�1.Suggesting that during these three rainless months, the ecosystemlost a total of 12.11 g of CO2 per mm of evapotranspirated water.During July, August and September EWUE values were 0.72, 3.55 and3.08 g CO2 mm H2O�1, respectively, giving a total of approximately7.36 g of CO2 acquired per every mm of evapotranspired water. Thus,the ecosystem became more efficient in its carbon acquisition duringthe rainy period.
4. Discussion
4.1. Factors controlling NEE during the wet and dry season
Patterns of net ecosystem CO2 exchange and evapotranspirationwere different during wet and dry periods. In seasonally dryecosystems, precipitation and soil moisture are expected to be theprimary control on the exchange of water and carbon between theland surface and atmosphere (Kurc and Small, 2007). In our case,during the pre-monsoon period, the carbon dioxide and watervapour exchange being close to zero indicated that the biologicalactivity in the ecosystem was dormant and that the soil surface wastoo dry. The absence of leaves in trees and the absence of availablemoisture were likely the controlling factors. Isolated rains prior tothe onset of the NAMS induced water vapour fluxes (up to1 mm day�1) which were most likely coming solely from soilevaporation since the canopy was still inactive. The arrival of theNAMS dramatically affected the trend of environmental conditionsand the behaviour of the NEE and ET. With the first precipitation
Fig. 2. Daily average values of several environmental variables during the study period a) Shows the values of air temperature, soil temperature and net radiation, b) shows valuesof relative humidity and soil moisture.
E.R. Perez-Ruiz et al. / Journal of Arid Environments 74 (2010) 556–563 559
Author's personal copy
events, NEE rapidly responded and indicated a net CO2 efflux fromthe ecosystem (positive values), suggesting a large respiration ratefrom the soil decomposing microbial activity (Jarvis et al., 2007).Soon after this respiratory period and along with the rapid canopydevelopment, CO2 exchange rates showed a marked assimilationtrend as the monsoon activity peaked early in the season. Thisgeneral pattern is consistent the conceptual model proposed byHuxman et al. (2004a) which suggests that the TDF shares commongas exchange features with other arid and semi-arid ecosystems.
As the ecosystem greened up (Fig. 3), negative NEE values indi-cated that photosynthetic assimilation started, and that graduallyincreased until the maximum leaf development was attained.However, the CO2 exchange pattern during this assimilation periodshowed marked fluctuations with periods of high and low assimi-lation rates and occasional emission rates. The source of this variationmight be explained by the accompanying fluctuation in solar radia-tion and precipitation, since periods of low assimilation and emissioncoincided with cloudy and rainy days (Fig. 2 and 3). This pattern isconsistent with those observed in other arid and subtropicalecosystems (Scott et al., 2004; Mendez-Barroso and Vivoni, 2010).
Flux dynamics in the TDF illustrate the behaviour of seasonallydry ecosystems and the dependence of gas exchange with precip-itation and moisture availability. During the pre-monsoon period,the TDF ecosystem lost a total of 347.62 g CO2 m�2 to the atmo-sphere, and during the rest of the monsoon period, the ecosystemgain a total of �722.38 g CO2 m�2, thus, though the duration of thestudy, the ecosystem was a net sink of CO2 gaining �374.75 gCO2 m�2. Within the region of the NAMS influence, a Chihuahuandesert shrubland studied by Scott et al. (2006) was a total sink of
�77 g CO2 m�2 during July to October, values that are lower thanthe value found in TDF, and Yepez et al. (2007) found a total of�418 g CO2 m�2 during May to October in a semiarid riparianwoodland, which suggests a sequestration potential of the TDFduring years of average rainfall, similar to other seasonal dryecosystems of the region.
Carbon dioxide efflux values found in the TDF presented in thisstudy were also consistent with other seasonally dry ecosystemswith a shape in the gas exchange trends responding to seasonalprecipitation similar to that observed in woodlands, prairies (Xu andBaldocchi, 2004), shrublands (Scott et al., 2006), grasslands (Kurcand Small, 2007) and deserts (Hastings et al., 2005). Taking the pre-monsoon period in the TDF as representative of the dry season ofother ecosystems, we get that NEE values close to zero are compa-rable among ecosystems. However, early in the wet period of 2006our TDF reached maximum emission values of 22 g CO2 m�2 day�1,a rate that was higher than the values found by Xu and Baldocchi(2004) in a mediterranean prairie and a Mojave desert ecosystem(Wohlfahrt et al., 2008) which showed values that were close to zeroduring their corresponding wet periods.
Positive NEE values during the early monsoon in the TDF werecomparable to maximum efflux values of Chihuahuan shrublandsthat, depending on the location and environmental condition ofa particular year, varied between 5 and 25 g CO2 m�2 day�1
(Emmerich, 2003; Mielnick et al., 2005; Kurc and Small, 2007) andwere somewhat higher to those reported for a semiarid riparianmesquite woodland (15.2 g CO2 m�2 day�1; Scott et al., 2004).
In the case of assimilatory trends of NEE during the latemonsoon of different ecosystems, we found that the maximum
Fig. 3. Daily values showing the seasonal trends of NDVI, NEE (a) and, precipitation and ET (b) in a tropical dry forest in north-western Mexico during the summer monsoonseason of 2006.
E.R. Perez-Ruiz et al. / Journal of Arid Environments 74 (2010) 556–563560

Author's personal copy
value obtained in the TDF was approximately�22 g CO2 m�2 day�1,which is higher than the value of �18 g CO2 m�2 day�1 reported fora prairie (Xu and Baldocchi, 2004), a grassland and shrubland of�10 and �20 g CO2 m�2 day�1, respectively (Emmerich, 2003),a mezquite woodland with values of �9.5 g CO2 m�2 day�1, foundby Scott et al. (2004), �3.5 g CO2 m�2 day�1 in the Mojave desert(Wohlfahrt et al., 2008) and �6 and �7 g CO2 m�2 day�1 found byKurc and Small (2007) in a grassland and shrubland respectively.
With the information obtained we can see a marked influence ofmonsoonal precipitation in gas exchange characteristics of the TDF,expressed as a difference in the magnitude and patterns of the NEE.The TDF of north-western Mexico showed gas exchange patternssimilar to other seasonally dry ecosystems. However, according tothe data obtained and comparing with other studies, it seems thatTDF has the capacity to fix a larger quantity of CO2. These results,however, need to be viewed with caution because in the presentstudy we only report data from one growing season and highlyfiltered nighttime data. The patterns shown here underlie thenecessity for larger temporal scale studies (more years) thatdetermine the interseasonal, and interannual, variation in the gasexchange patterns of this ecosystem.
Monthly carbon balance (Table 1) in the TDF was higher than thevalues found in other seasonally dry ecosystems. Maximum carbonbalance for emission in TDF was found in June, with a total of 199 gCO2, while the maximum value for assimilation was �396 g CO2, inAugust. In a semiarid riparian woodland, Yepez et al. (2007) foundmaximum values of 191 g CO2 in July and�250 g CO2 in October foremission and assimilation respectively, in a Chihuahuan Desertshrubland, Scott et al. (2006) found values of 128 g CO2 in July and�95 g CO2 in October. In both cases, values found in TDF werehigher than the values of other seasonally dry ecosystems influ-enced by the NAMS. The absence of intraseasonal correspondence
of monthly precipitation and monthly carbon balance in the TDF(Table 1) can be explained by the fact that precipitation starts whenthe vegetation cover is still null and assimilation does not occuruntil a substantial canopy is developed (Huxman et al., 2004a). In
Fig. 4. Diurnal behaviour of NEE (a) and ET (b) in different months over the study period.
Fig. 5. Relationship between daily values of ET and daily values of NEE for the pre-monsoon period (DOY 121�171; NEE¼ 1.72*ETþ 0.64, r2¼ 0.1), early monsoon stage(DOY 172�189; NEE¼�2.31*ETþ 17.71 r2¼ 0.1), late monsoon stage (DOY 190�266;NEE¼�3.81*ETþ 2.61, r2¼ 0.3) and post-monsoon period (DOY 267�304;NEE¼ 1.87*ETþ 0.04, r2¼ 0.09).
E.R. Perez-Ruiz et al. / Journal of Arid Environments 74 (2010) 556–563 561

Author's personal copy
our case, this lag lasted about a month as evidenced by theprecipitation and NDVI trends (Fig. 3). Accordingly we observedthat the higher values of precipitation appeared in July, while themaximum assimilation values occurred until August, when thevegetation cover was fully developed (Table 1).
5. Relationship between ET and NEE
Understanding the timing and magnitude of ET and NEE,provide mechanisms to link hydrological processes and ecosystemproductivity (Yepez et al., 2007). Fig. 5 shows the relationshipbetween daily values of ET and NEE during the study period. Fromthis assessment, we see that the overall relationship between bothfluxes is weak in all cases but that there are marked differencesduring the different periods. For example, during the late monsoonstage the relationship between ET and NEE was negative. Thissuggests that vegetation controls NEE through the regulation ofwater flux since this late monsoon stage coincides with the periodwhen the vegetation is more abundant and more active. Reducedsoil evaporation rates due to shaded ground by a closed canopy andhigh photosynthetic rates of transpiring plants might be mecha-nisms that strengthen this relationship. In contrast, the relationshipduring the pre- and post-monsoon periods, was positive coincidingwith periods of null or low canopy activity.
Other factor showing the NEE in function of ET is the ecosystemwater use efficiency (EWUE). In seasonally dry ecosystems, theEWUE shows the ability of the ecosystem to adjust their capacity ofgas exchange to cope with environmental variables (Scott et al.,2006). The TDF ecosystem had higher values of EWUE during themonsoon period, this higher capacity of assimilating CO2 with lesswater may be due to very active and dense vegetation activityresulting from the frequent occurrence of precipitation events.
The most efficient EWUE was found in the months of August andSeptember (Table 1), however, the magnitude of the actual fluxeswas contrasting. During August, we found the highest values of CO2
assimilation and a higher ET, while in September there wasa reduction in both processes but EWUE remained high. Anexplanation for this contrast might be related to the availability ofwater rather than the change in the biological capacity controllinggas exchange. The lowest (negative) value of EWUE was found inJune, when the ecosystem released a high amount of CO2 to theatmosphere prior to the monsoon (Table 1).
The EWUE of the TDF during the peak of the monsoon (3.55 gCO2 mm�1 H2O) was similar to the EWUE reported by Scott et al.(2006) during the same season in a shrubland of the Chihuahuandesert in Arizona, where EWUE was close 3 g CO2 mm�1 H2O, andthe value obtained by Emmerich (2007) in another shrubland withan EWUE of 4.68 g CO2 mm�1 H2O. The main differences were thattheir positive values of EWUE were found in the months of August,September and October; while in the TDF the positive values werefound in July, August and September, indicating that the shrublandbecame more efficient later in the monsoon period, while our TDF
showed its higher efficiency earlier in the monsoon period.Contrary, Emmerich (2007) found a high EWUE in grassland, witha maximum value of 7.35 g CO2 mm�1 H2O. These comparisonsindicate that the TDF has a EWUE comparable with other seasonallydry ecosystems influenced by the NAMS.
6. Conclusions
The climate in the study region is characterized by summermonsoon precipitation which produces gas exchange patternsdistinctive of seasonally dry ecosystems. Measurements of netecosystem carbon dioxide and water vapour exchange obtained inthe TDF during the monsoon period were highly influenced by thepresence of precipitation. The ecosystems showed three differentperiods, characterized by the magnitude and response of the gasexchange to precipitation and canopy development:
� The first period occurred prior to active precipitation (pre-monsoon), when gas exchange was close to zero due the absenceof leaves and moisture.� The second period occurred during the monsoon, divided in
two stages. The first stage was characterized by a large positiveCO2 efflux probably due to the high respiratory flux asa response to the increase of biological activity with the onsetof precipitation. The second stage came after full canopydevelopment, when a strong assimilation of CO2 was observed.� The gradual decrease in gas exchange rates to minimal values,
when plants began to lose their leaves, characterized the third(post-monsoon) period.
The tropical dry forest of north-western Mexico has the typicalbehaviour of the seasonally dry ecosystems, however, during thesummer growing season of 2006, sustained rates of CO2 gainamounted �374 g CO2 m�2 which is on the upper limit forseasonally dry ecosystems, under the influence of the NAMS. Incontrast, the TDF had comparable ecosystem water use efficiency.
Despite of the clear influence of the vegetation in the patterns ofgas exchange between the ecosystems and the atmosphere in theTDF, mechanistic information about biological and environmentalvariables controlling gas exchange dynamics is still necessary inthis ecosystem. Understanding these factors is fundamental topredict how seasonally dry ecosystems would respond to animminent change in precipitation regimes and general climaticpatterns due to global change.
Acknowledgements
The authors wish to acknowledge to the authorities of Ejido LaEstrella, in Rosario, for lending their property for the towerinstallation. We also want to thank the special issue editors foruseful comments made to an earlier version of the manuscript. Alsothe support of Miguel Agustın Rivera-Diaz for equipment mainte-nance and data downloading is recognized. Financial support isacknowledged to CONACYT through the scholarships (#222153) forPerez-Ruiz ER and Yepez EA (#93369).
References
Adams, D.K., Comrie, A.C., 1997. The North American monsoon. Bulletin of theAmerican Meteorological Society 78 (10), 2197–2213.
Alvarez-Yepiz, J.C., Martınez-Yrızar, A., Burquez, A., Lindquist, C., 2008. Variation invegetation structure and soil properties related to land use history of old-growth and secondary tropical dry forest in northwestern Mexico. ForestEcology and Management 256 (3), 355–366.
Baldocchi, D.D., 2003. Assessing the eddy covariance technique for evaluatingcarbon dioxide exchange rates of ecosystems: past, present and future. GlobalChange Biology 9, 479–492.
Table 1Monthly values of net ecosystem carbon exchange (NEE) in g CO2 m�2 month�1,evapotranspiration (ET) in mm H20 month�1, ecosystem water use efficiency(EWUE) in g CO2 mm�1 H2O and precipitation (ppt) in mm month�1.
Month NEE ET EWUE ppt
May 21.82 6.67 �3.27 0.76Jun 199.73 29.22 �6.83 80.52Jul �69.92 97.10 0.72 181.11Aug �395.39 111.24 3.55 105.16Sep �212.76 68.98 3.08 53.35Oct 82.50 41.09 2.00 70.61
E.R. Perez-Ruiz et al. / Journal of Arid Environments 74 (2010) 556–563562

Author's personal copy
Baldocchi, D., Falge, E., Gu, L., Olson, R., Hollinger, D., Running, S., Anthoni, P.,Bernhofer, C., Davis, K., Evans, R., Fuentes, J., Goldstein, A., Katul, G., Law, B.,Lee, X., Malhi, Y., Meters, T., Munger, W., Oechel, W., Paw, U.K.T., Pilegaard, K.,Schmid, H.P., Valentini, R., Verma, S., Vesala, T., Wilson, K., Wofsy, S., 2001.FLUXNET: a new tool to study the temporal and spatial variability of ecosystem-scale carbon dioxide, water vapour and energy flux densities. Bulletin of theAmerican Meteorological Society 82 (11), 2415–2434.
Barbosa, H.A., Huete, A.R., Baethgen, W.E., 2006. A 20-year study of NDVI variabilityover the Northeast region of Brazil. Journal of Arid Environments 67 (2),288–307.
Becerra, J.X., Venable, D.L., 2008. Sources and sinks of diversification andconservation priorities for the Mexican tropical dry forest. PloS ONE 3 (10),E3436.
Burquez, A., Martinez-Yrizar, A., 2004. Lımites geograficos entre las Selvas BajasCaducifolias y los Matorrales Espinosos y Xerofilos: ¿Que Conservar? In:Ceballos, G., Bezaury, J.E. (Eds.), Identificacion de Amenazas y Prioridades paraConservacion en las Selvas Secas del Pacıfico Mexicano. WWF-CONABIO.
Douglas, M.W., Maddox, R.A., Howard, K., Reyes, S., 1993. The Mexican monsoon.Journal of Climate 6 (8), 1665–1677.
Emmerich, W.E., 2003. Carbon dioxide fluxes in a semiarid environment with highcarbonate soils. Agricultural and Forest Meteorology 116, 91–102.
Emmerich, W.E., 2007. Ecosystem water use efficiency in a semiarid shrubland andgrassland community. Rangeland Ecology & Management 60 (5), 464–470.
Falge, E., Baldocchi, D., Olson, R.J., Anthoni, P., Aubinet, M., Bernhofer, C., Burba, G.,Ceulemans, R., Clement, R., Dolman, H., Granier, A., Gross, P., Grunwald, T.,Hollinger, D., Jensen, N.-O., Katul, G., Keronen, P., Kowalski, A., Ta Lai, C., Law, B.E.,Meyers, T., Moncrieff, T., Moors, E., Mungers, J.W., Pilegaard, K., Rannik, U.,Rebmann, C., Suyker, A., Tenhunen, J., Tu, K., Verma, S., Vesala, T., Wilson, K.,Wofsy, S., 2001. Gap filling strategies for defensible annual sums of net ecosystemexchange. Journal of Agriculture and Forest Meteorology 107, 43–69.
Gochis, D.J., Brito-Castillo, L., Shuttleworth, W.J., 2006. Hydroclimatology of theNorth American monsoon region in northwest Mexico. Journal of Hydrology316, 53–70.
Hastings, S.J., Oechel, W.C., Muhlia-Melo, A., 2005. Diurnal, seasonal and annualvariation in the net ecosystem CO2 exchange of a desert shrub community(Sarcocaulescent) in Baja California, Mexico. Global Change Biology 11,927–939.
Huxman, T.E., Snyder, K.A., Tissue, D., Leffler, A.J., Ogle, K., Pockman, W.T.,Sandquist, D.R., Potts, D.L., Schwinning, S., 2004a. Precipitation pulses andcarbon fluxes in semiarid and arid ecosystems. Oecologia 141, 254–268.
Huxman, T.E., Cable, J.M., Ignace, D.D., Eilts, A.J., English, N., Weltzin, J.,Williams, D.G., 2004b. Response of net ecosystem gas exchange to a simulatedprecipitation pulse in a semiarid grassland: the role of native versus non-nativegrasses and soil texture. Oecologia 141, 295–305.
INEGI, 2007. Anuario Estadıstico de Sonora Mexico.Jarvis, P., Rey, A., Petsikos, C., Wingate, L., Tayment, M., Pereira, J., Banza, J., David, J.,
Miglietta, F., Borghetti, M., Manca, G., Valentini, R., 2007. Drying and wetting ofMediterranean soils stimulates decomposition and carbon dioxide emission:‘‘Birch effect’’ Tree Physiology 27, 929–940.
Kurc, S.A., Small, E.E., 2007. Soil moisture variations and ecosystem-scale fluxes ofwater and carbon in semiarid grassland and shrubland. Water ResourcesResearch 43, W06416.
Liu, H., Peters, G., Foken, T., 2001. New equations for sonic temperature variance andbuoyancy heat flux with an omnidirectional sonis anemometer. Boundary-LayerMeterology 100 (3), 459–468.
Martınez-Yrızar, A., Burquez, M., Maass, M., 2000. Structure and functioning oftropical deciduous forest in Western Mexico. In: Robichaux, R.H., Yetman, D.(Eds.), The Tropical Deciduous Forest of Alamos: Biodiversity of a ThreatenedEcosystem in Mexico. University of Arizona Press.
Mendez-Barroso, L.A., Vivoni, E.R., 2010. Observed shifts in land surface conditionsduring the North American Monsoon: implications for a vegetation-rainfallfeedback mechanism. Journal of Arid Environments 74, 549–555.
Mielnick, P., Dugas, W.A., Mitchell, K., Havstad, K., 2005. Long-term measurementsof CO2 flux and evapotranspiration in a Chihuahuan desert grassland. Journal ofArid Environments 60 (3), 423–436.
Murphy, P.G., Lugo, A.E., 1986. Ecology of tropical dry forest. Annual Review ofEcology and Systematics 17, 67–88.
Reichstein, M., Falge, E., Baldocchi, D., Papale, D., Aubinet, M., Berbigier, P.,Bernhofer, C., Buchmann, N., Gilmanov, T., Granier, A., Grunwald, T.,Havrankova, K., Ilvesniemi, H., Janous, D., Knohl, A., Laurila, T., Lohila, A.,Loustau, D., Matteucci, G., Meyers, T., Miglietta, F., Ourcival, J.-M., Pumpanen, J.,Rambal, S., Rotenberg, E., Sanz, M., Tenhunen, J., Seufert, G., Vaccari, F., Vesala, T.,Yakir, D., Valentini, R., 2005. On the separation of net ecosystem exchange intoassimilation and ecosystem respiration: review and improved algorithm. GlobalChange Biology 11, 1424–1439.
Rzedowski, J., 1978. Vegetacion de Mexico. Limusa, Mexico, D. F.Salinas-Zavala, C.A., Douglas, A.V., Dıaz, H.F., 2002. Interannual variability of NDVI in
northwest Mexico: associated climatic mechanisms and ecological implications.Remote Sensing and Environment 82, 417–430.
Sanchez-Mejıa, Z.M.-, Serrano-Grijalva, L., Penuelas-Rubio, O., Perez-Ruiz, E.R.,Siqueiros-Ruvalcaba, E., Garcıa-Calleja, M.T., 2007. Composicion florıstica yestructural de la comunidad vegetal del lımite del desierto de Sonora y la selvabaja caducifolia (Noroeste de Mexico). Revista Latinoamericana de RecursosNaturales 3 (1), 74–83.
Sanchez-Mejia, Z.M., Garatuza-Payan, J., Serrano-Grijalva, L., 2009. Caracterizacionflorıstica del bosque tropical estacionalmente seco: elementos para un manejosustentable de la vegetacion en el sur de Sonora. Revista Mexicana de Bio-diversidad (in revision).
Scott, R.L., Edwards, E.A., Shuttleworth, W.J., Huxman, T.E., Watts, C., Goodrich, D.C.,2004. Interannual and seasonal variation in fluxes of water and carbon dioxidefrom a riparian woodland ecosystem. Agricultural and Forest Meteorology 122,65–84.
Scott, R.L., Huxman, T.E., Cable, W.L., Emmerich, W.E., 2006. Partitioning of evapo-transpiration and its relation to carbon dioxide exchange in a Chihuahuandesert shrubland. Hydrological Processes 20, 3227–3243.
Vivoni, E.R., Gutierrez-Jurado, H.A., Aragon, C.A., Mendez-Barroso, L.A.,Rinehart, A.J., Wyckoff, R.L., Rodriguez, J.C., Watts, C.J., Bolten, J.D., Lakshmi, V.,Jackson, T.J., 2007. Variation of hydrometeorological conditions along a topo-graphic transect in Northwestern Mexico during the North American monsoon.Journal of Climate 20 (9), 1792–1809.
Vivoni, E.R., Moreno, H.A., Mascaro, G., Rodriguez, J.C., Watts, C.J., Garatuza-Payan, J.,Scott, R.L., 2008. Observed relation between evapotranspiration and soilmoisture in the North American monsoon region. Geophysical Research Letters35, L22403. doi:10.1029/2008GL036001.
Webb, E.K., Pearman, G.I., Leuning, R., 1980. Correction of flux measurements fordensity effects due to heat and water vapour transfer. Quarterly Journal of RoyalMeterological Society 106, 85–100.
Weiss, J.L., Gutzler, D.S., Coonrod, J.E.A., Dahm, C.N., 2004. Long-term vegetationmonitoring with NDVI in a diverse semi-arid setting, central New Mexico, USA.Journal of Arid Environments 58, 249–272.
Wohlfahrt, G., Fenstermaker, L.F., Arnone, J.A., 2008. Large annual net ecosystemCO2 uptake of a Mojave desert ecosystem. Global Change Biology 14, 1475–1487.
Xu, L., Baldocchi, D.D., 2004. Seasonal variation in carbon dioxide exchange overa mediterranean annual grassland in California. Agricultural and Forest Mete-orology 123, 79–96.
Yepez, E.A., Scott, R.L., Cable, W.L., Williams, D.G., 2007. Intraseasonal variation inwater and carbon dioxide flux components in a semiarid riparian woodland.Ecosystems 10, 1100–1115.
E.R. Perez-Ruiz et al. / Journal of Arid Environments 74 (2010) 556–563 563
Copyright © 2022 FDOKUMEN