Capturing needles in haystacks: a comparison of B-cell receptor sequencing methods
9
RESEARCH ARTICLE Open Access Capturing needles in haystacks: a comparison of B-cell receptor sequencing methods Rachael JM Bashford-Rogers 1 , Anne L Palser 1 , Saad F Idris 1 , Lisa Carter 2 , Michael Epstein 2 , Robin E Callard 2 , Daniel C Douek 3 , George S Vassiliou 1 , George A Follows 4 , Mike Hubank 2 and Paul Kellam 1,5* Abstract Background: Deep-sequencing methods are rapidly developing in the field of B-cell receptor (BCR) and T-cell receptor (TCR) diversity. These promise to revolutionise our understanding of adaptive immune dynamics, identify novel antibodies, and allow monitoring of minimal residual disease. However, different methods for BCR and TCR enrichment and amplification have been proposed. Here we perform the first systematic comparison between different methods of enrichment, amplification and sequencing for generating BCR and TCR repertoires using large sample numbers. Results: Resampling from the same RNA or cDNA pool results in highly correlated and reproducible repertoires, but resampling low frequency clones leads to stochastic variance. Repertoires generated by different sequencing methods (454 Roche and Illumina MiSeq) and amplification methods (multiplex PCR, 5’ Rapid amplification of cDNA ends (5’RACE), and RNA-capture) are highly correlated, and resulting IgHV gene frequencies between the different methods were not significantly different. Read length has an impact on captured repertoire structure, and ultimately full-length BCR sequences are most informative for repertoire analysis as diversity outside of the CDR is very useful for phylogenetic analysis. Additionally, we show RNA-based BCR repertoires are more informative than using DNA. Conclusions: Repertoires generated by different sequencing and amplification methods are consistent, but we show that read lengths, depths and error profiles should be considered in experimental design, and multiple sampling approaches could be employed to minimise stochastic sampling variation. This detailed investigation of immune repertoire sequencing methods is essential for informing basic and clinical research. Background The adaptive immune response selectively expands B- and T-cell clones from a diverse antigen naïve repertoire following antigen recognition by the hyper-variable re- gions of B- or T-cell receptors (BCR and TCR) respec- tively [1,2]. Functional BCRs and TCRs are generated by site-specific recombination of V, (D), and J gene seg- ments [3–5], with imprecise joining of the gene seg- ments leading to random deletion and insertion of nucleotides at the junctional regions. Clonal affinity selection for enhanced BCR-antigen or TCR-peptide binding contributes to shaping the mature immune repertoire [6–8]. Mapping of BCR and TCR repertoires promises to transform our understanding of adaptive immune dy- namics, with applications ranging from identifying novel antibodies and determining evolutionary pathways for haematological malignancies to monitoring of minimal residual disease following chemotherapy [1,2,8,9]. How- ever, there is concern over the validity of biological insights gained from the different BCR and TCR enrichment, amp- lification and sequencing methods. With immune reper- toire sequencing becoming an increasingly recognised and important tool for understanding the adaptive immune system, we have performed the first systematic comparison between different isolation, amplification and sequencing methods for elucidating B-cell repertoire diversity by deep sequencing. We have used samples of diverse B-cell popu- lations from healthy peripheral blood (PB), clonal B-cell populations from lymphoblastoid cell lines (LCL) and PB from chronic lymphocytic leukaemia (CLL) patients [9]. * Correspondence: [email protected] 1 Wellcome Trust Sanger Institute, Wellcome Trust Genome Campus, Hinxton, Cambridge CB10 1SA, UK 5 Research Department of Infection, Division of Infection and Immunity, University College London, Gower Street, London WC1E 6BT, UK Full list of author information is available at the end of the article © 2014 Bashford-Rogers et al.; licensee BioMed Central Ltd. This is an Open Access article distributed under the terms of the Creative Commons Attribution License (http://creativecommons.org/licenses/by/2.0), which permits unrestricted use, distribution, and reproduction in any medium, provided the original work is properly credited. The Creative Commons Public Domain Dedication waiver (http://creativecommons.org/publicdomain/zero/1.0/) applies to the data made available in this article, unless otherwise stated. Bashford-Rogers et al. BMC Immunology 2014, 15:29 http://www.biomedcentral.com/1471-2172/15/29
Transcript of Capturing needles in haystacks: a comparison of B-cell receptor sequencing methods

Bashford-Rogers et al. BMC Immunology 2014, 15:29http://www.biomedcentral.com/1471-2172/15/29
RESEARCH ARTICLE Open Access
Capturing needles in haystacks: a comparison ofB-cell receptor sequencing methodsRachael JM Bashford-Rogers1, Anne L Palser1, Saad F Idris1, Lisa Carter2, Michael Epstein2, Robin E Callard2,Daniel C Douek3, George S Vassiliou1, George A Follows4, Mike Hubank2 and Paul Kellam1,5*
Abstract
Background: Deep-sequencing methods are rapidly developing in the field of B-cell receptor (BCR) and T-cellreceptor (TCR) diversity. These promise to revolutionise our understanding of adaptive immune dynamics, identifynovel antibodies, and allow monitoring of minimal residual disease. However, different methods for BCR and TCRenrichment and amplification have been proposed. Here we perform the first systematic comparison betweendifferent methods of enrichment, amplification and sequencing for generating BCR and TCR repertoires using largesample numbers.
Results: Resampling from the same RNA or cDNA pool results in highly correlated and reproducible repertoires,but resampling low frequency clones leads to stochastic variance. Repertoires generated by different sequencingmethods (454 Roche and Illumina MiSeq) and amplification methods (multiplex PCR, 5’ Rapid amplification of cDNAends (5’RACE), and RNA-capture) are highly correlated, and resulting IgHV gene frequencies between the differentmethods were not significantly different. Read length has an impact on captured repertoire structure, and ultimatelyfull-length BCR sequences are most informative for repertoire analysis as diversity outside of the CDR is very usefulfor phylogenetic analysis. Additionally, we show RNA-based BCR repertoires are more informative than using DNA.
Conclusions: Repertoires generated by different sequencing and amplification methods are consistent, but weshow that read lengths, depths and error profiles should be considered in experimental design, and multiplesampling approaches could be employed to minimise stochastic sampling variation. This detailed investigation ofimmune repertoire sequencing methods is essential for informing basic and clinical research.
BackgroundThe adaptive immune response selectively expands B-and T-cell clones from a diverse antigen naïve repertoirefollowing antigen recognition by the hyper-variable re-gions of B- or T-cell receptors (BCR and TCR) respec-tively [1,2]. Functional BCRs and TCRs are generated bysite-specific recombination of V, (D), and J gene seg-ments [3–5], with imprecise joining of the gene seg-ments leading to random deletion and insertion ofnucleotides at the junctional regions. Clonal affinityselection for enhanced BCR-antigen or TCR-peptidebinding contributes to shaping the mature immunerepertoire [6–8].
* Correspondence: [email protected] Trust Sanger Institute, Wellcome Trust Genome Campus, Hinxton,Cambridge CB10 1SA, UK5Research Department of Infection, Division of Infection and Immunity,University College London, Gower Street, London WC1E 6BT, UKFull list of author information is available at the end of the article
© 2014 Bashford-Rogers et al.; licensee BioMeCreative Commons Attribution License (http:/distribution, and reproduction in any mediumDomain Dedication waiver (http://creativecomarticle, unless otherwise stated.
Mapping of BCR and TCR repertoires promises totransform our understanding of adaptive immune dy-namics, with applications ranging from identifying novelantibodies and determining evolutionary pathways forhaematological malignancies to monitoring of minimalresidual disease following chemotherapy [1,2,8,9]. How-ever, there is concern over the validity of biological insightsgained from the different BCR and TCR enrichment, amp-lification and sequencing methods. With immune reper-toire sequencing becoming an increasingly recognised andimportant tool for understanding the adaptive immunesystem, we have performed the first systematic comparisonbetween different isolation, amplification and sequencingmethods for elucidating B-cell repertoire diversity by deepsequencing. We have used samples of diverse B-cell popu-lations from healthy peripheral blood (PB), clonal B-cellpopulations from lymphoblastoid cell lines (LCL) and PBfrom chronic lymphocytic leukaemia (CLL) patients [9].
d Central Ltd. This is an Open Access article distributed under the terms of the/creativecommons.org/licenses/by/2.0), which permits unrestricted use,, provided the original work is properly credited. The Creative Commons Publicmons.org/publicdomain/zero/1.0/) applies to the data made available in this

Bashford-Rogers et al. BMC Immunology 2014, 15:29 Page 2 of 9http://www.biomedcentral.com/1471-2172/15/29
We have applied a number of approaches to assess the dif-ferences between methods. Firstly, IgHV gene usage istypically reported as an assessment of BCR repertoirestructure, where healthy individuals exhibit low frequen-cies of most or all IgHV genes, and where clonal po-pulations have significantly higher frequencies of a singleIgHV gene or group of IgHV genes [10]. We formally as-sess whether there is differential or biased method-specificamplification of each IgHV gene by comparing IgHV fre-quencies observed between different methods applied toeach sample. Secondly, we compare the individual BCRfull-length sequence frequencies between different sam-ples to assess the reproducibility of each BCR repertoiremethod. Thirdly, the overall clonality of each sample canbe assessed and compared using previously publishedclonality measures of vertex Gini indices, cluster Gini in-dices and maximum cluster sizes using BCR sequence net-work analysis [9]. Briefly, the Gini index is a measure ofunevenness. When applied to the vertex size distributionfor a given sample, the Gini index indicates the overallclonal nature of a sample, and when applied to the clustersize distribution, the Gini index indicates the overall som-atic hypermutation in the sample. Low vertex Gini indicesrepresent diverse populations and high vertex Gini indicesrepresent clonal populations of B-cells. Similarly, low clus-ter Gini indices represent populations with lower muta-tional diversity and high cluster Gini indices representclonal populations with higher mutational diversity. Themaximum cluster size is the percentage of reads corre-sponding to the largest cluster and indicates the degree ofclonal expansion of a sample. This allows assessment ofwhether overall BCR repertoire structures are faithfullyretained between the different methods.
MethodsSamplesPeripheral blood mononuclear cells (PBMCs) were iso-lated from 10 ml of whole blood from 9 healthy vo-lunteers and 8 CLL patients using Ficoll gradients (GEHealthcare). Total RNA was isolated using TRIzol® (Invi-trogen) and purified using RNeasy Mini Kit (Qiagen)including on-column DNase digestion according to manu-facturer’s instructions. Total RNA was also isolated from1×106 cells from 10 human lymphoblastoid cell lines(LCLs) from the HapMap project [11]. Research was ap-proved by relevant institutional review boards and ethicscommittees (07/MRE05/44, Eastern NHS Multi ResearchEthics Committee), and all subjects gave written con-sent for the research [9]. Samples are summarised inAdditional file 1: Table S4.
RNA and DNA multiplex PCR amplificationMultiplex PCR amplification of RNA samples were per-formed according to Bashford-Rogers et al. [9] (primers
in Additional file 1: Table S3). For multiplex PCR ampli-fication of DNA, 30 ng of DNA was mixed with the JHreverse primer and the FR1 forward primer set (0.25 μMeach), using 0.5 μl Phusion® High-Fidelity DNA Poly-merase (Finnzymes), 1 μl dNTPs (0.25 mM), 1 μl DTT(0.25 mM), per 50 μl reaction. The following PCR pro-gram was used: 3 minutes at 94°C, 35 cycles of 30 sec-onds at 94°C, 30 seconds at 60°C and 1 minute at 72°C,with a final extension cycle of 7 minutes at 72°C on anMJ Thermocycler.
RNA-captureTotal RNA was initially processed for target enrichmentusing the NEBNext kit (NEB) according to manufacturersprotocol. Briefly, mRNA was isolated by polyA + selectionand converted to cDNA. cDNA at 0.3 to 0.7 ng/μl wasfragmented to 200 bp (Covaris), ligated to sequencingadaptors (Illumina) and size selected at 200 bp (Life Tech-nologies E-Gel). Samples were then indexed for pre-capture pooling (NEBNext Multiplex Oligos for IlluminaIndex Primers 1 to 12). A pre-capture library was gene-rated using 12 cycles of PCR (KAPA Biosystems LibraryAmplification Kit). Libraries were pooled and hybridisedto biotinylated RNA-capture baits (custom design [12],full protocol available on request), Agilent SureSelect) at65°C for 24 h. Hybridised fragments were selected usingstreptavidin magnetic beads, washed and eluted for multi-plexed sequencing on Illumina Miseq.
5’RACE5’RACE was performed using SMARTer™ Pico PCRcDNA Synthesis Kit (Clontech) according to Clontechprotocols, using the JH-reverse primer (Additional file 1:Table S3) and SMARTer 5’ primer for PCR amplification.
Sequencing methods and read preparationSequencing libraries were prepared using standard Roche-454 Rapid Prep or Illumina protocols, and sequencedusing an FLX Titanium Genome Sequencer (Roche/454Life Sciences) or by 250 bp paired-ended MiSeq (Illumina)respectively. Raw 454 or MiSeq reads were filtered forbase quality (median Phred score >32) using the QUASRprogram. (http://sourceforge.net/projects/quasr/) [13].The 250 bp reads from the 5’RACE experiment wereretained if they contained a JH-reverse primer se-quence and orientated to begin with IgHV gene. Non-immunoglobulin sequences were removed and only readswith significant similarity to reference IgHV genes fromthe IMGT database [14] using BLAST [15] were re-tained (1×10⁻¹⁰ E-value threshold). Primer sequenceswere trimmed from the reads, and sequences retainedfor analysis only if both primer sequences were iden-tified. Reads from RNA-capture were BLAST aligned toreference IgH genes, and trimmed if the reads extended

Bashford-Rogers et al. BMC Immunology 2014, 15:29 Page 3 of 9http://www.biomedcentral.com/1471-2172/15/29
outside the IgHV-D-J region. Reads from each platformwere filtered for length (>255 bp, 120 bp and 160 bp for454, MiSeq (250 bp paired-end) and RNA-capture MiSeqrespectively). The combined per-base error-rate for theRT-PCR and sequencing process for the 454 and MiSeqplatforms were similar to other studies (1.74x10⁻⁴ and2.06×10−4 respectively) [9,10,16]. Excluding homopoly-meric indels, the per-base error rate for 454 is 7.04×10⁻⁵.
Repertoire analysisFor identification of IgHV genes, BLAST [15] was usedto align the BCR sequences against known BCR se-quences from the ImMunoGeneTics (IMGT) database[14] (e-value threshold of 10−20). Network assembliesand diversity measure calculations (vertex Gini index,cluster Gini index and maximum cluster size) were per-formed according to Bashford-Rogers et al. [9]. Statis-tical analyses were performed in R. Differences between454 sequence sets excluded homopolymeric indels.
Simulation of sampling BCR populationsFor a given sequencing depth N, the range of values, x,within 10% of the true BCR proportion pi would be
blower≤x ≤bupper
Where blower =N * pi * 0.9 blower =N * pi * 0.9 andbupper =N * pi * 1.1, and 0 ≤ blower, bupper ≤N. With a se-quencing error rate e per base, the probability of suc-cessfully sequencing the BCR sequence of length lbecomes p = pi − (e * l). Therefore the probability of sam-pling within the range x is the sum of the binomialprobabilities of the range x:
P xð Þ ¼Xbupper
i¼blower
Ni
� �pi 1− pð ÞN−i
To estimate the probability of sequencing at least oneread of a given type, the Poisson distribution can beemployed:
P X ≠ 0ð Þ ¼ 1− e−λ
Where λ is the expected value of sequencing reads ofthat type, λ =N * p.
Results and discussionAssessing the stochasticity of sampling B-cell repertoiresAs exhaustive sampling of B-cells is not possible inhumans, the “true” extent of the BCR repertoire in hu-mans can only be estimated. A typical PB sample (10-20 ml) accounts for ~0.2% of the total PB, from whichonly a fraction is used in current BCR sequencing me-thods. Therefore, we examined the effect of resamplingon repertoire structure. Firstly, we repeated repertoire
sequencing of the same multiplex PCR products from10 LCL and 5 healthy PB samples using 454 sequencing(Figure 1A, sequencing repeat). Comparing frequency dis-tributions for each IgHV gene formally assesses differentialrepresentation of particular IgHV genes. The IgHV fre-quencies are highly correlated between repeats with a gra-dient close to unitary (Figure 1B, R2-value = 0.9998, y =1.002×, unitary gradient equals a one-to-one mapping be-tween repeats) even at low IgHV frequencies (Figure 1C),suggesting minimal stochasticity introduced through se-quencing alone.Next, we determined the stochastic variation observed
when re-sampling 2 equimolar portions of the sameRNA from 9 CLL PB samples, and repeating both PCRand MiSeq sequencing (300 bp paired-end, Figure 1A,RT-PCR repeats). The IgHV frequencies were again highlycorrelated (R2-value = 0.9909, y = 1.115x, Figure 1D). Thecorrelation is lower than the sequencing repeats suggest-ing greater re-sampling stochasticity introduced at thePCR steps. As the correlation might be skewed by the veryhigh clonality of the CLL samples, the expected corre-lation between experimental conditions using diverse sam-ples is best assessed from low frequency gene usage,shown in Figure 1E. As expected, the correlation betweenIgHV genes present at low frequencies (<15%, represen-ting frequencies typically observed in diverse B-cell sam-ples) is less than that of IgHVs present at higher frequencyreflecting lower probabilities of re-sampling rarer mole-cules (R2-value = 0.8815 for RT-PCR repeats, Figure 1E),which is in-line with previous studies [9].We also used clonality measures, Gini index and ma-
ximum cluster size, and individual BCR sequence fre-quencies to determine whether overall BCR repertoirestructures were faithfully retained between the repeats[9]. These diversity measures correspond to that seen inequivalent sample types in previous studies (Table 1,[9]). These repertoire diversity measures are stronglycorrelated between both sequencing and RT-PCR repeats(Additional file 1: Figure S2 A-B, R2-values > 0.991). Weshow that the correlation between the individual BCR fre-quencies between RT-PCR repeats is strong (R2 = 0.9793),although again the correlation is weaker when consid-ering only the low frequency BCRs (Additional file 1:Figure S2 C). Therefore, samples from the same RNApool exhibit some re-sampling stochasticity, particu-larly for low frequency variants. However, overall re-peated samples are highly correlated and repertoires arereproducible.
Assessing differences between sequencing methodsDifferent sequencing platforms each have different read-lengths, depths and error profiles (Additional file 1:Tables S1-2). 454 sequencing uses emulsion PCR andpyrosequencing and can produce reads potentially over

Figure 1 Comparing different RNA-capture and amplification methods. A) Schematic diagram of all experiments. Left side: RNA wasextracted from B-cell samples, and multiplex RT-PCR performed in triplicate: sequencing repeats (re-sequencing the same PCR products), PCRrepeats (independent RT-PCR of the same RNA and sequencing by MiSeq) and sequencing method comparisons (independent RT-PCR of thesame RNA source and sequenced by 454 and MiSeq). Right side: RNA was extracted from B-cell samples, and 5’RACE (by MiSeq), RNA-capture (byMiSeq) were compared to PCR amplification of the same samples (using 454 sequencing). Graphs of IgHV gene-usage frequency distributionsbetween samples were generated from B) the sequencing repeats, D) RT-PCR repeats, F) sequencing method comparisons, H) multiplex PCRversus 5’RACE (by MiSeq), J) multiplex PCR versus RNA-capture (sequenced by MiSeq). Graphs C, E, G, I and K) are IgHV gene-usage frequencydistributions from only the low frequencies (<15%) respectively. Point colors are red, blue and green for healthy, LCL and CLL samplesrespectively. The linear regression equation and R2-values are given. L) Plot of the probability of sampling within 10% of the true of aBCR proportion with varying read depths (10,000, 25,000, 100,000, 1,000,000 and 10,000,000 reads) assuming an initial population of50,000,000 BCR sequences after amplification.
Table 1 Mean diversity measures for each sample type
Sample type Mean maximumcluster size (%)
Mean vertexGini index
Mean clusterGini index
Healthy 0.581 0.182 0.047
Chronic lymphocyticleukemia (CLL)
95.117 0.931 0.612
Human lymphoblastoidcell line (LCL)
65.205 0.934 0.790
Bashford-Rogers et al. BMC Immunology 2014, 15:29 Page 4 of 9http://www.biomedcentral.com/1471-2172/15/29
800 bp [17], and therefore has the capacity to sequence afull BCR amplicon in a single read. However, the 454 plat-form has high homopolymeric base pair error-rates causedby accumulated light intensity variance [16,18–20]. TheIllumina MiSeq has the highest throughput per run (1.6Gb of sequence/run, 60 Mb/hour) [17] and lower overallerror rate, particularly in homopolymeric regions [21].MiSeq however has its own distinct error profile of single-base errors associated with GGC motif [22] and at the 3’end of the reads compared to the 5’ end. MiSeq can cur-rently generate up to 300 bp paired-end reads that allowsfor paired-end joining and full coverage of multiplex PCR
Bashford-Rogers et al. BMC Immunology 2014, 15:29 Page 5 of 9http://www.biomedcentral.com/1471-2172/15/29
amplicons. We compared sequencing technologies by tak-ing two portions of RNA from 8 CLL and 6 healthy PBsamples and performed PCR followed by 454 or MiSeq(250 bp paired-end) sequencing (Figure 1A, sequencingcomparison). The IgHV frequencies between the sequen-cing methods were highly correlated (R2-value = 0.9844,y = 0.998x, Figure 1F). As the correlation might be skewedby the very high clonality of the CLL samples, we assessedthe correlation at low frequency gene usages. Again,greater variation of low frequency variants suggests botheffects of stochastic re-sampling and platform-specific dif-ferences (gene frequencies <15% representing typical ob-servations from diverse B-cell samples, Figure 1G, R2-value = 0.5885). The individual BCR sequence frequencieswere also highly correlated (Additional file 1: Figure S3A),suggesting that repertoire structure is retained when usingthe same amplification method on different sequencingplatforms. However, due to the lower homopolymericindel rate, only the MiSeq platform is currently appro-priate for filtering read sets for open reading frames (andsubsequent translation into protein sequence). MiSeq alsohas the advantage of a higher sequencing depth per lane,therefore allowing higher levels of multiplexing of samplesand reducing the per-sample cost.
How deep do we need to sequence?The sequencing depth required depends on the frequen-cies of clones of interest and sequencing method. Readsfrom all methods were filtered for quality and presenceof immunoglobulin sequence as detailed in the methodssection. Here, the percentage of filtered BCR sequencesfrom PCR amplification was 60% and 76% for MiSeqand 454 sequencing respectively and 55% for 5’RACE(using MiSeq). As the RNA-capture baits target bothBCRs and TCRs, the percentage of usable BCR sequen-ces was only 1.53% (Additional file 1: Table S2). There-fore, between 35-50x higher sequencing depth is requiredfor RNA-capture to obtain the equivalent number ofBCR-specific reads compared to the other methods. Todetermine the number of BCR sequences required for bio-logical studies, we modelled the probabilities of sequen-cing BCR clones at varying BCR sampling proportionsand sequencing depths. Assuming an initial population of50,000,000 BCRs after amplification, when a BCR cloneis >4% of the total population, a sequencing depth ofonly 10,000 reads has a 95% probability of sequencingwithin 90% accuracy (i.e. within 10% of the true clonalproportion, Figure 1L). For rarer BCR clones, higher se-quencing depths can significantly increase sampling accur-acy. For example, the probability of sequencing within90% accuracy for a clone at 0.04% of the total populationis increased from 0.522 at 100,000 reads to 0.956 at1,000,000 reads (i.e. 1/10 lane of MiSeq). For clonesof <0.001%, increasing the sequencing depth to as high as
1×10⁷ does not significantly increase sequencing accuracydue to low re-sampling probabilities. Thus, the optimumsequencing depth depends on the samples used and bio-logical question. Studies investigating highly clonal disor-ders, such as CLL, require less reads to obtain informationabout clonal sequence than studies of healthy individualswith diverse repertoires of low frequency clones.
Assessing different RNA-capture and amplificationmethodsThe three main BCR amplification methods are PCRusing IgH-specific multiplex primers [23], 5’ Rapidamplification of cDNA ends (5’RACE) [24–27] and RNA-capture using RNA bait/capture probes [28,29]. IgH-specific multiplex PCR primers have been designed [23],validated [30–34], and used in numerous biological stud-ies [9,10,35–41]. Such multiplex PCRs can be performedon either RNA or DNA and require a relatively smallamount of template. However, there is the potential forbiased primer annealing and unequal PCR amplificationof BCR sequences. RNA-capture is based around the me-thods used for human exome sequencing and uses RNAbait/capture probes and subsequent universal PCR ampli-fication [28,29]. This allows for enrichment, amplificationand sequencing of TCRs (α, β, γ and δ chains) and BCRs(heavy and light chains) simultaneously. PCR and RNA-capture methods can use RNA or DNA, but have thepotential for sequence-based differential annealing andbiased capture. 5’RACE overcomes this by using a singleIgH-specific primer for first strand Ig cDNA synthesis andsubsequent sequence-independent template switchingprimer for second strand cDNA synthesis. This elimi-nates potential multiplex primer bias, but can have lowefficiency, high non-specific amplification, and short frag-ment contamination from RNA degradation or incom-plete cDNA synthesis and template switching [24–27].Also, as the RNA bait probes and multiplex PCR primersare generated from reference Ig and TCR gene databases,they lack the same efficiency as 5’RACE for capturing hu-man allelic variants of TCR or BCR segments that are notrepresented in the reference database.To compare the different amplification methods, 5’RACE
(with MiSeq sequencing) was performed on 7 CLL and 5healthy PB samples, RNA-capture (with MiSeq sequen-cing) was performed on 1 healthy and 1 CLL PB, and werecompared to multiplex PCR of the same samples (using454 sequencing, Figure 1A). Strong IgHV gene frequencycorrelations were observed between PCR and 5’RACE(R2-value = 0.9792), and between PCR and RNA-capture(R2-value = 0.9795) (Figures 1H-K). This correlation isagain weaker for lower frequency BCR sequences (R2-value = 0.6041 and 0.8811 respectively, Figures 1I and K).Comparing individual BCR sequences rather than IgHVgene frequencies showed strong correlations between all
Bashford-Rogers et al. BMC Immunology 2014, 15:29 Page 6 of 9http://www.biomedcentral.com/1471-2172/15/29
the methods (R2-value > 0.96, Additional file 1: Figure S3)above 5% BCR sequence frequency. Both Pairwise-Wilcoxon tests and paired T-tests between IgHV genefrequencies (with Bonferroni multiple-testing corrections)showed no significant differentially captured IgHV genesbetween the RNA-capture, 5’RACE or PCR methods. To-gether, we suggest each method here captures similar BCRrepertoires.
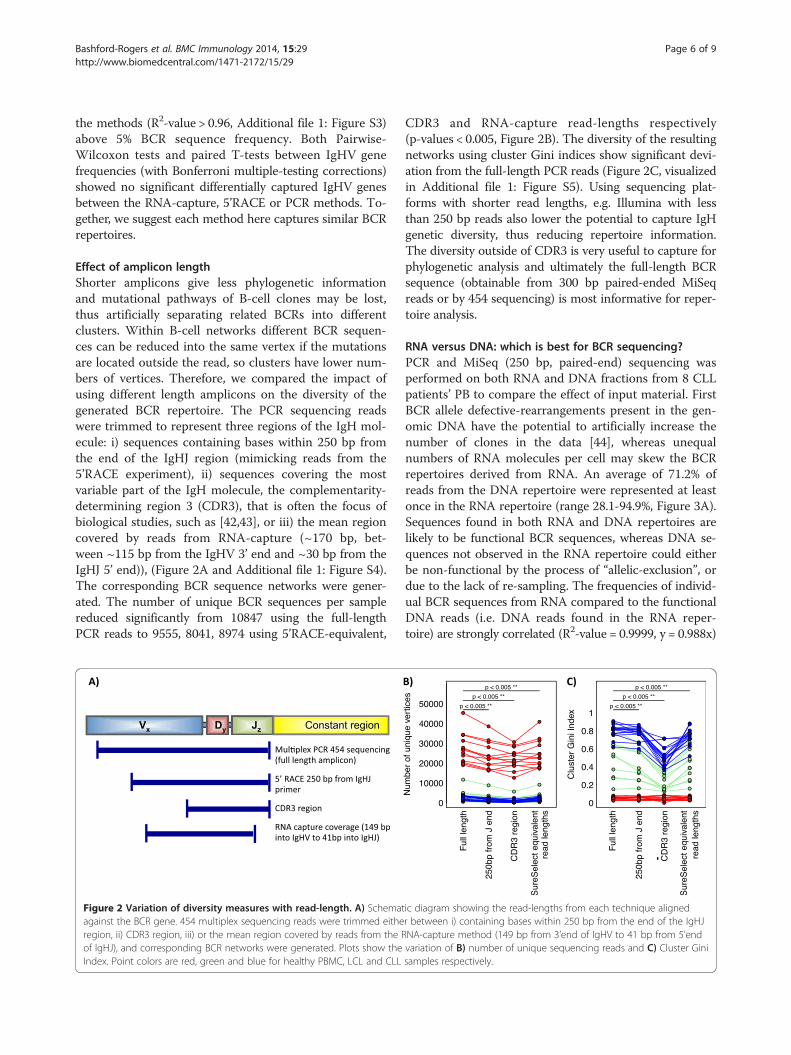
Effect of amplicon lengthShorter amplicons give less phylogenetic informationand mutational pathways of B-cell clones may be lost,thus artificially separating related BCRs into differentclusters. Within B-cell networks different BCR sequen-ces can be reduced into the same vertex if the mutationsare located outside the read, so clusters have lower num-bers of vertices. Therefore, we compared the impact ofusing different length amplicons on the diversity of thegenerated BCR repertoire. The PCR sequencing readswere trimmed to represent three regions of the IgH mol-ecule: i) sequences containing bases within 250 bp fromthe end of the IgHJ region (mimicking reads from the5’RACE experiment), ii) sequences covering the mostvariable part of the IgH molecule, the complementarity-determining region 3 (CDR3), that is often the focus ofbiological studies, such as [42,43], or iii) the mean regioncovered by reads from RNA-capture (~170 bp, bet-ween ~115 bp from the IgHV 3’ end and ~30 bp from theIgHJ 5’ end)), (Figure 2A and Additional file 1: Figure S4).The corresponding BCR sequence networks were gener-ated. The number of unique BCR sequences per samplereduced significantly from 10847 using the full-lengthPCR reads to 9555, 8041, 8974 using 5’RACE-equivalent,
Figure 2 Variation of diversity measures with read-length. A) Schematagainst the BCR gene. 454 multiplex sequencing reads were trimmed eitheregion, ii) CDR3 region, iii) or the mean region covered by reads from the Rof IgHJ), and corresponding BCR networks were generated. Plots show theIndex. Point colors are red, green and blue for healthy PBMC, LCL and CLL
CDR3 and RNA-capture read-lengths respectively(p-values < 0.005, Figure 2B). The diversity of the resultingnetworks using cluster Gini indices show significant devi-ation from the full-length PCR reads (Figure 2C, visualizedin Additional file 1: Figure S5). Using sequencing plat-forms with shorter read lengths, e.g. Illumina with lessthan 250 bp reads also lower the potential to capture IgHgenetic diversity, thus reducing repertoire information.The diversity outside of CDR3 is very useful to capture forphylogenetic analysis and ultimately the full-length BCRsequence (obtainable from 300 bp paired-ended MiSeqreads or by 454 sequencing) is most informative for reper-toire analysis.
RNA versus DNA: which is best for BCR sequencing?PCR and MiSeq (250 bp, paired-end) sequencing wasperformed on both RNA and DNA fractions from 8 CLLpatients’ PB to compare the effect of input material. FirstBCR allele defective-rearrangements present in the gen-omic DNA have the potential to artificially increase thenumber of clones in the data [44], whereas unequalnumbers of RNA molecules per cell may skew the BCRrepertoires derived from RNA. An average of 71.2% ofreads from the DNA repertoire were represented at leastonce in the RNA repertoire (range 28.1-94.9%, Figure 3A).Sequences found in both RNA and DNA repertoires arelikely to be functional BCR sequences, whereas DNA se-quences not observed in the RNA repertoire could eitherbe non-functional by the process of “allelic-exclusion”, ordue to the lack of re-sampling. The frequencies of individ-ual BCR sequences from RNA compared to the functionalDNA reads (i.e. DNA reads found in the RNA reper-toire) are strongly correlated (R2-value = 0.9999, y = 0.988x)
ic diagram showing the read-lengths from each technique alignedr between i) containing bases within 250 bp from the end of the IgHJNA-capture method (149 bp from 3’end of IgHV to 41 bp from 5’endvariation of B) number of unique sequencing reads and C) Cluster Ginisamples respectively.

Figure 3 Comparison of RNA and DNA repertoires. RNA and DNA were extracted from each peripheral blood sample from 8 CLL patients, onwhich multiplex RT-PCR or PCR was performed respectively and sequenced by MiSeq (250 bp paired-end). A) The percentage of DNA sequencesfound in each RNA sample. The correlation between the BCR frequency in RNA and functional DNA repertoires (DNA sequences that were foundalso in the RNA repertoire) for the 8 CLL patients in B) all IgHV gene usage frequencies and C) the low frequency IgHV gene usage frequenciesonly (<2%). If unequal numbers of RNA molecules per cell significantly skewed the RNA BCR repertoires, then deviation from y = x correlationwould be expected.
Bashford-Rogers et al. BMC Immunology 2014, 15:29 Page 7 of 9http://www.biomedcentral.com/1471-2172/15/29
suggesting no repertoire-skewing between the DNA andRNA proportions, even at low frequencies (Figure 3B-C).Therefore, due to defective-rearrangements present in thegenomic DNA, RNA is potentially more informative thanDNA for understanding BCR population structures.
ConclusionsNext-generation sequencing of immune receptor genescan provide a quantitative understanding of the land-scape of the adaptive immune response. The “true” BCRrepertoire in humans is not known, and current methodsrely on taking small samples of the total B-cells to esti-mate the population structure. Here we show little sam-pling bias in repeat samples and that multiplex PCR,RNA-capture and 5’RACE each captures a similar over-all BCR repertoire and clonal features of each sample.RNA capture offers the advantage of capturing both Band T-cell repertoires. We show that there is no signifi-cant inflation or deflation of clonality due to unequalnumbers of RNA transcripts per cell and suggest thatusing RNA input is more informative for understandingB-cell population structure as genomic DNA potentiallyexhibits artificially increased numbers of clones reflectingbiallelic rearrangements in a single clone [44]. Choice ofsequencing platform does not significantly affect the rep-ertoire structure captured but an amplicon and sequencereads covering the entire BCR is most informative for ana-lysis and sequencing depth should be sufficient to allowcapture of the BCR frequency of interest. The ability todetect BCR repertoire diversity and sensitivity varies withread length and depth respectively, resulting in an idealBCR sequencing solution of amplification of the full VDJ
region to a depth of 1,000,000 to identify unique BCRs at0.04% frequency with 90% theoretical accuracy.We show that the repertoires generated by different
sequencing and amplification methods is robust but readlengths, depths and error profiles should be consideredin experimental design and multiple sampling approa-ches could be employed to minimise stochastic samplingissues. We consider the multiplex PCR method to be themost automatable and sensitive method, with consist-ently good amplification from samples with low numbersof B-cells. The number of PCR cycles can be tailored tothe requirement of DNA amount required for sequen-cing, and therefore the best method for large studies orusing samples with low cell numbers. We recommendthe use of 5’RACE if a sample is likely to be highlysomatically mutated, thus potentially modifying the an-nealing sites for the multiplex PCR or RNA capture.However, we have shown that in CLL, where there is on-going somatic hypermutation, we see no evidence of dif-ferential primer annealing ability. RNA-capture can beuseful for situations where both the B- and T-cell reper-toires are to be assessed simultaneously. For sequencing,we recommend MiSeq as it is able to produce high qual-ity reads covering the full BCR, with read depths allow-ing for sequencing of many samples on a single run bymultiplexing.
Additional file
Additional file 1: Supplementary information. Description of data:Supplemental data file.

Bashford-Rogers et al. BMC Immunology 2014, 15:29 Page 8 of 9http://www.biomedcentral.com/1471-2172/15/29
AbbreviationsBCR: B-cell receptor; TCR: T-cell receptor; PB: Peripheral blood; CLL: Chroniclymphocytic leukemia; 5’RACE: 5’ Rapid amplification of cDNA ends;LCL: Lymphoblastoid cell line.
Competing interestsThe authors declare that they have no competing interests.
Authors’ contributionsRJMB-R, ALP and PK designed the study; RJMB-R, SI designed and performedthe 5’ RACE and multiplex PCR experiments. DD aided design of the 5’ RACEexperiments. LC, ME, RC and MH designed and performed the RNA captureexperiments. RJMB-R analysed the data; GAF and GSV provided patientsamples; GAF and GSV provided advice for the project; RJMB-R, ALP and PKwrote the paper, and all authors reviewed and approved the manuscript.
AcknowledgementsThis work was supported by the Wellcome Trust. We would like to thank theCambridge Cancer Trials Centre and nurse specialists Gwyn Stafford, RosieTween, Lisa Walbridge and Joanna Baxter, and the patients and staff ofAddenbrooke’s Haematology Translational Research Laboratory.
Author details1Wellcome Trust Sanger Institute, Wellcome Trust Genome Campus, Hinxton,Cambridge CB10 1SA, UK. 2Molecular Haematology and Cancer Biology Unit,UCL Institute of Child Health, London WC1N 1EH, UK. 3Human ImmunologySection, Vaccine Research Center, National Institute of Allergy and InfectiousDiseases, National Institutes of Health, Bethesda, MD 20892, USA.4Department of Hematology, Addenbrooke’s Hospital, Hills Road, CambridgeCB2 0QQ, UK. 5Research Department of Infection, Division of Infection andImmunity, University College London, Gower Street, London WC1E 6BT, UK.
Received: 29 January 2014 Accepted: 15 July 2014Published: 5 August 2014
References1. Woof JM, Burton DR: Human antibody-Fc receptor interactions
illuminated by crystal structures. Nat Rev Immunol 2004, 4:89–99.2. Tonegawa S: Somatic generation of antibody diversity. Nature 1983,
302:575–581.3. Schatz DG, Swanson PC: V(D)J Recombination: Mechanisms of Initiation.
Annu Rev Genet 2010, 45:167–202.4. Latchman D: Gene Regulation (Advanced Texts); 2005.5. Jung D, Giallourakis C, Mostoslavsky R, Alt FW: Mechanism and control of V
(D)J recombination at the immunoglobulin heavy chain locus. Annu RevImmunol 2006, 24:541–570.
6. Dorner T, Brezinschek HP, Foster SJ, Brezinschek RI, Farner NL, Lipsky PE:Delineation of selective influences shaping the mutated expressedhuman Ig heavy chain repertoire. J Immunol 1998, 160:2831–2841.
7. Batrak V, Blagodatski A, Buerstedde JM: Understanding theimmunoglobulin locus specificity of hypermutation. Methods Mol Biol2011, 745:311–326.
8. Weinstein JA, Jiang N, White RA 3rd, Fisher DS, Quake SR: High-throughputsequencing of the zebrafish antibody repertoire. Science 2009,324:807–810.
9. Bashford-Rogers RJ, Palser AL, Huntly BJ, Rance R, Vassiliou GS, Follows GA,Kellam P: Network properties derived from deep sequencing of humanB-cell receptor repertoires delineate B-cell populations. Genome Res 2013,23(11):1874–1884.
10. Boyd SD, Marshall EL, Merker JD, Maniar JM, Zhang LN, Sahaf B, Jones CD,Simen BB, Hanczaruk B, Nguyen KD, Nadeau KC, Egholm M, Miklos DB,Zehnder JL, Fire AZ: Measurement and clinical monitoring of humanlymphocyte clonality by massively parallel VDJ pyrosequencing. Sci TranslMed 2009, 1:12ra23.
11. Frazer KA, Ballinger DG, Cox DR, Hinds DA, Stuve LL, Gibbs RA, Belmont JW,Boudreau A, Hardenbol P, Leal SM, Pasternak S, Wheeler DA, Willis TD, Yu F,Yang H, Zeng C, Gao Y, Hu H, Hu W, Li C, Lin W, Liu S, Pan H, Tang X,Wang J, Wang W, Yu J, Zhang B, Zhang Q, Zhao H, et al: A secondgeneration human haplotype map of over 3.1 million SNPs. Nature 2007,449:851–861.
12. Fisher J, Yan M, Heuijerjans J, Carter L, Abolhassani A, Frosch J, Wallace R,Flutter B, Hubank M, Klein N, Callard R, Gustafsson K, Anderson J:Neuroblastoma killing properties of V-delta 2 and V-delta2 negativegamma delta T cells following expansion by artificial antigen presentingcells. Clinical cancer research: an official journal of the American Associationfor Cancer Research 2014.
13. Watson SJ, Welkers MRA, Depledge DP, Coulter E, Breuer JM, de Jong MD,Kellam P: Viral population analysis and minority-variant detection usingshort read next-generation sequencing. Philosophical Transactions of theRoyal Society B-Biological Sciences 2013, 368(1614).
14. Lefranc MP, Giudicelli V, Ginestoux C, Jabado-Michaloud J, Folch G,Bellahcene F, Wu Y, Gemrot E, Brochet X, Lane J, Regnier L, Ehrenmann F,Lefranc G, Duroux P: IMGT, the international ImMunoGeneTicsinformation system. Nucleic Acids Res 2009, 37:D1006–D1012.
15. Altschul SF, Gish W, Miller W, Myers EW, Lipman DJ: Basic local alignmentsearch tool. J Mol Biol 1990, 215:403–410.
16. Wang C, Mitsuya Y, Gharizadeh B, Ronaghi M, Shafer RW: Characterizationof mutation spectra with ultra-deep pyrosequencing: application toHIV-1 drug resistance. Genome Res 2007, 17:1195–1201.
17. Loman NJ, Misra RV, Dallman TJ, Constantinidou C, Gharbia SE, Wain J,Pallen MJ: Performance comparison of benchtop high-throughputsequencing platforms. Nat Biotechnol 2012, 30:434–439.
18. Quince C, Lanzen A, Curtis TP, Davenport RJ, Hall N, Head IM, Read LF,Sloan WT: Accurate determination of microbial diversity from 454pyrosequencing data. Nat Methods 2009, 6:639–641.
19. Margulies M, Egholm M, Altman WE, Attiya S, Bader JS, Bemben LA, Berka J,Braverman MS, Chen YJ, Chen Z, Dewell SB, Du L, Fierro JM, Gomes XV,Godwin BC, He W, Helgesen S, Ho CH, Irzyk GP, Jando SC, Alenquer ML,Jarvie TP, Jirage KB, Kim JB, Knight JR, Lanza JR, Leamon JH, Lefkowitz SM,Lei M, Li J, et al: Genome sequencing in microfabricated high-densitypicolitre reactors. Nature 2005, 437:376–380.
20. Luo C, Tsementzi D, Kyrpides N, Read T, Konstantinidis KT: DirectComparisons of Illumina vs. Roche 454 Sequencing Technologies on theSame Microbial Community DNA Sample. PLoS One 2012, 7:e30087.
21. Quail MA, Smith M, Coupland P, Otto TD, Harris SR, Connor TR, Bertoni A,Swerdlow HP, Gu Y: A tale of three next generation sequencingplatforms: comparison of Ion Torrent. Pacific Biosciences and Illumina MiSeqsequencers. BMC Genomics 2012, 13:341.
22. Nakamura K, Oshima T, Morimoto T, Ikeda S, Yoshikawa H, Shiwa Y, IshikawaS, Linak MC, Hirai A, Takahashi H, Altaf-Ul-Amin M, Ogasawara N, Kanaya S:Sequence-specific error profile of Illumina sequencers. Nucleic Acids Res2011, 39:e90.
23. van Dongen JJ, Langerak AW, Bruggemann M, Evans PA, Hummel M,Lavender FL, Delabesse E, Davi F, Schuuring E, Garcia-Sanz R, van Krieken JH,Droese J, Gonzalez D, Bastard C, White HE, Spaargaren M, Gonzalez M,Parreira A, Smith JL, Morgan GJ, Kneba M, Macintyre EA: Design andstandardization of PCR primers and protocols for detection of clonalimmunoglobulin and T-cell receptor gene recombinations in suspectlymphoproliferations: report of the BIOMED-2 Concerted ActionBMH4-CT98-3936. Leukemia 2003, 17:2257–2317.
24. Freeman JD, Warren RL, Webb JR, Nelson BH, Holt RA: Profiling the T-cellreceptor beta-chain repertoire by massively parallel sequencing. GenomeRes 2009, 19:1817–1824.
25. Bertioli D: Rapid amplification of cDNA ends. Methods Mol Biol 1997,67:233–238.
26. Warren RL, Freeman JD, Zeng T, Choe G, Munro S, Moore R, Webb JR, HoltRA: Exhaustive T-cell repertoire sequencing of human peripheral bloodsamples reveals signatures of antigen selection and a directlymeasured repertoire size of at least 1 million clonotypes. Genome Res2011, 21:790–797.
27. Varadarajan N, Julg B, Yamanaka YJ, Chen H, Ogunniyi AO, McAndrew E,Porter LC, Piechocka-Trocha A, Hill BJ, Douek DC, Pereyra F, Walker BD,Love JC: A high-throughput single-cell analysis of human CD8(+) T cellfunctions reveals discordance for cytokine secretion and cytolysis. J ClinInvest 2011, 121:4322–4331.
28. Choi M, Scholl UI, Ji WZ, Liu TW, Tikhonova IR, Zumbo P, Nayir A, BakkalogluA, Ozen S, Sanjad S, Nelson-Williams C, Farhi A, Mane S, Lifton RP: Geneticdiagnosis by whole exome capture and massively parallel DNA sequencing.Proc Natl Acad Sci U S A 2009, 106:19096–19101.
29. Mamanova L, Coffey AJ, Scott CE, Kozarewa I, Turner EH, Kumar A,Howard E, Shendure J, Turner DJ: Target-enrichment strategies for

Bashford-Rogers et al. BMC Immunology 2014, 15:29 Page 9 of 9http://www.biomedcentral.com/1471-2172/15/29
next-generation sequencing (vol 7, pg 111, 2010). Nat Methods 2010,7:479–479.
30. van Krieken JH, Langerak AW, Macintyre EA, Kneba M, Hodges E, Sanz RG,Morgan GJ, Parreira A, Molina TJ, Cabecadas J, Gaulard P, Jasani B, Garcia JF,Ott M, Hannsmann ML, Berger F, Hummel M, Davi F, Bruggemann M,Lavender FL, Schuuring E, Evans PA, White H, Salles G, Groenen PJ, GameiroP, Pott C, Dongen JJ: Improved reliability of lymphoma diagnostics viaPCR-based clonality testing: report of the BIOMED-2 Concerted ActionBHM4-CT98-3936. Leukemia 2007, 21:201–206.
31. Evans PAS, Pott C, Groenen PJTA, Salles G, Davi F, Berger F, Garcia JF, vanKrieken JHJM, Pals S, Kluin P, Schuuring E, Spaargaren M, Boone E, GonzalezD, Martinez B, Villuendas R, Gameiro P, Diss TC, Mills K, Morgan GJ, Carter GI,Milner BJ, Pearson D, Hummel M, Jung W, Ott M, Canioni D, Beldjord K,Bastard C, Delfau-Larue MH, et al: Significantly improved PCR-basedclonality testing in B-cell malignancies by use of multiple immunoglobulingene targets. Report of the BIOMED-2 Concerted Action BHM4–CT98–3936.Leukemia 2007, 21:207–214.
32. Vargas RL, Felgar RE, Rothberg PG: Detection of clonality inlymphoproliferations using PCR of the antigen receptor genes: Does sizematter? Leukemia Res 2008, 32:335–338.
33. Lukowsky A, Marchwat M, Sterry W, Gellrich S: Evaluation of B-cell clonalityin archival skin biopsy samples of cutaneous B-cell lymphoma byimmunoglobulin heavy chain gene polymerase chain reaction. LeukLymphoma 2006, 47:487–493.
34. Bruggemann M, White H, Gaulard P, Garcia-Sanz R, Gameiro P, Oeschger S,Jasani B, Ott M, Delsol G, Orfao A, Tiemann M, Herbst H, Langerak AW,Spaargaren M, Moreau E, Groenen PJ, Sambade C, Foroni L, Carter GI,Hummel M, Bastard C, Davi F, Delfau-Larue MH, Kneba M, van Dongen JJ,Beldjord K, Molina TJ: Powerful strategy for polymerase chain reaction-based clonality assessment in T-cell malignancies Report of theBIOMED-2 Concerted Action BHM4 CT98-3936. Leukemia 2007,21:215–221.
35. Campbell PJ, Pleasance ED, Stephens PJ, Dicks E, Rance R, Goodhead I,Follows GA, Green AR, Futreal PA, Stratton MR: Subclonal phylogeneticstructures in cancer revealed by ultra-deep sequencing. Proc Natl AcadSci U S A 2008, 105:13081–13086.
36. Sanchez ML, Almeida J, Gonzalez D, Gonzalez M, Garcia-Marcos MA,Balanzategui A, Lopez-Berges MC, Nomdedeu J, Vallespi T, Barbon M, MartinA, de la Fuente P, Martin-Nunez G, Fernandez-Calvo J, Hernandez JM,San Miguel JF, Orfao A: Incidence and clinicobiologic characteristics ofleukemic B-cell chronic lymphoproliferative disorders with more thanone B-cell clone. Blood 2003, 102:2994–3002.
37. Maletzki C, Jahnke A, Ostwald C, Klar E, Prall F, Linnebacher M: Ex-vivoclonally expanded B lymphocytes infiltrating colorectal carcinoma are ofmature immunophenotype and produce functional IgG. PLoS One 2012,7:e32639.
38. Boyd SD, Gaeta BA, Jackson KJ, Fire AZ, Marshall EL, Merker JD, Maniar JM,Zhang LN, Sahaf B, Jones CD, Simen BB, Hanczaruk B, Nguyen KD, NadeauKC, Egholm M, Miklos DB, Zehnder JL, Collins AM: Individual variation inthe germline Ig gene repertoire inferred from variable region generearrangements. J Immunol 2010, 184:6986–6992.
39. Lev A, Simon AJ, Bareket M, Bielorai B, Hutt D, Amariglio N, Rechavi G,Somech R: The kinetics of early T and B cell immune recovery after bonemarrow transplantation in RAG-2-deficient SCID patients. PLoS One 2012,7:e30494.
40. Jager U, Fridrik M, Zeitlinger M, Heintel D, Hopfinger G, Burgstaller S,Mannhalter C, Oberaigner W, Porpaczy E, Skrabs C, Einberger C, Drach J,Raderer M, Gaiger A, Putman M, Greil R: Rituximab serum concentrationsduring immuno-chemotherapy of follicular lymphoma correlate withpatient gender, bone marrow infiltration and clinical response.Haematologica 2012, 97:1431–1438.
41. Krause JC, Tsibane T, Tumpey TM, Huffman CJ, Briney BS, Smith SA, BaslerCF, Crowe JE Jr: Epitope-specific human influenza antibody repertoiresdiversify by B cell intraclonal sequence divergence and interclonalconvergence. J Immunol 2011, 187:3704–3711.
42. Larimore K, McCormick MW, Robins HS, Greenberg PD: Shaping of humangermline IgH repertoires revealed by deep sequencing. J Immunol 2012,189:3221–3230.
43. Wu YC, Kipling D, Leong HS, Martin V, Ademokun AA, Dunn-Walters DK:High-throughput immunoglobulin repertoire analysis distinguishesbetween human IgM memory and switched memory B-cell populations.Blood 2010, 116:1070–1078.
44. Langerak AW, Dongen JJM: Multiple clonal Ig/TCR products: implicationsfor interpretation of clonality findings. J Hematop 2011, 5:35–43.
doi:10.1186/s12865-014-0029-0Cite this article as: Bashford-Rogers et al.: Capturing needles in haystacks:a comparison of B-cell receptor sequencing methods. BMC Immunology2014 15:29.
Submit your next manuscript to BioMed Centraland take full advantage of:
• Convenient online submission
• Thorough peer review
• No space constraints or color figure charges
• Immediate publication on acceptance
• Inclusion in PubMed, CAS, Scopus and Google Scholar
• Research which is freely available for redistribution
Submit your manuscript at www.biomedcentral.com/submit