Capturing daily urban rhythms: The use of location aware technologies
14
10th International Conference on Computers in Urban Planning and Urban Management 11-13 July, 2007 Capturing daily urban rhythms: The use of location aware technologies Dr. Stephan Krygsman, Department of Logistics, University of Stellenbosch, South Africa, [email protected] , tel +27 21 8082624, fax +27 21 808 2409 Dr. Tom de Jong, Department of Geosciences, Utrecht University, The Netherlands [email protected] , tel +31 30 2531393, fax +31 30 2540604 Peter Schmitz, CSIR Built Environment, Pretoria, South Africa, [email protected] , tel +27 12 841 3841, fax +27 12 3841 3037 Abstract: Daily activities and travel often follow a natural rhythm or flow that is structured by the fixed spatial and temporal constraints. The work and home location act as pegs that define individual’s activity space and it is within these spaces that activities and travel behaviour are believed to be habitual and recurring. Aggregating such individual behaviour leads to so-called daily urban rhythms. Knowledge of these daily urban rhythms is important as they are indicative of temporal and spatial user demand, that is transport or land use demand. Furthermore, knowledge of where individuals are during the various times of the day is vital for emergency planning or disaster management. While emergency evacuation is often focussed on the residential areas, this might not be where people find themselves during the day. This paper reports on a proof-of-concept study which tracked a sample of individuals over a two day period making use of their personal cell phones. The result of the research shows that cell phone records allows planners and researchers to obtain a dynamic motion picture of collective behaviour. Keywords : Cell phones, location aware technologies, land use, transport, urban rhythms Table of Contents 1. Introduction ..................................................................................................................................... 2 2. Background and literature review ................................................................................................... 3 3. Methodology ................................................................................................................................... 4 4. Case study area, survey sample, land use and transport spatial data ........................................... 6 5. Accuracy and quality of the data..................................................................................................... 6 6. Interpreted activity and trip patterns ............................................................................................... 8 7. Descriptive analysis and presentation of urban rhythms ................................................................ 9 8. Concluding discussions and directions for future research .......................................................... 12 9. References.................................................................................................................................... 13 Non-Reviewed Paper
-
Upload
inhollandappliedsciences -
Category
Documents
-
view
0 -
download
0
Transcript of Capturing daily urban rhythms: The use of location aware technologies

10th International Conference on Computers in Urban Planning and Urban
Management
11-13 July, 2007
Capturing daily urban rhythms: The use of location aware technologies
Dr. Stephan Krygsman, Department of Logistics, University of Stellenbosch, South Africa, [email protected], tel +27 21 8082624, fax +27 21 808 2409
Dr. Tom de Jong, Department of Geosciences, Utrecht University, The Netherlands
[email protected], tel +31 30 2531393, fax +31 30 2540604
Peter Schmitz, CSIR Built Environment, Pretoria, South Africa, [email protected], tel +27 12 841 3841, fax +27 12 3841 3037
Abstract: Daily activities and travel often follow a natural rhythm or flow that is structured by the fixed spatial and temporal constraints. The work and home location act as pegs that define individual’s activity space and it is within these spaces that activities and travel behaviour are believed to be habitual and recurring. Aggregating such individual behaviour leads to so-called daily urban rhythms. Knowledge of these daily urban rhythms is important as they are indicative of temporal and spatial user demand, that is transport or land use demand. Furthermore, knowledge of where individuals are during the various times of the day is vital for emergency planning or disaster management. While emergency evacuation is often focussed on the residential areas, this might not be where people find themselves during the day. This paper reports on a proof-of-concept study which tracked a sample of individuals over a two day period making use of their personal cell phones. The result of the research shows that cell phone records allows planners and researchers to obtain a dynamic motion picture of collective behaviour. Keywords: Cell phones, location aware technologies, land use, transport, urban rhythms Table of Contents 1. Introduction ..................................................................................................................................... 2 2. Background and literature review ................................................................................................... 3 3. Methodology ................................................................................................................................... 4 4. Case study area, survey sample, land use and transport spatial data........................................... 6 5. Accuracy and quality of the data..................................................................................................... 6 6. Interpreted activity and trip patterns ............................................................................................... 8 7. Descriptive analysis and presentation of urban rhythms................................................................ 9 8. Concluding discussions and directions for future research .......................................................... 12 9. References.................................................................................................................................... 13
Non-Reviewed Paper
1. Introduction Daily activities and travel often follow a natural rhythm or flow that is structured by the fixed spatial and
temporal constraints. The work and home location act as pegs that define individual’s activity space
and it is within these spaces that activities and travel behaviour, for a large number of individuals, are
believed to be habitual and recurring.
Aggregating such individual behaviour leads to so-called daily urban rhythms. Urban rhythms, for the
purpose of this research can be defined as the aggregate behaviour of individuals during a day. This
behaviour is expressed as the distributed population patterns dominated by residential stay during the
evenings and early mornings, the daily commutes (as individuals converge and diverge, spatially and
temporally on work locations), leading to concentrated activity duration at work locations during the
work day, but also to semi-concentrated patterns dominated by leisure, retail and culture activities
outside office hours. The implications of these phenomena are morning and evening congestions
peaks, high concentrations of people in a few work locations and a fairly distributed pattern of activities
in the evenings.
From a transport and land use planning perspective, knowledge of these daily urban rhythms, their
temporal and spatial stability and their temporal/spatial convergence / divergence, is important. These
rhythms are indicative of temporal and spatial user demand, that is transport or land use demand. As
such, they can provide an indication of travel and activity needs (routes taken, departure time,
intermediate activity sojourns, locations visited, and activity duration) which is important for transport
and land use policy. Furthermore, knowledge of where individuals are during the various times of the
day is vital for emergency planning, disaster management or infrastructural services planning. While
emergency evacuation is often focussed on the residential areas, this might not be where people find
themselves exactly during the large parts of the day. Similarly, power (electricity) might be required in
the residential areas in the evenings but focussed on the retail and commercial areas during the day.
Such information can be very useful to electricity utility companies for example, when and where to
undertake load shedding.
Obtaining information on these daily rhythms has been difficult if not impossible. Daily urban rhythms
require, in addition to information on origin and destination of the main commute trip, information on all
activities undertaken during the day, their duration, location and sequence, time of departure and
arrival. This paper reports on a proof-of-concept study which tracked a sample of individuals over a
two day period making use of their personal cell phones. The overall aim of the research initiative was
to extract dynamic spatial intelligence including complete activity-travel patterns of individuals and
households and derive the collective daily urban rhythms for these individuals. Cell phones where
used to record location and temporal information for individuals in five-minute intervals (called a ping).
After cleaning and adding intelligence to the data, it was possible to extract a complete daily
time/space profile for each individual.
The outline of the paper is as follows. The following section, a brief overview is provided of daily
urban rhythms and data collection techniques. This is followed by a discussion of the methodology
and a small case study focussing on a descriptive analysis and presentation of urban rhythms without
ignoring issues such as accuracy and data quality.
2. Background and literature review
Traditionally, information on activity and travel behaviour is collected with a standard travel/activity
diary. However, these diaries (although they have definite advantages from other perspectives) only
capture static information on locations visited, modes used and in a limited number of cases, routes
chosen. While delivering valuable information, the data is insufficient to derive daily urban rhythms
and too outdated for adequate handling of emergencies. Location-Aware Technologies (LAT) and
more specifically cell phones provide a useful alternative (or rather a supplementary technological
solution) to address some of the problems associated with comprehensive data collection
requirements . These technologies may augment (or even replace) complex and cumbersome
travel/activity diaries which are difficult to administer, complete, and which require an accurate
recording of space-time trajectories. However, the uptake of these technologies by the transport
planning fraternity has been slow, with only a few studies in Europe, Japan and the USA and none in
the developing world being reported. The technology is of course a relatively new phenomenon and it
is really only in the last ten years or so that the technology has become established (Stopher, 2004;
Wermuth et al., 2004; Wolf, 2004).
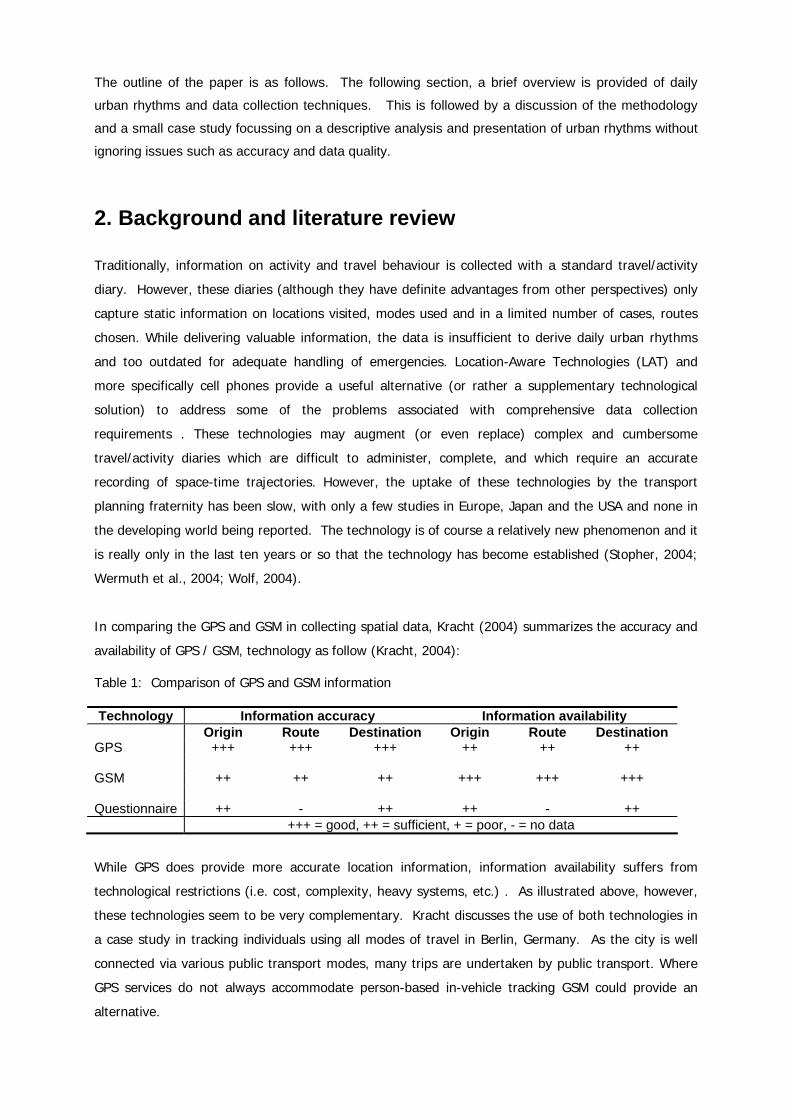
In comparing the GPS and GSM in collecting spatial data, Kracht (2004) summarizes the accuracy and
availability of GPS / GSM, technology as follow (Kracht, 2004):
Table 1: Comparison of GPS and GSM information
Technology Information accuracy Information availability Origin Route Destination Origin Route Destination GPS +++ +++ +++ ++ ++ ++ GSM ++ ++ ++ +++ +++ +++ Questionnaire ++ - ++ ++ - ++
+++ = good, ++ = sufficient, + = poor, - = no data
While GPS does provide more accurate location information, information availability suffers from
technological restrictions (i.e. cost, complexity, heavy systems, etc.) . As illustrated above, however,
these technologies seem to be very complementary. Kracht discusses the use of both technologies in
a case study in tracking individuals using all modes of travel in Berlin, Germany. As the city is well
connected via various public transport modes, many trips are undertaken by public transport. Where
GPS services do not always accommodate person-based in-vehicle tracking GSM could provide an
alternative.
The literature, while still sparse on the subject, does reveal that there are potentially many benefits to
using cell phones to collect travel behaviour, notably in a reduction in missing trips reporting,
improved accuracy in the reporting of trips and activities (time and space), better routing and speed
data, and the ability to capture longer periods of travel (Sharp and Murakami, 2004). The technology
also provides many benefits for respondents such as low input requirements and little (if any)
respondent burden (such as trying to recall activities/trips, etc.). The potential benefits of mobile
phones as compared to GPS was that (i) GPS is not always an unobstructed signal (i.e. in tunnels or
inner cities), especially when people are using public transport , (ii) the market penetration of mobile
phones is very high (with a very high potential), (iii) mobile phones are generally cheaper than GPS
and do not require additional cumbersome hardware. Other disadvantages of GPS involve the cost of
equipment and deployment, and the fact that data can only be downloaded after the survey.
Cell phones, however, also have some inherent problems in data collection, notably with regard to
pinpointing a location with accuracy. Complex positional algorithms supported by much additional data
requirements may be required to overcome this. Accuracy is very dependent on the density of base
stations and the quality of the signals in the study area. In urban areas with a higher density of base
stations, resolution can be up to 50 – 100 meters. In outlying areas, the accuracy may be
considerably less and in developed countries with fewer base stations, the positional data may be
rather poor.
In summary the literature revealed support for the potential usefulness of cellphones in obtaining
detailed activity and travel data in developed countries. While the technology potentially holds much
promise for use in developing countries, many technology and data quality issues still remain. This
proof-of-concept study was undertaken to address some of these issues.
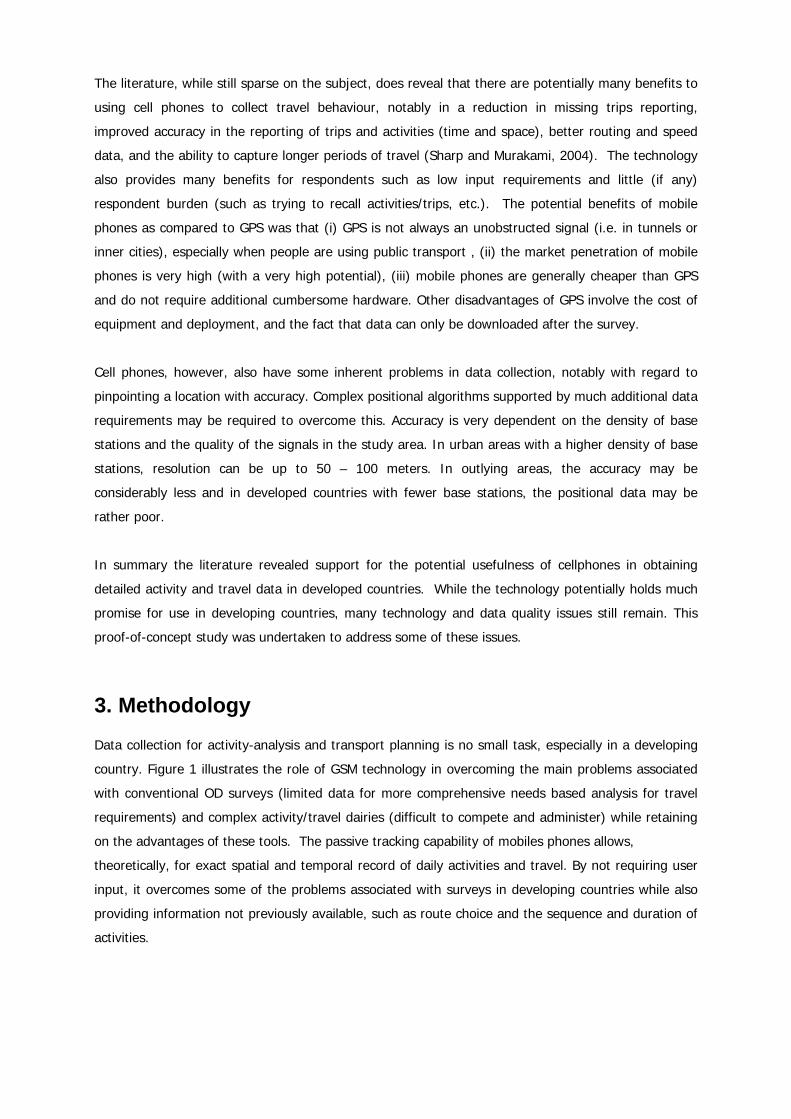
3. Methodology Data collection for activity-analysis and transport planning is no small task, especially in a developing
country. Figure 1 illustrates the role of GSM technology in overcoming the main problems associated
with conventional OD surveys (limited data for more comprehensive needs based analysis for travel
requirements) and complex activity/travel dairies (difficult to compete and administer) while retaining
on the advantages of these tools. The passive tracking capability of mobiles phones allows,
theoretically, for exact spatial and temporal record of daily activities and travel. By not requiring user
input, it overcomes some of the problems associated with surveys in developing countries while also
providing information not previously available, such as route choice and the sequence and duration of
activities.
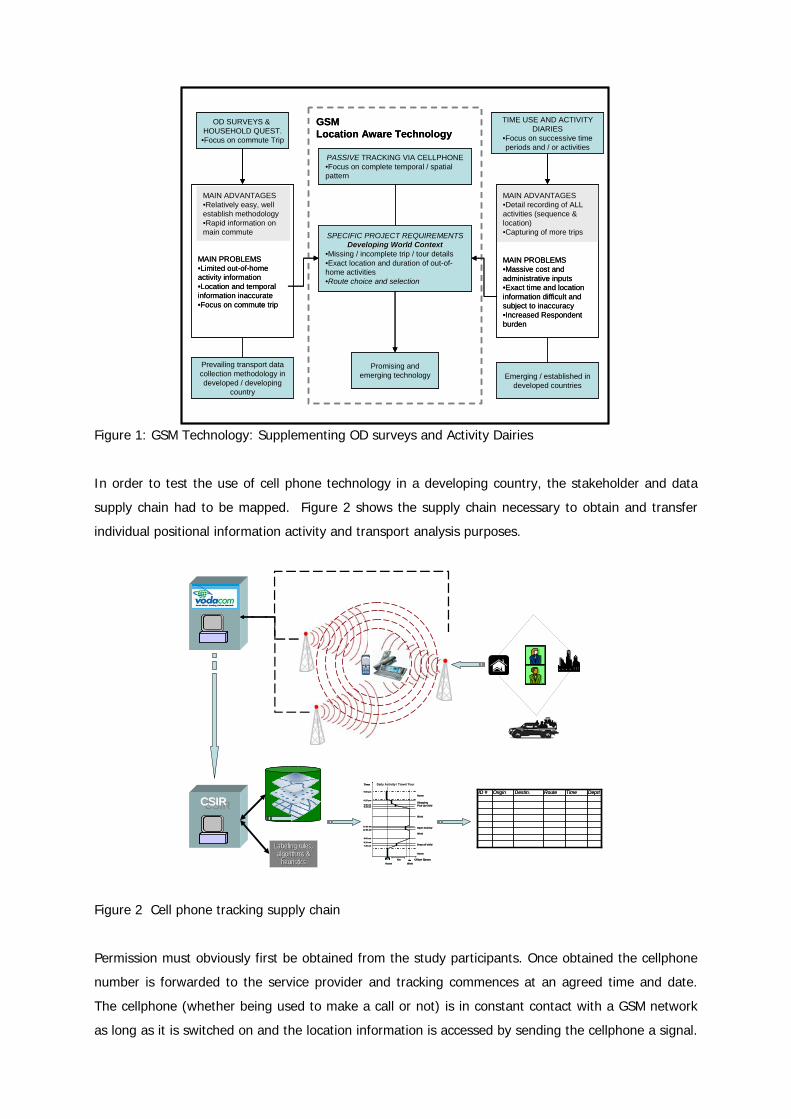
Figure 1: GSM Technology: Supplementing OD surveys and Activity Dairies
In order to test the use of cell phone technology in a developing country, the stakeholder and data
supply chain had to be mapped. Figure 2 shows the supply chain necessary to obtain and transfer
individual positional information activity and transport analysis purposes.
Labeling rules, Labeling rules, algorithms & algorithms &
heuristicsheuristics
12:00 pm12:30 am
9:00 pm
6:15 pm
KmKm
Time
Urban SpaceUrban Space
Daily Activity / Travel TourDaily Activity / Travel Tour
HomeHome WorkWork
9:00 am
5:30 am5:15 am
8:15 am7:45 am Drop off childDrop off child
Sport ActivitySport Activity
Pick Up ChildPick Up ChildShoppingShopping
HomeHome
HomeHome
WorkWork
WorkWork12:00 pm12:30 am
9:00 pm
6:15 pm
KmKm
Time
Urban SpaceUrban Space
Daily Activity / Travel TourDaily Activity / Travel Tour
HomeHome WorkWork
9:00 am
5:30 am5:15 am
8:15 am7:45 am Drop off childDrop off child
Sport ActivitySport Activity
Pick Up ChildPick Up ChildShoppingShopping
HomeHome
HomeHome
WorkWork
WorkWork
CSIRCSIRCSIRCSIRDeprtTimeRouteDestin.OriginID # DeprtTimeRouteDestin.OriginID #
Figure 2 Cell phone tracking supply chain
Permission must obviously first be obtained from the study participants. Once obtained the cellphone
number is forwarded to the service provider and tracking commences at an agreed time and date.
The cellphone (whether being used to make a call or not) is in constant contact with a GSM network
as long as it is switched on and the location information is accessed by sending the cellphone a signal.
GSM Location Aware Technology
OD SURVEYS & HOUSEHOLD QUEST.•Focus on commute Trip
MAIN ADVANTAGES•Relatively easy, well establish methodology•Rapid information on main commute
MAIN PROBLEMS•Limited out-of-home activity information•Location and temporal information inaccurate•Focus on commute trip
Prevailing transport data collection methodology in developed / developing
country
Emerging / established in developed countries
TIME USE AND ACTIVITY DIARIES
•Focus on successive time periods and / or activities
MAIN ADVANTAGES•Detail recording of ALL activities (sequence & location)•Capturing of more trips
MAIN PROBLEMS•Massive cost and administrative inputs•Exact time and location information difficult and subject to inaccuracy•Increased Respondent burden
PASSIVE TRACKING VIA CELLPHONE•Focus on complete temporal / spatial pattern
SPECIFIC PROJECT REQUIREMENTSDeveloping World ContextDeveloping World Context
•Missing / incomplete trip / tour details•Exact location and duration of out-of-home activities•Route choice and selection
Promising and emerging technology
The service provider (or partner application provider) receives the information and adds geographic
coordinates and time stamps. Positional accuracy (at a first level) is provided by the ‘catchment’
radius of the cellphone towers (which may be divided into segments). The information is subsequently
transferred to a processing unit which adds contextual information to the data and ‘interrogates” the
raw data with labelling algorithms and cleaning rules. A daily activity-travel path is derived and data
useful for applications, such as transport planning, is then extracted.
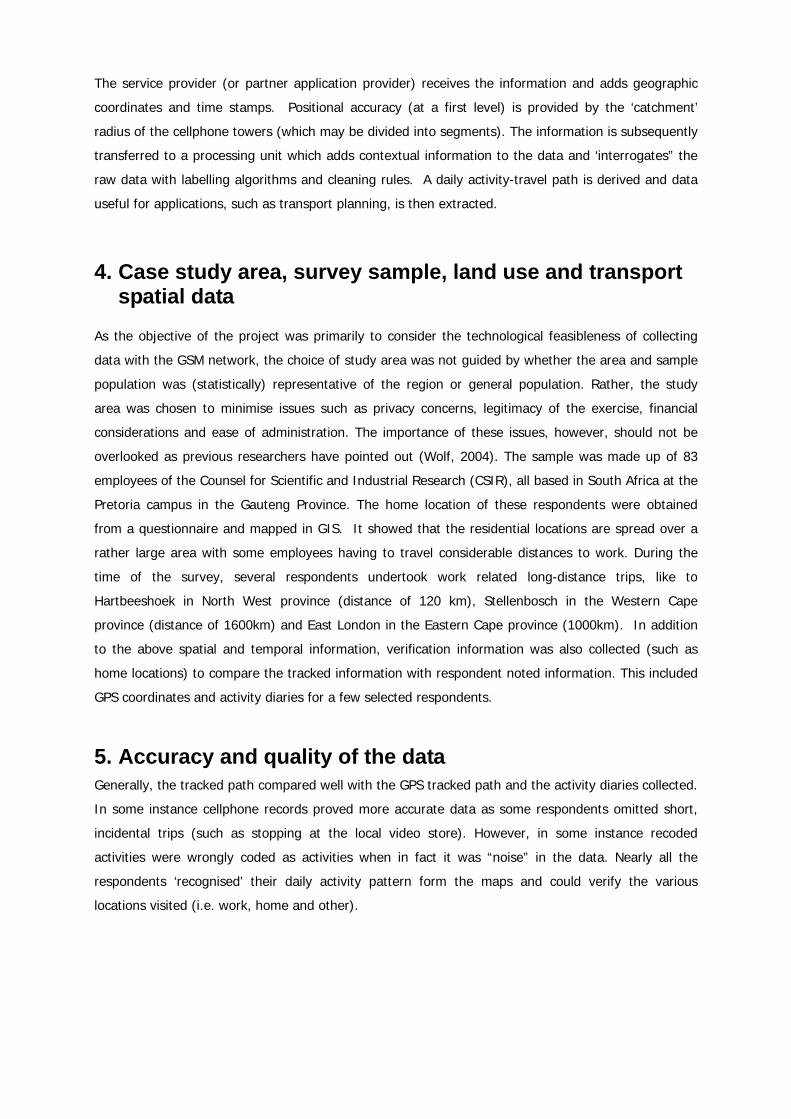
4. Case study area, survey sample, land use and transport spatial data
As the objective of the project was primarily to consider the technological feasibleness of collecting
data with the GSM network, the choice of study area was not guided by whether the area and sample
population was (statistically) representative of the region or general population. Rather, the study
area was chosen to minimise issues such as privacy concerns, legitimacy of the exercise, financial
considerations and ease of administration. The importance of these issues, however, should not be
overlooked as previous researchers have pointed out (Wolf, 2004). The sample was made up of 83
employees of the Counsel for Scientific and Industrial Research (CSIR), all based in South Africa at the
Pretoria campus in the Gauteng Province. The home location of these respondents were obtained
from a questionnaire and mapped in GIS. It showed that the residential locations are spread over a
rather large area with some employees having to travel considerable distances to work. During the
time of the survey, several respondents undertook work related long-distance trips, like to
Hartbeeshoek in North West province (distance of 120 km), Stellenbosch in the Western Cape
province (distance of 1600km) and East London in the Eastern Cape province (1000km). In addition
to the above spatial and temporal information, verification information was also collected (such as
home locations) to compare the tracked information with respondent noted information. This included
GPS coordinates and activity diaries for a few selected respondents.
5. Accuracy and quality of the data Generally, the tracked path compared well with the GPS tracked path and the activity diaries collected.
In some instance cellphone records proved more accurate data as some respondents omitted short,
incidental trips (such as stopping at the local video store). However, in some instance recoded
activities were wrongly coded as activities when in fact it was “noise” in the data. Nearly all the
respondents ‘recognised’ their daily activity pattern form the maps and could verify the various
locations visited (i.e. work, home and other).

Figure 3 compares the cellphone tracked records with a activity/travel dairy of a respondent. In this
instance the match between the two is very high with even a short incidental stop on the way to
home (i.e. a short 5-minute stop at the post office) capture and recorded as an ‘Other Activity’.
Figure 3 also shows two ‘noise’ locations in the data. These can be relatively easily cleaned, other
inaccuracies are harder to fix, but have relatively little effect on the overall picture.
Figure 3 Interpreted temporal / spatial path for four respondents
Apart from the above mentioned noise where a cell phone is suddenly and usually only for a very
short period picked up a relatively far removed tower, two more types of inaccuracies can be
distinguished:
Activity
Other activity
Work
Home
Travel
-2560000028500000
2
Hours
5
7
10
12
-25700000
14
28400000
17
19
22
24
-25800000
LatitudeLongitude
28300000 -2590000028200000 -26000000
Woman, part time working, 2 children
Activity
Other activity
Work
Home
Travel
-2560000028600000
2
Hours
5
7
10
12
28500000
14
-25700000
17
19
22
24
28400000
lLatitudelLongitude
-2580000028300000 -2590000028200000
Woman, 7 H/h members
Activity
Other activity
Work
Home
Travel
-2560000028500000
Hours
257
1012
28400000
14
-25700000
17192224
28300000
LatitudeLongitude
-2580000028200000 -2590000028100000
Activity
Other activity
Work
Home
Travel
-2550000028500000
2
Hours
5
7
10
28400000
12
-25600000
14
17
19
22
28300000
24
-25700000
LatitudeLongitude
28200000 -2580000028100000 -2590000028000000
Man, married, 2 children Man, single, no children
Activity
Other activity
Work
Home
Travel
-2560000028500000
2
Hours
5
7
10
12
-25700000
14
28400000
17
19
22
24
-25800000
LatitudeLongitude
28300000 -2590000028200000 -26000000
Woman, part time working, 2 children
Activity
Other activity
Work
Home
Travel
-2560000028600000
2
Hours
5
7
10
12
28500000
14
-25700000
17
19
22
24
28400000
lLatitudelLongitude
-2580000028300000 -2590000028200000
Woman, 7 H/h members
Activity
Other activity
Work
Home
Travel
-2560000028500000
Hours
257
1012
28400000
14
-25700000
17192224
28300000
LatitudeLongitude
-2580000028200000 -2590000028100000
Activity
Other activity
Work
Home
Travel
-2550000028500000
2
Hours
5
7
10
28400000
12
-25600000
14
17
19
22
28300000
24
-25700000
LatitudeLongitude
28200000 -2580000028100000 -2590000028000000
Man, married, 2 children Man, single, no children
Activities
Other activity
Work
Home
Travel
-2560000028500000
2
Hours
5
7
10
12
28400000
14
17
19
22
-25700000
24
28300000
LatitudeLongitude
28200000 -2580000028100000
Depart post office workDepart post office work
14:10 pm
14:21 am
21:17 pm
21:13 pm
8:36 am
21:12 am
21:00 am
7:36 am
7:03am Left homeLeft home
Dep. Dep. ToitsToits MotorsMotors
Arrive homeArrive home
Dept homeDept homeArrive ShoppingArrive Shopping
Arrive WorkArrive Work
Arrive Arrive ToitsToits motorsmotors8:46 am
17:35 pm
17:41 pm
17:30 pm
15:44 am
15:08 am
Dept. workDept. workArrive shopping centreArrive shopping centre
Dept. ShoppingDept. Shopping
Arrive workArrive work
Arrive / depart shoppingArrive / depart shopping
Left STATS SALeft STATS SA
Arrive Stats SAArrive Stats SA
Dep. workDep. workArrive post officeArrive post office
Arrive homeArrive home
Dept. ShoppingDept. Shopping
Daily action space-Trade of space and time-Shopping in-between home and work
-(never away)
S
14:40 am14:59 am
15:19 am
17:05 pm
Cells can, especially in relatively sparsely populated areas, cover quite a large area which means that
the centre of the cell can be several kilometres removed from the actual position.
Due to atmospheric conditions signal strengths may vary slightly which can cause a stationary cell
phone to be frequently “handed over” between a small group of neighbouring towers, thereby
seemingly moving around in circles.
In this study we will further ignore these effects apart from removing the obvious noise, but a in
follow on study GPS measurements need to be included to properly assess the effects of all these
inaccuracies on results.
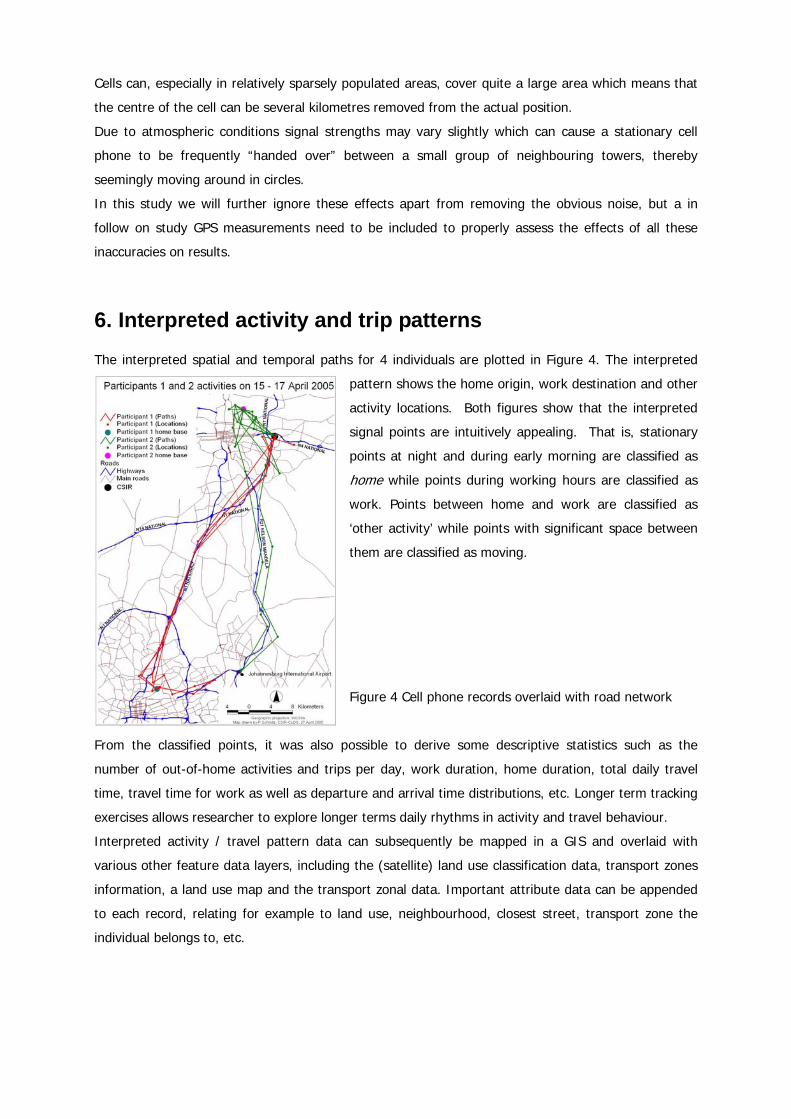
6. Interpreted activity and trip patterns The interpreted spatial and temporal paths for 4 individuals are plotted in Figure 4. The interpreted
pattern shows the home origin, work destination and other
activity locations. Both figures show that the interpreted
signal points are intuitively appealing. That is, stationary
points at night and during early morning are classified as
home while points during working hours are classified as
work. Points between home and work are classified as
‘other activity’ while points with significant space between
them are classified as moving.
Figure 4 Cell phone records overlaid with road network
From the classified points, it was also possible to derive some descriptive statistics such as the
number of out-of-home activities and trips per day, work duration, home duration, total daily travel
time, travel time for work as well as departure and arrival time distributions, etc. Longer term tracking
exercises allows researcher to explore longer terms daily rhythms in activity and travel behaviour.
Interpreted activity / travel pattern data can subsequently be mapped in a GIS and overlaid with
various other feature data layers, including the (satellite) land use classification data, transport zones
information, a land use map and the transport zonal data. Important attribute data can be appended
to each record, relating for example to land use, neighbourhood, closest street, transport zone the
individual belongs to, etc.
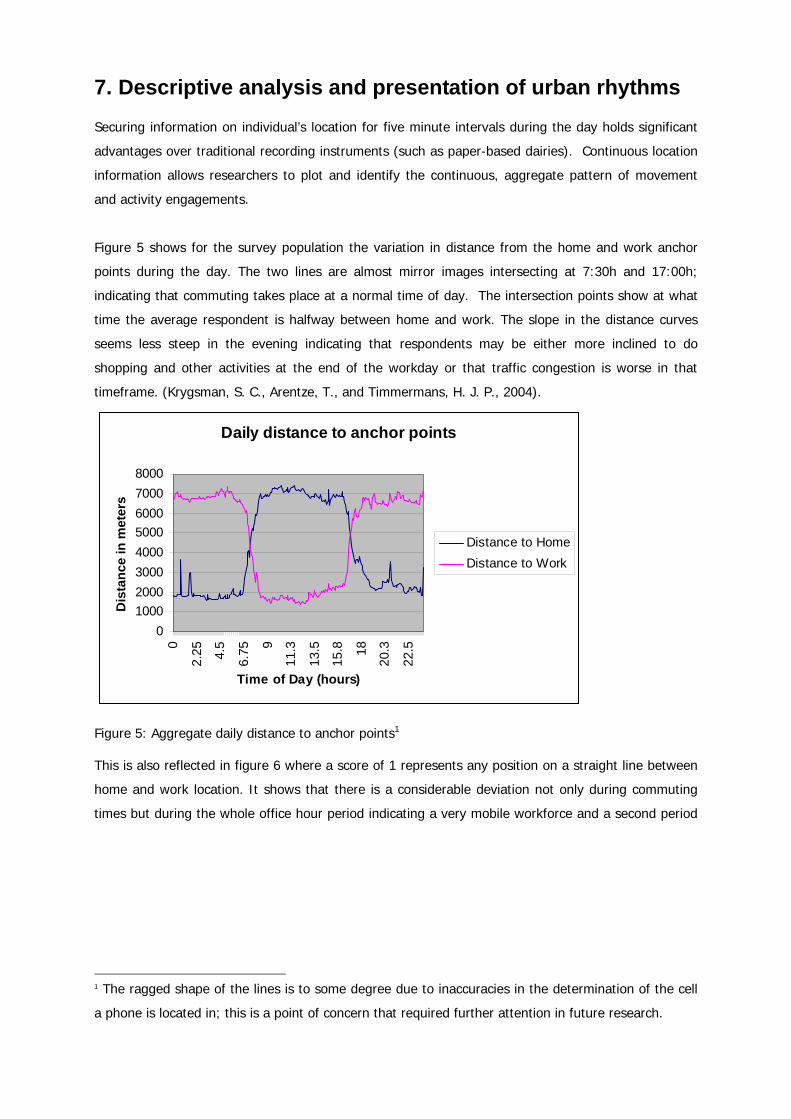
7. Descriptive analysis and presentation of urban rhythms Securing information on individual’s location for five minute intervals during the day holds significant
advantages over traditional recording instruments (such as paper-based dairies). Continuous location
information allows researchers to plot and identify the continuous, aggregate pattern of movement
and activity engagements.
Figure 5 shows for the survey population the variation in distance from the home and work anchor
points during the day. The two lines are almost mirror images intersecting at 7:30h and 17:00h;
indicating that commuting takes place at a normal time of day. The intersection points show at what
time the average respondent is halfway between home and work. The slope in the distance curves
seems less steep in the evening indicating that respondents may be either more inclined to do
shopping and other activities at the end of the workday or that traffic congestion is worse in that
timeframe. (Krygsman, S. C., Arentze, T., and Timmermans, H. J. P., 2004).
Daily distance to anchor points
010002000300040005000600070008000
0
2.25 4.5
6.75 9
11.3
13.5
15.8 18
20.3
22.5
Time of Day (hours)
Dis
tanc
e in
met
ers
Distance to HomeDistance to Work
Figure 5: Aggregate daily distance to anchor points1
This is also reflected in figure 6 where a score of 1 represents any position on a straight line between
home and work location. It shows that there is a considerable deviation not only during commuting
times but during the whole office hour period indicating a very mobile workforce and a second period
1 The ragged shape of the lines is to some degree due to inaccuracies in the determination of the cell
a phone is located in; this is a point of concern that required further attention in future research.
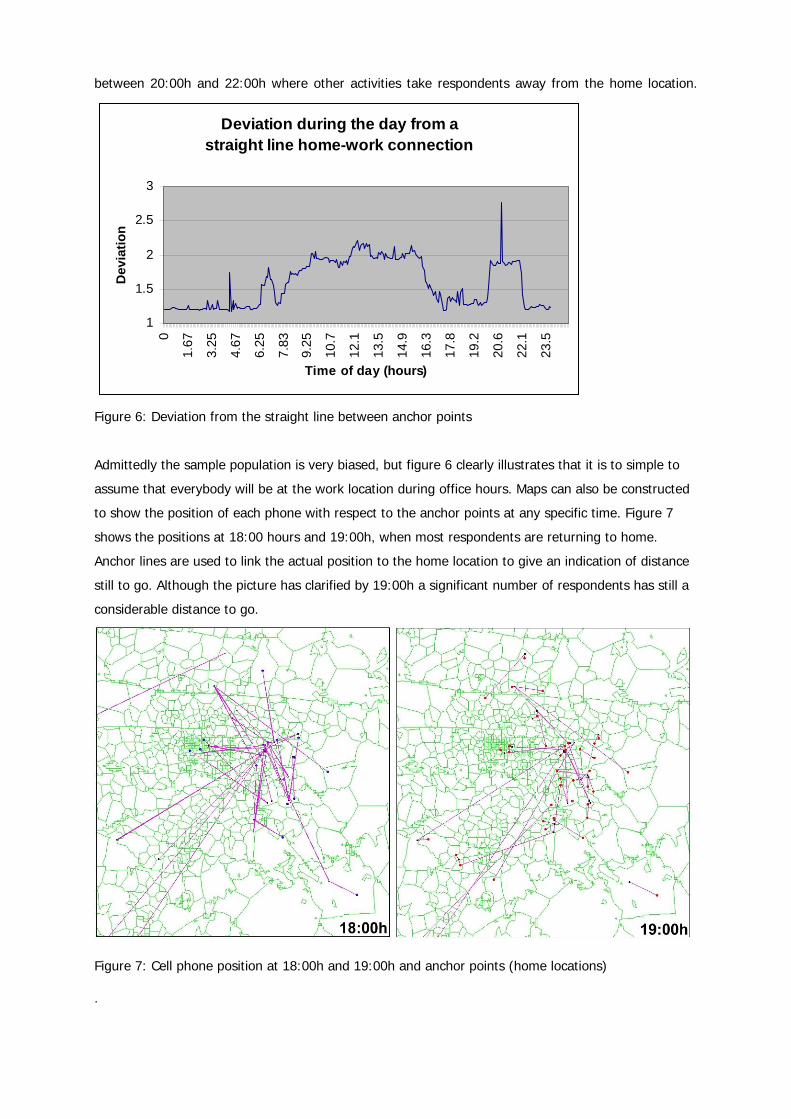
between 20:00h and 22:00h where other activities take respondents away from the home location.
Deviation during the day from a straight line home-work connection
1
1.5
2
2.5
3
0
1.67
3.25
4.67
6.25
7.83
9.25
10.7
12.1
13.5
14.9
16.3
17.8
19.2
20.6
22.1
23.5
Time of day (hours)
Dev
iatio
n
Figure 6: Deviation from the straight line between anchor points
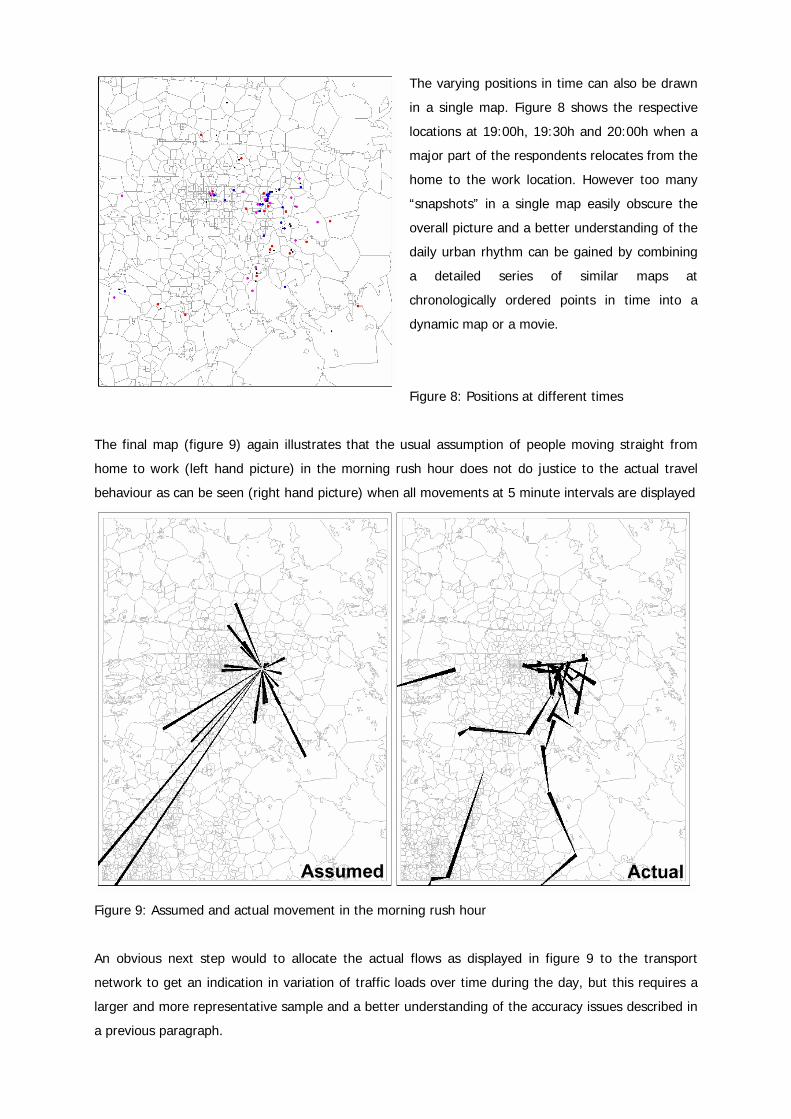
Admittedly the sample population is very biased, but figure 6 clearly illustrates that it is to simple to
assume that everybody will be at the work location during office hours. Maps can also be constructed
to show the position of each phone with respect to the anchor points at any specific time. Figure 7
shows the positions at 18:00 hours and 19:00h, when most respondents are returning to home.
Anchor lines are used to link the actual position to the home location to give an indication of distance
still to go. Although the picture has clarified by 19:00h a significant number of respondents has still a
considerable distance to go.
Figure 7: Cell phone position at 18:00h and 19:00h and anchor points (home locations)
.
The varying positions in time can also be drawn
in a single map. Figure 8 shows the respective
locations at 19:00h, 19:30h and 20:00h when a
major part of the respondents relocates from the
home to the work location. However too many
“snapshots” in a single map easily obscure the
overall picture and a better understanding of the
daily urban rhythm can be gained by combining
a detailed series of similar maps at
chronologically ordered points in time into a
dynamic map or a movie.
Figure 8: Positions at different times
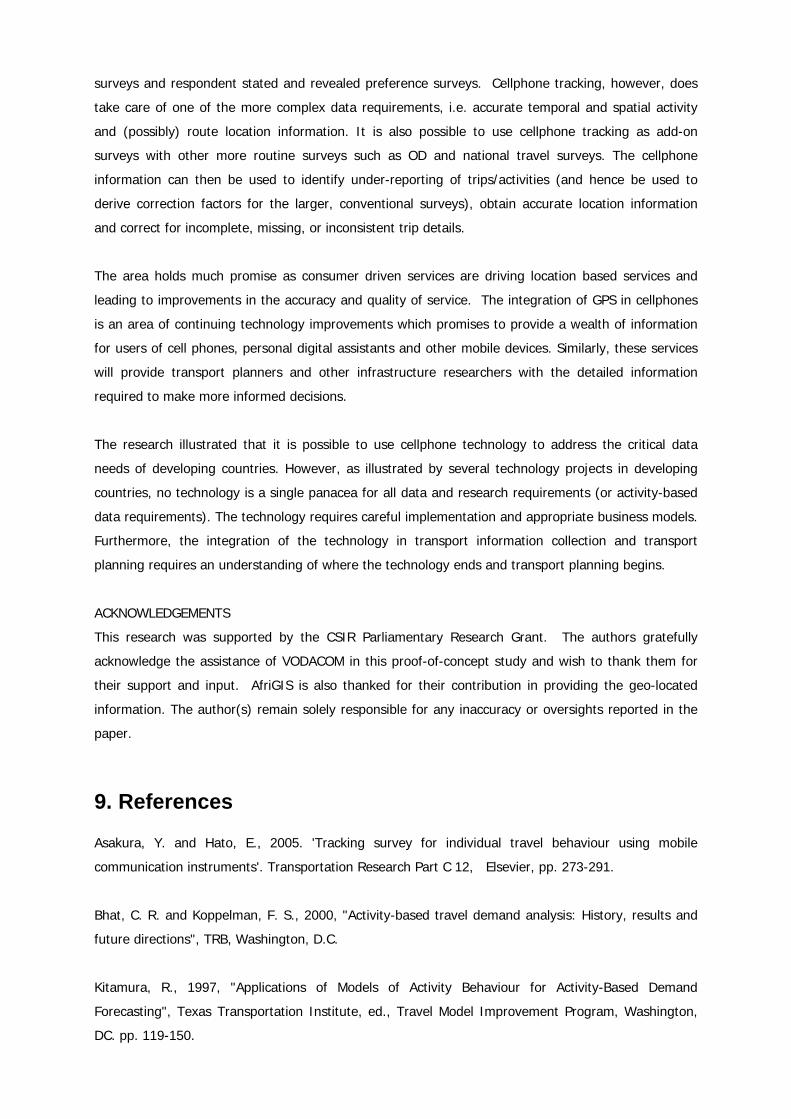
The final map (figure 9) again illustrates that the usual assumption of people moving straight from
home to work (left hand picture) in the morning rush hour does not do justice to the actual travel
behaviour as can be seen (right hand picture) when all movements at 5 minute intervals are displayed
Figure 9: Assumed and actual movement in the morning rush hour
An obvious next step would to allocate the actual flows as displayed in figure 9 to the transport
network to get an indication in variation of traffic loads over time during the day, but this requires a
larger and more representative sample and a better understanding of the accuracy issues described in
a previous paragraph.

8. Concluding discussions and directions for future research
This paper presented the findings of a proof-of-concept study to obtain detailed information on
individuals’ daily travel and activity patterns using cellphone tracking. The proliferation and adoption
consumer devices such as GSM technology (and Assisted-GSM in the future) offers the opportunity to
leverage existing hardware and software already in the hands of study participants for collecting
detailed travel behaviour information and at the same time overcoming the well-known problems with
complex and burdensome activity-travel diaries, specifically in a developing country (Wolf, 2004).
The proof-of-concept study showed that it is possible to obtain individual-level travel behaviour data
from cellphones. However, while information such as the origin and destination of trips (and the
linking thereof to transport zones) can be ‘extracted’ from cellphone data without significant labour
and technological intervention, obtaining a more richer description of individuals’ entire daily activity
and travel patterns proved considerably more complex requiring (at least initially) much more
methodological innovation.
To extract detailed daily activity and travel patterns entailed a complex (iterative) process relying on
labelling rules and algorithms to clean, verify and ultimately transform the raw data to travel pattern
data. Applying the rules and algorithms to the data resulted in a very real activity and travel path for
each individual from which valuable relevant information (departure time, arrival time, activity
duration, activity sequencing, etc.) could be extracted for use in conventional transport modelling
studies and more advanced activity-based research.
While the exercise was generally a success, the researchers did experience some problems in cleaning
and labelling the raw data and several areas for further research are considered. These include
improving the cleaning and labelling rules and algorithms, improving location accuracy (though
triangulation and/or signal strength determination), allocating movement points to routes and
integrating the data with various other contextual layers.
Furthermore, a need was also identified to replicate the exercise with larger and preferably a
randomly drawn sample with a variety of work destinations. In addition, it is recommended that
cellphone tracking is undertaken together with more conventional household surveys (to verify the
tracked information and inform the rules and algorithmes). Information on home and work locations
and other daily activity engagements can be used to verify the tracking data and provide information
on individual socio-demographic characteristics not available via cellphone tracking.
Cellphone data collected by way of passive tracking only provides locational and temporal data. When
used in transport and land use studies, the data should still be supplemented with GIS layers of land
use and other spatial features. Depending on the application (e.g. retail services, transport, logistics)
cellphone data will have to be supplemented with additional data, such as home interviews, telephone
surveys and respondent stated and revealed preference surveys. Cellphone tracking, however, does
take care of one of the more complex data requirements, i.e. accurate temporal and spatial activity
and (possibly) route location information. It is also possible to use cellphone tracking as add-on
surveys with other more routine surveys such as OD and national travel surveys. The cellphone
information can then be used to identify under-reporting of trips/activities (and hence be used to
derive correction factors for the larger, conventional surveys), obtain accurate location information
and correct for incomplete, missing, or inconsistent trip details.
The area holds much promise as consumer driven services are driving location based services and
leading to improvements in the accuracy and quality of service. The integration of GPS in cellphones
is an area of continuing technology improvements which promises to provide a wealth of information
for users of cell phones, personal digital assistants and other mobile devices. Similarly, these services
will provide transport planners and other infrastructure researchers with the detailed information
required to make more informed decisions.
The research illustrated that it is possible to use cellphone technology to address the critical data
needs of developing countries. However, as illustrated by several technology projects in developing
countries, no technology is a single panacea for all data and research requirements (or activity-based
data requirements). The technology requires careful implementation and appropriate business models.
Furthermore, the integration of the technology in transport information collection and transport
planning requires an understanding of where the technology ends and transport planning begins.
ACKNOWLEDGEMENTS
This research was supported by the CSIR Parliamentary Research Grant. The authors gratefully
acknowledge the assistance of VODACOM in this proof-of-concept study and wish to thank them for
their support and input. AfriGIS is also thanked for their contribution in providing the geo-located
information. The author(s) remain solely responsible for any inaccuracy or oversights reported in the
paper.
9. References Asakura, Y. and Hato, E., 2005. 'Tracking survey for individual travel behaviour using mobile
communication instruments'. Transportation Research Part C 12, Elsevier, pp. 273-291.
Bhat, C. R. and Koppelman, F. S., 2000, "Activity-based travel demand analysis: History, results and
future directions", TRB, Washington, D.C.
Kitamura, R., 1997, "Applications of Models of Activity Behaviour for Activity-Based Demand
Forecasting", Texas Transportation Institute, ed., Travel Model Improvement Program, Washington,
DC. pp. 119-150.
Kracht, M., "Tracking and interviewing individuals with GPS and GSM technology on mobile electronic
devices", Seventh International Conference on Travel Survey Methods, Costa Rica.
Pas, E. I., 1990, "Is Travel Demand Analysis and Modelling in the Doldrums?," In Developments in
dynamic and activity-based approaches to travel analysis, Avebury Grower Publishing Company, pp. 3-
33.
Pas, E. I., 1995, "The Urban Transport Planning Process," In The Geography of Urban Transportation,
2 edn, S. Hanson, ed., The Guildford Press, New York, pp. 53-77.
Pipkin, J. S., 1986, "Disaggregate Travel Models," In The Geography of Urban Transportation, S.
Hanson, ed., The Guilford Press, New York.
Sharp, J. and Murakami, E., 4 A.D., "Travel Survey Methods and Technologies Resource Paper",
NATIONAL HOUSEHOLD TRAVEL SURVEY CONFERENCE: Understanding Our Nation's Travel,
Transportation Research Board, Washington, DC.
Stopher, P., 2004, "GPS, Location, and Household Travel," In Handbook of Geography and Spatial
System, 1 edn, D. A. Hensher et al., eds., Elsevier, Oxford, pp. 433-449.
Timmermans, H. J. P., 2000, "Theories and models of activity patterns," In Albatros: A Learning-Based
transportation Oriented Simulation System, European Institute of Retailing and Services Studies
(EIRASS), Eindhoven, pp. 6-70.
Wermuth, M., Sommer, C. and Kreitz, M., 2004, "Impact of new technologies in travel surveys," In
Transport Survey Quality and Innovation, P. Stopher & P. Jones, eds., Pergamon, Oxford, pp. 455-
482.
Wolf, J., "Applications of new technologies in travel surveys", August 2004, International Conference
on Transport Survey Quality and Innovation, Costa Rica.