capacity utilization, quality of tea and returns to ktda - UoN ...
68
CAPACITY UTILIZATION, QUALITY OF TEA AND RETURNS TO KTDA FACTORIES IN KENYA BY CHARLES MATHENGE MUCHEKE D61/63199/2010 A RESEARCH PROJECT SUMMITTED IN PARTIAL FULFILMENT OF THE REQUIREMENTS FOR THE AWARD OF THE DEGREE OF MASTER OF BUSINESS ADMINISTRATION, SCHOOL OF BUSINESS, UNIVERSITY OF NAIROBI, OCTOBER 2015
-
Upload
khangminh22 -
Category
Documents
-
view
1 -
download
0
Transcript of capacity utilization, quality of tea and returns to ktda - UoN ...
CAPACITY UTILIZATION, QUALITY OF TEA AND RETURNS TO KTDA
FACTORIES IN KENYA
BY
CHARLES MATHENGE MUCHEKE
D61/63199/2010
A RESEARCH PROJECT SUMMITTED IN PARTIAL FULFILMENT OF THE
REQUIREMENTS FOR THE AWARD OF THE DEGREE OF MASTER OF
BUSINESS ADMINISTRATION, SCHOOL OF BUSINESS, UNIVERSITY OF
NAIROBI,
OCTOBER 2015
ii
DECLARATION
I, the undersigned, declare that this research project is my original work and that it has not
been presented in any other University or Institution for academic purposes.
Signature……………………………………… Date……………………..
Name: Mucheke Charles Mathenge
Reg. No. D61/63199/2010
This research project has been submitted for examination with my approval as the
University Supervisor.
Signature…………………………………………Date……………….
Dr. X. N. Iraki
Senior Lecturer
University of Nairobi

iii
ACKNOWLEDGEMENT
Thanks to the Almighty God for the opportunity and His blessings that made this work a
reality. My special appreciations go to my Supervisors, Dr. X.N Iraki, Dr. Akello from the
School of Business, University of Nairobi for their guidance and support throughout the
project. I also wish to thank all my other Lectures from the University of Nairobi who took
me through the MBA course work, my colleagues for their contribution and moral support.
I thank KTDA, the Regional and Factory Unit managers for their support when collecting
the data. Finally my thanks go to my family, my bother Wahome, my dad Mucheke, my
uncle P.M.Njagira and my cousin Wakonyu who have always stood by me during the entire
period when I was doing the project and the entire period when I was taking the course.
God bless you all.

iv
DEDICATION
I dedicate this research project to my family, Waruguru my wife, Wambui my daughter,
Mukinyi and Mucheke, my sons and my parents Mucheke and Wambui for their love and
sacrifice for me.
v
TABLE OF CONTENTS
DECLARATION.............................................................................................................. ii
TABLE OF CONTENTS ................................................................................................ v
LIST OF TABLES ........................................................................................................ viii
LIST OF FIGURES ........................................................................................................ ix
LIST OF ABBREVIATIONS ......................................................................................... x
ABSTRACT .................................................................................................................... xii
CHAPTER ONE: INTRODUCTION ............................................................................ 1
1.1 Background of the Study ........................................................................................... 1
1.1.1 Capacity Utilization ............................................................................................ 2
1.1.2 Quality ................................................................................................................ 3
1.1.3 Returns ................................................................................................................ 5
1.1.4 Tea Industry in Kenya ........................................................................................ 5
1.2 Problem Statement .................................................................................................... 8
1.3 Research Objectives ................................................................................................ 10
1.4 Value of the Study ................................................................................................... 11
CHAPTER TWO: LITERATURE REVIEW ............................................................. 12
2.1 Introduction ............................................................................................................. 12
2.1.1 Tea Industry Structure in Kenya ................................................................. 12
2.1.2 Tea production ............................................................................................ 13
vi
2.1.3 Tea Marketing ............................................................................................. 14
2.2 Theoretical Review ................................................................................................. 17
2.2.1 Constraint Theory ............................................................................................. 17
2.2.2 Quality Theory .................................................................................................. 18
2.2.3 Theory of Diminishing Returns ........................................................................ 19
2.2.4 Economies and Diseconomies of Scale ............................................................ 19
2.3 Empirical Studies .................................................................................................... 19
2.4 Summary of literature Review ................................................................................ 22
2.5 Conceptual Framework ........................................................................................... 22
CHAPTER THREE: RESEARCH METHODOLOGY ............................................ 24
3.1 Introduction ............................................................................................................. 24
3.2 Research Design ...................................................................................................... 24
3.3 Target Population .................................................................................................... 24
3.4 Data Collection ........................................................................................................ 24
3.5 Data Analysis .......................................................................................................... 25
CHAPTER FOUR .......................................................................................................... 28
DATA ANALYSIS, RESULTS AND DISCUSSIONS ................................................ 28
4.1 Introduction ............................................................................................................. 28
4.2 Response Rate ......................................................................................................... 28
4.3 Correlation Analysis ................................................................................................ 31
vii
4.4 Regression Analysis ................................................................................................ 33
4.4.1 Model Summary ............................................................................................... 33
4.8 Summary and Interpretations of Findings ............................................................... 35
CHAPTER FIVE ........................................................................................................... 38
SUMMARY, CONCLUSIONS AND RECOMMENDATION.................................. 38
5.1 Introduction ............................................................................................................. 38
5.2 Summary of the Findings ........................................................................................ 38
5.3 Conclusions ........................................................................................................ 38
5.3 Policy recommendations ......................................................................................... 39
5.4 Limitations of the study........................................................................................... 40
5.5 Suggestions for further studies ................................................................................ 40
REFERENCES ............................................................................................................... 41
APPENDIXES ................................................................................................................ 44
Appendix I: Tea Growing Areas in Kenya.................................................................... 44
Appendix II: Tea industry Structure.............................................................................. 45
Appendix: III Ten Year (2004-2013) Production Figures in Million Kgs .................... 45
Appendix IV: Production of tea by major producing countries in 2012(million Kgs) . 46
Appendix V: Export of tea by major producing countries in 2012(million Kgs) ......... 46
Appendix VI: Data collection clearance letter from University of Nairobi .................. 47
Appendix VII: Data collection authority letter from KTDA......................................... 48
viii
Appendix VIII: Research Questionnaire ....................................................................... 49
Appendix IX: Raw data on variables ........................................................................... 55
LIST OF TABLES
Table 4.1: Descriptive Statistics ....................................................................................... 28
Table 4.2: Correlation Analysis ........................................................................................ 32
Table 4.3: Coefficient of Determinants ............................................................................ 34
Table 4.4: ANOVA Results .............................................................................................. 34
Table 4.5: Analysis of Coefficients .................................................................................. 35
ix
LIST OF FIGURES
Figure 2.1: Relationship between Variables. .................................................................... 23
Figure 4.2: Capacity utilization and quality ...................................................................... 30
Figure 4.3: Capacity utilization and returns ...................................................................... 30
Figure 4.4: Capacity utilization, returns and quality ......................................................... 31
x
LIST OF ABBREVIATIONS
AC Actual Capacity
AFFA: Agriculture, Fisheries and Food Authority
AO Actual Output
CTC Cut, Tear and Curl
CU Capacity Utilization
DC Designed Capacity
EATTA East African Tea Trade Association
EC Effective Utilization
FAO Food and Agriculture Organisation
GDP Gross Domestic Product
GOK Government of Kenya
IISD International Institute for Sustainable Development
ITC International Tea Council
KTDA Kenya Tea Development Agency Limited
KTGA Kenya Tea Growers Association
KNBS Kenya National Bureau of Statistics
KSH Kenya Shilling
NTZDC Nyayo Tea Zones Development Corporation
xi
TBK Tea Board of Kenya
TRFK Tea research Foundation of Kenya
UK United Kingdom
UON University of Nairobi
USD United States Dollar
xii
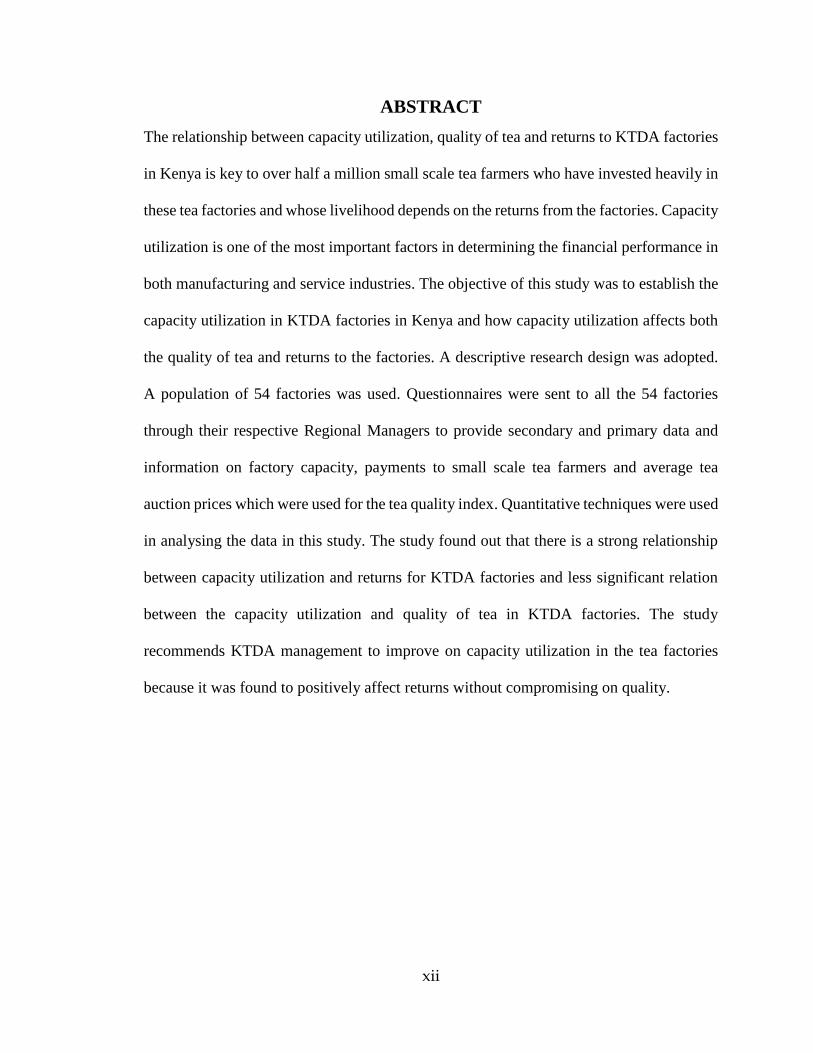
ABSTRACT
The relationship between capacity utilization, quality of tea and returns to KTDA factories
in Kenya is key to over half a million small scale tea farmers who have invested heavily in
these tea factories and whose livelihood depends on the returns from the factories. Capacity
utilization is one of the most important factors in determining the financial performance in
both manufacturing and service industries. The objective of this study was to establish the
capacity utilization in KTDA factories in Kenya and how capacity utilization affects both
the quality of tea and returns to the factories. A descriptive research design was adopted.
A population of 54 factories was used. Questionnaires were sent to all the 54 factories
through their respective Regional Managers to provide secondary and primary data and
information on factory capacity, payments to small scale tea farmers and average tea
auction prices which were used for the tea quality index. Quantitative techniques were used
in analysing the data in this study. The study found out that there is a strong relationship
between capacity utilization and returns for KTDA factories and less significant relation
between the capacity utilization and quality of tea in KTDA factories. The study
recommends KTDA management to improve on capacity utilization in the tea factories
because it was found to positively affect returns without compromising on quality.
1
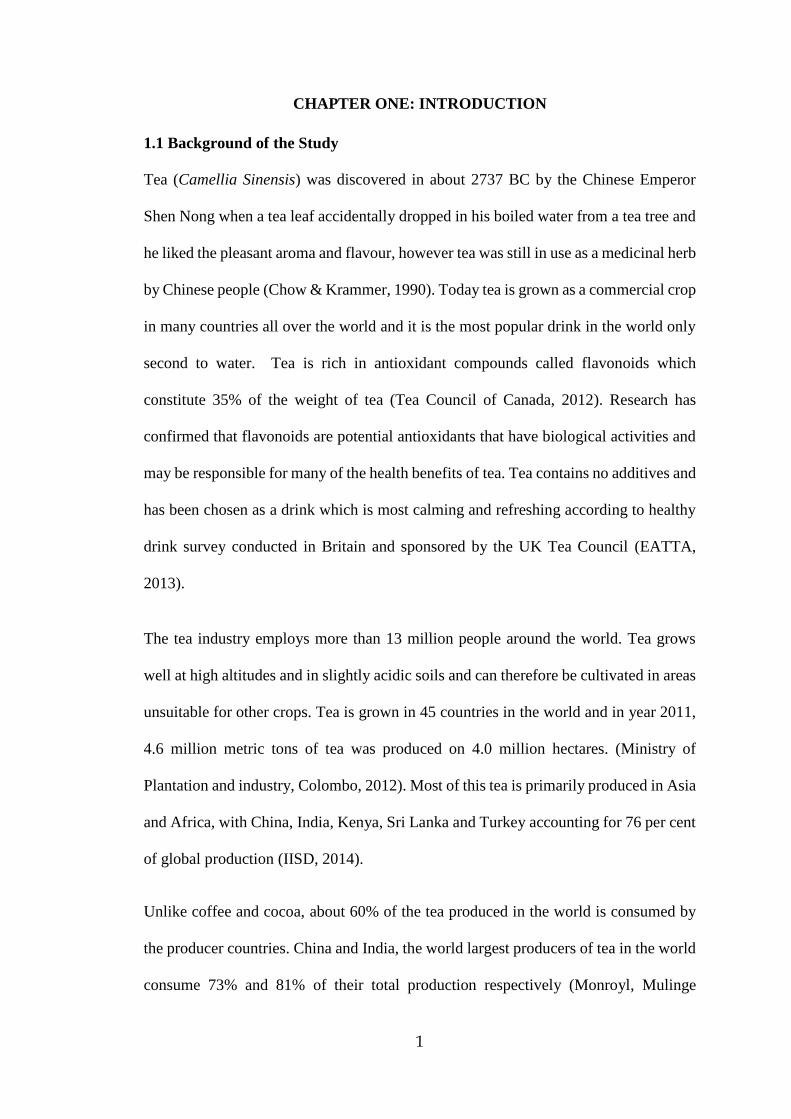
CHAPTER ONE: INTRODUCTION
1.1 Background of the Study
Tea (Camellia Sinensis) was discovered in about 2737 BC by the Chinese Emperor
Shen Nong when a tea leaf accidentally dropped in his boiled water from a tea tree and
he liked the pleasant aroma and flavour, however tea was still in use as a medicinal herb
by Chinese people (Chow & Krammer, 1990). Today tea is grown as a commercial crop
in many countries all over the world and it is the most popular drink in the world only
second to water. Tea is rich in antioxidant compounds called flavonoids which
constitute 35% of the weight of tea (Tea Council of Canada, 2012). Research has
confirmed that flavonoids are potential antioxidants that have biological activities and
may be responsible for many of the health benefits of tea. Tea contains no additives and
has been chosen as a drink which is most calming and refreshing according to healthy
drink survey conducted in Britain and sponsored by the UK Tea Council (EATTA,
2013).
The tea industry employs more than 13 million people around the world. Tea grows
well at high altitudes and in slightly acidic soils and can therefore be cultivated in areas
unsuitable for other crops. Tea is grown in 45 countries in the world and in year 2011,
4.6 million metric tons of tea was produced on 4.0 million hectares. (Ministry of
Plantation and industry, Colombo, 2012). Most of this tea is primarily produced in Asia
and Africa, with China, India, Kenya, Sri Lanka and Turkey accounting for 76 per cent
of global production (IISD, 2014).
Unlike coffee and cocoa, about 60% of the tea produced in the world is consumed by
the producer countries. China and India, the world largest producers of tea in the world
consume 73% and 81% of their total production respectively (Monroyl, Mulinge
2
&Witwer, 2012). Nevertheless, a lot of tea is exported annually. In the year 2011 for
example, 44 per cent of global production worth US$6.6 billion was destined for export
(Food and Agriculture Organization of the United Nations (FAO), 2013).
About one-quarter of trade is destined for Russia, the United States and the United
Kingdom (FAO, 2013). About 85% of global tea production is sold by multinationals,
three of which control about 20% of the market: Unilever (>12%), which is also the
biggest tea multinational in Kenya, Tata Global Beverages (>4%), and Twinings (>3%)
(IISD report, 2014). Consequently, small tea farmers have little influence over the tea
trade.
1.1.1 Capacity Utilization
Capacity is the maximum output rate of a facility. Designed capacity is the maximum
output rate of a facility under ideal conditions while effective capacity is the maximum
output rate of a facility under normal (realistic) conditions. According to Iraki (2013),
capacity utilization can make all the difference between economic progress and poverty
because there is a lot of idle capacity in all nations including the developed world like
America. It is an important measure of production efficiency in comparison with the
set targets, past achievements, and an indicator of economic performance. Capacity is
very important but least understood concept in manufacturing and business world. It is
measured differently depending on category of business and the level of value chain.
For example, some financial managers might measure plant capacity in terms of the
equipment installed in the plant while operational supervisors might measure capacity
in terms of worker efficiency. Ragon (1976) defined an organization’s productive
capacity as the total level of output or production that the organization could produce
in a given time period. Capacity utilization is the percentage of the firm’s total possible
production capacity that is being used. Therefore, an organization should be most
3
efficient if it is running at 100% capacity utilization. An organization’s full capacity is
the minimum point on total cost function, a full input point on the aggregate production
function and a bottleneck point in a general equilibrium system.
Mathematically, capacity utilization is the actual output expressed as a percentage of
potential output or designed capacity. (CU=AO/DC %), where CU is capacity
utilization, AO is actual output while DC is the designed capacity. The Federal Reserve
Board and U.S. Census Bureau’s gives capacity utilization (CU) a figure of less than or
equal to 1.0 or 100%. If CU = 1.0, the production entity is operating at maximum
capacity utilization. A value of CU > 1.0 implies that there is a shortage of capacity
relative to demand and CU<1 implies there is excess capacity (Kirland, Walden
&Ward, 1999). However in real life situations, it is very difficult to achieve 100%
capacity utilization due to factors limiting production. The decision on what capacity
to install should be informed by capacity analysis based on the firm’s future demands.
Utilization of full capacity in the tea industry is challenging given the fact that the
production of green leaf (raw material for tea) is seasonal and weather dependant.
However, a lot need to be done to improve the capacity utilization at tea factories in
order to reduce the cost of production and improve returns. The main focus of this
research was on the capacity utilization at the tea factories and how it affects quality of
tea and the returns to the factories. This will help the factory management to improve
on utilization of the already existing factory capacity and formulation of policies that
guide on future capacity expansions.
1.1.2 Quality
Quality has been described in many various ways but quality in a business sense is
meeting and/or exceeding the customer’s expectations. This refers to both products and
4
service (Zeithaml & Bitner, 1990). This was also supported by a research done by
Pheri& Mcwabe (2013) printed in international journal of research and social science.
Quality has been described as fitness for purpose or freedom from deficiencies (Juran,
1988). It has also been described as the total composite product and service
characteristics of marketing, engineering, manufacturing and maintenance through
which the product and service in use will meet the expectations by the consumer
(Feigenbaum, 1983).
In the past, quality was thought to mean a focus on doing the repeatable things well
(Miller & Pearce, 1988). It suggested predictability and reliability and was applied
almost exclusively to the manufacturing environment. Further, it emphasized only
incremental improvements, building on what was already in place, improving
repeatability, refining and perfecting the existing process. These definitions, although
trying to define the word quality, are all inherently different. It is therefore necessary
to consider International Standards Organization (ISO, 1986) Standard 8402-1986 in
order to standardize the definition. ISO in 1986 attempted to rationalize the range of
opinions on quality issue by releasing its first quality standard. This standard defines
quality as "the totality of features and characteristics of a product or service that bear
on its ability to satisfy stated or implied needs.
In the tea industry, the prices of tea in the international tea auctions are primarily based
on the quality of tea on offer and the prices are therefore a very strong indicator of tea
quality. The tea buyer at the auction gives the highest bid based on that which he
considers “fit for purpose”. Every tea producer or factory is therefore constantly trying
to improve and offer the quality demanded by the market and that which will meet and
exceed the customer’s expectations. In this research therefore, the auction tea prices
will be used as the measure for quality.
5
1.1.3 Returns
Return is used as a measure of business performance. There are several ways of
measuring financial performance but one of the most popular method is the use of
internal rate of return (IRR). The main interest of an investor is how much income he
will get from his investment within a given period of time. IRR is expressed as a
percentage and in financial terms, rate of return means profit derived from an
investment. The purpose of calculating the rate of return on investment is to measure
the financial performance, assess the desirability of a project and make a decision on
valuation of firms. Rate of returns indicators are important for monitoring the economic
performance of both public listed corporations and government enterprises (Feenstra &
Wang, 2000). In this research the term return is used in the context of the benefit
distributed to the owner of a factor of production. In the case of the KTDA factories,
the return is given to the small scale tea farmer who is a shareholder of the factory and
supplies the raw material for tea manufacture.
1.1.4 Tea Industry in Kenya
Tea is a perennial crop, which is grown for its leaves that are processed to make tea for
preparing beverages. A European settler Mr.G.W.L.Caine introduced tea into Kenya
from India in 1903.The first tea bushes have now grown into large trees, forming a
historic feature on what is now Unilever’s Mabroukie Tea Estate. Tea was exclusively
grown in estates by the private companies, which were owned by the white settlers who
started commercial tea farming in 1930’s. Small-scale tea farming was started as a pilot
scheme in 1954 in Nyeri and Kericho districts. In 1961, it was declared a special crop
under section 191 of agriculture Act (Cap318) and was placed under the management
of Special Crops Development Authority (SCDA) in the same year. The Special Crops
Development Authority (SCDA) was established under the Agriculture Act in 1960 to
6
promote the cultivation of cash crops including tea. In 1964, the Kenyan Tea
Development Order was promulgated to form Kenya Tea Development Authority
(KTDA), a government parastatal, to promote smallholder tea growers in the processing
and marketing of tea.
In the year 2000, the industry was fully liberalized to promote efficiency and
competitiveness as well as to attract private sector investment and grower participation
in factory ownership and management. Kenya Tea Development Authority was
therefore transformed into Kenya Tea Development Agency, a private company. The
ownership of the smallholder factories was transferred to the small-scale growers under
the management of their own managing agent, KTDA.
Tea is produced in high altitude areas ranging from 1500 and 2700 m above the sea
level where rainfall ranges between 1200mm and 2700 mm annually with long sunny
intervals and well-drained soils. Suitable temperature for tea growth ranges from
minimum 120C to a maximum of 280
C and a soil PH range of between 4.5 and 6.5
beyond which the tea is retarded(TRFK,2002). The major tea growing counties are
Nakuru, Kericho, Bomet, Nandi, Elegweyo Marakwet, Nyamira, Kisii, Kakamega,
Kiambu, Murang’a, Nyeri, Kirinyaga, Embu, Tharaka Nthi and Meru. (Appendix I)
Tea production in Kenya is divided into two main categories, privately owned large
plantations, which account for about 40% of the total tea production in the county and
the smallholder tea farmers who produce the remaining 60% of Kenyan tea. The
smallholder tea is produced under the management of the Kenya Tea Development
Agency (KTDA). The management of the smallholder tea by KTDA involves
supervising and advising on good husbandry practices; provision of inputs on credit,
collection and transportation to the factories, processing, marketing of the final product
7
and payment to farmers. Payment to farmers is done on monthly basis pegged on the
quantity of tea that is sold to the factory for that particular month. The farmers also
receive a lump sum payment in the month of May and November every year generally
referred to as tea bonus based on the performance of every factory. KTDA therefore
plays a key role in rural economic development in areas where tea is grown in Kenya.
Tea estates are privately owned companies which produce, process and market their
own tea individually. The largest tea estate belongs to Unilever Kenya Ltd while the
others are James Finlay (Kenya) Ltd., Eastern Produce Kenya Ltd. and George
Williamson Tea Kenya Ltd. Since the liberalization of the Tea industry in the year
2000, a lot of changes have taken place in the industry both locally and globally. In the
last 10 years, global tea production has outstripped demand by about 2.5 percent
annually but the trend will change in the next decade where production and demand are
projected to reach an equilibrium with production increasing by 5% and consumption
by the same margin (FAO Report 2014). Consequently, with the average global auction
prices projected to remain the same in the next decade (FAO Report 2014), then the
returns to the farmer are expected to decline due to escalating costs of production.
Miano (2010) observed that some farmers in Kenya had switched resources to other
substitutes like horticulture and dairy farming due to the escalating cost of tea
production arising from high cost of labour, fertilizers, electricity, furnace oil as well
as high taxation leading to reduced grower’s earnings.
The tea industry makes an important contribution to the Kenyan economy. Currently
tea contributes 4% of the GDP and is the leading foreign exchange earner in Kenya,
contributing 23% of foreign exchange (KNBS report 2014). In the year ended 31st
December 2013, tea exports earned the country about Ksh. 114 billion placing it first
to tourism and horticulture. This compares favourably with Ksh. 112 billion earned in
8
2012(EATTA, 2014). The industry supports directly and indirectly about 4 million
people making tea one of the leading sources of livelihood in the country.
This sub sector also provides market for the industrial goods for example fertilizers
besides providing employment to Kenyans. The incomes from this sub sector are
normally used by economic agents to finance major household expenditure such as,
food, health care and school fees. The tea industry therefore has a direct impact on rural
poverty and any decline in its performance will lead to increased poverty in the tea
growing regions and in the overall economy.
1.2 Problem Statement
Capacity utilization is a key factor in economic development for any country. For any
meaningful economic development to take place, firms and nations must address the
issue of efficiencies by utilizing idle capacities in the existing facilities. This should be
improved to CU=1 or to an optimum depending on the industry. This will consequently
bring down the cost of production and lower the cost of goods and services. Reduction
of idle capacity also reduces wastage of raw materials and finished products in
manufacturing industry. In the long run, the quality and returns are expected to improve.
In the last few years, the tea prices in the world market have been on the decline and
the supply outstripped demand. The cost of production has been escalating due to the
rising costs of inputs, equipment and labour. This has reduced the net tea earnings to
the producer and particularly the small scale tea farmer. A lot of interventions have
been done especially in the area of research in order to improve productivity in terms
of high yielding clones, drought resistant, pests and disease resistant clones. There is
some good progress in marketing since liberation of the tea industry in Kenya.
However, a lot needs to be done to reduce the escalating cost of production by
9
addressing the efficiency in terms of capacity utilization both at farm and the factory
level. This research will focus on capacity utilization at the factory production level
with an objective of optimising capacity utilization that is currently installed in the tea
factories. Secondly, it will identify the bottlenecks in the existing systems by applying
the theory of constraints. This will help the factory management to improve on factory
processing capacity by matching or synchronising existing capacities of individual
machines in the production line. Addressing such bottlenecks in the existing systems
from an informed point of view will cut down the cost of installing an entire production
line and save the farmers money.
Nyaoga, Wang and Magutu (2015) in their research to establish the relationship
between capacity utilization and value chain performance, and established positive
relationship. One of the recommendations from the research was that tea processing
factories should invest more in effective capacity utilization. However, the study did
not establish up to what level the factory management needs to invest in effective
capacity utilization in order leap maximum benefits.
Mbuthia (2013) in his research, a case study at Gacharage Tea Factory looked at the
design of the withering troughs in order to improve withering efficiency. The research
came up with a more improved engineering design of a withering trough which would
improve efficiency in the withering section and save on energy utilization.
Consequently, this would improve on capacity utilization of the withering section.
However, the research did not address capacity utilization in entire production system
but rather focused on efficiency of the withering troughs.
Karugo (2003) in his study on effects of liberalization of tea industry on income of
smallholder tea producers in Central Kenya found out that the farmers did not benefit
10
much from the liberalization of tea industry and the production costs continued to rise
and farmers continued to increase production even when the market prices were on a
downward trend. He found out that production cost in a given factory related to the
output per factory. The study did not investigate how capacity utilization at the farm
and factory level would affect the cost of production and returns to the farmers but
rather concentrated on the effects of liberalization.
Oluoch (1978) did a research on labour utilization in tea smallholder sector in Kenya
due to its rapid growth. He did not find any labour constraints in tea production but
recommended further research due to the high rate of growth of the sub-sector.
However, this study did not address any capacity utilization at the factory production
level.
Oluoko (1999) did a research on the aspects of smallholder tea production in Belgut
division of Kericho District to establish social-economic factors influencing
smallholder tea production. The study recommended the intervention of GOK and
KTDA to develop a policy to address the problems facing the small scale tea farmers.
The study did not address the issue of capacity utilization at the factory level.
The above studies therefore indicate there was an urgent need to research in capacity
utilization at the factory level given the important role that the factory operations play
towards improving the returns of factories or the small scale tea farmers (shareholders).
It was also evident that very little research has been done in this field and this gap needs
to be filled.
1.3 Research Objectives
The objectives of this study were:
i) To establish capacity utilization of KTDA factories in Kenya.
11
ii) To establish how capacity utilization affects the quality of tea in KTDA
factories
iii) To establish how capacity utilization affects the returns to KTDA factories
1.4 Value of the Study
The study will help in establishing the relationship between capacity utilization, quality
tea and returns to KTDA tea factories and whether the relationship is positive. Kenyan
economy majorly depends on agriculture and the tea industry contributes 4% of the
country’s GDP and more than 20% of total foreign exchange and therefore tea is a very
important component in Kenya’s economy. About 4 million people in Kenya depend
on tea out of which over 560,000 are small scale tea farmers under KTDA and whose
contribution is over 60% of the tea produced in the country. These small scale farmers
are found in the rural areas and directly depend on the crop. A lot of challenges have
been encountered in the past on capacity utilization with some factories suffering excess
capacities while others suffer from under capacities. This study will therefore help in
formulation of a policy on factory operations in regard to capacity utilization in order
to reduce the cost of production in the tea factories. This will therefore be of great
benefit to KTDA,GOK and the tea farmers. The findings will also add to the existing
body of knowledge.

12
CHAPTER TWO: LITERATURE REVIEW
2.1 Introduction
This chapter discusses the performance of the tea industry in Kenya and studies that
relate to capacity utilization and their importance in economic development. The focus
is more on past related studies and theories that are important to this particular research.
2.1.1 Tea Industry Structure in Kenya
The diagram in Appendix II shows the key institutions that constitute the tea industry
in Kenya. The Ministry of Agriculture (MOA) has the mandate to promote and facilitate
production of food and agricultural raw materials for food security and incomes;
advance agro-based industries and agricultural exports; and enhance sustainable use of
land resources as a basis for agricultural enterprises. The Tea Board of Kenya (TBK),
regulates the tea industry in all aspects of tea growing, research, manufacture, trade and
promotion in both the local and the international markets. The Board also disseminates
information relating to tea and advises the Government on all policy matters regarding
the tea industry. Currently the Tea Board of Kenya is functioning as a Tea Directorate
under AFFA in the Ministry of Agriculture. Tea Research Foundation of Kenya
(TRFK), currently called Tea Research Institute(TRI) under Kenya Agricultural and
Livestock Research Organization(KARLO) is the technical arm of the Tea Directorate
and has a mandate to carry out research on tea and advise growers on the control of
pests and diseases, improvement of planting material, general husbandry, yields and
quality. The Foundation has so far developed and released to growers over 45 well-
adapted clones.
Kenya Tea Development Agency (KTDA) Ltd, currently manages 66 tea factories in
the smallholder tea sub-sector serving over 560,000 growers. Kenya Tea Growers
13
Association (KTGA) was established by large-scale tea producers to promote the
common interests of the members in the cultivation and manufacture of tea and to
promote good industrial relations and sound wage policies for the workers. The
plantation sub-sector maintains 39 tea factories while Nyayo Tea Zones Development
Corporation (NTZDC), is a State Corporation established in 1986 to create and manage
tea buffer belts around gazetted natural forests to protect them from human
encroachment and owns one tea factory.
East African Tea Trade Association (EATTA) brings together tea Producers, Brokers,
Buyers and Packers and is the auspices under which the Mombasa Tea Auction is
conducted. It has 10 member countries from Eastern and central Africa namely; Kenya,
Uganda, Tanzania, Rwanda, Burundi, Malawi, Mozambique, DRC Congo, Ethiopia
and Madagascar.
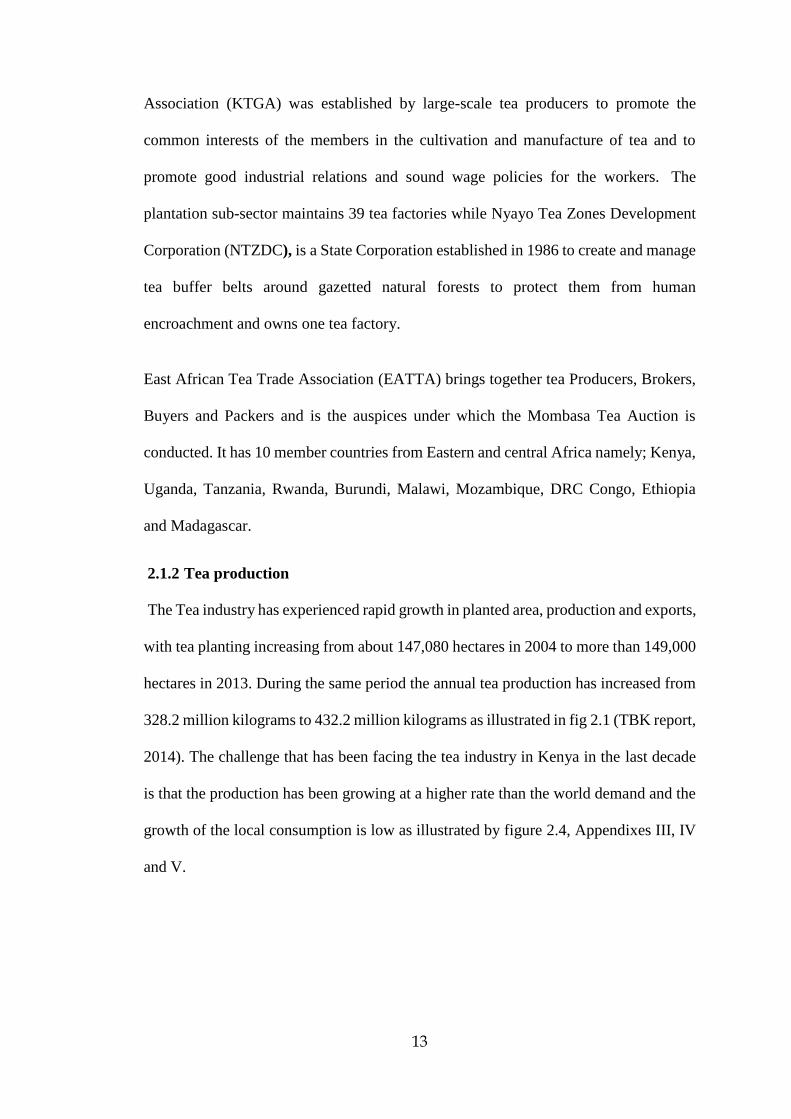
2.1.2 Tea production
The Tea industry has experienced rapid growth in planted area, production and exports,
with tea planting increasing from about 147,080 hectares in 2004 to more than 149,000
hectares in 2013. During the same period the annual tea production has increased from
328.2 million kilograms to 432.2 million kilograms as illustrated in fig 2.1 (TBK report,
2014). The challenge that has been facing the tea industry in Kenya in the last decade
is that the production has been growing at a higher rate than the world demand and the
growth of the local consumption is low as illustrated by figure 2.4, Appendixes III, IV
and V.
14
Source: TBK
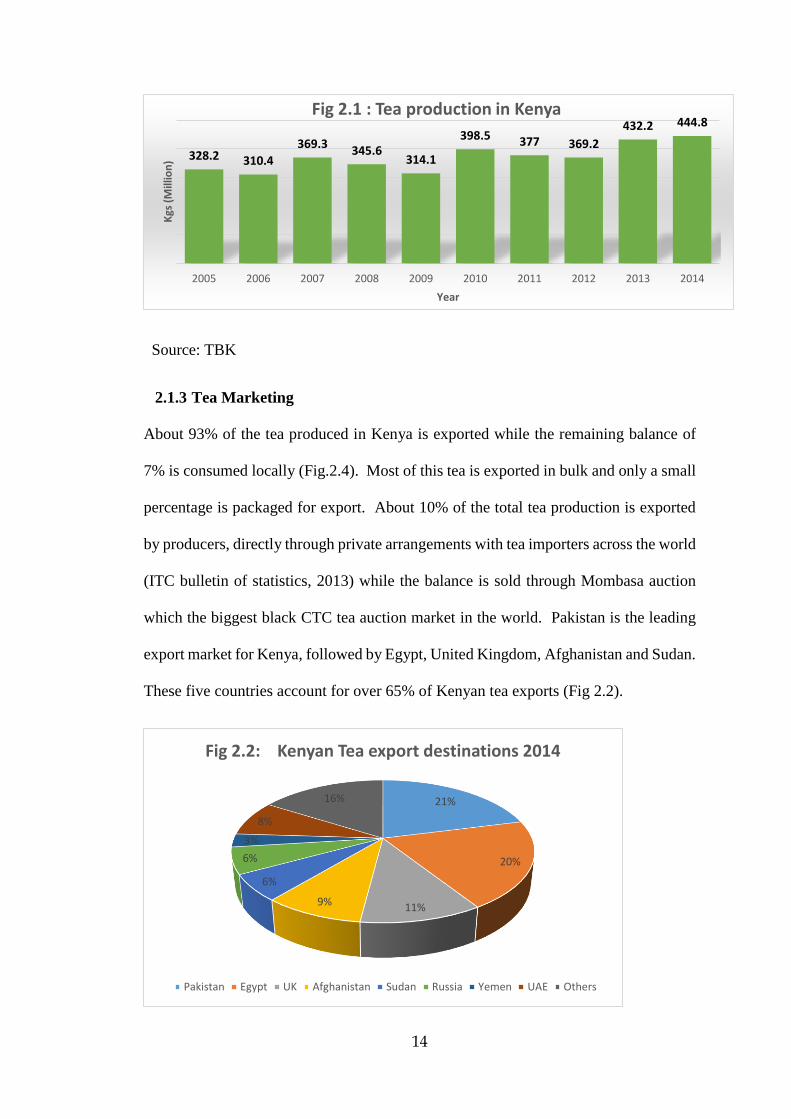
2.1.3 Tea Marketing
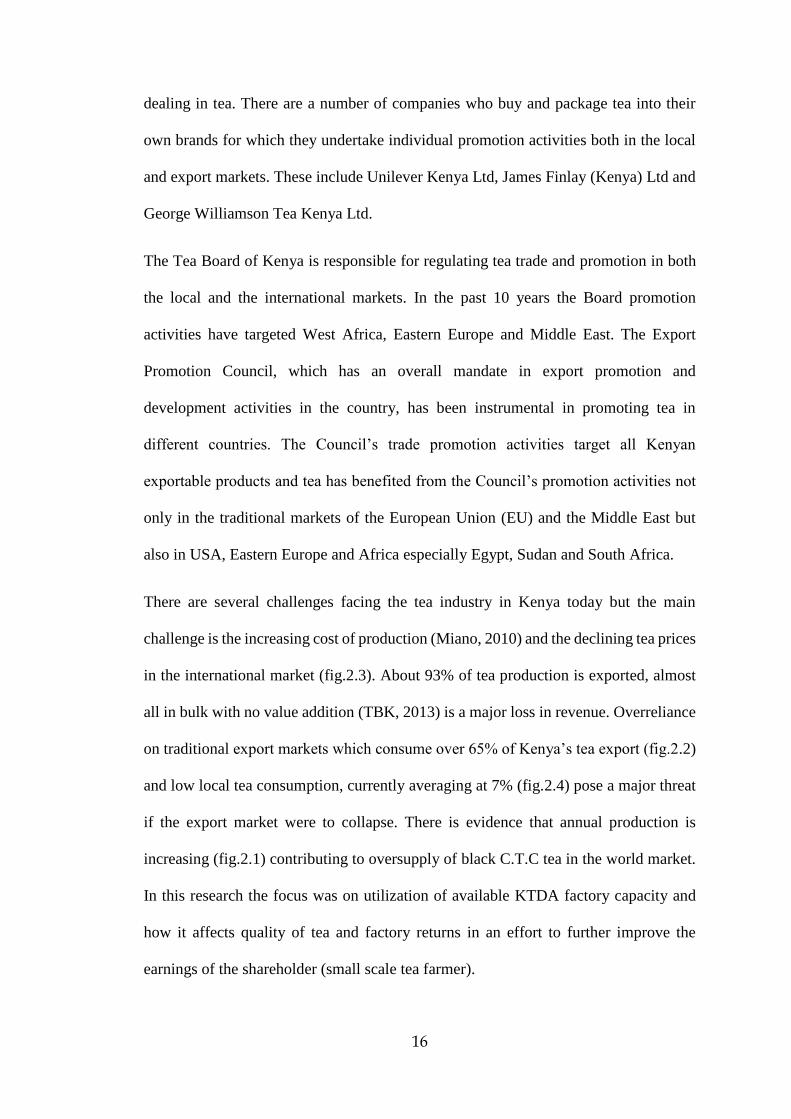
About 93% of the tea produced in Kenya is exported while the remaining balance of
7% is consumed locally (Fig.2.4). Most of this tea is exported in bulk and only a small
percentage is packaged for export. About 10% of the total tea production is exported
by producers, directly through private arrangements with tea importers across the world
(ITC bulletin of statistics, 2013) while the balance is sold through Mombasa auction
which the biggest black CTC tea auction market in the world. Pakistan is the leading
export market for Kenya, followed by Egypt, United Kingdom, Afghanistan and Sudan.
These five countries account for over 65% of Kenyan tea exports (Fig 2.2).
328.2 310.4
369.3345.6
314.1
398.5 377 369.2
432.2 444.8
2005 2006 2007 2008 2009 2010 2011 2012 2013 2014
Kgs
(M
illio
n)
Year
Fig 2.1 : Tea production in Kenya
21%
20%
11%9%
6%
6%
3%
8%
16%
Fig 2.2: Kenyan Tea export destinations 2014
Pakistan Egypt UK Afghanistan Sudan Russia Yemen UAE Others
15
Source: Africa Tea Brokers Ltd
Source: T.B.K
Source: TBK
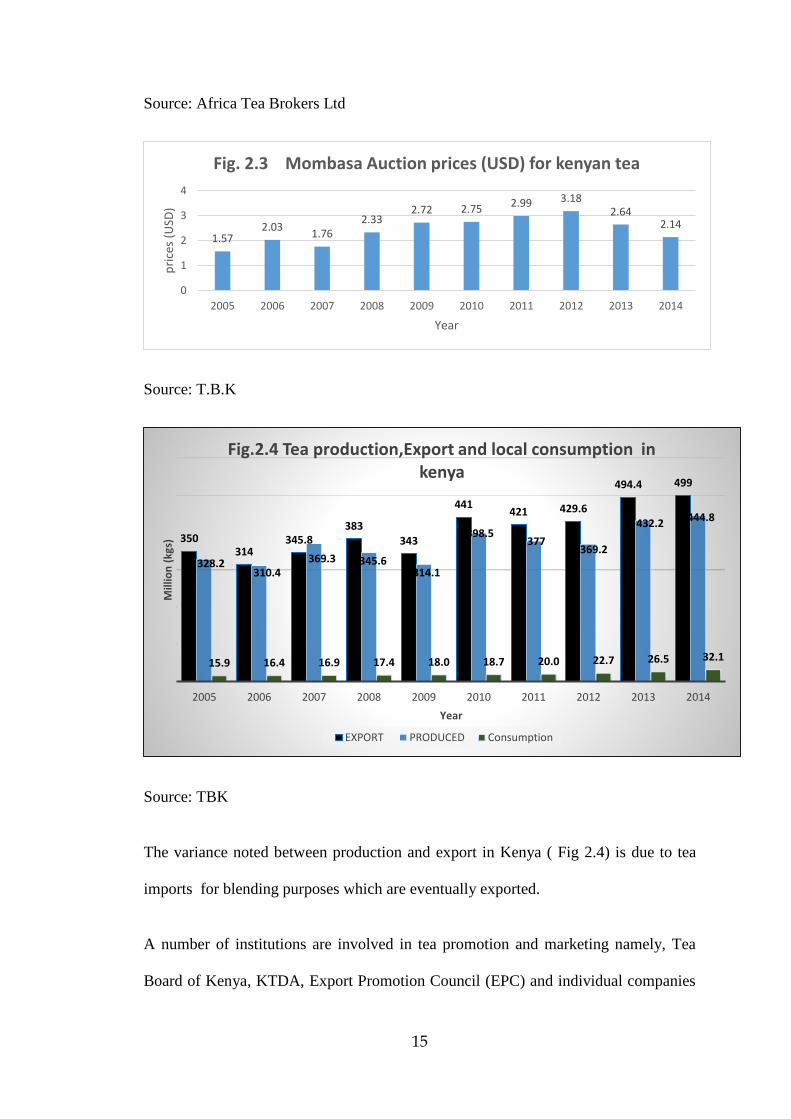
The variance noted between production and export in Kenya ( Fig 2.4) is due to tea
imports for blending purposes which are eventually exported.
A number of institutions are involved in tea promotion and marketing namely, Tea
Board of Kenya, KTDA, Export Promotion Council (EPC) and individual companies
1.572.03
1.762.33
2.72 2.752.99 3.18
2.642.14
0
1
2
3
4
2005 2006 2007 2008 2009 2010 2011 2012 2013 2014
pri
ces
(USD
)
Year
Fig. 2.3 Mombasa Auction prices (USD) for kenyan tea
350314
345.8383
343
441421 429.6
494.4 499
328.2310.4
369.3 345.6314.1
398.5377
369.2
432.2444.8
15.9 16.4 16.9 17.4 18.0 18.7 20.0 22.7 26.5 32.1
2005 2006 2007 2008 2009 2010 2011 2012 2013 2014
Mill
ion
(kg
s)
Year
Fig.2.4 Tea production,Export and local consumption in kenya
EXPORT PRODUCED Consumption
16
dealing in tea. There are a number of companies who buy and package tea into their
own brands for which they undertake individual promotion activities both in the local
and export markets. These include Unilever Kenya Ltd, James Finlay (Kenya) Ltd and
George Williamson Tea Kenya Ltd.
The Tea Board of Kenya is responsible for regulating tea trade and promotion in both
the local and the international markets. In the past 10 years the Board promotion
activities have targeted West Africa, Eastern Europe and Middle East. The Export
Promotion Council, which has an overall mandate in export promotion and
development activities in the country, has been instrumental in promoting tea in
different countries. The Council’s trade promotion activities target all Kenyan
exportable products and tea has benefited from the Council’s promotion activities not
only in the traditional markets of the European Union (EU) and the Middle East but
also in USA, Eastern Europe and Africa especially Egypt, Sudan and South Africa.
There are several challenges facing the tea industry in Kenya today but the main
challenge is the increasing cost of production (Miano, 2010) and the declining tea prices
in the international market (fig.2.3). About 93% of tea production is exported, almost
all in bulk with no value addition (TBK, 2013) is a major loss in revenue. Overreliance
on traditional export markets which consume over 65% of Kenya’s tea export (fig.2.2)
and low local tea consumption, currently averaging at 7% (fig.2.4) pose a major threat
if the export market were to collapse. There is evidence that annual production is
increasing (fig.2.1) contributing to oversupply of black C.T.C tea in the world market.
In this research the focus was on utilization of available KTDA factory capacity and
how it affects quality of tea and factory returns in an effort to further improve the
earnings of the shareholder (small scale tea farmer).
17
2.2 Theoretical Review
This section gives a set propositions under which the study is anchored in an attempt to
provide a plausible or rational explanation of cause-and-effect (causal) relationships
among the study variables. The study is specifically hinged on the constraint theory,
quality theory, theory of diminishing returns and also the economies and diseconomies
of scale
2.2.1 Constraint Theory
Theory of Constraints (TOC) was created by Dr Eli Goldratt and was published in his
book "The Goal." in 1984.It provides a set of holistic processes and rules, all based on
a systems approach that exploits the inherent simplicity within complex systems
through focusing on the few "leverage points” as a way to synchronize the parts to
achieve ongoing improvement in the performance of the system as a whole. The whole
concept behind this theory is to manage the weakest link as a chain is as strong as its
weakest link. In any industry, there is often scope for boosting overall performance and
the greatest way in achieving this is to identify and eliminate "bottlenecks," or things
that are holding you back. The Theory of Constraints (TOC) helps to identify the most
important bottleneck in processes and systems, in order to manage it and improve
performance (Golgratt, 1984).
According to Goldratt (1984), organizational performance is dictated by constraints.
These are restrictions that prevent an organization from maximizing its performance
and reaching its goals. Constraints can involve people, supplies, information,
equipment, or even policies, and can be internal or external to an organization.
The theory states that in every system, no matter how well it performs, has at least one
constraint that limits its performance – this is the system's "weakest link." The theory

18
also states that a system can have only one constraint at a time, and that other areas of
weakness are "non-constraints" until they become the weakest link. The theory was
originally used successfully in manufacturing, but today it used in a variety of
situations. Nyaoga, Wang and Magutu (2015) in their research on capacity utilization
and value chain indicate that key theoretical perspectives of TOC have greatly been
used in supply chain management studies. The theory is relevant in this research since
it can be used in identifying bottlenecks that limit capacity utilization in tea processing
factories.
2.2.2 Quality Theory
The Juran Trilogy, published in 1986, identified and was accepted worldwide as the
basis for quality management. After almost 50 years of research, his trilogy defined
three management processes required by all organizations to improve. Quality control,
quality improvement, and quality planning. These have become synonymous with Juran
and Juran Institute.
Juran describes quality from the customer perspective as having two aspects: higher
quality means a greater number of features that meet customers’ needs. The second
aspect relates to “freedom from trouble”; higher quality consists of fewer defects. In
summary Juran (1986) described quality as “fitness for purpose or use”. Quality of tea
is the most important factor in determination of prices in the tea auction. The tea buyer
looks at the whole aspect of tea quality, that is, leaf appearance, infusion and liquor to
value a specific tea. This explains why different factories get different prices for their
teas by the same buyer under the same auction conditions or why different invoices
from the same factory attract different bids in the same auction. This is all based on the
quality as viewed by the customer, in this case the tea buyer.
19
2.2.3 Theory of Diminishing Returns
The law of diminishing returns is an empirical law and applies in various production
activities. The theory may not apply universally to all kinds of productive activities. It
will operate faster in some production activities than others. This have been found to
operate in agricultural production more regularly than in industrial production because
in agriculture, natural factors play a predominant role whereas man made factors play
a major role in industrial production. However, despite these limitations, the marginal
returns to a variable input eventually decreases by increasing the units of the input to a
fixed factor of production (Kunwar & Nyandemo, 2007). This relates very well to the
concept of optimum capacity utilization in a tea processing factory at the point where
the minimum cost of production is achieved.
2.2.4 Economies and Diseconomies of Scale
Economies of scale result in cost saving and diseconomies lead to rise in cost. This is
classified into Internal and external economies of scale.
Conceptually, the optimum size of a firm is the one which ensures the most efficient
utilization of resources. Practically, the optimum size of a firm is the one that minimises
the long average curve (LAC). At a given level of technology there is technically a
unique size of the firm and level of output associated to the least cost concept (Dwivedi,
2008). In this study emphasis is made on the utilization of internal economies of the tea
processing factories particularly their available technology and capacity.
2.3 Empirical Studies
There are two approaches to measuring capacity utilization. The first approach
measures capacity utilization using an estimated cost function. Another approach uses
Federal Resource Board (FRB) or Wharton measure that investigates the
20
macroeconomic implications of high or low capacity utilization. Sarbapriya (2013)
observed that very little research work has been undertaken on economic measurement
of capacity utilization since most of the studies on capacity utilization had used
conventional methods and had paid less attention to the possible theoretical problems.
Therefore, there was a need to have a study to extend the concept of capacity utilization
beyond conventional methods and build up some new theory.
Nyaoga,Wang and Magutu (2015) did a research with an objective to determine the
relationship between capacity utilization and value chain performance of tea processing
firms in Kenya. A sample of 85 tea processing factories was used with only 44 of the
total responding giving a response rate of 51.8%. The results indicated a very strong
positive relationship between capacity utilization and value chain performance in tea
processing factories. The empirical evidence indicated that firms should invest more in
effective capacity utilization through enhanced levels of outputs compared to the
designed capacity in order to improve the throughput and value chain performance. The
study also clears the contradictions by Guy et al. (2005) whose study on the impact of
application of the Theory of Constraints in the health sector indicated a negative relation
where the increase of patients in the outpatient section increased with no actual value
addition.
Sarbapriya (2013) in his research work in analysing capacity utilization studies on
capacity in India and other countries found out that no comprehensive studies on
capacity utilization existed for India which are based on economic notion of capacity
whose coverage is comprehensive in terms of period of the study as well as coverage
of the industrial sectors. Earlier studies on capacity utilization had left unaddressed
several theoretical and data problems in measuring capacity utilization. This is not
different for Kenya and more so in the tea industry.
21
Shahidul, et al (2013) did a research to measure machinery capacity utilization and its
impact on manufacturing performance and environment in plastic manufacturing
industry. The main objectives was to evaluate the impact of CU on efficiency of
machinery and the impact the CU has on wastage and environmental sustainability. It
was observed that CU and production efficiency are positively related. This is because
during the production process inputs are transformed into outputs at higher rates. It was
also noted that lower level of CU could produce poor quality products which could lead
to low production efficiency and higher degree of waste. In summary the observation
was that the optimization of capacity utilization of machinery is essentially important
for achieving sustainable production performance and environment. It was also further
observed that CU is negatively correlated with waste of inputs namely raw materials
and final products. The study further recommends for further in-depth study in other
relevant industries.
Iraki (2013) in his research paper entitled “The Forgotten Secret in Trading Out Poverty”
identified capacity utilization as a catalyst which can enhance faster economic growth of
a country. He refers to earlier studies done by Levine and Renelt (1992) which indicate
that the variables most closely related to growth are trade and investment; but Frankel
and Romer (1999) suggested that a third factor may be at play; however, they did not
identify this third factor. Iraki (2013) identifies this factor as capacity utilization and
emphasis the need to fully utilize the existing capacity in terms of facilities, machinery
and personnel to foster economic development. The study also indicates that there was
not available data from the Eastern African countries which suggests that there is need
for more research in the region to provide the necessary data in future.
Kathata (2011) did a research on factors affecting the quality of tea in KTDA factories
in Thika district. The research looked at the increasing tea production and declining tea
22
returns to the farmers and concluded that the focus should be on quality other than the
quantity of tea. He noted that the cost of production is also on the rise. However, the
study focused on quality and how it can be used to improve factory returns but did not
address factory capacity utilization as a possible solution to improving the returns.
It is against this backgound that I undertook this research to bridge the identified gaps in
capacity utilization and its effect on quality of tea and returns to the tea factories more
specifically in the KTDA factories in Kenya.
2.4 Summary of literature Review
From the studies discussed, capacity utilization is a key factor for economic
development of a nation. There exists a very huge unutilized capacity in all sectors and
countries including developed economies like America and more research is required
especially in East Africa Countries (Iraki, 2013). There is very little research that has
been done on capacity utilization in tea industry in Africa and more specifically in
Kenya and yet there are many challenges facing the tea industry in Kenya today.
It is against this background that more research was needed to establish the level of
capacity utilization of tea factories and how it affects the quality of tea and factory
returns. For the purpose of this research, KTDA factories for small scale tea farmers in
Kenya were used.
2.5 Conceptual Framework
The conceptual framework looks at how the different variables relate with each other.
Fig.5 below shows how the dependent variables, quality and returns vary with capacity
utilization which is the independent variable. The established relationship between the
three variables are discussed in Chapter 4 and 5.
23
Figure 2.5: Relationship between Variables.
Capacity
Utilization
(Independent
variable)
Quality, Returns
(Dependent
Variables)

24
CHAPTER THREE: RESEARCH METHODOLOGY
3.1 Introduction
This chapter discusses the research design, the target population, the basis of the sample
selection, data collection, the techniques of data analysis used and data analysis
procedure.
3.2 Research Design
The research adopted a descriptive design. The design was chosen since it is concerned
with determining the frequency with which something occurs or the relationship
between variables (Bryman and Bell, 2007). In addition, the design is preferred because
it enables assessing relationships between variables (Tashakkori & Teddlie, 2003) and
enables large and diverse amounts of data to be collected within a short time frame and
analyzed quantitatively, giving a credible presentation of results (Singleton, 2009).
3.3 Target Population
The target population refers to the entire group of elements that possess information
that the research is interested in. The target population for this research was KTDA tea
factories in Kenya. There are 66 tea factories under KTDA, 12 of which are subsidiaries
and the study therefore focused on 54 factories. A census approach was undertaken to
ensure adequate information is obtained for the study since the population is not big.
The information was mainly obtained from the Factory Unit Managers who are the
overall in-charge of the factories.
3.4 Data Collection
Secondary data was collected from the respective Factories, Regional office, KTDA
Head Office for the period 2009/2010 to 2014/2015. In addition a structured
questionnaire was also used to collect data and information on factory capacity.
25
3.5 Data Analysis
Data was analyzed using Statistical Package for Social Sciences (SPSS Version 21.0).
All the questionnaires received were referenced and items in the questionnaire coded
to facilitate data entry. After data cleaning which entailed checking for errors in entry,
descriptive statistics such as frequencies, percentages, mean score and standard
deviation were estimated for all the quantitative variables to achieve the first objective.
Descriptive statistics was used because they enable the researcher to meaningfully
describe distribution of scores or measurements using few indices (Mugenda &
Mugenda, 2003). The qualitative data from the open ended questions was analyzed
using conceptual content analysis. The information presented inform of frequency
tables and graphs for easy understanding and interpretation of the results.
For the second and third objectives, inferential data analysis was done using multiple
regression analysis to establish the relationship between the variables. The regression
equation used was as follows:
CU= β0 + β1X1 + β2X2 + €
Where: CU was capacity utilization (CU= actual Output/Installed capacity, weighted
average for 6yrs was used for each factory), β0 is a constant, β1, β2 were coefficients of
determination, X1 was return to the farmer, (monthly plus bonus payments in the year,
weighted average for 6yrs was used for each factory), X2 was quality index (measure
was the average auction tea prices in a year, weighted average for 6yrs was used to get
quality index for each factory) and € was error term. The coefficient of determination
(R2) were used to measure the extent to which the variation in returns was explained by
the variations in the independent variables. F-statistic was computed at 95% confidence
level to test whether there was any significant relationship between the variables.
26
Capacity utilization was obtained by using the actual capacity utilized in a given year
divided by the installed capacity of each specific factory as follows:
CU=AO/DC where CU was the capacity utilization for the factory, AO was actual
output of the factory per year while DC was the designed (installed) capacity for the
factory. DC was calculated by applying Theory of Constraint (TOC) in the most critical
sections in tea processing for 8760 hours in a year. The most critical sections were
found to be withering, cutting, fermentation and drying. To arrive at more realistic CU
for a specific factory, a period of 6 years (2009/10 to 2014/15) was considered and a
weighted average calculated. The following equation was used,
𝐶𝑈𝑦 = (∑𝐴𝑂𝑦𝑡
6
𝑡=1
)/6𝐷𝐶
Where CUy was capacity utilization for factory y, t was period (t=1 is 2009/10,……,t=6
is 2014/15), AO was actual output and DC was designed capacity.
The weighted average represented the capacity utilization for a specific factory. This
was calculated for all the factories. Each factory therefore represented a specific level
of capacity utilization.
The rate of return to the farmer (X1) per factory was obtained by adding up the total
payments for 6 years and a weighted average rate per kilogram of tea obtained as
follows: X1y= Total farmers payment in 6yrs
Total production in 6yrs
Where, X1y is total average rate of return for farmers in factory y, t is period (year).
This was done for all the factories. A graph to show how returns varied in relation to
capacity utilization was done.
27
Tea quality index was established by using a proxy indicator of the tea auction prices
and average obtained by the following equation, 𝑋2𝑦 = (∑ 𝑋2𝑦𝑡6𝑡=1 )/6
Where,X2y is tea quality index for factory y, t is period (year). This was done for all the
factories. A graph to show how tea quality index varied with capacity utilization was
done. Some graphical analysis showing the relationship between the capacity utilization
vis a vis quality and returns was also done and is presented in the next chapter.

28
CHAPTER FOUR
DATA ANALYSIS, RESULTS AND DISCUSSIONS
4.1 Introduction
This chapter presents analysis and findings of the study as set out in the research
objectives in chapter one under 1.3. The study findings represent the effects of capacity
utilization, quality of tea and returns to KTDA factories in Kenya. The data was
collected from the respective factory, Regional offices and KTDA Head Office for the
period 2009/2010 to 2014/15
4.2 Response Rate
The total population was made up of 54 KTDA factories in Kenya. Out of the 54
companies, 31 factories responded to the questionnaires making a response rate of
57.4%. According to Mugenda and Mugenda (1999), a response rate of 50% is adequate
for analysis and reporting. Kothari (2004) gives response rate of 50% as adequate, while
a response rate greater than 70% is very good. This means that the response rate for this
study was adequate and therefore enough for data analysis and interpretation.
Table 4.1: Descriptive Statistics
N Minimum Maximum Mean Std.
Deviation
capacity
utilization
31 18% 58% 38.92% 0.09055
Returns 31 1.90 2.94 2.3848 0.29050
Quality 31 2.64 3.24 2.9574 0.17761
Returns in USD per Kg of tea.
29
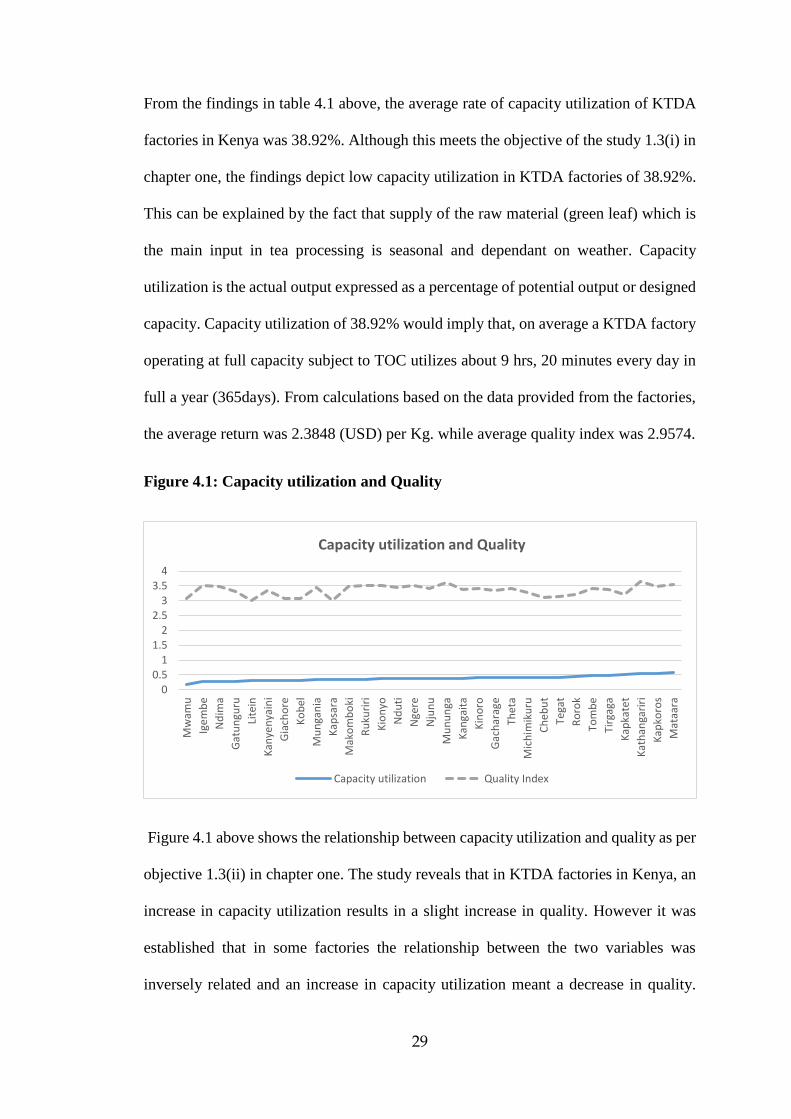
From the findings in table 4.1 above, the average rate of capacity utilization of KTDA
factories in Kenya was 38.92%. Although this meets the objective of the study 1.3(i) in
chapter one, the findings depict low capacity utilization in KTDA factories of 38.92%.
This can be explained by the fact that supply of the raw material (green leaf) which is
the main input in tea processing is seasonal and dependant on weather. Capacity
utilization is the actual output expressed as a percentage of potential output or designed
capacity. Capacity utilization of 38.92% would imply that, on average a KTDA factory
operating at full capacity subject to TOC utilizes about 9 hrs, 20 minutes every day in
full a year (365days). From calculations based on the data provided from the factories,
the average return was 2.3848 (USD) per Kg. while average quality index was 2.9574.
Figure 4.1: Capacity utilization and Quality
Figure 4.1 above shows the relationship between capacity utilization and quality as per
objective 1.3(ii) in chapter one. The study reveals that in KTDA factories in Kenya, an
increase in capacity utilization results in a slight increase in quality. However it was
established that in some factories the relationship between the two variables was
inversely related and an increase in capacity utilization meant a decrease in quality.
00.5
11.5
22.5
33.5
4
Mw
amu
Ige
mb
e
Nd
ima
Gat
un
guru
Lite
in
Kan
yen
yain
i
Gia
cho
re
Ko
bel
Mu
nga
nia
Kap
sara
Mak
om
bo
ki
Ru
kuri
ri
Kio
nyo
Nd
uti
Nge
re
Nju
nu
Mu
nu
nga
Kan
gait
a
Kin
oro
Gac
har
age
Thet
a
Mic
him
iku
ru
Ch
eb
ut
Tega
t
Ro
rok
Tom
be
Tirg
aga
Kap
kate
t
Kat
han
gari
ri
Kap
koro
s
Mat
aara
Capacity utilization and Quality
Capacity utilization Quality Index
30
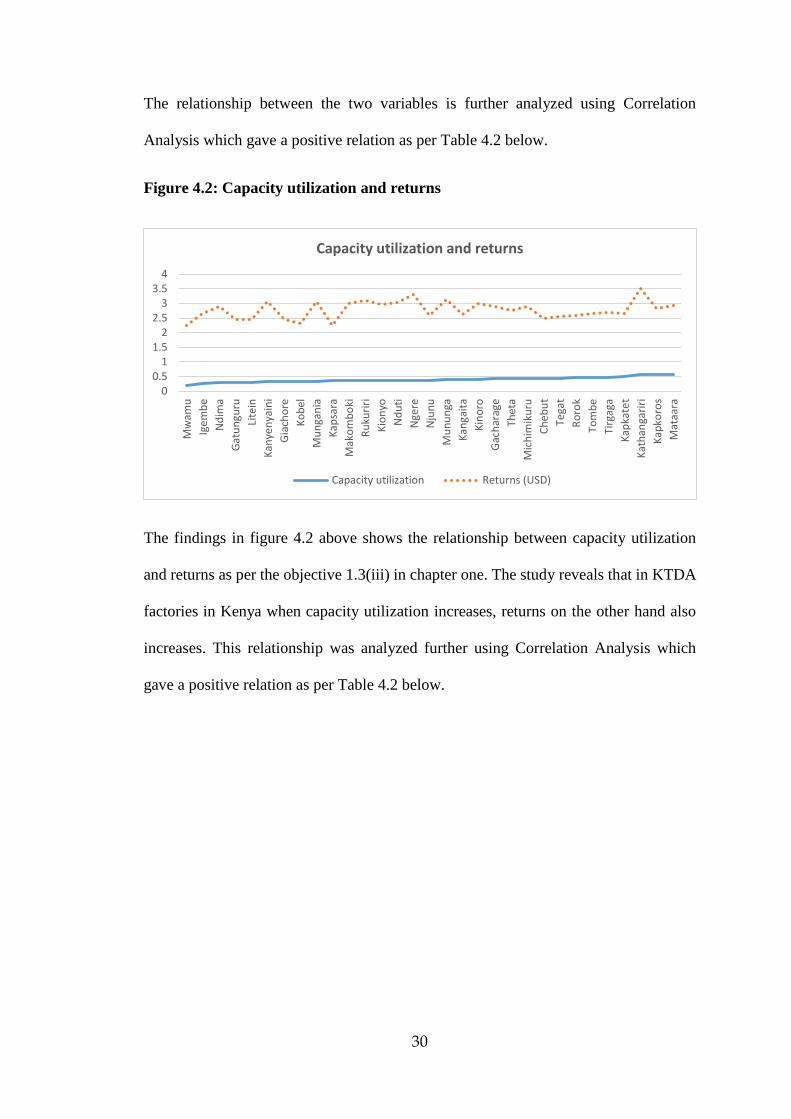
The relationship between the two variables is further analyzed using Correlation
Analysis which gave a positive relation as per Table 4.2 below.
Figure 4.2: Capacity utilization and returns
The findings in figure 4.2 above shows the relationship between capacity utilization
and returns as per the objective 1.3(iii) in chapter one. The study reveals that in KTDA
factories in Kenya when capacity utilization increases, returns on the other hand also
increases. This relationship was analyzed further using Correlation Analysis which
gave a positive relation as per Table 4.2 below.
00.5
11.5
22.5
33.5
4
Mw
amu
Ige
mb
e
Nd
ima
Gat
un
guru
Lite
in
Kan
yen
yain
i
Gia
cho
re
Ko
bel
Mu
nga
nia
Kap
sara
Mak
om
bo
ki
Ru
kuri
ri
Kio
nyo
Nd
uti
Nge
re
Nju
nu
Mu
nu
nga
Kan
gait
a
Kin
oro
Gac
har
age
Thet
a
Mic
him
iku
ru
Ch
eb
ut
Tega
t
Ro
rok
Tom
be
Tirg
aga
Kap
kate
t
Kat
han
gari
ri
Kap
koro
s
Mat
aara
Capacity utilization and returns
Capacity utilization Returns (USD)

31
Figure 4.3: Capacity utilization, returns and Quality
Figure 4.3 above shows the relationship between the three variables, capacity
utilization, returns and quality.
4.3 Correlation Analysis
The study used Karl Pearson’s coefficient of correlation in order to quantify the strength
of the relationship between the variables. The Pearson product-moment correlation
coefficient determines the strength of a linear association between two variables and is
denoted by r which can take a range of values from +1 to -1. A value of 0 indicates that
there is no association between the two variables. A value greater than 0 indicates a
positive association, that is, as the value of one variable increases so does the value of
the other variable. A value less than 0 indicates a negative association, that is, as the
value of one variable increases the value of the other variable decreases.
The Pearson’s coefficient was used to verify the existence or non-existence of linear
correlation between and among the capacity utilization with returns and quality. The
findings are presented as follows;
0
0.5
1
1.5
2
2.5
3
3.5
4M
wam
u
Ige
mb
e
Nd
ima
Gat
un
guru
Lite
in
Kan
yen
yain
i
Gia
cho
re
Ko
bel
Mu
nga
nia
Kap
sara
Mak
om
bo
ki
Ru
kuri
ri
Kio
nyo
Nd
uti
Nge
re
Nju
nu
Mu
nu
nga
Kan
gait
a
Kin
oro
Gac
har
age
Thet
a
Mic
him
iku
ru
Ch
eb
ut
Tega
t
Ro
rok
Tom
be
Tirg
aga
Kap
kate
t
Kat
han
gari
ri
Kap
koro
s
Mat
aara
Capacity utilization, returns and Quality
Capacity utilization Returns (USD) Quality Index

32
Table 4.2: Correlation Analysis
capacity
utilization
returns quality
capacity
utilization
Pearson
Correlation
1 0.765* 0.439*
Sig. (2-tailed) 0.047 0.015
N 31 31 31
Returns
Pearson
Correlation
0.765* 1 0.199
Sig. (2-tailed) 0.047 0.293
N 31 30 30
Quality
Pearson
Correlation
0.439* 0.199 1
Sig. (2-tailed) 0.015 0.293
N 31 31 31
*. Correlation is significant at the 0.05 level (2-tailed).
Results from table 4.2 above reveal that there is a significant positive relationship
between capacity utilizationand returns (r= .765, P-value < 0.05). This implies that
capacity utilization influences returns at KTDA factories in Kenya.
The findings also disclosed a significant positive relationship between capacity
utilization and quality (r = .439**, P-value < 0.01). Thus, implying that capacity
utilization influences quality at KTDA factories in Kenya
The above findings collaborate with Shahidul and Shazali (2011) findings who noted
that the degree of CU is a manufacturing performance indicator; and CU growth rate is
33
positively associated with manufacturing productivity. Practically, productivity growth
is measured and adjusted with CU for maintaining sustainable industrial growth.
Productivity growth is also realized by reducing non-value added inputs and
maximizing output. It is because underutilized capacity creates capacity gap and
capacity gap acts as non-value added input which contributed to reduce productivity.
4.4 Regression Analysis
This was used to further establish the relationship of the three variables, that is, capacity
utilization, quality of tea and returns in KTDA factories. However, the data was not
tested for normality, heteroscedasticity and multicollinearity.
4.4.1 Model Summary
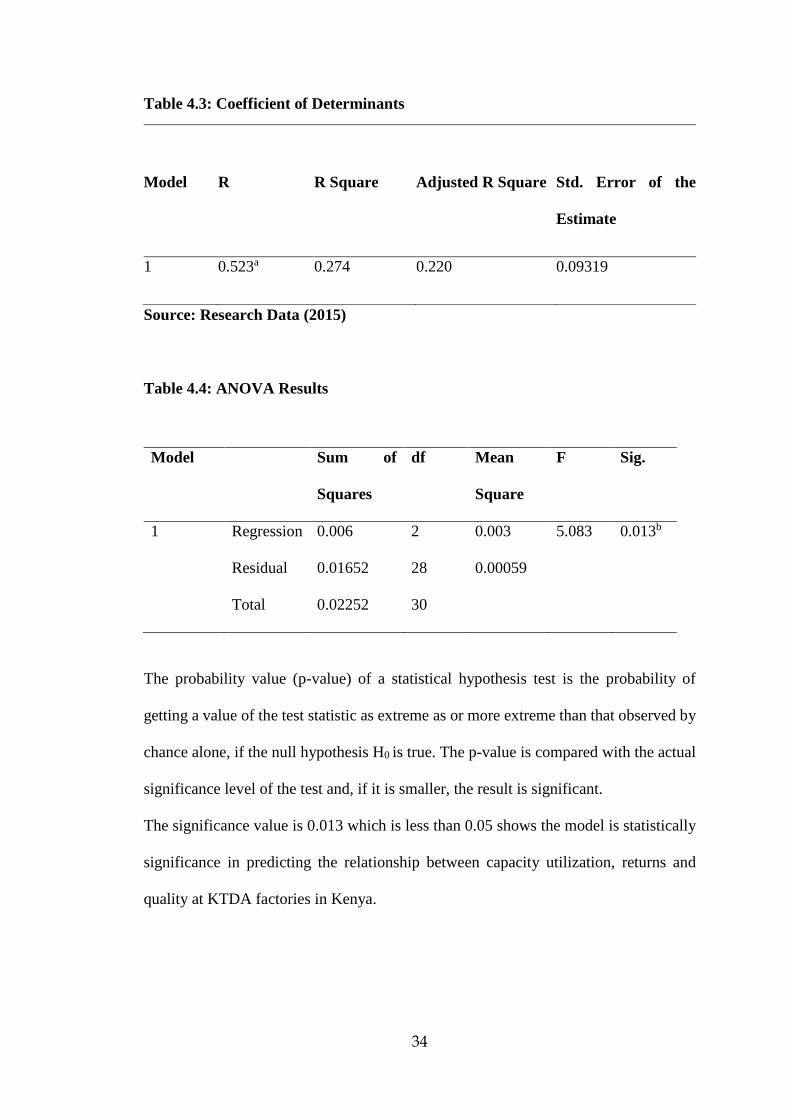
The coefficient of determination (R Square) is used to test the goodness-of-fit of the
model. That is, R Square measures the proportion or percentage of the total variation in
the dependent variable explained by the independent variable. The value of R Square
lie between 0 and 1 and if R Square value is 1, then there is a perfect fit while R Square
value 0 indicates that there is no relationship between dependent and independent
variables. The capacity utilization, explain only 27.4% of the returns and quality at
KTDA factories in Kenya as represented by the R2. This therefore means that other
factors affecting returns and quality at KTDA factories in Kenya not studied in this
research add up to 72.6%. Such other factors might include technology of machinery
used in factories, age of the factory and machinery which will affect the quality of tea
and returns to the KTDA factories. Also, the time lag between plucking of green leaf
(raw material) to manufacture and eventual delivery of tea to the auction might affect
the quality of tea resulting into low prices and low returns. .
34
Table 4.3: Coefficient of Determinants
Model R R Square Adjusted R Square Std. Error of the
Estimate
1 0.523a 0.274 0.220 0.09319
Source: Research Data (2015)
Table 4.4: ANOVA Results
The probability value (p-value) of a statistical hypothesis test is the probability of
getting a value of the test statistic as extreme as or more extreme than that observed by
chance alone, if the null hypothesis H0 is true. The p-value is compared with the actual
significance level of the test and, if it is smaller, the result is significant.
The significance value is 0.013 which is less than 0.05 shows the model is statistically
significance in predicting the relationship between capacity utilization, returns and
quality at KTDA factories in Kenya.
Model Sum of
Squares
df Mean
Square
F Sig.
1 Regression 0.006 2 0.003 5.083 0.013b
Residual 0.01652 28 0.00059
Total 0.02252 30

35
Table 4.5: Analysis of Coefficients
Model Unstandardized
Coefficients
Standardized
Coefficients
t Sig.
B Std. Error Beta
1
(Constant) 0.359 0.183 1.961 0.060
Returns 0.601 0.283 0.289 2.120 0.045
Quality 0.013 0.005 0.382 2.282 0.031
Multiple regression analysis was conducted as to determine capacity utilization,
quality of tea and returns to KTDA factories in Kenya. As per the SPSS generated
table above, the equation (CU= β0 + β1X1 + β2X2 + €) becomes:
CU=0.359+ β10.601+ β20.013+ €
Whereby
CU represents capacity utilization,
β0 is a constant term,
X1- Returns
X2- Quality
4.8 Summary and Interpretations of Findings
The study reveals that in KTDA factories in Kenya when capacity utilization increases
returns on the other hand also increases. The study also established that there is positive
relationship between capacity utilization and quality. However the relationship between
capacity utilization and returns is positively stronger than that of capacity utilization
36
and quality. In line with the findings, Nyaoga, Wang and Magutu (2015) did a research
with an objective to determine the relationship between capacity utilization and value
chain performance of tea processing firms in Kenya. The results indicated a very strong
positive relationship between capacity utilization and value chain performance in tea
processing factories in Kenya. The empirical evidence indicated that firms should
invest more in effective capacity utilization through enhanced levels of outputs
compared to the designed capacity in order to improve the throughput and value chain
performance. Also in collaboration with the findings, Shahidul, et al. (2013) did a
research to measure machinery capacity utilization and its impact on manufacturing
performance and environment in plastic manufacturing industry. The main objectives
were to evaluate the impact of CU on efficiency of machinery and the impact the CU
has on wastage and environmental sustainability. It was observed that CU and
production efficiency are positively related. This is because during the production
process inputs are transformed into outputs at higher rates. It was also noted that lower
level of CU could produce poor quality products which could lead to low production
efficiency and higher degree of waste. In summary the observation was that the
optimization of capacity utilization of machinery is essentially important for achieving
sustainable production performance and environment.
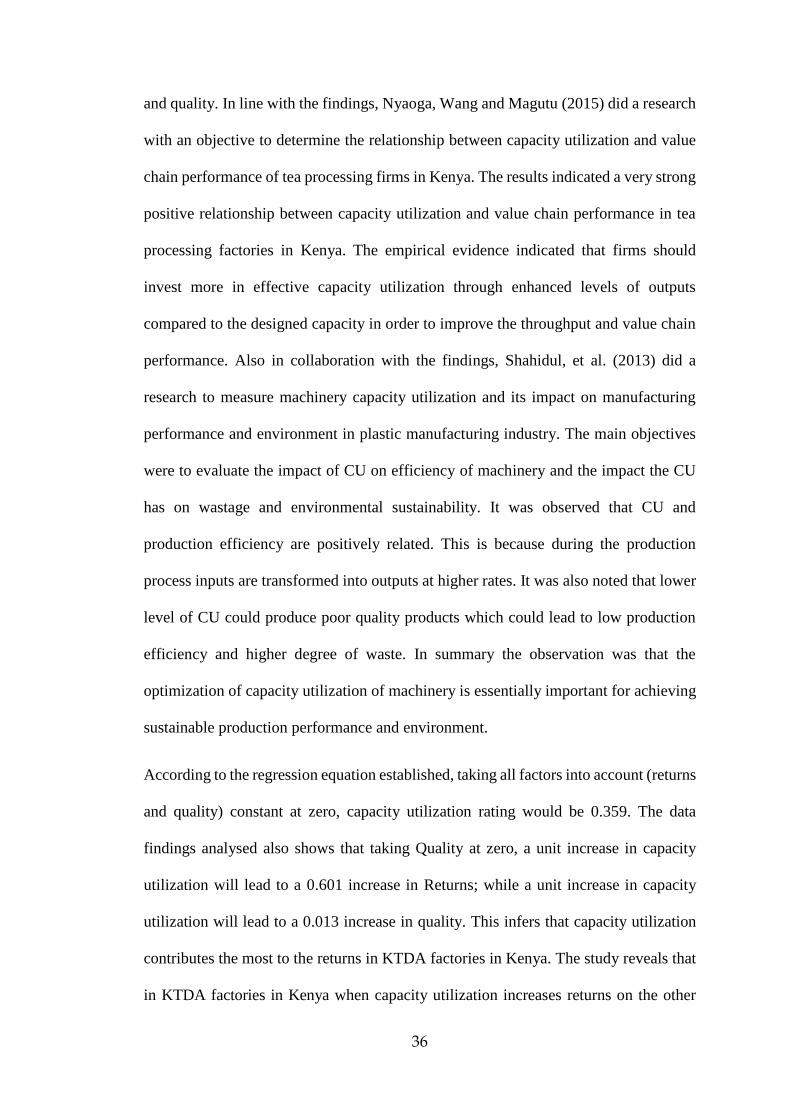
According to the regression equation established, taking all factors into account (returns
and quality) constant at zero, capacity utilization rating would be 0.359. The data
findings analysed also shows that taking Quality at zero, a unit increase in capacity
utilization will lead to a 0.601 increase in Returns; while a unit increase in capacity
utilization will lead to a 0.013 increase in quality. This infers that capacity utilization
contributes the most to the returns in KTDA factories in Kenya. The study reveals that
in KTDA factories in Kenya when capacity utilization increases returns on the other
37
hand also increases. There is also positive relationship between capacity utilization and
quality. Similar to the findings, Guy et al. (2005) did a study on impact of application
of Theory of Constraint in the health sector and found out that the number of patients
in outpatient increased but there was no actual value addition, the reason might have
been on issues to do with capacity.
38
CHAPTER FIVE
SUMMARY, CONCLUSIONS AND RECOMMENDATION
5.1 Introduction
The chapter provides the summary of the findings from chapter four, and it also gives
the conclusions and recommendations of the study based on the objectives of the study.
5.2 Summary of the Findings
The study established that there was low capacity utilization in KTDA factories. This
was mainly attributed to unreliable supply of the raw material (green leaf) which is
dependent on weather leading to idle capacity in KTDA factories.
The study established that there was a significant positive relationship between capacity
utilization and quality and also a significant positive relationship between capacity
utilization and returns in KTDA factories. It was further established that the relationship
between capacity utilization and returns was much stronger compared to the
relationship between capacity utilization and quality.
5.3 Conclusions
In relation to the objective of the study on establishing the capacity utilization in KTDA
factories, the study concludes that, KTDA factories are operating at a low capacity
utilization of 38.92%. In relation to the objective of the study on the effect of capacity
utilization and returns, it was found out that there is a significant positive relationship
between capacity utilization and returns to KTDA factories
In addition and in relation to the objective of the study on the effect of capacity
utilization on the quality of tea in KTDA factories, the findings conclude there is a
significant positive relationship between capacity utilization and quality hence capacity
utilization influences quality at KTDA factories in Kenya.
39
The study concludes that taking all factors into account (returns and quality) constant
at zero, capacity utilization rating would be 0.359. The study also concludes that taking
quality at zero, a unit increase in capacity utilization will lead to a 0.601 increase in
returns; while a unit increase in capacity utilization will lead to a 0.013 increase in
quality.
5.3 Policy recommendations
The study recommends that factories should improve in utilization of the already
installed capacity in order to improve on returns since the study shows that this will not
compromise the tea quality. This will directly translate into better payments to the small
scale tea farmers. However, it will be prudent to establish the optimum capacity
utilization level for every individual factory taking into account the effective capacity
since a negative relationship between capacity utilization and quality was observed in
a few factories.
The study shows that KTDA management need to focus more in the medium and long
term capacity planning in order to improve capacity utilization and factory returns in
the long run.
The management should also address the capacity mismatches identified through TOC
at different stages along the processing line in order to reduce the overall idle capacity
in the factories.
The study recommends that operations managers should do capacity planning in order
to match capacity with production for better financial performance of their firms.
Finally, the study recommends more funding by GOK towards tea research in key
research institutions like Tea Research Institute and the Universities to develop better

40
yielding tea clones for the farmers in order to improve the supply of raw material (green
leaf) to the factories. This will improve capacity utilization in KTDA factories.
5.4 Limitations of the study
The response rate was low at 57.4% hence making it difficult to generalize the findings
to all KTDA factories.
Time constraint was experienced as the amount of time available to collect data was
limited. The study used primary and secondary data; the data used may have been kept
for other purpose as opposed to this research objective.
5.5 Suggestions for further studies
Future research can use case studies of individual tea processing factories in an effort
to determine the relationship between capacity utilization, quality of tea and returns and
to validate the findings of this study.
Capacity utilization explains only 27.4% of the returns and quality at KTDA factories
in Kenya as represented by the R2. This therefore means that other factors affecting
returns and quality at KTDA factories in Kenya not studied in this research add up to
72.6%. Future research should thus be undertaken to examine the other factors affecting
returns and quality at KTDA factories in Kenya.
A research in capacity utilisation is recommended for multinational and other non
KTDA tea factories in Kenya for purposes of industry benchmarking.

41
REFERENCES
Bryman,A.& Bell,E.(2007). Nature of qualitative Research in Business. Business
Research Methods. New York: Oxford University Press.
Chow, K.& Krammer, L.(1990). All the Tea in China, 179, San Francisco: China book
and Periodicals.
Dwivedi, D.N. (2008). Theory of Economies and Diseconomies of scale. Managerial
Economics 7th Edition, Delhi: Maharaja Agrasen Institute of Management
Studies. 11(4) 277-279, New Delhi, India.
East Africa Tea Trade Association. Kenya Tea Industry Performance Report, 2014,
Mombasa, Kenya
Feenstra,D.W.,Wang, H. (2000). Economic and Accounting Rates of Return.
Department of Finance and Accounting, Faculty of Economics, University of
Groningen, Netherlands.
Feigenbaum. A. V. (1983).Total Quality Control, US: MCGraw-Hill, Food and
Agriculture Organization of the United Nations (2014), New York.
Frankel, J. & Romer, D. (1999). Does Trade Cause Growth? American Economic Review,
6: 379-399, New York.
International Institute for Sustainable Development (2014). Tea Market Report, IISD
14,297, Winnipeg, Canada
International Standards Organization standard(1986). ISO, 8402-1986, Geneva
Iraki, X.N. (2013) Capacity Utilization: The Forgotten Secret in Trading Out Poverty.
DBA Africa Management Review, August 2013, Vol 3 No.2 Pg 16-23,
University of Nairobi, Kenya.
Karugo, J. G. (2003). Effects of Liberalization on income of smallholder tea Producers
in central Kenya. Unpublished MBA project, University of Nairobi
Kathata, P.M. (2011).Factors which affect the quality of made tea in factories managed
by KTDA. Study of Thika District. Unpublished MBA Research Project,
University of Nairobi.
Kenya Tea Development Agency. 1995,1996,2004,2007, 2012 annual reports, Nairobi,
Kenya.
Kirkland, E.J., Walden, J.& Ward, J. (1999).National Marine Fisheries Service
Workshop of “Assessing Technical Efficiency and Capacity in Fisheries,
Maryland: Silver Spring publishers.
Klein, L,R.& Summers, R. (1966). The Wharton Index of Capacity Utilization.
University of Pennsylvania Economics, Research Unit.
KNBS. (2014). Kenya Bureau of Statistics annual report 2014, Nairobi, Kenya
Kothari C. R. (2004) Research Methodology, method and techniques 2nd Edition, New
Age International Publishers, College of Commerce, University of Rajasthan,
Jaipur, India

42
Krishedath, R. (2010). Measuring Capacity Utilization in the Manufacturing Sector of
Trinidad and Tobago. Economic bulletin.Volume xii no.2, 77
Kunwar, D. S, & Nyandemo, S.M. (2007). Law of Diminishing Returns, Managerial
Economics, 2nd Edition, 5, 96-97. Department of Economics, University of
Nairobi, Kenya
Levine, T., Ross, S. & Renelt, P.M. (2011). A Sensitivity Analysis of Cross Country
Growth Regressions, American Economic Review, 82 (4): 942-63. World Bank,
Washington D.C
M. I. Shahidul and S. T. Syed Shazali, (2011). “Dynamics of manufacturing
productivity: from labour intensive industries,” International Journal of
Manufacturing Technology Management, vol. 22, no. 5, pp. 664-674. Dublin
City University, Ireland.
Mbuthia, W.K. (2013). Improved design of the withering trough in tea processing: case
study Gacharage tea factory. Unpublished MBA Research Project, University
of Nairobi.
Miano, G. W. (2010). Determinants of tea export supply in Kenya (1970-2007)
Unpublished MBA project, University of Nairobi
Miller, C. W., & Pearce, N. T. (1988). Synergizing Total Quality and Innovation.
National Production Review/Winter.
Ministry of Planning Industries. (2013). Statistical Information on Plantation Crops
2012.55/75, Vauxhall Lane, Colombo 2.
Mugenda, O. N, & Mugenda A.G. (2003). Research Methods. A quantative and
qualitative approach. Nairobi: Acts Press.
Monroy L., Mulinge W., & Witwer, M. (2012). Analysis of incentives for tea in Kenya.
Technical notes series, MAFAP,FAO., Rome.
Nyaoga, R. B., M. Wang, & Magutu, P. O. (2015).The relationship between capacity
utilization and value chain performance: Evidence from Kenyan tea processing
firms. African journal of Business Management.Vol 5: 27- 46.
Oluoch, K. W. A. (1978). Smallholder tea sector in Kenya. Unpublished MBA project,
University of Nairobi.
Oluoko, A. (1999). Some aspects of smallholder tea production in Belgut division of
Kericho District. Unpublished MBA project, University of Nairobi
Phiri, M. A.& Mcwabe, T. (2013). Customers’ expectations and perceptions of service
quality: the case of pick n pay supermarket stores in Pietermaritzburg area,
South Africa. International Journal of Research in social Sciences.
Vol 3. No 2. 16-23.
Ragan, F.(1976). Measuring Capacity Utilization in manufacturing. FRBM Quarterly
Review. Vol 4: 248 – 63. New York
Ruxton, C.H.S. (2012). The Health Effects of black tea and flavonoids. Nutrition
Communications, Cupar, UK.
Sarbapriya, R. (2013). A Close Look into Research Studies on Capacity Utilization in
43
India and Abroad .International Journal of Economics, Finance and
Management. 82 (4): 942-63. University of Calcutta, India
Shahidul, M. S., Sahzali, T.S., Abdullah, Y.C.T., Hashamuddin, A.H., Azrin, M.S., &
Adzlan, A.F.K. (2013).Measuring Machinery Capacity Utilization and Its
Impact on Manufacturing Performance and Environment. Manufacturing
Operations Research and Sustainability, Volume (1), No. (1), 7-12, University
of Malaysia.
Singleton, C., H. (2009). Intervention for Dyslexia Bracknail. The Dylexia-Specific
Learning Difficulties. University of Hull, UK.
Tashkkori, A., & Teddie, C. (2003). Handbook of Mixed Methods in Social &
Behavioural Research. Sage: Thousand Oaks. Sage
Tea Board of Kenya. Annual Production Reports. 2010,2011,212,2013 2014,
Nairobi,Kenya
Tea Council of Canada. Annual tea Report. 2012. North York, Canada
Tea Research Foundation of Kenya. (2002). Tea Growers Handbook, 5Th Edition, 1, 1-
5, Kericho, Kenya
Zeithaml, V, A. & Bitner, M, J. (1990).Service Marketing, McGraw-Hill., US

44
APPENDIXES
Appendix I: Tea Growing Areas in Kenya
Source; KTDA
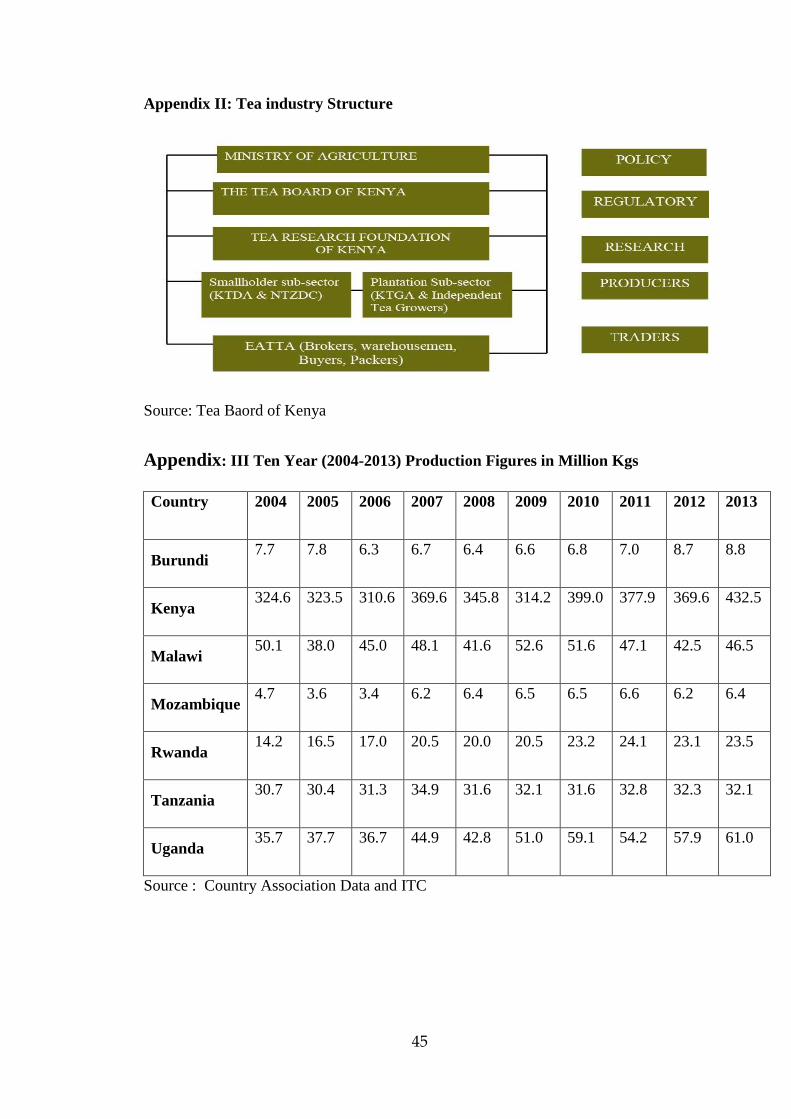
45
Appendix II: Tea industry Structure
Source: Tea Baord of Kenya
Appendix: III Ten Year (2004-2013) Production Figures in Million Kgs
Country 2004 2005 2006 2007 2008 2009 2010 2011 2012 2013
Burundi 7.7 7.8 6.3 6.7 6.4 6.6 6.8 7.0 8.7 8.8
Kenya 324.6 323.5 310.6 369.6 345.8 314.2 399.0 377.9 369.6 432.5
Malawi 50.1 38.0 45.0 48.1 41.6 52.6 51.6 47.1 42.5 46.5
Mozambique 4.7 3.6 3.4 6.2 6.4 6.5 6.5 6.6 6.2 6.4
Rwanda 14.2 16.5 17.0 20.5 20.0 20.5 23.2 24.1 23.1 23.5
Tanzania 30.7 30.4 31.3 34.9 31.6 32.1 31.6 32.8 32.3 32.1
Uganda 35.7 37.7 36.7 44.9 42.8 51.0 59.1 54.2 57.9 61.0
Source : Country Association Data and ITC
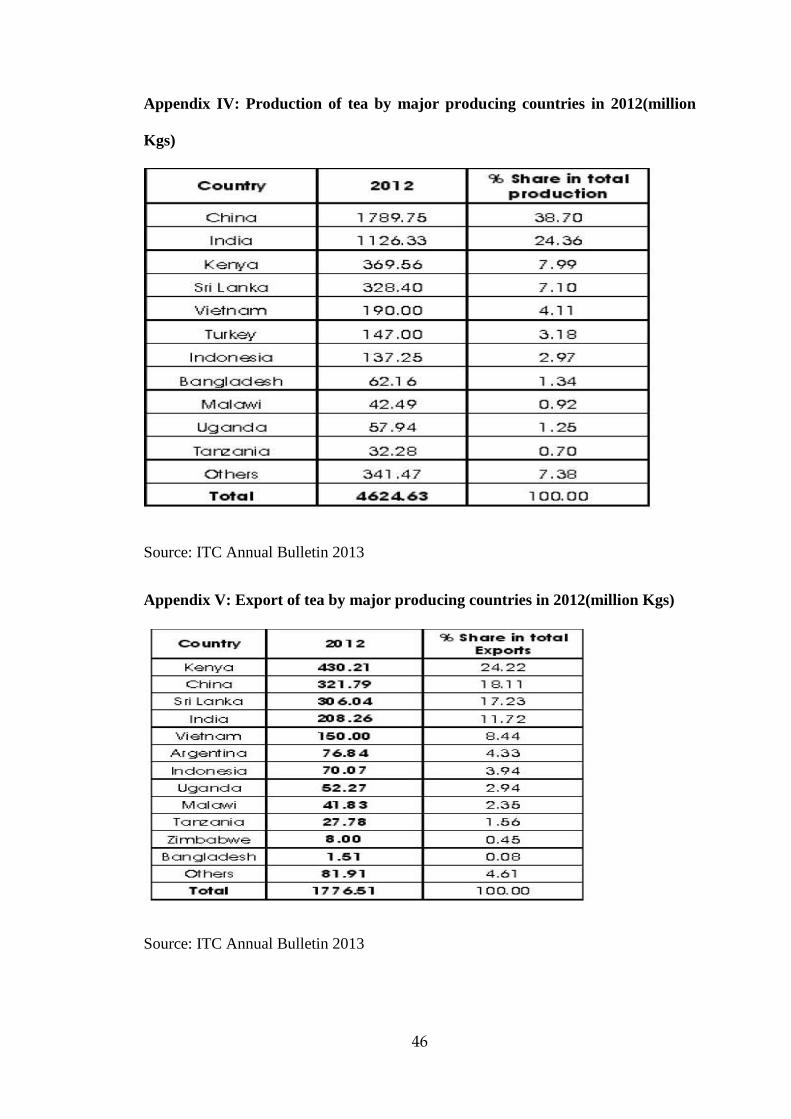
46
Appendix IV: Production of tea by major producing countries in 2012(million
Kgs)
Source: ITC Annual Bulletin 2013
Appendix V: Export of tea by major producing countries in 2012(million Kgs)
Source: ITC Annual Bulletin 2013
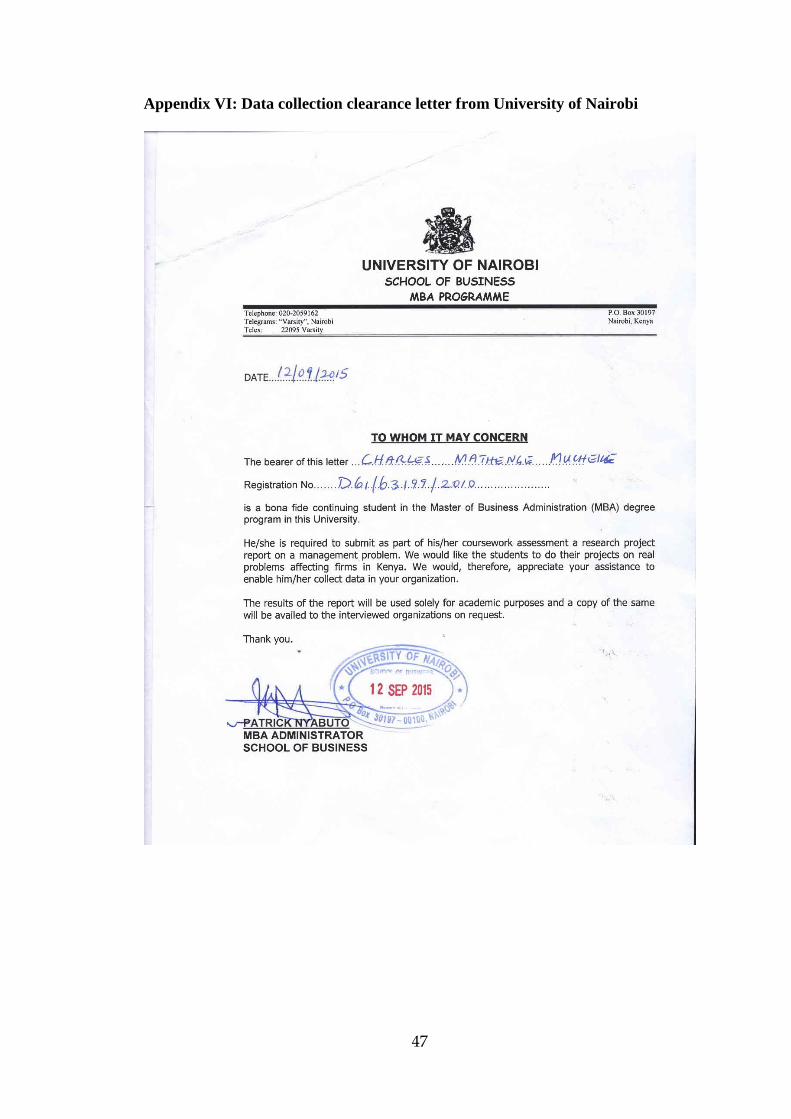
47
Appendix VI: Data collection clearance letter from University of Nairobi
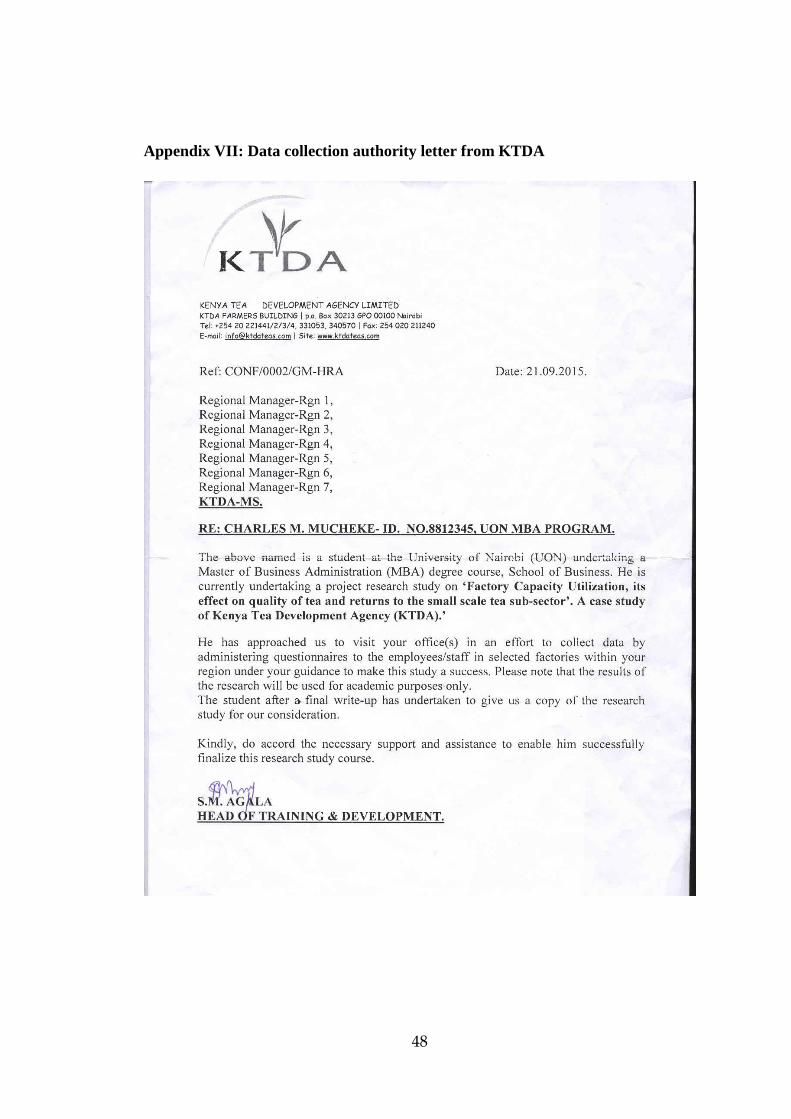
48
Appendix VII: Data collection authority letter from KTDA

49
Appendix VIII: Research Questionnaire
Research Questionnaire
FACTORY CAPACITY UTILIZATION
This questionnaire is aimed at obtaining data for a Research Project (UON) whose
objective is to establish the relationship between capacity utilization, quality of tea and
returns to KTDA factories. It consists of four sections which will help in getting the
relevant information and data required for this study. Kindly fill in all the information
in the spaces provided. The research will benefit your factory, KTDA, GOK, the
university and the tea industry.
Section A:
This section requires information on the factory. Kindly fill the information in the
spaces provided.
Name of Factory…………………………………………..
Year commissioned………………………………………..
Managing Agent…………………………………………..
Region………………………………………………………
County…………………………………………………….
Name of Manager………………………………………..
Designation………………………………Signature……………………….
Email Address……………………………
Official Stamp………………….Date……….
Section B:
This section consists of 7 questions regarding the machinery installed and their
processing capacities. Kindly fill in the information required in spaces provided.
1. Withering: No. of troughs ______________
Size of troughs ______________
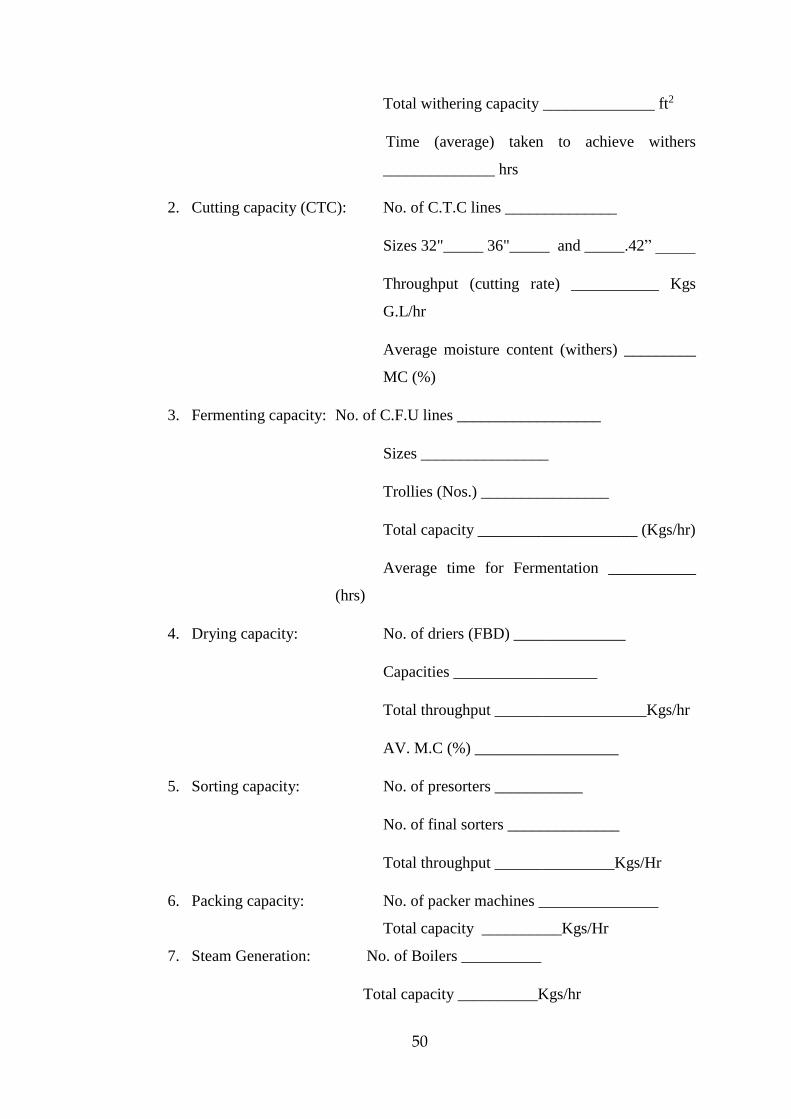
50
Total withering capacity ______________ ft2
Time (average) taken to achieve withers
______________ hrs
2. Cutting capacity (CTC): No. of C.T.C lines ______________
Sizes 32"_____ 36"_____ and _____.42” _____
Throughput (cutting rate) ___________ Kgs
G.L/hr
Average moisture content (withers) _________
MC (%)
3. Fermenting capacity: No. of C.F.U lines __________________
Sizes ________________
Trollies (Nos.) ________________
Total capacity ____________________ (Kgs/hr)
Average time for Fermentation ___________
(hrs)
4. Drying capacity: No. of driers (FBD) ______________
Capacities __________________
Total throughput ___________________Kgs/hr
AV. M.C (%) __________________
5. Sorting capacity: No. of presorters ___________
No. of final sorters ______________
Total throughput _______________Kgs/Hr
6. Packing capacity: No. of packer machines _______________
Total capacity __________Kgs/Hr
7. Steam Generation: No. of Boilers __________
Total capacity __________Kgs/hr
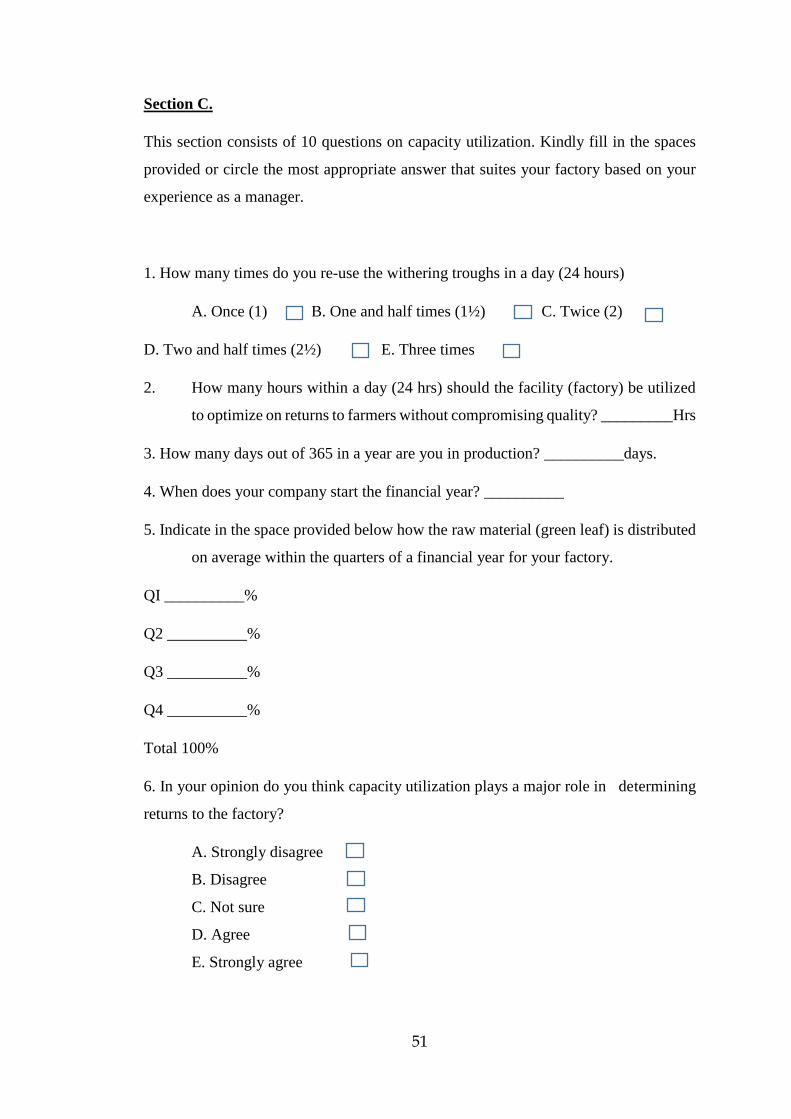
51
Section C.
This section consists of 10 questions on capacity utilization. Kindly fill in the spaces
provided or circle the most appropriate answer that suites your factory based on your
experience as a manager.
1. How many times do you re-use the withering troughs in a day (24 hours)
A. Once (1) B. One and half times (1½) C. Twice (2)
D. Two and half times (2½) E. Three times
2. How many hours within a day (24 hrs) should the facility (factory) be utilized
to optimize on returns to farmers without compromising quality? _________Hrs
3. How many days out of 365 in a year are you in production? __________days.
4. When does your company start the financial year? __________
5. Indicate in the space provided below how the raw material (green leaf) is distributed
on average within the quarters of a financial year for your factory.
QI __________%
Q2 __________%
Q3 __________%
Q4 __________%
Total 100%
6. In your opinion do you think capacity utilization plays a major role in determining
returns to the factory?
A. Strongly disagree
B. Disagree
C. Not sure
D. Agree
E. Strongly agree
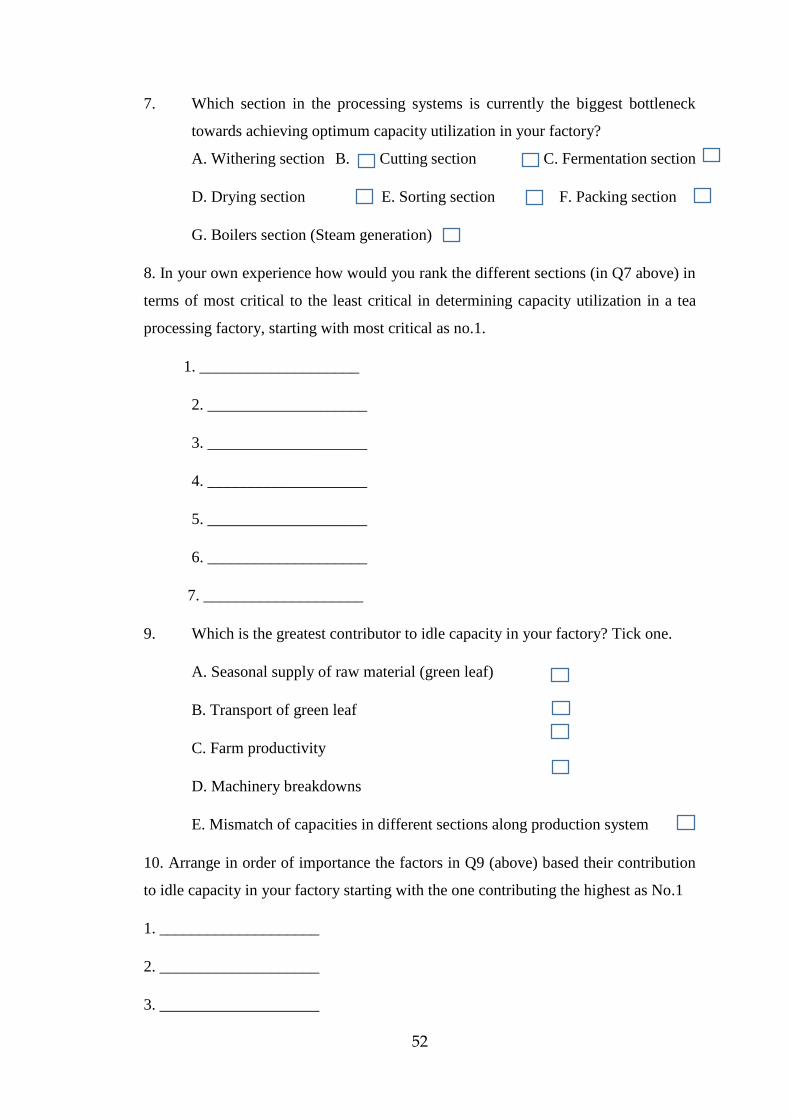
52
7. Which section in the processing systems is currently the biggest bottleneck
towards achieving optimum capacity utilization in your factory?
A. Withering section B. Cutting section C. Fermentation section
D. Drying section E. Sorting section F. Packing section
G. Boilers section (Steam generation)
8. In your own experience how would you rank the different sections (in Q7 above) in
terms of most critical to the least critical in determining capacity utilization in a tea
processing factory, starting with most critical as no.1.
1. ____________________
2. ____________________
3. ____________________
4. ____________________
5. ____________________
6. ____________________
7. ____________________
9. Which is the greatest contributor to idle capacity in your factory? Tick one.
A. Seasonal supply of raw material (green leaf)
B. Transport of green leaf
C. Farm productivity
D. Machinery breakdowns
E. Mismatch of capacities in different sections along production system
10. Arrange in order of importance the factors in Q9 (above) based their contribution
to idle capacity in your factory starting with the one contributing the highest as No.1
1. ____________________
2. ____________________
3. ____________________
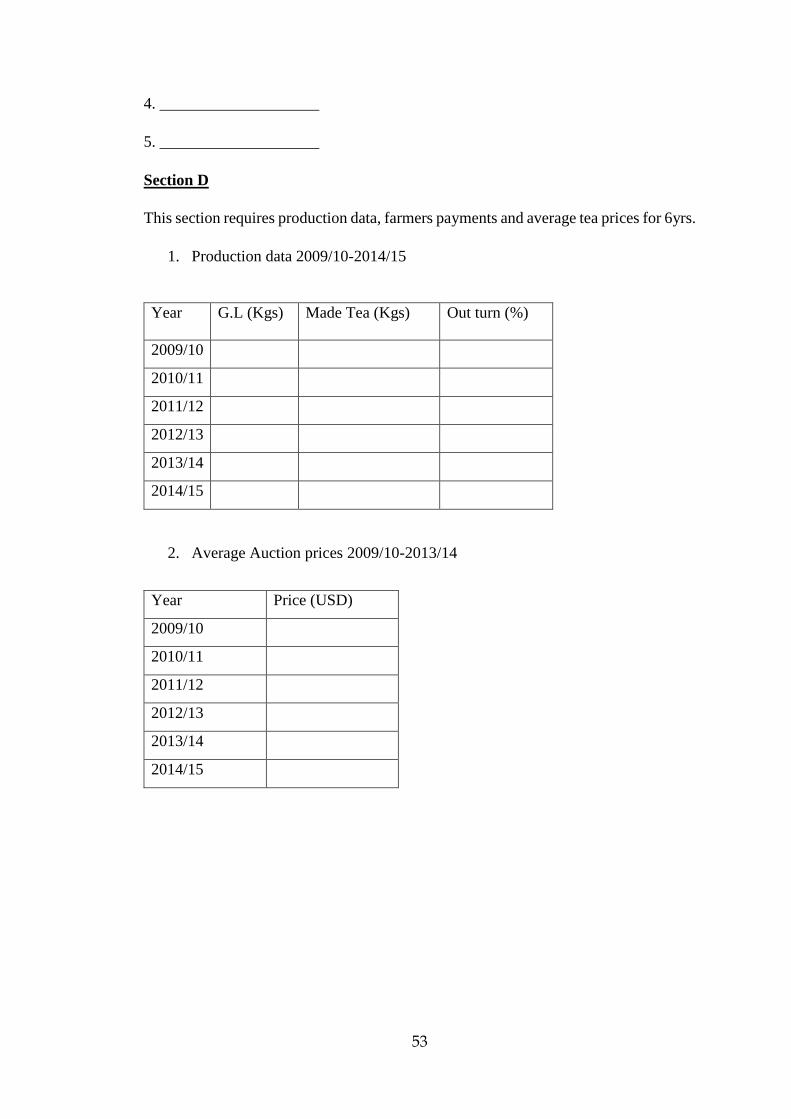
53
4. ____________________
5. ____________________
Section D
This section requires production data, farmers payments and average tea prices for 6yrs.
1. Production data 2009/10-2014/15
2. Average Auction prices 2009/10-2013/14
Year G.L (Kgs) Made Tea (Kgs) Out turn (%)
2009/10
2010/11
2011/12
2012/13
2013/14
2014/15
Year Price (USD)
2009/10
2010/11
2011/12
2012/13
2013/14
2014/15

54
3. Farmers Payments 2009/10-2013/14
Year Monthly
Pay(Ksh.)
Mini Bonus
(KSh.)
Final Pay
(Bonus) Ksh.)
Total Pay
(Ksh.)
2009/10
2010/11
2011/12
2012/13
2013/14
2014/15
Give any other information you consider relevant to this study including 2014/15 data
if the results are out.
THANK YOU

55
Appendix IX: Raw data on variables
Factory Capacity utilization
(%)
Returns (USD) Quality Index
Mwamu 18 2.07 2.89
Igembe 26 2.38 3.24
Ndima 28 2.60 3.2
Gatunguru 28 2.18 3.04
Litein 31 2.13 2.69
Kanyenyaini 32 2.76 3.02
Giachore 32 2.13 2.77
Kobel 32 2.00 2.74
Mungania 33 2.74 3.13
Kapsara 35 1.90 2.64
Makomboki 36 2.65 3.11
Rukuriri 36 2.75 3.17
Kionyo 37 2.58 3.16
Nduti 37 2.67 3.06
Ngere 38 2.92 3.13
Njunu 38 2.21 3.03
Mununga 39 2.75 3.22
Kangaita 39 2.23 3.00
Kinoro 40 2.60 3.01
Gacharage 42 2.48 2.93
Theta 42 2.34 2.98
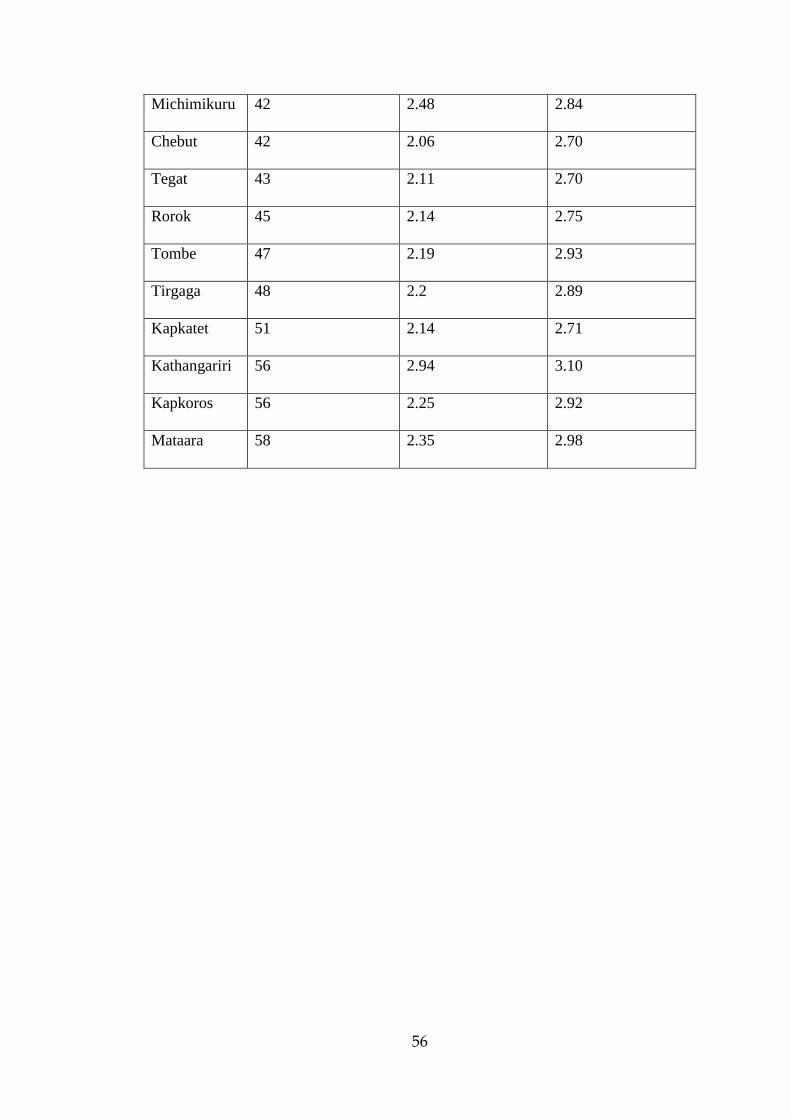
56
Michimikuru 42 2.48 2.84
Chebut 42 2.06 2.70
Tegat 43 2.11 2.70
Rorok 45 2.14 2.75
Tombe 47 2.19 2.93
Tirgaga 48 2.2 2.89
Kapkatet 51 2.14 2.71
Kathangariri 56 2.94 3.10
Kapkoros 56 2.25 2.92
Mataara 58 2.35 2.98