Cancer Burden and Trends in the Asian Pacific Rim Region
22
Binh H Yang et al Asian Pacific Journal of Cancer Prevention, Vol 5, 2004 96 Asian Pacific J Cancer Prev, 5, 96-117 REVIEW Introduction With the control of infectious diseases in the countries of the Asian Pacific Rim, the importance of non- communicable diseases such as cancer is sure to increase. This paper will describe the current burden of cancer such as incidence, mortality, and prevalence, discuss the dominant risk factors, time trends, and prevention routes for the top cancers, and project future cancer trends in the Asian Pacific Rim region. We will be focusing on Asia and the Pacific Islands of the Pacific Rim. The data will be divided into five regions: Eastern Asia (Japan), Eastern Asia (South and North Korea), Eastern Asia (China), South-Eastern Asia, and the Pacific Islands. Japan is separated as its own region because it is generally categorized as a ‘developed’ country, whereas the rest of Eastern Asia, as well as the rest of the Asian Pacific Rim, is considered ‘developing’ (World Bank, 1993). We further chose to separate China and Korea to prevent China’s results from overshadowing those of South and North Korea due to the much larger population size of China. The Pacific Islands includes the islands of Melanesia, Micronesia, and Polynesia. Cancer Burden and Trends in the Asian Pacific Rim Region Binh H Yang 1 , D Maxwell Parkin 2 , Lin Cai 3 , Zuo-Feng Zhang 1 1 Department of Epidemiology, University of California, Los Angeles (UCLA), School of Public Health, CA 90095, USA . 2 Unit of Descriptive Epidemiology, International Agency for Research on Cancer (IARC), 69372 Lyon Cedex 08, France. 3 Department of Epidemiology, Fujian Medical University, School of Public Health, Fuzhou, Fujian, People’s Republic of China Correspondence: Zuo-Feng Zhang, M.D., Ph.D., Professor of Epidemiology, Department of Epidemiology, UCLA School of Public Health, 71-225 CHS, Box 951772, Los Angeles, CA 90095-1772, USA Tel: +1 (310) 825-8418 Fax: +1 (310) 206-6039 E-mail: [email protected] Abstract This paper describes the current cancer burden and time trends, discusses dominant risk factors and prevention and control strategies, and makes future projections for the top eight cancers (stomach, lung, liver, colon/rectum, esophagus, breast, cervix, and leukemia) in the Asian Pacific Rim region. The future cancer trends through to the year 2050 are projected based on population dynamics, including population growth and ageing. In 2000, the Asian Pacific Rim had over 3 million new cancer cases, over 2 million cancer deaths, and 5.4 million people living with cancer. In 2050, 7.8 million new cancer cases and 5.7 million deaths from cancer are projected. The current cancer burden and the future projection provide facts that cancer is and will be a very serious public health problem in the Asian Pacific Rim region and will assist public health officers and cancer researchers in the design and establishment of public health policies, prioritization of future research, and application of current knowledge in the prevention and control of cancer. Key Words: Cancer burden - risk factors - time trends - prevention - cancer projections - Asian Pacific Rim Indices of “Burden” There are many indices for measuring burden, or impact, of a disease. The three indices we will use in this analysis to assess the burden of cancer are incidence, mortality, and prevalence. Other indices that will not be further discussed but are used as well are years of life lost (YLLs), disability- adjusted life years (DALYs), and quality-adjusted life years (QALYs). Incidence measures the frequency of new cases in a population. Often, it is expressed as an absolute number of newly diagnosed cases in the defined population or as a rate of new cases per 100,000 persons per year. The incidence rate gives an estimate of the average risk of developing the cancer in question. Also, it allows for comparisons of risk of developing the cancer among different populations. For evaluating the effectiveness of primary prevention strategies, incidence would be the most appropriate indicator. Mortality measures the frequency of deaths in a population. Like incidence, mortality is also commonly expressed as an absolute number of deaths in a defined population or as a rate per 100,000 persons per year.
-
Upload
khangminh22 -
Category
Documents
-
view
1 -
download
0
Transcript of Cancer Burden and Trends in the Asian Pacific Rim Region
Binh H Yang et al
Asian Pacific Journal of Cancer Prevention, Vol 5, 200496
Asian Pacific J Cancer Prev, 5, 96-117
REVIEW
Introduction
With the control of infectious diseases in the countriesof the Asian Pacific Rim, the importance of non-communicable diseases such as cancer is sure to increase.This paper will describe the current burden of cancer suchas incidence, mortality, and prevalence, discuss the dominantrisk factors, time trends, and prevention routes for the topcancers, and project future cancer trends in the Asian PacificRim region. We will be focusing on Asia and the PacificIslands of the Pacific Rim. The data will be divided intofive regions: Eastern Asia (Japan), Eastern Asia (South andNorth Korea), Eastern Asia (China), South-Eastern Asia, andthe Pacific Islands. Japan is separated as its own regionbecause it is generally categorized as a ‘developed’ country,whereas the rest of Eastern Asia, as well as the rest of theAsian Pacific Rim, is considered ‘developing’ (World Bank,1993). We further chose to separate China and Korea toprevent China’s results from overshadowing those of Southand North Korea due to the much larger population size ofChina. The Pacific Islands includes the islands of Melanesia,Micronesia, and Polynesia.
Cancer Burden and Trends in the Asian Pacific Rim Region
Binh H Yang1, D Maxwell Parkin2, Lin Cai3, Zuo-Feng Zhang1
1Department of Epidemiology, University of California, Los Angeles (UCLA), School of Public Health, CA 90095, USA . 2Unit of DescriptiveEpidemiology, International Agency for Research on Cancer (IARC), 69372 Lyon Cedex 08, France. 3Department of Epidemiology,Fujian Medical University, School of Public Health, Fuzhou, Fujian, People’s Republic of ChinaCorrespondence: Zuo-Feng Zhang, M.D., Ph.D., Professor of Epidemiology, Department of Epidemiology, UCLA School of PublicHealth, 71-225 CHS, Box 951772, Los Angeles, CA 90095-1772, USA Tel: +1 (310) 825-8418 Fax: +1 (310) 206-6039 E-mail:[email protected]
Abstract
This paper describes the current cancer burden and time trends, discusses dominant risk factors and preventionand control strategies, and makes future projections for the top eight cancers (stomach, lung, liver, colon/rectum,esophagus, breast, cervix, and leukemia) in the Asian Pacific Rim region. The future cancer trends through to theyear 2050 are projected based on population dynamics, including population growth and ageing. In 2000, the AsianPacific Rim had over 3 million new cancer cases, over 2 million cancer deaths, and 5.4 million people living withcancer. In 2050, 7.8 million new cancer cases and 5.7 million deaths from cancer are projected. The current cancerburden and the future projection provide facts that cancer is and will be a very serious public health problem in theAsian Pacific Rim region and will assist public health officers and cancer researchers in the design and establishmentof public health policies, prioritization of future research, and application of current knowledge in the preventionand control of cancer.
Key Words: Cancer burden - risk factors - time trends - prevention - cancer projections - Asian Pacific Rim
Indices of “Burden”
There are many indices for measuring burden, or impact,of a disease. The three indices we will use in this analysisto assess the burden of cancer are incidence, mortality, andprevalence. Other indices that will not be further discussedbut are used as well are years of life lost (YLLs), disability-adjusted life years (DALYs), and quality-adjusted life years(QALYs).
Incidence measures the frequency of new cases in apopulation. Often, it is expressed as an absolute number ofnewly diagnosed cases in the defined population or as a rateof new cases per 100,000 persons per year. The incidencerate gives an estimate of the average risk of developing thecancer in question. Also, it allows for comparisons of riskof developing the cancer among different populations. Forevaluating the effectiveness of primary prevention strategies,incidence would be the most appropriate indicator.
Mortality measures the frequency of deaths in apopulation. Like incidence, mortality is also commonlyexpressed as an absolute number of deaths in a definedpopulation or as a rate per 100,000 persons per year.
Asian Pacific Journal of Cancer Prevention, Vol 5, 200497
Cancer in the Asian Pacific
Mortality is a reflection of both the incidence and survival(which will be further explained below) of a given cancer,such that the higher the incidence and the shorter the survivalof a cancer the higher the mortality will be. Thus, themortality rate gives an estimate of the average populationrisk of dying from the cancer in question. Mortality is oftenchosen as an indicator because the data for it is generallymore readily available.
Prevalence specifically measures the number of peoplealive in a population who have ever been diagnosed with agiven cancer in the past. Prevalence by this definition,however, is not particularly practical for healthcare planningpurposes since the regimen for treating newly diagnosedpatients is quite different from that for long-term survivors,whom often may be considered ‘cured’ if the survival timeis very long. Prevalence, therefore, is commonly given as apartial prevalence, or the number of cases diagnosed withina fixed time period in the past. It is often expressed as theprevalence within 5 years since patients of most cancers wholive beyond 5 years after diagnosis are considered to be‘cured’ of the cancer.
Survival is the time between cancer diagnosis and death.It is commonly expressed as a 5-year survival, which is thepercentage of patients alive after 5 years of follow-up fromthe diagnosis date.
As previously mentioned, incidence, mortality, andprevalence data will be used in this paper to assess the burdenof cancer. Incidence and mortality data will be presented
by the absolute number of people developing and dying,respectively, from cancer and as a rate per 100,000 personsper year. Incidence and mortality rates will be age-standardized to the world standard population (Doll et al.,1967) to allow for comparisons between differentpopulations. Age-standardization accounts for differencesin the age structures between populations. Prevalence willbe presented within a 5-year period. For the site-specificcancers that are further discussed later in the paper, thefollowing ICD-10 codes were used unless specifiedotherwise: stomach (C16), lung (C33 and C34), liver (C22),colon/rectum (C18-C20), esophagus (C15), female breast(C50), cervix uteri (C53), and leukemia (C91-95) (WorldHealth Organization, 1992).
Data Sources
Data for this review were retrieved primarily from sixsources. Current incidence, mortality, prevalence, and futuretrend estimates were obtained from the GLOBOCAN 2000database (Ferlay et al., 2001). Survival information wasobtained from ‘Cancer Survival in Developing Countries’(Sankaranarayanan et al., 1998), the Osaka Tumor Registry(Department of Cancer Control and Statistics, 2003), and‘Cancer Facts & Figures’ (American Cancer Society, 2002).Age-standardized incidence rates for time trends wereobtained from ‘Cancer Incidence in Five Continents’(Waterhouse et al., 1982; Muir et al., 1987; Parkin et al.,
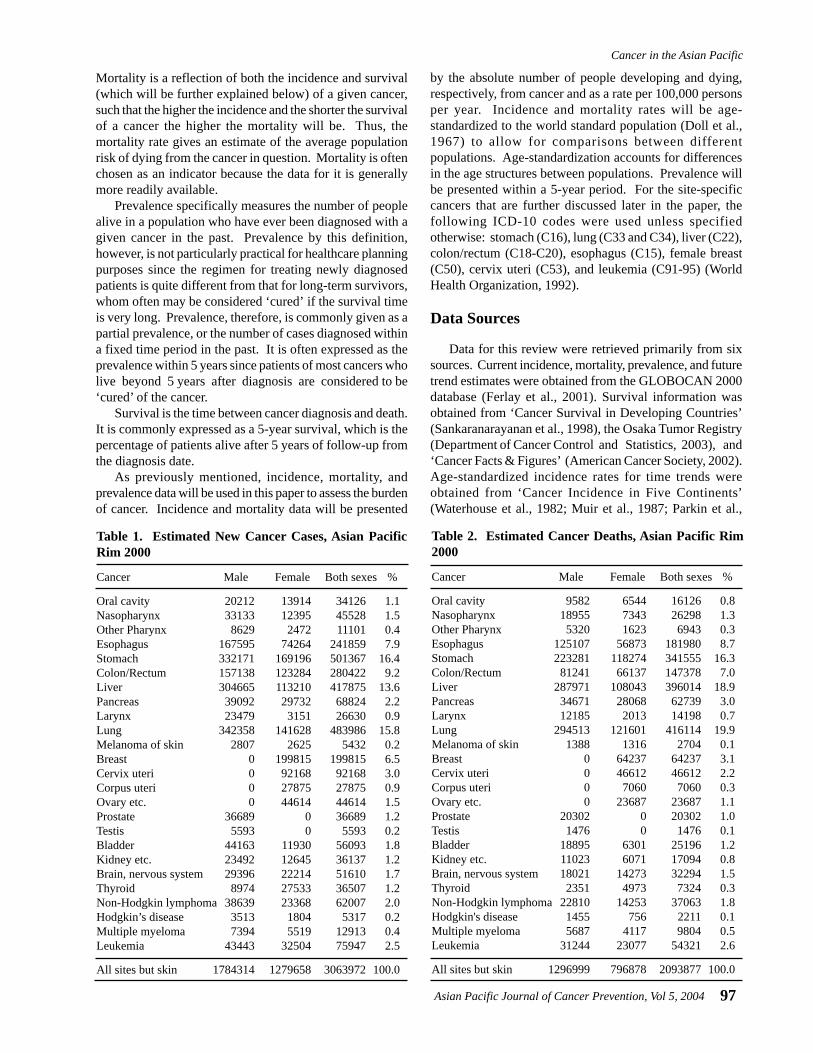
Table 1. Estimated New Cancer Cases, Asian PacificRim 2000
Cancer Male Female Both sexes %
Oral cavity 20212 13914 34126 1.1Nasopharynx 33133 12395 45528 1.5Other Pharynx 8629 2472 11101 0.4Esophagus 167595 74264 241859 7.9Stomach 332171 169196 501367 16.4Colon/Rectum 157138 123284 280422 9.2Liver 304665 113210 417875 13.6Pancreas 39092 29732 68824 2.2Larynx 23479 3151 26630 0.9Lung 342358 141628 483986 15.8Melanoma of skin 2807 2625 5432 0.2Breast 0 199815 199815 6.5Cervix uteri 0 92168 92168 3.0Corpus uteri 0 27875 27875 0.9Ovary etc. 0 44614 44614 1.5Prostate 36689 0 36689 1.2Testis 5593 0 5593 0.2Bladder 44163 11930 56093 1.8Kidney etc. 23492 12645 36137 1.2Brain, nervous system 29396 22214 51610 1.7Thyroid 8974 27533 36507 1.2Non-Hodgkin lymphoma 38639 23368 62007 2.0Hodgkin’s disease 3513 1804 5317 0.2Multiple myeloma 7394 5519 12913 0.4Leukemia 43443 32504 75947 2.5
All sites but skin 1784314 1279658 3063972 100.0
Table 2. Estimated Cancer Deaths, Asian Pacific Rim2000
Cancer Male Female Both sexes %
Oral cavity 9582 6544 16126 0.8Nasopharynx 18955 7343 26298 1.3Other Pharynx 5320 1623 6943 0.3Esophagus 125107 56873 181980 8.7Stomach 223281 118274 341555 16.3Colon/Rectum 81241 66137 147378 7.0Liver 287971 108043 396014 18.9Pancreas 34671 28068 62739 3.0Larynx 12185 2013 14198 0.7Lung 294513 121601 416114 19.9Melanoma of skin 1388 1316 2704 0.1Breast 0 64237 64237 3.1Cervix uteri 0 46612 46612 2.2Corpus uteri 0 7060 7060 0.3Ovary etc. 0 23687 23687 1.1Prostate 20302 0 20302 1.0Testis 1476 0 1476 0.1Bladder 18895 6301 25196 1.2Kidney etc. 11023 6071 17094 0.8Brain, nervous system 18021 14273 32294 1.5Thyroid 2351 4973 7324 0.3Non-Hodgkin lymphoma 22810 14253 37063 1.8Hodgkin's disease 1455 756 2211 0.1Multiple myeloma 5687 4117 9804 0.5Leukemia 31244 23077 54321 2.6
All sites but skin 1296999 796878 2093877 100.0

Binh H Yang et al
Asian Pacific Journal of Cancer Prevention, Vol 5, 200498
1992; Parkin et al., 1997; Parkin et al., 2002). Populationprojections were taken from ‘World Population Prospects:The 2000 Revision’ (United Nations, 2001).
Current Cancer Burden
In 2000, the Asian Pacific Rim contained 24% of theworld’s total population. The Asian Pacific Rim had over 3million new cases (Table 1), over 2 million deaths (Table2), and 5.4 million people living with cancer (Table 3), whichaccounts for 30% of the world’s new cases and 34% of theworld’s cancer deaths. The most commonly occurring newcancers are stomach (16.4%), lung (15.8%), and liver(13.6%). The top three killers include lung (19.9%), liver(18.9%), and stomach (16.3%). Cancers of the stomach(16.4%), breast (13.0%), and colon/rectum (12.3%) are themost prevalent cancers. Non-melanoma skin cancer isexcluded from the total because of the lack of data anddifficulty of measurement for this tumor.
The rankings of these cancers in males are different fromthe rankings in females. The ten most common cancers bysex based on the number of new cases is shown in Figure 1,the ten top cancer killers based on the number of deaths isshown in Figure 2, and the ten most prevalent cancers basedon the five-year prevalence is shown in Figure 3. Themortality to incidence ratio can be used as an indicator ofcase fatality. When comparing Figures 1 and 2, the high
Figure 1. Number of New Cases (in thousands) for the10 most Common Cancers, 2000
Figure 2. Number of Deaths (in thousands) for the 10most Common Cancers, 2000
Figure 3. Five-year Prevalence (in thousands) for the 10most Prevalent Cancers, 2000
Table 3. Estimated 5-year Prevalence of Cancer, AsianPacific Rim 2000
Cancer Male Female Both sexes %
Oral cavity 53184 31442 84626 1.6Nasopharynx 86009 32920 118928 2.2Other Pharynx 17060 4563 21623 0.4Esophagus 164127 68917 233044 4.3Stomach 600141 291625 891766 16.4Colon/Rectum 372772 296342 669113 12.3Liver 142752 51954 194707 3.6Pancreas 18613 13441 32054 0.6Larynx 59164 7848 67012 1.2Lung 406294 153351 559645 10.3Melanoma of skin 7857 7767 15624 0.3Breast 0 707195 707195 13.0Cervix uteri 0 266100 266100 4.9Corpus uteri 0 106662 106662 2.0Ovary etc. 0 121531 121531 2.2Prostate 85677 0 85677 1.6Testis 18161 0 18161 0.3Bladder 109384 30506 139890 2.6Kidney etc. 54535 28648 83183 1.5Brain, nervous system 52479 37182 89661 1.7Thyroid 36621 114057 150678 2.8Non-Hodgkin lymphoma 76662 48554 125216 2.3Hodgkin's disease 9199 4663 13862 0.3Multiple myeloma 11138 9105 20243 0.4Leukemia 49782 38979 88761 1.6
All sites but skin 2687032 2738589 5425621 100.0
case fatality and magnitude of liver and lung cancerunderlines their importance in the Asian Pacific Rim, withmortality to incidence ratios of 0.95 and 0.86, respectively.The ratio between prevalence and incidence can be used asan indicator of prognosis. Comparing Figures 1 and 3, wesee that although breast cancer falls below liver and lung
Asian Pacific Journal of Cancer Prevention, Vol 5, 200499
Cancer in the Asian Pacific
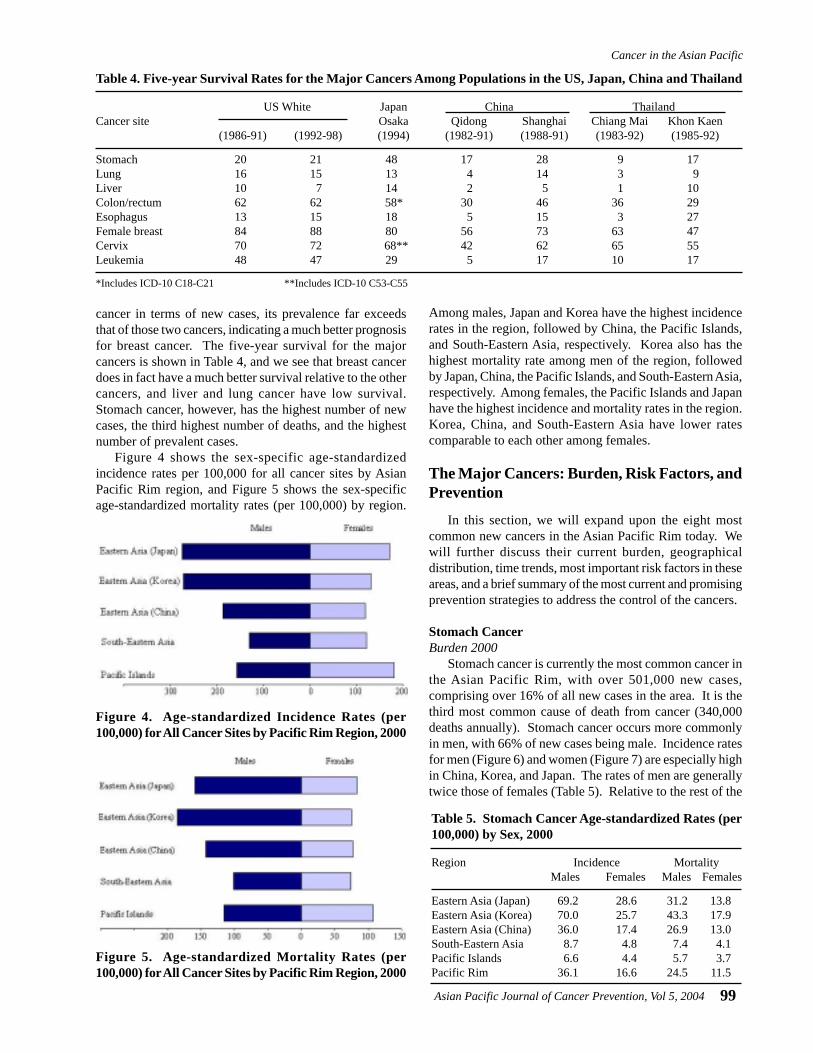
cancer in terms of new cases, its prevalence far exceedsthat of those two cancers, indicating a much better prognosisfor breast cancer. The five-year survival for the majorcancers is shown in Table 4, and we see that breast cancerdoes in fact have a much better survival relative to the othercancers, and liver and lung cancer have low survival.Stomach cancer, however, has the highest number of newcases, the third highest number of deaths, and the highestnumber of prevalent cases.
Figure 4 shows the sex-specific age-standardizedincidence rates per 100,000 for all cancer sites by AsianPacific Rim region, and Figure 5 shows the sex-specificage-standardized mortality rates (per 100,000) by region.
Among males, Japan and Korea have the highest incidencerates in the region, followed by China, the Pacific Islands,and South-Eastern Asia, respectively. Korea also has thehighest mortality rate among men of the region, followedby Japan, China, the Pacific Islands, and South-Eastern Asia,respectively. Among females, the Pacific Islands and Japanhave the highest incidence and mortality rates in the region.Korea, China, and South-Eastern Asia have lower ratescomparable to each other among females.
The Major Cancers: Burden, Risk Factors, andPrevention
In this section, we will expand upon the eight mostcommon new cancers in the Asian Pacific Rim today. Wewill further discuss their current burden, geographicaldistribution, time trends, most important risk factors in theseareas, and a brief summary of the most current and promisingprevention strategies to address the control of the cancers.
Stomach CancerBurden 2000
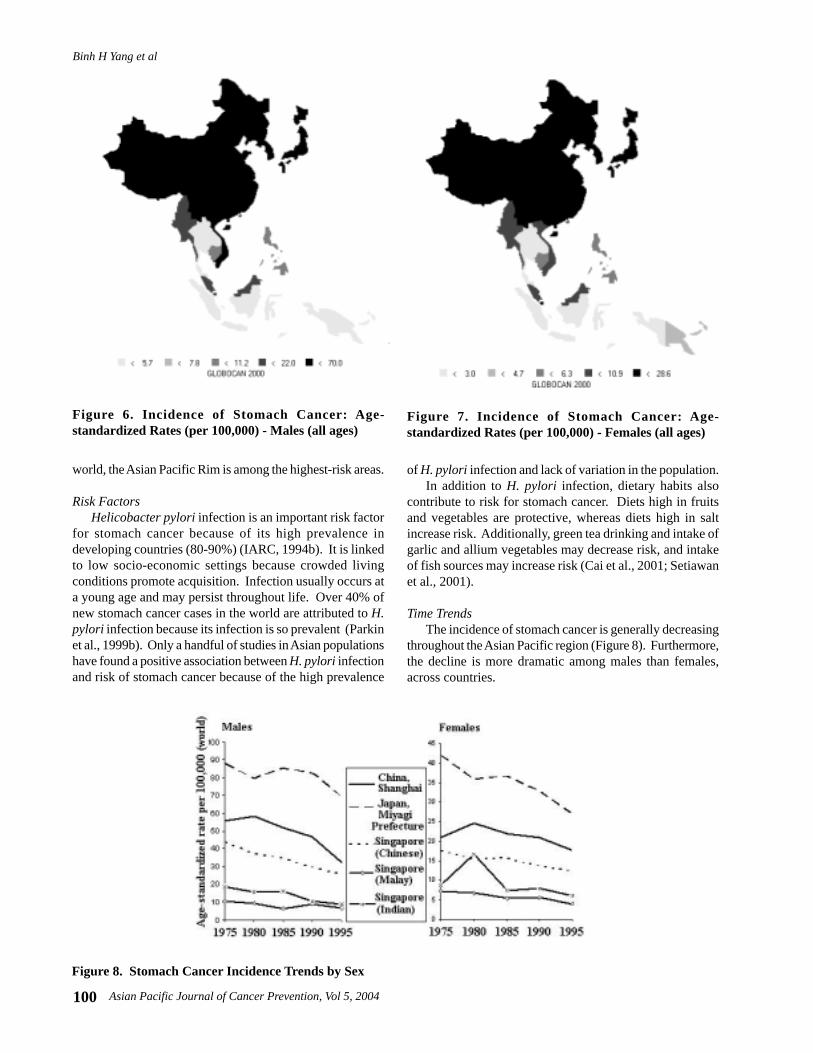
Stomach cancer is currently the most common cancer inthe Asian Pacific Rim, with over 501,000 new cases,comprising over 16% of all new cases in the area. It is thethird most common cause of death from cancer (340,000deaths annually). Stomach cancer occurs more commonlyin men, with 66% of new cases being male. Incidence ratesfor men (Figure 6) and women (Figure 7) are especially highin China, Korea, and Japan. The rates of men are generallytwice those of females (Table 5). Relative to the rest of the
Table 4. Five-year Survival Rates for the Major Cancers Among Populations in the US, Japan, China and Thailand
US White Japan China ThailandCancer site Osaka Qidong Shanghai Chiang Mai Khon Kaen
(1986-91) (1992-98) (1994) (1982-91) (1988-91) (1983-92) (1985-92)
Stomach 20 21 48 17 28 9 17Lung 16 15 13 4 14 3 9Liver 10 7 14 2 5 1 10Colon/rectum 62 62 58* 30 46 36 29Esophagus 13 15 18 5 15 3 27Female breast 84 88 80 56 73 63 47Cervix 70 72 68** 42 62 65 55Leukemia 48 47 29 5 17 10 17
*Includes ICD-10 C18-C21 **Includes ICD-10 C53-C55
Figure 4. Age-standardized Incidence Rates (per100,000) for All Cancer Sites by Pacific Rim Region, 2000
Figure 5. Age-standardized Mortality Rates (per100,000) for All Cancer Sites by Pacific Rim Region, 2000
Table 5. Stomach Cancer Age-standardized Rates (per100,000) by Sex, 2000
Region Incidence MortalityMales Females Males Females
Eastern Asia (Japan) 69.2 28.6 31.2 13.8Eastern Asia (Korea) 70.0 25.7 43.3 17.9Eastern Asia (China) 36.0 17.4 26.9 13.0South-Eastern Asia 8.7 4.8 7.4 4.1Pacific Islands 6.6 4.4 5.7 3.7Pacific Rim 36.1 16.6 24.5 11.5
Binh H Yang et al
Asian Pacific Journal of Cancer Prevention, Vol 5, 2004100
world, the Asian Pacific Rim is among the highest-risk areas.
Risk FactorsHelicobacter pylori infection is an important risk factor
for stomach cancer because of its high prevalence indeveloping countries (80-90%) (IARC, 1994b). It is linkedto low socio-economic settings because crowded livingconditions promote acquisition. Infection usually occurs ata young age and may persist throughout life. Over 40% ofnew stomach cancer cases in the world are attributed to H.pylori infection because its infection is so prevalent (Parkinet al., 1999b). Only a handful of studies in Asian populationshave found a positive association between H. pylori infectionand risk of stomach cancer because of the high prevalence
of H. pylori infection and lack of variation in the population.In addition to H. pylori infection, dietary habits also
contribute to risk for stomach cancer. Diets high in fruitsand vegetables are protective, whereas diets high in saltincrease risk. Additionally, green tea drinking and intake ofgarlic and allium vegetables may decrease risk, and intakeof fish sources may increase risk (Cai et al., 2001; Setiawanet al., 2001).
Time TrendsThe incidence of stomach cancer is generally decreasing
throughout the Asian Pacific region (Figure 8). Furthermore,the decline is more dramatic among males than females,across countries.
Figure 7. Incidence of Stomach Cancer: Age-standardized Rates (per 100,000) - Females (all ages)
Figure 6. Incidence of Stomach Cancer: Age-standardized Rates (per 100,000) - Males (all ages)
Figure 8. Stomach Cancer Incidence Trends by Sex
Asian Pacific Journal of Cancer Prevention, Vol 5, 2004101
Cancer in the Asian Pacific
Prospects for PreventionWith many environmental risk factors, prevention of
stomach cancer seems a possibility. Migrant studies havegiven evidence that environmental changes can reducestomach cancer risk. Studies of Japanese migrants to Hawaiiand the United States show a decline in rates between thefirst and subsequent generations (Kolonel et al., 1981).Given the dietary risk/protective factors, increasing theconsumption of fresh fruits and vegetables and decreasingconsumption of salty foods should be considered as effectivepreventive measures. In addition, the use of refrigerator forfood storage at home may keep food fresh and reducedconsumption of salty foods may also be an effective methodfor prevention. Eradication of H. pylori is another possibleroute of prevention that has been considered. Theeffectiveness of eradication, however, might be questionedsince a large proportion of the population is infected yetonly a relatively small proportion will develop stomachcancer. Vaccinations against H. pylori infection may be amore reasonable route, but the development of an effectivevaccine will take some time. In addition, investigators inthe People’s Republic of China have been conductingrandomized intervention trials involving amoxicillin/omeprazole, vitamins C and E and selenium, and garlic oil/extract since 1995 (Gail et al., 1998). Japan also has X-rayscreening followed by gastroscopy to detect early cancerswhich, although resource intensive, has shown promise indecreasing mortality rates (Parkin et al., 1999a).
Lung CancerBurden 2000
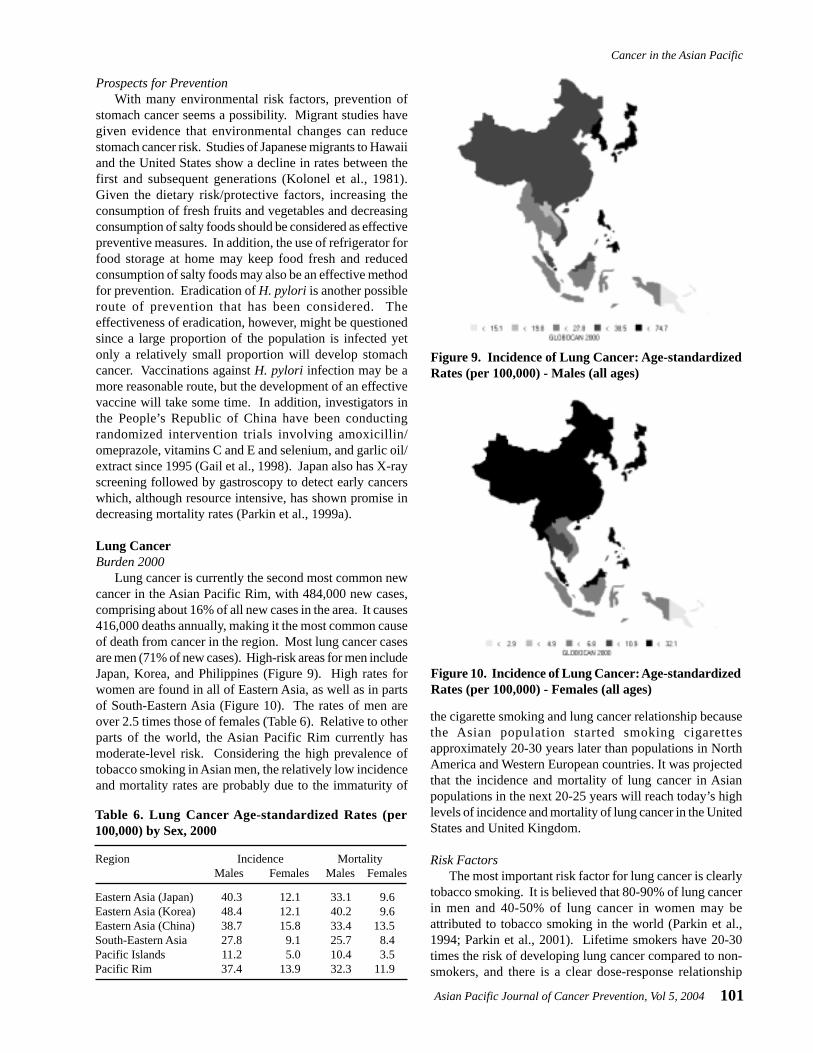
Lung cancer is currently the second most common newcancer in the Asian Pacific Rim, with 484,000 new cases,comprising about 16% of all new cases in the area. It causes416,000 deaths annually, making it the most common causeof death from cancer in the region. Most lung cancer casesare men (71% of new cases). High-risk areas for men includeJapan, Korea, and Philippines (Figure 9). High rates forwomen are found in all of Eastern Asia, as well as in partsof South-Eastern Asia (Figure 10). The rates of men areover 2.5 times those of females (Table 6). Relative to otherparts of the world, the Asian Pacific Rim currently hasmoderate-level risk. Considering the high prevalence oftobacco smoking in Asian men, the relatively low incidenceand mortality rates are probably due to the immaturity of
the cigarette smoking and lung cancer relationship becausethe Asian population started smoking cigarettesapproximately 20-30 years later than populations in NorthAmerica and Western European countries. It was projectedthat the incidence and mortality of lung cancer in Asianpopulations in the next 20-25 years will reach today’s highlevels of incidence and mortality of lung cancer in the UnitedStates and United Kingdom.
Risk FactorsThe most important risk factor for lung cancer is clearly
tobacco smoking. It is believed that 80-90% of lung cancerin men and 40-50% of lung cancer in women may beattributed to tobacco smoking in the world (Parkin et al.,1994; Parkin et al., 2001). Lifetime smokers have 20-30times the risk of developing lung cancer compared to non-smokers, and there is a clear dose-response relationship
Table 6. Lung Cancer Age-standardized Rates (per100,000) by Sex, 2000
Region Incidence MortalityMales Females Males Females
Eastern Asia (Japan) 40.3 12.1 33.1 9.6Eastern Asia (Korea) 48.4 12.1 40.2 9.6Eastern Asia (China) 38.7 15.8 33.4 13.5South-Eastern Asia 27.8 9.1 25.7 8.4Pacific Islands 11.2 5.0 10.4 3.5Pacific Rim 37.4 13.9 32.3 11.9
Figure 9. Incidence of Lung Cancer: Age-standardizedRates (per 100,000) - Males (all ages)
Figure 10. Incidence of Lung Cancer: Age-standardizedRates (per 100,000) - Females (all ages)

Binh H Yang et al
Asian Pacific Journal of Cancer Prevention, Vol 5, 2004102
between number of cigarettes smoked per day, degree ofinhalation, and age at initiation and risk for lung cancer.Alarmingly, two-thirds of men in China smoke (Zhang etal., 2003). Importation of tobacco from the United Statesinto the Asian Pacific Rim region, beginning in 1986 withJapan, drove smoking prevalences to increase as a result ofthe aggressive advertising strategies of the American tobaccocompanies (Chen et al., 1990; Connolly, 1992; Honjo et al.,2000). Additionally, passive exposure to tobacco smoke(ETS) is also believed to increase risk by about 25% (Zhonget al., 2000).
Although smoking is fairly uncommon among Chinesewomen, their rates are higher than in other ethnicities. Thisincrease in risk is partly attributed to exposure toenvironmental risk factors, such as passive smoking (Zhonget al., 1999a), cooking fumes (Zhong et al., 1999b; Ko etal., 2000) and indoor smoky coal emissions (Xu et al., 1989).
Another important risk factor in the Asian Pacific regionis occupational exposure to harmful materials, such asasbestos and rubber exposure. Occupational exposure toasbestos, including among factory workers and miners, hasbeen shown to have an excess of death from lung cancer.Additionally, the effects of asbestos and rubber exposurework synergistically with the effects of cigarette smokingin increasing risk for lung cancer (Zhang et al., 1989;Morinaga et al., 2001).
Diet also contributes to risk for lung cancer. Diets highin vegetables, especially green vegetables and carrots, andfruits can decrease risk (IARC, 2003). Clinical trials,however, found that β-carotene, in fact, did not prevent lungcancer but actually increased risk in high-risk individuals,including heavy smokers (IARC, 1998).
Time TrendsThe incidence rates of lung cancer are increasing in some
areas of the Asian Pacific Rim and decreasing in others(Figure 11). Among males, rates in Japan and Singapore
(Malay) have been generally increasing, whereas rates inChina and Singapore (Chinese and Indian) have beendecreasing. The rates among females are generallyincreasing throughout the region, with the possible exceptionof Singapore (Indian).
Prospects for PreventionThe promotion of smoking cessation is the most cost-
effective campaign against lung and other smoking-relatedcancers and diseases. The risk of lung cancer willprogressively decline with duration of cessation relative toa continuation in smoking; yet it still remains unclear whetherthe increased risk of former smokers will ever drop back tothat of ‘never-smokers’ (Doll et al., 1976). Therefore, anotherprospect for prevention involves programs to persuadeadolescents not to start smoking. Social pressure to makesmoking socially unappealing and legislation to makesmoking financially less accessible are important measuresfor prevention. These preventive measures have been shownto be effective and successful in the United States (Fishmanet al., 1999; Weir et al., 2003).
Control of other risk factors, such as workplace exposureassociated with the increase of lung cancer, environmentaltobacco smoking, and radon exposure in residences may alsolead to a reduction in lung cancer. Also, sputum cytologyand chest radiographs are not recommended for lung cancerscreening because no favorable impact of the screening onlung cancer mortality could be demonstrated (Zhang, 2002).Spiral computerized topography, however, another screeningmethod that may be able to detect small, asymptomatic lungcancers in heavy smokers aged over 60 years has receivedincreasing interest (Henschke et al., 1999). Additionally,recent developments have pointed out that molecular geneticalterations associated with progression toward lung cancer,such as p53 mutations in sputum samples, may be employedto identify high-risk individuals for early detection andchemoprevention (Samet, 1995).
Figure 11. Lung Cancer Incidence Trends by Sex
Asian Pacific Journal of Cancer Prevention, Vol 5, 2004103
Cancer in the Asian Pacific
Liver CancerBurden 2000
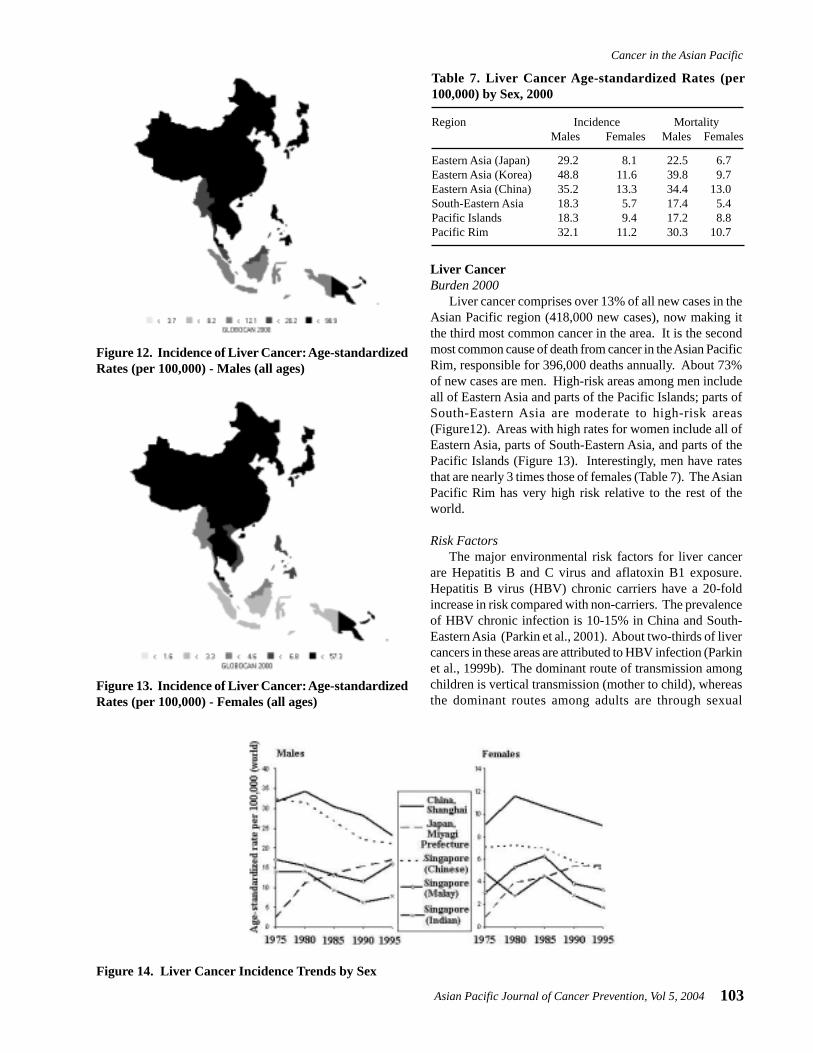
Liver cancer comprises over 13% of all new cases in theAsian Pacific region (418,000 new cases), now making itthe third most common cancer in the area. It is the secondmost common cause of death from cancer in the Asian PacificRim, responsible for 396,000 deaths annually. About 73%of new cases are men. High-risk areas among men includeall of Eastern Asia and parts of the Pacific Islands; parts ofSouth-Eastern Asia are moderate to high-risk areas(Figure12). Areas with high rates for women include all ofEastern Asia, parts of South-Eastern Asia, and parts of thePacific Islands (Figure 13). Interestingly, men have ratesthat are nearly 3 times those of females (Table 7). The AsianPacific Rim has very high risk relative to the rest of theworld.
Risk FactorsThe major environmental risk factors for liver cancer
are Hepatitis B and C virus and aflatoxin B1 exposure.Hepatitis B virus (HBV) chronic carriers have a 20-foldincrease in risk compared with non-carriers. The prevalenceof HBV chronic infection is 10-15% in China and South-Eastern Asia (Parkin et al., 2001). About two-thirds of livercancers in these areas are attributed to HBV infection (Parkinet al., 1999b). The dominant route of transmission amongchildren is vertical transmission (mother to child), whereasthe dominant routes among adults are through sexual
Figure 14. Liver Cancer Incidence Trends by Sex
Table 7. Liver Cancer Age-standardized Rates (per100,000) by Sex, 2000
Region Incidence MortalityMales Females Males Females
Eastern Asia (Japan) 29.2 8.1 22.5 6.7Eastern Asia (Korea) 48.8 11.6 39.8 9.7Eastern Asia (China) 35.2 13.3 34.4 13.0South-Eastern Asia 18.3 5.7 17.4 5.4Pacific Islands 18.3 9.4 17.2 8.8Pacific Rim 32.1 11.2 30.3 10.7
Figure 13. Incidence of Liver Cancer: Age-standardizedRates (per 100,000) - Females (all ages)
Figure 12. Incidence of Liver Cancer: Age-standardizedRates (per 100,000) - Males (all ages)
Binh H Yang et al
Asian Pacific Journal of Cancer Prevention, Vol 5, 2004104
transmission or blood transfusion (IARC, 1994a). Althoughthe mechanism by which HBV infection may increase riskfor liver cancer is still unclear, two possible pathways arethrough viral DNA integration, which promotes geneticinstability in the host (Brechot, 1998), and inflammation(Butel et al., 1995; Ghebranious et al., 1998).
Hepatitis C virus (HCV) infection increases risk for livercancer 25-fold compared with those never infected. Theprevalence of HCV in Japan is among the highest in theworld. Unlike HBV, it is transmitted primarily by bloodand blood products through transfusions or injection withcontaminated equipment. HCV appears to cause liver cancerthrough chronic hepatitis and cirrhosis, both known asprecursors of liver cancer, through the intense hepatocyteregeneration occurring in these conditions (Rocken et al.,2001).
Aflatoxin B1, a toxin found in mildewed grains and nuts,has shown to increase risk for liver cancer in several studiesin China (Yeh et al., 1989; Qian et al., 1994). It is believedto cause point mutations in the tumor-suppressor gene TP53(Aguilar et al., 1993). Microcystins (MC), a hepatotoxicpeptide produced by water bloom algae, contaminate thedrinking water in the endemic areas of primary liver cancerin China. It was believed that intake of MC in drinking watermay be related to primary liver cancer in China (Ueno et al.,1996). Other environmental risk factors include alcoholconsumption (Chen et al., 1991; Goodman et al., 1995) andcigarette smoking (Doll, 1996).
Time trendsThere have been large increases in liver cancer incidence
and mortality in Japan (Figure 14); this has been ascribed toincreasing alcohol consumption (in men) (Makimoto et al.,1999) and to an increasing prevalence of HCV infection(Tanaka et al., 1991). Transmission of the virus, by non-sterile transfusions and injections, was at a maximum in theyears after the second World War, and the risk of liver cancerin Osaka (which has one of the highest rates in the world)has decreased in successive birth cohorts, born since around1931-35, along with prevalence of infection with HCV(Tsukuma et al., 1999). Incidence rates in China have alsobeen decreasing, more dramatically among males thanfemales. Rates in Singapore have also generally beendecreasing.
Prospects for PreventionGiven the large proportion of liver cancers attributed to
HBV, the vaccine against HBV renders great promise forthe prevention of liver cancer. Studies have shown that 90-95% of transmission in neonates can be prevented if HepatitisB immune globin (HBIG) is given in conjunction with thevaccine (Beasley et al., 1983; Wong et al., 1984). Toestablish the effectiveness of the vaccine in preventing livercancers later in life, a study in Qidong County, China iscurrently underway, but it will be many years before resultsare available (Sun et al., 1991). In Taiwan, mass vaccinationagainst Hepatitis B was introduced in the 1980s, first to
neonates born of HBsAg positive mothers, then, in 1984,for all new-borns. By 1994, it was possible to compare livercancer incidence in children aged 6-9 born beforevaccination was introduced and after. There was a four-folddifference in incidence (Chang et al., 1997). Vaccinationagainst HBV, therefore, provides great hope in liver cancerprevention. In addition, improvements in conditions forfood storage and avoidance of drinking contaminated watermay also be effective in reducing incidence of primary livercancer.
Colorectal CancerBurden 2000
Cancer of the colon/rectum is currently the fourth mostcommon new cancer in the Asian Pacific Rim, with over280,000 new cases, making up about 9% of all new cases inthe area. It is the cause of over 147,000 deaths annually,making it the fifth most common cause of death from cancer.Colorectal cancer cases are split almost evenly between menand women (56% of new cases are men). High-risk areasfor both men and women include Japan and parts of South-Eastern Asia (Figures 15 and 16). Moderate-level risk areasinclude the remainder of Eastern Asia and other parts ofSouth-Eastern Asia. The age-standardized mortality ratesare nearly half the incidence rates (Table 8), indicating arelatively good prognosis. Relative to the rest of the world,the Pacific Rim has moderate to low-level risk, with theexception of Japan which is considered to be a high-riskarea.
Risk FactorsMigrant studies of Japanese immigrants to the United
States have shown that risk for colorectal cancer increasesgreatly in the migrants, lending support to the large role ofenvironmental factors in the risk for colorectal cancer(Shimizu et al., 1987). These environmental factors includediet and exercise. Diets rich in vegetables and unrefinedplant foods, like cereals and legumes, protect againstcolorectal cancer, whereas, diets rich in red meat increaserisk (World Cancer Research Fund Panel, 1997). Themechanism by which these foods confer risk, however,remains unclear. Alcohol also increases risk for colorectalcancer. Regular physical exercise has been shown todecrease risk, and obesity may increase risk (Le Marchandet al., 1997; Giacosa et al., 1999).
Table 8. Colorectal Cancer Age-standardized Rates (per100,000) by Sex, 2000
Region Incidence MortalityMales Females Males Females
Eastern Asia (Japan) 43.2 25.3 17.6 11.0Eastern Asia (Korea) 14.9 10.3 8.8 5.7Eastern Asia (China) 13.2 9.9 7.2 5.4South-Eastern Asia 12.6 10.0 8.1 6.4Pacific Islands 10.4 5.8 6.7 3.8Pacific Rim 16.9 12.1 8.8 6.4

Asian Pacific Journal of Cancer Prevention, Vol 5, 2004105
Cancer in the Asian Pacific
Time TrendsIn the Asian Pacific Rim region, incidence rates for
colorectal cancer in both men and women have been rising,with the possible exception of Singapore (Indian) (Figure17). Rates in Japan and China have had a more dramaticincrease.
Prospects for PreventionGiven the dietary and behavioral risk factors for
colorectal cancer, improvements in diet and exercisefrequency are a prospect for prevention. Diets rich invegetables and unrefined plant foods and moderate in redand processed meat, as well as regular exercise and weightcontrol, should be promoted. Diets rich in fiber have beenhypothesized to be protective against colorectal cancer.Recent trials, however, have found little evidence to supportthis hypothesis (Alberts et al., 2000; Schatzkin et al., 2000).
Figure 17. Colorectal Cancer Incidence Trends by Sex
Figure 15. Incidence of Colorectal Cancer: Age-standardized Rates (per 100,000) - Males (all ages)
Figure 16. Incidence of Colorectal Cancer: Age-standardized Rates (per 100,000) - Females (all ages)
Another potential prevention route is screening.Colorectal cancer can be screened by tests for occult bloodin stool, sigmoidoscopy, or colonoscopy. Any of thesemethods can be used for early detection of colorectaladenomatous polyps, which are precursors of colorectalcancer, and localized cancers.
Esophageal CancerBurden 2000
Esophageal cancer is currently ranked fifth in terms ofnew cancers (242,000 new cases) and fourth in cancer deaths(182,000 deaths annually). It makes up about 8% of thenew cancers in the Pacific Rim, and most cases are men(69% of new cases). Recently, there has been an increase inincidence of adenocarcinoma of the esophagus in the UnitedStates and European countries, which accounts forapproximately 50% of esophageal cancers (Powell et al.,
Binh H Yang et al
Asian Pacific Journal of Cancer Prevention, Vol 5, 2004106
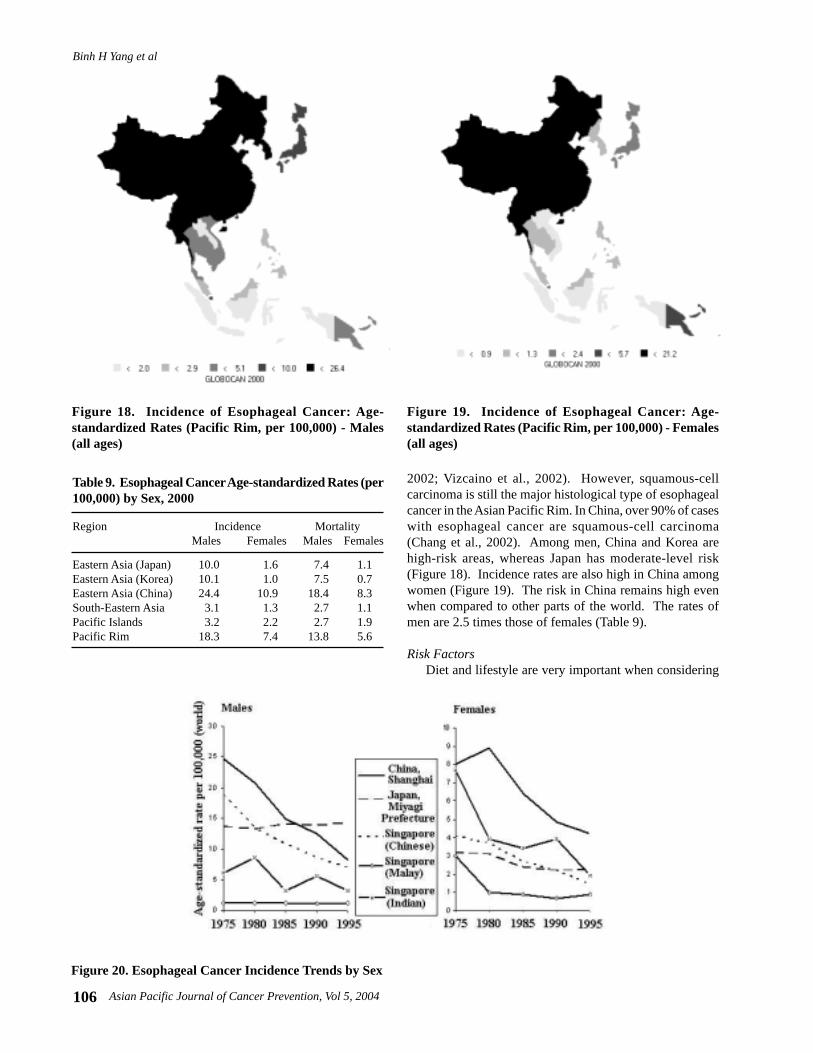
Figure 18. Incidence of Esophageal Cancer: Age-standardized Rates (Pacific Rim, per 100,000) - Males(all ages)
Figure 19. Incidence of Esophageal Cancer: Age-standardized Rates (Pacific Rim, per 100,000) - Females(all ages)
Table 9. Esophageal Cancer Age-standardized Rates (per100,000) by Sex, 2000
Region Incidence MortalityMales Females Males Females
Eastern Asia (Japan) 10.0 1.6 7.4 1.1Eastern Asia (Korea) 10.1 1.0 7.5 0.7Eastern Asia (China) 24.4 10.9 18.4 8.3South-Eastern Asia 3.1 1.3 2.7 1.1Pacific Islands 3.2 2.2 2.7 1.9Pacific Rim 18.3 7.4 13.8 5.6
2002; Vizcaino et al., 2002). However, squamous-cellcarcinoma is still the major histological type of esophagealcancer in the Asian Pacific Rim. In China, over 90% of caseswith esophageal cancer are squamous-cell carcinoma(Chang et al., 2002). Among men, China and Korea arehigh-risk areas, whereas Japan has moderate-level risk(Figure 18). Incidence rates are also high in China amongwomen (Figure 19). The risk in China remains high evenwhen compared to other parts of the world. The rates ofmen are 2.5 times those of females (Table 9).
Risk FactorsDiet and lifestyle are very important when considering
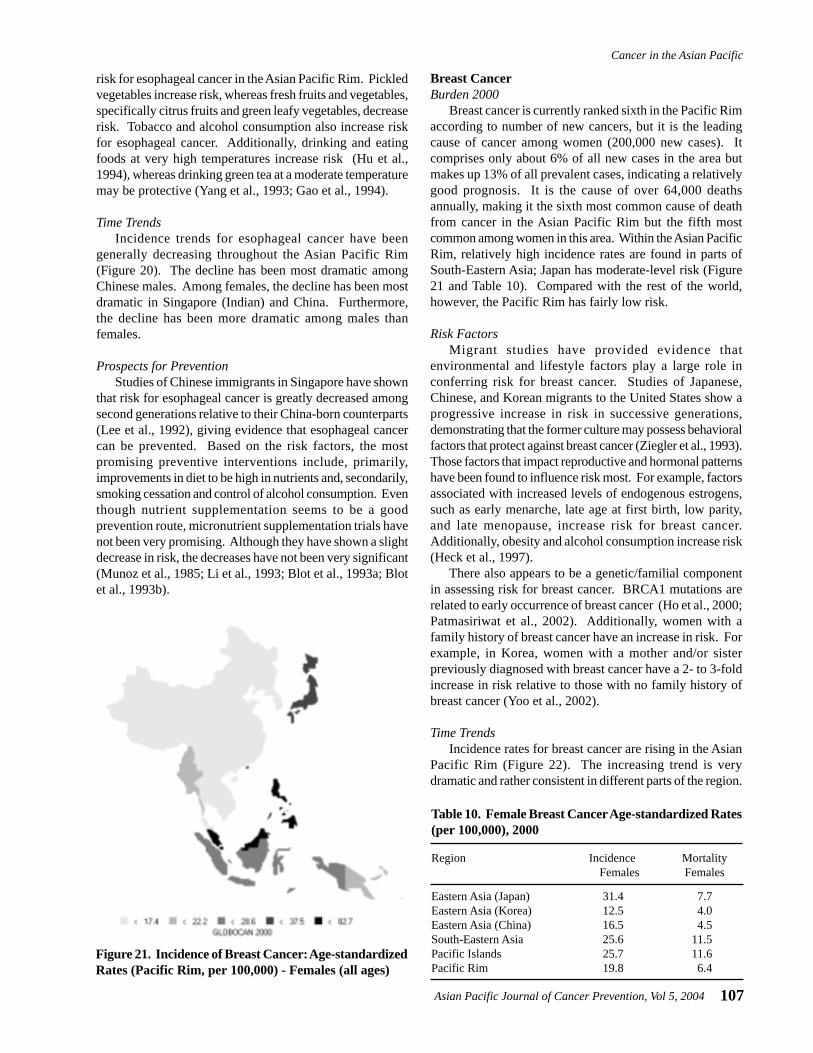
Figure 20. Esophageal Cancer Incidence Trends by Sex
Asian Pacific Journal of Cancer Prevention, Vol 5, 2004107
Cancer in the Asian Pacific
risk for esophageal cancer in the Asian Pacific Rim. Pickledvegetables increase risk, whereas fresh fruits and vegetables,specifically citrus fruits and green leafy vegetables, decreaserisk. Tobacco and alcohol consumption also increase riskfor esophageal cancer. Additionally, drinking and eatingfoods at very high temperatures increase risk (Hu et al.,1994), whereas drinking green tea at a moderate temperaturemay be protective (Yang et al., 1993; Gao et al., 1994).
Time TrendsIncidence trends for esophageal cancer have been
generally decreasing throughout the Asian Pacific Rim(Figure 20). The decline has been most dramatic amongChinese males. Among females, the decline has been mostdramatic in Singapore (Indian) and China. Furthermore,the decline has been more dramatic among males thanfemales.
Prospects for PreventionStudies of Chinese immigrants in Singapore have shown
that risk for esophageal cancer is greatly decreased amongsecond generations relative to their China-born counterparts(Lee et al., 1992), giving evidence that esophageal cancercan be prevented. Based on the risk factors, the mostpromising preventive interventions include, primarily,improvements in diet to be high in nutrients and, secondarily,smoking cessation and control of alcohol consumption. Eventhough nutrient supplementation seems to be a goodprevention route, micronutrient supplementation trials havenot been very promising. Although they have shown a slightdecrease in risk, the decreases have not been very significant(Munoz et al., 1985; Li et al., 1993; Blot et al., 1993a; Blotet al., 1993b).
Breast CancerBurden 2000
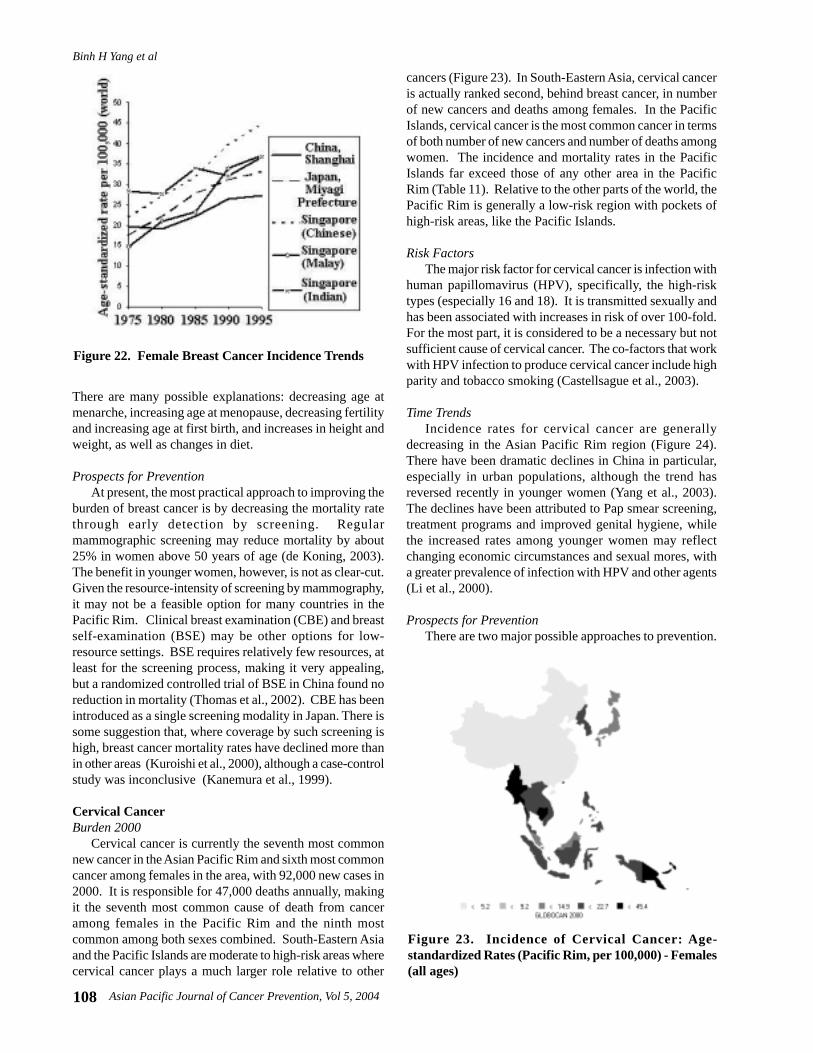
Breast cancer is currently ranked sixth in the Pacific Rimaccording to number of new cancers, but it is the leadingcause of cancer among women (200,000 new cases). Itcomprises only about 6% of all new cases in the area butmakes up 13% of all prevalent cases, indicating a relativelygood prognosis. It is the cause of over 64,000 deathsannually, making it the sixth most common cause of deathfrom cancer in the Asian Pacific Rim but the fifth mostcommon among women in this area. Within the Asian PacificRim, relatively high incidence rates are found in parts ofSouth-Eastern Asia; Japan has moderate-level risk (Figure21 and Table 10). Compared with the rest of the world,however, the Pacific Rim has fairly low risk.
Risk FactorsMigrant studies have provided evidence that
environmental and lifestyle factors play a large role inconferring risk for breast cancer. Studies of Japanese,Chinese, and Korean migrants to the United States show aprogressive increase in risk in successive generations,demonstrating that the former culture may possess behavioralfactors that protect against breast cancer (Ziegler et al., 1993).Those factors that impact reproductive and hormonal patternshave been found to influence risk most. For example, factorsassociated with increased levels of endogenous estrogens,such as early menarche, late age at first birth, low parity,and late menopause, increase risk for breast cancer.Additionally, obesity and alcohol consumption increase risk(Heck et al., 1997).
There also appears to be a genetic/familial componentin assessing risk for breast cancer. BRCA1 mutations arerelated to early occurrence of breast cancer (Ho et al., 2000;Patmasiriwat et al., 2002). Additionally, women with afamily history of breast cancer have an increase in risk. Forexample, in Korea, women with a mother and/or sisterpreviously diagnosed with breast cancer have a 2- to 3-foldincrease in risk relative to those with no family history ofbreast cancer (Yoo et al., 2002).
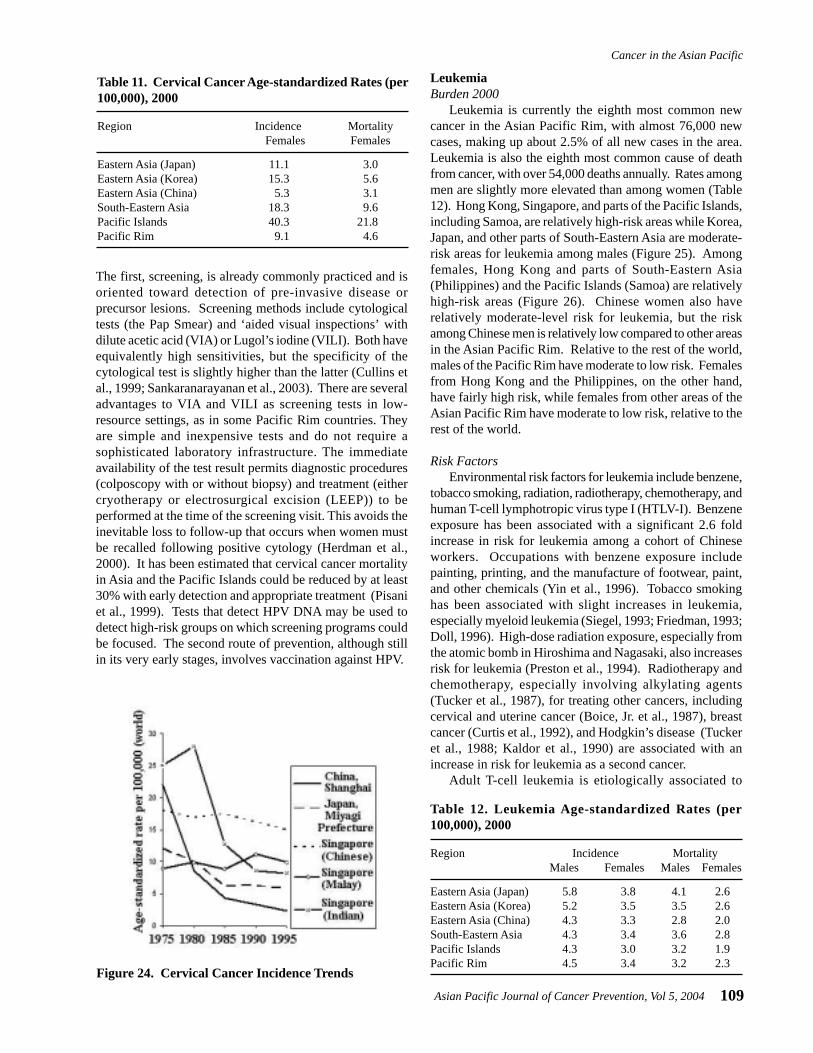
Time TrendsIncidence rates for breast cancer are rising in the Asian
Pacific Rim (Figure 22). The increasing trend is verydramatic and rather consistent in different parts of the region.
Table 10. Female Breast Cancer Age-standardized Rates(per 100,000), 2000
Region Incidence MortalityFemales Females
Eastern Asia (Japan) 31.4 7.7Eastern Asia (Korea) 12.5 4.0Eastern Asia (China) 16.5 4.5South-Eastern Asia 25.6 11.5Pacific Islands 25.7 11.6Pacific Rim 19.8 6.4
Figure 21. Incidence of Breast Cancer: Age-standardizedRates (Pacific Rim, per 100,000) - Females (all ages)
Binh H Yang et al
Asian Pacific Journal of Cancer Prevention, Vol 5, 2004108
There are many possible explanations: decreasing age atmenarche, increasing age at menopause, decreasing fertilityand increasing age at first birth, and increases in height andweight, as well as changes in diet.
Prospects for PreventionAt present, the most practical approach to improving the
burden of breast cancer is by decreasing the mortality ratethrough early detection by screening. Regularmammographic screening may reduce mortality by about25% in women above 50 years of age (de Koning, 2003).The benefit in younger women, however, is not as clear-cut.Given the resource-intensity of screening by mammography,it may not be a feasible option for many countries in thePacific Rim. Clinical breast examination (CBE) and breastself-examination (BSE) may be other options for low-resource settings. BSE requires relatively few resources, atleast for the screening process, making it very appealing,but a randomized controlled trial of BSE in China found noreduction in mortality (Thomas et al., 2002). CBE has beenintroduced as a single screening modality in Japan. There issome suggestion that, where coverage by such screening ishigh, breast cancer mortality rates have declined more thanin other areas (Kuroishi et al., 2000), although a case-controlstudy was inconclusive (Kanemura et al., 1999).
Cervical CancerBurden 2000
Cervical cancer is currently the seventh most commonnew cancer in the Asian Pacific Rim and sixth most commoncancer among females in the area, with 92,000 new cases in2000. It is responsible for 47,000 deaths annually, makingit the seventh most common cause of death from canceramong females in the Pacific Rim and the ninth mostcommon among both sexes combined. South-Eastern Asiaand the Pacific Islands are moderate to high-risk areas wherecervical cancer plays a much larger role relative to other
cancers (Figure 23). In South-Eastern Asia, cervical canceris actually ranked second, behind breast cancer, in numberof new cancers and deaths among females. In the PacificIslands, cervical cancer is the most common cancer in termsof both number of new cancers and number of deaths amongwomen. The incidence and mortality rates in the PacificIslands far exceed those of any other area in the PacificRim (Table 11). Relative to the other parts of the world, thePacific Rim is generally a low-risk region with pockets ofhigh-risk areas, like the Pacific Islands.
Risk FactorsThe major risk factor for cervical cancer is infection with
human papillomavirus (HPV), specifically, the high-risktypes (especially 16 and 18). It is transmitted sexually andhas been associated with increases in risk of over 100-fold.For the most part, it is considered to be a necessary but notsufficient cause of cervical cancer. The co-factors that workwith HPV infection to produce cervical cancer include highparity and tobacco smoking (Castellsague et al., 2003).
Time TrendsIncidence rates for cervical cancer are generally
decreasing in the Asian Pacific Rim region (Figure 24).There have been dramatic declines in China in particular,especially in urban populations, although the trend hasreversed recently in younger women (Yang et al., 2003).The declines have been attributed to Pap smear screening,treatment programs and improved genital hygiene, whilethe increased rates among younger women may reflectchanging economic circumstances and sexual mores, witha greater prevalence of infection with HPV and other agents(Li et al., 2000).
Prospects for PreventionThere are two major possible approaches to prevention.
Figure 23. Incidence of Cervical Cancer: Age-standardized Rates (Pacific Rim, per 100,000) - Females(all ages)
Figure 22. Female Breast Cancer Incidence Trends
Asian Pacific Journal of Cancer Prevention, Vol 5, 2004109
Cancer in the Asian Pacific
The first, screening, is already commonly practiced and isoriented toward detection of pre-invasive disease orprecursor lesions. Screening methods include cytologicaltests (the Pap Smear) and ‘aided visual inspections’ withdilute acetic acid (VIA) or Lugol’s iodine (VILI). Both haveequivalently high sensitivities, but the specificity of thecytological test is slightly higher than the latter (Cullins etal., 1999; Sankaranarayanan et al., 2003). There are severaladvantages to VIA and VILI as screening tests in low-resource settings, as in some Pacific Rim countries. Theyare simple and inexpensive tests and do not require asophisticated laboratory infrastructure. The immediateavailability of the test result permits diagnostic procedures(colposcopy with or without biopsy) and treatment (eithercryotherapy or electrosurgical excision (LEEP)) to beperformed at the time of the screening visit. This avoids theinevitable loss to follow-up that occurs when women mustbe recalled following positive cytology (Herdman et al.,2000). It has been estimated that cervical cancer mortalityin Asia and the Pacific Islands could be reduced by at least30% with early detection and appropriate treatment (Pisaniet al., 1999). Tests that detect HPV DNA may be used todetect high-risk groups on which screening programs couldbe focused. The second route of prevention, although stillin its very early stages, involves vaccination against HPV.
Table 11. Cervical Cancer Age-standardized Rates (per100,000), 2000
Region Incidence MortalityFemales Females
Eastern Asia (Japan) 11.1 3.0Eastern Asia (Korea) 15.3 5.6Eastern Asia (China) 5.3 3.1South-Eastern Asia 18.3 9.6Pacific Islands 40.3 21.8Pacific Rim 9.1 4.6
Figure 24. Cervical Cancer Incidence Trends
Table 12. Leukemia Age-standardized Rates (per100,000), 2000
Region Incidence MortalityMales Females Males Females
Eastern Asia (Japan) 5.8 3.8 4.1 2.6Eastern Asia (Korea) 5.2 3.5 3.5 2.6Eastern Asia (China) 4.3 3.3 2.8 2.0South-Eastern Asia 4.3 3.4 3.6 2.8Pacific Islands 4.3 3.0 3.2 1.9Pacific Rim 4.5 3.4 3.2 2.3
LeukemiaBurden 2000
Leukemia is currently the eighth most common newcancer in the Asian Pacific Rim, with almost 76,000 newcases, making up about 2.5% of all new cases in the area.Leukemia is also the eighth most common cause of deathfrom cancer, with over 54,000 deaths annually. Rates amongmen are slightly more elevated than among women (Table12). Hong Kong, Singapore, and parts of the Pacific Islands,including Samoa, are relatively high-risk areas while Korea,Japan, and other parts of South-Eastern Asia are moderate-risk areas for leukemia among males (Figure 25). Amongfemales, Hong Kong and parts of South-Eastern Asia(Philippines) and the Pacific Islands (Samoa) are relativelyhigh-risk areas (Figure 26). Chinese women also haverelatively moderate-level risk for leukemia, but the riskamong Chinese men is relatively low compared to other areasin the Asian Pacific Rim. Relative to the rest of the world,males of the Pacific Rim have moderate to low risk. Femalesfrom Hong Kong and the Philippines, on the other hand,have fairly high risk, while females from other areas of theAsian Pacific Rim have moderate to low risk, relative to therest of the world.
Risk FactorsEnvironmental risk factors for leukemia include benzene,
tobacco smoking, radiation, radiotherapy, chemotherapy, andhuman T-cell lymphotropic virus type I (HTLV-I). Benzeneexposure has been associated with a significant 2.6 foldincrease in risk for leukemia among a cohort of Chineseworkers. Occupations with benzene exposure includepainting, printing, and the manufacture of footwear, paint,and other chemicals (Yin et al., 1996). Tobacco smokinghas been associated with slight increases in leukemia,especially myeloid leukemia (Siegel, 1993; Friedman, 1993;Doll, 1996). High-dose radiation exposure, especially fromthe atomic bomb in Hiroshima and Nagasaki, also increasesrisk for leukemia (Preston et al., 1994). Radiotherapy andchemotherapy, especially involving alkylating agents(Tucker et al., 1987), for treating other cancers, includingcervical and uterine cancer (Boice, Jr. et al., 1987), breastcancer (Curtis et al., 1992), and Hodgkin’s disease (Tuckeret al., 1988; Kaldor et al., 1990) are associated with anincrease in risk for leukemia as a second cancer.
Adult T-cell leukemia is etiologically associated to

Binh H Yang et al
Asian Pacific Journal of Cancer Prevention, Vol 5, 2004110
HTLV-I, which is endemic in certain areas of the AsianPacific Rim, including Southwestern and Northern Japan.The lifetime risk for ATL is about 5% for HTLV-I carriers,with a latency period of 30 years or more (Kondo et al.,1989). A dominant transmission route for HTLV-I is verticaltransmission, believed to be primarily due to breast-feeding(Sugiyama et al., 1986; Kusuhara et al., 1987). Additionally,vertical transmission is significantly higher among childrenbreast-fed for over three months than among children breast-fed under three months (Hirata et al., 1992; Oki et al., 1992).
In addition to environmental risk factors, there are alsofamilial and genetic factors that increase risk of leukemia.Family studies have shown an increase in risk of leukemiaamong close relatives of a leukemia patient (Linet, 1985;Pottern et al., 1991). Chromosomal abnormalities, including
Down’s syndrome (trisomy of chromosome 21) (Robison,1992), ataxia telangiectasia (chromosomal breakagesyndrome) (Linet et al., 1996), and translocations, alsoincrease risk for leukemia, especially among children. Somechromosomal abnormalities may result from exposure toenvironmental risk factors. For example, benzene is believedto cause t(8;21) translocations (Smith, 1996).
Time TrendsLeukemia incidence rates have been increasing in some
parts of the Asian Pacific Rim and decreasing in other parts(Figure 27). Among males, the rates have been generallyincreasing except in Singapore (Indian). Among females,the trend is increasing in Singapore (Malay and Chinese)but decreasing in China and Japan. The trend in Singapore
Figure 27. Leukemia Incidence Trends by Sex
Figure 25. Incidence of Leukemia: Age-standardizedRates (Pacific Rim, per 100,000) - Males (all ages)
Figure 26. Incidence of Leukemia: Age-standardizedRates (Pacific Rim, per 100,000) - Females (all ages)
Asian Pacific Journal of Cancer Prevention, Vol 5, 2004111
Cancer in the Asian Pacific
among Indians is very erratic and difficult to generalize.
Prospects for PreventionGiven the environmental risk factors for leukemia, there
are strategies that may lead to prevention. Prevention ofvertical transmission of human T-cell lymphotropic virustype I is the best strategy for prevention of adult T-cellleukemia. Prevention of vertical transmission of HTLV-Iinvolves screening pregnant women for HTLV-I antibodiesin areas where HTLV-I is endemic, including Southwesternand Northern Japan, and advising seropositive women toavoid breast-feeding their newborn (Bittencourt, 1998). Thisprevention strategy has had great success in preventingvertical transmission in Nagasaki, Japan (Hino et al., 1996;Hino et al., 1997). Additionally, control of other risk factors,including tobacco smoking and occupational exposuresassociated with the increased risk for leukemia, may alsolead to reduced risk for leukemia.
Future Trends
When making projections, changes in the annual numberof cases (or deaths) are due to three components: changes inthe size of the population at risk, ageing of the population,and changes in the age-specific rates. Trends in the pastmay not, however, be a good guide to what will happen inthe future due to improvements in prevention, earlydetection, and treatment. Projections may therefore be highlyinaccurate, especially over 50 years, if past patterns areincorporated. In addition, there are only limited data onpast trends in cancer incidence from the Asian Pacific Rimregion. The projections in this section incorporate only the
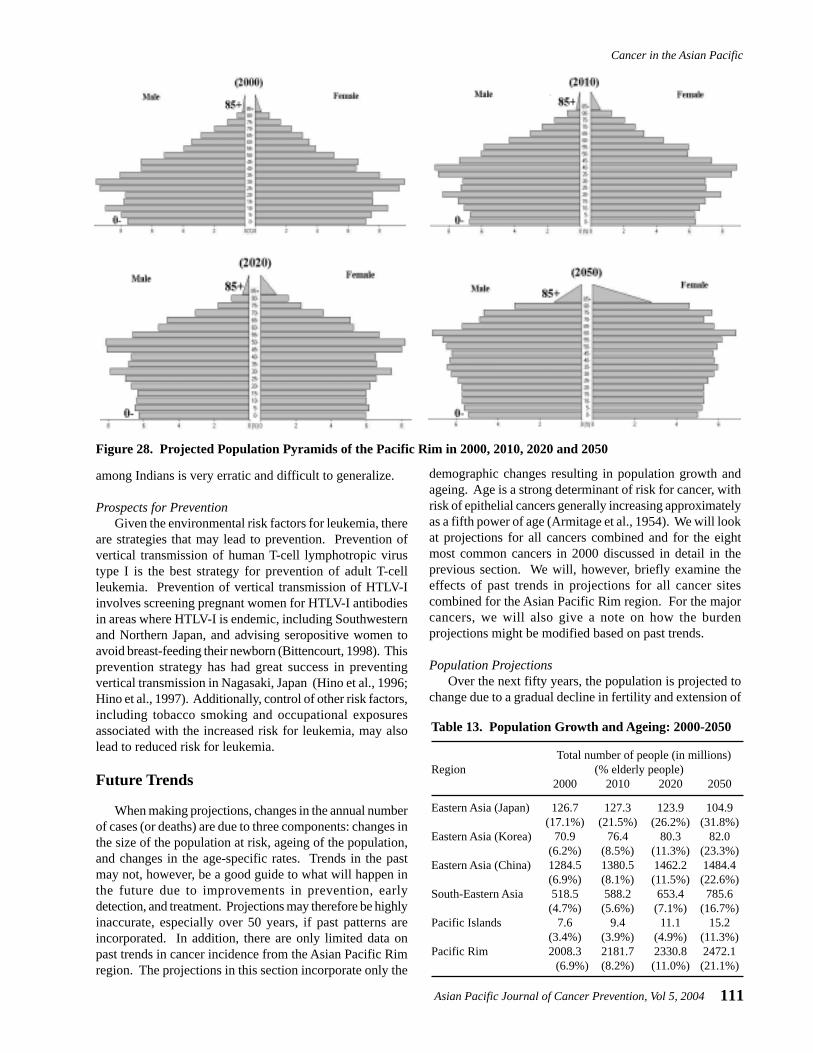
Figure 28. Projected Population Pyramids of the Pacific Rim in 2000, 2010, 2020 and 2050
Table 13. Population Growth and Ageing: 2000-2050
Total number of people (in millions)Region (% elderly people)
2000 2010 2020 2050
Eastern Asia (Japan) 126.7 127.3 123.9 104.9(17.1%) (21.5%) (26.2%) (31.8%)
Eastern Asia (Korea) 70.9 76.4 80.3 82.0(6.2%) (8.5%) (11.3%) (23.3%)
Eastern Asia (China) 1284.5 1380.5 1462.2 1484.4(6.9%) (8.1%) (11.5%) (22.6%)
South-Eastern Asia 518.5 588.2 653.4 785.6(4.7%) (5.6%) (7.1%) (16.7%)
Pacific Islands 7.6 9.4 11.1 15.2(3.4%) (3.9%) (4.9%) (11.3%)
Pacific Rim 2008.3 2181.7 2330.8 2472.1(6.9%) (8.2%) (11.0%) (21.1%)
demographic changes resulting in population growth andageing. Age is a strong determinant of risk for cancer, withrisk of epithelial cancers generally increasing approximatelyas a fifth power of age (Armitage et al., 1954). We will lookat projections for all cancers combined and for the eightmost common cancers in 2000 discussed in detail in theprevious section. We will, however, briefly examine theeffects of past trends in projections for all cancer sitescombined for the Asian Pacific Rim region. For the majorcancers, we will also give a note on how the burdenprojections might be modified based on past trends.
Population ProjectionsOver the next fifty years, the population is projected to
change due to a gradual decline in fertility and extension of
Binh H Yang et al
Asian Pacific Journal of Cancer Prevention, Vol 5, 2004112
life expectancy. According to these projections, thepopulation is expected to become “top-heavy,” with agrowing elderly population (people 65 years of age or older)and a relatively shrinking child population, as shown inFigure 28. The population of the Pacific Rim is projectedto grow by 23% between 2000 and 2050 (Table 13). InJapan, however, the growth rate will actually be negativeover the fifty years. The elderly population (65 and above)of the Pacific Rim is expected to increase from 7% to 21%over this time period. In Japan, where the elderly proportionis already relatively large (17%), nearly one out of threepeople are expected to be elderly in 2050.
Cancer Burden ProjectionsThe population growth and ageing will not only impact
the dynamics of support and care for the elderly but willalso affect the burden of cancer. Age is a very strongpredictor of risk for cancer; generally, cancer risk rises withincreasing age. Future trends in cancer burden wereestimated by applying the currently estimated rates of theyear 2000 to the projected populations for 2010, 2020, and2050, taking into account the age and sex distributions ofeach year.
The number of new cases (Table 14) and deaths (Table15) from all cancers is expected to more than double from2000 to 2050. In 2050, there are expected to be 7.8 millionnew cancer cases and 5.7 million deaths from cancer.Although Japan is expected to have a high elderly population,we do not see a great increase in the number of new casesand deaths from cancers because of a 30% decrease in thenon-elderly population (and number of new cases and deaths)and a 50% increase in the elderly population over the 50years. Overall, the burden of cancer will greatly increase inthe decades to come with the ‘aging of the population’,putting a great deal of pressure on the need for futureexpansion of resources.
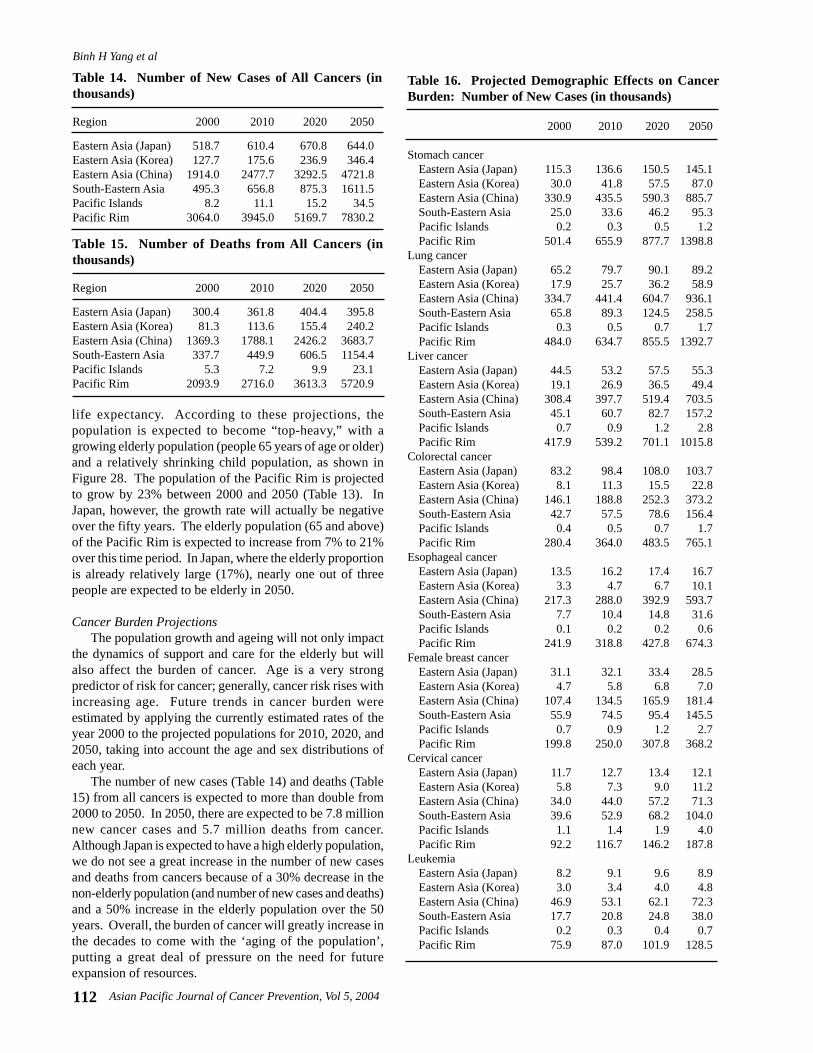
Table 16. Projected Demographic Effects on CancerBurden: Number of New Cases (in thousands)
2000 2010 2020 2050
Stomach cancerEastern Asia (Japan) 115.3 136.6 150.5 145.1Eastern Asia (Korea) 30.0 41.8 57.5 87.0Eastern Asia (China) 330.9 435.5 590.3 885.7South-Eastern Asia 25.0 33.6 46.2 95.3Pacific Islands 0.2 0.3 0.5 1.2Pacific Rim 501.4 655.9 877.7 1398.8
Lung cancerEastern Asia (Japan) 65.2 79.7 90.1 89.2Eastern Asia (Korea) 17.9 25.7 36.2 58.9Eastern Asia (China) 334.7 441.4 604.7 936.1South-Eastern Asia 65.8 89.3 124.5 258.5Pacific Islands 0.3 0.5 0.7 1.7Pacific Rim 484.0 634.7 855.5 1392.7
Liver cancerEastern Asia (Japan) 44.5 53.2 57.5 55.3Eastern Asia (Korea) 19.1 26.9 36.5 49.4Eastern Asia (China) 308.4 397.7 519.4 703.5South-Eastern Asia 45.1 60.7 82.7 157.2Pacific Islands 0.7 0.9 1.2 2.8Pacific Rim 417.9 539.2 701.1 1015.8
Colorectal cancerEastern Asia (Japan) 83.2 98.4 108.0 103.7Eastern Asia (Korea) 8.1 11.3 15.5 22.8Eastern Asia (China) 146.1 188.8 252.3 373.2South-Eastern Asia 42.7 57.5 78.6 156.4Pacific Islands 0.4 0.5 0.7 1.7Pacific Rim 280.4 364.0 483.5 765.1
Esophageal cancerEastern Asia (Japan) 13.5 16.2 17.4 16.7Eastern Asia (Korea) 3.3 4.7 6.7 10.1Eastern Asia (China) 217.3 288.0 392.9 593.7South-Eastern Asia 7.7 10.4 14.8 31.6Pacific Islands 0.1 0.2 0.2 0.6Pacific Rim 241.9 318.8 427.8 674.3
Female breast cancerEastern Asia (Japan) 31.1 32.1 33.4 28.5Eastern Asia (Korea) 4.7 5.8 6.8 7.0Eastern Asia (China) 107.4 134.5 165.9 181.4South-Eastern Asia 55.9 74.5 95.4 145.5Pacific Islands 0.7 0.9 1.2 2.7Pacific Rim 199.8 250.0 307.8 368.2
Cervical cancerEastern Asia (Japan) 11.7 12.7 13.4 12.1Eastern Asia (Korea) 5.8 7.3 9.0 11.2Eastern Asia (China) 34.0 44.0 57.2 71.3South-Eastern Asia 39.6 52.9 68.2 104.0Pacific Islands 1.1 1.4 1.9 4.0Pacific Rim 92.2 116.7 146.2 187.8
LeukemiaEastern Asia (Japan) 8.2 9.1 9.6 8.9Eastern Asia (Korea) 3.0 3.4 4.0 4.8Eastern Asia (China) 46.9 53.1 62.1 72.3South-Eastern Asia 17.7 20.8 24.8 38.0Pacific Islands 0.2 0.3 0.4 0.7Pacific Rim 75.9 87.0 101.9 128.5
Table 14. Number of New Cases of All Cancers (inthousands)
Region 2000 2010 2020 2050
Eastern Asia (Japan) 518.7 610.4 670.8 644.0Eastern Asia (Korea) 127.7 175.6 236.9 346.4Eastern Asia (China) 1914.0 2477.7 3292.5 4721.8South-Eastern Asia 495.3 656.8 875.3 1611.5Pacific Islands 8.2 11.1 15.2 34.5Pacific Rim 3064.0 3945.0 5169.7 7830.2
Table 15. Number of Deaths from All Cancers (inthousands)
Region 2000 2010 2020 2050
Eastern Asia (Japan) 300.4 361.8 404.4 395.8Eastern Asia (Korea) 81.3 113.6 155.4 240.2Eastern Asia (China) 1369.3 1788.1 2426.2 3683.7South-Eastern Asia 337.7 449.9 606.5 1154.4Pacific Islands 5.3 7.2 9.9 23.1Pacific Rim 2093.9 2716.0 3613.3 5720.9
Asian Pacific Journal of Cancer Prevention, Vol 5, 2004113
Cancer in the Asian Pacific
When including the effects of past trends, the projectednumber of new cases in the Asian Pacific Rim region in theyear 2020 for all cancer sites is 4.77 million (a decrease ofabout 7.7% compared with the projection using constantrates); the number of new cases decreases among men by204,000 (a total of 2.8 million cases) and decreases amongwomen by 194,000 (a total of 1.9 million cases). The AsianPacific Rim region is projected to have 3.36 million deathsfrom all cancers in 2020 when including effects of past trends(a decrease of about 7.1% compared with the projectionusing constant rates); the number of deaths decreases by139,000 among males (a total of 2.1 million deaths) anddecreases by over 118,000 among females (a total of over1.2 million deaths). The decrease in new cancer cases anddeaths when including past trends is due to an overalldecrease in rates from stomach, esophageal, cervical cancer,and leukemia. The cancers that are projected to have anincrease because of increasing past trends are lung and breastcancer. For liver cancer, rural populations have increasingpast trends, whereas urban populations have experienced adecreasing trend. On the other hand, rural populations havedecreasing trends for colorectal cancer, whereas urbanpopulations have increasing trends. The annual percentchanges used in the projections were estimated from urban-and rural-specific cancer mortality time trends in China(Yang et al., 2003) and urbanization projections (UnitedNations Population Division, 2002). Our projections withpast trends, therefore, are limited to the appropriateness ofusing mortality trends, which reflects changes in bothincidence and treatment, in the projection of incidence andhow representative China is of the whole Asian Pacific Rimregion. Future discussion on projections will be based uponconstant rates.
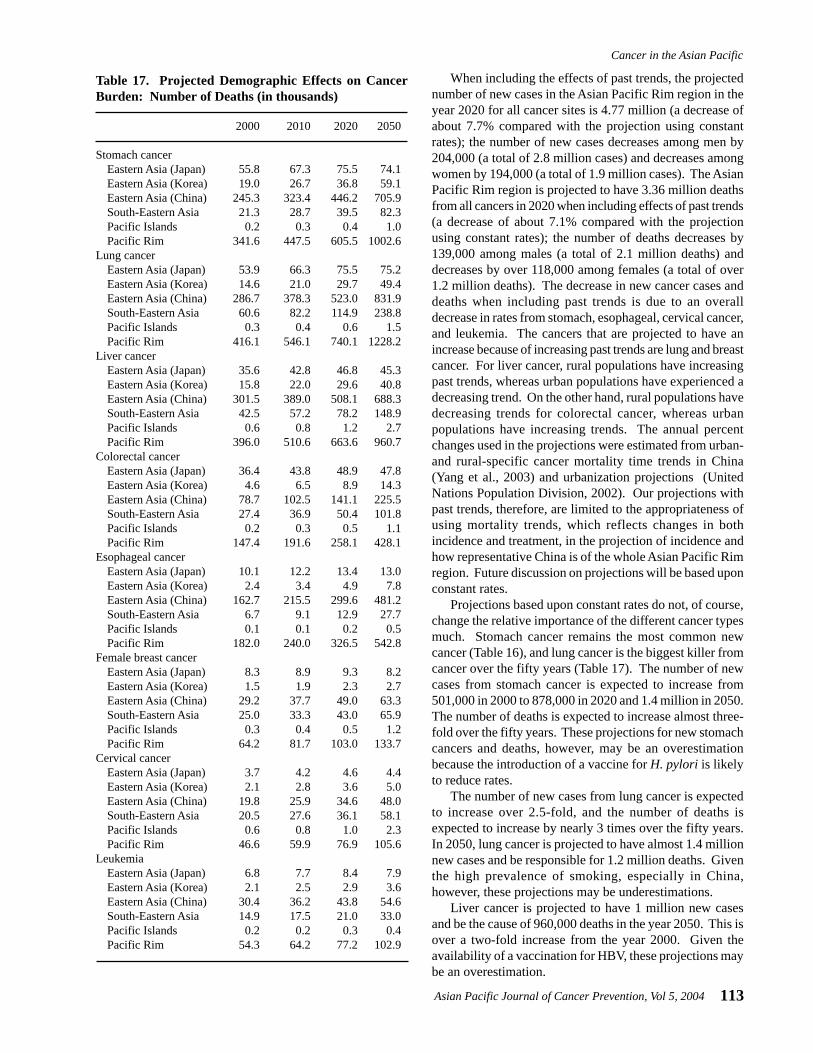
Projections based upon constant rates do not, of course,change the relative importance of the different cancer typesmuch. Stomach cancer remains the most common newcancer (Table 16), and lung cancer is the biggest killer fromcancer over the fifty years (Table 17). The number of newcases from stomach cancer is expected to increase from501,000 in 2000 to 878,000 in 2020 and 1.4 million in 2050.The number of deaths is expected to increase almost three-fold over the fifty years. These projections for new stomachcancers and deaths, however, may be an overestimationbecause the introduction of a vaccine for H. pylori is likelyto reduce rates.
The number of new cases from lung cancer is expectedto increase over 2.5-fold, and the number of deaths isexpected to increase by nearly 3 times over the fifty years.In 2050, lung cancer is projected to have almost 1.4 millionnew cases and be responsible for 1.2 million deaths. Giventhe high prevalence of smoking, especially in China,however, these projections may be underestimations.
Liver cancer is projected to have 1 million new casesand be the cause of 960,000 deaths in the year 2050. This isover a two-fold increase from the year 2000. Given theavailability of a vaccination for HBV, these projections maybe an overestimation.
Table 17. Projected Demographic Effects on CancerBurden: Number of Deaths (in thousands)
2000 2010 2020 2050
Stomach cancerEastern Asia (Japan) 55.8 67.3 75.5 74.1Eastern Asia (Korea) 19.0 26.7 36.8 59.1Eastern Asia (China) 245.3 323.4 446.2 705.9South-Eastern Asia 21.3 28.7 39.5 82.3Pacific Islands 0.2 0.3 0.4 1.0Pacific Rim 341.6 447.5 605.5 1002.6
Lung cancerEastern Asia (Japan) 53.9 66.3 75.5 75.2Eastern Asia (Korea) 14.6 21.0 29.7 49.4Eastern Asia (China) 286.7 378.3 523.0 831.9South-Eastern Asia 60.6 82.2 114.9 238.8Pacific Islands 0.3 0.4 0.6 1.5Pacific Rim 416.1 546.1 740.1 1228.2
Liver cancerEastern Asia (Japan) 35.6 42.8 46.8 45.3Eastern Asia (Korea) 15.8 22.0 29.6 40.8Eastern Asia (China) 301.5 389.0 508.1 688.3South-Eastern Asia 42.5 57.2 78.2 148.9Pacific Islands 0.6 0.8 1.2 2.7Pacific Rim 396.0 510.6 663.6 960.7
Colorectal cancerEastern Asia (Japan) 36.4 43.8 48.9 47.8Eastern Asia (Korea) 4.6 6.5 8.9 14.3Eastern Asia (China) 78.7 102.5 141.1 225.5South-Eastern Asia 27.4 36.9 50.4 101.8Pacific Islands 0.2 0.3 0.5 1.1Pacific Rim 147.4 191.6 258.1 428.1
Esophageal cancerEastern Asia (Japan) 10.1 12.2 13.4 13.0Eastern Asia (Korea) 2.4 3.4 4.9 7.8Eastern Asia (China) 162.7 215.5 299.6 481.2South-Eastern Asia 6.7 9.1 12.9 27.7Pacific Islands 0.1 0.1 0.2 0.5Pacific Rim 182.0 240.0 326.5 542.8
Female breast cancerEastern Asia (Japan) 8.3 8.9 9.3 8.2Eastern Asia (Korea) 1.5 1.9 2.3 2.7Eastern Asia (China) 29.2 37.7 49.0 63.3South-Eastern Asia 25.0 33.3 43.0 65.9Pacific Islands 0.3 0.4 0.5 1.2Pacific Rim 64.2 81.7 103.0 133.7
Cervical cancerEastern Asia (Japan) 3.7 4.2 4.6 4.4Eastern Asia (Korea) 2.1 2.8 3.6 5.0Eastern Asia (China) 19.8 25.9 34.6 48.0South-Eastern Asia 20.5 27.6 36.1 58.1Pacific Islands 0.6 0.8 1.0 2.3Pacific Rim 46.6 59.9 76.9 105.6
LeukemiaEastern Asia (Japan) 6.8 7.7 8.4 7.9Eastern Asia (Korea) 2.1 2.5 2.9 3.6Eastern Asia (China) 30.4 36.2 43.8 54.6South-Eastern Asia 14.9 17.5 21.0 33.0Pacific Islands 0.2 0.2 0.3 0.4Pacific Rim 54.3 64.2 77.2 102.9
Binh H Yang et al
Asian Pacific Journal of Cancer Prevention, Vol 5, 2004114
Cancer of the colon/rectum is projected to increase 2.5-fold over the fifty years. The number of new cancers fromcolorectal cancer is expected to increase from 280,000 in2000 to 765,000 in 2050. These estimates, however, maybe underestimated when taking into account that the ratesfor colorectal cancer in the area have been increasing.
In 2050, esophageal cancer is projected to have 674,000new cancers, a 2.5-fold increase from 2000 (242,000 newcases). This projection, however, may be an overestimationsince the rates for esophageal cancer in the area have beendropping, with the exception of Japan (based on MiyagiPrefecture).
The number of new cancers from breast cancer isprojected to increase from 200,000 in 2000 to 308,000 in2020 and 368,000 in 2050. The number of deaths attributedto breast cancer will increase 2-fold by 2050, with 134,000deaths, compared with 2000 (64,000 deaths). Furthermore,this may be underestimated since incidence and mortalityrates for breast cancer have been increasing in the PacificRim.
The number of new cancers and deaths from cervicalcancer is projected to increase 2-fold over the next fifty years.The number of new cancers is expected to increase from92,000 to 188,000 between 2000 and 2050. These estimates,however, may drop with advances in screening andtreatment, especially for low-resource settings, and with areadily available and effective vaccine against HPV.
Leukemia is projected to have almost 129,000 new casesand be the cause of 103,000 deaths in the year 2050. This isover a 1.5-fold increase from the year 2000. Given theincreasing trend of leukemia, though, this projection maybe an underestimation.
Conclusions
The relative importance of non-communicable diseases,such as cancer, is increasing with the control of infectiousdiseases. Cancer prevention strategies covered in this paperinvolve control of exposures to risk factors and/or screeningfor pre-invasive disease or precursor lesions. A topic that isgaining increasing interest that was not touched upon greatlyin this paper is the molecular epidemiology of cancer.Molecular epidemiology of cancer involves finding thegenetic components of risk, or susceptibility genes, forcancers. There are numerous genetic markers that arecurrently under study. We chose, however, to focus on therisk factors that had the most potential to be altered,environmental and lifestyle factors, and would lead to themost promising and feasible preventive interventions forcancers in the Asian Pacific Rim region.
We have summarized the burden and trends of cancer inthe Asian Pacific Rim. Additionally, for the eight top cancers,we summarized the major risk factors and presented futureburden trends through to the year 2050 based on populationdynamics. The facts and data contained within this paperwill hopefully assist in the prioritization of future cancerprevention and control strategies, as well as cancer research,
References
Aguilar F, Hussain SP, Cerutti P (1993). Aflatoxin B1 induces thetransversion of G-->T in codon 249 of the p53 tumor suppressorgene in human hepatocytes. Proc Natl Acad Sci U S A, 90,8586-90.
Alberts DS, Martinez ME, Roe DJ, et al (2000). Lack of effect ofa high-fiber cereal supplement on the recurrence of colorectaladenomas. Phoenix Colon Cancer Prevention Physicians'Network. N Engl J Med, 342, 1156-62.
American Cancer Society (2002). Cancer Facts & Figures 2002.American Cancer Society, Inc., Atlanta, GA.
Armitage P, Doll R (1954). The age distribution of cancer and amulti-stage theory of carcinogenesis. Br J Cancer, 8, 1-12.
Beasley RP, Hwang LY, Lee GC, et al (1983). Prevention ofperinatally transmitted hepatitis B virus infections with hepatitisB virus infections with hepatitis B immune globulin andhepatitis B vaccine. Lancet, 2, 1099-102.
Bittencourt AL (1998). Vertical transmission of HTLV-I/II: a review.Rev Inst Med Trop Sao Paulo, 40, 245-51.
Blot WJ, Devesa SS, Fraumeni JF Jr (1993a). Continuing climb inrates of esophageal adenocarcinoma: an update. JAMA, 270,1320.
Blot WJ, Li JY, Taylor PR, et al (1993b). Nutrition interventiontrials in Linxian, China: supplementation with specific vitamin/mineral combinations, cancer incidence, and disease- specificmortality in the general population. J Natl Cancer Inst, 85,1483-92.
Boice JD Jr, Blettner M, Kleinerman RA, et al (1987). Radiationdose and leukemia risk in patients treated for cancer of thecervix. J Natl Cancer Inst, 79, 1295-311.
Brechot C (1998). Molecular mechanisms of hepatitis B and Cviruses related to liver carcinogenesis. Hepatogastroenterology,45 Suppl 3, 1189-96.
Butel JS, Lee TH, Slagle BL (1995). Viral co-factors in liver cancer:lessons from hepatitis B virus. Princess Takamatsu Symp, 25,185-98.
Cai L, Yu SZ, Zhan ZF (2001). Cytochrome P450 2E1 geneticpolymorphism and gastric cancer in Changle, Fujian Province.World J Gastroenterol, 7, 792-5.
Castellsague X, Munoz N (2003). Chapter 3: Cofactors in humanpapillomavirus carcinogenesis--role of parity, oralcontraceptives, and tobacco smoking. J Natl Cancer InstMonogr, 31, 20-8.
Chang MH, Chen CJ, Lai MS, et al (1997). Universal hepatitis Bvaccination in Taiwan and the incidence of hepatocellularcarcinoma in children. Taiwan Childhood Hepatoma StudyGroup. N Engl J Med, 336, 1855-9.
Chang SS, Lu CL, Chao JY, et al (2002). Unchanging trend ofadenocarcinoma of the esophagus and gastric cardia in Taiwan:
and in the application of current knowledge in order toprevent and treat cancer.
Acknowledgements
This project is supported by Grant CA09412 and CA90388 from the National Cancer Institute, ES11667 fromNational Institute of Environment Health Sciences, NIH,Department of Health and Human Services, the Helene G.Brown Award and the Alper Program of UCLAComprehensive Cancer Center.
Asian Pacific Journal of Cancer Prevention, Vol 5, 2004115
Cancer in the Asian Pacific
a 15-year experience in a single center. Dig Dis Sci, 47, 735-40.
Chen CJ, Liang KY, Chang AS, et al (1991). Effects of hepatitis Bvirus, alcohol drinking, cigarette smoking and familial tendencyon hepatocellular carcinoma. Hepatology, 13, 398-406.
Chen TT, Winder AE (1990). The opium wars revisited as US forcestobacco exports in Asia. Am J Public Health, 80, 659-62.
Connolly GN (1992). Worldwide expansion of transnationaltobacco industry. J Natl Cancer Inst Monogr, 12, 29-35.
Cullins VE, Wright TC, Beattie DJ, Pollack AE (1999). Cervicalcancer prevention using visual screening methods.Reproductive Health Matters, 7, 134-43.
Curtis RE, Boice JD Jr, Stovall M, et al (1992). Risk of leukemiaafter chemotherapy and radiation treatment for breast cancer.N Engl J Med, 326, 1745-51.
de Koning HJ (2003). Mammographic screening: evidence fromrandomised controlled trials. Ann Oncol, 14, 1185-9.
Department of Cancer Control and Statistics OMCfCaCD (2003).Osaka Cancer Registry. http://www mc pref osaka jp/ocr_e/ocr/#survival,
Doll R (1996). Cancers weakly related to smoking. Br Med Bull,52, 35-49.
Doll R, Cook P (1967). Summarizing indices for comparison ofcancer incidence data. Int J Cancer, 2, 269-79.
Doll R, Peto R (1976). Mortality in relation to smoking: 20 years'observations on male British doctors. Br Med J, 2, 1525-36.
Ferlay J, Bray F, Pisani P, Parkin DM (2001). GLOBOCAN 2000:Cancer Incidence, Mortality and Prevalence Worldwide,Version 1.0. IARC CancerBase No. 5. IARC Press, Lyon,France,
Fishman JA, Allison H, Knowles SB, et al (1999). State laws ontobacco control--United States, 1998. MMWR CDC SurveillSumm, 48, 21-40.
Friedman GD (1993). Cigarette smoking, leukemia, and multiplemyeloma. Ann Epidemiol, 3, 425-8.
Gail MH, You WC, Chang YS, et al (1998). Factorial trial of threeinterventions to reduce the progression of precancerous gastriclesions in Shandong, China: design issues and initial data.Control Clin Trials, 19, 352-69.
Gao YT, McLaughlin JK, Blot WJ, et al (1994). Reduced risk ofesophageal cancer associated with green tea consumption. JNatl Cancer Inst, 86, 855-8.
Ghebranious N, Sell S (1998). Hepatitis B injury, male gender,aflatoxin, and p53 expression each contribute tohepatocarcinogenesis in transgenic mice. Hepatology, 27, 383-91.
Giacosa A, Franceschi S, La Vecchia C, et al (1999). Energy intake,overweight, physical exercise and colorectal cancer risk. EurJ Cancer Prev, 8 Suppl 1, S53-S60.
Goodman MT, Moriwaki H, Vaeth M, et al (1995). Prospectivecohort study of risk factors for primary liver cancer inHiroshima and Nagasaki, Japan. Epidemiology, 6, 36-41.
Heck KE, Pamuk ER (1997). Explaining the relation betweeneducation and postmenopausal breast cancer. Am J Epidemiol,145, 366-72.
Henschke CI, McCauley DI, Yankelevitz DF, et al (1999). EarlyLung Cancer Action Project: overall design and findings frombaseline screening. Lancet, 354, 99-105.
Herdman C, Sherris J (2000). Planning appropriate cervicalprevention programs. Program for Appropriate Technology inHealth, Seattle, WA.
Hino S, Katamine S, Miyata H, et al (1996). Primary prevention ofHTLV-I in Japan. J Acquir Immune Defic Syndr Hum
Retrovirol, 13 Suppl 1, S199-S203.Hino S, Katamine S, Miyata H, et al (1997). Primary prevention of
HTLV-1 in Japan. Leukemia, 11 Suppl 3, 57-9.Hirata M, Hayashi J, Noguchi A, et al (1992). The effects of
breastfeeding and presence of antibody to p40tax protein ofhuman T cell lymphotropic virus type-I on mother to childtransmission. Int J Epidemiol, 21, 989-94.
Ho GH, Phang BH, Ng IS, et al (2000). Novel germline BRCA1mutations detected in women in singapore who developedbreast carcinoma before the age of 36 years. Cancer, 89, 811-6.
Honjo K, Kawachi I (2000). Effects of market liberalisation onsmoking in Japan. Tob Control, 9, 193-200.
Hu J, Nyren O, Wolk A, et al (1994). Risk factors for oesophagealcancer in northeast China. Int J Cancer, 57, 38-46.
International Agency for Research on Cancer (1994a). HepatitisViruses. Evaluation of Carcinogenic Risks to Humans, vol. 59.IARC, Lyon, France.
International Agency for Research on Cancer (1994b).Schistosomes, liver flukes and helicobacter pylori. IARCMonographs on the Evaluation of Carcinogenic Risks toHumans, Volume 61. IARC, Lyon, France.
International Agency for Research on Cancer (1998). Carotenoids.IARC Handbooks of Cancer Prevention, vol. 2. IARC, Lyon,France.
International Agency for Research on Cancer (2003). Fruit andVegetables. IARC Handbooks of Cancer Prevention, vol. 8.IARC, Lyon, France.
Kaldor JM, Day NE, Clarke EA, et al (1990). Leukemia followingHodgkin's disease. N Engl J Med, 322, 7-13.
Kanemura S, Tsuji I, Ohuchi N, et al (1999). A case control studyon the effectiveness of breast cancer screening by clinical breastexamination in Japan. Jpn J Cancer Res, 90, 607-13.
Ko YC, Cheng LS, Lee CH, et al (2000). Chinese food cookingand lung cancer in women nonsmokers. Am J Epidemiol, 151,140-7.
Kolonel LN, Nomura AM, Hirohata T, et al (1981). Association ofdiet and place of birth with stomach cancer incidence in HawaiiJapanese and Caucasians. Am J Clin Nutr, 34, 2478-85.
Kondo T, Kono H, Miyamoto N, et al (1989). Age- and sex-specificcumulative rate and risk of ATLL for HTLV-I carriers. Int JCancer, 43, 1061-4.
Kuroishi T, Hirose K, Suzuki T, Tominaga S (2000). Effectivenessof mass screening for breast cancer in Japan. Breast Cancer,7, 1-8.
Kusuhara K, Sonoda S, Takahashi K, et al (1987). Mother-to-childtransmission of human T-cell leukemia virus type I (HTLV-I):a fifteen-year follow-up study in Okinawa, Japan. Int J Cancer,40, 755-7.
Le Marchand L, Wilkens LR, Kolonel LN, et al (1997). Associationsof sedentary lifestyle, obesity, smoking, alcohol use, anddiabetes with the risk of colorectal cancer. Cancer Res, 57,4787-94.
Lee HP, Chia KS, Shanmugaratnam K (1992). Cancer Incidencein Singapore 1983-87. Singapore Cancer Registry, Singapore.
Li B, Taylor PR, Li JY, et al (1993). Linxian nutrition interventiontrials. Design, methods, participant characteristics, andcompliance. Ann Epidemiol, 3, 577-85.
Li H, Jin S, Xu H, Thomas DB (2000). The decline in the mortalityrates of cervical cancer and a plausible explanation inShandong, China. Int J Epidemiol, 29, 398-404.
Linet MS (1985). The Leukemias: Epidemiologic Aspects. OxfordUniversity Press, New York.
Binh H Yang et al
Asian Pacific Journal of Cancer Prevention, Vol 5, 2004116
Linet MS, Cartwright RA (1996). The Leukemias. In CancerEpidemiology and Prevention. Schottenfeld D, Fraumeni JF,Jr. (Eds). Oxford University Press, New York pp 841-92.
Makimoto K, Higuchi S (1999). Alcohol consumption as a majorrisk factor for the rise in liver cancer mortality rates in Japanesemen. Int J Epidemiol, 28, 30-4.
Morinaga K, Kishimoto T, Sakatani M, et al (2001). Asbestos-related lung cancer and mesothelioma in Japan. Ind Health,39, 65-74.
Muir C, Waterhouse J, Mack T, et al (1987). Cancer Incidence inFive Continents, vol. V. IARC Scientific Publications No. 88.IARC, Lyon, France.
Munoz N, Wahrendorf J, Bang LJ, et al (1985). No effect ofriboflavine, retinol, and zinc on prevalence of precancerouslesions of oesophagus. Randomised double-blind interventionstudy in high-risk population of China. Lancet, 2, 111-4.
Oki T, Yoshinaga M, Otsuka H, et al (1992). A sero-epidemiologicalstudy on mother-to-child transmission of HTLV-I in southernKyushu, Japan. Asia Oceania J Obstet Gynaecol, 18, 371-7.
Parkin DM, Bray FI, Devesa SS (2001). Cancer burden in the year2000. The global picture. Eur J Cancer, 37 Suppl 8, S4-66.
Parkin DM, Muir CS, Whelan SL, et al (1992). Cancer Incidencein Five Continents, vol. VI. IARC Scientific Publications No.120. IARC, Lyon, France.
Parkin DM, Pisani P (1999a). Gastric cancer. In Cancer Screening.Theory and Practice. Kramer BR, Gohagan JK, Prorok P (Eds).Dekker, New York pp 515-29.
Parkin DM, Pisani P, Lopez AD, Masuyer E (1994). At least one inseven cases of cancer is caused by smoking. Global estimatesfor 1985. Int J Cancer, 59, 494-504.
Parkin DM, Pisani P, Munoz N, Ferlay J (1999b). The global healthburden of infection associated cancers. Cancer Surv, 33, 5-33.
Parkin DM, Whelan SL, Ferlay J, et al (1997). Cancer Incidencein Five Continents, vol. VII. IARC Scientific Publications No.143. IARC, Lyon, France.
Parkin DM, Whelan SL, Ferlay J, et al (2002). Cancer Incidencein Five Continents, vol. VIII. IARC Scientific Publications No.155. IARC, Lyon, France.
Patmasiriwat P, Bhothisuwan K, Sinilnikova OM, et al (2002).Analysis of breast cancer susceptibility genes BRCA1 andBRCA2 in Thai familial and isolated early-onset breast andovarian cancer. Hum Mutat, 20, 230.
Pisani P, Parkin DM, Bray F, Ferlay J (1999). Estimates of theworldwide mortality from 25 cancers in 1990. Int J Cancer,83, 18-29.
Pottern LM, Linet M, Blair A, et al (1991). Familial cancersassociated with subtypes of leukemia and non-Hodgkin'slymphoma. Leuk Res, 15, 305-14.
Powell J, McConkey CC, Gillison EW, Spychal RT (2002).Continuing rising trend in oesophageal adenocarcinoma. Int JCancer, 102, 422-7.
Preston DL, Kusumi S, Tomonaga M, et al (1994). Cancer incidencein atomic bomb survivors. Part III. Leukemia, lymphoma andmultiple myeloma, 1950-1987. Radiat Res, 137, S68-S97.
Qian GS, Ross RK, Yu MC, et al (1994). A follow-up study ofurinary markers of aflatoxin exposure and liver cancer risk inShanghai, People's Republic of China. Cancer EpidemiolBiomarkers Prev, 3, 3-10.
Robison LL (1992). Down syndrome and leukemia. Leukemia, 6Suppl 1, 5-7.
Rocken C, Carl-McGrath S (2001). Pathology and pathogenesisof hepatocellular carcinoma. Dig Dis, 19, 269-78.
Samet JM (1995). Lung Cancer. In Cancer Prevention and Control.
Greenwald P, Kramer BS, Weed DL (Eds). Marcel Dekker Inc.,New York pp 561-84.
Sankaranarayanan R, Basu P, Wesley RS, et al (2003). Visualscreening for cervical neoplasia: Results from an IARCmulticentre study in India and Africa. IARC, Lyon, France (inpress).
Sankaranarayanan R, Black RJ, Parkin DM, eds (1998). CancerSurvival in Developing Countries. IARC ScientificPublications No. 145. IARC, Lyon, France.
Schatzkin A, Lanza E, Corle D, et al (2000). Lack of effect of alow-fat, high-fiber diet on the recurrence of colorectaladenomas. Polyp Prevention Trial Study Group. N Engl J Med,342, 1149-55.
Setiawan VW, Zhang ZF, Yu GP, et al (2001). Protective effect ofgreen tea on the risks of chronic gastritis and stomach cancer.Int J Cancer, 92, 600-4.
Shimizu H, Mack TM, Ross RK, Henderson BE (1987). Cancer ofthe gastrointestinal tract among Japanese and white immigrantsin Los Angeles County. J Natl Cancer Inst, 78, 223-8.
Siegel M (1993). Smoking and leukemia: evaluation of a causalhypothesis. Am J Epidemiol, 138, 1-9.
Smith MT (1996). The mechanism of benzene-induced leukemia:a hypothesis and speculations on the causes of leukemia.Environ Health Perspect, 104 Suppl 6, 1219-25.
Sugiyama H, Doi H, Yamaguchi K, et al (1986). Significance ofpostnatal mother-to-child transmission of human T-lymphotropic virus type-I on the development of adult T-cellleukemia/lymphoma. J Med Virol, 20, 253-60.
Sun Z, Zhu Y, Stjernsward J, et al (1991). Design and complianceof HBV vaccination trial on newborns to prevent hepatocellularcarcinoma and 5-year results of its pilot study. Cancer DetectPrev, 15, 313-8.
Tanaka K, Hirohata T, Koga S, et al (1991). Hepatitis C and hepatitisB in the etiology of hepatocellular carcinoma in the Japanesepopulation. Cancer Res, 51, 2842-7.
Thomas DB, Gao DL, Ray RM, et al (2002). Randomized trial ofbreast self-examination in Shanghai: final results. J Natl CancerInst, 94, 1445-57.
Tsukuma H, Ajiki W, Oshima A (1999). Cancer incidence andsurvival in Osaka. In Cancer epidemiology and control in theAsia-Pacific region International Center for Medical Research,Kobe University School of Medicine, Japan.
Tucker MA, Coleman CN, Cox RS, et al (1988). Risk of secondcancers after treatment for Hodgkin's disease. N Engl J Med,318, 76-81.
Tucker MA, Meadows AT, Boice JD, Jr., et al (1987). Leukemiaafter therapy with alkylating agents for childhood cancer. JNatl Cancer Inst, 78, 459-64.
Ueno Y, Nagata S, Tsutsumi T, et al (1996). Detection ofmicrocystins, a blue-green algal hepatotoxin, in drinking watersampled in Haimen and Fusui, endemic areas of primary livercancer in China, by highly sensitive immunoassay.Carcinogenesis, 17, 1317-21.
United Nations (2001). World Population Prospects. The 2000Revision. United Nations, New York, Ref Type: Data File
United Nations Population Division (2002). World UrbanizationProspects: The 2001 Revision. United Nations, New York.
Vizcaino AP, Moreno V, Lambert R, Parkin DM (2002). Time trendsincidence of both major histologic types of esophagealcarcinomas in selected countries, 1973-1995. Int J Cancer, 99,860-8.
Waterhouse J, Muir C, Shanmugaratnam K, Powell J (1982). CancerIncidence in Five Continents, vol. IV. IARC Scientific
Asian Pacific Journal of Cancer Prevention, Vol 5, 2004117
Cancer in the Asian Pacific
Publications No. 42. IARC, Lyon, France.Weir HK, Thun MJ, Hankey BF, et al (2003). Annual report to the
nation on the status of cancer, 1975-2000, featuring the usesof surveillance data for cancer prevention and control. J NatlCancer Inst, 95, 1276-99.
Wong VC, Ip HM, Reesink HW, et al (1984). Prevention of theHBsAg carrier state in newborn infants of mothers who arechronic carriers of HBsAg and HBeAg by administration ofhepatitis- B vaccine and hepatitis-B immunoglobulin. Double-blind randomised placebo-controlled study. Lancet, 1, 921-6.
World Bank (1993). World development report 1993. Investing inHealth. Oxford University Press, New York.
World Cancer Research Fund (WCRF) Panel (1997). Diet,Nutrition, and the Prevention of Cancer: A Global Perspective.World Cancer Research Fund, Washington, USA.
World Health Organization (1992). International Classification onDiseases and Related Health Problems, 1989 Revision. WHO,Geneva.
Xu ZY, Blot WJ, Xiao HP, et al (1989). Smoking, air pollution,and the high rates of lung cancer in Shenyang, China. J NatlCancer Inst, 81, 1800-6.
Yang CS, Wang ZY (1993). Tea and cancer. J Natl Cancer Inst,85, 1038-49.
Yang L, Parkin DM, Li L, Chen Y (2003). Time trends in cancermortality in China: 1987-1999. Int J Cancer, 106, 771-83.
Yeh FS, Yu MC, Mo CC, et al (1989). Hepatitis B virus, aflatoxins,and hepatocellular carcinoma in southern Guangxi, China.Cancer Res, 49, 2506-9.
Yin SN, Hayes RB, Linet MS, et al (1996). An expanded cohortstudy of cancer among benzene-exposed workers in China.Benzene Study Group. Environ Health Perspect, 104 Suppl6, 1339-41.
Yoo KY, Kang D, Park SK, et al (2002). Epidemiology of breastcancer in Korea: occurrence, high-risk groups, and prevention.J Korean Med Sci, 17, 1-6.
Zhang H, Cai B (2003). The impact of tobacco on lung health inChina. Respirology, 8, 17-21.
Zhang ZF (2002). Lung Cancer. In Encyclopedia of Public Health.Breslow L (Ed). Macmillan Reference USA, New York pp 702-4.
Zhang ZF, Yu SZ, Li WX, Choi BC (1989). Smoking, occupationalexposure to rubber, and lung cancer. Br J Ind Med, 46, 12-5.
Zhong L, Goldberg MS, Gao YT, Jin F (1999a). A case-controlstudy of lung cancer and environmental tobacco smoke amongnonsmoking women living in Shanghai, China. Cancer CausesControl, 10, 607-16.
Zhong L, Goldberg MS, Gao YT, Jin F (1999b). Lung cancer andindoor air pollution arising from Chinese-style cooking amongnonsmoking women living in Shanghai, China. Epidemiology,10, 488-94.
Zhong L, Goldberg MS, Parent ME, Hanley JA (2000). Exposureto environmental tobacco smoke and the risk of lung cancer: ameta-analysis. Lung Cancer, 27, 3-18.
Ziegler RG, Hoover RN, Pike MC, et al (1993). Migration patternsand breast cancer risk in Asian-American women. J NatlCancer Inst, 85, 1819-27.