Canceling out both the real and the spectral lines
10
Canceling out both the real and the spectral lines Alessio Toraldo a, * , Martina Gandola b,c , Simona Loffredo c,d , Anna Rancati b , Gabriele Zanardi b , Gabriella Bottini b,c a International School for Advanced Studies, Trieste, Italy b Dipartimento di Psicologia, Universita ` degli Studi di Pavia, Pavia, Italy c Laboratorio di Neuropsicologia, Dipartimento di Scienze Neurologiche, Ospedale Niguarda, Milano, Italy d Facolta ` di Psicologia, Universita ` degli Studi di Milano Bicocca, Milano, Italy Accepted 12 August 2004 Abstract Neglect patients typically show motor perseveration while canceling targets on the ipsilesional side. This behavior can be influ- enced by the presence vs. absence of targets on the (neglected) contralesional side (Bottini & Toraldo, 2003). As alternative expla- nations, the authors proposed (i) directional hypokinesia—the patient cannot perform reaching movements towards detected left- sided targets, and thus carries on canceling on the right side, and (ii) allochiria—the patient misperceives left-sided targets as located on the right side, and cancels them there. We report here data from a patient (EZ) that might confirm the second hypothesis. EZ was presented with 19 displays in which the number and position of cancellation targets on both sides were varied systematically. EZ showed motor perseveration while canceling, but this tendency did not vary across conditions. Interestingly though, EZ also drew cancellation marks in the empty space between the ipsilesional targets, and this phenomenon was significantly more intense when there were more targets on the neglected side. As EZÕs comments suggested, such a behavior might reflect the attempt to cancel out delusional targets. Our speculation is that those objects were generated by allochiria. Ó 2004 Elsevier Inc. All rights reserved. Keywords: Allochiria; Spatial neglect; Perseveration; Spatial processing; Directional hypokinesia 1. Introduction The Albert line cancellation task (Albert, 1973) is one of the commonly used tests for the examination of uni- lateral neglect. On this task, it may happen that a neglect patient not only omits a number of targets on the con- tralesional side, but also traces further marks over al- ready cancelled targets on the ipsilesional side (Damasio, Damasio, & Chui, 1980; Na et al., 1999). Although this kind of motor perseveration is quite fre- quent among the neglect population, relatively little the- oretical work has been devoted to describing its possible causes. As a first, conservative possibility, there might be no causal link between the two symptoms. Their associ- ation would just be accidental – the random co-occur- rence of functionally independent deficits, one an impairment in exploring the contralesional side of space and the second, according to some interpretations, an impairment in interrupting an initiated motor response (see, e.g., Goldberg, 1986; Hudson, 1968). If this were the case, the degree of statistical association between the two symptoms would just reflect the degree of ana- tomical contiguity of the brain regions involved in the two deficits. Since there is little overlap—neglect can fol- low lesions in diverse locations of the right hemisphere (see, e.g., Rizzolatti, Gentilucci, & Matelli, 1985; Vallar & Perani, 1986) and perseverative behavior is generally associated with frontal damage often involving both hemispheres (see, e.g., Luria, 1965)—one should predict www.elsevier.com/locate/b&c Brain and Cognition 57 (2005) 226–235 0278-2626/$ - see front matter Ó 2004 Elsevier Inc. All rights reserved. doi:10.1016/j.bandc.2004.08.051 * Corresponding author. Fax: +39 40 3787615. E-mail address: [email protected] (A. Toraldo).
Transcript of Canceling out both the real and the spectral lines

www.elsevier.com/locate/b&c
Brain and Cognition 57 (2005) 226–235
Canceling out both the real and the spectral lines
Alessio Toraldoa,*, Martina Gandolab,c, Simona Loffredoc,d, Anna Rancatib,Gabriele Zanardib, Gabriella Bottinib,c
a International School for Advanced Studies, Trieste, Italyb Dipartimento di Psicologia, Universita degli Studi di Pavia, Pavia, Italy
c Laboratorio di Neuropsicologia, Dipartimento di Scienze Neurologiche, Ospedale Niguarda, Milano, Italyd Facolta di Psicologia, Universita degli Studi di Milano Bicocca, Milano, Italy
Accepted 12 August 2004
Abstract
Neglect patients typically show motor perseveration while canceling targets on the ipsilesional side. This behavior can be influ-enced by the presence vs. absence of targets on the (neglected) contralesional side (Bottini & Toraldo, 2003). As alternative expla-nations, the authors proposed (i) directional hypokinesia—the patient cannot perform reaching movements towards detected left-sided targets, and thus carries on canceling on the right side, and (ii) allochiria—the patient misperceives left-sided targets as locatedon the right side, and cancels them there. We report here data from a patient (EZ) that might confirm the second hypothesis. EZ waspresented with 19 displays in which the number and position of cancellation targets on both sides were varied systematically. EZshowed motor perseveration while canceling, but this tendency did not vary across conditions. Interestingly though, EZ also drewcancellation marks in the empty space between the ipsilesional targets, and this phenomenon was significantly more intense whenthere were more targets on the neglected side. As EZ�s comments suggested, such a behavior might reflect the attempt to cancel outdelusional targets. Our speculation is that those objects were generated by allochiria.� 2004 Elsevier Inc. All rights reserved.
Keywords: Allochiria; Spatial neglect; Perseveration; Spatial processing; Directional hypokinesia
1. Introduction
The Albert line cancellation task (Albert, 1973) is oneof the commonly used tests for the examination of uni-lateral neglect. On this task, it may happen that a neglectpatient not only omits a number of targets on the con-tralesional side, but also traces further marks over al-ready cancelled targets on the ipsilesional side(Damasio, Damasio, & Chui, 1980; Na et al., 1999).Although this kind of motor perseveration is quite fre-quent among the neglect population, relatively little the-oretical work has been devoted to describing its possiblecauses. As a first, conservative possibility, there might be
0278-2626/$ - see front matter � 2004 Elsevier Inc. All rights reserved.
doi:10.1016/j.bandc.2004.08.051
* Corresponding author. Fax: +39 40 3787615.E-mail address: [email protected] (A. Toraldo).
no causal link between the two symptoms. Their associ-ation would just be accidental – the random co-occur-rence of functionally independent deficits, one animpairment in exploring the contralesional side of spaceand the second, according to some interpretations, animpairment in interrupting an initiated motor response(see, e.g., Goldberg, 1986; Hudson, 1968). If this werethe case, the degree of statistical association betweenthe two symptoms would just reflect the degree of ana-tomical contiguity of the brain regions involved in thetwo deficits. Since there is little overlap—neglect can fol-low lesions in diverse locations of the right hemisphere(see, e.g., Rizzolatti, Gentilucci, & Matelli, 1985; Vallar& Perani, 1986) and perseverative behavior is generallyassociated with frontal damage often involving bothhemispheres (see, e.g., Luria, 1965)—one should predict

A. Toraldo et al. / Brain and Cognition 57 (2005) 226–235 227
a low degree of association. By contrast, Rusconi, Mar-avita, Bottini, and Vallar (2002) reported that 88.6% ofneglect patients showed perseveration in cancellation,1
while only 12.9% of non-neglect patients did so (seeTable 2 in their paper)—a very strong statistical associ-ation. Therefore, the assumption of entirely independentdeficits that incidentally co-occur after brain damage isvery unlikely—the hypothesis that neglect patients showa specific kind of perseveration is more convincing. Pos-ner, Walker, Friedrich, and Rafal (1984) attributed theclassical neglect symptomatology to a failure to disen-gage the visuo-spatial attentional focus from the ipsile-sional stimuli. One might propose that the disengagingdeficit causes both an under-exploration of the contrale-sional side and an over-exploration of the ipsilesionalside, thus inducing the patient both to omit contrale-sional stimuli and to perseverate in the detection ofipsilesional stimuli. Another view has more recentlybeen suggested by Rusconi et al. (2002) themselves(but see also Na et al., 1999), who hypothesized a causallink between the two—otherwise functionally indepen-dent—symptoms. According to their proposal, neglectwould be induced by damage to a system devoted tothe exploration/representation of space (traditionallylocalized in the right inferior-posterior parietal cortex,see Vallar & Perani, 1986) while perseveration wouldfollow concomitant damage to a frontal-subcortical sys-tem (Denny-Brown, 1958). Crucially, Rusconi et al.(2002) suggested that the first deficit, the ipsilesional rep-resentational bias, would ‘‘trigger’’ the second deficit,perseveration, which would then develop rather inde-pendently (p. 602). This assumption of a ‘‘triggering’’role of neglect allows one to explain the massive differ-ence in perseveration incidence between neglect(88.6%) and non-neglect (12.9%) patients and the virtualabsence of perseveration in left hemisphere patients. Infact, in spite of possible damage to the fronto-subcorti-cal system, left hemisphere patients would not have therepresentational bias that allows perseverations toemerge. Consistent with Rusconi et al.�s (2002) view,perseveration in neglect emerged almost exclusivelywhen the frontal and/or subcortical regions were in-volved in the lesion.
However, none of the above hypotheses can accountfor some experimental results from our lab (Bottini &Toraldo, 2003). Three out of four neglect patients whoperseverated while canceling targets on the right sideof a display, did so more intensely when there were (ne-glected) targets on the left side, than when there werenot. Even more crucially, one patient (D) perseveratedonly when there were targets on the neglected side. On
1 These data are in sharp contrast with Na et al.�s (1999) results, inwhich the percentage drops to 35%. The discrepancy is likely to be dueto differences between Rusconi et al.�s (2002) and Na et al.�s (1999) taskinstructions and criteria for defining a patient as ‘‘perseverating’’.
grounds of these findings, the authors speculated that(i) directional hypokinesia (Heilman, Bowers, Coslett,Whelan, & Watson, 1985), or (ii) allochiria (Halligan,Marshall, & Wade, 1992; Kawamura, Hirayama, Shino-hara, Watanabe, & Sugishita, 1987) might have a causalrole in perseveration, at least in a subset of neglectpatients. According to the first hypothesis the patientcannot perform reaching movements towards detectedleft-sided targets, and thus carries on canceling on theright side. According to the second hypothesis the pa-tient misperceives left-sided targets as located on theright side, and cancels them out in that region. (iii) A re-cent work by Husain et al. (2001) suggests a third possi-bility. These authors proposed that neglect of left-sidedtargets is exacerbated by loss of memory of what posi-tions have already been explored during the visualsearch. The combination of a rightward search biasand a spatial short-term memory (STM) deficit would in-duce the patient to search on the right side over and over,because he/she is not inhibited in his/her search on al-ready visited positions. If the patient also has a deficitin inhibiting the automatic cancellation response oncefixation has landed on a previously visited target, despitethe vision of the mark/s drawn over it, the prediction isthat extra marks will be produced. Crucially, these extramarks will be the more frequent the higher the load onthe damaged STM system, i.e., the higher the numberof positions to be remembered. In Bottini and Toraldo�s(2003) condition with targets on the left side, there weremore cancelled targets—more positions to be remem-bered—than in the condition without left-sided targets.The higher memory load in the former condition wouldtherefore account for the more frequent extra marks.
The aim of this study is to report a case that closelymatches one crazy prediction that Bottini and Toraldo(2003) did not dare to propose following their allochiriaconjecture (ii), and that is less compatible with either ofthe other views (i, iii). We prepared an experimental setwhich allowed us to study independently the effects ofposition and number of contralesional targets on cancel-lation in the ipsilesional side.
2. Methods
2.1. Case report
EZ, a 75-year–old right-handed lady with five yearsof education, was admitted at the neurological ward ofNiguarda Hospital after a stroke. A CT scan showed alarge lesion in the right hemisphere involving the frontal,temporal, parietal and occipital lobes as well as the insu-la. EZ showed mild left hemiplegia, left hemianopia andleft hemianaesthesia. She was anosognosic for the lattertwo deficits (Bisiach, Cappa, & Vallar, 1983). EZ mislo-calized contralesional stimuli as on the ipsilesional side
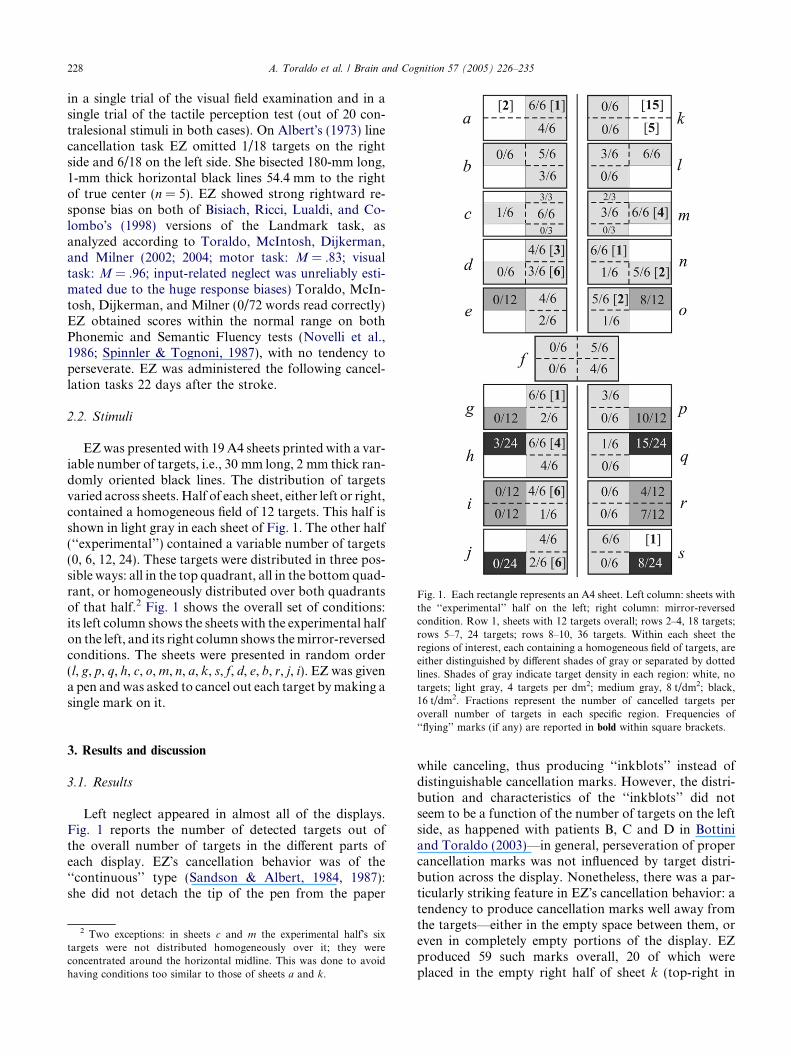
Fig. 1. Each rectangle represents an A4 sheet. Left column: sheets withthe ‘‘experimental’’ half on the left; right column: mirror-reversedcondition. Row 1, sheets with 12 targets overall; rows 2–4, 18 targets;rows 5–7, 24 targets; rows 8–10, 36 targets. Within each sheet theregions of interest, each containing a homogeneous field of targets, areeither distinguished by different shades of gray or separated by dottedlines. Shades of gray indicate target density in each region: white, notargets; light gray, 4 targets per dm2; medium gray, 8 t/dm2; black,16 t/dm2. Fractions represent the number of cancelled targets per
228 A. Toraldo et al. / Brain and Cognition 57 (2005) 226–235
in a single trial of the visual field examination and in asingle trial of the tactile perception test (out of 20 con-tralesional stimuli in both cases). On Albert�s (1973) linecancellation task EZ omitted 1/18 targets on the rightside and 6/18 on the left side. She bisected 180-mm long,1-mm thick horizontal black lines 54.4 mm to the rightof true center (n = 5). EZ showed strong rightward re-sponse bias on both of Bisiach, Ricci, Lualdi, and Co-lombo�s (1998) versions of the Landmark task, asanalyzed according to Toraldo, McIntosh, Dijkerman,and Milner (2002; 2004; motor task: M = .83; visualtask: M = .96; input-related neglect was unreliably esti-mated due to the huge response biases) Toraldo, McIn-tosh, Dijkerman, and Milner (0/72 words read correctly)EZ obtained scores within the normal range on bothPhonemic and Semantic Fluency tests (Novelli et al.,1986; Spinnler & Tognoni, 1987), with no tendency toperseverate. EZ was administered the following cancel-lation tasks 22 days after the stroke.
2.2. Stimuli
EZwas presented with 19A4 sheets printed with a var-iable number of targets, i.e., 30 mm long, 2 mm thick ran-domly oriented black lines. The distribution of targetsvaried across sheets.Half of each sheet, either left or right,contained a homogeneous field of 12 targets. This half isshown in light gray in each sheet of Fig. 1. The other half(‘‘experimental’’) contained a variable number of targets(0, 6, 12, 24). These targets were distributed in three pos-sible ways: all in the top quadrant, all in the bottom quad-rant, or homogeneously distributed over both quadrantsof that half.2 Fig. 1 shows the overall set of conditions:its left column shows the sheets with the experimental halfon the left, and its right column shows themirror-reversedconditions. The sheets were presented in random order(l, g, p, q, h, c, o,m, n, a, k, s, f, d, e, b, r, j, i). EZ was givena pen andwas asked to cancel out each target bymaking asingle mark on it.
overall number of targets in each specific region. Frequencies of‘‘flying’’ marks (if any) are reported in bold within square brackets.
3. Results and discussion
3.1. Results
Left neglect appeared in almost all of the displays.Fig. 1 reports the number of detected targets out ofthe overall number of targets in the different parts ofeach display. EZ�s cancellation behavior was of the‘‘continuous’’ type (Sandson & Albert, 1984, 1987):she did not detach the tip of the pen from the paper
2 Two exceptions: in sheets c and m the experimental half�s sixtargets were not distributed homogeneously over it; they wereconcentrated around the horizontal midline. This was done to avoidhaving conditions too similar to those of sheets a and k.
while canceling, thus producing ‘‘inkblots’’ instead ofdistinguishable cancellation marks. However, the distri-bution and characteristics of the ‘‘inkblots’’ did notseem to be a function of the number of targets on the leftside, as happened with patients B, C and D in Bottiniand Toraldo (2003)—in general, perseveration of propercancellation marks was not influenced by target distri-bution across the display. Nonetheless, there was a par-ticularly striking feature in EZ�s cancellation behavior: atendency to produce cancellation marks well away fromthe targets—either in the empty space between them, oreven in completely empty portions of the display. EZproduced 59 such marks overall, 20 of which wereplaced in the empty right half of sheet k (top-right in

A. Toraldo et al. / Brain and Cognition 57 (2005) 226–235 229
Fig. 1; see Fig. 2A for the exact reproduction). These‘‘flying’’ marks were clearly intentional, and in manycases they were of comparable intensity to that of themarks made over the targets. Although no formal re-cord was taken of the order in which EZ traced themarks, one experimenter (AR) recalled that EZ tendedto intermingle ‘‘flying’’ and cancellation marks whileexploring the display in an essentially ordered fashion,mostly from left to right and from top to bottom.
We performed an analysis of the distribution of the‘‘flying’’marks as a function of the display characteristics.
3.1.1. Definition of ‘‘flying’’ mark
We excluded from further analysis all marks thatseemed to have been produced by accidental pen-papercontacts. A ‘‘flying’’ mark was operationally defined asa mark entirely outside the rectangular areas centered
Fig. 2. (A) Sheet k (top right in Fig. 1).
on each target and extending 4 mm outwards from itsshort side and 1 mm outwards from its long side. Allmarks extending even partially within those areas wereclassified as cancellation marks and the involved targetwas classified as a detected one. By using this criterionwe could avoid misjudging marks made in the closevicinity of a target, and thus likely to be proper cancel-lation marks, as ‘‘flying’’ marks. Fig. 1 reports theresulting distribution of ‘‘flying’’ marks; their frequencyis reported in square brackets in any given region. In thenext sections we will sometimes use the shortcut ‘‘F’’ for‘‘flying marks.’’
3.1.2. Measure of ‘‘flying’’ marks production: densityin explored white area
By definition, F could appear only in the sheet�s sur-face lying outside each rectangular perimeter surround-
(B) Sheet j (bottom left in Fig. 1).
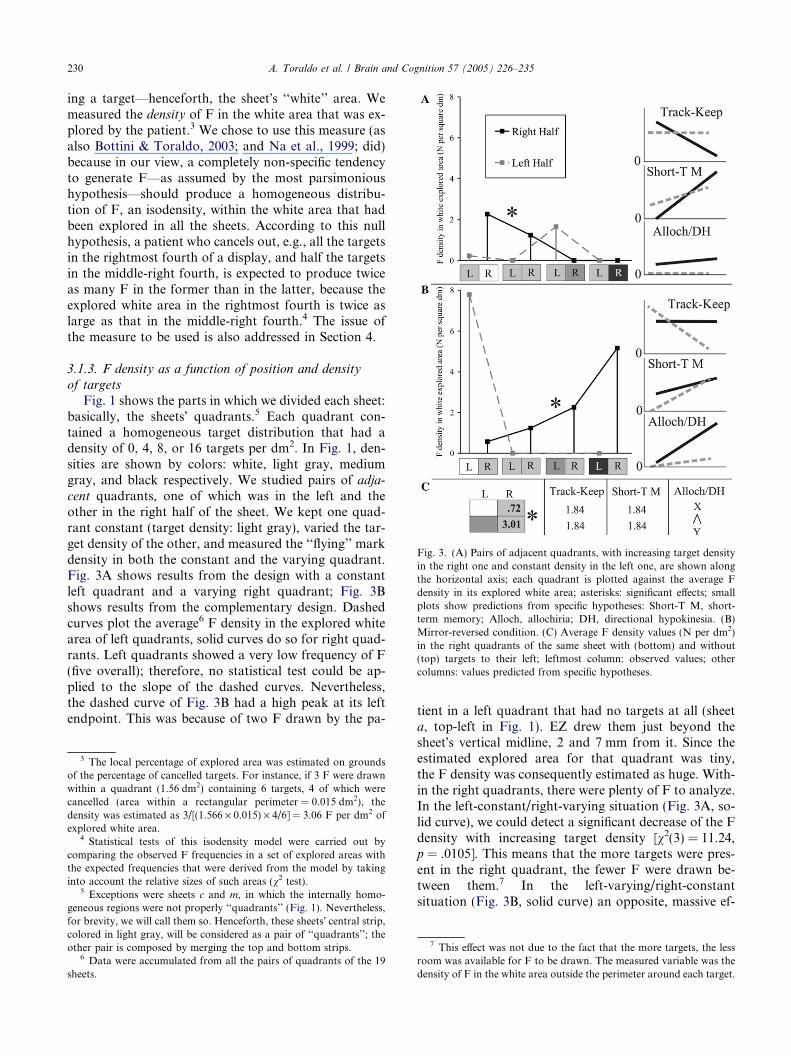
Fig. 3. (A) Pairs of adjacent quadrants, with increasing target densityin the right one and constant density in the left one, are shown alongthe horizontal axis; each quadrant is plotted against the average Fdensity in its explored white area; asterisks: significant effects; smallplots show predictions from specific hypotheses: Short-T M, short-term memory; Alloch, allochiria; DH, directional hypokinesia. (B)Mirror-reversed condition. (C) Average F density values (N per dm2)in the right quadrants of the same sheet with (bottom) and without(top) targets to their left; leftmost column: observed values; othercolumns: values predicted from specific hypotheses.
230 A. Toraldo et al. / Brain and Cognition 57 (2005) 226–235
ing a target—henceforth, the sheet�s ‘‘white’’ area. Wemeasured the density of F in the white area that was ex-plored by the patient.3 We chose to use this measure (asalso Bottini & Toraldo, 2003; and Na et al., 1999; did)because in our view, a completely non-specific tendencyto generate F—as assumed by the most parsimonioushypothesis—should produce a homogeneous distribu-tion of F, an isodensity, within the white area that hadbeen explored in all the sheets. According to this nullhypothesis, a patient who cancels out, e.g., all the targetsin the rightmost fourth of a display, and half the targetsin the middle-right fourth, is expected to produce twiceas many F in the former than in the latter, because theexplored white area in the rightmost fourth is twice aslarge as that in the middle-right fourth.4 The issue ofthe measure to be used is also addressed in Section 4.
3.1.3. F density as a function of position and density
of targets
Fig. 1 shows the parts in which we divided each sheet:basically, the sheets� quadrants.5 Each quadrant con-tained a homogeneous target distribution that had adensity of 0, 4, 8, or 16 targets per dm2. In Fig. 1, den-sities are shown by colors: white, light gray, mediumgray, and black respectively. We studied pairs of adja-cent quadrants, one of which was in the left and theother in the right half of the sheet. We kept one quad-rant constant (target density: light gray), varied the tar-get density of the other, and measured the ‘‘flying’’ markdensity in both the constant and the varying quadrant.Fig. 3A shows results from the design with a constantleft quadrant and a varying right quadrant; Fig. 3Bshows results from the complementary design. Dashedcurves plot the average6 F density in the explored whitearea of left quadrants, solid curves do so for right quad-rants. Left quadrants showed a very low frequency of F(five overall); therefore, no statistical test could be ap-plied to the slope of the dashed curves. Nevertheless,the dashed curve of Fig. 3B had a high peak at its leftendpoint. This was because of two F drawn by the pa-
3 The local percentage of explored area was estimated on groundsof the percentage of cancelled targets. For instance, if 3 F were drawnwithin a quadrant (1.56 dm2) containing 6 targets, 4 of which werecancelled (area within a rectangular perimeter = 0.015 dm2), thedensity was estimated as 3/[(1.566 · 0.015) · 4/6] = 3.06 F per dm2 ofexplored white area.
4 Statistical tests of this isodensity model were carried out bycomparing the observed F frequencies in a set of explored areas withthe expected frequencies that were derived from the model by takinginto account the relative sizes of such areas (v2 test).
5 Exceptions were sheets c and m, in which the internally homo-geneous regions were not properly ‘‘quadrants’’ (Fig. 1). Nevertheless,for brevity, we will call them so. Henceforth, these sheets� central strip,colored in light gray, will be considered as a pair of ‘‘quadrants’’; theother pair is composed by merging the top and bottom strips.
6 Data were accumulated from all the pairs of quadrants of the 19sheets.
tient in a left quadrant that had no targets at all (sheeta, top-left in Fig. 1). EZ drew them just beyond thesheet�s vertical midline, 2 and 7 mm from it. Since theestimated explored area for that quadrant was tiny,the F density was consequently estimated as huge. With-in the right quadrants, there were plenty of F to analyze.In the left-constant/right-varying situation (Fig. 3A, so-lid curve), we could detect a significant decrease of the Fdensity with increasing target density [v2(3) = 11.24,p = .0105]. This means that the more targets were pres-ent in the right quadrant, the fewer F were drawn be-tween them.7 In the left-varying/right-constantsituation (Fig. 3B, solid curve) an opposite, massive ef-
7 This effect was not due to the fact that the more targets, the lessroom was available for F to be drawn. The measured variable was thedensity of F in the white area outside the perimeter around each target.
A. Toraldo et al. / Brain and Cognition 57 (2005) 226–235 231
fect was found: the denser the left-sided targets, the den-ser F in the right quadrant [v2(3) = 24.77, p = .00002].
3.1.4. Within-sheet effect of density of left-sided targets
In the previous section, the effect of the density ofleft-sided targets on the F density in the right quadrantswas studied (solid curve in Fig. 3B). However, dataregarding different target densities often came from dif-ferent sheets; e.g., ‘‘medium gray’’ density was studied insheets e, g, and i while ‘‘black’’ density was studied insheets h and j. The same effect could be studied withina same sheet, e.g., b (Fig. 1). Although both its rightquadrants were identical, the top-right one had targetsto its left, while the bottom-right one did not. By com-paring the F densities in the white explored areas ofthose two quadrants, an effect of left-sided targets den-sity, albeit gross, could be extracted. In order to obtaina more powerful statistical test, data were accumulatedfrom all the sheets of Fig. 1�s left column for whichthe same reasoning could be applied—b, d, e, g, h, andj. Right quadrants without targets to their left were ex-plored in 5.56 dm2 of their white space; 5.32 dm2 wereinstead explored in the right quadrants with targets totheir left. If the null hypothesis of F isodensity held true,the proportion of F in the first area out of the overallarea should be 5.56/(5.56 + 5.32) = .511. The observedproportion was .2 (4/20 F), significantly smaller than.511 (binomial test, one-tailed p = .0027). ‘‘Flying’’marks were denser in the quadrants that had targets totheir left (see, e.g., sheet j in Fig. 2B). The exact F den-sities are reported in Fig. 3C.
3.2. Discussion
In this section, different hypotheses will be discussedand their specific predictions (small plots in Fig. 3) willbe compared to the observed results (large plots).
3.2.1. The ‘‘track-keeping’’ hypothesis
To perform a cancellation task it is necessary to avoidcoming back to already explored positions of the display,otherwise the search would be endless. To this purpose,the patient needs to know what position of the pagehe/she is fixating at any given moment. Neglect patientsmay have a pathologically restricted attentional focus(see, e.g., Ladavas, Petronio, & Umilta, 1990). EZ, whohad a very large lesion, might have had a tiny attentionalfocus, thus ‘‘seeing’’ just a small portion of the display,e.g., 2–3 cm across, at any given time. If a patient cannotwiden his/her attentional focus enough for includingboth the fixated position and a relevant landmark, e.g.,a sheet�s corner, he/she cannot know where he/she is fix-ating on the page—a lack of page-centered positionalinformation that makes it impossible to know whetheror not the current position has already been visited.One way of compensating for this deficit would be to
scan the page along some egocentrically-defined direc-tions—as indeed EZ tended to do, from left to rightand from top to bottom—and make marks everywhereduring the search, in order to leave a track that helpsavoid returning over an already covered route. Whenthe tiny focus is set over an entirely white sector of page,‘‘flying’’ marks would be drawn; when the focus includesa target, marks would be made on it, both accomplishingthe task and keeping track of the visit. This hypothesiswould explain the extreme case of sheet k, in which EZproduced 20 ‘‘flying’’ marks (Fig. 2A), as a result ofEZ�s attentional focus swimming desperately throughthe entirely blank right half of the sheet and leavingtraces of its passage in order to be able to avoid re-visits.
The most obvious prediction of such a view is that EZshould have produced ‘‘flying’’ marks also on an entirelyempty sheet – unfortunately we did not administer thiscondition to her. Another prediction is that the produc-tion of F should also be possible in blank fields lying tothe left of the leftmost targets; this actually happenedin sheet a (Fig. 1), and is a crucial finding because it can-not be predicted by any of the other hypotheses discussedin this paper. Other predictions of the ‘‘track-keeping’’theory directly refer to the findings shown in Fig. 3.According to the hypothesis, F are produced when thefocus is set over an entirely white part of the display; thisis less likely to occur, the denser the targets are in the re-gion. Therefore, the denser the targets in a region, the lessdense F should be in the explored white area of that region.Graphically, if one plots target density against F density,a negative slope should be found (see Fig. 3A, ‘‘Track-Keep’’: solid curve; Fig. 3B, ‘‘Track-Keep’’: dashedcurve). This negative slope was empirically observed inboth cases—albeit not significantly so in the secondcase—thus confirming the prediction. A more severe testof the track-keeping hypothesis addresses its sufficiencyas an explanation: if different explored regions have the
same density of targets, they should also have the samedensity of F in their white areas. The left quadrants inFig. 3A and right quadrants in Fig. 3B have a constanttarget density. Therefore, according to the track-keepinghypothesis, they should show a constant F density (flatfunctions in Figs. 3A and B, ‘‘Track-Keep’’). While theobserved function of Fig. 3A is compatible with that pre-diction, the observed function in Fig. 3B has a signifi-cantly positive slope, which violates the prediction.
3.2.2. The hypothesis of a short-term memory deficit
As an effect of a deficit in STM for spatial positions(Husain et al., 2001), EZ might have frequently comeback to already explored regions of the display that con-tained targets. One might assume that EZ produced F inthose regions during returns—a problematic point to bediscussed later. Returns in each region would be morefrequent the higher the memory load, i.e., the largerthe overall area of the sheet that has already been ex-
232 A. Toraldo et al. / Brain and Cognition 57 (2005) 226–235
plored, and the longer the time taken for exploring thesheet. Crucially, one can assume that the search timeis influenced by the number of neglected targets—someform of implicit processing might slow down the pa-tient�s search. The indirect effect would thus be of morefrequent returns with increasing number of neglectedtargets. The effects of number of cancelled targets(STM load) and of neglected targets (slowing down)would combine and provide the predictions shown inthe small plots ‘‘Short-T M’’ of Figs. 3A and B. Radicaldiscrepancies emerge between those predictions and theobserved results; the STM deficit hypothesis seems thusinadequate as a unique explanation.
3.2.3. Combination of the track-keeping and STM
deficit hypotheses
Although both the track-keeping and the STM deficithypotheses, each taken alone, seem inadequate inexplaining the results pattern of Figs. 3A and B, onemight suggest that their combination could do so. Ifthe two predictive plots ‘‘Track-Keep’’ and ‘‘Short-TM’’ were averaged out by giving more weight to the for-mer, a good fit with the real data would be obtained inFig. 3A; less so in Fig. 3B where the averaged slope ofthe solid curve would be virtually zero—in sharp con-trast to the observed slope. Nevertheless, suppose thatthis combination gives a satisfactory explanation for re-sults in Figs. 3A and B. Both the hypotheses, and there-fore their combination, predict a null result when onecompares F densities in quadrants of a same sheet thathave/do not have targets to their left (Fig. 3C). In fact,all the crucial variables are equal between those two com-parison terms. Target density, which is important for thetrack-keeping hypothesis, is the same in the two quad-rants; both the overall area explored in the sheet andthe overall number of neglected targets in the sheet,which are determinant for the STM deficit hypothesis,are equal for the two quadrants—they are quadrants ofa same sheet! The empirical result contradicts the predic-tion: F density was massively higher when targets werepresent in the aligned right field (Fig. 3C).
3.2.4. Allochiria and directional hypokinesia
‘‘Flying’’ marks might have been produced while try-ing to cross out delusional targets—maybe, undetectedtargets whose position was misperceived rightwards(allochiria). Another possibility is that EZ made ‘‘fly-ing’’ marks after having ‘‘undershot’’ leftward reachingmovements towards targets, i.e., she might have pro-duced the cancellation action that naturally follows thereaching movement, some distance to the right of thetarget itself (directional hypokinesia). If formulated inthis way, both the allochiria and the directional hypoki-nesia hypotheses provide the same predictions for allphenomena summarized in Fig. 3. Predictions were ob-tained by simulating reaching actions as directed 10, 15,
or 20 cm to the right of each neglected target, andassuming that a ‘‘flying’’ mark was produced there withprobability proportional to the local percentage of ex-plored area. According to the resulting predictions,one should expect (i) negligible or marginal variationsin F production in the left quadrants (Figs. 3A and B,‘‘Alloch/DH,’’ dashed curves), but (ii) notable differ-ences in the right quadrants, according to how dense tar-gets are to their left (Fig. 3B, solid curve) and, to asmaller extent, according to how dense targets are insidethem (Fig. 3A, solid curve; this little effect would be dueto neglected right-sided targets that were ‘‘cancelled’’ theshortest way—10 cm—to their right). By no means werethese predictions fully met when compared to the ob-served results. Nevertheless, the within-sheet effect ofleft-sided targets� density on right-sided F�s density(Fig. 3C) was correctly predicted; crucially, this effectwas not predicted by either of the other models.
3.2.5. One solution
A combination of the allochiria/directional hypoki-nesia and of the track-keeping hypotheses provides thebest model for explaining the pattern of results. By aver-aging their predictive plots ‘‘Alloch/DH’’ and ‘‘Track-Keep’’ in Figs. 3A and B the resulting slopes adequatelymatch the observed ones. Also the within-sheet effect(Fig. 3C) is predicted by this combination. In general,the allochiria hypothesis is necessary for explainingwhy an increase in the density of left-sided targets in-duced an increase in the density of right-sided F (solidcurve in Fig. 3B, effect in 3C) and the track-keepinghypothesis is necessary to explain the reduction of thedensity of right-sided F with increasing number of sur-rounding targets (solid curve in Fig. 3A). The track-keeping explanation is the only one we could providefor EZ�s behavior of making two F to the left of the left-most targets on sheet a, in an entirely empty region—none of the other hypotheses can account for that (seethe null value at the left end of the dashed curves, forall predictive plots except ‘‘Track-Keep,’’ Fig. 3B).
4. General discussion
An effect of presence vs. absence of left-sided targetson ipsilesional perseveration in neglect has already beendescribed in previous work (Bottini & Toraldo, 2003).We replicated those results (Fig. 3C). Most importantly,this time ‘‘perseveration’’ is the behavior of drawingmarks in the empty space between targets. In an hypoth-esis-elimination procedure, we analyzed a number of ac-counts for this bizarre behavior—namely, (i) the ideathat EZ was trying to compensate for a pathologicallyrestricted attentional focus by keeping track of the ex-plored territory; (ii) a short-term memory deficit induc-ing frequent returns over previously visited positions;
8 This explains the apparent discrepancies between Na et al.�s(1999) and Rusconi et al.�s (2002) data. The former used a measure ofdensity of perseveration in a given area, the second used the merenumber of perseverations.
A. Toraldo et al. / Brain and Cognition 57 (2005) 226–235 233
(iii) consistently with one previous proposal (Bottini &Toraldo, 2003), allochiria/directional hypokinesia. Eachof these views, taken alone, failed to predict all the mainfeatures of EZ�s behavior (Fig. 3). The best solution wecould offer was the combination of the track-keepingand the allochiria/directional hypokinesia models.
The (hypothetical) effects of allochiria and directionalhypokinesia are hard to tell apart in a cancellation task.Transferring a perceptual object to the right, or under-shooting a leftward reaching movement towards it, pro-duces the same result. Furthermore, there is independentevidence of EZ�s directional hypokinesia, namely, hermassive rightward response bias on both of Bisiach etal.�s (1998) versions of the Landmark task. Nevertheless,we have theoretical reasons to prefer allochiria as anexplanation in this case. The idea of directional hypoki-nesia per se provides a reason why reaching movementsmight be misdirected—undershot—when they areplanned towards the left. Yet, once the patient�s handlands in an empty position, he/she should not makemarks there: since there is no time limit and there is fullvisual feedback, the patient should realize that he/shehad reached an empty region. In other words, the disad-vantage of the directional hypokinesia hypothesis is thatit requires a corollary assumption specifying why penstrokes that were originally programmed for a specifictarget are not inhibited in empty space—in this respect,the allochiria hypothesis provides a natural solution: thepatient literally believes the target is under the pen tip.Similar critiques could be applied against the STM def-icit model: it needs a corollary assumption specifyingwhy ‘‘returns’’ over previously visited regions should in-duce the patient to cancel in midair—if anything, onemight expect the targets to be cancelled over and over.There is another, puzzling reason, albeit anecdotal, forwhich the allochiria model might be preferable to thehypokinesia one. While making ‘‘flying’’ marks in sheetk, EZ spontaneously commented that she did see ‘‘somelines, less thick and lighter in color than the other ones.’’What she referred to as ‘‘the other ones’’ were the realtargets. This is consistent with the view of a productiveperceptual phenomenon, and therefore, with our conjec-ture about the pathological misplacement of perceptualobjects towards the ipsilesional side.
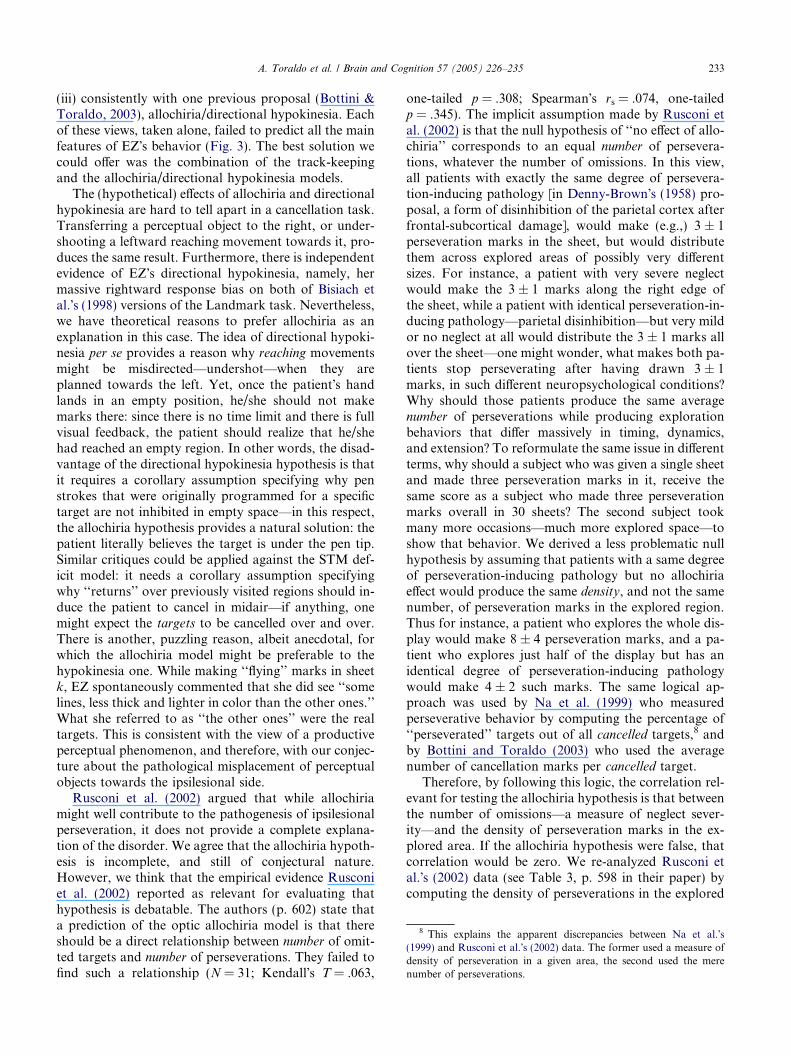
Rusconi et al. (2002) argued that while allochiriamight well contribute to the pathogenesis of ipsilesionalperseveration, it does not provide a complete explana-tion of the disorder. We agree that the allochiria hypoth-esis is incomplete, and still of conjectural nature.However, we think that the empirical evidence Rusconiet al. (2002) reported as relevant for evaluating thathypothesis is debatable. The authors (p. 602) state thata prediction of the optic allochiria model is that thereshould be a direct relationship between number of omit-ted targets and number of perseverations. They failed tofind such a relationship (N = 31; Kendall�s T = .063,
one-tailed p = .308; Spearman�s rs = .074, one-tailedp = .345). The implicit assumption made by Rusconi etal. (2002) is that the null hypothesis of ‘‘no effect of allo-chiria’’ corresponds to an equal number of persevera-tions, whatever the number of omissions. In this view,all patients with exactly the same degree of persevera-tion-inducing pathology [in Denny-Brown�s (1958) pro-posal, a form of disinhibition of the parietal cortex afterfrontal-subcortical damage], would make (e.g.,) 3 ± 1perseveration marks in the sheet, but would distributethem across explored areas of possibly very differentsizes. For instance, a patient with very severe neglectwould make the 3 ± 1 marks along the right edge ofthe sheet, while a patient with identical perseveration-in-ducing pathology—parietal disinhibition—but very mildor no neglect at all would distribute the 3 ± 1 marks allover the sheet—one might wonder, what makes both pa-tients stop perseverating after having drawn 3 ± 1marks, in such different neuropsychological conditions?Why should those patients produce the same averagenumber of perseverations while producing explorationbehaviors that differ massively in timing, dynamics,and extension? To reformulate the same issue in differentterms, why should a subject who was given a single sheetand made three perseveration marks in it, receive thesame score as a subject who made three perseverationmarks overall in 30 sheets? The second subject tookmany more occasions—much more explored space—toshow that behavior. We derived a less problematic nullhypothesis by assuming that patients with a same degreeof perseveration-inducing pathology but no allochiriaeffect would produce the same density, and not the samenumber, of perseveration marks in the explored region.Thus for instance, a patient who explores the whole dis-play would make 8 ± 4 perseveration marks, and a pa-tient who explores just half of the display but has anidentical degree of perseveration-inducing pathologywould make 4 ± 2 such marks. The same logical ap-proach was used by Na et al. (1999) who measuredperseverative behavior by computing the percentage of‘‘perseverated’’ targets out of all cancelled targets,8 andby Bottini and Toraldo (2003) who used the averagenumber of cancellation marks per cancelled target.
Therefore, by following this logic, the correlation rel-evant for testing the allochiria hypothesis is that betweenthe number of omissions—a measure of neglect sever-ity—and the density of perseveration marks in the ex-plored area. If the allochiria hypothesis were false, thatcorrelation would be zero. We re-analyzed Rusconi etal.�s (2002) data (see Table 3, p. 598 in their paper) bycomputing the density of perseverations in the explored
234 A. Toraldo et al. / Brain and Cognition 57 (2005) 226–235
area as the ratio between number of perseverations andnumber of detected targets—the latter is used as an esti-mate of the size of the explored area. The prediction ofthe allochiria hypothesis was confirmed, as the correla-tion between perseveration density and number of omis-sions was significantly higher than zero (N = 31;T = .263, one-tailed p = .027; rs = .346, one-tailedp = .029). This replicates the results obtained by Na etal. (1999) who found a significant proportionality be-tween neglect severity and perseveration density. More-over, the correlation becomes higher if Rusconi et al.�s(2002) four patients with right neglect after left hemi-sphere stroke are included in the analysis (N = 35;T = .382, one-tailed p = .0015; rs = 487, one-tailedp = .0015). The size of the correlation can best be under-stood by looking at the rs value, whose scale and meaningare the same as those of Pearson�s parametric r (Siegel &Castellan, 1988, p. 251). The value of .487 indicates acorrelation of moderate size. On this view, Rusconi etal.�s (2002) non-significant correlation should be inter-preted as the result of two opposite (independent) effectsthat cancel each other out. A first effect would be an in-crease in the number of the allochiria-induced persevera-tions with increasing number of neglected targets; asecond effect would be a simultaneous decrease in thenumber of those perseverations that are instead causedby the frontal-subcortical damage (Denny-Brown,1958), because of the decrease in the explored area.
Although the above correlation (.487) confirms theallochiria hypothesis, this remains still conjectural, andcrucially, incomplete as an explanation of perseverationin neglect. For instance, the allochiria model does notexplain the higher perseveration scores of anterior corti-cal and/or subcortical patients with respect to posteriorcortical patients (Na et al., 1999; Rusconi et al., 2002): ifanything, one would predict that optic allochiria followsposterior cortical damage. Neither does it explain the‘‘complex’’ variants of perseveration, e.g., the tendencyto produce irrelevant material while canceling. Onecan also state that the allochiria hypothesis cannot ex-plain the cases of florid perseveration without neglect,even though, as a simple dissociation, this pattern mightin principle be explained in terms of an artifact of differ-ential test sensitivity (Shallice, 1988). In any case, as sug-gested by previous work (Bottini & Toraldo, 2003), bythe current case report and by our re-analysis of Rus-coni et al.�s (2002) neglect data—that replicate those ofNa et al., 1999—the role of the allochiria hypothesis inthe study of perseveration cannot be prematurely de-fined as marginal.
Acknowledgments
This research was supported by grants from the Ital-ian Ministry of University and Scientific Research. We
wish to thank Nicola van Rijsbergen for her kind helpin revising the English.
References
Albert, M. L. (1973). A simple test of visual neglect. Neurology, 23,658–664.
Bisiach, E., Cappa, S., & Vallar, G. (1983). Guida all�esame neurops-
icologico. Milano: Raffaello Cortina.Bisiach, E., Ricci, R., Lualdi, M., & Colombo, M. R. (1998).
Perceptual and response bias in unilateral neglect: two modifiedversions of the Milner landmark task. Brain and Cognition, 37,369–386.
Bottini, G., & Toraldo, A. (2003). The influence of contralesionaltargets on the cancellation of ipsilesional targets in unilateralneglect. Brain and Cognition, 53, 117–120.
Damasio, A. R., Damasio, H., & Chui, H. C. (1980). Neglect followingdamage to frontal lobe or basal ganglia. Neuropsychologia, 18,123–132.
Denny-Brown, D. (1958). The nature of apraxia. Journal of Nervous
and Mental Disease, 126, 9–32.Goldberg, E. (1986). Varieties of perseveration: a comparison of two
taxonomies. Journal of Clinical and Experimental Neuropsychology,
8, 710–726.Halligan, P. W., Marshall, J. C., & Wade, D. T. (1992). Left on the
right: allochiria in a case of left visuo-spatial neglect. Journal ofNeurology, Neurosurgery and Psychiatry, 55, 717–719.
Heilman, K. M., Bowers, D., Coslett, H. B., Whelan, H., & Watson,R. T. (1985). Directional hypokinesia: prolonged reaction times forleftward movements in patients with right hemisphere lesions andneglect. Neurology, 35, 855–859.
Hudson, A. J. (1968). Perseveration. Brain, 91, 571–582.Husain, M., Mannan, S., Hodgson, T., Wojciulik, E., Driver, J., &
Kennard, C. (2001). Impaired spatial working memory acrosssaccades contributes to abnormal search in parietal neglect. Brain,124, 941–952.
Kawamura, M., Hirayama, K., Shinohara, Y., Watanabe, Y., &Sugishita, M. (1987). Alloaesthesia. Brain, 110, 225–236.
Ladavas, E., Petronio, A., & Umilta, C. (1990). The deployment ofvisual attention in the intact field of hemineglect patients. Cortex,26, 307–317.
Luria, A. (1965). Two kinds of motor perseveration in massive injuryof the frontal lobes. Brain, 88, 1–10.
Na, D. L., Adair, J. C., Kang, Y., Chung, C. S., Lee, K. H., &Heilman, K. M. (1999). Motor perseverative behavior on a linecancellation task. Neurology, 52, 1569–1576.
Novelli, G., Papagno, C., Capitani, E., Laiacona, M., Vallar, G., &Cappa, S. F. (1986). Tre test clinici di ricerca e produzione lessicale.Taratura su soggetti normali. Archivio di Psicologia, Neurologia e
Psichiatria, 47, 477–506.Posner, M. I., Walker, J. A., Friedrich, F. J., & Rafal, R. D. (1984).
Effects of parietal injury on covert orienting of attention. Journal ofNeuroscience, 4, 1863–1874.
Rizzolatti, G., Gentilucci, M., & Matelli, M. (1985). Selective spatialattention: one center, one circuit or many circuits?. In M. I. Posner& O. S. M. Marin (Eds.). Attention and Performance (vol. XI,pp. 251–265). Hillsdale, NJ: Erlbaum.
Rusconi, M. L., Maravita, A., Bottini, G., & Vallar, G. (2002). Is theintact side really intact? Perseverative responses in patients withunilateral neglect: a productive manifestation. Neuropsychologia,
40, 594–604.Sandson, J., & Albert, M. L. (1984). Varieties of perseveration.
Neuropsychologia, 22, 725–732.Sandson, J., & Albert, M. L. (1987). Perseveration in behavioral
neurology. Neurology, 37, 1736–1741.

A. Toraldo et al. / Brain and Cognition 57 (2005) 226–235 235
Shallice, T. (1988). From Neuropsychology to Mental Structure.Oxford: Oxford University Press.
Siegel, S., & Castellan, N. J. (1988). Nonparametric Statistics for the
Behavioural Sciences. New York: McGraw-Hill.Spinnler, H., & Tognoni, G. (1987). Standardizzazione e taratura
italiana di test neuropsicologici. Italian Journal of Neurological
Sciences(Suppl 6), 1–113.Toraldo, A., McIntosh, R. D., Dijkerman, H. C., & Milner, A. D.
(2002). Disentangling perceptual and response bias in unilateral
neglect: A methodological proposal. Brain and Cognition, 48,593–597.
Toraldo, A., McIntosh, R., Dijkerman, H. C., & Milner, A. D. (2004).A revised method for analyzing neglect using the Landmark Task.Cortex, 40, 415–431.
Vallar, G., & Perani, D. (1986). The anatomy of unilateralneglect after right-hemisphere stroke lesions. A clinical/CT-scan correlation study in man. Neuropsychologia, 24,609–622.


![Straight Lines Slides [Compatibility Mode]](https://static.fdokumen.com/doc/165x107/6316ee6071e3f2062906978b/straight-lines-slides-compatibility-mode.jpg)