Can you see what I see? Transparency, consumer demand, and strategic pricing in B2C electronic...
32
CAN YOU SEE WHAT I SEE? TRANSPARENCY, CONSUMER DEMAND AND STRATEGIC PRICING IN B2C ELECTRONIC COMMERCE Nelson Granados (contact author) Doctoral Program Alok Gupta Associate Profesor Robert J. Kauffman Professor and Chair, Co-Director, MIS Research Center Information and Decision Sciences University of Minnesota, Minneapolis MN 55455 Email: {ngranados; agupta; rkauffman}@csom.umn.edu Last Revised: May 19, 2003 ______________________________________________________________________________ ABSTRACT Internet technology has transformed the nature of business-to-business (B2B) and business-to- consumer (B2C) transaction-making practices. One of the significant areas of impact has occurred with respect to the transparency of markets for end-consumers in many industries, including the market mechanisms, the prices, the quantities bid and offered, and the participating buyers and sellers. In the context of this recent reduction in the informational asymmetries of the marketplace, we propose a new theory-based framework to evaluate the effects of the changed level of market transparency on the strategic pricing decisions of a B2C firm, and their subsequent effects on consumer demand. Market transparency is defined as the level of availability and accessibility of information about the transaction-making process and the product that is exchanged. We develop an economic model that allows us to examine the impacts of different levels of market transparency in the presence of firm-level strategic pricing decisions on consumer demand in the marketplace. We apply the findings from the model to the online travel agency (OTA) industry, where novel mechanisms with different degrees of transparency have emerged in recent years (e.g., Hotwire, Expedia, Orbitz, Travelocity and Priceline.com). Our results indicate that firms can take multiple approaches to increase their revenues by matching pricing decisions to the level of transparency provided by their market mechanism, which we now recognize as a key parameter of organizational strategy. KEYWORDS: Economic analysis, electronic commerce, electronic markets, market transparency, online travel agents, pricing, strategic pricing. ___________________________________________________________________________ Acknowledgements. Alok Gupta’s research is supported by NSF grant #IIS-0301239, but does not necessarily reflect the views of the NSF. Rob Kauffman acknowledges the support of the MIS Research Center at the University of Minnesota and Carlson Wagonlit Travel.
-
Upload
spanalumni -
Category
Documents
-
view
0 -
download
0
Transcript of Can you see what I see? Transparency, consumer demand, and strategic pricing in B2C electronic...

CAN YOU SEE WHAT I SEE? TRANSPARENCY, CONSUMER DEMAND AND STRATEGIC PRICING
IN B2C ELECTRONIC COMMERCE
Nelson Granados (contact author) Doctoral Program
Alok Gupta
Associate Profesor
Robert J. Kauffman Professor and Chair, Co-Director, MIS Research Center
Information and Decision Sciences
University of Minnesota, Minneapolis MN 55455 Email: {ngranados; agupta; rkauffman}@csom.umn.edu
Last Revised: May 19, 2003
______________________________________________________________________________
ABSTRACT
Internet technology has transformed the nature of business-to-business (B2B) and business-to-consumer (B2C) transaction-making practices. One of the significant areas of impact has occurred with respect to the transparency of markets for end-consumers in many industries, including the market mechanisms, the prices, the quantities bid and offered, and the participating buyers and sellers. In the context of this recent reduction in the informational asymmetries of the marketplace, we propose a new theory-based framework to evaluate the effects of the changed level of market transparency on the strategic pricing decisions of a B2C firm, and their subsequent effects on consumer demand. Market transparency is defined as the level of availability and accessibility of information about the transaction-making process and the product that is exchanged. We develop an economic model that allows us to examine the impacts of different levels of market transparency in the presence of firm-level strategic pricing decisions on consumer demand in the marketplace. We apply the findings from the model to the online travel agency (OTA) industry, where novel mechanisms with different degrees of transparency have emerged in recent years (e.g., Hotwire, Expedia, Orbitz, Travelocity and Priceline.com). Our results indicate that firms can take multiple approaches to increase their revenues by matching pricing decisions to the level of transparency provided by their market mechanism, which we now recognize as a key parameter of organizational strategy. KEYWORDS: Economic analysis, electronic commerce, electronic markets, market transparency, online travel agents, pricing, strategic pricing. ___________________________________________________________________________ Acknowledgements. Alok Gupta’s research is supported by NSF grant #IIS-0301239, but does not necessarily reflect the views of the NSF. Rob Kauffman acknowledges the support of the MIS Research Center at the University of Minnesota and Carlson Wagonlit Travel.
0

INTRODUCTION
The Internet revolution has brought about significant changes to “market transparency” in
business-to-consumer (B2C) markets. Market transparency is the level of availability and
accessibility of information to potential consumers about the transaction-making and exchange
process and the product that is purchased, including prices and quality levels. (We provide
additional justification for a related definition in the context of our review of the relevant
literature.) Market transparency has reduced consumer search costs, and given consumers access
to multiple purchasing channels and many new product options. In turn, sellers have obtained
new avenues to attract customers and sell their products, and can now leverage innovative and
new market mechanisms that are intended to increase the efficacy of transaction-making. In the
process, however, senior managers in leading firms have come to recognize that the degree to
which they make information available to the customer about the details of products, prices,
inventories, delivery performance, warranty returns and other information has become a
conscious and strategic decisionmaking process, apt to have an impact on the firm’s success in
the market. As Eugene Polistuk, CEO of Toronto, Canada-based electronic manufacturing
services firm, Celestica, asserts: “Before, companies guarded and filtered information. Now
we’re all naked” (Ticoll, 2000).
The importance of this “Can you see what I see?” transformation of the market and selling
environment in the presence of the Internet and related technological innovations has been
widely recognized. Today, organizations are faced with the paradox that the very benefit of the
Internet for corporations—making information widely available to facilitate product marketing
and distribution—also makes it difficult for them to capture profits, according to Porter (2001).
Sawhney (2002) takes a more aggressive stance, stating that the Internet has brought us one step
1

closer to an “information democracy” by shifting the balance of power to consumers. However,
Adexa Inc. (2003), an automotive industry consultancy, states that “too much visibility” of
information about products and production can expose firms to real risks, such as thinner
margins. In order to address this issue, some consultants (e.g., Peoplesoft and Gartner Group)
claim that embedded in their Enterprise Systems and Customer Relationship Management
applications is the capability to implement information transparency strategies.
A good example of the revolutionary transformation of market transparency can be found in
the air travel and online travel agency (OTA) industries. Travelers can now browse the Internet
to make well-informed purchases about the many flights that are offered by large and small air
carriers. When a consumer’s trip specification involves low complexity (e.g., the purchase of a
domestic round-trip ticket), the consumer can act as her own travel agent, by either going direct
to an air carrier’s travel booking Web site and eliminating the intermediary, or by going through
an online travel intermediary, which consolidates booking information from the global
distribution systems or direct from the airlines. These multiple channels, based on our
preliminary research, appear to provide consumers with different levels of information about the
travel services they hope to purchase. When a consumer’s trip specification involves high
complexity (as is often the case with circuit trips involving multiple destinations and timed
stopovers, multi-carrier ticketing and international trips), transparency is less of an issue. Why?
Because few travel booking Web sites provide sufficient decision support capabilities to make
booking such trips online very effective. Consumers have a difficult time to discover the
relevant information for decision, and typically require the services of a travel specialist.
The reader should consider the market for online travel services as it works today. On the
high end of transparency are online travel agencies such as Orbitz (www.orbitz.com),
2

Travelocity (www.travelocity.com), and Expedia (www.expedia.com), which display a wide
range of travel options based on combinations of airline carrier, price, itinerary, and travel dates.
On the other hand, Hotwire (www.hotwire.com) offers a limited set of promotional fares, and the
airline name and itinerary are only specified after purchase. On the lower end of transparency is
Priceline (www.priceline.com), which shields price and product information until the consumer
makes a contract-binding bid. (See Figure 1 for some initial indications of market transparency
that a traveler who wishes to book any airline will encounter at Hotwire and Priceline.)
As the OTA example suggests, Internet technology has expanded the feasible levels of
transparency by increasing the ability to reveal or conceal product and price information. But
has this transformation tilted the balance in favor of the final consumers? If so, what are the
implications for demand, prices, and market structure? And what can organizations do
proactively to confront the challenges triggered by this information revolution? In this paper,
we address these questions by developing a simple model of consumer demand that is influenced
by market transparency. The model is based on existing findings from the market microstructure
literature in Industrial Organization and the financial market design literature in Finance.
We offer three primary contributions in this work. First, we provide a framework to define and
classify various industry and transaction-making settings in terms of the concordance between
their predicted and observed transparency in electronic markets. Second, we study the
implications of market transparency on market demand. Third, our results show how firms can
increase revenues by basing pricing decisions on the level of transparency provided by the
market mechanism that they select. Taken together, these contributions offer interesting insights
for both the academic and industry audiences, and encourage us to develop a more broadly-based
research initiative on the impacts of market transparency in the e-commerce domain.
3

Figure 1. First Hints: Visual Evidence of Market Transparency Issues for Hotwire and Priceline
Note: To illustrate the first hints of market transparency that greet a consumer who wishes to use Hotwire and Priceline, we began the process for booking a round-trip fare for one of the co-authors departing October 17, 2003 from Minneapolis-St.Paul Int’l (MSP), and returning October 22, 2003 from Atlanta/Hartsfield Int’l (ATL).
□ Priceline: Will book a ticket with a price matching bid price by traveler; no choices of airlines or tickets—just the matching flight; travel to occur in 6am to 10pm time frame; no control over air carrier; no more than one stopover. No guarantee that ticket is available at the bidder’s price. Taxes and processing fees presented.
□ Hotwire: Will book a ticket from available fares selecting lowest price for traveler; no choice of carrier; flight time information not given prior to ticketing. Will result in an available ticket, since traveler is not asked to make a ticket price bid. Booking fee shown, but taxes built into ticket price.
Additional transparency issues arise for the traveler between the time that he specifies the trip details, does a sign-up procedure and gives credit card information, and makes a query on the Hotwire and Priceline ticket databases. We present more details later in the paper.
Source: Hotwire, www.hotwire.com, and Priceline.com, www.priceline.com, accessed May 17, 2003.
4

The rest of this paper is organized as follows. The next section provides the basis in the
literature for a working definition of market transparency for this research. We also develop and
discuss the elements of a transparency evaluation framework for B2C e-commerce. In the third
section, we present and analyze the profit maximization model of market transparency in terms
of firm pricing decisions and the resulting consumer demand. The fourth section briefly
discusses the broader implications of our findings, both in the OTA industry and with respect to
other industries that also can manipulate market transparency in their organizational strategy.
INFORMATION RELEVATION AND TRANSPARENCY IN B2C MARKETS
To provide a foundation for our market transparency and strategic pricing model, we define
market transparency in terms of the relevant theoretical work. A second related task is to
characterize the implementation and operation of different levels of market transparency in the
marketplaces that we study. We do this through a framework.
Defining Market Transparency in B2C Markets
The transparency of transaction-relevant information can take on multiple interpretations,
depending on the context in which it is analyzed.
The Financial Markets’ View of Market Transparency. Most of the literature on
information revelation and transparency has been built up in the context of financial markets,
where researchers have explored the extent to which greater transparency in security trading in
the financial markets leads to higher market efficiency and liquidity (Biais, 1993; Lyons, 1994;
Gemmill, 1996; Madhavan, 1996; Pagano and Roell, 1996; Kofman and Moser, 1997). The
main motivation for this line of research has been the ongoing policy debate about the
appropriateness and breadth of the publication of information related to financial market trades
(Schwartz, 1995). This literature defines market transparency as the ability of market
5

participants to observe information about the trading process (Harbrouck, 1995; O’Hara, 1995;
Board and Sutcliffe, 2000). By obtaining more information about the trading process, including
order flow, transaction history, quotes, and the identities of the traders, buyers and sellers are in a
position to obtain economic benefits that would be otherwise be held up by market
intermediaries, or inappropriately distributed, since financial market design involves multi-lateral
bargaining among investors, dealers, market-making intermediaries and the regulators.
Financial market order flow information provides a picture of market supply and demand
through buy and sell orders (Pagano and Roell, 1996; Madhavan, 1996; Lyons, 1994).
Aggregate measures, such as the difference between buy and sell orders, give market participants
an idea about the pressure to buy or to sell a given financial instrument. Transaction history
includes information about past order flow. Its availability is sometimes referred to as post-trade
transparency (Pagano and Roell, 1996; Biais, 1993). In B2C markets, posted-price mechanisms
make order flow transparent mainly to sellers, because buyers usually have information only
about their own transaction. For example, in the air travel industry, airlines use aggregate history
and estimates of demand to make strategic scheduling and pricing decisions, while a traveler is
usually uninformed and hence relies on the information provided by the selling agent. In
addition, dynamic-price mechanisms, such as auction markets like eBay, reveal useful
information for transacting buyers and selling that changes over time, increasing willingness-to-
pay on the part of the buyer and liquidity for the seller.
Another useful kind of information that is often revealed in financial market settings is price
quotes (Pagano and Roell, 1996; Biais, 1993). These are indications for price-quantity
combinations for a financial instrument, indicating the price levels at which market participants
are willing to trade. Quotes to buy or sell are called bid prices and ask prices (or offer prices),
6

respectively. Dealers and market-making intermediaries may take a trading position for a
security by posting a bid and ask price, such as what is seen with market specialists at the New
York Stock Exchange. The difference between the bid price and ask price is called the bid-ask
spread, and it represents the margin that intermediaries require to engage in trade. The Finance
literature characterizes the public revelation of the bid-ask spread as being commonly associated
with pre-trade transparency. In B2C markets, producers and retailers post selling prices to
provide transparency regarding the ask price. However, they usually do not publish their
respective opportunity costs or the lowest prices they will accept from consumers, effectively
concealing margins or bid-ask spreads from consumers.
Another important determinant of transparency is the identity of the trader (Kofman and
Moser, 1997). This provides clues about the reputation and motivation for trade (Narayan,
Neuberger and Viswanathan, 1999). The motivations for making trades in financial markets
include long-term investing, speculation, intra-day market-making, or immediate liquidity needs.
Not all markets provide an equivalent degree of information revelation about the seller and the
buyer. In fact, in many financial market settings, to ensure fair market operations—especially
when there is trade occurring in large lots of a security—information on the seller is withheld
until a transaction is completed. Similarly, buyers may also not be well served by the revelation
of their identities. In B2C markets, in contrast, the seller’s identity is commonly posted together
with the selling price. But the consumer can hide his or her identity until transaction completion.
Domowitz (1995) breaks down the impact of transparency in financial markets into two
categories: provision of liquidity and improvement of the price discovery process. He defines
financial market liquidity as “the capacity to quickly execute orders near the last-sale price”
(Domowitz, 1995, p. 390). Liquidity can be further classified in into two components. Insider
7

liquidity is provided by market intermediaries who aggregate and match orders (Spulber, 1999).
Outsider liquidity comes from outside investors who make bids and offers. In B2C electronic
markets-based selling, liquidity can be viewed in a similar way, with insider liquidity provided
by digital intermediaries and outside liquidity provided by sellers and buyers. Outsider liquidity
is obtained when a market attracts many buyers, which increases the probability that a
consumer’s valuation will match the offer made by a seller or intermediary (Spulber, 1999).
But how does market transparency attract consumers in B2C electronic markets? Consumer
behavior researchers have found evidence that consumers may view a product with suspicion
upon the absence of information about a salient attribute. For example, Johnson and Levin
(1985) observed lower product ratings when the appropriate product information in a purchase
process was missing. Thus, one can hypothesize that higher market transparency enhances
liquidity by attracting consumers. A second hypothesis is that willingness-to-pay increases.
In financial markets, financial instruments typically are fungible: one share of a stock in IBM
Corporation is the same as any other share, and their prices rise and fall in response to the same
demand and supply conditions in the marketplace. You don’t need to see any specific instance
of the exchange goods. However, due to the complexity of describing the risk characteristics of
a security, traders try to infer value from signals embedded in the trading process, especially
prices for quantities exchanged. In B2C markets, we see a different situation. In addition to
information about the trading process, explicit information about characteristics of the product is
expected (Johnson and Levin, 1985). For many products, consumers are not indifferent about
buying any instance of a product (e.g., used cars of different quality, an airline seat on a
Minneapolis to Atlanta flight at 6am or 10pm, etc.).
“Market Transparency” Versus “Information Transparency.” Market transparency is
8

different from “information transparency,” a term that we have purposely not used up to this
point in the paper to avoid confusing the reader. The existing literature in the Information
Systems (IS) field has used the terms information transparency and market transparency
interchangeably (e.g., Grover, Ramanlal and Segars, 1999). We contend that there should be a
clear distinction between the two, however. Market transparency exists when information is
made available that provides value to a market participant. Greater information transparency
may lead to greater market transparency, which is probably why these terms have been used
interchangeably. In most electronic market settings, information about the trading process and
the product being traded in the hands of a market participant has the potential to increase and
redistribute the economic benefits of buyers and sellers (Clemons and Weber, 1990). Thus, we
propose the following operational definition:
Definition: B2C market transparency is the level of availability and accessibility of information about the product for which an exchange transaction is made, as well as information about the trading process that supports the exchange.
Table 1 provides initial determinants of market transparency to consumers, categorized by
the product characteristic it describes and the consumer objective it satisfies.
Table 1. Determinants of Transparency for Consumers in B2C Electronic Markets PRODUCT CHARACTERISTICS
CONSUMER OBJECTIVE
Maximize Minimize Quality Comfort Integrity Cost Time Digital Features
Market share Seller identity
Warranty Flexibility
Privacy policy
Price Delivery Warranty Tax Production cost Transaction history
Price comparison Delivery time Payment form Waiting time
Non-Digital Features Service quality FriendlinessCongestion
Reputation Risk of use
Product positioning Search capability
Note: The consumer objective categorization and the content in each cell was adapted from Keeney (1999), who interviewed over 100 Internet users to identify consumers’ information needs.
9
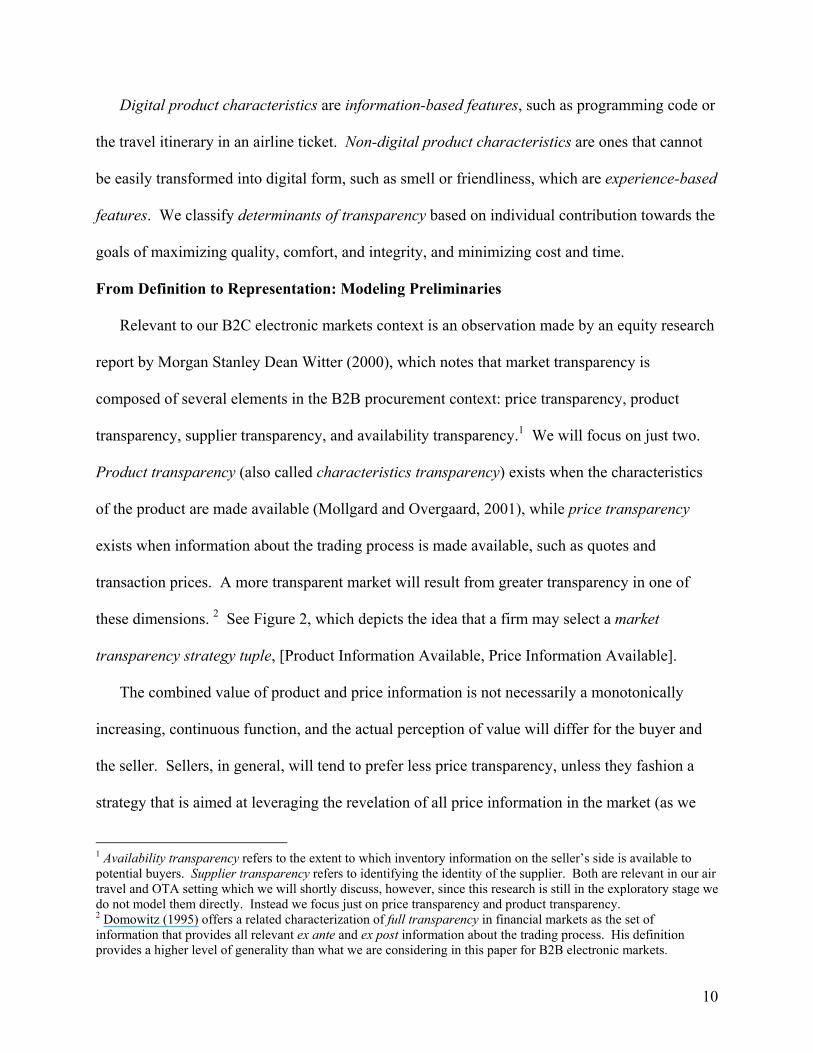
Digital product characteristics are information-based features, such as programming code or
the travel itinerary in an airline ticket. Non-digital product characteristics are ones that cannot
be easily transformed into digital form, such as smell or friendliness, which are experience-based
features. We classify determinants of transparency based on individual contribution towards the
goals of maximizing quality, comfort, and integrity, and minimizing cost and time.
From Definition to Representation: Modeling Preliminaries
Relevant to our B2C electronic markets context is an observation made by an equity research
report by Morgan Stanley Dean Witter (2000), which notes that market transparency is
composed of several elements in the B2B procurement context: price transparency, product
transparency, supplier transparency, and availability transparency.1 We will focus on just two.
Product transparency (also called characteristics transparency) exists when the characteristics
of the product are made available (Mollgard and Overgaard, 2001), while price transparency
exists when information about the trading process is made available, such as quotes and
transaction prices. A more transparent market will result from greater transparency in one of
these dimensions. 2 See Figure 2, which depicts the idea that a firm may select a market
transparency strategy tuple, [Product Information Available, Price Information Available].
The combined value of product and price information is not necessarily a monotonically
increasing, continuous function, and the actual perception of value will differ for the buyer and
the seller. Sellers, in general, will tend to prefer less price transparency, unless they fashion a
strategy that is aimed at leveraging the revelation of all price information in the market (as we
1 Availability transparency refers to the extent to which inventory information on the seller’s side is available to potential buyers. Supplier transparency refers to identifying the identity of the supplier. Both are relevant in our air travel and OTA setting which we will shortly discuss, however, since this research is still in the exploratory stage we do not model them directly. Instead we focus just on price transparency and product transparency. 2 Domowitz (1995) offers a related characterization of full transparency in financial markets as the set of information that provides all relevant ex ante and ex post information about the trading process. His definition provides a higher level of generality than what we are considering in this paper for B2B electronic markets.
10

have seen with firms such as MySimon.com and DealPilot.com). In addition, the marginal
contribution to value of an additional piece of information may be complex to measure or
calculate. Increasing the complexity, it is also likely that the value associated with a given
market transparency strategy tuple, (i, j), selected by the seller will depend on other related
factors, including the firm’s approach to market segmentation and price discrimination, as well
as the kind of product or service that is actually being sold. For example, when try-or-buy
“contingent pricing” is used, the weight of the consumer’s evaluation shifts away from price to
the actual experience that is obtained for a service or the performance of the good (Bhargava and
Sundaresan, 2003). Thus, we have concluded that there is inherent complexity in deriving a
transparency function. And so, rather than specifying a function of the value or utility of market
transparency, we propose a framework to assess the potential for transparency to affect value.
Figure 2. Market Transparency Space in B2C Electronic Commerce I
(i, j)
(I,J)
i Product Information Available
eJ j
Note: Here, i indicates a subset osuperset of all possible available information available out of all p
A Transparency Framework
We define transparency po
Price Information Availabl
f information that a B2C seller makes available to the consumer from the information on the product. Similarly, j denotes the subset of ossible available information J on price-related aspects.
for B2C Electronic Markets
tential as the closest point to full transparency that is feasible in a
11

given market setting. Regarding product transparency, the more digital are the characteristics of
a product (up to the point where the product becomes a pure information product), the higher is
the potential for product transparency when the product is traded electronically. For example,
airline tickets are information-based products that can be described electronically better than
tangible goods, such as food or clothes, or intangible goods, such as tax consulting services or
home repair services, whose description will be even more complex. Regarding price
transparency, the literature on financial markets suggests that market mechanisms that generate
more information about the trading process have a higher potential for price transparency.
Therefore, we propose a framework that classifies transparency potential in B2C electronic
markets based on product characteristics and market microstructure. (See Table 2.)
Table 2. Transparency Potential in B2C Electronic Markets
TYPE OF PRODUCT MARKET MICROSTRUCTURE
Static Dynamic
Digital Low price transparency High product transparency Example: airline tickets
High price transparency High product transparency Example: Securities trading
Non-Digital Low price transparency Low product transparency Example: clothing
High price transparency Low product transparency Example: Auctions of collectibles
Product transparency is potentially higher when the product characteristics are digital. While
in reality most goods have a combination of digital and non-digital characteristics, the point is
that the higher the degree of digital characteristics, the higher is the potential for transparency in
B2C electronic markets. Conversely, the greater the extent of non-digital characteristics, the
higher is the potential for transparency in channels where physical inspection or live
demonstrations are possible.
Furthermore, the more dynamic the trading process, the higher is the potential for price
transparency. Static markets are those where posted prices prevail and changes occur over a
12

relatively extended period. Dynamic markets are those where prices fluctuate constantly based
on demand-supply pressures (hence the term “dynamic prices,” as we mentioned earlier), such as
in double auctions where both buyers and sellers can influence transaction prices. With some
exceptions, the more dynamic the process of price-setting in a market, the more information
related to prices is potentially available to its participants.
Industries can be positioned in a quadrant of the framework based on their product and
market characteristics. For example, at the low end of product and price transparency potential
are tangible goods such as food and clothes, which defy accurate description on the Internet (e.g.,
how they taste, how they feel to the touch, and how they fit the shape of a person’s body). At the
high end of transparency potential is securities trading. Securities are information goods that are
traded using dynamic market mechanisms such as auction or dealer markets.
Our framework is also useful to understand the viability of technological support for
transaction-making. New technology that transforms non-digital product characteristics into
digital form increases transparency potential in electronic markets. In terms of the framework,
this technology causes a shift from the bottom quadrants to the upper quadrants. For example,
technological developments to convert music and photos into digital form have increased the
potential for product transparency in B2C electronic markets, enabling fast and inexpensive
distribution via the Internet, spurring new products and business, and challenging the status quo
of their respective industries.
In addition, technological advances may enable market mechanisms that provide higher
transparency compared to traditional trading practices. In terms of the framework, these novel
mechanisms cause a shift from the left quadrants to the right quadrants. For example, the
success of eBay may have come, in part, because it laid bare the strategic vulnerability of
13

traditional posted-price, static mechanisms for selling goods. Although eBay originally started
with a traditional business concept as an auctioneer of collectibles, its expansion strategy came to
include auctions of any products for which it was able to structurally increase price transparency
for sellers and buyers in many industries, thus increasing liquidity (Chircu and Kauffman, 2000).
The concept of market transparency may come across as complex or elusive. We hope that
we have dispelled this faulty notion for the reader. We developed our conceptualization of
market transparency in the context of B2C markets, based on existing literature on market
microstructure and transparency in financial markets. We proposed a conceptual framework that
characterizes market transparency in B2C electronic markets based on the type of product that is
exchanged and the type of market in which exchange occurs. First, we noted that products that
are on the high or low end of the transparency dimension are so positioned due to the proportion
of their digital and non-digital characteristics. The greater are the digital characteristics of a
product, the larger is the potential for product transparency when it is exchanged in a B2C
electronic market setting. Second, conceptualizing transparency based on market microstructures
facilitates the assessment of potential for price transparency. With some exceptions, the more
dynamic the price-setting mechanism, the higher is the potential for price transparency.
THE IMPACT OF MARKET TRANSPARENCY ON CONSUMER DEMAND
Based on the operational definition and framework we proposed, we will now model the
impact of transparency on consumer demand and the implications for a firm’s pricing decisions.
To give this analysis more contextual meaning to assist the reader, we have chosen to apply it to
the air travel and online travel agency (OTA) industry, where new market mechanisms with
different levels of market transparency have emerged.
In this section of the paper, we characterize three different market transparency impact
14

scenarios. In one scenario, we assume transparency impacts the liquidity of market exchange. In
a second scenario, we explore the impact of transparency on the price and product discovery
process. Finally, a third scenario combines these effects of transparency and derives a more
complex set of implications. Before we set up the details and analyze each scenario, we provide
background description of the online air travel industry.
The Online Air Travel (OTA) Industry
Online travel agencies emerged in the 1990s to sell travel services over the Internet.
Table 3 describes four different types of OTAs and their different market transparency levels.
Table 3. Relative Levels of Market Transparency for Online Travel Agencies (OTAs) OTA TYPE EXAMPLES PRICE
TRANSPARENCY PRODUCT TRANSPARENCY
DESCRIPTION
Airline consortium
Orbitz, Expedia, Travelocity
High High Multiple airlines, itineraries, and fares
Airline direct portal
AA.com, NWA.com, KLM.com
High Medium Multiple itineraries and fares on one airline
Supplier agreements
Hotwire Medium Low Price quotes with no information about airline or specific itinerary
Market clearing reverse auction
Priceline Low Low Price bid, no information until purchase completed
Note: For the purposes of analyzing OTA market transparency, we distinguish between “price transparency” and “product transparency.” Price transparency is characterized by the extent of the information that is available related to the price and exchange process. Product transparency by the extent to which the characteristics of the product are made available to the consumer. We make no assertion about which, if either or both, provide a more effective basis to support market exchange in airline tickets. This probably depends on the firm’s strategy.
Two types of OTAs offer higher levels of transparency to the consumer. One type is an
airline consortium Web site, which offers multiple combinations of air carrier, itinerary, and fare
information related to a given reservation request. The other type is the airline portal, which
targets frequent flyers or preferred customers by allowing them to search for and purchase tickets
on the airline’s flights. These Web sites are an automated extension of the airlines’ physical
reservation offices, which can normally be accessed either by phone or by going to a reservation
“ticket office” in person. These Web sites tend to be less transparent than the airline consortium
15

Web sites because they offer travel options for only one airline rather than multiple ones. As a
result, there is no opportunity for the consumer to do much price comparison and price shopping.
Two OTAs that have introduced novel market mechanisms are Hotwire (www.hotwire.com)
and Priceline (www.priceline.com) involving supplier agreements. Both offer lower levels of
market transparency to the consumer than traditional distribution channels, but, in exchange,
consumers get lower fares. In Hotwire, the traveler requests a ticket based on origin, destination,
and travel dates, and Hotwire responds with a set of ask prices that the consumer can evaluate.
Information about the airline and the specific itinerary is only revealed after purchase is done.
On the other hand, Priceline patented and introduced a “name-your-own-price” market
clearing reverse auction mechanism, where customers bid for an airline ticket while specifying
the origin, destination, and travel dates. Priceline agrees to sell the ticket if a carrier agrees to
provide one that meets the required characteristics at an ask price lower than or equal to the
consumer’s bid price. Once a consumer’s bid is submitted, if the bid is accepted, the consumer
must pay the bid price. However, prior to purchase completion, the consumer does not receive
information about carrier, itinerary, or available ask prices. The difference is that Hotwire
provides transparency regarding ask prices, while Priceline does not. (See Appendix.)
Scenario 1: Impact of Market Transparency on Liquidity
Our evaluative framework suggests that B2C electronic markets and Internet-based sellers
that transact in products with more digital product characteristics or that deploy more dynamic
market microstructures will tend to attract more consumers. As a result, the marketplace will
provide more liquidity to market participants. This, in turn, should lead to a higher base level of
demand. This leads us to offer the following conjecture about the relationship between
consumer demand and market transparency:
16

□ Conjecture 1 (The Market Transparency-Demand Proportionality Conjecture): Consumer demand is proportional to the level of market transparency. However, market transparency does not influence consumers’ price elasticity of demand.
We further expect that the base level of demand for a seller who offers greater market
transparency will be greater than for a seller who offers less. This scenario is represented by
Orbitz and Hotwire in the OTA industry. For each booking information request by a customer,
Orbitz’s market mechanism for airline ticket selling lists multiple travel options organized with
the lowest ticket prices and fewest stopovers first. As a result of its relatively transparent market
mechanism, it is likely that the demand for tickets on Orbitz is higher than for Hotwire.
Although some customers may search both Web sites for tickets, others may only search on
Orbitz due to its higher level of product transparency. Again, we expect the price elasticities of
consumer demand to be the same regardless of the site they search.
We next present a simple analytical model to provide pricing strategy and market
transparency configuration guidance for firms under Scenario 1. We assume that consumer
demand can be represented by a linear demand function. Further assume that there are two
sellers in the market under perfect competition. In Scenario 1, lower transparency leads to a
downward shift in the demand curve, ceteris paribus. (See Figure 3.)
Figure 3. Impact of Market Transparency: Shift in Consumer Demand
D(p)
The following proposition summarizes the implications for relative prices and market shares:
D2
α βo βo
D1
p
17

□ Proposition 1 (The Market Share and Price Ratio Equivalence Proposition): If two sellers price at different levels of market transparency to maximize revenue, their market share ratio will be equal to the price ratio.
Proof. Let Seller 1 have consumer demand D1(p) = β o – β 1 p1, where β o is the base demand
and – β1 is the slope of the demand curve. If Seller 2 offers lower market transparency and our
Market Transparency-Demand Proportionality Conjecture (Conjecture 1) holds, then its base
demand will be equal to α% of Seller 1’s demand, with 0 < α < 1. The demand curve of Seller
2 can be represented by D1(p) = α βo – β1 p2. Let M be the market share ratio D2 / D1, so that M
= (αβ o – β 1 p2 ) / (β o – β 1 p1 ). The result is:
β o (M – α) + β1 ( p2 – M p1 ) = 0 (1)
To maximize revenue, we take the first order conditions of the revenue function. So the
sellers will price respectively at p1* = βo / 2β1 and p2* = α βo / 2β1. The resulting price ratio is
p2*/ p1* = α. Substituting the resulting price ratio into Equation 1 results in M* = α. This
implies that if the sellers set prices to maximize revenue, the price ratio will be equivalent to the
market share ratio. Now, if we observe p2 / p1 < M, then Seller 2 is overcharging (or Seller 1 is
undercharging), and if p2 / p1 > M, then Seller 2 is undercharging (or Seller 1 is overcharging).
This proposition can be empirically tested in scenarios where market transparency attracts
consumer demand, and for industries where pricing decisions are based on revenue-maximizing
objectives. In the airline industry, the need to provide stable route scheduling creates the basis
for fixed supply with low marginal costs (i.e., the cost of carrying a passenger), so short and
medium-term pricing decisions are based on a revenue maximization objective.
If the relationship between market transparency and consumer demand behave as we have
sketched out here, then the Market Share and Price Ratio Equivalence Proposition (Proposition
1) suggests that Hotwire should charge a lower price for the same airline ticket than Orbitz in
18

order to maximize revenue, since it offers a lower level of market transparency. It also follows
that if the market share ratio of these Web sites is different than the price ratio, the price levels
that are chosen may be sub-optimal. If the price ratio is higher than the market share ratio, then
Hotwire can charge a higher fare or Orbitz can charge a lower fare to increase revenue.
Scenario 2: Impact of Market Transparency on the Product and Price Discovery Process
When market transparency goes up, consumer surplus increases three ways. (See Figure 4).
Figure 4. Contribution of Market Transparency to Consumer Surplus
CONTRIBUTION OF Value Price MARKET TRANSPARENCY
Price decrease
Consumer Surplus B Decrease
in search costs Value
increase Consumer Surplus A
Note: Consumer Surplus A = Consumer surplus without transparency Consumer Surplus B = Consumer surplus with transparency
First, the value of a purchase increases if the consumer discerns the benefits of existing
alternatives with higher precision, resulting in more accurate product valuation (Harbrouck,
1995). In financial markets, for example, Internet brokerage firms are able to provide
instantaneous and detailed information about a given stock, which enables a more accurate
valuation by the investor. Likewise, in the music or software industry, the ability to experience
online product demonstrations increases product transparency for consumers.
Second, search costs may decrease such that more product alternatives are made available.
For example, through the Internet, major OTAs such as Orbitz, Travelocity, and Expedia now
19

provide immediate and inexpensive access to tables with multiple combinations of air carriers,
flight itineraries, and ticket prices. By purchasing a ticket via these OTAs, consumers can
evaluate multiple alternatives and act as their own travel agents in some travel scenarios, such as
the purchase of a domestic round-trip ticket between major cities. This contrasts with the limited
options that are offered by a traditional travel agent or an airline’s reservation office, where some
pre-selection and screening services are provided to make the travel consultation more effective.
Third, information may become available that allows a consumer to transact at a lower price
for a given product. For example, a lower price may result if search costs are reduced such that a
lower market price is discovered (Stigler, 1961). Several papers in the recent literature support
this assertion. Furstenberg (2001) states that greater transparency in a principal-agent scenario
often harms the principals. Wise and Morrison (2000) suggest that even though the Internet has
brought higher liquidity and transparency, sellers have little incentive to participate due to the
risk of price pressures. Likewise, Zhu (2002) suggests that transparent electronic environments
are detrimental to large, high cost suppliers in a B2B exchange.
In B2C markets, some retailers charge low prices to attract informed consumers, while others
charge high prices to uninformed consumers (Brynjolfsson and Smith, 2000). Sinha (2000)
suggests that the Internet often allows consumers to ascertain sellers’ costs, which allows them to
negotiate or stand firm on lower bids, effectively reducing market prices. An increase in market
transparency may increase the consumer’s valuation of a purchase by increasing the value of the
purchase or decreasing the search costs. The resulting increase in consumer surplus may result
in a higher willingness-to-pay, leading to a lower price elasticity of demand.
□ Conjecture 2 (The Market Transparency-Price Elasticity of Demand Conjecture): There is a negative relationship between market transparency and price elasticity of demand. However, market transparency does not affect the total potential market size.
20

In this scenario, the base consumer demand for two sellers with different levels of market
transparency is the same, but the demand for the more market transparent seller is less sensitive
to price changes than for the less transparent seller. This scenario is well represented by Hotwire
and Priceline. The firms target the same market for price-sensitive consumers by offering low
levels of transparency in exchange for lower prices. However, due to a less transparent market
mechanism, purchases on Priceline may induce higher sensitivity to price changes among
consumers than purchases on Hotwire.
Using the same linear demand model as above, in Scenario 2 a higher level of transparency
leads to a more steeply sloping demand curve. Figure 5 illustrates this effect, where Seller 1 has
greater transparency than Seller 2. In Scenario 2, the implications for pricing and market share
are different than those found for Scenario 1. This leads to a second proposition:
□ Proposition 2 (The Similar Market Shares Proposition): If two sellers price at different levels of transparency to maximize revenue, their market shares will be equal.
Figure 5. Impact of Market Transparency: Shift in Price Elasticity of Demand
D(p)
D1
D2
Proof. Let Seller 1 have a demand D1 = βo – β1 p1 as before. If Seller 2 has lower market
transparency, then the demand curve for Seller 2 will have a steeper slope than Seller 1’s, so the
former’s demand can be represented by D2 = βo – β1 p2 / α, where 0 < α < 1. α is a parameter
such that 1/(α - 1) represents the percent decrease in the slope of Seller 2’s demand curve
p
21

relative to that of Seller 1. Next let M be the market share ratio D2 /D1, also as before. Then
with M = (βo – β1 p2 / α ) / βo – β1 p1, we see that
α βo (M – 1) + β1 (p2 – α M p1) = 0 (2)
Now, to maximize revenue, Sellers 1 and 2 will price at p1* = βo / 2β1 and p2* = α βo / 2β1,
respectively. Notice that the price ratio, p2* / p1* = α, is the same result as in Scenario 1.
Finally, substituting p1* and p2* in Equation 2 results in (α βo / 2) (M – 1) = 0. This equation
suggests that if the sellers set prices to maximize revenue, their market share ratio will be 1, so
their respective market shares will be the same.
The results of the Similar Market Shares Proposition (Proposition 2) offer insights into the
price competition and market mechanism choices of Hotwire and Priceline. We learn that if their
target market is the same but consumers are more price-sensitive when purchasing on Priceline,
then it should charge lower prices than Hotwire to compensate for its lower transparency and
have a fair share of the potential revenues. But if the share of Priceline is higher than that of
Hotwire, it can charge a lower fare to increase revenues, to the point where market shares equate.
Scenario 3: Combined Effects of Market Transparency
Scenarios 1 and 2 are not mutually exclusive, which suggests that they can occur together.
This is likely if, in addition to attracting consumers, an increase in market transparency decreases
price elasticity of demand for the seller’s new and existing consumers. This leads to:
□ Conjecture 3 (The Willingness-to-Pay and Price Elasticity of Demand Conjecture). Market transparency has a positive relationship with willingness-to-pay, which results in higher consumer demand and lower price elasticity for firms with greater transparency.
The related Scenario 3 is illustrated in Figure 6. Here, Seller 1 has a more transparent market
mechanism, which results in a higher base demand and a less steep slope of the demand curve.
22

Figure 6. Impact of Market Transparency: Mixed Effects
D(p) βo
α βo D1
pD2
This competitive scenario may be best represented by Orbitz and Priceline. On one hand, the
base demand for Priceline is likely to be lower because it specifically targets customers that are
less concerned about the product characteristics. On the other hand, due to its less transparent
mechanism, purchases on Priceline may be subject to higher consumer price-sensitivity. Here,
the analysis and implications for strategic pricing and market share capture are more complex
than in the single-effect cases. We characterize the impacts with the following proposition:
□ Proposition 3 (The Mixed Effects Proposition): If two sellers price to reflect two different chosen levels of market transparency to maximize revenue in Internet-based selling, then their price ratio will be equal to the square of the market share ratio.
Proof. Assume that Seller 1 has demand D1 = βo – β1 p1. If Seller 2 has lower transparency
and the Willingness-to-Pay and Price Elasticity of Demand Conjecture (Conjecture 3) holds, the
demand curve of Seller 2 will have a lower base demand and a steeper slope than Seller 1’s.
Seller 2’s demand can be represented by D2 = α1 βo – β1 p2 / α 2, where 0 < α1 <1 and
0 < α2 <1. To further simplify our analysis for this initial exploratory work, we assume that α1 =
α2 = α holds.3 Again, let M be the market share ratio, D2 /D1. Then M = (α βo – β1 p2 / α ) /(βo
– β1 p1), which can be expressed as:
3 The assumption that α1 = α2 = α holds means that both Seller 1 and Seller 2 are equally affected by similar levels of market transparency, such that we expect similar impacts on their abilities to sell in the presence of similar market microstructures. This seems like a reasonable first step in our analysis. However, we recognize it will be appropriate to examine the cases of α1 < α2 and α1 > α2 more fully and such an analysis is a part of our ongoing study.
23

α βo (M – α) + β1 (p2 – α M p1) = 0 (3)
To maximize revenue, Sellers 1 and 2 will price at p1* = β o / 2β1 and p2* = α ² βo / 2 β1,
respectively. Therefore, the price ratio is given by p2*/p1* = α 2. When we substitute p1* and p2*
into Equation 3, we obtain the following:
(α βo / 2) (M – α) = 0 (4)
From the price ratio expression, p2* / p1*, and Equation 4, it follows that p2* / p1* = M 2.
This implies that sellers can maximize their revenue by setting prices so that the price ratio is the
square of the market share ratio. Now, if we observe p2 / p1 < M², Seller 2’s prices are too high
(or Seller 1’s prices are too low), and if p2 / p1 > M², Seller 2 is undercharging (or Seller 1 is
overcharging). This is suggestive of the strategic pricing policies that will be appropriate for the
firms to be revenue-efficient in the marketplace.
In Scenario 3, due to a lower market transparency mechanism, Priceline’s consumer demand
is affected in two ways compared to Orbitz. First, some consumers may only browse for fares in
Orbitz due to its more transparent mechanism and avoid Priceline, so the base demand of
Priceline will be smaller. Second, Orbitz and Priceline are likely to have a common set of price-
sensitive consumers who check both Web sites in the search for the lowest fares. However,
consumers purchasing on Priceline are more price-sensitive than if they purchase via Hotwire
due to the lesser transparency of its market mechanism. This “double effect” of lower
transparency is reflected in the quadratic nature of the price ratio relative to market share in the
Mixed Effects Proposition (Proposition 3). By the same token, if Priceline only reduces prices
such that the price ratio is equal to the market share ratio, it will get less than optimum revenue.
Instead, to maximize revenue, Priceline must reduce the ticket prices to the point where its price
ratio is equal to the square of the market share ratio. If a price ratio is observed to be higher in
24

the market than the square of the market share, then Priceline can increase prices or Orbitz can
decrease prices to increase revenue.
DISCUSSION
Our preliminary analysis of the impacts of market transparency, defined in both product
transparency and price transparency terms, suggests a range of opportunities for the application
of these ideas, as well as a number of other issues that merit further discussion. In terms of
application areas, there are many other contexts in e-commerce for which our theory and analysis
can offer insights. They include hotel and rental car booking, music and video sales, and so on.
We briefly consider some of the developments in electronic bond trading below. We also
consider the new role that shopbots play as “proxies” for market transparency, which is
increasingly available through the shopbots aggregation of information.
Electronic Bond Trading on the Internet. During the latter part of the 1990s, and under
the pressure of mandated reform from the Securities Exchange Commission and the U.S. Federal
Government, major firms that have been involved in the issuance of corporate debt securities and
related public sector instruments (municipal bonds, school board debt, etc.) began to undertake
IT investment projects that created new market mechanisms for issuing and trading fixed income
securities on the Internet (Bond Market Association, 2002).
Although few of the names have achieved the status of “household familiarity” (such as
eTrade and Schwab.com in personal investments), there nonetheless have been technological
innovations which, when viewed in aggregate, suggest that the limitations to market transparency
will never be the same for market-makers, debt issuers and fixed income security investors. In
bond trading, both price transparency (in terms of current bid-ask spread, and for the current best
bids and best offers in the market) and product transparency (in terms of the specifics of the
25

fixed income securities issue that is to be traded) are critical. Since bonds have an inherently
complex product specification (current credit risk of the issuer, bond covenants and claims
subordination, and provisions for bond calls), only trading in the most-commodity like of issues
(especially the “vanilla debt” of leading corporations) is presently supported well.
Some of the leaders include TradeWeb LLC, MarketAxess, J. P. Morgan eXpress (JPex),
and the Bloomberg BondTrader. Cantor Fitzgerald’s eSpeed (www.espeed.com), whose
notoriety comes from its operations having been destroyed in the September 2001 World Trade
Center bombing, is representative of the breadth of market transparency-driven innovation.
Today, eSpeed provides fully price-transparent electronic bond trading services for 500 clients,
including the world’s largest 25 bond trading firms, a major departure from the past, when price
transparency was very low, and executions were not reported in real-time, reducing price
transparency. Now, transaction confirmation occurs in 300 milliseconds, essentially real-time.
Shopbots, Inventory and Availability Transparency. In more typical Internet-based
selling, pressure to bring about greater price and product transparency has been promoted by the
popular shopbots, which aggregate information and provide decision support capabilities to
consumers. The shopbots now support transaction-making and consumer choice in many
product areas, including software tools and computer games, electronics goods, consumer
appliances, and computers. By aggregating information about product descriptions and prices,
they provide a degree of “virtual” market transparency in a way that the Web sites of the
individual sellers alone cannot provide. In financial markets, transparency “in-the-aggregate” is
not always accessible to individual traders and investors, for example, as with the electronic
order book that provides the basis for the immediate visibility of prices and computerized
matching of stock trades on London’s Stock Exchange Electronic Trading Service (SETS) (The
26

Motley Fool, 2000).
Albeit for the lack of inventory information, the popular shopbots provide an important portal
with which to view the relative efficiency of the market for various goods that are sold on the
Internet. However, this is where individual Internet-based sellers have an opportunity to
differentiate themselves, as we see in Figure 7. Consumer electronic, computer equipment and
software reseller, Insight Inc. (www.insight.com), lists the number of items in stock for a
product, as well as those that are temporarily out of stock. In addition, bookseller Amazon.com
lists the availability of used items, along with the list price and availability of new books.
Figure 7. Examples of Availability Transparency, Insight Inc. and Amazon.com
Sources: Excerpts from queries on Insight Inc. (www.insight.com) and Amazon.com, May 18, 2003.
Another issue that can be studied using our framework is changes in industrial organization
that relate to market transparency. We’ve seen that, for example, in the airline and OTA
industry with the creation of Orbitz, which now provides booking capabilities for airline tickets,
rental cars, hotel and vacation packages, and related travel and hospitality products. Orbitz was
conceptualized as a “reintermediation” play on the part of five airlines, American, Continental,
Delta, Northwest and United, in order to counterbalance the airlines’ share of the market for
27

intermediation services on the Internet. We have work in progress that gauges impacts on the
OTA marketplace following the entry of Orbitz.
CONCLUSION
In the effort to implement management strategies to confront the challenges of the Internet
revolution, senior managers must realize the impact of this new technology on market
transparency. We contend that transparency in B2C electronic markets will likely be higher in
industries where products have a high degree of digital characteristics, where the traditional
market microstructure is dynamic, and where new technologies have enabled a digital
representation of product information or novel market mechanisms for transaction-making.
We analyzed the impacts of changes in market transparency on consumer demand and
derived ways in which senior managers can evaluate the effectiveness of their pricing strategies.
As a first step, firms can observe their market shares relative to competitors and assess whether
their prices are in line with their level of market transparency. Specifically, in linear demand
environments, pricing levels should be evaluated when market transparency affects: (1)
consumer demand but not price elasticity, and the price ratio is not equal to the market share
ratio; (2) price elasticity but not consumer demand, and market shares are not the same; and (3)
both price elasticity and consumer demand, and the price ratio is not equal to the square of the
market share ratio. These findings suggest that senior managers whose firms utilize some of the
new market mechanisms that are made available by the Internet must have an awareness of their
market transparency relative to competition. To illustrate this point, we provided a comparison
of the relative transparency among OTAs.
Future research should expand on the analysis of the relationship between transparency and
consumer demand. Interesting directions are the development of models that extend the results
28

to include non-linear demand scenarios, and further adaptation of market transparency models in
the financial markets literature to B2C electronic markets. While these models will provide
more robust findings, we expect the general findings to hold. Finally, we propose empirical
research that is aimed at deriving functional forms of demand curves and then testing the
resulting consumer demand and strategic pricing choices under different levels of transparency.
REFERENCES [1] Adexa Inc. “Collaborative Commerce in the Automotive Industry: Implementing
Transparency on Your Terms,” White paper, Adexa, Inc., Los Angeles, CA, 2003. [2] Anderson, J. C., and Narus, J. A. “Business Marketing: Understanding What Customers
Value,” Harvard Business Review, 76(6), 1998, 53-63. [3] Bhargava, H., and Sundaresan, S. “Thirty Seconds or Free: “Journal of Management
Information Systems, 20(2), 2003, forthcoming. [4] Biais, B. “Price Formation and Equilibrium Liquidity in Fragmented and Centralized
Markets,” Journal of Finance, 48(1), 1993, 157-185. [5] Board, J., and Sutcliffe, C. “The Proof of the Pudding: The Effects of Increased Trade
Transparency in the London Stock Exchange,” Journal of Business Finance and Accounting, 27(7-8), 2000, 887-909.
[6] Bond Market Association. “eCommerce in the Fixed-Income Markets: The 2002 Review of Electronic Transaction Systems,” Bond Market Association, New York, NY, November 2002. Available on the Internet at www.bondmarkets.com/Research/ ecommerce/ecommercedraft.shtml.
[7] Brynjolfsson, E., and Smith, M. D. “Frictionless Commerce? A Comparison of Internet and Conventional Retailers,” Management Science, 46(4), 2000, 563-585.
[8] Chircu, A. M., and Kauffman, R. J. “Digital Intermediation in Electronic Commerce: The eBay Model,” in S. J. Barnes and B. Hunt (Eds.), E-Commerce and V-Business, London, UK, Butterworth-Heinemann Publishers, April 2000.
[9] Clemons, E. K., and Weber, B. W. “The Big Bang at the London Stock Exchange:” Journal of Management Information Systems, 6(4), 1990, 41-60.
[10] Domowitz, I. "Financial Market Automation and the Investment Services Directive", in R. A. Schwartz (Ed.), Global Equity Markets: Technological, Competitive, and Regulatory Challenges, Irwin Professional Publishing, New York, NY, 1995.
[11] Furstenberg, G. v. “Hopes and Delusions of Transparency,” North American Journal of Economics and Finance, 12(1), 2001, 105-120.
[12] Gemmill, G. “Transparency and Liquidity: A Study of Block Trades on the London Stock Exchange under Different Publication Rules,” J. Finance, 51(5), 1996, 1765-1790.
[13] Grover, Ramanlal and Segars, 1999). “Information Exchange in Electronic Markets: Implications for Market Structures,” Intl. J. of Elec. Commerce, 3(4), 1999, 89-102.
29

[14] Harbrouck, J. "Trade and Quote Transparency: Principles and Prospects for the Year 2000", in R. A. Schwartz (Ed.), Global Equity Markets: Technological, Competitive, and Regulatory Challenges, Irwin Professional Publishing, New York, NY, 1995, 218-226.
[15] Johnson, R. D., and Levin, I. P. “More than Meets the Eye: The Effect of Missing Information on Purchase Evaluations,” J. Consumer Research, 12(3), 1985, 169-177.
[16] Keeney, R. L. “The Value of Internet Commerce to the Customer,” Management Science, 45(4), 1999, 533-542.
[17] Kofman, P., and Moser, J. T. “Spreads, Information Flows, and Transparency across Trading Systems,” Applied Financial Economics, 7(3), 1997, 281-294.
[18] Lyons, R. K. “Optimal Transparency in a Dealer Market with an Application to Foreign Exchange,” Journal of Financial Intermediation, 5(3), 1994, 225-254.
[19] Madhavan, A. “Security Prices and Market Transparency,” Journal of Financial Intermediation, 5, 1996, 225-283.
[20] Mollgard, H. P., and Overgaard, P. B. “Market Transparency and Competition Policy,” Working paper, Department of Economics, Copenhagen Business School, 2001.
[21] Morgan Stanley Dean Witter. “The B2B Internet Report: Collaborative Commerce,” Equity Research, Morgan Stanley Dean Witter, New York, NY, April 2000.
[22] Narayan, N., Neuberger, A., and Viswanathan, S., “Trade Disclosure Regulation in Markets with Negotiated Trade,” Review of Financial Studies, 12(4), 1999, 886-900.
[23] O'Hara, M. Market Microstructure Theory, Basic Blackwell, Cambridge, MA, 1995. [24] Pagano, M., and Roell, A. “Transparency and Liquidity: A Comparison of Auction and
Dealer Markets with Informed Trading,” Journal of Finance, LI(2), 1996, 579-611. [25] Porter, M. E. “Strategy and the Internet,” Harvard Business Review, 79(1), 2001, 62-78. [26] Sawhney, M. “Profit from Transparency,” CIO Magazine, June 15, 2002. Available on
the Internet at www.cio.com/archive/061502/netgains_content.html. [27] Schwartz, R. A. Global Equity Markets: Technological, Competitive, and Regulatory
Challenges, Irwin Professional Publishing, New York, NY, 1995. [28] Sinha, I. “Cost Transparency: The Net's Real Threat to Prices and Brands,” Harvard
Business Review, 78(2), 2000, 43-49. [29] Spulber, D. F. Market Microstructure: Intermediaries and the Theory of the Firm,
Cambridge University Press, New York, NY, 1999. [30] Stigler, G. J. "The Economics of Information," J. Pol. Econ. 69(3), 1961, 213-225. [31] The Motley Fool. “Everything You Ever Wanted to Know About SETS … But Were
Afraid to Ask,” Fool’s Eye View, The Motely Fool, February 14, 2000. Available on the Internet at (www.fool.co.uk/news/foolseyeview/2000/fev000214d.htm).
[32] Ticoll, D. “Drivers: It’s All About Trust,” Teledotcom—Strategic Context for Service Providers, November 13, 2000. Available on the Internet at www.teledotcom.com/article/ TEL20001113S0010.
[33] Wise, R., and Morrison, D. “Beyond the Exchange: The Future of B2B,” Harvard Business Review, 78(6), 2000, 43-49
[34] Zhu, K. “Information Transparency in Electronic Marketplaces: Why Data Transparency May Hinder the Adoption of B2B Exchanges,” Electronic Markets, 12(2), 2002, 92-99.
30

31
Appendix. Categories of Pre-Transaction Transparency for Hotwire Vs. Priceline
INFORMATION CATEGORY
INFORMATION
HOTWIRE
PRICELINE
Maximize quality
Airline name (seller identity) Major airline, type of aircraft Same airline each direction
Major airline, type of aircraft
Departure, arrival, and layover times Peak and off-peak departures, maximum number of connections, maximum length of domestic connections
Peak and off-peak departures, maximum number of connections maximum length of domestic connections
Class of service Meal
Economy No
Economy No
Maximize convenience
Refundability/transferability Yes Yes
Flexibility to change plans Yes Yes Payment forms Yes Yes Policy for cancelled and delayed flights Yes Yes Customer complaint rules Yes Yes Online payment options and security Yes Yes Maximize integrity
Airline accident record and feet age No No
Airline on-time performance, customer complaint records, luggage lost record
No No
Minimize time Time to obtain information Low High Confirmation after purchase Yes Yes Minimize costs Mailing costs vs. e-ticket Yes Yes Taxes Yes Approximate Quotes Price of a specific itinerary Yes Price with “fair” and
“good” chance of being accepted
Price of specific itinerary from multiple air carriers
Yes No
Price of itineraries to similar destinations
Multiple (with a subsequent query)
One (with a subsequent query)
Transaction history
Historical demand and prices for the same product, itinerary, and season.
No No
Historical demand and prices for similar products, itineraries, seasons, or destinations
No No
Note: Differences between Hotwire and Priceline are marked in italics.