can organic far ming be an alternative to improve - SUA IR
117
CAN ORGANIC FAR MING BE AN ALTERNATIVE TO IMPROVE WELL-BEING OF SMALLHOLDER FARMERS IN DISADVANTAGED AREAS? A CASE STUDY OF MOROGORO REGION, TANZANIA CHIE MIYASHITA A DISSERTATION SUBMITTED IN PARTIAL FULFILMENT OF THE REQUIREMENTS FOR THE DEGREE OF MASTER OF ARTS IN RURAL DEVELOPMENT OF SOKOINE UNIVERSITY OF AGRICULTURE. MOROGORO, TANZANIA. 2015
-
Upload
khangminh22 -
Category
Documents
-
view
1 -
download
0
Transcript of can organic far ming be an alternative to improve - SUA IR
CAN ORGANIC FAR MING BE AN ALTERNATIVE TO IMPROVE
WELL-BEING OF SMALLHOLDER FARMERS IN DISADVANTAGED AREAS?
A CASE STUDY OF MOROGORO REGION, TANZANIA
CHIE MIYASHITA
A DISSERTATION SUBMITTED IN PARTIAL FULFILMENT OF THE
REQUIREMENTS FOR THE DEGREE OF MASTER OF ARTS IN RURAL
DEVELOPMENT OF SOKOINE UNIVERSITY OF AGRICULTURE.
MOROGORO, TANZANIA.
2015

ii
ABSTRACT
This research was done to assess contribution of organic farming on improving well-being
of smallholder farmers through crop productivity, profit and food security among 324
smallholder farmers in Morogoro Region, Tanzania. The specific objectives were to:
examine how farmers implement organic farming practices and sell their products;
compare productivity, profit and food security between conventional/traditional farmers
and organic farmers; determine factors affecting productivity, profit and food security;
determine challenges of organic farming; and determine communities’ attitude towards
organic products. The results showed that organic farmers had diversified crops and
availability of water for irrigation, and they had better selling situation of their crop
products. Productivity of maize, cow peas and pumpkins did not show significant
differences between organic and conventional/traditional farmers, but profit and food
security did. Food security was analysed using food consumption score and dietary energy
consumed by organic farmers and showed significantly better results compared to that of
conventional/traditional farmers. The factors which influenced productivity significantly
were sex of a household head, number of people in a household, constant markets and
livestock keeping. Years of practicing organic farming showed significant association with
profit, and livestock keeping and age of a household head had significant impacts on food
security. It was revealed that there were challenges of land preparation, markets, getting
premium price, and contamination with other farms. Customers of a normal market place
had similar attitude to that of customers of an organic shop. In conclusion, organic farming
has a potential to improve well-being of smallholder farmers in disadvantaged areas
especially from the aspects of profit and food security. Therefore, it is recommended that
more emphasis should be put on promotion of organic farming by agricultural stakeholders
such as the government, agricultural institutions, development institutions and organic
farming organizations.

iii
DECLARATION
I, Chie Miyashita, do hereby declare to the Senate of Sokoine University of Agriculture that
this dissertation is my own original work done within the period of registration and that it
has neither been submitted nor being concurrently submitted in any other institution.
Chie Miyashita Date
(MARD Candidate)
The above declaration is confirmed by:
Prof. Kim A. Kayunze Date
(Supervisor)

iv
COPYRIGHT
No part of this dissertation may be reproduced, stored in any retrieval system, or
transmitted in any form or by any means without prior written permission of the author or
Sokoine University of Agriculture in that behalf.

v
DEDICATION
I dedicate this dissertation to my beloved parents Mr. and Mrs. Miyashita who always
supported me during studies in Tanzania.
vi
ACKNOWLEDGEMENTS
I am really happy to thank my supervisor, Prof. Kim A. Kayunze, for guiding me with
encouragement. I am very much indebted to him for his timely and deep support and
willingness to advise me from the stage of designing the research proposal to the final
write-up of the dissertation.
I also thank my MARD classmates for studying hard together and giving me comfortable
environment of staying in Tanzania. My special gratitude goes to Sustainable Agriculture
Tanzania (SAT), Comunità Volontari per il Mondo (CVM) and smallholder farmers for
assisting me in data collection.
vii
TABLE OF CONTENTS
ABSTRACT ....................................................................................................................... ii
DECLARATION .............................................................................................................. iii
COPYRIGHT ................................................................................................................... iv
DEDICATION .................................................................................................................... v
ACKNOWLEDGEMENTS ............................................................................................ vi
TABLE OF CONTENTS ............................................................................................... vii
LIST OF TABLES ........................................................................................................... xi
LIST OF FIGURES ....................................................................................................... xiii
LIST OF APENDICES .................................................................................................. xiv
LIST OF ABBREVIATIONS ......................................................................................... xv
CHAPTER ONE ................................................................................................................ 1
1.0 INTRODUCTION ................................................................................................... 1
1.1 Background Information ............................................................................................ 1
1.1.1 World rural poverty ............................................................................................. 1
1.1.2 Organic agriculture as a poverty reduction strategy ............................................ 3
1.2 Problem Statement ..................................................................................................... 4
1.3 Research Justification ................................................................................................ 5
1.4 Objectives and Hypotheses ........................................................................................ 6
1.4.1 General objective ................................................................................................. 6
1.4.2 Specific objectives ............................................................................................... 6
1.4.3 Research questions ............................................................................................... 6
1.4.4 Null hypotheses .................................................................................................... 6
1.5 Conceptual Framework .................................................................................................. 7
viii
CHAPTER TWO ............................................................................................................... 9
2.0 LITERATURE REVIEW ........................................................................................ 9
2.1 Rural Poverty in Tanzania .......................................................................................... 9
2.2 Agriculture in Tanzania ............................................................................................. 9
2.2.1 General information ............................................................................................. 9
2.2.2 Agricultural modernization ................................................................................ 10
2.3 Smallholder Farmers in Tanzania ............................................................................. 11
2.4 Food Security .......................................................................................................... 12
2.4.1 Definition of food security ................................................................................. 12
2.4.2 Food security in Tanzania .................................................................................. 13
2.5 Organic Farming ...................................................................................................... 13
2.5.1 Definition of organic farming ............................................................................ 13
2.5.2 Organic farming position among agricultural systems ...................................... 14
2.5.3 Organic agriculture organizations ...................................................................... 16
2.5.4 Organic farming ways ........................................................................................ 17
2.6 Theoretical Literature Review .................................................................................. 19
2.7 World Attention to Organic Farming as Poverty Reduction Strategy ........................ 20
2.7.1 Possibility of organic farming ............................................................................ 20
2.7.2 Success of world organic farming ..................................................................... 21
2.7.3 Limitations of organic farming .......................................................................... 22
2.7.4 Organic farming in Tanzania ............................................................................. 23
CHAPTER THREE ......................................................................................................... 26
3.0 RESEARCH METHODOLOGY .......................................................................... 26
3.1 Description of Study Area ........................................................................................ 26
3.2 Research Design ...................................................................................................... 27

ix
3.3 Sampling ................................................................................................................. 27
3.4 Data Collection ........................................................................................................ 28
3.5 Data Analysis .......................................................................................................... 29
3.6 Limitations of the Study ........................................................................................... 37
CHAPTER FOUR ............................................................................................................ 39
4.0 RESULTS AND DISCUSSION ............................................................................. 39
4.1 Socio-Demographic Characteristics of the Respondents ........................................... 39
4.2 Implemented Organic Farming................................................................................. 41
4.2.1 Agricultural Environment .................................................................................. 42
4.2.2 Adoption level of farming practices .................................................................. 49
4.3 Situation of Crop Products’ Selling .......................................................................... 52
4.4 Comparison of Productivity, Profit and Food Security between Organic Farmers
and Conventional/traditional Farmers ..................................................................... 57
4.4.1 Productivity ........................................................................................................ 57
4.4.2 Profit .................................................................................................................. 58
4.4.3 Food security ...................................................................................................... 60
4.5 Factors Influencing Crop Productivity, Profit and Food Security .............................. 62
4.5.1 Crop Productivity ............................................................................................... 63
4.5.2 Profit .................................................................................................................. 65
4.5.3 Food security ...................................................................................................... 66
4.6 Challenges of Organic Farmers ................................................................................ 67
4.6.1 Profiles of villages ............................................................................................. 68
4.6.2 Reasons to start organic farming ....................................................................... 69
4.6.3 Strengths of organic farming ............................................................................. 70
4.6.4 Difficulties of conducting organic farming ....................................................... 71

x
4.7 Communities’ Attitude towards Organic Products .................................................... 75
4.7.1 Knowledge of organic products ......................................................................... 75
4.7.2 Attitudes of market customers towards organic products .................................. 76
CHAPTER FIVE ............................................................................................................. 80
5.0 CONCLUSIONS AND RCOMMENDATIONS ................................................... 80
5.1 Conclusion ............................................................................................................... 80
5.2 Recommendations .................................................................................................. 82
5.3 Suggestions for Further Research ............................................................................. 84
REFERENCES ................................................................................................................. 85
APPENDICES .................................................................................................................. 92

xi
LIST OF TABLES
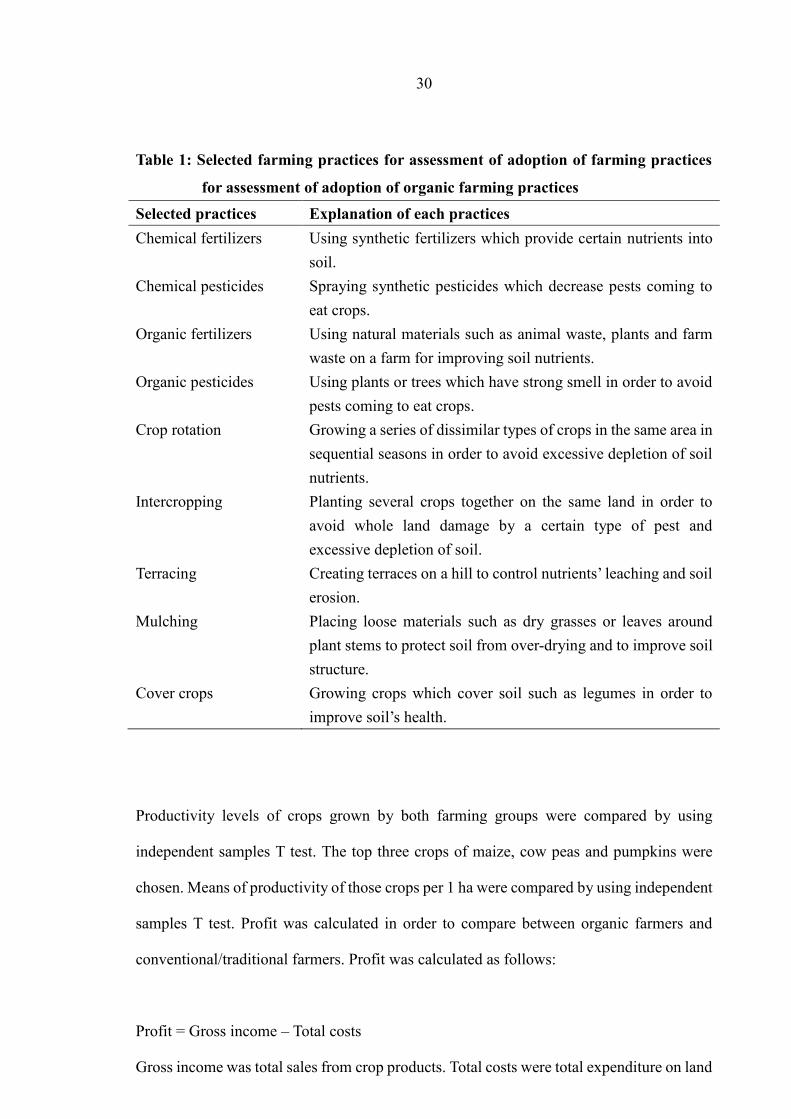
Table 1: Selected farming practices for assessment of adoption of farming
practices for assessment of adoption of organic farming practices ................... 30
Table 2: Score for calculation of adoption of organic farming practices ........................... 31
Table 3: Food consumption score ...................................................................................... 32
Table 4: Adult equivalent scales for East Africa .................................................................. 33
Table 5: Household economies of scale .............................................................................. 34
Table 6: Questions regarding customers’ attitude .............................................................. 36
Table 7: Socio-demographic characteristics of the households surveyed .......................... 40
Table 8: Socio-demographic characteristics of the respondents ........................................ 41
Table 9: Crops grown by more than half of each farming group ....................................... 42
Table 10: Livestock owned by the households .................................................................. 44
Table 11: Information of water for irrigation ..................................................................... 45
Table 12: Labourers employed by farmers in 2013 ........................................................... 46
Table 13: Organic farming support .................................................................................... 48
Table 14: The use of farming practices among the farmers ............................................... 51
Table 15: Score of overall adaptation of organic farming practices .................................. 52
Table 16: Crop products’ selling ways ............................................................................... 54
Table 17: Top five crop products sold by each farming group .......................................... 55
Table 18: Selling price of crop products of organic farmers .............................................. 56
Table 19: Average price of 1kg of crop products sold (TZS) ............................................. 57
Table 20: Means of productivity from 1 ha........................................................................ 58
Table 21: Descriptive information of gross income, total costs and profits among
organic farmers and conventional/traditional farmers ....................................... 59
Table 22: Profit (TZS) among organic farmers and conventional/traditional
farmers ............................................................................................................... 60
xii
Table 23: Independent sample T test comparing food security between organic
farmers and conventional/traditional farmers .................................................... 62
Table 24: Impact of some of the independent variables to productivity, profit
and food security ............................................................................................... 67
Table 25: Knowledge about organic products .................................................................... 76
Table 26: Score of overall customers’ attitude towards organic products ......................... 77
Table 27: Customers’ attitude ............................................................................................ 79
xiii
LIST OF FIGURES
Figure 1: Conceptual framework for the research ............................................................... 7
Figure 2: Simplified organic farming position among agricultural systems ...................... 15
Figure 3: Size of farm land owned by the households (ha) ............................................... 43
Figure 4: Farm equipment used ......................................................................................... 49
Figure 5: Overall attitude towards organic products .......................................................... 77

xiv
LIST OF APENDICES
Appendix 1: Organic farming organizations of Tanzania .................................................. 92
Appendix 2: A questionnaire for farmers ........................................................................... 94
Appendix 3: A questionnaire for market customers ........................................................... 99
Appendix 4: A check list for the focus group discussion ................................................. 102

xv
LIST OF ABBREVIATIONS
CA Conservation Agriculture
CVM Comunità Volontari per il Mondo
EPOPA Export Promotion of Organic Products from Africa
FAO Food and Agriculture Organization
IFOAM International Federation of Organic Agriculture
MVIWATA National Networks of Farmers’ Groups in Tanzania
NBS National Bureau of Statistics
OECD Organization for Economic Cooperation and Development
ORCA Organic and Resource Conserving Agriculture
SAT Sustainable Agriculture Tanzania
UMADEP The Uluguru Mountains Agricultural Development Project
UN United Nations
URT United Republic of Tanzania
WB World Bank
WHO World Health Organization
CHAPTER ONE
1.0 INTRODUCTION
1.1 Background Information
1.1.1 World rural poverty
There are always people who are in the shade of development, but they are actually the ones
who should be targeted. A country’s developments sometimes skip the people at the lower
levels, and it lets them stay in poverty. In the world, there are about 2 billion smallholder
farmers who depend on themselves for their livelihood (IFAD, 2011). Rural poverty is a
problem that people have been discussing for decades. However, generally, it is said that
peasants have not benefitted from development efforts thrust upon them by governments,
multinational corporations, and international agencies (Leonard, 2006). It seems that
development happens somewhere different from the bottom of the social ladder, and this
may be the reason why the poor persist across space and time.
In urbanized countries, where agriculture itself contributes only 6% of countries’ GDP, they
have done poverty reduction by the employment of unskilled labour. However, because of
strong existence of food retailing and agribusiness, it is a challenge for smallholder farmers
to manage supplying modern food markets (WB, 2007). Japan, for example, the third
largest-economy-country, built dynamic growth by manufacturing, technology and exports.
Meanwhile, the growth in demand for non-farm sectors has stimulated young people to
leave aged people at farms. Between 1960 and 2006, farm household declined by 50% and
farm labour by 80% (OECD, 2009). In transforming countries, where countries are shifting
from agriculture to urbanization, the non-farm sector is rapidly rising, and it expands
rural-urban disparity. Therefore, rural poverty remains a national problem (WB, 2007).
Green revolution in the 1960s brought historical increase in grain yields in Mexico, India

2
and the Philippines. However, since this tremendous success depends on the use of
chemical fertilizers and pesticides, irrigation and other inputs that poor farmers cannot
afford, there are questions to the value of Green revolution to peasants (Leonard, 2006,
Sebby, 2010).
Agriculture-based countries have more than half a billion people in the world. More than
four-fifths of agriculture-based countries are in Sub-Saharan Africa. About a half of them
live on less than $1.25 per day, and 68% of them are in rural areas. Their access to modern
inputs is quite limited. Only 4% of total arable and cropland is irrigated in Sub-Saharan
Africa while it is 39% in South Asia. Fertilizer use in Sub-Saharan Africa is 13 kg per ha,
which is less than one fourteenth of that of South Africa. According to World Bank (2008),
public spending on agriculture in agricultural-based countries is lower than that of
transforming and urbanized countries even though their share of agriculture in GDP is
higher.
In Tanzania, one of the agriculture-based countries, agriculture is the primary economic
activity for about 80% of Tanzania’s population (WB, 2012). In terms of GDP, Tanzania is
soundly developing by more than 7% (WB, 2014). However, it seems economic
development does not include rural people, and rural people still do not see the
improvement in their lives from the views of economy and food security (NBS, 2014).
Smallholder agricultural households occupy 98% of the total rural households. More than
half of the total households growing crops only operate between 0.01 and 1.5 ha. The
percentage of rural crops farming households using tractor is 0.8%, and 0.3% to power
tiller (NBS, 2012). The use of insecticides is limited to only 9% (NBS, 2012). Because of
these limited opportunities to agricultural modernization and inactive public support,
organic farming has been promoted as one of alternative development ways in
3
agriculture-based countries to improve smallholder farmers’ well-being.
1.1.2 Organic agriculture as a poverty reduction strategy
Organic farming is one type of agriculture, which is becoming popular in the world.
Organic farming is defined and explained in so many different ways, but the common
understanding among them is that it is a system that relies on ecosystem management rather
than external agricultural inputs (FAO, 2014a). The ecosystem management refers to all
kinds of skill which improve the condition of farming naturally, such as mulching for
conserving the moisture of soil, growing leguminous cover crops to improve the soil,
making compost to improve the soil nutrients, and intercropping and crop rotation to
preserve the soil. External agricultural inputs refer to the use of chemical pesticides to
control pests, diseases and weeds, and the use of chemical fertilizers and genetically
modified seeds and breeds to have higher yields with less energy (SAT, 2013). The
advantages of conducting organic farming could be: 1) less costs for input, 2) less
vulnerability, and 3) better outputs. In other words, they are able to reduce expenditure by
avoiding agrochemicals, to reduce risks of crops failure caused by climate conditions and
the fluctuation in prices of inputs, and to have higher quantity and quality of products which
leads to higher income and better food security (Pimentel, 2005, cited by Leu, 2012;
Eyhornet al., 2007; Sudheer, 2013; Aher et al., 2012; Andersson et al., 2012). Therefore,
organic farming is expected to be an alternative way of development for smallholder
farmers.
There are at least 43 organic agricultural groups in Tanzania (See Appendix 1). According
to Tanzanian Organic Agriculture Movement (TOAM), the umbrella organization of
Tanzanian organic agriculture, there are 89 subscribed institutional members including
farmer associations and cooperatives, NGOs and CBOs, organic operators, researchers and
trainers (TOAM, 2014). It implies that organic agriculture is getting attention in Tanzania,
and more and more organic producers are expected to appear in the future in Tanzania.

4
Most of them tend to depend on monoculture and exporting their products.
The United Nations Conference and Trade and Development (UNTAD) and United Nations
Environmental Programme (UNEP) professed that 114 organic agricultural projects from
24 African countries showed 116% increase in average change in crop yields. In Tanzania,
9 projects showed 67% increase (UN, 2008). This remark has truly increased the future
expectation of organic farming in Tanzania. The latest National Agriculture Policy of
Tanzania mentioned organic farming as “another window of opportunity that can be
exploited towards enhancing national and farm incomes” (URT, 2013). It states that organic
farming shall be more promoted to increase household incomes. For smallholder farmers in
disadvantaged areas, where people are geographically, politically and relationally limited
to external advantages, organic farming could be promoted as an alternative way to
improve their farm life conditions.
1.2 Problem Statement
Although organic farming has a potential to help smallholder farmers improve their
well-being, such agriculture has hardly been practised for smallholder farmers in
disadvantaged areas in Tanzania (UN, 2008; Malaki, 2010; Aher et al., 2012; Andersson et
al., 2012; Sudheer, 2013; FAO, 2014b; CHEMA, 2014). There are some researches
showing the contribution of export-oriented organic farmers and mono-cropping organic
farmers (UN, 2008; Malaki, 2010; CHEMA, 2014). However, the potential of non-contract
multi cropping organic farming has not been surely confirmed on-site. For smallholder
farmers to take advantage of contract farming is demanding because of a chance of
contracts, quantity and quality of crops. Moreover, export-oriented organic farming and
mono-cropping organic farming still keep farmers vulnerable in many cases. First, they
make the farmers depend on a premium price of a single crop production which is easily
fluctuated by global market situation. Second, unfavourable agricultural conditions such as
climate and insect problems could damage them because of their dependence on
5
monoculture (Eyhorn et al., 2007). Therefore, the study for this dissertation attempted to
assess the contribution of organic farming to improve “well-being” which is indicated by
crop productivity, profitability and food security of smallholder farmers in disadvantaged
areas where farmers live geographically, politically and relationally under un conducive
environment. Smallholder farmers in disadvantaged areas were targeted since they are the
majority of the rural poor who do not have external advantages such as good markets,
financial services and export contracts (Hansen, 2011; URT, 2009; WB, 2007; Minot, 2009)
1.3 Research Justification
The aim of the study was to show the contribution of organic farming to smallholders’
well-being in disadvantaged areas who do not have the chance to export contract, and who
grow multi crops for their local consumption, because such information is scarce among
past researches of organic farming (Malaki, 2010; Sudheer, 2013; UN, 2008). If the
potential of organic farming could be shown against low productivity, income poverty and
food insecurity, which have been discussed as major problems of poverty, it could generate
empirical information on which to base efforts to promote organic farming with the aim to
improve well-being of smallholder farmers. Hence, the findings would contribute to
improvements of national development policies and strategies which seem to have failed to
involve smallholder farmers. It is also hoped to be a new global model of sustainable rural
development which accomplishes poverty reduction from the bottom of the society where
changes are really needed.
6
1.4 Objectives and Hypotheses
1.4.1 General objective
To determine the contribution of organic farming to well-being of smallholder farmers.
1.4.2 Specific objectives
(i) To examine how farmers implement organic farming practices
(ii) To examine how farmers sell their products
(iii) To compare productivity, profit and food security between conventional/traditional
farmers and organic farmers
(iv) To determine impacts of some elements of characteristics of households, those of
agricultural environment and market conditions on crop productivity, profit and food
security
(v) To determine challenges for smallholder farmers to conduct organic farming
(vi) To determine communities’ attitude towards organic products
1.4.3Research questions
(i) How are farmers implementing organic farming practices?
(ii) How are farmers selling their products?
(iii) What kind of challenges are organic farmers facing?
(iv) What is the communities’ attitude toward organic products?
1.4.4 Null hypotheses
(i) Productivity, profit and food security do not differ significantly between
conventional/traditional and organic farmers
(ii) Elements of characteristics of households, those of agricultural environment and
market conditions do not have significant impacts on crop productivity, profit and food

7
security among organic farmers and conventional/traditional farmers
1.5 Conceptual Framework
The variables that were studied are summarised in Fig. 1, and the hypothetical relationships
among them are explained thereafter.
Figure 1: Conceptual framework for the research
The primary independent variable is organic farming. The dependent variable is well-being,
which was measured in terms of crop productivity, profit and food security. Crop
productivity was measured by calculating each crop’s production per ha. Profit was
measured by net margin. Food security was measured by food consumption score, food
sufficiency level, dietary energy consumed and percentage of a household’s total
expenditure on food. The other variables in the conceptual framework are characteristics of
household as background variable and secondary independent variables. The secondary
independent variables are grouped into agricultural environment and market conditions.
The indicators of the three categories of secondary independent variables are as seen in Fig.
1.
Organic farming Seeds
Tillage
Crop varieties
(Mono cropping,
multi cropping)
Organic fertilizers
Organic pesticides
Soil conservation
Water conservation
Well-being of smallholder farmers Crop
productivity Profit
Food security Agricultural environment Farm size Livestock keeping
Water availability
Years of practicing organic
farming
Organic farming support
Characteristics of household Age of household head
Sex of household head
Education of household head
Non-farm workers
Side business
Market condition
Certification body
Export contract
Selling place
Premium price
Customers’ attitude
8
It is hypothesised that variation in well-being is affected by variation in the characteristics
of household head and independent variables. For instance, sex of household head affects
food security because women usually care about food more than men. Livestock keeping,
which is one of farming activities, may cause higher profit, because availability of animal
manure may influence a crop’s growth and lead to higher productivity. If there is a good
market condition such as export contract, it directly helps farmers get higher profit, because
of premium prices from the buyers. Organic farming supporters such as NGOs can give
knowledge and skills of organic farmers, and it could involve productivity.
9
CHAPTER TWO
2.0 LITERATURE REVIEW
2.1 Rural Poverty in Tanzania
Tanzania is located in East Africa with a population of about 48 million. The GDP is $28.24
billion as of 2012, and Tanzania is soundly developing in terms of GDP by more than 7% as
of 2013 and 2014. However, poverty is still a big national concern. The poverty headcount
ratio at national poverty line is 28.2% as of 2012 (WB, 2014). There are many limitations in
rural areas compared to urban areas. The proportion of households connected to electricity
grid in rural areas is only 10%, while it is 59% in Dar es Salaam and 30% in other urban
areas. Rural people have long distances to important services. Average distance to a bank is
37 km, and 18km to a police post. About water supply, only 49% of rural households have
their supply within 1km, while 84% and 73% of households in Dar es Salaam and in other
urban areas respectively have the supply within 1km. Hygienic and safe drinking water also
differs. Some 53% of rural households depend on unprotected water supply such as
unprotected wells, springs, rivers and lakes, while 76% in other urban areas have piped
water. Some 65% of household consumption expenditure is on food, and this proportion is
higher in rural areas (NBS, 2012).
2.2 Agriculture in Tanzania
2.2.1 General information
According to Tanzania National Agriculture Policy (URT, 2013), the agricultural sector is
comprised of crops, livestock and forestry and hunting sub sectors. Tanzanian agricultural
sector is an important sector as a source of food, employment, raw materials, and foreign
exchange. This sector provides livelihood for more than two-thirds of the population in
Tanzania. Although the number of people working in agriculture is decreasing little by little,

10
agriculture is still the most important economic activity. Some 70% of households are
headed by individuals who work in agriculture. The sale of agricultural products is the main
source of cash income for 62% of households (NBS, 2012). Arable land which is defined as
land under temporary crops is 13% as of 2011 (WB, 2014). Crop production is the major
sub-sector which contributed about 17.8% of GDP in 2010 while livestock production
contributed about 3.8% of the GDP, and forestry and hunting contributed about 2.4%
(Economic Survey 2010 cited by URT, 2013).
Most of the regions in Tanzania depend on the long rainy season, since few regions receive
substantial rain in both long and short rainy seasons. During 2002/03, the total area planted
with annual crops was 7,818,620 ha in the short rainy season, and 6,349,707 ha were
planted during the long rainy season (NBS, 2012). The main staple foods are maize and
paddy. The main cash crops are cashews, coffee, cotton, sisal, sugar, tea and tobacco, as
well as spices from Zanzibar. Generally, food crop producers are poorer than cash crop
producers. But both farmers are frequently exposed to cyclical and structural constraints,
such as drought and flooding.
2.2.2 Agricultural modernization
Generally, Tanzania makes minimum use of mechanization. The percentage of rural crops
farming households using tractors is 0.8%, and 0.3% to power tillers. According to
National Census of Agriculture 2007/08 (NBS, 2012), the use of oxen is categorized as
mechanization. Ox-plow is the leading method, and it is used by 14.4% of the total rural
crop farming households. Ox-planter is used by 0.6%, and oxcart is used by 4.4% (NBS,
2012).
11
Agricultural inputs do not seem to be common for large population. According to National
Census of Agriculture 2007/08 (NBS, 2012), 18.2% out of all households planted with
fertilizer, out of which 11.0% used organic fertilizer and 7.2% used inorganic fertilizer.
During the long rainy season, 19.8% out of all households used fertilizers, out of which
9.9% used organic fertilizers and 9.9% used inorganic fertilizers. These data show low use
of purchased inputs as other African countries’ smallholder farmers sectors do (NBS, 2012;
Hillocks, 2002). Moreover, the data tell that the use of organic fertilizers is not common.
With regard to technology, crop growing smallholder farmers’ access to improved seeds is
24.3%, 14.0% to insecticides/fungicides, and 7% to irrigation (UTR, 2010).
Even though Tanzanian agriculture policy states that its aim is to achieve modernized,
commercial, productive and profitable agriculture in a sustainable manner, it seems that
national development direction is promoting more chemical inputs with less consideration
about their availability (URT, 2013). KILIMO KWANZA1was launched as new assistance
for smallholder farmers to reach agricultural transformation. However, there are still
difficulties for most of smallholder farmers to access several sources such as financial
support and mechanical support promoted in this policy, because minimum requirements to
access those sources are financially still high (URT, 2009;Ngaiza, 2012).
2.3 Smallholder Farmers in Tanzania
Smallholder agricultural households occupy 98% of the total rural households (NBS, 2012).
The population of rural agricultural smallholder households in Tanzania is 31,013,026
(30,264,358 Mainland and 748,668 Zanzibar), of which 15,487,217 are males (15,114,238
Mainland and 372,978 Zanzibar) and 15,525,810 are females (15,150,120 Mainland and
1KILIMO KWANZA, which means Agriculture First in Swahili is a national resolve formulated under
patronage of Tanzania National Business Council Forum in 2009 to accelerate Tanzanian agricultural
transformation. It is a central pillar to achieve Tanizania’s Development Vision 2025 (Ngaiza, 2012).

12
375,690 Zanzibar). The total number of smallholder agricultural households is 5,838,523
(NBS, 2012).The region with the largest number of smallholder Agricultural Households in
Tanzania Mainland is Shinyanga (9%) followed by Mbeya (8%). More than half of crop
growing households hold less than 2 ha, and 36.1% hold less than 1 ha. About half of crop
and livestock growing households hold less than 2 ha and 22.7% for less than 1 ha (NBS,
2012).
2.4 Food Security
2.4.1 Definition of food security
The World Food Summit of 1996 defined food security as “when all people at all times
have access to sufficient, safe, nutritious food to maintain a healthy and active life”. WHO
states that the concept of food security is commonly “defined as including both physical
and economic access to food that meets people's dietary needs as well as their food
preferences” (WHO, 2014).
Commonly, there are four parameters of food security: Availability, access, utilization and
stability on a consistent basis. The availability addresses sufficient quantity of food which
is physically available. The access refers to physical and economic access to food
concerning incomes, markets and prices. The utilization is nutritious status of individuals
by diet diversity and intra-household distribution. The stability considers stabilities of those
three dimensions over time. Unstable situation such as adverse weather conditions,
political instability, unemployment or rising food prices contribute to food insecurity
(FAO, 2008;WHO, 2014).
Food sufficiency is one of the factors composing food security. Since food is the most
important means of subsistence, food sufficiency is often said that it is strong especially

13
when market economy is bad. This is because people are self-supported for basic food.
Food security at individual and community level could be secured by food sufficiency. In
this paper, therefore, the word “food security” is used as food security from individual to
community level, and distinguishes from national food security.
2.4.2 Food security in Tanzania
Statistics show that over 70% of world food insecure population in Africa lives in rural
areas. Ironically, smallholder farmers who produce over 90% of the continent’s food supply
make up half of this hungry population (Leu, 2013). Tanzania is not considered a severe
food-deficit country, and normally produces over 90% of food requirement of the
population (IFAD, 2011). However, there are some factors contributing to food insecurity
such as dependence on rain especially in semi-arid areas .In Tanzania Mainland, 21.5% of
the population is considered that they are under the poverty line based on Basic Needs
Poverty Line which is TZS 36,482 per adult per month in 2012 prices. From the view of
Food Poverty Line which is TZS 26,085, 7.2% is considered that they are under the poverty
line (NBS, 2014).
2.5 Organic Farming
2.5.1 Definition of organic farming
FAO/WHO Codex Alimentarius Commission of 1999 stated the definition of organic
agriculture as follows:
“Organic agriculture is a holistic production management system which promotes and
enhances agro-ecosystem health, including biodiversity, biological cycles, and soil
biological activity. It emphasises the use of management practices in preference to the use
of off-farm inputs, taking into account that regional conditions require locally adapted
14
systems. This is accomplished by using, where possible, agronomic, biological, and
mechanical methods, as opposed to using synthetic materials, to fulfil any specific function
within the system” (FAO, 2014a).
Organic farming applies this definition to the farming sector. In short, organic farming is a
system that relies on ecosystem management rather than external agricultural inputs.
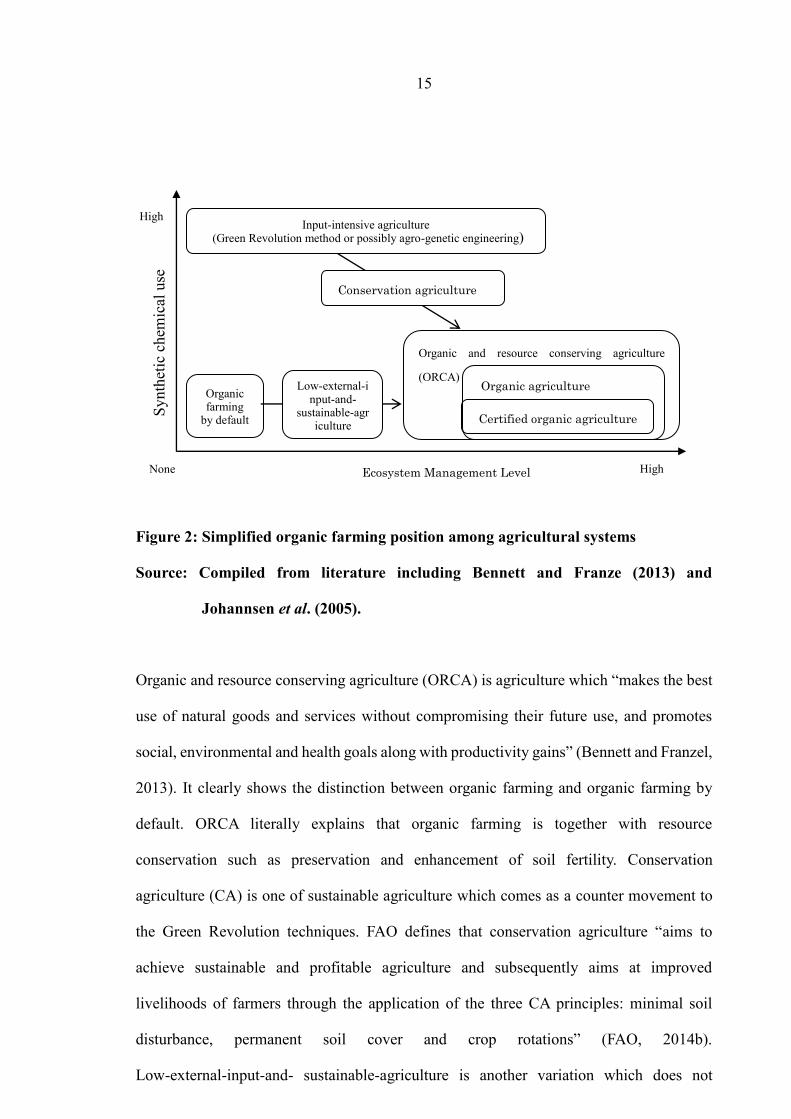
2.5.2 Organic farming position among agricultural systems
Fig. 1 explains the organic farming position among agricultural system. According to the
figure, organic farming stands at low synthetic chemical use and high ecosystem
management position. Development of organic farming method comes from two sides:
Input-intensive agriculture using the Green Revolution method or possibly agro-genetic
engineering and organic by default (See Fig. 1). From Input-intensive agriculture side, it
goes to lower use of chemical inputs in modern culture as a counter movement of
techniques of Green Revolution. This anti-conventional farming movement has risen from
developed countries because of a concern about the food production method impacts on
human health. From organic farming by default, it goes to integrate modern ecological
insights into traditional method. Developing countries in many cases entered organic
agriculture with the big goal of supporting smallholder farmers’ livelihoods (Johannsen et
al., 2005).In developing countries, many farmers conduct organic farming by default. Since
smallholder farmers cannot afford agricultural inputs, they end up not using any modern
agricultural technology. This situation does not come from smallholder farmers’ intention
but from their financial limitation. This is why they are called organic farmers by default.
15
Figure 2: Simplified organic farming position among agricultural systems
Source: Compiled from literature including Bennett and Franze (2013) and
Johannsen et al. (2005).
Organic and resource conserving agriculture (ORCA) is agriculture which “makes the best
use of natural goods and services without compromising their future use, and promotes
social, environmental and health goals along with productivity gains” (Bennett and Franzel,
2013). It clearly shows the distinction between organic farming and organic farming by
default. ORCA literally explains that organic farming is together with resource
conservation such as preservation and enhancement of soil fertility. Conservation
agriculture (CA) is one of sustainable agriculture which comes as a counter movement to
the Green Revolution techniques. FAO defines that conservation agriculture “aims to
achieve sustainable and profitable agriculture and subsequently aims at improved
livelihoods of farmers through the application of the three CA principles: minimal soil
disturbance, permanent soil cover and crop rotations” (FAO, 2014b).
Low-external-input-and- sustainable-agriculture is another variation which does not
Organic farming
by default Certified organic agriculture
Organic agriculture
Input-intensive agriculture (Green Revolution method or possibly agro-genetic engineering)
Synth
etic
chem
ical
use
Ecosystem Management Level None High
High
Organic and resource conserving agriculture
(ORCA)
Low-external-input-and-
sustainable-agriculture
Conservation agriculture

16
entirely rule out pesticides and synthetic fertilizer (Johannsen, 2005).
Certified organic farming is a type of farming which ensures that organic products are
indeed grown according to certain organic standards. Fundamental differences are found
among countries. These differences in standards are acceptable, because ecological
management needs to depend on countries’ or regions’ conditions (FAO, 2014b).
According to Reddy (2010), there are three types of certification of the system. The first
one is a third party certification for an individual, and this is an internationally recognized
certification system. The second scheme is a third party certification for a group in which
individuals are certified using Internal Control System (ICS). The third system is a
Participatory Guarantee System (PGS), which involves participation of smallholder
farmers, small entrepreneurs, traders and consumers in the certification process.
2.5.3 Organic agriculture organizations
Organic agriculture organizations are mainly divided into three types: research institutions,
network organizations and certification organizations. Research institutions support to
make a sound methodology which explains why and how the organic system works. For
example, Kenyan Institute of Organic Agriculture and Gami Seva Sevana in Sri Lanka were
established in order to supplement the methodology with their research (FAO, 2014b). The
aim of network organizations is to make a sound board of organic agricultural network in
order to promote it properly. International Federation of Organic Agriculture (IFOAM) is
the biggest and the oldest umbrella organization which has over 710 member organizations
in 115 countries. It has been working to promote organic agriculture and to educate organic
organizations since 1972 (IFOAM, 2014). Certification organizations work to certify
organic products according to a certain organic standard in order to ensure the products are
grown organically. There are more than 100 national or regional organic standards in the
world. These certification bodies are important to avoid inadequate organic producers who

17
are only interested in getting premium prices (FAO, 2014b, IFOAM, 2014).
2.5.4 Organic farming ways
At the forefront of organic farming consideration is a holistic ecosystem management. This
idea came from numerous demerits from conventional agricultural technologies such as
chemical pesticides, diseases and weeds, and the use of chemical fertilizers and genetically
modified seeds to have higher yields. They are usually associated with greenhouse gas
emissions, pesticide residues, reduced biodiversity, soil erosion, declining fertility and salt
built-ups (Bennett and Franze, 2013). However, the ecosystem management improves the
condition of farms naturally, and it goes along well with surrounding environmental
situations. Several main techniques are mentioned below.
Ecosystem surely gets damaged when external agricultural inputs are used such as
chemical pesticides for controlling pests, diseases and weeds, chemical fertilizers and
genetically modified seeds and breeds for having higher yields with less energy. In order
not to destroy natural system, genetically modified seeds and breeds are kept out of this
type of agriculture. Instead of chemical pesticides and fertilizers, organic fertilizers and
pesticides are applied. Examples of organic fertilizers are farmyard manure, organic
manure, vermiform compost, crop residues and green manure. These natural fertilizers help
increase bulk density and maximum water holding capacity (Bhanuvally, 2006). Organic
pesticides have several ways to control pests, such as coordinating planting dates, row
covers, plastic tunnels, mulch and chemical pesticides approved for use in organic
agriculture. In addition, organic farming enables biological control, and it builds up large
numbers of beneficial parasites and predators that help control pests in many crops (Fouche
et al., 2000). These natural pest management methods are called integrated pest

18
management (IPM2).Soil conservation is the heart of the ecosystem. There are several ways
to conserve nutritious soil such as mulching, compost, cover crops, intercropping and crop
rotation. Mulching is to cover soil with vinyl sheet or organic materials. It helps to maintain
moisture in soil by reducing the amount of water lost thorough evaporation, to maintain a
uniform soil temperature, to minimize soil erosion from heavy rain, and to reduce weed
problem. Moreover, since plant materials progressively stimulate decomposition by
biological effects from microorganisms, cultivation workforce may decrease. Several local
materials can be used as organic mulch such as leaves, compost, straw, wood chips and
hulls (Williams, 2014).
Composting is a natural process of decomposition of organic matters by microorganisms.
Compost is made from rotten organic matter, and farm compost which is especially made
from farm waste such as crop residues and weed. This raw feedstock, through composting
process, becomes a concentrated form of nutrients, and it helps build a fertile soil structure.
Good compost which is balanced with carbon and nitrogen and other nutrients can manage
microorganisms in a soil. Humic substances, increased by composting make a soil more
resistant to erosion (Biernbaum and Fogiel, 2006).
Cover crops such as grasses and legumes improve soil health and structure as mulch and
composting do. Soil will have better micro biotic activities, stronger structure against soil
erosion and higher water infiltration rate. Some cover crops have been proved to contain
double nitrogen as that of compost. Therefore, cover crops are used to avoid nitrogen
deficiency. Moreover, nitrogen from cover crops does neither readily run off nor leach as
inorganic nitrogen fertilizer does (Mikkelsen and Hartz, 2008).
2 IPM is defined as “a decision support system for the selection and use of pest control tactics, singly or harmoniously
coordinated into a management strategy that takes into account the interests of and impact upon producers, society and the
environment” (Kogan, 1998 cited by Hillocks, 2002).
19
Intercropping is defined as an agricultural practice of growing two or more crops within the
same place at the same time (Andrews and Kassam, 1976, cited by Hunady and Hochman,
2014). Intercropping has benefits in terms of pest control and nutrient control. Several
kinds of plants would decrease pest damage. Considering crops’ nutrient consuming degree
is also important, since each crop has different nutrient requirements. Planting only nutrient
consuming crops such as fruiting vegetables depletes nutrition especially nitrogen. Mixing
with low nutrient consuming crops such as roots or nitrogen fixing legumes will be good
for soil fertility (Hunady and Hochman, 2014). Therefore, mono cropping creates a weak
system whereby pests or high nutrient consuming crops may destroy a farm. Moreover,
mono cropping has weak resistance to unfavourable weather condition and price decrease
in a market.
Crop rotation is to rotate crop species at a farm for certain duration. Many studies have
shown a decrease of microbial activities in farm soils which continuously grow single
species. Two general biological and physical benefits of crop rotation are improvement of
soil quality and pests management. As intercropping has a benefit by mixing crops which
consume nutrient differently, crop rotation has a merit of controlling soil nutrition. Mohler
and Johnson (2009) say that when the land is in grass, legume sod and cover crops, the soil
tends to improve. For pest management, crop rotation is a key component, since it can
control host-specific pests which specialize on a particular species (Mohler and Johnson,
2009).
2.6 Theoretical Literature Review
Sustainability of organic farming can be explained in a theory of sufficiency economy
which was introduced by His Majesty King Bhumibol Adulyadej in Thailand. Its aim is to
live in moderation and being self-sufficient in order to be strong against shocks and
changes instead of being characterized as a newly industrialized country. Before putting

20
emphasis on industrial expansion, basic economic stability should be established first to
assure that the majority of rural people have enough to subsist. By producing enough to eat
as a first priority, farmers can avoid several risks such as price fluctuation, unproductive
conditions and natural disasters. Therefore, this sufficiency economy enables people to
think of adequate development with adequate size and technology without necessities of
excessive external intervention. This approach is applicable at every level, from individual
through community to national level (The Chaipattana Foundation, 2014; UN, 2014).
Smallholders’ multi cropping organic farming follows this ideology of sufficiency
economy with accessible local resources. Risk management idea of this theory also
matches the merit of organic farming.
2.7 World Attention to Organic Farming as Poverty Reduction Strategy
2.7.1 Possibility of organic farming
Organic farming is an environment friendly farming strategy because of its less greenhouse
gases (Aher et al., 2012). Besides such an environmental impact, the advantages of
conducting organic farming are: 1) less costs for input, 2) less vulnerability, and 3) better
outputs as poverty reduction. Organic farming is a feasible agricultural way by any
smallholder farmer because of less cash inputs. Avoiding agrochemicals helps conventional
farmers to reduce extra expenditure. Traditional farmers who are not using agrochemicals
could get advantages of organic farming without money for external inputs (Eyhorn et al.,
2007).
Organic farming is expected to be less vulnerable to several unfavourable factors. One of
them is its strength against unfavourable climate conditions such as drought and damaging
rainfall (Khanal, 2009). Rodale Institute showed more maize production from the organic
system than from the conventional one in drought years. The average maize yields during
21
the drought years were about 30% higher in organic legume systems. The yields were 7,235
kg per ha compared to 5,333 kg per ha in the conventional system (Pimentel, 2005, cited by
Leu, 2012; Eyhorn et al., 2007).
Another unfavourable factor is price fluctuation because of dependence on world markets.
Conventional farmers depending on world markets easily get economic damages caused by
world price decrease. Even organic farmers exporting products have the same risks (Eyhorn
et al., 2007). Depending on a single buyer is also risky, because farmers would be hit when
they get some trouble on their market connection. However, organic farmers who grow
crops for local consumption are stronger than others against these problems, because they
do not really depend on externals for making their lives. Multi cropping organic farming
also contributes to tackle food insecurity in terms of crop varieties, because crop variety is
one of the factors which lead to food sufficiency.
Better outputs are mainly achieved as better products and higher profit (Sudheer, 2013;
Aher et al., 2012; Andersson et al., 2012). Moreover, in Tanzania, since more than 80% of
households use neither organic fertilizer nor chemical fertilizers, organic agricultural inputs
would help them have higher yields (NBS, 2012). This higher quantity of products leads to
higher profit. This higher profit is sometimes seen because of subsidies (FAO, 2014b). In
addition, organic products have premium prices because of their high quality and high
demand (van Elzakker and Tulip, 2000, cited by FAO, 2014b). These better outputs also
lead to food security.
2.7.2 Success of world organic farming
There are several researches about income increase from organic farming all over the world.
In Uganda, where organic agriculture is leading in East Africa nowadays, organic cotton
farming achieved higher yields compared to that of conventional farmers in the same case
22
study site. Economic performance of organic cotton was much higher due to 20% of
premium price on export (van Elzakker and Tulip, 2000, cited by FAO, 2014b). A research
of economics of organic farmers in India also showed a higher gross income than that of
conventional farmers with lower input costs. Since the target organic farmers were not
certified, these profits were brought without any premium price. This result was seen in
paddy, red gram and groundnuts in Andhra Pradesh, a south eastern coastal state (Sudheer,
2013).
Yields increase on organic farms has also been found in several researches. In the UK,
150-year-trial proved that organic wheat farms had higher yields than those of conventional
farms (Leigh, 1997 cited by Aher et al., 2012). Other organic wheat and soybean farms in
the US brought 3.5% and 4.8% higher yields respectively than conventional farms (Welsh,
1990 cited by Aher et al., 2012). Since organic farming is one of the means to enhance
biodiversity in agricultural landscapes, it leads to higher pollination success. Andersson et
al. (2012) found that organic strawberry farms have higher pollination success and the
proportion of fully pollinated strawberries in the southernmost part of Sweden.
2.7.3 Limitations of organic farming
There are many obstacles to succeed in organic farming. For producers, lack of available
knowledge and skills is often a reason for low adoption of organic farming and low outputs
(Khaledi, 2007 and Svotwa et al., 2009). Weak organic market development also leads to
difficulties of introducing organic food, and organic farmers end up giving up premium
prices of organic products. There are also some certification constraints. Understanding
export market regulations is a task. These regulations are often too difficult for smallholder
farmers to follow. In addition, certification fee by external bodies are often expensive (UN,
23
2006).From the view of consumers, their awareness of organic products has been
increasing due to ravage of HIV/AIDS, health concerns and taste quality. However, such
awareness is not prevalent enough to create a big demand for organic products (UN, 2006).
Higher price of organic products often limits consumers, especially in developing countries.
Therefore, co-operative model of organic farming including market environment,
consumers’ awareness and farmers’ skills is normally used (IFOAM and FiBL, 2008).
Yield decrease has been seen during conversion period from conventional to organic
farming (Eyhorn et al., 2007). Especially conversion from external-input-intensive farming
to organic farming shows yield decrease, because such farms depend on only functions of
artificial fertilizers to make good crops, and it takes time until the soil becomes fertile
enough to produce crops (Reddy, 2010). One research conducted in California showed
yields decrease in tomato production in initial three years, but it increased later (Clark,
1990 cited by Aher et al., 2012). Another research of corn and soybean production showed
lower yields for three years, but it increased in the fourth year (Delate, 2004 cited by Aher
et al., 2012).
Yields increase has not been achieved in several cases. A survey conducted in California
showed that yields of tomato between organic and conventional farmers were similar even
though the organic farms had higher microbial abundance, nitrogen and carbon in soils
(Drink water et al., 1995). Another survey also showed the same yields between organic
and conventional farming for 22 years (Primentel, 2005 cited by Aher et al., 2012).
2.7.4 Organic farming in Tanzania
In Tanzania, organic farming history started in 1898 with Peramiho Organic Garden in
Ruvuma Region which produced various vegetables (UN, 2006). Now, there are several
organic farming organizations such as Participatory Ecological Land Use Management

24
(PELUM) Tanzania and Tanzanian Organic Agriculture Movement (TOAM). Organic
products are normally confirmed by Tanzanian standards, TanCert and PELUM Tanzania,
or international standards offered by IMO, EcoCert and Bio Inspector. Besides these
certification bodies, there are organic farmers using European countries’ organic standards
where they are exporting to.
There are a few researches about the impact of organic farming. United Nations Conference
and Trade and Development (UNTAD) and United Nations Environmental Program
(UNEP) collected several results of organic farming impacts in Tanzania. In Meatu district,
Shinyanga Region, 45 contracted cotton farmers agreed organic cultivation as project
farmers in the 1994/5 agricultural season, and showed increased food security. In
Mkuranga district, Pwani Region, with facilitation of EPOPA3, Premier Cashews Industry
Ltd. worked with 480 farmers to export organic cashew nuts. Because of changes of world
market prices, they could not bring good results. However, women in the villages grew
some fruits and vegetables using organic farming practices, and helped to diversify sources
of food and income. It was good improvement because people in that area had neglected
food crops since they had been benefited from good cashew prices. Besides increase of
available food, they also developed social capitals such as opening savings accounts and
making local processing groups (UN, 2008).
In cotton production in Meatu and Kishapu Districts, Sinyanga Region, farmers supported
by private companies Biore Tanzania Limited4
and Busangwa Organic Farming
Association5 were researched. The results showed that organic cotton exporters had lower
3 EPOPA is a Swedish supported programme called Export Promotion of Organic Products from Africa. Organic projects
were started in Tanzania, Uganda and Zambia (EPOPA, 2014). 4 Biore Tanzania Limited is a subsidiary of Swiss Company Remei, formed with an objective of improving living
conditions for rural people (Malaki, 2010). 5 Busangwa Organic Farming Association is a nongovernmental organization facilitating organic farming in Shinyanga
Region (Malaki, 2010).

25
gross margin, and this implies a need for another utilization of cotton rather than
dependence on foreign market (Malaki, 2010). In Karagwe District, Kagera Region, about
300 farmers are growing organic pineapples, papayas and sweet bananas with support of
Community Habitat Environmental Management (CHEMA). An organic product exporter,
Matunda Mema, dries them and exports them to Germany. They succeeded to have higher
yields and higher income including premium price from Germany (CHEMA, 2014). In
Kilombero District, Morogoro Region, 44 organic cocoa farmers showed TZS 50,438,400
of total gross margin which implies quite good payment. However, the research revealed
several constraints of organic cocoa production such as insufficient supply of
recommended organic inputs, price fluctuation and high certification costs.

26
CHAPTER THREE
3.0 RESEARCH METHODOLOGY
3.1 Description of Study Area
This study was done in Morogoro Region which is located in the Eastern part of Tanzania.
In the region, the number of rural households involved in agriculture is 298,421, but only
few of them make use of mechanization and technology. Ox-plough is used by 2.9% of the
total rural crop farming households, ox-planter by 0.2%, and ox-cart by 1.2%. Tractor is
utilized by 2.3%, and power tiller is used by 0.3%. During the short rainy season, 12.1% of
households apply fertilizer, out of which 2.0% apply organic and 10.1% apply inorganic
fertilizer. During the long rainy season, 3% of households apply fertilizer, out of which
1.5% apply organic and 1.5% apply inorganic fertilizer (URT, 2013).
In Morogoro Region, there are organisations dealing with organic agriculture. They are
Sustainable Agriculture Tanzania (SAT) which supports production of various kinds of
crops, Kimango Farm Enterprises Ltd which produces spices, Mbingu Farmers Association
(MOCOA) which supports production of cocoa beans, Mikese Organic Farm which
produces fruits, and Tanzania Organic Products Ltd (TAZOP) which produces spices. Most
of them, except for SAT, depend on monoculture for exporting their products. The region is
divided into six districts namely Morogoro Urban, Morogoro Rural, Mvomero, Kilosa,
Kilombero and Ulanga. The study was conducted in Morogoro Municipality, Morogoro
Rural district and Mvomero district which have 120,021 agricultural households in total
(NBS and OCGS, 2013; Mella et al., 2007 and ESRC, 2015). Smallholder farmers were
selected from Morogoro Municipality, Morogoro Rural District and Mvomero District in
Morogoro Region, since these are the areas where there are smallholders farmers
conducting organic farming for local consumption. Most of the organic farmers are trained
by Tanzanian organic farming organization named SAT.
27
3.2 Research Design
Cross-sectional research design was used in this study since it allows collection of data to
make inferences about a target population at one time (Kothari, 2014). The study was a
comparative one whereby an impact assessment was done to compare organic farmers and
conventional/traditional farmers. This was done because a comparative study is used when
they aim to explain differences and the assumptions they make about the underlying causal
patterns present (Pickvance, 2001).
3.3 Sampling
Morogoro Municipality, Morogoro Rural district and Mvomero district which have small
scale organic farmers who are conducting multi crop organic farming for their local
consumption were selected purposively. For conventional/traditional farmers, four villages
named Misongeni, Langali, Lukobe and Mkambalani from the 3 target districts were
chosen purposively, and random sampling was done to get households of smallholder
farmers. For organic farmers, purposive sampling was done to have the target farmers, and
20 villages were chosen (Mgambazi, Kauzeni, Langali, Lukobe, Konga, Ruvuma,
Msowelo, Kinole, Banba, Tulo, Choma, Mwanzo mgumu, Kireka, Tandai, Ka;undwa,
Tegerero, Rugala, Bagiro, Hewa, Amini). A total of 362households were selected from the
areas comprising 181 organic farmers and 181 conventional/traditional farmers. The
sample size was calculated using the following
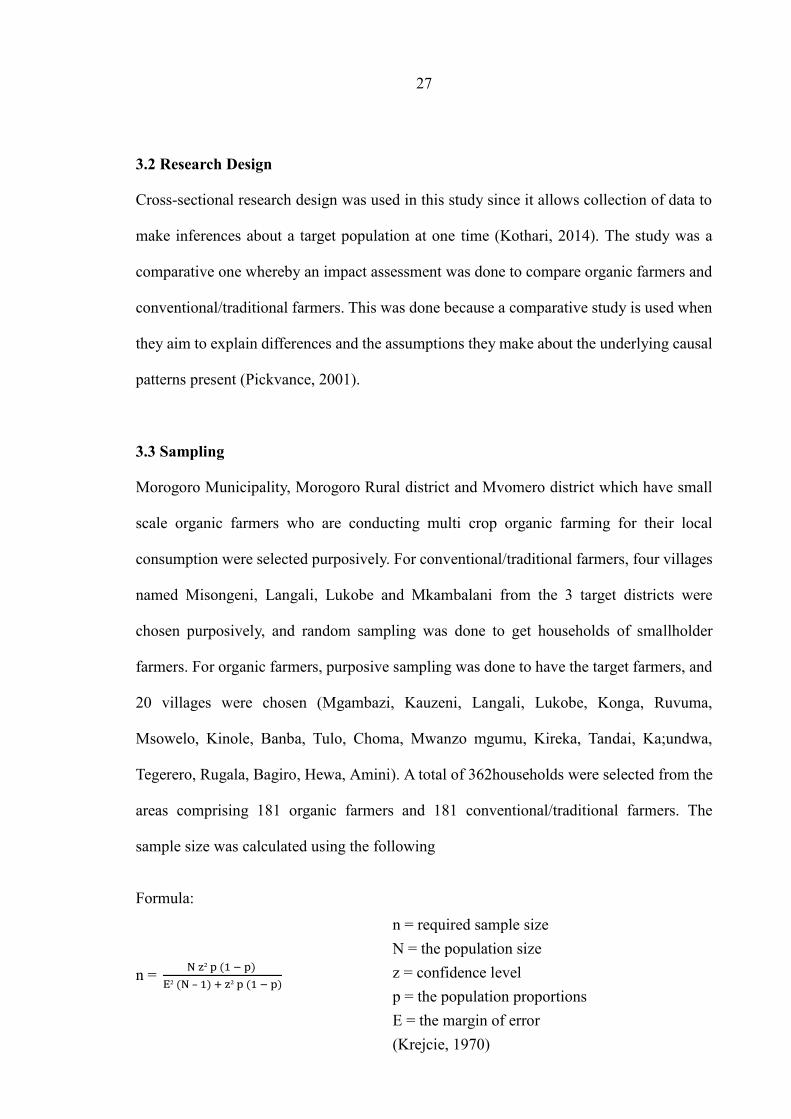
Formula:
n =
–
n
n = required sample size
N = the population size
z = confidence level
p = the population proportions
E = the margin of error
(Krejcie, 1970)

28
For this research, the population size was 120,021, and the confidence level was set at 95%,
50% for the population proportions and 5% for the margin of error. Since the population
proportion was not known, the maximum possible proportion, 0.5, was used. The required
sample size was 362 from the calculation, 120,021×1.96²×0.5 (0.5) / 0.05² (120,021 - 1) +
1.96² 0.5 (0.5). However, a sample of 324 farmers comprising 160 organic farmers and 164
conventional/traditional farmers was used since some of the farmers were not available.
For qualitative data, 24 respondents including 8 organic farmers from 3 villages, who were
available, were chosen purposively in order to conduct focus group discussions. Sixty (60)
customers including 30 occasional consumers of organic agricultural products at an organic
shop and 30 customers who went to normal market places were selected to administer the
questionnaire about communities’ attitude towards organic products. However, a total of 49
customers comprising 32 customers of the normal market place and 18 customers of the
organic shop were available.
3.4 Data Collection
The study used mixed method, which collects quantitative and qualitative data, since this
method helps the researcher to understand the problem deeply by using closed-ended
measures and open-ended observations (Creswell, 2003). The information of farmers about
organic farming practices, product selling, and productivity, profit and food security was
collected through a structured questionnaire. Copies of the questionnaire were administered
by the researcher to the households.
The information about communities’ attitude towards organic products was collected
through another type of questionnaire for customers who went to normal market places and
occasional customers who often went to an organic shop. The organic shop established by
SAT in Morogoro town and Soko Kubwa (literally means a big market place) were chosen
29
to administer the questionnaire. In order to obtain information about organic farmers’
challenges, focus group discussions (FGDs) were conducted.
A total of 3 focus groups were selected from 3 villages with different environmental
conditions. In each of the focus groups, the number of discussants was about 8, which was
in line with the suggestion by Morgan (1998 cited by Bryman, 2004) that a typical focus
group size should have 6 to 10 members. The explanation for this is that with fewer
discussants difficult topics may not be discussed effectively, while with more discussants
some participants do not give their opinions. Available organic farmers were selected
purposively as participants of the FDGs. The discussions were conducted using open-ended
questions, and audio-recording was done after getting consent of the participants in the
research. The discussion topics mainly focused on reasons to start organic farming,
strengths of organic farming and difficulties of conducting organic farming.
3.5 Data Analysis
Questions about organic farming practices and products selling were asked through the
questionnaire copies to know their ways of farming and selling. Frequencies and
percentages were used to summarise the data. Adoption of 9 selected farming practices
(See Table 1) was assessed through the structured questionnaire in order to assess adoption
level of organic farming practices. The responses were separated into: i) In use of practice
now and ii) Not in use of practice now. The frequencies and percentages of adoption for
each farming practice were compared between two faring groups. For calculation of overall
adoption of organic farming practices, the responses were scored as shown in Table 2, and
the total scores were compared using independent samples T test.
30
Table 1: Selected farming practices for assessment of adoption of farming practices
for assessment of adoption of organic farming practices
Selected practices Explanation of each practices
Chemical fertilizers Using synthetic fertilizers which provide certain nutrients into
soil.
Chemical pesticides Spraying synthetic pesticides which decrease pests coming to
eat crops.
Organic fertilizers Using natural materials such as animal waste, plants and farm
waste on a farm for improving soil nutrients.
Organic pesticides Using plants or trees which have strong smell in order to avoid
pests coming to eat crops.
Crop rotation Growing a series of dissimilar types of crops in the same area in
sequential seasons in order to avoid excessive depletion of soil
nutrients.
Intercropping Planting several crops together on the same land in order to
avoid whole land damage by a certain type of pest and
excessive depletion of soil.
Terracing Creating terraces on a hill to control nutrients’ leaching and soil
erosion.
Mulching Placing loose materials such as dry grasses or leaves around
plant stems to protect soil from over-drying and to improve soil
structure.
Cover crops Growing crops which cover soil such as legumes in order to
improve soil’s health.
Productivity levels of crops grown by both farming groups were compared by using
independent samples T test. The top three crops of maize, cow peas and pumpkins were
chosen. Means of productivity of those crops per 1 ha were compared by using independent
samples T test. Profit was calculated in order to compare between organic farmers and
conventional/traditional farmers. Profit was calculated as follows:
Profit = Gross income – Total costs
Gross income was total sales from crop products. Total costs were total expenditure on land

31
clearance, seeds, farm equipment, manure application, fertilizer application, pesticide
application, wage of labourers, transportation for selling and land rental fees.
Table 2: Score for calculation of adoption of organic farming practices
Farming practice Score
In use Not in use
Chemical fertilizers -1 1
Chemical pesticides -1 1
Organic fertilizers 1 0
Organic pesticides 1 0
Crop rotation 1 0
Intercropping 1 0
Terracing 1 0
Mulching 1 0
Cover crops 1 0
Food security was analysed with indicators of food consumption score, dietary energy
consumed and percentage of expenditure on food. In this paper, the word “food security”
is used as food security at the household level, and distinguishes from national food
security. Food consumption score is defined as “a composite score based on dietary
diversity, food frequency, and relative nutritional importance of different food groups”
(WFP, 2008). Each respondent was asked about food items consumed at home over a period
of previous 7 days. Food items were grouped into 10 food groups with weights assigned for
each group (See Table 3).

32
Table 3: Food consumption score
Source: Compiled from literature including WFP (2008) and Vhurumuku (2014)
Food consumption score was calculated as follows:
FCS = acerealsxcereals + atubersxtubers + apulsesxpulses + avegetablesxvegetables +afruitsxfruits + ameat and
fishxmeat and fish + amilkxmilk + asugarxsugar + aoilxoil + acondimentsxcondiments
Where FCS = Food consumption score
a = Frequencies of food group consumed during the previous 7 days
x = Weight of each food group
(WFP, 2008)
According to WFP (2008), the calculated scores were categorized as poor food
consumption if the score was 0 – 28, borderline food consumption if the score was 28.5 -
42, and acceptable food consumption if the score was more than 42.
The data of items and weight of food consumed by each household over a period of
previous 7 days was used to calculate kCal. Food consumption table by Lukmanji and
Hertzmark (2008) was used to obtain the kCal of each food item and dish. Dietary energy
consumed was calculated per adult equivalent per day. Each household member was
Food group Food items Weight
1 Cereals Maize, maize porridge, rice, sorghum, millet, pasta and
bread
2
2 Tubers Cassava and potatoes 2
3 Pulses Beans, peas, groundnuts and cashew nuts 3
4 Vegetables Vegetables and leaves 1
5 Fruits Fruit 1
6 Meat and fish Beef, goat, poultry, pork, eggs and fish 4
7 Milk Milk, yogurt and other dairy 4
8 Sugar Sugar and sugar products 0.5
9 Oil Oils, fats and butter 0.5
10 Condiments Condiments 0
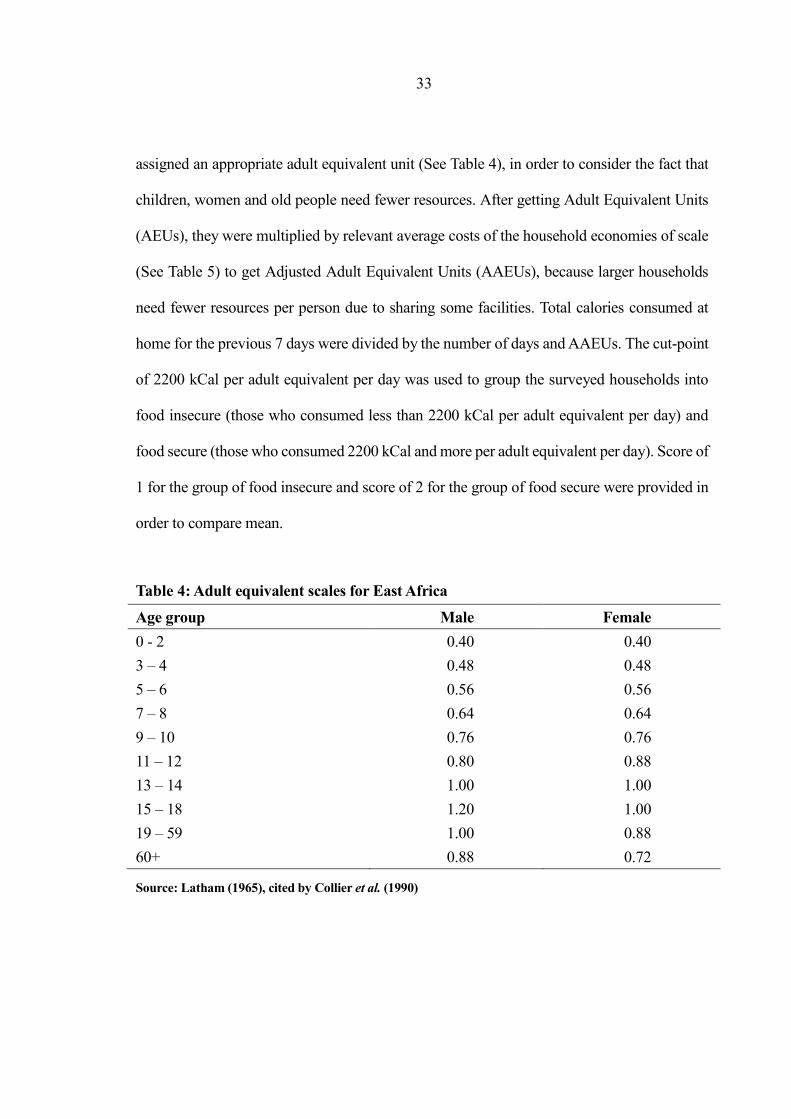
33
assigned an appropriate adult equivalent unit (See Table 4), in order to consider the fact that
children, women and old people need fewer resources. After getting Adult Equivalent Units
(AEUs), they were multiplied by relevant average costs of the household economies of scale
(See Table 5) to get Adjusted Adult Equivalent Units (AAEUs), because larger households
need fewer resources per person due to sharing some facilities. Total calories consumed at
home for the previous 7 days were divided by the number of days and AAEUs. The cut-point
of 2200 kCal per adult equivalent per day was used to group the surveyed households into
food insecure (those who consumed less than 2200 kCal per adult equivalent per day) and
food secure (those who consumed 2200 kCal and more per adult equivalent per day). Score of
1 for the group of food insecure and score of 2 for the group of food secure were provided in
order to compare mean.
Table 4: Adult equivalent scales for East Africa
Age group Male Female
0 - 2 0.40 0.40
3 – 4 0.48 0.48
5 – 6 0.56 0.56
7 – 8 0.64 0.64
9 – 10 0.76 0.76
11 – 12 0.80 0.88
13 – 14 1.00 1.00
15 – 18 1.20 1.00
19 – 59 1.00 0.88
60+ 0.88 0.72
Source: Latham (1965), cited by Collier et al. (1990)

34
Table 5: Household economies of scale
Number of adults Marginal cost Average cost
1 1.000 1.000
2 0.892 0.946
3 0.798 0.897
4 0.713 0.851
5 0.632 0.807
6 0.632 0.778
7 0.632 0.757
8 0.632 0.741
9 0.632 0.729
10≤ 0.632 0.719
Source: Deaton (1980), cited by Collier et al. (1990)
About percentage of expenditure on food, total expenditure per household was calculated
by asking the amount of money they had spent during the previous month on food, farm,
medical care, education6, electricity, water, fuels, taxes and housing. Percentage of
expenditure on food was calculated as follows:
Percentage of expenditure on food =
×100
Households spending more than 75% of their total expenditure on food are defined that
their food insecure level is very high. High food insecurity is denoted by 65 – 75%
expenditure on food, while 50 – 65% indicates moderate food insecurity, and 50% indicates
low food insecurity(Smith and Subandoro, 2007)
Multiple linear regression was used to determine impacts of some variables on productivity,
profit and food security among organic farmers and conventional/traditional farmers. The
regression was run with 13 independent variables for each of the dependent variables. The
model was specified as follows:
6 Education cost was calculated by dividing annual costs by 12 to get the costs per month.
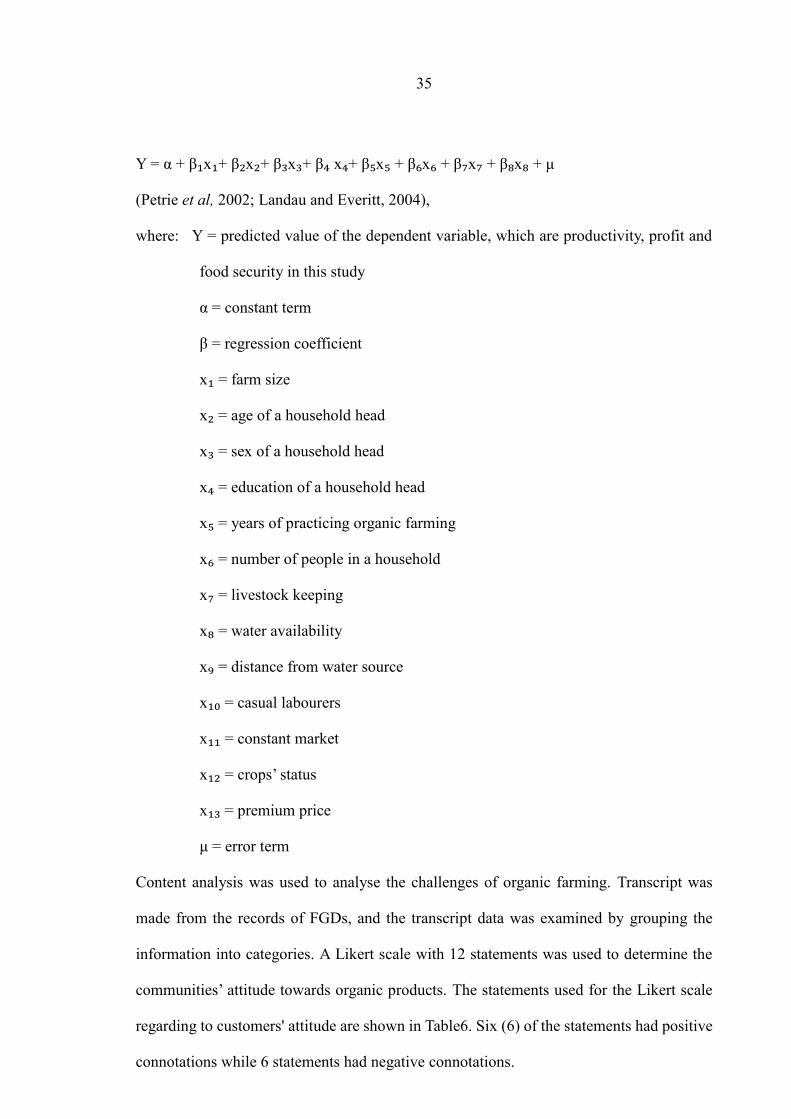
35
Y = α + β₁x₁+ β₂x₂+ β₃x₃+ β₄ x₄+ β₅x₅ + β₆x₆ + β₇x₇ + β₈x₈ + μ
(Petrie et al, 2002; Landau and Everitt, 2004),
where: Y = predicted value of the dependent variable, which are productivity, profit and
food security in this study
α = constant term
β = regression coefficient
x₁ = farm size
x₂ = age of a household head
x₃ = sex of a household head
x₄ = education of a household head
x₅ = years of practicing organic farming
x₆ = number of people in a household
x₇ = livestock keeping
x₈ = water availability
x₉ = distance from water source
x₁₀ = casual labourers
x₁₁ = constant market
x₁₂ = crops’ status
x₁₃ = premium price
μ = error term
Content analysis was used to analyse the challenges of organic farming. Transcript was
made from the records of FGDs, and the transcript data was examined by grouping the
information into categories. A Likert scale with 12 statements was used to determine the
communities’ attitude towards organic products. The statements used for the Likert scale
regarding to customers' attitude are shown in Table6. Six (6) of the statements had positive
connotations while 6 statements had negative connotations.

36
Table 6: Questions regarding customers’ attitude
Aspect Connotation Statement
Socio-cultural
aspects
1 +
There are organic farmers in your area
2 +
When buying food products, considering the process
how the products were grown
3 +
You want to eat (or want your family eat) healthy
food
4 + Preferring organic products to normal products
Economic aspects 5 - Prices of organic products are not reasonable
6 - Prices of organic products are not affordable
7 +
Organic products are worth of buying regardless its
price
8 +
When getting extra money for food, you want to
change crop products to organic
9
-
When getting extra money for food, you want to buy
something which is not crop products (such as meat
and fish)
10 -
When getting extra money, budget of food is not the
first to increase
11 -
When buying food products, price is the most
important thing to consider
12 -
Quantity of food is more important than quality of
food
For each of the 12 statements, the respondents were asked to respond Not at all = 1, Not
really = 2, Undecided = 3, somewhat= 4, or Very much = 5.The scores were grouped into
favourable, neutral and unfavourable. Favourable attitude was denoted by the score of more
than 37, while 36 indicated a neutral attitude, and the score which was less than 35
indicated unfavourable attitude. Independent samples T test was used to determine whether
there were significant differences in scores on Likert scale between customers of normal
market places and customers of an organic shop.
37
3.6 Limitations of the Study
There were language barriers since the researcher is not a native user of the Swahili
language. During data collection, translators were needed to proceed with FGDs. This
might have broken atmosphere to get more information from the participants since the
process of using a translator sometimes stopped a flow of the FDGs. Moreover, the
situation that the researcher sometimes could not talk directly to the participants may have
caused difficulties to make good atmosphere that the farmers could speak comfortably.
Some information became difficult to identify if it was attributed to organic farming or not,
since longitudinal research questions were not prepared. For instance, the differences of
selling situation between organic farmers and conventional/traditional farmers would have
been explained more clearly if comparison of before and after starting organic farming had
been done.
There were limitations of accuracy of collected data about farmers, since information is
based on their memories. Especially information of productivity and profit was asked about
the year of 2013. This might have some misinformation.
With regard to information of productivity, accuracy would have been improved if the
situation of intercropping had been considered. Since many farmers were intercropping in
the same field, farm size for each crop should have been calculated by considering how
many crops and what kinds of crops were intercropped in the same farm. Moreover, data
which show whether or not methods of organic farming were applied to certain crops would
have brought deeper discussions.
Communities' attitude towards organic products was analysed in this study with a final
sample of 32 customers of a normal market place and 18 customers of an organic shop.
38
Since there were more occasional customers of the organic shop, this analysis would have
been better if the study had involved all customers. In addition, it was realized that some
statements used for the Likert scale were not well answered by people who did not know
organic products. Since it decreased the number of sample of the normal market place for
some statements, the results for some statements came only from the views of people who
knew or had heard of organic products. The statements which could be answered by every
people should have been made in order to gain more overall insight including various
people’s opinions.

39
CHAPTER FOUR
4.0 RESULTS AND DISCUSSION
4.1 Socio-Demographic Characteristics of the Respondents
The socio-demographic characteristics of the smallholder farmers’ households are
summarized in Table 7. More than 60% of the households had 4 up to 7 members living
together, and more than two-thirds of the households were male-headed. The majority of
the household heads had ages ranging from 31 to70. The highest education level of a
household head shows that more than 60% of household heads interviewed had primary
education. More than 90% of household heads of the surveyed households were producing
crops as their main occupation. The proportion of people having salaried employment
shows that more than 80% of households in the study areas did not have any person having
employment. The proportion of the households with people having a side business was
more than one-third.
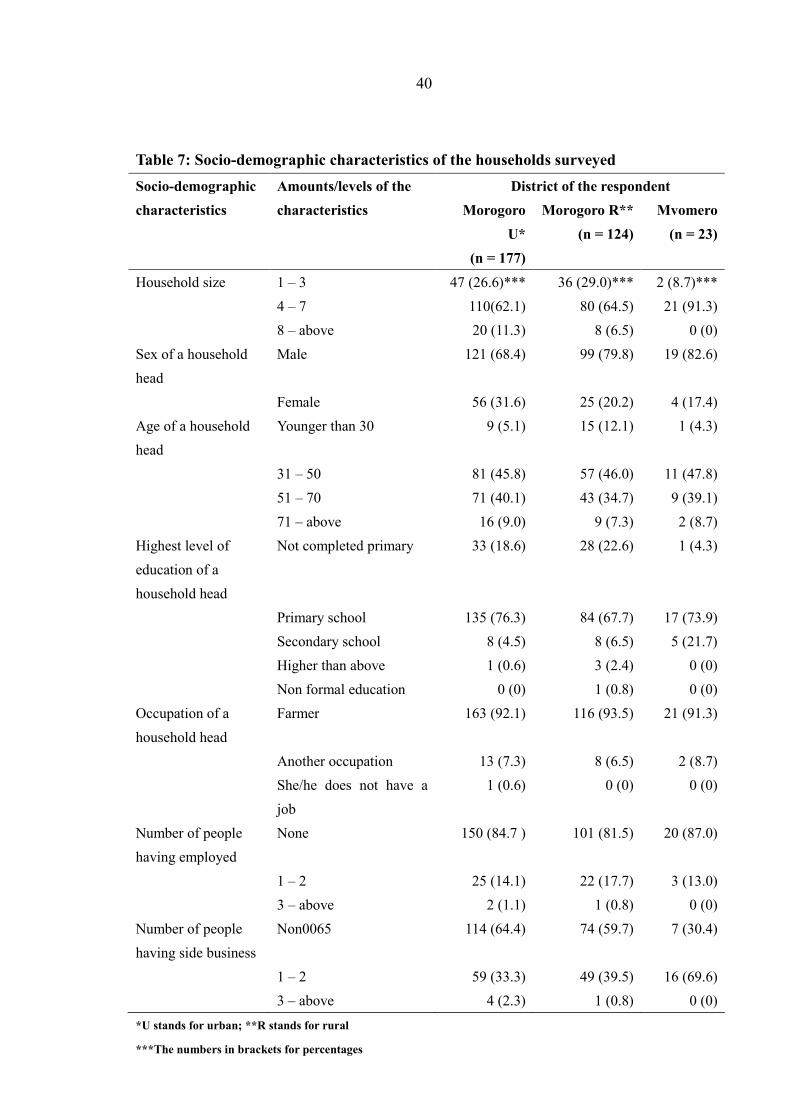
40
Table 7: Socio-demographic characteristics of the households surveyed
Socio-demographic
characteristics
Amounts/levels of the
characteristics
District of the respondent
Morogoro
U*
(n = 177)
Morogoro R**
(n = 124)
Mvomero
(n = 23)
Household size 1 – 3 47 (26.6)*** 36 (29.0)*** 2 (8.7)***
4 – 7 110(62.1) 80 (64.5) 21 (91.3)
8 – above 20 (11.3) 8 (6.5) 0 (0)
Sex of a household
head
Male 121 (68.4) 99 (79.8) 19 (82.6)
Female 56 (31.6) 25 (20.2) 4 (17.4)
Age of a household
head
Younger than 30 9 (5.1) 15 (12.1) 1 (4.3)
31 – 50 81 (45.8) 57 (46.0) 11 (47.8)
51 – 70 71 (40.1) 43 (34.7) 9 (39.1)
71 – above 16 (9.0) 9 (7.3) 2 (8.7)
Highest level of
education of a
household head
Not completed primary 33 (18.6) 28 (22.6) 1 (4.3)
Primary school 135 (76.3) 84 (67.7) 17 (73.9)
Secondary school 8 (4.5) 8 (6.5) 5 (21.7)
Higher than above 1 (0.6) 3 (2.4) 0 (0)
Non formal education 0 (0) 1 (0.8) 0 (0)
Occupation of a
household head
Farmer 163 (92.1) 116 (93.5) 21 (91.3)
Another occupation 13 (7.3) 8 (6.5) 2 (8.7)
She/he does not have a
job
1 (0.6) 0 (0) 0 (0)
Number of people
having employed
None 150 (84.7 ) 101 (81.5) 20 (87.0)
1 – 2 25 (14.1) 22 (17.7) 3 (13.0)
3 – above 2 (1.1) 1 (0.8) 0 (0)
Number of people
having side business
Non0065 114 (64.4) 74 (59.7) 7 (30.4)
1 – 2 59 (33.3) 49 (39.5) 16 (69.6)
3 – above 4 (2.3) 1 (0.8) 0 (0)
*U stands for urban; **R stands for rural
***The numbers in brackets for percentages
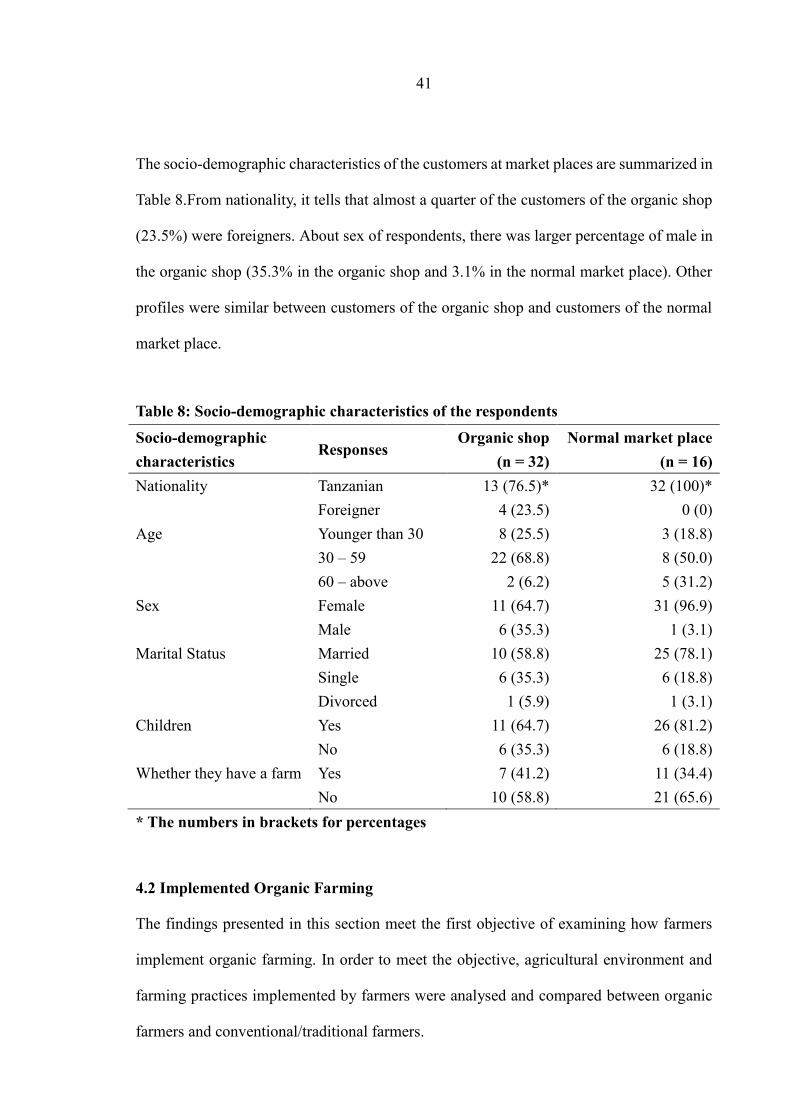
41
The socio-demographic characteristics of the customers at market places are summarized in
Table 8.From nationality, it tells that almost a quarter of the customers of the organic shop
(23.5%) were foreigners. About sex of respondents, there was larger percentage of male in
the organic shop (35.3% in the organic shop and 3.1% in the normal market place). Other
profiles were similar between customers of the organic shop and customers of the normal
market place.
Table 8: Socio-demographic characteristics of the respondents
Socio-demographic
characteristics Responses
Organic shop
(n = 32)
Normal market place
(n = 16)
Nationality Tanzanian 13 (76.5)* 32 (100)*
Foreigner 4 (23.5) 0 (0)
Age Younger than 30 8 (25.5) 3 (18.8)
30 – 59 22 (68.8) 8 (50.0)
60 – above 2 (6.2) 5 (31.2)
Sex Female 11 (64.7) 31 (96.9)
Male 6 (35.3) 1 (3.1)
Marital Status Married 10 (58.8) 25 (78.1)
Single 6 (35.3) 6 (18.8)
Divorced 1 (5.9) 1 (3.1)
Children Yes 11 (64.7) 26 (81.2)
No 6 (35.3) 6 (18.8)
Whether they have a farm Yes 7 (41.2) 11 (34.4)
No 10 (58.8) 21 (65.6)
* The numbers in brackets for percentages
4.2 Implemented Organic Farming
The findings presented in this section meet the first objective of examining how farmers
implement organic farming. In order to meet the objective, agricultural environment and
farming practices implemented by farmers were analysed and compared between organic
farmers and conventional/traditional farmers.

42
4.2.1 Agricultural Environment
Crops grown by farmers in the study areas were categorized into seven crop groups of
cereals, vegetables, tubers, pulses and seeds, fruits, and cash crops. Numerous types of
vegetables were grown, but many of them were only grown by organic farmers and not by
conventional/traditional farmers. Most of cash crops were also grown by only organic
farmers. They grew various spices and coffee beans. Among the crops, the top three crops
grown by both organic farmers and conventional/traditional farmers were maize, cow peas
and pumpkins (See Table9). Those three crops were the crops grown most by both of
organic farmers and conventional/traditional farmers, but there were other crops grown by
a large proportion of organic farmers such as cassava (51.2%), banana (63.1%), beans
(53.8%) and Chinese cabbage (41.2%). The average number of crops grown by organic
farmers was 8.54 while that of the crops grown by conventional/traditional farmers
was4.70. It was revealed that organic farmers covered a variety of crops while
conventional/traditional farmers were mainly growing: maize, cow peas and pumpkins.
Table 9: Crops grown by more than half of each farming group
Crop Organic farmers
(n = 160)
Conventional/traditional
farmers
(n = 164)
Maize 143 (89.4)* 163 (99.4)*
Cow peas 88 (55.0) 107 (65.2)
Pumpkins 102 (63.8) 102 (62.2)
* The numbers in brackets for percentages
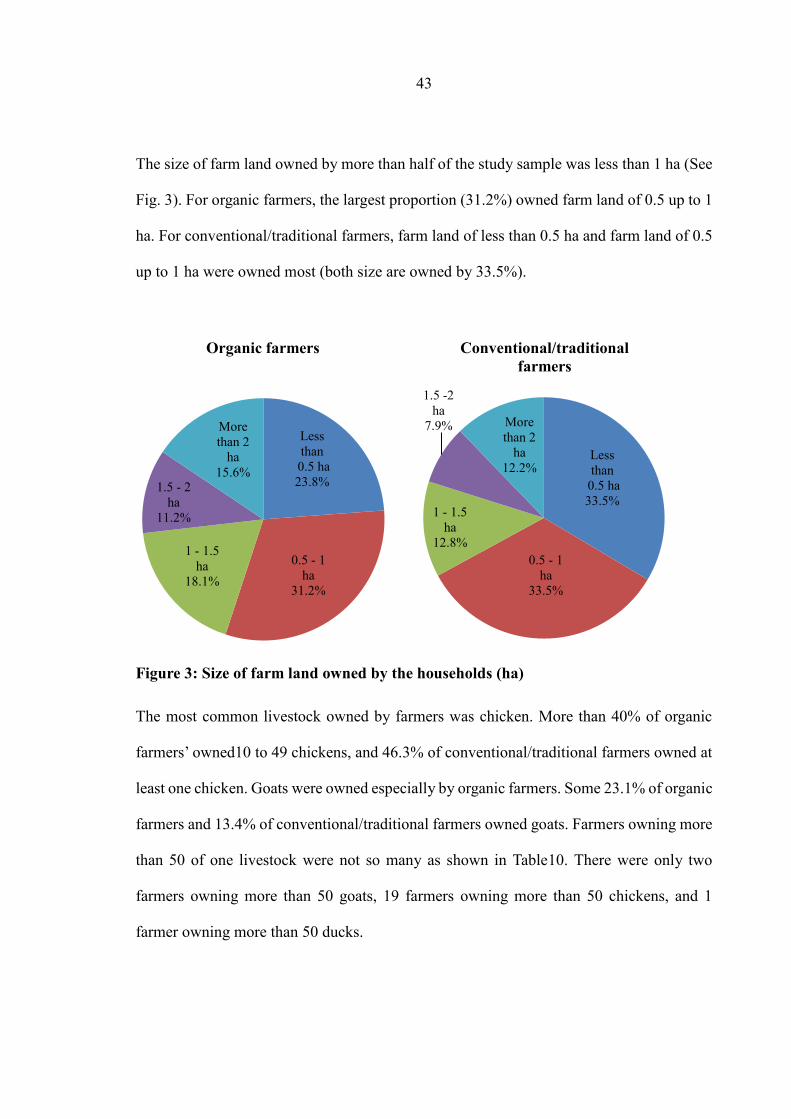
43
The size of farm land owned by more than half of the study sample was less than 1 ha (See
Fig. 3). For organic farmers, the largest proportion (31.2%) owned farm land of 0.5 up to 1
ha. For conventional/traditional farmers, farm land of less than 0.5 ha and farm land of 0.5
up to 1 ha were owned most (both size are owned by 33.5%).
Figure 3: Size of farm land owned by the households (ha)
The most common livestock owned by farmers was chicken. More than 40% of organic
farmers’ owned10 to 49 chickens, and 46.3% of conventional/traditional farmers owned at
least one chicken. Goats were owned especially by organic farmers. Some 23.1% of organic
farmers and 13.4% of conventional/traditional farmers owned goats. Farmers owning more
than 50 of one livestock were not so many as shown in Table10. There were only two
farmers owning more than 50 goats, 19 farmers owning more than 50 chickens, and 1
farmer owning more than 50 ducks.
Less
than
0.5 ha
23.8%
0.5 - 1
ha
31.2%
1 - 1.5
ha
18.1%
1.5 - 2
ha
11.2%
More
than 2
ha
15.6%
Organic farmers
Less
than
0.5 ha
33.5%
0.5 - 1
ha
33.5%
1 - 1.5
ha
12.8%
1.5 -2
ha
7.9% More
than 2
ha
12.2%
Conventional/traditional
farmers
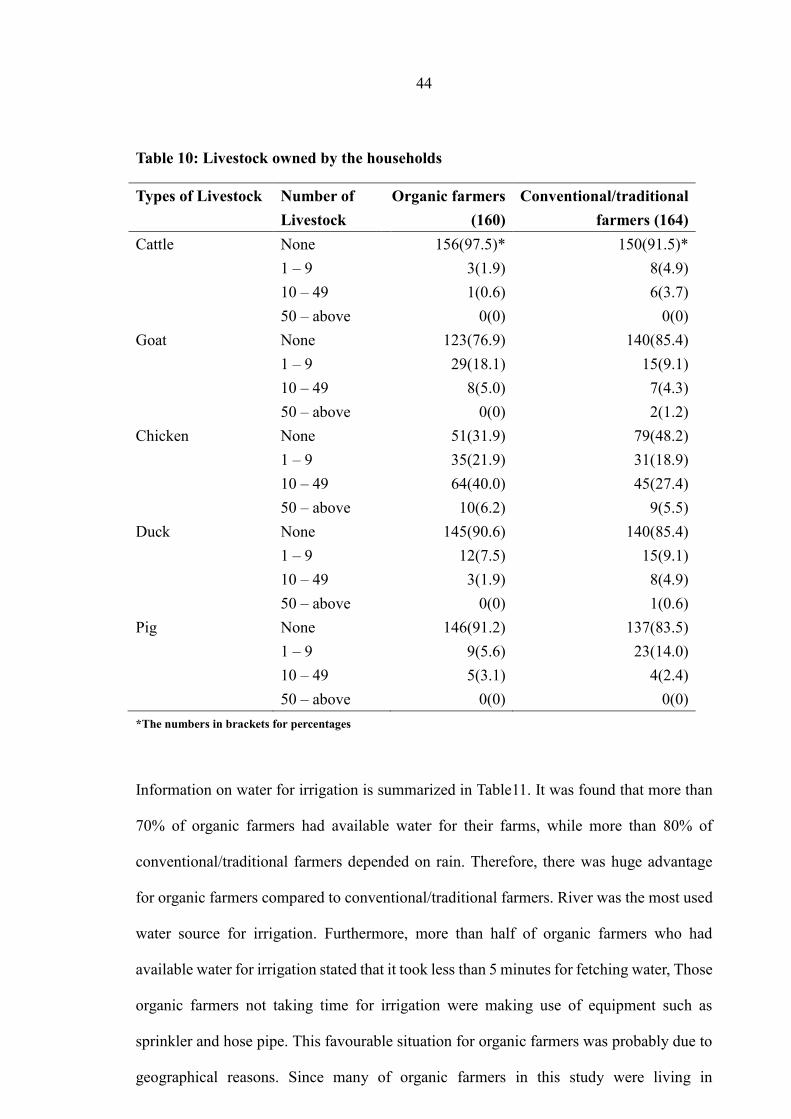
44
Table 10: Livestock owned by the households
Types of Livestock Number of
Livestock
Organic farmers
(160)
Conventional/traditional
farmers (164)
Cattle None 156(97.5)* 150(91.5)*
1 – 9 3(1.9) 8(4.9)
10 – 49 1(0.6) 6(3.7)
50 – above 0(0) 0(0)
Goat None 123(76.9) 140(85.4)
1 – 9 29(18.1) 15(9.1)
10 – 49 8(5.0) 7(4.3)
50 – above 0(0) 2(1.2)
Chicken None 51(31.9) 79(48.2)
1 – 9 35(21.9) 31(18.9)
10 – 49 64(40.0) 45(27.4)
50 – above 10(6.2) 9(5.5)
Duck None 145(90.6) 140(85.4)
1 – 9 12(7.5) 15(9.1)
10 – 49 3(1.9) 8(4.9)
50 – above 0(0) 1(0.6)
Pig None 146(91.2) 137(83.5)
1 – 9 9(5.6) 23(14.0)
10 – 49 5(3.1) 4(2.4)
50 – above 0(0) 0(0)
*The numbers in brackets for percentages
Information on water for irrigation is summarized in Table11. It was found that more than
70% of organic farmers had available water for their farms, while more than 80% of
conventional/traditional farmers depended on rain. Therefore, there was huge advantage
for organic farmers compared to conventional/traditional farmers. River was the most used
water source for irrigation. Furthermore, more than half of organic farmers who had
available water for irrigation stated that it took less than 5 minutes for fetching water, Those
organic farmers not taking time for irrigation were making use of equipment such as
sprinkler and hose pipe. This favourable situation for organic farmers was probably due to
geographical reasons. Since many of organic farmers in this study were living in

45
mountainous areas, they were able to make advantages of existence of rivers there.
Moreover, it seems that organic farming organizations chose good localities with good
water sources for starting up organic farming training. Mountainous areas are among
disadvantaged areas from the views of transportation and marketing, but this geography
brought benefit of water availability for irrigation in organic farming.
Table 11: Information of water for irrigation
Information of water for
irrigation
Organic farmers
Conventional/traditional farmers
Water availability (n = 160) (n = 164)
Available 114(71.2)* 16 (9.8)*
Depends on a farm 10 (6.2) 6 (3.7)
Depends on rain 36 (22.5) 142 (86.6)
Water source (n = 124) (n = 22)
River 117 (94.4)* 12 (54.5)
Lower land 2 (1.6) 4 (18.2)
Tap water 3 (2.4) 2 (9.1)
Dam 0 (0) 1 (4.5)
Well 2 (1.6) 3 (13.6)
Time required for fetching
water
(n = 123) (n = 20)
Less than 5 mins 102 (63.8)* 13 (7.9)*
Less than 30 mins 18 (11.2) 5 (3.0)
More than 30 mins 3 (1.9) 2 (1.2)
* The numbers in brackets for percentages
Information on labourer is presented in Table 12. The Table shows that about half of both
farming groups hired labourers, and there were no farmers employing permanent labourers.
More than four-fifths of farmers employed labourers for less than one week (84.4% of
organic farmers and 84.8% of conventional/traditional farmers). One up to five labourers
was the most common number to employ, and expenditure on labourers of less than TZS
100,000 was the most common. Since target farmers are smallholder farmers, more than
80% of whom own less than 2 ha; labourers are usually needed only during farm land
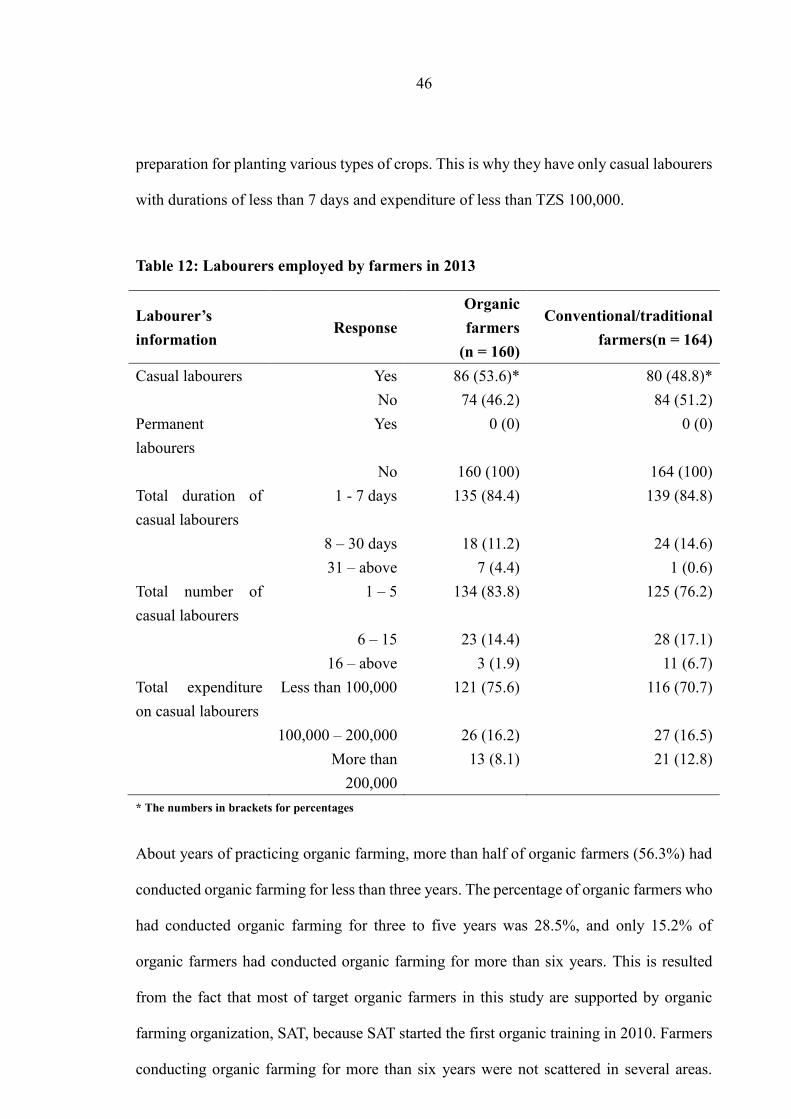
46
preparation for planting various types of crops. This is why they have only casual labourers
with durations of less than 7 days and expenditure of less than TZS 100,000.
Table 12: Labourers employed by farmers in 2013
Labourer’s
information Response
Organic
farmers
(n = 160)
Conventional/traditional
farmers(n = 164)
Casual labourers Yes 86 (53.6)* 80 (48.8)*
No 74 (46.2) 84 (51.2)
Permanent
labourers
Yes 0 (0) 0 (0)
No 160 (100) 164 (100)
Total duration of
casual labourers
1 - 7 days 135 (84.4) 139 (84.8)
8 – 30 days 18 (11.2) 24 (14.6)
31 – above 7 (4.4) 1 (0.6)
Total number of
casual labourers
1 – 5 134 (83.8) 125 (76.2)
6 – 15 23 (14.4) 28 (17.1)
16 – above 3 (1.9) 11 (6.7)
Total expenditure
on casual labourers
Less than 100,000 121 (75.6) 116 (70.7)
100,000 – 200,000 26 (16.2) 27 (16.5)
More than
200,000
13 (8.1) 21 (12.8)
* The numbers in brackets for percentages
About years of practicing organic farming, more than half of organic farmers (56.3%) had
conducted organic farming for less than three years. The percentage of organic farmers who
had conducted organic farming for three to five years was 28.5%, and only 15.2% of
organic farmers had conducted organic farming for more than six years. This is resulted
from the fact that most of target organic farmers in this study are supported by organic
farming organization, SAT, because SAT started the first organic training in 2010. Farmers
conducting organic farming for more than six years were not scattered in several areas.
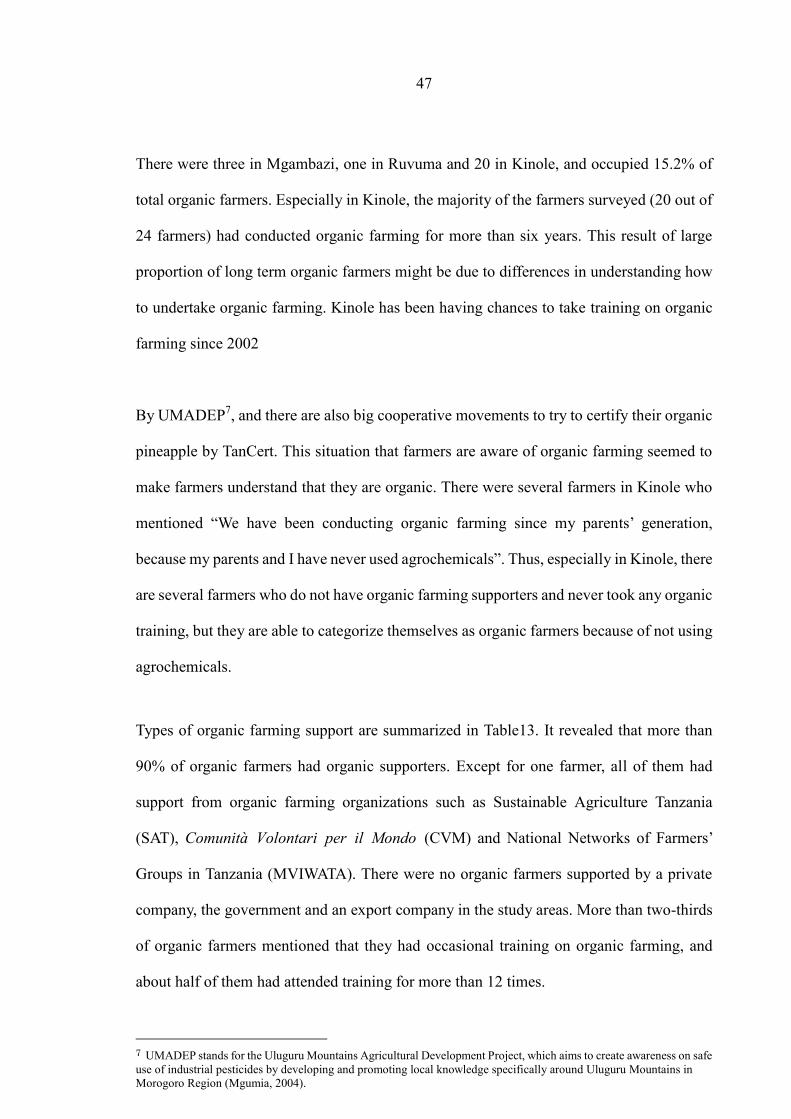
47
There were three in Mgambazi, one in Ruvuma and 20 in Kinole, and occupied 15.2% of
total organic farmers. Especially in Kinole, the majority of the farmers surveyed (20 out of
24 farmers) had conducted organic farming for more than six years. This result of large
proportion of long term organic farmers might be due to differences in understanding how
to undertake organic farming. Kinole has been having chances to take training on organic
farming since 2002
By UMADEP7, and there are also big cooperative movements to try to certify their organic
pineapple by TanCert. This situation that farmers are aware of organic farming seemed to
make farmers understand that they are organic. There were several farmers in Kinole who
mentioned “We have been conducting organic farming since my parents’ generation,
because my parents and I have never used agrochemicals”. Thus, especially in Kinole, there
are several farmers who do not have organic farming supporters and never took any organic
training, but they are able to categorize themselves as organic farmers because of not using
agrochemicals.
Types of organic farming support are summarized in Table13. It revealed that more than
90% of organic farmers had organic supporters. Except for one farmer, all of them had
support from organic farming organizations such as Sustainable Agriculture Tanzania
(SAT), Comunità Volontari per il Mondo (CVM) and National Networks of Farmers’
Groups in Tanzania (MVIWATA). There were no organic farmers supported by a private
company, the government and an export company in the study areas. More than two-thirds
of organic farmers mentioned that they had occasional training on organic farming, and
about half of them had attended training for more than 12 times.
7 UMADEP stands for the Uluguru Mountains Agricultural Development Project, which aims to create awareness on safe
use of industrial pesticides by developing and promoting local knowledge specifically around Uluguru Mountains in
Morogoro Region (Mgumia, 2004).

48
Table 13: Organic farming support
Organic farming support Percentage
Whether they have organic farming supporters(n = 160) 145 (90.6)
Organic farming supporters (n = 145)
Organic farming organization 144 (99.3)*
Private company 0 (0)
Government 0 (0)
Export company 0 (0)
Individual farmers 2 (1.4)*
Whether they have occasional training on organic farming (n
= 160)
111 (69.4)
Number of times they attended training within a year(n = 111)
More than 12 times 54 (48.6)
More than 3 times 28 (25.2)
Less than twice 29 (26.1)
*Farmers were able to choose more than one answer. One farmer had support from organic farming organization
and an individual farmer. Hence, total percentage exceeds 100%
Farm equipment used (Fig. 4) shows that the most common farm equipment used were a
hand hoe and a machete. Equipment for irrigation such as manual sprinkler, automatic
sprinkler, and plastic bucket and hose pipe was highly used by organic farmers compared to
conventional/traditional farmers. More than one-third of organic farmers (36.2%) used
manual sprinklers while only 1.8% of conventional/traditional farmers used it. Automatic
sprinkler was used by 11.9% of organic farmers, but there was no conventional/traditional
farmers using it. On the other hand, tractor was used more by conventional/traditional
farmers. There were only 6.2% of organic farmers using tractor while there were 36.6% of
conventional/traditional farmers using tractor.
Differences in uses of farm equipment could result from differences in cropping style and
existence of organic farming supporters. Many of conventional/traditional farmers grew
very few crops, and their top three crops grown were maize, cow peas and pumpkins with
percentages of 99.4%, 65.2% and 62.2% respectively. Those three crops are in most cases
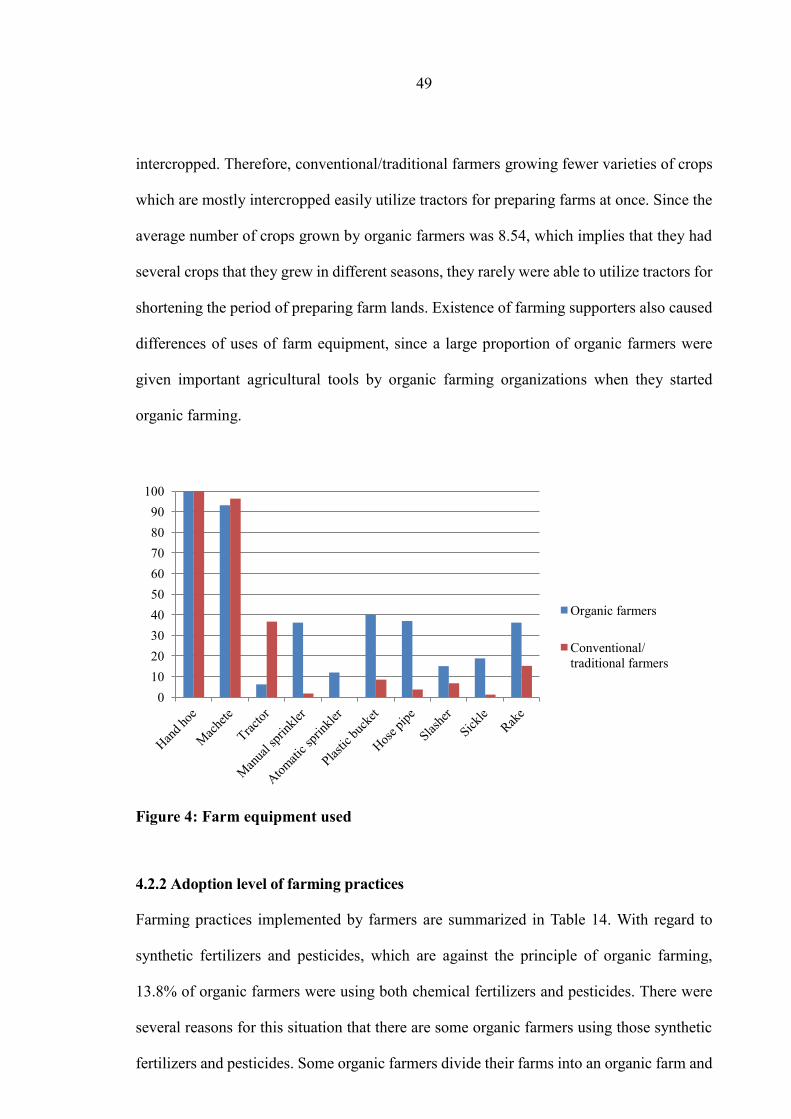
49
intercropped. Therefore, conventional/traditional farmers growing fewer varieties of crops
which are mostly intercropped easily utilize tractors for preparing farms at once. Since the
average number of crops grown by organic farmers was 8.54, which implies that they had
several crops that they grew in different seasons, they rarely were able to utilize tractors for
shortening the period of preparing farm lands. Existence of farming supporters also caused
differences of uses of farm equipment, since a large proportion of organic farmers were
given important agricultural tools by organic farming organizations when they started
organic farming.
Figure 4: Farm equipment used
4.2.2 Adoption level of farming practices
Farming practices implemented by farmers are summarized in Table 14. With regard to
synthetic fertilizers and pesticides, which are against the principle of organic farming,
13.8% of organic farmers were using both chemical fertilizers and pesticides. There were
several reasons for this situation that there are some organic farmers using those synthetic
fertilizers and pesticides. Some organic farmers divide their farms into an organic farm and
0
10
20
30
40
50
60
70
80
90
100
Organic farmers
Conventional/
traditional farmers
50
conventional farm such as some organic farmers of Langali village in Mvomero district and
Kireka village in Morogoro Municipality. One old man conducting organic farming in
Langali village said that “When we started organic farming as a group, I made one of my
farms as an organic farm for family uses, because I want my family to eat non-harmful food.
I left other farms as conventional for commercial uses”. One young girl in Kireka village
mentioned that “My family is not applying organic farming to a maize farm, because
organic farming works well for a vegetable farm. We were taught so by CVM (which is
their supporter)”. In another case, some organic farmers learnt organic farming in a group
farm, but they had not applied it to their family farm yet.
In a group of conventional/traditional farmers, 21.3% used those chemical fertilizers and
pesticides. This result proved that many of conventional/traditional farmers do not use
agrochemicals as researched in national statistics. According to NBS (2012), only 7.2% of
the total area planted was applied with chemical fertilizers in Tanzania Mainland. The low
per cent of uses agrochemicals by conventional/traditional farmers which was 21.3% tells
that most of the conventional/traditional farmers targeted in this study were traditional
farmers who did not utilize synthetic fertilizers and pesticides. This is why in this
dissertation farmers are categorized into organic farmers and “conventional/traditional
farmers”.
Big differences were seen in the use of organic fertilizers and organic pesticides. Over 90%
of organic farmers used organic fertilizers, and 71.9% used organic pesticides. On the other
hand, conventional/traditional farmers using organic fertilizers and pesticides were 35.4%
and 3.0% respectively. The uses of crop rotation, terracing and mulching also showed
differences between them. The results in Table 19 show that 81.9% of organic farmers used

51
crop rotation while 25.6% of conventional/traditional farmers used this farming practice.
For terracing, 63.1% of organic farmers used it while 34.1% of conventional/traditional
farmers used it. Mulching was used by 81.2% of organic farmers and 19.5% of
conventional/traditional farmers. There were not so big differences in the uses of
intercropping and cover crops even though the percentage of organic farmers was slightly
higher. Both of the farming groups applied those two practices at high percentages.
Conventional/traditional farmers’ high adaptation level of the two farming practices may
have resulted from the trend of the crops grown. The top three crops grown by both organic
farmers and conventional/traditional farmers were maize, cow peas and pumpkins, and
many farmers tended to intercrop those crops. This trend of crops grown explains small
differences in percentages of the used of intercropping and cover crops.
Table 14: The use of farming practices among the farmers
Farming practices Organic farmers
(n = 160)(%)
Conventional/traditional
farmers
(n = 164)(%)
Chemical fertilizers 13.8 21.3
Chemical pesticides 13.8 21.3
Organic fertilizers 90.0 35.4
Organic pesticides 71.9 3.0
Crop rotation 81.9 25.6
Intercropping 75.0 74.4
Terracing 63.1 34.1
Mulching 81.2 19.5
Cover crops 88.8 78.0
Scores of overall adaptation of organic farming practices are summarized in Table 15. The
minimum score was 2 from organic farmers and -1 from conventional/traditional farmers.
The maximum score was 9 from organic farmers and 8 from conventional/traditional
farmers. The mean scores showed big difference; organic farmers had a mean of 6.97 while
conventional/traditional farmers had 3.85. The score on overall adaptation of organic
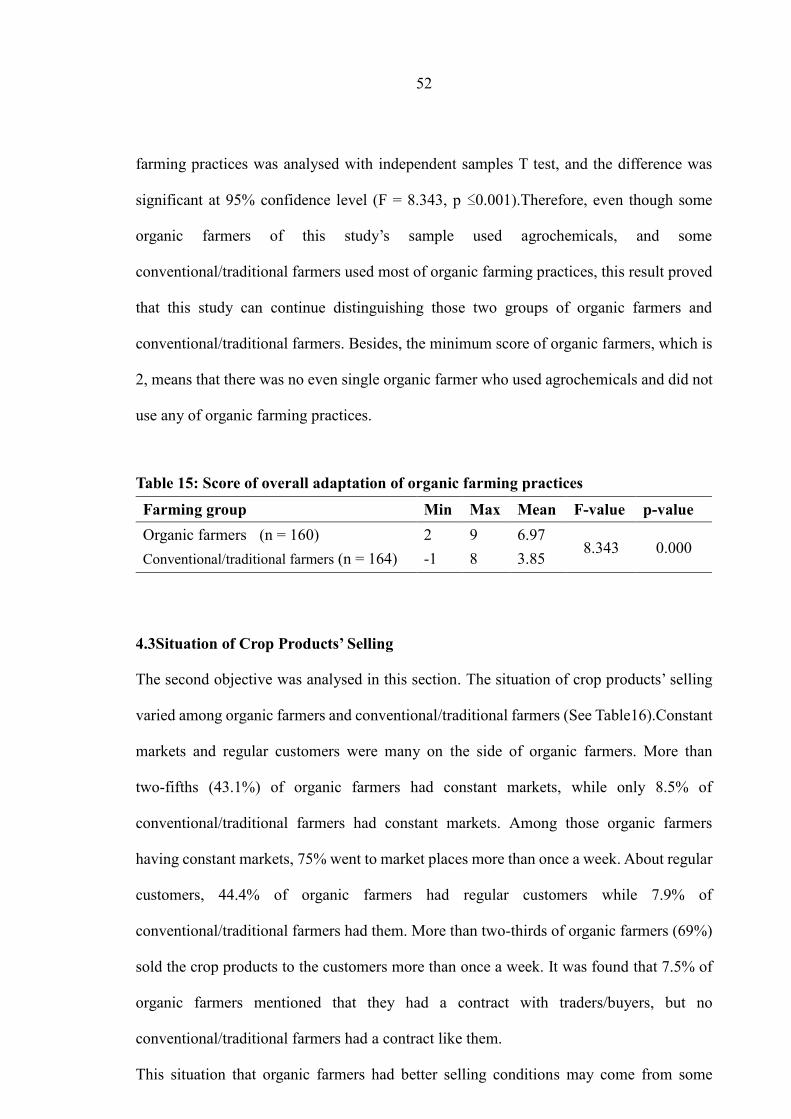
52
farming practices was analysed with independent samples T test, and the difference was
significant at 95% confidence level (F = 8.343, p ≤0.001).Therefore, even though some
organic farmers of this study’s sample used agrochemicals, and some
conventional/traditional farmers used most of organic farming practices, this result proved
that this study can continue distinguishing those two groups of organic farmers and
conventional/traditional farmers. Besides, the minimum score of organic farmers, which is
2, means that there was no even single organic farmer who used agrochemicals and did not
use any of organic farming practices.
Table 15: Score of overall adaptation of organic farming practices
Farming group Min Max Mean F-value p-value
Organic farmers (n = 160) 2 9 6.97 8.343 0.000
Conventional/traditional farmers (n = 164) -1 8 3.85
4.3Situation of Crop Products’ Selling
The second objective was analysed in this section. The situation of crop products’ selling
varied among organic farmers and conventional/traditional farmers (See Table16).Constant
markets and regular customers were many on the side of organic farmers. More than
two-fifths (43.1%) of organic farmers had constant markets, while only 8.5% of
conventional/traditional farmers had constant markets. Among those organic farmers
having constant markets, 75% went to market places more than once a week. About regular
customers, 44.4% of organic farmers had regular customers while 7.9% of
conventional/traditional farmers had them. More than two-thirds of organic farmers (69%)
sold the crop products to the customers more than once a week. It was found that 7.5% of
organic farmers mentioned that they had a contract with traders/buyers, but no
conventional/traditional farmers had a contract like them.
This situation that organic farmers had better selling conditions may come from some

53
reasons. First, a trend of crops grown by each farming groups influences the selling
situation. Since conventional/traditional farmers grow fewer crops compared to organic
farmers, they do not really have various crops to sell. Conventional/traditional farmers’
most grown crops were maize, cow peas and pumpkins, which are typically consumed at
home. However, a quite large proportion of organic farmers grew several crops which
commonly bring sales such as banana and Chinese cabbage. Those differences led to the
result that the percentage of organic farmers having constant markets and regular customers
were more than four times the percentage of conventional/traditional farmers. Second,
organic farmers seemed to be more motivated to sell their crop products as organic products
since when they started organic farming. Farmers’ unwillingness to participate in the
market is reported as one of the reasons of low rate of commercialization in Tanzania
(Morisset, 2013). However, one old man in Langali village mentioned that “I had an
expectation that organic market would grow, and we would get premium price”. Another
old man in Ruvuma village also said that “We expected that organic products would be
different from normal ones, and prices would be higher”. Even though not so many organic
farmers got premium prices, that motivation possibly led to the higher number of crops to
sell.

54
Table 16: Crop products’ selling ways
Information of crop
products’ selling Response
Organic farmers
(n =160)
Conventional/traditional
farmers (n = 164)
Whether they have a
constant market
Yes 69 (43.1)* 14 (8.5%)*
No 91 (56.9) 150 (91.5%)
Whether they have a
contract with
trader/buyers
Yes 12 (7.5) 0 (0)
No 147 (91.9) 164 (100)
How often they go to
a market
More than once a week 51 (75.0) 8 (57.1)
More than once month 14 (20.6) 1 (7.1)
Less than once month 3 (4.4) 5 (35.7)
Whether they have a
regular customers
Yes 71 (44.4) 13 (7.9)
No 89 (55.6) 151 (92.1)
How often they sell
the crop products to
the customers
More than once a week 49 (69.0) 9 (69.2)
More than once a month 16 (22.5) 4 (30.8)
Less than once a month 6 (8.5) 0 (0)
* The numbers in brackets for percentages
About the percentages of crop products sold by farmers, it was revealed that except for
maize, sunflower, millet, pigeon pea leaves, green gram, orange and watermelon, every
crop product was sold more by organic farmers (among those, green gram, orange and
watermelon are not grown by any organic farmers). There were several crop products that
no conventional/traditional farmers sold; especially vegetables, fruits and cash crops.
The top five crop products sold most by each farming group are shown with average
income of each crop in Table 17. The most common staple crop in Tanzania, which is maize,
was the first crop product sold most by conventional/traditional farmers, but it was not in
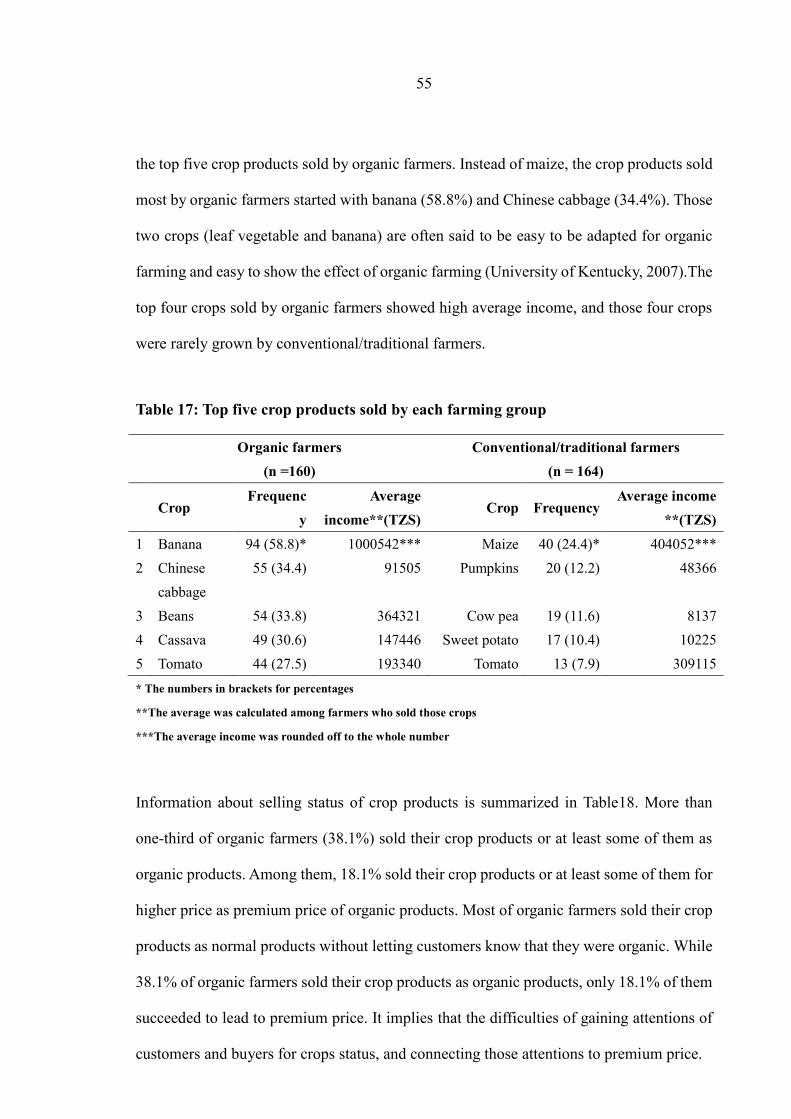
55
the top five crop products sold by organic farmers. Instead of maize, the crop products sold
most by organic farmers started with banana (58.8%) and Chinese cabbage (34.4%). Those
two crops (leaf vegetable and banana) are often said to be easy to be adapted for organic
farming and easy to show the effect of organic farming (University of Kentucky, 2007).The
top four crops sold by organic farmers showed high average income, and those four crops
were rarely grown by conventional/traditional farmers.
Table 17: Top five crop products sold by each farming group
Organic farmers
(n =160)
Conventional/traditional farmers
(n = 164)
Crop
Frequenc
y
Average
income**(TZS) Crop Frequency
Average income
**(TZS)
1 Banana 94 (58.8)* 1000542*** Maize 40 (24.4)* 404052***
2 Chinese
cabbage
55 (34.4) 91505 Pumpkins 20 (12.2) 48366
3 Beans 54 (33.8) 364321 Cow pea 19 (11.6) 8137
4 Cassava 49 (30.6) 147446 Sweet potato 17 (10.4) 10225
5 Tomato 44 (27.5) 193340 Tomato 13 (7.9) 309115
* The numbers in brackets for percentages
**The average was calculated among farmers who sold those crops
***The average income was rounded off to the whole number
Information about selling status of crop products is summarized in Table18. More than
one-third of organic farmers (38.1%) sold their crop products or at least some of them as
organic products. Among them, 18.1% sold their crop products or at least some of them for
higher price as premium price of organic products. Most of organic farmers sold their crop
products as normal products without letting customers know that they were organic. While
38.1% of organic farmers sold their crop products as organic products, only 18.1% of them
succeeded to lead to premium price. It implies that the difficulties of gaining attentions of
customers and buyers for crops status, and connecting those attentions to premium price.

56
Table 18: Selling price of crop products of organic farmers
Information of selling price Response Organic
farmers(n=160)
Status of crop products at market Organic crop products 42 (26.2)*
Normal crop products 99 (61.9)
Organic and normal crop
products
19 (11.9)
Whether crop products have
premium price due to being
organic
Yes 11 (6.9)
No 131 (81.9)
It depends on a crop product 18 (11.2)
* The numbers in brackets for percentages
The crops that gave organic farmers premium prices are seen in Table 19. Prices of three
staple food (maize, rice and banana), two more crops grown most by
conventional/traditional farmers (cow pea and pumpkins), and some vegetable grown by
both farming groups (Chinese cabbage, tomato, cabbage) are summarized. Average prices
of crop products of organic farmers were higher than those of conventional/traditional
farmers, except for cow pea and pumpkins. Big differences in average prices were seen in
the price of rice (745.12 by organic farmers and 530 by conventional/traditional farmers).
Some differences in average prices resulted from selling places. In the case of rice which
showed the biggest differences in the price between organic farmers and
conventional/traditional farmers, some organic farmers sold rice in the organic shop of SAT
for higher price. That is the maximum price of TZS 1500 (per 1 kg) in Table 19.
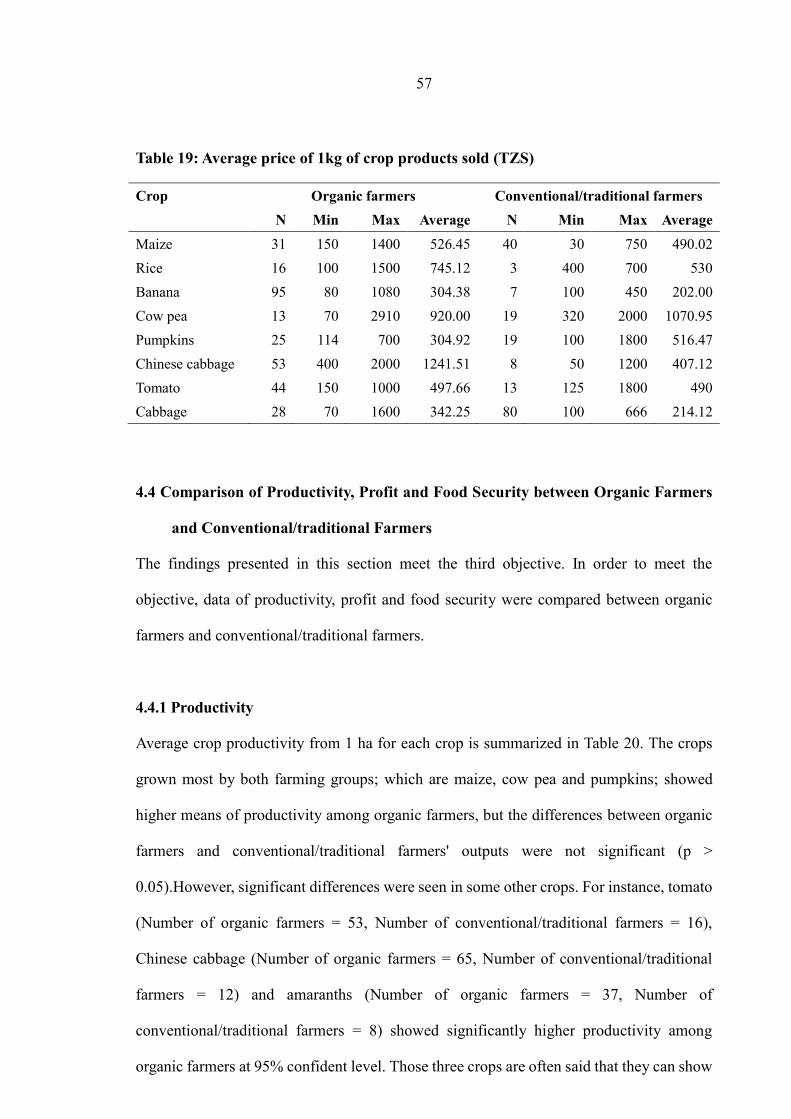
57
Table 19: Average price of 1kg of crop products sold (TZS)
Crop Organic farmers Conventional/traditional farmers
N Min Max Average N Min Max Average
Maize 31 150 1400 526.45 40 30 750 490.02
Rice 16 100 1500 745.12 3 400 700 530
Banana 95 80 1080 304.38 7 100 450 202.00
Cow pea 13 70 2910 920.00 19 320 2000 1070.95
Pumpkins 25 114 700 304.92 19 100 1800 516.47
Chinese cabbage 53 400 2000 1241.51 8 50 1200 407.12
Tomato 44 150 1000 497.66 13 125 1800 490
Cabbage 28 70 1600 342.25 80 100 666 214.12
4.4 Comparison of Productivity, Profit and Food Security between Organic Farmers
and Conventional/traditional Farmers
The findings presented in this section meet the third objective. In order to meet the
objective, data of productivity, profit and food security were compared between organic
farmers and conventional/traditional farmers.
4.4.1 Productivity
Average crop productivity from 1 ha for each crop is summarized in Table 20. The crops
grown most by both farming groups; which are maize, cow pea and pumpkins; showed
higher means of productivity among organic farmers, but the differences between organic
farmers and conventional/traditional farmers' outputs were not significant (p >
0.05).However, significant differences were seen in some other crops. For instance, tomato
(Number of organic farmers = 53, Number of conventional/traditional farmers = 16),
Chinese cabbage (Number of organic farmers = 65, Number of conventional/traditional
farmers = 12) and amaranths (Number of organic farmers = 37, Number of
conventional/traditional farmers = 8) showed significantly higher productivity among
organic farmers at 95% confident level. Those three crops are often said that they can show
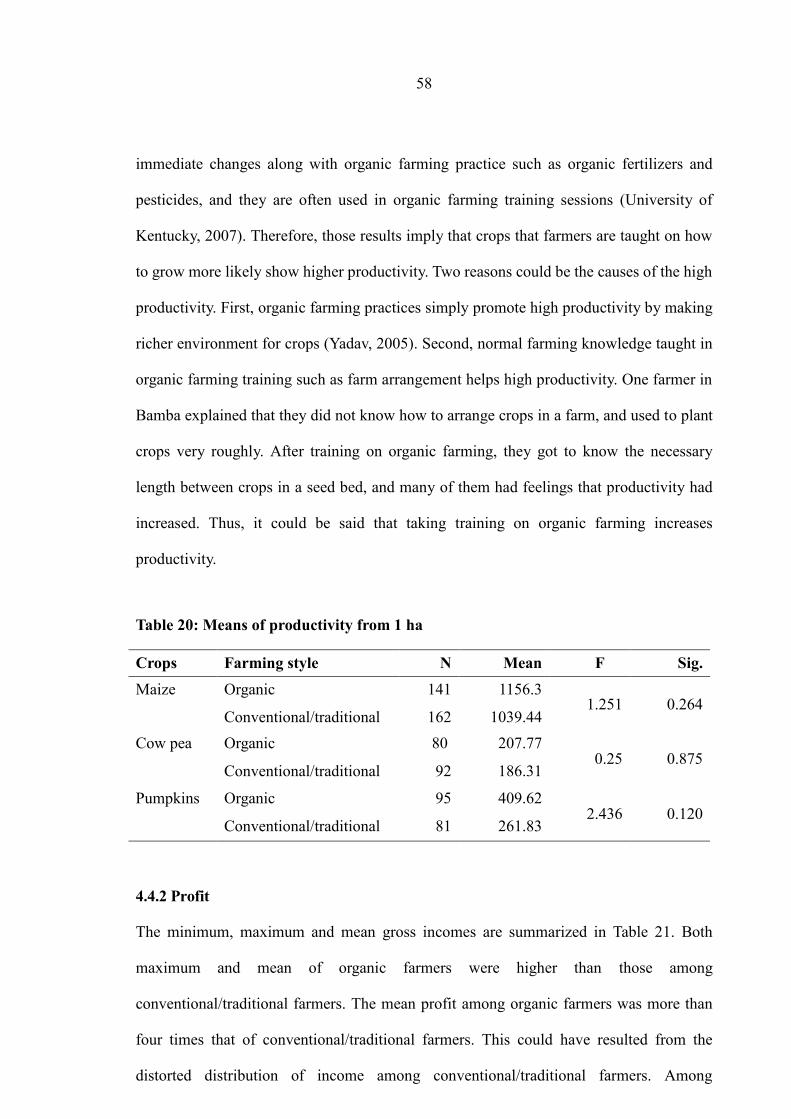
58
immediate changes along with organic farming practice such as organic fertilizers and
pesticides, and they are often used in organic farming training sessions (University of
Kentucky, 2007). Therefore, those results imply that crops that farmers are taught on how
to grow more likely show higher productivity. Two reasons could be the causes of the high
productivity. First, organic farming practices simply promote high productivity by making
richer environment for crops (Yadav, 2005). Second, normal farming knowledge taught in
organic farming training such as farm arrangement helps high productivity. One farmer in
Bamba explained that they did not know how to arrange crops in a farm, and used to plant
crops very roughly. After training on organic farming, they got to know the necessary
length between crops in a seed bed, and many of them had feelings that productivity had
increased. Thus, it could be said that taking training on organic farming increases
productivity.
Table 20: Means of productivity from 1 ha
Crops Farming style N Mean F Sig.
Maize Organic 141 1156.3 1.251 0.264
Conventional/traditional 162 1039.44
Cow pea Organic 80 207.77 0.25 0.875
Conventional/traditional 92 186.31
Pumpkins Organic 95 409.62 2.436 0.120
Conventional/traditional 81 261.83
4.4.2 Profit
The minimum, maximum and mean gross incomes are summarized in Table 21. Both
maximum and mean of organic farmers were higher than those among
conventional/traditional farmers. The mean profit among organic farmers was more than
four times that of conventional/traditional farmers. This could have resulted from the
distorted distribution of income among conventional/traditional farmers. Among

59
conventional/traditional farmers, 44.5% did not have any income from their crop
production, while there were only 5.6% of organic farmers who did not have any income.
This low rate of commercialization of Tanzanian farmers is also reported by Morisset
(2013) that 26% of all farmers did not sell any of their crop products. Besides, as FAO
(1999) stated that “diversity in production increases income-generating opportunities”,
organic farmers’ diversification of crops also contributed to the higher income. The
minimum, maximum and mean total costs are summarized in Table 28. Even though the
percentage of conventional/traditional farmers who did not spend any money for
agricultural expenditure was higher than that of organic farmers (12.8% of
conventional/traditional farmers and 5.6% of organic farmers), mean costs of
conventional/traditional farmers were higher than those of organic farmers.
Table 21: Descriptive information of gross income, total costs and profits among
organic farmers and conventional/traditional farmers
Variable described n Min Max Mean
Gross income of organic farmers 160 0 56005000 1842657.20
Gross income of conventional/traditional farmers 164 0 17255000 378872.99
Total costs of organic farmers 160 0 1269000 206049
Total costs of conventional/traditional farmers 164 0 2382500 231902
Descriptive information of profit of farmers is summarized in Table 22. The mean profit
among organic farmers was higher than that among conventional/traditional farmers with
smaller minimum amount and bigger maximum amount. The mean of profit of 2013 of
organic farmers was TZS 1,636,608.14 and TZS 146,970.55 for conventional/traditional
farmers, which is less than one-tenth of that of organic farmers. Independent sample T test
showed significant difference between profits of organic farmers and those of
conventional/traditional farmers (F = 13.652, p ≤ 0.001). This big difference stemmed
from deficit of a large proportion of conventional/traditional farmers. There were 58.5% of

60
conventional/traditional farmers who had deficit, while only 13.1% of organic farmers had
deficit. Less income and higher expenditure of conventional/traditional farmers made up
this situation. On the other hand, organic farmers can lower farm expenditure and increase
income. This combination of less expenditure and higher income of organic farming is
supported by several researches which showed reduction of input costs and increase of
incomes in organic system (Peramaiyan et al., 2009 and IFOAM, 2006)
Table 22: Profit (TZS) among organic farmers and conventional/traditional farmers
Framing group n Min Max Mean F Sig.
Organic farmers 160 -391000 54736000 1636608.14 13.652 0.000*
Conventional/traditional farmers 164 -1879000 16625500 146970.55
*significant at 0.001 level
4.4.3 Food security
The mean of food consumption score of organic farmers was 51.17, and was higher than
that of conventional/traditional farmers, which was 49.45. Scores calculated according to
the categories of poor (1), borderline (2) and acceptable (3) were compared between two
farming groups, and it showed higher mean of organic farmers (See Table23). The
difference between organic farmers and conventional/traditional farmers was significant (F
= 6.514, p < 0.05).
In terms of dietary energy consumed, households of organic farmers had higher mean of
dietary energy consumed (2976.53kCal per adult equivalent per day) than the kCal
consumed by households of conventional/traditional farmers (2912.25 per adult equivalent
per day).As shown in Table 23, the difference of the mean dietary energy consumed was not
significant (F = 1.414, p > 0.05). Households were grouped into food insecure and food
secure based on the cut-point of 2200 kCal, which is the national caloric poverty line per
61
adult equivalent per day in Tanzania. There were 24.4% of households of
conventional/traditional farmers that were below the cut-point, while the proportion of
households of organic farmers that were below the cut-point was less than 19.4%. It implies
that there were more households having secured dietary energy consumed The score of the
group of food insecure which consumed below 2200 kCal (1) and the score of the group of
food secure which consumed more than 2200 kCal (2) were compared between organic
farmers and conventional/traditional farmers (See Table30). The difference between
organic farmers and conventional/traditional farmers was significant (F = 4.793, p ≤
0.001).
The percentage of expenditure on food showed opposite results from other food security
information. The mean percentage of expenditure on food of organic farmers (65.9%) was
higher than that of conventional/traditional farmers (54.3%) when higher percentage means
more vulnerable to food insecurity. From the view of categories of food insecure level, the
score in Table 23showed significant difference between them (F = 5.438, p ≤ 0.001).
Therefore, the result tells that organic farmers were more vulnerable to food security
according to this indicator. This result might be related to the fact that organic farmers had
lower average of expenditure on farming activities than that of conventional/traditional
farmers. When the total expenditure is low because of the low costs for farming activities,
the percentage of expenditure on food becomes higher. This could explain why the
percentages of expenditure on food of organic farmers are higher than that of
conventional/traditional farmers. When considering this background, it is difficult to
simply say that organic farmers were more vulnerable to food security.
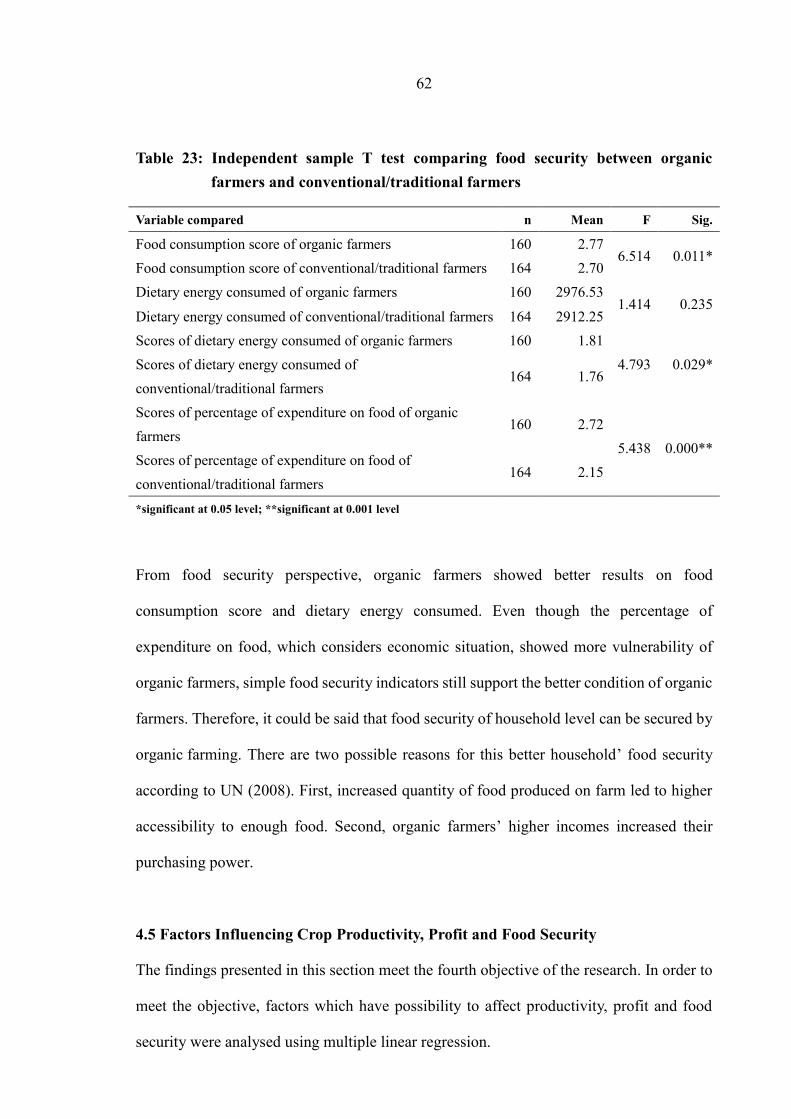
62
Table 23: Independent sample T test comparing food security between organic
farmers and conventional/traditional farmers
Variable compared n Mean F Sig.
Food consumption score of organic farmers 160 2.77 6.514 0.011*
Food consumption score of conventional/traditional farmers 164 2.70
Dietary energy consumed of organic farmers 160 2976.53 1.414 0.235
Dietary energy consumed of conventional/traditional farmers 164 2912.25
Scores of dietary energy consumed of organic farmers 160 1.81
4.793 0.029* Scores of dietary energy consumed of
conventional/traditional farmers 164 1.76
Scores of percentage of expenditure on food of organic
farmers 160 2.72
5.438 0.000** Scores of percentage of expenditure on food of
conventional/traditional farmers 164 2.15
*significant at 0.05 level; **significant at 0.001 level
From food security perspective, organic farmers showed better results on food
consumption score and dietary energy consumed. Even though the percentage of
expenditure on food, which considers economic situation, showed more vulnerability of
organic farmers, simple food security indicators still support the better condition of organic
farmers. Therefore, it could be said that food security of household level can be secured by
organic farming. There are two possible reasons for this better household’ food security
according to UN (2008). First, increased quantity of food produced on farm led to higher
accessibility to enough food. Second, organic farmers’ higher incomes increased their
purchasing power.
4.5 Factors Influencing Crop Productivity, Profit and Food Security
The findings presented in this section meet the fourth objective of the research. In order to
meet the objective, factors which have possibility to affect productivity, profit and food
security were analysed using multiple linear regression.

63
4.5.1 Crop Productivity
The multiple linear regression was run for productivity of maize, cow pea and pumpkins.
The results of multiple linear regression analysis of maize productivity showed that sex of a
household head, number of people in a household and whether they had a constant market
had significant impact on productivity of maize (See Table24). Since the B coefficient for
sex of a household head was negative, it tells inverse relationship with productivity of
maize. Since coding of sex of a household head was 0 = Female and 1 = Male, this result
implies that female headed household had higher productivity of maize. About the number
of people in a household, it implies that households with the higher number of household
members had higher productivity of maize. At last, it was shown that households having a
constant market had higher productivity of maize. Multiple linear regression of
productivity of cow peas showed that there was no any factor which affected productivity
of cow peas significantly.
The result that female-headed households had higher maize productivity became opposite
to a number of studies. For instance, one research about difference in maize productivity
between male- and female-headed households in Uganda revealed that productivity was
significantly lower for female-headed households (Koru and Holden, 2010). Another
research in rural Zimbabwe also revealed that productivity of cotton of female-headed
households is lower than that found for male-headed households (Horrell and Krishnan,
2006). Those unfavourable situations for female-headed households are often explained by
education and accessibility of farm assets such as equipment and fertilizers (FAO, 2015,
Takane, 2007). Therefore, this study revealed that female-headed households no longer
suffer from their traditional disadvantages which have been discussed. While there is no
noticeable support for female-headed households from the government and education of a

64
household head did not have significant impact on maize productivity, this result could be
explained by women’s high commitment to maize production activities. However, more
research on gender roles in agricultural practices could bring deeper explanation for this
higher productivity of maize by female-headed households.
The factor of the number of people in a household tells that households with a larger
number of people had higher productivity. It could be said that large number of household
members leads to bigger labour force at farm. Since maize is the most important crop which
is consumed at home, most of households allocate a large space of farm to maize. Thus,
having enough number of workers from a household is a quite big help for a family. The
result also shows that having a constant market leads to higher productivity of maize. There
may be a difference of motivation for production of maize. Households having constant
markets could care more about their farm because of motivation for selling.
The variable of whether they owned livestock showed significant association with
productivity of pumpkins. Impact of organic fertilizer could be expected first since they
could utilize animal manure from livestock, but the variable of whether they applied
organic fertilizers did not show significant impact (p > 0.05),while whether they owned
livestock did (p = 0.001) on productivity of pumpkins in regression. Therefore, adaptation
of organic fertilizers did not contribute to high productivity of pumpkins. It was found that
total income from livestock keeping had significant impact on productivity of maize in
regression (p ≤ 0.05). This income from livestock could help farmers buy farm inputs or
equipment, and lead to higher productivity. Additionally, higher income added by livestock
keeping may make households to be able to have a separate farm for pumpkins. Since
maize, cow pea and pumpkins are the crops used most for intercropping, many households
did not have a separate farm of pumpkins. It may cause lower productivity of pumpkins in

65
this study, since the study did not consider whether they intercropped or not when
calculating productivity. Therefore, this relationship between productivity of pumpkins and
whether they owned livestock implies livestock owners’ ability of making separate farms.
The result for productivity of pumpkins showed inverse relationship between productivity
of pumpkins and whether they owned livestock (See Table24). Since the coding of
livestock was 0 = Yes and 1 = No, it implies that livestock owners tended to have higher
productivity of pumpkins.
4.5.2 Profit
Empirical analysis between profit and some of the dependent variables were conducted.
According to the results shown in Table24, profit was attributed to years of practicing
organic farming. It implies that more experienced organic farmers tend to get higher profit.
Two main reasons can explain this observation. First, experienced organic farmers easily
take advantages of organic fertilizers and pesticides which they can prepare with local
materials without purchasing. Some new organic farmers have not adapted such practices.
Some have not found the reasonable purchasing way of animal manures for them.
Therefore, experienced organic farmers could decrease their expenditure on inputs, and
bring higher profit. Second, experienced organic farmers could get higher income by
establishing markets for their crop products’ selling. It could be quite difficult for new
organic farmers to get premium price at market places. Experienced organic farmers are
more likely to get a chance to sell their crop products as organic products. However, years
of practicing organic farming is one of the elements of organic farming. Except for
elements of organic farming, there would be no significant factors affecting profit of the
farmers. Therefore, this result after all came to support the significant difference of profit
between organic farmers and conventional/traditional farmers.
66
4.5.3 Food security
Factors affecting food security were analysed from aspects of food consumption score,
dietary energy consumed and percentage of a household’s total expenditure on food.
Multiple linear regression of food consumption score showed it was attributed to whether
they owned livestock, age of a household head and whether they had organic supporters
(See Table 31). Since B coefficient of whether they owned livestock was negative (0 = Yes,
1 = No), it implies that households with livestock had higher food consumption score.
About age, elder person-headed households had higher food consumption score. The
variable of whether they owned livestock could be related to income from livestock. Since
about half of livestock keepers had incomes in 2013 from selling their livestock or their
products such as eggs and milk (average income from livestock was 205421.3), these
additional earnings to income from crop production may have economically caused better
food security. In a related study, Bashir et al. (2012) found that smallholder farmers with
livestock of cows, buffalos, goats and sheep had significantly higher food security in
Pakistan. Age of household head may have positive effect on food security because of their
richer experiences as supported by Obamiro et al (2003).
About dietary energy consumed, multiple linear regression showed that there was no
significantly effective factors to dietary energy consumed. Multiple linear regression of
percentage of a household’s total expenditure on food showed that it was due to whether
they had enough water in their farm (See Table 24). Since the coding of the variable of
whether they had enough water in their farm was 2 = Available, 1 = Depends on a farm and
0 = Depends on rain, this inverse relationship implies that households having available
water source had higher vulnerability to food insecurity. Water cost would be one of the
reasons of the situation that households with available water source were more vulnerable
to food insecurity. Since other households not having available water source had occasional
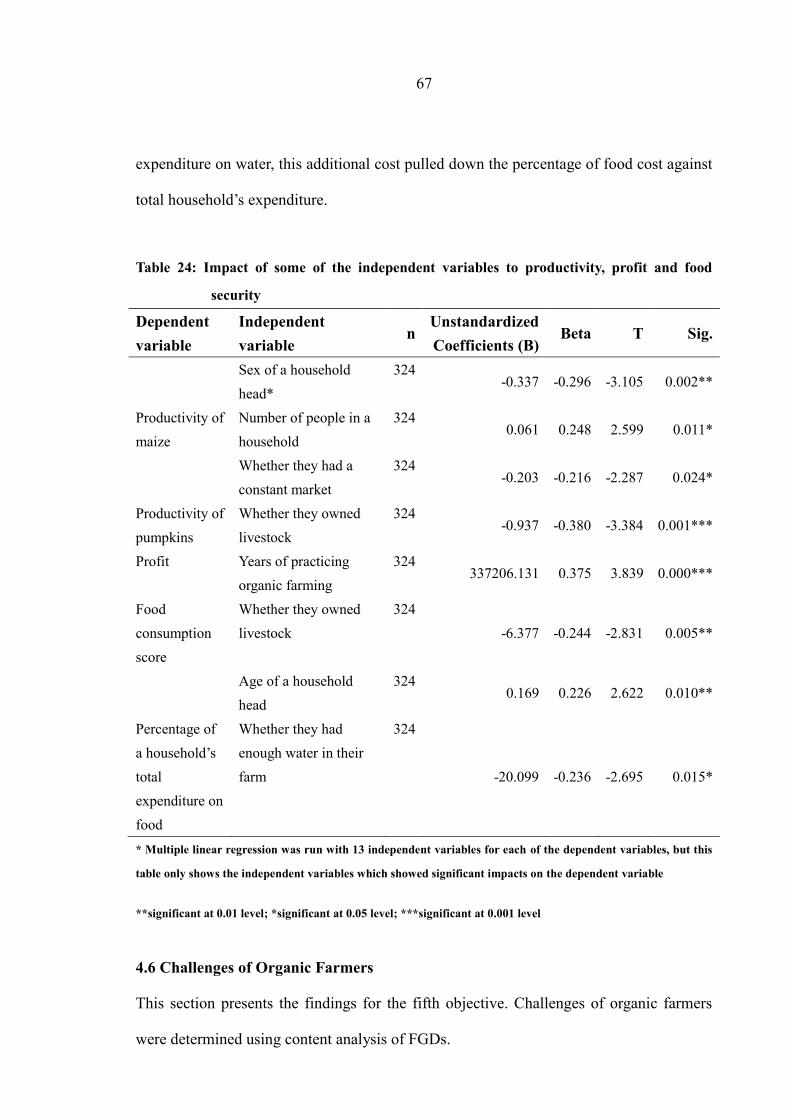
67
expenditure on water, this additional cost pulled down the percentage of food cost against
total household’s expenditure.
Table 24: Impact of some of the independent variables to productivity, profit and food
security
Dependent
variable
Independent
variable n
Unstandardized
Coefficients (B) Beta T Sig.
Productivity of
maize
Sex of a household
head*
324 -0.337 -0.296 -3.105 0.002**
Number of people in a
household
324 0.061 0.248 2.599 0.011*
Whether they had a
constant market
324 -0.203 -0.216 -2.287 0.024*
Productivity of
pumpkins
Whether they owned
livestock
324 -0.937 -0.380 -3.384 0.001***
Profit Years of practicing
organic farming
324 337206.131 0.375 3.839 0.000***
Food
consumption
score
Whether they owned
livestock
324
-6.377 -0.244 -2.831 0.005**
Age of a household
head
324 0.169 0.226 2.622 0.010**
Percentage of
a household’s
total
expenditure on
food
Whether they had
enough water in their
farm
324
-20.099 -0.236 -2.695 0.015*
* Multiple linear regression was run with 13 independent variables for each of the dependent variables, but this
table only shows the independent variables which showed significant impacts on the dependent variable
**significant at 0.01 level; *significant at 0.05 level; ***significant at 0.001 level
4.6 Challenges of Organic Farmers
This section presents the findings for the fifth objective. Challenges of organic farmers
were determined using content analysis of FGDs.
68
4.6.1 Profiles of villages
Focus group discussions were conducted in three villages namely Kireka, Ruvuma and
Kauzeni. In Kireka, which is located at the bottom of Uluguru Mountains with several
rivers in Morogoro Municipality, 25 households were conducting organic farming. In 2013,
Kireka village got a chance to get a free organic farming training from an Italian NGO,
Comunità Volontari per il Mondo (CVM) which is targeting youth development in
agriculture. Kireka village made a youth group for the training, and they had an one
year-training which was offered once per week in a group farm. They were taught how to
make fertilizers and pesticides organically, how to make good farming environment by
terracing, crop rotation and mulching. Members were given important agricultural
equipment, seeds, and certificates after completion of the training. According to the group
members, CVM teaches that organic farming works better for garden farming, so some of
the members divide their farm into an organic farm which is mainly for vegetables and a
conventional farm which is for other crops such as maize.
In Ruvuma village, which is located in upper Uruguru Mountains with plenty water in
Morogoro Municipality, about 20 households were conducting organic farming. In 2010,
the village got an announcement of free organic farming training from a Tanzanian
organization named Sustainable Agriculture Tanzania (SAT). People made a group and
started taking the once per week-training for a year in a group farm. They were taught how
to prepare farm land by terracing, how to make organic fertilizers and pesticides and
arrangement of planting. SAT gave the group necessary farm equipment. They are the main
producers for an organic shop established by SAT in Morogoro town. They bring their crop
products to the organic shop every week according to the order from the shop. From 2013,
they started training other two farmers’ groups which are near to Ruvuma village. Their
organic products are certified by a Participatory Guarantee System (PGS) under the East
69
African Product Standards (EAOPS) (SAT, 2013).
In Kauzeni village, which is located about 8 km away from the centre of Morogoro
Municipality, about 10 households were conducting organic farming. In 2012, the village
got an announcement of free organic farming training from SAT, and farmers started taking
the training for a year in a group farm. They learnt how to make organic fertilizers and
pesticides and ecosystem which should be conserved. SAT gave the group necessary farm
equipment.
4.6.2 Reasons to start organic farming
There are several reasons for farmers to start organic farming (See Box 1). There are
expectations for less expenditure on agrochemicals, health issues and expectation of
premium price.
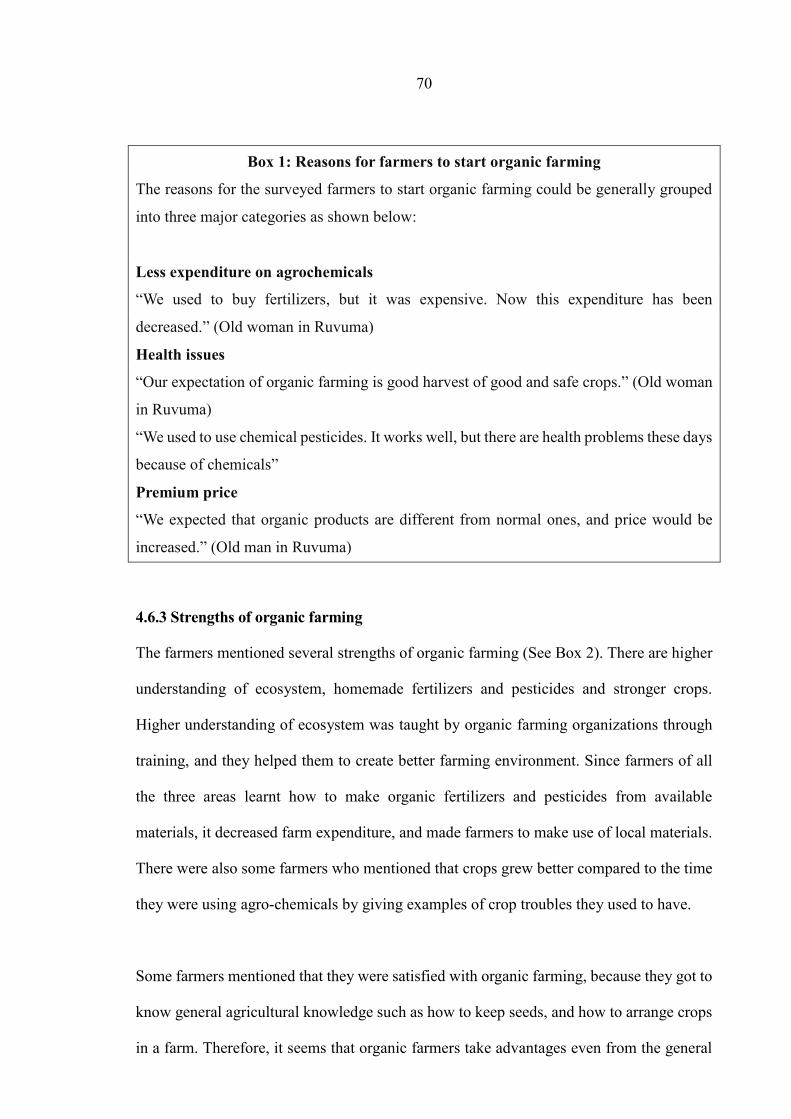
70
Box 1: Reasons for farmers to start organic farming
The reasons for the surveyed farmers to start organic farming could be generally grouped
into three major categories as shown below:
Less expenditure on agrochemicals
“We used to buy fertilizers, but it was expensive. Now this expenditure has been
decreased.” (Old woman in Ruvuma)
Health issues
“Our expectation of organic farming is good harvest of good and safe crops.” (Old woman
in Ruvuma)
“We used to use chemical pesticides. It works well, but there are health problems these days
because of chemicals”
Premium price
“We expected that organic products are different from normal ones, and price would be
increased.” (Old man in Ruvuma)
4.6.3 Strengths of organic farming
The farmers mentioned several strengths of organic farming (See Box 2). There are higher
understanding of ecosystem, homemade fertilizers and pesticides and stronger crops.
Higher understanding of ecosystem was taught by organic farming organizations through
training, and they helped them to create better farming environment. Since farmers of all
the three areas learnt how to make organic fertilizers and pesticides from available
materials, it decreased farm expenditure, and made farmers to make use of local materials.
There were also some farmers who mentioned that crops grew better compared to the time
they were using agro-chemicals by giving examples of crop troubles they used to have.
Some farmers mentioned that they were satisfied with organic farming, because they got to
know general agricultural knowledge such as how to keep seeds, and how to arrange crops
in a farm. Therefore, it seems that organic farmers take advantages even from the general
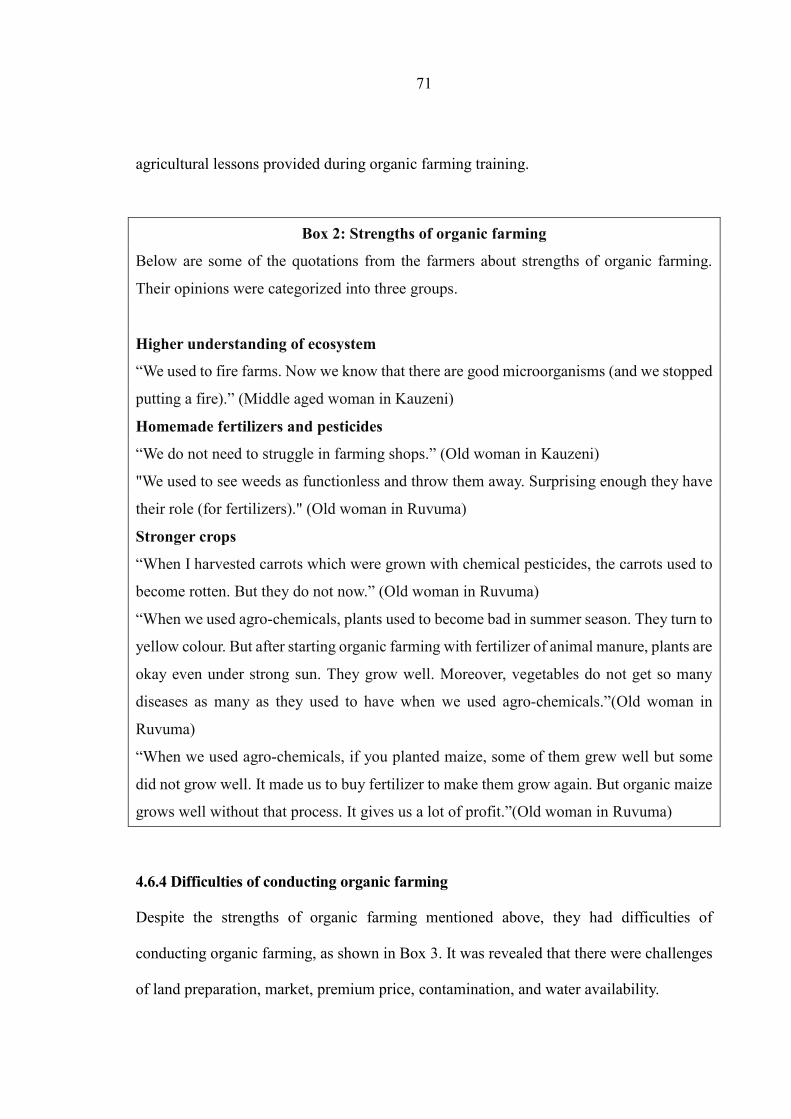
71
agricultural lessons provided during organic farming training.
Box 2: Strengths of organic farming
Below are some of the quotations from the farmers about strengths of organic farming.
Their opinions were categorized into three groups.
Higher understanding of ecosystem
“We used to fire farms. Now we know that there are good microorganisms (and we stopped
putting a fire).” (Middle aged woman in Kauzeni)
Homemade fertilizers and pesticides
“We do not need to struggle in farming shops.” (Old woman in Kauzeni)
"We used to see weeds as functionless and throw them away. Surprising enough they have
their role (for fertilizers)." (Old woman in Ruvuma)
Stronger crops
“When I harvested carrots which were grown with chemical pesticides, the carrots used to
become rotten. But they do not now.” (Old woman in Ruvuma)
“When we used agro-chemicals, plants used to become bad in summer season. They turn to
yellow colour. But after starting organic farming with fertilizer of animal manure, plants are
okay even under strong sun. They grow well. Moreover, vegetables do not get so many
diseases as many as they used to have when we used agro-chemicals.”(Old woman in
Ruvuma)
“When we used agro-chemicals, if you planted maize, some of them grew well but some
did not grow well. It made us to buy fertilizer to make them grow again. But organic maize
grows well without that process. It gives us a lot of profit.”(Old woman in Ruvuma)
4.6.4 Difficulties of conducting organic farming
Despite the strengths of organic farming mentioned above, they had difficulties of
conducting organic farming, as shown in Box 3. It was revealed that there were challenges
of land preparation, market, premium price, contamination, and water availability.
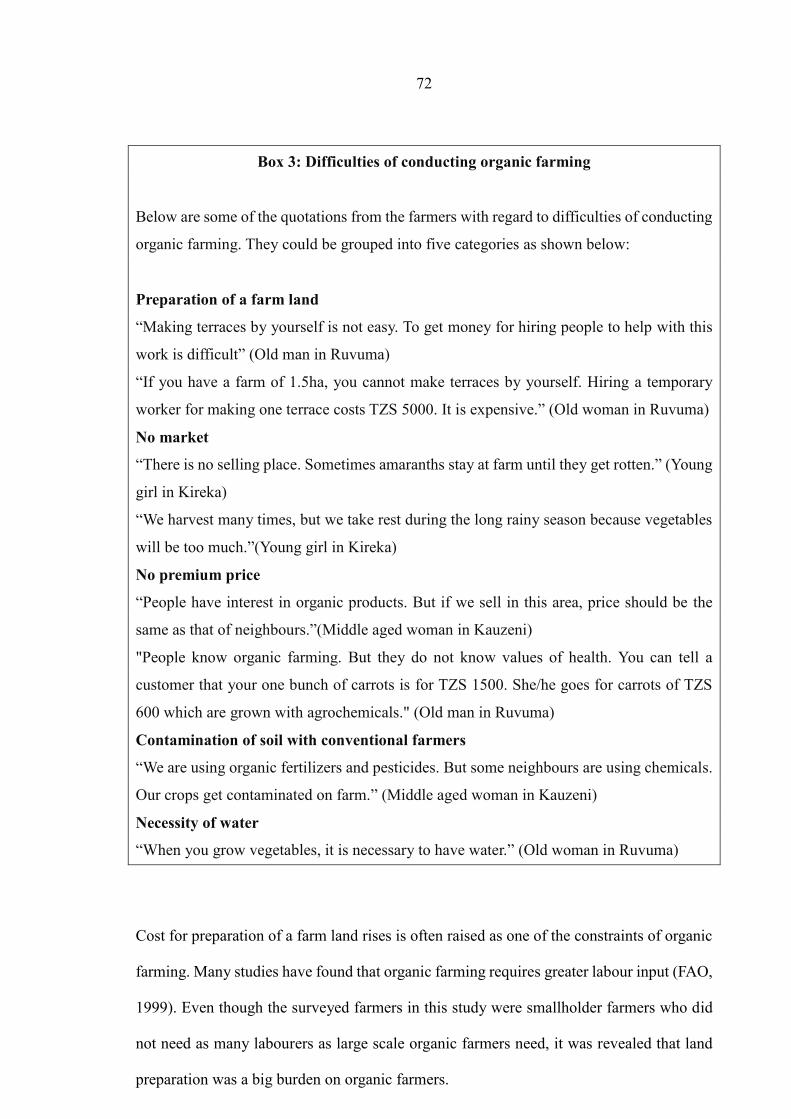
72
Box 3: Difficulties of conducting organic farming
Below are some of the quotations from the farmers with regard to difficulties of conducting
organic farming. They could be grouped into five categories as shown below:
Preparation of a farm land
“Making terraces by yourself is not easy. To get money for hiring people to help with this
work is difficult” (Old man in Ruvuma)
“If you have a farm of 1.5ha, you cannot make terraces by yourself. Hiring a temporary
worker for making one terrace costs TZS 5000. It is expensive.” (Old woman in Ruvuma)
No market
“There is no selling place. Sometimes amaranths stay at farm until they get rotten.” (Young
girl in Kireka)
“We harvest many times, but we take rest during the long rainy season because vegetables
will be too much.”(Young girl in Kireka)
No premium price
“People have interest in organic products. But if we sell in this area, price should be the
same as that of neighbours.”(Middle aged woman in Kauzeni)
"People know organic farming. But they do not know values of health. You can tell a
customer that your one bunch of carrots is for TZS 1500. She/he goes for carrots of TZS
600 which are grown with agrochemicals." (Old man in Ruvuma)
Contamination of soil with conventional farmers
“We are using organic fertilizers and pesticides. But some neighbours are using chemicals.
Our crops get contaminated on farm.” (Middle aged woman in Kauzeni)
Necessity of water
“When you grow vegetables, it is necessary to have water.” (Old woman in Ruvuma)
Cost for preparation of a farm land rises is often raised as one of the constraints of organic
farming. Many studies have found that organic farming requires greater labour input (FAO,
1999). Even though the surveyed farmers in this study were smallholder farmers who did
not need as many labourers as large scale organic farmers need, it was revealed that land
preparation was a big burden on organic farmers.
73
The situation of no market is a big problem, and even the long rainy season, which is
usually a suitable time for farming, became a time to take a rest because of too much crops
without markets in some areas. According to UN (2006), poor organic market development
is raised as one of the constraints of organic farming. During the FGDs, it was found that
even normal market development was very poor, and it became a challenge for organic
farmers. It was also revealed that there were organic farming groups which could access the
organic shop for selling and which could not. One middle aged woman in Kauzeni
mentioned that “we were told that there is an organic shop in town, but we did not have
transportation”. The organic shop in town, owned by SAT, buys crop products from only a
few villages which are near to the shop. Therefore, even organic farmers trained by SAT do
not have an easy access to sell there. In another case, farmers in Kireka, the group trained
by CVM, did not have a selling place. In addition to this accessibility issue, there were also
challenges of selling crop products in the organic shop. One of the farmers mentioned that
“If you order only five (crop products), others get rotten in a big farm”, meagre scale of the
organic shop is another issue which constrains organic farming.
With regard to the selling price, most farmers had difficulties to get premium price. The
FGDs revealed that people have interests in organic products, but it rarely leads to premium
price. Farmers in Kireka explained that people know they conduct organic farming and
many of them like their organic products because they do not have chemicals. Another
farmer in Kauzeni also mentioned that people get interest in organic products when they tell
them about organic products. However, those customers’ positive reactions do not seem to
be big enough to create premium price in many cases as one farmer in Kauzeni said that
“price (of our organic products) should be the same as that of neighbours”. There are
chances for organic farmers to get higher price as a young girl in Kireka said that
“sometimes we see others selling their crop products for TZS 200 and our price is TZS
74
300”.Another man in Ruvuma also mentioned that there are some people who buy even for
higher price because they know what health is. However, as he continued that those people
are very few, those who have understanding of organic products with willingness to
purchase are very few. This premium price issue is also important when considering
promoting organic farming. One farmer in Ruvuma explained that when they promote
organic farming to neighbours, some farmers do not get attracted because of the same
selling price.
Contamination of soil with conventional farmers is a difficult issue. Even though there are
not so many conventional farmers using agro-chemicals for this time yet, according to the
country’s trend, the number of users of agro-chemicals would increase in the future.
Especially mountainous areas where no efficient coping strategies against soil erosion are
used would get serious damage.
The necessity of water was not a problem for the people who mentioned it, but it reminds us
that it is difficult to conduct organic farming in areas where there is poor water availability.
The availability of water should be considered well when starting organic farming. As
organic farming organizations provided hose pipes or sprinklers when starting training,
presence of water is considered as very important. One traditional farmer in Lukobe
pointed out one of the challenges of organic farming by explaining their situation that they
need to buy buckets of water. She mentioned “If I buy buckets of water which for TZS 200
each for growing vegetables and sell one bunch of them for TZS 200, can we really get
profit?”. This water issue would be essential when considering possibilities of
conventional/traditional farmers to start organic farming.

75
4.7 Communities’ Attitude towards Organic Products
The sixth objective of this research was to determine communities’ attitude towards organic
products. In order to meet this objective, this section analyses the data of knowledge of
market customers and their attitude towards organic products.
4.7.1 Knowledge of organic products
Knowledge of market customers about organic products is summarized in Table25. About
the question whether they knew what organic products are, 100% of customers of the
organic shop answered either "I know them well" or "I know a little bit". On the other hand,
25% of customers of the normal market place answered "I know them well" or "I know a
little bit", and 65.6% of them chose the answer of "I have never heard of them". Among the
people who answered "I know them well" or "I know a little bit", only 30.8% of the
customers of the normal market place chose the right answer of explanation of organic
farming (Farming which is not using agro-chemicals), while 76.5% of customers of the
organic shop selected the right answers (Farming which is not using agro-chemicals and
farming considering ecosystem).There were two merits of organic products chosen most;
they are more nutritious; you can avoid taking chemicals; and they are environmentally
friendly. For the answer of "You can avoid taking chemicals", there was only one person
who chose this, while 41.2% of customers of the organic shop chose this answer. The
reasons to get to know organic products varied among people from media, family, relatives,
friends and neighbours, studies to coming across an organic shop.

76
Table 25: Knowledge about organic products
Knowledge about organic products Normal market place Organic shop
Do you know what organic products are? n = 32 n = 17
I know them well 6 (18.8)* 12 (70.6%)*
I know a little bit 2 (6.2) 5 (29.4%)
I have heard of them, but I am not sure what they are 3 (9.4) 0 (0%)
I have never heard of them 21 (65.6) 0 (0%)
Select all explanations of organic farming** n = 13 n = 17
Farming using special seeds 6 (46.2) 2 (11.8)
Mechanized farming 0 (0) 0 (0)
Farming which is not using agro-chemicals 4 (30.8) 13 (76.5)
Western style of farming 0 (0) 2 (11.8)
Farming considering ecosystem 0 (0) 3 (17.6)
I am not sure 1 (7.7) 1 (5.9)
What are the merits of organic products for you?** n = 11 n = 17
They are more nutritious 6 (54.5) 10 (58.8)
You can avoid taking chemicals 1 (9.1) 7 (41.2)
They are environmentally friendly 6 (54.5) 9 (52.9)
They are more delicious 0 (0) 3 (17.6)
I am not sure 0 (0) 0 (0)
How did you know about organic products?** n = 11 n = 17
From media 3 (27.3) 1 (5.9)
From family, relatives, friends and neighbours 4 (36.4) 6 (35.3)
Studied about organic farming 5 (45.5) 5 (29.4)
Came across an organic shop 0 (0) 8 (47.1)
* The numbers in brackets for percentages
**Respondents were allowed to tick more than one answer. Therefore total percentage can exceed 100%.
4.7.2 Attitudes of market customers towards organic products
The overall attitude of customers was grouped into favourable, neutral and unfavourable
among 17 customers of the organic shop and 10 customers of the normal market place. The
number became smaller due to some of the likert scale items, which were not answered by
all the respondents. Table 26 shows that 80% of customers who went to the normal market
place had favourable attitudes, and 64.7% of customers of the organic shop had favourable
attitude.

77
Figure 5: Overall attitude towards organic products
Minimum, maximum and mean scores of overall customers' attitude towards organic
products are shown in Table 26. The mean score of all farmers was 39.00. The mean scores
of customers of the organic shop and the normal market place were similar (39.18 and
38.70 respectively), and there was no significant difference between them (p > 0.05). The
result of no significant difference in scores of overall customers’ attitude towards organic
products between customers of the organic shop and customers of the normal market place
tells us that customers of the normal market have almost similar attitude to the attitude of
customers of the organic shop. It implies that the only difference between them is whether
they are empowered about organic products or not. Therefore, if people got appropriate
knowledge of organic products, organic products would be more familiar and produced.
Table 26: Score of overall customers’ attitude towards organic products
Customer group n Min Max Mean F Sig.
All customers 27 32 46 39.00
Customers of an organic shop 17 34 46 39.18
1.126 0.299 Customers of a normal market
place 10 32 44 38.70
Favourab
le
80%
Neutral
10%
Unfavora
ble 10%
Normal market place
Favourab
le
64.7%
Neutral
5.9%
Unfavora
ble
29.4%
Organic shop
78
Details of customers’ attitude towards organic products are summarized in Table 27. The
responses of not at all and not really were grouped as “disagree”, while “undecided” was
left alone, and the responses of somewhat and very much were grouped as “agree”.
Regarding the statement of “when buying food products, considering the process how the
products were grown”, 71.9% of customers of the normal market place answered
“disagree”, while customers of the organic shop who chose this answer were only 35.3%.
There were many similar comments for this statement from only customers of the normal
markets. They stated that “it is impossible to know” and “even sellers do not know”. It tells
us that a market for them is a place where they cannot know everything they want, and they
do not know about the place such as an organic shop where they can be sure about the
process of how products are grown.
From economic point of view, a large percentage of customers had positive attitude towards
organic products. For the statement of “prices of organic products are not reasonable”,
more than 50% of customers of both markets disagreed. In line with this, more than 80%
disagreed with the statement of “prices of organic products are not affordable”. However,
87.5% of customers of the normal market place agreed with the statement of “when buying
food products, price is the most important thing to consider”. It tells us that price of crop
products is still the most important thing, and price is the biggest factor which influences
customers’ buying intention. It seems that people do not have negative economic
impression for organic products. Even though a large amount of people stated that price is
the most important thing to consider when they buy crop products, they did not think prices
of organic products were not reasonable. Therefore, it could be said that financial situation
of customers would not trouble much for the promotion of organic products.

79
Table 27: Customers’ attitude
Statements about customers’ attitude Disagree Undecided Very much
O* N** O N O N
There are organic farmers in your area (O: n =
17, N: n = 10)
4
(23.5)***
2
(20.0)
4
(23.5)
0
(0)
9
(53.0)
8
(80.0)
When buying food products, considering the
process how the products were grown (O: n =
17, N: n = 32)
6
(35.3)
23
(71.9)
2
(11.8)
2
(6.2)
9
(53.0)
7
(21.9)
You want to eat (or want your family eat)
healthy food (O: n = 17, N: n = 32)
0
(0)
0
(0)
0
(0)
1
(3.1)
17
(100)
31
(96.9)
Preferring organic products to normal products
(O: n = 17, N: n = 10)
0
(0)
1
(10.0)
0
(0)
0
(0)
17
(100)
9
(90.0)
Prices of organic products are not reasonable
(O: n = 17, N: n = 10)
10
(58.8)
7
(70.0)
0
(0)
1
(10.0)
7
(41.2)
2
(20.0)
Prices of organic products are not affordable(O:
n = 17, N: n = 10)
15
(88.3)
9
(90.0)
0
(0)
0
(0)
2
(11.8)
2
(20.0)
Organic products are worth of buying
regardless its price (O: n = 17, N: n = 10)
10
(58.8)
7
(70.0)
0
(0)
0
(0)
7
(41.2)
3
(30.0)
When getting extra money for food, you want to
change crop products to organic(O: n = 17, N: n
= 10)
1
(5.9)
0
(0)
0
(0)
0
(0)
16
(94.1)
10
(100)
When getting extra money for food, you want to
buy something which is not crop products (such
as meat and fish)(O: n = 32, N: n = 10)
4
(23.5)
9
(28.1)
1
(5.9)
1
(3.1)
12
(70.6)
22
(68.8)
When getting extra money, budget of food is
not the first to increase (O: n = 32, N: n = 10)
14
(82.4)
22
(68.7)
1
(5.9)
2
(6.2)
2
(11.8)
8
(25.0)
When buying food products, price is the most
important thing to consider (O: n = 32, N: n =
10)
7
(41.2)
4
(12.5)
0
(0)
0
(0)
10
(58.8)
28
(87.5)
Quantity of food is more important than quality
of food (O: n = 32, N: n = 10)
13
(76.5)
28
(87.5)
0
(0)
3
(9.4)
4
(23.5)
1
(3.1)
*O stands for customers of the organic shop; **N stands for customers of the normal market place
* **The numbers in brackets are for percentages
80
CHAPTER FIVE
5.0 CONCLUSIONS AND RCOMMENDATIONS
5.1 Conclusion
The study examined several differences of agricultural environment and practices between
organic farmers and conventional/traditional farmers. Organic farmers grew more
diversified crops and had more availability of water for irrigation. With regard to farming
practices, even though a large proportion of conventional/traditional farmers did not use
synthetic fertilizers and pesticides as organic farmers, most of other organic farming
practices such as organic fertilizers, organic pesticides, crop rotation, terracing and
mulching were mostly used by organic farmers. Therefore, organic farmers take advantages
of organic farming practices including crop varieties and water availability.
It was found that organic farmers had a better selling situation of their crop products. The
percentage of organic farmers having a constant market and regular customers was much
higher than that of conventional/traditional farmers. However, it was revealed that there
were still difficulties for organic farmers to sell their crop products as organic, and to get
premium price because of low awareness of organic products’ value. Therefore, more
awareness of organic brand is a key to practise organic farming, which definitely brings
organic farmers a better selling situation.
The productivity of the three crops grown most by each farming groups; maize, cow pea
and pumpkins; did not show significant difference between organic farmers and
conventional/traditional farmers even though the averages among organic farmers were
slightly higher than those among conventional/traditional farmers. However, some crops
grown by many organic farmers such as tomato, cabbage and amaranths showed

81
significantly higher productivity. Profit among organic farmers was revealed to be more
than ten times of profit among conventional/traditional farmers, with less expenditure for
farm activity and higher income from their crops. Organic farming could be one of the ways
to get higher profit by balancing expenditure and income, since organic farming can lower
farm expenditure by taking advantages of hand-made organic fertilizers and pesticides, and
can bring higher income by making farmers connected to markets with more crop varieties.
Even from the food security perspective, organic farmers brought significantly better
results with two food security indicators of consumption score and dietary energy
consumed. Hence, organic farming would be one of the development approaches to
improve well-being of smallholder farmers in terms of profit and food security.
Several determinants of crop productivity, profit and food security were analysed. With
regard to productivity, sex of a household head, number of people in a household, whether
they had a constant market and livestock keeping were found to significantly influence
productivity of maize and pumpkins. As raised as one of the challenges of organic farming
in FGDs, construction of more market places would help smallholder farmers get higher
crop productivity. About profit, years of practicing organic farming showed significant
association, and it supports the contribution of organic farming to profit. Food security
which was analysed by food consumption score showed that livestock keeping and age of a
household head were significant determinants. Hence livestock keeping is one of important
factors to be taught in training on farming for improvement in social economic well-being.
From the FGDs of organic farmers, several challenges were revealed in organic farming.
There was hardness of land preparation, lack of markets, and difficulty of getting premium
price and a problem of contamination with other farms. In order for smallholder farmers to
conduct organic farming smoothly and for new farmers to get interested in starting organic

82
farming, these challenges should be overcome, especially difficulties of land preparation in
mountainous areas that need terraces. Moreover, further support is needed against the soil
contamination problem.
Overall customers’ attitude towards organic products between customers of the organic
shop and customers of the normal market place revealed that customers of the normal
market place had similar attitude towards the customers of the organic shop. It implies that
the only difference between them was whether they were empowered about organic
products or not. Therefore, it appears that customers have high possibilities to be familiar
with organic products.
Based on the above conclusions, this study has shown that organic farming can be an
alternative to improve well-being of smallholder farmers with respect to profit and food
security. It could be said that organic farming, which is enhanced by accessible local
resources, can replace former development efforts as a sustainable rural development
approach.
5.2 Recommendations
(i) In order to improve the agricultural situation of conventional/traditional farmers,
organic farming practices and crop diversity should be introduced by agricultural
organizations making use of media and agricultural officers that farmers are familiar
with. Water availability should be considered as an important factor to succeed in
organic farming and to bring the diversification of crops. The government is urged to
improve water systems especially in flatland areas where people have limited water
for irrigation.
83
(ii) More conducive environment for organic farmers to be able to sell their crop products
as organic should be made by organic farming organizations and development
institutions in order for customers to be more familiar with the organic brand, and for
organic farmers to get better selling situations.
(iii) Organic farming should be highly recommended as one of the development ways to
improve well-being of smallholder farmers from aspects of profit and food security.
Since those two are often discussed as core problems of poverty, the government,
development institutions and agricultural organizations should take organic farming
as one of effective ways to eliminate poverty.
(iv) Construction of new market places, more convenient transportation and more
reasonable transaction costs at market places should be promoted by the government,
development institutions and agricultural organizations in order for smallholder
farmers to get high productivity. Moreover, training on farming should include
livestock keeping as one of the important factors which cause high profit.
(v) Further support for organic farming is required in order to solve the difficulties of
preparing organic farms, especially in mountainous areas that need terraces.
Mechanisms to solve the soil contamination problem are required as well.
(vi) Organic products should be promoted by organic farming organizations and
development institutions in order to make more customers to know organic products
with efficient ways such as media. Those organizations need to get connected with
media organizations for promotion. Moreover, organic shops in which customers can
be familiar with the organic brand should be increased.
84
5.3 Suggestions for Further Research
(i) This study concluded that water availability is an important factor to succeed in
organic farming, but how to do away with rain fed agriculture should be researched on.
(ii) Using longitudinal research questions whether the selling situation changed after
starting organic farming would bring deeper explanation. If the longitudinal research
questions show that organic farmers got new market places and customers after starting
organic farming, this would prove the contribution of organic farming to well-being.
(iii) Further research on productivity of vegetables should be conducted in order to show
advantages of organic farming on vegetables, since this study showed significantly
higher productivity of some vegetables, but the number of farmers growing those
vegetable was much smaller than that of organic farmers. A more concerted study on
this topic would bring more appropriate results with statistical significance.
(iv) Information on productivity considering intercropping and applied organic farming
practices is required to examine the surrounding environment of organic farmers’
productivity, since this study could not take into account the intercropping issue in the
calculation of productivity, and could not relate the productivity to the applied organic
farming practices.
(v) Since this study showed that female-headed households have higher productivity of
maize, further research on gender roles in agricultural practices in relation to
productivity is needed in order to bring deeper explanation. For instance, when women
participate in cultivation of farm, which crops women tend to take charge of could
explain better relationships between gender roles and maize productivity.
85
REFERENCES
Aher, S., Swami, B. and Sengupta, B. (2012). Organic agriculture: Way towards sustainable
development. International Journal of Environmental Sciences 3: 209 – 216.
Andersson, G., Rundlof, M., and Smith, H. (2012). Organic Farming Improves Pollination
Success in Strawberries. PLoS ONE 7 (2): 12 – 20.
Bashir, M., Schilizzi, S. and Pandit, R. (2012). Livestock and Rural Household Food
Security: The Case of Small Farmers of the Punjab, Pakisitan. University of
Western Australia, Crawley, Australia, 14pp.
Bennett, M. and Franzel, S. (2013). Can organic and resource-conserving agriculture
improve livelihoods? A synthesis. International Journal of Agricultural
Sustainability 11: 193 – 215.
Bhanuvally, M (2006). Impact of farmers’ organic farming practices on soil properties in
northern dry zone of Karhataka.Dissertation for Award of MSc Degree at
University of Agriculture Sciences, Dharwad, India, 86pp.
Biernbaum, J. and Fogiel, A. (March 2006). Compost Production and Use.
[http://www.msuorganicfarm.com/Compost.pdf]site visited on 16/4/2014.
Bryman, A. (2004). Social Research Methods (Second Edition). Oxford University Press,
Oxford. 592pp.
CHEMA. Organic farming in Karagwe district. [www.sustainet.org/ download/
sustainest_publication_eafrica_part2.pdf] site visited on 1/5/2014.
Collier, P., Radwan, S., Wangwe, S. and Wagner, A. (1990).Labour and Poverty in
Tanzania: Ujamaa and Rural Development in the United Republic of Tanzania.
Clarendon Press, Oxford. 346pp.
Creswell, J. (2003).Research Design Qualitative, Quantitative, and Mixed Methods
Approaches Second Edition. Sage publications, Inc., California. 26pp.
86
Drinkwater, L., Letourneau, D., Workneh, F., van Bruggen, A. and Shennan, C. (1995).
Fundamental differences between conventional and organic tomato
agroecosystems in California. Ecological Applications, 5 (4): 1098 – 1112.
ESRC[http://trickleout.net/index.php/directory-pilot/Tanzania_/mbingo-organic-cocoa-out
growers-association-mocoa], site visited on 5/4/2015.
EPOPA [http://www.grolink.se/epopa/] site visited on 16/4/2014.
FAO[http://www.fao.org/documents/show_cdr.asp?url_file=/DOCREP/004/y6000e/y600
0e00.htm] site visited on 10/3/2015.
FAO (2008). Food Security Information for Action Practical Guidelines, FAO Food
Security Program, Rome. 3pp.
FAO. [http://www.fao.org/ag/ca/] site visited on 12/3/2014a.
FAO. FAO corporate document repository Evaluating the Potential Contribution of Organic
Agriculture to Sustainability, Natural Resources Management and
Environmental Department.
[http://www.fao.org/docrep/003/ac116e/ac116e01.htm#TopOfPage] site visited
on 11/4/2014b.
FAO (1999). [http://www.fao.org/ag/magazine/9901sp3.htm] site visited on 23/3/2015.
Fouche, C, Gaskeli, M, Koike, S, Mitcheli, J and Smith, R. (2000). Insect Pest Management
for Organic Crops.Regents of the University of California, 5pp.
Eyhorn, F., Ramakrishnan, M. and and Mader, P. (2007). The viability of cotton-based
organic farming systems in India. International Journal of Agricultural
Sustainability 5: 25–38.
Hansen, B. (2011).Agricultural Input Subsidies in Sub-Saharan Africa, Ministry of Foreign
Affairs of Denmark, Danida. 40pp.
Hillockes, R. (2002). IPM and organic agriculture for smallholders in Africa.Integrated
Pest Management Revies 7: 17 – 27.

87
Horrell, S. and Krishnan, P. (2006).Poverty and Productivity in Female-headed
Households in Zimbabwe.University of Cambridge, Cambridge. 32pp.
Hunady, I. and Hochman, M. (2014). Potential of Legume-Cereal Intercropping for
Increasing Yields and Yield Stability for Self-Sufficiency with Animal Fodder in
Organic Farming. Plant Breed 50: 185 – 194.
IFAD (2011).Enabling Poor Rural People to Overcome Poverty in the United Republic of
Tanzania, International Fund for Agricultural Development, Rome, 8pp.
IFOAM (2006). Organic Agriculture and Food Security. IFOAM, Germany. 41pp.
IFOAM and FiBL(2008). The World of Organic Agriculture. Statistics and Emerging
Trends 2008. International Federation of Organic Agriculture Movements, Bonn.
276pp.
Johannsen, J., Mertineit, A., Wilhelm, B., BuntzelCano, R., Sch¨one, F. and Fleckenstein,
M. (2005). Organic Farming.A Contribution to Sustainable Poverty Alleviation in
Developing Countries? German NGO Forum on Environment and Development,
Bonn. 54pp.
Khaledi, M. (2007).Assessing the Barriers to Conversion to Organic Farming: An
Institutional Analysis. University of Saskatchewan. 67pp.
Koru, B. and Holden, S. (2010). Difference in Maize Productivity between Male- and
Female-headed Households in Uganda. Ethiopian Development Research
Institute, Addis Ababa. 23pp.
Krejcie (1970).Determining Sample Size for Research Activities. Educational and
Psychological Measurement 30: 607 – 610.
Khanal, R. (2009). Climate Change and Organic Agriculture. The Journal of Agriculture
and Environment 10: 100 – 110.
Pickvance, C.(2001).Four varieties of comparative analysis.Journal of Housing and the
Built Environment 16: 7 – 28.
88
Leonard, T.(2006). Impact of economic development on peasants. Encyclopedia of the
Developing World 3: 1256-1258.
Leu, A. (2012) Organic agriculture and food security – not a contradiction. Rural 21: 9 –
13.
Lukmanji, Z. and Hertzmark, E. (2008). Tanzania Food Composition Tables First Edition.
Deak Top Productions Ltd., Dar es Salaam. 272pp.
Mella, E., Kulindwa, K., Shechambo, F. and Mesaki, S. (2007). The integrated Assessment
of Organic Agriculture in Tanzania. Policy Options for PromotingProductin and
Trading Opportunities for Organic Agriculture. University of Far es Salaam, Dar
es Salaam, 62pp.
MESULA. [http://meru-sustainableland.wix.com/mesula] site visited on 30/8/2014.
Mgumia, A. (2004). A Study on Documentation, Communication and Dissemination of
Local Knowledge and Practices. FAO, Rome. 16pp.
Mhagama (2013). The Economics of Organic Cocoa Production in Tanzania: A Case Study
of Smallholder Cocoa Farmers in Mbingu Ward of Kilombero District.
Dissertation for Award of MSc Degree at Sokoine University of Agriculture,
Morogoro, Tanzania, 68pp.
Minot, N. (2009). Fertilizer policy and use in Tanzania. In: Proceedings of Fertilizer Policy
Symposium of the COMESA African Agricultural Markets Programme (AAMP).
15 June 2009, Livingstone, Zambia. 12pp.
Mohler, C. and Johnson, S. (2009). Crop Rotation on Organic Farms: A Planning Manual.
NRAES, New York. 164pp.
Morisset, J. (2013). Why Tanzanian farmers don’t sell what they produce?
[http://blogs.worldbank.org/africacan/why-don-t-tanzanian-farmers-sell-what-th
ey-produce] site visited on 14/4/2015.

89
NBS (2014). Household Budget Survey Main Report, 2011/12. National Bureau of
Statistics (NBS), Dar es Salaam. 201pp.
NBS (2012). National Sample Census of Agriculture 2007/2008S mall holders Agriculture:
Volume II: Crop Sector – National Report. National Bureau of Statistics (NBS),
Dar es Salaam. 539pp.
NBS and OCGS (2013). 2012 Population and Housing Census: Population Distribution by
Administrative Areas. National Bureau of Statistics (NBS), Dar es Salaam and
Office of Chief Government Statistician (OCGS). Zanzibar. 244 pp.
Ngaiza, R. (2012). KILIMO KWANZA. In: Regional Workshop on an Integrated Policy
Approach to Commercializing Smallholder Maize Production. 6 – 7 June 2012,
Nairobi, Kenya. 30pp.
Obamiro, E., Doppler, W. and Kormawa, P. (2003). Farming Systems and Policy Options
for Food Security in South-western Nigeria.International Institute of Tropical
Agriculture, Ibandan. 7pp.
OECD (2009). Evaluation of Agricultural Policy Reforms in Japan.OECD publishing,
Paris. 121pp.
Peramaiyan, P, Halberg, N. and Hermansen, E. (2009). Organic Agriculture in Relation to
Food Security of developing. VaxtEko, Aarhus. 4pp.
Reddy, S. (2010). Organic Farming: Status, Issues and Prospects – A Review. Agricultural
Economics Research Review 5: 343 – 272.
Sebby, K. (2010). The green revolution of the 1960’s and its impact on small farmers in
India. Dissertation for Award of BA Degree at University of Nebraska-Lincoln
2010, Nebraska, the USA, 32pp.
SAT [http://kilimo.org/WordPress] site visited on 4/2/2014.
SAT (2013). IFOAM Documentary. [http://kilimo.org/WordPress/ifoam-documentary/]
site visited on 7/4/2015.

90
Smith, L. and Subandoro, A. (2007) Measuring Food Security Using Household
Expenditure Surveys. International Food Policy Research Institute. Washington
DC. 124pp.
Sudheer, K. (2013). Economics of organic versus chemical farming for three crops in
Andhra Paradesh, India. Journal of Organic Systems 8 (2): 36 – 49.
Svotwa, E., Baipai, R. and Jiyane, J. (2009).Organic Farming in the Small Holder Farming
Sector of Zimbabwe. Journal of Organic Systems 4 (1): 8 – 14.
Takane, A. (2007). Diversities and Disparities among Female-Headed Households in
Rural Malawi. Institute of Developing Economies, JETRO, 35pp.
TOAM (2014). [http://www.kilimohai.org/] site visited on 16/4/2015.
UN (2008). Organic Agriculture and Food Security in Africa. United Nations, New York
and Geneva. 61pp.
UN (2006). Overview of the Current State of Organic Agriculture in Kenya, Uganda and
the United Republic of Tanzania and the Opportunities for Regional
Harmonization. United Nations, New York and Geneva. 65pp.
University of Kentucky (2007). [http://www.uky.edu/Ag/CCD/introsheets/or
anicsurvey.pdf] site visited on 23/3/2015.
URT (2013). National Agriculture Policy. Government Printer, Dar es Salaam.79pp.
URT (2009).Ten Pillars of KILIMO KWANZA.
[http://www.tzonline.org/pdf/tenpillarsofkilimokwanza.pdf] site visited on
16/4/2014.
Vhurumuku, E. (2014). Food Security Indicators. Proceedings of Integrating Nutrition and
Food Security Programming for Emergency response workshop, Nairobi, 17 – 25
February,2014. 25pp.
WFP (2008). Food Consumption Score. Proceedings of Measures of Food Consumption
Workshop, Rome Italy, 9 – 10April, 2008. 102pp.

91
WHO (2014). [http://www.who.int/trade/glossary/story028/en/] site visited on 15/1/2014.
WB (2012). Boost for Tanzania’s Agriculture Sector.
[http://www.worldbank.org/en/news/press-release/2012/10/23/boost-for-tanzani
a-agriculture-sector] site visited on 8/4/2015.
WB [http://data.worldbank.org/country/tanzania] site visited on 3/1/2014.
WB (2007). World Development Report 2008. Agriculture for Development. The World
Bank, Washington DC. 386pp.
Williams, D., Organic Mulch.
[http://www.aces.uiuc.edu/vista/html_pubs/mulch/MULCH.html] site visited on
3/3/2015.
Yadav, A. (2005). Organic Agriculture: (Concept Scenario, Principals and Practices).
National Centre of Organic Farming, Ghaziabad. 60pp.
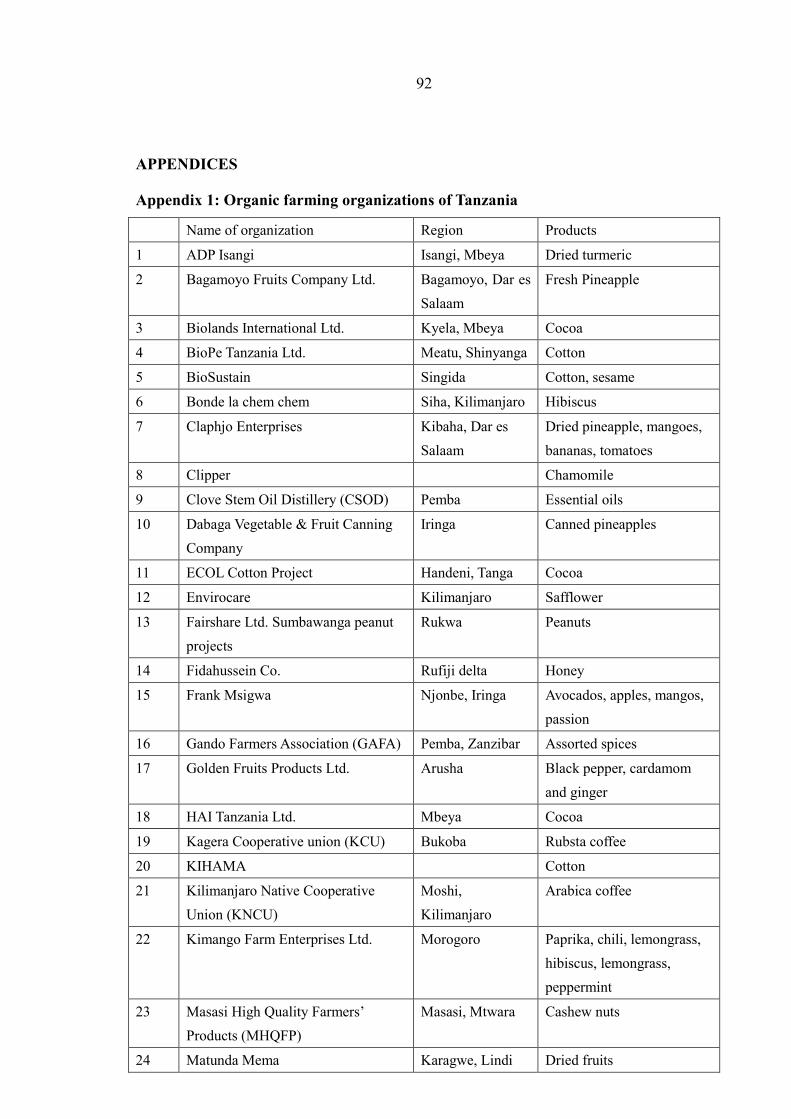
92
APPENDICES
Appendix 1: Organic farming organizations of Tanzania
Name of organization Region Products
1 ADP Isangi Isangi, Mbeya Dried turmeric
2 Bagamoyo Fruits Company Ltd. Bagamoyo, Dar es
Salaam
Fresh Pineapple
3 Biolands International Ltd. Kyela, Mbeya Cocoa
4 BioPe Tanzania Ltd. Meatu, Shinyanga Cotton
5 BioSustain Singida Cotton, sesame
6 Bonde la chem chem Siha, Kilimanjaro Hibiscus
7 Claphjo Enterprises Kibaha, Dar es
Salaam
Dried pineapple, mangoes,
bananas, tomatoes
8 Clipper Chamomile
9 Clove Stem Oil Distillery (CSOD) Pemba Essential oils
10 Dabaga Vegetable & Fruit Canning
Company
Iringa Canned pineapples
11 ECOL Cotton Project Handeni, Tanga Cocoa
12 Envirocare Kilimanjaro Safflower
13 Fairshare Ltd. Sumbawanga peanut
projects
Rukwa Peanuts
14 Fidahussein Co. Rufiji delta Honey
15 Frank Msigwa Njonbe, Iringa Avocados, apples, mangos,
passion
16 Gando Farmers Association (GAFA) Pemba, Zanzibar Assorted spices
17 Golden Fruits Products Ltd. Arusha Black pepper, cardamom
and ginger
18 HAI Tanzania Ltd. Mbeya Cocoa
19 Kagera Cooperative union (KCU) Bukoba Rubsta coffee
20 KIHAMA Cotton
21 Kilimanjaro Native Cooperative
Union (KNCU)
Moshi,
Kilimanjaro
Arabica coffee
22 Kimango Farm Enterprises Ltd. Morogoro Paprika, chili, lemongrass,
hibiscus, lemongrass,
peppermint
23 Masasi High Quality Farmers’
Products (MHQFP)
Masasi, Mtwara Cashew nuts
24 Matunda Mema Karagwe, Lindi Dried fruits

93
25 MAYAWA Bukoba, Kagera Vanilla
26 Mbingu Farmers Association
(MOCOA)
Mbingu,
Morogoro
Cocoa beans
27 MELTD Kyela Cocoa beans
28 Mikese Organic Farm Kyela, Morogoro Mangos, oranges,
tangarines, young coconuts,
limes
29 Mkuranga Women Vegetable
Growers
Mkuranga, Coast Amaranths, cassava,
tomatoes
30 Mufindi Tea Estates Ltd. (MTC) Njombe, Iringa Black tea
31 Premier Cashew Industries Ltd. (PCI) Kerekese,
Mkuranga
Cashew nuts
32 Rufiji Pwani Honey
33 Saienergy and Logistic Service Iringa Fertilizer, Charcoal
34 Sea Products Ltd. Tanga Tuna fish and line caught
35 Tanganyika Instant Coffee Company
(TANICA)
Bukoba, Kagera Instant coffee
36 TANPRO Sumbawanga,
Rukwa
Groundnuts
37 Tanzania Organic Products Ltd.
(TAZOP)
Zanzibar,
Morogoro
Ginger, turmeric, pepper,
cinnamon, cloves
38 UMA Arabica coffee
39 West Lake Agro Products Ltd. Bukoba Vanilla
40 ZAFFIDE Zanzibar Spices
41 Zanzgerm Enterprises Ltd. Zanzibar, Tanga,
Kigoma
Ginger, turmeric, pepper,
chili, lemongrass
42 Zanzibar Organic Spices and Herbs Zanzibar Hibiscus
43 Zanzibar State Trading Company
(ZSTC)
Zanzibar Essential oils
Source: Compiled from the literature including EPOPA (2014), TanCert (2014), and Bakewell-Stone (2006)

94
Appendix 2: A questionnaire for farmers
SOKOINE UNIVERSITY OF AGRICULTURE (SUA)
DEVELOPMENT STUDIES INSTITUTE (DSI)
Chie Miyashita (Master of Rural Development)
Research Title “Can organic farming be an alternative to improve well-being of
smallholder farmers in disadvantaged areas?
A case study of Morogoro region, Tanzania”
Phone: +255759903200 E-mail: [email protected]
A. Characteristics of a household
1. Village…………………………….
2. Household members’ information (family member living together and sharing
food only)
S/N 1. Head 2 3 4 5
Sex (1 = F, 2 = M)
Age
Occupation (1 = farmer, 2 =
non-farm employee, 3 = no job)
Side business
Final education (1 = no formal
education, 2 = not completed
primary, 3 = primary, 4 =
secondary, 5 = higher than
above)
S/N 6 7 8 9 10
Sex (1 = F, 2 = M)
Age
Occupation (1 = farmer, 2 =
non-farm employee, 3 = no job)
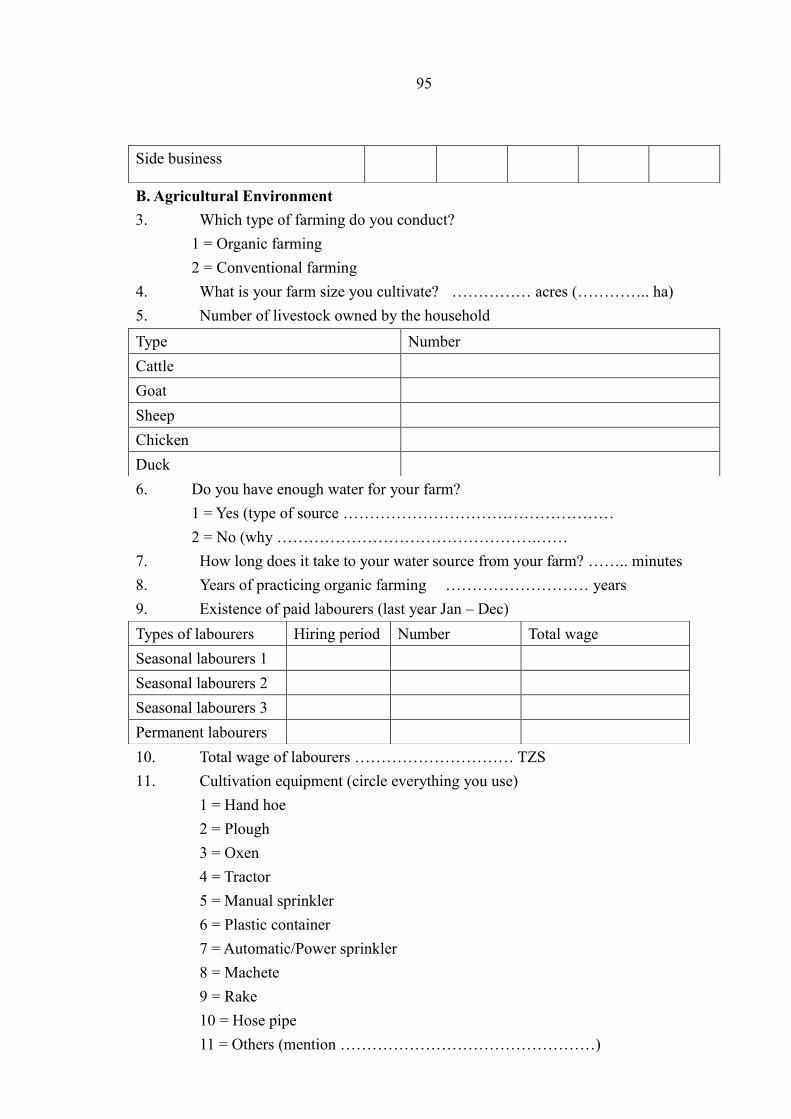
95
B. Agricultural Environment
3. Which type of farming do you conduct?
1 = Organic farming
2 = Conventional farming
4. What is your farm size you cultivate? …………… acres (………….. ha)
5. Number of livestock owned by the household
6. Do you have enough water for your farm?
1 = Yes (type of source ……………………………………………
2 = No (why ………………………………………….……
7. How long does it take to your water source from your farm? …….. minutes
8. Years of practicing organic farming ……………………… years
9. Existence of paid labourers (last year Jan – Dec)
10. Total wage of labourers ………………………… TZS
11. Cultivation equipment (circle everything you use)
1 = Hand hoe
2 = Plough
3 = Oxen
4 = Tractor
5 = Manual sprinkler
6 = Plastic container
7 = Automatic/Power sprinkler
8 = Machete
9 = Rake
10 = Hose pipe
11 = Others (mention …………………………………………)
Side business
Type Number
Cattle
Goat
Sheep
Chicken
Duck
Types of labourers Hiring period Number Total wage
Seasonal labourers 1
Seasonal labourers 2
Seasonal labourers 3
Permanent labourers
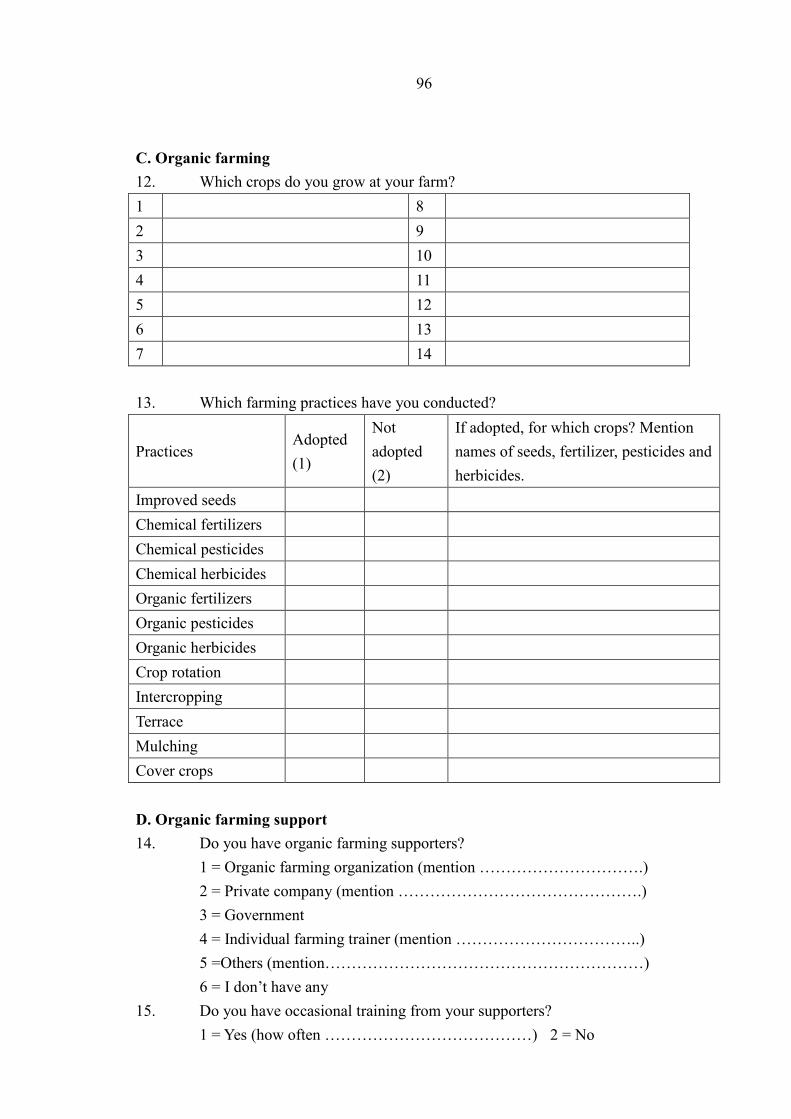
96
C. Organic farming
12. Which crops do you grow at your farm?
1 8
2 9
3 10
4 11
5 12
6 13
7 14
13. Which farming practices have you conducted?
D. Organic farming support
14. Do you have organic farming supporters?
1 = Organic farming organization (mention ………………………….)
2 = Private company (mention ……………………………………….)
3 = Government
4 = Individual farming trainer (mention ……………………………..)
5 =Others (mention……………………………………………………)
6 = I don’t have any
15. Do you have occasional training from your supporters?
1 = Yes (how often …………………………………) 2 = No
Practices Adopted
(1)
Not
adopted
(2)
If adopted, for which crops? Mention
names of seeds, fertilizer, pesticides and
herbicides.
Improved seeds
Chemical fertilizers
Chemical pesticides
Chemical herbicides
Organic fertilizers
Organic pesticides
Organic herbicides
Crop rotation
Intercropping
Terrace
Mulching
Cover crops

97
C. Market Condition
16. Do you have a constant market where you sell your crop products?
1 = Yes (how often …………………………) 2 = No
17. Do you have a contract with a certain trader/buyer?
1 = Yes (mention … ………………….…….) 2 = No
18. Do you have occasional customers whom you take your crops to or who come to
buy your crops?
1 = Yes (how often ………………………) 2 = No
19. Are your crop products sold as Organic?
1 = Yes 2 = No
20. Do you get premium price due to organic crops?
1 = Yes 2 = No
D. Farmers’ Well-being
21. Write the productivity and income of each crop and animal you grew last year
(Jan – Dec).
Name
of a
crop
Farm
size
(acre)
Weight of a
harvested
crop (kg)
Intercropped
with
Weight of
a crop
sold (kg)
Sold
price
(TZS)
Sold as Organic
/ Normal
Name of a
livestock
Land size
for the
livestock
(acre)
Number of livestock sold Sold price (TZS)
22. Cost items about the farm (last year Jan - Dec)
Ways Costs (TZS)
Land clearance
Seeds

98
23. Describe the foods that your family members ate or drank in the past 7 days.
Mention status whether the food were purchased or taken from farm .
24. Write down your household’s expenditure of last month.
Type of cost Expenditure (TZS)
Food (including sugar, salt, cooking oil, etc)
Medical care
Education
Electricity and water
Fuel (oil, charcoal, fire wood, etc)
Taxes
Housing
Thank you very much for your cooperation. This information is only used for my research
at SUA.
Farm equipment
Manure application
Fertilizer and pesticides application
Transportation for selling
Morning Lunch time Dinner time
Food Kg Status Food Kg Status Food Kg Status
Day1
Day2
Day3
Day4
Day5
Day6
Day7

99
Appendix 3: A questionnaire for market customers
SOKOINE UNIVERSITY OF AGRICULTURE (SUA)
DEVELOPMENT STUDIES INSTITUTE (DSI)
Chie Miyashita (Master of Rural Development)
Research Title “Can organic farming be an alternative to improve well-being of
smallholder farmers in disadvantaged areas?
A case study of Morogoro region, Tanzania”
Phone: +255759903200 E-mail: [email protected]
A. Personal Information
1. Market
1 = Normal market (Where …………………………….)
2 = Organic shop (How often do you come per month …………….....)
2. Age …………………………
3. Sex
1 = Female2 = Male
4. Marital status
1 = Married 2 = Single 3 = Divorced
5. Do you have children?
1 = Yes (how many …………) 2 = No
6. Do you have a farm?
1 = Yes 2 = No
7. Occupation ……………………………………
B. Knowledge about organic products
8. Do you know what organic products are?
1. I know them well
2. I know a little bit
3. I have heard of them, but I am not sure what they are
4. I have never heard of them
9. If you answer 1, 2 and 3 for Q.9, select all explanations of organic farming.
1. Farming using special seeds
2. Mechanized farming

100
3. Farming which is not using agro-chemicals
4. Western style of farming
5. Farming considering ecosystem
6. I am not sure
10. If you answer 1, 2 and 3 for Q.9, what are the merits of organic products for you?
1. They are more nutritious
2. You can avoid taking chemicals
3. They are environmentally friendly
4. They are more delicious
5. I am not sure
6. Others (mention …………………………………………)
11. If you answer 1, 2 and 3 for Q.9, how did you know about organic products?
1. From media
2. From family, relatives, friends and neighbours
3.Studied about organic farming
4.Came across an organic shop
5. Others (mention …………………………..……………)
If you answer 1, 2 and 3 for Q.8, continue for next following questions.
C. Attitude towards organic products from socio-cultural aspects
Statements regarding attitude
to organic products
Not at
all
Not
Really
Undecided
Somewhat
Very
much
12. There are organic
farmers in your area
13. When buying food
products, considering the
process how the products were
grown.
14. You want to eat (or
want your family eat) healthy
food.
15. Preferring organic
products to normal products.
D. Attitude towards organic products from economic aspects
Statements regarding attitude to
organic products
Not at
all
Not
Really
Undecided
Somewhat
Very
much
16. Prices of organic products
are not reasonable.
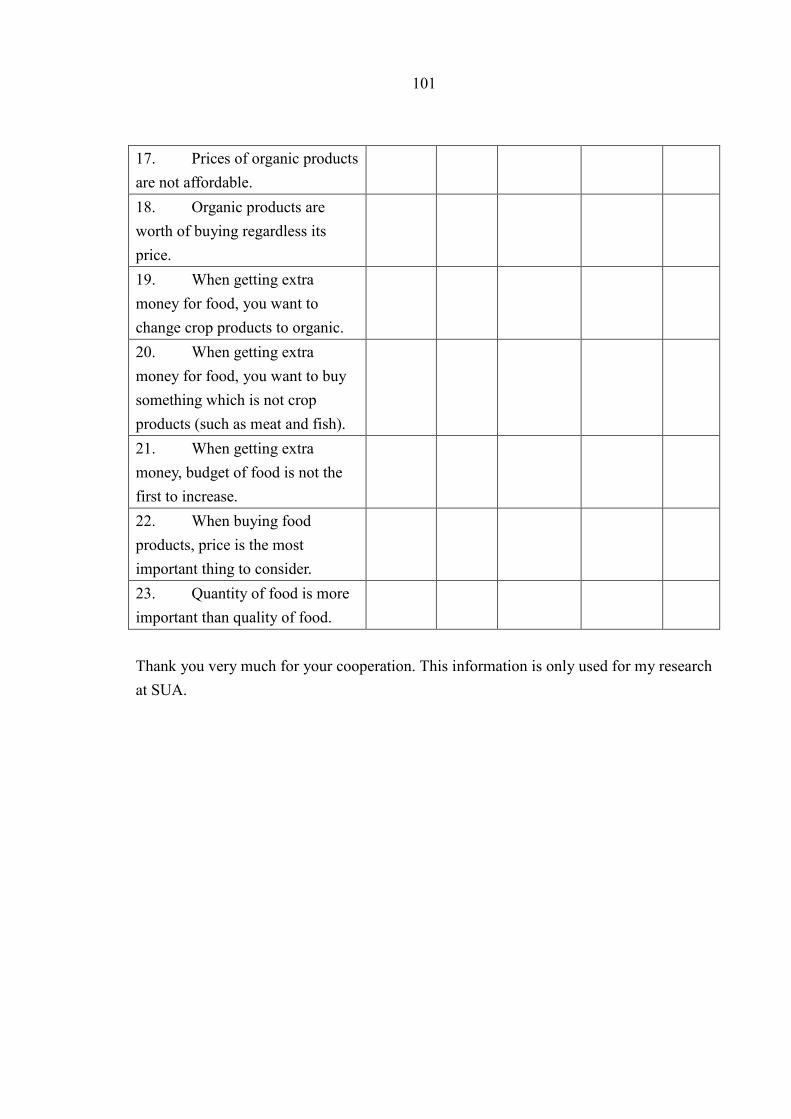
101
17. Prices of organic products
are not affordable.
18. Organic products are
worth of buying regardless its
price.
19. When getting extra
money for food, you want to
change crop products to organic.
20. When getting extra
money for food, you want to buy
something which is not crop
products (such as meat and fish).
21. When getting extra
money, budget of food is not the
first to increase.
22. When buying food
products, price is the most
important thing to consider.
23. Quantity of food is more
important than quality of food.
Thank you very much for your cooperation. This information is only used for my research
at SUA.

102
Appendix 4: A check list for the focus group discussion
SOKOINE UNIVERSITY OF AGRICULTURE (SUA)
DEVELOPMENT STUDIES INSTITUTE (DSI)
Chie Miyashita (Master of Rural Development)
Research Title “Can organic farming be an alternative to improve well-being of
smallholder farmers in disadvantaged areas?
A case study of Morogoro region, Tanzania”
Phone: +255759903200 E-mail: [email protected]
Reasons to start organic farming
Expectation before starting organic farming
Unsuitable organic farming practices in the area
Strengths of organic farming (e.g.growth of crops / selling price / against
unfavourable farming situation / selling prices)
Difficulties of conducting organic farming (e.g.cultivation practices / converting
period / trainers / accessibility of materials / suitable selling place / certification)
Reactions of people at markets towards organic products