Can a leader be seen as too ethical? The curvilinear effects of ethical leadership
16
Can a leader be seen as too ethical? The curvilinear effects of ethical leadership Jeroen Stouten a, ⁎, Marius van Dijke b , David M. Mayer c , David De Cremer d , Martin C. Euwema a a University of Leuven, Leuven, Belgium b Rotterdam School of Management, Erasmus University, The Netherlands c University of Michigan, United States d China Europe International Business School, CEIBS, China article info abstract Article history: Received 8 May 2012 Received revised form 23 May 2013 Accepted 25 May 2013 Available online 24 June 2013 Associate Editor: Kevin Lowe Ethical leadership predicts important organizational outcomes such as decreased deviant and increased organizational citizenship behavior (OCB). We argued that due to the distinct nature of these two types of employee behaviors, ethical leadership decreases deviance in a linear manner (i.e., more ethical leadership leading to less deviance), but we expected ethical leadership to reveal a curvilinear relationship with respect to OCB. Specifically, we expected that, at lower levels, ethical leadership promotes OCB. However, at high levels, ethical leadership should lead to a decrease in these behaviors. We also examined a mechanism that explains this curvilinear pattern, that is, followers' perceptions of moral reproach. Our predictions were supported in three organizational field studies and an experiment. These findings offer a better understanding of the processes that underlie the workings of ethical leadership. They also imply a dilemma for organizations in which they face the choice between limiting deviant employee behavior and promoting OCB. © 2013 Elsevier Inc. All rights reserved. Keywords: Ethical leadership OCB Deviance 1. Introduction Recent ethical failures within organizations such as fraud and corruption highlight the need for ethical leadership. Ethical leadership focuses on leaders as guardians and communicators of ethical standards. Even though there are multiple accounts on ethical leadership, a number of studies have drawn upon Brown and colleagues' (2005) conception of ethical leadership as: “the demonstration of normatively appropriate conduct through personal actions and interpersonal relationships, and the promotion of such conduct to followers through two-way communication, reinforcement, and decision-making” (p. 120). This definition clarifies that ethical leaders act as role models for employees with regard to following procedures or ethical regulations, but they also actively encourage employees to behave in an ethical manner through reward and punishment systems (cf. Treviño, Hartman, & Brown, 2000). These leaders feel obligated to moral and legal rules (De Hoogh & Den Hartog, 2008). Although the scientific literature on ethical leadership is relatively new (e.g. Brown, Treviño, and Harrison, 2005; Gini, 1998), scholars have already provided some clear-cut evidence showing that ethical leaders can reduce deviant employee behaviors and promote organizational citizenship behavior (OCB; Mayer, Aquino, Greenbaum, & Kuenzi, 2012; Mayer, Kuenzi, Greenbaum, Bardes, & Salvador, 2009; Walumbwa & Schaubroeck, 2009). In the present paper, we develop and test an argument regarding unintended and undesirable consequences of ethical leadership for important organizational variables. Specifically, we distinguish between consequences of ethical leadership with The Leadership Quarterly 24 (2013) 680–695 ⁎ Corresponding author. E-mail address: [email protected] (J. Stouten). 1048-9843/$ – see front matter © 2013 Elsevier Inc. All rights reserved. http://dx.doi.org/10.1016/j.leaqua.2013.05.002 Contents lists available at ScienceDirect The Leadership Quarterly journal homepage: www.elsevier.com/locate/leaqua
Transcript of Can a leader be seen as too ethical? The curvilinear effects of ethical leadership

The Leadership Quarterly 24 (2013) 680–695
Contents lists available at ScienceDirect
The Leadership Quarterly
j ourna l homepage: www.e lsev ie r .com/ locate / leaqua
Can a leader be seen as too ethical? The curvilinear effects ofethical leadership
Jeroen Stouten a,⁎, Marius van Dijke b, David M. Mayer c, David De Cremer d, Martin C. Euwema a
a University of Leuven, Leuven, Belgiumb Rotterdam School of Management, Erasmus University, The Netherlandsc University of Michigan, United Statesd China Europe International Business School, CEIBS, China
a r t i c l e i n f o
⁎ Corresponding author.E-mail address: [email protected]
1048-9843/$ – see front matter © 2013 Elsevier Inc. Ahttp://dx.doi.org/10.1016/j.leaqua.2013.05.002
a b s t r a c t
Article history:Received 8 May 2012Received revised form 23 May 2013Accepted 25 May 2013Available online 24 June 2013
Associate Editor: Kevin Lowethat, at lower levels, ethical leadership promotes OCB. However, at high levels, ethical
Ethical leadership predicts important organizational outcomes such as decreased deviant andincreased organizational citizenship behavior (OCB). We argued that due to the distinct natureof these two types of employee behaviors, ethical leadership decreases deviance in a linearmanner (i.e., more ethical leadership leading to less deviance), but we expected ethicalleadership to reveal a curvilinear relationship with respect to OCB. Specifically, we expected
leadership should lead to a decrease in these behaviors. We also examined a mechanism thatexplains this curvilinear pattern, that is, followers' perceptions of moral reproach. Ourpredictions were supported in three organizational field studies and an experiment. Thesefindings offer a better understanding of the processes that underlie the workings of ethicalleadership. They also imply a dilemma for organizations in which they face the choice betweenlimiting deviant employee behavior and promoting OCB.
© 2013 Elsevier Inc. All rights reserved.
Keywords:Ethical leadershipOCBDeviance
1. Introduction
Recent ethical failures within organizations such as fraud and corruption highlight the need for ethical leadership. Ethicalleadership focuses on leaders as guardians and communicators of ethical standards. Even though there are multiple accounts onethical leadership, a number of studies have drawn upon Brown and colleagues' (2005) conception of ethical leadership as: “thedemonstration of normatively appropriate conduct through personal actions and interpersonal relationships, and the promotionof such conduct to followers through two-way communication, reinforcement, and decision-making” (p. 120). This definitionclarifies that ethical leaders act as role models for employees with regard to following procedures or ethical regulations, but theyalso actively encourage employees to behave in an ethical manner through reward and punishment systems (cf. Treviño,Hartman, & Brown, 2000). These leaders feel obligated to moral and legal rules (De Hoogh & Den Hartog, 2008). Although thescientific literature on ethical leadership is relatively new (e.g. Brown, Treviño, and Harrison, 2005; Gini, 1998), scholars havealready provided some clear-cut evidence showing that ethical leaders can reduce deviant employee behaviors and promoteorganizational citizenship behavior (OCB; Mayer, Aquino, Greenbaum, & Kuenzi, 2012; Mayer, Kuenzi, Greenbaum, Bardes, &Salvador, 2009; Walumbwa & Schaubroeck, 2009).
In the present paper, we develop and test an argument regarding unintended and undesirable consequences of ethicalleadership for important organizational variables. Specifically, we distinguish between consequences of ethical leadership with
(J. Stouten).
ll rights reserved.

681J. Stouten et al. / The Leadership Quarterly 24 (2013) 680–695
regard to prohibitions, that is, limiting undesired, deviant behavior from consequences with regard to prescriptions, that is, theencouragement of OCB that is intended to actively support the collective (cf. Smith, Organ, & Near, 1983; Tyler & Blader, 2003).We will argue that due to the distinct nature of these two types of employee behaviors, ethical leadership decreases deviance in alinear manner (i.e., more ethical leadership leading to less deviance), but we expect ethical leadership to reveal a curvilinearrelationship with OCB. Specifically, at lower levels, ethical leadership should promote OCB. However, at high levels, ethicalleadership arguably leads to a decrease in these behaviors. Moreover, we also examine the mechanism that we argue to underliethis relation. That is, we propose that followers' perceptions of moral reproach explain the curvilinear relationship of ethicalleadership with follower OCB. In other words, we argue that followers perceive leaders who act in highly ethical ways as lookingdown upon their morality and consider them not being sufficiently moral, which would undermine their motivation to engage inOCB. Similarly though, followers will perceive leaders who don't care about displaying ethical behavior also as looking down upontheir morality given that these followers might perceive such leaders as frowning upon their own moral behavior. Hence,followers will also perceive low ethical leaders to morally reproach them because these leaders do not care for morality.
Our research adds to the emerging literature on ethical leadership in at least three ways. First, the behavioral ethics literatureoften focuses on voluntary positive contributions to the organization and not harming the organization as outcome variables. Itoperationalizes these concepts usually as OCB and deviance, respectively (Mayer et al., 2009, 2012). Yet, prior work has mostlyfocused on beneficial aspects of ethical leadership in promoting OCB and in decreasing deviance (Mayer et al., 2009, 2012;Walumbwa & Schaubroeck, 2009). In contrast to these findings, we examine effects of ethical leadership that are potentiallyunintended and may have less desirable consequences for organizations and their members. Second, we intend to show thatresearch on ethical leadership should distinguish not harming the organization, such as by refraining from antisocial, unethicalbehavior as an outcome of ethical leadership, from voluntary extra-role behaviors that actually support the organization, such asOCB. OCB denotes voluntary behaviors as diverse as defending or promoting the organization, helping co-workers, andperforming one's tasks beyond the call of duty (e.g. Organ, 1988). Third, we will investigate a previously unidentified mechanismthat explains why ethical leadership influences employee OCB, that is, employees' perceptions of moral reproach. That is, weexamine whether highly ethical but also highly unethical leaders are perceived as looking down upon or judging people's moralvalues which would explain the effect on OCB (cf. Monin, Sawyer, & Marquez, 2008). Fourth, in order to be able to generalize ourfindings to multiple countries, we will test our ideas in different populations (i.e., Europe and the US) using differentmethodologies (experimental, single and multi-source field research).
2. Ethical leadership
Even though ethical behavior is the shared responsibility of the complete collection of organizational stakeholders, it is clearthat many initiatives rely heavily on management and hence are dependent on leaders' concern for moral issues. In other words,at the root of many organizational processes stand leaders whose values and interests shape the extent to which they incorporateethics in their decisions. Gini (1998) described ethical leaders as leaders who use their social power in their decisions, their ownactions, and their influence on others in such a way that they act in the best interest of followers and don't enact harm upon themby respecting the rights of all parties (see also Kanungo, 2001). Riggio, Zhu, Reina, and Maroosis (2010) focused on “cardinalvirtues” to describe the motivations behind leaders' ethical behavior. Yet, rather than focusing on the intent or motivation ofethical leaders, most research on ethical leadership draws on Brown et al.'s (2005) work that defined ethical leadership in termsof behavior.
The literature on ethical leadership is not the first to highlight the importance of ethics for organizational leaders. Influentialliteratures such as those on transformational (Bass, 1999) and authentic leadership (Walumbwa, Avolio, Gardner, Wernsing, &Peterson, 2008) have already implied a focus on the importance of ethics. However, ethical leadership can be distinguished fromauthentic leadership as authentic leaders tend to focus on self-awareness and relational transparency rather than mere ethicalbehavior (Walumbwa et al., 2008). Ethical leadership also differs from transformational leadership, particularly with regard to theunderlying process. That is, ethical leadership contains an important transactional component through which ethical leaders focuson communicating and encouraging ethical conduct rather than being a role model only (Brown et al., 2005). In other words,because of this transactional aspect compliance to ethical standards is expected and discipline and consequences are used forethical lapses (Treviño, Brown, & Hartman, 2003).
The process through which ethical leaders influence employees is commonly explained in reference to social learning theory(Brown et al., 2005; Mayer et al., 2009; see Bandura, 1986, for an extensive formulation of social learning theory). This theoryargues that people learn specific behaviors by observing a person who is perceived as legitimate in his/her actions. Here, followersobserve leaders and take their behavior as a reference. Also in line with social learning theory, ethical leaders hold employeesaccountable for ethical behavior (Gini, 1998; Treviño et al., 2003). To meet these ethical expectations, in terms of social learningtheory, ethical leaders ensure that employees meet ethical expectations not only by functioning as a role model but also by usingpositive and negative reinforcement. Hence, ethical leaders encourage people to follow rules as mandatory, thus limitingundesirable deviant behaviors (Mayer et al., 2009). Deviance is defined as “voluntary behavior that violates significantorganizational norms and, in so doing, threatens the well-being of the organization or its members, or both” (Bennett & Robinson,2000, p. 349). Given that ethical leaders wish to discourage and negatively reinforce undesirable behavior, we expect that ethicalleadership will be negatively related to employees' deviant behavior.
Hypothesis 1. Ethical leadership is negatively related to employees' deviant behavior.

682 J. Stouten et al. / The Leadership Quarterly 24 (2013) 680–695
3. Unintended effects of ethical leadership
Many ethical behaviors that are also critical to the long-term functioning of groups and organizations are voluntary in nature.For instance, prosocial behaviors such as OCB have a strong ethical component (Aquino, Freeman, Reed, Lim, & Felps, 2009). Thesebehaviors are particularly important to organizations because they allow for flexibility in adapting to challenges faced by theorganization to which normative expectations and rules have not yet adapted. Thus, understanding how to motivate OCB is animportant challenge for leaders. Consistent with prior work (e.g. Mayer et al., 2009, 2012), we expect that ethical leaders arelikely to promote these types of behaviors by their functioning as role models.
In line with social learning theory (Bandura, 1986), we expect employees to feel obliged to comply with the required ethicalstandards, particularly because ethical leadership also implies reinforcing such desired, minimum level behaviors as it is part oftheir daily duties (i.e. reduced levels of deviance). Yet, at the same time people may feel that leaders high in ethical standards andbehavior are ethically unreachable. Employees may consider that “their own morality pales” in comparison to the leaders' ethicalbehavior (cf. Monin et al., 2008, p. 13). In fact, employees may perceive ethical leaders to evaluate the legitimacy of their valuesand call into question their attitudes and behavior (cf. Minson & Monin, 2012).
Such feelings of being questioned in one's morality and being looked down upon is often seen as insulting and arrogant (Sabini& Silver, 1982), which can result in the letting go of desirable behavior that is seen as voluntary and goes beyond daily tasks, suchas OCB (e.g. Rollins & Thomas, 1979). As employees might perceive that high ethical leaders evaluate the legitimacy of theirvalues, this is expected to undermine OCB. That is, ethical leadership often can be perceived as a social exchange relationship(Mayer et al., 2009) in which both leaders and followers aim to balance costs and benefits (Homans, 1961). Social exchangetheory states that employees who feel supported by their organization respond to the experienced support with increasedorganizational commitment (Rhoades, Eisenberger, & Armeli, 2001). Yet, if ethical leaders are perceived as judging employees'values employees are motivated to restore the balance by refraining from behavior beyond the call of duty, that is, decreased OCB.Because we expect this especially will be the case at low and high levels of ethical leadership, the relation between ethicalleadership and OCB is expected to show a curvilinear (rather than a linear) pattern. This leads to the following hypothesis:
Hypothesis 2. Ethical leadership has a negative curvilinear relationship (inverted U-shape) with organizational citizenshipbehavior (OCB).
Above we argued that employees might perceive that ethical leaders judge their values as they cannot keep up with theleaders' values. As such, we argue that followers are likely to perceive the leader who is high in ethical behavior, even when itoriginates from the best of intentions, as looking down upon their own values (Calhoun, 1989). Employees may perceive suchmoral reproach and feel that the leader considers them to be morally unequal (Minson & Monin, 2012). Following from this, weargue that employees will perceive highly ethical leaders as evaluating their morality and perceive high ethical leaders to morallyreproach their values more than moderate ethical leaders.
Similar to high ethical leaders, followers may also perceive low ethical leaders to judge their values as followers. That is, interms of low ethical leadership, employees might feel that this leader does not act in an ethical fashion and thus think the leaderlooks down on them and trusts their ethicality less. When ethical leadership is low employees feel less satisfied and committed(Brown et al., 2005) and part of it might be because the leader might make you think the (s)he would look down on you in termsof ethics. This might signal to employees that low ethical leaders consider employees' moral principles irrelevant. As such, likehigh ethical leaders, followers can be expected to perceive low ethical leaders to look down upon their values relative to moderateethical leaders. Therefore, we hypothesize:
Hypothesis 3. High and low ethical leaders will be perceived as more morally reproachful than moderate ethical leaders.
Moreover, given that we expect a curvilinear relationship between ethical leadership, perceptions of moral reproach and OCB,we subsequently examine whether perceptions of moral reproach underlies the curvilinear relation with OCB.
Hypothesis 4. The curvilinear relationship of ethical leadership with organizational citizenship behavior (OCB) will be explainedby perceptions of moral reproach.
4. Overview of the studies
We tested our hypotheses in four studies: three field studies and one experimental study. In order to generalize our findingsindependent of a specific measurement of OCB, we used different OCB measures in Study 1/3, Study 2, and Study 4. Studies 1–3are field studies and one of the most important challenges in these studies is to ensure that the observed relationships betweenvariables result frommeaningful covariation rather than from commonmethod variance (Podsakoff, MacKenzie, Lee, & Podsakoff,2003). We took two different measures to limit this bias. In Study 1, we focused on OCB, and collected data from employees aswell as their co-workers, thus relying on distinct data sources. In Study 2, we separated the measurement of our dependent andindependent variables in time in order to reduce the likelihood of common method bias (Podsakoff et al., 2003). In this study, weagain tested for the curvilinear effect of ethical leadership on employee OCB (Hypothesis 2) and this time we also measured

683J. Stouten et al. / The Leadership Quarterly 24 (2013) 680–695
employee deviance directed at the organization (Hypothesis 1). In Study 3, we again relied on a multisource design to test therelationship between ethical leadership and employee's deviance (Hypothesis 1) and OCB (Hypothesis 2). Moreover, here we alsofocused on supervisor-directed deviance in addition to organizational deviance in order to be able to generalize to different typesof deviance. As such, our findings are not limited to one specific measurement of deviance.
Studies 1–3 are field studies that allow us to generalize our findings to organizational contexts. In Study 4, we used anexperimental procedure to test our hypothesis regarding deviance (Hypothesis 1) and to examine whether ethical leaders arebeing perceived to morally reproach people's values (Hypothesis 3) and to decrease OCB (Hypothesis 2). This allows us to detectthe mechanism of unintended effects of ethical leadership (Hypothesis 4). An experimental approach also suggests the causalpath that a specific relationship takes such as in this case how ethical leaders influence people's perceptions of moral reproach aswell as OCB and deviance.
Finally, in order to be able to increase possible generalization of our findings we used a multi-country approach for thedifferent studies. We used samples from Belgium, the Netherlands, and the US.
5. Study 1
In Study 1 we specifically focused on examining the possibility of a curvilinear relationship between ethical leadership andemployee OCB. In order to reduce common-method and self-presentation concerns, this study used a multi-source design. Focalemployees indicated their supervisor's ethical leadership and co-workers indicated the focal employee's OCB.
5.1. Method
5.1.1. Participants and procedureA total of 280 individuals—140 focal employees and their matched co-workers—participated in the study as part of a snowball
sampling procedure (response rate: 40%; see e.g., Morgeson & Humphrey, 2006; Skarlicki & Folger, 1997; Van Dijke, De Cremer,Mayer, & van Quaquebeke, 2012 for similar procedures). Researchers send out email invitations to employees and requested theirparticipation. Focal employees were instructed to visit a website to complete a survey and to send an electronic survey link to aco-worker familiar with their work. Respondents were assured that their responses would remain confidential. We took anumber of steps to ensure that the surveys were completed by the correct sources. First, in introducing the study, we told theemployees that it was essential for the focal employees and co-worker respondents to fill out the correct surveys. Second, whenparticipants submitted their on-line surveys, time stamps and IP addresses were recorded to ensure that the surveys weresubmitted at different times and with different IP addresses. We found no irregularities in the responses.
Participants were from a variety of different organizations in Flanders (Belgium). The focal employees were 55% male. Themean age was 39.23 years (SD = 10.32). Thirty-four percent had graduated only from high school, and 66% had a college degree.The respondents worked, on average, for 8.30 years in their current job (SD = 8.37).
The co-workers were 44% male and averaged 38.53 (SD = 10.73) years of age. Thirty-five percent had graduated only fromhigh school, and 65% had a college degree. The respondents worked, on average, for 8.39 years in their current job (SD = 8.47).
5.1.2. MeasuresAll items employed the same five-point rating scale format (1 = strongly disagree; 5 = strongly agree).
5.1.2.1. Ethical leadership. We assessed ethical leadership by asking focal employees to respond to the 10-item scale constructedand validated by Brown et al. (2005). Sample items are “My manager disciplines employees who violate ethical standards” and“My manager sets an example of how to do things the right way in terms of ethics” (Cronbach's α = .91).
5.1.2.2. OCB. Co-workers indicated the focal employee's OCB with Lee and Allen's (2002) eight-item OCB scale. Sample items are:this employee “willingly gives up his/her time to help others who have work-related problems” and “gives up time to help otherswho have work or nonwork problems” Cronbach's α = .85).
5.1.3. AnalysesIn order to test our hypotheses regarding the curvilinear effects of ethical leadership we calculated the square of ethical
leadership. Regressing control variables and ethical leadership in step 1 and the squared ethical leadership variable in step 2allows for examining the curvilinear relationship. We tested whether the squared variable of ethical leadership explainssignificant variance in the dependent variable beyond the variance explained by the linear term this provides evidence for thecurvilinear relationship (Cohen, Cohen, Aiken, & West, 2002). Furthermore, we calculated the inflection point—a maximum or aminimum depending on the shape of the curve—of the curvilinear pattern.1
1 Following from the curvilinear equation: ∈ (y) = ax2 + bx + c. The inflection point (maximum or minimum) of the graph can be calculated (x) as follows:x ¼ −b
2a .

684 J. Stouten et al. / The Leadership Quarterly 24 (2013) 680–695
5.2. Results
5.2.1. Measurement modelBefore testing our hypotheses, we conducted CFAs to test our measurement model at the item level to determine whether
scale items adequately indicate their intended underlying constructs (Anderson & Gerbing, 1998; Bandalos & Finney, 2001). Theinitial measurement model had two latent factors and 18 indicators (i.e., ethical leadership and OCB). We estimated a model withtwo latent variables (ethical leadership and OCB) as well as a one-factor model in which all items loaded onto one factor. We alsofitted a three-factor model, which included the two latent variables together with a commonmethod factor that was uncorrelatedto the theoretically derived factors (cf. Podsakoff et al., 2003). To judge the goodness of fit of the measurement model, we reliedon the root-mean-square error of approximation (RMSEA, Steiger, 1990), the comparative fit index (CFI, Bentler, 1990), and theparsimony adjusted comparative fit index PCFI; Mulaik et al., 1989).
The two-factormodel fitted the data quite well (χ2(136) = 249.57, RMSEA = .079 (90% CI = .063–.094), CFI = .93, PCFI = .83).The fit of the one-factor model was clearly insufficient (χ2(136) = 861.18, RMSEA = .199 (90% CI = .187–.212), CFI = .54,PCFI = .48). The three-factor model also fitted the data well (χ2(118) = 170.24, RMSEA = .057 (90% CI = .037–.076),CFI = .97, PCFI = .75). CFI and RMSEA suggest a slightly better fit for the three-factor model. However, PCFI (i.e., whichexplicitly corrects for model complexity) is clearly lower for the three- than the two-factor model. Hence, common methoderror does not appear to play a significant role in our data. Furthermore, the fact that our main hypothesis regards amultiplicative effect (which is not affected by common method error; Evans, 1985) further increases our confidence that wecan validly interpret the findings from these data.
5.2.2. Hypothesis testTable 1 shows the descriptive statistics and intercorrelations. Table 2 shows the regression results. In line with our
expectations, the squared ethical leadership term explained variance in addition to the linear ethical leadership term for OCB(β = −1.73, p b .05; Fig. 1). More specifically, the relationship of OCB with ethical leadership showed an inverted-U shape,indicating that at low levels ethical leadership had a positive relation with OCB, but at high levels of ethical leadership OCBdecreased (with a maximum at ethical leadership = 4.07)2. This finding supports Hypothesis 2.
5.3. Discussion
In a multi-source field study, results showed that ethical leadership has a curvilinear relationship with OCB. Hence, eventhough OCB increased at low to moderate levels it declined after the inflection point at high levels of ethical leadership. Thisprovided some first evidence for our hypotheses.
6. Study 2
Study 2 aimed to replicate and extend the results of Study 1 by focusing on a number of additional outcome variables.Specifically, we included measures of employees' organizational deviance. We expected that ethical leadership has a negativelinear relationship with deviance, but an inverted U-shaped relationship with employee OCB.
6.1. Method
6.1.1. Participants and procedureWe invited 834 employees from a variety of occupations in the Netherlands to participate in the study. To make our analyses
less sensitive to common-method bias (Podsakoff et al., 2003) we separated the measurement of the dependent and independentvariables in time. A total of 676 employees responded at the first measurement point, and 410 employees responded again at thesecondmeasurement point, three months later. Of the employees who completed both surveys, 264 were male (63.8%). Themeanage was 44 years, 32.1% had a college degree and the respondents worked on average 5.73 years in their organization.
Table 1Study 1: Means, standard deviations and intercorrelations.
Mean SD 1 2 3 4 5 6
1 Sex – –
2 Age 39.23 10.32 − .063 Education – – .12 .074 Tenure 8.30 8.37 − .11 − .55** − .045 OCB 4.06 .48 − .18* − .06 .00 − .036 Ethical Leadership 3.96 .66 − .10 − .03 .08 − .09 .15
*p b .05, **p b .01.

Table 2Study 1: Regression results for ethical leadership.
OCB
Model Beta t R2 change
1 Sex − .18⁎ −2.11Age − .12 −1.20Education .01 .16Tenure − .10 −1.00Ethical leadership .11 1.31
2 .03⁎Sex − .19⁎ −2.19Age − .14 −1.40Education .02 .19Tenure − .10 − .95Ethical Leadership 1.83⁎ 2.14Ethical Leadership squared −1.73⁎ −2.02
⁎ p b .05.
685J. Stouten et al. / The Leadership Quarterly 24 (2013) 680–695
6.1.2. MeasuresAll items employed the same five-point rating scale format (1 = strongly disagree; 5 = strongly agree).
6.1.2.1. Time 1 measures. At time 1 we assessed demographic variables. We also measured ethical leadership with the same scale asin Study 1 (Cronbach's α = .92).
6.1.2.2. Time 2 measures. We measured organizational deviance with Bennett and Robinson's (2000) 12 item scale. Sample itemsinclude, “I have taken property from work without permission” and “I come in late without permission” Cronbach's α = .90).
We used Moorman and Blakely's (1995) 19-item instrument to measure OCB. Example items are: “I motivate others to expresstheir ideas and opinions” and “I voluntarily help new employees to settle into the job” (Cronbach's α = .88).
6.2. Results
6.2.1. Measurement modelLike in Study 1, we first conducted CFAs to test our measurement model at the item level. The initial measurement model had
six latent factors and 41 indicators (i.e., ethical leadership, organizational deviance, and the four OCB dimensions). We estimateda model with these six latent variables as well as a one-factor model in which all items loaded onto one factor. We also fitted a
OCB
Fig. 1. The curvilinear relation of ethical leadership and OCB in Study 1.

686 J. Stouten et al. / The Leadership Quarterly 24 (2013) 680–695
seven-factor model, which included the six latent variables together with a common method factor that was uncorrelated to thetheoretically derived factors. To judge the goodness of fit of the measurement model, we relied on the same indices as in Study 1.
The six-factor model (with ethical leadership, deviance and OCB as latent variables) did not fit the data very well (χ2(765) =2027.67, RMSEA = .063 (90% CI = .060–.067), CFI = .85, PCFI = .79). The fit of the one-factor model was clearly insufficient(χ2(779) = 6234.62, RMSEA = .130 (90% CI = .127–.133), CFI = .34, PCFI = .32). The seven-factor model fitted the data best(χ2(724) = 1663.30, RMSEA = .056 (90% CI = .053–.060), CFI = .89, PCFI = .78). This suggests that common method variancemay play a role in our data. This is not surprising given that the four OCB dimensions and organizational deviance were indexedby the same focal employee at the same point in time. Yet, it is also not problematic because method variance that is sharedbetween the different depended variable dimensions does not compromise the test of our hypotheses regarding linear andcurvilinear relations between the independent variable and the various dependent variables.
To investigate the reason for the less than optimal fit of the six and seven factor models (particularly for the CFI), weconsidered which of the two dependent variables (i.e., OCB or organizational deviance) most clearly compromised the model. Inorder to do this, we compared a series of models that contained the independent variable (ethical leadership) and one dependentvariable at a time (i.e., either the OCB dimensions, or organizational deviance).
We first fitted a measurement model with five latent factors (i.e., ethical leadership and the four OCB dimensions). The five-factormodel showed a less than desirable fit (χ2(368) = 1096.90, RMSEA = .069 (90% CI = .065–.074), CFI = .87, PCFI = .79). However,the six-factormodel (adding a commonmethod factor to the five-factormodel), fitted the datawell (χ2(339) = 637.85, RMSEA = .046(90% CI = .041–.052), CFI = .95, PCFI = .79).
We subsequently fitted a measurement model with two latent factors (i.e., ethical leadership and organizational deviance).The two-factor model showed insufficient fit to the data (χ2(209) = 1144.33, RMSEA = .104 (90% CI = .098–.110), CFI = .81,PCFI = .74). The three-factor model (adding a commonmethod factor to the two-factor model), fitted the data better, and almostacceptable according to most accepted cutoff points for fit criteria (χ2(189) = 719.33, RMSEA = .082 (90% CI = .076–.089),CFI = .89, PCFI = .73).
In sum, these analyses showed that the model containing the four OCB dimensions and ethical leadership showed a good fit tothe data. Commonmethod variance plays a role in this model, but this is not surprising given that the OCB items were all assessedby the same focal employee at the same point in time. The model with ethical leadership and organizational deviance showed aless impressive but still almost sufficient fit. Given these results, and because our most important predictions were about thecurvilinear effects of ethical leadership on OCB, we decided to proceed with testing our hypotheses.
6.2.2. Hypotheses testsTable 3 shows descriptives and intercorrelations. Table 4 shows the results of the regression analyses. Results show that higher
ethical leadership was associated with reduced deviance. The squared ethical leadership term was, however, not related todeviance, revealing no evidence for a curvilinear relationship between ethical leadership and employee deviance. This supportsHypothesis 1.
Further, ethical leadership was significantly positively related to OCB. Entering the squared ethical leadership term resulted invariance explained in addition to the linear ethical leadership term for OCB. More specifically, the relationship of OCB with ethicalleadership showed an inverted-U shape see Fig. 2. At lower levels, ethical leadership was positively related to OCB but at higherlevels, the relationship was negative.2 This supports Hypothesis 2.
6.3. Discussion
Results of Study 2 were consistent with the findings of Study 1 in which we showed a curvilinear effect of ethical leadershipand OCB. Even though we used a different method and a different measure of OCB we found consistent evidence that at lowerlevels of ethical leadership it was positively associated with OCB but at higher levels of ethical leadership, it was negatively relatedto OCB. Moreover, Study 2 also showed that ethical leadership is negatively related to employee deviance, suggesting that ethicalleadership has differential results with respect to stimulating positive (OCB) and decreasing negative (deviance) employeebehavior.
7. Study 3
Study 3 aimed to extend the results of Study 2 by assessing an additional deviance measure, that is, supervisor directeddeviance (in addition to organization directed deviance). This would allow us to generalize our findings more independently fromspecific measures. Furthermore, in order to generalize to different samples data were collected in a different country (US). Similarto Study 1, this study used a multi-source design. Focal employees indicated their supervisor's ethical leadership and co-workersindicated the focal employees' deviance and OCB.
2 Curvilinear effects can be sensitive to outliers in the data. We therefore scanned the data for outliers (i.e., standardized and studentized residuals >|3|) andinfluential cases (i.e., Cook's distances >1). Performing the analyses with or without these cases did not influence the significance or shape of the curvilineareffect in any of the three field studies.

OCB
Fig. 2. The curvilinear relation of ethical leadership and OCB in Study 2.
687J. Stouten et al. / The Leadership Quarterly 24 (2013) 680–695
7.1. Method
7.1.1. Sample and procedureA total of 336 individuals—168 focal employees and their matched co-workers—participated in the study as part of a snowball
sampling procedure (e.g., Grant & Mayer, 2009; Morgeson & Humphrey, 2006; Skarlicki & Folger, 1997). Researchers sent anelectronic message to 349 business major students in the US and asked them to help with a study for extra credit. Students whoworked at least 20 hours per week in a job were allowed to participate in the study; if they did not, they were asked to invite afamily member or close other to complete the survey. A total of 168 focal employees participated (a response rate of 48%). Weused the same procedure as in Study 1. That is, focal employees were instructed to visit a website to complete a survey, and tosend an electronic survey link to a co-worker familiar with their work. Here as well, we found no irregularities in the responses.
Participants were from a variety of different organizations in the Southeast U.S., including technology, government, insurance,financial, food service, retail, manufacturing, and medical organizations. The focal employees were 48% male and 65% Caucasian(19% Hispanic, 4% African-American, 3% Latino Latina, 1% biracial, and 5% Asian American; 3% indicated “another racialbackground”). The mean age was 24.09 years (SD = 5.76). Four percent of the respondents had only lower education (highschool), 55% had some college experience, and 42% had a college degree. The respondents worked, on average, for 2.34 years withtheir current organization (SD = 2.14). They worked on average for 1.65 years with their current supervisor (SD = 1.59).
The co-workers were 40% male. Sixty-seven percent were Caucasian (13% Hispanic, 8% African-American, 5% Latino/Latina,and 5% Asian American; 1% indicated “another racial background”). Fourteen percent of the co-workers indicated having onlylower education (high school), 42% had some college experience, 33% had a college degree, 5% were in graduate school and 5% hada master degree. They averaged 27.5 (SD = 9.66) years of age with 3.49 years of experience working in their organizations(SD = 3.81).
7.1.2. MeasuresAll items employed the same seven-point rating scale format (1 = strongly disagree; 7 = strongly agree).
Table 3Study 2: Means, standard deviations and intercorrelations.
Mean SD 1 2 3 4 5 6 7
1. Sex – –
2. Age 44.00 10.55 .10*3. Education – – − .21 .22**4. Tenure 5.73 6.85 .00 − .40** − .18**5. Position 3.68 2.21 .04 − .06 − .17** .056. Ethical Leadership 2.49 .68 − .06 .03 − .07 .08 .027. Deviance 1.49 .48 − .11** − .14** − .01 .03 − .02 − .22***8. OCB 2.22 .43 .06 .09 − .07 − .08 .17** .22** − .26
*p b .05, **p b .01, ***p b .001.

Table 4Study 2: Regression results for ethical leadership.
Deviance OCB
Model Beta T R2 change Beta t R2 change
1 Sex − .10* −2.06 .04 .89Age .13* 2.31 .07 1.27Education .05 .93 − .04 − .84Tenure − .11* −2.02 − .08 −1.59Position .01 .18 .16** 3.38Ethical leadership − .17** −3.57 .21** 4.30
2 .01 .05**Sex − .10* −2.04 .05 1.00Age .01 .38 .09 1.65Education .05 .90 − .04 − .74Tenure − .11* −2.02 − .06 −1.10Position .01 .18 .16** 3.41Ethical leadership − .20** −3.99 .28** 5.70Ethical leadership squared .05 1.70 − .24** −4.85
*p b .05, **p b .001.
688 J. Stouten et al. / The Leadership Quarterly 24 (2013) 680–695
7.1.2.1. Ethical leadership. Focal employees indicated their supervisor's ethical leadership by responding to the same scale that wasalso used in Studies 1 and 2 (Cronbach's α = .95).
7.1.2.2. Deviance. Co-workers indexed the focal employee's organizational deviancewith the same scale that was also used in Study2 (Cronbach's α = .94). Co-workers also indexed the focal employee's supervisor-directed deviance with Mitchell and Ambrose's(2007) 10 item scale. Sample items include “This employee gossiped about my supervisor,” and “This employee swore at mysupervisor” (Cronbach's α = .94).
7.1.2.3. OCB. Co-workers indexed the focal employee's OCB with Lee and Allen's (2002) eight item OCB scale (Cronbach's α = .96).
7.2. Results
7.2.1. Measurement modelLike in Studies 1 and 2, we first conducted CFAs to test our measurement model at the item level. The initial measurement
model had four latent factors and 40 indicators (i.e., ethical leadership, organizational deviance, supervisor directed deviance, andOCB). We estimated a model with these four latent variables as well as a one-factor model in which all items loaded onto onefactor. We also fitted a five-factor model, which included the four latent variables together with a common method factor thatwas uncorrelated to the theoretically derived factors. To judge the goodness of fit of the measurement model, we relied on thesame indices as in Studies 1 and 2.
The four-factormodel did not fit the datawell (χ2(734) = 1953.16, RMSEA = .123 (90% CI = .116–.130), CFI = .76, PCFI = .71).The fit of the one-factor model was clearly insufficient (χ2(742) = 3702.16, RMSEA = .190 (90% CI = .184–.197), CFI = .41, PCFI =.39). The five-factor model (adding a common method factor to the four-factor model), fitted the data best, but the fit of this modelwas still clearly below accepted standards (χ2(695) = 1620.23, RMSEA = .110 (90% CI = .103–.117), CFI = .82, PCFI = .73).
To investigate the reason behind the less than optimal fit of the four and five factor models, we proceeded by consideringwhich of the dependent variables compromised model fit most significantly.
A model without organizational deviance in the analyses showed unacceptable fit (χ2(347) = 794.21, RMSEA = .108 (90%CI = .098–.118), CFI = .86, PCFI = .79). The same model but now with also a method factor as part of the analysis showedacceptable fit (χ2(320) = 622.76, RMSEA = .093 (90% CI = .082–.104), CFI = .91, PCFI = .77).
A model without supervisor directed deviance showed unacceptable fit to the data (χ2(420) = 934.50, RMSEA = .110 (90%CI = .100–.119), CFI = .84, PCFI = .77). The same model but now with also a method factor as part of the analysis showedimproved, but still barely acceptable fit (χ2(372) = 766.55, RMSEA = .098 (90% CI = .088–.108), CFI = .88, PCFI = .75).
A model without OCB showed clearly unacceptable fit (χ2(461) = 1434.50, RMSEA = .139 (90% CI = .130–.147), CFI = .75,PCFI = .70). The same model but now with also a method factor as part of the analysis showed also unacceptable fit (χ2(430) =1111.78, RMSEA = .120 (90% CI = .111–.129), CFI = .82, PCFI = .71).
A model without supervisor directed deviance and organizational deviance (and thus only OCB and ethical leadershipincluded) fit the data well (χ2(134) = 233.09, RMSEA = .082 (90% CI = .064–.099), CFI = .95, PCFI = .83). The same model butnow with also a method factor as part of the analysis showed clearly acceptable fit (χ2(116) = 163.05, RMSEA = .061 (90% CI =.037–.082), CFI = .98, PCFI = .74).
In sum, like in Study 1, the model that contains our primary dependent variable (OCB) together with the independent variable(ethical leadership) shows a superior fit to the data, relative to all other models. Furthermore, this model also shows littleevidence for the operation of common method variance: CFI and RMSEA are slightly higher for the model containing a method

689J. Stouten et al. / The Leadership Quarterly 24 (2013) 680–695
factor, but PCFI (which explicitly “punishes” model complexity) is clearly lower (and, in fact, unacceptably low) in the modelcontaining a method factor, relative to the model that does not contain this factor. This is not surprising given that ethicalleadership and OCB were indexed by two different sources.
Furthermore, like in Study 2, including deviance in the model resulted in clearly lowered fit. We thus decided to proceed withour hypotheses tests, which are mostly concerned with the curvilinear effects of ethical leadership on active cooperativebehaviors like OCB. We will also use deviance as a dependent variable in our analyses, but the reader should interpret theseanalyses with more caution.
7.2.2. Hypotheses testsTable 5 shows descriptive statistics and intercorrelations. Regression results are presented in Table 6. These analyses showed
that the linear term of ethical leadership significantly predicted supervisor- as well as organization-directed deviance such thatdeviance was lower when ethical leadership was higher. We found no evidence for a curvilinear relationship between devianceand ethical leadership. This supports Hypothesis 1.
The linear effect of ethical leadership was also significantly related to OCB. Furthermore, after entering the squared ethicalleadership term, it explained additional variance and revealed significant relationships for OCB. More specifically, the relationshipfor OCB showed an inverted-U pattern (see Fig. 3).2 This supports Hypotheses 3.
7.3. Discussion
Study 3 again showed consistent results with the previous studies by showing a curvilinear relation of ethical leadership andOCB. Moreover, this study replicated the previous findings in a different country (US) which enables us to generalize findingsacross different sample characteristics. Moreover, like Study 2, results showed a linear negative relation of ethical leadership andemployee deviance. Here, we extended organizational deviance with supervisor-directed deviance for which ethical leadershipalso showed a negative linear relation.
8. Study 4
In a fourth study, we wished to examine the unintended negative effect of high ethical leadership on deviance and OCB.Further, we focused on the underlying process of perceptions of moral reproach (Monin et al., 2008) to be able to explain therelation of ethical leadership and OCB. A vignette experiment was used, which provides the possibility to increase internal validityand to infer causality (e.g Burris, 2012).
8.1. Method
8.1.1. Participants and procedureEighty-seven undergraduate business students from a European university participated voluntarily. Participants were 50.6%
male and on average 20 years old (SD = 2.16). They had an average work experience of 2.5 years (SD = 2.13). After their arrivalin the lab, they were welcomed by the experimenter. All instructions were given on paper. We employed a between-subjectdesign by assigning our participants on a random basis to one of three conditions of ethical leadership (low, moderate, or high).Participants were asked to place themselves in the situation of an employee in a company and were given a description of theirsupervisor. Then, our manipulation of ethical leadership commenced. This manipulation was based on the conception of ethicalleadership by Brown et al. (2005). In the low ethical leadership condition, their supervisor was described as a person who doesnot make fair and balanced decisions:
Table 5Study 3
1. Sex2. Age3. Edu4. Org5. Sup6. Eth7. Org8. Sup9. OC
*p b .05
“René is a supervisor who doesn't believe in doing the “right” thing in terms of ethics. That is why René often makescompromises regarding ethics. Many will describe René as a person who never makes ethical decisions. René never doeswhat he says regarding ethics and hardly ever consistently acts according to own ethical values if it comes to taking
: Means, standard deviations and intercorrelations.
Mean SD 1 2 3 4 5 6 7 8
– –
24.09 5.76 − .00cation – – − .04 .32**⁎
anization tenure 2.34 2.14 − .17* .42** .10*ervisor tenure 1.65 1.59 − .08 .41** .16* .71**ical Leadership 5.19 1.21 .02 − .02 .02 .01 .02anizational deviance 1.79 .92 − .13 − .10 .03 − .08 − .06 − .31**ervisor directed deviance 1.78 1.11 − .18* − .07 − .05 .04 .02 − .30** .79**B 5.49 1.22 .08 − .05 − .01 − .03 − .07⁎ .37** − .52** − .46**
; **p b .01.

Table 6Study 3: Regression results for ethical leadership.
Organizational deviance Supervisor directed deviance OCB
Model Beta t R2 change Beta t R2 change Beta t R2 change
1 Sex − .07 − .96 − .12 − .60 .07 .98Age − .16 1.64 − .16 1.67 − .01 − .16Education .10 1.21 − .03 − .35 .02 .27Supervisor tenure − .01 − .09 .03 .25 − .12 −1.16Organization tenure .03 .24 .14 1.28 .06 .54Ethical Leadership − .32*** −3.99 − .29 −3.66 .38*** 5.24
2 .00 .01 .03*Sex − .07 − .94 − .11 − .54 .08 1.21Age − .16 -1.65 − .16 −1.66 − .01 − .13Education .10 1.32 − .02 − .20 .06 .77Supervisor tenure − .01 − .10 .02 .80 − .12 −1.24Organization tenure .04 .35 .16 1.42 .06 .61Ethical leadership − .36*** −4.17 − .36*** −4.08 .19* 2.43Ethical leadership squared − .09 −1.33 − .12 −1.71 − .38*** −4.84
*p b .05, **p b .01, ***p b .001.
690 J. Stouten et al. / The Leadership Quarterly 24 (2013) 680–695
decisions. This is the reason that René tolerates violations of ethical standards. When faced with dilemmas at work, Renésays “get it done by any means.”
In the high ethical leadership condition, their supervisor was described as a person who makes fair and balanced decisions, aperson of integrity, who walks the talk, and someone who does not tolerate any violation of ethical standards:
“René is a supervisor who very strongly believes in doing the “right” thing in terms of ethics without making compromises.René likes to be seen as a person who always takes ethical decisions. René always does what he says regarding ethics andconsistently acts according to own ethical values if it comes to taking decisions. This is the reason that René does nottolerate any violations of his ethical standards. When faced with dilemmas at work, René asks “what is the right thing todo?”
In the moderate ethical leadership condition, their supervisor is described as a person who is concerned with ethics:
“René is a supervisor who believes in doing it “right” in terms of ethics. That is why René (depending on the exactsituation) evaluates the necessity to make a compromise or not in terms of ethics. Many like to see René as a person whoconsiders it important to make ethical decisions (but not at all costs and consequences). René tries to walk the talk andaims to be consistent with everyone's ethical values if it comes to taking decisions. When faced with dilemmas at work,René asks “what is the right and ethical thing to do in this particular situation?”
OCB
Fig. 3. The curvilinear relation of ethical leadership and OCB in Study 3.

691J. Stouten et al. / The Leadership Quarterly 24 (2013) 680–695
8.1.2. MeasuresAll items were assessed using a 7-point Likert scale ranging from 1 (not at all) to 7 (very much so). First, we measured
participants' perceptions of moral reproach (cf. Minson & Monin, 2012). Participants were asked to what extent they consideredthe leader to look down upon them, to be moral equals (reversed), and to trust them for their ethical judgment (Cronbachs'alpha = .66). Second, participants' deviance (cf. Bennett & Robinson, 2000) was measured by asking for the extent they wouldcome in late at work without notice and refuse to pass on information to others in the situation described in the vignette(Cronbachs' alpha = .79). Finally, interpersonally oriented OCB (cf. Moorman & Blakely, 1995) was measured by askingparticipants whether they would be motivated and willing to help their co-workers (Cronbachs' alpha = .91) if they worked forthe supervisor described in the vignette.
8.2. Results
In order to test for the effectiveness of the manipulation of ethical leadership independent of the measurement of perceptionsof moral reproach and OCB we used a different sample of participants (i.e., to avoid demand characteristics). Eighty-fiveundergraduate students participated voluntarily in a between-subject design in which ethical leadership was manipulated (low,moderate, and high) using the exact same manipulations as those used in the main study. We measured the extent to whichparticipants considered the leader to be ethical with four items: “to what extent to you consider this leader to be “ethical”, “true tohis/her own values”, “moral”, and “principled” (Cronbachs' alpha = .96). An ANOVA on the extent to which participantsconsidered the leader to be ethical showed a significant effect, F(2, 82) = 156.74, p b .001. Post-hoc tests showed that low ethicalleaders (M = 2.14; SD = .94) were perceived to be lower on ethicality than moderate (M = 5.18; SD = .79), p b .001, and highethical leaders (M = 5.68; SD = .69), p b .001. Moderate ethical leaders were also found to be significantly lower on ethicalitythan high ethical leaders, p b .05. These results show that the manipulation of ethical leadership was successful.
To test our first hypothesis concerning the relation of ethical leadership and deviance we performed an ANOVA, whichrevealed a significant effect for ethical leadership, F(2, 84) = 11.46, p b .001. Post-hoc tests showed that low ethical leadership(M = 3.22; SD = 1.56) resulted in more deviance than moderate ethical leadership (M = 1.87; SD = .59), p b .001, and highethical leadership (M = 2.16; SD = 1.07), p b .001. Moderate and high ethical leadership did not significantly differ from eachother, p > .30. This offers support Hypothesis 1.
An ANOVA showed a significant effect for ethical leadership on perceptions of moral reproach, F(2, 84) = 24.20, p b .001.Post-hoc tests showed that moderate ethical leadership (M = 2.62; SD = .87) was perceived as lower on perceptions of moralreproach than high ethical leadership (M = 3.80; SD = 1.10), p b .001, and low ethical leadership (M = 4.57; SD = 1.27), p b .001.High and low ethical leadership also significantly differed from each other, p b .05. Given these differences between the differentlevels, we tested for the curvilinear relation using polynomial contrasts. Results showed that the effect of ethical leadership onperceptions of moral reproach supports a curvilinear pattern (95% CI [.88, 1.68]). This offers support for Hypothesis 3.
Similarly, for OCB an ANOVA showed a significant effect for ethical leadership, F(2, 84) = 12.56, p b .001. Post-hoc testsshowed that moderate ethical leadership (M = 5.15; SD = .88) resulted in higher OCB than high ethical leadership (M = 4.30;SD = 1.36), p b .001, and low ethical leadership (M = 3.33; SD = 1.81), p b .024. Further, high and low ethical leadership alsodiffered significantly, p b .05. Polynomial contrasts here also showed that the effect of ethical leadership on OCB showed acurvilinear pattern (95% CI [−1.60, − .58]). This supports Hypothesis 2.
Furthermore, in order to test for mediation on OCB, an ANCOVA with perceptions of moral reproach as a covariate showed asignificant effect for perceptions of moral reproach F(1, 83) = 22.54, p b .001, but ethical leadership became nonsignificant, F(2,84) = 1.59, p > .20. A Sobel-test showed that the indirect effect was significant (Sobel = 2.23, p b .05). Bootstrap mediationtests (Preacher & Hayes, 2008) also showed that perceptions of moral reproach mediated the effect of ethical leadership on OCB.Specifically, perceptions of moral reproach mediated on low (95% CI [.88, 2.77]), moderate (95% CI [.09, .50]), and high ethicalleadership (95% CI [−2.16, − .56]). This supports Hypothesis 4.
8.3. Discussion
Consistent with the previous studies, our results showed that high ethical leaders decreased participants' deviance incomparison to low ethical leaders. Further, the results pointed out that high relative to moderate ethical leaders were perceived asmorally reproaching participants' values andmorality. Further, we also showed that low ethical leaders were perceived to morallyreproach participants' values more than moderate ethical leaders. Similar to high ethical leaders, people may have felt that lowethical leaders looked down upon their principles and values possibly because employees needed to downplay their ethicalbehavior to reach the leader's low normative standards. This study also revealed that ethical leadership showed a curvilinearpattern for people's OCB. Moderate ethical leaders were found to encourage OCB more than low and high ethical leaders.Moreover, perceptions of moral reproach explained (mediated) this pattern on OCB. In relation to the previous studies that testedour hypotheses in an organizational sample, this study tested and showed the causal relations.
9. General discussion
Our research – at least to our knowledge – is the first to explicitly address unintended negative effects of ethical leadership.Across three studies, using different methodologies (i.e., experimental, single and multisource studies) and conducted in three
692 J. Stouten et al. / The Leadership Quarterly 24 (2013) 680–695
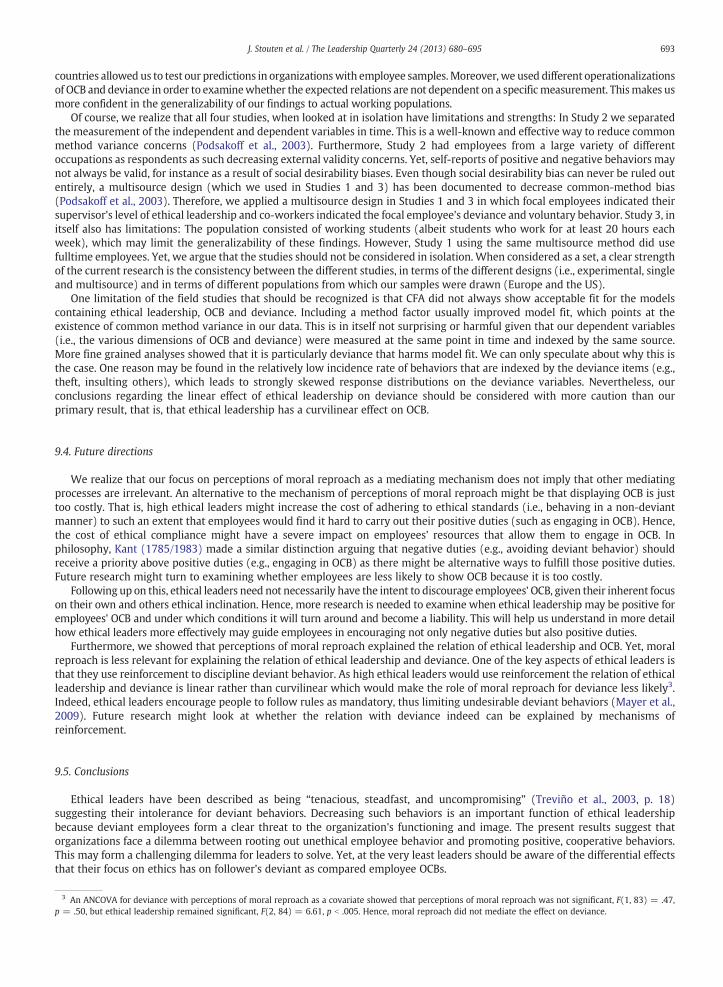
different countries (i.e., Belgium [Studies 1 and 4], the Netherlands, [Study 2], and the US [Study 3), we showed that ethicalleadership is linearly related to employee deviance. In line with prior work, deviance was shown to be lower at higher levels ofethical leadership (e.g. Mayer et al., 2009). However, ethical leadership revealed an inverted U-shaped relationship with OCB. Inother words, at lower levels of ethical leadership OCB increases, whereas at higher levels OCB decreases. Moreover, we couldshow that perceptions of moral reproach underlie this curvilinear relation. In the following sections, we will discuss thesefindings.
9.1. Theoretical implications
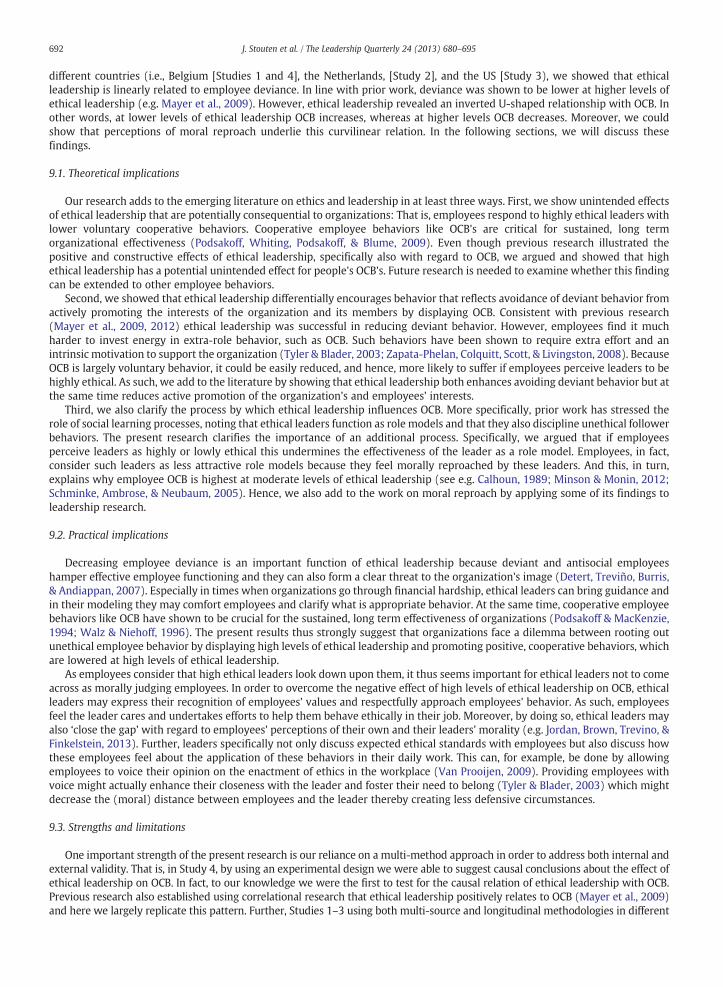
Our research adds to the emerging literature on ethics and leadership in at least three ways. First, we show unintended effectsof ethical leadership that are potentially consequential to organizations: That is, employees respond to highly ethical leaders withlower voluntary cooperative behaviors. Cooperative employee behaviors like OCB's are critical for sustained, long termorganizational effectiveness (Podsakoff, Whiting, Podsakoff, & Blume, 2009). Even though previous research illustrated thepositive and constructive effects of ethical leadership, specifically also with regard to OCB, we argued and showed that highethical leadership has a potential unintended effect for people's OCB's. Future research is needed to examine whether this findingcan be extended to other employee behaviors.
Second, we showed that ethical leadership differentially encourages behavior that reflects avoidance of deviant behavior fromactively promoting the interests of the organization and its members by displaying OCB. Consistent with previous research(Mayer et al., 2009, 2012) ethical leadership was successful in reducing deviant behavior. However, employees find it muchharder to invest energy in extra-role behavior, such as OCB. Such behaviors have been shown to require extra effort and anintrinsic motivation to support the organization (Tyler & Blader, 2003; Zapata-Phelan, Colquitt, Scott, & Livingston, 2008). BecauseOCB is largely voluntary behavior, it could be easily reduced, and hence, more likely to suffer if employees perceive leaders to behighly ethical. As such, we add to the literature by showing that ethical leadership both enhances avoiding deviant behavior but atthe same time reduces active promotion of the organization's and employees' interests.
Third, we also clarify the process by which ethical leadership influences OCB. More specifically, prior work has stressed therole of social learning processes, noting that ethical leaders function as role models and that they also discipline unethical followerbehaviors. The present research clarifies the importance of an additional process. Specifically, we argued that if employeesperceive leaders as highly or lowly ethical this undermines the effectiveness of the leader as a role model. Employees, in fact,consider such leaders as less attractive role models because they feel morally reproached by these leaders. And this, in turn,explains why employee OCB is highest at moderate levels of ethical leadership (see e.g. Calhoun, 1989; Minson & Monin, 2012;Schminke, Ambrose, & Neubaum, 2005). Hence, we also add to the work on moral reproach by applying some of its findings toleadership research.
9.2. Practical implications
Decreasing employee deviance is an important function of ethical leadership because deviant and antisocial employeeshamper effective employee functioning and they can also form a clear threat to the organization's image (Detert, Treviño, Burris,& Andiappan, 2007). Especially in times when organizations go through financial hardship, ethical leaders can bring guidance andin their modeling they may comfort employees and clarify what is appropriate behavior. At the same time, cooperative employeebehaviors like OCB have shown to be crucial for the sustained, long term effectiveness of organizations (Podsakoff & MacKenzie,1994; Walz & Niehoff, 1996). The present results thus strongly suggest that organizations face a dilemma between rooting outunethical employee behavior by displaying high levels of ethical leadership and promoting positive, cooperative behaviors, whichare lowered at high levels of ethical leadership.
As employees consider that high ethical leaders look down upon them, it thus seems important for ethical leaders not to comeacross as morally judging employees. In order to overcome the negative effect of high levels of ethical leadership on OCB, ethicalleaders may express their recognition of employees' values and respectfully approach employees' behavior. As such, employeesfeel the leader cares and undertakes efforts to help them behave ethically in their job. Moreover, by doing so, ethical leaders mayalso ‘close the gap’ with regard to employees' perceptions of their own and their leaders' morality (e.g. Jordan, Brown, Trevino, &Finkelstein, 2013). Further, leaders specifically not only discuss expected ethical standards with employees but also discuss howthese employees feel about the application of these behaviors in their daily work. This can, for example, be done by allowingemployees to voice their opinion on the enactment of ethics in the workplace (Van Prooijen, 2009). Providing employees withvoice might actually enhance their closeness with the leader and foster their need to belong (Tyler & Blader, 2003) which mightdecrease the (moral) distance between employees and the leader thereby creating less defensive circumstances.
9.3. Strengths and limitations
One important strength of the present research is our reliance on a multi-method approach in order to address both internal andexternal validity. That is, in Study 4, by using an experimental design we were able to suggest causal conclusions about the effect ofethical leadership on OCB. In fact, to our knowledge we were the first to test for the causal relation of ethical leadership with OCB.Previous research also established using correlational research that ethical leadership positively relates to OCB (Mayer et al., 2009)and here we largely replicate this pattern. Further, Studies 1–3 using both multi-source and longitudinal methodologies in different
693J. Stouten et al. / The Leadership Quarterly 24 (2013) 680–695
countries allowed us to test our predictions in organizationswith employee samples.Moreover, we used different operationalizationsof OCB and deviance in order to examinewhether the expected relations are not dependent on a specificmeasurement. Thismakes usmore confident in the generalizability of our findings to actual working populations.
Of course, we realize that all four studies, when looked at in isolation have limitations and strengths: In Study 2 we separatedthe measurement of the independent and dependent variables in time. This is a well-known and effective way to reduce commonmethod variance concerns (Podsakoff et al., 2003). Furthermore, Study 2 had employees from a large variety of differentoccupations as respondents as such decreasing external validity concerns. Yet, self-reports of positive and negative behaviors maynot always be valid, for instance as a result of social desirability biases. Even though social desirability bias can never be ruled outentirely, a multisource design (which we used in Studies 1 and 3) has been documented to decrease common-method bias(Podsakoff et al., 2003). Therefore, we applied a multisource design in Studies 1 and 3 in which focal employees indicated theirsupervisor's level of ethical leadership and co-workers indicated the focal employee's deviance and voluntary behavior. Study 3, initself also has limitations: The population consisted of working students (albeit students who work for at least 20 hours eachweek), which may limit the generalizability of these findings. However, Study 1 using the same multisource method did usefulltime employees. Yet, we argue that the studies should not be considered in isolation.When considered as a set, a clear strengthof the current research is the consistency between the different studies, in terms of the different designs (i.e., experimental, singleand multisource) and in terms of different populations from which our samples were drawn (Europe and the US).
One limitation of the field studies that should be recognized is that CFA did not always show acceptable fit for the modelscontaining ethical leadership, OCB and deviance. Including a method factor usually improved model fit, which points at theexistence of common method variance in our data. This is in itself not surprising or harmful given that our dependent variables(i.e., the various dimensions of OCB and deviance) were measured at the same point in time and indexed by the same source.More fine grained analyses showed that it is particularly deviance that harms model fit. We can only speculate about why this isthe case. One reason may be found in the relatively low incidence rate of behaviors that are indexed by the deviance items (e.g.,theft, insulting others), which leads to strongly skewed response distributions on the deviance variables. Nevertheless, ourconclusions regarding the linear effect of ethical leadership on deviance should be considered with more caution than ourprimary result, that is, that ethical leadership has a curvilinear effect on OCB.
9.4. Future directions
We realize that our focus on perceptions of moral reproach as a mediating mechanism does not imply that other mediatingprocesses are irrelevant. An alternative to the mechanism of perceptions of moral reproach might be that displaying OCB is justtoo costly. That is, high ethical leaders might increase the cost of adhering to ethical standards (i.e., behaving in a non-deviantmanner) to such an extent that employees would find it hard to carry out their positive duties (such as engaging in OCB). Hence,the cost of ethical compliance might have a severe impact on employees' resources that allow them to engage in OCB. Inphilosophy, Kant (1785/1983) made a similar distinction arguing that negative duties (e.g., avoiding deviant behavior) shouldreceive a priority above positive duties (e.g., engaging in OCB) as there might be alternative ways to fulfill those positive duties.Future research might turn to examining whether employees are less likely to show OCB because it is too costly.
Following up on this, ethical leaders need not necessarily have the intent to discourage employees' OCB, given their inherent focuson their own and others ethical inclination. Hence, more research is needed to examine when ethical leadership may be positive foremployees' OCB and under which conditions it will turn around and become a liability. This will help us understand in more detailhow ethical leaders more effectively may guide employees in encouraging not only negative duties but also positive duties.
Furthermore, we showed that perceptions of moral reproach explained the relation of ethical leadership and OCB. Yet, moralreproach is less relevant for explaining the relation of ethical leadership and deviance. One of the key aspects of ethical leaders isthat they use reinforcement to discipline deviant behavior. As high ethical leaders would use reinforcement the relation of ethicalleadership and deviance is linear rather than curvilinear which would make the role of moral reproach for deviance less likely3.Indeed, ethical leaders encourage people to follow rules as mandatory, thus limiting undesirable deviant behaviors (Mayer et al.,2009). Future research might look at whether the relation with deviance indeed can be explained by mechanisms ofreinforcement.
9.5. Conclusions
Ethical leaders have been described as being “tenacious, steadfast, and uncompromising” (Treviño et al., 2003, p. 18)suggesting their intolerance for deviant behaviors. Decreasing such behaviors is an important function of ethical leadershipbecause deviant employees form a clear threat to the organization's functioning and image. The present results suggest thatorganizations face a dilemma between rooting out unethical employee behavior and promoting positive, cooperative behaviors.This may form a challenging dilemma for leaders to solve. Yet, at the very least leaders should be aware of the differential effectsthat their focus on ethics has on follower's deviant as compared employee OCBs.
3 An ANCOVA for deviance with perceptions of moral reproach as a covariate showed that perceptions of moral reproach was not significant, F(1, 83) = .47,p = .50, but ethical leadership remained significant, F(2, 84) = 6.61, p b .005. Hence, moral reproach did not mediate the effect on deviance.

694 J. Stouten et al. / The Leadership Quarterly 24 (2013) 680–695
Acknowledgment
This work was supported by STRT1/10/013TBA from the Research Fund of the Katholieke Universiteit Leuven awarded to thefirst and last author and Innovation grant 42009 from the European Science Fund awarded to the first author.
References
Anderson, J., & Gerbing, D. (1998). Structural equation modeling in practice: A review and recommended two-step approach. Psychological Bulletin, 103, 411–423.Aquino, K., Freeman, D., Reed, A. I. I., Lim, V. K. G., & Felps, W. (2009). Testing a social cognitive model of moral behavior: The interaction of situational factors and
moral identity centrality. Journal of Personality and Social Psychology, 97, 123–141.Bandalos, D. L., & Finney, S. J. (2001). Items parceling issues in structural equation modeling. In G. A. Marcoulides, & R. S. Schumaker (Eds.), New developments and
techniques in structural equation modeling. Mahwah, NJ: Erlbaum.Bandura, A. (1986). Social foundations of thought and action: A social cognitive view. Englewood Cliffs, NJ: Prentice-Hall.Bass, B. M. (1999). Two decades of research and development in transformational leadership. European Journal of Work and Organizational Psychology, 8, 9–32.Bennett, R. J., & Robinson, S. L. (2000). Development of a measure of workplace deviance. Journal of Applied Psychology, 85, 349–360.Bentler, P. M. (1990). Comparative fit indices in structural models. Psychological Bulletin, 107, 238–246.Brown, M. E., Treviño, L. K., & Harrison, D. A. (2005). Ethical leadership: A social learning perspective for construct development and testing. Organizational
Behavior and Human Decision Processes, 97(2), 117–134.Burris, E. R. (2012). The risks and rewards of speaking up: Managerial responses to employee voice. Academy of Management Journal, 55, 851–875, http:
//dx.doi.org/10.5465/amj.2010.0562.Calhoun, C. (1989). Responsibility and reproach. Ethics, 99, 389–406.Cohen, P., Cohen, J., Aiken, L. S., & West, S. G. (2002). Applied multiple regression/correlation analysis for the behavioral sciences (3rd ed.). Mahwah, NJ: Lawrence
Erlbaum.De Hoogh, A., & Den Hartog, D. (2008). Ethical and despotic leadership, relationships with leader's social responsibility, top management team effectiveness and
subordinates' optimism: A multi-method approach. The Leadership Quarterly, 19, 297–311.Detert, J. R., Treviño, L. K., Burris, E. R., & Andiappan, M. (2007). Managerial modes of influence and counterproductivity in organizations: A longitudinal
business-unit-level investigation. Journal of Applied Psychology, 92, 993–1005.Evans, M. G. (1985). A Monte Carlo study of the effects of correlated method variance in moderated multiple regression analysis. Organizational Behavior and
Human Decision Processes, 36, 305–323.Gini, A. (1998). Moral leadership and business ethics. In J. B. Ciulla (Ed.), Ethics, the heart of leadership. Westport, CT: Quorum.Grant, A. M., & Mayer, D. M. (2009). Good soldiers and good actors: Prosocial and impression management motives as interactive predictors of affiliative
citizenship behaviors. Journal of Applied Psychology, 94(4), 900–912.Homans, G. C. (1961). Social Behavior: Its Elementary Forms. New York: Harcourt, Brace & World.Jordan, J., Brown, M. E., Trevino, L. K., & Finkelstein, S. (2013). Someone to look up to: executive-follower ethical reasoning and perceptions of ethical leadership.
Journal of Management, 39, 660–683.Kant, I. (1785/1983). Grounding for the metaphysics of morals (J. W. Ellington, Trans.). Indianapolis: Hackett.Kanungo, R. N. (2001). Ethical values of transactional and transformational leaders. Canadian Journal of Administrative Sciences, 18, 257–265.Lee, K., & Allen, N. J. (2002). Organizational citizenship behavior and workplace deviance: The role of affect and cognitions. Journal of Applied Psychology, 87, 131–142.Mayer, D. M., Aquino, K., Greenbaum, R. L., & Kuenzi, M. (2012). Who displays ethical leadership and why does it matter: An examination of antecedents and
consequences of ethical leadership. Academy of Management Journal, 55, 151–171.Mayer, D. M., Kuenzi, M., Greenbaum, R., Bardes, M., & Salvador, R. (2009). How low does ethical leadership flow? Test of a trickle-down model. Organizational
Behavior and Human Decision Processes, 108, 1–13.Minson, J. A., & Monin, B. (2012). Do-gooder derogation: Disparaging morally motivated minorities to defuse anticipated reproach. Social Psychological and
Personality Science, 3, 200–207.Mitchell, M. S., & Ambrose, M. L. (2007). Abusive supervision and workplace deviance and the moderating effects of negative reciprocity beliefs. Journal of Applied
Psychology, 92, 1159–1168.Monin, B., Sawyer, P. J., & Marquez, M. J. (2008). The rejection of moral rebels: Resenting those who do the right thing. Journal of Personality and Social Psychology,
95(1), 76–93, http://dx.doi.org/10.1037/0022-3514.95.1.76.Moorman, R. H., & Blakely, G. L. (1995). Individualism–collectivism as an individual difference predictor of organizational citizenship behavior. Journal of
Organizational Behavior, 16, 127–142.Morgeson, F. P., & Humphrey, S. E. (2006). The Work Design Questionnaire (WDQ): Developing and validating a comprehensive measure for assessing job design
and the nature of work. Journal of Applied Psychology, 91(6), 1321–1339.Mulaik, S. A., James, L. R., Van Alstine, J., Bennett, N., Lind, S., & Stilwell, C. D. (1989). Evaluation of goodness-of-fit indices for structural equation models.
Psychological Bulletin, 105, 430–445.Organ, D. W. (1988). Organizational citizenship behavior: The good soldier syndrome. Lexington, MA: Lexington Books.Podsakoff, P. M., & MacKenzie, S. B. (1994). Organizational citizenship behaviors and sales unit effectiveness. Journal of Marketing Research, 3, 351–363.Podsakoff, P. M., MacKenzie, S. B., Lee, J. Y., & Podsakoff, N. P. (2003). Common method biases in behavioral research: A critical review of the literature and
recommended remedies. Journal of Applied Psychology, 88(5), 879–903.Podsakoff, N. P., Whiting, S. W., Podsakoff, P. M., & Blume, B. D. (2009). Individual- and organizational-level consequences of organizational citizenship behaviors:
A meta-analysis. Journal of Applied Psychology, 94, 122–141.Preacher, K., & Hayes, A. (2008). Asymptotic and resampling strategies for assessing and comparing indirect effects in multiple mediator models. Behavior
Research Methods, 40, 879–891.Rhoades, L., Eisenberger, R., & Armeli, S. (2001). Affective commitment to the organization: The contribution of perceived organizational support. Journal of
Applied Psychology, 86, 825–836.Riggio, R. E., Zhu, W., Reina, C., & Maroosis, J. a (2010). Virtue-based measurement of ethical leadership: The Leadership Virtues Questionnaire. Consulting
Psychology Journal: Practice and Research, 62, 235–250, http://dx.doi.org/10.1037/a0022286.Rollins, B. C., & Thomas, D. L. (1979). Parental support, power, and control techniques in the socialization of children. In W. R. Burr, R. Hill, F. I. Nye, & I. L. Reiss
(Eds.), Contemporary theories about the family, Vol. 1, New York: Free Press.Sabini, J., & Silver, M. (1982). Moralities of everyday life. Oxford: University Press.Schminke, M., Ambrose, M. L., & Neubaum, D. O. (2005). The effect of leader moral development on ethical climate and employee attitudes. Organizational
Behavior and Human Decision Processes, 97, 135–151.Skarlicki, D. P., & Folger, R. (1997). Retaliation in the workplace: The roles of distributive, procedural, and interactional justice. Journal of Applied Psychology, 82,
434–443.Smith, C. A., Organ, D. W., & Near, J. P. (1983). Organizational citizenship behavior: Its nature and antecedents. Journal of Applied Psychology, 68(4), 653–663.Steiger, J. H. (1990). Structural model evaluation and modification: An interval estimation approach. Multivariate Behavioral Research, 25, 173–180.Treviño, L. K., Brown, M., & Hartman, L. P. (2003). A qualitative investigation of perceived executive ethical leadership: Perceptions from inside and outside the
executive suite. Human Relations, 56(1), 5–37.

695J. Stouten et al. / The Leadership Quarterly 24 (2013) 680–695
Treviño, L. K., Hartman, L. P., & Brown, M. (2000). Moral person and moral manager: How executives develop a reputation for ethical leadership. CaliforniaManagement Review, 42(4), 128–142.
Tyler, T. R., & Blader, S. (2003). The group engagement model: Procedural justice, social identity, and cooperative behavior. Personality and Social PsychologyReview, 7, 349–361.
Van Dijke, M. H., De Cremer, D., Mayer, D. A., & van Quaquebeke, N. (2012). When does procedural fairness promote organizational citizenship behavior?:Integrating empowering leadership types in relational justice models. Organizational Behavior and Human Decision Processes, 117, 235–248.
Van Prooijen, J.-W. (2009). Procedural justice as autonomy regulation. Journal of Personality and Social Psychology, 96, 1166–1180.Walumbwa, F. O., Avolio, B. J., Gardner, W. L., Wernsing, T., & Peterson, S. J. (2008). Authentic leadership: Development and validation of a theory-based measure.
Journal of Management, 34, 89–126.Walumbwa, F. O., & Schaubroeck, J. (2009). Leader personality traits and employee voice behavior: Mediating roles of ethical leadership and work group
psychological safety. Journal of Applied Psychology, 94(5), 1275–1286.Walz, S. M., & Niehoff, B. P. (1996). Organizational citizenship behaviors and their effect on organizational effectiveness in limited-menu restaurants. In J. B. Keys,
& L. N. Dosier (Eds.), Academy of management best papers proceedings (pp. 307–311).Zapata-Phelan, C. P., Colquitt, J. A., Scott, B. A., & Livingston, B. (2008). Procedural justice, interactional justice, and task performance: The mediating role of
intrinsic motivation. Organizational Behavior and Human Decision Processes, 108, 93–105.