
CAMPO Journal of Biomedical Optics 2014
11
Digital image correlation for full-field time-resolved assessment of arterial stiffness Adriaan Campo Joris Soons Hilde Heuten Guy Ennekens Inge Goovaerts Christiaan Vrints Pascal Lava Joris Dirckx
Transcript of CAMPO Journal of Biomedical Optics 2014
Digital image correlation for full-fieldtime-resolved assessment of arterialstiffness
Adriaan CampoJoris SoonsHilde HeutenGuy EnnekensInge GoovaertsChristiaan VrintsPascal LavaJoris Dirckx
Digital image correlation for full-field time-resolvedassessment of arterial stiffness
Adriaan Campo,a,* Joris Soons,a Hilde Heuten,b Guy Ennekens,b Inge Goovaerts,b Christiaan Vrints,bPascal Lava,c and Joris Dirckxa
aUniversity of Antwerp, Bimef, Groenenborgerlaan 171, 2020 Antwerp, BelgiumbUniversity Hospital Antwerp, Department of Cardiology, Wilrijkstraat 10, 2650 Edegem, BelgiumcKaHo-St.Lieven, Department of Metallurgy and Materials Engineering, Gebroeders De Smetstraat 1, 9000 Ghent, Belgium
Abstract. Pulse wave velocity (PWV) of the arterial system is a very important parameter to evaluate cardio-vascular health. Currently, however, there is no golden standard for PWV measurement. Digital image corre-lation (DIC) was used for full-field time-resolved assessment of displacement, velocity, acceleration, and strainsof the skin in the neck directly above the common carotid artery. By assessing these parameters, propagation ofthe pulse wave could be tracked, leading to a new method for PWV detection based on DIC. The method wastested on five healthy subjects. As a means of validation, PWV was measured with ultrasound (US) as well.Measured PWV values were between 3.68 and 5.19 m∕s as measured with DIC and between 5.14 and6.58 m∕s as measured with US, with a maximum absolute difference of 2.78 m∕s between the two methods.DIC measurements of the neck region can serve as a test base for determining a robust strategy for PWV detec-tion, they can serve as reference for three-dimensional fluid–structure interaction models, or they may evenevolve into a screening method of their own. Moreover, full-field, time-resolved DIC can be adapted forother applications in biomechanics. © The Authors. Published by SPIE under a Creative Commons Attribution 3.0 Unported License.
Distribution or reproduction of this work in whole or in part requires full attribution of the original publication, including its DOI. [DOI: 10.1117/1
.JBO.19.1.016008]
Keywords: digital image correlation; pulse wave velocity; arteriosclerosis.
Paper 130293RR received Apr. 30, 2013; revised manuscript received Nov. 12, 2013; accepted for publication Nov. 26, 2013; pub-lished online Jan. 9, 2014.
1 IntroductionIn digital image correlation (DIC), a speckle pattern is physi-cally applied to an object. Coordinates of points, labeled bythe randomly applied stochastic (speckled) pattern are capturedwith a camera and identified with an image correlation.1 Thesepoints are followed when the object is deformed and displace-ments are acquired with subpixel resolution. Full-field, three-dimensional (3-D) surface results can be acquired using a stereocamera system. The optical setup for 3-D acquisition consists oftwo cameras and a bright light source only, making this tech-nique easy to deploy and measurements easy to perform.Although image analysis is computationally intensive, increas-ing computer power has made the technique more popular2
resulting in biomechanical applications such as strain measure-ments on human bone and tendon,3 on mouse arteries,4 onmouse bone,5 and on finch beak.6
In the present work, DIC is applied for the first time, to ourknowledge, on a living (human) subject. DIC was used for time-resolved, full-field assessment of the movement of the skin inthe neck directly above the common carotid artery (CCA). Themovement of the skin on this location is directly linked to thepressure inside the CCA (Ref. 7). Detecting skin motion on thisspot thus allows tracking the pressure wave inside CCA. Thispressure wave propagates with a certain velocity, the pulse wavevelocity (PWV). PWV of the arterial system is a measure forcardiovascular health.8
Several methods to measure PWV exist today. Currently,PWV is being measured between the femoral artery (FA) inthe groin and the CCA in the neck. For this purpose, thereare contact methods based on tonometry9 or ultrasound(US),10 or noncontact methods based on laser Doppler vibrom-etry (LDV).11 The main advantage of this approach is that it isalready well integrated in the clinical circuit. However, thepatient is required to be undressed and PWV detection betweenthe neck and the groin poses specific difficulties.12
Recently, local PWVof the CCA has attracted a serious inter-est for screening purposes. The CCA is often affected by arterio-sclerosis and atherosclerosis.13 Also, elevated PWV in this partof the arterial system is hypothesized to play a major role in theetiology of cardiovascular disease.14 Moreover, the easy accessof the artery allows the patient to remain dressed during mea-surements. Local PWV measurements in the CCA have beenrealized using US (Refs. 15 and 16) and LDV.17 However, thisapproach is relatively new in general and it lacks validation atthe moment.
In this work, DIC is proposed as a screening method on itsown for local PWV detection of the CCA. Data acquired withDIC describe full-field, time-resolved deformation of the skinoverlaying the CCA. This information can serve as a test basefor determining a robust strategy for PWV detection as they cre-ate insight in the movements of the skin above the artery and thepressures inside the artery. Moreover, they can serve as a refer-ence for 3-D fluid–structure interaction (FSI) models of theCCA when complete systems, including arteries and surround-ing tissue and skin, are being modeled. Finally, the measure-ment approach can be adapted easily for other applications in
*Address all correspondence to: Adriaan Campo, E-mail: [email protected]
Journal of Biomedical Optics 016008-1 January 2014 • Vol. 19(1)
Journal of Biomedical Optics 19(1), 016008 (January 2014)

biomechanics such as determination or modeling of biomateri-als, study of growth dynamics, among other possible examples.
2 Materials and Methods
2.1 Measurement Setup
A stereo system with two cameras (Redlake HR1000 andRedlake Motion PRO, IDT, Tallahassee, Florida), with 8-bitdepth, resolution of 1280 × 1024 pixels, and maximum framerate of 500 fps, was used. The cameras were placed at a distanceof approximately 1 m from the subject and the mutual distancebetween cameras was approximately 0.5 m. Both cameras weremounted with an identical 200 mm f/4 lens (Nikon, Tokyo,Japan) with an opening angle of approximately 30 deg.Movies were synchronized post hoc, using a short flash froma laser pen. High power light-emitting diodes (LEDs) fedwith distensibility coefficient (DC) to avoid flickering illumi-nated the sample (see Fig. 1). Automatic system calibration wasperformed by using various images of a translated and rotatedregular grid pattern within a bundle adjustment technique takenbefore, between, and after the entire experiment.18,19 As a result,intrinsic and extrinsic camera parameters were obtained (seeTable 1). DIC requires the presence of a random pattern onthe specimen. This was applied by air brushing black paint (AirStream Makeup Black, Kryolan, Berlin, Germany) on top of awhite ground layer (Wet Makeup White, Kryolan, Berlin,Germany) in the left neck region at the level of the left CCA.In order for DIC to perform optimally, the air brushed specklepattern should have a random character, and the contrastbetween the speckles and the backgrounds should be as highas possible. Without the preparation of the surface, i.e., on thebare skin, DIC will not render satisfying results. Five youngmale healthy volunteers participated in this study. Each meas-urement, a movie of about 1 to 2 s, was recorded with a samplefrequency of 500 images∕s, in order to capture the movementsgenerated by between 3 and 6 heartbeats. (The exact number of
recorded heartbeats per subject is given in Sec. 3.) The wholemeasurement was repeated one-day later with a different specklepattern on the same location. In one image, the initial nonde-formed shape was reconstructed by finding the correspondingspeckles in the images captured by camera 1 and camera 2and via a triangulation method invoking the determined stereocamera parameters.20 In the next step, a similar procedure wasapplied to the subsequent image of the deformed state. Finally, adirect comparison of the deformed ðx; y; zÞ and the undeformedðx0; y0; z0Þ shape yields the 3-D deformation coordinatesðu; v; wÞ. These contain all the information needed to determinethe in-plane normal and shear strain components ðεxx; εyy; εxyÞ,or the principal strains and the shear angle ðε1; ε2; γÞ asdescribed in Ref. 21 The following settings were used in thedisplacement determination: a subset size of 16 × 16 pixelsthat is being compared between two images, a step size of 5 pix-els determining the resolution of the correlation analysis, zero-normalized cross-correlation algorithm,22 bicubic interpola-tion,23 and affine shape functions.24 Strains were calculated inthe Green–Lagrange convention25 and a strain window of 50 ×50 pixels and a bilinear interpolation21 was taken. The resultsare transformed into the coordinate system of camera 1. All cal-ibration and correlation steps are executed in the MatchID soft-ware package (in-house developed: http://www.matchid.org/).
2.2 Data Analysis
For further analysis, the deformation in the out-of-plane direc-tion (z) of every frame was assessed with the dedicated algo-rithms implemented in MATLAB (MathWorks, Natick,Massachusetts). First z-displacement was filtered with a 3-Dpolynomial filter. (Order was 1 × 1 × 3 and 3-D window sizewas 10 × 10 × 15 in the x, y, and time dimension, respectively.)The filter first provided out-of-plane displacement, but also thevelocity (first-derivative) and acceleration (second-derivative) inthe time domain in one filtering step (see Fig. 2). Although the
Fig. 1 The experimental setup with the relative position of the stereo system and the measurement area(left panel). x and y axes define the in-plane components, out-of-plane components are reported in theright panel as the z-axis. A stereo system with two cameras with an opening angle of approximately30 deg was used. Approximate distance D1 between cameras and subjects was 1 m, approximatemutual distance between cameras was 0.5 m. High power LEDs fed with distensibility coefficient toavoid flickering illuminate the sample. In the neck in the region around the CCA, a ground layer ofwhite paint is applied, covered with a black speckle pattern. The trajectory of the artery is indicatedwith a black arrow. The white cross in the right panel refers to Fig. 2.
Journal of Biomedical Optics 016008-2 January 2014 • Vol. 19(1)
Campo et al.: Digital image correlation for full-field time-resolved assessment of arterial stiffness

paint was applied around the presumed trajectory of the artery asfound by palpation, and although the trajectory was indicatedwith markings from a marker pen, arterial trajectory was esti-mated in an extra step by plotting maximal displacement duringone heartbeat [see Figs. 3(a) and 3(b)], hypothesizing that thedistension of the skin lying on top of the tissues flanking the
artery (muscle and larynx) is much smaller than the distensionof the skin lying on top of the artery. Then, the time domain wasresampled 30 times in MATLAB using a polyphase filter imple-mentation,26 increasing sample frequency to 15;000 samples∕s.For further processing, the acceleration of the skin surface inthe z-direction was considered (see Fig. 1). For each pixel, the
Table 1 Automatic system calibration was performed by using various images of a translated and rotated regular grid pattern within a bundleadjustment technique taken before, between, and after the entire experiment. As a result, intrinsic and extrinsic camera parameters were obtained.
Intrinsic parameters
Extrinsic parameters
Translation (mm) Rotation (deg)
Camera (#) 1 2 Tx −873.63 Θx −0.95
Distortions
K1 1.91 −0.22
K2 742.90 4043.47 Ty −29.68 Φy 26.38
K3 0.40 4.26
Plane center location (pixels) X 587.14 635.53 Tz 67.67 Ψz −0.06
Y 408.46 485.61
Fig. 2 After smoothing, for each pixel displacement, velocity, and acceleration in the z-direction, wasacquired by the filtering step as described. Three quantities are illustrated here as a function of time foran arbitrary point on the assessed surface (measurement location is indicated with a white cross inthe previous Fig. 1). Characteristic time points of the wave are indicated with the numbers in therightmost panel (z-acceleration): maximum of acceleration (1) and dicrotic notch (2).
Fig. 3 Arterial trajectory was estimated in an extra step by rendering maximal displacement during oneheartbeat, hypothesizing that the distension of the skin lying on top of the tissues flanking the artery(muscle and larynx) is much smaller than the distension of the skin lying on top of the artery. As a con-sequence, a clear longitudinal region can be seen, highlighting the trajectory of the artery. (a) The maxi-mal distension is shown in one heartbeat and (b) a contour plot is shown on the same data. Isolines are inmillimeters. The trajectory of the artery is indicated with a black arrow. In the upper right corner of thisfigures, some noise can be seen.
Journal of Biomedical Optics 016008-3 January 2014 • Vol. 19(1)
Campo et al.: Digital image correlation for full-field time-resolved assessment of arterial stiffness

acceleration of the skin surface in the z-direction was analyzedfor the two specific local maxima, commonly used for the detec-tion of PWV: the maximum of z-acceleration of the surface andthe dicrotic notch27 (see Fig. 2). To detect these maxima, first, atime window was manually delineated in one randomly chosenpixel. Then the local maximum was determined automatically inthis window in every other pixel. After detection of the maxima,a visual inspection of accuracy of this approach was performed.Maps were made with the relative progress of the wave (seeFig. 4). Second, the same characteristic time points were ana-lyzed along the trajectory of the artery as described in the pre-vious paragraph (see Fig. 3). The distance along the trajectory ofthe artery was plotted against the apparition in time of the local
maxima, and from the slope of this relationship, the velocity ofthe wave, or the PWV, was derived and its measurement error(ME) (see Fig. 5). PWV was determined for every recordedpulse wave using the two described algorithms (see Tables 2and 3). The strains were not subjected to any additional process-ing and are mentioned for illustrative purposes only.
2.3 Ultrasound Measurements
In order to compare the measured PWV values with the param-eters of the CCA, in each test subject arterial parameters weredetermined with the US 1 to 3 weeks before the DIC measure-ments, performed by trained clinicians of the Department
Fig. 4 For each pixel, time domain was analyzed for the characteristic time points in the shape of eachrecorded pulse wave, in order to track the wave and determine its velocity. This was done for the entiremeasured domain for two different characteristic time points commonly used in PWV detection: the maxi-mum of z-acceleration of the surface (a), and the dicrotic notch (b). Contour plots were made using therelative progress of these time points, thus displaying the progress of the wave. Again, the trajectory ofthe artery is indicated with a black arrow. Isolines are in milliseconds. In the upper right corner of thisfigures, some noise is present.
Fig. 5 The trajectory was found as explained above. The trajectory is displayed in Fig. 3. The distancealong the trajectory of the artery was plotted against the moment of appearance of the characteristic timepoints, and from the slope of this relationship, the velocity of the wave, or the PWV, was derived. (a) PWVis calculated by finding the maximum of z-acceleration and (b) PWV is calculated by finding the dicroticnotch. In this particular example, we find for PWVacceleration: PWVacceleration ¼ ð4.00� 0.04Þ m∕s,R2 ¼ 0.97; and for PWVdicrotic notch: PWVdicrotic notch ¼ ð5.00� 0.09Þ m∕s, R2 ¼ 0.92.
Journal of Biomedical Optics 016008-4 January 2014 • Vol. 19(1)
Campo et al.: Digital image correlation for full-field time-resolved assessment of arterial stiffness
Cardiology of the University Hospital of Antwerp. All measure-ments were performed three times in a row. Test subjects wereasked to remain sober 3 h prior to the US measurement. Arterialparameters were used to estimate PWV, using the Bramwell–Hill equation:
PWV ¼ sqrtðA � dP∕ðρ � dAÞÞ; (1)
where A is the arterial cross-sectional area during diastole, dA isthe difference in the cross-sectional area between systole anddiastole, ρ is the blood density, and dP is the pressure differencein the artery between systole and diastole.7
The US and DIC methods were compared using a Bland–Altman (BA) analysis. For comparison, the average of PWVpooled per individual, per method—and if applicable—per algo-rithm was used. For the BA analysis, a range of agreement wasdefined as mean bias �2 times standard deviation (SD).28
3 Results
3.1 Digital Image Correlation
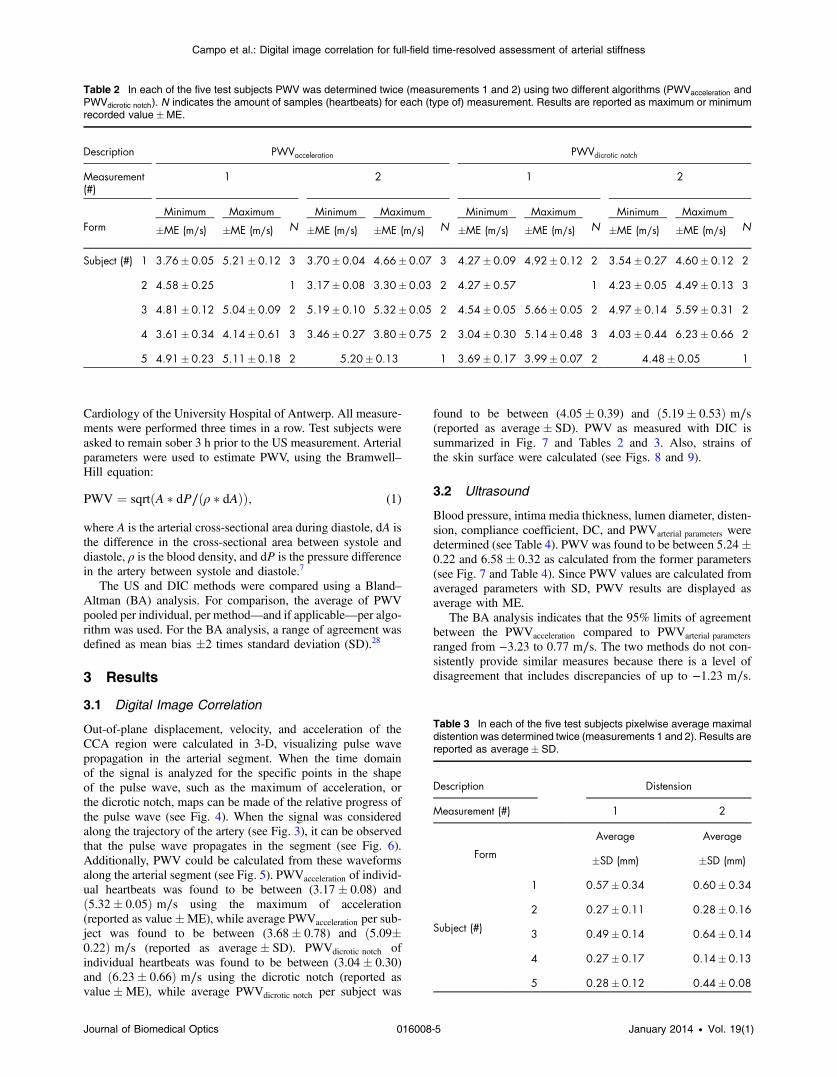
Out-of-plane displacement, velocity, and acceleration of theCCA region were calculated in 3-D, visualizing pulse wavepropagation in the arterial segment. When the time domainof the signal is analyzed for the specific points in the shapeof the pulse wave, such as the maximum of acceleration, orthe dicrotic notch, maps can be made of the relative progress ofthe pulse wave (see Fig. 4). When the signal was consideredalong the trajectory of the artery (see Fig. 3), it can be observedthat the pulse wave propagates in the segment (see Fig. 6).Additionally, PWV could be calculated from these waveformsalong the arterial segment (see Fig. 5). PWVacceleration of individ-ual heartbeats was found to be between (3.17� 0.08) andð5.32� 0.05Þ m∕s using the maximum of acceleration(reported as value�ME), while average PWVacceleration per sub-ject was found to be between (3.68� 0.78) and ð5.09�0.22Þ m∕s (reported as average� SD). PWVdicrotic notch ofindividual heartbeats was found to be between (3.04� 0.30)and ð6.23� 0.66Þ m∕s using the dicrotic notch (reported asvalue�ME), while average PWVdicrotic notch per subject was
found to be between (4.05� 0.39) and ð5.19� 0.53Þ m∕s(reported as average� SD). PWV as measured with DIC issummarized in Fig. 7 and Tables 2 and 3. Also, strains ofthe skin surface were calculated (see Figs. 8 and 9).
3.2 Ultrasound
Blood pressure, intima media thickness, lumen diameter, disten-sion, compliance coefficient, DC, and PWVarterial parameters weredetermined (see Table 4). PWVwas found to be between 5.24�0.22 and 6.58� 0.32 as calculated from the former parameters(see Fig. 7 and Table 4). Since PWV values are calculated fromaveraged parameters with SD, PWV results are displayed asaverage with ME.
The BA analysis indicates that the 95% limits of agreementbetween the PWVacceleration compared to PWVarterial parameters
ranged from −3.23 to 0.77 m∕s. The two methods do not con-sistently provide similar measures because there is a level ofdisagreement that includes discrepancies of up to −1.23 m∕s.
Table 2 In each of the five test subjects PWV was determined twice (measurements 1 and 2) using two different algorithms (PWVacceleration andPWVdicrotic notch). N indicates the amount of samples (heartbeats) for each (type of) measurement. Results are reported as maximum or minimumrecorded value�ME.
Description PWVacceleration PWVdicrotic notch
Measurement(#)
1 2 1 2
FormMinimum Maximum
NMinimum Maximum
NMinimum Maximum
NMinimum Maximum
N�ME (m∕s) �ME (m∕s) �ME (m∕s) �ME (m∕s) �ME (m∕s) �ME (m∕s) �ME (m∕s) �ME (m∕s)
Subject (#) 1 3.76� 0.05 5.21� 0.12 3 3.70� 0.04 4.66� 0.07 3 4.27� 0.09 4.92� 0.12 2 3.54� 0.27 4.60� 0.12 2
2 4.58� 0.25 1 3.17� 0.08 3.30� 0.03 2 4.27� 0.57 1 4.23� 0.05 4.49� 0.13 3
3 4.81� 0.12 5.04� 0.09 2 5.19� 0.10 5.32� 0.05 2 4.54� 0.05 5.66� 0.05 2 4.97� 0.14 5.59� 0.31 2
4 3.61� 0.34 4.14� 0.61 3 3.46� 0.27 3.80� 0.75 2 3.04� 0.30 5.14� 0.48 3 4.03� 0.44 6.23� 0.66 2
5 4.91� 0.23 5.11� 0.18 2 5.20� 0.13 1 3.69� 0.17 3.99� 0.07 2 4.48� 0.05 1
Table 3 In each of the five test subjects pixelwise average maximaldistention was determined twice (measurements 1 and 2). Results arereported as average� SD.
Description Distension
Measurement (#) 1 2
Form
Average Average
�SD (mm) �SD (mm)
Subject (#)
1 0.57� 0.34 0.60� 0.34
2 0.27� 0.11 0.28� 0.16
3 0.49� 0.14 0.64� 0.14
4 0.27� 0.17 0.14� 0.13
5 0.28� 0.12 0.44� 0.08
Journal of Biomedical Optics 016008-5 January 2014 • Vol. 19(1)
Campo et al.: Digital image correlation for full-field time-resolved assessment of arterial stiffness

The BA analysis indicates that the 95% limits of agreementbetween the PWVdicrotic notch compared to PWVarterial parameters
ranged from −2.85 to 0.44 m∕s. The two methods do not con-sistently provide similar measures because there is a level ofdisagreement that includes discrepancies of up to −1.20 m∕s(see Fig. 10).
4 Discussion and ConclusionPWV is a clinical important marker for cardiovascular disease.8
However, a golden standard for PWV detection is nonexistent atthe moment.29 Several approaches are available. Most methodsfocus on the PWVas measured between the carotid and the FA.
Fig. 6 When the z-acceleration is considered along the trajectory of the artery, the propagation of thepulse wave can be tracked by observing characteristic time points such as the maximum of accelerationor the dicrotic notch. In this figure, the left panel displays a typical profile of the z-acceleration of the skinabove the CCA. Three heartbeats can be discerned. The right panel shows a close-up (close-up windowis indicated with the dashed box) of the region around the maximum of z-acceleration of the secondheartbeat in the left panel for a series of points along the trajectory of the artery. The horizontal axisindicates time, and the vertical axis indicates distance traveled along the arterial trajectory by thepulse wave. The angle displayed on the right panel illustrates propagation of the maximum of acceler-ation along the trajectory of the artery.
Fig. 7 PWV was determined using three different detection methods: using the maximum of accelera-tion, using the dicrotic notch, and using arterial parameters in combination with the Bramwell–Hillequation (1). PWV values are represented as average PWV per subject, per measurement.
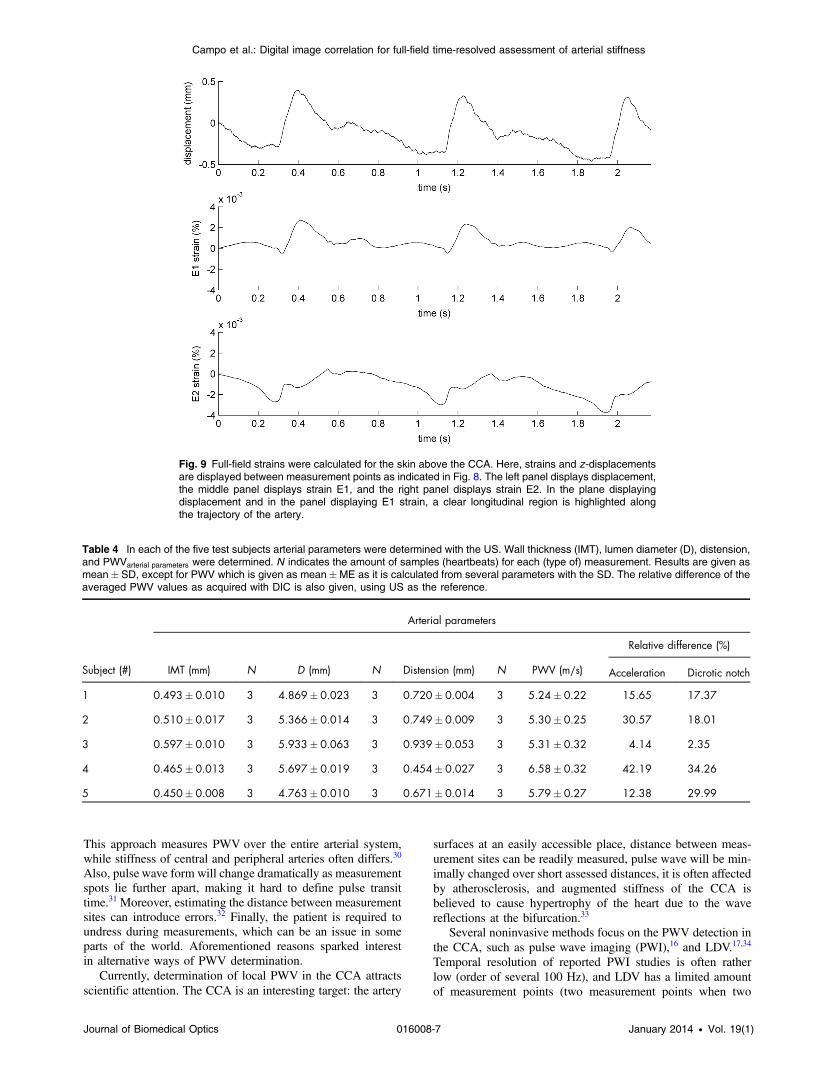
Fig. 8 Strains of the skin on top of the CCA were calculated. Here, a z-displacement profile from anarbitrary point on the skin is given, as well as the principal strains E1 and E2 for the same point.Strain profiles appeared very similar within the same test subject and for different calculationwindows. Diamonds indicate points compared in Fig. 9. The upper panel displays displacement,the middle panel displays strain E1, and the lower panel displays strain E2.
Journal of Biomedical Optics 016008-6 January 2014 • Vol. 19(1)
Campo et al.: Digital image correlation for full-field time-resolved assessment of arterial stiffness
This approach measures PWV over the entire arterial system,while stiffness of central and peripheral arteries often differs.30
Also, pulse wave form will change dramatically as measurementspots lie further apart, making it hard to define pulse transittime.31 Moreover, estimating the distance between measurementsites can introduce errors.32 Finally, the patient is required toundress during measurements, which can be an issue in someparts of the world. Aforementioned reasons sparked interestin alternative ways of PWV determination.
Currently, determination of local PWV in the CCA attractsscientific attention. The CCA is an interesting target: the artery
surfaces at an easily accessible place, distance between meas-urement sites can be readily measured, pulse wave will be min-imally changed over short assessed distances, it is often affectedby atherosclerosis, and augmented stiffness of the CCA isbelieved to cause hypertrophy of the heart due to the wavereflections at the bifurcation.33
Several noninvasive methods focus on the PWV detection inthe CCA, such as pulse wave imaging (PWI),16 and LDV.17,34
Temporal resolution of reported PWI studies is often ratherlow (order of several 100 Hz), and LDV has a limited amountof measurement points (two measurement points when two
Fig. 9 Full-field strains were calculated for the skin above the CCA. Here, strains and z-displacementsare displayed between measurement points as indicated in Fig. 8. The left panel displays displacement,the middle panel displays strain E1, and the right panel displays strain E2. In the plane displayingdisplacement and in the panel displaying E1 strain, a clear longitudinal region is highlighted alongthe trajectory of the artery.
Table 4 In each of the five test subjects arterial parameters were determined with the US. Wall thickness (IMT), lumen diameter (D), distension,and PWVarterial parameters were determined. N indicates the amount of samples (heartbeats) for each (type of) measurement. Results are given asmean� SD, except for PWV which is given as mean�ME as it is calculated from several parameters with the SD. The relative difference of theaveraged PWV values as acquired with DIC is also given, using US as the reference.
Subject (#)
Arterial parameters
IMT (mm) N D (mm) N Distension (mm) N PWV (m∕s)
Relative difference (%)
Acceleration Dicrotic notch
1 0.493� 0.010 3 4.869� 0.023 3 0.720� 0.004 3 5.24� 0.22 15.65 17.37
2 0.510� 0.017 3 5.366� 0.014 3 0.749� 0.009 3 5.30� 0.25 30.57 18.01
3 0.597� 0.010 3 5.933� 0.063 3 0.939� 0.053 3 5.31� 0.32 4.14 2.35
4 0.465� 0.013 3 5.697� 0.019 3 0.454� 0.027 3 6.58� 0.32 42.19 34.26
5 0.450� 0.008 3 4.763� 0.010 3 0.671� 0.014 3 5.79� 0.27 12.38 29.99
Journal of Biomedical Optics 016008-7 January 2014 • Vol. 19(1)
Campo et al.: Digital image correlation for full-field time-resolved assessment of arterial stiffness

regular LDV systems are used). Moreover, aiming the LDVsystems exactly on top of the artery can be difficult.
In the present work, a DIC based noncontact method ispresented for the local PWV measurements in the CCA.
Temporal resolution of 500 frames∕s is achieved with thecurrent setup, equaling resolution acquired with US. Foryoung healthy volunteers, where the PWV is low, this framerate appears to be sufficient to detect PWV. However, inmore clinically relevant populations, PWV will attain valuesof 13 m∕s and more.8 As such, a higher frame rate will berequired. Frame rates up to several kilohertz are within thereach of modern high-speed camera systems and will be the sub-ject of future research in order to attain validation in a populationwith higher PWV. Beat-to-beat variability defined as SD is ashigh as 1.56 m∕s with DIC, and intersession variability is ashigh as 1.35 m∕s. Since local PWV measurements are notyet established as a screening method for cardiovascular disease,the question whether this is sufficient has yet to be answered.However, it can be expected that intersession and beat-to-beatvariability of the measurements will improve as frame ratesincrease.
Spatial resolution, on the other hand, is limited by factorssuch as resolution of the cameras at a specific sample frequency,position of the cameras, quality of the calibration step, character-istics of the lenses, coarseness of the speckle pattern, andcorrelation software.35 An experimental or theoretical determi-nation of the uncertainties on presented quantities was not per-formed during this experiment, since we were only interested inthe actual shape of the waveforms. However, post hoc, we wereable to achieve a resolution better than 0.015 mm.
Due to the achieved spatial resolution, it was possible to visu-alize the trajectory of the artery (see Fig. 3) highlighting theimportance of knowing the exact trajectory of the artery forlocal methods for PWV detection. Subsequently, PWV wasassessed along this trajectory using known methods for thepulse wave detection (Fig. 5). Finally, maps of the relativeprogression of the wave could be made (see Fig. 4).
However, it can be seen that the isolines in Fig. 4 are non-equidistant. This could be explained by nonideal elastic behav-ior and structural inhomogeneity in the trajectory of the artery orby artifacts due to undersampling and smoothing of the data, orby a combination of both. Also, the isolines appear to be slightlyoff axis. The latter could be due to a slight tilt of the direction in
which pulsation is at its maximum, and the z-axis of the meas-urement setup. To tackle this problem, coordinate systems couldbe rotated, such that the displacements in the z-direction aremaximal (e.g., using principal component analysis).
In order to validate the results, PWV values obtained withDIC measurements were compared with those obtained fromthe US measurements as derived with the Bramwell–Hill equa-tion (1) (see Fig. 7). However, validation of the local PWV mea-surements poses specific problems. The presented method is atime-of-flight approach, typically prone to errors introduced bywave reflections and changes in waveform over distance.12,29,33
A single point measurement method could circumvent this prob-lem. However, this would require extra information, such aslocal blood velocity profiles or local blood pressure profiles.36,37
It can be expected that the additional measurement equipmentfor this purpose would make the technique either impractical orinvasive.
PWV velocities as obtained from the Bramwell–Hill equa-tion (1), however, give only an approximation of the“ground-truth” PWV, assuming ideal circumstances. PWV ascalculated with this equation assumes the absence of wavereflections, homogeneous mechanical parameters along thearterial trajectory, and zero blood velocity.38 The dA and Afrom the equations are measured with the US probe, exertingmechanical pressure on the artery. It is plausible that thisinfluences both arterial diameter and mechanical properties ofthe artery. Also, dP is measured as the difference betweendiastolic and systolic pressures as measured at the wrist. Thispressure difference is expected to differ from the pressure atthe CCA. Also, ρ is based on the literature values only.
Due to the small sample size, it is not possible to draw soundconclusions regarding the reliability of the DIC method. Only apreliminary discussion of the precision, accuracy, and reproduc-ibility of the method will be given. The precision was alreadydiscussed earlier in terms of variability. A BA analysis was per-formed to assess the accuracy. According to such an analysis,DIC estimates PWVon average lower than US, with wide limitsof agreement considered from the clinical perspective (seeFig. 10). More research is needed to determine the accuracyof the DIC method in relation to the reference method, giventhat the cause of the bias is not fully understood. Possibleexplanations are a flaw in one of the methods, the entirely differ-ent natures of the methods, or the fact that the PWV was not
Fig. 10 A BA analysis to assess the level of agreement between the PWVacceleration compared toPWVarterial parameters (a) and between PWVdicrotic notch compared to PWVarterial parameters (b). A range ofagreement was defined as mean bias (full line) �2 times SD (dashed line).
Journal of Biomedical Optics 016008-8 January 2014 • Vol. 19(1)
Campo et al.: Digital image correlation for full-field time-resolved assessment of arterial stiffness

simultaneously recorded. Neither a correlation analysis compar-ing methods nor an intraclass correlation analysis comparingmeasurement sessions was performed due to the small samplesize. Therefore, reproducibility of the method remains to beinvestigated. Nevertheless, the values obtained from DIC andUS are in the same order of magnitude, and they both are in theexpected range considering medical background, age, and gen-der of the test subjects, suggesting that the values are realistic.7
Additionally, strains were calculated, for illustrative purposesonly (see Figs. 8 and 9). Although strains were acquired in alltest subjects, data could not be validated with another techniquein this experiment. However, as calculation windows were var-ied, strain patterns remained very similar as assessed with visualinspection. Also, when more heartbeats were recorded in onesession, patterns were periodical for separate heartbeats.
The extended spatial and temporal information acquired withDIC opens possibilities for cardiovascular research purposes.Time-resolved, full-field information of the neck region is usefulfor creating strategies to measure PWV in a noncontact manner.It allows testing for algorithms to detect progress ofthe wave optically. It allows testing for a robust measurementapproach applicable on all types of patients. Moreover, it shedslight on the mechanical behavior of the neck region, and it canbe used as the reference for highly realistic FSI models of theCCA. Or, given that reliable FSI models are present, the arterialcharacteristics can be estimated through reverse engineering,revealing arterial characteristics.
Moreover, DIC can be further developed as a standalonediagnostic technique for PWV detection. One of the benefitsof DIC is that the patient can remain fully dressed duringmeasurements. Also, the actual measurement is noncontact;circumventing artifacts due to probe contact in tonometry andUS-based applications. The data allow post hoc determinationof the arterial trajectory. Additionally, performing a measure-ment (application of the speckle pattern and recording severalheartbeats with DIC) is not likely to take >10 min whenexecuted by a skilled technician.
However, the technique also has its limitations: time-of-flightmethods for the PWV detection are typically sensitive to theeffect of wave reflections. Also, special attention is requiredfor the preparation of the surface: the contrast between back-ground and speckles has to be as high as possible, and specklesideally are as small as possible and are evenly distributed in arandom fashion, requiring some experience. Moreover, setup ofthe camera systems, calibration, and especially processing of thedata is time consuming making real-time analysis unfeasible atthe moment.
Additionally, in order for an object to be studied, visual accessfrom the camera(s) is required over the entire surface, limitingextensive miniaturization of the setup. Also, in order to achievefocus over the entire object, high illumination is required whensome reliefs or substantial out-of-plane displacements are atplay, especially at the short shutter times. Shadows and blind cor-ners, caused, e.g., by wrinkles, hairs, impurities of the skin, andskin folds will inevitably lead to artifacts. The current measure-ments were performed in the healthy young males with no facialhair, low BMI, and low PWV. However, it remains to be testedhow DIC will perform on skin with skin folds, wrinkles or whenthere is a prominent presence of facial hair. In order to make theskin surface smoother, a white ground layer capable of fillingcracks and pores could be used, and patients could be asked toshave themselves before a consultation. Also, pulsation could
be hard to detect when fat content in the neck is high, or whenblood pressure is very low. In this case, required sensitivity of thetechnique could be acquired with a finer speckle pattern. However,the limits of the technique remain to be explored in future work.
Some measures could be made to make the technique moreapplicable and more user-friendly. The ground layer couldbe enriched with a fluorescent molecule. By illuminating thepatch with a laser and recording with an appropriate filter forthe camera, the use of large illumination equipment can beavoided. Or, in order to skip the process of applying two layersof paint, a printed fluorescent pattern could be applied on theskin, e.g., with a rub-on tattoo. The cameras could be triggeredby electrocardiogram (ECG) to reduce the amount of images tobe analyzed to a minimum. If 3-D information is not required,variants of the technique can be developed with only one cameraand even a projected pattern, reducing the cost, reducing therequired computational power, and increasing the user friendli-ness of the setup. In the presence of background movements,principal strains could be used for the estimation of PWV.
It is obvious that the time-resolved, full-field assessment ofmovement and strains of surfaces creates opportunities for allkinds of biological and nonbiological applications. The tech-nique requires at most two cameras, a bright light source,and the application of some paint, and is physiologically harm-less. Moreover, a setup is relatively small and lightweight, andas such very versatile and mobile. There are no interferometricstability requirements, rendering this technique usable for theapplications outside the laboratory. Consequently, this techniquehas the potential to find its way in other biological studies wheremotion of surfaces is to be assessed as a function of time, forexample, study of the movement of eardrums for differentfrequencies and amplitudes,39 dynamics of leaf growth, model-ing of biting mechanics of stag beetles, and assessing complexbiomaterials in general, amongst other possible applications.
AcknowledgmentsWe acknowledge the Research Foundation of Flanders (FWO-Vlaanderen) for financial support.
References1. H. Schreier, J.-J. Orteu, and M. A. Sutton, Image Correlation for Shape,
Motion and Deformation Measurements, Springer, Boston,Massachusetts (2009).
2. T. Schmidt, J. Tyson, and K. Galanulis, “Full-field dynamic displace-ment and strain measurement using advanced 3D image correlationphotogrammetry: part 1,” Exp. Tech. 27(3), 47–50 (2003).
3. J. Tyson, T. Schmidt, and K. Galanulis, “Biomechanics deformationand strain measurements with 3D image correlation photogrammetry,”Exp. Tech. 26(5), 39–42 (2002).
4. M. A. Sutton et al., “Strain field measurements on mouse carotidarteries using microscopic three-dimensional digital image correlation,”J. Biomed. Mater. Res. A 84(1), 178–190 (2008).
5. P. Sztefek et al., “Using digital image correlation to determine bone sur-face strains during loading and after adaptation of the mouse tibia,”J. Biomech. 43(4), 599–605 (2010).
6. J. Soons et al., “Full-field optical deformation measurement in biome-chanics: digital speckle pattern interferometry and 3D digital imagecorrelation applied to bird beaks,” J. Mech. Behav. Biomed. Mater.14, 186–191 (2012).
7. W. R. Milnor, Hemodynamics, p. 390, Williams & Wilkins, Baltimore,Maryland (1982).
8. S. Laurent et al., “Aortic stiffness is an independent predictor ofall-cause and cardiovascular mortality in hypertensive patients,”Hypertension 37(5), 1236–1241 (2001).
Journal of Biomedical Optics 016008-9 January 2014 • Vol. 19(1)
Campo et al.: Digital image correlation for full-field time-resolved assessment of arterial stiffness
9. K. Matthys and P. Verdonck, “Development and modelling of arterialapplanation tonometry: a review,” Technol. Health Care 10(1), 65–76(2002).
10. J. Calabia et al., “Doppler ultrasound in the measurement of pulse wavevelocity: agreement with the Complior method,” Cardiovasc. Ultrasound9(1), 13 (2011).
11. M. De Melis et al., “A noncontact approach for the evaluation oflarge artery stiffness: a preliminary study,” Am. J. Hypertens. 21(12),1280–1283 (2008).
12. E. Hermeling et al., “Potentials and pitfalls of local PWV measure-ments,” Am. J. Hypertens. 23(9), 934, author reply 935 (2010).
13. P. Boutouyrie et al., “Common carotid artery stiffness and patterns ofleft ventricular hypertrophy in hypertensive patients,” Hypertension25(4), 651–659 (1995).
14. S. C. Millasseau et al., “Evaluation of carotid-femoral pulse wavevelocity: influence of timing algorithm and heart rate,” Hypertension45(2), 222–226 (2005).
15. S. I. Rabben et al., “An ultrasound-based method for determining pulsewave velocity in superficial arteries,” J. Biomech. 37(10), 1615–1622(2004).
16. J. Vappou, J. Luo, and E. E. Konofagou, “Pulse wave imaging fornoninvasive and quantitative measurement of arterial stiffness in vivo,”Am. J. Hypertens. 23(4), 393–398 (2010).
17. A. Campo, P. Segers, and J. Dirckx, “Laser Doppler vibrometry for invivo assessment of arterial stiffness,” in 2011 IEEE Int. Symp. Med.Meas. Appl., pp. 119–121, IEEE (2011).
18. Z. Zhang, “A flexible new technique for camera calibration,” IEEETrans. Pattern Anal. Mach. Intell. 22(11), 1330–1334 (2000).
19. B. Triggs, “Detecting keypoints with stable position, orientation, andscale under illumination changes,” Lec. Notes Comput. Sci. 3024,100–113 (2004).
20. P. Lava, “Assessment of measuring errors in strain fields obtained viaDIC on planar sheet metal specimens with a non-perpendicular cameraalignment,” Appl. Mech. Mater. 70, 165–170 (2011).
21. P. Lava et al., “Assessment of measuring errors in DIC using deforma-tion fields generated by plastic FEA,” Opt. Lasers Eng. 47(7–8), 747–753 (2009).
22. B. Pan et al., “Two-dimensional digital image correlation for in-planedisplacement and strain measurement: a review,” Meas. Sci. Technol.20(6), 062001 (2009).
23. R. Keys, “Cubic convolution interpolation for digital image processing,”IEEE Trans. Acoust. 29(6), 1153–1160 (1981).
24. H. A. Bruck et al., “Digital image correlation using Newton–Raphsonmethod of partial differential correction,” Exp. Mech. 29(3), 261–267(1989).
25. G. T. Mase, Continuum Mechanics for Engineers, 2nd ed., p. 380, CRCPress, New York (1999).
26. E. Hermeling et al., Eds., Discrete-Time Signal Processing, 2nd ed.,p. 896, Prentice-Hall Inc., New Jersey (1999).
27. E. Hermeling et al., “The dicrotic notch as alternative time-referencepoint to measure local pulse wave velocity in the carotid artery bymeans of ultrasonography,” J. Hypertens. 27(10), 2028–2035 (2009).
28. J. M. Bland and D. Altman, “Statistical methods for assessing agree-ment between two methods of clinical measurement,” Lancet1(8476), 307–310 (1986).
29. E. Hermeling et al., “Measurement of local pulse wave velocity: effectsof signal processing on precision,” Ultrasound Med. Biol. 33(5), 774–781 (2007).
30. J. Sugawara et al., “Brachial-ankle pulse wave velocity: an index ofcentral arterial stiffness?” J. Hum. Hypertens. 19(5), 401–406 (2005).
31. C.-W. Chang et al., “PWVmeasurement influenced by distance betweentwo recording sites,” Am. J. Hypertens. 24(3), 250.
32. S. A. M. Huybrechts et al., “Carotid to femoral pulse wave velocity: acomparison of real travelled aortic path lengths determined by MRI andsuperficial measurements,” J. Hypertens. 29(8), 1577–1582 (2011).
33. P. Segers et al., “Wave reflection: myth or reality?,” Artery Res. 6(1),7–11 (2012).
34. Y. Li et al., “On-chip laser Doppler vibrometer for arterial pulsewave velocity measurement,” Biomed. Opt. Express 4(7), 1229–1235(2013).
35. R. H. Pritchard et al., “Precise determination of the Poisson ratio in softmaterials with 2D digital image correlation,” Soft Matter 9(26), 6037–6045 (2013).
36. A. W. Khir et al., “Determination of wave speed and wave separation inthe arteries,” J. Biomech. 34(9), 1145–1155 (2001).
37. J. Feng and A. W. Khir, “Determination of wave speed and wave sep-aration in the arteries using diameter and velocity,” J. Biomech. 43(3),455–462 (2010).
38. W. W. Nichols et al., McDonald’s Blood Flow in Arteries: Theoretical,Experimental and Clinical Principles, p. 755, Hodder ArnoldPublishers, Boca Raton, Florida (2011).
39. J. Aernouts, J. R. M. Aerts, and J. J. J. Dirckx, “Mechanical propertiesof human tympanic membrane in the quasi-static regime from in situpoint indentation measurements,” Hear. Res. 290(1–2), 45–54 (2012).
Adriaan Campo studied bioengineering at the KULeuven. Hisresearch aims at development of noncontact screening methodsfor assessment of cardiovascular health. Currently, he performs hisresearch at the Laboratory of Biomedical Physics (Bimef) at theUniversity of Antwerp, under supervision of Joris Dirckx.
Joris Soons graduated as a PhD in physics at the University ofAntwerp. In his doctorate work he investigated the mechanics ofDarwin’s finch beaks by combining modelling, experimental and opti-cal techniques. Currently he is a postdoctoral researcher at theUniversity of Antwerp and Stanford University, studying the mechan-ics of hearing. His research interests include mechanics of biologicalstructures, finite element modelling, interferometric techniques, digitalimage correlation, and two-photon imaging.
Hilde Heuten graduated as a doctor in medicine, surgery, and obstet-rics at the University of Antwerp (UA) in 1992. Subsequently shegraduated as a cardiologist at the same university in 1997.Currently she holds a position of senior resident in the departmentof cardiology at the Antwerp University Hospital (UZA) where sheis responsible for the Department of Arterial Hypertension andVascular Medicine (measurement of intima-media thickness, vascularstiffness and endothelial function). She participated in numerous clini-cal studies as investigator and principal investigator.
Guy Ennekens studied mathematics in secondary school, and indus-trial engineering in biochemistry, specialty environmental technolo-gies, in higher education. For fourteen years he has been workingin noninvasive cardiology, dividing time between technical supportin cardiac catheterization, cardiac CT, and ultrasound examinationsof vascular function.
Christiaan Vrints graduated as a cardiologist in 1981. He obtainedhis PhD in 1991 at the current University of Antwerp (UA). Since 1998,he is head of the Department of Cardiology at the University HospitalAntwerp (UZA). He participated in numerous clinical studies as inves-tigator and principal investigator.
Pascal Lava acquired a master’s degree in mathematics at GhentUniversity in June 2002. On May 16, 2006, he acquired a PhD in sci-ences—nuclear physics at Ghent University. Since January 1, 2008,he has worked as an associate professor in the DepartmentMetallurgy and Materials Engineering (MTM) at Leuven University.His research topics include digital image correlation (DIC) andmaterial identification via virtual fields and finite element updating.He is author of more than 25 peer-reviewed articles and the founderand main developer of the DIC platform MatchID.
Joris Dirckx obtained a PhD in physics in the field of optical meas-urement techniques for applications in hearing research. His currentresearch interests are in the development of optical metrology and itsapplications in biomechanics, combined with numerical modeling ofbiomechanical systems. He is full professor and chair of the depart-ment of physics at Antwerp University.
Inge Goovaerts: Biography is not available.
Journal of Biomedical Optics 016008-10 January 2014 • Vol. 19(1)
Campo et al.: Digital image correlation for full-field time-resolved assessment of arterial stiffness