Calibration and performance of the AMS-02 time of flight detector in space
8
Calibration and performance of the AMS-02 time of flight detector in space V. Bindi a , G.M. Chen b , H.S. Chen b , E. Choumilov c , V. Choutko c , A. Contin d,e , A. Lebedev c , Y.S. Lu b , N. Masi d,e , A. Oliva f , F. Palmonari d,e , L. Quadrani d,e , Q. Yan b,n a University of Hawaii, Physics and Astronomy Department, 2505 Correa Road, WAT 432, Honolulu, HI 96822, USA b Institute of High Energy Physics, IHEP, Chinese Academy of Sciences, Beijing 100049, China c Massachusetts Institute of Technology, MIT, Cambridge, MA 02139, USA d Universit‘a di Bologna, I-40126 Bologna, Italy e INFN-Sezione di Bologna, I-40126 Bologna, Italy f Centro de Investigaciones Energeticas, Medioambientales y Tecnologicas, CIEMAT, E-28040 Madrid, Spain article info Article history: Received 13 October 2013 Received in revised form 24 December 2013 Accepted 4 January 2014 Available online 11 January 2014 Keywords: AMS TOF Scintillator Calibration Charge Velocity abstract AMS-02 is a high energy particle detector deployed in May 19, 2011 on board of the International Space Station (ISS) where it is expected to be in operation for the ISS lifetime of at least a decade. The main goal of AMS-02 is the detection of cosmic rays and gammas from the GeV to the TeV energy region to search for anti-matter, dark matter and understanding the origin of the cosmic rays. The AMS-02 time of flight (TOF) detector provides the trigger to experiment and allows precise measurements of the cosmic rays velocity and charge magnitude from hydrogen to iron and above. With the data set acquired during the first two and a half years of operation in space, a precise time-dependent calibration for time, velocity and charge measured by the TOF had been developed. The TOF calibration methods are described and the AMS-02 TOF performance in space is presented. & 2014 Elsevier B.V. All rights reserved. 1. Introduction The TOF system of AMS-02 [1] provides an accurate measurement of the velocity and of the charge magnitude of the detected cosmic rays (CRs). The detector was designed to ensure long term reliability, thanks to the choice of components and their redundancy. During the first two and a half years of operation in space, TOF operated according to the design, providing the trigger to the AMS-02 detector with an efficiency approaching 100%. In order to exploit the full potential of the instrument in a constantly changing thermal environment, a time- dependent calibration method of TOF system was developed. 2. The AMS detector The layout of the AMS-02 detector [2] is shown in Fig. 1. AMS-02 consists of the following: A permanent magnet with a 0.14 T dipole-shaped magnetic field to bend charged particles. Nine planes of silicon tracker (Tracker) [3] to reconstruct the particle rigidity 1 (R). With a spatial point resolution of 7 μm (2 rZ r8), and a maximum lever arm of about 3 m, the maximum detectable rigidity (MDR) is estimated to be 3 TV for ions. Moreover, each Tracker plane can independently evaluate the charge magnitude of the crossing particle in a wide range (1 rZ r26Þ. Four layers of time of flight (TOF) counters [4] to provide the trigger and measure the particle velocity and charge. A transition radiation detector (TRD) [5] to separate electrons from hadrons at the 10 4 level. An array of anti-coincidence counters surrounding the inner tracker (ACC) [6] to reject interactions on the magnet bore with an efficiency of 99.99%. A ring imaging Cherenkov detector (RICH) [7] to measure the velocity of the crossing particle with a resolution of 0.1% and the absolute charge up to Z ¼ 26. A 17 radiation lengths thick electromagnetic calorimeter (ECAL) [8] to measure the energy released by electromagnetic particles with the resolution of 2% in the hundreds GeV energy region and separate electrons from hadrons at the 10 4 level. Contents lists available at ScienceDirect journal homepage: www.elsevier.com/locate/nima Nuclear Instruments and Methods in Physics Research A 0168-9002/$ - see front matter & 2014 Elsevier B.V. All rights reserved. http://dx.doi.org/10.1016/j.nima.2014.01.002 n Corresponding author. E-mail address: [email protected] (Q. Yan). 1 The particle rigidity is defined as momentum (P) divided by charge (Z). Nuclear Instruments and Methods in Physics Research A 743 (2014) 22–29
Transcript of Calibration and performance of the AMS-02 time of flight detector in space
Calibration and performance of the AMS-02 time of flight detectorin space
V. Bindi a, G.M. Chen b, H.S. Chen b, E. Choumilov c, V. Choutko c, A. Contin d,e, A. Lebedev c,Y.S. Lu b, N. Masi d,e, A. Oliva f, F. Palmonari d,e, L. Quadrani d,e, Q. Yan b,n
a University of Hawaii, Physics and Astronomy Department, 2505 Correa Road, WAT 432, Honolulu, HI 96822, USAb Institute of High Energy Physics, IHEP, Chinese Academy of Sciences, Beijing 100049, Chinac Massachusetts Institute of Technology, MIT, Cambridge, MA 02139, USAd Universit‘a di Bologna, I-40126 Bologna, Italye INFN-Sezione di Bologna, I-40126 Bologna, Italyf Centro de Investigaciones Energeticas, Medioambientales y Tecnologicas, CIEMAT, E-28040 Madrid, Spain
a r t i c l e i n f o
Article history:Received 13 October 2013Received in revised form24 December 2013Accepted 4 January 2014Available online 11 January 2014
Keywords:AMSTOFScintillatorCalibrationChargeVelocity
a b s t r a c t
AMS-02 is a high energy particle detector deployed in May 19, 2011 on board of the International SpaceStation (ISS) where it is expected to be in operation for the ISS lifetime of at least a decade. The main goalof AMS-02 is the detection of cosmic rays and gammas from the GeV to the TeV energy region to searchfor anti-matter, dark matter and understanding the origin of the cosmic rays. The AMS-02 time of flight(TOF) detector provides the trigger to experiment and allows precise measurements of the cosmic raysvelocity and charge magnitude from hydrogen to iron and above. With the data set acquired during thefirst two and a half years of operation in space, a precise time-dependent calibration for time, velocityand charge measured by the TOF had been developed. The TOF calibration methods are described and theAMS-02 TOF performance in space is presented.
& 2014 Elsevier B.V. All rights reserved.
1. Introduction
The TOF system of AMS-02 [1] provides an accurate measurementof the velocity and of the charge magnitude of the detected cosmicrays (CRs). The detector was designed to ensure long term reliability,thanks to the choice of components and their redundancy. During thefirst two and a half years of operation in space, TOF operated accordingto the design, providing the trigger to the AMS-02 detector with anefficiency approaching 100%. In order to exploit the full potential of theinstrument in a constantly changing thermal environment, a time-dependent calibration method of TOF system was developed.
2. The AMS detector
The layout of the AMS-02 detector [2] is shown in Fig. 1.AMS-02 consists of the following:
� A permanent magnet with a 0.14 T dipole-shaped magneticfield to bend charged particles.
� Nine planes of silicon tracker (Tracker) [3] to reconstruct theparticle rigidity1 (R). With a spatial point resolution of 7 μm(2rZr8), and a maximum lever arm of about 3 m, themaximum detectable rigidity (MDR) is estimated to be 3 TVfor ions. Moreover, each Tracker plane can independentlyevaluate the charge magnitude of the crossing particle in awide range (1rZr26Þ.
� Four layers of time of flight (TOF) counters [4] to provide thetrigger and measure the particle velocity and charge.
� A transition radiation detector (TRD) [5] to separate electronsfrom hadrons at the 10�4 level.
� An array of anti-coincidence counters surrounding the innertracker (ACC) [6] to reject interactions on the magnet bore withan efficiency of 99.99%.
� A ring imaging Cherenkov detector (RICH) [7] to measure thevelocity of the crossing particle with a resolution of 0.1% andthe absolute charge up to Z¼26.
� A 17 radiation lengths thick electromagnetic calorimeter (ECAL)[8] to measure the energy released by electromagnetic particleswith the resolution of 2% in the hundreds GeV energy regionand separate electrons from hadrons at the 10�4 level.
Contents lists available at ScienceDirect
journal homepage: www.elsevier.com/locate/nima
Nuclear Instruments and Methods inPhysics Research A
0168-9002/$ - see front matter & 2014 Elsevier B.V. All rights reserved.http://dx.doi.org/10.1016/j.nima.2014.01.002
n Corresponding author.E-mail address: [email protected] (Q. Yan). 1 The particle rigidity is defined as momentum (P) divided by charge (Z).
Nuclear Instruments and Methods in Physics Research A 743 (2014) 22–29

3. TOF detector
The AMS-02 TOF system (shown in Fig. 2) had been designedand built at the INFN laboratories in Bologna (Italy). It is composedof four layers of EJ-200 scintillator counters [4] located two aboveand two below the AMS magnet. The upper TOF (UTOF) plane(layers 0 and 1) is firmly connected to the TRD support structure.The lower TOF (LTOF) plane (layers 2 and 3) is fixed to the UniqueSupport Structure (USS). The vertical distance between UTOF andLTOF is about 120 cm.
The four TOF layers have 8, 8, 10 and 8 paddles: the internalpaddles have a rectangular shape, 1 cm thick, 12 cm width and110–135 cm length, while the external counters have a trapezoidalshape with 18–26 cm width and 110 cm length. To ensure 100%trigger efficiency, neighbouring counters are overlapped by 0.5 cm.Each side of a TOF counter is connected to 2 or 3 R5946Hamamatsu Photo-Multiplier Tubes (PMTs) [9] through plexiglasslight guides. The light guides can be straight, tilted or twisted tominimize the effect of magnetic field on the PMT signal [10,11].The 144 photomultipliers, connected to the 34 TOF paddles,are powered by 4 power supply (Scintillator High Voltage, SHV),which can provide a voltage between 1700 V and 2250 V. Thenominal gain of the photomultipliers is about 106 when poweredat 2000 V.
3.1. TOF readout
The PMT anode and third last dynode signals are read outindependently, as shown in Fig. 3. The anode signals from the 2(3) PMTs of the same counter side are summed up and transmittedto the TOF readout electronics module SFET2 (Scintillator FrontEnd Time) [12] for time and anode charge measurement. Eachdynode signal is measured individually by the readout electronicsmodule SFEC (Scintillator Front End Charge) [12] and it is used forthe measurement of the charge.
The anode signal is divided into two parts. 95% of the signal isused for the time measurement and for the trigger. It is comparedto the following three thresholds:
1. a low threshold (LT), set at �20% of the minimum ionizingProton (MIP) signal for time measurement;
2. a high threshold (HT), set at �60% of the MIP signal for ZZ1trigger;
3. a super high threshold (SHT), set at �400% of the MIP signal forZZ2 trigger.
When the signal is above the thresholds, the output is sent to aHPTDC [13] to record the time. The time of the fast trigger is alsoregistered and it is used as the reference time in each event.
The remaining 5% of the anode signal is used for the chargemeasurement. Anode and dynode analog-to-digital converter (ADC)share a common design. The pulse is integrated by an AICPPP chip(shaper analog integrated circuit) [14] and then digitized.
The anode signal is used to measure absolute charge for low Znuclei (1rZr8), while the dynode extends the charge measure-ment to higher Z (ZZ3) particles.
3.2. Performance of the hardware in space
To assess the TOF capability of operating in space, all thecomponents underwent several vacuum, thermal and vibration testsbefore their integration on the TOF detector. In addition to that, theUTOF and LTOF have been space qualified, passing through strictthermal vacuum and vibration tests at SERMS laboratories [15]. Toensure a long term reliability, a certain degree of redundancy hasbeen implemented in the TOF system: each counter is 4(6)-foldredundant in PMTs, and doubly redundant in powering and read-outelectronics. During the first two years of data taking on the ISS, theTOF detector worked as expected without any major issue.
4. TOF velocity measurement
The velocity vpar ¼Δs=ΔT of particle crossing AMS-02 is mea-sured by the TOF using the particle time of flight ΔT betweendifferent layers, and the trajectory length Δs given by the Trackeror by the TOF. The TOF velocity measurement is used to determinethe particle velocity magnitude2 (β) and to distinguish upward-going from downward-going particles. In the following sectionsthe time calibration and the longitudinal coordinate calibration aredescribed.
4.1. Time measurement
TOF anode readout electronic SFET2s for the measurement ofthe particle crossing time, are located in four different S-Crates[12]. Each S-Crate has four different SFET2 boards, each SFET2serving two different sides from two TOF layers. The measurementof the particle crossing time is based on a 40 MHz clock HPTDC[13] inside each SFET2.
The time-to-digital converter (TDC) bin widths (nominal:25 ps) are slightly different depending on the individual electroniccomponents. Specific calibration to equalize the TDC bin width ofeach SFET2 is performed by using a large statistics of cosmic rayparticles. Once the calibration for the TDCs0 non-linearity isapplied, the TDCs are ready to be used for the time measurement.
The principle of the measurement is shown in Fig. 4. The lowthreshold measured time TLT in each counter side together withthe fast trigger time TFT is related to particle crossing time Tparthrough various delays, which depend on light transmission, oncable length and on the signal shape:
TLT ¼ TFT �ðTparþTtransþTdelþTslewÞ ¼ TFT � Tparþ xvc
þTdelþ f ðAÞ� �
ð1Þ
Fig. 1. Schematics of the AMS-02 detector.
2 The particle velocity magnitude is defined as velocity (vpar) divided by lightspeed (c).
V. Bindi et al. / Nuclear Instruments and Methods in Physics Research A 743 (2014) 22–29 23

where Ttrans ¼ x=vc is the light transmission time, Tdel is the cableand electronics delay time, Tslew ¼ f ðAÞ ¼ S=Aγ is the time walkdelay described by the empirical formula, vc is the effective light
speed inside the paddle, A is the anode ADC value, and S and γ arefree parameters related to the signal shape.
The particle crossing time Tpar can be calculated by averaging themeasured time (Tn;LT þTp;LT ) from the two counter sides (n and p):
Tn;LT ¼ TFT � Tn;parþxvcþTn;delþ
SnAγn
� �ð2Þ
Tp;LT ¼ TFT � Tp;parþL�xvc
þTp;delþSpAγp
!ð3Þ
to obtain
Tpar ¼Tn;parþTp;par
2¼ �
Tn;LT þTp;LT þ SnAγnþ Sp
Aγp
2�TDelþTFT
¼ �TnpþTFT ð4Þ
where TDel ¼ ðTn;delþTp;delþL=vcÞ=2, and Tnp ¼ ðTn;LT þTp;LT þSn=A
γnþSp=A
γpÞ=2þTDel. Therefore, each counter has four free para-
meters, Sn, Sp, TDel and γ, that need to be derived from the data.
4.2. Time calibration
The particle crossing times measured by two different counters cmand ck in two different layers li and lj are related to particle velocity vpar:
TnpðlicmÞ �TnpðljckÞ ¼ �TparðlicmÞ þTparðljckÞ ¼Lliljvpar
ð5Þ
Fig. 2. The TOF detector: (a) upper TOF plane; (b) lower TOF plane; and (c) one counter.
Fig. 3. TOF anode and dynode readout.
V. Bindi et al. / Nuclear Instruments and Methods in Physics Research A 743 (2014) 22–2924

where Llilj is the particle path length between the two TOF layers i andj. Llilj and vpar can be obtained from the measurement by the silicontracker detector.
The time calibration is performed by minimizing the value ofthe formula, defined as follows:
∑li lj
∑ckcm
∑events
TnpðlicmÞ �TnpðljckÞ �Lli ljvpar
� �2
ð6Þ
where∑events sums over all events of the time differences betweenany two counters in any two TOF layers, ∑ckcm sums over allcounter pairs in the two layers i and j, and ∑li lj sums over all layerpairs belonging to different planes (l0l2, l0l3, l1l2, l1l3).
The 103 time calibration parameters (68 for slewings, 34 fortime delays, 1 for γ) for 34 TOF paddles are determined by thisminimization.
The calibration of the TOF time measurement is performedusing high energy particles with rigidities greater than 20 GV, toensure that the particle β is close to 1.
The calibration also needs to take into account: the anode gainchanges due to the temperature variations, scintillator and PMTageing and threshold fluctuations. The calibration procedure isthus repeated every 15 days.
The time walk delay f ðAÞ ¼ S=Aγ is related to the pulse shape, tothe LT threshold setting and to the anode amplitude sampling. Inorder to trace the pulse shapes in the full dynamic range, a samplemade of different charged particles (Protons, Heliums and nuclei)with different weights is chosen to perform the calibration.
4.3. Longitudinal coordinate calibration
The difference between the times measured at the two countersides ðTn;LT �Tp;LT Þ is related to the coordinate of the hitting point
of the particle along the counter, CTOF, according to the relation:
CTOF ¼ vcTn;LT �Sn �dS
Aγn
� �� Tp;LT �Sp þdS
Aγp
� �2
þC0 ð7Þ
where Sn, Sp and γ are obtained by the time calibration procedure,dS is a term introduced to balance the change in the effective lightspeed with amplitude, and C0 is a constant which takes intoaccount the time differences in the signal transmission due tocable length and electronics.
By matching CTOF with the extrapolation of the Tracker track inthe counter, CTRACKER, it is possible to determine, for each counter,the constants vc, dS and C0 by minimizing the value of the formuladefined as follows:
∑events
ðCTOF�CTRACKERÞ2 ð8Þ
4.4. Performance in space
In the following, the performance of the TOF system aftercalibration is described. The data analysed corresponds to the datataking period from July 2011 to May 2013.
The velocity resolution of the TOF system improves withincreasing particle charge Z (see Fig. 5) from 4% at Z¼1 to 1.2%at Z¼6. Figs. 6 and 7 show the measured β distributions forHelium and Carbon ions, respectively, which correspond to thesingle counter time resolution is 80 ps for Helium and 48 ps forCarbons.
After the calibration, the resolution on the longitudinal coordi-nate measured by TOF is about 2.7 cm for Protons and 0.9 cm forCarbon ions, as shown in Fig. 8.
5. TOF charge measurement
The TOF system provides precise measurement of the charge ofthe particles crossing AMS-02. Several calibration steps are neces-sary to achieve the best measurement. In the following sections allthe calibration corrections are described and the performance ofthe TOF charge measurement in space is also reported. The relativesize of the most important calibration corrections for the TOFcharge measurement is shown in Table 1.
5.1. Attenuation and gain calibration
The light generated by the particle in the scintillator is partiallyabsorbed: this effect produces an attenuation of the signal as afunction of the particle hit position. This dependence is shown inFig. 9.
Fig. 4. Principle of the time measurement: particles hitting the counter at positionx (a) produce a signal which is discriminated with a low threshold (b); the particlecrossing time Tpar is related to the measured time TLT through various constants (c),as described in the text.
Fig. 5. TOF velocity resolution as a function of the particle charge Z.
V. Bindi et al. / Nuclear Instruments and Methods in Physics Research A 743 (2014) 22–29 25

During AMS data acquisition, the signal changes due to varyingtemperatures, PMT ageing and changing scintillator optical proper-ties. To correct for these effects, a calibration depending on time(i.e. “dynamic”) is needed. The dynamic calibration combinesscintillator light attenuation properties and PMT gain:
1. For each counter side, the light attenuation calibration isperformed every 15 days using anode signals. The calibration
sample includes high energy Protons and Helium nuclei. As aresult, a function f attðxÞ of the hit position is determined foreach counter side, to equalize the response along the counter:
Aatt ¼ Ameasured
f attðxÞð9Þ
where Aatt is the amplitude of the signal corrected for attenua-tion and Ameasured is the measured amplitude.
2. For each counter side, the anode gain calibration is performedevery 3 days. The calibration sample includes high energyProtons and Helium nuclei. As a result, a gain factor Ganode;eq
is determined for each counter side, to equalize all the anodeamplitudes:
Aeq ¼Aatt
Ganode;eqð10Þ
3. For each PMT dynode, the gain calibration is performed every7.5 days. The calibration sample includes high energy Carbonnuclei. As a result, a gain factor Gdynode;eq is determined for eachPMT to equalize all the dynode amplitudes:
Deq ¼Datt
Gdynode;eqð11Þ
Fig. 10 shows the light yield corrected for attenuation, obtainedafter applying the dynamic calibration procedure to one counterside.
After the dynamic calibration, the resulting amplitudes ofdynodes and anodes have to be further corrected for saturation,electronics non-linearities and particle velocity using the fullyavailable statistics. These corrections, which do not change withtime (i.e. they are “static”), are described in the following sections.
Fig. 6. Measured TOF velocity distribution for Helium ions with R420 GV. Thedashed line is a Gaussian fit with a standard deviation of 2%.
Fig. 7. Measured TOF velocity distribution for Carbon ions with R420 GV.The dashed line is a Gaussian fit with a standard deviation of 1.2%.
Fig. 8. Average TOF counter longitudinal coordinate resolution as a function of theparticle charge Z.
Table 1TOF charge measurement calibration corrections relative size.
Correction item Relative amplitude correction
Attenuation Up to 50% depending on the hit positionalong the counter
Anode and dynode gain Up to 5% depending on the PMT temperatureLight yield saturation o4% ðZr3Þ to 150% ðZ ¼ 26ÞAnode non-linearity o1% ðZr3Þ to 100% ðZ ¼ 10ÞVelocity dependence o1% ðβ¼ 0:99Þ to 150% ðβ¼ 0:4Þ
Fig. 9. Anode amplitude measured at one counter side as a function of thelongitudinal coordinate of the particle hit point.
V. Bindi et al. / Nuclear Instruments and Methods in Physics Research A 743 (2014) 22–2926

5.2. Light yield saturation
The scintillation light produced by a high Z particle is notlinearly proportional to the energy deposition. The number ofemitted photons tends to saturate with increasing depositedenergy (dE=dx). This effect is known as Birks0 saturation [17].
The saturation has been parametrized with the followingformula (Fig. 11):
dEdx
¼ aZ2
1þb arctan cb Z
2� � ð12Þ
where a, b and c are constant parameters, and Z is determinedusing the Tracker charge measurements. For Z-0, the aboveformula becomes the traditional Birks’ formula:
dEdx Z-0 �
aZ2
1þcZ2
����� ð13Þ
The calibration of light saturation is performed using thedynode signals, by minimizing the value defined as follows:
∑Npm ;Zmax
i ¼ 1;Z ¼ 3
Di;Z� GiZ2
1þb arctan cb Z2� �
si;Z
0B@
1CA
2
ð14Þ
where Npm is the number of PMTs for one counter, Zmax is themaximum detectable charge Z, Di;Z is the average dynode ampli-tude (corrected for attenuation) for Z, b and c are the saturationparameters, Gi is the dynode gain (equivalent to the factorGdynode;eq defined in Eq. (11)) and si;Z is the standard deviation ofDi;Z . The minimization procedure determines the parameters b andc for each counter.
5.3. Anode non-linearity calibration
Due to the limited dynamic range of the anode ADCs, theanode signal saturates for high charges. Fig. 12 shows the anodeamplitude compared to the dynode amplitude in a large amplituderange.
In order to extend the anodes measuring range, this effect iscorrected as follows:
1. determine the anode non-linearity by using the dynode ampli-tude as reference whenever possible;
2. extrapolate the anode measurement at lower energy deposi-tion, where the dynode signal is not present.
For anode signal a function f anl is defined, to correct the non-linear anode response(equalized for gain Ganode;eq) to the dynodeamplitude scale AAD:
AAD ¼ Ameasured
Ganode;eq f anlð15Þ
which is further equalized for attenuation:
Aeq ¼AAD
f attðxÞð16Þ
The amplitude Ascint with the correction of Birks’ saturationeffect for each TOF counter can be obtained either from the anodemeasurements from the counter two sides (An;eq and Ap;eqÞ:
Aanode;scint ¼ f �1Birks
An;eq=s2nþAp;eq=s2
p
1=s2nþ1=s2
p
!ð17Þ
or from the dynode measurements weighted with the resolutionof each PMT:
Adynode;scint ¼ f �1Birks
∑Npm
i ¼ 1Di;eq=s2i
∑Npm
i ¼ 11=s2i
!ð18Þ
Fig. 10. Dynode amplitude measured for Carbon at one counter side as a functionof the longitudinal coordinate of the particle hit point, after the dynamic correctiondescribed in the text.
Fig. 11. Measured dynode amplitude, corrected for attenuation, as a function of theparticle charge. The solid line is the fit with formula (12).
Fig. 12. Anode amplitude versus dynode amplitude. The anode high amplitude partis corrected for non-linearity using the dynode amplitude as reference (solid line),the anode low amplitude for charge measurement is extrapolated using anodelinear range (dashed line).
V. Bindi et al. / Nuclear Instruments and Methods in Physics Research A 743 (2014) 22–29 27

where sn and sp are the standard deviation of the amplitude oftwo side anodes, Di;eq is the amplitude of each dynode correctedfor dynode gain and attenuation, Npm is the number of PMTs ineach counter, si is the standard deviation of the amplitude of eachdynode, f �1
Birks is the inverse of the Birks’ saturation function offormula (12).
5.4. Dependence of the charge and of the energy loss from thevelocity
Particle energy deposition depends on particle energy asdescribed by the Bethe–Bloch formula (dE=dx¼ f ðβÞZ2) [16]. Espe-cially for the low β region, this dependence is quite significant.
The correction is based on the measured β value. However,when particle traverses the TOF paddles and the other AMSmaterial, their velocity decreases. Consequently, different β depen-dences are observed for each layer and particle.
To correct the energy loss (dE=dx) from effects related to theparticle energy, the following formula is used:
dEdx scintpAscint ¼ hðβ;AscintÞQ2
scint
��� ð19Þ
where Q scint is the counter measured charge. The functionhðβ;AscintÞ depends on TOF measured β and counter amplitudeAscint, parameterized for every counter.
Finally the continuous charge estimator Q scint from each TOFcounter can be derived:
Q scint ¼ffiffiffiffiffiffiffiffiffiffiffiffiffiffiffiffiffiffiffiffiffi
Ascint
hðβ;AscintÞ
sð20Þ
Fig. 13 shows the corrected amplitude as a function of β fordifferent Z.
5.5. Charge estimators
The charge estimator can use any or all of the charge identifica-tion capabilities: the charge can be derived from each PMT, eachcounter or each layer.
An overall measurement of the particle charge can be done byusing the measurements at the layer level and performing a“Gaussian mean” (Qgaus) with the following formula:
Qgaus ¼∑lQ l�½Qmin or Qmax�
n�1ð21Þ
where Ql is the charge measured by layer l, Qmax is the maximumcharge measured by any layer, Qmin is the minimum chargemeasured by any layer, and n is the number of layers. Namely,
Qgaus excludes the counter with the maximum deviation fromaverage charge (the lowest or the highest) which could be used toestimate the charge of particles (see Fig. 14).
A more powerful, charge estimator uses the likelihood methodto assign an integer value to the particle charge. The Likelihoodcharge estimator is defined as follows:
LðZÞ ¼ log ∏n
i ¼ 1Pi;Z;βðQiÞ
!ð22Þ
where n is the number of counters included in the measurement,Pi;Z;β is the TOF charge probability density function (PDF), para-meterized for each counter i, nuclei and velocity bin and Qi is thecharge estimator for counter i. An example of PDF is shown inFig. 15 for Z¼6 particles. PDF have been computed for particleswith charge from Z¼1 up to ZZ26.
The most probable measured charge Z is determined by solvingthe equation:
∂LZ∂Z
����Z ¼ Z
¼ 0
The probability for a given charge Z is
ProbðZÞ ¼ffiffi½pn�∏iPi;Z;βðQiÞ
∑Z0ffiffi½pn�∏iPi;Z0 ;βðQiÞ
ð23Þ
ProbðZÞ can be used as a quality indicator for the chargemeasurement. In particular, if a nucleus interacts inside the AMSdetector, the charge estimator in different planes will havedifferent values and the probability ProbðZ Þ of the most probable
Fig. 13. TOF counter corrected amplitude as a function of β for Z¼3 to Z¼26.
He
BeC
O
MgS Ca
Fe
Ni
Fig. 14. TOF charge estimation for different ions obtained using the Gaussian meancalculation (Qgaus, formula (21)).
Fig. 15. Typical TOF counter amplitude (Q2) for Z¼6 particles. The dashed line isthe related PDF function with the velocity range from 0.9 to 0.95c.
V. Bindi et al. / Nuclear Instruments and Methods in Physics Research A 743 (2014) 22–2928
charge will show a lower value with respect to non-interactingnuclei.
5.6. Performance in space
Once all the dynamic and static calibration procedures areapplied, the TOF is capable of measuring all particle charges fromZ¼1 to Z¼40 with high precision, as shown in Fig. 14. In Fig. 16 the
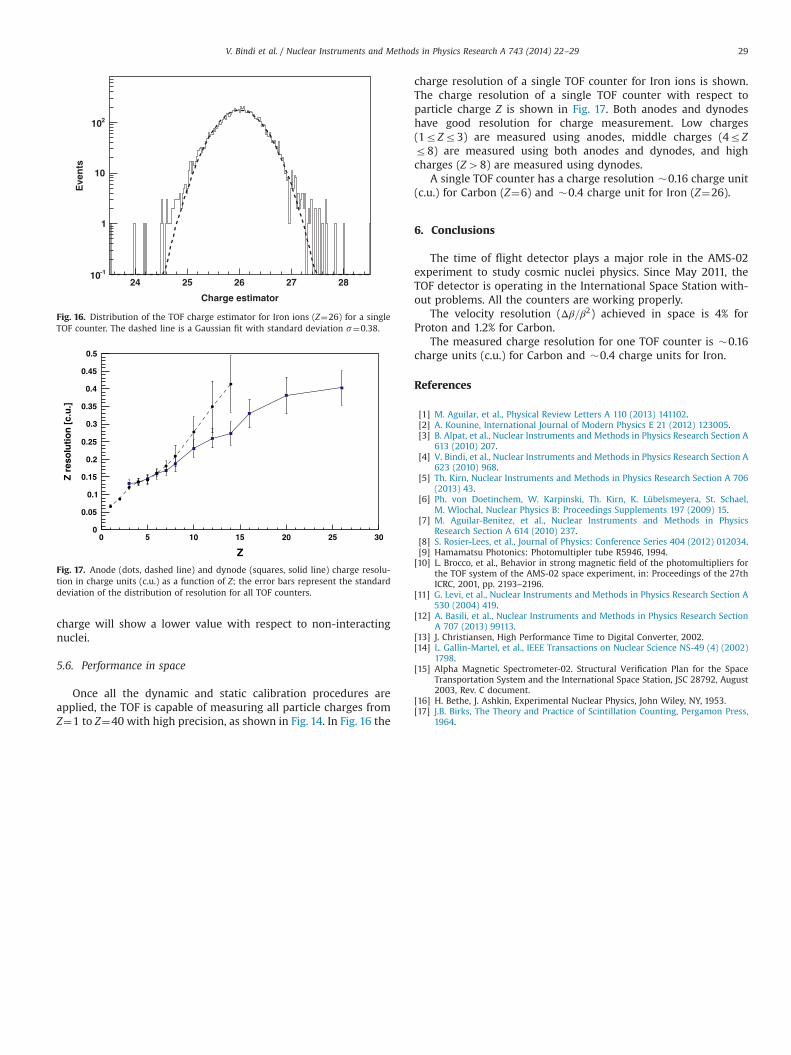
charge resolution of a single TOF counter for Iron ions is shown.The charge resolution of a single TOF counter with respect toparticle charge Z is shown in Fig. 17. Both anodes and dynodeshave good resolution for charge measurement. Low charges(1rZr3) are measured using anodes, middle charges (4rZr8) are measured using both anodes and dynodes, and highcharges (Z48) are measured using dynodes.
A single TOF counter has a charge resolution �0.16 charge unit(c.u.) for Carbon (Z¼6) and �0.4 charge unit for Iron (Z¼26).
6. Conclusions
The time of flight detector plays a major role in the AMS-02experiment to study cosmic nuclei physics. Since May 2011, theTOF detector is operating in the International Space Station with-out problems. All the counters are working properly.
The velocity resolution (Δβ=β2) achieved in space is 4% forProton and 1.2% for Carbon.
The measured charge resolution for one TOF counter is �0.16charge units (c.u.) for Carbon and �0.4 charge units for Iron.
References
[1] M. Aguilar, et al., Physical Review Letters A 110 (2013) 141102.[2] A. Kounine, International Journal of Modern Physics E 21 (2012) 123005.[3] B. Alpat, et al., Nuclear Instruments and Methods in Physics Research Section A
613 (2010) 207.[4] V. Bindi, et al., Nuclear Instruments and Methods in Physics Research Section A
623 (2010) 968.[5] Th. Kirn, Nuclear Instruments and Methods in Physics Research Section A 706
(2013) 43.[6] Ph. von Doetinchem, W. Karpinski, Th. Kirn, K. Lübelsmeyera, St. Schael,
M. Wlochal, Nuclear Physics B: Proceedings Supplements 197 (2009) 15.[7] M. Aguilar-Benitez, et al., Nuclear Instruments and Methods in Physics
Research Section A 614 (2010) 237.[8] S. Rosier-Lees, et al., Journal of Physics: Conference Series 404 (2012) 012034.[9] Hamamatsu Photonics: Photomultipler tube R5946, 1994.[10] L. Brocco, et al., Behavior in strong magnetic field of the photomultipliers for
the TOF system of the AMS-02 space experiment, in: Proceedings of the 27thICRC, 2001, pp. 2193–2196.
[11] G. Levi, et al., Nuclear Instruments and Methods in Physics Research Section A530 (2004) 419.
[12] A. Basili, et al., Nuclear Instruments and Methods in Physics Research SectionA 707 (2013) 99113.
[13] J. Christiansen, High Performance Time to Digital Converter, 2002.[14] L. Gallin-Martel, et al., IEEE Transactions on Nuclear Science NS-49 (4) (2002)
1798.[15] Alpha Magnetic Spectrometer-02. Structural Verification Plan for the Space
Transportation System and the International Space Station, JSC 28792, August2003, Rev. C document.
[16] H. Bethe, J. Ashkin, Experimental Nuclear Physics, John Wiley, NY, 1953.[17] J.B. Birks, The Theory and Practice of Scintillation Counting, Pergamon Press,
1964.
Fig. 16. Distribution of the TOF charge estimator for Iron ions (Z¼26) for a singleTOF counter. The dashed line is a Gaussian fit with standard deviation s¼0.38.
Fig. 17. Anode (dots, dashed line) and dynode (squares, solid line) charge resolu-tion in charge units (c.u.) as a function of Z; the error bars represent the standarddeviation of the distribution of resolution for all TOF counters.
V. Bindi et al. / Nuclear Instruments and Methods in Physics Research A 743 (2014) 22–29 29