Calculation of Absolute Protein-Ligand Binding Affinity Using Path and Endpoint Approaches
6
Structural dynamics of the lac repressor–DNA complex revealed by a multiscale simulation Elizabeth Villa, Alexander Balaeff, and Klaus Schulten* Theoretical and Computational Biophysics Group, Beckman Institute, University of Illinois, 405 North Mathews Avenue, Urbana, IL 61801 Edited by Bruce J. Berne, Columbia University, New York, NY, and approved March 11, 2005 (received for review December 16, 2004) A multiscale simulation of a complex between the lac repressor protein (LacI) and a 107-bp-long DNA segment is reported. The complex between the repressor and two operator DNA segments is described by all-atom molecular dynamics; the size of the simulated system comprises either 226,000 or 314,000 atoms. The DNA loop connecting the operators is modeled as a continuous elastic ribbon, described mathematically by the nonlinear Kirchhoff differential equations with boundary conditions obtained from the coordinates of the terminal base pairs of each operator. The forces stemming from the looped DNA are included in the molecular dynamics simulations; the loop structure and the forces are con- tinuously recomputed because the protein motions during the simulations shift the operators and the presumed termini of the loop. The simulations reveal the structural dynamics of the LacI– DNA complex in unprecedented detail. The multiple domains of LacI exhibit remarkable structural stability during the simulation, moving much like rigid bodies. LacI is shown to absorb the strain from the looped DNA mainly through its mobile DNA-binding head groups. Even with large fluctuating forces applied, the head groups tilt strongly and keep their grip on the operator DNA, while the remainder of the protein retains its V-shaped structure. A simulated opening of the cleft of LacI by 500-pN forces revealed the interactions responsible for locking LacI in the V-conformation. protein–DNA interaction molecular dynamics elastic rod model DNA loop large-scale protein motion T he lac repressor (LacI) is a celebrated DNA-binding protein that regulates the function of the lac operon (1), a set of genes responsible for the lactose metabolism in Escherichia coli. In the absence of lactose, LacI inhibits the expression of the operon by binding to two of three specifically recognized DNA sites, called operators, and causing the DNA between the operators to fold into a loop (2–4). Depending on which operators are bound, the loop may have a length of either 384 or 75 bp (4, 5). The smaller loop contains the promoter of the lac operon, which includes binding sites for RNA polymerase and the activator protein CAP (1). Several x-ray structures of LacI, both alone and in complex with DNA, were reported (4, 6, 7). The repressor is a homotetramer folded into a dimer of dimers, two massive ‘‘arms’’ connected at the ends by means of a four-helix bundle (Fig. 1). Each arm consists of a core and a DNA-binding head group domain; the lactose binding sites divide the core domains into two subdomains. This architec- ture is essential for the function of LacI. The protein binds two operators with its two head groups and holds them close together, enforcing the interoperator loop, while leaving the lactose binding sites inside the core domains open for lactose molecules to enter, disrupt the repressor, and induce the expression of the lac operon. At the same time, the loose connections between the LacI domains imply a great degree of structural f lexibility that LacI needs to first span a wide distance in search for the operators and, once bound to them, absorb the fluctuations of the created DNA loop. FRET experiments demonstrated that the V-shaped configuration of LacI observed in the crystal (4), where the protein binds disjoint DNA segments (Fig. 1c), is indeed altered when the protein is bound to a continuous DNA loop (8). It is believed that the arms of LacI rotate around the hinge domain when absorbing pressure from the looped DNA (refs. 6 and 8 and D. Swigon, B. D. Coleman, and W. K. Olson, unpublished data). Conceivably, rotation and tilting of the f lexible head group domains also contribute to the conformational change. Here we study the structural dynamics of LacI by means of molecular dynamics (MD) simulation of the all-atom model of its complex with DNA. The simulation presents a formidable compu- tational problem, because LacI alone is already a very large protein that, solvated in a water bath, results in a system of 200,000 atoms (10). Including even the short 75-bp-long DNA loop in the model increases the size of the system to at least 700,000 atoms and including the long 384-bp loop increases the size of the system to 2 million atoms. A MD simulation of a system of this size is extremely costly computationally. Moreover, the characteristic motions of the DNA loop in water occur on a much longer time scale than the tens of nanoseconds attainable by MD today. We therefore approach the problem through a multiscale strategy (10–12), describing the different parts of the system at different spatial and temporal resolution. The LacI complex with the operator DNA segments is simulated in solvent by all-atom MD, whereas the 75-bp DNA loop between the operators is described by a continuum model that mimics the observed elastic properties of DNA in solution (13–15) (Fig. 1 a and b). The mechanical properties of the loop are described by means of those of its lowest-energy equilibrium conformation, which is assumed to instantaneously follow the changes in the protein structure. A system of differential equations that yields the equilibrium conformation of the elastic loop and the force that the loop exerts on LacI is solved for a fraction of the computational cost of an all-atom MD simulation of the DNA loop (10, 15); the force then is included in the MD simulation of LacI. The multiscale approach permits us to address the key question regarding the structure–function relationship of LacI: how the structural dynam- ics of the repressor change under the inf luence of the strained DNA loop. Methods In this section, the simulated model systems and the protocols of the multiscale simulations are described. All-Atom System. The simulated all-atom structure of the LacI– DNA complex (Fig. 1), deposited to the Protein Data Bank (ID code 1Z04), was built from several Protein Data Bank structures; protein or DNA segments poorly resolved in one structure were taken from the other structures (see ref. 16 for details). The protein head groups in the constructed structure are bound to the 16-bp- long palindromic DNA sequence TTGTGAGCGCTCACAA that is a central part of the symmetrized LacI operator (4, 17). The constructed complex was embedded in a box-shaped (170 140 This paper was submitted directly (Track II) to the PNAS office. Abbreviations: MD, molecular dynamics; RMSD, rms deviation; avRMSD, RMSD value averaged over the entire simulation. Data deposition: The atomic coordinates and structure factors have been deposited in the Protein Data Bank, www.pdb.org (PDB ID code 1Z04). *To whom correspondence should be addressed. E-mail: [email protected]. © 2005 by The National Academy of Sciences of the USA www.pnas.orgcgidoi10.1073pnas.0409387102 PNAS May 10, 2005 vol. 102 no. 19 6783– 6788 BIOPHYSICS CHEMISTRY SPECIAL FEATURE
-
Upload
independent -
Category
Documents
-
view
1 -
download
0
Transcript of Calculation of Absolute Protein-Ligand Binding Affinity Using Path and Endpoint Approaches
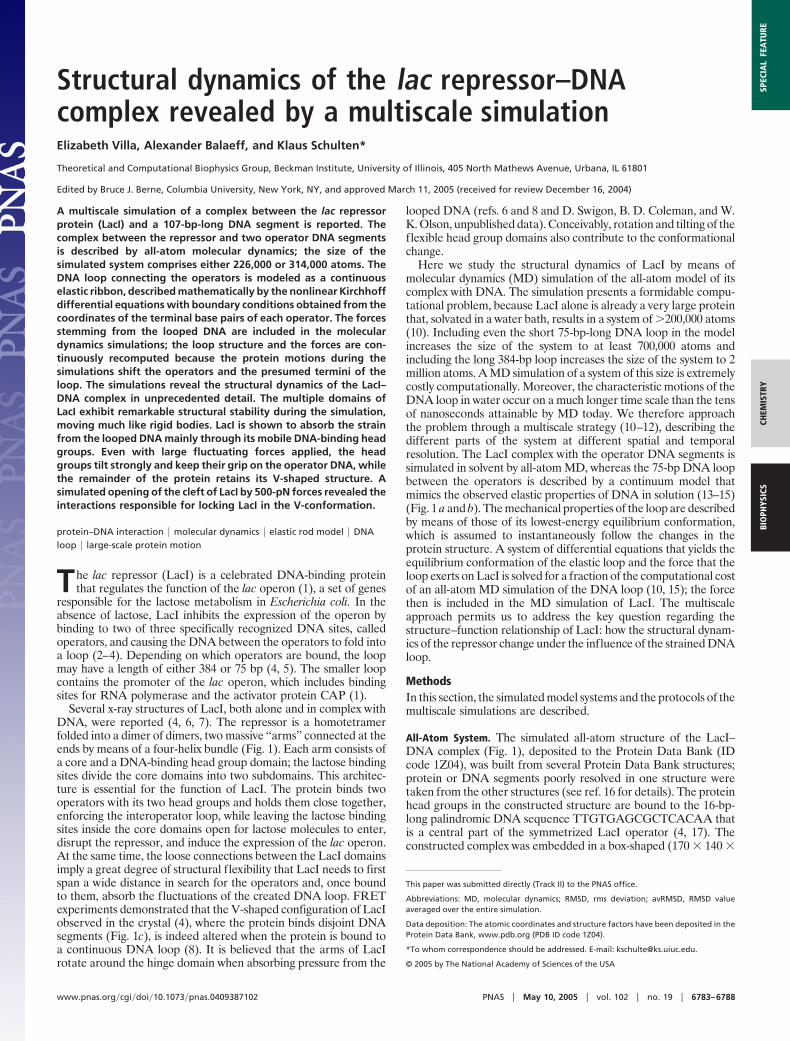
Structural dynamics of the lac repressor–DNAcomplex revealed by a multiscale simulationElizabeth Villa, Alexander Balaeff, and Klaus Schulten*
Theoretical and Computational Biophysics Group, Beckman Institute, University of Illinois, 405 North Mathews Avenue, Urbana, IL 61801
Edited by Bruce J. Berne, Columbia University, New York, NY, and approved March 11, 2005 (received for review December 16, 2004)
A multiscale simulation of a complex between the lac repressorprotein (LacI) and a 107-bp-long DNA segment is reported. Thecomplex between the repressor and two operator DNA segmentsis described by all-atom molecular dynamics; the size of thesimulated system comprises either 226,000 or 314,000 atoms. TheDNA loop connecting the operators is modeled as a continuouselastic ribbon, described mathematically by the nonlinear Kirchhoffdifferential equations with boundary conditions obtained from thecoordinates of the terminal base pairs of each operator. The forcesstemming from the looped DNA are included in the moleculardynamics simulations; the loop structure and the forces are con-tinuously recomputed because the protein motions during thesimulations shift the operators and the presumed termini of theloop. The simulations reveal the structural dynamics of the LacI–DNA complex in unprecedented detail. The multiple domains ofLacI exhibit remarkable structural stability during the simulation,moving much like rigid bodies. LacI is shown to absorb the strainfrom the looped DNA mainly through its mobile DNA-binding headgroups. Even with large fluctuating forces applied, the headgroups tilt strongly and keep their grip on the operator DNA, whilethe remainder of the protein retains its V-shaped structure. Asimulated opening of the cleft of LacI by 500-pN forces revealed theinteractions responsible for locking LacI in the V-conformation.
protein–DNA interaction � molecular dynamics � elastic rod model � DNAloop � large-scale protein motion
The lac repressor (LacI) is a celebrated DNA-binding proteinthat regulates the function of the lac operon (1), a set of genes
responsible for the lactose metabolism in Escherichia coli. In theabsence of lactose, LacI inhibits the expression of the operon bybinding to two of three specifically recognized DNA sites, calledoperators, and causing the DNA between the operators to fold intoa loop (2–4). Depending on which operators are bound, the loopmay have a length of either 384 or 75 bp (4, 5). The smaller loopcontains the promoter of the lac operon, which includes bindingsites for RNA polymerase and the activator protein CAP (1).
Several x-ray structures of LacI, both alone and in complex withDNA, were reported (4, 6, 7). The repressor is a homotetramerfolded into a dimer of dimers, two massive ‘‘arms’’ connected at theends by means of a four-helix bundle (Fig. 1). Each arm consists ofa core and a DNA-binding head group domain; the lactose bindingsites divide the core domains into two subdomains. This architec-ture is essential for the function of LacI. The protein binds twooperators with its two head groups and holds them close together,enforcing the interoperator loop, while leaving the lactose bindingsites inside the core domains open for lactose molecules to enter,disrupt the repressor, and induce the expression of the lac operon.At the same time, the loose connections between the LacI domainsimply a great degree of structural flexibility that LacI needs to firstspan a wide distance in search for the operators and, once boundto them, absorb the fluctuations of the created DNA loop. FRETexperiments demonstrated that the V-shaped configuration of LacIobserved in the crystal (4), where the protein binds disjoint DNAsegments (Fig. 1c), is indeed altered when the protein is bound toa continuous DNA loop (8). It is believed that the arms of LacIrotate around the hinge domain when absorbing pressure from the
looped DNA (refs. 6 and 8 and D. Swigon, B. D. Coleman, and W.K. Olson, unpublished data). Conceivably, rotation and tilting of theflexible head group domains also contribute to the conformationalchange.
Here we study the structural dynamics of LacI by means ofmolecular dynamics (MD) simulation of the all-atom model of itscomplex with DNA. The simulation presents a formidable compu-tational problem, because LacI alone is already a very large proteinthat, solvated in a water bath, results in a system of �200,000 atoms(10). Including even the short 75-bp-long DNA loop in the modelincreases the size of the system to at least 700,000 atoms andincluding the long 384-bp loop increases the size of the system to 2million atoms. A MD simulation of a system of this size is extremelycostly computationally. Moreover, the characteristic motions of theDNA loop in water occur on a much longer time scale than the tensof nanoseconds attainable by MD today. We therefore approachthe problem through a multiscale strategy (10–12), describing thedifferent parts of the system at different spatial and temporalresolution. The LacI complex with the operator DNA segments issimulated in solvent by all-atom MD, whereas the 75-bp DNA loopbetween the operators is described by a continuum model thatmimics the observed elastic properties of DNA in solution (13–15)(Fig. 1 a and b). The mechanical properties of the loop are describedby means of those of its lowest-energy equilibrium conformation,which is assumed to instantaneously follow the changes in theprotein structure. A system of differential equations that yields theequilibrium conformation of the elastic loop and the force that theloop exerts on LacI is solved for a fraction of the computational costof an all-atom MD simulation of the DNA loop (10, 15); the forcethen is included in the MD simulation of LacI. The multiscaleapproach permits us to address the key question regarding thestructure–function relationship of LacI: how the structural dynam-ics of the repressor change under the influence of the strained DNAloop.
MethodsIn this section, the simulated model systems and the protocols of themultiscale simulations are described.
All-Atom System. The simulated all-atom structure of the LacI–DNA complex (Fig. 1), deposited to the Protein Data Bank (IDcode 1Z04), was built from several Protein Data Bank structures;protein or DNA segments poorly resolved in one structure weretaken from the other structures (see ref. 16 for details). The proteinhead groups in the constructed structure are bound to the 16-bp-long palindromic DNA sequence TTGTGAGCGCTCACAA thatis a central part of the symmetrized LacI operator (4, 17). Theconstructed complex was embedded in a box-shaped (170 � 140 �
This paper was submitted directly (Track II) to the PNAS office.
Abbreviations: MD, molecular dynamics; RMSD, rms deviation; avRMSD, RMSD valueaveraged over the entire simulation.
Data deposition: The atomic coordinates and structure factors have been deposited in theProtein Data Bank, www.pdb.org (PDB ID code 1Z04).
*To whom correspondence should be addressed. E-mail: [email protected].
© 2005 by The National Academy of Sciences of the USA
www.pnas.org�cgi�doi�10.1073�pnas.0409387102 PNAS � May 10, 2005 � vol. 102 � no. 19 � 6783–6788
BIO
PHYS
ICS
CHEM
ISTR
YSP
ECIA
LFE
ATU
RE

100 Å3) bath of water molecules by using the program VMD (18).One hundred eighty water molecules were replaced by 114 Na� and66 Cl� ions according to the electrochemical potential around theLacI–DNA complex computed with the DELPHI program (19),resulting in an ionic strength of �100 mM and zero net charge. Theresulting system of 226,314 atoms (Fig. 1a) was equilibrated in a2-ns-long MD simulation following a multistep protocol, as de-scribed in Supporting Methods, which is published as supportinginformation on the PNAS web site.
To study large conformational changes during the LacI open-ing, a system of 314,452 atoms was similarly built by using a largerwater box (240 � 140 � 100 Å3; 143 Na�, 95 Cl�) andequilibrated for 1 ns.
MD Protocol. The MD simulations of the constructed system wererun with software package NAMD (20), by using the CHARMM27force field with a TIP3P water model (21). The system wasequilibrated as an NPT ensemble, using the Nose–Hoover method(22) at a temperature T � 300 K and pressure P � 1 atm (1 atm �101.3 kPa). Periodic boundary conditions were assumed, andlong-range electrostatic forces were computed by using the P3MEmethod (23). During equilibration, the simulation employed rigidand harmonic constraints on parts of the system as described inSupporting Methods. Planarity of the nucleotide bases at the 5� and3� termini of the operators was enforced by additional harmonicconstraints throughout the simulation (10).
The total of 22.4 ns of MD was simulated for the 226,314-atomsystem on 600 processors at the Pittsburgh Supercomputer Center,with an average production speed of 2.7 ns�day. The 314,452-atomsystem was simulated for 17 ns on 254 processors at the NationalCenter for Supercomputing Applications (University of Illinois),with an average production speed of 2.5 ns�day.
DNA Loop Model. The 75-bp-long DNA loop connecting the LacI-bound operators was modeled as an elastic ribbon (10, 15, 24)connecting the terminal base pairs of the operators (Fig. 1c). Theequilibrium structure of the ribbon was obtained by solving thesystem of Kirchhoff equations of elasticity, which assume balance
of the elastic stress at every cross-section along the loop, therebyminimizing the energy functional (10, 15, 24),
U �12 �
0
L
��1sK12s � �2sK2
2s � �s�s � �os2�ds.
[1]
Here, s is the arclength that parameterizes the elastic loop, L �258.4 Å is the length of the loop, �1 � 0.8 � 10�19 erg�cm (1 erg �0.1 �J), �2 � 3.2 � 10�19 erg�cm, and � � 3 � 10�19 erg�cm are theelastic moduli of DNA bending and twisting (15, 25, 26), K1, K2, and� are the local curvatures and twist, respectively, and �o � 34.6° perbp is the intrinsic twist of DNA (10, 15, 24). Electrostatic interactionterms, negligible for this loop at the chosen ionic strength of 100mM, were excluded from the computations (10). The boundaryconditions for the Kirchhoff equations were obtained from thecoordinates of the terminal base pairs of each operator in theall-atom model (10, 15).
Multiscale Simulation. In our multiscale approach, the MD sim-ulations included the forces that account for the elastic stress andtorque due to the looping of the DNA between the operators.The forces were computed by using Kirchhoff equations andapplied to the LacI-bound DNA segments during the simulationas described in ref. 10. The equilibrium structure of the loop andthe resulting forces were recomputed every 10 ps of MD with theboundary conditions derived from the last MD snapshot of theprotein–DNA structure. The forces had a typical value of severalpiconewtons (pN).
The multiscale simulations also were performed with additionalforce terms. These forces were orders of magnitude larger thaneither the computed elastic forces, the forces that occur in vivo, orthose used in single molecule experiments. The purpose of usingmuch larger forces was to bring the dynamics of the LacI–DNAcomplex within the time scale available to MD simulations (27).One simulation included forces obtained as a continuous time series
Fig. 1. The structure of the LacI–DNA complex in the multiscale simulation. (a) Overall setup of the simulation. The all-atom structure of the complex betweenLacI (blue and green protein cartoon) and operator DNA segments (bonds and ribbons) is solvated in a bath of water (blue box) and ions (Na�, yellow spheres;Cl�, pink spheres). The 75-bp-long DNA loop connecting the operators is modeled as an elastic ribbon (gray). The forces of interaction between the loop and theoperators (red arrows) are included in the MD simulation. (b) The centerline of the elastic ribbon approximating the DNA loop and the main variables of thecontinuum model. (c) The all-atom structure of the LacI–DNA complex, built by using available x-ray structures (4, 7, 17). The two symmetrical dimers of whichthe LacI tetramer is composed are colored green and blue; the monomers in each dimer (1A and 1B, 2A and 2B) are shown with a different degree of opacity.The different domains of the dimers are indicated.
6784 � www.pnas.org�cgi�doi�10.1073�pnas.0409387102 Villa et al.

that obeyed a Gaussian distribution around an average magnitudeof 80 pN, which is roughly 10 times the magnitude of the elasticforces in the initial conformation (see Fig. 6, which is published assupporting information on the PNAS web site). The goal was toobserve large-scale motions in the LacI–DNA complex and tomimic the thermal fluctuations of the DNA loop. Moreover, thesimulation with fluctuating forces also may mimic the in vivointeractions of LacI–DNA complex with its surroundings, suggest-
ing a routine usage of the fluctuating forces in future multiscalesimulations. Another simulation applied constant forces of 500 pNto the external base pairs of the operators as shown in Fig. 4a. Thegoal was to mimic the opening of the LacI cleft as it presumablyoccurs in vivo or is enforced in single-molecule experiments.
Observable Monitored. The conformational changes of LacI duringthe simulation were monitored through a few geometric properties.
Fig. 2. Dynamics of the LacI–DNA complex in the multiscale simulation with fluctuating forces. (a) The principal degrees of freedom of the protein involve thecleft angle � between the two halves of the tetramer and the spherical angles � and that determine the orientation of each head group domain, as definedin Methods. The head groups are shown in green; the DNA operators are omitted for clarity. (b) Time dependence of the RMSD of various domains of the LacI–DNAcomplex. (Top) RMSD of each core domain (green and dark green), the two core domains together (blue), and the four-helix bundle (magenta). (Middle) RMSDof a head group (black), the operator bound to that head group (orange), and the same operator if computed after the best-fit alignment of the head group(violet). (Bottom) RMSD of the two core domains (blue) and the two head groups (red, turquoise) computed after the alignment of the core domains. (c) Thedynamics of the principal angles � (violet), 1 (blue), 1 (green), 2 (red), and 2 (orange).
Fig. 3. Head group and DNA loop motion during the multiscale simulation with fluctuating forces. (a) The protein structure before (red) and after (blue) thesimulation. The colored lines represent the long principal axis of each head group after every 200 ps of the simulation (see the color scheme at the bottom). (b)The structure of the DNA loop drawn after every 200 ps of the simulation and colored by the same scheme as in a. The initial structure of the whole complex(red) and the final structure of the head groups and the operators (blue) also are shown. (c) The distance d between two fluorophores attached to the DNA loopin ref. 8. The red line in the plot shows the change in d during the simulation; the green line shows how d would change if the head groups were immobile withrespect to the core domains. The purple band with the dotted line shows the experimental range and the average estimate for d (8).
Villa et al. PNAS � May 10, 2005 � vol. 102 � no. 19 � 6785
BIO
PHYS
ICS
CHEM
ISTR
YSP
ECIA
LFE
ATU
RE

The rms deviation (RMSD) of atomic coordinates from their initialvalues was computed for the protein and DNA backbone of eachdomain of the LacI–DNA complex. The RMSD value computedfor a certain domain after the best-fit alignment with its initialstructure allows one to assess how well that structure was conservedduring the simulation. Typically, MD studies show that structurallystable protein domains fluctuate with an average RMSD of 0.5–3.0Å from their average or experimental structure (see, e.g., refs.28–30). Alternatively, the RMSD value computed for a proteindomain after the best-fit alignment of a different domain allows oneto assess the mobility of those domains with respect to each other.A substantial (�1 Å) difference between the thus-computedRMSD and the individual RMSD of both domains signifies amotion of the domains.
We denote by avRMSD the RMSD value averaged over theentire simulation, implying that the RMSD was observed to stabi-lize at this average with a standard deviation of 0.5 Å, unlessotherwise stated. For the duplicate domains of the same kind (headgroups, dimer cores, DNA operators, etc.), the avRMSD value isthe average of the two avRMSDs computed for each individualdomain.
Three angle parameters are introduced to describe the move-ments of the LacI domains during the simulation (Fig. 2a). The cleftangle � is defined as the angle between the lines connecting thecenter of mass of each dimer arm of LacI with the center of massof the four-helix bundle. Altitudinal and azimuthal angles �1,2 and1,2 describe the orientation of the longest principal axis of inertiaof each of the two head groups in the lab coordinate system. � is
the angle between the principal axis and the lab coordinate systemvector z�, and is the angle between the lab coordinate system vectorx� and the projection of the principal axis on the x–y plane of the labcoordinate system (Fig. 2a). The changes in the three angles �� �� � �0, �� � � � �0, and � � � 0 with respect to their valuesat the end of the equilibration stage are reported below.
ResultsThe work presented here comprises one of the largest protein–DNA simulations to date. In this section, we first describe theequilibration of the constructed model of the LacI–DNA complex,then present the results of the multiscale simulation of that system,and, finally, discuss the forced opening simulation of the LacI–DNAcomplex.
Equilibration. During the equilibration, the LacI structure wasstable; protein domains conserved their secondary and tertiarystructure. The structure of the protein core had an avRMSD of1.27 Å; i.e., the ‘‘V’’ configuration remained mainly undisturbed(���� � 0.05°). The upper core domain of the dimers did notsignificantly move with respect to the lower core (avRMSD 1.48 Å).The interdomain interactions and the structure of the lactose-binding pockets also remained unchanged. The pockets were filledwith, on average, 15 water molecules freely exchanging with thebulk solvent.
The head group structures showed similar stability (avRMSD1.43 Å). However, the head groups moved with respect to the coreof the protein (avRMSD 2.59 Å), with no clear tendency to the
Fig. 4. Opening of the LacI–DNA complex by an applied external force. (a) Snapshots of the LacI–DNA complex at the following different stages of thesimulation: I, 0 ns; II, 1.65 ns; III, 3.4 ns; IV, 6.4 ns; and IV�, 16 ns. The DNA loop is colored according to the local density of the elastic energy (scale is shown inthe lower left of the figure). (b) Density plot of the elastic energy along the DNA loop over the course of the simulation. The value of the energy is color-codedaccording to the same scale as in a. The length is measured in DNA helical steps: h � 3.4 Å. (c) The cleft angle � (violet) and the angle of rotation � of a headgroup (green), as defined in Fig. 2b, over the course of the simulation. The different stages of the opening, indicated on the plot, are characterized by thedifference in the slope � (red lines) as follows: stage I, 2.4° per ns; II, 0.15° per ns; III, 2.7° per ns; and IV to IV�, 4.5° per ns. Each of the snapshots in a shows acharacteristic structure from each stage.
6786 � www.pnas.org�cgi�doi�10.1073�pnas.0409387102 Villa et al.

direction of that movement. The maximum angles of rotation of thehead groups were ��1 � 2.6°, �1 � 2.0°, ��2 � 3.0°, and �2 �2.9° (see Fig. 7, which is published as supporting information on thePNAS web site). The DNA segments preserved their B-DNAstructure with a protein-induced kink in the middle (17) (avRMSD1.75 Å).
Overall, the model complex proved remarkably stable for ahybrid, newly constructed from several Protein Data Bank struc-tures, and allowed further simulation studies.
Multiscale Simulation. Our 7.4-ns multiscale simulation of the equil-ibrated system included the forces from the elastic model of theDNA loop, as described in Methods. Throughout the simulation,these forces remained in the range of 1–10 pN, which is comparablewith observed values of other biomolecular forces, e.g., thosegenerated by protein motors (31). The forces did not change thestructure of the protein core, which remained stable throughoutthe simulation (avRMSD 2.23 Å, ��max � 1°; see Fig. 2), but causedthe protein head groups to rotate. The rotation followed thedirection of the force, with ��max � 10°. One can conclude that theflexible head groups can readily absorb the strain from the DNAloop. However, the configurational changes in the LacI–DNAcomplex under forces of this scale are slow compared with the timescale of the simulation, and it is impossible to foresee the largestextent of the head group rotation or what other changes may occurin the LacI structure.
A second simulation was performed for 12.8 ns in whichfluctuating forces with an average magnitude of 80 pN acted onthe operators (see Methods). Similar forces have been shown tobe sufficient to disrupt protein structure in vivo and in silico (9,32). The results of the simulation are presented in Figs. 2 and 3(see also Movies 1 and 2, which are published as supporting
information on the PNAS web site). Despite the strong forces,the domains of LacI mainly conserved their overall structure(avRMSD of only 1.2 Å for individual core domains and 2.2 Åfor the whole protein core, 2.5 Å for the head groups, and 2.6 Åfor the operators). The core domains did not move significantlywith respect to each other; the maximum opening of the cleft was��max � 4°. The whole effect of the applied forces was todrastically increase the motion of the head groups with respectto their dimer cores (avRMSD � 15.1 � 1.5 Å; ��1,max � 51.4°and �2,max � 40.7°; see Fig. 2 b and c). It is notable that differentspherical angles (��1,max vs. �2,max) showed the dominantchange for the two head groups, meaning that the head groupsrotated in different planes (Figs. 2c and 3a). This result suggeststhat the head group rotations can occur in a variety of directions,implying even greater conformational f lexibility than initiallyappreciated. The flexibility allows the head groups to absorb thestrain of the DNA loop without LacI losing its grip on it.
The change in the structure of the DNA loop during thesimulation is shown in Fig. 3b. The loop steadily moved towardlower-energy conformations, its energy (Eq. 1) diminished from 20kBT to 12 kBT during the simulation. The force of the protein–DNAinteraction dropped from 7.2 to 2.0 pN. Thus, a significant relax-ation of the loop can be possible solely due to the mobility of theLacI head groups. Interestingly, this finding dissents from theprevailing view that the opening of the LacI cleft is the principaldegree of freedom of the protein (ref. 8 and D. Swigon, B. D.Coleman, and W. K. Olson, unpublished data). Edelman et al. (8)measured the distance between fluorophores attached to the DNAloop near the LacI head groups to be �50 Å larger than the samedistance in the crystal structure (4); this increase in distance wasascribed to the opening of the LacI cleft. However, the correspond-ing increase in distance measured in our simulation is 52 Å (Fig. 3c),
Fig. 5. Dissociation of the interdimer lock during the LacI cleft opening by a constant force. (a) The lock is located on the outlined interface between the dimercores and the four-helix bundle; the key elements of the lock are highlighted as described below. (b) Interactions in the lock. (Top) Van der Waals (orange) andelectrostatic (lime) energy of interaction between the �-helices 2221B–2361B and 2222B–2362B, connecting the two dimers. (Middle) Electrostatic energy of thesalt bridges R3262A–E2591B (blue) and R3261A–E2592B (magenta). (Bottom) Interaction energy between R3511A and the backbone oxygens of either its own dimer(purple) or the other dimer (green). (c) Snapshots of the interface between the dimers at the different stages of the cleft opening, defined in Fig. 4. The interactinghelices (see b Top) are highlighted in orange with the tone corresponding to the strength of the interaction. The key salt bridges (b Middle) are shown by dottedlines that are thick for fully formed bridges and thin for broken bridges. R3511A is highlighted in turquoise, and the backbone sections of either dimer, most closelyinteracting with R3511A in each snapshot, are highlighted with the same colors as the corresponding plots in b Bottom.
Villa et al. PNAS � May 10, 2005 � vol. 102 � no. 19 � 6787
BIO
PHYS
ICS
CHEM
ISTR
YSP
ECIA
LFE
ATU
RE

which explains the experimental observation without invoking asignificant opening of the cleft.
Opening LacI. To study the opening of the cleft, a third simulationwas performed for 16 ns, in which external forces of 500 pN wereapplied to the outer DNA ends (Fig. 4a). Even under theseexceedingly large forces, the structure of all domains of LacI onceagain remained unchanged (avRMSD of 1.51 Å for the headgroups, 1.32 Å for the dimer cores, and 2.17 Å for the operators).Nevertheless, the simulation succeeded in opening the cleft by�� � 53° (Fig. 4 a and c; see also Fig. 8 and Movie 3, which arepublished as supporting information on the PNAS web site). Theopening was accompanied by an appreciable change in the struc-ture of the four-helix bundle (avRMSD � 3.28 � 0.54 Å). The headgroups yet again rotated (���� � 48°), absorbing a significant partof the applied force. The DNA loop adapted a more open config-uration (Fig. 4a); the overall twist of the loop changed both its valueand its sign because of the rotation of the head groups, from �� ��1.24° per bp to �� � 0.75° per bp. The elastic energy (Eq. 1) ofthe loop decreased from 20 kBT to 10 kBT and became more evenlydistributed along the loop (Fig. 4b). It is notable that the finalenergy is only slightly less than that recorded in the previoussimulation, indicating that a significant degree of the loop relax-ation can be achieved solely by rotation of the head groups.
The simulation revealed four distinct stages of LacI opening,characterized by different rates of change in � (Fig. 4c). Duringstage I, some initial opening of the cleft took place as � grew steadilyat an average rate � � 2.4° per ns. During stage II, the increase in� slowed down to � � 0.15° per ns, indicating that certaininteractions in the protein resisted further cleft opening. At thesame time, stage II is characterized by a jump in the � angles (Fig.4c), indicating that the head groups of the LacI rotated, absorbingthe pulling force. During stage III, the protein resumed its openingmotion at the earlier rate (� � 2.7° per ns), and during stage IV,it continued the opening at an even faster pace, � � 4.5° per ns.
We identified several interactions responsible for locking LacI inthe V configuration when the protein is subject to strain (Fig. 5; seealso Movie 4, which is published as supporting information on thePNAS web site). These interactions accounted for 80% of theinteraction energy between the dimers, excluding the self-interaction of the four-helix bundle (see Fig. 9, which is publishedas supporting information on the PNAS web site). The interactionsincluded two salt bridges (E2351B–R3262A and E2352B–R3261A), acharge–dipole interaction between R3511A and the C terminus ofan �-helix 2472B–2602B, and the hydrophobic interaction betweentwo �-helices, 2221B–2361B and 2222B–2362B, protruding from eachdimer into the cleft. The latter hydrophobic interaction had beensuggested to be the most important bond between the cores of the
dimers (ref. 4 and D. Swigon, B. D. Coleman, and W. K. Olson,unpublished data). Fig. 5 shows the evolution of these interactionsduring stages I–IV. During stage I, the attraction on the hydro-phobic interface became stronger. At the beginning of stage II, saltbridges E2351B–R3262A and E2352B–R3261A, nonexistent in theinitial structure, were formed (Fig. 5c, I and II). During stage III,the electrostatic bonds were ruptured, R3511A switched to bind tothe C terminus of an �-helix in its own dimer (Fig. 5c, III and IV),and the �-helices that formed the hydrophobic interface movedapart. By stage IV, all the interactions discussed were lost.
These observations suggest the following mechanism of LacIopening. During stage I, some initial opening of the cleft is allowedby the protein structure but results in straining the interdimericinterface and forming the lock that keeps LacI in the V configu-ration. During stage II, the pulling force is absorbed for a while bythe rotating head groups. During stage III, the cost of head grouprotation becomes comparable with the energy of the interdimericinteractions, the bonds in the lock rupture, and LacI opens its cleft.During stage IV, the interaction between the dimers is lost, andLacI dimers move independently (Fig. 4c, IV�), held together onlyby the four-helix bundle acting as a hinge.
ConclusionIn this work, we combined MD simulations with a previouslydescribed multiscale approach (10) to study the structural dynamicsand large-scale motions of the LacI–DNA complex, a paradigmsystem of gene regulation. The protein domains in the constructedstructure of the complex showed remarkable stability: Throughoutthe simulations, they conserved their structure and moved withrespect to each other like rigid bodies. The protein head groupdomains showed significant mobility with respect to the proteincore and proved to be able to absorb significant strain from thebound DNA loop. We therefore conclude that head group rotationis an important degree of freedom, essential for LacI function. Oursimulations of LacI cleft opening identified the key residues thatlock the LacI tetramer in the V configuration during repression ofthe lac operon genes.
The multiscale method applied here furnished much-neededinsight into the large-scale structural dynamics of a complex be-tween a multidomain protein and a DNA loop. Because similarcomplexes form in the genomes of many living organisms (2, 3), ourmodeling method shows much promise for future applications.
We thank L. Mahadevan for earlier collaboration on the elastic rodmodel of DNA and Mu Gao for stimulating discussions. This work wassupported by National Institutes of Health Grant PHS5 P41RR05969-04and National Science Foundation Grant MCB-9982629; computer timewas provided by National Resource Allocations Committee GrantMCA93S028.
1. Berg, J. M., Tymoczko, J. L. & Stryer, L. (2002) Biochemistry (Freeman, New York),5th Ed.
2. Matthews, K. S. (1992) Microbiol. Rev. 56, 123–136.3. Schleif, R. (1992) Annu. Rev. Biochem. 61, 199–223.4. Lewis, M., Chang, G., Horton, N. C., Kercher, M. A., Pace, H. C., Schumacher, M. A.,
Brennan, R. G. & Lu, P. (1996) Science 271, 1247–1254.5. Oehler, S., Eismann, E. R., Kramer, H. & Muller-Hill, B. (1990) EMBO J. 9, 973–979.6. Friedman, A. M., Fischmann, T. O. & Steitz, T. A. (1995) Science 268, 1721–1727.7. Bell, C. E. & Lewis, M. (2000) Nat. Struct. Biol. 7, 209–214.8. Edelman, L. M., Cheong, R. & Kahn, J. D. (2003) Biophys. J. 84, 1131–1145.9. Rief, M., Gautel, M., Oesterhelt, F., Fernandez, J. M. & Gaub, H. E. (1997) Science
276, 1109–1112.10. Villa, E., Balaeff, A., Mahadevan, L. & Schulten, K. (2004) Multiscale Model Simul.
2, 527–553.11. Phillips, R., Dittrich, M. & Schulten, K. (2002) Annu. Rev. Mater. Res. 32, 219–233.12. Ayton, G., Bardenhagen, S., McMurtry, P., Sulsky, D. & Voth, G. (2001) J. Chem.
Phys. 114, 6913–6924.13. Schlick, T. (1995) Curr. Opin. Struct. Biol. 5, 245–262.14. Olson, W. K. (1996) Curr. Opin. Struct. Biol. 6, 242–256.15. Balaeff, A., Mahadevan, L. & Schulten, K. (1999) Phys. Rev. Lett. 83, 4900–4903.16. Balaeff, A., Mahadevan, L. & Schulten, K. (2004) Structure (London) 12, 123–132.17. Spronk, C. A. E. M., Bovin, A. M. J. J., Radha, P. K., Melacini, G., Boelens, R. &
Kaptein, R. (1999) Struct. Folding Des. 7, 1483–1492.
18. Humphrey, W., Dalke, A. & Schulten, K. (1996) J. Mol. Graphics 14, 33–38.19. Honig, B. & Nicholls, A. (1995) Science 268, 1144–1149.20. Kale, L., Skeel, R., Bhandarkar, M., Brunner, R., Gursoy, A., Krawetz, N., Phillips,
J., Shinozaki, A., Varadarajan, K. & Schulten, K. (1999) J. Comp. Phys. 151,283–312.
21. MacKerell, A. D., Jr., Bashford, D., Bellott, M., Dunbrack, R. L., Jr., Evanseck, J.,Field, M. J., Fischer, S., Gao, J., Guo, H., Ha, D., et al. (1998) J. Phys. Chem. B 102,3586–3616.
22. Martyna, G., Tobias, D. J. & Klein, M. L. (1994) J. Chem. Phys. 101, 4177–4189.23. Deserno, M. & Holm, C. (1998) J. Chem. Phys. 109, 7678–7693.24. Balaeff, A., Koudella, C. R., Mahadevan, L. & Schulten, K. (2004) Philos. Trans. R.
Soc. London A 362, 1355–1371.25. Hagerman, P. J. (1988) Annu. Rev. Biophys. Biophys. Chem. 17, 265–286.26. Strick, T. R., Allemand, J.-F., Bensimon, D., Bensimon, A. & Croquette, V. (1996)
Science 271, 1835–1837.27. Isralewitz, B., Gao, M. & Schulten, K. (2001) Curr. Opin. Struct. Biol. 11, 224–230.28. Karplus, M. & Petsko, G. A. (1990) Nature 347, 631–639.29. Snow, C. D., Nguyen, H., Pande, V. S. & Gruebele, M. (2002) Nature 420, 102–106.30. Dominy, B. N. & Brooks, C. L., III (2001) J. Comp. Chem. 23, 147–160.31. Howard, J. (2001) Mechanics of Motor Proteins and the Cytoskeleton (Sinauer,
Sunderland, MA).32. Gao, M., Craig, D., Vogel, V. & Schulten, K. (2002) J. Mol. Biol. 323, 939–950.
6788 � www.pnas.org�cgi�doi�10.1073�pnas.0409387102 Villa et al.