Calculating Cross Slot Flux Losses in High Voltage Stator ... - ucf stars
80
University of Central Florida University of Central Florida STARS STARS Retrospective Theses and Dissertations 1995 Calculating Cross Slot Flux Losses in High Voltage Stator Coils Calculating Cross Slot Flux Losses in High Voltage Stator Coils John D. Amos University of Central Florida, [email protected] Part of the Electrical and Computer Engineering Commons Find similar works at: https://stars.library.ucf.edu/rtd University of Central Florida Libraries http://library.ucf.edu This Masters Thesis (Open Access) is brought to you for free and open access by STARS. It has been accepted for inclusion in Retrospective Theses and Dissertations by an authorized administrator of STARS. For more information, please contact [email protected]. STARS Citation STARS Citation Amos, John D., "Calculating Cross Slot Flux Losses in High Voltage Stator Coils" (1995). Retrospective Theses and Dissertations. 3138. https://stars.library.ucf.edu/rtd/3138
-
Upload
khangminh22 -
Category
Documents
-
view
1 -
download
0
Transcript of Calculating Cross Slot Flux Losses in High Voltage Stator ... - ucf stars

University of Central Florida University of Central Florida
STARS STARS
Retrospective Theses and Dissertations
1995
Calculating Cross Slot Flux Losses in High Voltage Stator Coils Calculating Cross Slot Flux Losses in High Voltage Stator Coils
John D. Amos University of Central Florida, [email protected]
Part of the Electrical and Computer Engineering Commons
Find similar works at: https://stars.library.ucf.edu/rtd
University of Central Florida Libraries http://library.ucf.edu
This Masters Thesis (Open Access) is brought to you for free and open access by STARS. It has been accepted for
inclusion in Retrospective Theses and Dissertations by an authorized administrator of STARS. For more information,
please contact [email protected].
STARS Citation STARS Citation Amos, John D., "Calculating Cross Slot Flux Losses in High Voltage Stator Coils" (1995). Retrospective Theses and Dissertations. 3138. https://stars.library.ucf.edu/rtd/3138
CALCULATING CROSS SLOT FLUX LOSSES I HIGH VOLTAGE
STATOR COILS
by
JOHND. AMOS BSEE Southern University, 1989
THESIS
Submitted in partial fulfillment of the requirements for the degree of
Master of Science in Electrical Engineering College of Engineering
University of Central Florida Orlando Florida
Summer Term 1995
Thi thesis is dedicated to my father, John Noles Amos, Sr. in memory of the wise
coun el and examples he gave that encouraged me to pursue a career in Electrical
Engine ring ..
111

ACKNOWLEDGMENTS
Foremost, I would like to express my sincere appreciation to my advisor, Dr.
Michael Haralambous, whose guidance and direction made this project a success. I
ould also like to thank Dr. Roger Johnson and Dr. Issa Batarseh for serving on my
c mmittee.
I am e pecially grateful to my wife Michelle E. Amos for the constant support and
enc urag m nt he ha given me throughout my educational and professional career.
Finally I ould like to thank Mr. Calvin Paris of Westinghouse Electric for his
upp rt and ad i eon thi project. If it were not for him this project would not have
b n po ibl .
lV
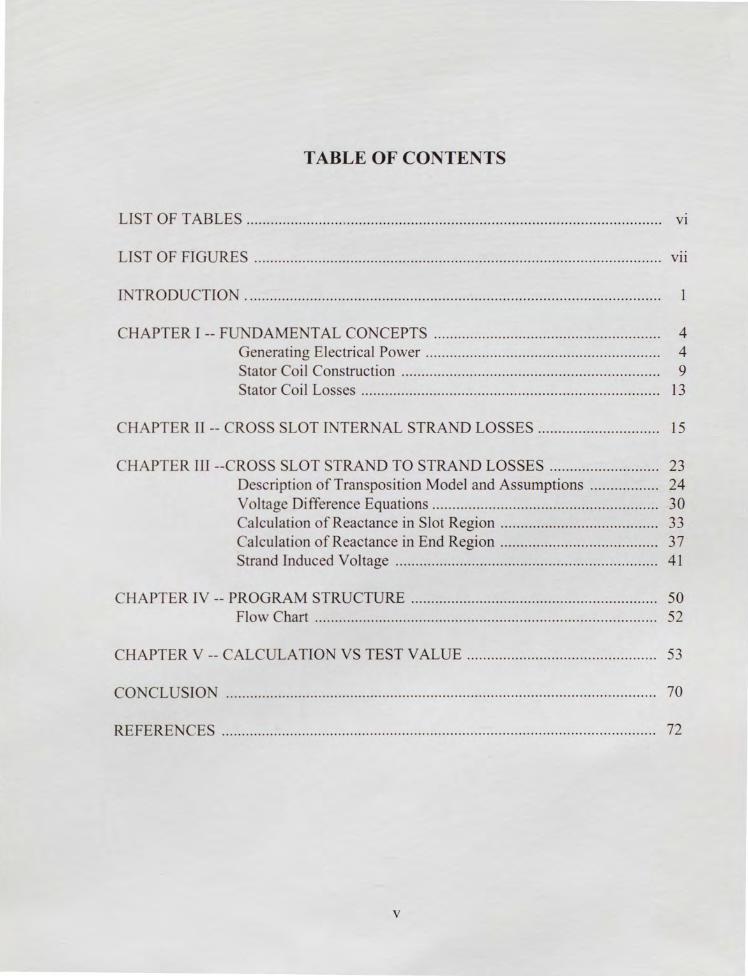
TABLE OF CONTENTS
LIST OF TABLES . . . . . . . . . . . . . . . . . . . . . .. . . . . . . . . . . . .. . . . . . . .. . . . . . . . . .. . . . . . . . . . . . . . . . . . .. . . . . . . . . . . . . . . . . . . . . . .. . . . . . . . Vl
L[ST OF FIGURES ·························································································· ··········· Vll
TRODUCTIO . ...................................................................................................... 1
CHAPTER I -- FUND AME T AL CO CEPTS . . . . . .. . . . . . . . . . . .. . . . . . . . . . . .. . . . . . . . . . . . .. . . . . . . . . . . .. 4 Generating Electrical Power . . . . . . . . . . . . . . . . . . . . . . . . . . . . . . . . . . . . . . . . . . . . . . . . . . . . . . . . . . 4 Stator Coil Construction ................................................................ 9 Stator Coil Losses . . . . . . . . . . . . . . . . . . . . . . . . . . . . . . . . . .. . . . . . . . . . . .. . . . . . . . . . . . . . . . . . . . . . . . . . .. 13
H PTER II -- CROSS SLOT I TER AL STRA D LOSSES .............................. 15
H PTER III -- ROSS SLOT STRA D TO STRA D LOSSES ........................... 23 De cription of Transposition Model and Assumptions ............... .. 24 Voltage Difference Equations . .... ....... ...... ........ .............................. 30
alculation of Reactance in Slot Region ....................................... 33 Calculation of Reactance in End Region ...................... ......... ........ 3 7 Strand Induced Voltage ................................................................. 41
H PTER IV -- PROGRAM STRUCTURE ............................................................. 50 Flow Chart ..................................................................................... 52
CHAPTER V -- CALCULA TIO VS TEST VALUE ............................................... 53
CO CLUSIO .................. ... .......... ................. ........................................................... 70
REFERE CES . . . . . . . .. . . . . . . . .. . . . . . . . . . . . . . . . . . . .. . . . . . .. . . .. . . . . . . . . . . . . .. . . . . . . . . . .. . . ... .. . . . ... . . . ... . . . . . . . . . . . . . . . 72
V
LIST OF TABLES
1. Top Coil Test Values (Slot 16) ............................................................................... 63
2. Bottom Coil Test Values (Slot 16) ......................................................................... 64
3. Test Data compared to Calculated Data ................................................................. 65
4. Test Data compared to Calculation Data ................................................................ 66
5. Te t Data compared to Calculation Data ................................................................ 67
6. T t Data compared to Calculation Data ................................................................ 68
7. Te t Data compared to Calculation Data ................................................................ 69
,.
Vl
LIST OF FIGURES
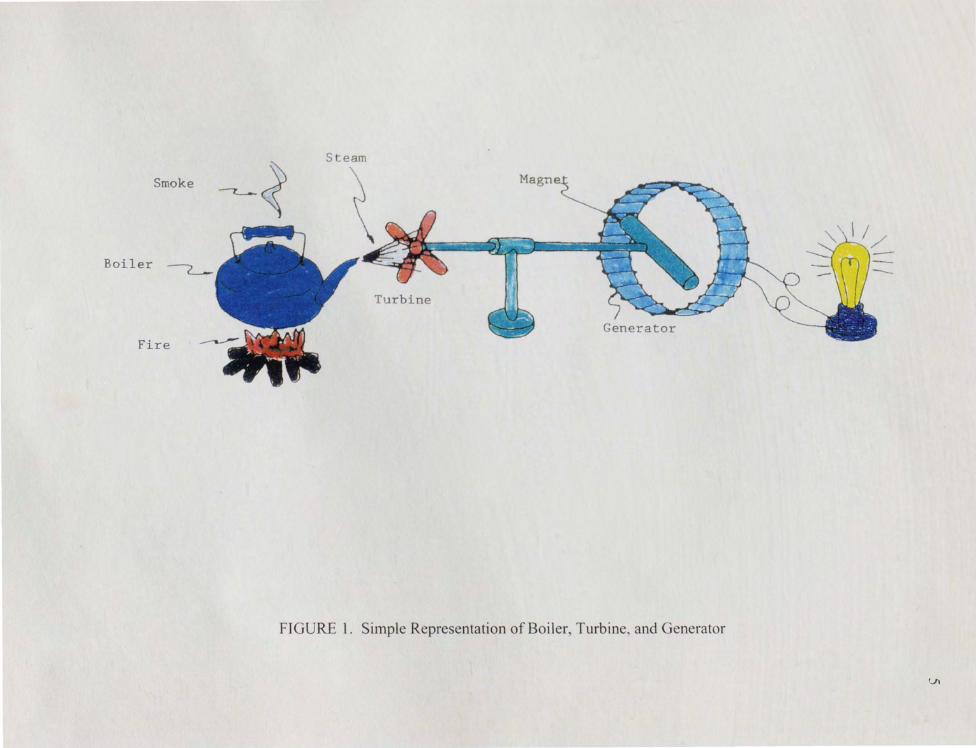
1. Simple Representation of Boiler, Turbine, and Generator..................................... 5
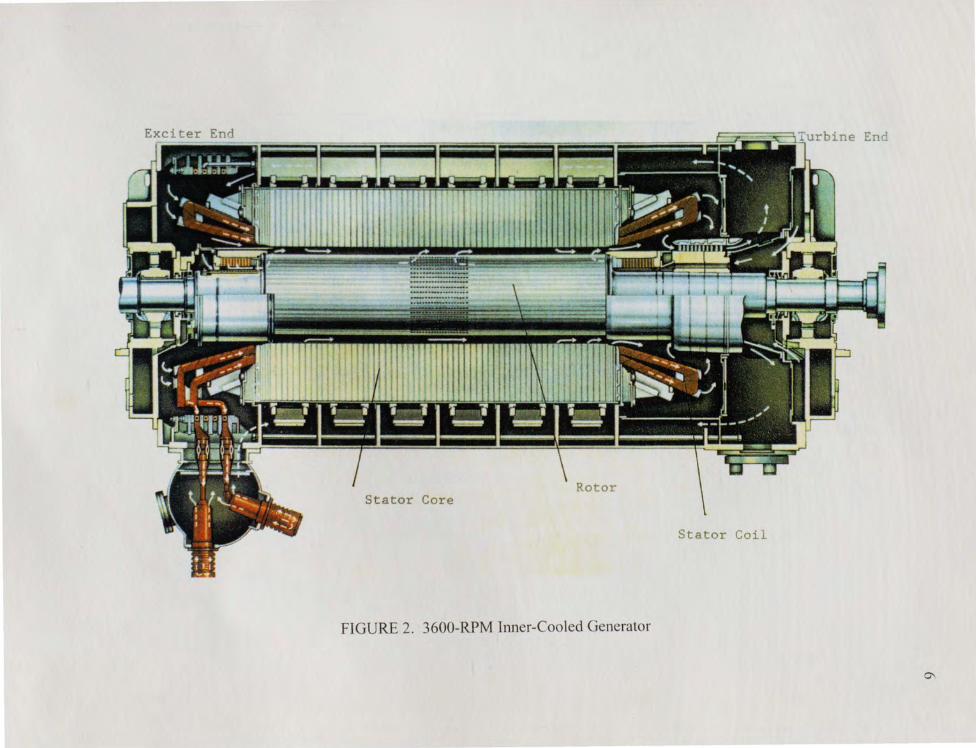
2. 3600-RPM Inner-Cooled Generator....................................................................... 6
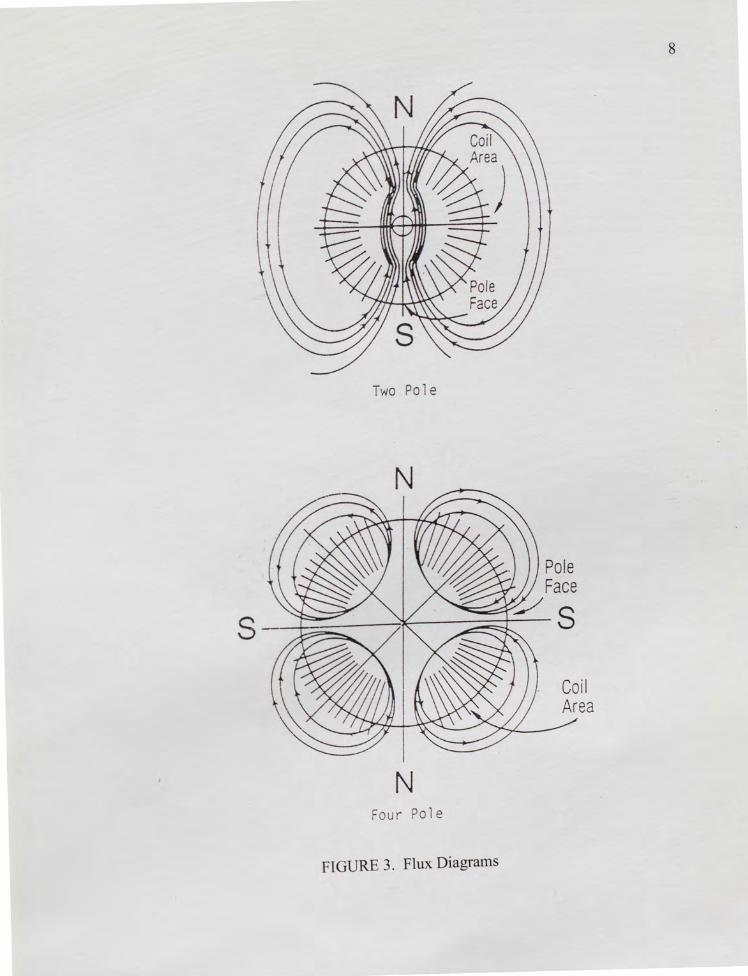
3. Flux Diagrams........................................................................................................ 8
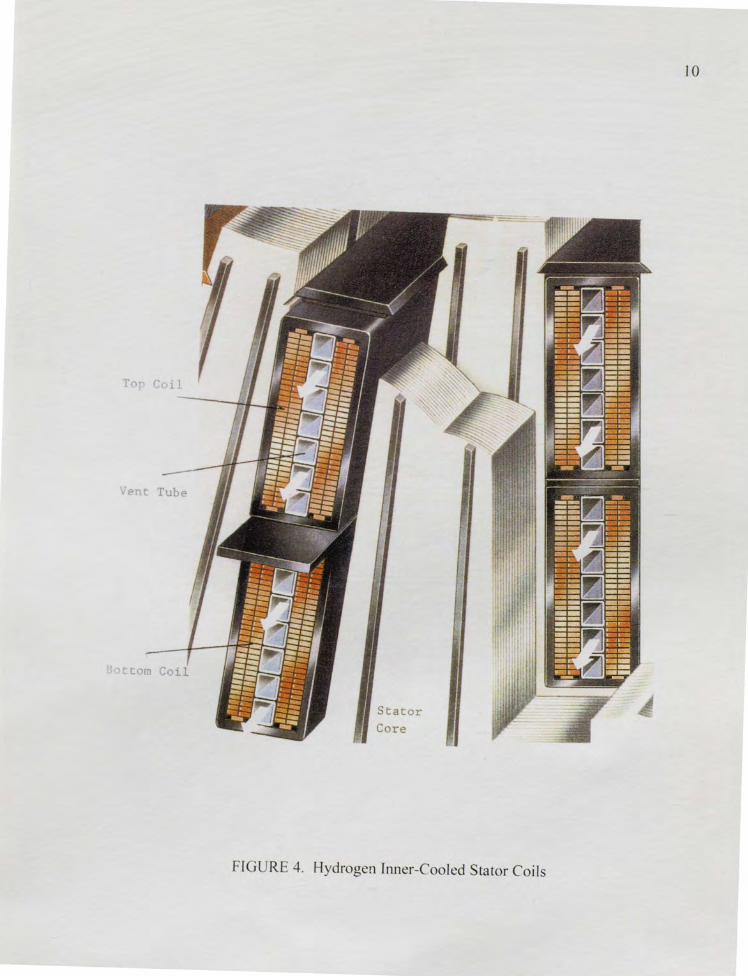
4. Hydrogen Inner-Cooled Stator Coil........................................................................ 10
R b I Tran positions............................................................................................ 12
P ak Fun dam ntal Amp-Tum/Pole............................... ............... .......................... 17
7. P ak Fundam ntal Armatur Leakage Flux Density .............................................. 18
Flux Field Cau ing Cro s Slot Flux........................................................................ 20
9. E ample of Coil Structures and Transpositions.................................................... 25
I 0. Mo ment of the Strands with the Advancement along the Coil.. ......................... 27
I 1. Strand umber at Exciter End................................................................................ 28
12. Calculation Mod 1 of Strand Path .................. ........................................................ 29
13. Electrical Circuit in a Coil Side.............................................................................. 31
14. Impedanc Matri ... . ... ... ...... . ... .... ...... .... ............... ......................... ..... .. ..... ............. 34
l 5. Area to D te1mine X; and Xu . . . . . . . . . . . . . . . . . . . . . . . . . . . . . . . . . . . . . . . . . . . . . . . . . . . . . . . . . . . . . . . . . . . . . . . . . . . . . . . . . . 3 6
16. Flux Pattern in End Regions Along Coil Height..,. ................................................ 38
Vll
17. Simple Example of Flux Density in End Region.............................. ................... 40
18. Complete Impedance Matrix.............................................. .................................. 42
19. Faraday's Law....................................................................................................... 43
20. Simplified Model for Voltage Difference Equations............................................ 45
2 1. Fluxes in End Regions and in Slot Region........................... ................................ 48
22 . Pha or Diagram of Electromotive Force................................................ .............. 49
2 . Flowchart................. ............................................................................................. 52
24. Th nnocouple Locations.................................................... .................................. 56
2 . T p Coil L ft Strand T mperatme Profile............................................................ 57
26. T p oil V nt Tub T mperature Profile....... ..... ..... .............. .............................. 58
2 7. T oil Right trand T mperature Profile........................................................... 59
2 . Bott m oil Right Strand Temperature Profile.................................................... 60
... 9. Bottom C ii Vent Tube Temperature Profile....................................................... 61
0. Bottom Coil L ft Strand Temperature Profile...................................................... 62
Vlll

INTRODUCTION
The maximum capability of an electric generator is limited primarily by the heating
of it components. Temperatures developed in various parts of the generator must be
ithin limit that will provide safe and reliable operation during its design life. In most
g n rator components it is the highest, rather than the average temperature, that must
m t th required limits.
In th nit d State , generators are designed based on meeting requirements or
limit tat d in th merican ational Standards Institute (A SI). In reference to stator
il fi r larg yn hronou generators A SI C50. l 3 states that the hottest-spot
mp ratur hall not xceed 130° C for class B insulation systems. It also states that
th h tte t- pot t mperatures for a1mature windings shall be demonstrable by direct
m a ur m nt or recognized methods of calculation correlated to special factory tests on
a ba ically similar machin [l].
Thi means that either we have a proved method of calculating the hottest-spot
temperature that is verified with test data on a similar type machine or that we must test
ry machin built. Well a complete Engineering factory test on one single large
el ctric g nerator could cost in excess of one million dollars ( depending on customer
requests). Therefore it is very important that we continue to develop methods of

calculating losses and temperatures for all new designs which differ in design from
pr viou ly t sted machines.
As the cost to produce electric power increases throughout the world, the need for
more efficient machines become higher in demand by the power utilities. It is,
therefore important to have uniform temperature distribution for economical and
fficient utilization of all generator components, stator windings in particular.
Th variou types of eddy current losses taking place in the stator winding would
cau e non-uniform temperature distribution and utilization of the coil material, if
m a ur to r duce them were not taken. The eddy current losses in stator coils are
r du d by building th conductors of a large number of mutually insulated cooper
trand hi h ar hart circuited at least at the ends of the phase group. The currents
ir ulating b tw 11th e tra11ds are suppressed by transposing them in such ways that
all trand ha th same oltage induced in them. Building coils with ideal
tr 11 p ition patt m uch that voltage balance is achieved within each individual coil
id i the topic for much on-going research and development.
Becau of co t and efficiency it i necessary to analyze the possibilities of using
diffi r nt coil con tructions from those presently in use. This thesis will limit the scope
to hydrogen inner-cooled stator windings for large AC electric synchronous generators.
Pa t practic ha been to u e 360° roebel transpositions and therefore this is where the
emphasis of past eddy loss analysis was conducted [2].
Various roebel transpositions now being introduced into stator winding designs
bring new challenges to the eddy loss theory and calculation. Using past loss
2

3
calculation methods on these new coil designs tend to calculate temperatures with hot
pots 15 to 20% different than test data. This large error in calculation greatly reduces
the ability to achieve the full capability of new machines. Therefore, the primary
purpose of this thesis is to focus on the analysis and calculation of the cross-slot eddy
lo ses associated with these new multi-roebel transposition schemes to more accurately
calculate their associated hot spot temperatures.
The eddy lo e a calculated by this thesis together with the other standard stator
coi I lo (r2 R radial flux losses) are used to calculate stator coil hottest-spot
t mp ratur of the fir t recently built, generator using a 72ft roebel scheme with solid
nd connection . Th calculated temperatures are compared to factory test data of this
ma hin to alidat th eddy los calculation developed in this thesis.
hapt r 1 ill pro idea review of the fundamental concepts of generating electric
plain ba ic tator coil construction, and briefly describe the various types of
tat r coil lo e .
hapt r 2 ill de lop an improved method of calculating the cross slot flux in the
lot r gion and it as ociated internal strand losses.
Chapter 3 will develop a method of calculating the strand to strand currents
produced by the deep bar effect using the cross slot flux developed in chapter 2.
hapter 4 will briefly explain the main features of the computer programs used to
make th loss calculations developed in this thesis.
Chapter 5 will compare the calculated results using the above methods with test data
on a production machine with the same stator coil designs described in this thesis.
I. FUNDAMENTAL CONCEPTS
GENERATING ELECTRIC POWER
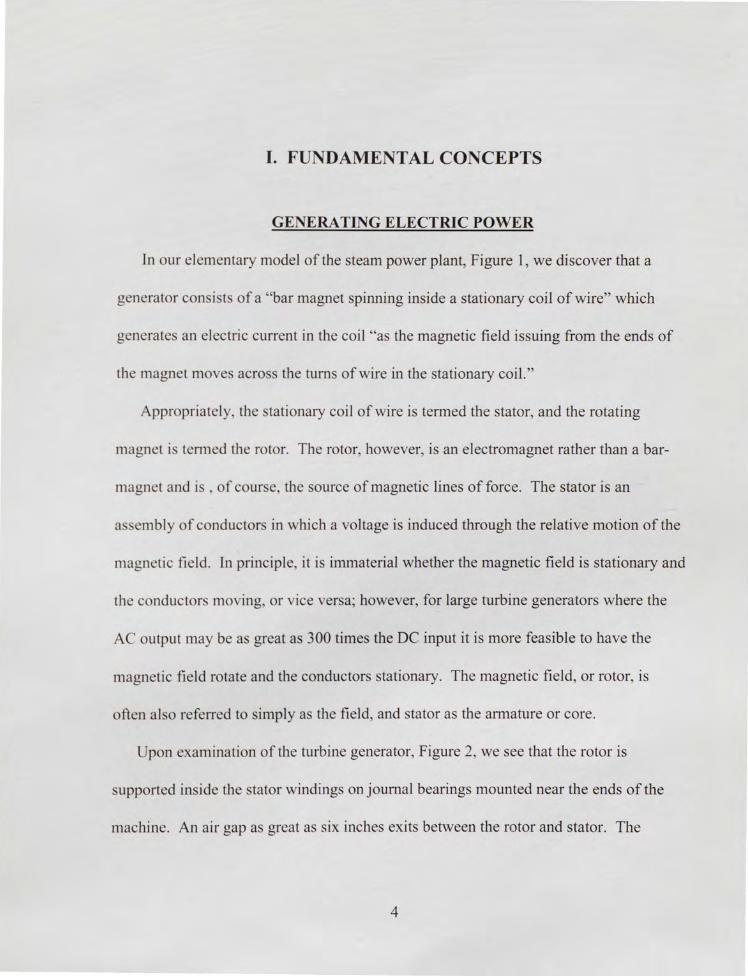
In our elementary model of the steam power plant, Figure 1, we discover that a
g n rator con i t of a 'bar magnet spinning inside a stationary coil of wire" which
g n rat an lectric current in the coil "as the magnetic field issuing from the ends of
th magn t mo e acros the turns of wire in the stationary coil."
ppr priately the tationary coil of wire is termed the stator, and the rotating
magn t i t rm d th rotor. The rotor however is an electromagnet rather than a bar
magn t and i , of cour the source of magnetic lines of force. The stator is an
a mbly of conductor in which a voltage is induced through the relative motion of the
magn tic field. In principle it is immaterial whether the magnetic field is stationary and
th conductor mo ing or ice versa· however for large turbine generators where the
output may b as great as 300 times the DC input it is more feasible to have the
magn tic field rotate and the conductors stationary. The magnetic field, or rotor, is
oft n also referred to simply as the field, and stator as the armature or core.
Upon xamination of the turbine generator, Figure 2, we see that the rotor is
upport d inside the tator windings on journal bearings mounted near the ends of the
machine. An air gap a great as six inches exits between the rotor and stator. The
4
Smoke ~~ Steam
\
\ Magn
Boiler ~
Turbine
Fire
FIGURE 1. Simple Representation of Boiler, Turbine, and Generator
U)
Rotor Stator Core
Stator Coil
FlGURE 2. 3600-RPM Inner-Cooled Generator
0\

7
m chanicaJ energy delivered by the turbine is transferred across this air gap and appears
a Jectrical power at the stator leads. To explain this phenomenon we observe that the
rotor consists of a large steel forging with machined longitudinal slots inset with
interconnected copper bars wound in such a way as to form what basically are oblong
' coil · oriented about the unslotted portion of the rotor. Direct current is supplied to the
coil thereby producing the magnetic field. This direct current is referred to as field
current or excitation and is produced by an exciter. The direct current flows through the
c pp r fi Id inding of the rotor forming an even number of powerful magnetic poles
in th un Iott d rotor portion (Figure 3). Domestically two different rotational speeds
( ith th appropriate number of poles) are dictated by the necessity to produce 60 hertz
( 0 RPM) for nit d State and 50 hertz (3000 RPM) for overseas. The magnetic
flu that m rg from the 'north pole of the rotor must return to the rotor through the
uth p ho e er thi flux acts similar to water or electric current in that it takes
th path flea t re i tance and may be guided and made to follow predetermined paths.
rt a high re i tance (reluctance) to this flow while iron or steel has much lower
. G n rator design is such that the flux leaves the north pole of the rotor,
th air gap into the stator, goes through the stator iron and back across the air
gap into the outh pole thereby completing the magnetic circuit (Figure 3). As the flux
w p aero the tator iron due to the rotor's movement voltage is induced in copper
coil mounted in th iron. This is the source of electrical power generated by the
g n rator.
Two Pol e
N
Pole Face
S---+----"11...-----l--- S
N Four Pol e
FIGURE 3. Flux Diagrams
Coil Area
8

The current that is produced is dependent on various parameters, including flux
d n ity, coil proportions and sweep velocity of the flux lines (E = Blv, a variation of
the Lorentz force equation, where E being voltage generated in a conductor length"/"
passing through a magnetic field of flux density B at a velocity v. The flux density,
9
oltage and velocity will all be at right angles to each other, the Lorentz equation being
a ctor relationship) [3].
After the rotating speed has been determined a rotor's primary performance
charact ri tic curve i determined and therefore the number of lines of magnetic flux
g n rat d by the field. The desired magnetic fields can be engineered by varying the
numb r f machined rotor lots the number of copper bars in each slot, excitation
urr nt and p nn ability (magnetic conductivity) of the rotor forging, and the length
and diam t r of th rotor body. The stator's design similarly can be varied around the
numb rand d pth of coil-hou ing stator slots parallel to the shaft, the characteristics and
12 f th ta tor iron core coil ventilation method chosen, winding pattern of slot coils,
c r I ngth and inner and outer core diameter.
STATOR COIL CONSTRUCTION
Th cope of thi thesis is limited to hydrogen inner-cooled stator windings as
hown in Figure 4. A typical large hydrogen cooled generator have two coils per stator
lot a hown in Figure 4. The coil closer to the air gap is referred to as the top coil and
th oth r coi I is r ferred to as the bottom coil. A typical stator coil have several rows or
To i
ent T 1be
Stator
Core
FIGURE 4. Hydrogen Inner-Cooled Stator Coils
10
11
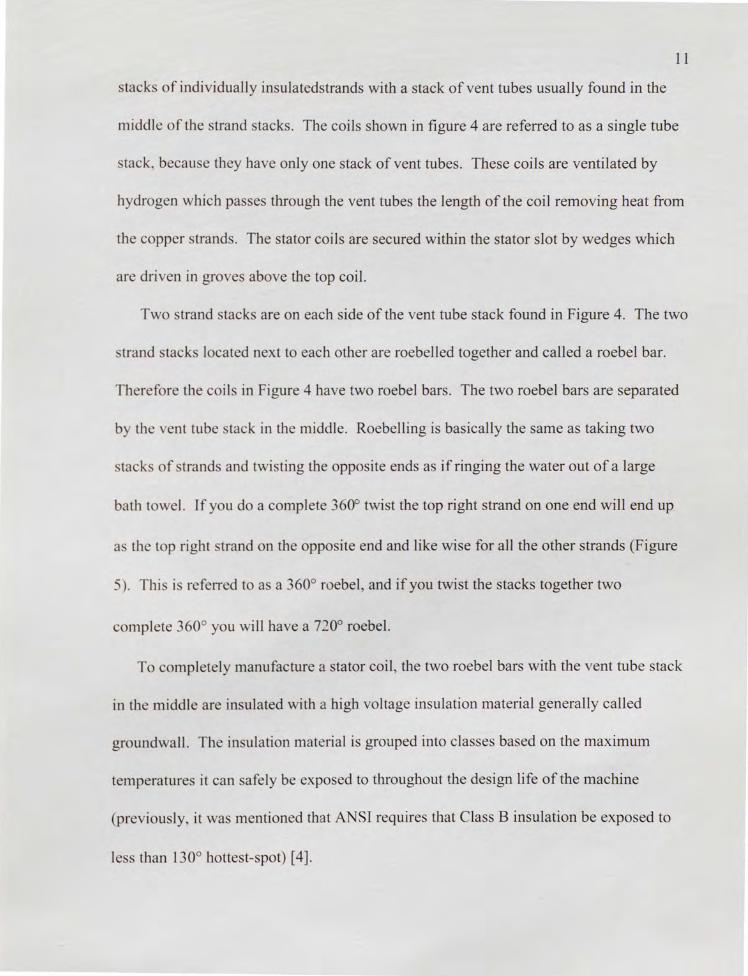
tack of individually insulatedstrands with a stack of vent tubes usually found in the
rniddl of the trand stacks. The coils shown in figure 4 are referred to as a single tube
tack because they ha e only one stack of vent tubes. These coils are ventilated by
hydrogen which passes through the vent tubes the length of the coil removing heat from
the copper trands. The stator coils are secured within the stator slot by wedges which
are driven in grove above the top coil.
Two strand stacks are on each side of the vent tube stack found in Figure 4. The two
trand tack located next to each other are roebelled together and called a roebel bar.
Th r fore the coil in Figure 4 have two roebel bars. The two roebel bars are separated
b th nt tub tack in the middle. Roebelling is basically the same as taking two
tack and twi ting the opposite ends as if ringing the water out of a large
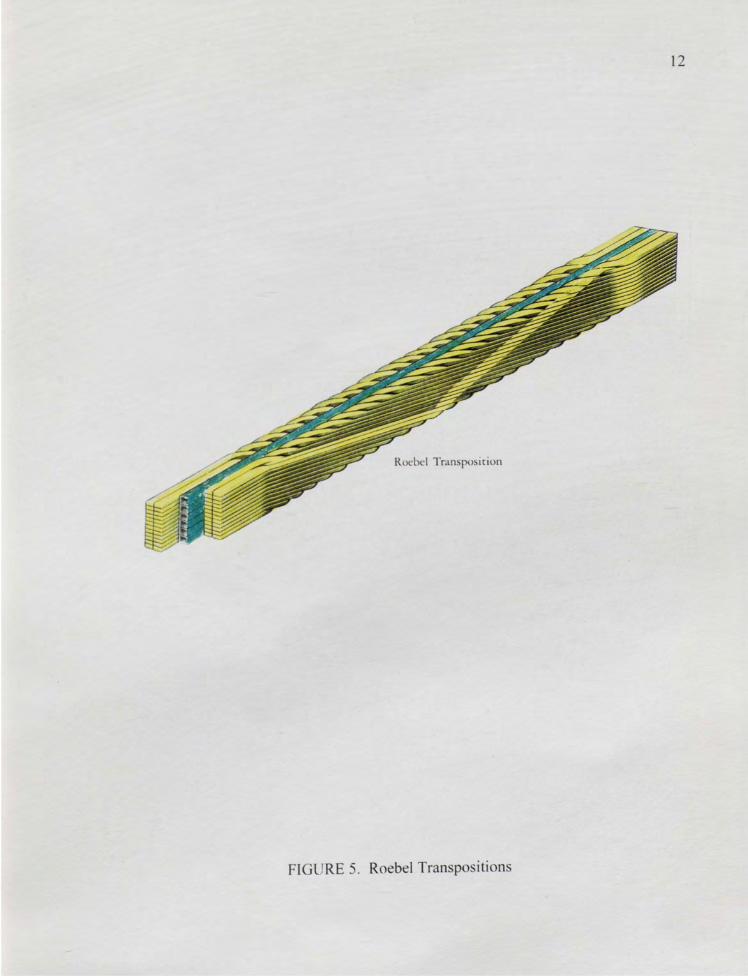
bath t w 1. If you do a complete 360° twist the top right strand on one end will end up
a th top right trand on th opposite end and like wise for all the other strands (Figure
. Thi i refen- d to a a 360° roebel, and if you twist the stacks together two
cornplet 360° you will ha ea 720° roebel.
To completely manufacture a stator coil, the two roebel bars with the vent tube stack
in th middl are in ulated with a high voltage insulation material generally called
groundwall. The in ulation material is grouped into classes based on the maximum
t mperatur s it can safely be e posed to throughout the design life of the machine
(pr viou ly, it wa mention d that ANSI requires that Class B insulation be exposed to
le than 130° hottest-spot) [ 4].
12
FIGURE 5. Roebel Transpo itions
STATOR COIL LOSSES
The tator coils have two primary functions in a turbine generator. The generator
oltage i induced in the stator winding and it conducts the load current. Performing
the e functions causes secondary phenomena to take place in the conductors of the
13
ta tor winding. Due to the finite physical size of the conductors the same flux that links
the turns of the winding links small loops inside the conductors themselves causing
curr nt to circulate in them and generate loses [5]. The load current causes losses in
th conductor re i tance. That same current excites leakage fluxes that link contours
in id th c nductor cau ing non-uniform current distribution and additional losses.
Th larg t lo in the tator winding is the loss due to the generator load current
fl ing through conductor with finite resistance. This loss has the same value as if the
I ad urr nt a DC and had the intensity equal to the RMS value of the AC current
Inns 2R . The curr nt in th tator winding being located in the slots, excites a
tang ntial flu flo ing from one side wall of the slot to the other. This flux induces
!tag both in the loop located inside the individual strands and in the loops formed
b diffi r nt trand . The radial flux that fringes from the air gap into the stator slots
induc oltag in the trand and between the strands.
Th los e cau ed by eddy currents induced inside individual strands are called eddy
cutT nt losse . Th y are cau ed both by fluxes oriented tangentially and by fluxes
orient d radially. Th fonner ones are called cross slot flux eddy current losses and the
latter radial flu lo es. They occur both in the slot and in the end regions, with the

II. CROSS SLOT INTERNAL STRAND LOSSES
The internal strand loss within an individual strand is primarily caused by the cross
lot flux in the slot region of the stator coil. Some stator slots have top and bottom coils
ith the ame phase currents and other slots have top and bottom coils with different
pha current . The ultimate goal is to determine the highest hot spots in the coil side.
Th r for the following analysis was completed for the cross slot flux and its
a iat d lo for ach trand in a roebel bar with top and bottom coils having the
am pha curr nt and al o tho e slots with top and bottom coils having different
pha curr nt .
Th typical m thod of calculating cross slot flux is to use the average cross slot flux
B [ ]. Howe er, it i the intent of this thesis to develop the cross slot flux and its
a ciated I for each indi idual strand in the coil side to more accurately account
for th cro slot internal strand losses. The cross slot eddy loss in the top coil depends
on the phase of the bottom coil in the same slot. If the coils are of the same phase the
cro lot eddy lo will be higher than when the two coils are of different phases as
hown later in thi chapter. The basic equation for calculating cross slot eddy loss as
d cribed by William Timbie [6] states:
15
16
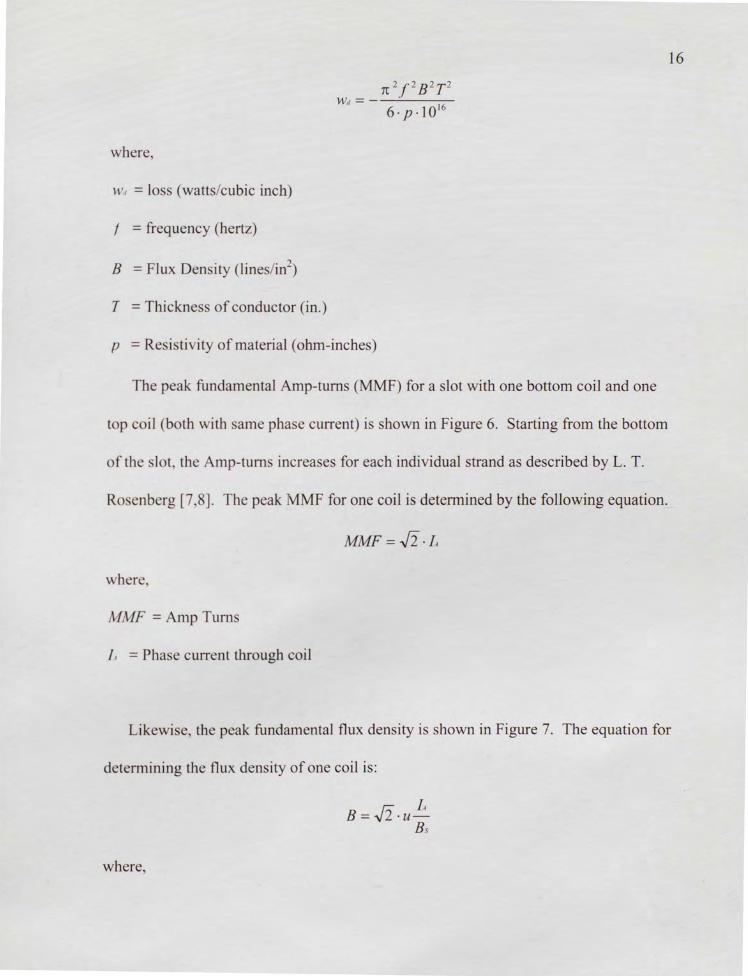
n2f2B2T2 W 11 =-----
6·p·l016
where
tt , = loss (watts/cubic inch)
t = frequency (hertz)
B = Flux Den ity (lines/in2)
T = Thicknes of conductor (in.)
p = Re i tivity of material (ohm-inches)
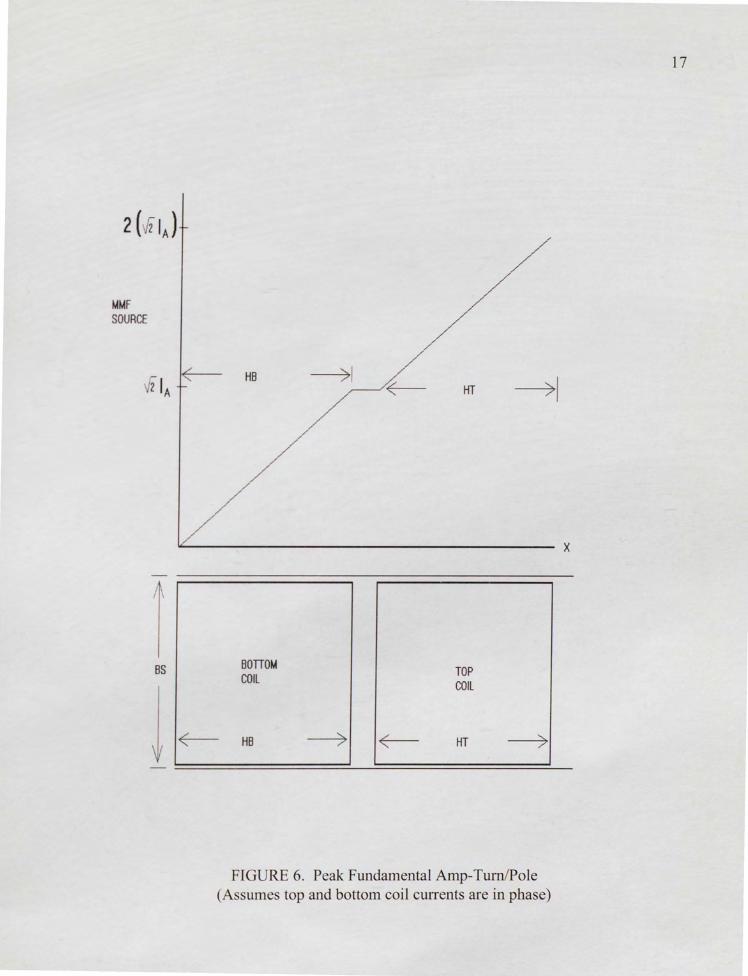
Th p ak fundamental Amp-turns (MMF) for a slot with one bottom coil and one
p iJ (b th ith am pha current) i shown in Figure 6. Starting from the bottom
Amp-tum increa es for each individual strand as described by L. T.
R nb rg [7 ] . The peak MMF for one coil is determined by the following equation.
MMF= ✓2·L
h r
MMF = Amp Turn
14 = Pha curTent through coil
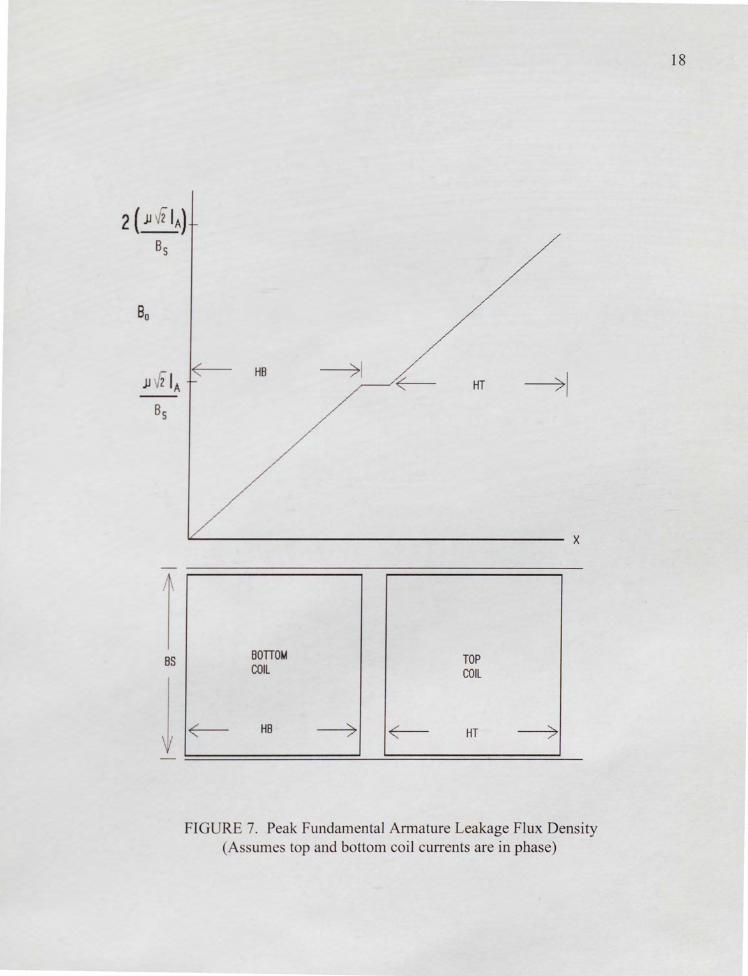
Likewi e th peak fundamental flux density is shown in Figure 7. The equation for
determining the flux density of one coil is:
wh re
B= ✓2·u_!:_ B
MMF SOURCE
-- , ~ HB 2 A HT
I BS
l
/
BOTTOM TOP COIL COIL
~ HB ~ ~ HT ~ _,,..--·
FIGURE 6. Peak Fundamental Amp-Tum/Pole (Assumes top and bottom coil cmrents are in phase)
17
X
l BS
l
HT
/ X
BOTTO~ TOP COIL COIL
~ HB ~ ~ HT ~
FIGURE 7. Peak Fundamental Armature Leakage Flux Density (As um es top and bottom coil currents are in phase)
18

B = Flux density
u = permeability
I~ = RMS phase current
B = Slot width
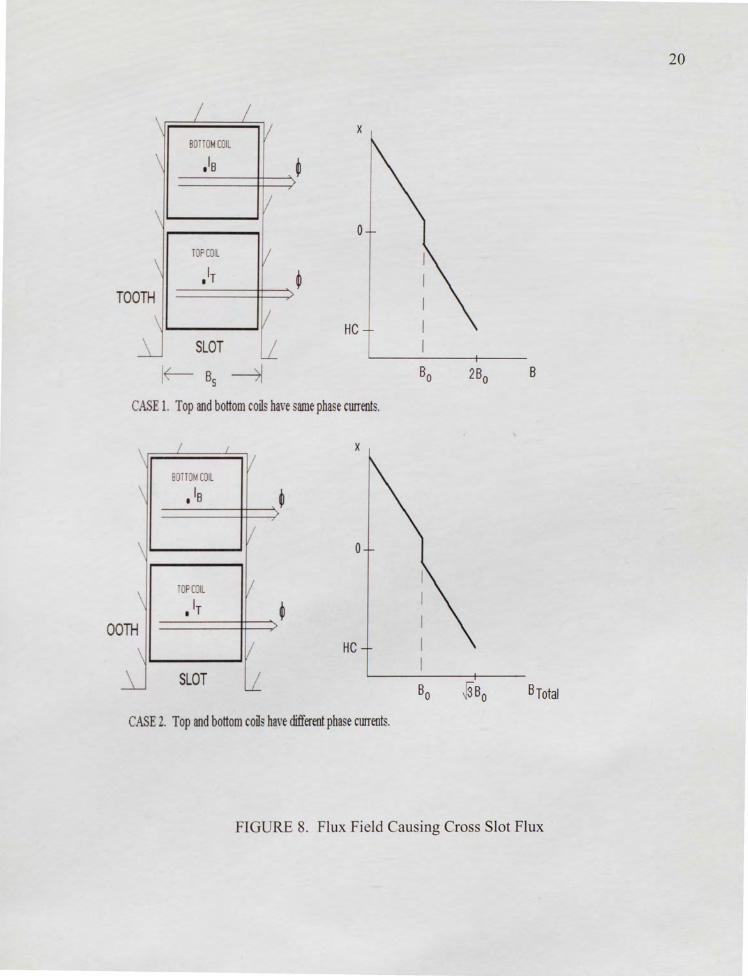
A hown in Figure 8 the cross slot flux density in the top coil is greater when the
b ttom coil i of the same phase. (The cross slot flux density of the bottom coil is not
affi cted by th pha e of the top coil. Therefore, the cross slot eddy loss is identical in
all b tt m coil .) When the cross slot flux density of the top coil is higher, the loss in
th t p coil ill b high r. Sine the cross slot eddy loss varies with the square of the
flu d n ity th lo will ary with the integral of the square of the flux density. For
op and bottom coils are the same (I8orr=lrop), the cross slot flux
d n it ill qua! B,,,.,. a een in Figure 8.
h r
x = height from bottom of slot.
Ht = height of top coil.
For slots where the top and bottom coils are different phases, the cross slot flux
den ity equals B.,,17 as seen in Figure 8.
19
20
X BOTTOM COIL
\ ,IB
0
TOP COIL
• IT
HC SLOT
If- B5 ~ Bo 2B 0 B
CASE 1. Top and bottom coils ha e same phase cwrents.
X
BO TO COIL
• 10
0
OPCOI
• IT
HC
SLOT Bo ✓3Bo 8Total
CASE 2. Top and bottom coils have different phase currents.
FIGURE 8. Flux Field Causing Cross Slot Flux
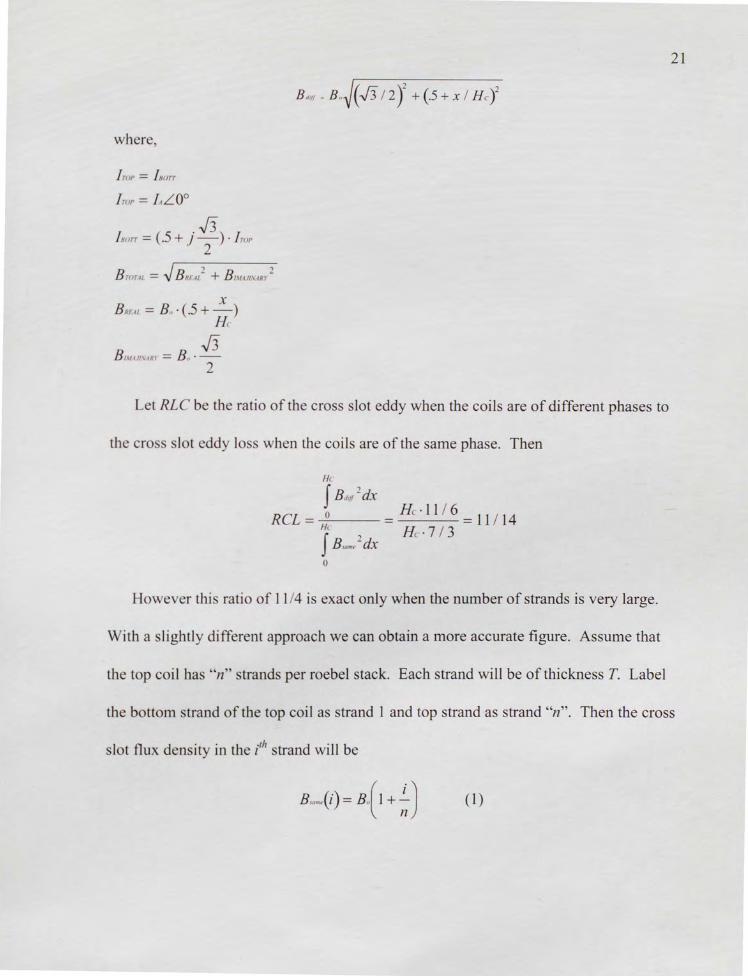
where
f mf' = f norr
l ror = I~L.0°
/ Borr = (.5 + j ✓3) · fror 2
X B F ~L = B,, . .5 + -)
He ✓3
B l\(U/\IR> = B ,, ·-
2
B ,1111 B,. -J(✓3 / 2 Y + (.5 + X / Hc)2
L t RL b th ratio of the cross lot eddy when the coils are of different phases to
th er lo when the coils are of the same phase. Then
He
f Bd,,r 1dx
R CL = 0 = He- I 1/ 6 = 11/ l 4 Hfc , Hc·7 / 3
B'°"' -dx 0
Ho r thi ratio of 11/4 is exact only when the number of strands is very large.
21
With a lightly different approach we can obtain a more accurate figure. Assume that
th top coil ha 'n 'strand per roebel stack. Each strand will be of thickness T. Label
the bottom trand of the top coil as strand 1 and top strand as strand "n". Then the cross
lot flux density in the i'h trand will be
The associated cross slot flux losses are
(2)
2 / 7 2 n -r Ln (·)2
W i1,11 = 16 · . B <ufT l 6 · p · 10 i=l
n approach infinit RCL(n) approaches 11/14, so this derivation agrees with
th fir t. If n qual 10 then RCL(n) equals 1161/1491 = .779. In decimal form 11/14
qual .0786. Th di agreement between these two numbers is less that nine tenths of
n p re nt. ote that a typical inner cooled stator coil for a large generator will have
b n 25 and 46 trand per stack so the difference will be negligible.
22
It i hown that the worst ca .. e or largest losses will occur in slots with top and
bottom coil having the same phase current. Therefore the loss calculation in this thesis
will u lo for slots with top and bottom coils having the same phase currents
( quation 1 and 2) to in ure calculation of the true hot spots throughout the stator coil.

Ill. CROSS-SLOT STRAND TO STRAND LOSSES
In turbo-generators, strands in a stator coil side are transposed to suppress additional
ddy current lo produced by alternating flux due to currents in the coil itself and in
oth r coil . The ddy current flows in a strand from one coil end to another end, and
r tum through another strand because these strands are short-circuited at both ends.
en rally, a bigger coil ha higher eddy current loss. This effect is usually called "Deep
Bar Effi t '.
R c ntly, a proj tarted to examine various types of transpositions and to
d t rmin ch aper coil tructures. Gas inner cooled stator coils have a large cross
ction hich r ult in higher deep bar effect and have less cooling effect compared
ith at r ool d tator coils. on-uniform current distribution by the higher deep bar
ffi ct may er ly affect the hottest temperature in the gas inner cooled stator coils.
Up to thi time the deep bar effect was calculated by a computer program that only
accounted for up to 360° roebels. A more flexible and accurate calculation procedure
had to be de eloped for new coil designs. In the old program, reactance calculations
wer completed using a MVP (Magnetic Vector Potential) grid model [9,10,11].
23
24
In this analysis a different approach was taken. Two separate calculations are
completed. One for the slot region and one for the end regions. Reactances in the slot
region are calculated by the area above strands, and it assumes that the cross slot flux
goe traight across the slot. Reactances in the stator coil end regions are calculated by
a urning that the flux density normal to coil side varies in proportion to the coil height.
Th e calculation will be discussed later.
DESCRIPTIO OF TRANSPOSITION MODEL AND ASSUMPTIONS
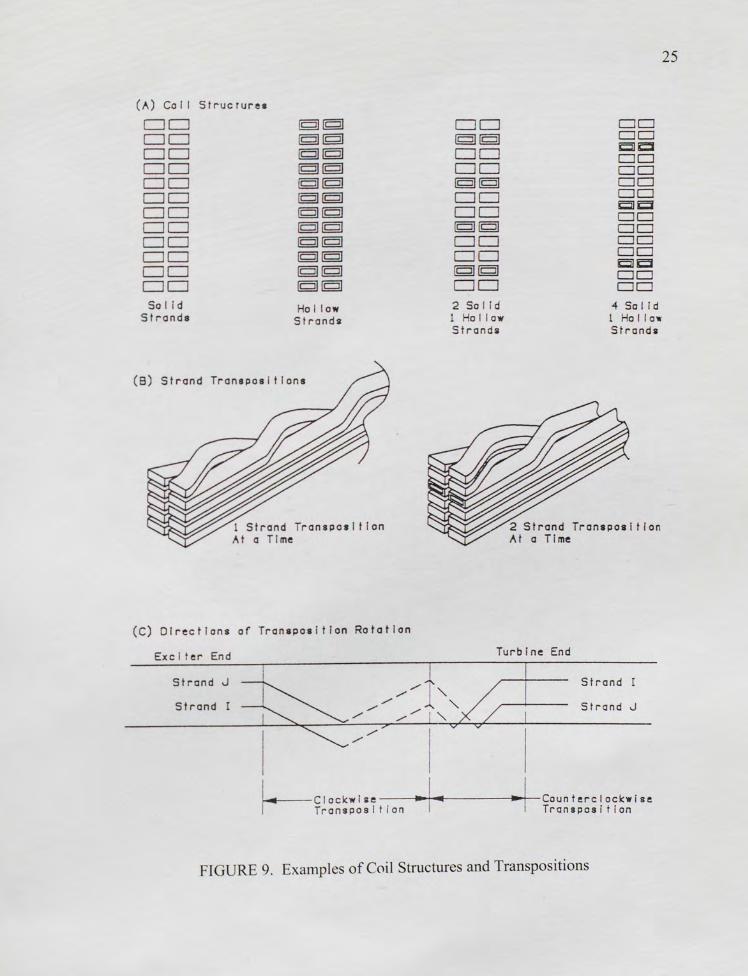
Th re are many coil stmctures and strand transpositions. Figure 9a shows some
amp! of th . Solid trand structures are used for conventional cooled coils and
ga inn r cool d coil . Hollo trand structures and composite structure of hollow and
lid trand ar u d for ater cooled coils. This thesis focuses on gas inner-cooled
c i I tructure and its a ociated transpo itions in the slot region and coil end region.
Th trand can be transposed in various ways, one at a time or two at a time. Figure
9b ho, the et o ca es. Direction of the transposition rotation can be clockwise or
count r-clockwi e (Figure 9c ). In this paper, direction of rotation is defined as the view
from th e citer end of the ta tor coil.
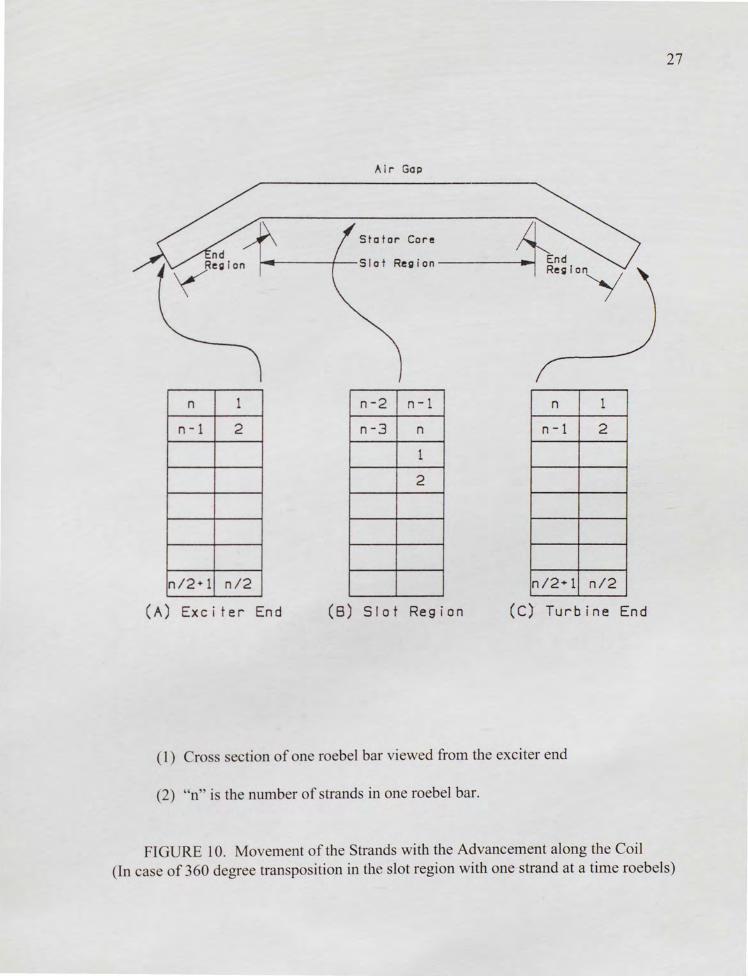
In this calculation all strands in one roebel bar are numbered in the clockwise
dir ction from 1 at th top strand in the right hand stack ton at the top strand in the left
hand tack. n i, th number of strands in one roebel bar. The coil is always viewed
from the excit rend. With the advancement along the coil all strands change their
(A) Co I I Structures
DD [g](g]
DD (g] (g]
DD [g][g]
DD g[g DD (g] [g]
DD [g](g]
DD [g][gj
DD [g][gj
DD (g] [g]
DD [g][g]
DD [g] [g]
DD g[g]
So I Id Ho I I ow Strands Strands
( B) Strand Transpos i t ions
(C) Direct i ons of Transposition Rotation
Exc it er End
Strand J
Strand I
DD [g](g]
DD DD [g[g]
DD DD g[g] DD DD g[g.] DD 2 So Ii d 1 Ho I I ow S t rands
DD CJD cc DD DD DD DD Ci::i DD DD CJD DD Ci::i DD DD
4 So 11 d 1 Ho I I ow Strands
2 Strand Transposition At a Tl me
Turbine End
Strand
Strand J
I CI ockw I ae --~•..+-t --•1------1..,..+-t -Coun t ere I ockw I se ~ Transpos It i on Transpos It l on
FIGURE 9. Examples of Coil Structures and Transpositions
25
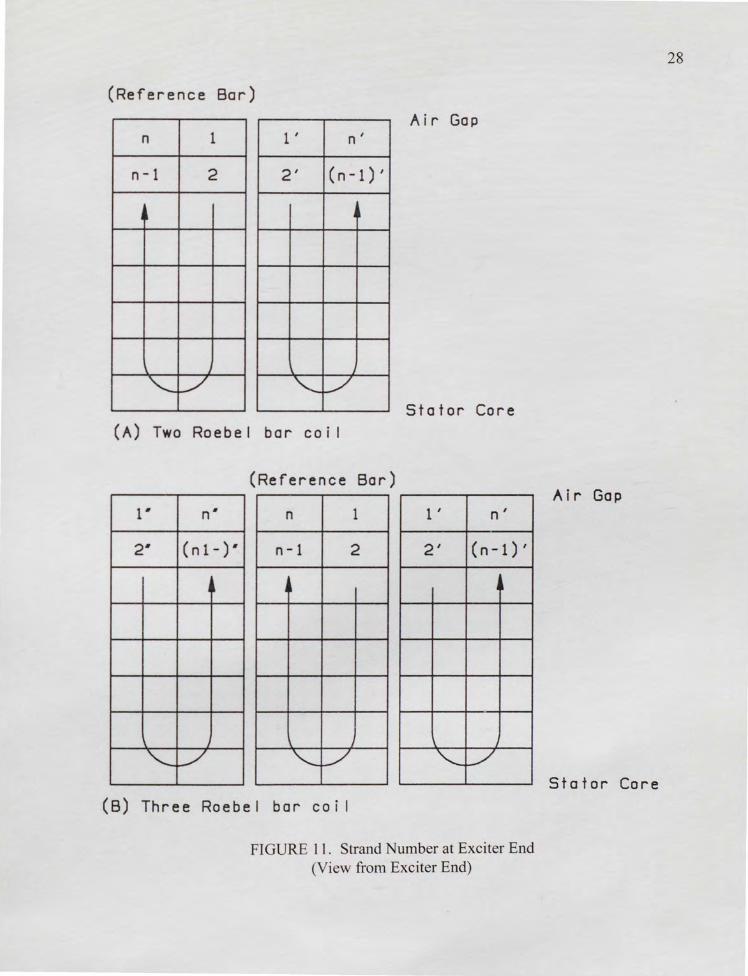
26
locations in the roebel bar. All data describing this strand movement is part of the
program input. Figure 10 shows the movement of the strand. For multi roebel bar coils,
th trand number is defined as in Figure 11.
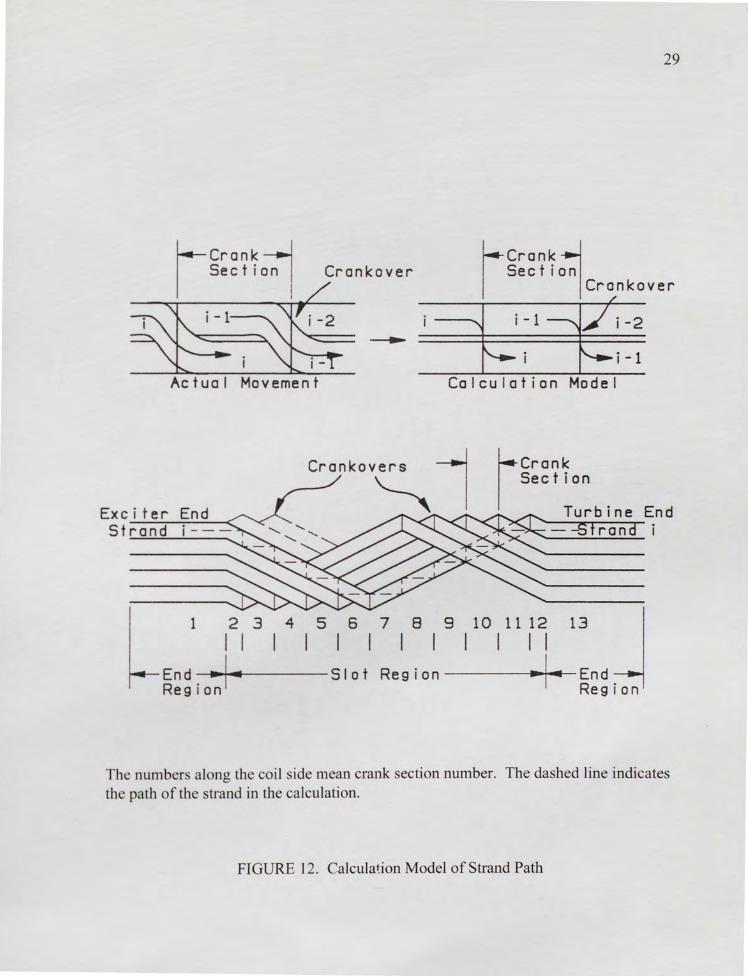
To determine the circulating currents between strands in a roebel bar, this paper
a embles and sol es a set of voltage difference equations for each pair of successive
trand [ 12]. The equations are based on a model of the roebel bar convenient to
c mput rized quation assembly for various transposition patterns. The path of an
indi idual trand i approximated by a succession of axial moves between crankovers
and radial mo at crankov r shown by a dashed line in Figure 12. The strands are
n n t tran po d in th end regions in this figure. This however, is not a limitation
f thi analy i . Th u er can input the transposition data for the end regions as well as
fi r th lot r gion.
In addition to th approximation described above the following general assumptions
ar mad in th analy i :
1. P rm ability of tator core is infinite.
2. Only th fundamental frequency component of the current and flux is
considered.
The ffect of the radial flux which penetrates into a coil in the slot and the coil
end region i not considered.
4. 0th r as umption will be describe as needed.
Air Gap
Stator Core
n 1 n-2 n-1
n-1 2 n-3 n
1
2
n/2•1 n/2
(A) Exciter End (8) Slot Region
End Reglo~
n 1
n-1 2
n/2•1 n/2
(C) Turbine End
( 1) Cross section of one roebel bar viewed from the exciter end
(2) "n" is the number of strands in one roebel bar.
FIGURE 10. Movement of the Strands with the Advancement along the Coil
27
(In ca e of 360 degree transposition in th slot region with one strand at a time roebels)
(Reference Bar)
Air Gap n 1 1 , n I
n-1 2 2' (n-1)'
4l I
" ' ' '--_/ '--_/
Stator Core (A) Two Raebel bar coi I
(Reference Bar)
1· n• n 1 1 , n,
2· (nl-)' n-1 2 2' (n-1)'
I I j
l ' \ ' \ ' '--_/ '--_/ '--_/
(B) Three Raebel bar coi I
FIGURE 11. Strand Number at Exciter End (View from Exciter End)
28
Air Gap
Stator Core
29
f---crank ~ Crankover Section I Section
1 rCrank1 Cr~nkover
i 4 i-1 ~i-2
f-=. i i-1
Actual Movement Calculation Model
Exciter End
Crankov~ I Strand
1 2 3 4 5 6 7 8 9 10 11 12 13
I I End -- 1 ◄ Region
I I I I Slot Region----~• ...... J ◄--End
Region
The numbers along the coil side mean crank section number. The dashed line indicates th path of the trand in the calculation.
FIGURE 12. Calculation Model of Strand Path

30
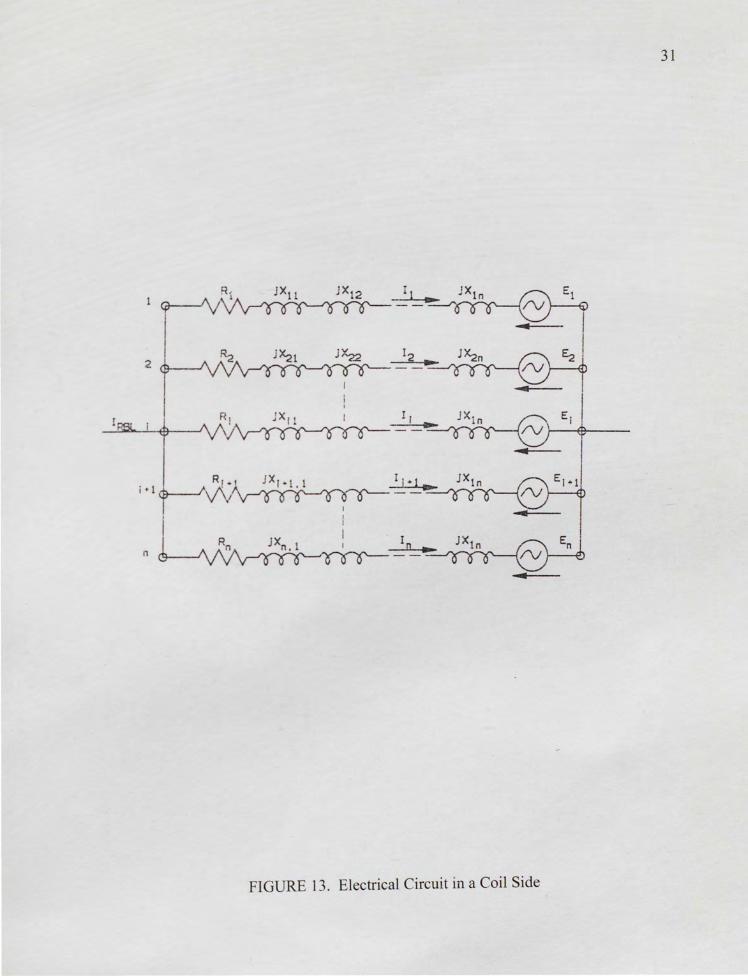
VOLTAGE DIFFERENCE EQUATIONS
The voltage equations between ends of the coil strands consists of three parts, that
V nni for the coil end region of exciter side, V swr for the stator slot region, and VE.\m
for the coil end region of the turbine side, and they are given below (Figure 13) [ 10, 12].
V1 = V1nm + V1swr + V1nm = R1 · 11 + iX 11 · 11 + iX 12 · 12+ ... + iX 1, . ],+ ... + iX 111 . ],, + E1
V = nni + V.swr + V.nm = R,. J, + JX1 · 11 + }X2 · 12+ ... + jX,,. J.+ ... + jX,, -J,, + E, (1)
V,. = V.,no1 + V, wr + V.,nn2 = R" · J,, + }X11 · / 1 + }X,2 · / 2+ ... + jX,,, · l+ .. . + jX,,,, · J,, + E ,,
I and E are phasor quantities, and
R : R i tanc of trand i
lf-r actanc of trand i
: Mutual-r actanc b t een strand i and strand j in coil
/ : urr nt in trand i
I =R
!tag b tween nd of trand i
E : El ctromoti fore in strand i
For top coil th electromotive force is produced by the fluxes from the other coils in
th nd regions and from the bottom coil in the slot region. For bottom coil, the
ctromoti e fore i produced by the fluxes from the other coils in the end regions.
In equation 1, mutual reactances between strands in the top coil and strands in the
bottom coil do not appear. The flux linkage between these coils is treated as the
electromotive force in th top coil strand.
31
-~~""\ -- ---o O 0~
◄
~ I2 -~X-.2n ~ -- /\J
I _.__ I
___f'V'"'"'_,........._,.... _/\._,,........,_
1
~.... --a..---~__I~•..,. ◄ EI I
FIGURE 13. Electrical Circuit in a Coil Side

R i tance is given below.
/, R = p,-
S, (2)
wher
p, : Re i tivity of trand material
/ : Length of trand i. It is assumed that the length of strand i is equal to the length of
th coil ide.
: Cro ction area of trand i
32
!tag diffi r nc quation between successive strands are determined as follows from
Equati n 1.
- ~ = R 1 · J 1 - R~ · J ~ + j ( X 11 - X cl ) · J 1 + ... + j ( X 111 - X 111 ) · J,, + E 1 - E]
V - J ' = R · J, - R, - I ·/, + I+ j(X.1 - X - 1,1 ) • f 1+ .. . + j(Xn - X + 1.11 ) •},, + E, - E, + I (3)
1n 1-V., = R,, 1·!11 - 1-R. -J,,+ J(X,-1.1 -X,, )·l1+ ... +j(X,-1.11 -X,.11 )·J,,+E,, -1 -E
Th n both nd of a coil are short-circuited,
In addition to the abo e (n-1) voltage difference equations the following current
quation mu t b ati fied:
f unL / 1 + / 1+ ... +J,, =Im = - (5)
RBL
where,

J, : Curr nt in strand i
I RnL : Raebel bar current
lwn : Coil current
RBL : The number of Raebel bars in one coil side
Equations 3 and 5 are written below in matrix form.
where
J,
E - £ ~
E - E - ,
£,, I - E,
0
0
0 [V]=
0
[ I( OIL I I/BL ] =
0
0
Icon/ RBL
(7)
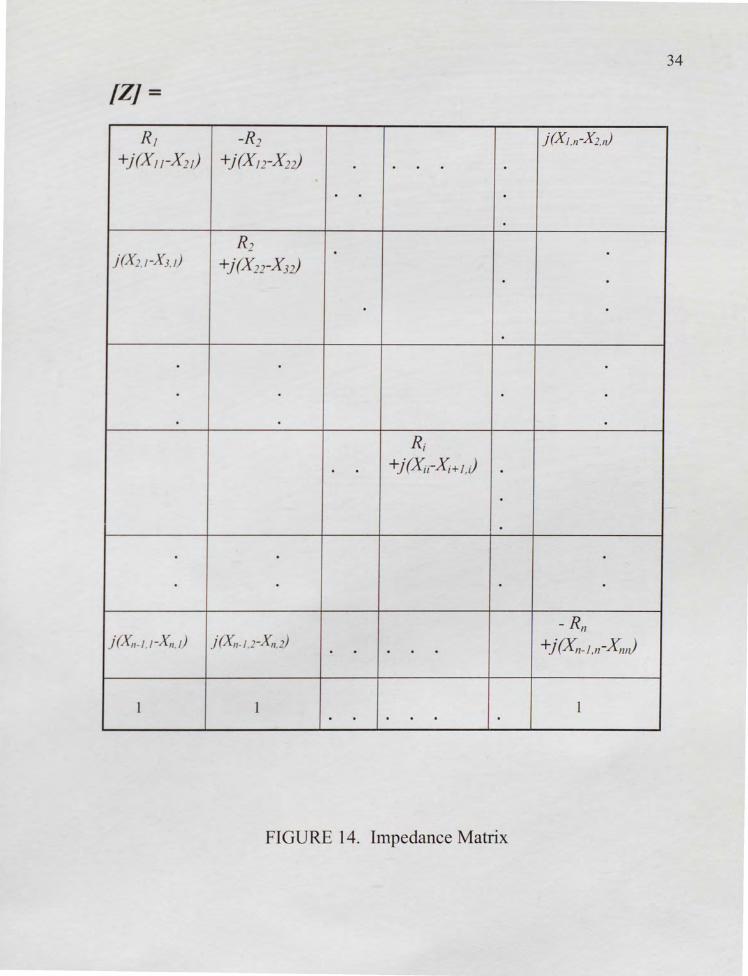
Impedance matri which is the largest matrix in the program, is shown on the next
pag Figure 14). Equation 6 will be solved by Gaussian Elimination Method [ 1 OJ.
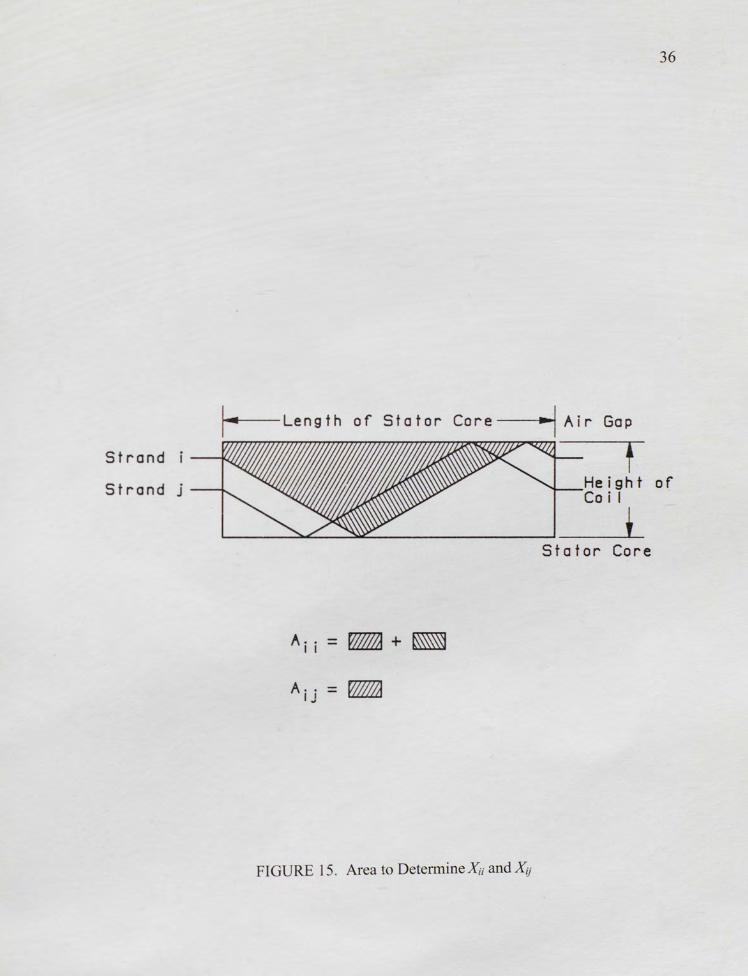
CALCULATION OF REACTANCE IN SLOT REGION
Calculation of trand reactances in the slot region to set the impedance matrix [Z] is
xplained her . As urning the cross slot flux in the slot region goes straight across the
lot elf-reactance of strand i is determined by the area above strand i in an axial/radial
33
34
[Z]=
R, -R2 J(X1,n-X2,n)
+j(X,rX21) +j(X,rX22) . .
R2 J(X::. 1-X1. 1) +j(X22-X12)
.
.
Ri . +j(X;cX;+1,J
.
-Rn j( 11- I . 1-X,,. 1) '(X -X) j 11- / ,_ 11 ,- +j(Xn-l ,n-X,111)
1 1 1 .
FIGURE 14. Impedance Matrix

35
plan through the length of a stator core. Then, mutual-reactance between strand i and
trand j i determined by the mutual area above strand i and strand j.
Reactances are given below.
X u,, • A,,
,, =(D---B. • 10
wh r
lf-reactanc
Mutual-r actanc
cu : ngular fr qu ncy
u : P nn ability of free pace
B : Jot width
A : r a abo e trand i ( ee Figure 15)
A Mutual area abo e strand i and strand j (see figure 15)
Thu the problem reduces to calculation of area [13]. In this program the location of
th trand i det nnined at each crank section, then the area is calculated from product
of the length of the crank section and the location of the strands. The areas at all crank
ection are ummed up along the length of the stator core.
Strand
Strand j
36
!---Length of Stator Core---j Air Gap
FIGURE 15. Area to Determine Xi and XiJ
t Height of Co i I
t Stator Core

37
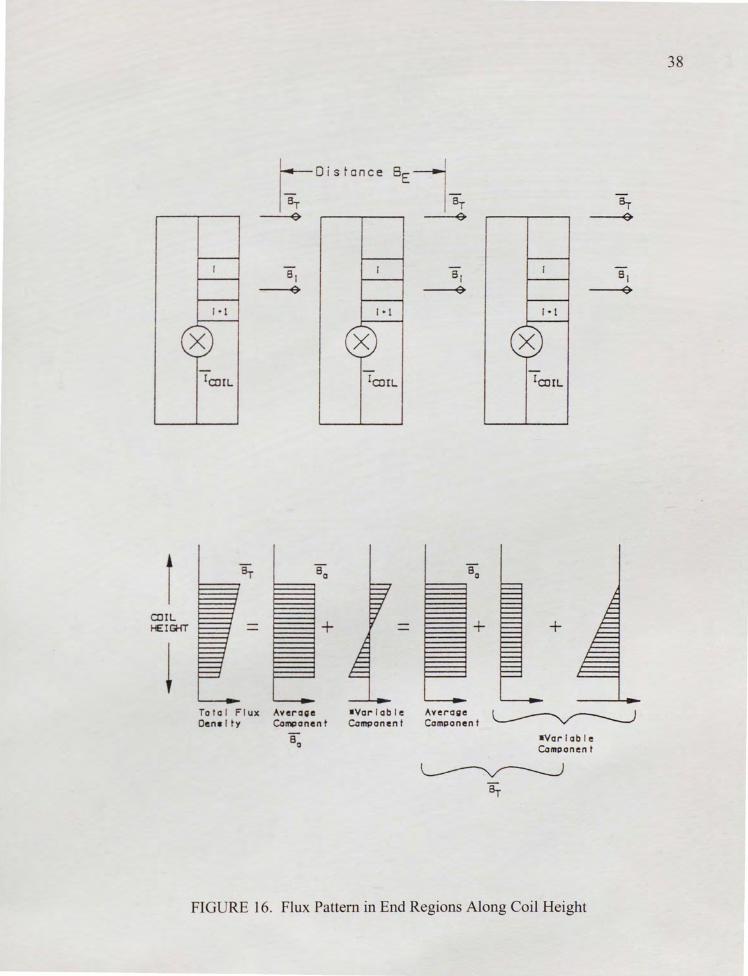
CALCULATION IN END REGION
The flux pattern along the coil height in the end regions is assumed like in Figure
16. Flux con ists of the average component Ba and the variable component shown in
the middle part of Figure 16. The variable component of the flux was divided into two
component in the computer program.
ummg averag flux density B,, , then Br in Figure 16 is given below.
K . Br = B,,+-·(Pwll + }Qwn )
2
h r
n tant t rm
B, : n c nterlines of two adjacent coils (see Figure 16)
P1 '" : R al part of the coil current.
Qw, : Imaginar part of the coil current.
rag flu d n ity at each crank-section in the end regions has to be input. Hence,
th flu d n it B, which produces the emf between consecutive strand i and strand i+ 1
pr ed a follow.
K KL .J. + KL.J. - I
B, = B,, + -(Pcoll + }Qwll )- 1 ,+I · NRBL (8)
2 2
t COIL HE I GHT
!
r-- □ i s t a n ce
IB-r 0
6r 80
+
To t a l F l ux Average •Var f able Dens I ty Companen t Cornponen t
80
Bo
+
Average Componen t
+
B-r 0
~ •Var fable Component
~ 6r
FIGURE 16. Flux Pattern in End Regions Along Coil Height
38

KL/ i K time the um of currents in strands above strand i, including strand i, and
K""" J, , 1 is K time the sum of currents in strands above strand i+ 1. ~ i+l
The voltage difference equation between strand i and strand i+ 1 consists of three
parts that i the exciter end part, the slot part, and the turbine part. The voltage
difference equation in the end regions is given below instead of the use of the
reactance .
- V, . , = - i CB ( 9)
h re,
Ct)
=W·Lnn·-1 O'
H : Di tanc b twe n two consecutive strand i and strand i+ 1. !),,H is positive when
trand i I ocat a bo tand i+ 1.
Lnn : L ngth of th tran po ition ection in the end region.
co : Angular frequency.
Sub tituting equation 9 into equation 3
{ViE'l>t -V,. 1DD1}+{Vo -Vi- 1!la-}+Vi£VJ2 -V,-1DD2}==-JC&.a. +{R·l-R 1 ·1+,
+j(X-X. 1.1 )·!1+. .. +j(X-X. 1.,,)·L}-JCBsm
(10)
39
40
Strand •
) 3 ---- --- - - - ------- I
Tj 0 --- -- -------- - --
Tj·Ti --4 ---- ------ - - - --
Tj·Ti·~ 5 -- - - ---- - -
~ -Tj·Ti ·~·Ts
0 ~ --- - - -- -"G·Ti ·~·Ts·"G
6 - -- - ---Tj·Ti ·~·Is·T;·Is -- -
Flux Dens I ty -
FIGURE 17. Simple Example of Flux Density in End Region

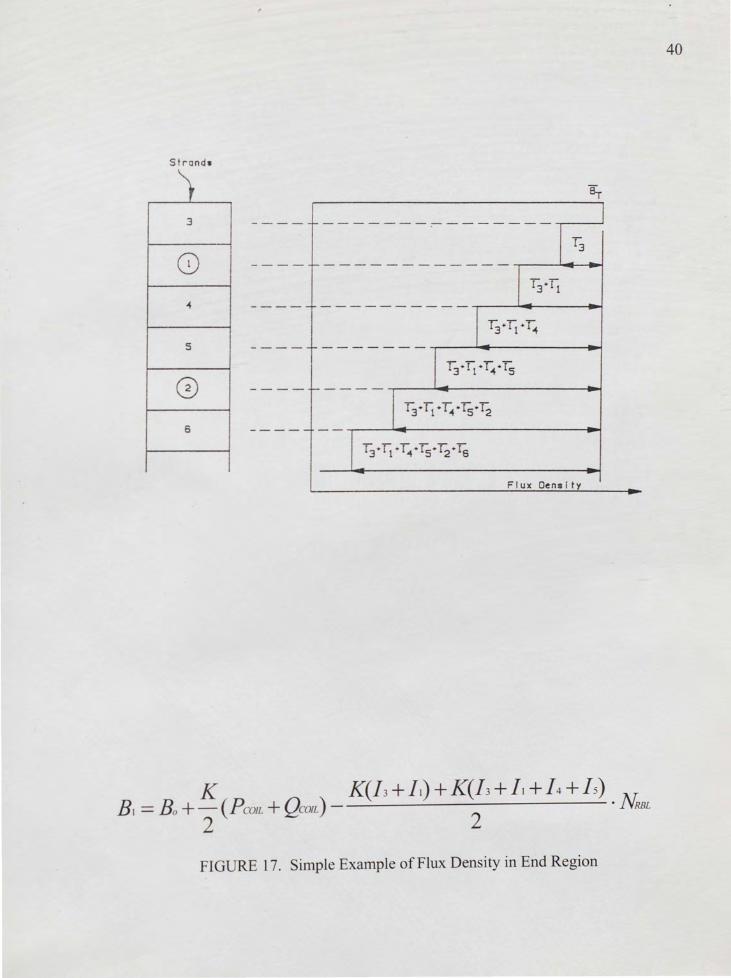
41
[n the above equation, reactances X,., , ... , X, + , . ,, have slot reactances only. Substituting
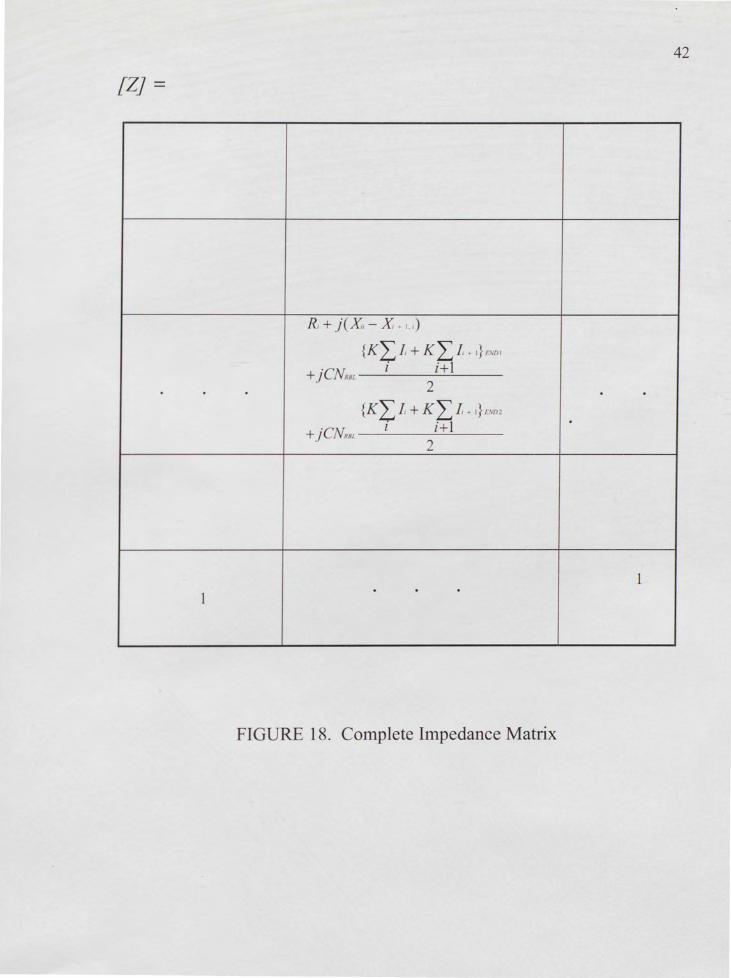
equation 8 into equation 10 the voltage equation for the ends is:
R, - I, - R, • 1 • /, 1- 1 + J(X, -X + 1.1 ). J,+ ... +J(X, ,, -X - ,,,,) · J,, = {jCBa + JC K (Peon + JQcon )-2
K"LJ,+KLI +1 KLL+KLL ~, JCNRHL i i+l } 0,01 + {jCBo + JC K (Peon + JQcmL ) - JCNRBL i+ l }nm
2 2 2
Thu
Thi g1 th complete reactance equation for the exciter end, slot region, and turbine
n d a n in Fi gur 1 .
STRAND INDUCED VOLTAGE
Th e oltag are produced in the end regions and in the slot region by the flux
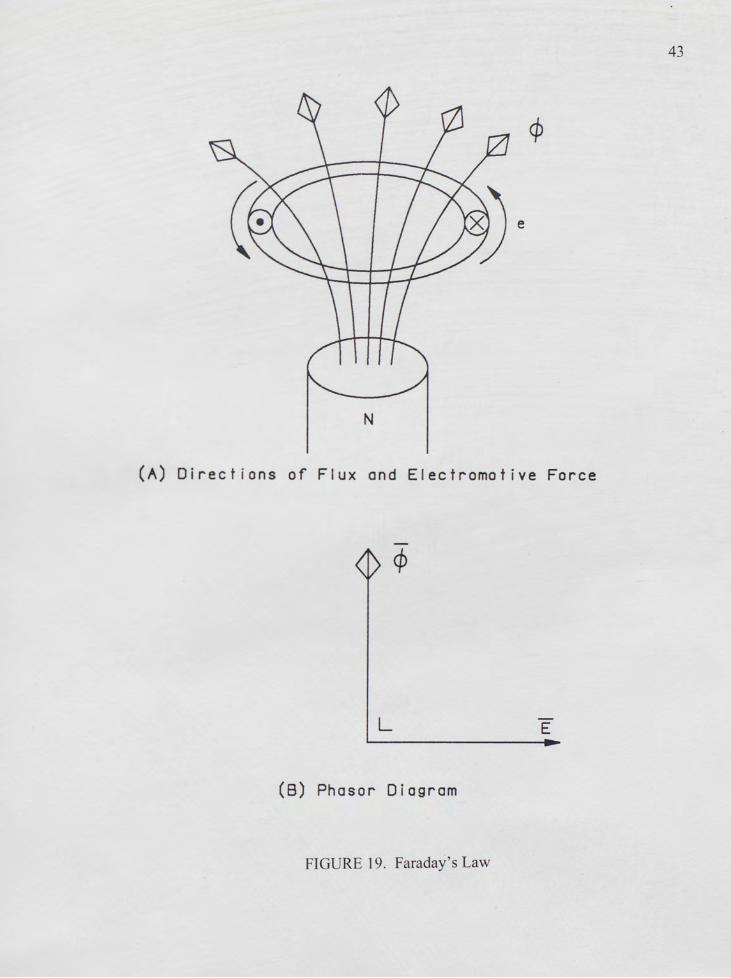
from oth r coil . In thi program the induced voltages are calculated by Faraday's Law
(Figur 19). El ctromoti e force is given below [3].
d~ e=-N-
dt
42
[Z} =
R, + j ( x, - X - I. I)
{KL J, + KL/, - 1} £,\'DI
+ JCNRBL i i+ l 2
{KI/, + KL/, + 1} r:sn2
+JCNRBL l i+ l 2
1 . 1
FIGURE 18. Complete Impedance Matrix
43
e
N
(A) Directions of Flux and Electromotive Force
cp
L E
(8) Phaser Diagram
FIGURE 19. Faraday's Law

wh re,
e: EJ ctromotive force
umb r of turns
<j> : Flux linking coil
t: Time
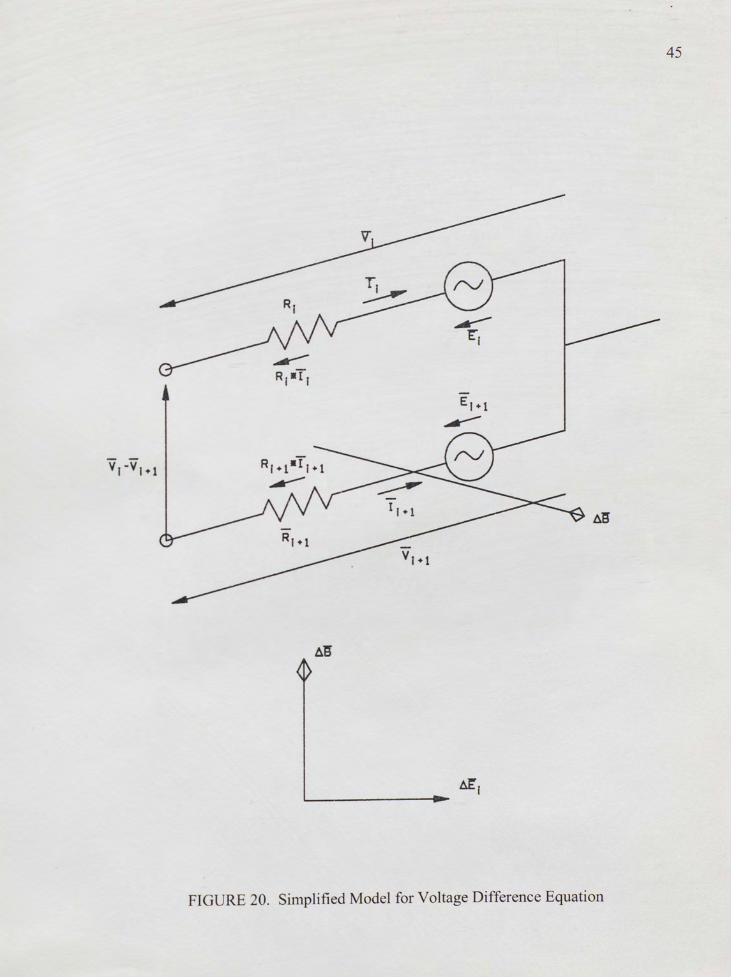
Figure 20 hows the simplified model to explain the directions of the flux, current,
and electromoti e force in two consecutive strands.
= R-l +E
, = R · l -1 +E I
V - V I = R 'I - R, •I "/,_ 1) + (£, - E, • 1) = (R," J, - R, - I " J, - ,) - JC· Af3
trand i and trand i+ 1 ar hort circuited. So the above equation is:
R-1 - R ·/.)-/ · B=O
Th trand induc d oltage is defined as the voltage produced by the flux from other
coil B i ind p ndent of the trand currents Ii and t+ 1• Thus, the equation is given
b lo .
R. J, - R I . I I = JC· B
In thi pr gram trand induc d voltages are calculated at each crank section, and they
ar added ctoriall through the whole length of the coil side [ 14].
44
45
~'B
FIGURE 20. Simplified Model for Voltage Difference Equation

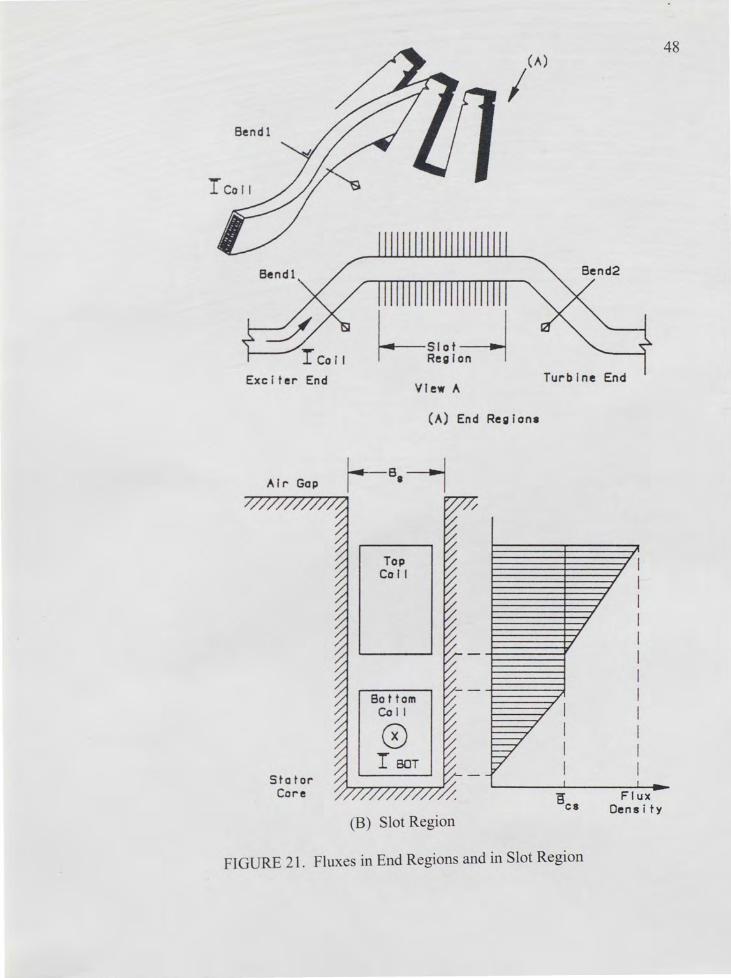
Stand induced voltages are produced in the end regions and also in the slot region.
The flux densitie needed for calculation in the end regions have to be supplied by the
program u er. RMS value of the flux densities should be used in this program.
In th lot region cross slot flux produces the voltage. As mentioned in chapter 2,
th typical method of calculating the cross slot flux is as follows [5]:
here
Bo : Cro lot flux in RMS value
] BOT
Bcs =Uo• Bs
l Bur : urr nt of bottom coil in RMS alue
u : P rm abilit of fre pace
B : I t idth
46
T mor accurat ly account for the voltage induced by cross slot flux, the cross slot
flu quation d eloped in chapt r 2 will be used:
X B rnr = B . ( I + --)
H
, h re,
H = height of top tator coil.

47
x;= radia] height of i"1 strand.
In the Jot region, the voltage is produced only in the top coil, because there is no
flux excited by the top coil that penetrates the bottom coil [ 1 OJ. Figure 21 shows these
fluxes u ed in the program of the deep bar effect.
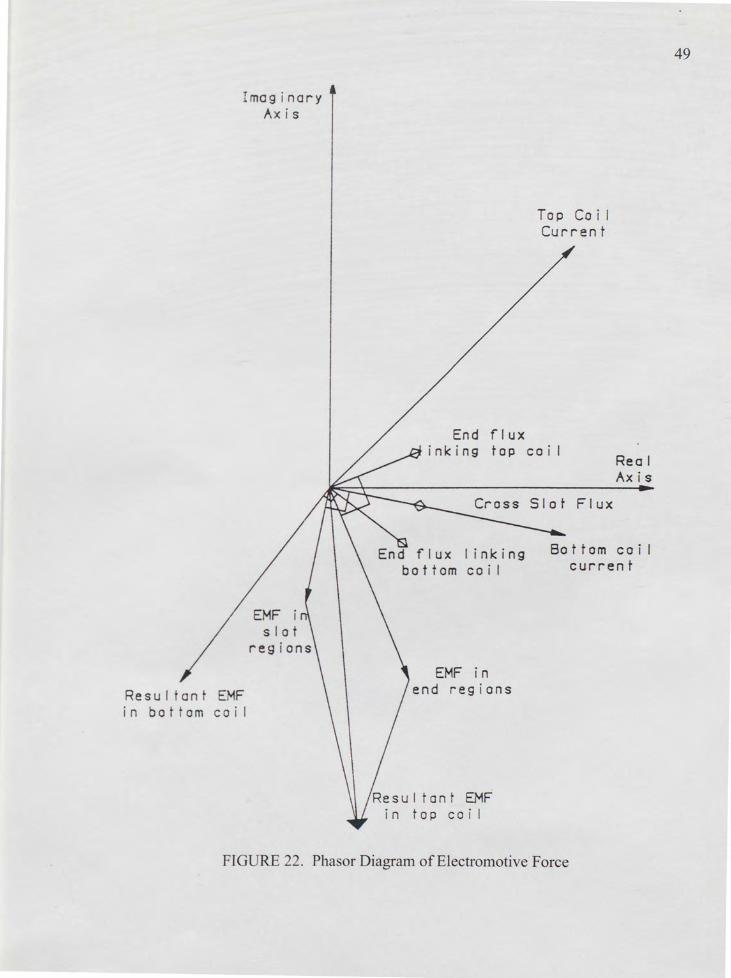
Figure 22 hows the phasor diagram of the electromotive forces in top and bottom
coils. Phasor representing fluxes in the end regions are drawn in arbitrary directions
ju t for explanation purpose. Resultant electromotive force in the top coil is the sum of
th voltage in the end regions and in the slot region. Resultant electromotive force in
th bott m c il, ho er is the sum of the voltages in the end regions. In Figure 22, it
v a a um d that th nd region fluxes in the exciter end and the turbine end regions
had th am pha . Thi a umption is not required by the program. The user can
input diffi r nt nd r gion fluxe for the exciter end and the turbine end regions.
quati n 6 i ol d by Gaussian Elimination to determine the individual strand
urr nt [I]. ho n in equation 5 all the strand currents in a roebel bar add together
to qual load current. However, ome strands may have twice the RMS cmTent of
an th r trand, th r fore, cau ing a localized hot spot in the stator coil. This is a major
t accounted for in past Joss calculation methods. It is the intent of this thesis to
1mpro th flu and lo calculation to more accurately calculate these localized hot
p t in tator oil .
Bend l
I Co l I
Bendl
1
SI of 1
~Reg!~
I 48
(A)
Exc i ter End Turb ine End
Stator Core
Vlew A
(A) End Region•
Top Co 11
Bot tom UJI I
0 I BOT
(B) Slot Region
7 7 ,
-~
I
T 7
I
I
I -,
/
/I I I I I
FIGURE 21. Fluxes in End Regions and in Slot Region
I
I , ,
A -,
/ I T I T
I I I I I I I I I I I --Flux
Density
Imag i nary Ax i s
Res u I t an t EMF i n bot t om co i I
Top Co i I Current
End flux inking top coi I
Flux
Real Axis
I inking co i I current
EMF in end regions
Resultant EMF in top coil
FIGURE 22. Phasor Diagram of Electromotive Force
49
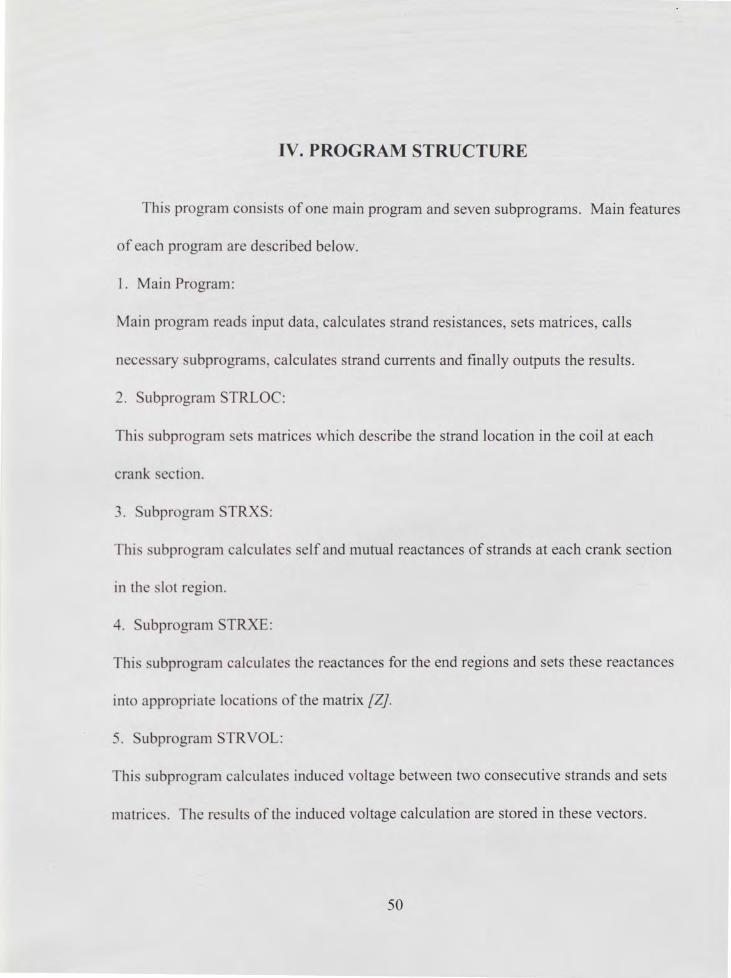
IV. PROGRAM STRUCTURE
Thi program consists of one main program and seven subprograms. Main features
of each program are described below.
1. Main Program:
Main program read input data calculates strand resistances, sets matrices, calls
n ce ary ubprograms calculates strand currents and finally outputs the results.
2. ubprogram STRLOC:
Thi ubpr gram et matrices which describe the strand location in the coil at each
crank ecti n.
ubpr gram TR.XS:
Thi ubpr gram cal ulate elf and mutual reactances of strands at each crank section
in th I t r gi n.
4. ubpr gram STRXE:
Thi ubprogram calculates the reactances for the end regions and sets these reactances
into a ppr priat location of the matrix [Z}.
. Subprogram STRVOL:
Thi ubprogram alculate induced voltage between two consecutive strands and sets
ma trice . Th r ult of the induced oltage calculation are stored in these vectors.
50

6. Subprogram SOLVER:
Thi ubprogram olves the complex simultaneous voltage difference equations.
7. Subprogram CSLOSS:
Thi ubprogram calculates the cross slot flux and its associated losses in each strand.
51
TOP COIL OR
BOTTOM COIL
#OF TRANSPOSITION
SECTIONS
#OF STRANDS
DATA
SET[Z] FOR RESISTANCE
L SUB: STRLOC
SUB: STRXS
SET [Z] FOR REACTANCE
L_ _____ _
SUB: STRVOL
STRXE SUB: STRVOL
SUB: SOLVER
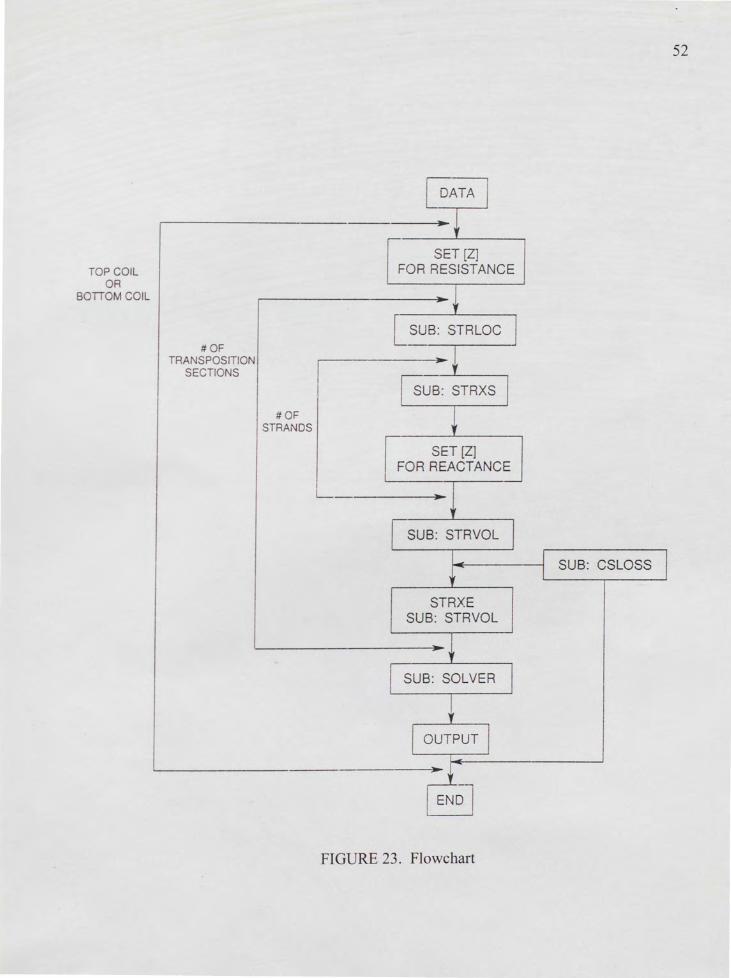
FIGURE 23. Flowchart
52
SUB: CSLOSS

CALCULATION VS TEST VALVES
Thi chapter demonstrates the validity of the methods discussed in this thesis by
comparing the results calculated by the program described in the previous chapter to
tho e mea ured during factory test. The program uses individual strand currents, and
cro lot internal trand losses to determine the total cross slot flux losses. These
lo tog th r with the additional losses calculated by other programs (I2R) are inputs
int a t mp ratur calculation program. This temperature program calculates the
t mp rature for ach trand and ent tube in the stator coil.
re placed at the end of the core and the end of the coil since these
are u uall th h tt pot in th coil [ 15]. The end of the core is a potential hot spot
b cau th trand lo in ten ity is the highest in the slot, and the end of the coil is a
p t ntial h t pot b cau e the ga ' is the hottest at this point which in tum pushes the
copper t mperatur up. In addition to these two potential hot spots, five other
th rm c upl r placed at various axial lengths throughout the coil to develop a
m r accurat t mperature profile for validating the calculation. All axial locations are
r fi r nc d from the E citer End.
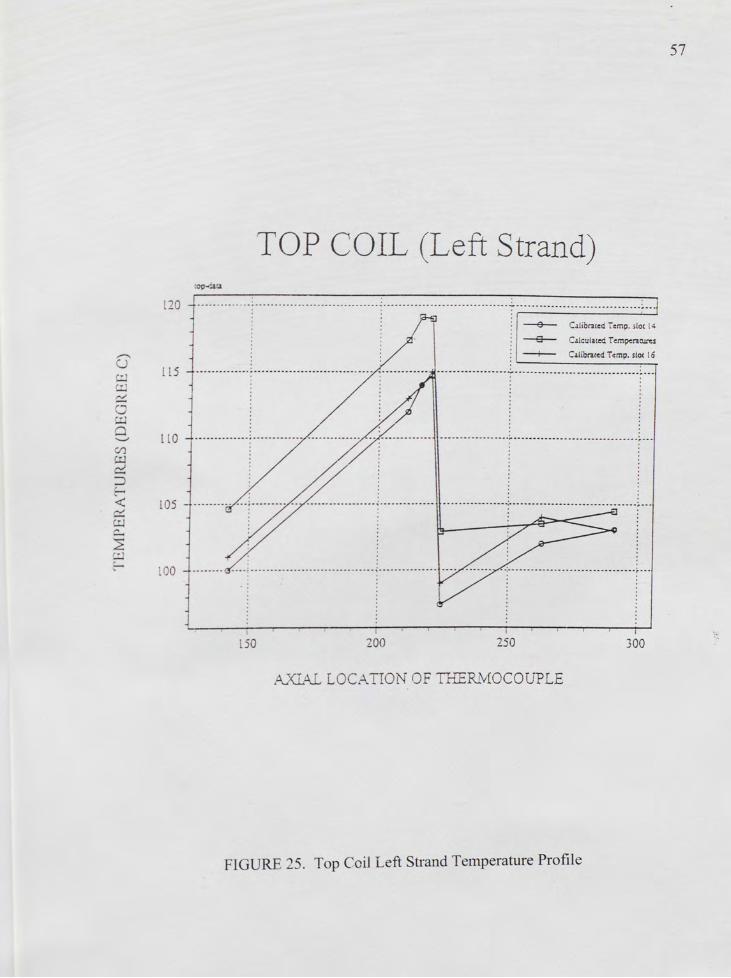
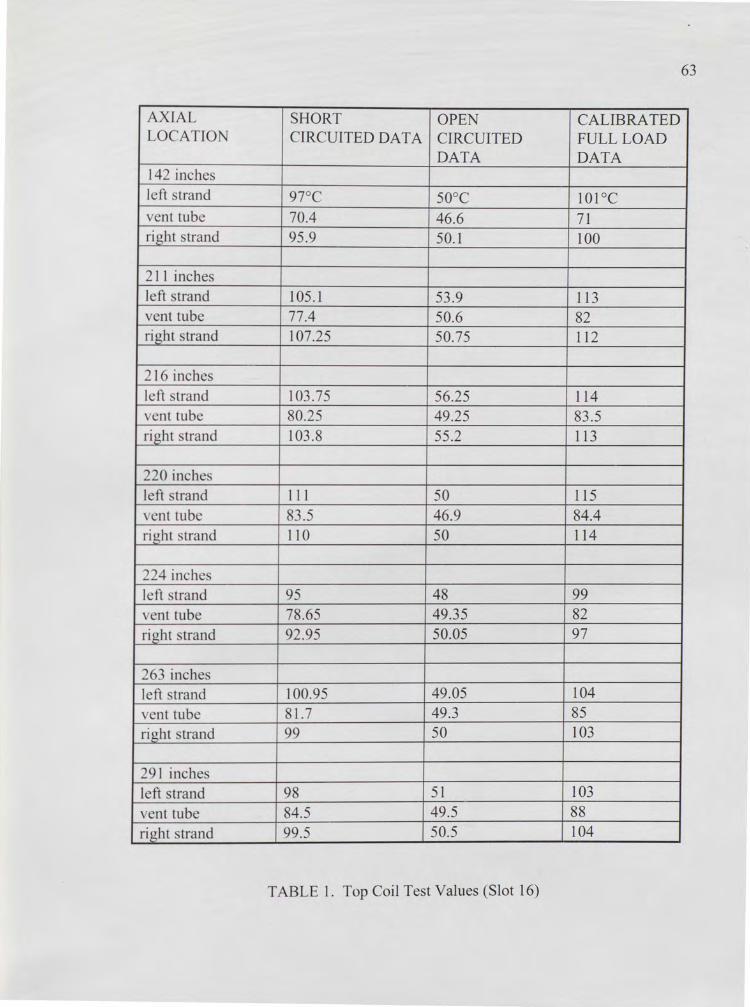
Top coil a ial thermocouple locations: 142",211 ",216",220",224",263",291"
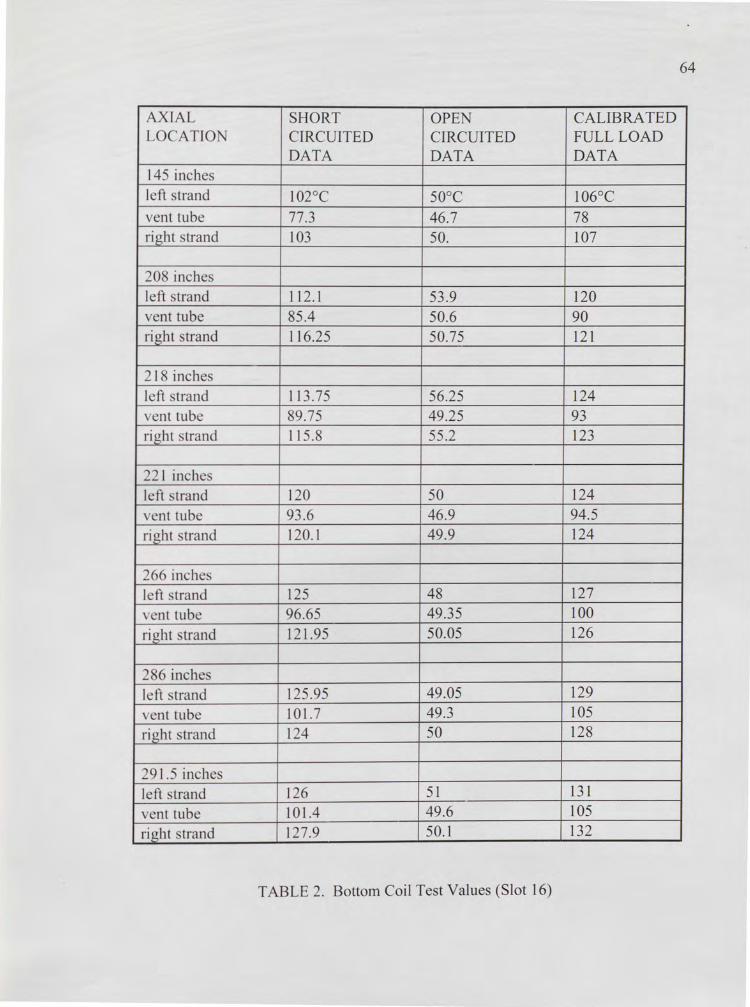
B ttom coil location : 145 '208'' 218",221 ,266",286",291 .5"
53

54
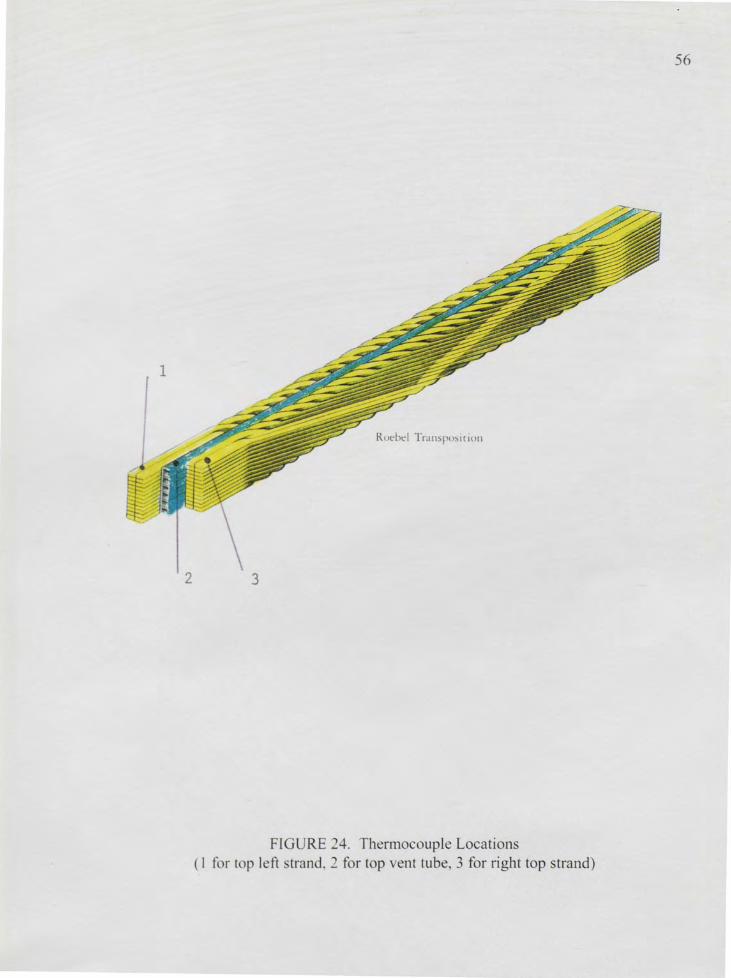
Three thermocouples were placed at each axial location mentioned above. Of the
three thermocouples, one was placed on the top left strand, one on the top vent tube, and
one on the top right strand (Figure 24). Thermocouples were installed at the same axial
location in lots 14 and 16. Temperatures in these two slots were expected to be
approximately identical because top and bottom coil currents in both slots were in phase
(all 4 coil were in the same phase group). Because of the redundant thermocouples
(two slot v one) there was a great deal of confidence in the tested data.
Th AC ynchronous generator tested was hydrogen inner-cooled, single tube stack,
720° ro bel tran po ition, rated at 285 MV A, 20KV, .85 power factor. The test was
c nduct d under both short circuited and open circuited conditions with cold gas
t mperatur f 46°C at 60 psig. Before the test the ambient temperatures were recorded
and tat r oil re i tanc s w re mea ured to ensure proper I2R loss calculations.
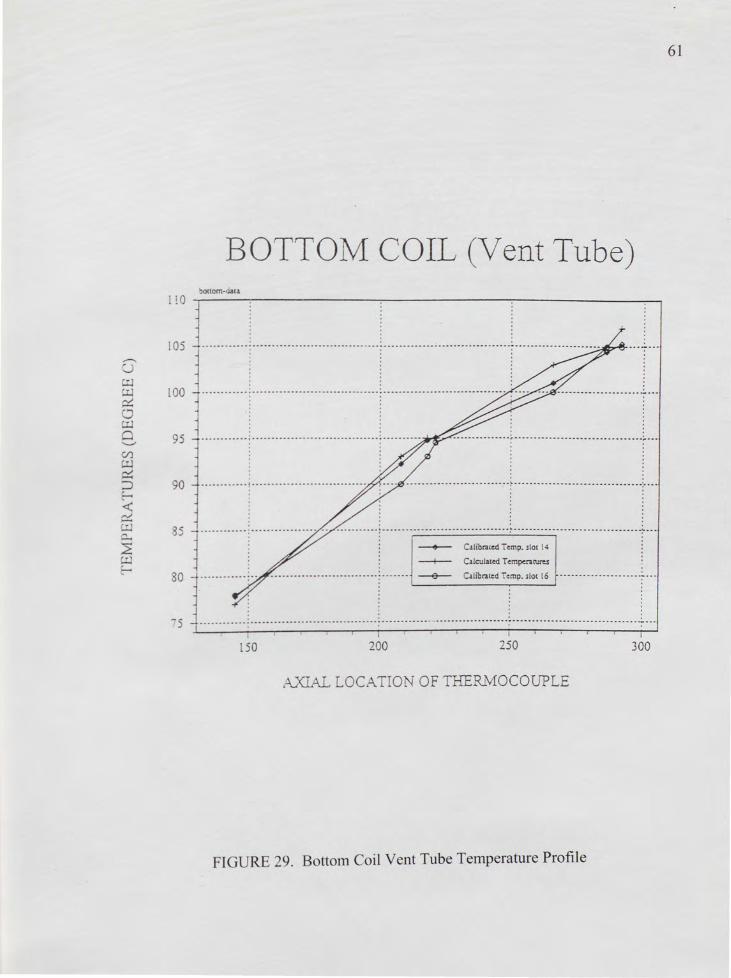
Tab] l and 2 ho the te ted values for open circuit and short circuit tests in slot
16. Th calibrat d full load temperatures were tabulated using the short circuit and open
ircuit t t data p r IEEE t t pr cedures for synchronous machines. Figures 25 through
0 how that the th nnocouple readings in slot 14 were within 2°C for top coils and 5°C
for bott m c il . Th refore, it i assumed that all thermocouples were reliable and
r ading correct] .
Initially th full load calculated data using the present (traditional) loss calculation
m thod wa compared to the calibrated full load test data. The maximum temperature

55
difference between the calibrated test values and the calculation values (traditional
m thod) wa found to be over 20°C (Table 3).
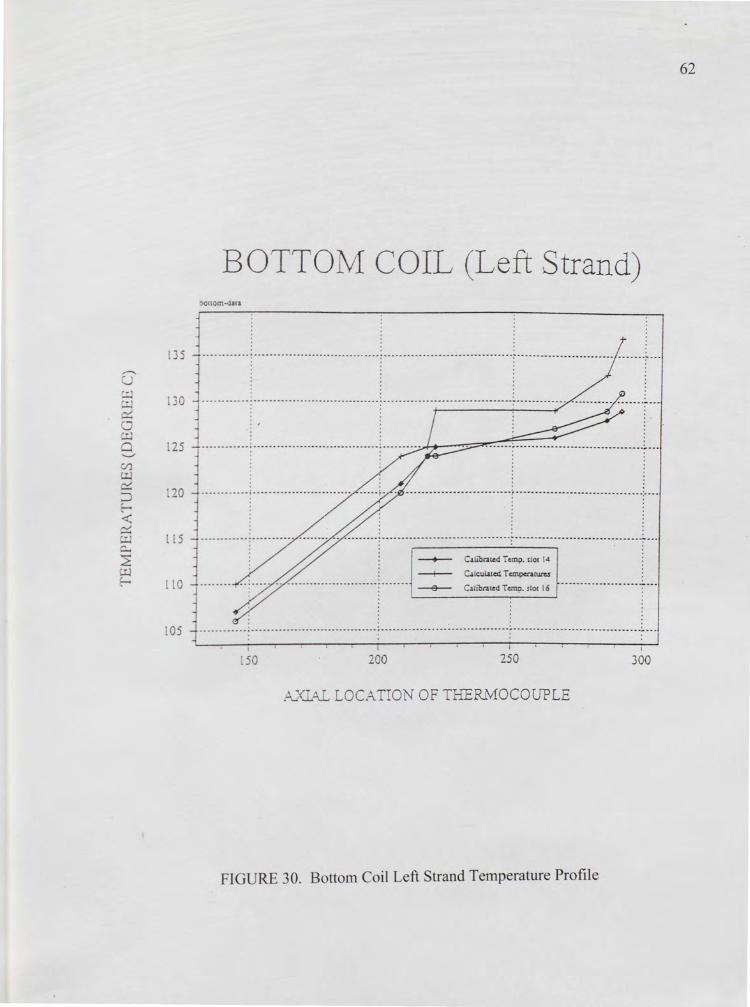
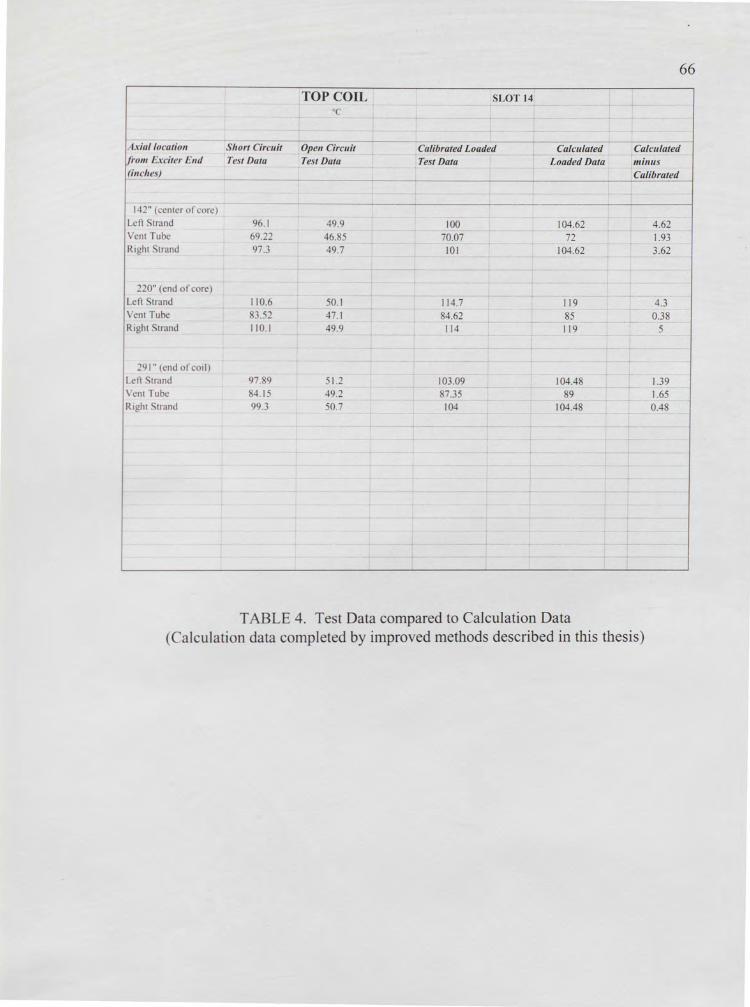
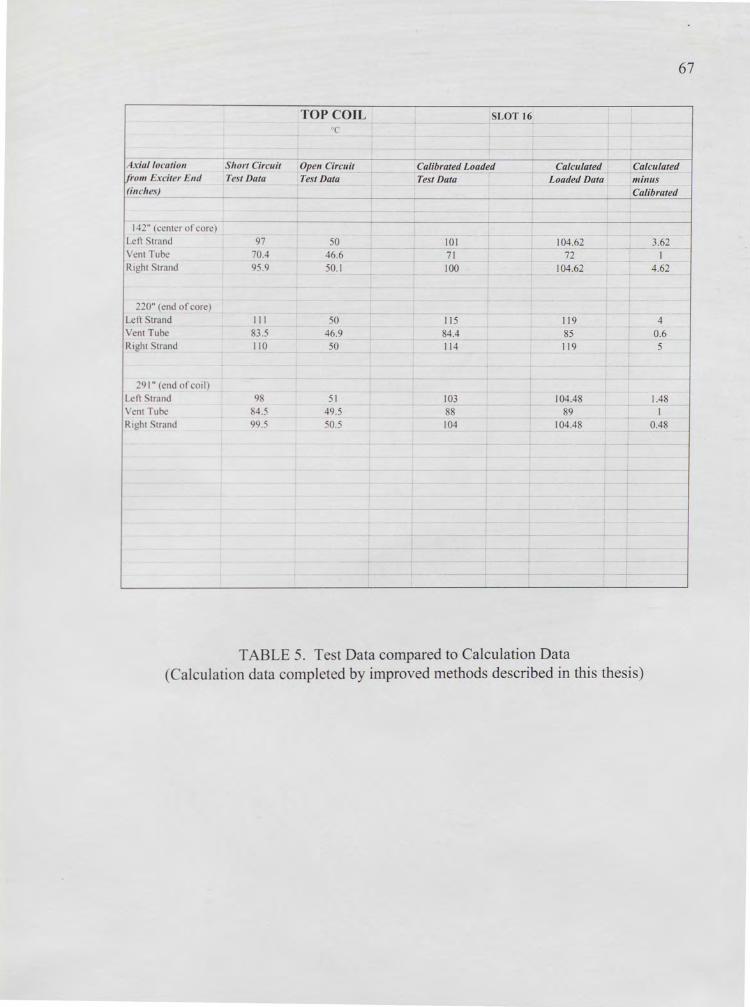
The loss calculations were repeated using the improved methods described in this
the is. The calibrated full loss test values compared to these new calculated full load
te t value showed significantly more accurate results. Temperature differences
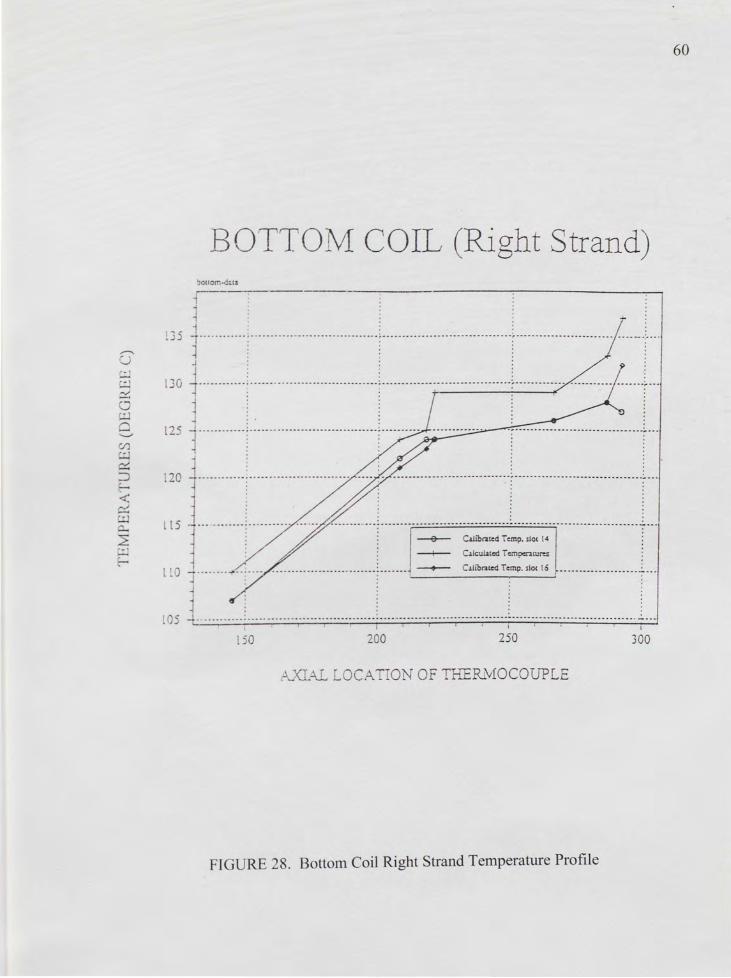
between test and calculated data for the top coils was less than 5°C; and less than 10°C
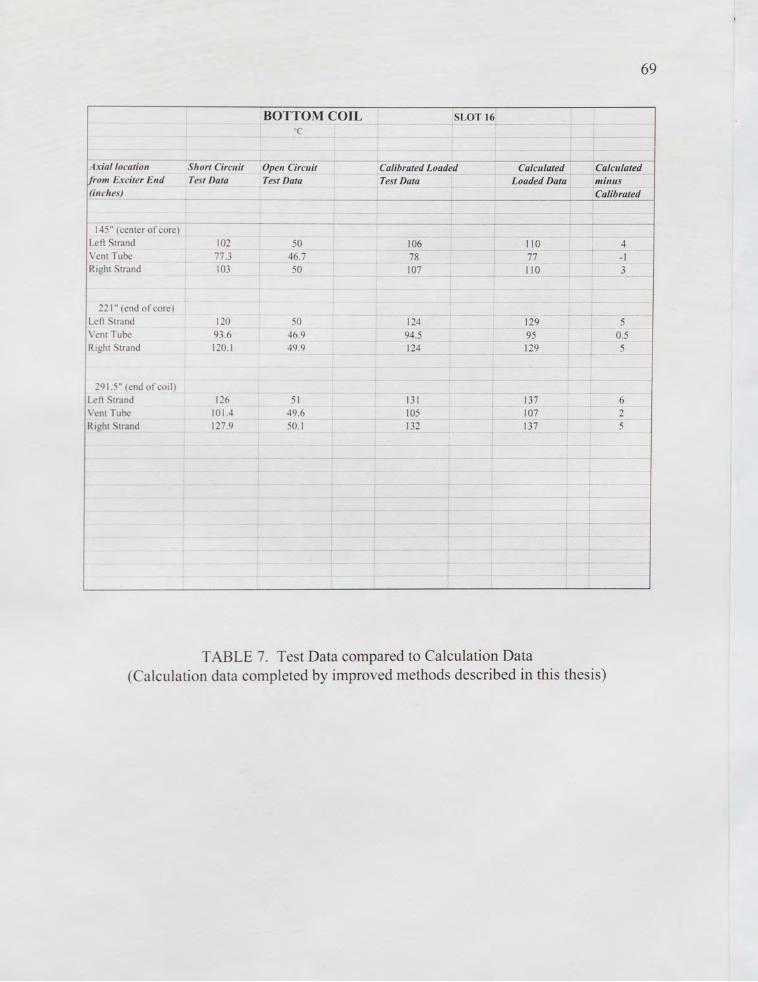
for the bottom coil (Tables 4-7). Most data points in the bottom coils were within 5°C
but one alue showed approximately a 10°C difference. The exact reason for this rather
igni ficant di crepancy in the bottom coil has not been determined at this time.
H we r thi di er pancy could be because of inconsistencies during manufacturing or
a mbly.
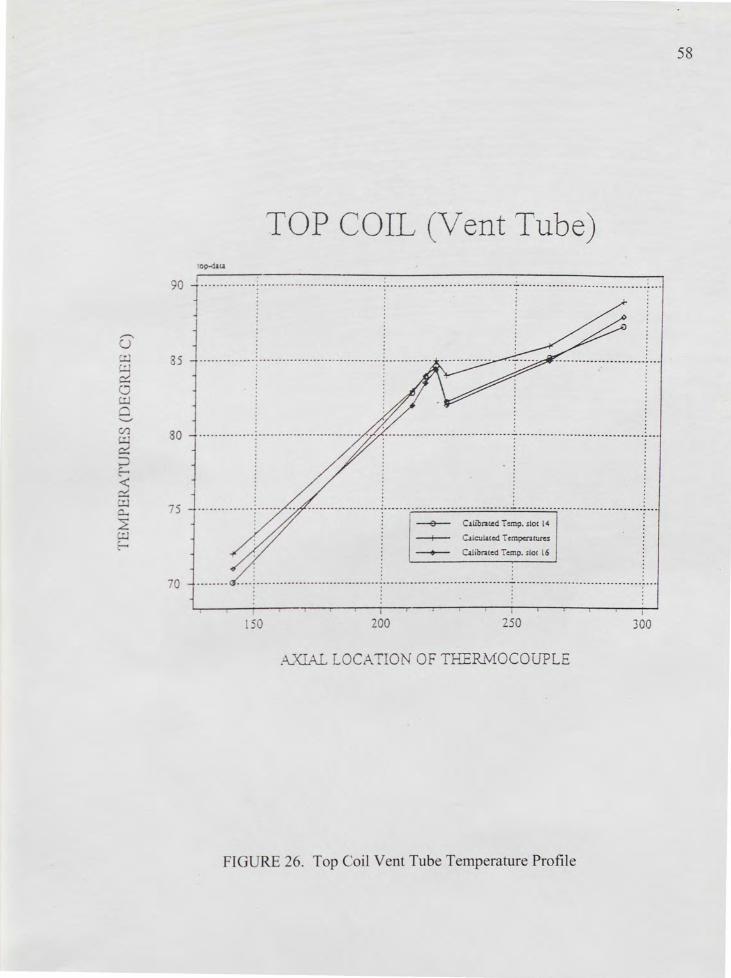
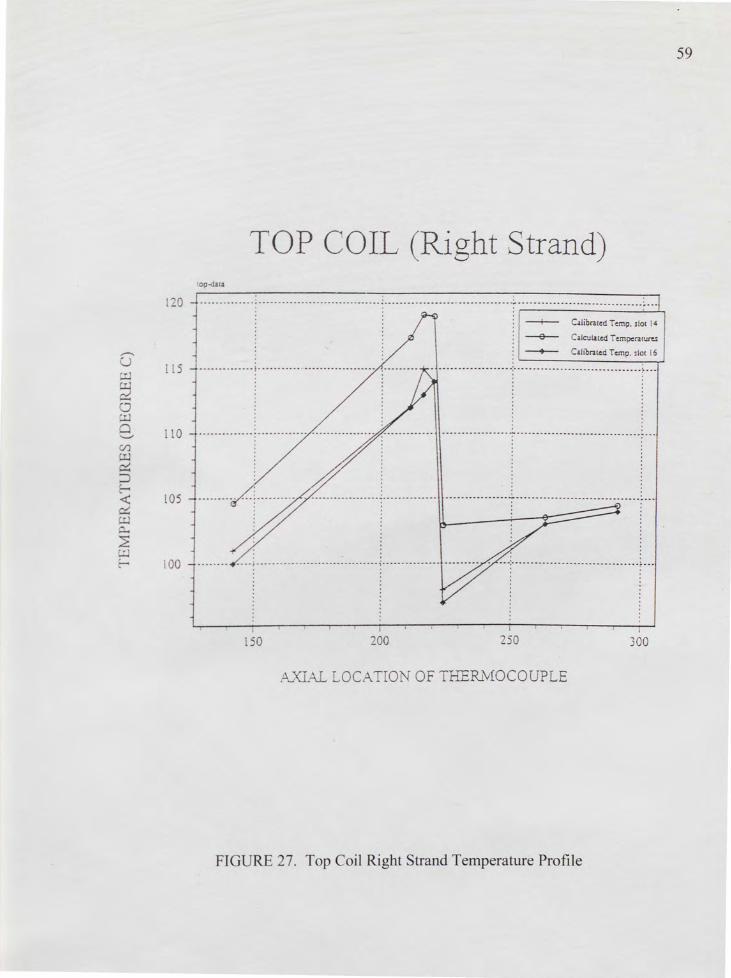
Figur 25 through 30 show the close temperature profile between test data and the
alculat d data (u ing impro ed loss calculation methods described in this thesis).
56
2 3
FIGURE 24. Thermocouple Locations ( I for top left trand, 2 for top vent tube, 3 for right top strand)
G ~ i:.:.J c::
:......
20
5
l l0
TOP COIL (Left Strand) op-<iat.t
-· --- .. . -- .. . -- .... ------ . ----- ---- ... -· -- . --... ~ ------. --- -- ·- -- -------· -·- -- ·-·~ ------ ............................................ -- ·--~--·
50 I
' ' : : ~ Calibrated Temp. sloe l4
! ----S-- Calculated Tempcratur!:.S
: -+--- Cllibraced Temp. sloe 16
... ················t················ ················~···
I
200 250 300
AXLA.L LOCATIOt - OF TI-IERJ.\10COUPLE
FIGURE 25. Top Coil Left Strand Temperature Profile
57
G r ,...... ~ c:::
Cl)
~ 2 ~ ~ :.:.J
85
80
75
0
58
TOP COIL (Vent Tube) lop-data
································ ~ ································: ...
--e-- C1libcated Temp. slot 14
-+-- C1lculaced T empcracurcs
~ Calibcaccd T cmp. sloe 16
. . . : : : : ' . . ' : : : :
200 250 300
.-.\)<IAL LOCATION OF THERMOCOUPLE
FIGURE 26. Top Coil Vent Tube Temperature Profile
~
~ 0 ~ C) ...__;
Cl)
59
TOP COIL (Right Strand) •op-data
110 ····· ······················· ... I . .. :
100 ········
I I
50 _oo 250 300
A...,'(L-\L LOCATIOr OF THERJvfOCOUPLE
FIGURE 27. Top Coil Right Strand Temperature Profile
G :.:J :.:..i
60
BOTTOM COIL (Right Strand) '.)OlC Om •d;:ca
25
: _o ·· ··· ····· ·· l··· ·· ·· ··· ············ ·· ·· ························)·································~···
' ' . . '
[) ... ······ ··:· ~ ;& : -&- Cilib~<odT•~p.do<I< ·· 1 ···
/ ! -+-- Calculated Tcmpc:ncures ;
~0 -- ········ -f'··· ·· ·· ··· · ···· · ···· · ····· · ······· : ··· · ··· ~ C.1libratedTemp.1lo< 16 ····················-···
... .. . . -. ... - .. .. --.. . -- .. - ... - .. -....... .. .. -·- ... .. ....... - ' . .. .. ---- -- ·-- ....... - .. -- ........... ·--- ...... ---- --·-----. --- -- .... -- .. . .... .. I ' ' I ' • • •
\jO 200 250 300
~ X ·_.\L LOCA T O OF THERLvfOCOUPLE
FIGURE 28. Bottom Coil Right Strand Temperature Profile
G c:.J c..:..l ~
c..:..l 0 .........,, C/)
61
BOTTOM COIL (Vent Tube) ~oncm•oata
I ta -,------:-----------:--------;------------,
95 ----. -------; -. -----.. ----.. --. --.. ---------. -- ~ ---.. -. ---. ' ' ···············1 ····· ····························i ...
90
5 J ············I················· ·· ···········I······· ·~·· ~::::::::~::························r··· 0 , ··················· ·· ·······: ....... ~ C1libra1cdTcmp.slo1 l6 ·····················-·· ·
I
50 200 250 300
A.1'GAL LOCATION OF THERMOCOUPLE
FIGURE 29. Bottom Coil Vent Tube Temperature Profile
62
BOTTOM COIL (Left Strand) ouom•Oa<a
lJ 5 i ···. ········: ····························· .... ; ..... ····························~························· ....... ~ .. . : : : :
JO ....•..•.... : ...............•.........•.•..•.• / •.. ..•.•.•••.•••.•.•......••••... l ............. ··········· ······'··· ·· 25 !' L-~~~~=~ i --.... - ... --..... : .. -.... --.................... ....... --- .. --- .. -: .. --- .. -...... - . . . -.. ---.. ~ ...... --................ -................................... _ .... . . . . . . . . .
20 ············ ·············~·r············· ····················r···
5
,;___,
.. : ... ··A I -- c,u,~~,T,mo ,1,. ,, • LL ; -- C.tcu•<"1Tonponru,u I 0 i········ '·· ;·· ··· .. ························!······· --a-- C.itibratedTc:.mp.slo< 16 ····················~···
: l l : l05 ············ i································· f ·································~································+···
' ' , , I ' • ' '
.50 200 250 300
A..XlA..L LOCAT 0. ~ OF THERMOCOUPLE
FIGURE 30. Bottom Coil Left Strand Temperature Profile
63
AXlAL SHORT OPEN CALIBRATED LOCATION CIRCUITED DAT A CIRCUITED FULL LOAD
DATA DATA 142 inche left trand 97°c 50°C 101 °C v nt tube 70.4 46.6 71 right trand 95.9 50.1 100
211 inches left strand 105.1 53.9 113 vent tube 77.4 50.6 82 right strand 107.25 50.75 112
216 inche I ft trand 103.75 56.25 114 v nt tube 80.25 49.25 83.5 right trand 103.8 55.2 113
220inch I ft trand 111 50 115
nt tub 3.5 46.9 84.4 right trand 110 50 114
224 inche l ft trand 95 48 99
nt tub 78.65 49.3 5 82
right trand 92.95 50.05 97
26 inche I ft trand 100.95 49.05 104
nt tub 81.7 49.3 85
right trand 99 50 103
291 inche l ft trand 98 51 103
ent tub 84.5 49.5 88
right trand 99.5 50.5 104
TABLE 1. Top Coil Test Values (Slot 16)
64
AXIAL SHORT OPEN CALIBRATED LO ATION CIRCUITED CIRCUITED FULL LOAD
DATA DATA DATA 145 inch s I ft trand 102°c 50°C 106°C
vent tube 77.3 46.7 78 right strand 103 50. 107
208 inches left trand 112.1 53.9 120 vent tube 85.4 50.6 90 right trand 116.25 50.75 121
218 inche left trand 113.75 56.25 124
nt tub 89.75 49.25 93 right trand 115.8 55.2 123
221 inch I ft trand 120 50 124
nt tub 93.6 46.9 94.5
right trand 120.1 49.9 124
266 in h I ft trand 125 48 127
nt tub 96.65 49.35 100
right trand 121.95 50.05 126
2 6inche I ft trand 125.95 49.05 129
nt tube 101.7 49.3 105
right trand 124 50 128
291.5 inche I ft trand 126 51 131
nt tube 101.4 49.6 105
right trand 127.9 50.1 132
TABLE 2. Bottom Coil Test Values (Slot 16)

OLD METHOD BOTTOM COIL SLOT 16 oc
Axial location Short Circuit Open Circuit Calibrated Loaded Calculated 'rom Ei::citer End Test Data Test Data Test Data Loaded Data
(ind,e)
142" (center of core) Left trand 97 50 IOI 123 Vent Tube 70.4 46.6 71 81 Right trand 95.9 50.1 100 123
220" (end of core) Left trand 111 50 115 130
ent Tube 3.5 46.9 84.4 88 Righ t trand 110 50 114 130
~91" (end ore ii) Left trand 98 51 103 122 Vent Tube 4.5 49.5 95 Right . trand 99.5 50.5 104 122
TABLE 3. Test Data compared to Calculated Data Calculated data completed by traditional methods { old methods})
65
Calculated minus Calibrated
22 10 23
15 3.6 16
19 7 18
66
TOP COIL SLOT 14 +-cc
Axial /ocatio11 Short Circuit Open Circuit Calibrated loaded Calculated Calculated rom txciter End Test Data Test Data Test Data Loaded Data minus
(inches) Calibrated
142" (center of ore) Left . trand 96.1 49.9 100 104.62 4.62
ent Tub 69.22 46.85 70.07 72 1.93 Right lrand 97.3 49.7 IOI 104.62 3.62
220" (end f core) Left lrand 110.6 50. 1 114.7 119 4.3
ent Tube 3.52 47.1 84.62 85 0.38 Right 1rand 110.1 49.9 114 119 5
291" (entl f coil) Left trand 97. 9 51.2 103.09 I 04.48 1.39 Vent Tube -I . I 49.2 7.35 89 1.65 Right trantl 99.3 50.7 104 I 04.48 0.48
TABLE 4. Test Data compared to Calculation Data alculation data completed by improved methods described in this thesis)
67
TOP COIL SLOT 16 -' C
Axial loc:atio11 Short Circuit Open Circuit Calibrated Loaded Calculated Calculated rom Exciter End Test Data Test Data Test Data Loaded Data minus
(inches) Calibrated
142" (center of core) Left trand 97 50 IOI 104.62 3.62
ent Tube 70.4 46.6 71 72 I Right trand 95 .9 50.1 100 104.62 4.62
220" (end of core) Left trand Ill 50 115 l 19 4
ent Tube 3.5 46.9 84.4 85 0.6 Right trand II 0 50 114 I 19 5
_9l"(endofc Ii)
Left . trand 9 51 103 l 04.48 1.48 \'ent Tube 4.5 49 .5 8 89 I
Right , trand 99 . ~ 50.5 104 I 04.48 0.48
TABLE 5. Test Data compared to Calculation Data (Calculation data completed by improved methods described in this thesis)
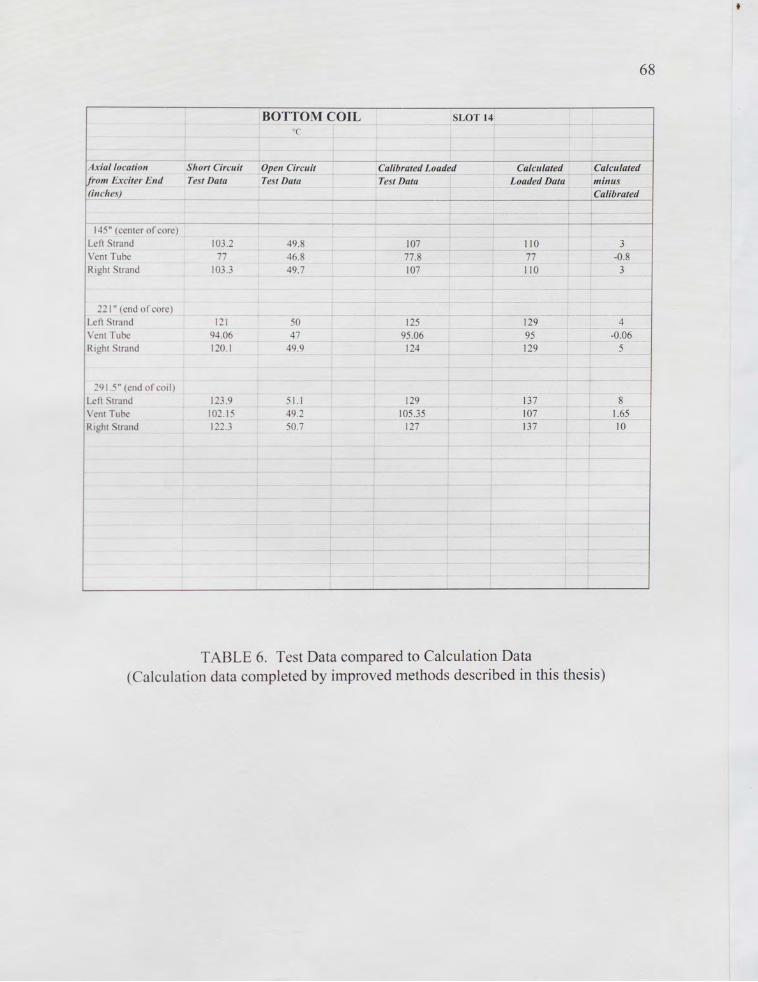
xial location rom Exciter End
(incl,e)
14 "(ccnLcrofcore)
Left . !rand
Vent Tube R1gh1 trand
221" (end ofc re)
Left trand
\'ent Tube R1ghL . trand
291 .5" end ofc ii)
Left . tram.I
Vent Tube Right . trand
Short Circuit Test Data
103.2 77
103 .3
121 94.06 120.1
123.9 10-. 1: 122.3
BOTTOM COIL
Open Circuit Test Data
49.8 46.8 49.7
-o 47
49.9
I.I 49.2 50.7
SLOT 14
Calibrated Loaded Test Data
107 77.8 107
125 95 .06 ]24
129 105 .35
127
Calculated Loaded Data
110 77 110
129 95 129
137 107 137
68
Calculated minus Calibrated
3 -0.8
3
4 -0.06
5
8 1.65 10
TABLE 6. Test Data compared to Calculation Data (Calculation data completed by improved methods described in this thesis)
69
BOTTOM COIL SLOT 16 oc
Axial loc:atio11 Short Circuit Open Circuit Calibrated Loaded Calculated Calculated rom Exciter End Te t Data Test Data Test Data Loaded Data minus
(i11c:hes) Calibrated
1-l.:-" (cent r of core)
Left, trand 102 50 106 110 4 \ ent Tube 77.3 46.7 78 77 - I Right trand 103 50 107 110 3
~21" (end ofc re)
Left , trand L .. O 50 124 129 5 \ 'ent Tube 93.6 46.9 94.5 95 0.5 R1gh1 . trand 120.1 49 .9 124 129 5
_91.5" (end of coil)
Lcf1 . 1rand 126 51 131 137 6 \ 'en! Tube 101.4 49.6 105 107 2 R1gh1 . 1rand 127.9 50.1 132 137 5
TABLE 7. Test Data compared to Calculation Data (Calculation data completed by improved methods described in this thesis)
CONCLUSION
A the power industry strive to increase overall plant efficiencies, there tends to be a
growing demand for more efficient electric generators. A major limiting factor in
determining the maximum rating of an electric generator is the hot spot temperatures
located in the stator coils. To try and meet the demand for more efficient electric
g n rator new tator coil designs are being manufactured.
ing th pr ent method of calculating hot spot temperatures on the recently
d ign d t t machine refereed to in this thesis showed a difference in calculated vs
t d temp ratur of 7 to 23°C. This large temperature difference requires that the
machin b d rat d to n ure that it operates properly throughout its design life;
th refore th ma hine is not being used to its full potential and therefore is not as
ffi ient a it could be.
Th purpo of thi thesis was to develop a more accurate method of calculating hot
p t t mp rature by more accurately calculating the cross slot flux and its associated
lo e . Unlik pa t calculations which used average cross flux in all cross slot flux loss
calculation thi the i de eloped the individual cross slot flux for each strand in the
roebeJ bar th r for more accurately calculating its associated losses and circulating
urr nt . Th r ults of using the improved method developed in this thesis were very
70

71
po itive. The temperature difference between tested and calculated values were
between 2 to l 0°C. This is a substantial improvement (two hundred percent better)
from th result using the present (traditional) calculation methods.
Although very positive, this calculation method was verified with only one type of
roebel transposition (720° roebel) and was tested on only one machine. The improved
m thod described in the paper can be applied to various roebel transpositions with solid
end connections· but more tests should follow to identify all the practical applications
for the e impro ed cro s slot flux loss calculations. The effects of radial flux were
a urned n gligible for this application because of the distance of the top coil below the
tat r b re. Howe r radial flux and its effects on the cross slot flux should be
in tigat d for Iarg r machines where the radial flux becomes very significant. Also,
ma hin v ithout n connections such as water cooled coils, have significant roebel
I bar circulating currents and provisions to more accurately calculate these
h uld b con idered.
REFERENCES
[ 1]. American ational Standard for Rotating Electrical Machinery, "Cylindrical-Rotor Synchronous Generators", ANSI C50.13-1989
[2]. G. eidhoefer 'Roebel Bar Windings for Large Synchronous Machines", BBC Re iew Vol. 57 January 1970
[3]. A.E. Fitzgerald Charles Kingsley Jr., Stephen D. Umans, Electric Machinery, McGraw-Hill ew York Y, 1983
[ 4]. Am rican ational Standard "General Requirements for Synchronous Machines", IC 0.10-1977
[ ]. B .J. B nni ngton Eddy Currents in a Transposed Turbo-Generator Coil Side, Short ircuit d at Each End Westinghouse Internal Technical Report 371, 1967
[6]. William H. Timbie Vannevar Bush, Principles of Electrical Engineering, John ii & on 1947
[7]. W.L. Ringland L.T. Rosenberg 'A ew Stator Coil for Large Machines", AIEE Tran acti n (Power Apparatus and Systems) Vol 78, Oct. 1959
[ ]. R.E. Gilman Eddy Current Losses in Armature Conductors", AIEE Transactions PO\ r pparatu and Systems)· Vol. 39 1920· continued in Vol 43, 1924
[9]. B.J. B nnington W.C. Brenner "Transpositions in Turbogenerator Coil Sides h rt ircuit d at Each End IEEE PAS Vol PAS-89 #8, Nov/Dec 1970
[ 1 OJ. M. Mat u aki, Theory of Eddy Current Calculation in a Turbo-Generator Stator oil Sid Short-Circuited at Each End" Westinghouse Internal Technical Report 87025,
19 7
[ 11]. E.I. King, 'Equivalent Circuits for Two-Dimensional Magnetic Fields", IEEE PAS Vol PAS-85, #9 Sept 1966
72
[ 12]. M. Matsu aki, "Current Distribution in a Turbo-Generator Stator Coil Side with Variou Transpositions", Westinghouse Internal Technical Report 87095, 1987
[ 13]. A. Pro le "The Influence of Deep Bar Losses in Design of Stator Coils", Westinghou e Internal Technical Paper, 1988
[14]. M. f eli K. Reichert, G. Neidhofer, "Calculation of Current Distribution and Stray Lo ses in Arbitrarily Transposed Stator Coils", International Conference on Electric Machines, Pisa, Italy, Proceedings Vol II, 1988.
[ 15]. K.M. Sochats, "Waterwheel RTD Temperature Prediction Program", We tinghou e Internal Technical Report 489, 1971.
[ 16]. Institute of Electrical and Electronics Engineers, "Test Procedures for Synchronou Machines", IEEE Std 115-1983.
73