Cadmium and other heavy metal concentrations in bovine kidneys in the Republic of Ireland
9
Cadmium and other heavy metal concentrations in bovine kidneys in the Republic of Ireland Mary J. Canty a,b , Aiden Scanlon c , Daniel M. Collins a , Guy McGrath a , Tracy A. Clegg a , Elizabeth Lane a,b , Michael K. Sheridan c , Simon J. More a, ⁎ a Centre for Veterinary Epidemiology and Risk Analysis (CVERA), UCD School of Veterinary Medicine, University College Dublin, Belfield, Dublin 4, Ireland b Department of Agriculture, Food and the Marine, Backweston Campus, Celbridge, Co. Kildare, Ireland c Department of Agriculture, Food and the Marine, Agriculture House, Kildare St, Dublin 2, Ireland HIGHLIGHTS • An estimated 15% of Irish soils exceed the EU Cd threshold limit of 1 mg/kg. • 11.3% of cattle had kidney Cd concentrations in excess of the EU ML of 1 mg/kg. • Age, soil Cd concentrations and region were key predictors of elevated kidney Cd. • Kidneys of most Irish cattle under three years of age will conform with EU requirements. abstract article info Article history: Received 17 January 2014 Received in revised form 10 March 2014 Accepted 16 March 2014 Available online 12 April 2014 Editor: F.M. Tack Keywords: Cadmium Heavy metals Bovine kidneys Ireland In Ireland, an estimated 15% of Irish soils exceed the EU threshold limit for soil Cd of 1 mg/kg. The aim was to de- termine the concentrations of Cd and other heavy metals (As, Hg and Pb) in kidneys collected from cattle at slaughter. Systematic sampling of eligible animals (animals that were born and reared until slaughter in the same Irish county) at the time of slaughter was conducted, until a threshold number of animals from all 26 counties and 6 age categories was reached. A predictive surface of soil Cd was generated, by kriging the Cd values of 1310 previously reported soil samples. A linear regression weighted model was developed to model kidney Cd concentration, using the risk factors of age, sex, breed, province and estimated soil Cd concentration. Kidney Cd (n = 393) concentrations varied between 0.040 and 8.630 mg/kg wet weight; while concentrations of As, Hg and Pb were low. The estimated weighted proportion of animals with a high (≥1 mg/kg) kidney Cd concentra- tion was 11.25% (95% CI: 8.63–14.53%). Key predictors for high kidney Cd concentration were soil Cd, animal age and province. At a soil Cd concentration of 1.5 mg/kg, it was predicted that an age threshold to avoid exceeding a kidney Cd concentration of 1 mg/kg in most animals would be ~3 y in Connacht, N 4 y in Ulster, and N 5 y in Leinster and Munster. In naturally occurring areas of high Cd levels in soils in Ireland, the Cd level in bovine kidneys can exceed the current EU ML of 1 mg/kg in older animals. Kidneys of most cattle under three years of age will conform with EU requirements. © 2014 The Authors. Published by Elsevier B.V. This is an open access article under the CC BY license (http://creativecommons.org/licenses/by/3.0/). 1. Introduction Cadmium (Cd) is a naturally occurring heavy metal that is also emit- ted as part of industrial pollution. It has no known biological function in either animals or humans but mimics the actions of other divalent metals that are essential to diverse biological functions (EFSA Panel on Contaminants in the Food Chain, 2009). Cd is an environmental contam- inant that is readily taken up by plants and, through feed intake, is fur- ther transferred to animals (Waegeneers et al., 2009a). In animals, Cd is not easily cleared by the cells, and the poor efficiency of cellular export systems explains the long residence time of this element in storage tis- sues such as the intestine, the liver and the kidneys (EFSA Panel on Contaminants in the Food Chain, 2009). It is for this reason that older animals have higher liver and kidney Cd concentrations (Nriagu et al., 2009), even if the concentrations of Cd in their diets and water are low. The highest concentrations of Cd in topsoil in Europe occurs in Ireland, England, the western Alps and southern France, the Belgian– Science of the Total Environment 485–486 (2014) 223–231 ⁎ Corresponding author. Tel.: +353 1 716 6071. E-mail addresses: [email protected] (M.J. Canty), [email protected] (A. Scanlon), [email protected] (D.M. Collins), [email protected] (G. McGrath), [email protected] (T.A. Clegg), [email protected] (E. Lane), [email protected] (M.K. Sheridan), [email protected] (S.J. More). http://dx.doi.org/10.1016/j.scitotenv.2014.03.065 0048-9697/© 2014 The Authors. Published by Elsevier B.V. This is an open access article under the CC BY license (http://creativecommons.org/licenses/by/3.0/). Contents lists available at ScienceDirect Science of the Total Environment journal homepage: www.elsevier.com/locate/scitotenv
-
Upload
independent -
Category
Documents
-
view
1 -
download
0
Transcript of Cadmium and other heavy metal concentrations in bovine kidneys in the Republic of Ireland
Science of the Total Environment 485–486 (2014) 223–231
Contents lists available at ScienceDirect
Science of the Total Environment
j ourna l homepage: www.e lsev ie r .com/ locate /sc i totenv
Cadmium and other heavymetal concentrations in bovine kidneys in theRepublic of Ireland
Mary J. Canty a,b, Aiden Scanlon c, Daniel M. Collins a, Guy McGrath a, Tracy A. Clegg a, Elizabeth Lane a,b,Michael K. Sheridan c, Simon J. More a,⁎a Centre for Veterinary Epidemiology and Risk Analysis (CVERA), UCD School of Veterinary Medicine, University College Dublin, Belfield, Dublin 4, Irelandb Department of Agriculture, Food and the Marine, Backweston Campus, Celbridge, Co. Kildare, Irelandc Department of Agriculture, Food and the Marine, Agriculture House, Kildare St, Dublin 2, Ireland
H I G H L I G H T S
• An estimated 15% of Irish soils exceed the EU Cd threshold limit of 1 mg/kg.• 11.3% of cattle had kidney Cd concentrations in excess of the EU ML of 1 mg/kg.• Age, soil Cd concentrations and region were key predictors of elevated kidney Cd.• Kidneys of most Irish cattle under three years of age will conform with EU requirements.
⁎ Corresponding author. Tel.: +353 1 716 6071.E-mail addresses: [email protected] (M.J.
[email protected] (A. Scanlon), [email protected] (G. McGrath), [email protected] ([email protected] (E. Lane), michael.sherid(M.K. Sheridan), [email protected] (S.J. More).
http://dx.doi.org/10.1016/j.scitotenv.2014.03.0650048-9697/© 2014 The Authors. Published by Elsevier B.V
a b s t r a c t
a r t i c l e i n f oArticle history:Received 17 January 2014Received in revised form 10 March 2014Accepted 16 March 2014Available online 12 April 2014
Editor: F.M. Tack
Keywords:CadmiumHeavy metalsBovine kidneysIreland
In Ireland, an estimated 15% of Irish soils exceed the EU threshold limit for soil Cd of 1 mg/kg. The aimwas to de-termine the concentrations of Cd and other heavy metals (As, Hg and Pb) in kidneys collected from cattle atslaughter. Systematic sampling of eligible animals (animals that were born and reared until slaughter in thesame Irish county) at the time of slaughter was conducted, until a threshold number of animals from all 26counties and 6 age categorieswas reached. A predictive surface of soil Cdwas generated, by kriging the Cd valuesof 1310 previously reported soil samples. A linear regression weighted model was developed to model kidneyCd concentration, using the risk factors of age, sex, breed, province and estimated soil Cd concentration. KidneyCd (n= 393) concentrations varied between 0.040 and 8.630 mg/kgwet weight; while concentrations of As, Hgand Pb were low. The estimated weighted proportion of animals with a high (≥1 mg/kg) kidney Cd concentra-tion was 11.25% (95% CI: 8.63–14.53%). Key predictors for high kidney Cd concentration were soil Cd, animal ageand province. At a soil Cd concentration of 1.5 mg/kg, it was predicted that an age threshold to avoid exceeding akidney Cd concentration of 1 mg/kg in most animals would be ~3 y in Connacht, N4 y in Ulster, and N5 y inLeinster and Munster. In naturally occurring areas of high Cd levels in soils in Ireland, the Cd level in bovinekidneys can exceed the current EU ML of 1 mg/kg in older animals. Kidneys of most cattle under three years ofage will conform with EU requirements.
© 2014 The Authors. Published by Elsevier B.V. This is an open access article under the CC BY license(http://creativecommons.org/licenses/by/3.0/).
1. Introduction
Cadmium (Cd) is a naturally occurring heavymetal that is also emit-ted as part of industrial pollution. It has no known biological function ineither animals or humans but mimics the actions of other divalent
Canty),[email protected] (D.M. Collins),. Clegg),[email protected]
. This is an open access article under
metals that are essential to diverse biological functions (EFSA Panel onContaminants in the Food Chain, 2009). Cd is an environmental contam-inant that is readily taken up by plants and, through feed intake, is fur-ther transferred to animals (Waegeneers et al., 2009a). In animals, Cd isnot easily cleared by the cells, and the poor efficiency of cellular exportsystems explains the long residence time of this element in storage tis-sues such as the intestine, the liver and the kidneys (EFSA Panel onContaminants in the Food Chain, 2009). It is for this reason that olderanimals have higher liver and kidney Cd concentrations (Nriagu et al.,2009), even if the concentrations of Cd in their diets and water are low.
The highest concentrations of Cd in topsoil in Europe occurs inIreland, England, the western Alps and southern France, the Belgian–
the CC BY license (http://creativecommons.org/licenses/by/3.0/).

224 M.J. Canty et al. / Science of the Total Environment 485–486 (2014) 223–231
German border, south Sardinia, eastern Italy, Slovenia, Croatia, Albaniaand Greece. High Cd concentrations inmost of these areas are the resultof intensive agricultural use of phosphate fertilisers and sewage sludge,except in Ireland, southern Sardinia and Poland and theGoslar district inGermany, where naturally occurring high concentrations are found(Pan et al., 2010).
In Europe, maximum limits (ML) for Cd in foodstuffs are set byCommission Regulation No. 1881/2006 (European Communities,2006), including bovine muscle, liver and kidneys. The regulatory MLfor Cd in bovine muscle, liver and kidneys are 0.05, 0.5 and 1.0 mg/kgwet weight, respectively. Several authors have highlighted high kid-ney Cd concentrations in cattle in contaminated agricultural areas, bothin Europe (including Belgium, Waegeneers et al., 2009a,b; theNetherlands, Spierenburg et al., 1988) and elsewhere (Farmer andFarmer, 2000). However, several studies have also highlighted difficul-ties in agricultural areas of Europe not exposed to industrial contamina-tion (Andersen andHansen, 1982;Waegeneers et al., 2009a,b; Bilandžićet al., 2010). As an example, the European maximum concentration forCd in kidneys was exceeded in 47% of kidneys from Belgian cattle raisedin uncontaminated areas (Waegeneers et al., 2009b), leading these au-thors to conclude that the CdML in the EU is realistic in Belgiumonly forcattle up to 2 years of age (Waegeneers et al., 2009a). CommissionRegulation No. 1881/2006 also specifies a ML for lead (Pb) in bovinekidneys (0.5 mg/kg wet weight), but not arsenic (As) or mercury (Hg).
In Ireland, it is estimated that 15% of Irish soils exceed the EU thresh-old limit for soil Cd of 1 mg/kg, particularly in counties Dublin, Meath,Kildare, Westmeath, north Tipperary and Roscommon (Fay et al.,2007), attributable to the chemical composition of limestone in theseareas. As yet, however, there is limited understanding of Cd concentra-tions in Irish cattle at the time of slaughter. The primary objective of thisstudy was to determine the concentration of Cd in kidneys collectedfrom cattle at slaughter in Ireland. In addition, the kidney concentra-tions of some other important heavy metals (As, Hg and Pb) wereinvestigated.
2. Material and methods
2.1. Animal identification
In Ireland, all bovines are identified at birth in accordance with EUrequirements. The Animal Identification and Movement (AIM) systemis a centralised database, managed by the Department of Agriculture,Food and the Marine (DAFM), for the identification and movement ofall cattle in Ireland. There is significant animal movement withinIreland due to its geography and traditional rearing and trading pat-terns. Arising from this, many animals will spend their lives on morethan one farm and in different geographic regions of Ireland. For thisreason, an algorithmwas developed for use in AIM to identify cattle el-igible for inclusion in the study, being all animals that were born andreared until slaughter in the same county.
Systematic sampling was conducted in participating slaughter-houses, with samples being collected from eligible animals at the timeof slaughter, until a predefined number of animals from each county(26 counties) and age category (6 in total) had been reached. Thestudy was undertaken in two phases, focusing on animals N60 months,and on younger cattle (aged 18–60 months). In all counties exceptDublin, Kildare and Meath, approximately 12 animals were selected,being approximately 2 animals each in the age categories 18 to b24,24 to b30, and 30 to b36 months; 1 animal in each in the age categories36 to b48, and 48 to b60 months, and 4 animals in the age category≥60 months. In counties Dublin, Kildare and Meath, where a parallelstudy was being undertaken by DAFM horticulturalists, additionalbovine kidney samples were collected, and included in this study.In these three latter counties, a threshold of approximately 40 sampleswas used, being 8 animals each in the age categories 18 to b24, 24 tob30, and 30 to b36 months; 4 animals in each of the age categories 36
to b48, and 48 to b60 months, and 8 animals in the age category≥60 months. Samples were collected from 11 participating slaughter-houses in Ireland, from December 2010 to December 2012.
2.2. Sample collection
At each participating slaughterhouse, DAFM personnel notified theFood Business Operator (FBO) when an eligible animal was identified.Both kidneys were removed from each animal with a clean sterileknife and the fat coverings removed. Kidneys were stored in clean plas-tic bags at −20 °C until sectioning. A laboratory submission form wascompleted for each animal, and samples were sent to the DAFM Veteri-nary Public Health Regulatory Laboratory, Backweston Campus, Young'sCross, Celbridge, Co. Kildare, and stored at−20 °C until sectioning.
2.3. Sample analyses
Entire kidneys were allowed to partially thaw. Each kidney was sec-tioned twice at 90° to the long axis of the kidney, to create a 1 cmwidecross-section of the entire kidney including the renal hilum. The 1 cmwide sections from the left and right kidney from each animal werethen combined and sent on ice to the Food and Environmental ResearchAgency, Sand Hutton, York, United Kingdom for analyses. Samples werehomogenised before being digested and analysed using inductivelycoupled plasma-mass spectrometry (ICP-MS) with collision cell.Reagent blanks and reagent blanks spiked with known amount ofeach analyte were analysed with test samples for recovery estimatepurposes. All results were corrected for reagent blank and spike recov-ery. The limit of detection was calculated from 3 × standard deviationof reagent blank values adjusted for dilution and sample weight. Thelimit of quantification was calculated from 10 × standard deviation ofreagent blank values adjusted for dilution and sample weight. Heavymetal concentrations are all reported as mg/kg wet weight.
2.4. Data management and analysis
2.4.1. GeneralData were managed using Microsoft Excel (Microsoft Corporation,
Redmond, WA, USA). Data from the laboratory submission formfor each animal was cross-referenced with DAFM's Animal HealthComputer System (AHCS) to confirm the animal identity tag, date ofslaughter, final herd of residence and that the animal resided withinthe county boundary throughout its life. Other animal level informationwas also gathered from AHCS including breed, sex, class, date of birth,herd of origin, number of progeny, number of calving events andmove-ment between herds. Geographic data were generated, managed andanalysed using ArcGIS 10.1 (Environmental Systems Research InstituteInc., Redlands, CA, USA).
The location of each animal formapping and analyseswas attributedto the herd in which the animal resided for the longest period in its life,subsequently referred to as the ‘max herd’ (n = 357). Herd locationswere represented by the centroid of the largest fragment of land associ-ated with each herd according to the Land Parcel Identification System(LPIS) for 2012. The centroid of the herds District Electoral Division(DED) of origin was used to represent the location when LPIS datawas unavailable.
Data analyses were conducted usingMicrosoft Excel and Stata SE ver-sion 12.1 (StataCorp, Texas, USA). Where Cd results were below the limitof detection (LOD; 0.01 mg/kg for Cd), we arbitrarily assigned a Cd valueof 0.005 mg/kg, being half of the LOD. Maps were created using ArcViewGIS 3.2 (Environmental Systems Research Institute, Inc., CA, USA).
2.4.2. Estimating mean soil CdData were available on soil Cd values for 1310 samples throughout
Ireland, collected during 1995–96 (295 soil samples) and 2002 (1015soil samples) by the Environmental Protection Agency (Fay and Zhang,

225M.J. Canty et al. / Science of the Total Environment 485–486 (2014) 223–231
2013), as mapped by Fay et al., 2007 (Fig. 1). These data were obtainedandmapped as point locations. A predictive surface representing soil Cdwas generated by kriging these points using ordinary kriging with aGaussian semivariogram model. A variable search distance with 12neighbours was selected with an output raster cell size set of 50 m.Kriging is a geostatistical analytical technique which assumes that thedistance and direction between sample points relates to an underlyingspatial correlation that can be used to explain variation in a predictedsurface. In this analysis, kriging was used independently of other
Fig. 1. Estimated soil Cd concentration in Ireland (
variables such as soil type or geology to create a simple mathematicalpredictive surface based on proximity to neighbouring points and theirrespective Cd value.
Of the 357 farms sampled for kidney Cd, 349 farms were identifiedthrough DAFM's Land Parcel Identification System (LPIS). For spatialanalysis at a national level, the centroid of the largest fragment of landof a farm is normally used as a point representation of the farm. Forthe purposes of this study, however, all the fragments in a farm wererepresented. For this reason, a point map was created consisting of
used with permission, from Fay et al., 2007).

226 M.J. Canty et al. / Science of the Total Environment 485–486 (2014) 223–231
2317 fragments for the 349 farms. The fragment pointmapwas queriedto find the value of the underlying kriged Cd surface for each point usinga bilinear interpolation of each value. This addresses the issue of a valuefrom a single point representing a fragment of land. Subsequently, anestimated mean, median, minimum and maximum soil Cd concentra-tionwas calculated for each of the 349 farms from the kriged Cd concen-tration assigned to each farm fragment.
2.4.3. Statistical analysesa. Weighting.
The sample was weighted in order to account for unequal proba-bility of selection within county/age strata. The target populationused to calculate weights was ‘all animals slaughtered in 2012’(this being the year in which the majority – 67% – of the samplewas selected), aged over 18 months. Weights were calculatedwithin each county/age stratum as:
Nh=nh;
whereNhwas the total number of cattle slaughtered in the stratum in2012 and nh was the number of animals sampled in the stratum.Data were stratified by county. Three of the county/age stratumpoints had no cattle sampled (Table 1); therefore age groups ‘36 tob48 months’ and ‘48 to b60 months’ were combined so thateach stratum contained at least one sampled animal. Each county(n= 26) was also assigned to the province (n= 4; Ulster, Munster,Leinster and Connacht) in which it is located.
b. Univariable analysis.The distribution of kidney heavy metal (Cd, As, Hg and Pb) con-centrations was estimated, using both unweighted and weightedobservations. The weighted and unweighted distribution of Cd con-centrations was also estimated by the five risk factors:• age, categorised into 6 groups (18 to b24, 24 to b30, 30 to b36, 36to b48, 48 to b60, ≥60 months),
• sex,
Table 1Sample population of cattle slaughtered between December 2010 and December 2012 by prov
Province of herd at slaughter County of herd at slaughter Age (months)
18 to b24 24
Connacht Galway 2 2Leitrim 3 1Mayo 2 2Roscommon 2 2Sligo 2 2
Leinster Carlow 3 3Dublin 3 6Kildare 6 6Kilkenny 2 2Laois 2 3Longford 1 3Louth 2 4Meath 5 6Offaly 2 2Westmeath 2 2Wexford 3 2Wicklow 2 2
Munster Clare 2 3Cork 2 2Kerry 2 2Limerick 2 3Tipperary 2 3Waterford 2 2
Ulster Cavan 2 2Donegal 2 2Monaghan 2 2
Total 62 71
• breed, either dairy or beef,• province of the max herd, and• estimated median concentration of Cd in the soil of the max herd,continuous for modelling purposes and grouped into low(b0.555) and high (≥0.555) concentrations, based on the medianfor descriptive purposes.
c. Multivariable analysis.A linear regressionmodelwasdeveloped tomodel the concentrationof Cd in kidneys, using each of the five described risk factors. Initiallya model was developed using the unweighted data. The ‘regress’command in STATA SE version 12.1 (StataCorp, Texas, USA) wasused to build the unweightedmodel.Whether to include continuousvariables (the median Cd soil concentration and age) as linear wasassessed by examining plots of the kidney Cd concentration againsteach risk factor. An initialmodelwas created by including all risk fac-tors then reducing the model using a backward selection procedurebased on the F-test (p N 0.05). Residual plots from the initial modelwere examined to identify whether the dependent or independentvariables needed to be transformed. Outliers were also examinedin order to assess the fit of the model. The model developed usingthe unweighted data was then recreated using weighted data. The‘survey regress’ command in STATA SE version 12.1 (StataCorp,Texas, USA) was used to model the weighted data and to accountfor the stratified sample design. County/age stratum points with asingle sample unit were centred so that the variance was calculatedat the overall variance.
3. Results
3.1. The study animals
There were 393 animals sampled from 357 max herds. Of these, 326max herdshad only 1 animal sampled, 28 had 2 animals, 2 herds had 3 an-imals and 1 herd had 5 animals sampled. The median age of the studypopulation was 3.0 years, composed of 69% females and 70% beef breeds.
ince and county of the herd at slaughter, and age category.
Total
to b30 30 to b36 36 to b48 48 to b60 ≥60
2 1 1 4 122 1 1 4 122 1 1 4 122 1 2 4 132 1 1 5 132 1 1 2 127 2 1 11 306 3 3 4 282 1 0 5 122 1 1 4 132 1 1 3 111 2 1 7 175 4 3 19 422 1 1 4 122 1 1 4 123 1 1 4 142 1 1 5 132 1 1 4 132 1 1 4 122 1 1 5 132 1 1 4 133 0 3 4 152 1 1 5 131 2 1 4 122 1 1 4 122 0 2 4 12
64 32 33 131 393
227M.J. Canty et al. / Science of the Total Environment 485–486 (2014) 223–231
3.2. Univariable analysis
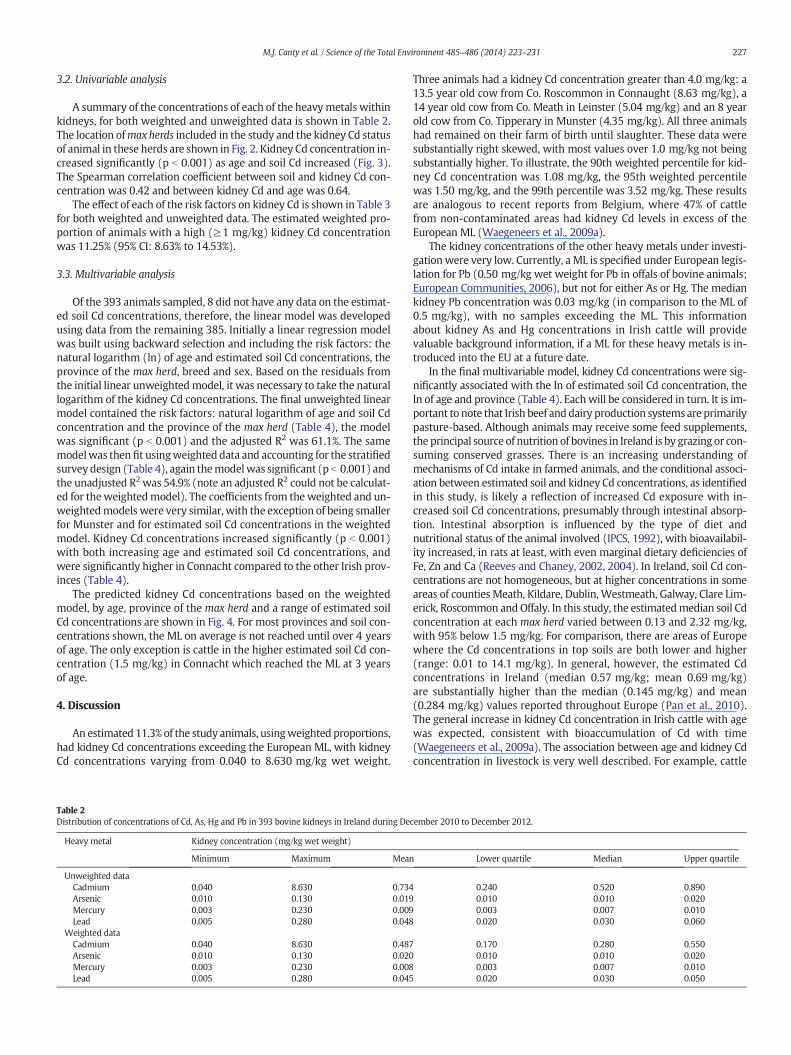
A summary of the concentrations of each of the heavymetals withinkidneys, for both weighted and unweighted data is shown in Table 2.The location ofmax herds included in the study and the kidney Cd statusof animal in these herds are shown in Fig. 2. Kidney Cd concentration in-creased significantly (p b 0.001) as age and soil Cd increased (Fig. 3).The Spearman correlation coefficient between soil and kidney Cd con-centration was 0.42 and between kidney Cd and age was 0.64.
The effect of each of the risk factors on kidney Cd is shown in Table 3for both weighted and unweighted data. The estimated weighted pro-portion of animals with a high (≥1 mg/kg) kidney Cd concentrationwas 11.25% (95% CI: 8.63% to 14.53%).
3.3. Multivariable analysis
Of the 393 animals sampled, 8 did not have any data on the estimat-ed soil Cd concentrations, therefore, the linear model was developedusing data from the remaining 385. Initially a linear regression modelwas built using backward selection and including the risk factors: thenatural logarithm (ln) of age and estimated soil Cd concentrations, theprovince of the max herd, breed and sex. Based on the residuals fromthe initial linear unweightedmodel, it was necessary to take the naturallogarithm of the kidney Cd concentrations. The final unweighted linearmodel contained the risk factors: natural logarithm of age and soil Cdconcentration and the province of the max herd (Table 4), the modelwas significant (p b 0.001) and the adjusted R2 was 61.1%. The samemodelwas then fit usingweighted data and accounting for the stratifiedsurvey design (Table 4), again themodelwas significant (p b 0.001) andthe unadjusted R2 was 54.9% (note an adjusted R2 could not be calculat-ed for theweightedmodel). The coefficients from theweighted and un-weightedmodels were very similar, with the exception of being smallerfor Munster and for estimated soil Cd concentrations in the weightedmodel. Kidney Cd concentrations increased significantly (p b 0.001)with both increasing age and estimated soil Cd concentrations, andwere significantly higher in Connacht compared to the other Irish prov-inces (Table 4).
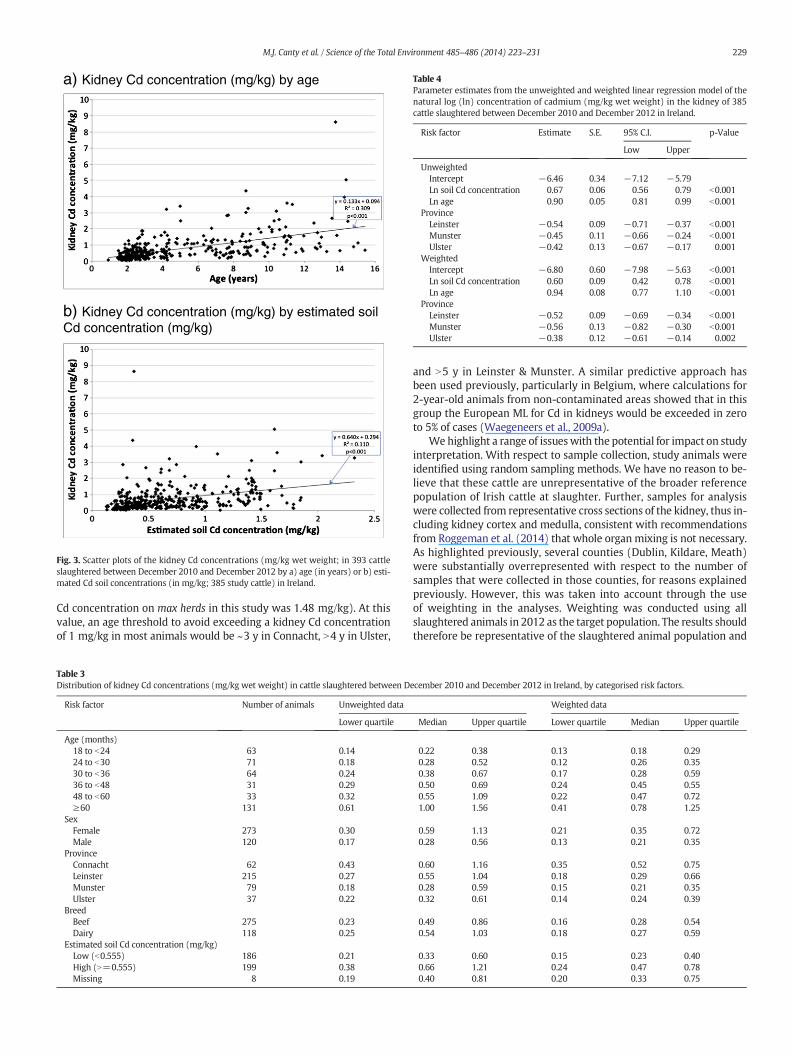
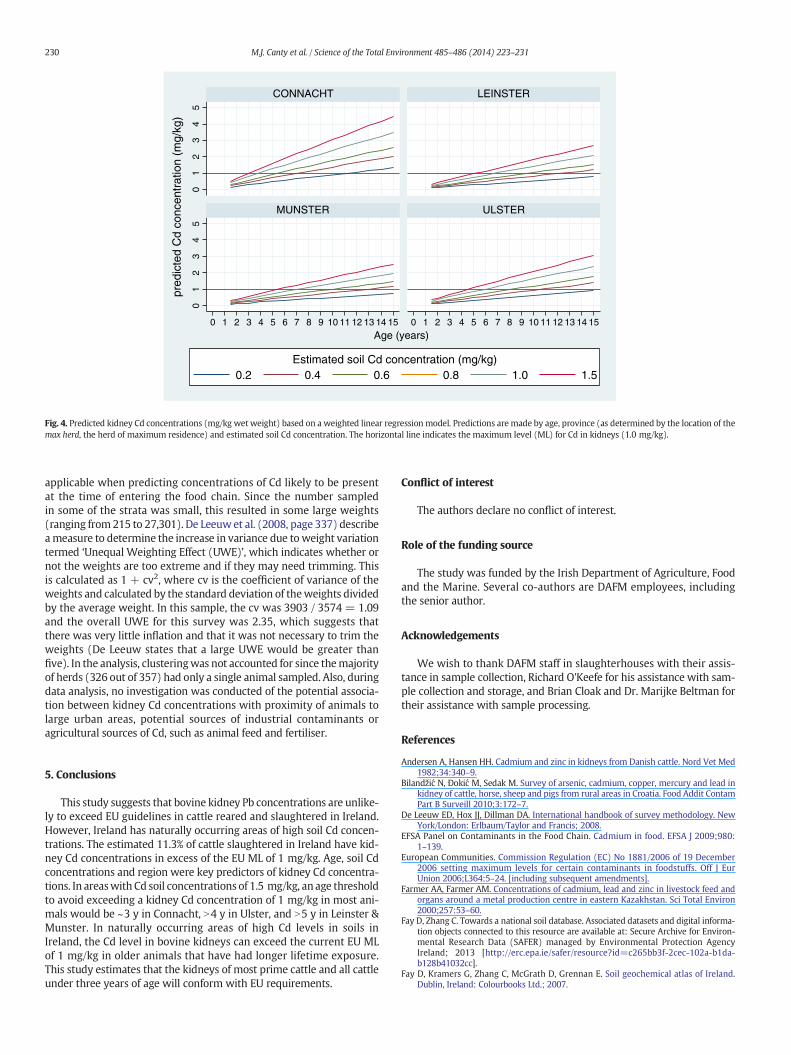
The predicted kidney Cd concentrations based on the weightedmodel, by age, province of the max herd and a range of estimated soilCd concentrations are shown in Fig. 4. For most provinces and soil con-centrations shown, the ML on average is not reached until over 4 yearsof age. The only exception is cattle in the higher estimated soil Cd con-centration (1.5 mg/kg) in Connacht which reached the ML at 3 yearsof age.
4. Discussion
An estimated 11.3% of the study animals, usingweighted proportions,had kidney Cd concentrations exceeding the European ML, with kidneyCd concentrations varying from 0.040 to 8.630 mg/kg wet weight.
Table 2Distribution of concentrations of Cd, As, Hg and Pb in 393 bovine kidneys in Ireland during De
Heavy metal Kidney concentration (mg/kg wet weight)
Minimum Maximum Mean
Unweighted dataCadmium 0.040 8.630 0.734Arsenic 0.010 0.130 0.019Mercury 0.003 0.230 0.009Lead 0.005 0.280 0.048
Weighted dataCadmium 0.040 8.630 0.487Arsenic 0.010 0.130 0.020Mercury 0.003 0.230 0.008Lead 0.005 0.280 0.045
Three animals had a kidney Cd concentration greater than 4.0 mg/kg: a13.5 year old cow from Co. Roscommon in Connaught (8.63 mg/kg), a14 year old cow from Co. Meath in Leinster (5.04 mg/kg) and an 8 yearold cow from Co. Tipperary in Munster (4.35 mg/kg). All three animalshad remained on their farm of birth until slaughter. These data weresubstantially right skewed, with most values over 1.0 mg/kg not beingsubstantially higher. To illustrate, the 90th weighted percentile for kid-ney Cd concentration was 1.08 mg/kg, the 95th weighted percentilewas 1.50 mg/kg, and the 99th percentile was 3.52 mg/kg. These resultsare analogous to recent reports from Belgium, where 47% of cattlefrom non-contaminated areas had kidney Cd levels in excess of theEuropean ML (Waegeneers et al., 2009a).
The kidney concentrations of the other heavy metals under investi-gationwere very low. Currently, a ML is specified under European legis-lation for Pb (0.50 mg/kg wet weight for Pb in offals of bovine animals;European Communities, 2006), but not for either As or Hg. The mediankidney Pb concentration was 0.03 mg/kg (in comparison to the ML of0.5 mg/kg), with no samples exceeding the ML. This informationabout kidney As and Hg concentrations in Irish cattle will providevaluable background information, if a ML for these heavy metals is in-troduced into the EU at a future date.
In the final multivariable model, kidney Cd concentrations were sig-nificantly associated with the ln of estimated soil Cd concentration, theln of age and province (Table 4). Eachwill be considered in turn. It is im-portant to note that Irish beef anddairy production systems are primarilypasture-based. Although animals may receive some feed supplements,the principal source of nutrition of bovines in Ireland is by grazing or con-suming conserved grasses. There is an increasing understanding ofmechanisms of Cd intake in farmed animals, and the conditional associ-ation between estimated soil and kidney Cd concentrations, as identifiedin this study, is likely a reflection of increased Cd exposure with in-creased soil Cd concentrations, presumably through intestinal absorp-tion. Intestinal absorption is influenced by the type of diet andnutritional status of the animal involved (IPCS, 1992), with bioavailabil-ity increased, in rats at least, with even marginal dietary deficiencies ofFe, Zn and Ca (Reeves and Chaney, 2002, 2004). In Ireland, soil Cd con-centrations are not homogeneous, but at higher concentrations in someareas of counties Meath, Kildare, Dublin, Westmeath, Galway, Clare Lim-erick, Roscommon and Offaly. In this study, the estimatedmedian soil Cdconcentration at each max herd varied between 0.13 and 2.32 mg/kg,with 95% below 1.5 mg/kg. For comparison, there are areas of Europewhere the Cd concentrations in top soils are both lower and higher(range: 0.01 to 14.1 mg/kg). In general, however, the estimated Cdconcentrations in Ireland (median 0.57 mg/kg; mean 0.69 mg/kg)are substantially higher than the median (0.145 mg/kg) and mean(0.284 mg/kg) values reported throughout Europe (Pan et al., 2010).The general increase in kidney Cd concentration in Irish cattle with agewas expected, consistent with bioaccumulation of Cd with time(Waegeneers et al., 2009a). The association between age and kidney Cdconcentration in livestock is very well described. For example, cattle
cember 2010 to December 2012.
Lower quartile Median Upper quartile
0.240 0.520 0.8900.010 0.010 0.0200.003 0.007 0.0100.020 0.030 0.060
0.170 0.280 0.5500.010 0.010 0.0200.003 0.007 0.0100.020 0.030 0.050

Fig. 2. Location of 357 max herds, and kidney Cd concentrations (mg/kg wet weight; all samples ≤1 mg/kg, green dot; at least 1 sample N1 mg/kg, red dot) of 393 bovine animalsslaughtered between December 2010 and December 2012, in each of the four provinces (Ulster, Munster, Leinster and Connacht) of Ireland.
228 M.J. Canty et al. / Science of the Total Environment 485–486 (2014) 223–231
from north eastern Poland aged between 8 and 12 years had kidney cor-tex Cd concentrations between 0.68 and 2.0 mg/kg wet weight. Freeranging bison from the same area, aged 7 to 12 years, had kidney cortexconcentrations between 1.95 and 3.52 mg/kg wet weight (Włostowskiet al., 2006). Similarly in northwestern Spain, cows had significantlyhigher kidney Cd concentrations than female calves (López Alonsoet al., 2000). In Jamaica, where soil Cd concentrations are high, cattle kid-ney Cd concentrations between 0.012 and 117 mg/kg have been report-ed, with the Cd contents of older cows much higher than those ofyounger animals (Nriagu et al., 2009). The influence of province was sig-nificant, after accounting for both estimated soil Cd concentration andanimal age. In particular, after accounting for these other two variables,animals sampled in Connacht had the highest median concentrationsof kidney Cd. We can currently only speculate on reasons for this
difference. It could also, in part, be an artefact of the sample designsince the sample size was much smaller in Connacht (62) compared toLeinster (215). Further, the area of high soil Cd passes through certaincounties in Connacht, and it is possible, given the limited sample size inthis province, that the estimated soil Cd concentrations is an imprecisemeasure of the actual value near the farms in the survey. It may also re-late to other factors affecting Cd absorption, including differences be-tween provinces in terms of trace element status.
In Fig. 4, we present predicted kidney Cd concentrations based ontheweighted linear regressionmodel. The key predictors in theweight-edmodel were soil Cd, animal age and province, and therefore there is aneed for different interpretations by province, when considering kidneyCd concentrations by age and soil Cd. We illustrate using a soil Cdconcentration of 1.5 mg/kg (the 95th percentile for estimated soil
a) Kidney Cd concentration (mg/kg) by age
b) Kidney Cd concentration (mg/kg) by estimated soil Cd concentration (mg/kg)
Fig. 3. Scatter plots of the kidney Cd concentrations (mg/kg wet weight; in 393 cattleslaughtered between December 2010 and December 2012 by a) age (in years) or b) esti-mated Cd soil concentrations (in mg/kg; 385 study cattle) in Ireland.
Table 4Parameter estimates from the unweighted and weighted linear regression model of thenatural log (ln) concentration of cadmium (mg/kg wet weight) in the kidney of 385cattle slaughtered between December 2010 and December 2012 in Ireland.
Risk factor Estimate S.E. 95% C.I. p-Value
Low Upper
UnweightedIntercept −6.46 0.34 −7.12 −5.79Ln soil Cd concentration 0.67 0.06 0.56 0.79 b0.001Ln age 0.90 0.05 0.81 0.99 b0.001
ProvinceLeinster −0.54 0.09 −0.71 −0.37 b0.001Munster −0.45 0.11 −0.66 −0.24 b0.001Ulster −0.42 0.13 −0.67 −0.17 0.001
WeightedIntercept −6.80 0.60 −7.98 −5.63 b0.001Ln soil Cd concentration 0.60 0.09 0.42 0.78 b0.001Ln age 0.94 0.08 0.77 1.10 b0.001
ProvinceLeinster −0.52 0.09 −0.69 −0.34 b0.001Munster −0.56 0.13 −0.82 −0.30 b0.001Ulster −0.38 0.12 −0.61 −0.14 0.002
229M.J. Canty et al. / Science of the Total Environment 485–486 (2014) 223–231
Cd concentration on max herds in this study was 1.48 mg/kg). At thisvalue, an age threshold to avoid exceeding a kidney Cd concentrationof 1 mg/kg in most animals would be ~3 y in Connacht, N4 y in Ulster,
Table 3Distribution of kidney Cd concentrations (mg/kg wet weight) in cattle slaughtered between D
Risk factor Number of animals Unweighted data
Lower quartile
Age (months)18 to b24 63 0.1424 to b30 71 0.1830 to b36 64 0.2436 to b48 31 0.2948 to b60 33 0.32≥60 131 0.61
SexFemale 273 0.30Male 120 0.17
ProvinceConnacht 62 0.43Leinster 215 0.27Munster 79 0.18Ulster 37 0.22
BreedBeef 275 0.23Dairy 118 0.25
Estimated soil Cd concentration (mg/kg)Low (b0.555) 186 0.21High (N=0.555) 199 0.38Missing 8 0.19
and N5 y in Leinster & Munster. A similar predictive approach hasbeen used previously, particularly in Belgium, where calculations for2-year-old animals from non-contaminated areas showed that in thisgroup the European ML for Cd in kidneys would be exceeded in zeroto 5% of cases (Waegeneers et al., 2009a).
We highlight a range of issueswith the potential for impact on studyinterpretation. With respect to sample collection, study animals wereidentified using random sampling methods. We have no reason to be-lieve that these cattle are unrepresentative of the broader referencepopulation of Irish cattle at slaughter. Further, samples for analysiswere collected from representative cross sections of the kidney, thus in-cluding kidney cortex and medulla, consistent with recommendationsfrom Roggeman et al. (2014) that whole organ mixing is not necessary.As highlighted previously, several counties (Dublin, Kildare, Meath)were substantially overrepresented with respect to the number ofsamples that were collected in those counties, for reasons explainedpreviously. However, this was taken into account through the useof weighting in the analyses. Weighting was conducted using allslaughtered animals in 2012 as the target population. The results shouldtherefore be representative of the slaughtered animal population and
ecember 2010 and December 2012 in Ireland, by categorised risk factors.
Weighted data
Median Upper quartile Lower quartile Median Upper quartile
0.22 0.38 0.13 0.18 0.290.28 0.52 0.12 0.26 0.350.38 0.67 0.17 0.28 0.590.50 0.69 0.24 0.45 0.550.55 1.09 0.22 0.47 0.721.00 1.56 0.41 0.78 1.25
0.59 1.13 0.21 0.35 0.720.28 0.56 0.13 0.21 0.35
0.60 1.16 0.35 0.52 0.750.55 1.04 0.18 0.29 0.660.28 0.59 0.15 0.21 0.350.32 0.61 0.14 0.24 0.39
0.49 0.86 0.16 0.28 0.540.54 1.03 0.18 0.27 0.59
0.33 0.60 0.15 0.23 0.400.66 1.21 0.24 0.47 0.780.40 0.81 0.20 0.33 0.75
01
23
45
01
23
45
0 1 2 3 4 5 6 7 8 9 10 11 12 13 14 15 0 1 2 3 4 5 6 7 8 9 10 11 12 13 14 15
CONNACHT LEINSTER
MUNSTER ULSTER
0.2 0.4 0.6 0.8 1.0 1.5Estimated soil Cd concentration (mg/kg)
pred
icte
d C
d co
ncen
trat
ion
(mg/
kg)
Age (years)
Fig. 4. Predicted kidney Cd concentrations (mg/kg wet weight) based on a weighted linear regression model. Predictions are made by age, province (as determined by the location of themax herd, the herd of maximum residence) and estimated soil Cd concentration. The horizontal line indicates the maximum level (ML) for Cd in kidneys (1.0 mg/kg).
230 M.J. Canty et al. / Science of the Total Environment 485–486 (2014) 223–231
applicable when predicting concentrations of Cd likely to be presentat the time of entering the food chain. Since the number sampledin some of the strata was small, this resulted in some large weights(ranging from 215 to 27,301). De Leeuwet al. (2008, page 337) describeameasure to determine the increase in variance due toweight variationtermed ‘Unequal Weighting Effect (UWE)’, which indicates whether ornot the weights are too extreme and if they may need trimming. Thisis calculated as 1 + cv2, where cv is the coefficient of variance of theweights and calculated by the standard deviation of theweights dividedby the average weight. In this sample, the cv was 3903 / 3574 = 1.09and the overall UWE for this survey was 2.35, which suggests thatthere was very little inflation and that it was not necessary to trim theweights (De Leeuw states that a large UWE would be greater thanfive). In the analysis, clusteringwas not accounted for since themajorityof herds (326 out of 357) had only a single animal sampled. Also, duringdata analysis, no investigation was conducted of the potential associa-tion between kidney Cd concentrations with proximity of animals tolarge urban areas, potential sources of industrial contaminants oragricultural sources of Cd, such as animal feed and fertiliser.
5. Conclusions
This study suggests that bovine kidney Pb concentrations are unlike-ly to exceed EU guidelines in cattle reared and slaughtered in Ireland.However, Ireland has naturally occurring areas of high soil Cd concen-trations. The estimated 11.3% of cattle slaughtered in Ireland have kid-ney Cd concentrations in excess of the EU ML of 1 mg/kg. Age, soil Cdconcentrations and region were key predictors of kidney Cd concentra-tions. In areaswith Cd soil concentrations of 1.5 mg/kg, an age thresholdto avoid exceeding a kidney Cd concentration of 1 mg/kg in most ani-mals would be ~3 y in Connacht, N4 y in Ulster, and N5 y in Leinster &Munster. In naturally occurring areas of high Cd levels in soils inIreland, the Cd level in bovine kidneys can exceed the current EU MLof 1 mg/kg in older animals that have had longer lifetime exposure.This study estimates that the kidneys of most prime cattle and all cattleunder three years of age will conform with EU requirements.
Conflict of interest
The authors declare no conflict of interest.
Role of the funding source
The study was funded by the Irish Department of Agriculture, Foodand the Marine. Several co-authors are DAFM employees, includingthe senior author.
Acknowledgements
We wish to thank DAFM staff in slaughterhouses with their assis-tance in sample collection, Richard O'Keefe for his assistance with sam-ple collection and storage, and Brian Cloak and Dr. Marijke Beltman fortheir assistance with sample processing.
References
Andersen A, Hansen HH. Cadmium and zinc in kidneys from Danish cattle. Nord Vet Med1982;34:340–9.
Bilandžić N, Đokić M, Sedak M. Survey of arsenic, cadmium, copper, mercury and lead inkidney of cattle, horse, sheep and pigs from rural areas in Croatia. Food Addit ContamPart B Surveill 2010;3:172–7.
De Leeuw ED, Hox JJ, Dillman DA. International handbook of survey methodology. NewYork/London: Erlbaum/Taylor and Francis; 2008.
EFSA Panel on Contaminants in the Food Chain. Cadmium in food. EFSA J 2009;980:1–139.
European Communities. Commission Regulation (EC) No 1881/2006 of 19 December2006 setting maximum levels for certain contaminants in foodstuffs. Off J EurUnion 2006;L364:5–24. [including subsequent amendments].
Farmer AA, Farmer AM. Concentrations of cadmium, lead and zinc in livestock feed andorgans around a metal production centre in eastern Kazakhstan. Sci Total Environ2000;257:53–60.
Fay D, Zhang C. Towards a national soil database. Associated datasets and digital informa-tion objects connected to this resource are available at: Secure Archive for Environ-mental Research Data (SAFER) managed by Environmental Protection AgencyIreland; 2013 [http://erc.epa.ie/safer/resource?id=c265bb3f-2cec-102a-b1da-b128b41032cc].
Fay D, Kramers G, Zhang C, McGrath D, Grennan E. Soil geochemical atlas of Ireland.Dublin, Ireland: Colourbooks Ltd.; 2007.

231M.J. Canty et al. / Science of the Total Environment 485–486 (2014) 223–231
IPCS. Environmental health criteria 134, cadmium. International Programme on ChemicalSafety. Geneva: World Health Organisation; 1992. [http://www.inchem.org/documents/ehc/ehc/ehc134.htm].
López Alonso M, Benedito JL, Miranda M, Castillo C, Hernández J, Shore RF. Arsenic,cadmium, lead, copper and zinc in cattle from Galicia, NW Spain. Sci Total Environ2000;246:237–48.
Nriagu J, BoughanenM, Linder A, Howe A, Grant C, Rattray R, et al. Levels of As, Cd, Pb, Cu, Seand Zn in bovine kidneys and livers in Jamaica. Ecotoxicol Environ Saf 2009;72:564–71.
Pan J, Plant J, Voulvoulis N, Oates C, Ihlenfeld C. Cadmium levels in Europe: implicationsfor human health. Environ Geochem Health 2010;32:1–12.
Reeves PG, Chaney RL. Nutritional status affects the absorption and whole-body andorgan retention of Cd in rats fed rice-based diets. Environ Sci Technol 2002;15:2684–9.
Reeves PG, Chaney RL. Marginal nutritional status of zinc, iron, and calcium increases Cdretention in the duodenum and other organs of rats fed rice-based diets. Environ Res2004;96:311–22.
Roggeman S, de Boeck G, De Cock H, Blust R, Bervoets L. Accumulation and detoxificationof metals and arsenic in tissues of cattle (Bos taurus), and the risks for human con-sumption. Sci Total Environ 2014;466–467:175–84.
Spierenburg TJ, Graaf GJ, Baars AJ, Brus DHJ, Tielen MJM, Arts BJ. Cadmium, zinc, lead, andcopper in livers and kidneys of cattle in the neighbourhood of zinc refineries. EnvironMonit Assess 1988;11:107–14.
Waegeneers N, Pizzolon JC, Hoenig M, de Temmerman L. The European maximum levelfor cadmium in bovine kidneys is in Belgium only realistic for cattle up to 2 yearsof age. Food Addit Contam Part A Chem Anal Control Expo Risk Assess 2009a;26:1239–48.
Waegeneers N, Pizzolon JC, Hoenig M, De Temmerman L. Accumulation of trace elementsin cattle from rural and industrial areas in Belgium. Food Addit Contam Part A ChemAnal Control Expo Risk Assess 2009b;26:326–32.
Włostowski T, Bonda E, Krasowska A. Free-ranging European bisons accumulate morecadmium in the liver and kidneys than domestic cattle in north-eastern Poland. SciTotal Environ 2006;364:295–300.