
CAD-based simulations and design of experiments for determining thrust force in drilling operations
12
Computer-Aided Design 43 (2011) 1879–1890 Contents lists available at SciVerse ScienceDirect Computer-Aided Design journal homepage: www.elsevier.com/locate/cad CAD-based simulations and design of experiments for determining thrust force in drilling operations Panagiotis Kyratsis a,∗ , Nikolaos Bilalis b , Aristomenis Antoniadis b a Technological Educational Institution of West Macedonia, Kila Kozani, GR50100, Greece b Technical University of Crete, University Campus, Kounoupidiana, Chania GR73100, Greece article info Article history: Received 12 February 2011 Accepted 5 June 2011 Keywords: CAD-based manufacturing Design of experiments Regression analysis Drilling thrust force abstract Drilling thrust force calculations require a large amount of experimental work, which can be greatly reduced, since an extensively validated CAD-based approach, using the DRILL3D software application, has become available. DRILL3D calculates the thrust force of both the cutting areas of the tool (main edges and chisel edge) simultaneously, which means that every simulation can substitute two separate lab experiments. Nevertheless, as the number of parameters involved is increasing, the amount of the necessary simulations becomes substantial. This is the reason that led to the combined use of the DRILL3D and the design of experiments methodology, which reduces the amount of the necessary digital experiments to an impressive degree. The main factors affecting the current analysis are the tool diameter, the web to diameter ratio, the feed rate and the cutting speed used. Using an L16 Taguchi table, a function of the developed thrust force can be calculated using the response surface methodology. This statistical modeling tool employs the regression analysis to establish the relationship between various process parameters and response. © 2011 Elsevier Ltd. All rights reserved. 1. Introduction Hole drilling is by far the most widely used process in manufacturing. Although it appears to be a relatively simple process, it is actually a very complex one. One has to consider that, there are two basic tool areas, the main cutting lips and the chisel edge, where thrust force is generated. The drilling point’s chisel edge is dominant at the generation of the tool thrust force, while the torque is heavily depended on the action of the cutting lips [1]. Researchers have used a number of different approaches, when simulating drilling, in order to be able to describe accurately the complexity as well as to calculate thrust forces, torques, temperatures, tool wear etc. Three main directions have been adopted over the years. 1. The analytical mathematical approach, where the drilling tool is analytically described by complicated equations in 3D space and used for rigorous geometrical calculations of the drilling process. In a great deal of research efforts, 2D projected geometry is used instead, in order to reduce the amount of calculations necessary [2–6]. 2. The experimental one, where an extensive amount of experi- ments take place and the results are stored in databases so that ∗ Corresponding author. Tel.: +30 24610 68294. E-mail addresses: [email protected], [email protected] (P. Kyratsis), [email protected] (N. Bilalis), [email protected] (A. Antoniadis). different parameters can be used for experimentally derived equations [7–10]. 3. The numerical approach, where methodologies such as the finite element analysis are used, based on the Lagrangian and Eulerian methods [11–16]. In an increasing amount of cases, researchers use modern statistical and artificial intelligence tools, in order to reduce the amount of experiments needed and derived equations based on these methods, without performing extensive experiment plans [17–24]. The current paper focuses on the combination of CAD-based drilling simulation and design of experiments. Thrust force calculations require a large amount of experimental work, which can be greatly reduced, since the CAD-based approach has been extensively validated via the DRILL3D software application, built especially for that [25,26]. Nevertheless, as the number of parameters is increasing, so does the magnitude of the necessary experimental work. This is the main reason that led to the combined use of the DRILL3D and the design of experiments methodology, which limits the amount of the necessary digital experiments to an impressive degree. 2. The CAD-based methodology A modern CAD system, together with its API (Application Programming Interface), can be used to automate a number of 0010-4485/$ – see front matter © 2011 Elsevier Ltd. All rights reserved. doi:10.1016/j.cad.2011.06.002
Transcript of CAD-based simulations and design of experiments for determining thrust force in drilling operations
Computer-Aided Design 43 (2011) 1879–1890
Contents lists available at SciVerse ScienceDirect
Computer-Aided Design
journal homepage: www.elsevier.com/locate/cad
CAD-based simulations and design of experiments for determining thrust forcein drilling operationsPanagiotis Kyratsis a,∗, Nikolaos Bilalis b, Aristomenis Antoniadis b
a Technological Educational Institution of West Macedonia, Kila Kozani, GR50100, Greeceb Technical University of Crete, University Campus, Kounoupidiana, Chania GR73100, Greece
a r t i c l e i n f o
Article history:Received 12 February 2011Accepted 5 June 2011
Keywords:CAD-based manufacturingDesign of experimentsRegression analysisDrilling thrust force
a b s t r a c t
Drilling thrust force calculations require a large amount of experimental work, which can be greatlyreduced, since an extensively validated CAD-based approach, using the DRILL3D software application,has become available. DRILL3D calculates the thrust force of both the cutting areas of the tool (mainedges and chisel edge) simultaneously, which means that every simulation can substitute two separatelab experiments. Nevertheless, as the number of parameters involved is increasing, the amount of thenecessary simulations becomes substantial. This is the reason that led to the combined use of theDRILL3D and the design of experiments methodology, which reduces the amount of the necessary digitalexperiments to an impressive degree. Themain factors affecting the current analysis are the tool diameter,the web to diameter ratio, the feed rate and the cutting speed used. Using an L16 Taguchi table, a functionof the developed thrust force can be calculated using the response surface methodology. This statisticalmodeling tool employs the regression analysis to establish the relationship between various processparameters and response.
© 2011 Elsevier Ltd. All rights reserved.
1. Introduction
Hole drilling is by far the most widely used process inmanufacturing. Although it appears to be a relatively simpleprocess, it is actually a very complex one. One has to consider that,there are two basic tool areas, the main cutting lips and the chiseledge, where thrust force is generated. The drilling point’s chiseledge is dominant at the generation of the tool thrust force, whilethe torque is heavily depended on the action of the cutting lips [1].
Researchers have used a number of different approaches, whensimulating drilling, in order to be able to describe accuratelythe complexity as well as to calculate thrust forces, torques,temperatures, tool wear etc. Three main directions have beenadopted over the years.
1. The analytical mathematical approach, where the drilling toolis analytically described by complicated equations in 3D spaceand used for rigorous geometrical calculations of the drillingprocess. In a great deal of research efforts, 2D projectedgeometry is used instead, in order to reduce the amount ofcalculations necessary [2–6].
2. The experimental one, where an extensive amount of experi-ments take place and the results are stored in databases so that
∗ Corresponding author. Tel.: +30 24610 68294.E-mail addresses: [email protected], [email protected] (P. Kyratsis),
[email protected] (N. Bilalis), [email protected] (A. Antoniadis).
0010-4485/$ – see front matter© 2011 Elsevier Ltd. All rights reserved.doi:10.1016/j.cad.2011.06.002
different parameters can be used for experimentally derivedequations [7–10].
3. The numerical approach, where methodologies such as thefinite element analysis are used, based on the Lagrangian andEulerian methods [11–16].
In an increasing amount of cases, researchers use modernstatistical and artificial intelligence tools, in order to reduce theamount of experiments needed and derived equations basedon these methods, without performing extensive experimentplans [17–24].
The current paper focuses on the combination of CAD-baseddrilling simulation and design of experiments. Thrust forcecalculations require a large amount of experimental work, whichcan be greatly reduced, since the CAD-based approach hasbeen extensively validated via the DRILL3D software application,built especially for that [25,26]. Nevertheless, as the number ofparameters is increasing, so does the magnitude of the necessaryexperimental work. This is the main reason that led to thecombined use of the DRILL3D and the design of experimentsmethodology, which limits the amount of the necessary digitalexperiments to an impressive degree.
2. The CAD-based methodology
A modern CAD system, together with its API (ApplicationProgramming Interface), can be used to automate a number of
1880 P. Kyratsis et al. / Computer-Aided Design 43 (2011) 1879–1890
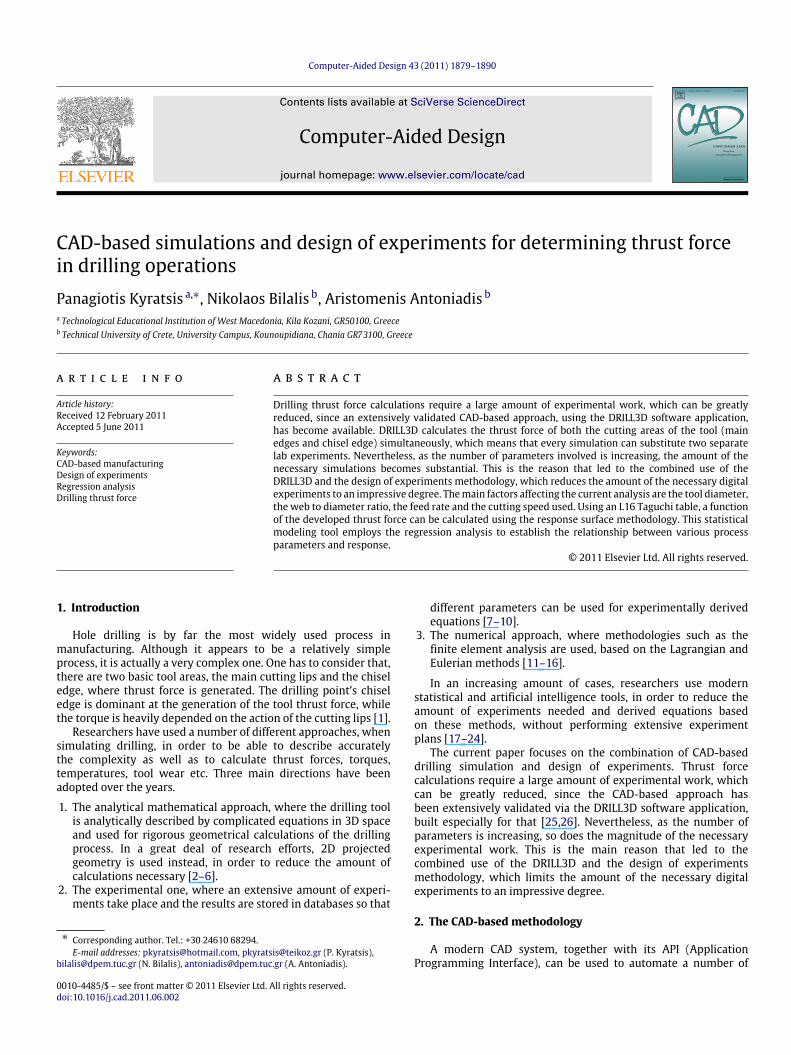
Fig. 1. DRILL3D simulation workflow.
steps toward manufacturing simulations. Different drill tools andwork pieces can be created parametrically and an appropriatevirtual motion can be programmed, in order to produce all thenecessary solid models of the undeformed chips. Using thesemodels, the thrust force of the tool can be calculated for everytool–work-piece material and geometry combination, using adatabase containing the appropriate experimental coefficients.
DRILL3D creates automatically both the tool and thework piece3D solid models and allows the user to select the motion fragment— step for cutting the work piece (in degrees), as well as the speed(in m/min) and the feed rate (in mm/rev). In addition, a numberof parameters for setting up the initial conditions, before thework is initiated, is made available (drill kinematics parameters).Based on the data referred previously, DRILL3D produces twomore3D solid models, one describing the drilling action on the maincutting edge and another for the application of drilling in thearea of the chisel edge. These models of the undeformed chipfollow a procedure of being segmented into smaller pieces, so thathigher accuracy of the thrust force calculation can be achieved. Itis worth mentioning that the automatic extraction of the chips’main geometrical characteristics, prior to the calculation of the toolthrust force, integrates the procedure. The complete flow chart ofthis novel drilling simulation method is presented in Fig. 1.
2.1. Tool description
The DRILL3D routine outputs the Galloway’s geometricaldescription of the tool in a CAD solid model [27]. This solid modelof the twist drill fluted part is formed by sweeping helically anappropriate flute cross section for straight cutting lips. The twistdrill point geometry is finalized by the Boolean subtraction of thegrinding cones, mentioned in Galloway’s geometry. According tothis model, a range of parameters, separated into two main sets,have to be set in order to produce the desired variety of drillingtools. The first set determines the main shape of the tool (radius,web thickness, half point angle and helix angle), while the secondset provides the detail shape of the tool, based on the conventional
grinding method (half cone angle, distance of the cone along the xaxis and the y axis).
2.2. Digital drilling process
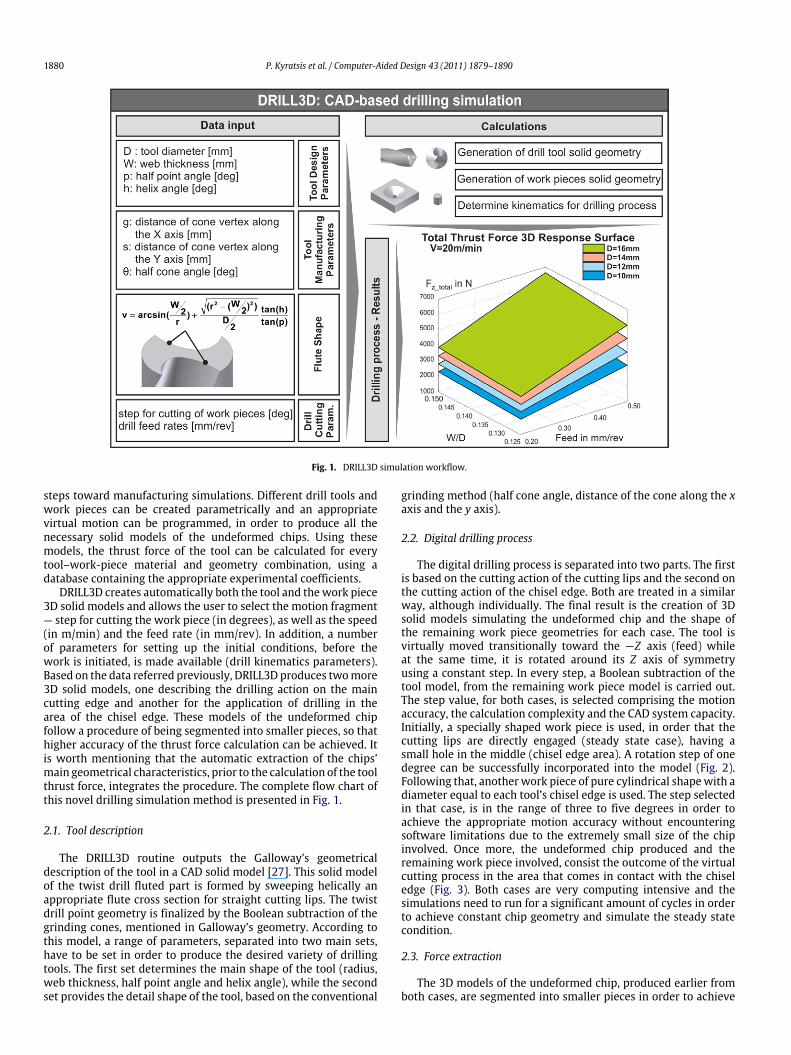
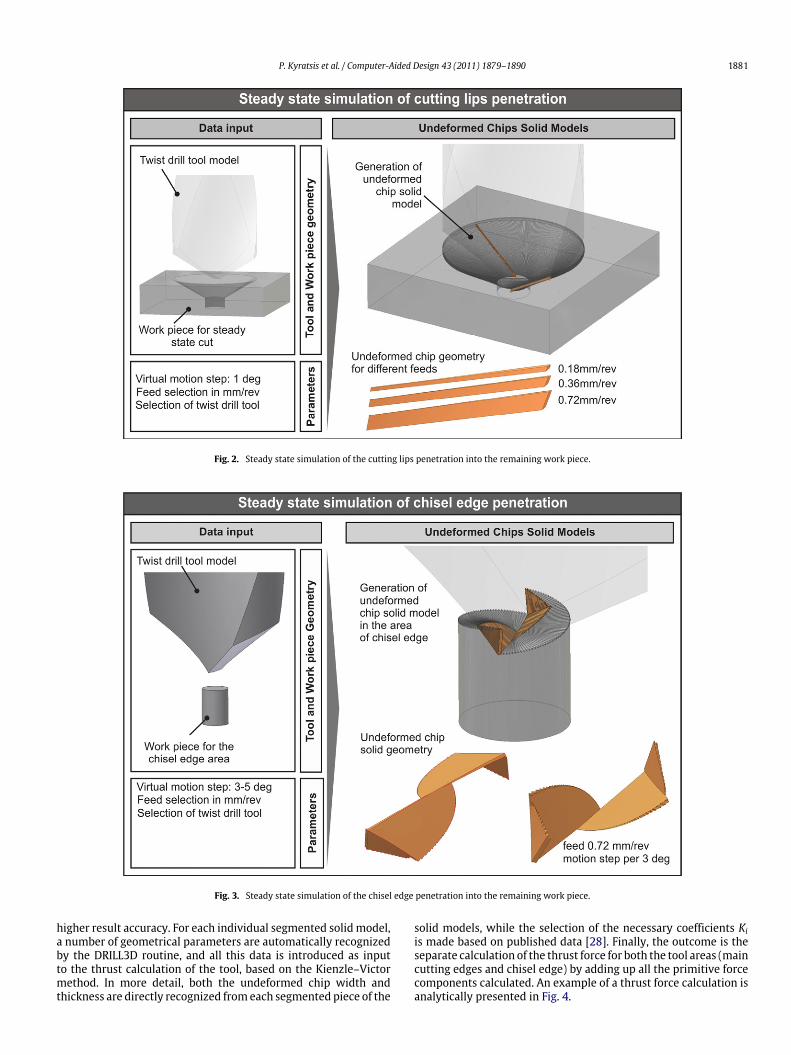
The digital drilling process is separated into two parts. The firstis based on the cutting action of the cutting lips and the second onthe cutting action of the chisel edge. Both are treated in a similarway, although individually. The final result is the creation of 3Dsolid models simulating the undeformed chip and the shape ofthe remaining work piece geometries for each case. The tool isvirtually moved transitionally toward the −Z axis (feed) whileat the same time, it is rotated around its Z axis of symmetryusing a constant step. In every step, a Boolean subtraction of thetool model, from the remaining work piece model is carried out.The step value, for both cases, is selected comprising the motionaccuracy, the calculation complexity and the CAD system capacity.Initially, a specially shaped work piece is used, in order that thecutting lips are directly engaged (steady state case), having asmall hole in the middle (chisel edge area). A rotation step of onedegree can be successfully incorporated into the model (Fig. 2).Following that, another work piece of pure cylindrical shapewith adiameter equal to each tool’s chisel edge is used. The step selectedin that case, is in the range of three to five degrees in order toachieve the appropriate motion accuracy without encounteringsoftware limitations due to the extremely small size of the chipinvolved. Once more, the undeformed chip produced and theremaining work piece involved, consist the outcome of the virtualcutting process in the area that comes in contact with the chiseledge (Fig. 3). Both cases are very computing intensive and thesimulations need to run for a significant amount of cycles in orderto achieve constant chip geometry and simulate the steady statecondition.
2.3. Force extraction
The 3D models of the undeformed chip, produced earlier fromboth cases, are segmented into smaller pieces in order to achieve
P. Kyratsis et al. / Computer-Aided Design 43 (2011) 1879–1890 1881
Fig. 2. Steady state simulation of the cutting lips penetration into the remaining work piece.
Fig. 3. Steady state simulation of the chisel edge penetration into the remaining work piece.
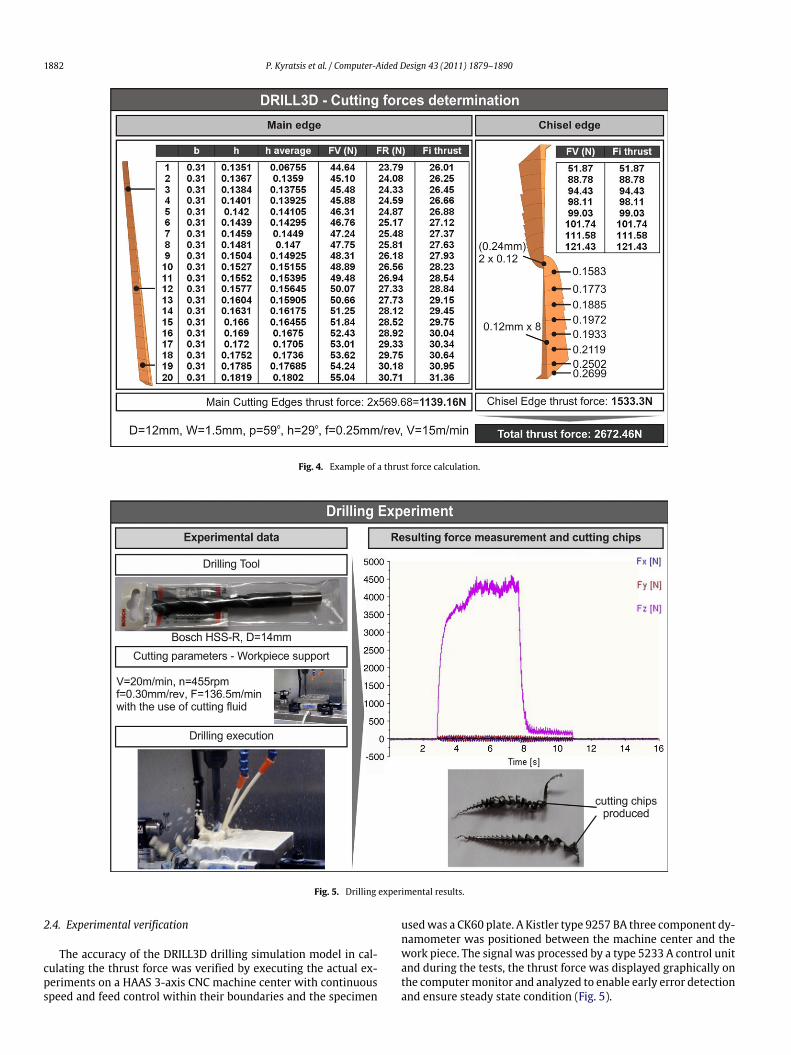
higher result accuracy. For each individual segmented solid model,a number of geometrical parameters are automatically recognizedby the DRILL3D routine, and all this data is introduced as inputto the thrust calculation of the tool, based on the Kienzle–Victormethod. In more detail, both the undeformed chip width andthickness are directly recognized fromeach segmented piece of the
solid models, while the selection of the necessary coefficients Kiis made based on published data [28]. Finally, the outcome is theseparate calculation of the thrust force for both the tool areas (maincutting edges and chisel edge) by adding up all the primitive forcecomponents calculated. An example of a thrust force calculation isanalytically presented in Fig. 4.
1882 P. Kyratsis et al. / Computer-Aided Design 43 (2011) 1879–1890
Fig. 4. Example of a thrust force calculation.
Fig. 5. Drilling experimental results.
2.4. Experimental verification
The accuracy of the DRILL3D drilling simulation model in cal-culating the thrust force was verified by executing the actual ex-periments on a HAAS 3-axis CNC machine center with continuousspeed and feed control within their boundaries and the specimen
usedwas a CK60 plate. A Kistler type 9257 BA three component dy-namometer was positioned between the machine center and thework piece. The signal was processed by a type 5233 A control unitand during the tests, the thrust force was displayed graphically onthe computermonitor and analyzed to enable early error detectionand ensure steady state condition (Fig. 5).
P. Kyratsis et al. / Computer-Aided Design 43 (2011) 1879–1890 1883
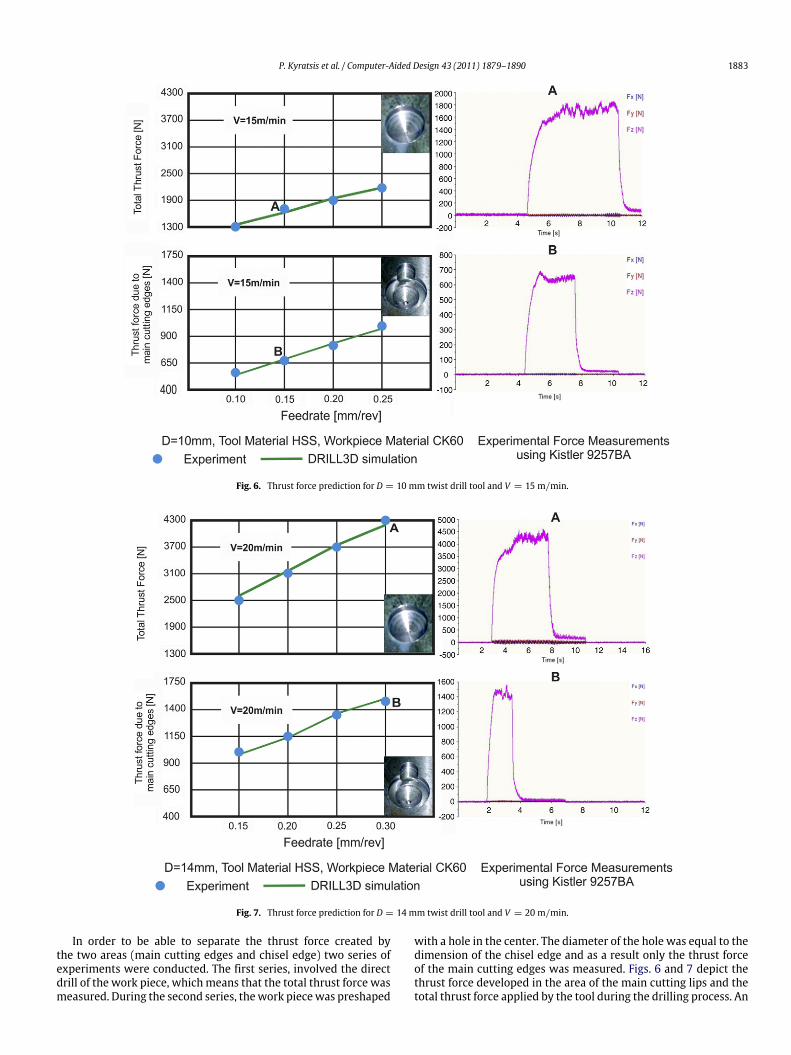
Fig. 6. Thrust force prediction for D = 10 mm twist drill tool and V = 15 m/min.
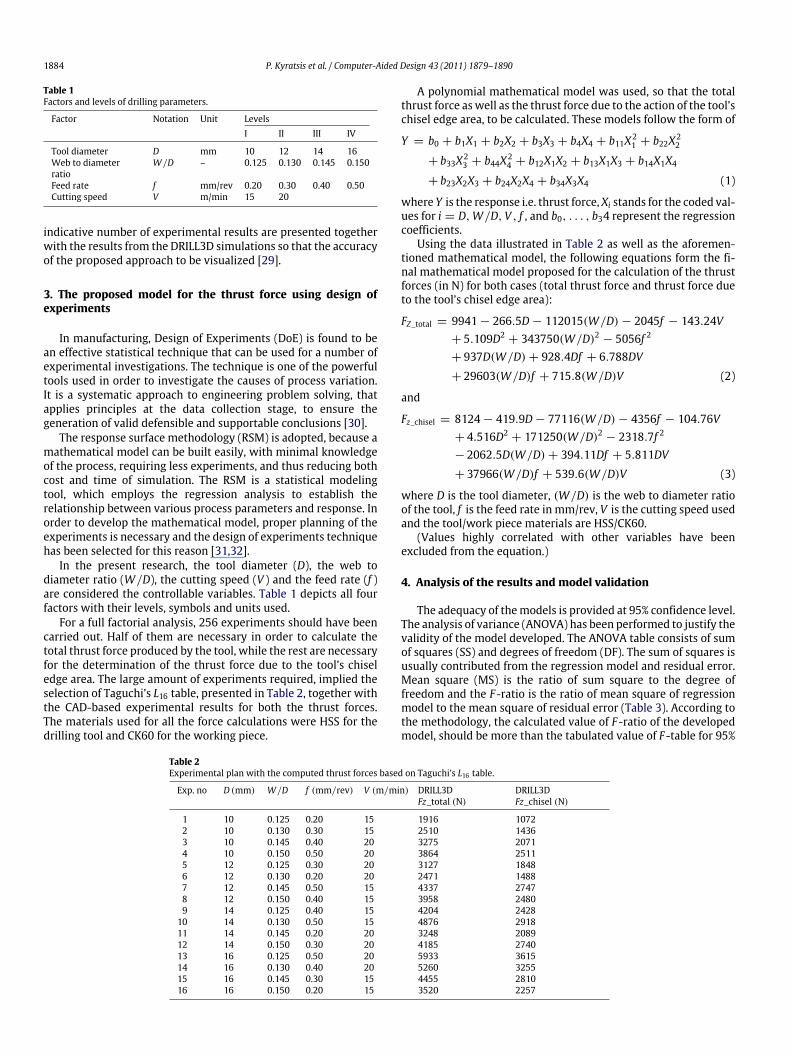
Fig. 7. Thrust force prediction for D = 14 mm twist drill tool and V = 20 m/min.
In order to be able to separate the thrust force created bythe two areas (main cutting edges and chisel edge) two series ofexperiments were conducted. The first series, involved the directdrill of the work piece, whichmeans that the total thrust force wasmeasured. During the second series, thework piecewas preshaped
with a hole in the center. The diameter of the hole was equal to thedimension of the chisel edge and as a result only the thrust forceof the main cutting edges was measured. Figs. 6 and 7 depict thethrust force developed in the area of the main cutting lips and thetotal thrust force applied by the tool during the drilling process. An
1884 P. Kyratsis et al. / Computer-Aided Design 43 (2011) 1879–1890
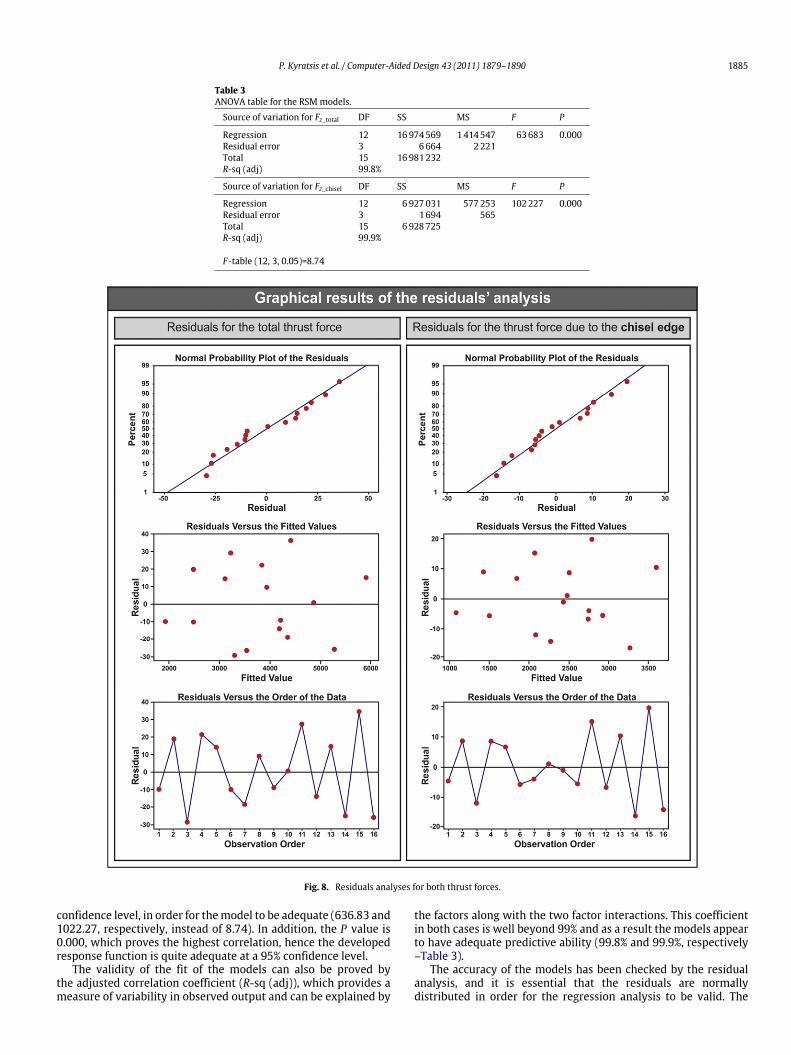
Table 1Factors and levels of drilling parameters.
Factor Notation Unit LevelsI II III IV
Tool diameter D mm 10 12 14 16Web to diameterratio
W/D – 0.125 0.130 0.145 0.150
Feed rate f mm/rev 0.20 0.30 0.40 0.50Cutting speed V m/min 15 20
indicative number of experimental results are presented togetherwith the results from the DRILL3D simulations so that the accuracyof the proposed approach to be visualized [29].
3. The proposed model for the thrust force using design ofexperiments
In manufacturing, Design of Experiments (DoE) is found to bean effective statistical technique that can be used for a number ofexperimental investigations. The technique is one of the powerfultools used in order to investigate the causes of process variation.It is a systematic approach to engineering problem solving, thatapplies principles at the data collection stage, to ensure thegeneration of valid defensible and supportable conclusions [30].
The response surface methodology (RSM) is adopted, because amathematical model can be built easily, with minimal knowledgeof the process, requiring less experiments, and thus reducing bothcost and time of simulation. The RSM is a statistical modelingtool, which employs the regression analysis to establish therelationship between various process parameters and response. Inorder to develop the mathematical model, proper planning of theexperiments is necessary and the design of experiments techniquehas been selected for this reason [31,32].
In the present research, the tool diameter (D), the web todiameter ratio (W/D), the cutting speed (V ) and the feed rate (f )are considered the controllable variables. Table 1 depicts all fourfactors with their levels, symbols and units used.
For a full factorial analysis, 256 experiments should have beencarried out. Half of them are necessary in order to calculate thetotal thrust force produced by the tool, while the rest are necessaryfor the determination of the thrust force due to the tool’s chiseledge area. The large amount of experiments required, implied theselection of Taguchi’s L16 table, presented in Table 2, together withthe CAD-based experimental results for both the thrust forces.The materials used for all the force calculations were HSS for thedrilling tool and CK60 for the working piece.
A polynomial mathematical model was used, so that the totalthrust force aswell as the thrust force due to the action of the tool’schisel edge area, to be calculated. These models follow the form of
Y = b0 + b1X1 + b2X2 + b3X3 + b4X4 + b11X21 + b22X2
2
+ b33X23 + b44X2
4 + b12X1X2 + b13X1X3 + b14X1X4
+ b23X2X3 + b24X2X4 + b34X3X4 (1)
where Y is the response i.e. thrust force, Xi stands for the coded val-ues for i = D,W/D, V , f , and b0, . . . , b34 represent the regressioncoefficients.
Using the data illustrated in Table 2 as well as the aforemen-tioned mathematical model, the following equations form the fi-nal mathematical model proposed for the calculation of the thrustforces (in N) for both cases (total thrust force and thrust force dueto the tool’s chisel edge area):
FZ_total = 9941 − 266.5D − 112015(W/D) − 2045f − 143.24V+ 5.109D2
+ 343750(W/D)2 − 5056f 2
+ 937D(W/D) + 928.4Df + 6.788DV
+ 29603(W/D)f + 715.8(W/D)V (2)
and
Fz_chisel = 8124 − 419.9D − 77116(W/D) − 4356f − 104.76V+ 4.516D2
+ 171250(W/D)2 − 2318.7f 2
− 2062.5D(W/D) + 394.11Df + 5.811DV
+ 37966(W/D)f + 539.6(W/D)V (3)
where D is the tool diameter, (W/D) is the web to diameter ratioof the tool, f is the feed rate in mm/rev, V is the cutting speed usedand the tool/work piece materials are HSS/CK60.
(Values highly correlated with other variables have beenexcluded from the equation.)
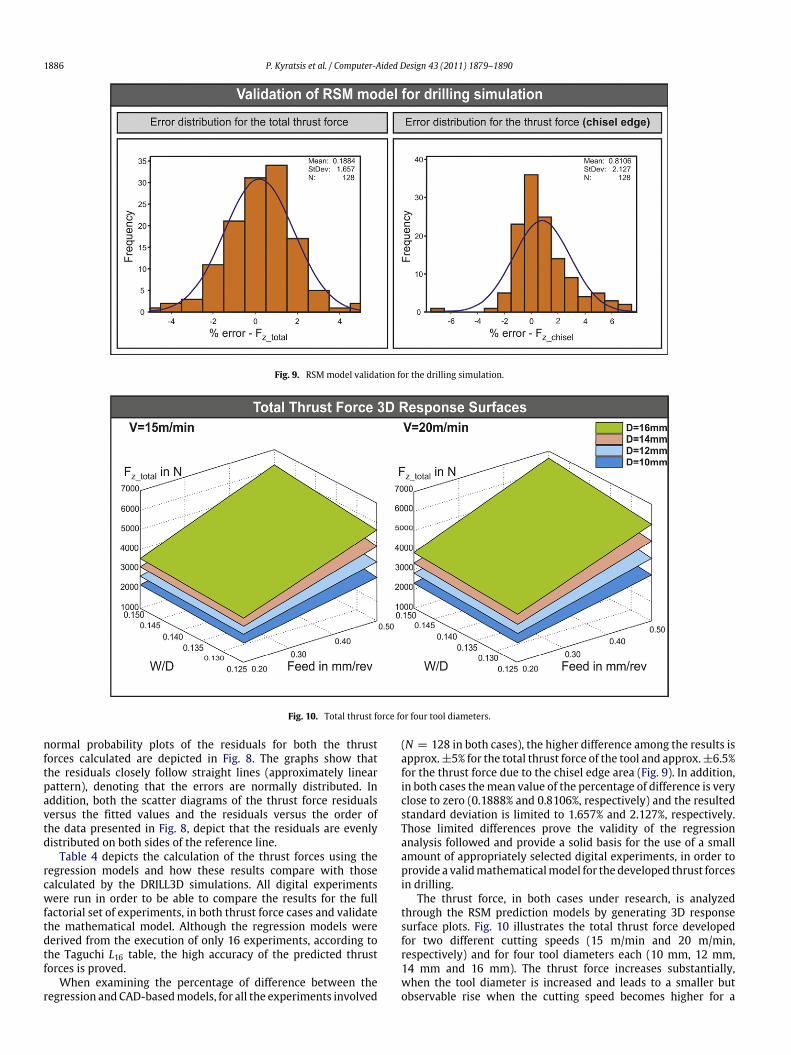
4. Analysis of the results and model validation
The adequacy of themodels is provided at 95% confidence level.The analysis of variance (ANOVA) has been performed to justify thevalidity of the model developed. The ANOVA table consists of sumof squares (SS) and degrees of freedom (DF). The sum of squares isusually contributed from the regression model and residual error.Mean square (MS) is the ratio of sum square to the degree offreedom and the F-ratio is the ratio of mean square of regressionmodel to the mean square of residual error (Table 3). According tothe methodology, the calculated value of F-ratio of the developedmodel, should be more than the tabulated value of F-table for 95%
Table 2Experimental plan with the computed thrust forces based on Taguchi’s L16 table.
Exp. no D (mm) W/D f (mm/rev) V (m/min) DRILL3DFz_total (N)
DRILL3DFz_chisel (N)
1 10 0.125 0.20 15 1916 10722 10 0.130 0.30 15 2510 14363 10 0.145 0.40 20 3275 20714 10 0.150 0.50 20 3864 25115 12 0.125 0.30 20 3127 18486 12 0.130 0.20 20 2471 14887 12 0.145 0.50 15 4337 27478 12 0.150 0.40 15 3958 24809 14 0.125 0.40 15 4204 2428
10 14 0.130 0.50 15 4876 291811 14 0.145 0.20 20 3248 208912 14 0.150 0.30 20 4185 274013 16 0.125 0.50 20 5933 361514 16 0.130 0.40 20 5260 325515 16 0.145 0.30 15 4455 281016 16 0.150 0.20 15 3520 2257
P. Kyratsis et al. / Computer-Aided Design 43 (2011) 1879–1890 1885
Table 3ANOVA table for the RSMmodels.
Source of variation for Fz_total DF SS MS F P
Regression 12 16974569 1414547 63683 0.000Residual error 3 6664 2221Total 15 16981232R-sq (adj) 99.8%
Source of variation for Fz_chisel DF SS MS F P
Regression 12 6927031 577253 102227 0.000Residual error 3 1694 565Total 15 6928725R-sq (adj) 99.9%
F-table (12, 3, 0.05)=8.74
Fig. 8. Residuals analyses for both thrust forces.
confidence level, in order for themodel to be adequate (636.83 and1022.27, respectively, instead of 8.74). In addition, the P value is0.000, which proves the highest correlation, hence the developedresponse function is quite adequate at a 95% confidence level.
The validity of the fit of the models can also be proved bythe adjusted correlation coefficient (R-sq (adj)), which provides ameasure of variability in observed output and can be explained by
the factors along with the two factor interactions. This coefficientin both cases is well beyond 99% and as a result the models appearto have adequate predictive ability (99.8% and 99.9%, respectively–Table 3).
The accuracy of the models has been checked by the residualanalysis, and it is essential that the residuals are normallydistributed in order for the regression analysis to be valid. The
1886 P. Kyratsis et al. / Computer-Aided Design 43 (2011) 1879–1890
Fig. 9. RSMmodel validation for the drilling simulation.
Fig. 10. Total thrust force for four tool diameters.
normal probability plots of the residuals for both the thrustforces calculated are depicted in Fig. 8. The graphs show thatthe residuals closely follow straight lines (approximately linearpattern), denoting that the errors are normally distributed. Inaddition, both the scatter diagrams of the thrust force residualsversus the fitted values and the residuals versus the order ofthe data presented in Fig. 8, depict that the residuals are evenlydistributed on both sides of the reference line.
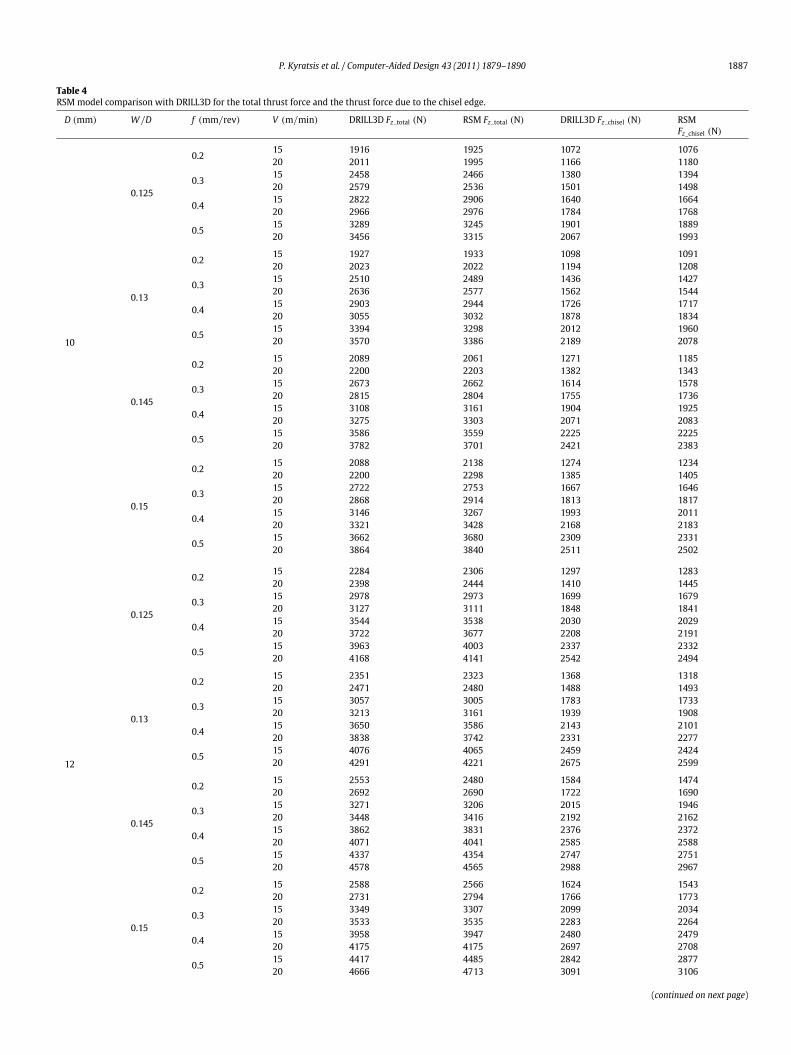
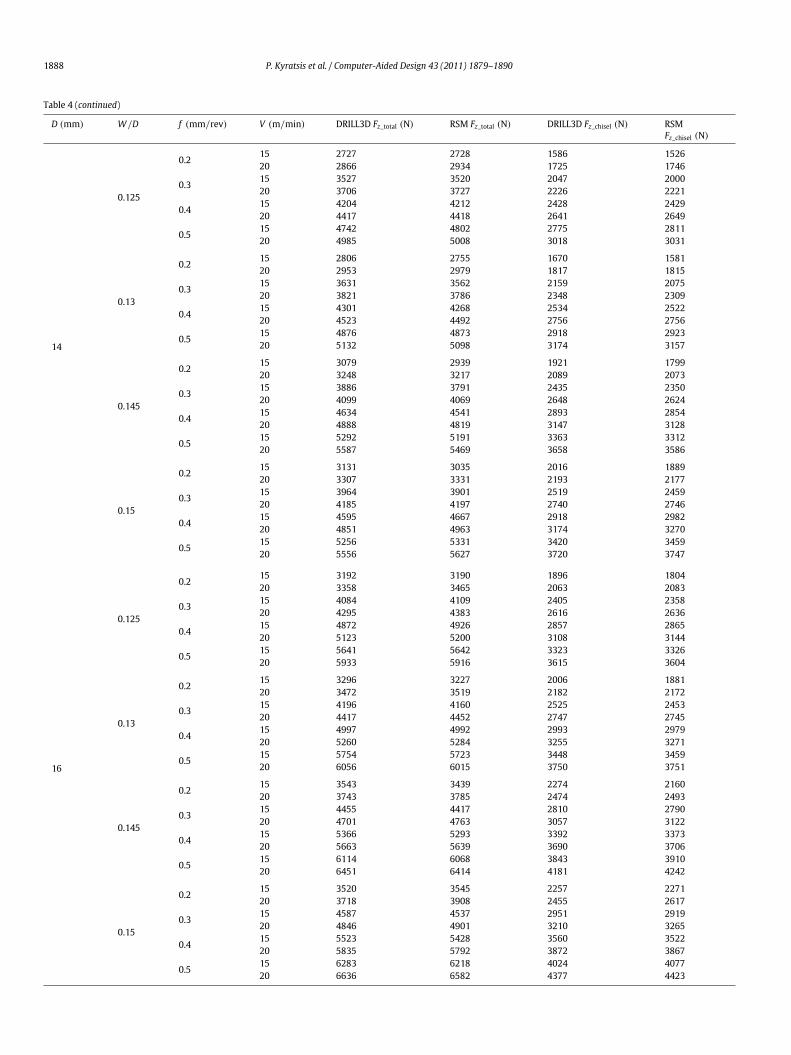
Table 4 depicts the calculation of the thrust forces using theregression models and how these results compare with thosecalculated by the DRILL3D simulations. All digital experimentswere run in order to be able to compare the results for the fullfactorial set of experiments, in both thrust force cases and validatethe mathematical model. Although the regression models werederived from the execution of only 16 experiments, according tothe Taguchi L16 table, the high accuracy of the predicted thrustforces is proved.
When examining the percentage of difference between theregression and CAD-basedmodels, for all the experiments involved
(N = 128 in both cases), the higher difference among the results isapprox.±5% for the total thrust force of the tool and approx.±6.5%for the thrust force due to the chisel edge area (Fig. 9). In addition,in both cases themean value of the percentage of difference is veryclose to zero (0.1888% and 0.8106%, respectively) and the resultedstandard deviation is limited to 1.657% and 2.127%, respectively.Those limited differences prove the validity of the regressionanalysis followed and provide a solid basis for the use of a smallamount of appropriately selected digital experiments, in order toprovide a validmathematicalmodel for the developed thrust forcesin drilling.
The thrust force, in both cases under research, is analyzedthrough the RSM prediction models by generating 3D responsesurface plots. Fig. 10 illustrates the total thrust force developedfor two different cutting speeds (15 m/min and 20 m/min,respectively) and for four tool diameters each (10 mm, 12 mm,14 mm and 16 mm). The thrust force increases substantially,when the tool diameter is increased and leads to a smaller butobservable rise when the cutting speed becomes higher for a
P. Kyratsis et al. / Computer-Aided Design 43 (2011) 1879–1890 1887
Table 4RSMmodel comparison with DRILL3D for the total thrust force and the thrust force due to the chisel edge.
D (mm) W/D f (mm/rev) V (m/min) DRILL3D Fz_total (N) RSM Fz_total (N) DRILL3D Fz_chisel (N) RSMFz_chisel (N)
10
0.125
0.215 1916 1925 1072 107620 2011 1995 1166 1180
0.315 2458 2466 1380 139420 2579 2536 1501 1498
0.415 2822 2906 1640 166420 2966 2976 1784 1768
0.515 3289 3245 1901 188920 3456 3315 2067 1993
0.13
0.215 1927 1933 1098 109120 2023 2022 1194 1208
0.315 2510 2489 1436 142720 2636 2577 1562 1544
0.415 2903 2944 1726 171720 3055 3032 1878 1834
0.515 3394 3298 2012 196020 3570 3386 2189 2078
0.145
0.215 2089 2061 1271 118520 2200 2203 1382 1343
0.315 2673 2662 1614 157820 2815 2804 1755 1736
0.415 3108 3161 1904 192520 3275 3303 2071 2083
0.515 3586 3559 2225 222520 3782 3701 2421 2383
0.15
0.215 2088 2138 1274 123420 2200 2298 1385 1405
0.315 2722 2753 1667 164620 2868 2914 1813 1817
0.415 3146 3267 1993 201120 3321 3428 2168 2183
0.515 3662 3680 2309 233120 3864 3840 2511 2502
12
0.125
0.215 2284 2306 1297 128320 2398 2444 1410 1445
0.315 2978 2973 1699 167920 3127 3111 1848 1841
0.415 3544 3538 2030 202920 3722 3677 2208 2191
0.515 3963 4003 2337 233220 4168 4141 2542 2494
0.13
0.215 2351 2323 1368 131820 2471 2480 1488 1493
0.315 3057 3005 1783 173320 3213 3161 1939 1908
0.415 3650 3586 2143 210120 3838 3742 2331 2277
0.515 4076 4065 2459 242420 4291 4221 2675 2599
0.145
0.215 2553 2480 1584 147420 2692 2690 1722 1690
0.315 3271 3206 2015 194620 3448 3416 2192 2162
0.415 3862 3831 2376 237220 4071 4041 2585 2588
0.515 4337 4354 2747 275120 4578 4565 2988 2967
0.15
0.215 2588 2566 1624 154320 2731 2794 1766 1773
0.315 3349 3307 2099 203420 3533 3535 2283 2264
0.415 3958 3947 2480 247920 4175 4175 2697 2708
0.515 4417 4485 2842 287720 4666 4713 3091 3106
(continued on next page)
1888 P. Kyratsis et al. / Computer-Aided Design 43 (2011) 1879–1890
Table 4 (continued)
D (mm) W/D f (mm/rev) V (m/min) DRILL3D Fz_total (N) RSM Fz_total (N) DRILL3D Fz_chisel (N) RSMFz_chisel (N)
14
0.125
0.215 2727 2728 1586 152620 2866 2934 1725 1746
0.315 3527 3520 2047 200020 3706 3727 2226 2221
0.415 4204 4212 2428 242920 4417 4418 2641 2649
0.515 4742 4802 2775 281120 4985 5008 3018 3031
0.13
0.215 2806 2755 1670 158120 2953 2979 1817 1815
0.315 3631 3562 2159 207520 3821 3786 2348 2309
0.415 4301 4268 2534 252220 4523 4492 2756 2756
0.515 4876 4873 2918 292320 5132 5098 3174 3157
0.145
0.215 3079 2939 1921 179920 3248 3217 2089 2073
0.315 3886 3791 2435 235020 4099 4069 2648 2624
0.415 4634 4541 2893 285420 4888 4819 3147 3128
0.515 5292 5191 3363 331220 5587 5469 3658 3586
0.15
0.215 3131 3035 2016 188920 3307 3331 2193 2177
0.315 3964 3901 2519 245920 4185 4197 2740 2746
0.415 4595 4667 2918 298220 4851 4963 3174 3270
0.515 5256 5331 3420 345920 5556 5627 3720 3747
16
0.125
0.215 3192 3190 1896 180420 3358 3465 2063 2083
0.315 4084 4109 2405 235820 4295 4383 2616 2636
0.415 4872 4926 2857 286520 5123 5200 3108 3144
0.515 5641 5642 3323 332620 5933 5916 3615 3604
0.13
0.215 3296 3227 2006 188120 3472 3519 2182 2172
0.315 4196 4160 2525 245320 4417 4452 2747 2745
0.415 4997 4992 2993 297920 5260 5284 3255 3271
0.515 5754 5723 3448 345920 6056 6015 3750 3751
0.145
0.215 3543 3439 2274 216020 3743 3785 2474 2493
0.315 4455 4417 2810 279020 4701 4763 3057 3122
0.415 5366 5293 3392 337320 5663 5639 3690 3706
0.515 6114 6068 3843 391020 6451 6414 4181 4242
0.15
0.215 3520 3545 2257 227120 3718 3908 2455 2617
0.315 4587 4537 2951 291920 4846 4901 3210 3265
0.415 5523 5428 3560 352220 5835 5792 3872 3867
0.515 6283 6218 4024 407720 6636 6582 4377 4423

P. Kyratsis et al. / Computer-Aided Design 43 (2011) 1879–1890 1889
Fig. 11. Thrust force due to the chisel edge for four tool diameters.
constant diameter. A similar trend of the thrust force due to thechisel edge area is illustrated in Fig. 11.
5. Conclusions
A combined use of CAD-based simulation and design ofexperiments has been presented in this paper, in order toaccurately calculate the developed thrust force on a drilling tool.The thrust forces under consideration involved both the totalthrust force and the thrust force due to the action of the chisel edgearea. Theywere both studiedwith respect to the tool diameter, theweb to diameter ratio, the feed rate and the cutting speed used. Thefull factorial analysis would demand 256 experiments; so designof experiments was adopted in order to reduce the amount of theexperiments. All the experimental work was based on DRILL3D, anovel drilling simulation application, which has been validated inthe previously published research work.
The combination of the CAD-based drilling simulation andthe design of experiments methodology was used in order toachieve higher level of verification, while at the same time toradically reduce the cost of the necessary experimental effort. Themathematical models produced based on the RSM methodology,proved to be very accurate and extremely easy to use since theyprovide a function, which can be used directly in a variety of otherapplications.
References
[1] Grzesik W. Advanced machining processes of metallic materials. Elsevier;2008.
[2] Armarego EJA. The unified-generalized mechanics of cutting approach—a steptowards a house of predictive performance models for machining operations.Machining Science & Technology 2000;4(3):319–62.
[3] Kang D, Armarego EJA. Computer-aided geometrical analysis of the flutingoperation for the twist drill design and production. I. Forward analysis andgenerated flute profile. Machining Science & Technology 2003;7(2):221–48.
[4] Kang D, Armarego EJA. Computer-aided geometrical analysis of the flutingoperation for the twist drill design and production. II. Backward analysis,wheel profile and simulation studies. Machining Science & Technology 2003;7(2):249–66.
[5] Wang J, Zhang QA. A study of high-performance plane rake faced twist drills.Part II: predictive force models. International Journal of Machine Tools andManufacture 2008;48:1286–95.
[6] Paul A, Kappor SG, Devor RE. Chisel edge and cutting lip shape optimizationfor improved twist drill point design. International Journal of Machine Toolsand Manufacture 2005;45:421–31.
[7] Koehler W. Analysis of the high performance drilling process: influence ofshape and profile of cutting edge of twist drills. Journal of ManufacturingScience and Engineering 2008; doi:10.1115/1.2951932.
[8] Claudin C, Poulachon G, Lambertin M. Correlation between drill geometry andmechanical forces in MQL conditions. Machining Science & Technology 2008;12:133–44.
[9] Abrao AM, Rubio JCC, Faria PE, Davim JP. The effect of cutting tool geometryon thrust force and delamination when drilling glass fibre reinforced plasticcomposite. Materials and Design 2008;29:508–13.
[10] Hamade RF, Seif CY, Ismail F. Extracting cutting forcé coefficients from frillingexperiments. International Journal of Machine Tools & Manufacture 2006;46:387–96.
[11] Singh I, Bhatnagar N, Viswanath P. Drilling of uni-directional glass fiberreinforcement plastics: experimental and finite element study. Materials andDesign 2008;29:546–53.
[12] Strenkowski JS, Hsieh CC, Shih AJ. An analytical finite element technique forpredicting thrust forcé and torque in drilling. International Journal of MachineTools and Manufacture 2004;44:1413–21.
[13] Zitoune R, Collombet F. Numerical prediction of the thrust force responsibleof delamination during the drilling of the long fibre composite structures.Composites Part A: Applied Science and Manufacturing 2007;38:858–66.
[14] Kadirgama K, Abou-El-Hossein KA, Mohammad B, Habeeb AA, Noor MM.Cutting force prediction model by FEA and RSM when machining HastelloyC-22HS with 90° holder. Journal of Scientific & Industrial Research 2008;67:421–7.
[15] Bagci E, Ozcelik B. Finite element and experimental investigation oftemperature changes on a twist drill in sequential dry drilling. InternationalJournal of Advanced Manufacturing Technology 2006;28:680–7.
[16] Vijayaraghavan A, Dornfeld D. Automated drill modeling for drilling processsimulation. Journal of Computing and Information Science in Engineering2007;7:276–83.
[17] ChandrasekaranM,MuralidharM,Murali KC, Dixit US. Application of comput-ing techniques in machining performance prediction and optimization: a lit-eratura review. International Journal of Advanced Manufacturing Technology2010;46:445–64.
[18] Laporte S, K’Nevez JY, CahucO. Phenomenologicalmodel for drilling operation.International Journal of Advanced Manufacturing Technology 2009;40:1–11.
[19] Tsao CC. Taguchi analysis of drilling quality associatedwith core dril in drillingof composite material. International Journal of Advanced ManufacturingTechnology 2007;32:877–84.
[20] Tsao CC. Prediction of thrust force of step drill in drilling composite materialby Taguchi method and radial basis function network. International Journal ofAdvanced Manufacturing Technology 2008;36:11–8.
[21] Tsao CC, Hocheng H. Evaluation of thrust force and surface roughness indrilling compositematerial using Taguchi analysis andneural network. Journalof Materials Processing Technology 2008;203:342–8.
[22] Basavarajappa S, Chandramohan G, Davim JP. Some studies on drilling ofhybrid metal matrix composites based on Taguchi techniques. Journal ofMaterials Processing Technology 2008;196:332–8.
[23] Hayajneh MT, Hassan AM, Mayyas AT. Artificial neural network modelingof the drilling process of self-lubricated aluminium/alumina/graphite hybridcomposites synthesized by powder metallurgy technique. Journal of Alloysand Compounds 2009;478:559–65.

1890 P. Kyratsis et al. / Computer-Aided Design 43 (2011) 1879–1890
[24] Zhang JZ, Chen JC. Surface roughness optimisation in a drilling operation usingthe Taguchi design method. Materials and Manufacturing Processes 2009;24:459–67.
[25] Kyratsis P, Bilalis N, Antoniadis A. CAD based predictive models of theundeformed chip geometry in drilling. International Journal of MechanicalSystems Science and Engineering 2009;1:129–35.
[26] Kyratsis P, Tapoglou N, Bilalis N, Antoniadis A. Thrust force prediction oftwist drill tools using a 3D CAD system application programming interface.International Journal of Machining and Machinability of Materials [in press].
[27] Galloway G. Some experiments on the influence of various factors on drillperformance. ASME Transactions 1957;79:191–231.
[28] Konig W, Essel K. Spezifische schnittkraftwerte für die zerspanung metallis-cher werkstoffe. Dusseldorf: Verlag Stahleisen MBH; 1973.
[29] Kyratsis P. Simulation of the drilling manufacturing process using a CAD/CAMsystem. Ph.D. thesis. Technical University of Crete; 2011.
[30] Cohran WG, Cox GM. Experimental design. New York: John Wiley and Sons;1992.
[31] Montgomery DC. Design and analysis of experiments. New York: John Wileyand Sons; 2001.
[32] Myers RH, Montgomery DC. Response surface methodology: process andproduct optimization using designed experiments. New York: JohnWiley andSons; 1995.