C hin a E ve rb rig ht B a nk - HKEXnews
164
China Everbright Bank Company Limited (a joint stock company incorporated in the People’s Republic of China with limited liability) Stock Code : 6818 2016 INTERIM REPORT
-
Upload
khangminh22 -
Category
Documents
-
view
0 -
download
0
Transcript of C hin a E ve rb rig ht B a nk - HKEXnews

China Everbright Bank Company Limited(a joint stock company incorporated in the People’s Republic of China with limited liability)
Stock Code : 6818
Address: Everbright Center, No.25 Taipingqiao Ave, Xicheng District, Beijing P. R. China.Tel: (86)10-63636363Fax: (86)10-63639066Postal Code: 100033Website: www.cebbank.com
This interim report is printed on environmentally friendly paper.
Ch
ina E
verbrig
ht Bank
INTERIM
REPORT
2016
2016INTERIM REPORT


Contents
Important Notice and Definition 2
Corporate Information 4
Summary of Accounting Data and Financial Indicators
6
Management Discussion and Analysis 10
Significant Events 39
Changes in Ordinary Shares and Shareholders
43
Changes in Preference Shares and Shareholders
48
Directors, Supervisors, Senior Management, Staff and Branch Outlets
50
Corporate Governance 54
Interim Financial Information and Review Report
57

CH
INA
EVER
BR
IGH
T B
ANK
2
Important Notice and DefinitionI. Important Notice
(I) The Board of Directors, Board of Supervisors and Directors, Supervisors and Senior Management of the Bank hereby warrant the authenticity, accuracy and completeness of the contents of this report and that there are no false representations, misleading statements or material omissions, and jointly and severally accept full responsibility for the information in this report.
(II) The Bank will not implement any profit distribution or capitalization of capital reserves for the first half of 2016.
(III) The 2nd meeting of the Seventh Session of the Board of Directors of the Bank was convened on 26 August, 2016 by written resolution, at which the 2016 Interim Report of the Bank was considered and approved. 14 directors were entitled to vote and 14 of them casted their votes.
(IV) The financial statements of the Bank for the first half of 2016 were prepared in accordance with the PRC Generally Accepted Accounting Principles (respectively “PRC GAAP”) and the International Financial Reporting Standards (“IFRSs”) and have been reviewed by Ernst & Young Hua Ming LLP and Ernst & Young in accordance with China and International Standards on Review Engagements, respectively.
(V) Mr. Tang Shuangning, Chairman of the Board of Directors, Mr. Zhang Jinliang, President and Mr. Xie Rong, Independent Non-Executive Director hereby warrant the authenticity, accuracy and completeness of the financial statements in this report.
(VI) Unless otherwise stated, all monetary sums stated in this report are expressed in Renminbi/RMB.
(VII) Forward-looking statements such as future plans of the Bank mentioned in this report do not constitute actual commitments of the Bank to the investors. Investors are cautioned against the investment risks.
(VIII) In this report, “We/we”, the “Company”, the “Bank”, “our Company”, “Whole Bank” and “China Everbright Bank” refer to China Everbright Bank Company Limited, and the “Group” refers to China Everbright Bank Company Limited and its subsidiaries.

2016 Interim
Rep
ort
3
II. Definition
(I) In this report, unless the context otherwise requires, the following terms shall have the meanings set out below:
Ministry of Finance : Ministry of Finance of the People’s Republic of ChinaCentral Bank : The People’s Bank of ChinaCBRC : China Banking Regulatory CommissionCSRC : China Securities Regulatory CommissionCIC : China Investment CorporationCHI : Central Huijin Investment Ltd.Everbright Group : China Everbright Group LimitedSSE : Shanghai Stock ExchangeHKSE : The Stock Exchange of Hong Kong Limited
(II) The terms in this report are general concepts adopted in the banking industry. For certain special terms used in connection with products of the Bank which may cause difficulty in understanding their technical meanings, investors please refer to the 2015 annual report of the Bank.

CH
INA
EVER
BR
IGH
T B
ANK
4
Corporate InformationI. Name of the Bank
Registered Chinese Company Name: 中國光大銀行股份有限公司 (Abbreviation: 中國光大銀行 or 光大銀行)Registered English Company Name: CHINA EVERBRIGHT BANK COMPANY LIMITED
(Abbreviation: CEB BANK)
II. Relevant Parties
Legal Representative: Tang ShuangningAuthorized Representatives: Ma Teng, Cai YungeSecretary to the Board of Directors, Company Secretary: Cai YungeSecurities Affairs Representative: Li JiayanAssistant to Company Secretary: Lee Mei Yi
III. Contacts
Contact Address: China Everbright Center, No. 25 Taipingqiao Avenue, Xicheng District, BeijingPostal code: 100033Tel: 010-63636363Fax: 010-63636713E-mail: [email protected] hotline: 010-63636388
IV. Corporate information
Registered and Office Address: China Everbright Center, No. 25 and 25 A Taipingqiao Avenue, Xicheng District, Beijing
Business license registration number for enterprise legal person: 100000000011748Code of financial authority: B0007H111000001Tax registration No: 110102100011743Code of organisation: 10001174-3
V. Principal Place of Business in Hong Kong
Hong Kong Branch of the Company: 30/F, Far East Finance Centre, No. 16, Harcourt Road, Admiralty, Hong Kong
VI. Newspaper and Website Designated for Information Disclosure
Mainland China: China Securities Journal, Shanghai Securities News, Securities Times, Securities DailyWebsites designated by CSRC for publication of A share interim report:SSE’s website: www.sse.com.cnBank’s website: www.cebbank.comWebsites designated by HKSE for publication of H share interim report:HKSE’s website: www.hkex.com.hkBank’s website: www.cebbank.comCopies of interim report are available at: Office of the Board of Directors of the Bank

2016 Interim
Rep
ort
5
VII. Stock Exchanges for Listing of Shares:
A Share: Shanghai Stock Exchange (SSE)Abbreviated name of Ordinary Shares: Everbright Bank; Stock code of Ordinary Shares: 601818Abbreviated name of Preference Shares: Everbright P 1, Everbright P 2;Stock code of Preference Shares: 360013, 360022 (SSE Comprehensive Business Platform)H Share: The Stock Exchange of Hong Kong Limited (HKSE)Abbreviated name: CEB Bank; Stock code: 6818
VIII. Auditors of the reporting period
Domestic Auditor: Ernst & Young Hua Ming LLPOffice Address: 16/F, Ernst & Young Tower, Oriental Plaza, No.1 East Chang An Avenue, BeijingCertified Public Accountants for Signature: Liang Chengjie, Gu JunOverseas Auditor: Ernst & YoungOffice Address: 22/F, CITIC Tower, 1 Tim Mei Avenue, Central, Hong Kong
IX. Legal Advisors to the Board in the reporting period
A Share Legal Advisor: Jun He Law OfficesH Share Legal Advisor: Herbert Smith Freehills
X. Share Depository
A Share and Preference Shares Depository: Shanghai Branch, China Securities Depository and Clearing Corporation Limited
Office Address: 36/F, China Insurance Building, No. 166 Lujiazui East Road, Pudong New District, ShanghaiH Share Registrar: Computershare Hong Kong Investor Services LimitedOffice Address: Rooms 1712-1716, 17/F, Hopewell Centre, 183 Queen’s Road East, Wan Chai, Hong Kong

CH
INA
EVER
BR
IGH
T B
ANK
6
Summary of Accounting Data and Financial IndicatorsI. Key Financial Data and Indicators
ItemJanuary –
June, 2016January –
June, 2015Change
(%)January –
June, 2014
Operating performance (RMB million)Net interest income 32,625 32,105 1.62 27,838Net fee and commission income 13,898 13,558 2.51 8,632Operating income 47,081 45,587 3.28 37,560Operating expenses (15,413) (15,710) -1.89 (13,661)Impairment losses on assets (9,956) (8,387) 18.71 (3,128)Total Profit 21,712 21,490 1.03 20,771Net profit 16,468 16,267 1.24 15,872Net profit attributable to equity shareholders of the Bank 16,439 16,241 1.22 15,845Basic and diluted earnings per share 0.33 0.35 -5.71 0.34
ItemJanuary –
June, 2016January –
June, 2015 ChangeJanuary –
June, 2014
Profitability indicators (%)Return on average total assets 0.95 1.13 -0.18
percentage point1.25
Return on weighted average equity 14.55 17.30 -2.75percentage points
19.40
Net interest spread 1.68 2.03 -0.35percentage point
1.99
Net interest margin 1.88 2.27 -0.39percentage point
2.25
Proportion of fee and commission income in operating income
29.52 29.74 -0.22percentage point
22.98
Cost-to-income ratio 27.49 26.69 +0.80percentage point
28.38

2016 Interim
Rep
ort
7
ItemJune 30,
2016December 31,
2015Change
(%)December 31,
2014
Scale indicators (RMB million)Total assets 3,764,912 3,167,710 18.85 2,737,010 Balance of loans 1,700,372 1,513,543 12.34 1,299,455 Loan impairment allowances (38,324) (38,119) 0.54 (28,025)Total liabilities 3,534,984 2,943,663 20.09 2,557,527 Deposits from customers 2,177,369 1,993,843 9.20 1,785,337Equity attributable to equity shareholders of the Bank 229,345 223,493 2.62 178,975Share capital 46,679 46,679 – 46,679Net asset per share attributable to equity shareholders of the Bank 4.49 4.36 2.98 3.83
Asset quality indicators (%)Non-performing loan ratio 1.50 1.61 -0.11
percentage point1.19
Provision coverage ratio 150.25 156.39 -6.14percentage points
180.52
Provision-to-loan ratio 2.25 2.52 -0.27percentage point
2.16
Note: The calculation of basic and diluted earnings per share, return on weighted average equity, return on net asset per share attributable to equity shareholders of the Bank excluded the effect of the issuance of preference shares. And it is same thereafter.
II. Supplementary Financial Indicators
Unit: %
ItemStandard
ValueJune 30,
2016December 31,
2015December 31,
2014
Liquidity ratio RMB ≥25 57.23 54.90 45.90Foreign currency ≥25 55.51 98.87 109.61
Loan to deposit ratio RMB – 76.45 74.90 70.86Currencies converted into RMB – 75.95 73.59 70.10
Loan exposure to single largest customer ratio ≤10 2.29 2.38 3.05Loan exposure to top ten customers ratio ≤50 12.55 11.86 15.19
Note: The above data of the Bank is calculated in accordance with the regulatory requirements of the CBRC.

CH
INA
EVER
BR
IGH
T B
ANK
8
Summary of Accounting Data and Financial Indicators
III. Capital Composition and Changes
Capital adequacy ratios calculated in accordance with the Regulation Governing Capital of Commercial Banks (Provisional) (released by CBRC on June 7, 2012) are as follows:
Unit: RMB million, %June 30, 2016 December 31, 2015
Item ConsolidatedNon-
consolidated ConsolidatedNon-
consolidated
1. Total net capital 264,418 257,836 259,482 253,1201.1 Core tier-1 capital 209,852 207,634 203,950 202,0131.2 Core tier-1 capital deductions (2,091) (5,456) (2,115) (5,479)1.3 Net core tier-1 capital 207,761 202,178 201,835 196,5341.4 Other tier-1 capitals 20,012 19,965 19,992 19,9651.5 Other tier-1 capital deductions – – – –1.6 Net tier-1 capital 227,773 222,143 221,827 216,4991.7 Tier-2 capital 36,645 35,693 37,655 36,6211.8 Tier-2 capital deductions – – – –2. Credit risk weighted asset 2,273,440 2,220,462 2,032,386 1,993,8753. Market risk weighted asset 11,216 11,005 4,970 4,9704. Operational risk weighted asset 148,160 146,445 148,160 146,4455. Total risk weighted asset 2,432,816 2,377,912 2,185,516 2,145,2906. Core tier-1 capital adequacy ratio 8.54 8.50 9.24 9.167. Tier-1 capital adequacy ratio 9.36 9.34 10.15 10.098. Capital adequacy ratio 10.87 10.84 11.87 11.80
Note:
1. All domestic and overseas branches, as well as invested financial institutions within the scope of consolidated management should calculate the consolidated capital adequacy ratios in accordance with the Regulation Governing Capital of Commercial Banks (Provisional). The invested financial institutions within the scope of consolidated management include Everbright Financial Leasing Co., Ltd., Shaoshan Everbright Village Bank Co., Ltd., Jiangsu Huai’an Everbright Village Bank Co., Ltd. and CEB International Investment Corporation Limited.
2. Core tier-1 net capital = Core tier-1 capital – Core tier-1 capital deductions; Net tier-1 capital = Net core tier-1 capital + Other tier-1 capital – Other tier-1 capital deductions; Total net capital = Net tier-1 capital + Tier-2 capital – Tier-2 capital deductions.
3. Please refer to the website of the Bank for details of the capital composition.

2016 Interim
Rep
ort
9
IV. Leverage Ratio
For the end of the reporting period, the leverage ratio calculated by the Group pursuant to the Regulation Governing Leverage Ratio of Commercial Banks issued by the CBRC was 5.30%, representing a decrease of 0.65 percentage point as compared with the leverage ratio at the end of 2015. For further details, please refer to “Unaudited supplementary financial information to the financial statements”.
V. Liquidity Coverage Ratio
Please refer to “Unaudited supplementary financial information to the financial statements”.

CH
INA
EVER
BR
IGH
T B
ANK
10
Management Discussion and AnalysisI. Overall Operations of the Bank
(I) Assets and liabilities moderately increased
At the end of the reporting period, the total assets of the Group were RMB3,764,912 million, representing an increase of RMB597,202 million or 18.85% as compared with those at the end of the previous year. The balance of all items of loans were RMB1,700,372 million, representing an increase of RMB186,829 million or 12.34% as compared with those at the end of the previous year. The total liabilities were RMB3,534,984 million, representing an increase of RMB591,321 million or 20.09% as compared with the end of the previous year, among which, the total deposits from customers were RMB2,177,369 million, representing an increase of RMB183,526 million or 9.20% as compared with the end of the previous year.
(II) Profitability remained stable
During the reporting period, operating income of the Group was RMB47,081 million, representing a year-on-year increase of RMB1,494 million or 3.28%. Operating expenses were RMB15,413 million, representing a year-on-year decrease of RMB297 million or 1.89%. Total profit was RMB21,712 million, representing a year-on-year increase of RMB222 million or 1.03%. Net profit was RMB16,468 million, representing a year-on-year increase of RMB201 million or 1.24%.
(III) Progress was made in structural readjustment
During the reporting period, the Group’s business with low capital requirements grew fast and the weight of risk assets decreased by 1.55 percentage points, so that the asset structure was improved. The Group conscientiously reduced its active liabilities and raised the proportion of core deposits by 3.63 percentage points, thus putting the cost of liabilities well under control. The Group also reinforced the revenue of traditional business and expanded E-banking, agency, precious metal and custody business, leading to a more diversified source of income.
(IV) Overall risk control was achieved
As at the end of the reporting period, the Group’s non-performing loans were RMB25,507 million, representing an increase of RMB1,132 million as compared with the end of the previous year. Non-performing loan ratio was 1.50%, down by 0.11 percentage point as compared with the end of the previous year. Credit provision coverage ratio was 150.25%, down by 6.14 percentage points as compared with the end of the previous year.
(V) Capital adequacy ratio consistently met the target
As at the end of the reporting period, the Group’s capital adequacy ratio reached 10.87%, down by 1.00 percentage point as compared with that at the end of the previous year. Core tier-1 capital adequacy ratio was 8.54%, down by 0.70 percentage point as compared with that at the end of the previous year. Tier-1 capital adequacy ratio was 9.36%, down by 0.79 percentage point as compared with that at the end of the previous year. All tiers of the Group’s capital adequacy ratio consistently met the regulatory requirements.
2016 Interim
Rep
ort
11
II. Income Statement Analysis
(I) Changes in items of Income Statement
Unit: RMB million
ItemJanuary –
June, 2016January –
June, 2015 Change
Net interest income 32,625 32,105 520Net fee and commission income 13,898 13,558 340Net trading gains/(losses) 546 (337) 883Dividend income – 4 (4)Net (losses)/gains arising from investment securities (77) 5 (82)Net foreign exchange (losses)/gains (174) 160 (334)Other operating income 263 92 171Operating expenses 15,413 15,710 (297)Impairment losses on assets 9,956 8,387 1,569Total profit 21,712 21,490 222Income tax 5,244 5,223 21Net profit 16,468 16,267 201Net profit attributable to equity shareholders of the Bank 16,439 16,241 198
(II) Operating income
During the reporting period, operating income of the Group was RMB47,081 million, representing a year-on-year increase of RMB1,494 million or 3.28%, of which, the proportion of net interest income was 69.30%, representing a year-on-year decrease of 1.13 percentage points and the proportion of net fee and commission income was 29.52%, representing a year-on-year decrease of 0.22 percentage point. The Group carried out its “Business Tax to Value-added Tax” reform since May 1, 2016, while the price and tax are separated upon income recognition, which may post certain influence to the income for the current period and its year-on-year increase.
Unit: %
ItemJanuary –
June, 2016January –
June, 2015
The proportion of Net interest income 69.30 70.43The proportion of Net fee and commission income 29.52 29.74The proportion of Other income 1.18 (0.17)The proportion of Total operating income 100.00 100.00

CH
INA
EVER
BR
IGH
T B
ANK
12
Management Discussion and Analysis
(III) Net interest income
During the reporting period, the Group’s net interest income was RMB32,625 million, representing a year-on-year increase of RMB520 million or 1.62%, and in the meanwhile, its net interest spread was 1.68%, representing a year-on-year decrease of 35 basis points; and net interest margin was 1.88%, representing a year-on-year decrease of 39 basis points.
Unit: RMB million, %January – June, 2016 January – June, 2015
ItemAverageBalance
Interestincome/expense
Averageyield/cost
AverageBalance
Interestincome/expense
Averageyield/cost
Interest-earning assetsLoans and advances 1,641,799 38,587 4.70 1,378,775 41,245 5.98Finance lease receivables 45,150 892 3.95 28,178 652 4.63Investments 1,020,862 21,304 4.17 684,359 18,212 5.32Deposits with the central bank 349,651 2,600 1.49 343,857 2,524 1.47Placements and deposits with financial institutions and financial assets held under resale agreements 406,523 6,227 3.06 387,592 8,516 4.39Total interest-earning assets 3,463,985 69,610 4.02 2,822,761 71,149 5.04Interest income – 69,610 – – 71,149 –
Interest-bearing liabilitiesDeposits from customers 2,090,200 21,649 2.07 1,815,795 23,962 2.64Deposits from banks and other financial institutions, placements and amount sold under repurchase agreements 788,981 10,554 2.68 649,046 12,203 3.76Debt securities issued 282,143 4,782 3.39 127,922 2,879 4.50Total interest-bearing liabilities 3,161,324 36,985 2.34 2,592,763 39,044 3.01Interest expense – 36,985 – – 39,044 –
Net interest income – 32,625 – – 32,105 –Net interest spread – – 1.68 – – 2.03Net interest margin – – 1.88 – – 2.27
Note:
1. Net interest spread is the difference between average yield of total interest-earning assets and average cost of total interest-bearing liabilities;
2. Net interest margin is net interest income divided by the average balance of total interest-earning assets.

2016 Interim
Rep
ort
13
(IV) Interest income
During the reporting period, the Group’s interest income, mainly from loans and advances, was RMB69,610 million, representing a year-on-year decrease of RMB1,539 million or 2.16%.
1. Interest income from loans and advances
The Group’s interest income from loans and advances was RMB38,587 million, representing a year-on-year decrease of RMB2,658 million or 6.44%, mainly due to the year-on-year decrease in its average yields.
Unit: RMB million, %January – June, 2016 January – June, 2015
ItemAveragebalance
Interestincome
Averageyield
Averagebalance
Interestincome
Averageyield
Corporate loans 1,015,654 23,342 4.60 854,770 26,029 6.09Retail loans 552,748 12,999 4.70 473,101 13,749 5.81Discounted bills 73,397 2,246 6.12 50,904 1,467 5.76Total loans and advances 1,641,799 38,587 4.70 1,378,775 41,245 5.98
2. Interest income from investments
The Group’s interest income from investments was RMB21,304 million, representing a year-on-year increase of RMB3,092 million or 16.98%, mainly due to the year-on-year increase in its average balance.
3. Interest income from placements and deposits with financial institutions and financial assets held under resale agreements
The Group’s interest income from placements and deposits with financial institutions and assets held under resale agreements was RMB6,227 million, representing a year-on-year decrease of RMB2,289 million or 26.88%, mainly due to the year-on-year decrease in its average yields.
(V) Interest expense
During the reporting period, the Group’s interest expense was RMB36,985 million, representing a year-on-year decrease of RMB2,059 million or 5.27%. Interest expense on deposits from customers is a major part of the Group’s interest expense.

CH
INA
EVER
BR
IGH
T B
ANK
14
Management Discussion and Analysis
1. Interest expense on deposits from customers
Interest expense on deposits from customers was RMB21,649 million, representing a year-on-year decrease of RMB2,313 million or 9.65%, mainly due to the year-on-year decrease in its average costs.
Unit: RMB million, %January – June, 2016 January – June, 2015
ItemAverageBalance
Interestexpense
Averagecost
AverageBalance
Interestexpense
Averagecost
Corporate deposits 1,623,362 16,672 2.05 1,389,839 17,839 2.57Including: Corporate demand deposits 533,593 1,650 0.62 445,699 1,558 0.70 Corporate time deposits 1,089,769 15,022 2.76 944,140 16,281 3.45Retail deposits 466,838 4,977 2.13 425,956 6,123 2.87Including: Retail demand deposits 138,825 293 0.42 109,182 325 0.60 Retail time deposits 328,013 4,684 2.86 316,774 5,798 3.66Total deposits from customers 2,090,200 21,649 2.07 1,815,795 23,962 2.64
2. Interest expense on placements and deposits from banks and other financial institutions, and financial assets sold under repurchase agreements
Interest expense on placements and deposits from banks and other financial institutions, and financial assets sold under repurchase agreements of the Group was RMB10,554 million, representing a year-on-year decrease of RMB1,649 million or 13.51%, mainly due to the year-on-year decrease in its average costs.
3. Interest expense on debt securities issued
The Group’s interest expense on debt securities issued was RMB4,782 million, representing a year-on-year increase of RMB1,903 million or 66.10%, mainly due to the year-on-year increase in its average balance of debt securities issued.

2016 Interim
Rep
ort
15
(VI) Net fee and commission income
During the reporting period, the Group’s net fee and commission income was RMB13,898 million, representing a year-on-year increase of RMB340 million or 2.51%, mainly due to the significant increase in agency service fees and bank card service fees, of which, income from agency service fees increased by RMB355 million year-on-year or 56.62%, and income from bank card service fees increased by RMB290 million year-on-year or 4.72%.
Unit: RMB million
ItemJanuary –
June, 2016January –
June, 2015
Fee and commission income 14,602 14,211 Underwriting and advisory fees 762 913 Bank card service fees 6,434 6,144 Settlement and clearing fees 541 829 Wealth management service fees 3,646 3,651 Acceptance and guarantee fees 466 599 Agency service fees 982 627 Custody and other fiduciary business fees 912 815 Others 859 633Fee and commission expense (704) (653)Net fee and commission income 13,898 13,558
(VII) Other income
During the reporting period, the Group’s other income was RMB558 million, representing a year-on-year increase of RMB634 million, mainly due to the increase in net trading gains.
Unit: RMB million
ItemJanuary –
June, 2016January –
June, 2015
Net trading gains/(losses) 546 (337)Dividend income – 4Net (losses)/gains arising from investment securities (77) 5Net foreign exchange (losses)/gains (174) 160Other operating income 263 92Total 558 (76)

CH
INA
EVER
BR
IGH
T B
ANK
16
Management Discussion and Analysis
(VIII) Operating expenses
During the reporting period, the Group’s operating expenses were RMB15,413 million, a year-on-year decrease of RMB297 million or 1.89%. Cost-to-income ratio was 27.49%, representing a year-on-year increase of 0.80 percentage point.
Unit: RMB million
ItemJanuary –
June, 2016January –
June, 2015
Staff costs 7,995 7,761Premises and equipment expenses 2,318 2,191Business tax and surcharges 2,472 3,543Others 2,628 2,215Total operating expense 15,413 15,710
(IX) Impairment losses on assets
During the reporting period, impairment losses on assets of the Group were RMB9,956 million, representing a year-on-year increase of RMB1,569 million or 18.71%, mainly due to the increase in impairment losses on loans and advances to customers.
Unit: RMB million
ItemJanuary –
June, 2016January –
June, 2015
Impairment losses on loans and advances to customers 9,330 7,687Impairment losses on finance lease receivables 332 161Impairment losses on held-to-maturity investments 102 1Impairment losses on available-for-sale financial assets 34 –Impairment losses on debt securities classified as receivables – 494Others 158 44Total impairment losses on assets 9,956 8,387
(X) Income tax
During the reporting period, the Group’s income tax was RMB5,244 million, representing a year-on-year increase of RMB21 million or 0.40%.

2016 Interim
Rep
ort
17
III. Balance Sheet Analysis
(I) Assets
At the end of the reporting period, the total assets of the Group reached RMB3,764,912 million, representing an increase of RMB597,202 million or 18.85% as compared with those at the end of the previous year, mainly due to the increase in business including loans and advances to customers, investment securities and other financial assets and etc.
Unit: RMB million, %June 30, 2016 December 31, 2015
Item Balance Percentage Balance Percentage
Total loans and advances to customers 1,700,372 – 1,513,543 –Provision for impairment of loans (38,324) – (38,119) –Net loans and advances to customers 1,662,048 44.15 1,475,424 46.58Deposits with banks and other financial institutions 168,085 4.46 86,311 2.72Cash and deposits with the Central Bank 389,003 10.34 326,735 10.31Investment securities and other financial assets 1,259,998 33.47 905,496 28.59Placements with banks and other financial institutions, and financial assets held under resale agreements 172,559 4.58 285,406 9.01Finance lease receivables 51,952 1.38 38,735 1.22Interest receivable 20,365 0.54 18,546 0.59Fixed assets 13,333 0.35 12,646 0.40Goodwill 1,281 0.03 1,281 0.04Deferred tax assets 3,739 0.10 3,923 0.12Other assets 22,549 0.60 13,207 0.42Total assets 3,764,912 100.00 3,167,710 100.00
1. Loan and advances
At the end of the reporting period, the Group’s total loans and advances to customers were RMB1,700,372 million, representing an increase of RMB186,829 million or 12.34% as compared with those at the end of the previous year. Net loans and advances to customers accounted for 44.15% of total assets, representing a decrease of 2.43 percentage points as compared with that at the end of the previous year. It was mainly due to the rapid increase in investment securities and placements with banks and other financial institutions, which accounted for a larger proportion of the Bank’s total assets.
Unit: RMB million, %June 30, 2016 December 31, 2015
Item Balance Percentage Balance Percentage
Corporate loans 1,035,423 60.89 917,327 60.61Retail loans 590,280 34.72 525,020 34.69Discounted bills 74,669 4.39 71,196 4.70Total loans and advances to customers 1,700,372 100.00 1,513,543 100.00

CH
INA
EVER
BR
IGH
T B
ANK
18
Management Discussion and Analysis
2. Investments
At the end of the reporting period, the Group’s investments in securities and other financial assets were RMB1,259,998 million, representing an increase of RMB354,502 million as compared with those at the end of the previous year, accounting for 33.47% of total assets, and representing an increase of 4.88 percentage points as compared with that at the end of the previous year.
Unit: RMB million, %June 30, 2016 December 31, 2015
Item Balance Percentage Balance Percentage
Financial assets at fair value through profit or loss 13,249 1.05 5,637 0.62Positive fair value of derivatives 1,998 0.16 1,625 0.18Available-for-sale financial assets 334,208 26.52 222,495 24.57Held-to-maturity investments 178,245 14.15 152,312 16.82Debt securities classified as receivables 732,298 58.12 523,427 57.81Total investment in securities and other financial assets 1,259,998 100.00 905,496 100.00
3. Types and amounts of financial bonds held
Unit: RMB million, %June 30, 2016 December 31, 2015
Item Balance Percentage Balance Percentage
Financial assets at fair value through profit or loss 2,020 1.42 1,419 2.13Available-for-sale financial assets 117,107 82.15 47,331 71.24Held-to-maturity investments 23,420 16.43 17,690 26.63Total 142,547 100.00 66,440 100.00
4. Top 10 financial bonds held
Unit: RMB million, %
Name of bonds
Nominalvalue Annual interest rate Maturity date
Provision forimpairment
Losses
Bond 1 2,810 3.80 2036-01-25 –Bond 2 2,290 3.95 2031-02-26 –Bond 3 1,690 4.89 2016-10-24 –Bond 4 1,160 4.23 2021-11-05 –Bond 5 1,070 5-day average of 3-month Shibor -0.20 2018-06-09 –Bond 6 1,050 4.04 2019-07-22 –Bond 7 1,050 One-year time deposit interest rate +0.70 2019-09-23 –Bond 8 940 3.42 2018-11-25 –Bond 9 920 3.86 2022-02-05 –Bond 10 900 4.58 2022-08-20 –

2016 Interim
Rep
ort
19
5. Goodwill
The Group’s original value of goodwill was RMB6,019 million. As at the end of the reporting period, the provision for impairment losses on goodwill was RMB4,738 million, and the carrying value of goodwill was RMB1,281 million, which was the same as that at the end of the previous year.
(II) Liabilities
At the end of the reporting period, the Group’s total liabilities reached RMB3,534,984 million, representing an increase of RMB591,321 million or 20.09% as compared with those at the end of the previous year, mainly due to the increase in deposits with banks and other financial institutions and deposits from customers.
Unit: RMB million, %June 30, 2016 December 31, 2015
Item Balance Percentage Balance Percentage
Due to the Central Bank 64,000 1.81 14,840 0.50Deposits from customers 2,177,369 61.59 1,993,843 67.73Deposits from banks and other financial institutions 730,506 20.67 541,066 18.38Placements from banks and other financial institutions, and financial assets sold under repurchase agreements 146,371 4.14 119,178 4.05Negative fair value of derivatives 1,330 0.04 1,391 0.05Accrued staff costs 11,756 0.33 11,217 0.38Taxes payable 2,752 0.08 6,392 0.22Interest payable 29,168 0.83 30,612 1.04Debt securities issued 340,562 9.63 210,061 7.14Other liabilities 31,170 0.88 15,063 0.51Total liabilities 3,534,984 100.00 2,943,663 100.00
Note: Deposits from customers include structured deposits measured at fair value as specified, same hereinafter.
At the end of the reporting period, the balance of the Group’s deposits from customers reached RMB2,177,369 million, representing an increase of RMB183,526 million or 9.20% as compared with that at the end of the previous year.
Unit: RMB million, %June 30, 2016 December 31, 2015
Item Balance Percentage Balance Percentage
Corporate deposits 1,675,956 76.97 1,544,053 77.44Including: Demand deposits 650,098 29.86 515,929 25.88 Time deposits 1,025,858 47.11 1,028,124 51.56Retail deposits 374,049 17.18 339,125 17.01Including: Demand deposits 164,245 7.54 145,561 7.30 Time deposits 209,804 9.64 193,564 9.71Other deposits 127,364 5.85 110,665 5.55Total deposits from customers 2,177,369 100.00 1,993,843 100.00

CH
INA
EVER
BR
IGH
T B
ANK
20
Management Discussion and Analysis
(III) Equity of shareholders
At the end of the reporting period, the equity attributable to equity shareholders of the Bank was RMB229,345 million, representing an increase of RMB5,852 million as compared with that at the end of the previous year. The change was primarily attributed to: (i) the increase of RMB16,439 million in equity of shareholders due to the increase in the net profit attributable to equity shareholders of the Bank during the reporting period; (ii) the decrease of RMB8,869 million in equity of shareholders due to the distribution of dividends of ordinary shares during the reporting period; and (iii) the decrease of RMB1,060 million in equity of shareholders due to the distribution of dividends of preference shares during the reporting period.
Unit: RMB million
ItemJune 30,
2016December 31,
2015
Share capital 46,679 46,679Other equity instruments 19,965 19,965Capital reserve 33,365 33,365Other comprehensive income 3,271 3,929Surplus reserve 14,964 14,964General reserve 40,289 40,271Retained earnings 70,812 64,320Total equity attributable to equity shareholders of the Bank 229,345 223,493Non-controlling interests 583 554Total equity 229,928 224,047
(IV) Off-balance sheet items
The Group’s off-balance sheet items are mainly credit commitments, including business of loan and credit card commitments, acceptances, letters of guarantee, letters of credit and guarantees. As at the end of the reporting period, the total amount of credit commitments was RMB676,103 million, down by RMB26,629 million as compared with that at the end of the previous year, mainly due to a decrease of RMB34,212 million in acceptances.
Unit: RMB million
ItemJune 30,
2016December 31,
2015
Loan and credit card commitments 140,103 128,389Acceptances 415,173 449,385Letters of guarantee issued 63,695 61,704Letter of credit issued 56,947 63,069Guarantees 185 185Total 676,103 702,732

2016 Interim
Rep
ort
21
IV. Cash Flow Analysis
Total net cash inflow generated from the Group’s operating activities was RMB314,519 million, of which cash inflow from operating activities was RMB36,445 million; cash outflow from changes in operating assets was RMB170,459 million; cash inflow from changes in operating liabilities was RMB448,533 million.
Net cash outflow from investing activities was RMB356,185 million, of which cash inflow from disposal and redemption of investments was RMB323,854 million; cash outflow from payment for investment activities was RMB679,009 million.
Net cash inflow from financing activities was RMB123,300 million, of which cash inflow from issue of bonds was RMB130,501 million.
V. Analysis of Loan Quality
(I) Distribution of loans by industry
During the reporting period, by focusing on the target of economic restructuring, transforming and upgrading, the Bank proactively adjusted its credit portfolio by industry, and as a result, the proportion of its loans to manufacturing, real estate, wholesale and retail industries reduced while the loans to livelihood and public utility sectors rose.
Unit: RMB million, %June 30, 2016 December 31, 2015
Item Balance Percentage Balance Percentage
Manufacturing 247,197 23.87 246,140 26.83Real estate 144,616 13.97 143,428 15.64Water, environment and public utility management 130,446 12.60 70,864 7.72Wholesale and retail trade 115,719 11.18 123,907 13.51Transportation, storage and postal services 81,689 7.89 75,108 8.19Leasing and commercial services 72,184 6.97 54,119 5.90Construction 56,049 5.41 50,084 5.46Financial services 52,905 5.11 28,592 3.12Production and supply of power, gas and water 32,492 3.14 26,349 2.87Mining 26,959 2.60 31,416 3.42Others 75,167 7.26 67,320 7.34Subtotal of corporate loans 1,035,423 100.00 917,327 100.00Personal loans 590,280 – 525,020 –Discounted bills 74,669 – 71,196 –Gross loans and advances to customers 1,700,372 – 1,513,543 –
Note: Other industries consist of agriculture, forestry, animal husbandry and fishery; accommodation and catering; public administration and social organization; scientific research, technical services and geological prospecting; resident services and other services; health, social security and social welfare; culture, sports and entertainment; information transmission, computer service and software; education etc.

CH
INA
EVER
BR
IGH
T B
ANK
22
Management Discussion and Analysis
(II) Distribution of loans by region
The distribution of loans by region was relatively stable leading to a balanced regional distribution structure.
Unit: RMB million, %June 30, 2016 December 31, 2015
Region Balance Percentage Balance Percentage
Yangtze River Delta 346,325 20.37 301,904 19.95Pearl River Delta 212,510 12.50 191,858 12.68Bohai Rim 290,821 17.10 265,918 17.57Central 267,463 15.73 230,898 15.25Western 256,566 15.09 229,682 15.18Northeastern 104,711 6.16 96,047 6.35Abroad 30,051 1.77 24,414 1.60Head Office 191,925 11.28 172,822 11.42Gross loans and advances to customers 1,700,372 100.00 1,513,543 100.00
(III) Types of loan guarantee and their proportions
The Group’s proportion of guaranteed, mortgage and pledge loans reached 73.08%, and unsecured loans were mainly provided to clients with high credit rating results.
Unit: RMB million, %June 30, 2016 December 31, 2015
Item Balance Percentage Balance Percentage
Unsecured loans 457,732 26.92 434,735 28.72Guaranteed loans 375,080 22.06 314,118 20.75Mortgage loans 654,276 38.48 585,530 38.69Pledge loans 213,284 12.54 179,160 11.84Gross loans and advances to customers 1,700,372 100.00 1,513,543 100.00
(IV) Top 10 loan customers
Unit: RMB million, %
Name Industry
June 30, 2016Balance of
loansProportion to
total loansProportion to
net capital
Borrower A Transportation, storage and postal services 6,061 0.36 2.29Borrower B Public administration and social organization 4,795 0.28 1.81Borrower C Manufacturing 3,404 0.20 1.29Borrower D Water, environment and public utility management 3,350 0.20 1.27Borrower E Manufacturing 3,000 0.18 1.13Borrower F Wholesale and retail trade 2,990 0.18 1.13Borrower G Real estate 2,600 0.15 0.98Borrower H Public administration and social organization 2,430 0.14 0.92Borrower I Financial services 2,313 0.13 0.87Borrower J Transportation, storage and postal services 2,285 0.13 0.86Total amount 33,228 1.95 12.55
Note: The proportion of the balance of loans to net capital is calculated according to the relevant requirements of the CBRC.

2016 Interim
Rep
ort
23
(V) Five-category loan classification
Due to some factors such as economic slowdown and structural adjustment, the non-performing loans of the Group increased moderately, while its non-performing loans ratio decreased as a result of the expansion of the total loan book. As at the end of the reporting period, the balance of non-performing loans was RMB25,507 million, representing an increase of RMB1,132 million as compared with that as at the end of the previous year. Non-performing loan ratio was 1.50%, down by 0.11 percentage point as compared with that as at the end of the previous year.
Unit: RMB million, %June 30, 2016 December 31, 2015
Item Balance Percentage Balance Percentage
Normal 1,602,622 94.25 1,422,656 94.00Special mention 72,243 4.25 66,512 4.39Substandard 10,298 0.61 11,109 0.73Doubtful 12,922 0.76 10,572 0.70Loss 2,287 0.13 2,694 0.18Gross loans and advances to customers 1,700,372 100.00 1,513,543 100.00Performing loans 1,674,865 98.50 1,489,168 98.39Non-performing loans 25,507 1.50 24,375 1.61
(VI) Loan migration ratio
Unit: %
ItemJanuary –
June, 2016 2015 2014
Loan migration ratio of normal loans 2.28 4.27 4.08Loan migration ratio of special mention loans 17.37 30.33 26.68Loan migration ratio of substandard loans 52.13 86.57 64.04Loan migration ratio of doubtful loans 6.42 24.98 28.77
(VII) Restructured loans and overdue loans
1. Restructured loans
Unit: RMB million, %June 30, 2016 December 31, 2015
Item Balance Percentage Balance Percentage
Restructured loans and advances 15,236 0.90 12,034 0.80Less: Restructured loans and advances overdue for more than 90 days 1,375 0.08 4,202 0.28Restructured loans and advances overdue for less than 90 days 13,861 0.82 7,832 0.52
2. Overdue loans
Please refer to “Notes to Financial Statements” for details of overdue loans.

CH
INA
EVER
BR
IGH
T B
ANK
24
Management Discussion and Analysis
(VIII) Non-performing loans by business type
Unit: RMB million, %June 30, 2016 December 31, 2015
Item Balance Percentage Balance Percentage
Corporate loans 19,256 75.49 19,227 78.88Retail loans 6,251 24.51 5,148 21.12Discounted bills – – – –Total amount of non-performing loans 25,507 100.00 24,375 100.00
(IX) Distribution of non-performing loans by industry
At the end of the reporting period, the Group’s non-performing loans were mainly from manufacturing and wholesale and retail trade sectors.
Unit: RMB million, %June 30, 2016 December 31, 2015
Item Balance Percentage Balance Percentage
Manufacturing 8,569 33.59 7,253 29.75Wholesale and retail trade 8,154 31.97 7,836 32.15Real estate 9 0.04 1,096 4.50Transportation, storage and postal services 179 0.70 45 0.18Leasing and commercial services 49 0.19 139 0.57Construction 475 1.86 494 2.03Mining 1,419 5.56 1,938 7.95Public administration and social organization 10 0.04 10 0.04Others 392 1.54 416 1.71Subtotal of corporate loans 19,256 75.49 19,227 78.88Personal loans 6,251 24.51 5,148 21.12Discounted bills – – – –Total amount of non-performing loans 25,507 100.00 24,375 100.00
Note: Other industries consist of agriculture, forestry, animal husbandry and fishery; accommodation and catering; education; information transmission, computer service and software; health, social security and social welfare.

2016 Interim
Rep
ort
25
(X) Distribution of non-performing loans by region
During the reporting period, the Group’s non-performing loans in Yangtze River, Central and Western regions decreased whereas the non-performing loans in Pearl River Delta and Bohai Rim increased.
Unit: RMB million, %June 30, 2016 December 31, 2015
Region Balance Percentage Balance Percentage
Yangtze River Delta 4,874 19.11 5,974 24.51Pearl River Delta 6,187 24.26 4,357 17.87Bohai Rim 3,073 12.05 2,104 8.63Central 3,296 12.92 4,022 16.50Western 4,209 16.50 4,914 20.16Northeastern 897 3.52 699 2.87Abroad 8 0.03 – –Head Office 2,963 11.61 2,305 9.46Total amount of non-performing loans 25,507 100.00 24,375 100.00
(XI) Distribution of non-performing loans by guarantee type
Unit: RMB million, %June 30, 2016 December 31, 2015
Item Balance Percentage Balance Percentage
Unsecured loans 5,872 23.02 4,568 18.74Guaranteed loans 10,710 41.99 10,593 43.46Mortgage loans 7,547 29.59 7,788 31.95Pledge loans 1,378 5.40 1,426 5.85Total amount of non-performing loans 25,507 100.00 24,375 100.00
(XII) Repossessed assets and provision for impairment
Unit: RMB million
ItemJune 30,
2016December 31,
2015
Repossessed assets 357 346Of which: land, buildings and structures 355 346Less: provision for impairment (19) (17)Net value of repossessed assets 338 329

CH
INA
EVER
BR
IGH
T B
ANK
26
Management Discussion and Analysis
(XIII) Provision for loan impairment and write-off
The Group’s provision for loan impairment includes provision for corporate loans, retail loans and discounted bills. The Group conducted impairment tests on the carrying value of credit assets on the balance sheet date, and provision for impairment would be recognized through profit or loss for the current period if there was objective evidence indicating that the credit assets were impaired.
Unit: RMB million
ItemJune 30,
2016December 31,
2015
Balance at the beginning of the period 38,119 28,025Charge for the period 9,953 20,071Release for the period (623) (347)Recoveries for the period 312 334Unwinding of discount (note) (417) (802)Write-offs during the period (3,111) (5,579)Disposal in the period (5,909) (3,583)Balance at the end of the period 38,324 38,119
Note: It refers to cumulative interest income of impaired loans due to the subsequent increase in present value over time.
VI. Capital Adequacy Ratio Analysis
Please refer to the “Summary of Accounting Data and Financial Indicators” for the details.
VII. Segment Performance
(I) Performance by geographical segment
Unit: RMB millionJanuary – June, 2016 January – June, 2015
ItemOperating
IncomeTotalProfit
OperatingIncome
TotalProfit
Yangtze River Delta 7,890 2,638 7,608 2,504Pearl River Delta 4,909 689 5,170 1,626Bohai Rim 6,911 3,131 8,257 4,358Central 6,480 2,787 5,933 2,307Western 4,402 1,080 4,900 1,498Northeastern 2,360 781 2,357 785Abroad 324 192 114 40Head Office 13,805 10,414 11,248 8,372Total 47,081 21,712 45,587 21,490

2016 Interim
Rep
ort
27
(II) Performance by business segment
Unit: RMB millionJanuary – June, 2016 January – June, 2015
ItemOperating
IncomeTotalProfit
Operatingincome
TotalProfit
Corporate banking business 21,068 6,314 21,207 8,449Retail banking business 14,111 5,156 13,616 4,612Financial market business 11,812 10,171 10,711 8,397Other business 90 71 53 32Total 47,081 21,712 45,587 21,490
VIII. Others
(I) Changes in Major Financial Indicators and Reasons
Unit: RMB million, %
ItemJune 30,
2016December 31,
2015Increase or
decrease Major reasons for change
Deposits with banks and other financial institutions
168,085 86,311 94.74 Increase in scale of deposits with banks based on treasury position and changes in the market interest rate
Financial assets at fair value through profit or loss
13,249 5,637 135.04 Increase in bonds held for trading
Financial assets held under resale agreements
52,266 153,045 -65.85 Decrease in purchase scale of financial assets held under resale agreements
Financial lease receivables
51,952 38,735 34.12 Expansion in scale of financial leasing business, causing the increase in financial lease receivables
Available-for-sale financial assets
334,208 222,495 50.21 Expansion in scale of available-for-sale financial assets
Debt securities classified as receivables
732,298 523,427 39.90 Increase in scale of beneficial interest transfer plans and wealth management products issues by other financial institution
Other assets 22,549 13,207 70.74 Increase in scale of precious metalsDue to the Central Bank 64,000 14,840 331.27 Increase in scale of due to the Central BankDeposits with banks and other financial institutions
730,506 541,066 35.01 Increase in deposits with non-deposit financial institutions
Placements from banks and other financial institutions
80,750 60,305 33.90 Increase in scale of placement from banks based on fund position and changes in the market interest rate
Taxes payable 2,752 6,392 -56.95 Completed clearance of funds and decrease in income taxes payable
Debts securities issued 340,562 210,061 62.13 Increase in scale of interbank negotiable certificate of deposits
Other liabilities 31,170 15,063 106.93 Increase in dividend payables and funds pending clearance

CH
INA
EVER
BR
IGH
T B
ANK
28
Management Discussion and Analysis
ItemJanuary –
June, 2016January –
June, 2015Increase or
decrease Major reasons for change
Net trading gains/(losses) 546 (337) Notapplicable
Affected by changes in forward RMB exchange rate and the outbound transferring of the net losses or gains in valuation from some matured foreign currency swaps, the fair value was changed, leading to the increase of net trading gains
Dividend income – 4 -100.00 Decrease in dividend incomeNet (losses)/gains arising from investment securities
(77) 5 -1,640.00 Increase in losses arising from bond trading
Net foreign exchange (losses)/gains
(174) 160 -208.75 Affected by transferring in changes in spot RMB exchange rate and in valuation of some matured foreign currency swaps, net exchange losses increased
Other operating income 263 92 185.87 Increase in other operating incomeOther total comprehensive income
(658) 1,426 -146.14 Valuation losses from available-for-sale assets
(II) Overdue and outstanding debts
During the reporting period, the Bank did not incur any overdue and outstanding debts.
(III) Interest receivables and provision for bad debts
1. Change in on-balance sheet interest receivables
Unit: RMB million
Item
Balance at the beginning of the period
Increase in the period
Decrease in the period
Balance at the end of the period
On-balance sheet interest receivables 18,583 46,574 44,752 20,405
2. Provision for bad debt of interest receivables
Unit: RMB million
ItemJune 30,
2016December 31,
2015 Increase
Balance of provision for bad debt of interest receivables 40 37 3

2016 Interim
Rep
ort
29
(IV) Other receivables and provision for bad debts
1. Change in other receivables
Unit: RMB million
ItemJune 30,
2016December 31,
2015 Increase
Other receivables 6,597 5,201 1,396
2. Provision for bad debt of other receivables
Unit: RMB million
ItemJune 30,
2016December 31,
2015 Increase
Balance of provision for bad debt of other receivables 540 535 5
IX. Performance of Business Lines
(I) Corporate banking business
1. Corporate deposit and loans
Seizing the opportunity of implementing the national strategy for steady growth, the Bank actively developed its large-asset business. It strictly controlled the initiative liabilities and vigorously adjusted the credit portfolio so that its corporate business structure was apparently improved. By fostering the innovation and improving its operational management, the Bank was able to continuously releasing vitality of major business. As at the end of the reporting period, the Bank’s large-asset business scale reached RMB2.67 trillion, representing an increase of RMB181,844 million or 7.32%, among which, the corporate loans accounted for RMB1,035,423 million, up by RMB118,096 million or 12.87% over that at the end of the previous year. The Bank’s corporate deposits amounted to RMB1,679,891 million (including the corporate business related portion of other deposits), representing an increase of RMB132,084 million or 8.53%, among which, daily average core corporate deposits amounted to RMB1,202,458 million, representing an increase of RMB120,568 million or 11.14%.
2. Small and micro finance business
The Bank focused on its small and micro lending and continued to improve the related systems and mechanisms. It actively expanded marketing channels and vigorously developed its high-tech finance business and green finance business. It continued to optimize the business process for small credit loans to and micro enterprises with RMB5 million credit limit or below and improve the approval efficiency, so as to facilitate the continuous and healthy development of small and micro finance business. According to the SME categorization standards jointly issued by the Ministry of Industry and Information Technology and four other ministries in 2011 and regulatory requirements of CBRC, the balance of the Bank’s SME loans amounted to RMB337,790 million as at the end of the reporting period, representing an increase of RMB49,354 million or 17.11% as compared with that as at the end of the previous year, well above the bank-wide average loan growth rate. The number of SME clients was 209,000, representing a year-on year increase of 36,300 clients.

CH
INA
EVER
BR
IGH
T B
ANK
30
Management Discussion and Analysis
3. Investment banking business
The Bank actively provided a wide range of debt financing products such as ultra- short-term commercial papers, short-term commercial papers, medium-term notes and private placement notes. It conscientiously implemented the national policy “to trim down excessive production capacity, to lower inventory level, to reduce financial leverage, to cut down production cost, to expand effective supply”, continued to optimize the customer structure of investment banking and strengthened the risk examination and prevention efforts of risks in key industries during the economic downturn. It accelerated the innovation in the investment banking business, actively expanded the business of issuing corporate bonds for domestic companies in Hong Kong and accelerated the research and development of structured products. During the reporting period, the Bank served as a leading underwriter of 126 debt financing instruments of non-financial institutions with a value of RMB95,081 million in aggregate, maintaining the Bank’s comparative advantages in serving clients of power, transportation, construction and construction material industries etc.
4. Custody business
The Bank stepped up its marketing efforts for custodian products, enhanced the product innovation according to the market demand, such as “outsourcing investment fund custodian service” and “bank wealth management fund custodian service” and developed the system and mechanism of outsourcing administration of asset management business, to further enhance its market service capabilities. At the end of the reporting period, the Bank’s custodian assets amounted to RMB3,436,600 million, among which the scale of custodian service for equity investment funds and the asset management of fund company customers increased 64.47% and 48.87% respectively as compared with those at the end of last year, respectively. During the reporting period, the income from the Bank’s custodian service reached RMB842 million, marking a year-on-year increase of 9.78%, among which, the income from the custodian service for bank wealth management funds and investment funds of securities companies up by 181.64% and 84.57% respectively as compared with those of the same period of last year.
5. Trade banking business
The bank further consolidated its trade finance and foreign currency lending products to cover both on-balance-sheet and off-balance-sheet items, leveraging on the “large-asset” concept. It focused on the traditional international business on the one hand, and promoted its foreign currency business, free-trade-zone products, factoring and domestic RMB letter of credit product through innovation on the other hand to boost its trade business. Meanwhile, it strengthened its compliance management of the foreign exchange business. The bank also reduced some of its trade finance exposure to certain high-risk industries with excessive capacity and exit from some industries of highest risk to ensure the sustainable and healthy development. At the end of the reporting period, the balance of the on-balance-sheet trade finance business increased by 21.09% as compared with that at the end of last year.

2016 Interim
Rep
ort
31
(II) Retail banking business
1. Personal deposit business
The retail banking business line of the Bank adhered to the operation strategy of “actively expanding core deposits and continuously optimizing the structure of deposits”, and expanded the business scope of certain projects for better efficiency through the collaboration between the corporate banking and retail banking business lines and for synergy through the utilization of various type of channels. It seized the opportunities of Chinese government’s efforts to transform shanty town and urbanization, and successfully launched the business model of “one-stop service” for shanty town transformation leading to the increase both in the scale and the profit of the personal deposit business. As at the end of the reporting period, the personal deposits of the Bank amounted to RMB497,478 million (including those retail banking related deposits in other deposits), representing an increase of RMB51,442 million from that at the end of the previous year, among which the core private deposits accounted for RMB283,971 million, up by RMB17,523 million from the end of the previous year.
2. Personal loan business
Taking the consumer credit and small and micro credit as two driving forces, the Bank focused on supporting the residents’ appropriate housing consumption and expanded the scale of mortgage loans. With the aid of the big data and the Internet technology, the Bank conducted research and development of the standardized e-channel self-serviced loans, which provided innovative experience of small-amount consumer finance. The Bank strictly defended the bottom line of risk control and maintained a stable quality of its personal loans. As at the end of the reporting period, the balance of personal loans (excluding credit cards lending) amounted to RMB398,365 million, an increase of RMB46,157 million or 13.11% from that as at the end of the previous year. Among it, the balance of consumer loan accounted for RMB259,033 million, up by RMB55,233 million from that at the end of the previous year. The volume of personal loans reached RMB117,466 million, up by RMB35,902 million or 44% over the same period of the previous year.
3. Private banking business
By regarding the mid-to-high end customers as its core customer base, the Bank sped up the building of private banking business. It set up an open product platform through internal collaboration and external integration. It implemented the customer segmentation, improved the customer experience so as to establish a system of differentiated services. It launched precision marketing activities with the support of big data and improved the execution abilities of its team. As at the end of the reporting period, the Bank had 27,318 private banking customers, representing an increase of 3,068 customers or 12.70% from that as at the end of the previous year. The total assets under management of its private banking business amounted to RMB250,987 million, increasing by RMB22,546 million or 9.90% from that as at the end of the previous year.

CH
INA
EVER
BR
IGH
T B
ANK
32
Management Discussion and Analysis
4. Bank card business
(1) Debit card business
Focusing on the ten areas of people’s daily life such as “medical service, dining, housing, traveling and tourism, education, entertainment, health, safety and beauty”, the Bank made some innovation its debit card business, such as the launching of the Sunshine Happy Salary Card, a payroll specific debit card, and the debit card mobile payment project. Based on the traditional debit card business, the Bank commenced cooperation in various sectors such as transportation, social security, education, community services and corporate operation through co-branded cards and industrial specific cards. As at the end of the reporting period, the accumulated number of debit cards issued by the Bank reached 55,640 thousand.
(2) Credit card business
The Bank’s credit card business continued to explore the cross-sector integration of products and services in the “Internet+” scenarios so as to expand its customer base through the internet. To build a multi-level product system, it launched co-branded credit cards with Jingdong and iReader respectively, as well as co-branded platinum credit cards with Umetrip and Youku. To boost the brand image of “Convenient, Fast and Affordable Service”, Sunshine Life APP was upgraded to provide a more intelligent solution for customers. At the end of the reporting period, the total number of credit cards issued by the Bank reached 31,771.1 thousand, including 3,437.7 thousand new credit cards issued in 2015. The total transactions volume of the credit card business during the reporting period was RMB597,955 million, representing a year-on-year increase of 28.97%. The overdraft balance (excluding the payment adjustment to transitional account) amounted to RMB192,681 million, representing an increase of 10.10% as compared with those at the end of the previous year. The total operating income (with the commission expense deducted) of the credit cards business was RMB9,624 million, representing a year-on-year increase of 10.52%.
(III) Financial market and interbank business
1. Financial market business
The Bank optimized its management structure of financial markets business line. In precious metal sector, client mix was optimized with more diversified industry distribution. The Bank steadily expanded its fiduciary business and actively issued interbank CDs. The Bank also adjusted the scheme of bond credit management and optimized the structure of its bond portfolio by investing in the government bonds and high-grade credit bonds. As at the end of the reporting period, the balance of bonds amounted to RMB451,920 million, accounting for 12.00% of the Bank’s total assets. And 46.67% of the balance of bonds was government bonds and local government bonds. The bank cumulatively scored 11.37 trillion in RMB bonds settlement, which ranks No. 1 among joint-stock commercial banks (by China Central Depository & Clearing Co., Ltd.).
2. Interbank business
Taking risk management and liquidity safety as top priority, the Bank adjusted its product structure and strengthened its refined management to keep its interbank business at an appropriate scale. The Bank also continued to work with other banks in assets and liabilities business and vigorously expanded its business with non-banking financial institutions. Pursuant to the requirements of regulatory authorities, the Bank seriously implemented the licensed operation for interbank business in order to achieve the healthy and compliant business development. As at the end of the reporting period, the balances of interbank deposits, placement with others banks and bill discounted were RMB730,506 million, RMB168,085 million and RMB74,669 million respectively.

2016 Interim
Rep
ort
33
(IV) Asset management business
The Bank continued to reinforce the fundamental construction in the asset management business and endeavored to improve its capital and investment structure. Marketing of quality asset management projects was strengthened, equity asset allocation was moderately increased, and the scale of floating-rate products and “Smart Savings” products were greatly expanded. Sales channel through internet was explored, while the proportion of financial products for institutional clients was increased. At the end of the reporting period, the balance of wealth management products reached RMB1.26 trillion, increased by 3.28% from that of the previous year. Fee income earned from wealth management products amounted to RMB3,646 million, financial proceeds for customers earned from wealth management products reached RMB35,949 million representing a year-on-year increase of 9.91%. All products under the Bank’s “Sunshine Wealth Management” brand were redeemed upon maturity, while the risk of outstanding wealth management products was at a normal level.
(V) E-banking business
The Bank continued to build six E-banking brands of “Sunshine Bank,” “Cloud Payment,” “Cloud Fee Payment,” “e Financing,” “e Wealth Management” and “e Commerce”, providing customers with comprehensive service solutions. Efforts to acquire new clients and create profits were made actively while the Bank’s brand image in E-banking was greatly promoted. The overall E-banking business achieved a rapid and healthy development. At the end of the reporting period, the number of mobile banking customers reached 24,148.3 thousand, increased by 2,117.6 thousand as compared to the end of last year. The number of online retail banking customers reached 22,949.2 thousand, increased by 1,735.8 thousand as compared to the end of last year. The number of electronic payment customers reached 12,541.3 thousand, increased by 2,129.5 thousand as compared to the end of last year. The number of Everbright WeChat banking customers reached 13,964.7 thousand, increased by 3,624.7 thousand as compared to the end of last year. The number of online corporate banking clients reached 343.7 thousand, increased by 15 thousand as compared to the end of last year.
X. Business Innovation
According to its strategy orientation, the Bank actively promoted innovation in the following strategic sectors: asset management, investment banking, credit cards and e-banking. The Bank was the first in the industry to launch “Priced at Your Will”(隨心定), an online financial product of crowd-funding, which was a breakthrough in the sales model of wealth management products. An APP “Sunshine Life”(陽光惠生活)was designed for credit card business combining “finance, life and entertainment” functions into one. As the main underwriter, the Bank successfully issued 2016 “Wuhan Provident Fund” (Phase 1), an asset-backed security product in mortgage loans, which was the first deal in 2016 and also the second one in the interbank market in China.
XI. Information Technology
During the reporting period, the Bank’s operation remained safe and sound without any major security incidents, thus the Bank was ranked among the first echelon of national joint-stock commercial banks in CBRC’s Information Supervision Rating.
The Bank successively completed the construction of following systems, including the customer line management, the VAT management system, overseas innovative banking system, overseas trade & finance system, phase II of sunshine asset management system and the market risk data mart. Several new projects were also launched: the new fund trusteeship system, gold trade 3.0, internet financing system and the new CRM. The application of new technologies was continuously explored, such as cloud computing, big data, intermediary business cloud platform, cash manage cloud system and big data application system. The Bank also launched innovative projects such as face recognition system and CEB Insight system. The Bank continued to increase its R&D capability by studying new technology applications such as block chain.

CH
INA
EVER
BR
IGH
T B
ANK
34
Management Discussion and Analysis
XII. Investment Analysis
(I) The external equity investments
During the reporting period, the Bank has no newly added external equity investment.
(II) Material equity investments
Unit: RMB ten thousand, ten thousand shares, %
Investment entityPrinciple business
InvestmentAmount
Numberof
SharesShareholding
percentageSource offund
Investmentduration
Profit orLoss in the
reportingperiod Partner
Everbright Financial Leasing Co., Ltd.
Financial leasing 270,000 333,000 90 Equity Fund Long-term 26,265.95 Wuhan New Harbor Construction and Investment Development Group Co., Ltd., Wuhan Rail Transit Construction Co., Ltd.
Shaoshan Everbright Village Bank Co., Ltd.
Commercial bank 10,500 10,500 70 Equity Fund Long-term 608.26 Sany Group Co., Ltd., Changsha Tongcheng Holding Co., Ltd., Hunan Poly Real Estate Development Co., Ltd., Shaoshan City Construction Investment Company Limited
Jiangsu Huai’an Everbright Village Bank Co., Ltd.
Commercial bank 7,000 7,000 70 Equity Fund Long-term 431.04 Jiangsu East Golden Fox Garment Co., Ltd., Huai’an Shuanglong Weiye Technology Co., Ltd., Jiangsu Huatai Pharmaceutical Company Limited, Nanjing Mengdu Tobacco Packing Co., Ltd.
CEB International Investment Corporation Limited
Investment banking HK$600 million
60,000 100 Equity Fund Long-term HK$-26.3882million
Nil
China Unionpay Co., Ltd. Bank card inter-bank information exchange network
9,750 7,500 2.56 Equity Fund Long-term 139,325 Other commercial banks
Note: The above equity investments are not subject to any litigation.

2016 Interim
Rep
ort
35
(III) The Bank had no material non-equity investment, and the Bank conducted bond investments in the ordinary course of its businesses. Please refer to the aforementioned for details.
(IV) Financial assets at fair value during the reporting period
The domestic and foreign bonds and derivative financial instruments measured at fair value held by the Bank are in the daily business of the Bank, the details of which please see “Notes to Financial Statements”.
XIII. Special Purpose Entities Controlled by the Bank and Structured Products
(I) There are no special purpose entities controlled by the Bank.
(II) The structured products whose equities are held by the Group but not recognised in the consolidated financial statements mainly include special asset management plans. Please refer to the “Notes to Financial Statements” for details.
XIV. Risk Management
(1) Credit Risk Management
Pursuant to the principle of “full range, whole process and all staff control”, the Bank continued to improve the overall risk management framework, specifying responsibility of credit risk management and asset quality control for each institution, department and position, strengthening the management for whole process of credit business and the construction of three lines of defense in business management, risk management and compliance, internal audit and supervision, so as to effectively enhance risk management and control of key aspects.
While strengthening the guidance of credit policy, the Bank actively readjusted its asset structure, keep optimizing the structure of industry, customers and guarantee types and enhancing the credit support for key construction projects. In its process of credit stock adjustment, the Bank strictly limited the total loans to overcapacity industry and successively reduced credit to the commodity wholesaling sector. Persisting in serving the real economy, it managed to maintain its stable business growth and hold up bottom line of credit risk management thus better adapting itself to and serving the New Normal of Chinese economy.
The Bank orderly resolved the credit risk of customers in stock, with a list of customers under intensive post-credit surveillance put into place, to enable dynamic monitoring of customers with potential risks. The Bank also laid particular strength on the written-off of non-performing loans and stepped up efforts in mitigating risks while introducing new channels for the disposal of non-performing credit asset. It carried out the restructuring and transformation of problem loans by providing assistance for struggling companies to stay afloat, strive for upgrading and transformation and regain their competitiveness.
Please refer to “Notes to the Financial Statements” for more details on credit risk management of the Bank.

CH
INA
EVER
BR
IGH
T B
ANK
36
Management Discussion and Analysis
(2) Liquidity Risk Management
In adherence with a prudent policy of liquidity risk management, the Bank flexibly utilized a variety of liquidity management tools in an effort to improve its refined management and maintain stability of the overall liquidity situation. The Bank paid close attention to changes of the central bank’s monetary policy and the capital market, dynamically adjusting its business strategy and replenishing sources of funding of more stability by means of issuance of interbank deposit certificates. It timely adjusted the interbank asset-liabilities ratio, strengthened the management and control of daytime fluctuations and mismatching limits on the on-and-off balance sheet and increased the reserve of liquidity asset of high quality. To emphasize the monitoring on key business with strong market relevance, the Bank set up the limit on cumulative fluctuation for one day and one week, leading to effective control of ranges of daytime position fluctuation. It conducted consultation on liquidity risk management, further improved management system of stress tests and rechecked management measures for stress tests, in order to ensure requirement met for liquidity regulatory indicators.
Please refer to “Notes to the Financial Statements” for further details of liquidity risk management of the Bank.
(3) Market Risk Management
The Bank continuously perfected its market risk management system, regularly rechecking and revising its market risk policies and optimizing the scheme for market-oriented business investment and the process of market risk management. It put much emphasis on the research of risks of interest rate and exchange rate, kept a watchful eye on the mutual conversion among interest rate risk, exchange rate risk, liquidity risk and credit risk, and as a result, seizing the initiative of management of interest rate risk and exchange rate risk. It strengthened the quota management, integrating related business in treasury, interbank, precious metal, investment banking and overseas branches into one system of market risk quota management while continuously monitoring, controlling and reporting its implementation. It managed to launch the database of market risks and pushed forward the building of the market risk measurement project in the aim of further enhancing its processing abilities of market risks information and its risk measuring capabilities.
Please refer to “Notes to the Financial Statements” for further details of market risk management of the Bank.
(4) Operational Risk Management
The Bank continuously improved its operational risk management framework and system, established new reporting standards for operational risk Loss Data Collection (LDC) and re-checked history loss events. It continued emphasis on the accountability of departments of business and function as “the first line of defense” in operational risk management, set up a system of pre-warning, reminding, reporting and handling operational risks in a timely manner, preventing the occurrence of material operational risk events and cases. It refined the internal control management system of grass-roots institutions and conducted routine supervision and inspection of internal control. The Bank intensified investigation on unusual fund transactions and improved the contingency mechanism for extraordinary events so as to improve the capability of operational risk management.
Please refer to “Notes to the Financial Statements” for further details of the operational risk management of the Bank.

2016 Interim
Rep
ort
37
(5) Compliance Risk Management
The Bank constantly improved the system of compliance risk management, enhancing the effectiveness of the management of the Bank’s grassroots institutions. It vigorously advanced the integration of internal control and operational risk and the implementation of the achievements of management-enhancing projects to further improve the management efficiency. By actively tracking the changes in related laws and regulations, the Bank’s Legal and Compliance Department played a leading role in providing prior guidance, compliance review and consultancy. It reinforced the rectification on problems identified in compliance inspections and audits and conducted supervision on the operational and management activities. Meanwhile, it attached great importance to the building of part-time compliance manager team of the Bank and carried out management of list system and resumption training.
(6) Reputation Risk Management
The Bank paid great attention to reputation maintenance and brand building, optimizing the mechanism of reputation risk monitoring, pre-warning and emergency response by conducting reputation risk management training, major emergency drills and potential reputation risk identification in various ways. It took numerous reputation risk factors into full account concerning product design, business marketing and customer service in order to effectively enhance the management capability of reputation risk.
(7) Anti-money Laundering (AML) Management
The Bank reinforced the management and guidance on anti-money laundering, successively completed the development and construction of a new generation of anti-money laundering system and established a self-monitoring monitoring model. It continued to carry out the assessment on money laundering risks in financial products, develop and optimize the watch list system of anti-money laundering and strengthen the management of high-risk customers. The Bank reported large sum and suspicious transaction data to regulatory authorities in a timely manner, assisting regulatory investigations.
XV. Outlook of the Bank
(1) Progress and achievement of business target
During the first half year of 2016, faced with severe challenges and complicated problems in business environment, the Bank successively acted in accordance with the plans made at the beginning of the year and the benchmark set among counterparts in the banking industry, leading to its steady performance and fairly good completion of various tasks. Its main business indicators were in line with expectations and the overall operation actively pressed ahead while ensuring stability. As at the end of the reporting period, total assets of the Bank increased by 18.85%, the balance of loans was up by 12.34%, and the balance of deposit was raised by 9.20%, all compared with the end of last year, leading to steady and sound achievement of the annual business target.
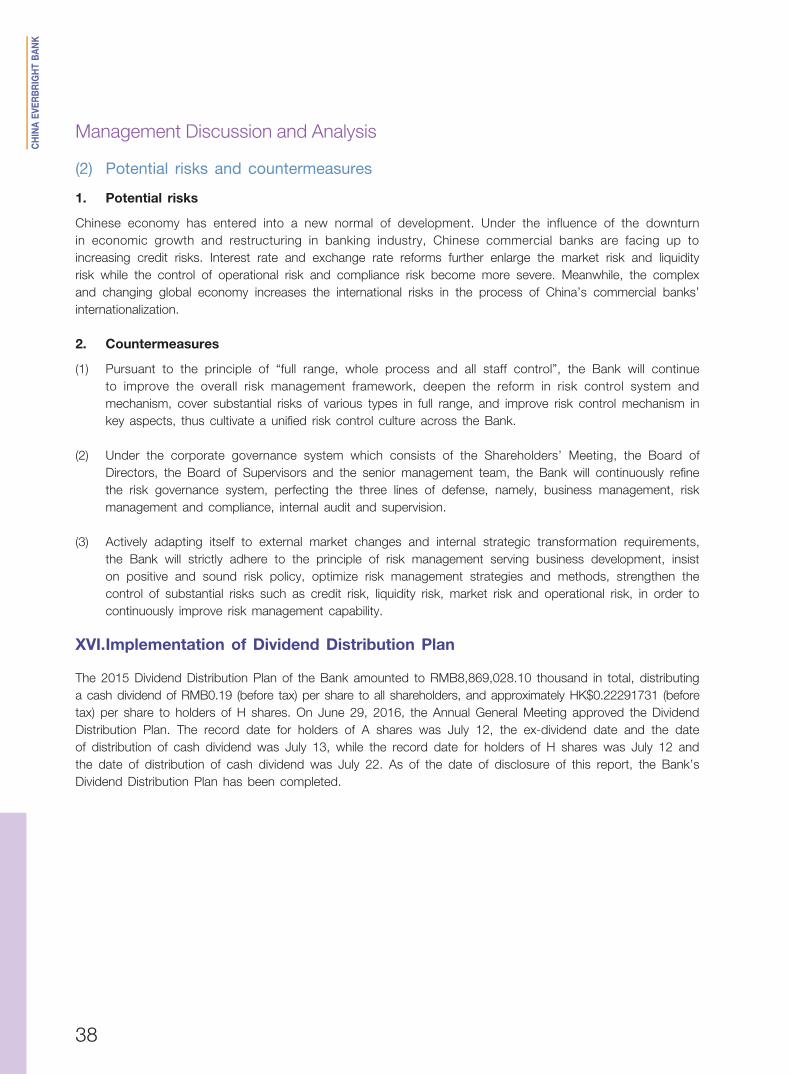
CH
INA
EVER
BR
IGH
T B
ANK
38
Management Discussion and Analysis
(2) Potential risks and countermeasures
1. Potential risks
Chinese economy has entered into a new normal of development. Under the influence of the downturn in economic growth and restructuring in banking industry, Chinese commercial banks are facing up to increasing credit risks. Interest rate and exchange rate reforms further enlarge the market risk and liquidity risk while the control of operational risk and compliance risk become more severe. Meanwhile, the complex and changing global economy increases the international risks in the process of China’s commercial banks’ internationalization.
2. Countermeasures
(1) Pursuant to the principle of “full range, whole process and all staff control”, the Bank will continue to improve the overall risk management framework, deepen the reform in risk control system and mechanism, cover substantial risks of various types in full range, and improve risk control mechanism in key aspects, thus cultivate a unified risk control culture across the Bank.
(2) Under the corporate governance system which consists of the Shareholders’ Meeting, the Board of Directors, the Board of Supervisors and the senior management team, the Bank will continuously refine the risk governance system, perfecting the three lines of defense, namely, business management, risk management and compliance, internal audit and supervision.
(3) Actively adapting itself to external market changes and internal strategic transformation requirements, the Bank will strictly adhere to the principle of risk management serving business development, insist on positive and sound risk policy, optimize risk management strategies and methods, strengthen the control of substantial risks such as credit risk, liquidity risk, market risk and operational risk, in order to continuously improve risk management capability.
XVI. Implementation of Dividend Distribution Plan
The 2015 Dividend Distribution Plan of the Bank amounted to RMB8,869,028.10 thousand in total, distributing a cash dividend of RMB0.19 (before tax) per share to all shareholders, and approximately HK$0.22291731 (before tax) per share to holders of H shares. On June 29, 2016, the Annual General Meeting approved the Dividend Distribution Plan. The record date for holders of A shares was July 12, the ex-dividend date and the date of distribution of cash dividend was July 13, while the record date for holders of H shares was July 12 and the date of distribution of cash dividend was July 22. As of the date of disclosure of this report, the Bank’s Dividend Distribution Plan has been completed.

2016 Interim
Rep
ort
39
Significant EventsI. Purchase, Sale or Repurchase of the Bank’s Listed Securities
During the reporting period, the Bank and its subsidiaries did not purchase, sell or repurchase any listed securities of the Bank.
II. Material Litigation and Arbitration
During the reporting period, the Bank was not involved in any material litigation and arbitration.
III. Use of Capital by the Controlling Shareholders and their Related Parties for Non-Operating Purposes
During the reporting period, no capital of the Bank was used by the controlling shareholders and their related parties for non-operating purposes.
IV. Bankruptcy or Reorganization
During the reporting period, no bankruptcy or reorganization took place in the Bank.
V. Material Acquisitions, Sales or Disposals of Assets and Mergers
During the reporting period, the Bank was not involved in any material acquisitions, sales or disposals of assets or mergers.
VI. Share Incentive Scheme
The Bank has not implemented any share incentive scheme.
VII. Connected Transactions of the Bank under the Rules Governing the Listing of Securities on the HKSE (“Hong Kong Listing Rules”)
In accordance with the Hong Kong Listing Rules, the transactions between the Bank and its connected persons (as defined in Hong Kong Listing Rules) constitute connected transactions of the Bank. The Bank has monitored and managed these connected transactions in compliance with the Hong Kong Listing Rules.

CH
INA
EVER
BR
IGH
T B
ANK
40
Significant Events
(I) Non-exempt connected transactions
1. Everbright Group’s subscription of domestic preference shares
On October 31, 2014, as approved by the Board of Directors of the Bank, the Bank entered into an agreement of subscription for preference shares with Everbright Group and announced the connected transaction with Everbright Group (“the Transaction”), under which Everbright Group proposed to subscribe for part of the domestic preference shares to be issued by the Bank, the details of which were set out in the Bank’s announcement dated October 31, 2014 on “Connected Transaction – Subscription of Domestic Preference Shares by Controlling Shareholder”. Since Everbright Group is a connected person of the Bank, the transaction constituted a connected transaction of the Bank and was subject to reporting, announcement and independent shareholders’ approval requirements under Chapter 14A of the Hong Kong Listing Rules. The Transaction was proposed to and passed by the independent shareholders by way of ordinary resolution at the 2014 Third Extraordinary General Meeting of the Bank on December 23, 2014. As at the date of this report, the relevant government and regulatory authorities (CBRC and CSRC) had approved the issuance of the domestic preference shares and the issuance of the first tranche of 200 million preference shares was completed on July 2, 2015. The subscribers for the first tranche did not include any connected person of the Bank.
The original specific mandate regarding the issuance of domestic preference shares granted at the 2014 Third Extraordinary General Meeting of the Bank had expired in December, 2015. In order to carry out the issuance of subsequent tranches of the domestic preference shares pursuant to the preference shares issuance plan as well as the Transaction, a resolution was passed by the Board of Directors of the Bank and then was approved by the Bank’s independent shareholders at both the 2015 Annual General Meeting and relevant class shareholders’ meetings of the Bank on June 29, 2016. The specific mandate was re-granted to the Board of Directors to handle all matters relating to the issuance of the subsequent tranches of the issuance of domestic preference shares individually or jointly within the framework and according to the principles as considered and approved by the shareholders’ general meeting and relevant class shareholders’ meetings. The validity of the specific mandate shall be 12 months commencing from the effective date of the shareholders’ resolutions. The details of the specific mandate were set out in the Bank’s announcement dated March 29, 2016 on “Re-grant of the Specific Mandate Concerning the Domestic Preference Shares Issuance”. As at the date of this report, the Transaction has been completed.
2. Non-public issuance of H shares to Everbright Group
On September 25, 2015, with the approval from the Board of Directors of the Bank, the Bank entered into an agreement on subscribing for H shares with Everbright Group and announced the connected transaction under which Everbright Group proposed to subscribe for the Bank’s H shares through non-public issuance. Please refer to the announcement “Connected Transaction – Subscription of New Shares by Connected Person Under Specific Mandate and Resumption of Trading” published by the Bank on September 25, 2015 for details. As Everbright Group is a connected person of the Bank, the transaction constituted a connected transaction, and was subject to the reporting, announcement and independent shareholders’ approval requirements pursuant to Chapter 14A of the Hong Kong Listing Rules. The transaction and related resolutions were considered and approved by the independent shareholders at the 2015 First Extraordinary General Meeting, the 2015 First A Shareholder’ Meeting and the 2015 First H Shareholder’ Meeting held by the Bank on November 19, 2015.
As at the date of this report, the Bank’s non-public issuance of H shares is still pending and subject to the consideration and approval by relevant regulatory authorities.

2016 Interim
Rep
ort
41
(II) Exempted connected transactions
During the reporting period, a series of connected transactions were entered into between the Bank and its connected persons in the ordinary course of business of the Bank. Pursuant to Chapter 14A of the Hong Kong Listing Rules, such connected transactions were exempted from the requirements of reporting, annual review, announcement and independent shareholders’ approval.
VIII. Material Contracts and Their Performance
(I) Significant events of material custody, contracting or leasing assets of other companies by the Bank, or material custody, contracting or leasing assets of the Bank by other companies
During the reporting period, except for ordinary business, there was no significant matter in relation to material custody, contracting or leasing assets of other companies by the Bank, or material custody, contracting or leasing assets of the Bank by other companies.
(II) Significant guarantee
The Bank’s guarantee business is in the ordinary course of the Bank’s business. During the reporting period, the Bank did not enter into any significant guarantee business which was required to be disclosed save for the financial guarantees within its business scope as approved by the People’s Bank of China and the CBRC. The Bank did not violate stipulated decision-making procedures in issuing guarantees.
(III) Other material contracts
During the reporting period, the Bank had no other material contracts and all contracts regarding operations of ordinary business were duly performed.
IX. Important Undertakings of the Bank or Shareholders Holding More than 5% of Its Shares and Their Performance
During the reporting period, neither the Bank nor shareholders holding more than 5% of its shares had made any new undertakings. As at the end of the reporting period, the continual undertakings of the Bank or shareholders holding more than 5% of its shares have all been performed.
X. Changes in Accounting Policies
During the reporting period, the Bank did not have changes in accounting policies.
XI. Investigation and Administrative Penalty by Regulatory Authorities
During the reporting period, none of the Bank, its Directors, Supervisors, Senior Management, controlling shareholders and actual controllers was subject to any investigation by competent authorities, any mandatory measures by judicial authorities or disciplinary departments, transfer to judicial authorities, criminal proceedings, investigation, administrative penalty or public censure by the CSRC, or public censure by any stock exchange, or any penalty with significant impact on the Bank’s operation imposed by any other regulatory body.

CH
INA
EVER
BR
IGH
T B
ANK
42
Significant Events
XII. Other Significant Events
(I) Non-public issuance of H shares
The relevant resolution on the proposal concerning the plan of non-public issuance of H shares was considered and approved at the shareholders’ general meeting held by the Bank on November 19, 2015, pursuant to which the Bank proposed to issue 4 billion H shares to Everbright Group in a non-public manner and raise total capital amounting to about HK$19.6 billion. As at the date of this report, the non-public issuance of H shares is still pending and subject to the approval of relevant regulatory authorities.
(II) Progress of issuance of second tranche of preference shares
The resolution in respect of the re-grant of the specific mandate to the Board of Directors to handle matters relating to the domestic non-public preference shares issuance was considered and approved at the shareholders’ general meeting held by the Bank on June 29, 2016. As at the date of this report, the Bank has completed the issuance of second tranche of preference shares, issuing 100 million preference shares and raising RMB10 billion in total.
(III) Issuance of convertible bonds
The proposal concerning the public issuance of A share convertible corporate bonds and its listing was considered and approved at the shareholders’ general meeting held by the Bank on June 29, 2016. According to the proposal, the Bank will issue no more than RMB30 billion convertible corporate bonds. As at the date of this report, the relevant work is in progress.
XIII. Review of Interim Results
The Bank’s external auditor Ernst & Young reviewed the Bank’s interim financial statements which were prepared in compliance with the disclosure requirements of the International Financial Reporting Standards and the Hong Kong Listing Rules. The Audit Committee and the Board of Directors of the Bank have reviewed and approved the interim results and financial report of the Bank for the six-month period ended June 30, 2016.
XIV. Publication of Interim Report
The interim report, in both Chinese and English, prepared by the Bank in compliance with the International Financial Reporting Standards and the Hong Kong Listing Rules is available at the websites of the HKSE and the Bank. In case of any discrepancy, the Chinese version shall prevail.

2016 Interim
Rep
ort
43
Changes in Ordinary Shares and ShareholdersI. Changes in shares
Unit: share, %
Before change
Changes during the
reporting period After change
Number Percentage Number Number Percentage
I. Shares subject to trading moratorium – – – – –II. Shares not subject to trading moratorium
1. RMB-denominated ordinary shares (A shares) 39,810,359,500 85.29 – 39,810,359,500 85.292. Domestically listed foreign shares – – – – –3. Overseas listed foreign shares (H shares) 6,868,735,500 14.71 – 6,868,735,500 14.714. Others – – – – –
III. Total shares 46,679,095,000 100.00 – 46,679,095,000 100.00
II. Number of shareholders
Unit: ShareholderItem A shares H shares
Total number of shareholders as at the end of the reporting period 295,303 1,034
III. Confirmation of the Bank’s compliance with the requirement of sufficiency of public float under the Hong Kong Listing Rules
Based on publicly available information and the knowledge of the Directors, as at June 30, 2016, the Bank has maintained the public float as required by the Hong Kong Listing Rules and kept the public float level as required by the HKSE for relevant waiver upon the listing of the Bank.

CH
INA
EVER
BR
IGH
T B
ANK
44
Changes in Ordinary Shares and Shareholders
IV. Shareholdings of top 10 shareholders
Unit: share, %
Name of shareholder Nature
Change in the reporting
period (+, -)Class of shares
Number of shares held at the end of the reporting period
Shareholdingpercentage
Numberof shares
pledged or frozen
Shares not subject to
trading moratorium
Sharessubject
to tradingmoratorium
China Everbright Group Limited Domestic legal person +150,551,435 A shares 11,207,831,469 – 24.01 –+45,930,000 H shares 172,965,000 – 0.37 –
Central Huijin Investment Ltd State – A shares 10,250,916,094 – 21.96 –HKSCC Nominees Limited, including: – +301,980 H shares 6,862,961,480 – 14.70 Unknown Ocean Fortune Investment Limited Overseas legal person +17,093,000 H shares 1,626,366,000 – 3.48 – China Life Reinsurance Company Limited
Domestic legal person +85,000,000 H shares 1,247,713,000 – 2.67 –
China Everbright Limited Overseas legal person – A shares 1,572,735,868 – 3.37 –China Securities Finance Corporation Limited
Domestic legal person +66,670,502 A shares 1,402,164,782 – 3.00 –
China Reinsurance (Group) Corporation
Domestic legal person – A shares 782,913,367 – 1.68 –+237,537,000 H shares 275,977,000 – 0.59 –
Shenergy (Group) Co., Ltd. Domestic legal person – A shares 766,002,403 – 1.64 –Central Huijin Asset Management Ltd.
State – A shares 629,693,300 – 1.35 –
Yunnan Hehe (Group) Co., Ltd. Domestic legal person +626,063,556 A shares 626,063,556 – 1.34 –Guangzhou Maritime Transport (Group) Co., Ltd
Domestic legal person – A shares 423,982,589 – 0.91 –
The connected relations or concerted actions among the aforementioned shareholders: so far as the Bank was informed, as at the end of the reporting period, Central Huijin Investment Limited (“CHI”) held a 55.67% and 71.56% interest in China Everbright Group Limited and China Reinsurance (Group) Corporation respectively. Central Huijin Asset Management Ltd. is a wholly-owned subsidiary of CHI, China Everbright Limited is a subsidiary of China Everbright Holdings Company Limited, and China Everbright Holdings Company Limited is a wholly-owned subsidiary of China Everbright Group Limited. China Life Reinsurance Company Limited is a subsidiary of China Reinsurance (Group) Corporation. Guangzhou Maritime Transport (Group) Co., Ltd. and Ocean Fortune Investment Limited are subsidiaries of China Shipping (Group) Company. China Shipping (Group) Company is a wholly-owned subsidiary of China COSCO Shipping Corporation Limited. Save for the above, the Bank is not aware of any connected relations or concerted actions among the aforementioned shareholders.

2016 Interim
Rep
ort
45
Notes: 1. The total number of H shares of the Bank held by the HKSCC Nominees Limited acting as the nominee for all institutional and individual investors that maintain an account with it as at the end of the reporting period was 6,862,961,480 H shares. Apart from the 1,626,366,000, 1,247,713,000, 172,965,000 and 275,977,000 H shares of the Bank held by Ocean Fortune Investment Limited, China Life Reinsurance Company Limited, China Everbright Group Limited and China Reinsurance (Group) Corporation respectively, all of which were under the name of HKSCC Nominees Limited, as the Bank was informed, the number of remaining H shares of the Bank held under the name of HKSCC Nominees Limited was 3,539,940,480 H shares.
2. The shares held by Yunnan Hehe (Group) Co., Ltd. were from Hongta Tobacco (Group) Limited and Hongyunhonghe Tobacco (Group) Co., Ltd. under gratuitous transfer.
V. Shareholdings of the top 10 shareholders not subject to trading moratorium
Shareholding of the top 10 shareholders not subject to trading moratorium of the Bank is the same as that of the top 10 shareholders.
VI. There was no change in the substantial shareholders of the Bank during the reporting period.
VII. Interests or short positions of substantial shareholders and other persons in shares and underlying shares of the Bank under Hong Kong laws and regulations
As at June 30, 2016, so far as was known to Directors and Supervisors of the Bank, the following persons or corporations (other than Directors, Supervisors or Chief Executives of the Bank) had interests and short positions in the shares or underlying shares of the Bank as recorded in the register required to be kept under section 336 of the Securities and Futures Ordinance of Hong Kong (“HKSFO”) or which were required to be notified to the Bank:

CH
INA
EVER
BR
IGH
T B
ANK
46
Changes in Ordinary Shares and Shareholders
Name of substantial shareholder NoteClass of shares Type of interest
Long/short position
Number of shares
Percentage of the
relevant shares in
issue(%)5,6
Percentageof the total
issuedshares
(%)5,6
China COSCO Shipping Corporation Limited 1 H shares Interest of controlled corporation Long 1,626,366,000 23.67 3.48China Shipping (Group) Company 1 H shares Interest of controlled corporation Long 1,626,366,000 23.67 3.48COSCO Shipping Financial Holding Co., Ltd. (formerly known as China Shipping (Hong Kong) Holdings Co., Ltd.)
1 H shares Interest of controlled corporation Long 1,626,366,000 23.67 3.48
Ocean Fortune Investment Limited 1 H shares Beneficial Owner Long 1,626,366,000 23.67 3.48Central Huijin Investment Ltd 2,3 H shares Interest of controlled corporation Long 5,780,285,000 84.15 12.38China Everbright Group Limited 2,3 H shares Beneficial Owner/Interest of
controlled corporationLong 4,256,595,000 61.97 9.11
China Reinsurance (Group) Corporation 2 H shares Beneficial Owner/Interest of controlled corporation
Long 1,523,690,000 22.18 3.26
China Life Reinsurance Company Ltd. 2 H shares Beneficial Owner Long 1,247,713,000 18.16 2.67National Council for Social Security Fund H shares Beneficial Owner Long 617,375,500 8.98 1.32China Everbright Group Limited 4 A shares Beneficial Owner/Interest of
controlled corporationLong 12,997,123,595 32.64 27.84
Central Huijin Investment Ltd 4 A shares Beneficial Owner/Interest of controlled corporation
Long 24,660,646,356 61.94 52.83
Notes: 1. Ocean Fortune Investment Limited held a long position in 1,626,366,000 H shares of the Bank directly. As far as the Bank is aware, Ocean Fortune Investment Limited was wholly-owned by COSCO Shipping Financial Holding Co., Ltd., while COSCO Shipping Financial Holding Co., Ltd. was wholly-owned by China Shipping (Group) Company, and China Shipping (Group) Company was wholly-owned by China COSCO Shipping Corporation Limited. In accordance with the HKSFO, China COSCO Shipping Corporation Limited, China Shipping (Group) Company and COSCO Shipping Financial Holding Co., Ltd. were deemed to be interested in the 1,626,366,000 H shares held by Ocean Fortune Investment Limited.
2. China Life Reinsurance Company Ltd. held a long position in 1,247,713,000 H shares of the Bank directly. China Reinsurance (Group) Corporation held a long position in 275,977,000 H shares of the Bank directly. China Everbright Group Limited held 4,172,965,000 H shares of the Bank directly. China Everbright Holdings Company Limited held 83,630,000 H shares of the Bank directly. As far as the Bank is aware, China Life Reinsurance Company Ltd. was wholly-owned by China Reinsurance (Group) Corporation, while 71.56% of the issued share capital of China Reinsurance (Group) Corporation was held by Central Huijin Investment Ltd. China Everbright Holdings Company Limited was wholly-owned by China Everbright Group Limited, while 55.67% of the issued share capital of China Everbright Group Limited was held by Central Huijin Investment Ltd. In accordance with the HKSFO, China Reinsurance (Group) Corporation was deemed to be interested in the 1,247,713,000 H shares held by China Life Reinsurance Company Ltd., whereas China Everbright Group Limited was deemed to be interested in the 83,630,000 H shares held by China Everbright Holdings Company Limited. Therefore, Central Huijin Investment Ltd. was deemed to be interested in a total of 5,780,285,000 H shares of the Bank.
3. Among the 4,172,965,000 H shares of the Bank directly held by China Everbright Group Limited, 4,000,000,000 H shares have not been allotted. Pursuant to the Subscription Agreement dated September 25, 2015 made between the Bank and China Everbright Group Limited, the Bank conditionally agreed to issue and allot a total of 4,000,000,000 H shares to China Everbright Group Limited.
Among the 5,780,285,000 H shares of the Bank indirectly held by Central Huijin Investment Ltd., 4,000,000,000 H shares as mentioned above have not been allotted.

2016 Interim
Rep
ort
47
4. China Everbright Group Limited directly held a long position in 11,207,831,469 A shares of the Bank. China Everbright Group Limited was deemed to be interested in a long position in a total of 1,789,292,126 A shares of the Bank held by its following subsidiaries:
(1) China Everbright Limited directly held a long position in 1,572,735,868 A shares of the Bank.
(2) Meiguang Enyu (Shanghai) Properties Company Limited directly held a long position of 148,156,258 A shares of the Bank.
(3) China Everbright Investment and Assets Management Co., Ltd. directly held a long position of 8,000,000 A shares of the Bank.
(4) Everbright Financial Holding Asset Management Co., Ltd. held a long position of 60,400,000 A shares of the Bank.
Therefore, China Everbright Group Limited directly and indirectly held a long position of 12,997,123,595 A shares of the Bank in total.
Central Huijin Investment Ltd directly held a long position in 10,250,916,094 A shares of the Bank, while China Reinsurance (Group) Corporation and Central Huijin Asset Management Ltd. directly held a long position of 782,913,367 and 629,693,300 A shares of the Bank respectively. As far as the Bank is aware, the entire issued share capital of Central Huijin Asset Management Ltd., 71.56% of the issued share capital of China Reinsurance (Group) Corporation and 55.67% of the issued share capital of China Everbright Group Limited were held by Central Huijin Investment Ltd respectively. In accordance with the HKSFO, Central Huijin Investment Ltd was deemed to be interested in the long position in 629,693,300 A shares held by Central Huijin Asset Management Ltd., the long position in 782,913,367 A shares held by China Reinsurance (Group) Corporation, and the long position of 12,997,123,595 A shares held by China Everbright Group Limited. Therefore, Central Huijin Investment Ltd directly and indirectly held a long position in 24,660,646,356 A shares of the Bank in total.
5. As at June 30, 2016, the total issued share capital of the Bank was 46,679,095,000 shares, including 39,810,359,500 A shares and 6,868,735,500 H shares.
6. The percentage of shareholdings are calculated by rounding to two decimal places.
Save as disclosed above, as at June 30, 2016, the Bank had not been notified by any persons who had interests or short positions in the shares or underlying shares of the Bank which were required to be disclosed to the Bank under the provisions of Divisions 2 and 3 of Part XV of the HKSFO, or which were recorded in the register required to be kept by the Bank under section 336 of the HKSFO.
VIII. Interests or short positions of Directors, Supervisors and Chief Executives in shares, underlying shares and debentures of the Bank under the Hong Kong laws and regulations
As at June 30, 2016, as far as the Directors and Supervisors of the Bank are aware, none of the Directors, Supervisors nor the Chief Executives of the Bank had any interests or short positions in the shares, underlying shares or debentures of the Bank or any of its associated corporations (as defined in Divisions 7 and 8 of Part XV of the HKSFO) which were required to be recorded in the register required to be kept and notified to the Bank and HKSE under section 352 of the HKSFO, or which were required to be notified to the Bank and the HKSE pursuant to the Model Code for Securities Transactions by Directors of Listed Issuers (“Model Code”) set out in Appendix 10 to the Hong Kong Listing Rules, nor had they been granted the right to acquire any interests in shares or debentures of the Bank or any of its associated corporations.

CH
INA
EVER
BR
IGH
T B
ANK
48
Changes in Preference Shares and ShareholdersI. The issuance and listing of preference shares during the reporting period
During the reporting period, the Bank had no issuance and listing for preference shares, with 200 million preference shares already trading on the comprehensive business platform of the SSE.
On June 15, 2015, upon approval by the CSRC via document Zheng Jian Xu Ke [2015] No. 1239, the non-public issuance of preference shares by the Bank was approved. The Bank was permitted to conduct the non-public issuance of no more than 300 million preference shares, in which the issuance of the first tranche of 200 million preference shares by the Bank was completed on June 19, 2015 and the issuance of the second tranche of 100 million preference shares was completed on August 8, 2016 with a par value of RMB100 per share. After deducting issuance expenses, the actual proceeds raised amounted to RMB9,981 million, all of which are used to replenish the tier-1 capital.
II. Total number of holders of preference shares and shareholdings of top 10 shareholders
Unit: Share, %Number of preference shareholders as at the end of the reporting period 18
Name of shareholderNature of shareholder
Changes in shareholding
during thereporting
periodNumber of
shares held
Percentage of
shareholding Class of shares
Numberof sharespledged/
frozen
Bank of Communications Schroder Fund Management Co., Ltd.
Others – 37,750,000 18.88 Domestic preference shares –
China CITIC Bank Corporation Limited Others – 17,750,000 8.88 Domestic preference shares –Chuangjin Hexin Fund Management Limited
Others – 15,510,000 7.76 Domestic preference shares –
BOCI Securities Limited Others – 15,500,000 7.75 Domestic preference shares –Bank of Communications International Trust Co., Ltd.
Others – 15,500,000 7.75 Domestic preference shares –
Hwabao Trust Co., Ltd. Others – 13,870,000 6.94 Domestic preference shares –China Resources SZITIC Trust Co., Ltd.
Others – 13,870,000 6.94 Domestic preference shares –
CCB Trust Co., Limited Others – 10,000,000 5.00 Domestic preference shares –China Ping An Property & Casualty Insurance Co., Ltd.
Others – 10,000,000 5.00 Domestic preference shares –
China Ping An Life Insurance Co., Ltd. Others – 10,000,000 5.00 Domestic preference shares –
The connected relations or concerted actions among the aforementioned shareholders: China Ping An Property & Casualty Insurance Co., Ltd. and China Ping An Life Insurance Co., Ltd., preference shareholders, have connected relations. Bank of Communications Schroder Fund Management Co., Ltd. and Bank of Communications International Trust Co., Ltd. have connected relations.

2016 Interim
Rep
ort
49
III. The profit distribution of preference shares during the reporting period
At the Board Meeting held on May 11, 2016, the Bank considered and approved the proposal in respect of the 2016 dividend distribution of the first tranche of preference shares, allowing the Bank to distribute a dividend of the first tranche of preference shares at the coupon rate of 5.30% (before tax) on June 27, 2016. The distribution proposal has been implemented.
IV. During the reporting period, the Bank neither repurchased preference shares nor converted preference shares into ordinary shares.
V. During the reporting period, the Bank restored no voting rights of preference shares.
VI. The Bank’s accounting policies for its preference shares and reasons for such policies
Pursuant to the provisions of the “Accounting Standards for Enterprises No. 22 – Recognition and Measurement of Financial Instruments”, “Accounting Standards for Enterprises No. 37 – Presentation of Financial Instruments” and “Rules on Differentiating the Financial Liabilities and the Equity Instruments and Relevant Accounting Treatments” promulgated by the Ministry of Finance, the preference shares issued by the Bank would be accounted for as an equity instrument.

CH
INA
EVER
BR
IGH
T B
ANK
50
Directors, Supervisors, Senior Management, Staff and Branch OutletsI. None of the Directors, Supervisors and Senior Management of the Bank
held any shares, stock options of the Bank or had been granted any restrictive shares of the Bank during the reporting period.
II. Basic Information of Directors, Supervisors and Senior Management
As at the end of the reporting period, the Board of Directors of the Bank had 171 Directors in total, including 3 Executive Directors, namely Zhang Jinliang, Ma Teng and Li Jie; 8 Non-executive Directors, namely Tang Shuangning, Gao Yunlong, Liu Jun, Zhang Shude, Wu Gang, Li Huaqiang, Zhao Wei and Yang Jigui; and 6 Independent Non-Executive Directors, namely Zhang Xinze, Qiao Zhimin, Xie Rong, Fok Oi Ling Catherine, Xu Hongcai and Feng Lun.
As at the end of the reporting period, the Board of Supervisors of the Bank had 9 Supervisors in total, including 3 Shareholder Supervisors, namely Li Xin, Yin Lianchen and Wu Junhao; 3 External Supervisors, namely Yu Erniu, Wu Gaolian and Deng Ruilin; and 3 Employee Supervisors, namely Mu Huijun, Ye Donghai and Liu Yan.
As at the end of the reporting period, the Senior Management of the Bank comprised 9 people in total, namely Zhang Jinliang, Ma Teng, Li Jie, Zhang Huayu, Lu Hong, Wu Jian, Yao Zhongyou, Cai Yunge and Huang Haiqing.
III. Changes in Directors, Supervisors and Senior Management
(I) Changes in Directors
1. On January 14, 2016, due to job assignment, Mr. Zhao Huan resigned from the positions of Executive Director of the Board of Directors, member of the Strategy Committee of the Board of Directors and member of the Risk Management Committee of the Board of Directors of the Bank.
2. On June 29, 2016, the 2015 Annual General Meeting of the Bank elected Mr. Zhang Jinliang and Ms. Li Jie as Executive Directors of the Bank. On 25 August 2016, CBRC approved the appointment qualifications of Mr. Zhang Jinliang as Executive Directors. The appointment qualifications of Ms. Li Jie as Executive Director are still pending for the approval by CBRC.
3. On June 29, 2016, the 2015 Annual General Meeting of the Bank elected Mr. Liu Jun, Mr. Zhang Shude and Mr. Li Huaqiang as Non-Executive Directors of the Bank. On 25 August 2016, CBRC approved the appointment qualification of Mr. Liu Jun as Non-Executive Director. The appointment qualifications of Mr. Zhang Shude and Mr. Li Huaqiang as Directors are still pending for the approval by CBRC.
4. On June 29, 2016, due to change of session of the Board of Directors, Mr. Wu Jian ceased to serve as Non-Executive Director of the Board of Directors, Chairman of the Risk Management Committee of the Board of Directors, member of the Strategy Committee of the Board of Directors and member of the Audit Committee of the Board of Directors of the Bank.
5. On June 29, 2016, due to change of session of the Board of Directors, Ms. Wang Shumin ceased to serve as Non-Executive Director of the Board of Directors, member of the Remuneration Committee of the Board of Directors and member of the Strategy Committee of the Board of Directors of the Bank.
1 As at the date of this report, the appointment qualifications of the three directors, namely Li Jie, Zhang Shude and Li Huaqiang, are subject to the approval by the CBRC.

2016 Interim
Rep
ort
51
6. On June 29, 2016, due to change of session of the Board of Directors, Mr. Wu Gaolian ceased to serve as Non-Executive Director of the Board of Directors, member of the Remuneration Committee of the Board of Directors and member of the Risk Management Committee of the Board of Directors of the Bank.
(II) Changes in Supervisors
1. On June 27, 2016, the 2016 staff representative meeting of the Bank elected Ms. Liu Yan as an Employee Supervisor of the Bank. Ms. Chen Yu and Mr. Ma Ning ceased to serve as Employee Supervisors of the Bank.
2. On June 29, 2016, the 2015 Annual General Meeting of the Bank elected Mr. Wu Gaolian and Mr. Deng Ruilin as External Supervisors of the Bank.
3. On June 29, 2016, due to change of session of the Board of Supervisors, Mr. James Parks Stent ceased to serve as External Supervisor, Chairman of the Supervision Committee of the Board of Supervisors and member of the Nomination Committee of the Board of Supervisors of the Bank.
(III) Changes in Senior Management
1. On January 14, 2016, due to job assignment, Mr. Zhao Huan resigned as President of the Bank.
2. On January 14, 2016, the 38th meeting of the Sixth Session of the Board of Directors of the Bank appointed Mr. Zhang Jinliang as President of the Bank; his appointment qualification as a President was approved by the CBRC on February 22, 2016.
3. On May 20, 2016, due to job assignment, Mr. Qiu Huofa resigned as Vice President of the Bank.
4. On June 2, 2016, Mr. Huang Haiqing was appointed by the CPC Committee of China Everbright Group Limited as a CPC Committee member and Secretary of Disciplinary Committee (Executive Vice President Level) of the Bank.
(IV) Changes in Information of Directors and Supervisors during the Reporting Period
1. Mr. Yang Jigui, a Non-Executive Director of the Bank, concurrently served as Deputy Chief Accountant of China COSCO Shipping Company Limited.
2. Mr. Zhang Xinze, an Independent Non-Executive Director of the Bank, ceased to concurrently serve as Vice Chairman of the China Economic Value Added Application Association.
3. Mr. Xie Rong, an Independent Non-Executive Director of the Bank, ceased to concurrently serve as an Independent Director of Shanghai Baosight Software Co., Ltd..
4. Ms. Fok Oi Ling Catherine, an Independent Non-Executive Director of the Bank, concurrently served as an independent consultant of Siya International Consultancy Service Co., Ltd..

CH
INA
EVER
BR
IGH
T B
ANK
52
Directors, Supervisors, Senior Management, Staff and Branch Outlets
(V) Directors’ and Supervisors’ Interests in Contracts and Service Contracts
None of the Directors and Supervisors of the Bank had any material interest in the material contracts to which the Bank or any of its subsidiaries was a party during the reporting period. None of the Directors and Supervisors of the Bank has entered into any service contract with the Bank which is not determinable by the Bank within one year without payment of compensation (excluding statutory compensation).
(VI) Information on Employees and Branch Outlets
As at the end of the reporting period, the Bank had 39,821 employees (exclusive of those of subsidiaries).
The total number of domestic branches and outlets of the Bank was 1,080, including 37 tier-1 branches, 73 tier-2 branches and 970 outlets, representing an increase of 33 outlets compared with that at the end of the previous year. During the reporting period, the Bank opened 5 new tier-2 branches and 28 outlets. The Bank had 2 overseas branches in both Hong Kong and Seoul, while the Seoul branch was established during the reporting period.
Name of BranchNumber of
OutletsNumber ofemployees
Total assets(RMB million)
Head Office 1 3,594 2,188,995Beijing Branch 67 2,887 457,246Shanghai Branch 55 1,896 215,705Tianjin Branch 34 1,132 65,368Chongqing Branch 26 1,039 91,353Shijiazhuang Branch 43 1,173 78,954Taiyuan Branch 32 1,133 54,597Hohhot Branch 16 579 24,977Dalian Branch 23 723 48,451Shenyang Branch 33 1,140 65,416Changchun Branch 29 841 45,589Heilongjiang Branch 37 1,088 40,537Nanjing Branch 36 1,256 139,682Suzhou Branch 20 850 77,901Wuxi Branch 7 312 56,411Hangzhou Branch 34 1,265 84,667Ningbo Branch 19 811 64,213Hefei Branch 39 1,308 90,486Fuzhou Branch 34 1,265 51,069Xiamen Branch 13 508 58,743Nanchang Branch 19 544 53,870Jinan Branch 26 875 49,106Qingdao Branch 33 954 97,795Yantai Branch 13 487 26,311Zhengzhou Branch 44 1,316 87,048Wuhan Branch 31 1,055 53,090

2016 Interim
Rep
ort
53
Name of BranchNumber of
OutletsNumber ofemployees
Total assets(RMB million)
Changsha Branch 48 1,107 87,672Guangzhou Branch 75 2,192 157,838Shenzhen Branch 47 1,315 185,584Nanning Branch 24 834 43,372Haikou Branch 20 729 48,154Chengdu Branch 24 893 68,392Kunming Branch 23 761 37,499Xi’an Branch 32 1,022 99,480Urumqi Branch 6 168 7,822Guiyang Branch 7 290 20,209Lanzhou Branch 9 266 16,180Yinchuan Branch 2 75 2,402Hong Kong Branch 1 112 54,919Seoul Branch 1 26 928Adjustment on consolidation of regions -1,483,828Total 1,083 39,821 3,714,203
Notes: 1. Employees of the Head Office included 600 employees from the Credit Card Center and 1,629 employees from 95595 the Call Center.
2. The number of branches and outlets, employees and total assets in the above table excluded those of the subsidiaries of the Bank.

CH
INA
EVER
BR
IGH
T B
ANK
54
Corporate GovernanceI. Overview of Corporate Governance
During the reporting period, the Board of Directors of the Bank continued to enhance the building up of its corporate system by amending the terms of reference of the six special committees under the Board of Directors to further regulate their operation. It also strengthened the Bank’s authorization management with the amendments to the Proposal Regarding Authorization by Shareholders’ General Meeting to Board of Directors, the Proposal Regarding Authorization by Board of Directors to President and the Management Measures of Authorization by Board of Directors to President. The Board of Directors continuously focused on capital management by considering and approving the proposals on the issuance of preference shares (second tranche) and the A share convertible corporate bonds and re-examining the Report on Capital Planning (2016-2020). The election of a new session of the Board of Directors was completed smoothly while the self-construction of the Board of Directors was enhanced.
During the reporting period, the Board of Supervisors of the Bank amended the terms of reference of the special committees under the Board of Supervisors according to the latest Articles of Association and Rules of Procedure of the Board of Supervisors. It also continued to conduct annual evaluation on the duty performance of the Board of Directors and its members as well as the Senior Management and completed the first annual evaluation on the duty performance of supervisors. In addition, the Board of Supervisors considered the regular reports of the Bank in performing its function of overseeing the Bank’s financial affairs. The election of a new session of the Board of Supervisors was smoothly completed.
II. Shareholders’ General Meeting
The Bank convenes shareholders’ general meetings in strict compliance with the Articles of Association of the Bank and Rules of Procedures of the General Meeting of Shareholders to ensure that decisions on important matters are made in compliance with the law, and to safeguard the legitimate rights and interests of shareholders. During the reporting period, the Bank convened one annual general meeting, one A Shareholders Meeting and one H Shareholders Meeting, the details of which are as follows:
On June 29, 2016, the 2015 Annual General Meeting considered and approved 16 resolutions on the work report of the Board of Directors, the work report of the Board of Supervisors, the audited accounts, financial budget plan, profit distribution plan and the election of directors and supervisors, and heard 2 reports.
On June 29, 2016, the 2016 First A Shareholders Meeting and the 2016 First H Shareholders Meeting considered and approved two proposals, regarding the re-grant of mandate to the Board of Directors to handle matters relating to the issuance of preference shares and the public issuance and listing of A share convertible corporate bonds.
The procedures for issuing the notice of, convening of and voting at the above meetings fully complied with the Company Law, the listing rules of the two places where the Bank is listed and the Articles of Association of the Bank. The legal advisor engaged by the Board of Directors of the Bank attested the above shareholders’ meetings of the Bank. The PRC lawyer issued the relevant legal opinion.

2016 Interim
Rep
ort
55
III. Convening of Meetings of the Board of Directors and its Special Committees
During the reporting period, the Board of Directors of the Bank convened 7 meetings, including 5 on-site meetings, namely the thirty-eighth, thirty-ninth, forty-first and forty-second meetings of the Sixth Session of the Board of Directors and the first meeting of the Seventh Session of the Board of Directors, and 2 meetings by written resolution, namely the thirty-seventh and fortieth meetings of the Sixth Session of the Board of Directors. The Board of Directors considered 45 proposals and heard 11 reports, effectively playing its role in scientific decision-making.
The special committees under the Board of Directors convened 22 meetings in total, including 4 meetings of the Strategy Committee, 4 meetings of the Audit Committee, 4 meetings of the Risk Management Committee, 3 meetings of the Nomination Committee, 3 meetings of the Remuneration Committee and 4 meetings of the Connected Party Transaction Control Committee. The Board Committees considered 34 proposals in total and heard and studied 12 special research reports.
IV. Convening of Meetings of the Board of Supervisors and its Special Committees
During the reporting period, the Board of Supervisors of the Bank convened 4 meetings, including 3 on-site meetings, namely the twenty-second and twenty-fourth meetings of the Sixth Session of the Board of Supervisors and the first meeting of the Seventh Session of the Board of Supervisors, and 1 meeting by written resolution, namely the twenty-third meeting of the Sixth Session of the Board of Supervisors. It considered 14 proposals and heard 1 report, effectively performing its supervisory duty.
The special committees of the Board of Supervisors convened 5 meetings in total, including 2 meetings of the Supervision Committee and 3 meetings of the Nomination Committee, and considered 11 proposals in total.
V. Information Disclosure
During the reporting period, the Bank published the 2015 Annual Report and 2016 First Quarterly Report as scheduled to fully disclose the operations and management of the Bank to domestic and foreign investors. Pursuant to the regulatory rules for disclosure, 38 provisional announcements (including non-announcement online documents) were published on the SSE, and 77 provisional announcements (including overseas regulatory announcements) were published on the HKSE, so as to ensure timely and synchronized disclosure of information in the markets of the two places. In strict compliance with the relevant requirements of regulatory authorities on the management of inside information, the Bank continued to strengthen the management of insiders to prevent leakage of sensitive information, so as to ensure the rights of investors to fair access to the information of the Bank.

CH
INA
EVER
BR
IGH
T B
ANK
56
Corporate Governance
VI. Investor Relations
The Bank manages investor relationships through various activities. During the reporting period, the Bank held the 2015 annual results (A+H shares) announcement and press conference for investors and domestic and overseas media in Hong Kong, which were attended by over 120 institutional investors, banking industry analysts and media correspondents at home and abroad. 155 investors and domestic and overseas investment banking analysts visited the Bank or made on-site researches. The management and staff of the Bank participated in some strategy seminars organized by investment institutions and held over 10 on-site group meetings. They answered more than 260 phone calls, replied to over 210 enquiry emails from domestic and overseas investors, and interacted with investors via “SSE e-interaction”. The Bank’s website in both Chinese and English version has been updated in a timely manner to keep investors well informed about the Bank.
VII. Securities Transactions by Directors, Supervisors and Relevant Employees
The Bank has adopted the standards set out in the Model Code in Appendix 10 to the Hong Kong Listing Rules as the code of conduct for securities transactions by Directors and Supervisors of the Bank. Upon enquiry, all Directors and Supervisors have confirmed that they have complied with the Model Code during the six months ended June 30, 2016. The Bank has also formulated guidelines on trading of securities of the Bank by relevant employees, which are no less stringent than the Model Code. It did not come to the attention of the Bank that any relevant employee was in breach of the guidelines.
VIII. Statement on Compliance with the Corporate Governance Code of the Hong Kong Listing Rules
During the six months ended June 30, 2016, the Bank has applied the principles and complied with all the code provisions of the Corporate Governance Code (the “CG Code”) contained in Appendix 14 to the Hong Kong Listing Rules.

57
2016 Interim
Rep
ort
Report on Review of Interim Financial Information
Ernst & Young22/F, CITIC Tower1 Tim Mei AvenueCentral, Hong Kong
To the Board of Directors of China Everbright Bank Company Limited(Incorporated in the People’s Republic of China with limited liability)
Introduction
We have reviewed the accompanying interim financial information set out on pages 58 to 155, which comprises the condensed consolidated statement of financial position of China Everbright Bank Company Limited (the “Bank”) and its subsidiaries (together, the “Group”) as at 30 June 2016 and the related condensed consolidated statements of profit or loss, comprehensive income, changes in equity, and cash flows for the six-month period then ended and explanatory notes. The Rules Governing the Listing of Securities on The Stock Exchange of Hong Kong Limited require the preparation of a report on interim financial information to be in compliance with the relevant provisions thereof and International Accounting Standard 34 “Interim Financial Reporting” (“IAS 34”) issued by the International Accounting Standards Board.
The directors are responsible for the preparation and presentation of this interim financial information in accordance with IAS 34. Our responsibility is to express a conclusion on this interim financial information based on our review. Our report is made solely to you, as a body, in accordance with our agreed terms of engagement, and for no other purpose. We do not assume responsibility towards or accept liability to any other person for the contents of this report.
Scope of review
We conducted our review in accordance with International Standard on Review Engagements 2410 “Review of Interim Financial Information Performed by the Independent Auditor of the Entity”. A review of interim financial information consists of making inquiries, primarily of persons responsible for financial and accounting matters, and applying analytical and other review procedures. A review is substantially less in scope than an audit conducted in accordance with International Standards on Auditing and consequently does not enable us to obtain assurance that we would become aware of all significant matters that might be identified in an audit. Accordingly, we do not express an audit opinion.
Conclusion
Based on our review, nothing has come to our attention that causes us to believe that the accompanying interim financial information is not prepared, in all material respects, in accordance with IAS 34.
Ernst & YoungCertified Public Accountants
Hong Kong26 August 2016

CH
INA
EVER
BR
IGH
T B
ANK
58
Unaudited Condensed Consolidated Statement of Profit or Lossfor the six months ended 30 June 2016(Expressed in millions of Renminbi, unless otherwise stated)
For the six months ended 30 June
Note 2016 2015
Interest income 69,610 71,149Interest expense (36,985) (39,044)
Net interest income 3 32,625 32,105Fee and commission income 14,602 14,211Fee and commission expense (704) (653)
Net fee and commission income 4 13,898 13,558Net trading gains/(losses) 5 546 (337)Dividend income – 4Net (losses)/gains arising from investment securities 6 (77) 5Net foreign exchange (losses)/gains (174) 160Other operating income 263 92Operating income 47,081 45,587Operating expenses 7 (15,413) (15,710)
Operating profit before impairment 31,668 29,877Impairment losses on assets 8 (9,956) (8,387)
Profit before tax 21,712 21,490Income tax 9 (5,244) (5,223)
Net profit 16,468 16,267
The notes on pages 65 to 155 form part of these financial statements.

59
2016 Interim
Rep
ort
Unaudited Condensed Consolidated Statement of Comprehensive Incomefor the six months ended 30 June 2016(Expressed in millions of Renminbi, unless otherwise stated)
For the six months ended 30 June
Note 2016 2015
Net profit 16,468 16,267
Other comprehensive income:Items that may be reclassified subsequently to profit or loss:Available-for-sale financial assets: – Net change in fair value (982) 1,904 – Reclassified to the profit or loss upon disposal 90 (3) – Related income tax effect 223 (475)Exchange differences on translation of financial statements of overseas subsidiaries 11 –
Other comprehensive income, net of tax (658) 1,426
Total comprehensive income 15,810 17,693
Net profit attributable to:Equity shareholders of the Bank 16,439 16,241Non-controlling interests 29 26
16,468 16,267
Total comprehensive income attributable to:Equity shareholders of the Bank 15,781 17,667Non-controlling interests 29 26
15,810 17,693
Basic and diluted earnings per ordinary share (in RMB) 10 0.33 0.35
The notes on pages 65 to 155 form part of these financial statements.

CH
INA
EVER
BR
IGH
T B
ANK
60
Unaudited Condensed Consolidated Statement of Financial PositionAs at 30 June 2016(Expressed in millions of Renminbi, unless otherwise stated)
30 June 31 DecemberNote 2016 2015
Assets Cash and deposits with the central bank 11 389,003 326,735 Deposits with banks and other financial institutions 12 168,085 86,311 Placements with banks and other financial institutions 13 120,293 132,361 Financial assets at fair value through profit or loss 14 13,249 5,637 Positive fair value of derivatives 15 1,998 1,625 Financial assets held under resale agreements 16 52,266 153,045 Interests receivable 17 20,365 18,546 Loans and advances to customers 18 1,662,048 1,475,424 Finance lease receivables 19 51,952 38,735 Available-for-sale financial assets 20 334,208 222,495 Held-to-maturity investments 21 178,245 152,312 Debt securities classified as receivables 22 732,298 523,427 Fixed assets 24 13,333 12,646 Goodwill 25 1,281 1,281 Deferred tax assets 26 3,739 3,923 Other assets 27 22,549 13,207
Total assets 3,764,912 3,167,710
Liabilities and equityLiabilities Due to the central bank 64,000 14,840 Deposits from banks and other financial institutions 29 730,506 541,066 Placements from banks and other financial institutions 30 80,750 60,305 Negative fair value of derivatives 15 1,330 1,391 Financial assets sold under repurchase agreements 31 65,621 58,873 Deposits from customers 32 2,177,369 1,993,843 Accrued staff costs 33 11,756 11,217 Taxes payable 34 2,752 6,392 Interests payable 35 29,168 30,612 Debt securities issued 36 340,562 210,061 Other liabilities 37 31,170 15,063
Total liabilities 3,534,984 2,943,663
The notes on pages 65 to 155 form part of these financial statements.

61
2016 Interim
Rep
ort
30 June 31 DecemberNote 2016 2015
Equity Share capital 38 46,679 46,679 Other equity instrument 39 19,965 19,965 Capital reserve 33,365 33,365 Other comprehensive income 40 3,271 3,929 Surplus reserve 41 14,964 14,964 General reserve 41 40,289 40,271 Retained earnings 42 70,812 64,320
Total equity attributable to equity shareholders of the Bank 229,345 223,493Non-controlling interests 583 554
Total equity 229,928 224,047
Total liabilities and equity 3,764,912 3,167,710
Approved and authorised for issue by the board of directors on 26 August 2016.
Tang Shuangning Zhang Jinliang Xie RongChairman of the Board President Independent Non-executiveof Directors, Executive Director DirectorNon-executive Director
The notes on pages 65 to 155 form part of these financial statements.

CH
INA
EVER
BR
IGH
T B
ANK
62
Unaudited Condensed Consolidated Statement of Changes in Equityfor the six months ended 30 June 2016(Expressed in millions of Renminbi, unless otherwise stated)
Attributable to equity shareholders of the Bank
NoteShare
Capital
Otherequity
instrumentCapitalreserve
Othercomprehensive
incomeSurplusreserve
Generalreserve
Retainedearnings Sub-total
Non–controlling
interests Total
Balance at 1 January 2016 46,679 19,965 33,365 3,929 14,964 40,271 64,320 223,493 554 224,047Changes in equity for the period: – Net income – – – – – – 16,439 16,439 29 16,468 – Other comprehensive income – – – (658) – – – (658) – (658)Appropriation of profit: 42 – Appropriation to general reserve – – – – – 18 (18) – – – – Dividends to common shareholders – – – – – – (8,869) (8,869) – (8,869) – Dividends to preference shareholders – – – – – – (1,060) (1,060) – (1,060)
Balance at 30 June 2016 46,679 19,965 33,365 3,271 14,964 40,289 70,812 229,345 583 229,928
Balance at 1 January 2015 46,679 – 33,365 222 12,050 33,903 52,756 178,975 508 179,483Changes in equity for the period: – Net income – – – – – – 16,241 16,241 26 16,267 – Other comprehensive income – – – 1,426 – – – 1,426 – 1,426Changes in share capital: – Capital injection by preference shareholders – 19,965 – – – – – 19,965 – 19,965Appropriation of profit: – Dividends to common shareholders – – – – – – (8,682) (8,682) (3) (8,685)
Balance at 30 June 2015 46,679 19,965 33,365 1,648 12,050 33,903 60,315 207,925 531 208,456
Attributable to equity shareholders of the Bank
NoteShare
Capital
Otherequity
instrumentCapitalreserve
Othercomprehensive
incomeSurplusreserve
Generalreserve
Retainedearnings Sub-total
Non–controlling
interests Total
Balance at 1 January 2015 46,679 – 33,365 222 12,050 33,903 52,756 178,975 508 179,483Changes in equity for the period: – Net income – – – – – – 29,528 29,528 49 29,577 – Other comprehensive income – – – 3,707 – – – 3,707 – 3,707Changes in share capital: – Capital injection by preference shareholders – 19,965 – – – – – 19,965 – 19,965Appropriation of profit: 42 – Appropriation to surplus reserve – – – – 2,914 – (2,914) – – – – Appropriation to general reserve – – – – – 6,368 (6,368) – – – – Dividends to common shareholders – – – – – – (8,682) (8,682) (3) (8,685)
Balance at 31 December 2015 46,679 19,965 33,365 3,929 14,964 40,271 64,320 223,493 554 224,047
The notes on pages 65 to 155 form part of these financial statements.

63
2016 Interim
Rep
ort
Unaudited Condensed Consolidated Cash Flow Statementfor the six months ended 30 June 2016(Expressed in millions of Renminbi, unless otherwise stated)
For the six months ended 30 June
2016 2015
Cash flows from operating activitiesNet profit 16,468 16,267Adjustments for: Impairment losses on assets 9,956 8,387 Depreciation and amortisation 1,093 1,039 Unwinding of discount (417) (362) Dividends income – (4) Unrealised foreign exchange (gains)/losses (213) 6 Net losses/(gains) on disposal of investment securities 77 (5) Net gains on disposal of trading securities (87) (179) Revaluation (gains)/losses on financial instruments at fair value through profit or loss (459) 516 Interest expense on debt securities issued 4,782 2,879 Net losses on disposal of fixed assets 1 2 Income tax 5,244 5,223
36,445 33,769
Changes in operating assets Net increase in deposits with the central bank, banks and other financial institutions (37,519) (1,170) Net (increase)/decrease in placements with banks and other financial institutions (12,208) 74,507 Net increase in loans and advances to customers (195,831) (123,080) Net decrease in financial assets held under resale agreements 101,790 73,667 Net increase in other operating assets (26,691) (18,711)
(170,459) 5,213
Changes in operating liabilities Net increase in deposits from banks and other financial institutions 189,440 82,740 Net increase in placements from banks and other financial institutions 20,445 8,582 Net increase/(decrease) in financial assets sold under repurchase agreements 6,777 (20,636) Net increase/(decrease) in amount due to central bank 49,160 (19,000) Net increase in deposits from customers 183,526 109,239 Income tax paid (8,140) (5,199) Net increase in other operating liabilities 7,325 5,641
448,533 161,367
Net cash flows from operating activities 314,519 200,349
Cash flows from investing activities Proceeds from disposal and redemption of investments 323,854 84,966 Proceeds from dividends income – 4 Proceeds from disposal of fixed assets and other assets 6 4 Payments on acquisition of investments (679,009) (339,179) Payments on acquisition of fixed assets, intangible assets and other assets (1,036) (592)
Net cash flows used in investing activities (356,185) (254,797)
The notes on pages 65 to 155 form part of these financial statements.

CH
INA
EVER
BR
IGH
T B
ANK
64
Unaudited Condensed Consolidated Cash Flow Statementfor the year ended 31 December 2015(Expressed in millions of Renminbi, unless otherwise stated)
For the six months ended 30 June
Note 2016 2015
Cash flows from financing activities Net proceeds from issue of preference shares – 19,965 Net proceeds from issue of new debt securities 130,501 67,548 Interest paid on debt securities issued (6,141) (4,198) Dividends paid (1,060) (8,691)
Net cash flows from financing activities 123,300 74,624
Effect of foreign exchange rate changes on cash and cash equivalents 617 (204)
Net increase in cash and cash equivalents 46(a) 82,251 19,972Cash and cash equivalents as at 1 January 121,964 98,001
Cash and cash equivalents as at 30 June 46(b) 204,215 117,973
Interest received 66,765 67,164
Interest paid (excluding interest expense on debt securities issued) (32,318) (35,738)
The notes on pages 65 to 155 form part of these financial statements.

65
2016 Interim
Rep
ort
Notes to the Unaudited Condensed Consolidated Financial Statementsfor the Six Months Ended 30 June 2016(Expressed in millions of Renminbi, unless otherwise stated)
1 Background information
China Everbright Bank Company Limited (the “Bank”) commenced its operations in Beijing, the People’s Republic of China (“the PRC”) on 18 August 1992. The A-shares and H-shares of the Bank were listed on the Shanghai Stock Exchange in August 2010 and The Stock Exchange of Hong Kong Limited in December 2013 respectively.
The principal activities of the Bank and its subsidiaries (collectively the “Group”) are the provision of corporate and retail deposits, loans and advances, settlement, treasury business and other financial services as approved by the China Banking Regulatory Commission (the “CBRC”). The Bank mainly operates in mainland China, which, for the purpose of the report, excludes the Hong Kong Special Administration Region of the PRC (“Hong Kong”), the Macau Special Administration Region of the PRC and Taiwan.
The Bank has branches in 29 provinces, autonomous regions, municipalities in mainland China, Hong Kong and Seoul in South Korea as at 30 June 2016.
2 Basis of preparation
(1) Compliance with International Financial Reporting Standards (“IFRSs”)
The unaudited condensed consolidated interim financial information for the six months ended 30 June 2016 has been prepared in accordance with International Accounting Standard 34 Interim Financial Reporting (“IAS 34”) and should be read in conjunction with the annual financial statements for the year ended 31 December 2015.
Except as described below, the principal accounting policies adopted in the preparation of the unaudited condensed consolidated interim financial information are consistent with those used in the Group’s annual financial statements for the year ended 31 December 2015.
(2) Use of estimates and assumptions
The preparation of the consolidated interim financial statements requires management to make judgments, estimates and assumptions that affect the application of policies and reported amounts of assets and liabilities, income and expenses. Actual results in the future may differ from those reported as a result of the use of estimates and assumptions about future conditions. The nature and assumptions related to the Group’s accounting estimates are consistent with those adopted in the Group’s financial statements for the year ended 31 December 2015.

CH
INA
EVER
BR
IGH
T B
ANK
66
Notes to the Unaudited Condensed Consolidated Financial Statementsfor the Six Months Ended 30 June 2016(Expressed in millions of Renminbi, unless otherwise stated)
2 Basis of preparation (continued)
(3) Significant accounting policies
Standards, amendments and interpretations effective in 2016
On 1 January 2016, the Group adopted the following new standards, amendments and interpretations.
IAS 27 Amendments Equity Method in Separate Financial StatementsIFRS 10, IFRS 12 and IAS 28 Amendments
Investment Entities: Applying the Consolidation Exception
IAS 1 Amendments Disclosure InitiativeIFRS 11 Amendments Accounting for Acquisitions of Interests in
Joint OperationsIAS 16 and IAS 38 Amendments Clarification of Acceptable Methods of
Depreciation and AmortisationAnnual Improvements to IFRSs 2012-2014 cycle (issued in September 2014)
IAS 27 Amendments allows entities to use the equity method to account for investments in subsidiaries, joint ventures and associates in their separate financial statements.
The amendments to IFRS 10, IFRS 12 and IAS 28 address issues that have arisen in applying the investment entities exception under IFRS 10. The amendments to IFRS 10 clarify that the exception from presenting consolidated financial statements applies to a parent entity that is a subsidiary of an investment entity, when the investment entity measures all of its subsidiaries at fair value. The amendments also clarify that only a subsidiary of an investment entity that is not an investment entity itself and that provides support services to the investment entity is consolidated. All other subsidiaries of an investment entity are measured at fair value. The amendments to IAS 28 allow the investor, when applying the equity method, to retain the fair value measurement applied by the investment entity associate or joint venture to its interests in subsidiaries.
The amendments to IAS 1 include narrow-focus improvements in materiality, disaggregation and subtotals, notes structure, disclosure of accounting policies and presentation of items of other comprehensive income arising from equity accounted investments.
The amendment to IFRS 11 requires an investor to apply the principles of business combination accounting when it acquires an interest in a joint operation that constitutes a “business” (as defined in IFRS 3 Business Combinations).

67
2016 Interim
Rep
ort
2 Basis of preparation (continued)
(3) Significant accounting policies (continued)
Standards, amendments and interpretations effective in 2016 (continued)
The amendments to IAS 16 and IAS 38 clarifies that revenue reflects a pattern of economic benefits that are generated from operating a business rather than the economic benefits that are consumed through use of the asset. As a result, the ratio of revenue generated to total revenue expected to be generated cannot be used to depreciate property, plant and equipment and may only be used in very limited circumstances to amortise intangible assets.
Annual Improvements to IFRSs 2012-2014 cycle:
IFRS 5 Non-Current Assets Held for Sale and Discontinued Operations
Assets (or disposal groups) are generally disposed of either through sale or distribution to owners. The amendment clarifies that changing from one of these disposal methods to the other would not be considered a new plan of disposal, rather it is a continuation of the original plan. There is, therefore, no interruption of the application of the requirements in IFRS 5.
IFRS 7 Financial Instruments: Disclosures
The amendment clarifies that a servicing contract that includes a fee can constitute continuing involvement in a financial asset. An entity must assess the nature of the fee and the arrangement against the guidance for continuing involvement in order to assess whether the disclosures are required. In addition, the amendment clarifies that the offsetting disclosure requirements do not apply to condensed interim financial statements, unless such disclosures provide a significant update to the information reported in the most recent annual report.
Amendments to IAS 19 Employee benefits
The amendment clarifies that market depth of high quality corporate bonds is assessed based on the currency in which the obligation is denominated, rather than the country where the obligation is located. When there is no deep market for high quality corporate bonds in that currency, government bond rates must be used.
IAS 34 Interim Financial Reporting
The amendment clarifies that the required interim disclosures must be either in the interim financial statements or incorporated by cross-reference between the interim financial statements and wherever they are included within the interim financial report (e.g., in the management commentary or risk report). The other information within the interim financial report must be available to users on the same terms as the interim financial statements and at the same time.
CH
INA
EVER
BR
IGH
T B
ANK
68
Notes to the Unaudited Condensed Consolidated Financial Statementsfor the Six Months Ended 30 June 2016(Expressed in millions of Renminbi, unless otherwise stated)
2 Basis of preparation (continued)
(3) Significant accounting policies (continued)
Standards, amendments and interpretations effective in 2016 (continued)
The adoption of the above standards, amendments and interpretations does not have any significant impact on the operating results, financial position and comprehensive income of the Group.
Standards, amendments and interpretations that are not yet effective and have not been early adopted by the Group in 2016
Effective for annual periods beginning on or after
IAS 7 Amendments Statement of Cash Flow 1 January 2017IAS 12 Amendments Recognition of Deferred Tax Assets for
Unrealised Losses1 January 2017
IFRS 2 Amendments Share-based Payment 1 January 2018IFRS 9 Financial Instruments 1 January 2018IFRS 15 and Amendments Revenue from Contracts with Customers 1 January 2018IFRS 16 Leases 1 January 2019IFRS 10, IAS 28 Amendments Sale or Contribution of Assets between
an Investor and its Associate or Joint Venture
Has not yet decided (effective date has been deferred indefinitely)
The Group is considering the impact of these standards and amendments on the consolidated financial statements.

69
2016 Interim
Rep
ort
3 Net interest income
For the six months ended 30 June
Note 2016 2015
Interest income arising fromDeposits with the central bank 2,600 2,524Deposits with banks and other financial institutions 1,894 735Placements with banks and other financial institutions 2,255 1,248Loans and advances to customers 3(a)– Corporate loans and advances 23,342 26,029– Personal loans and advances 12,999 13,749– Discounted bills 2,246 1,467Finance lease receivables 892 652Financial assets held under resale agreements 2,078 6,533Investments 21,304 18,212
Sub-total 69,610 71,149
Interest expenses arising fromDue to the central bank 561 409Deposits from banks and other financial institutions 8,212 10,586Placements from banks and other financial institutions 847 586Deposits from customers– Corporate customers 13,307 15,763– Individual customers 2,068 2,657– Structured deposits from corporate customers 3,365 2,076– Structured deposits from individual customers 2,909 3,466Financial assets sold under repurchase agreements 934 622Debt securities issued 3(b) 4,782 2,879
Sub-total 36,985 39,044
Net interest income 32,625 32,105
Note:
(a) The interest income arising from impaired financial assets for the period ended 30 June 2016 amounted to RMB417 million (Six
months ended 30 June 2015: RMB362 million).
(b) Interest expense on financial liabilities with maturity over five years mainly represented the interest expense on debt securities
issued.

CH
INA
EVER
BR
IGH
T B
ANK
70
Notes to the Unaudited Condensed Consolidated Financial Statementsfor the Six Months Ended 30 June 2016(Expressed in millions of Renminbi, unless otherwise stated)
4 Net fee and commission income
For the six months ended 30 June
2016 2015
Fee and commission incomeBank card service fees 6,434 6,144Wealth management service fees 3,646 3,651Agency services fees 982 627Custody and other fiduciary business fees 912 815Underwriting and advisory fees 762 913Settlement and clearing fees 541 829Acceptance and guarantee fees 466 599Others 859 633
Sub-total 14,602 14,211
Fee and commission expenseBank card transaction fees 537 515Settlement and clearing fees 43 42Others 124 96
Sub-total 704 653
Net fee and commission income 13,898 13,558
5 Net trading gains/(losses)
For the six months ended 30 June
2016 2015
Trading financial instruments– Derivatives 425 (567)– Debt securities 131 215
Sub-total 556 (352)
Financial instruments designated at fair value through profit or loss (10) 15
Total 546 (337)

71
2016 Interim
Rep
ort
6 Net (losses)/gains arising from investment securities
For the six months ended 30 June
2016 2015
Net gains/(losses) on disposal of available-for-sale financial assets 13 (20)Net revaluation (losses)/gains reclassified from other comprehensive income on disposal (90) 3Net gains on disposal of held-to-maturity investments – 12Net gains on disposal of debt securities classified as receivables – 10
Total (77) 5
7 Operating expenses
For the six months ended 30 June
2016 2015
Staff costs– Salaries and bonuses 6,126 6,208– Pension and annuity 611 567– Housing allowances 307 281– Staff welfares 118 116– Supplementary retirement benefits – 2– Others 833 587
Sub-total 7,995 7,761
Premises and equipment expenses– Rental and property management expenses 1,225 1,152– Depreciation of fixed assets 737 717– Amortisation of other long-term assets 212 203– Amortisation of intangible assets 144 119
Sub-total 2,318 2,191
Business tax and surcharges 2,472 3,543Other general and administrative expenses 2,628 2,215
Total 15,413 15,710

CH
INA
EVER
BR
IGH
T B
ANK
72
Notes to the Unaudited Condensed Consolidated Financial Statementsfor the Six Months Ended 30 June 2016(Expressed in millions of Renminbi, unless otherwise stated)
8 Impairment losses on assets
For the six months ended 30 June
2016 2015
Loans and advances to customers 9,330 7,687Finance lease receivables 332 161Held-to-maturity investments 102 1Available-for-sale financial assets 34 –Debt securities classified as receivables – 494Others 158 44
Total 9,956 8,387
9 Income tax
(a) Income tax:
For the six months ended 30 June
Note 2016 2015
Current tax 4,620 6,402Deferred tax 26(b) 407 (1,020)Adjustments for prior year 9(b) 217 (159)
Total 5,244 5,223
(b) Reconciliations between income tax and accounting profit are as follows:
For the six months ended 30 June
2016 2015
Profit before tax 21,712 21,490
Statutory tax rate 25% 25%Income tax calculated at statutory tax rate 5,428 5,373
Non-deductible expenses– Staff costs 24 40– Impairment losses on assets 300 415– Others 42 69
366 524
Non-taxable income– Interest income from the PRC government bonds (767) (515)
Sub-total 5,027 5,382
Adjustments for prior year 217 (159)
Income tax 5,244 5,223

73
2016 Interim
Rep
ort
10 Basic and diluted earnings per ordinary share
For the six months ended 30 June
Note 2016 2015
Weighted average number of ordinary shares (in millions) 10(a) 46,679 46,679
Net profit attributable to equity shareholders of the Bank 10(b) 15,379 16,241Basic and diluted earnings per ordinary share attributable to equity shareholders of the Bank (in RMB) 0.33 0.35
There is no difference between basic and diluted earnings per ordinary share as there was no potentially dilutive shares outstanding during the period.
Note:
(a) Weighted average number of ordinary shares (in millions)
For the six months ended 30 June
2016 2015
Number of ordinary shares as at 1 January 46,679 46,679
Newly added weighted average number of ordinary shares – –
Weighted average number of ordinary shares 46,679 46,679
(b) Net profit attributable to equity shareholders of Bank has been deducted by dividends of preference shares decleared in this
reporting period.
11 Cash and deposits with the central bank
30 June 31 DecemberNote 2016 2015
Cash on hand 6,583 6,594
Deposits with the central bank– Statutory deposit reserves 11(a) 306,045 287,484– Surplus deposit reserves 11(b) 70,641 27,553– Foreign currency risk reserves 11(c) 656 154– Fiscal deposits 5,078 4,950
Sub-total 382,420 320,141
Total 389,003 326,735

CH
INA
EVER
BR
IGH
T B
ANK
74
Notes to the Unaudited Condensed Consolidated Financial Statementsfor the Six Months Ended 30 June 2016(Expressed in millions of Renminbi, unless otherwise stated)
11 Cash and deposits with the central bank (continued)
Note:
(a) The Group places statutory deposit reserves with the People’s Bank of China (the “PBOC”) in accordance with relevant
regulations. As at the end of the reporting period, the statutory deposit reserve ratios applicable to the Bank were as follows:
30 June 31 December
2016 2015
Reserve ratio for RMB deposits 15.0% 15.0%
Reserve ratio for foreign currency deposits 5.0% 5.0%
The statutory deposit reserves are not available for the Group’s daily business.
(b) The surplus deposit reserves are maintained with the PBOC for the purpose of clearing.
(c) The Group places foreign currency risk reserves with the People’s Bank of China in accordance with relevant regulations. As
at 30 June 2016, the foreign currency risk reserve ratio was 20% (31 December 2015: 20%).
12 Deposits with banks and other financial institutions
Analysed by type and location of counterparty
30 June 31 December2016 2015
Deposits in mainland China– Banks 161,637 80,192– Other financial institutions 1,806 299
Sub-total 163,443 80,491
Deposits outside mainland China– Banks 4,673 5,850
Sub-total 4,673 5,850
Total 168,116 86,341Less: Provision for impairment losses (31) (30)
Net balances 168,085 86,311

75
2016 Interim
Rep
ort
13 Placements with banks and other financial institutions
Analysed by type and location of counterparty
30 June 31 December2016 2015
Placements in mainland China– Banks 16,258 19,536– Other financial institutions 87,960 79,529
Sub-total 104,218 99,065
Placements outside mainland China– Banks 16,079 33,297
Sub-total 16,079 33,297
Total 120,297 132,362Less: Provision for impairment losses (4) (1)
Net balances 120,293 132,361
14 Financial assets at fair value through profit or loss
30 June 31 DecemberNote 2016 2015
Debt securities held for trading 14(a) 11,768 5,474Financial assets designated at fair value through profit or loss 14(b) 1,481 163
Total 13,249 5,637

CH
INA
EVER
BR
IGH
T B
ANK
76
Notes to the Unaudited Condensed Consolidated Financial Statementsfor the Six Months Ended 30 June 2016(Expressed in millions of Renminbi, unless otherwise stated)
14 Financial assets at fair value through profit or loss (continued)
(a) Debt securities held for trading
30 June 31 DecemberNote 2016 2015
Issued by the following governments or institutions:In mainland China– Government 271 266– The PBOC – 40– Banks and other financial institutions 1,572 1,356– Other institutions (i) 9,380 3,722
Sub-total 11,223 5,384
Outside mainland China– Banks and other financial institutions 448 63– Other institutions 97 27
Total (ii) 11,768 5,474
Listed 580 102– of which listed in Hong Kong 580 49Unlisted 11,188 5,372
Total 11,768 5,474
Note:
(i) Debt securities issued by other institutions in mainland China mainly represented debt securities issued by state-owned
enterprises and joint stock enterprises in mainland China.
(ii) No investments were subject to material restrictions on realisation.
(b) Financial assets designated at fair value through profit or loss
30 June 31 December2016 2015
Precious metal 1,395 50Fixed interest rate personal mortgage loans 86 113
Total 1,481 163
For fixed interest rate personal mortgage loans, the Group used interest rate swap to manage the associated interest rate risk. The changes in fair value during the period and the accumulated changes attributable to credit risk were immaterial.
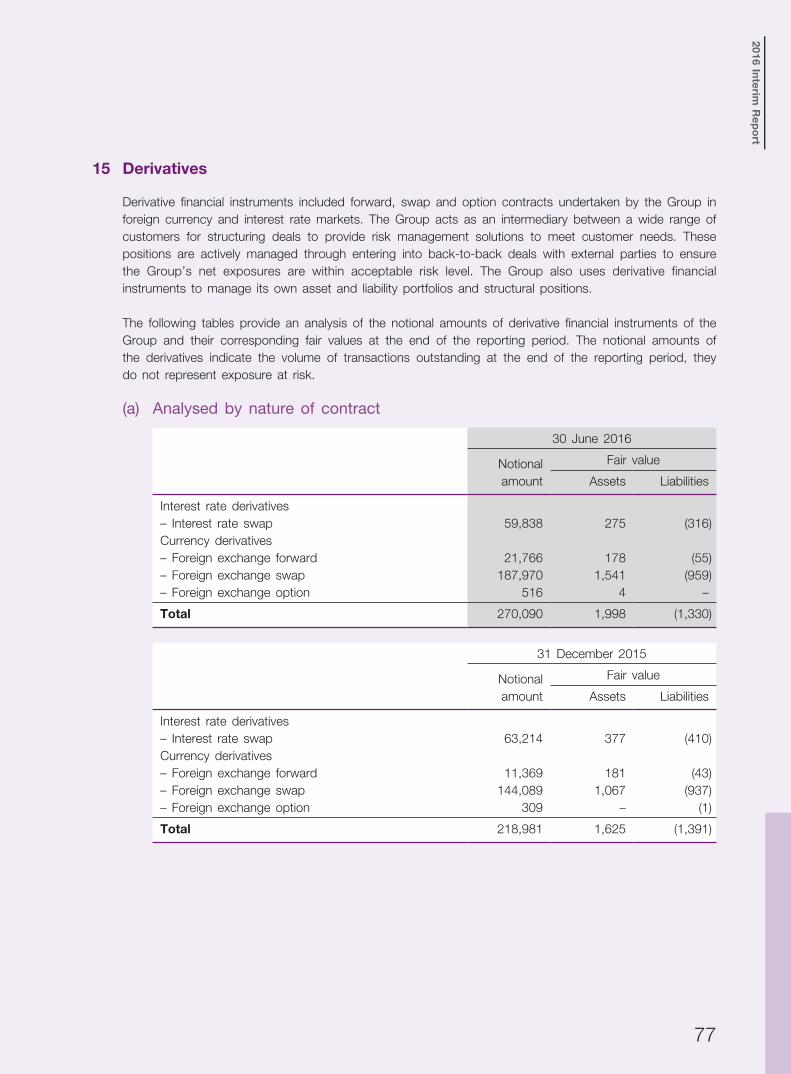
77
2016 Interim
Rep
ort
15 Derivatives
Derivative financial instruments included forward, swap and option contracts undertaken by the Group in foreign currency and interest rate markets. The Group acts as an intermediary between a wide range of customers for structuring deals to provide risk management solutions to meet customer needs. These positions are actively managed through entering into back-to-back deals with external parties to ensure the Group’s net exposures are within acceptable risk level. The Group also uses derivative financial instruments to manage its own asset and liability portfolios and structural positions.
The following tables provide an analysis of the notional amounts of derivative financial instruments of the Group and their corresponding fair values at the end of the reporting period. The notional amounts of the derivatives indicate the volume of transactions outstanding at the end of the reporting period, they do not represent exposure at risk.
(a) Analysed by nature of contract
30 June 2016
Notionalamount
Fair value
Assets Liabilities
Interest rate derivatives– Interest rate swap 59,838 275 (316)Currency derivatives– Foreign exchange forward 21,766 178 (55)– Foreign exchange swap 187,970 1,541 (959)– Foreign exchange option 516 4 –
Total 270,090 1,998 (1,330)
31 December 2015
Notionalamount
Fair value
Assets Liabilities
Interest rate derivatives– Interest rate swap 63,214 377 (410)Currency derivatives– Foreign exchange forward 11,369 181 (43)– Foreign exchange swap 144,089 1,067 (937)– Foreign exchange option 309 – (1)
Total 218,981 1,625 (1,391)

CH
INA
EVER
BR
IGH
T B
ANK
78
Notes to the Unaudited Condensed Consolidated Financial Statementsfor the Six Months Ended 30 June 2016(Expressed in millions of Renminbi, unless otherwise stated)
15 Derivatives (continued)
(b) Analysed by credit risk-weighted amounts
30 June 31 December2016 2015
Counterparty default risk-weighted assets– Interest rate derivatives 197 90– Currency derivatives 1,007 876Credit value adjustment 398 524
Total 1,602 1,490
The credit risk weighted amounts represent the counterparty credit risk associated with derivative transactions, which are calculated with reference to the guidelines issued by the CBRC in 2012.
As at 30 June 2016, the Group did not hold any derivatives used as hedge instruments in accounting treatment.
16 Financial assets held under resale agreements
(a) Analysed by type and location of counterparty
30 June 31 December2016 2015
In mainland China– Banks 13,006 124,405– Other financial institutions 39,260 28,640
Total 52,266 153,045
(b) Analysed by type of security held
30 June 31 December2016 2015
Bonds– Government bonds 6,110 11,860– Other debt securities 43,145 60,590
Sub-total 49,255 72,450
Bank acceptances 3,011 80,595
Total 52,266 153,045

79
2016 Interim
Rep
ort
17 Interests receivable
30 June 31 December2016 2015
Interests receivable from investments 14,125 12,420Interests receivable from loans and advances to customers 4,597 4,620Interests receivable from deposits and placements with banks and other financial institutions 1,254 1,263Other interests receivable 429 280
Total 20,405 18,583Less: Provision for impairment losses (40) (37)
Net balances 20,365 18,546
18 Loans and advances to customers
(a) Analysed by nature
30 June 31 December2016 2015
Corporate loans and advances 1,035,423 917,327Personal loans and advances– Personal housing mortgage loans 231,860 180,127– Personal business loans 139,332 148,706– Personal consumption loans 27,173 23,375– Credit cards 191,915 172,812
Sub-total 590,280 525,020
Discounted bills 74,669 71,196
Gross loans and advances to customers 1,700,372 1,513,543
Less: Provision for impairment losses – Individually assessed (9,454) (10,083) – Collectively assessed (28,870) (28,036)
Total provision for impairment losses (38,324) (38,119)
Net loans and advances to customers 1,662,048 1,475,424
Part of the above loans and advances to customers was pledged for repurchase agreements, see Note 28(a).

CH
INA
EVER
BR
IGH
T B
ANK
80
Notes to the Unaudited Condensed Consolidated Financial Statementsfor the Six Months Ended 30 June 2016(Expressed in millions of Renminbi, unless otherwise stated)
18 Loans and advances to customers (continued)
(b) Analysed by economic sector
30 June 2016
Loans and advances
secured byAmount Percentage collaterals
Manufacturing 247,197 14.54% 70,129Real estate 144,616 8.50% 108,564Water, environment and public utility management 130,446 7.67% 65,380Wholesale and retail trade 115,719 6.81% 43,502Transportation, storage and postal services 81,689 4.80% 32,763Leasing and commercial services 72,184 4.25% 34,679Construction 56,049 3.30% 15,826Finance 52,905 3.11% 3,282Others 134,618 7.92% 46,055
Sub-total of corporate loans and advances 1,035,423 60.90% 420,180Personal loans and advances 590,280 34.71% 372,711Discounted bills 74,669 4.39% 74,669
Gross loans and advances to customers 1,700,372 100.00% 867,560
Less: Provision for impairment losses – Individually assessed (9,454) – Collectively assessed (28,870)
Total provision for impairment losses (38,324)
Net loans and advances to customers 1,662,048

81
2016 Interim
Rep
ort
18 Loans and advances to customers (continued)
(b) Analysed by economic sector (continued)
31 December 2015
Loans andadvances
secured byAmount Percentage collaterals
Manufacturing 246,140 16.26% 64,126Real estate 143,428 9.48% 115,126Wholesale and retail trade 123,907 8.19% 49,311Transportation, storage and postal services 75,108 4.96% 30,576Water, environment and public utility management 70,864 4.68% 35,952Leasing and commercial services 54,119 3.58% 27,982Construction 50,084 3.31% 14,551Finance 28,592 1.89% 1,462Others 125,085 8.27% 40,971
Sub-total of corporate loans and advances 917,327 60.62% 380,057Personal loans and advances 525,020 34.68% 323,307Discounted bills 71,196 4.70% 61,326
Gross loans and advances to customers 1,513,543 100.00% 764,690
Less: Provision for impairment losses – Individually assessed (10,083) – Collectively assessed (28,036)
Total provision for impairment losses (38,119)
Net loans and advances to customers 1,475,424

CH
INA
EVER
BR
IGH
T B
ANK
82
Notes to the Unaudited Condensed Consolidated Financial Statementsfor the Six Months Ended 30 June 2016(Expressed in millions of Renminbi, unless otherwise stated)
18 Loans and advances to customers (continued)
(b) Analysed by economic sector (continued)
As at the end of the reporting period and during the period, detailed information of the impaired loans and advances to customers as well as the corresponding provision for impairment losses in respect of each economic sector which constitute 10% or more of gross loans and advances to customers are as follows:
30 June 2016
Individually Collectivelyassessed assessed Impairment
Impaired provision for provision for charged Written-offloans and impairment impairment during duringadvances losses losses the period the period
Manufacturing 8,569 (4,199) (6,516) 4,034 583
31 December 2015
Individually Collectivelyassessed assessed Impairment
Impaired provision for provision for charged Written-offloans and impairment impairment during duringadvances losses losses the year the year
Manufacturing 7,253 (3,516) (6,806) 6,526 988
(c) Analysed by type of collateral
30 June 31 December2016 2015
Unsecured loans 457,732 434,735Guaranteed loans 375,080 314,118Secured loans – By tangible assets other than monetary assets 654,276 585,530 – By monetary assets 213,284 179,160
Gross loans and advances to customers 1,700,372 1,513,543
Less: Provision for impairment losses – Individually assessed (9,454) (10,083) – Collectively assessed (28,870) (28,036)
Total provision for impairment losses (38,324) (38,119)
Net loans and advances to customers 1,662,048 1,475,424

83
2016 Interim
Rep
ort
18 Loans and advances to customers (continued)
(d) Overdue loans analysed by overdue period
30 June 2016
Overdue Overdue Overduewithin more than more thanthree three months one year to Overdue
months to one year three years more than(inclusive) (inclusive) (inclusive) three years Total
Unsecured loans 5,678 2,149 2,300 33 10,160Guaranteed loans 6,803 9,978 5,804 29 22,614Secured loans– By tangible assets other than monetary assets 7,526 8,592 5,515 143 21,776– By monetary assets 2,020 2,266 857 13 5,156
Total 22,027 22,985 14,476 218 59,706
As a percentage of gross loans and advances to customers 1.30% 1.35% 0.85% 0.01% 3.51%
31 December 2015
Overdue Overdue Overduewithin more than more thanthree three months one year to Overdue
months to one year three years more than(inclusive) (inclusive) (inclusive) three years Total
Unsecured loans 5,991 3,187 661 60 9,899Guaranteed loans 8,851 9,197 5,046 70 23,164Secured loans– By tangible assets other than monetary assets 10,228 9,886 5,034 292 25,440– By monetary assets 1,591 1,169 555 15 3,330
Total 26,661 23,439 11,296 437 61,833
As a percentage of gross loans and advances to customers 1.76% 1.55% 0.75% 0.03% 4.09%
Overdue loans represent loans, of which the whole or part of the principal or interest were overdue for one day or more.

CH
INA
EVER
BR
IGH
T B
ANK
84
Notes to the Unaudited Condensed Consolidated Financial Statementsfor the Six Months Ended 30 June 2016(Expressed in millions of Renminbi, unless otherwise stated)
18 Loans and advances to customers (continued)
(e) Loans and advances and provision for impairment losses
30 June 2016
(Note (i))Loans andadvancesfor whichprovision
arecollectivelyassessed
(Note (ii))Impaired loansand advances
Total
Grossimpaired
loans andadvances asa percentage
of grossloans andadvances
for whichprovision
arecollectivelyassessed
for whichprovision
areindividuallyassessed
Gross loans and advances to customers 1,674,865 6,251 19,256 1,700,372 1.50%Less: Provision for impairment losses (26,090) (2,780) (9,454) (38,324)
Net loans and advances to customers 1,648,775 3,471 9,802 1,662,048
31 December 2015
(Note (i))Loans andadvancesfor whichprovision
arecollectivelyassessed
(Note (ii))Impaired loansand advances
Total
Grossimpaired
loans andadvances asa percentage
of grossloans andadvances
for whichprovision
arecollectivelyassessed
for whichprovision
areindividuallyassessed
Gross loans and advances to customers 1,489,168 5,148 19,227 1,513,543 1.61%Less: Provision for impairment losses (25,667) (2,369) (10,083) (38,119)
Net loans and advances to customers 1,463,501 2,779 9,144 1,475,424
Note:
(i) Loans and advances for which allowance is collectively assessed consist of loans and advances which have not been
specifically identified as impaired.
(ii) Identified impaired loans and advances are loans for which objective evidence of impairment exists and which have
been identified as bearing an impairment loss and assessed either:
– Individually (including corporate loans and advances which are impaired); or
– Collectively (including personal loans which are impaired).
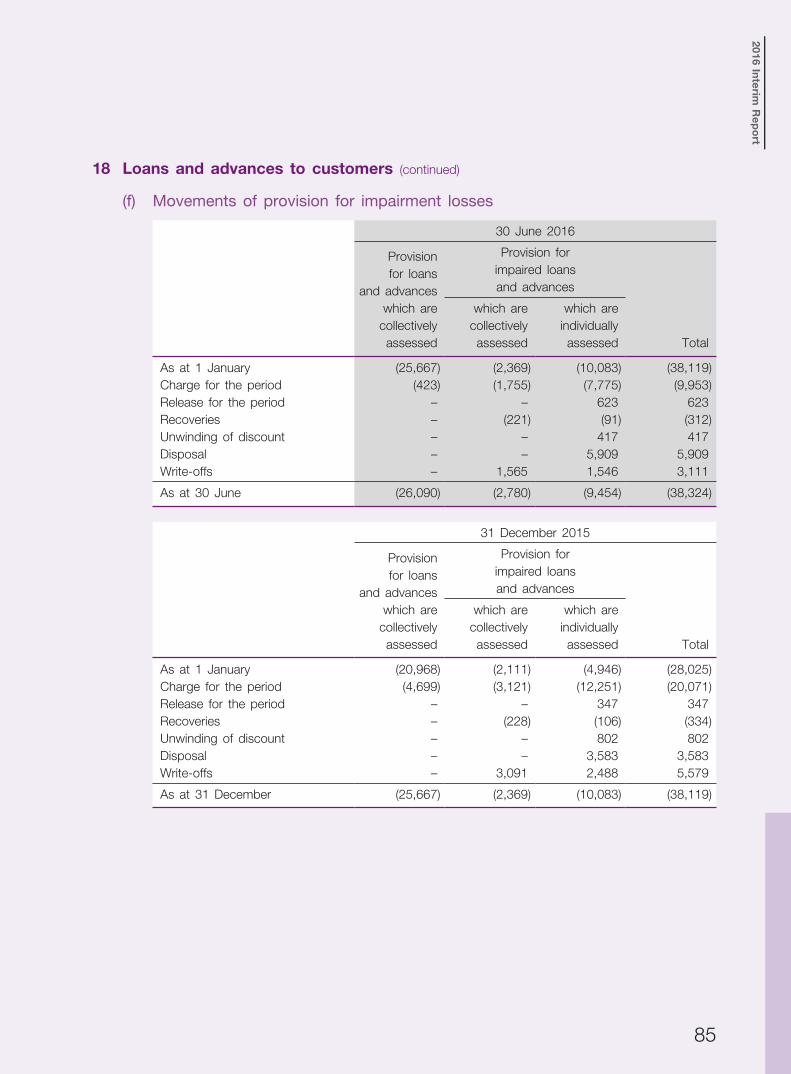
85
2016 Interim
Rep
ort
18 Loans and advances to customers (continued)
(f) Movements of provision for impairment losses
30 June 2016
Provisionfor loans
and advanceswhich are
collectivelyassessed
Provision for impaired loans and advances
Total
which arecollectivelyassessed
which areindividuallyassessed
As at 1 January (25,667) (2,369) (10,083) (38,119)Charge for the period (423) (1,755) (7,775) (9,953)Release for the period – – 623 623Recoveries – (221) (91) (312)Unwinding of discount – – 417 417Disposal – – 5,909 5,909Write-offs – 1,565 1,546 3,111
As at 30 June (26,090) (2,780) (9,454) (38,324)
31 December 2015
Provisionfor loans
and advanceswhich are
collectivelyassessed
Provision for impaired loans and advances
Total
which arecollectivelyassessed
which areindividuallyassessed
As at 1 January (20,968) (2,111) (4,946) (28,025)Charge for the period (4,699) (3,121) (12,251) (20,071)Release for the period – – 347 347Recoveries – (228) (106) (334)Unwinding of discount – – 802 802Disposal – – 3,583 3,583Write-offs – 3,091 2,488 5,579
As at 31 December (25,667) (2,369) (10,083) (38,119)

CH
INA
EVER
BR
IGH
T B
ANK
86
Notes to the Unaudited Condensed Consolidated Financial Statementsfor the Six Months Ended 30 June 2016(Expressed in millions of Renminbi, unless otherwise stated)
18 Loans and advances to customers (continued)
(g) Analysed by geographical sector
30 June 2016
Loans andadvances
secured byLoan balance Percentage collaterals
Yangtze River Delta 346,325 20.37% 189,032Bohai Rim 290,821 17.10% 145,896Central 267,463 15.73% 154,625Western 256,566 15.09% 156,880Pearl River Delta 212,510 12.50% 146,469Northeastern 104,711 6.16% 68,805Overseas 30,051 1.77% 5,853Head Office 191,925 11.28% –
Gross loans and advances to customers 1,700,372 100.00% 867,560
31 December 2015
Loans andadvances
secured byLoan balance Percentage collaterals
Yangtze River Delta 301,904 19.95% 169,533Bohai Rim 265,918 17.57% 129,959Central 230,898 15.25% 129,482Western 229,682 15.18% 142,753Pearl River Delta 191,858 12.68% 127,514Northeastern 96,047 6.35% 58,777Overseas 24,414 1.60% 6,672Head Office 172,822 11.42% –
Gross loans and advances to customers 1,513,543 100.00% 764,690

87
2016 Interim
Rep
ort
18 Loans and advances to customers (continued)
(g) Analysed by geographical sector (continued)
As at the end of the reporting period, detailed information of the impaired loans and advances to customers as well as the corresponding impairment provision in respect of geographic sectors which constitute 10% or more of gross loans and advances to customers are as follows:
30 June 2016
Individually Collectivelyassessed assessed
Impaired provision for provision forloans and impairment impairmentadvances losses losses
Pearl River Delta 6,187 (2,802) (4,390)Yangtze River Delta 4,874 (1,876) (5,976)Western 4,209 (1,643) (4,785)Central 3,296 (1,443) (4,026)Bohai Rim 3,073 (1,402) (5,304)
31 December 2015
Individually Collectivelyassessed assessed
Impaired provision for provision forloans and impairment impairmentadvances losses losses
Pearl River Delta 4,357 (1,872) (4,186)Yangtze River Delta 5,974 (2,947) (6,247)Western 4,914 (2,445) (4,531)Central 4,022 (1,656) (3,891)Bohai Rim 2,104 (913) (5,043)
The definitions of the regional distributions are set out in Note 48(b).
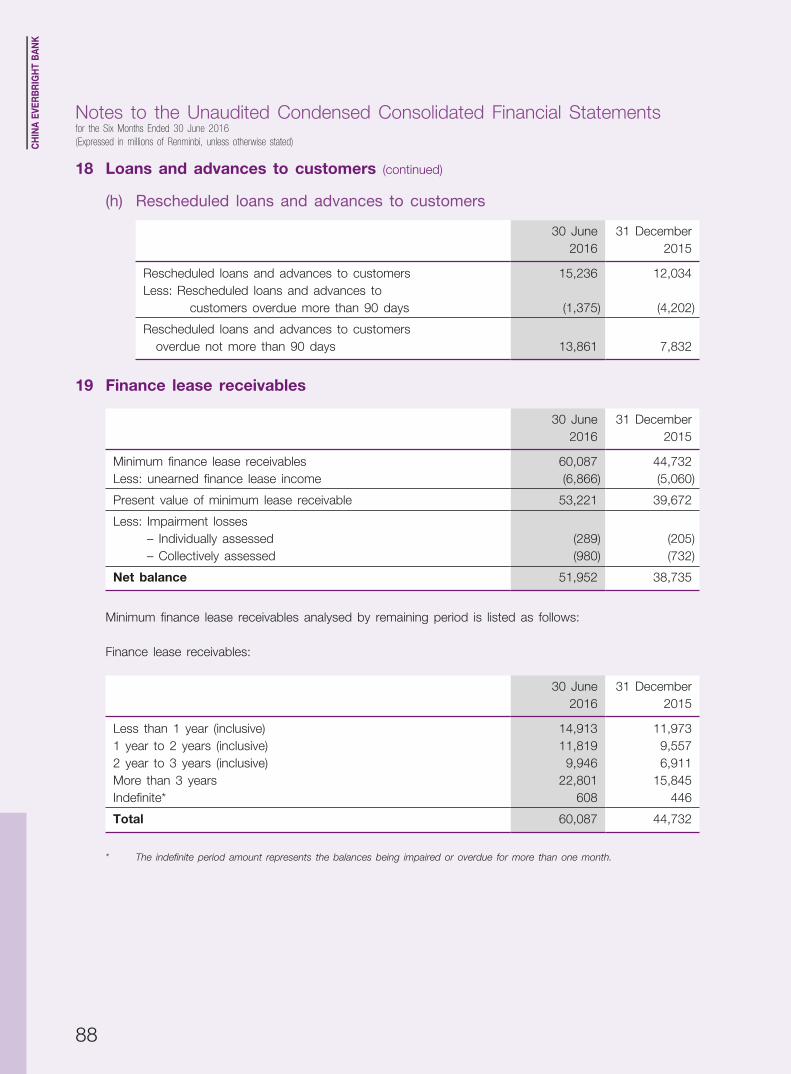
CH
INA
EVER
BR
IGH
T B
ANK
88
Notes to the Unaudited Condensed Consolidated Financial Statementsfor the Six Months Ended 30 June 2016(Expressed in millions of Renminbi, unless otherwise stated)
18 Loans and advances to customers (continued)
(h) Rescheduled loans and advances to customers
30 June 31 December2016 2015
Rescheduled loans and advances to customers 15,236 12,034Less: Rescheduled loans and advances to customers overdue more than 90 days (1,375) (4,202)
Rescheduled loans and advances to customers overdue not more than 90 days 13,861 7,832
19 Finance lease receivables
30 June 31 December2016 2015
Minimum finance lease receivables 60,087 44,732Less: unearned finance lease income (6,866) (5,060)
Present value of minimum lease receivable 53,221 39,672
Less: Impairment losses – Individually assessed (289) (205) – Collectively assessed (980) (732)
Net balance 51,952 38,735
Minimum finance lease receivables analysed by remaining period is listed as follows:
Finance lease receivables:
30 June 31 December2016 2015
Less than 1 year (inclusive) 14,913 11,9731 year to 2 years (inclusive) 11,819 9,5572 year to 3 years (inclusive) 9,946 6,911More than 3 years 22,801 15,845Indefinite* 608 446
Total 60,087 44,732
* The indefinite period amount represents the balances being impaired or overdue for more than one month.
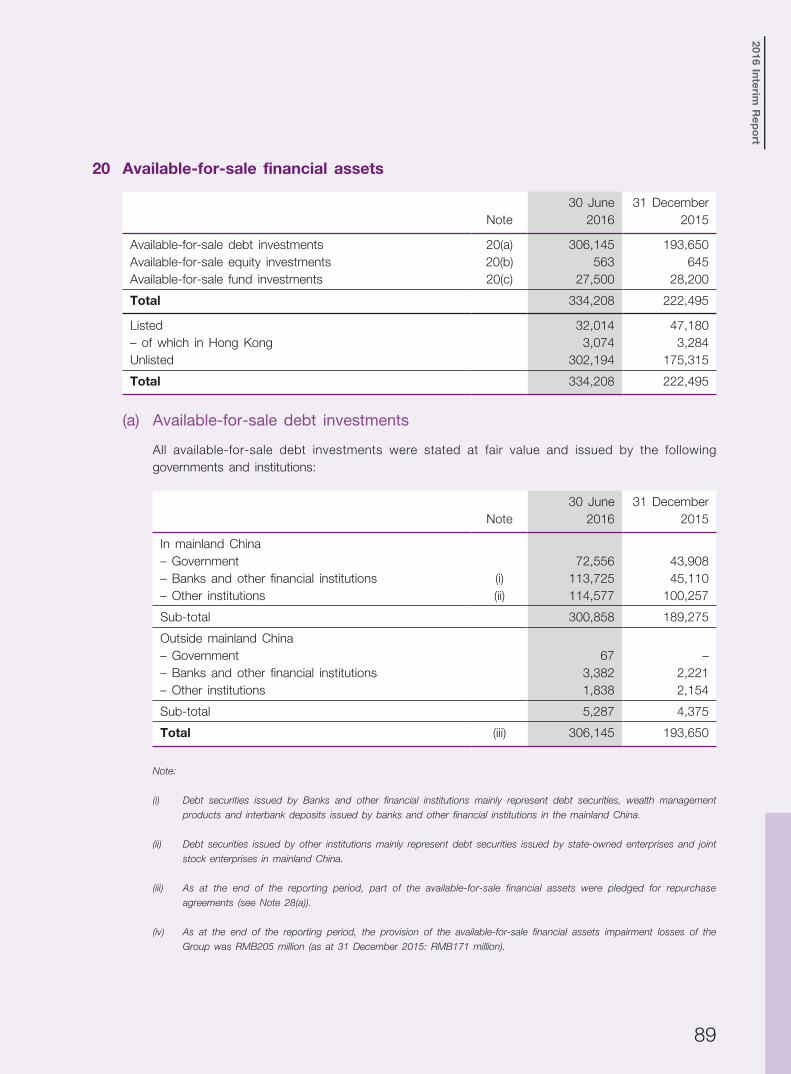
89
2016 Interim
Rep
ort
20 Available-for-sale financial assets
30 June 31 DecemberNote 2016 2015
Available-for-sale debt investments 20(a) 306,145 193,650Available-for-sale equity investments 20(b) 563 645Available-for-sale fund investments 20(c) 27,500 28,200
Total 334,208 222,495
Listed 32,014 47,180– of which in Hong Kong 3,074 3,284Unlisted 302,194 175,315
Total 334,208 222,495
(a) Available-for-sale debt investments
All available-for-sale debt investments were stated at fair value and issued by the following governments and institutions:
30 June 31 DecemberNote 2016 2015
In mainland China– Government 72,556 43,908– Banks and other financial institutions (i) 113,725 45,110– Other institutions (ii) 114,577 100,257
Sub-total 300,858 189,275
Outside mainland China– Government 67 –– Banks and other financial institutions 3,382 2,221– Other institutions 1,838 2,154
Sub-total 5,287 4,375
Total (iii) 306,145 193,650
Note:
(i) Debt securities issued by Banks and other financial institutions mainly represent debt securities, wealth management
products and interbank deposits issued by banks and other financial institutions in the mainland China.
(ii) Debt securities issued by other institutions mainly represent debt securities issued by state-owned enterprises and joint
stock enterprises in mainland China.
(iii) As at the end of the reporting period, part of the available-for-sale financial assets were pledged for repurchase
agreements (see Note 28(a)).
(iv) As at the end of the reporting period, the provision of the available-for-sale financial assets impairment losses of the
Group was RMB205 million (as at 31 December 2015: RMB171 million).

CH
INA
EVER
BR
IGH
T B
ANK
90
Notes to the Unaudited Condensed Consolidated Financial Statementsfor the Six Months Ended 30 June 2016(Expressed in millions of Renminbi, unless otherwise stated)
20 Available-for-sale financial assets (continued)
(b) Available-for-sale equity investments
30 June 31 DecemberNote 2016 2015
At costAs at 1 January 401 305Additions for the period – 132Reductions for the period – (36)
As at the end of the period 401 401Less: Provision for impairment losses (1) (1)
Sub-total (i) 400 400
At fair value 163 245
Total 563 645
Note:
(i) Available-for-sale unlisted equity investments which do not have any quoted market prices and whose fair values cannot
be measured reliably are stated at cost less any impairment losses. The Group intends to dispose those unlisted equity
investments where opportunities arise.
(c) Available-for-sale fund investments
30 June 31 December2016 2015
Measured as fair valueIn mainland China – Other financial institutions 27,500 28,200
Total 27,500 28,200
(d) Movements of allowance for impairment losses of available-for-sale financial assets during the period are as follows:
Available-for-sale debtinvestments
Available-for-sale equity
investments Total
At 1 January 2015 – 1 1
At 31 December 2015 and 1 January 2016 171 1 172Charge for the period 34 – 34
At 30 June 2016 205 1 206
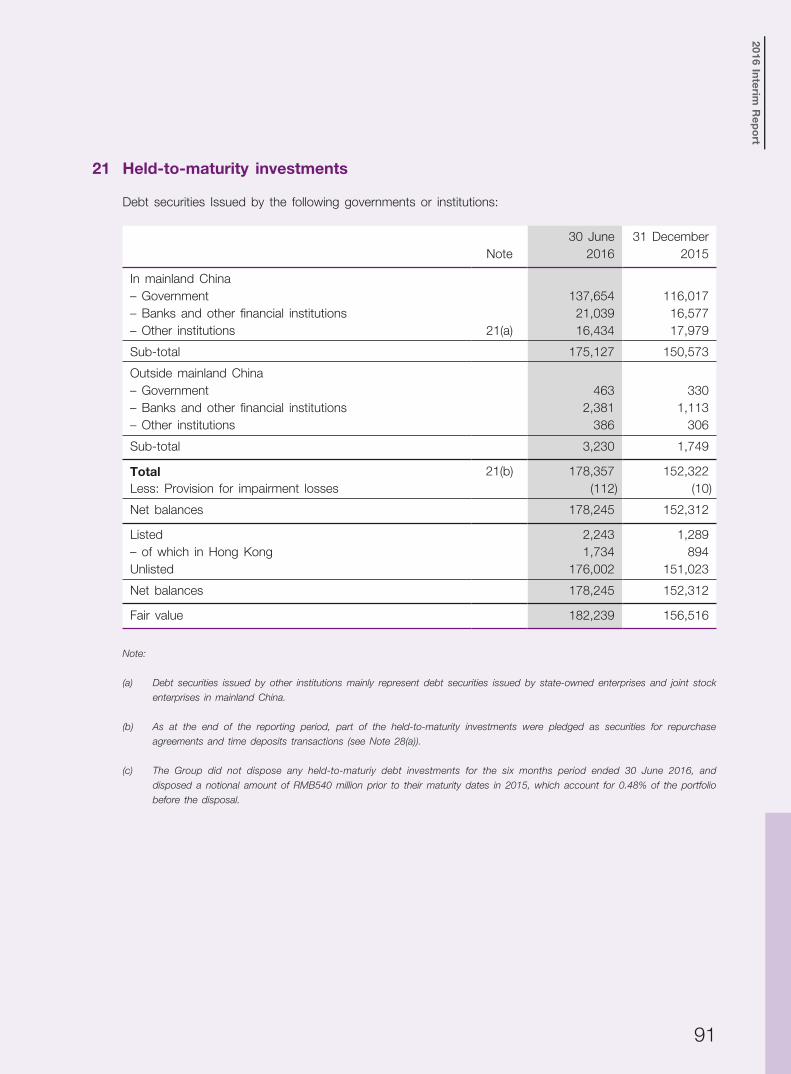
91
2016 Interim
Rep
ort
21 Held-to-maturity investments
Debt securities Issued by the following governments or institutions:
30 June 31 DecemberNote 2016 2015
In mainland China– Government 137,654 116,017– Banks and other financial institutions 21,039 16,577– Other institutions 21(a) 16,434 17,979
Sub-total 175,127 150,573
Outside mainland China– Government 463 330– Banks and other financial institutions 2,381 1,113– Other institutions 386 306
Sub-total 3,230 1,749
Total 21(b) 178,357 152,322Less: Provision for impairment losses (112) (10)
Net balances 178,245 152,312
Listed 2,243 1,289– of which in Hong Kong 1,734 894Unlisted 176,002 151,023
Net balances 178,245 152,312
Fair value 182,239 156,516
Note:
(a) Debt securities issued by other institutions mainly represent debt securities issued by state-owned enterprises and joint stock
enterprises in mainland China.
(b) As at the end of the reporting period, part of the held-to-maturity investments were pledged as securities for repurchase
agreements and time deposits transactions (see Note 28(a)).
(c) The Group did not dispose any held-to-maturiy debt investments for the six months period ended 30 June 2016, and
disposed a notional amount of RMB540 million prior to their maturity dates in 2015, which account for 0.48% of the portfolio
before the disposal.

CH
INA
EVER
BR
IGH
T B
ANK
92
Notes to the Unaudited Condensed Consolidated Financial Statementsfor the Six Months Ended 30 June 2016(Expressed in millions of Renminbi, unless otherwise stated)
22 Debt securities classified as receivables
30 June 31 DecemberNote 2016 2015
Wealth management products issued by financial institution 22(a) 211,437 136,434Beneficial interest transfer plans 22(b) 522,262 388,394
Total 733,699 524,828Less: Provision for impairment losses (1,401) (1,401)
Net balances 732,298 523,427
Note:
(a) Wealth management products issued by financial institutions are fixed-term products.
(b) Beneficial interest transfer plans are mainly beneficial interests issued by trust companies, securities companies, insurance
companies and asset management companies. As at 30 June 2016, part of investments in the beneficial interest transfer
plans held by the Bank were under forward sale contracts with other financial institutions in mainland China, the notional
amount of which was RMB1,669 million (31 December 2015: RMB14,220 million). The fair values of the above mentioned
investments approximate to their carrying amount.
23 Investments in subsidiaries
30 June 31 DecemberNote 2016 2015
Everbright Financial Leasing Co., Ltd. 23(a) 2,700 2,700CEB International Investment Co., Ltd. 23(b) 494 494Shaoshan Everbright Village Bank Co., Ltd. 23(c) 105 105Jiangsu Huai’an Everbright Village Bank Co., Ltd. 23(d) 70 70
Total 3,369 3,369
Note:
(a) Everbright Financial Leasing Co., Ltd. (“Everbright Financial Leasing”) was incorporated on 19 May 2010 in Wuhan city
of Hubei Province, with registered capital of RMB3,700 million. The principal activity of Everbright Financial Leasing is the
provision of leasing services. The Bank holds 90% of equity interests and voting rights of Everbright Financial Leasing.
(b) CEB International Investment Co., Ltd. (“CEBI”) was incorporated on 9 November 2015 in Hong Kong, with registered capital
of HKD600 million, which equals to RMB494 million approximately, according to the spot exchange rate 0.823655, on the day
of transferring the registration capital. The principal activity of CEBI is the provision of investment banking business activities.
The Bank holds 100% of equity interests and voting rights of CEBI.
(c) Shaoshan Everbright Village Bank Co., Ltd. (“Shaoshan Everbright”) was incorporated on 24 September 2009 in Shaoshan city
of Hunan Province, with registered capital of RMB150 million. The principal activities of Shaoshan Everbright are the provision
of corporate and retail banking services. The Bank holds 70% of equity interests and voting rights of Shaoshan Everbright.
(d) Jiangsu Huai’an Everbright Village Bank Co., Ltd. (“Huai’an Everbright”) was incorporated on 1 February 2013 in Huai’an city
of Jiangsu Province, with registered capital of RMB100 million. The principal activities of Huai’an Everbright are the provision
of corporate and retail banking services. The Bank holds 70% of equity interests and voting rights of Huai’an Everbright.

93
2016 Interim
Rep
ort
24 Fixed Assets
Aircraft Construction ElectronicPremises and vessels in progress equipment Others Total
(Note(i))
Cost As at 1 January 2016 11,117 – 900 5,325 3,420 20,762 Additions 31 1,225 33 111 42 1,442 Transfers out – – (3) – – (3) Disposals – – – (44) (20) (64)
As at 30 June 2016 11,148 1,225 930 5,392 3,442 22,137
Accumulated depreciation As at 1 January 2016 (2,630) – – (3,376) (1,951) (7,957) Charge for the period (192) (25) – (341) (179) (737) Disposals – – – 38 12 50
As at 30 June 2016 (2,822) (25) – (3,679) (2,118) (8,644)
Provision for impairment As at 1 January 2016 (159) – – – – (159) Charge for the period (1) – – – – (1)
As at 30 June 2016 (160) – – – – (160)
Net book value As at 30 June 2016 8,166 1,200 930 1,713 1,324 13,333
Note:
(i) As at June 30, 2016, Everbright Financial Leasing Co., Ltd., the group’s subsidiary leases certain aircrafts and aircraft engines
which were included in “Aircraft and vessels” to third parties under operating lease arrangements, with a net book value of
RMB1.20 billion. (2015: null).

CH
INA
EVER
BR
IGH
T B
ANK
94
Notes to the Unaudited Condensed Consolidated Financial Statementsfor the Six Months Ended 30 June 2016(Expressed in millions of Renminbi, unless otherwise stated)
24 Fixed Assets (continued)
Construction ElectronicPremises in progress equipment Others Total
Cost As at 1 January 2015 10,992 673 4,906 3,367 19,938 Additions 131 234 627 86 1,078 Transfers in/(out) – (7) (3) 3 (7) Disposals (6) – (205) (36) (247)
As at 31 December 2015 11,117 900 5,325 3,420 20,762
Accumulated depreciation As at 1 January 2015 (2,273) – (2,899) (1,564) (6,736) Charge for the period (357) – (678) (407) (1,442) Transfers out/(in) – – 2 (2) – Disposals – – 199 22 221
As at 31 December 2015 (2,630) – (3,376) (1,951) (7,957)
Provision for impairment As at 1 January 2015 (159) – – – (159)
As at 31 December 2015 (159) – – – (159)
Net book value As at 31 December 2015 8,328 900 1,949 1,469 12,646
As at 30 June 2016, title deeds were not yet finalised for the premises with a carrying amount of RMB159 million (31 December 2015: RMB176 million). Management of the Group expected that there would be no significant cost in obtaining the title deeds.
The net book values of premises at the end of the reporting period are analysed by the remaining terms of the leases as follows:
30 June 31 December2016 2015
Held in mainland China– Medium term leases (10 – 50 years) 8,134 8,315– Short term leases (less than 10 years) 32 13
Total 8,166 8,328

95
2016 Interim
Rep
ort
25 Goodwill
30 June 31 December2016 2015
Gross amount 6,019 6,019Less: Provision for impairment losses (4,738) (4,738)
Net balances 1,281 1,281
As approved by the PBOC, the Bank and China Development Bank (“CDB”) jointly signed an “Agreement between China Development Bank and China Everbright Bank for the transfer of assets, liabilities and banking premises of China Investment Bank” (the “Agreement”) on 18 March 1999. According to the Agreement, CDB transferred the assets, liabilities, equity and 137 outlets of 29 branches of the former China Investment Bank (“CIB”) to the Bank. The Agreement became effective on 18 March 1999. The Bank assessed the fair value of the transferred assets and liabilities, and recognised the excess of the purchase cost over the sum of the fair value of the net assets transferred and deferred tax assets as goodwill.
26 Deferred tax assets and liabilities
(a) Analysed by nature
30 June 31 December2016 2015
Deferred tax assets 3,739 3,923Deferred tax liabilities – –
Net balances 3,739 3,923

CH
INA
EVER
BR
IGH
T B
ANK
96
Notes to the Unaudited Condensed Consolidated Financial Statementsfor the Six Months Ended 30 June 2016(Expressed in millions of Renminbi, unless otherwise stated)
26 Deferred tax assets and liabilities (continued)
(b) Movements of deferred tax
Net losses/(gains)
from fairProvision for value changes Net balance
impairment Accrued of financial of deferredlosses Staff costs instruments tax assetsNote(i) Note(ii)
1 January 2016 3,288 2,043 (1,408) 3,923Recognised in profit or loss (374) 84 (117) (407)Recognised in other comprehensive income – – 223 223
30 June 2016 2,914 2,127 (1,302) 3,739
Net losses/(gains)
from fairProvision for value changes Net balance
impairment Accrued of financial of deferredlosses Staff costs instruments tax assetsNote(i) Note(ii)
1 January 2015 1,484 1,694 (144) 3,034Recognised in profit or loss 1,804 349 (10) 2,143Recognised in other comprehensive income – – (1,254) (1,254)
31 December 2015 3,288 2,043 (1,408) 3,923
Note:
(i) The Group made provision for impairment losses on loans and advances to customers and other assets. The provision
for impairment losses were determined based on the expected recoverable amount of the relevant assets at the end
of the reporting period. Besides, the amounts deductible for income tax purposes are calculated at 1% of the gross
carrying amount of qualifying assets at the end of the reporting period, together with write-offs which fulfill specific
criteria as set out in the PRC tax rules and are approved by the tax authorities.
(ii) Net losses/(gains) on fair value changes of financial instruments are subject to tax when realised.
(iii) Unrecognised deferred tax assets
As at 30 June 2016, the Group has not recognised deferred tax assets of RMB3,895 million (31 December 2015:
RMB3,673 million) for provision of impairment losses amounting to RMB15,580 million (31 December 2015: RMB14,691
million). This was mainly because it was uncertain whether the losses from write-offs of the impaired assets could be
approved by the relevant tax authorities in the foreseeable future.

97
2016 Interim
Rep
ort
27 Other assets
30 June 31 December2016 2015
Precious metal 11,679 4,779Other receivables 6,057 4,666Long-term deferred expense 1,339 1,450Intangible assets 810 834Fixed assets purchase prepayment 398 995Repossessed assets 338 329Land use rights 109 112Others 1,819 42
Total 22,549 13,207
28 Pledged assets
(a) Assets pledged as collaterals
Financial assets pledged by the Group as collaterals for liabilities include discounted bills and debt securities. They are mainly pledged for repurchase agreements and time deposits. The carrying amount of the financial assets pledged as securities as at 30 June 2016 is RMB84,845 million (31 December 2015: RMB70,574 million).
(b) Collaterals received
The Group conducts resale agreements under the usual and customary terms of placements, and holds collaterals for these transactions. As at the end of the reporting period, the Group did not hold any resale agreement that collaterals were permitted to be sold or repledged in the absence of the counterparty’s default on the agreements.
29 Deposits from banks and other financial institutions
Analysed by type and location of counterparty
30 June 31 December2016 2015
Deposits in mainland China– Banks 274,658 234,625– Other financial institutions 444,817 305,547
Sub-total 719,475 540,172
Deposits outside mainland China– Banks 11,031 894
Sub-total 11,031 894
Total 730,506 541,066

CH
INA
EVER
BR
IGH
T B
ANK
98
Notes to the Unaudited Condensed Consolidated Financial Statementsfor the Six Months Ended 30 June 2016(Expressed in millions of Renminbi, unless otherwise stated)
30 Placements from banks and other financial institutions
Analysed by type and location of counterparty
30 June 31 December2016 2015
Placements in mainland China– Banks 52,240 41,263– Other financial institutions – 500
Sub-total 52,240 41,763
Placements outside mainland China– Banks 28,510 18,542
Sub-total 28,510 18,542
Total 80,750 60,305
31 Financial assets sold under repurchase agreements
(a) Analysed by type and location of counterparty
30 June 31 December2016 2015
In mainland China– Banks 65,621 55,550– Other financial institutions – 3,323
Total 65,621 58,873
(b) Analysed by collateral
30 June 31 December2016 2015
Bank acceptances 30,913 19,770Debt securities 34,708 39,103
Total 65,621 58,873

99
2016 Interim
Rep
ort
32 Deposits from customers
30 June 31 December2016 2015
At amortised costDemand deposits– Corporate customers 616,710 480,487– Individual customers 163,716 145,026
Sub-total 780,426 625,513
Time deposits– Corporate customers 664,656 677,167– Individual customers 120,336 121,019
Sub-total 784,992 798,186
Pledged deposits– Acceptances 171,004 190,874– Letters of credit 11,332 14,327– Letters of guarantees 9,414 8,299– Others 10,083 7,365
Sub-total 201,833 220,865
Other deposits 127,364 110,665
Total deposits from customers at amortised cost 1,894,615 1,755,229
At fair valueStructured deposits– Corporate customers 193,774 166,646– Individual customers 88,980 71,968
Total deposits from customers at fair value 282,754 238,614
Total 2,177,369 1,993,843

CH
INA
EVER
BR
IGH
T B
ANK
100
Notes to the Unaudited Condensed Consolidated Financial Statementsfor the Six Months Ended 30 June 2016(Expressed in millions of Renminbi, unless otherwise stated)
33 Accrued staff costs
30 June 31 DecemberNote 2016 2015
Salary and welfare payable 11,126 10,721Pension payable 33(a) 231 97Supplementary retirement benefits payable 33(b) 399 399
Total 11,756 11,217
Note:
(a) Pension scheme
Pursuant to the relevant laws and regulations in the PRC, the Group has joined a defined contribution scheme for the
employees arranged by local government labour and social security organisations. The Group makes contributions to the
retirement scheme at the applicable rates based on the amounts stipulated by the relevant government organisations.
The Group provides an annuity plan to the eligible employees. The Group makes annuity contributions in proportion to its
employees’ gross wages in prior year, which are expensed to profit or loss when the contributions are made.
(b) Supplementary retirement benefits (“SRB”)
The Group pays SRB for eligible employees. The amount represents the present value of the total estimated amount of future
benefits that the Group is committed to pay for eligible employees at the end of the reporting period.
Except as mentioned in Note (a) and Note (b) above, the Group has no significant responsibilities to pay any other retirement benefits to retired employees.
34 Taxes payable
30 June 31 December2016 2015
Value added tax payable 1,252 41Income tax payable 1,225 4,527Business tax and surcharges payable 4 1,702Others 271 122
Total 2,752 6,392

101
2016 Interim
Rep
ort
35 Interests payable
30 June 31 December2016 2015
Deposits from customers 26,249 25,854Debt securities issued 363 1,722Others 2,556 3,036
Total 29,168 30,612
36 Debt securities issued
30 June 31 DecemberNote 2016 2015
Subordinated debts issued 36(a) 6,700 6,700Financial bonds issued 36(b) 32,800 32,800Tier-two capital bonds 36(c) 16,200 16,200Interbank deposits issued 36(d) 279,188 146,531Certificates of deposits issued 36(e) 5,674 7,830
Total 340,562 210,061
(a) Subordinated debts
30 June 31 DecemberNote 2016 2015
Subordinated fixed rate debts maturing in June 2027 (i) 6,700 6,700
Total 6,700 6,700
Note:
(i) Fixed rate subordinated debts of RMB6.7 billion with a term of fifteen years were issued on 7 June 2012. The coupon
rate is 5.25% per annum. The Group has an option to redeem the debts on 8 June 2022 at the nominal amount.
(ii) As at 30 June 2016, the fair value of the total subordinated debt securities issued approximates to RMB7,269 million (31
December 2015: RMB7,142 million).

CH
INA
EVER
BR
IGH
T B
ANK
102
Notes to the Unaudited Condensed Consolidated Financial Statementsfor the Six Months Ended 30 June 2016(Expressed in millions of Renminbi, unless otherwise stated)
36 Debt securities issued (continued)
(b) Financial bonds
30 June 31 DecemberNote 2016 2015
Financial fixed rate bonds maturing in March 2017 (i) 20,000 20,000Financial floating rate bonds maturing in March 2017 (ii) 10,000 10,000Financial fixed rate bonds maturing in June 2018 (iii) 2,800 2,800
Total 32,800 32,800
Note:
(i) Fixed rate financial bonds of RMB20 billion with a term of five years were issued on 28 March 2012. The coupon rate
is 4.20% per annum.
(ii) Floating rate financial bonds of RMB10 billion with a term of five years were issued on 28 March 2012. The bonds
bear interest at a floating rate based on the PBOC’s one-year time deposits rate plus a margin of 0.95%.
(iii) Fixed rate financial bonds of RMB3.50 billion with a term of three years were issued by Everbright Financial Leasing
Co., Ltd on 16 June 2015. The coupon rate is 4.00% per annum. AS at 30 June 2016, the Bank held RMB0.7 billion
of these bonds.
(iv) As at 30 June 2016, the fair value of the total financial bond securities issued approximates to RMB32,950 million (31
December 2015: RMB32,958 million).
(c) Tier-two capital bonds
(i) Fixed rate tier-two capital bonds of RMB16.2 billion with a term of ten years were issued on 9 June 2014. The coupon rate is 6.20% per annum. The Group has an option to redeem the debts on 10 June 2019 at the nominal amount.
(ii) As at 30 June 2016, the fair value of the total tier-two capital bonds approximates to RMB17,338 million (31 December 2015: RMB17,436 million).
(d) Interbank deposits issued
As at 30 June 2016, the interbank deposits were measured at amortised cost. The fair value of the interbank deposits issued mentioned above approximates to RMB277,187 million (31 December 2015: RMB146,688 million).
(e) Certificates of deposits issued
As at 30 June 2016, the certificates of deposits were issued by the Bank’s Hong Kong branch and measured at amortised cost. The fair value of the certificates of deposits issued approximates to their carrying amount.

103
2016 Interim
Rep
ort
37 Other liabilities
30 June 31 DecemberNote 2016 2015
Dividend payables 8,897 28Finance leases payable 3,608 3,366Payment and collection clearance accounts 2,557 1,743Deferred income 2,290 2,083Provisions 37(a) 423 446Dormant accounts 371 295Others 13,024 7,102
Total 31,170 15,063
Note:
(a) Provisions
As at 30 June 2016, the accruals for litigation losses estimated by the Group based on the status of outstanding litigation
cases and the probability of losses amounted to RMB17 million (31 December 2015: RMB17 million).
38 Share capital
The Bank’s shareholding structure as at the end of the reporting period is as follows:
30 June 31 December2016 2015
Ordinary shares listed in mainland China (A share) 39,810 39,810Ordinary shares listed in Hong Kong (H share) 6,869 6,869
Total 46,679 46,679
The H shares rank pari passu in all respects with the A shares including the right to receive dividends and distributions declared.
39 Other equity instrument
(a) Preference shares at the end of the period
Issuedate
Dividendrate
Issueprice
Number ofshares issued
millionRMB
million
Conversioncondition
2015-6-19 5.30% 100 RMB/share 200 20,000 Mandatory conversion trigger events
Less: Issuing costs (35)
Book value 19,965

CH
INA
EVER
BR
IGH
T B
ANK
104
Notes to the Unaudited Condensed Consolidated Financial Statementsfor the Six Months Ended 30 June 2016(Expressed in millions of Renminbi, unless otherwise stated)
39 Other equity instrument (continued)
(b) Main Clauses
(i) Dividend
Fixed rate for the first 5 years after issuance.
Dividend reset every 5 years thereafter to the sum of the benchmark rate and the fixed spread.
The fixed spread equals to the spread between the dividend rate at the time of issuance and the benchmark rate. The fixed spread will remain unchanged throughout the term of the preference shares.
Dividends are paid annually.
(ii) Conditions to distribution of dividends
The Group could pay dividends while the Group still has distributable after-tax profit after making up previous years’ losses, contributing to the statutory reserve and making general provisions, and the Group’s capital adequacy ratio meets regulatory requirements. The Group may elect to cancel any dividend, but such cancellation requires a shareholder’s resolution to be passed.
(iii) Dividend stopper
If the Group cancels all or part of the dividends to the preference shareholders, the Group shall not make any dividend distribution to ordinary shareholders before the Group pays the dividends for the current dividend period to the preference shareholders in full.
(iv) Order of distribution and liquidation method
The preference shareholders are subordinated to the depositors, ordinary creditors, holders of subordinated debt and holders of Tier-two capital bonds, but will be senior to the ordinary shareholders.
(v) Mandatory conversion trigger events
Upon the occurrence of an Additional Tier-one Capital Trigger Event (Core Tier-one Capital Adequacy Ratio of the Group falling to 5.125% or below), the Group shall have the right to convert all or part of the Preference Shares into A shares, in order to restore the Core Tier-one Capital Adequacy Ratio of the Group to above 5.125%; If Preference Shares were converted to A shares, it could not be converted to Preference Shares again.

105
2016 Interim
Rep
ort
39 Other equity instrument (continued)
(b) Main Clauses (continued)
(v) Mandatory conversion trigger events (continued)
Upon the occurrence of a Non-Viability Trigger Event (Earlier of the two situations: (1) CBRC has determined that the Group would become non-viable if there is no conversion or write-down of capital; or (2) the relevant authorities have determined that a public sector injection of capital or equivalent support is necessary, without which the Group would become non-viable), the Group shall have the right to convert all Preference Shares into A shares.
(vi) Redemption
Subject to the prior approval of the CBRC and the satisfaction of the relevant requirements, the Group shall have the right to redeem all or part of the Preference Shares on any redeemable day (the payment date for dividends of the Preference Shares each year) after the fifth year following the completion date of the Issuance of the Preference Shares. The specific commencement date of the redemption period shall be determined by the Board in line with market conditions, subject to authorisation at a shareholders’ general meeting (the authorisation can be further delegated). The redemption period for the Preference Shares shall commence on such commencement date of the redemption period and end on the completion date of the redemption or conversion of all the Preference Shares. Where redemption is in part, the Preference Shares shall be redeemed based on the same proportion and conditions. Preference Shares shall be redeemed in cash. The redemption price shall be the par value plus the dividend declared but unpaid for the relevant period.
(c) Changes in Preference shares outstanding
OutstandingFinancialInstruments
1 January 2016 Additions for the period 30 June 2016
Numberof shares
(million)
Carryingvalue
Numberof shares
(million)
Carryingvalue
Numberof shares
(million)
Carryingvalue
Preference Shares 200 19,965 – – 200 19,965
OutstandingFinancialInstruments
1 January 2015 Additions for the year 31 December 2015
Numberof shares
(million)
Carryingvalue
Numberof shares
(million)
Carryingvalue
Numberof shares
(million)
Carryingvalue
Preference Shares – – 200 19,965 200 19,965

CH
INA
EVER
BR
IGH
T B
ANK
106
Notes to the Unaudited Condensed Consolidated Financial Statementsfor the Six Months Ended 30 June 2016(Expressed in millions of Renminbi, unless otherwise stated)
39 Other equity instrument (continued)
(d) Interests attributable to equity instruments’ holders
Equity instrument 30 June 31 December2016 2015
1. Total equity attributable to equity shareholders of the Bank 229,345 223,493(1) Equity attributable to ordinary equity holders of the Bank 209,380 203,528(2) Equity attributable to preference shares holders of the Bank 19,965 19,965
2. Total equity attributable to non-controlling interests 583 554(1) Equity attributable to non-controlling interests of ordinary shares 583 554(2) Equity attributable to non-controlling interests of preference shares – –
40 Other comprehensive income
30 June 31 December2016 2015
Fair value changes on available-for-sale financial assets 3,313 3,982Remeasurement of defined benefit plan (61) (61)Exchange differences on translation of financial statements of overseas subsidiaries 19 8
Total 3,271 3,929
41 Surplus reserve and general reserve
(a) Surplus reserve
The surplus reserve at the end of the reporting period represented statutory surplus reserve fund. The Bank is required to appropriate 10% of its net profit, after making good prior year’s accumulated loss, to statutory surplus reserve fund until the reserve fund balance reaches 50% of its registered capital.
(b) General reserve
The Bank is required, in principle, to set aside a general reserve, through appropriation of profit after tax, with an amount of not lower than 1.5% of the ending balance of its gross risk-bearing assets.
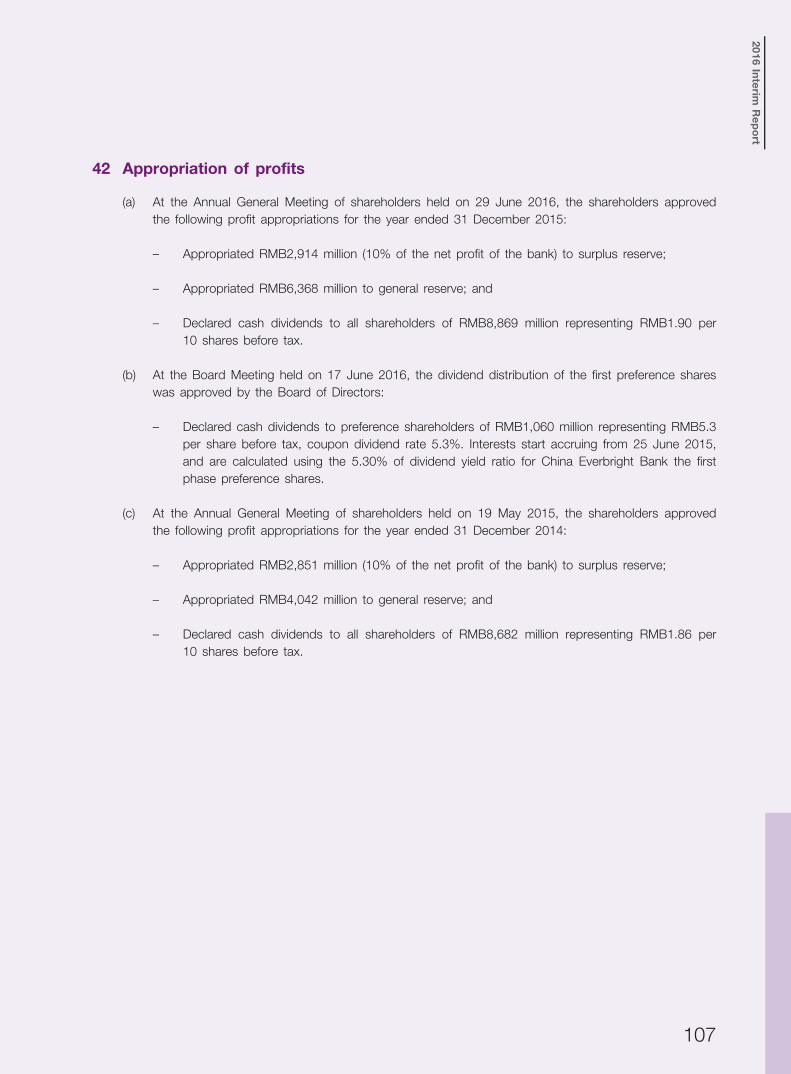
107
2016 Interim
Rep
ort
42 Appropriation of profits
(a) At the Annual General Meeting of shareholders held on 29 June 2016, the shareholders approved the following profit appropriations for the year ended 31 December 2015:
– Appropriated RMB2,914 million (10% of the net profit of the bank) to surplus reserve;
– Appropriated RMB6,368 million to general reserve; and
– Declared cash dividends to all shareholders of RMB8,869 million representing RMB1.90 per 10 shares before tax.
(b) At the Board Meeting held on 17 June 2016, the dividend distribution of the first preference shares was approved by the Board of Directors:
– Declared cash dividends to preference shareholders of RMB1,060 million representing RMB5.3 per share before tax, coupon dividend rate 5.3%. Interests start accruing from 25 June 2015, and are calculated using the 5.30% of dividend yield ratio for China Everbright Bank the first phase preference shares.
(c) At the Annual General Meeting of shareholders held on 19 May 2015, the shareholders approved the following profit appropriations for the year ended 31 December 2014:
– Appropriated RMB2,851 million (10% of the net profit of the bank) to surplus reserve;
– Appropriated RMB4,042 million to general reserve; and
– Declared cash dividends to all shareholders of RMB8,682 million representing RMB1.86 per 10 shares before tax.

CH
INA
EVER
BR
IGH
T B
ANK
108
Notes to the Unaudited Condensed Consolidated Financial Statementsfor the Six Months Ended 30 June 2016(Expressed in millions of Renminbi, unless otherwise stated)
43 Involvement with unconsolidated structured entities
(a) Structured entities sponsored by third party institutions in which the Group holds an interest:
The types of structured entities that the Group does not consolidate but in which it holds an interest include entities set up for wealth management products issued by other financial institutions and beneficial interest transfer plans (“asset management plans”), available-for-sale fund investments, wealth management products and asset-backed securities. The nature and purpose of these structured entities are to generate fees from managing assets on behalf of third party investors. These vehicles are financed through the issue of units to investors.
The following table sets out an analysis of the carrying amounts and maximum exposure of interests held by the Group in unconsolidated structured entities as at 30 June 2016:
30 June 2016 31 December 2015
Carrying Maximum Carrying Maximumamount exposure amount exposure
Debt securities classified as receivables 732,298 732,298 523,427 523,427Available-for-sale fund investments 27,500 27,500 28,200 28,200Non-principal guaranteed wealth management products 35,600 35,600 – –Asset-backed securities – – 12,385 12,385
Total 795,398 795,398 564,012 564,012
(b) Structured entities sponsored by the Group which the Group does not consolidate but holds an interest in:
The types of unconsolidated structured entities sponsored by the Group include non-principal guaranteed wealth management products. The nature and purpose of these structured entities are to generate fees from managing assets on behalf of investors. These structured entities are financed through the issue of units to investors. Interest held by the Group includes investments in units issued by these structured entities and fees charged by providing management services. As at 30 June 2016, the carrying amounts of the investments in the notes issued by these structured entities and management fee receivables being recognized are not material in the statement of financial positions.
As at 30 June 2016, the amount of assets held by the unconsolidated non-principal guaranteed wealth management products, which are sponsored by the Group, is RMB856,481 million (31 December 2015: RMB876,855 million).

109
2016 Interim
Rep
ort
43 Involvement with unconsolidated structured entities (continued)
(c) Unconsolidated structure entities sponsored by the Group during the period which the Group does not have an interest in as at 30 June 2016.
The aggregated amount of the non-principal guaranteed wealth management products sponsored and issued by the Group after 1 January 2016 but matured before 30 June 2016 amounted to RMB279,551 million (Six months ended 30 June 2015: RMB158,791 million).
(d) During the six months ended 30 June 2016, the amount of fee and commission income received from the unconsolidated structured entities by the Group amounted to RMB3,646 million (Six months ended 30 June 2015: RMB3,651 million).
44 Transferred financial assets
The Group enters into transactions in the normal course of business by which it transfers recognised financial assets to third parties or to structured entities. In some cases where these transfers may give rise to full or partial derecognition of the financial assets concerned in accordance with IFRSs. In other cases where the transferred assets do not qualify for derecognition as the Group has retained substantially all the risks and rewards of these assets, the Group continued to recognise the transferred assets.
The Group enters into credit assets transfer transactions in the normal course of business by which it transfers credit assets to structured entities which sell trust benefit interests to investors.
As the Group neither transfers nor retains substantially all the risks and rewards of ownership of the financial asset and it has retained control on them, these financial assets are recognised on the statement of financial position to the extent of the Group’s continuing involvement. The extent of the Group’s continuing involvement is the extent to which the Group is exposed to changes in the value of the transferred assets. As at 30 June 2016, loans with an original carrying amount of RMB6,393 million (31 December 2015: RMB5,204 million) had been transferred by the Group under arrangements in which the Group retains a continuing involvement in such assets in the form of subordinated tranches. As at 30 June 2016, the carrying amount of assets that the Group continues to recognise amounts to RMB2,902 million (31 December 2015: RMB2,682 million).
CH
INA
EVER
BR
IGH
T B
ANK
110
Notes to the Unaudited Condensed Consolidated Financial Statementsfor the Six Months Ended 30 June 2016(Expressed in millions of Renminbi, unless otherwise stated)
45 Capital management
The Group’s capital management includes capital adequacy ratio management, capital financing management and economic capital management, of which the primary focus is on capital adequacy ratio management. The Group calculates the capital adequacy ratio in accordance with guidelines issued by the CBRC. The capital of the Group is divided into core tier one capital, other core tier one capital and tier two capital.
Capital adequacy ratio management is the key in capital management. The capital adequacy ratio reflects the soundness of the Group’s operations and risk management capabilities. The main objective in capital adequacy ratio management is to set an optimal capital adequacy ratio that meets the regulatory requirements by benchmarking against the capital adequacy ratio level of leading global banks with reference to its own business environment and conditions.
The Group considers its strategic development plans, business expansion plans and risk variables when conducting scenario analysis and stress testing and executing other measures to forecast, plan and manage its capital adequacy ratio. The required information is filed with the CBRC by the Group and the Bank semi-annually and quarterly.
The Group started computing its capital adequacy ratios in accordance with “Regulation Governing Capital of Commercial Banks (provisional)” and other relevant regulations promulgated by the CBRC.
The CBRC requires commercial banks to meet the requirements of capital adequacy ratios by the end of 2018 in accordance with “Regulation Governing Capital of Commercial Banks (provisional)”. For systemically important banks, each bank is required to maintain the core tier-one capital adequacy ratio, tier-one capital adequacy ratio and capital adequacy ratio of at least 8.50%, 9.50% and 11.50%, respectively. For non-systemically important banks, the minimum ratios for core tier-one capital adequacy ratio, tier-one capital adequacy ratio and capital adequacy ratio are 7.50%, 8.50% and 10.50%, respectively. In addition, those individual banking subsidiaries or branches incorporated outside Mainland China are also directly regulated and supervised by their respective local banking supervisors. There are certain differences in the capital adequacy requirements of different countries.
The on-balance sheet risk-weighted assets are measured using different risk weights, which are determined according to the credit, market and other risks associated with each asset and counterparty, taking into account any eligible collaterals or guarantees. Similar treatment is adopted for off-balance sheet exposure, with adjustments made to reflect the more contingent nature of any potential losses. The counterparty credit risk-weighted assets for over-the-counter (OTC) derivatives are the summation of default risk-weighted assets and credit value adjustment (CVA). Market risk-weighted assets are calculated using the standardised approach. Operational risk-weighted assets are calculated using basic indicator approach.

111
2016 Interim
Rep
ort
45 Capital management (continued)
The capital adequacy ratios and related components of the Group illustrated below are computed based on the Group’s statutory financial statements prepared in accordance with PRC GAAP. During the period, the Group has complied in full with all its externally imposed capital requirements.
The Group calculates the capital adequacy ratios in accordance with “Regulation Governing Capital of Commercial Banks (provisional)” and relevant requirements promulgated by the CBRC.
30 June 31 December2016 2015
Total core tier-one capital 209,852 203,950 Share capital 46,679 46,679 Qualifying portions of capital reserve and other comprehensive income 36,636 37,294 Surplus reserve 14,964 14,964 General reserve 40,289 40,271 Retained earnings 70,812 64,320 Qualifying portions of non-controlling interests 472 422
Core tier-one capital deductions (2,091) (2,115) Goodwill (1,281) (1,281) Other intangible assets other than land use right (810) (834)
Net core tier-one capital 207,761 201,835
Other tier one capital 20,012 19,992 Additional tier-one capital instruments 19,965 19,965 Qualifying portions of non-controlling interests 47 27Tier-one capital net 227,773 221,827
Tier two capital 36,645 37,655 Qualifying portions of tier-two capital instruments issued and share premium 22,900 22,900 Surplus provision for loan impairment 13,659 14,680 Qualifying portions of non-controlling interests 86 75
Net capital base 264,418 259,482
Total risk weighted assets 2,432,816 2,185,516Core tier one capital adequacy ratio 8.54% 9.24%Tier one capital adequacy ratio 9.36% 10.15%Capital adequacy ratio 10.87% 11.87%

CH
INA
EVER
BR
IGH
T B
ANK
112
Notes to the Unaudited Condensed Consolidated Financial Statementsfor the Six Months Ended 30 June 2016(Expressed in millions of Renminbi, unless otherwise stated)
46 Notes to consolidated cash flow statements
(a) Net increase in cash and cash equivalents
For the six months ended 30 June
2016 2015
Cash and cash equivalents as at 30 June 204,215 117,973Less: Cash and cash equivalents as at 1 January 121,964 98,001
Net increase in cash and cash equivalents 82,251 19,972
(b) Cash and cash equivalents
30 June 30 June2016 2015
Cash on hand 6,583 6,941Deposits with the central bank 70,641 34,095Deposits with banks and other financial institutions 94,089 34,025Placements with banks and other financial institutions 32,902 42,912
Total 204,215 117,973
47 Related party relationships and transactions
(a) China Everbright Group Ltd. (“China Everbright Group”)
The transactions and balances with China Everbright Group and its affiliates are summarised in Note 47(b).
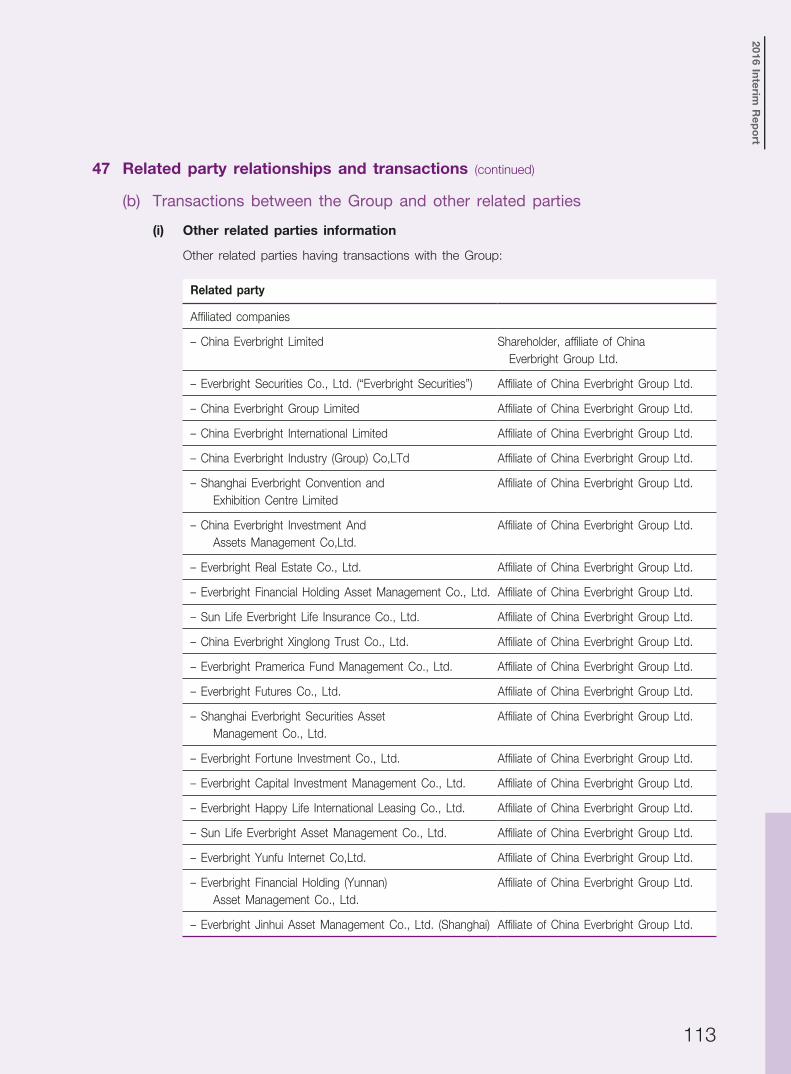
113
2016 Interim
Rep
ort
47 Related party relationships and transactions (continued)
(b) Transactions between the Group and other related parties
(i) Other related parties information
Other related parties having transactions with the Group:
Related party
Affiliated companies
– China Everbright Limited Shareholder, affiliate of China Everbright Group Ltd.
– Everbright Securities Co., Ltd. (“Everbright Securities”) Affiliate of China Everbright Group Ltd.
– China Everbright Group Limited Affiliate of China Everbright Group Ltd.
– China Everbright International Limited Affiliate of China Everbright Group Ltd.
– China Everbright Industry (Group) Co,LTd Affiliate of China Everbright Group Ltd.
– Shanghai Everbright Convention and Exhibition Centre Limited
Affiliate of China Everbright Group Ltd.
– China Everbright Investment And Assets Management Co,Ltd.
Affiliate of China Everbright Group Ltd.
– Everbright Real Estate Co., Ltd. Affiliate of China Everbright Group Ltd.
– Everbright Financial Holding Asset Management Co., Ltd. Affiliate of China Everbright Group Ltd.
– Sun Life Everbright Life Insurance Co., Ltd. Affiliate of China Everbright Group Ltd.
– China Everbright Xinglong Trust Co., Ltd. Affiliate of China Everbright Group Ltd.
– Everbright Pramerica Fund Management Co., Ltd. Affiliate of China Everbright Group Ltd.
– Everbright Futures Co., Ltd. Affiliate of China Everbright Group Ltd.
– Shanghai Everbright Securities Asset Management Co., Ltd.
Affiliate of China Everbright Group Ltd.
– Everbright Fortune Investment Co., Ltd. Affiliate of China Everbright Group Ltd.
– Everbright Capital Investment Management Co., Ltd. Affiliate of China Everbright Group Ltd.
– Everbright Happy Life International Leasing Co., Ltd. Affiliate of China Everbright Group Ltd.
– Sun Life Everbright Asset Management Co., Ltd. Affiliate of China Everbright Group Ltd.
– Everbright Yunfu Internet Co,Ltd. Affiliate of China Everbright Group Ltd.
– Everbright Financial Holding (Yunnan) Asset Management Co., Ltd.
Affiliate of China Everbright Group Ltd.
– Everbright Jinhui Asset Management Co., Ltd. (Shanghai) Affiliate of China Everbright Group Ltd.

CH
INA
EVER
BR
IGH
T B
ANK
114
Notes to the Unaudited Condensed Consolidated Financial Statementsfor the Six Months Ended 30 June 2016(Expressed in millions of Renminbi, unless otherwise stated)
47 Related party relationships and transactions (continued)
(b) Transactions between the Group and other related parties (continued)
(i) Other related parties information (continued)
Other related parties having transactions with the Group: (continued)
Related party (continued)
Affiliated companies
– Shenzhen Everbright Financial Holding Ruihua Asset Management Co., Ltd.
Affiliate of China Everbright Group Ltd.
– Wuxi Everbright Real Estate Development Co., Ltd. Affiliate of China Everbright Group Ltd.
– Everbright Urban and Rural Renewable Energy (Mianzhu) Co., Ltd.
Affiliate of China Everbright Group Ltd.
– Everbright Environmental Protection Energy (Hangzhou) Co., Ltd.
Affiliate of China Everbright Group Ltd.
– Everbright Bao De Xin Asset Management Co., Ltd. Affiliate of China Everbright Group Ltd.
– Everbright Industrial Capital Management (Shenzhen) Co., Ltd.
Affiliate of China Everbright Group Ltd.
– Everbright New Energy Low Carbon Venture Capital Jiangsu Co., Ltd.
Affiliate of China Everbright Group Ltd.
– Everbright Environmental Protection Energy (Peixian) Co., Ltd.
Affiliate of China Everbright Group Ltd.
Other related parties
– China Re Asset Management Compay,Ltd Common key management
– China Shipping (Group) Company Common key management
– Shanghai Baosight Software Co, Ltd. Common key management
– SAIC Motor Corporation, Ltd. Common key management
– Shanghai Electric Group Company Limited Common key management
– Vantone Holdings Co., Ltd Common key management
– Beijing Science and Technology Park Construction (group) Co. Ltd
Common key management
– Haitong Securities Company Limited Common key management
– China UnionPay Co., Ltd. Common key management
– Orient Securities Company Limited Common key management
– Shanghai ICY New Energy Venture Capital Co., Ltd. Common key management
– China Pacific Property Insurance Co., Ltd. Common key management
– China Pacific Life Insurance Co., Ltd. Common key management
– First-trust Fund Management Co., Ltd Common key management
– Shanghai Benemae Pharmaceutical Corporation Common key management
– Hithink Flush Information Network Co., Ltd Common key management

115
2016 Interim
Rep
ort
47 Related party relationships and transactions (continued)
(b) Transactions between the Group and other related parties (continued)
(ii) Related party transactions
The Group’s material transactions and balances with China Everbright Group and the above related parties during the reporting period are summarised as follows:
China ChinaEverbright Everbright Affiliated
Group Limited Companies Others Total(Note:47(a))
Transactions with related parties for the six months ended 30 June 2016:Interest income – – 365 82 447Interest expense (2) – (981) (365) (1,348)Balances with related parties as at 30 June 2016:Financial assets at fair value through profit or loss – – – 104 104Financial assets held under resale agreements – – 216 488 704Interests receivable – – 407 1 408Loans and advances to customers – – 4,022 – 4,022Available-for-sale financial assets – – 2,000 98 2,098Held-to-maturity investments – – – 900 900Debt securities classified as receivables – – 81,158 2,000 83,158
Total – – 87,803 3,591 91,394
Deposits from banks and other financial institutions – – 12,142 2,145 14,287Deposits from customers 998 – 11,609 13,445 26,052Interests payable 3 – 58 123 184
Total 1,001 – 23,809 15,713 40,523
Significant off-balance sheet items with related parties as at 30 June 2016:Guarantee granted (Note) 180 – – – 180

CH
INA
EVER
BR
IGH
T B
ANK
116
Notes to the Unaudited Condensed Consolidated Financial Statementsfor the Six Months Ended 30 June 2016(Expressed in millions of Renminbi, unless otherwise stated)
47 Related party relationships and transactions (continued)
(b) Transactions between the Group and other related parties (continued)
(ii) Related party transactions (continued)
The Group’s material transactions and balances with China Everbright Group and the above related parties during the reporting period are summarised as follows (continued):
China ChinaEverbright Everbright Affiliated
Group Limited Companies Others Total(Note:47(a))
Transactions with related parties for the six months ended 30 June 2015:Interest income – – 37 47 84Interest expense (13) – (729) (1,344) (2,086)Balances with related parties as at 31 December 2015:Financial assets at fair value through profit or loss – – – 105 105Financial assets held under resale agreements – – 349 624 973Interests receivable – – 47 19 66Loans and advances to customers – – 533 – 533Available-for-sale financial assets – – 998 – 998Held-to-maturity investments – – – 900 900Debt securities classified as receivables – – 80,539 2,000 82,539Other assets – – 4 65 69
Total – – 82,470 3,713 86,183
Deposits from banks and other financial institutions – – 12,318 2,964 15,282Deposits from customers 546 – 78,420 12,754 91,720Interests payable – – 995 110 1,105Other liabilities – – 4 – 4
Total 546 – 91,737 15,828 108,111
Significant off-balance sheet items with related parties as at 31 December 2015:Guarantee granted (Note) 180 – – – 180
Note: As at 30 June 2016, the Bank has guarantee obligations relating to the China Everbright Group’s outstanding
interest obligation of RMB180 million (31 December 2015: RMB180 million) due to one of the state-owned
commercial banks.

117
2016 Interim
Rep
ort
47 Related party relationships and transactions (continued)
(c) China Investment Corporation, Huijin and its affiliates
Approved by the State Council of the PRC, China Investment Corporation (“CIC”) was established on 29 September 2007 with a registered capital of USD200 billion. Central Huijin Investment Ltd. (“Huijin”) is a wholly owned subsidiary of CIC and exercises its rights and obligations as an investor on behalf of CIC.
Huijin was incorporated as a wholly state-owned investment company on 16 December 2003. It was registered in Beijing with a registered capital of RMB828,209 million. Apart from equity investments as authorised by the State Council of the PRC, it does not engage in any other commercial operations.
The Group’s transactions with CIC, Huijin and its affiliates mainly include deposit taking, purchase and sale of debt securities, money market transactions and inter-bank clearing. These transactions are priced based on market prices and conducted under normal commercial terms.
The Group has issued subordinated debts, financial bonds, interbank deposits and certificates of deposits which are bearer bonds tradable in the secondary market. Accordingly, the Group has no information in respect of the amount of the debts held by these banks and other financial institutions as at the end of the reporting period.
The Group’s material transactions and balances with CIC, Huijin and its affiliates during the reporting period are summarised as follows:
Six months ended 30 June2016 2015
Interest income 3,370 7,101Interest expense (3,037) (7,628)

CH
INA
EVER
BR
IGH
T B
ANK
118
Notes to the Unaudited Condensed Consolidated Financial Statementsfor the Six Months Ended 30 June 2016(Expressed in millions of Renminbi, unless otherwise stated)
47 Related party relationships and transactions (continued)
(c) China Investment Corporation, Huijin and its affiliates (continued)
30 June 31 December2016 2015
Deposits with banks and other financial institutions 49,151 5,049Placements with banks and other financial institutions 23,240 31,266Financial assets at fair value through profit or loss 837 380Positive fair value of derivatives 310 222Financial assets held under resale agreements 4,841 7,152Interests receivable 3,255 2,457Loans and advances to customers 858 1,631Available-for-sale financial assets 43,989 7,588Held-to-maturity investments 13,078 12,645Debt securities classified as receivables 220,724 122,095Other assets 610 –Deposits from banks and other financial institutions 207,145 135,682Placements from banks and other financial institutions 10,759 17,659Negative fair value of derivatives 223 208Financial assets sold under repurchase agreements 47,934 36,628Deposits from customers 25,231 28,637Interests payable 1,345 1,179Other liabilities 1 –
(d) Transactions with other PRC state-owned entities
The Group operates in an economic regime currently predominated by entities directly or indirectly owned by the PRC government through its government authorities, agencies, affiliations and other organisations (“state-owned entities”). Transactions with other state-owned entities include but are not limited to: lending and deposit taking; taking and placing of inter-bank balances; entrusted lending and other custody services; insurance and securities agency, and other intermediary services; sale, purchase, underwriting and redemption of bonds issued by other state-owned entities; purchase, sale and leases of property and other assets; and rendering and receiving of utilities and other services.
These transactions are conducted in the ordinary course of the Group’s banking business on terms similar to those that would have been entered into with non-state-owned entities. The Group’s pricing strategy and approval processes for major products and services, such as loans, deposits and commission income, do not depend on whether or not the customers are state-owned entities. Having considered the substance of the relationships, the Group is of the opinion that none of these transactions are material related party transactions that require separate disclosure.

119
2016 Interim
Rep
ort
47 Related party relationships and transactions (continued)
(e) Key management personnel
For the six months ended 30 June
2016 2015RMB’000 RMB’000
Remuneration 10,440 10,284
Retirement benefits 634 574
– Basic social pension insurance 336 292
(f) Loans and advances to directors, supervisors and officers
Loans and advances to directors, supervisors and officers of the Group disclosed pursuant to section 383 of the Hong Kong Companies Ordinance are as follows:
30 June 31 December2016 2015
RMB’000 RMB’000
Aggregate amount of relevant loans outstanding as at the period/year end 14,814 17,572
Maximum aggregate amount of relevant loans outstanding during the period/year 17,253 21,045

CH
INA
EVER
BR
IGH
T B
ANK
120
Notes to the Unaudited Condensed Consolidated Financial Statementsfor the Six Months Ended 30 June 2016(Expressed in millions of Renminbi, unless otherwise stated)
48 Segment reporting
The Group divides its operation by business line and geographical area into different operating segments, and manages them accordingly. In order to better reflect the Group’s future business developments and to provide more useful information to the users of the financial statements, this year, the Group has combined the interbank business and the treasury business into the ‘financial markets business’ for disclosure purposes, and split the asset management business and the custody business across the corporate banking, the retail banking and financial markets businesses. The comparative segment information for the same period last year has also been adjusted. The Group defines reporting segments based on the following operating segments:
Corporate banking
This segment represents the provision of a range of financial products and services to corporations and government agencies. These products and services include corporate loans and advances, trade financing and deposit taking activities, agency services, cash management services, financial consulting and advisory services, remittance and settlement services and guarantee services.
Retail banking
This segment represents the provision of a range of financial products and services to retail customers. These products and services include personal loans, deposit taking activities, bank card business, personal wealth management services, remittance services and securities agency services.
Financial market business
This segment covers the Group’s financial market business. The financial market business enters into inter-bank money market transactions, repurchases transactions and investments and inter-bank investments. It also trades in debt securities, derivatives and foreign currency trading for its own accounts. The financial market business segment also covers customer-driven derivatives and foreign currency trading, as well as management of the Group’s overall liquidity position, including the issuance of debts.
Others
These represent equity investments and related income.
Measurement of segment assets and liabilities and of segment income, expenses and results is based on the Group’s accounting policies.
Internal charges and transfer prices are determined with reference to market rates and have been reflected in the performance of each segment. Interest income and expense earned from third parties are referred to as “external net interest income”. Net interest income and expense arising from internal charges and transfer pricing adjustments are referred to as “internal net interest income/expense”.
Segment income, expenses, assets and liabilities include items directly attributable to a segment as well as those that can be allocated on a reasonable basis. Segment income, expenses, assets and liabilities are determined before intra-group balances and intra-group transactions are eliminated as part of the consolidation process. Segment capital expenditure is the total cost incurred to acquire property and equipment, intangible assets and other long-term assets.

121
2016 Interim
Rep
ort
48 Segment reporting (continued)
(a) Segment results, assets and liabilities
For the six months ended 30 June 2016
Corporate RetailFinancial
marketbanking banking business Others Total
Operating income External net interest income 9,029 8,571 15,025 – 32,625 Internal net interest income/(expense) 8,270 (2,506) (5,764) – –
Net interest income 17,299 6,065 9,261 – 32,625 Net fee and commission income 3,596 7,997 2,305 – 13,898 Net trading gains – – 546 – 546 Net (losses)/gains arising from investment securities – 22 (99) – (77) Foreign exchange (losses)/gains 49 (9) (211) (3) (174) Other operating income 124 36 10 93 263
Operating income 21,068 14,111 11,812 90 47,081Operating expenses (7,003) (6,891) (1,500) (19) (15,413)
Operating profit before impairment 14,065 7,220 10,312 71 31,668Impairment losses on assets (7,751) (2,064) (141) – (9,956)
Profit before tax 6,314 5,156 10,171 71 21,712
Other segment information– Depreciation and amortisation (509) (509) (75) – (1,093)
– Capital expenditure 805 202 29 – 1,036
30 June 2016
Corporate RetailFinancial
marketbanking banking business Others Total
Segment assets 1,426,325 741,168 1,591,921 478 3,759,892
Segment liabilities 1,738,515 516,055 1,271,357 160 3,526,087

CH
INA
EVER
BR
IGH
T B
ANK
122
Notes to the Unaudited Condensed Consolidated Financial Statementsfor the Six Months Ended 30 June 2016(Expressed in millions of Renminbi, unless otherwise stated)
48 Segment reporting (continued)
(a) Segment results, assets and liabilities (continued)
For the six months ended 30 June 2015
Corporate RetailFinancial
marketbanking banking business Others Total
Operating income External net interest income 9,997 8,285 13,823 – 32,105 Internal net interest income/(expense) 7,152 (2,205) (4,947) – –
Net interest income 17,149 6,080 8,876 – 32,105 Net fee and commission income 3,924 7,477 2,157 – 13,558 Net trading losses – – (337) – (337) Dividend income – – – 4 4 Net (losses)/gains arising from investment securities – 7 (2) – 5 Foreign exchange gains 109 39 12 – 160 Other operating income 25 13 5 49 92
Operating income 21,207 13,616 10,711 53 45,587Operating expenses (7,138) (6,735) (1,816) (21) (15,710)
Operating profit before impairment 14,069 6,881 8,895 32 29,877Impairment losses on assets (5,620) (2,269) (498) – (8,387)
Profit before tax 8,449 4,612 8,397 32 21,490
Other segment information– Depreciation and amortisation (470) (487) (82) – (1,039)
– Capital expenditure 268 277 47 – 592
31 December 2015
Corporate RetailFinancial
marketbanking banking business Others Total
Segment assets 1,254,760 671,926 1,207,053 28,767 3,162,506
Segment liabilities 1,601,054 464,209 878,210 162 2,943,635

123
2016 Interim
Rep
ort
48 Segment reporting (continued)
(a) Segment results, assets and liabilities (continued)
Reconciliation between segment assets, liabilities and total assets and total liabilities:
30 June 31 DecemberNote 2016 2015
Segment assets 3,759,892 3,162,506Goodwill 25 1,281 1,281Deferred tax assets 26 3,739 3,923
Total assets 3,764,912 3,167,710
Segment liabilities 3,526,087 2,943,635Dividend payables 37 8,897 28
Total liabilities 3,534,984 2,943,663
(b) Geographical information
The Group operates principally in mainland China with branches located in 29 provinces, autonomous regions and municipalities directly under the central government, with subsidiaries located in Wuhan city of Hubei Province, Shaoshan city of Hunan Province, Huai’an city of Jiangsu Province and Hong Kong.
Non-current assets include property and equipment, land use rights and intangible assets. In presenting of geographical information, non-current assets are allocated based on geographical location of the underlying assets. Operating income is allocated based on the locations of the branches which generate income. Geographical areas, as defined for management reporting purposes, are as follows:
– “Yangtze River Delta” refers to the following areas serviced by subsidiary and branches of the Bank: Huai’an Everbright, Shanghai, Nanjing, Hangzhou, Suzhou, Ningbo and Wuxi;
– “Pearl River Delta” refers to the following areas serviced by branches of the Bank: Guangzhou, Shenzhen, Fuzhou, Xiamen and Haikou;
– “Bohai Rim” refers to the following areas serviced by branches of the Bank: Beijing, Tianjin, Shijiazhuang, Jinan, Qingdao and Yantai;
– “Central” refers to the following areas serviced by subsidiaries and branches of the Bank: Everbright Financial Leasing and Shaoshan Everbright, Zhengzhou, Taiyuan, Changsha, Wuhan, Hefei and Nanchang;
– “Western” refers to the following areas serviced by branches of the Bank: Xi’an, Chengdu, Chongqing, Kunming, Nanning, Hohhot, Urumchi, Guiyang, Lanzhou and Yinchuan;
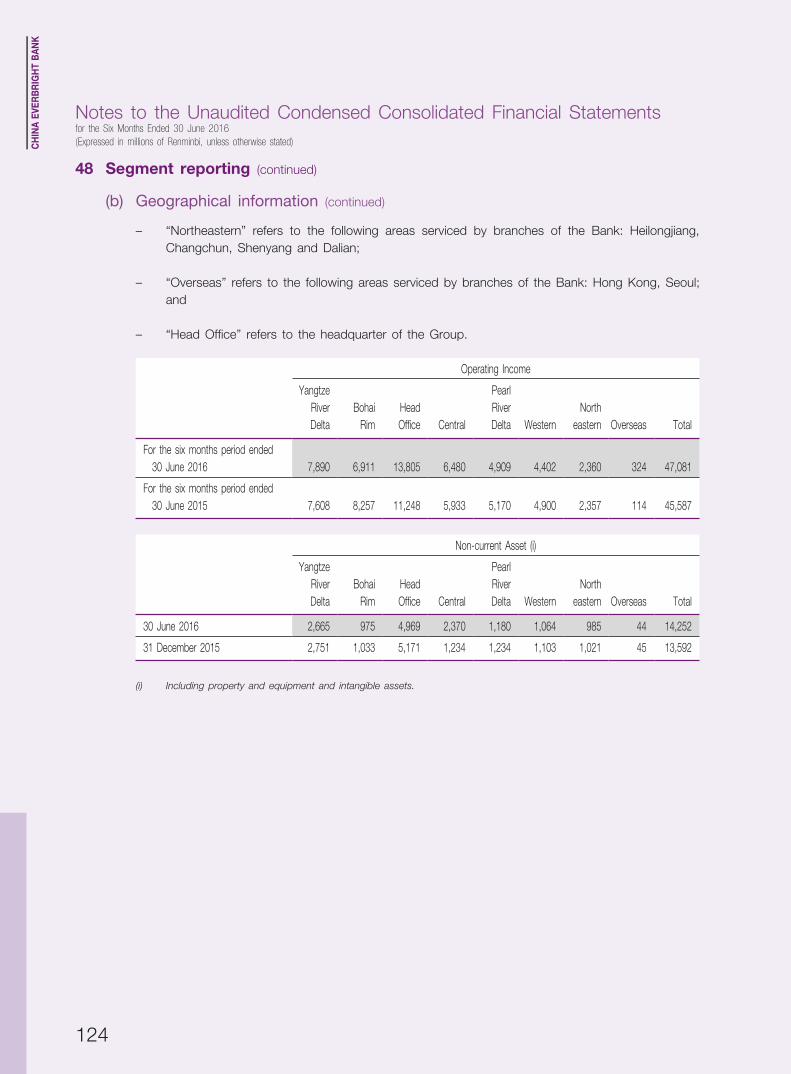
CH
INA
EVER
BR
IGH
T B
ANK
124
Notes to the Unaudited Condensed Consolidated Financial Statementsfor the Six Months Ended 30 June 2016(Expressed in millions of Renminbi, unless otherwise stated)
48 Segment reporting (continued)
(b) Geographical information (continued)
– “Northeastern” refers to the following areas serviced by branches of the Bank: Heilongjiang, Changchun, Shenyang and Dalian;
– “Overseas” refers to the following areas serviced by branches of the Bank: Hong Kong, Seoul; and
– “Head Office” refers to the headquarter of the Group.
Operating Income
YangtzeRiverDelta
BohaiRim
HeadOffice Central
PearlRiverDelta Western
Northeastern Overseas Total
For the six months period ended 30 June 2016 7,890 6,911 13,805 6,480 4,909 4,402 2,360 324 47,081
For the six months period ended 30 June 2015 7,608 8,257 11,248 5,933 5,170 4,900 2,357 114 45,587
Non-current Asset (i)
YangtzeRiverDelta
BohaiRim
HeadOffice Central
PearlRiverDelta Western
Northeastern Overseas Total
30 June 2016 2,665 975 4,969 2,370 1,180 1,064 985 44 14,252
31 December 2015 2,751 1,033 5,171 1,234 1,234 1,103 1,021 45 13,592
(i) Including property and equipment and intangible assets.

125
2016 Interim
Rep
ort
49 Risk Management
The Group has exposure to the following risks from its use of financial instruments: credit risk, market risk, liquidity risk and operational risk.
This note presents information about the Group’s exposure to each of the above risks and their sources, and the Group’s objectives, policies and procedures for measuring and managing these risks.
The Group’s risk management policies were established to identify and analyse the risks to which the Group is exposed, to set appropriate risk limits, and to design relevant internal control policies and systems for monitoring risks and adhering to risk limits. Risk management policies and relevant internal control systems are reviewed regularly to reflect changes in market conditions and the Group’s activities. The Internal Audit Department of the Group undertakes both regular and ad hoc reviews of the compliance of internal control implementation with risk management policies.
(a) Credit risk
Credit risk represents the potential loss that may arise from the failure of a debtor or counterparty to meet its contractual obligation or commitment to the Group. It arises primarily from credit and bond investment portfolios and guarantees granted.
Credit business
The board of directors is responsible for setting the Group’s risk management strategy and the overall risk tolerance level. The board also monitors the Group’s risk management process and regularly assesses the Group’s risk position and risk management strategies. The board gives advice on internal controls relating to risk management. The responsible department for credit risk management include the Risk Management Department, Credit Approval Department, Credit management department, Special Assets Resolution Department and Legal and Compliance Department, and the Group deployed Credit Officer to Retail Banking Department of Head office, the business line of medium-sized and small enterprises, credit card business, treasury business and the first tier branches. The Risk Management Department is responsible for implementing the Group’s overall risk management system. Besides risk monitoring and control, the Risk Management Department is also responsible for formulating risk management policies. To ensure the independence of credit approval, the Credit Approval Department is independent from customer relationship and product management departments. Credit management department is responsible for lending review and frequent monitoring and management of credit portfolio trends and developments. Front line departments such as the Corporate Banking Department and the Retail Banking Department carry out credit businesses according to the Group’s risk management policies and procedures.
CH
INA
EVER
BR
IGH
T B
ANK
126
Notes to the Unaudited Condensed Consolidated Financial Statementsfor the Six Months Ended 30 June 2016(Expressed in millions of Renminbi, unless otherwise stated)
49 Risk Management (continued)
(a) Credit risk (continued)
Credit business (continued)
The Group continuously improves the internal control mechanism and strengthens the management of the credit business. The Group has established comprehensive assessment and inquiry mechanisms, assigning the credit management accountability to the relevant departments and individuals.
For corporate and institutional businesses, the Group has established industry-specific limits for credit approval. It has put in place dynamic monitoring mechanism, with regular reporting of credit exposures to the board. The Group’s credit risk management covers key operational phases, including pre-lending evaluations, credit approval, and post-lending monitoring. With respect to pre-lending evaluations, the Group assesses customer credit ratings and performs integrated analysis on the risk and return of the loan. In the credit approval phase, all credit applications are approved by designated credit officers. During the post-lending monitoring, the Group continually monitors outstanding loans and other credit related businesses. Any adverse events that may significantly affect a borrower’s repayment ability are reported immediately, and actions are taken to mitigate the risks. The Group has further enhanced the parallel operating mechanism. Customer relationship managers and risk managers work independently to manage the key risk points throughout the process of credit business.
For personal credit operation business, credit assessment of applicants is used as the basis for loan approval. In the credit assessment, customer relationship managers are required to assess the income level, credit history, and repayment ability of the applicant. The customer relationship managers then forward the application and their recommendations to the loan-approval departments for further approval. The Group monitors borrowers’ repayment ability, the status of collaterals and any changes to their value during the post-lending phase. Once a loan becomes overdue, the Group starts the recovery process in accordance with its standardised loan recovery procedures.
The Group adopts a loan risk classification approach to manage its loan portfolio risk. Loans are generally classified as normal, special mention, substandard, doubtful and loss according to their levels of risk. Substandard, doubtful and loss loans are considered to be impaired loans and advances. They are classified as such when one or more events demonstrate that there is objective evidence of a loss event. The impairment loss is assessed collectively or individually as appropriate.

127
2016 Interim
Rep
ort
49 Risk Management (continued)
(a) Credit risk (continued)
Credit business (continued)
The core definitions of the five categories of loans and advances are set out below:
Norma: Borrowers can honour the terms of their loans. There is no reason to doubt their ability to repay principal and interest in full on a timely basis.
Special mention: Borrowers are currently able to service their loans and interest, although repayment may be adversely affected by specific factors.
Substandard: Borrowers’ ability to service their loans is in question and they cannot rely entirely on normal business revenues to repay principal and interest. Losses may ensue even when collateral or guarantees are invoked.
Doubtful: Borrowers cannot repay principal and interest in full and significant losses will need to be recognised even when collateral or guarantees are invoked.
Loss: Principal and interest of loans cannot be recovered or only a small portion of them can be recovered after taking all possible measures or resorting to all necessary legal procedures.
Treasury business
The Group sets credit limits for treasury operations based on the credit risk inherent in the products, counterparties and geographical areas. Credit risk exposure is closely monitored on a systematic and real-time basis, and credit limits are reviewed and revised regularly.
(i) Maximum credit risk exposure
The maximum exposure to credit risk is represented by the net carrying amount of each type of financial assets, including derivative financial instruments.

CH
INA
EVER
BR
IGH
T B
ANK
128
Notes to the Unaudited Condensed Consolidated Financial Statementsfor the Six Months Ended 30 June 2016(Expressed in millions of Renminbi, unless otherwise stated)
49 Risk Management (continued)
(a) Credit risk (continued)
Treasury business (continued)
(ii) Financial assets analysed by credit quality are summarised as follows:
30 June 2016
Deposits/ Financialplacements assets
Loans and with banks and held underadvances to Finance lease other financial resale
customers receivables institutions agreements Investments(*) Others(**)
Impaired Individually assessed gross amount 19,256 428 16 – 512 334 Provision for impairment losses (9,454) (289) (16) – (206) (94)
Sub-total 9,802 139 – – 306 240
Collectively assessed gross amount 6,251 – – – – 1,463 Provision for impairment losses (2,780) – – – – (81)
Sub-total 3,471 – – – – 1,382
Overdue but not impaired Gross amount – Less than 3 months (inclusive) 21,844 150 – – – – – Between 3 months and 6 months (inclusive) 6,817 399 – – – – – Over 6 months 7,894 – 350 – 369 –
Gross amount 36,555 549 350 – 369 – Provision for impairment losses (5,739) (62) – – (1) –
Sub-total 30,816 487 350 – 368 –
Neither overdue nor impaired Gross amount 1,638,310 52,244 288,047 52,266 1,258,838 29,020 Provision for impairment losses (20,351) (918) (19) – (1,512) (406)
Sub-total 1,617,959 51,326 288,028 52,266 1,257,326 28,614
Total 1,662,048 51,952 288,378 52,266 1,258,000 30,236

129
2016 Interim
Rep
ort
49 Risk Management (continued)
(a) Credit risk (continued)
Treasury business (continued)
(ii) Financial assets analysed by credit quality are summarised as follows (continued):
31 December 2015
Deposits/ Financialplacements assets
Loans and with banks and held underadvances to Finance lease other financial resale
customers receivables institutions agreements Investments(*) Others(**)
Impaired Individually assessed gross amount 19,227 308 16 – 313 322 Provision for impairment losses (10,083) (205) (16) – (173) (83)
Sub-total 9,144 103 – – 140 239
Collectively assessed gross amount 5,148 – – – – 976 Provision for impairment losses (2,369) – – – – (81)
Sub-total 2,779 – – – – 895
Overdue but not impaired Gross amount – Less than 3 months (inclusive) 26,342 230 – – 282 – – Between 3 months and 6 months (inclusive) 4,890 – – – – – – Over 6 months 8,155 – 350 – 1,968 –
Gross amount 39,387 230 350 – 2,250 – Provision for impairment losses (5,569) (31) – – (8) –
Sub-total 33,818 199 350 – 2,242 –
Neither overdue nor impaired Gross amount 1,449,781 39,134 218,337 153,045 902,891 24,536 Provision for impairment losses (20,098) (701) (15) – (1,402) (409)
Sub-total 1,429,683 38,433 218,322 153,045 901,489 24,127
Total 1,475,424 38,735 218,672 153,045 903,871 25,261
* Investments comprise financial assets at fair value through profit or loss, available-for-sale financial assets, held-
to-maturity investments and debt securities classified as receivables.
** Others comprise positive fair value of derivatives, interests receivable, assets from wealth management business
recorded in other assets, and other receivables.

CH
INA
EVER
BR
IGH
T B
ANK
130
Notes to the Unaudited Condensed Consolidated Financial Statementsfor the Six Months Ended 30 June 2016(Expressed in millions of Renminbi, unless otherwise stated)
49 Risk Management (continued)
(a) Credit risk (continued)
Treasury business (continued)
(iii) Credit rating
The distribution according to the credit quality of amounts due from banks and non-bank financial institutions (including deposits with banks and other financial institutions, placements with banks and other financial institutions, and financial assets held under resale agreements for which counterparties are banks and non-bank financial institutions) is as follows:
30 June 31 December2016 2015
Carrying valueIndividually assessed and impairedGross amount 16 16Provision for impairment losses (16) (16)
Sub-total – –
Overdue but not impaired– grade A to AAA 350 350
Sub-total 350 350
Neither overdue nor impaired– grade A to AAA 193,169 241,116– grade B to BBB 16,120 32,878– unrated (Note) 131,005 97,373
Sub-total 340,294 371,367
Total 340,644 371,717
Note: Mainly represent placements with other financial institutions and debt securities held under resale agreements
with other financial institutions.

131
2016 Interim
Rep
ort
49 Risk Management (continued)
(a) Credit risk (continued)
Treasury business (continued)
(iii) Credit rating (continued)
The Group adopts a credit rating approach in managing the credit risk of the debt securities portfolio. Debt securities are rated with reference to Bloomberg Composite, or the major rating agencies where the issuers of the securities are located. The carrying amounts of debt securities investments analysed by the rating agency designations as at the end of the reporting period are as follows:
30 June 31 December2016 2015
Carrying valueIndividually assessed and impairedGross amount 511 312Provision for impairment losses (205) (172)
Sub-total 306 140
Neither overdue nor impairedBloomberg Composite– grade AAA 1,059 161– grade AA- to AA+ 316 873– grade A- to A+ 3,533 1,782– grade lower than A- 1,761 1,710
Sub-total 6,669 4,526
Other agency ratings– grade AAA 196,283 75,389– grade AA- to AA+ 215,071 78,093– grade A- to A+ 9,796 155,229– grade lower than A- 4,799 1,430– unrated 27,634 36,629
Sub-total 453,583 346,770
Total 460,558 351,436

CH
INA
EVER
BR
IGH
T B
ANK
132
Notes to the Unaudited Condensed Consolidated Financial Statementsfor the Six Months Ended 30 June 2016(Expressed in millions of Renminbi, unless otherwise stated)
49 Risk Management (continued)
(b) Market risk
Market risk is the risk of loss, in respect of the Group’s activities, arising from adverse movements in market rates including interest rates, foreign exchange rates, commodity prices, stock prices and other prices.
The board of directors is ultimately responsible for monitoring the Group’s market risk to ensure that the Group has effectively identified, measured and monitored all types of market risk. The Risk Management Committee monitors the market risk management process within the scope authorised by the board of directors, which include review and approval of market risk management strategies, policies and procedures as well as the market risk tolerance level recommended by senior management. The Group is primarily exposed to market risk in its treasury business. The Financial Market Department is responsible for the Group’s investments and proprietary trading business. The Assets and Liability Management Department is responsible for monitoring and managing the interest rate risk and foreign exchange risk on a daily basis. The Market Risk Management Division in the Financial Market Department is responsible for formulating the market risk management policies and procedures, as well as identifying, measuring and monitoring the Group’s market risk.
The Group classified the transactions as the banking book transactions and trading book transactions. The identification, measurement, monitoring and controls over the relevant market risks are based on the nature and characteristics of these books. The trading book transactions consist of the Group’s investments which are acquired or incurred primarily for the purpose of selling in the near term, or for the purpose of short-term profit taking. The banking book transactions represent non-trading businesses. Sensitivity analysis, scenario analysis and foreign currency gap analysis are the main tools employed by the Group to measure and monitor the market risk in its trading book transactions. Sensitivity gap analysis, stress testing and effective duration analysis are the main tools used by the Group to measure and monitor the market risk of its non-trading businesses.
Sensitivity analysis is a technique which assesses the sensitivity of the Group’s overall risk profile and its risk profile with reference to the interest rate risks for different maturities.
Scenario analysis is a multi-factor analysis method which assesses the impact of multiple factors interacting simultaneously, taking into consideration of the probabilities of various scenarios.
Foreign currency gap analysis is a technique which estimates the impact of foreign exchange rate movements on the Group’s current profit or loss. The foreign currency gap mainly arises from the currency mismatch in the Group’s on/off-balance sheet items.

133
2016 Interim
Rep
ort
49 Risk Management (continued)
(b) Market risk (continued)
Sensitivity gap analysis is a technique which estimates the impact of interest rate movements on the Group’s current profit or loss. It is used to work out the gap between future cash inflows and outflows by categorising each of the Group’s interest-bearing assets and interest-taking liabilities into different periods based on repricing dates.
The results of stress testing are assessed against a set of forward-looking scenarios using stress moves in market variables. The results are used to estimate the impact on profit or loss.
Effective duration analysis is a technique which estimates the impact of interest rate movements by giving a weight to each period’s exposure according to its sensitivity, calculating the weighted exposure, and summarising all periods’ weighted exposures to estimate the non-linear impact of a change in interest rates on the Group’s economic value.
Interest rate risk
The Group is primarily exposed to interest rate risk arising from repricing risk in its commercial banking business and the risk of treasury position.
Repricing risk
Repricing risk, which is also known as “maturity mismatch risk”, is the most common form of interest rate risk. It is caused by the differences in timing between the maturities (related to fixed interest instruments) or repricing (related to floating interest instruments) of assets, liabilities and off-balance sheet items. The mismatch of repricing timing causes the Group’s income or its inherent economic value to vary with the movement in interest rates.
The Assets and Liability Management Department of the Group is responsible for measuring, monitoring and managing interest rate risk. The Group regularly performs assessment on the interest rate repricing gap between the assets and liabilities that are sensitive to changes in interest rates and sensitivity analysis on the net interest income as a result of changes in interest rates. The primary objective of interest rate risk management is to minimise potential adverse effects on its net interest income or its inherent economic value caused by interest rate volatility.
Trading interest rate risk
Trading interest rate risk mainly arises from the treasury’s investment portfolios. Interest rate risk is monitored using the effective duration analysis method. The Group employs other supplementary methods to measure its interest rate sensitivity, which is expressed as changes in the investment portfolios’ fair value given a 100 basis points (1%) movement in the interest rates.

CH
INA
EVER
BR
IGH
T B
ANK
134
Notes to the Unaudited Condensed Consolidated Financial Statementsfor the Six Months Ended 30 June 2016(Expressed in millions of Renminbi, unless otherwise stated)
49 Risk Management (continued)
(b) Market risk (continued)
Interest rate risk (continued)
(i) The following tables indicate the effective interest rates for the reporting period and the assets and liabilities as at the end of the reporting period by the expected next repricing dates or by maturity dates, depending on which is earlier:
30 June 2016
Non– Less than Between Between oneEffective interest three three months year and More than
interest rate Total bearing months and one year five years five years(Note (i))
AssetsCash and deposits with the central bank 1.49% 389,003 16,019 372,984 – – –Deposits with banks and other financial institutions 2.91% 168,085 – 117,411 50,674 – –Placements with banks and other financial institutions 3.15% 120,293 – 98,699 21,184 410 –Financial assets held under resale agreements 3.13% 52,266 – 50,266 2,000 – –Loans and advances to customers 4.70% 1,662,048 26,883 881,267 732,903 18,038 2,957Finance lease receivables 3.95% 51,952 – 43,461 7,919 1 571Investments (Note (i)) 4.17% 1,258,000 2,640 284,099 437,271 436,661 97,329Others – 63,265 61,171 412 590 460 632
Total assets 4.02% 3,764,912 106,713 1,848,599 1,252,541 455,570 101,489
LiabilitiesDue to the central bank 3.00% 64,000 – 17,000 47,000 – –Deposits from banks and other financial institutions 2.76% 730,506 5,954 723,850 702 – –Placements from banks and other financial institutions 2.39% 80,750 – 46,674 34,067 9 –Financial assets sold under repurchase agreements 2.21% 65,621 – 64,535 1,086 – –Deposits from customers 2.07% 2,177,369 160 1,722,591 331,099 123,519 –Debt securities issued 3.39% 340,562 – 142,599 171,200 3,863 22,900Others – 76,176 71,870 1,299 1,493 1,240 274
Total liabilities 2.34% 3,534,984 77,984 2,718,548 586,647 128,631 23,174
Asset-liability gap 1.68% 229,928 28,729 (869,949) 665,894 326,939 78,315

135
2016 Interim
Rep
ort
49 Risk Management (continued)
(b) Market risk (continued)
Interest rate risk (continued)
(i) The following tables indicate the effective interest rates for the reporting period and the assets and liabilities as at the end of the reporting period by the expected next repricing dates or by maturity dates, depending on which is earlier (continued):
31 December 2015
Non- Less than Between BetweenEffective interest three three months one year and More than
interest rate Total bearing months and one year five years five years(Note (i))
AssetsCash and deposits with the central bank 1.50% 326,735 16,083 310,652 – – –Deposits with banks and other financial institutions 3.11% 86,311 – 60,575 25,736 – –Placements with banks and other financial institutions 3.01% 132,361 – 65,982 66,379 – –Financial assets held under resale agreements 4.26% 153,045 – 88,570 64,475 – –Loans and advances to customers 5.80% 1,475,424 23,650 1,066,498 374,269 7,827 3,180Finance lease receivables 4.51% 38,735 – 38,735 – – –Investments (Note (i)) 5.02% 903,871 676 232,547 290,699 303,654 76,295Others – 51,228 49,561 1,667 – – –
Total assets 4.81% 3,167,710 89,970 1,865,226 821,558 311,481 79,475
LiabilitiesDue to the central bank 3.49% 14,840 – 8,000 6,840 – –Deposits from banks and other financial institutions 3.35% 541,066 – 538,633 2,433 – –Placements from banks and other financial institutions 2.41% 60,305 22 38,087 22,196 – –Financial assets sold under repurchase agreements 2.20% 58,873 – 56,517 2,356 – –Deposits from customers 2.54% 1,993,843 4,009 1,229,275 463,965 271,049 25,545Debt securities issued 4.25% 210,061 – 97,939 63,922 25,300 22,900Others – 64,675 61,851 1,444 1,265 115 –
Total liabilities 2.80% 2,943,663 65,882 1,969,895 562,977 296,464 48,445
Asset-liability gap 2.01% 224,047 24,088 (104,669) 258,581 15,017 31,030
Note:
– Effective interest rate represents the ratio of interest income/expense to average interest bearing assets/liabilities.
– Investments include financial assets at fair value through profit or loss, available-for-sale financial assets, held-to-
maturity investments and debt securities classified as receivables.

CH
INA
EVER
BR
IGH
T B
ANK
136
Notes to the Unaudited Condensed Consolidated Financial Statementsfor the Six Months Ended 30 June 2016(Expressed in millions of Renminbi, unless otherwise stated)
49 Risk Management (continued)
(b) Market risk (continued)
Interest rate risk (continued)
(ii) Interest rate sensitivity analysis
The Group uses sensitivity analysis to measure the impact of changes in interest rate on the Group’s net profit or loss and equity. As at 30 June 2016, assuming other variables remain unchanged, an increase in estimated interest rate of one hundred basis points will cause the Group’s net profit to decrease by RMB4,484 million (31 December 2015: RMB2,428 million), and equity to decrease by RMB3,836 million (31 December 2015: RMB5,723 million); a decrease in estimated interest rate of one hundred basis points will cause the Group’s net profit to increase by RMB4,484 million (31 December 2015: RMB2,438 million), and equity to increase by RMB3,836 million (31 December 2015: RMB5,904 million).
The sensitivity analysis above is based on a static interest rate risk profile of the Group’s assets and liabilities. This analysis measures only the impact of changes in interest rates within one year, showing how annualised net profit or loss and equity would have been affected by repricing of the Group’s assets and liabilities within the one-year period. The sensitivity analysis is based on the following assumptions:
– Interest rate movements at the end of the reporting period apply to all derivative and non-derivative financial instruments of the Group;
– At the end of the reporting period, an interest rate movement of one hundred basis points is based on the assumption of interest rates movement over the next 12 months;
– There is a parallel shift in the yield curve with the changes in interest rates;
– There are no other changes to the assets and liabilities portfolio;
– Other variables (including exchange rates) remain unchanged; and
– The analysis does not take into account the effect of risk management measures taken by the management.
Due to the adoption of the aforementioned assumptions, the actual changes in the Group’s net profit or loss and equity caused by an increase or decrease in interest rates might vary from the estimated results of this sensitivity analysis.
Foreign currency risk
The Group’s foreign currency risk mainly arises from the foreign currency portfolio within the treasury’s proprietary investments, and other foreign currency exposures. The Group manages foreign currency risk by spot and forward foreign exchange transactions, swap transactions and matching its foreign currency denominated assets with corresponding liabilities in the same currencies.

137
2016 Interim
Rep
ort
49 Risk management (continued)
(b) Market risk (continued)
Foreign currency risk (continued)
The Group’s currency exposures as at the end of the reporting period are as follows:
30 June 2016
RMB US Dollars Others Total(RMB (RMB (RMB
Equivalent) Equivalent) Equivalent)
AssetsCash and deposits with the central bank 383,592 4,615 796 389,003Deposits with banks and other financial institutions 157,115 8,149 2,821 168,085Placements with banks and other financial institutions 103,452 15,534 1,307 120,293Financial assets held under resale agreements 52,266 – – 52,266Loans and advances to customers 1,609,560 36,867 15,621 1,662,048Finance lease receivables 51,381 571 – 51,952Investments (Note (i)) 1,244,978 12,164 858 1,258,000Others 60,352 2,612 301 63,265
Total assets 3,662,696 80,512 21,704 3,764,912
LiabilitiesDue to the central bank 64,000 – – 64,000Deposits from banks and other financial institutions 729,755 718 33 730,506Placements from banks and other financial institutions 46,824 24,166 9,760 80,750Financial assets sold under repurchase agreements 65,621 – – 65,621Deposit from customers 2,092,833 62,952 21,584 2,177,369Debt securities issued 336,119 1,196 3,247 340,562Others 73,498 1,986 692 76,176
Total liabilities 3,408,650 91,018 35,316 3,534,984
Net position 254,046 (10,506) (13,612) 229,928
Off-balance sheet credit commitments 654,614 16,250 5,239 676,103
Derivative financial instruments (Note (ii)) (34,055) 18,605 16,156 706

CH
INA
EVER
BR
IGH
T B
ANK
138
Notes to the Unaudited Condensed Consolidated Financial Statementsfor the Six Months Ended 30 June 2016(Expressed in millions of Renminbi, unless otherwise stated)
49 Risk management (continued)
(b) Market risk (continued)
Foreign currency risk (continued)
The Group’s currency exposures as at the end of the reporting period are as follows (continued):
31 December 2015
RMB US Dollars Others Total(RMB (RMB (RMB
Equivalent) Equivalent) Equivalent)
AssetsCash and deposits with the central bank 321,412 4,696 627 326,735Deposits with banks and other financial institutions 77,701 4,225 4,385 86,311Placements with banks and other financial institutions 84,330 47,876 155 132,361Financial assets held under resale agreements 153,045 – – 153,045Loans and advances to customers 1,431,484 33,943 9,997 1,475,424Finance lease receivables 38,561 174 – 38,735Investments (Note (i)) 895,080 8,582 209 903,871Others 49,806 1,146 276 51,228
Total assets 3,051,419 100,642 15,649 3,167,710
LiabilitiesDue to the central bank 14,840 – – 14,840Deposits from banks and other financial institutions 537,681 3,355 30 541,066Placements from banks and other financial institutions 37,450 18,898 3,957 60,305Financial assets sold under repurchase agreements 58,873 – – 58,873Deposit from customers 1,899,128 69,478 25,237 1,993,843Debt securities issued 204,204 1,682 4,175 210,061Others 62,947 1,476 252 64,675
Total liabilities 2,815,123 94,889 33,651 2,943,663
Net position 236,296 5,753 (18,002) 224,047
Off-balance sheet credit commitments 676,069 21,856 4,807 702,732
Derivative financial instruments (Note (ii)) (32,176) 13,117 19,359 300

139
2016 Interim
Rep
ort
49 Risk management (continued)
(b) Market risk (continued)
Foreign currency risk (continued)
The Group’s currency exposures as at the end of the reporting period are as follows (continued):
Note:
(i) Investments include financial assets at fair value through profit or loss, available-for-sale financial assets, held-to-maturity
investments and debt securities classified as receivables.
(ii) Derivative financial instruments reflect the net notional amounts of derivatives.
The Group uses sensitivity analysis to measure the potential effect of changes in the Group’s exchange rates on the Group’s net profit or loss and equity. As at 30 June 2016, assuming other variables remain unchanged, an appreciation of one hundred basis points in the US dollar against the RMB would increase both the Group’s net profit and equity by RMB12 million (31 December 2015: RMB23 million); a depreciation of one hundred basis points in the US dollar against the RMB would decrease both the Group’s net profit and equity by RMB12 million (31 December 2015: RMB23 million).
The sensitivity analysis mentioned above is based on a static foreign exchange exposure profile of assets and liabilities and certain simplified assumptions:
– The foreign exchange sensitivity is the gain and loss recognised as a result of one hundred basis points fluctuation in the foreign currency exchange rates against RMB;
– The fluctuation of exchange rates by one hundred basis points is based on the assumption of exchange rates movement over the next 12 months;
– The exchange rates against RMB for the US dollars and HK dollars change in the same direction simultaneously. Due to the immaterial proportion of the Group’s total assets and liabilities denominated in currencies other than US dollars and HK dollars, other foreign currencies are converted into US dollars in the above sensitivity analysis;
– The foreign exchange exposures calculated include spot and forward foreign exchange exposures and swaps;
– Other variables (including interest rates) remain unchanged; and
– The analysis does not take into account the effect of risk management measures taken by the management.
Due to the assumptions adopted, actual changes in the Group’s net profit or loss and equity resulting from the increase or decrease in foreign exchange rates might vary from the estimated results of this sensitivity analysis.

CH
INA
EVER
BR
IGH
T B
ANK
140
Notes to the Unaudited Condensed Consolidated Financial Statementsfor the Six Months Ended 30 June 2016(Expressed in millions of Renminbi, unless otherwise stated)
49 Risk management (continued)
(c) Liquidity risk
Liquidity risk is the risk that a commercial bank is unable to obtain funds on a timely basis or obtain funds at a reasonable cost to meet repayment obligations or sustain its asset business. This risk exists even if a bank’s solvency remains strong. In accordance with liquidity policies, the Group monitors the future cash flows and maintains an appropriate level of highly liquid assets.
The Asset and Liability Management Committee (“ALMC”) is responsible for managing the Group’s overall liquidity risk. The ALMC, chaired by the President of the Bank, is responsible for the formulation of the liquidity policies in accordance with regulatory requirements and prudential principles. Such policies include:
– Maintaining liquidity at a stable and sufficient level; establishing integrated liquidity risk management system; ensuring the meeting on a timely basis of liquidity requirements and the payment of assets, liabilities, and off-balance sheet business, whether under a normal operating environment or a state of stress; balancing the effectiveness and security of funds in an efficient manner; and
– Making timely and reasonable adjustments to capital structure and scale in response to market changes and business developments; pursuing profit maximisation and cost minimisation to a modest extent while ensuring appropriate liquidity; achieving the integration of the security, liquidity, and effectiveness of the Bank’s funds.
The Assets and Liability Management Department is responsible for executing liquidity risk management policies. It is also responsible for identifying, measuring, monitoring and managing medium- and long-term working capital on a regular basis, and for formulating liquidity management strategies. The Assets and Liability Management Department is responsible for monitoring working capital on a daily basis and ensuring the liquidity of working capital meets management requirements based on the liquidity strategies outlined above. Significant disbursement or portfolio changes must be reported to the ALMC on a timely basis.
A substantial portion of the Group’s assets are funded by deposits from customers. These deposits from customers are widely diversified in terms of type and duration and represent a stable source of funds.
The Group principally uses liquidity gap analysis to measure liquidity risk. Scenario analysis and stress testing are also adopted to assess the impact of liquidity risk.

141
2016 Interim
Rep
ort
49 Risk management (continued)
(c) Liquidity risk (continued)
The following tables provide an analysis of assets and liabilities of the Group into relevant maturity groupings based on the remaining periods to repayment at the end of the reporting period:
30 June 2016
Indefinite
Repayableon
demandWithin
one month
Betweenone monthand three
months
Betweenthree
monthsand
one year
Betweenone year
andfive years
More thanfive years Total
AssetsCash and deposits with the central bank 311,779 77,224 – – – – – 389,003Deposit with banks and other financial institutions 350 26,760 46,654 43,340 50,674 307 – 168,085Placement with banks and other financial institutions – – 48,188 50,511 21,184 410 – 120,293Financial asset held under resale agreements – – 50,266 – 2,000 – – 52,266Loans and advances to customers 41,995 191,828 72,011 137,422 478,269 398,180 342,343 1,662,048Finance lease receivables 278 – 775 1,983 9,553 32,329 7,034 51,952Investments (*) 563 29,576 38,690 213,740 437,299 440,803 97,329 1,258,000Others 33,026 6,169 2,508 11,857 8,367 699 639 63,265
Total assets 387,991 331,557 259,092 458,853 1,007,346 872,728 447,345 3,764,912
LiabilitiesDue to the central bank – – 10,000 7,000 47,000 – – 64,000Deposits from banks and other financial institutions – 207,143 140,626 200,205 181,502 1,030 – 730,506Placements from banks and other financial institutions – – 21,630 25,044 34,067 9 – 80,750Financial assets sold under repurchase agreements – – 45,195 19,340 1,086 – – 65,621Deposit from customers – 1,020,689 205,766 262,603 461,899 226,412 – 2,177,369Debt securities issued – – 33,166 108,667 171,965 3,864 22,900 340,562Others – 27,007 16,492 4,687 21,656 6,144 190 76,176
Total liabilities – 1,254,839 472,875 627,546 919,175 237,459 23,090 3,534,984
Long/(Short) position 387,991 (923,282) (213,783) (168,693) 88,171 635,269 424,255 229,928
Notional amount of derivative financial instruments – – 88,693 35,275 118,351 27,533 238 270,090

CH
INA
EVER
BR
IGH
T B
ANK
142
Notes to the Unaudited Condensed Consolidated Financial Statementsfor the Six Months Ended 30 June 2016(Expressed in millions of Renminbi, unless otherwise stated)
49 Risk management (continued)
(c) Liquidity risk (continued)
The following tables provide an analysis of assets and liabilities of the Group into relevant maturity groupings based on the remaining periods to repayment at the end of the reporting period (continued):
31 December 2015
Indefinite
Repayableon
demandWithin
one month
Betweenone monthand three
months
Betweenthree
monthsand
one year
Betweenone year
andfive years
More thanfive years Total
AssetsCash and deposits with the central bank 292,588 34,147 – – – – – 326,735Deposit with banks and other financial institutions 350 14,883 31,605 12,330 26,836 307 – 86,311Placement with banks and other financial institutions – – 47,479 18,503 66,379 – – 132,361Financial asset held under resale agreements – – 78,563 10,007 64,475 – – 153,045Loans and advances to customers 32,698 178,184 61,751 136,580 466,630 350,552 249,029 1,475,424Finance lease receivables 193 – 109 2,098 7,901 22,513 5,921 38,735Investments (*) 645 30,492 48,519 142,794 291,194 313,415 76,812 903,871Others 21,036 5,045 5,210 12,117 7,438 370 12 51,228
Total assets 347,510 262,751 273,236 334,429 930,853 687,157 331,774 3,167,710
LiabilitiesDue to the central bank – – 5,000 3,000 6,840 – – 14,840Deposits from banks and other financial institutions – 160,543 111,726 212,503 55,239 1,055 – 541,066Placements from banks and other financial institutions – 22 21,436 16,651 22,196 – – 60,305Financial assets sold under repurchase agreements – 3 43,301 13,213 2,356 – – 58,873Deposit from customers – 781,263 203,041 248,980 463,965 271,049 25,545 1,993,843Debt securities issued – – 3,773 84,166 62,106 37,116 22,900 210,061Others – 17,554 21,972 4,560 11,713 8,204 672 64,675
Total liabilities – 959,385 410,249 583,073 624,415 317,424 49,117 2,943,663
Long/(Short) position 347,510 (696,634) (137,013) (248,644) 306,438 369,733 282,657 224,047
Notional amount of derivative financial instruments – – 57,795 41,842 90,496 28,668 180 218,981
* Investments include financial assets at fair value through profit or loss, available-for-sale financial assets, held-to-maturity
investments and debt securities classified as receivables.

143
2016 Interim
Rep
ort
49 Risk management (continued)
(c) Liquidity risk (continued)
The following tables provide an analysis of the contractual undiscounted cash flow of the non-derivative finance liabilities, loan commitments and credit card commitments at the end of the reporting period:
30 June 2016
Contractual Between one Between BetweenCarrying undiscounted Repayable Within month and three months one year and More thanamount cash flow demand one month three months and one year five years five years
Non-derivative financial liabilitiesDue to the central bank 64,000 65,220 – 10,111 7,064 48,045 – –Deposits from banks and other financial institutions 730,506 737,804 208,525 141,397 201,906 184,794 1,182 –Placements from banks and other financial institutions 80,750 81,026 – 21,659 25,099 34,259 9 –Financial assets sold under repurchase agreements 65,621 65,773 – 45,235 19,443 1,095 – –Deposits from customers 2,177,369 2,250,430 1,020,736 211,653 268,940 484,463 264,638 –Debt securities issued 340,562 356,708 – 33,494 109,761 176,011 9,419 28,023Other financial liabilities 45,678 45,734 27,007 13,666 790 1,915 2,173 183
Total non-derivative financial liabilities 3,504,486 3,602,695 1,256,268 477,215 633,003 930,582 277,421 28,206
Derivative financial liabilitiesDerivative financial instruments settled on net basis (38) – 1 – (18) (21) –
Derivative financial instruments settled on gross basis cash inflow 209,737 – 85,950 29,737 93,141 909 – cash outflow (209,026) – (85,613) (29,545) (92,961) (907) –
Total derivative financial liabilities 711 – 337 192 180 2 –
Loan and credit card commitment 140,103 130,360 144 373 1,317 2,758 5,151

CH
INA
EVER
BR
IGH
T B
ANK
144
Notes to the Unaudited Condensed Consolidated Financial Statementsfor the Six Months Ended 30 June 2016(Expressed in millions of Renminbi, unless otherwise stated)
49 Risk management (continued)
(c) Liquidity risk (continued)
The following tables provide an analysis of the contractual undiscounted cash flow of the non-derivative finance liabilities, loan commitments and credit card commitments at the end of the reporting period (continued):
31 December 2015
Contractual Between one Between BetweenCarrying undiscounted Repayable Within month and three months one year and More thanamount cash flow demand one month three months and one year five years five years
Non-derivative financial liabilitiesDue to the central bank 14,840 15,087 – 5,084 3,051 6,952 – –Deposits from banks and other financial institutions 541,066 547,616 160,954 113,425 215,416 56,612 1,209 –Placements from banks and other financial institutions 60,305 61,020 23 21,515 16,806 22,676 – –Financial assets sold under repurchase agreements 58,873 59,988 3 43,430 13,986 2,569 – –Deposits from customers 1,993,843 2,029,534 781,898 203,762 250,881 471,105 292,475 29,413Debt securities issued 210,061 220,484 – 3,773 85,253 63,719 44,135 23,604Other financial liabilities 32,672 32,689 13,685 17,609 – 1,278 117 –
Total non-derivative financial liabilities 2,911,660 2,966,418 956,563 408,598 585,393 624,911 337,936 53,017
Derivative financial liabilitiesDerivative financial instruments settled on net basis (25) – 2 2 (11) (18) –
Derivative financial instruments settled on gross basis cash inflow 173,381 – 67,586 37,787 67,088 920 – cash outflow (173,072) – (67,498) (37,620) (67,061) (893) –
Total derivative financial liabilities 309 – 88 167 27 27 –
Loan and credit card commitment 128,389 120,728 340 1,417 1,435 1,852 2,617
This analysis of the non-derivative financial liabilities by contractual undiscounted cash flow might diverge from actual results.

145
2016 Interim
Rep
ort
49 Risk management (continued)
(d) Operational risk
Operational risk refers to the risk of losses associated with internal processes deficiencies, personnel mistakes and information system failures, or impact from other external events.
The Group establishes a framework of operational risk management system to identify, assess, control, manage and report operational risk. The framework covers all business functions ranging from corporate banking, retail banking, trading, corporate finance, settlement, intermediary business, asset management and all supporting functions, including human resource management, financial management, legal affairs, anti-money laundering and administration management. The key elements of the framework are listed as below:
– A multi-level operational risk management framework with segregation of duties between front and back offices under the leadership of senior management;
– A series of operational risk management policies covering all businesses on the basis of core operational risk management policy;
– A set of standard operational procedures covering all products and services, which is practical, traceable and can be re-performed, investigated and remedied;
– A series of operational risk management tools, including Risk Control Self-Assessment (RCSA), Key Risk Index (KRI), Loss Event Collection and IT system monitoring;
– An operational risk management culture, the core values of the culture is that effective risk management could create value. It is supported with a team of operational risk management professionals across all branches, businesses and functions;
– An emergency plan and a business continuity system designed to deal with emergent and adverse circumstances, including public relation issues, natural disasters, IT system errors, bank runs, robberies, etc.;
– An evaluation system on the operational risk management as well as an inquiry and disciplinary system on the non-compliance issues; and
– An independent risk assessment framework based on the internal audit and the compliance review.

CH
INA
EVER
BR
IGH
T B
ANK
146
Notes to the Unaudited Condensed Consolidated Financial Statementsfor the Six Months Ended 30 June 2016(Expressed in millions of Renminbi, unless otherwise stated)
50 Fair value
(a) Methods and assumptions for measurement of fair value
The Group adopts the following methods and assumptions when evaluating fair values:
(i) Debt securities and equity investments
The fair values of debt securities and equity investments that are traded in an active market are based on their quoted market prices in an active market at the end of the reporting period. The fair values of unlisted equity investments are estimated using the applicable price/earning ratios of comparable listed companies, after adjustment for the specific circumstances of the issuers.
(ii) Receivables and other non-derivative financial assets
Fair values are estimated as the present value of the future cash flows, discounted at the market interest rates at the end of the reporting period.
(iii) Debt securities issued and other non-derivative financial liabilities
Fair values of debt securities issued are based on their quoted market prices at the end of the reporting period, or the present value of estimated future cash flows. The fair values of other non-derivative financial liabilities are valued at the present value of estimated future cash flows. The discount rates are based on the market interest rates at the end of the reporting period.
(iv) Derivative financial instruments
The fair values of foreign currency forward and swap contracts are determined by the difference between the present value of the forward price and the contractual price at the end of the reporting period, or is based on quoted market prices. The fair values of interest rate swaps are estimated as the present value of estimated future cash flows. The yield curve is based on the optimised price between the broker’s quoted price and Reuters’ quoted price.
(b) Fair value measurement
(i) Financial assets
The Group’s financial assets mainly consist of cash and deposits with the central bank, receivables with banks and other financial institutions, loans and advances to customers, and investments.
Deposits with the central bank and receivables with banks and other financial institutions are mostly priced at market interest rates and due within one year. Accordingly, the carrying amounts approximate the fair values.
Loans and advances to customers and debt securities classified as receivables are mostly priced at floating interest rates close to the PBOC rates. Accordingly, the carrying amounts approximate the fair values.
Available-for-sale investments and held for trading investments are stated at fair value. The carrying amount and fair value of held-to-maturity investments are disclosed in Note 21.

147
2016 Interim
Rep
ort
50 Fair value (continued)
(b) Fair value measurement (continued)
(ii) Financial liabilities
The Group’s financial liabilities mainly include payables to banks and other financial institutions, deposits from customers and subordinated debts issued.
The carrying amount and fair value of debt securities issued are disclosed in Note 36. The carrying amounts of other financial liabilities approximate their fair values.
(c) Fair value hierarchy
The following table presents the carrying value of financial instruments measured at fair value in the statements of financial position across the three levels of the fair value hierarchy. The level in the fair value hierarchy within which the fair value measurement is categorised is determined on the basis of the lowest level input that is significant to the fair value measurement in its entirety. The definitions of three levels are as below:
Level 1: Quoted prices (unadjusted) in active markets for identical assets or liabilities.
Level 2: Inputs other than quoted prices included within Level 1 that are observable for assets or liabilities, either directly (i.e. as prices) or indirectly (i.e. derived from prices). This level includes bonds and a majority of OTC derivative contracts. Input parameters like ChinaBond interbank yield curves or LIBOR yield curves are sourced from ChinaBond, Bloomberg and Shanghai Clearing House.
Level 3: Inputs for assets or liabilities that are not based on observable market data (unobservable inputs). This level includes complicated derivative contracts and structured deposits with one or more than one significant unobservable component.
This hierarchy requires the use of observable open market data wherever possible. The Group tries it best to consider relevant and observable market prices in valuations.
If there is a reliable market quote for financial instruments, the fair value of financial instruments is based on quoted market prices. If a reliable quoted market price is not available, the fair value of the financial instruments is estimated using valuation techniques. Valuation techniques applied include reference to the fair value of another instrument that is substantially the same, discounted cash flow analysis and option pricing models. The inputs used in valuation techniques include risk-free and benchmark interest rates, credit spreads and foreign exchange rates. Where discounted cash flow analysis is used, estimated cash flows are based on management’s best estimates and the discount rate used is reference to another instrument that is substantially the same.
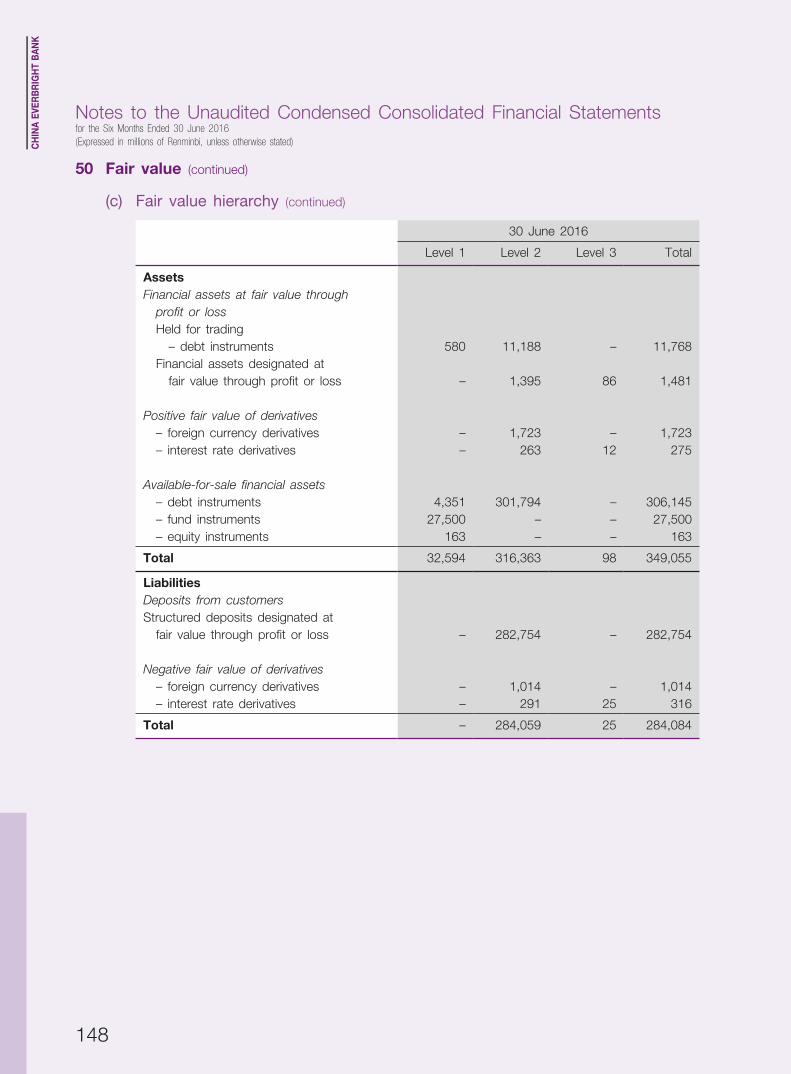
CH
INA
EVER
BR
IGH
T B
ANK
148
Notes to the Unaudited Condensed Consolidated Financial Statementsfor the Six Months Ended 30 June 2016(Expressed in millions of Renminbi, unless otherwise stated)
50 Fair value (continued)
(c) Fair value hierarchy (continued)
30 June 2016
Level 1 Level 2 Level 3 Total
AssetsFinancial assets at fair value through profit or loss Held for trading – debt instruments 580 11,188 – 11,768 Financial assets designated at fair value through profit or loss – 1,395 86 1,481
Positive fair value of derivatives – foreign currency derivatives – 1,723 – 1,723 – interest rate derivatives – 263 12 275
Available-for-sale financial assets – debt instruments 4,351 301,794 – 306,145 – fund instruments 27,500 – – 27,500 – equity instruments 163 – – 163
Total 32,594 316,363 98 349,055
LiabilitiesDeposits from customersStructured deposits designated at fair value through profit or loss – 282,754 – 282,754
Negative fair value of derivatives – foreign currency derivatives – 1,014 – 1,014 – interest rate derivatives – 291 25 316
Total – 284,059 25 284,084

149
2016 Interim
Rep
ort
50 Fair value (continued)
(c) Fair value hierarchy (continued)
31 December 2015
Level 1 Level 2 Level 3 Total
AssetsFinancial assets at fair value through profit or loss Held for trading – debt instruments 102 5,372 – 5,474 Financial assets designated at fair value through profit or loss – 50 113 163
Positive fair value of derivatives – foreign currency derivatives – 1,248 – 1,248 – interest rate derivatives – 364 13 377
Available-for-sale financial assets – debt instruments 18,735 174,915 – 193,650 – fund instruments 28,200 – – 28,200 – equity instruments 245 – – 245
Total 47,282 181,949 126 229,357
LiabilitiesDeposits from customersStructured deposits designated at fair value through profit or loss – 238,614 – 238,614
Negative fair value of derivatives – foreign currency derivatives – 981 – 981 – interest rate derivatives – 390 20 410
Total – 239,985 20 240,005
During the period/year ended 30 June 2016 and 31 December 2015, there were no significant transfers between instruments in Level 1 and Level 2.

CH
INA
EVER
BR
IGH
T B
ANK
150
Notes to the Unaudited Condensed Consolidated Financial Statementsfor the Six Months Ended 30 June 2016(Expressed in millions of Renminbi, unless otherwise stated)
50 Fair value (continued)
(c) Fair value hierarchy (continued)
The movement during the six months ended 30 June 2016 in the balance of Level 3 fair value measurements is as follows:
Financialassets
designatedat fair
value throughprofit or loss
Derivativefinancial
assets Total
Derivativefinancialliabilities Total
1 January 2016 113 13 126 (20) (20)Total gains or losses: In profit or loss for the current period (2) – (2) (5) (5)Purchases 9 – 9 – –Settlements (34) (1) (35) – –
30 June 2016 86 12 98 (25) (25)
Total gains or losses for the period included in profit or loss for assets and liabilities held at the end of the reporting period (1) – (1) (5) (5)
The movement during the year ended 31 December 2015 in the balance of Level 3 fair value measurements is as follows:
Financialassets
designatedat fair
value throughprofit or loss
Derivativefinancial
assets Total
Derivativefinancialliabilities Total
1 January 2015 172 30 202 (21) (21)Total gains or losses: In profit or loss for the current year 10 (8) 2 1 1Purchases 7 1 8 – –Settlements (76) (10) (86) – –
31 December 2015 113 13 126 (20) (20)
Total gains or losses for the year included in profit or loss for assets and liabilities held at the end of the reporting year 9 (7) 2 1 1
During the period/year ended 30 June 2016 and 31 December 2015, there were no significant transfers into or out of Level 3.

151
2016 Interim
Rep
ort
50 Fair value (continued)
(d) Valuation of financial instruments with significant unobservable inputs
Financial instruments valued with significant unobservable inputs are primarily certain structured derivatives. These financial instruments are valued using cash flow discount model. The models incorporate various non-observable assumptions such as discount rate and market rate volatilities.
As at 30 June 2016, the carrying amount of financial instrument valued with significant unobservable inputs were immaterial, and the effects of changes in significant unobservable assumptions to reasonably possible alternative assumptions were also immaterial.
51 Entrusted lending business
The Group provides entrusted lending business services to government agencies, corporations and individuals. All entrusted loans are funded by entrusted funds from these entities and individuals. The Group does not take any credit risk in relation to these transactions. The Group acts as an agent to hold and manage these assets and liabilities at the direction of the entrustors and receives fee income for the services provided. The entrusted assets are not the assets of the Group and are not recognised in the statements of financial position.
30 June 31 December2016 2015
Entrusted loans 112,048 98,671
Entrusted funds 112,048 98,671

CH
INA
EVER
BR
IGH
T B
ANK
152
Notes to the Unaudited Condensed Consolidated Financial Statementsfor the Six Months Ended 30 June 2016(Expressed in millions of Renminbi, unless otherwise stated)
52 Commitments and contingent liabilities
(a) Credit commitments
The Group’s credit commitments take the form of approved loans with signed contracts, credit card limits, bank acceptances, letters of credit and financial guarantees.
The contractual amounts of loans and credit card commitments represent the amounts should the contracts be fully drawn upon. The Group provides financial guarantees and letters of credit to guarantee the performance of customers to third parties. Acceptances comprise undertaking’s by the Group to pay bills of exchange drawn on customers. The Group expects most acceptances to be settled simultaneously with the reimbursement from the customers.
30 June 31 December2016 2015
Loan commitments Original contractual maturity within one year 13,028 9,180 Original contractual maturity more than one year (inclusive) 19,786 24,082Credit card commitments 107,289 95,127
Sub-total 140,103 128,389
Acceptances 415,173 449,385Letters of guarantees 63,695 61,704Letters of credit 56,947 63,069Guarantees 185 185
Total 676,103 702,732
The Group may be exposed to credit risk in all the above credit businesses. Group management periodically assesses the credit risk and makes provision for any probable losses. As the facilities may expire without being drawn upon, the total of the contractual amounts shown above is not representative of expected future cash outflows.
(b) Credit risk-weighted amount
30 June 31 December2016 2015
Credit risk-weighted amount of credit commitments 263,054 283,635
The credit risk weighted amount represent to the amount calculated with reference to the guidelines issued by the CBRC. The risk weights are determined in accordance with the credit status of the counterparties, the maturity profile and other factors. The risk weights ranged from 0% to 150% for credit commitments.

153
2016 Interim
Rep
ort
52 Commitments and contingent liabilities (continued)
(c) Operating lease commitments
As at the end of the reporting period, the Group’s future minimum lease payments under non-cancellable operating leases for properties are as follows:
30 June 31 December2016 2015
Within one year (inclusive) 2,231 2,156After one year but within two years (inclusive) 2,173 2,036After two years but within three years (inclusive) 1,912 1,889After three years but within five years (inclusive) 2,763 2,915After five years 2,928 3,040
Total 12,007 12,036
(d) Capital commitments
As at the balance sheet dates, the Group’s authorised capital commitments are as follows:
30 June 31 December2016 2015
Contracted for – Purchase of property and equipment 605 660Approved but not contracted for – Purchase of property and equipment 1,711 1,346
Total 2,316 2,006

CH
INA
EVER
BR
IGH
T B
ANK
154
Notes to the Unaudited Condensed Consolidated Financial Statementsfor the Six Months Ended 30 June 2016(Expressed in millions of Renminbi, unless otherwise stated)
52 Commitments and contingent liabilities (continued)
(e) Underwriting and redemption commitments
The Group has no unexpired commitments for underwriting bonds as at 30 June 2016.
As an underwriting agent of the PRC government bonds, the Group has the responsibility to buy back those bonds it previously sold should the holders decide to make an early redemption of the bonds held. The redemption price for a bond at any time before its maturity date is based on the coupon value plus any interest unpaid and accrued up to the redemption date. Accrued interests payable to the bond holders is calculated in accordance with the relevant MOF and PBOC rules. The redemption price may be different from the fair value of similar financial instruments traded at the redemption date.
The Group’s redemption commitments are as follows:
30 June 31 December2016 2015
Redemption commitments 8,202 8,556
(f) Forward assets purchase and sale commitments
The Group has unexpired forward purchase and sale commitments as follows:
30 June 31 December2016 2015
Forward assets purchase and sale commitments 550 1,350
(g) Outstanding litigations and disputes
As at 30 June 2016, the Group was the defendant in certain pending litigation and disputes with gross claims of RMB669 million (31 December 2015: RMB967 million). Provisions have been made for the estimated losses of such litigations based upon the opinions of the Group’s internal and external legal counsels. The Group considers that the provisions made are reasonable and adequate.

155
2016 Interim
Rep
ort
53 Subsequent Events
On 15 June 2015, the China Securities Regulatory Commission (CSRC) approved the Bank’s domestic non-public issuance of no more than 300 million preference shares in CSRC permit No. 1239 [2015]. The Bank completed the issuance of its first tranche of 200 million preference shares on the 19 June 2015; the second tranche of 100 million preference shares were issued on 8 August 2016, with RMB100 par value per share. After deducting issuance expenses, the actual proceeds amounted to about RMB9.981 billion. As at 12 August 2016, the Bank had already received the funds mentioned.
54 Comparative figures
Certain comparative figures have been adjusted to conform with changes in presentations in current period.
55 Immediate and ultimate parent
The immediate and ultimate parents of the Group are China Everbright Group and CIC.

CH
INA
EVER
BR
IGH
T B
ANK
156
Unaudited Supplementary Financial Information(Expressed in millions of Renminbi, unless otherwise stated)
The information set out below does not form part of the consolidated financial statements, and is included herein for information purposes only.
1 Liquidity Coverage Ratio and Leverage Ratio
Liquidity Coverage Ratio
Pursuant to the Administrative Measures for Liquidity Risk Management of Commercial Banks (Provisional), the liquidity coverage ratio of commercial banks shall reach 100% by the end of 2018. During the transitional period, such ratio shall reach 60%, 70%, 80% and 90% by the end of 2014, 2015, 2016 and 2017, respectively.
30 June2016
Liquidity coverage ratio 93.65%Liquid assets of high quality 398,239.25Net cash outflows in 30 days from the end of the reporting period 425,243.39
Liquidity Ratio*
Average for the Average for theAs at period ended As at year ended
30 June 30 June 31 December 31 December2016 2016 2015 2015
RMB current assets to RMB current liabilities 57.11% 54.50% 54.90% 51.29%
Foreign current assets to foreign current liabilities 56.32% 55.89% 98.87% 91.39%
* Liquidity ratio is calculated in accordance with the banking level.
Leverage Ratio
30 June2016
Leverage Ratio 5.30%
Pursuant to the Leverage Ratio Management of Commercial Banks issued by the CBRC and was effective since April 1, 2015, a minimum leverage ratio 4% is required.
The above liquidity coverage ratio and leverage ratio are calculated in accordance with the formula promulgated by the CBRC and based on the financial information prepared in accordance with PRC GAAP.

157
2016 Interim
Rep
ort
2 Currency concentrations
30 June 2016
US Dollars HK Dollars Others Total(RMB (RMB (RMB (RMB
equivalent) equivalent) equivalent) equivalent)
Spot assets 80,512 14,024 7,680 102,216Spot liabilities (91,018) (20,227) (15,089) (126,334)Forward purchases 113,369 10,103 13,552 137,024Forward sales (94,764) (2,088) (5,411) (102,263)
Net long position 8,099 1,812 732 10,643
Net structural position 11 26 4 41
31 December 2015
US Dollars HK Dollars Others Total(RMB (RMB (RMB (RMB
equivalent) equivalent) equivalent) equivalent)
Spot assets 100,642 10,082 5,567 116,291Spot liabilities (94,889) (16,706) (16,945) (128,540)Forward purchases 83,345 8,598 15,536 107,479Forward sales (70,228) (915) (3,860) (75,003)
Net long position 18,870 1,059 298 20,227
Net structural position 11 11 – 22
The net structural position of the Group includes the structural positions, denominated in foreign currency, of the Bank’s Hong Kong branch. Structural assets mainly include property and equipment.
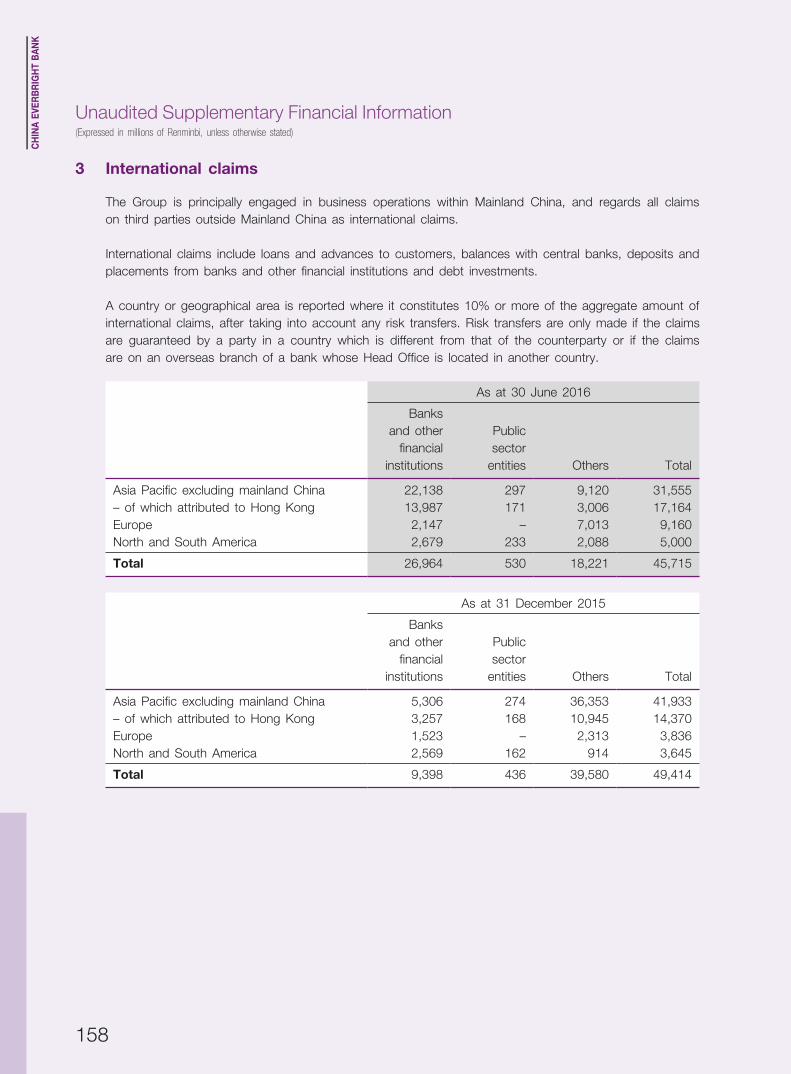
CH
INA
EVER
BR
IGH
T B
ANK
158
Unaudited Supplementary Financial Information(Expressed in millions of Renminbi, unless otherwise stated)
3 International claims
The Group is principally engaged in business operations within Mainland China, and regards all claims on third parties outside Mainland China as international claims.
International claims include loans and advances to customers, balances with central banks, deposits and placements from banks and other financial institutions and debt investments.
A country or geographical area is reported where it constitutes 10% or more of the aggregate amount of international claims, after taking into account any risk transfers. Risk transfers are only made if the claims are guaranteed by a party in a country which is different from that of the counterparty or if the claims are on an overseas branch of a bank whose Head Office is located in another country.
As at 30 June 2016
Banksand other
financialPublicsector
institutions entities Others Total
Asia Pacific excluding mainland China 22,138 297 9,120 31,555– of which attributed to Hong Kong 13,987 171 3,006 17,164Europe 2,147 – 7,013 9,160North and South America 2,679 233 2,088 5,000
Total 26,964 530 18,221 45,715
As at 31 December 2015
Banksand other
financialPublicsector
institutions entities Others Total
Asia Pacific excluding mainland China 5,306 274 36,353 41,933– of which attributed to Hong Kong 3,257 168 10,945 14,370Europe 1,523 – 2,313 3,836North and South America 2,569 162 914 3,645
Total 9,398 436 39,580 49,414
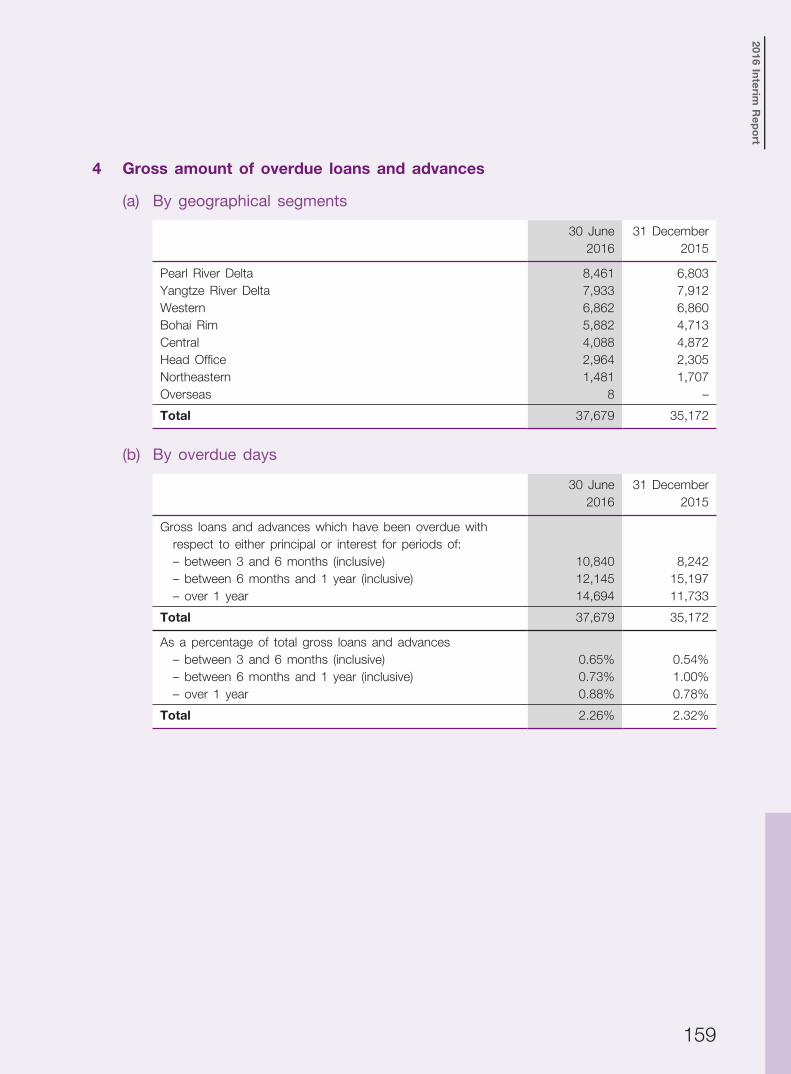
159
2016 Interim
Rep
ort
4 Gross amount of overdue loans and advances
(a) By geographical segments
30 June 31 December2016 2015
Pearl River Delta 8,461 6,803Yangtze River Delta 7,933 7,912Western 6,862 6,860Bohai Rim 5,882 4,713Central 4,088 4,872Head Office 2,964 2,305Northeastern 1,481 1,707Overseas 8 –
Total 37,679 35,172
(b) By overdue days
30 June 31 December2016 2015
Gross loans and advances which have been overdue with respect to either principal or interest for periods of: – between 3 and 6 months (inclusive) 10,840 8,242 – between 6 months and 1 year (inclusive) 12,145 15,197 – over 1 year 14,694 11,733
Total 37,679 35,172
As a percentage of total gross loans and advances – between 3 and 6 months (inclusive) 0.65% 0.54% – between 6 months and 1 year (inclusive) 0.73% 1.00% – over 1 year 0.88% 0.78%
Total 2.26% 2.32%

CH
INA
EVER
BR
IGH
T B
ANK
160
Unaudited Supplementary Financial Information(Expressed in millions of Renminbi, unless otherwise stated)
4 Gross amount of overdue loans and advances (continued)
(b) By overdue days (continued)
30 June 31 December2016 2015
Current market value of collateral held against the covered portion of overdue loans and advances 31,673 24,494Covered portion of overdue loans and advances 17,386 14,589Uncovered portion of overdue loans and advances 20,293 20,583Individual impairment allowances made on overdue loans and advances 9,021 9,747
The above analysis includes loans and advances overdue for more than 90 days. Loans and advances with a specific repayment date are classified as overdue when the principal or interest is overdue.
5 Non-bank mainland China exposure
The Bank is a commercial bank incorporated in mainland China with its banking business conducted in mainland China. As at 30 June 2016, substantial amounts of the Group’s exposures arose from businesses with mainland China entities or individuals.

Des
ign
ed &
Pro
du
ced
by
He
terM
ed
ia S
erv
ice
s L
imit
ed

China Everbright Bank Company Limited(a joint stock company incorporated in the People’s Republic of China with limited liability)
Stock Code : 6818
Address: Everbright Center, No.25 Taipingqiao Ave, Xicheng District, Beijing P. R. China.Tel: (86)10-63636363Fax: (86)10-63639066Postal Code: 100033Website: www.cebbank.com
This interim report is printed on environmentally friendly paper.
Ch
ina E
verbrig
ht Bank
INTERIM
REPORT
2016
2016INTERIM REPORT