The Five Offshore Drilling Rig Markets
23
Chapter 2 The Five Offshore Drilling Rig Markets Abstract The offshore drilling industry is composed of five markets engaged in the trade of a unique service or good. Mobile offshore drilling units are owned and operated in the contract drilling services market, supplied by the newbuild and secondhand markets, maintained and enhanced in the upgrade market, and com- plete their lifecycle in the scrap market. The purpose of this chapter is to describe the players, prices, activity and cash flows in each of the five offshore rig markets circa 2010–2011. Contract drilling and newbuilding are large transparent markets and activity is closely followed throughout the industry. From 2005 to 2012, contract drilling and newbuilding generated between $25–$50 billion and $10–$20 billion in transactions per year, respectively. Maintenance and upgrade activities are performed by a number of shipyards throughout the world, but because of the sporadic nature of the activities and limited record keeping, the market is difficult to track. The secondhand and upgrade markets are estimated to be worth between $2–$10 billion and $1–$5 billion annually. The scrap market is the smallest of the five markets and is poorly documented and worth less than $50 million during most years. 2.1 Offshore Rig Markets The offshore rig industry is composed of five markets (Fig. 2.1). Cash enters the contract drilling services market when exploration and production (E&P) firms lease rigs from contractors. Contractors use this cash to operate their units, acquire new rigs, and upgrade and maintain their fleet. The newbuild and upgrade markets are the primary mechanisms by which capital leaves the service market. In the contract drilling market, rigs owned and operated by contractors are leased to E&P firms on a dayrate basis to drill or service wells. The dayrate is the daily price to lease a rig and includes the use of the rig and its crew but does not include most of the other costs associated with drilling and completing a well (e.g., casing, drilling fluids, logistics, well evaluation, etc.). The drilling service industry is the largest and M.J. Kaiser and B.F. Snyder, The Offshore Drilling Industry and Rig Construction in the Gulf of Mexico, Lecture Notes in Energy 8, DOI 10.1007/978-1-4471-5152-4_2, © Springer-Verlag London 2013 29
-
Upload
independent -
Category
Documents
-
view
1 -
download
0
Transcript of The Five Offshore Drilling Rig Markets

Chapter 2
The Five Offshore Drilling Rig Markets
Abstract The offshore drilling industry is composed of five markets engaged in
the trade of a unique service or good. Mobile offshore drilling units are owned and
operated in the contract drilling services market, supplied by the newbuild and
secondhand markets, maintained and enhanced in the upgrade market, and com-
plete their lifecycle in the scrap market. The purpose of this chapter is to describe
the players, prices, activity and cash flows in each of the five offshore rig markets
circa 2010–2011. Contract drilling and newbuilding are large transparent markets
and activity is closely followed throughout the industry. From 2005 to 2012, contract
drilling and newbuilding generated between $25–$50 billion and $10–$20 billion in
transactions per year, respectively. Maintenance and upgrade activities are performed
by a number of shipyards throughout the world, but because of the sporadic nature of
the activities and limited record keeping, the market is difficult to track. The
secondhand and upgrade markets are estimated to be worth between $2–$10 billion
and $1–$5 billion annually. The scrap market is the smallest of the five markets and is
poorly documented and worth less than $50 million during most years.
2.1 Offshore Rig Markets
The offshore rig industry is composed of five markets (Fig. 2.1). Cash enters the
contract drilling services market when exploration and production (E&P) firms
lease rigs from contractors. Contractors use this cash to operate their units, acquire
new rigs, and upgrade and maintain their fleet. The newbuild and upgrade markets
are the primary mechanisms by which capital leaves the service market.
In the contract drilling market, rigs owned and operated by contractors are leased
to E&P firms on a dayrate basis to drill or service wells. The dayrate is the daily price
to lease a rig and includes the use of the rig and its crew but does not include most of
the other costs associated with drilling and completing a well (e.g., casing, drilling
fluids, logistics, well evaluation, etc.). The drilling service industry is the largest and
M.J. Kaiser and B.F. Snyder, The Offshore Drilling Industry and Rig Constructionin the Gulf of Mexico, Lecture Notes in Energy 8, DOI 10.1007/978-1-4471-5152-4_2,
© Springer-Verlag London 2013
29

most closely followed of the five markets and drives the activities of investors in the
other markets.
The newbuild market uses shipyard labor and capital to convert steel and third
party equipment into rigs. Drilling contractors enter into turnkey contracts with
shipyards for the construction and delivery of one or more rigs, or yards may build
on speculation. The newbuild market is primarily Asian with major shipyards in
Singapore, South Korea, and China.
Rigs operate offshore in a corrosive and hostile environment, and steel and
equipment needs to be replaced for safe and efficient operations. As a rig ages, its
technology also becomes obsolete and upgrades are required to sustain competi-
tiveness and market value. The upgrade market is a ship repair market which both
upgrades and maintains rigs. Upgrades improve and modernize rig technology and
represent significant capital expenditures.
In the secondhand market, rigs are sold among and between contractors and
other market participants. Rigs may be sold for use in the service market, may be
converted to another use by the buyer, or sold into the scrap market. Transactions
include corporate mergers where all the assets of the firm are purchased,
liquidations during bankruptcy where one or more units may be purchased, or
conventional sales.
In the scrap market, shipbreaking firms buy rigs on the secondhand market,
either directly from contractors or via brokers. Equipment is removed and reused or
sold as market conditions and demand permit. Following sale, dismantling occurs
and the steel is sold for scrap to steel mills. Rigs in the U.S. may be stored for years
until the price of scrap steel is adequate to make dismantling economic, while in
international yards, rigs are broken down quickly along with beached ships [14].
Fig. 2.1 Direction of cash
flow through offshore rig
markets
30 2 The Five Offshore Drilling Rig Markets

The financial value of individual sales in the scrap market is low, and companies do
not frequently report income from scrap sales leading to the smallest and least
transparent of the five markets.
2.2 Contract Drilling Market
2.2.1 Measures
The contract drilling service market is described by dayrates, utilization and fleet
size. Dayrates behave according to demand and supply conditions, and as regional
demand approaches available supply, dayrates generally rise. Demand for drilling is
driven by the capital spending patterns of E&P companies, which in turn, is based
on operator’s expectations of future oil and gas prices, the availability of acreage,
and many other factors [11, 15]. Dayrates are an indicator of market conditions and
the same drivers that impact dayrates tend to influence the rest of the offshore
service industry.
Utilization is a systemmeasure defined by the proportion of rigs working at a point
in time to the available fleet within a specific region. Industry capacity is not a fixed
resource because companies can add rigs through newbuilding and relocation to
respond to higher demand and stack rigs when demand declines. While adding new
capacity takes several years, rigs have very long lives (25+ years), and when demand
weakens, overcapacity in the market may lead to prolonged declines in utilization.
Stacking units removes capacity from the market and can be performed relatively
quickly to help support prices, but stacking, like newbuilding decisions, are firm
specific and are not performed in unison. High utilization cause dayrates to rise and
provide a signal to operators that additional capacity can be absorbed in themarket [4].
Fleet size describes the total number of rigs of a given water depth or class. Fleet
size is described by firm, and when reported regionally, is an indicator of the total
capacity in the drilling market at a given point in time. The scale and quality of a
contractor’s asset base is correlated with its revenue base. A large asset base implies
a platform for sustainable earnings and cash flows and is related to a company’s
market position, its ability to compete in terms of cost structure, and the ability to
obtain financing for capital projects.
2.2.2 Players
The number of offshore drilling companies varies over time, and in 2012 there were
approximately 100 offshore drilling contractors and the market was dominated by a
small number of firms, including Transocean, Ensco, Diamond Offshore and
Seadrill (Table 2.1). The top four firms owned 36 % of the 868 rigs in the world
2.2 Contract Drilling Market 31

fleet circa 2011 and the top eight firms owned over half of the marketable rigs. Fleet
size changes over time with changing market conditions, but the changes are often
slow and represent a small portion of the world’s asset base. Asset transactions and
additions are common but new firm entrants are infrequent. Most large firms are
publicly owned and all but one of the major players in the market (National
Drilling) are listed on stock exchanges. Contractors not listed in Table 2.1 own
on average three rigs per firm.
2.2.3 Prices
Dayrates are the primary contract specification during the bidding process and are
frequently announced by contractors and assembled by commercial data providers
such as RigLogix, ODS-Petrodata, and RigData. Contract durations are often less
than a year so there is a steady stream of new contracts that provide a large number
of transparent and reliable data.
Jackup and floater dayrates were relatively stable from 2000 to 2005 in most
regional markets before increasing sharply from 2005 to 2007 as oil prices rose
(Fig. 2.2). Following the 2008 global recession, dayrates fell rapidly, especially in
the over-supplied and volatile jackup market. Regional prices tend to move together
and follow oil prices but not all markets respond in the same manner.
Table 2.1 Distribution of rigs by class and operator circa 2Q2011
Company Jackups Semis Drillships Total Ownership
Transocean 68 50 23 141 Public
Ensco 49 20 7 76 Public
Noble Drilling 45 14 13 72 Public
Hercules Offshore 53 0 0 53 Public
Diamond Offshore 13 32 3 48 Public
Seadrill 21 12 6 39 Public
COSL 27 6 0 33 State
Rowan 31 0 0 31 Public
Maersk Drilling 14 6 0 20 Subsidiary
Aban Offshore 15 0 3 18 Public
Saipem 7 7 2 16 Public
Nabors Offshore 16 0 0 16 Public
Atwood Oceanics 6 6 1 13 Public
National Drilling 13 0 0 13 State
ONGC 8 0 2 10 State
Petrobras 6 4 0 10 State
All others (87 firms) 147 66 46 259
Top 4 firms 205 116 46 367
Top 8 firms 337 134 52 523
Total 539 223 106 868
Source: Data from RigLogix [16]
Note: Count includes cold-stacked rigs and rigs under construction
32 2 The Five Offshore Drilling Rig Markets

In the jackup market, there are significant price differences between regions,
ranging from 50,000 to 100,000 $/day in the U.S. GOM during 2009–2011 com-
pared with 100,000–175,000 $/day in the North Sea. In the floater market, there is
less variation between regions due to patterns of supply and demand, technical
requirements, and the greater similarity in deepwater rig specifications. In the
2009–2011 period, floater dayrates ranged between 300,000 and 500,000 $/day
with slightly lower dayrates in Southeast Asia than in the Atlantic basins.
2.2.4 Size
In 2011, approximately 85 % of the active fleet was operating in the Persian Gulf,
U.S. GOM, Brazil, North Sea, Southeast Asia, West Africa, India and China
(Table 2.2). Smaller markets include the Mexican GOM, Mediterranean, the Red
Sea, Black Sea, Caspian Sea, the Caribbean and Australia. Frontier regions typi-
cally have less than five working rigs and include the Arctic Ocean, East Africa,
Ghana, and the Philippines.
Fig. 2.2 Dayrates in the contract drilling market, 2000–2010 (Source: Data from RigLogix [16])
2.2 Contract Drilling Market 33

The number of offshore wells drilled since 1994 has ranged between 2,500 and
3,700 per year (Fig. 2.3). All exploratory wells are drilled using MODUs, but
development drilling may occur from either MODUs or platform rigs, and in
many instances, both mobile and platform rigs are responsible for well construction.
Deepwater drilling activity has grown over the past 15 years and is the more
lucrative business segment, but about 80 % of well construction still occurs in
shallow water throughout the world. Asia has accounted for nearly half of drilling
activity in recent years. North American activity is dominated by drilling in the
U.S. GOM, but after theMacondo blowout onApril 20, 2010 and subsequent drilling
moratorium, activity levels remain depressed through 2012, before returning to
historic levels.
2.2.5 Value
To estimate market value, the number of rigs of each class under contract in each
month and region were counted and multiplied by the average regional dayrates.
Over the past decade, the revenue in the contract drilling market ranged from $21
billion in 2004 to over $50 billion in 2009 (Fig. 2.4; Table 2.3). Although deepwater
drilling makes up a relatively small proportion (about 20 %) of the number of wells
drilled each year, the deepwater market accounted for approximately two-thirds of
total revenue throughout the decade. In 2010, the North Sea and Brazil were the
largest floater markets and the largest overall, while the Persian Gulf was the largest
jackup market.
Market valuations are performed by a number of industry consultancies (e.g.
Douglas-Westwood, GBI Research, IHS, R.S. Platou, Rystad Energy, Wood
Mackenzie). Comparisons across firms depend on the assumptions and methods
Table 2.2 Geographic
distribution of active rigs by
region in 2011
Region Jackups Semis Drillships Total
Persian Gulf 85 0 0 85
U.S. GOM 51 20 10 81
Brazil 3 52 15 70
North Sea 32 36 2 57
Southeast Asia 42 9 2 53
India 34 2 9 45
West Africa 17 13 9 39
China 28 4 0 32
Mexico 24 3 0 27
Egypt 20 2 2 24
All others 55 33 13 101
Top 4 171 108 27 306
Top 8 292 136 47 475
Total 394 175 57 626
Source: Data from RigLogix [16]
34 2 The Five Offshore Drilling Rig Markets

and the definition of the market employed [7, 18]. Large markets with a high degree
of involvement by public E&P companies and drilling contractors are transparent
and may be estimated with confidence. For small markets or those dominated by
National Oil Companies and state-owned drilling contractors, more uncertainty
Fig. 2.3 Number of wells drilled per year, 1994–2010. Deepwater defined as greater than 400 m
(Source: Data from Douglas-Westwood [5])
Fig. 2.4 Annual revenue of the offshore contract drilling market, 2000–2012 (Source: Data from
RigLogix [16])
2.2 Contract Drilling Market 35

arises in the valuation estimates. The Chinese market is particularly difficult to
reliably estimate due to the large number of state-owned rigs.
2.3 Newbuild Market
2.3.1 Measures
The newbuild market is specified by deliveries and prices. The market is transparent
because newbuilding is a significant capital expenditure for contractors and a
significant source of revenue for rig-building shipyards. Prices are widely reported
and tracked by the same firms that survey rig dayrates.
Drilling contractors order rigs when the expected rate of return from operating a
new rig exceeds company investment criteria. The benefit of investment depends
on dayrates and utilization over the life of the rig [2, 4], and since these are
unknown and uncertain, management employ their own expectations relative to
their business strategy [10]. The newbuild market is linked to conditions in the
service market, and the cyclical nature of contract drilling causes similar cycles in
the newbuild market.
Prices in the newbuild market are a function of demand and shipyard labor,
equipment and steel costs. As shipyard demand increases, backlogs develop and
yards are able to command higher prices for services. In addition, demand at
rig-building shipyards is generally associated with demand across the drilling
supply chain. Therefore, demand and prices for drilling equipment typically
increase along with demand at shipyards, which leads to further price increases.
Table 2.3 Regional contract drilling markets in 2010
Jackups (million $) Floaters (million $) Total (million $)
North Sea 1,865 6,436 8,302
Brazil 72 7,615 7,688
West Africa 994 4,314 5,307
U.S. GOM 983 3,781 4,765
Southeast Asia 1,931 2,092 4,023
Persian Gulf 3,253 3,253
India 1,263 1,369 2,632
China 1,377 526 1,903
Mediterranean 509 1,291 1,799
Mexico GOM 1,075 256 1,331
Australia 57 1,022 1,079
Venezuela & Caribbean 296 292 588
Red Sea 511 511
Total 14,187 28,588 42,775
Source: Data from RigLogix [16]; Authors calculations
36 2 The Five Offshore Drilling Rig Markets
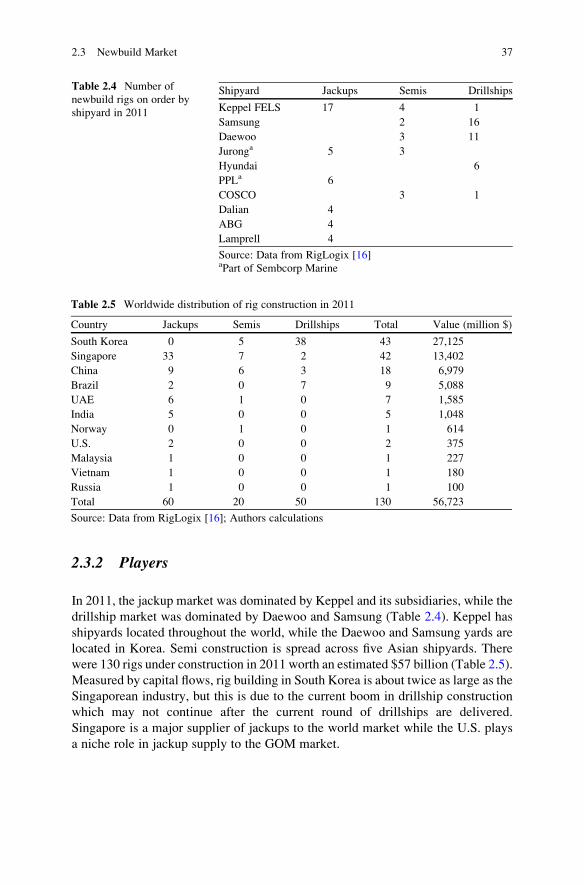
2.3.2 Players
In 2011, the jackup market was dominated by Keppel and its subsidiaries, while the
drillship market was dominated by Daewoo and Samsung (Table 2.4). Keppel has
shipyards located throughout the world, while the Daewoo and Samsung yards are
located in Korea. Semi construction is spread across five Asian shipyards. There
were 130 rigs under construction in 2011 worth an estimated $57 billion (Table 2.5).
Measured by capital flows, rig building in South Korea is about twice as large as the
Singaporean industry, but this is due to the current boom in drillship construction
which may not continue after the current round of drillships are delivered.
Singapore is a major supplier of jackups to the world market while the U.S. plays
a niche role in jackup supply to the GOM market.
Table 2.4 Number of
newbuild rigs on order by
shipyard in 2011
Shipyard Jackups Semis Drillships
Keppel FELS 17 4 1
Samsung 2 16
Daewoo 3 11
Juronga 5 3
Hyundai 6
PPLa 6
COSCO 3 1
Dalian 4
ABG 4
Lamprell 4
Source: Data from RigLogix [16]aPart of Sembcorp Marine
Table 2.5 Worldwide distribution of rig construction in 2011
Country Jackups Semis Drillships Total Value (million $)
South Korea 0 5 38 43 27,125
Singapore 33 7 2 42 13,402
China 9 6 3 18 6,979
Brazil 2 0 7 9 5,088
UAE 6 1 0 7 1,585
India 5 0 0 5 1,048
Norway 0 1 0 1 614
U.S. 2 0 0 2 375
Malaysia 1 0 0 1 227
Vietnam 1 0 0 1 180
Russia 1 0 0 1 100
Total 60 20 50 130 56,723
Source: Data from RigLogix [16]; Authors calculations
2.3 Newbuild Market 37

2.3.3 Prices
The average cost of jackup rigs increased from approximately $100 million in
2004–2005 to approximately $200 million for rigs delivered in 2012–2013
(Fig. 2.5). Price differences between high-spec (>350 ft) and standard (<350 ft)
jackups varied only slightly over most of the cycle, except in 2010–2011 when
several harsh environment high-spec units were delivered. Both ends of the jackup
newbuild market respond to the same market stimuli due to similarities in the rigs
and the firms engaged in construction.
Semis and floaters are two to three times more expensive than jackups and
usually command dayrate premiums of similar magnitude. Drillships are more
expensive to construct than semisubmersibles with average premiums ranging
between $70 to $275 million.
Fig. 2.5 Average cost of jackup and floater deliveries, 2000–2013 (Source: Data from
RigLogix [16])
38 2 The Five Offshore Drilling Rig Markets

2.3.4 Size
Newbuild deliveries have exhibited several cycles over the past half century
(Fig. 2.6). The jackup industry began in the U.S. in the late 1950s and spread to
Europe and Asia through the mid-1970s as exploration worldwide increased [1].
Prior to 1974, about 200 MODUs had been delivered. In the late 1970s and early
1980s, oil prices rose and the market grew rapidly, peaking in 1982 with 70 jackup
and 11 floater deliveries.
Oil prices declined in the mid 1980s and demand collapsed, and during the
decade 1986–1997, only 37 rigs were delivered. By the late 1990s, deepwater
drilling technology had advanced, but few rigs were capable of drilling in water
depths greater than 1,500 ft. Contractors responded by upgrading and ordering a
small number of floaters. New jackup orders also began in this period due to
concerns about the age of the fleet and operator interest in more challenging
reservoirs and harsh environments.
Fig. 2.6 Deliveries of newbuild rigs by class and oil prices, 1974–2014 (Source: Data from
RigLogix [16])
2.3 Newbuild Market 39
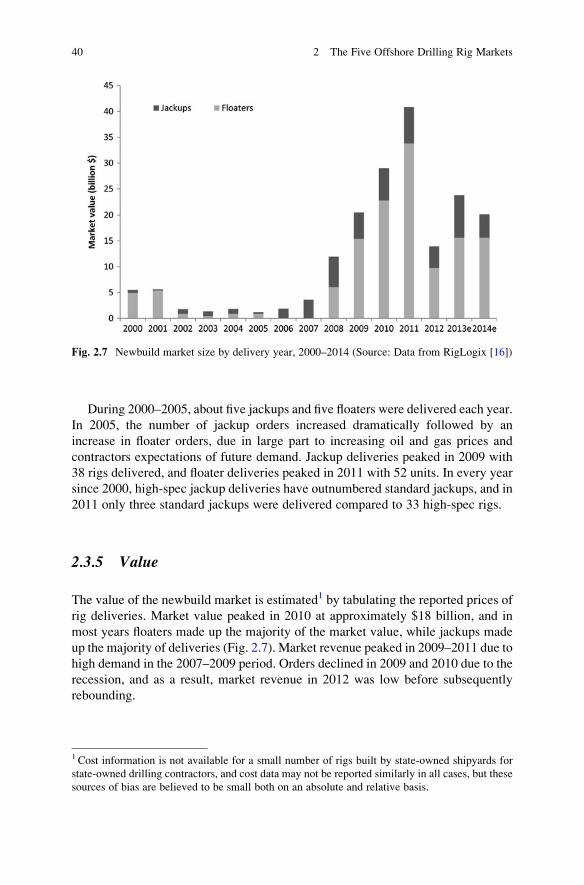
During 2000–2005, about five jackups and five floaters were delivered each year.
In 2005, the number of jackup orders increased dramatically followed by an
increase in floater orders, due in large part to increasing oil and gas prices and
contractors expectations of future demand. Jackup deliveries peaked in 2009 with
38 rigs delivered, and floater deliveries peaked in 2011 with 52 units. In every year
since 2000, high-spec jackup deliveries have outnumbered standard jackups, and in
2011 only three standard jackups were delivered compared to 33 high-spec rigs.
2.3.5 Value
The value of the newbuild market is estimated1 by tabulating the reported prices of
rig deliveries. Market value peaked in 2010 at approximately $18 billion, and in
most years floaters made up the majority of the market value, while jackups made
up the majority of deliveries (Fig. 2.7). Market revenue peaked in 2009–2011 due to
high demand in the 2007–2009 period. Orders declined in 2009 and 2010 due to the
recession, and as a result, market revenue in 2012 was low before subsequently
rebounding.
Fig. 2.7 Newbuild market size by delivery year, 2000–2014 (Source: Data from RigLogix [16])
1 Cost information is not available for a small number of rigs built by state-owned shipyards for
state-owned drilling contractors, and cost data may not be reported similarly in all cases, but these
sources of bias are believed to be small both on an absolute and relative basis.
40 2 The Five Offshore Drilling Rig Markets
2.4 Upgrade Market
2.4.1 Measures
Rigs require routine maintenance and periodically undergo upgrades. Periodic
maintenance occurs over a 3–10 year period and typically consists of painting,
replacing corroded or worn components, upgrading living quarters, and changing
out machinery and equipment. Maintenance is performed to repair defects, accom-
modate customer demands, and maintain the useful life and value of the rig.
In addition to periodic maintenance, rigs are generally upgraded and refurbished
at least once over the course of their lifetime to improve technology and maintain
competitiveness. Upgrades involve significant capital expenditures and often
involve structural changes to the rig, such as adding dynamic positioning, increas-
ing leg length, adding cantilever capability and increasing variable load [6,
21]. Installation of new drilling equipment is also common. Upgrades increase
the value of the rig and its replacement cost and require several months to
perform [17].
In some cases, E&P companies require modifications to a rig before commence-
ment of a drilling program. These typically do not significantly alter rig
specifications and are charged to the E&P company, either as a lump sum payment
or amortized over the duration of the contract. Money spent to maintain a rig in an
acceptable state are considered operating expenditures. Costs incurred to upgrade
the specifications of the rig or extend its life are considered capital costs.
2.4.2 Players
For most repairs and maintenance, work can be performed at local ports without
shipbuilding or drydocking facilities [23]. More intensive upgrades are conducted
at specialized facilities. Lamprell and Keppel are dominant players most years and
no other shipyard upgraded more than one rig during 2009–2010 (Table 2.6). Other
firms active in the upgrade market include Signal International and Gulf Cooper in
the U.S., Drydocks World in the U.A.E., Larsen and Toubro in Oman, Malaysia
Marine and Heavy Engineering in Malaysia, Maua Shipyard in Brazil, PD&MS in
the U.K., Rijeka Shipyard in Croatia, and Remontowa in Poland.
2.4.3 Prices
The scale of upgrades varies widely and only by reviewing the scope of work can
the variation in cost be understood. Recent jackup upgrades have ranged between
2.4 Upgrade Market 41

$10 and $30 million and include painting, drilling equipment change-outs, new
accommodations, piping and electrical system replacement, and leg and spudcan
repair work (Table 2.7). Upgrade costs can exceed $50 million but at higher prices
many firms choose to newbuild rather than upgrade [12].
Floater upgrades vary significantly in price depending on the type of upgrade
(Tables 2.8 and 2.9). Complete rebuilds using the existing hull cost $300–$350
million and replace nearly all other components. Minor upgrades costing $10–$50
million include survey work, helideck addition, quarters replacement, piping instal-
lation, and structural modifications. At the mid-range, $75–$150 million will buy
increased variable load, new accommodations and equipment. The 2010 upgrades
of Noble’s drillships Roger Eason and Leo Segerius are representative. For $152
million, new stern blocks were added to both vessels, over 85 % of the marine
operating systems were replaced, derricks were refurbished, top drives and cranes
were replaced, and the dynamic positioning system power was increased.
Table 2.6 Major rig
upgrades by shipyard,
2009–2010
Shipyard Nation 2009 2010
Lamprel UAE 3 8
Keppel Singapore 2 2
Keppel Brazil 3
Keppel Netherlands 1 2
Hindustan India 1
Keppel Philippines 1
L&T Oman 1
Aker Norway 1
Sembawang Singapore 1
Others 3
Total 13 16
Source: Offshore Magazine [13]
Table 2.7 Jackup upgrade contracts
Customer Shipyard Year
Cost
(million $) Scope
Ensco Lamprell 2008 14.8 Steel renewal, leg repairs, accommodation
upgrade, piping renewal, painting
National Drilling Drydocks 2010 20 Life extension
GSP Lamprell 2010 12 Upgrade electrical, drilling equipment,
accommodation refurbishment
Japan Drilling Lamprell 2010 11.8 Refurbishment
Aban Offshore ABG 2011 13.2 Steel renewal, replacement of equipment
Gulf Drilling Keppel-Qatar 2011 16.2 Major upgrade
Millennium Lamprell 2011 27.5 Conversion to accommodation unit
Source: Industry press
42 2 The Five Offshore Drilling Rig Markets
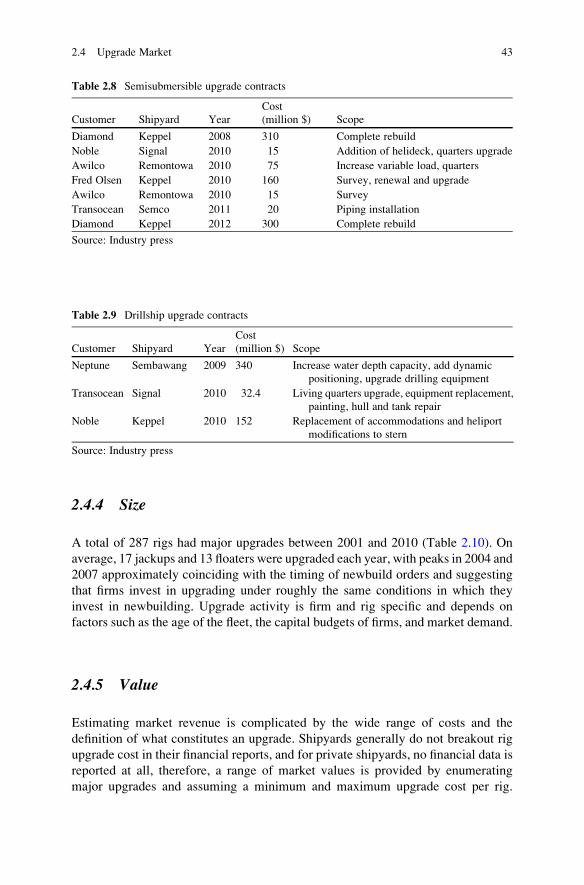
2.4.4 Size
A total of 287 rigs had major upgrades between 2001 and 2010 (Table 2.10). On
average, 17 jackups and 13 floaters were upgraded each year, with peaks in 2004 and
2007 approximately coinciding with the timing of newbuild orders and suggesting
that firms invest in upgrading under roughly the same conditions in which they
invest in newbuilding. Upgrade activity is firm and rig specific and depends on
factors such as the age of the fleet, the capital budgets of firms, and market demand.
2.4.5 Value
Estimating market revenue is complicated by the wide range of costs and the
definition of what constitutes an upgrade. Shipyards generally do not breakout rig
upgrade cost in their financial reports, and for private shipyards, no financial data is
reported at all, therefore, a range of market values is provided by enumerating
major upgrades and assuming a minimum and maximum upgrade cost per rig.
Table 2.8 Semisubmersible upgrade contracts
Customer Shipyard Year
Cost
(million $) Scope
Diamond Keppel 2008 310 Complete rebuild
Noble Signal 2010 15 Addition of helideck, quarters upgrade
Awilco Remontowa 2010 75 Increase variable load, quarters
Fred Olsen Keppel 2010 160 Survey, renewal and upgrade
Awilco Remontowa 2010 15 Survey
Transocean Semco 2011 20 Piping installation
Diamond Keppel 2012 300 Complete rebuild
Source: Industry press
Table 2.9 Drillship upgrade contracts
Customer Shipyard Year
Cost
(million $) Scope
Neptune Sembawang 2009 340 Increase water depth capacity, add dynamic
positioning, upgrade drilling equipment
Transocean Signal 2010 32.4 Living quarters upgrade, equipment replacement,
painting, hull and tank repair
Noble Keppel 2010 152 Replacement of accommodations and heliport
modifications to stern
Source: Industry press
2.4 Upgrade Market 43

Jackup upgrades are estimated to cost at least $10 million and floater upgrades at
least $75 million; at a maximum, jackup and floater upgrade costs are estimated as
$25 and $250 million. Upgrade costs for individual rigs may fall outside of this
range. Under these assumptions, the upgrade market is estimated to have an average
value between $1 and $3.4 billion per year.
2.5 Secondhand Market
2.5.1 Measures
The secondhand market is measured by the number, value and type of transactions
that occur. Rigs sold on the secondhand market may be part of the legacy fleet or
newbuilds; units may be sold through mergers, liquidations, or private transactions;
rigs may be sold with or without an existing contract backlog; and buyers may
continue to use the vessel as a rig or may convert it to another use.
Transactions are conducted for a wide variety of reasons. In some cases, firms
sell rigs due to bankruptcy. For example, Hercules purchased 20 rigs from Seahawk
in 2011 for $105 million. Another example is Seadrill’s purchase of a Petroprod
rig from Sembcorp in 2010. In this case, Petroprod ordered a rig from Sembcorp,
but entered bankruptcy before construction was finished. Sembcorp completed
construction and sold the rig to Seadrill. In other cases, firms sell rigs to eliminate
non-core assets which frequently involves a large drilling contractor selling older
rigs to a low-spec specialist. For example, in September 2012, Transocean agreed to
sell 38 shallow water rigs to Shelf Drilling International Holdings for $1.05 billion
as part of its strategy to focus on the high-end market.
Rigs may be obtained through merger activity such as Seadrill’s purchase of
Scorpion in 2010, Transocean’s purchase of Aker Drilling in 2011, and Noble’s
purchase of Frontier in 2010. However, the distinction between a secondhand
transaction and a merger is ambiguous. For example, Ensco’s purchase of Pride
Table 2.10 Number of major
upgrades and estimated
market value, 2001–2010
Jackups Floaters Total Value (billion $)
2001 8 7 15 0.6–1.9
2002 32 10 42 1.0–3.3
2003 15 12 27 1.0–3.3
2004 22 15 37 1.3–4.3
2005 9 9 0.1–0.2
2006 13 20 33 1.6–5.3
2007 36 29 65 2.5–8.1
2008 18 18 36 1.5–4.9
2009 9 4 13 0.4–1.2
2010 11 5 16 0.5–1.5
Total 172 115 287 10.1–34.3
Source: Offshore Magazine [13]; Authors calculations
44 2 The Five Offshore Drilling Rig Markets

in 2010 and Transocean’s purchase of Global Sante Fe in 2007 are typically
considered mergers by market tracking services and are not included in secondhand
market data. Mergers of similarly sized companies are not considered secondhand
transactions, while mergers between a larger and smaller firm are often considered
secondhand transactions.
2.5.2 Players
Hercules and Seadrill have been the most frequent buyers in the secondhand market
in recent years, while Transocean has been the most frequent seller (Table 2.11).
Seadrill has targeted newbuild and high-spec rig purchases, while Hercules has
focused on less expensive, low-spec units as an alternative to newbuilding.
Transocean has been active in divesting older rigs, particularly jackups.
The newbuild market allows firms to add capacity, but the secondhand market is
critical to matching fleets to business strategies. For firms focused on the high
specification market, the secondhand market provides a means to divest older
assets. For firms focused on lower specification rigs, the secondhand market is an
economic way to increase fleet size and gain market share.
2.5.3 Prices
Secondhand prices range widely due to differences in rig age and factors related to
the buyer and seller and market conditions at the time of sale (Table 2.12). The
minimum value of a rig on the secondhand market is $5 million which is approxi-
mately equal to the scrap value of a unit. Low-priced transactions are frequently
scrap sales or conversions.
Table 2.11 Number
of transactions in the
secondhand market for
select firms, 2005–2010
Firm Buyer Seller
Hercules 7 4
Seadrill 8 3
Transocean 10
Songa 4 4
Noble 6
Ensco 1 4
Rowan 3 2
Diamond Offshore 1 4
Maersk 2 3
Aban 3 1
Saipem 4
Source: Data from RigLogix [16]
Note: Transactions frequently involve multiple rigs of different
quality and classes
2.5 Secondhand Market 45
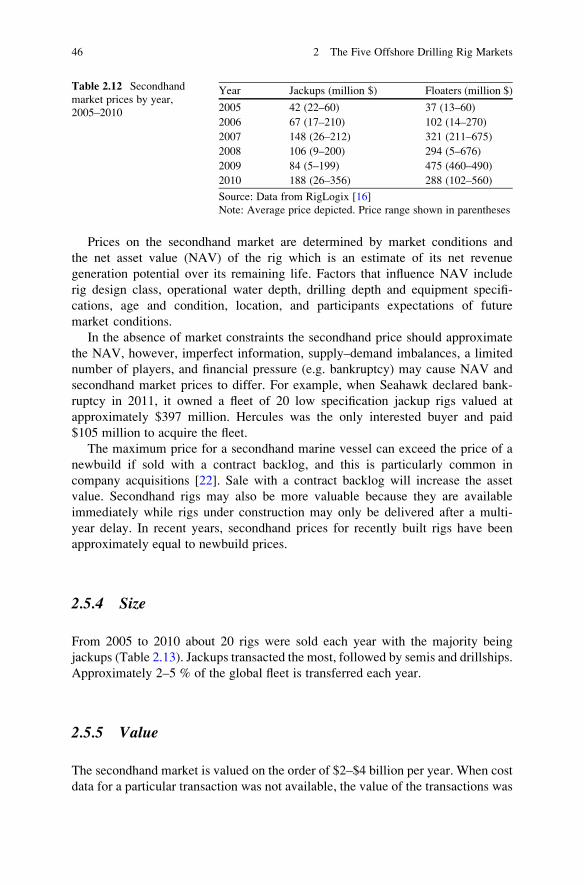
Prices on the secondhand market are determined by market conditions and
the net asset value (NAV) of the rig which is an estimate of its net revenue
generation potential over its remaining life. Factors that influence NAV include
rig design class, operational water depth, drilling depth and equipment specifi-
cations, age and condition, location, and participants expectations of future
market conditions.
In the absence of market constraints the secondhand price should approximate
the NAV, however, imperfect information, supply–demand imbalances, a limited
number of players, and financial pressure (e.g. bankruptcy) may cause NAV and
secondhand market prices to differ. For example, when Seahawk declared bank-
ruptcy in 2011, it owned a fleet of 20 low specification jackup rigs valued at
approximately $397 million. Hercules was the only interested buyer and paid
$105 million to acquire the fleet.
The maximum price for a secondhand marine vessel can exceed the price of a
newbuild if sold with a contract backlog, and this is particularly common in
company acquisitions [22]. Sale with a contract backlog will increase the asset
value. Secondhand rigs may also be more valuable because they are available
immediately while rigs under construction may only be delivered after a multi-
year delay. In recent years, secondhand prices for recently built rigs have been
approximately equal to newbuild prices.
2.5.4 Size
From 2005 to 2010 about 20 rigs were sold each year with the majority being
jackups (Table 2.13). Jackups transacted the most, followed by semis and drillships.
Approximately 2–5 % of the global fleet is transferred each year.
2.5.5 Value
The secondhand market is valued on the order of $2–$4 billion per year. When cost
data for a particular transaction was not available, the value of the transactions was
Table 2.12 Secondhand
market prices by year,
2005–2010
Year Jackups (million $) Floaters (million $)
2005 42 (22–60) 37 (13–60)
2006 67 (17–210) 102 (14–270)
2007 148 (26–212) 321 (211–675)
2008 106 (9–200) 294 (5–676)
2009 84 (5–199) 475 (460–490)
2010 188 (26–356) 288 (102–560)
Source: Data from RigLogix [16]
Note: Average price depicted. Price range shown in parentheses
46 2 The Five Offshore Drilling Rig Markets

estimated based on the age of the rig, its water depth capability, and the average cost
of similar transactions during the year. High market value in 2010 was due to three
transactions: the purchase of Skeie Drilling by Rowan, the purchase of Scorpion by
Seadrill, and the purchase of Frontier by Noble. Each of these transactions exceeded
$1 billion.
2.6 Scrap Market
2.6.1 Measures
The scrap market is characterized by the annual number of transactions and their
prices. Cold- and dead-stacked rigs are sold to specialized shipbreaking firms for
dismantling and recycling [8]. Rigs may be scrapped after being damaged in a
hurricane if toppled offshore, or may be economic to repair and re-enter the fleet
(Fig. 2.8). When rigs are scrapped following damage, a marine salvage firm is
contracted to remove the rig to the owner’s shipyard.
2.6.2 Players
Rig scrapping is a small part of the larger ship breaking industry concentrated in
India, Pakistan, China, Turkey and Bangladesh [14, 19]. Shipbreaking in the U.S. is
primarily driven by disposal of U.S. Navy ships and other federal vessels and very
little rig hull deconstruction occurs domestically [20]. The firms most likely to
process scrapped rigs in the U.S. are located along the Brownsville, Texas ship
channel: Esco Marine, International Shipbreaking, Marine Metals and All-Star
Metals.
Table 2.13 Rigs sold and market valuation in the secondhand market, 2005–2010
Year Jackups Semis Drillships Total Value (billion $)
2005 9 5 1 15 0.5
2006 20 10 1 31 2.1
2007 13 6 3 22 3.7
2008 10 3 1 14 2.2
2009 10 3 0 13 2.0
2010 20 4 7 31 6.8
Total 82 31 13 126 17.3
Source: Data from RigLogix [16]; Authors calculations
2.6 Scrap Market 47

2.6.3 Prices
Vessels are sold to ship breaking firms directly or via brokers on a per ton basis and
the value of a vessel will principally depend on its weight, the scrap metal price at
the time of sale, the labor required to dismantle the unit, and the transport cost
[9]. Most of the value in an obsolete rig lies in the drilling equipment which is
removed and sold before the rig is scrapped [3].
In 2010 and 2011, Hercules sold five jackups for scrap ranging between $1 and
$5 million with an average price of $2.5 million, consistent with scrap steel prices
in the range of $300–$550 per ton. In some cases, scrapping may result in a net cost
for contractors. In 2008, for example, the Texas General Land Office contracted
Cleveland Wrecking Company to remove the jackup rig Zeus in the Freeport Ship
Fig. 2.8 The Ocean Warwick grounded near Dauphin Island, Alabama following Hurricane
Katrina was repaired and re-entered the fleet (Source: Smit)
48 2 The Five Offshore Drilling Rig Markets

Channel. The Cleveland Wrecking Company was paid $1.75 million in addition to
the value of the scrap steel.
2.6.4 Size
Rigs are removed from the fleet when converted to another use, when lost due to
accidents or catastrophic events, or when sold into the scrap market. Conversion to
another use is usually more profitable than scrapping, but the option may only be
available sporadically. In addition, because storage costs are relatively low, there is
little incentive for contractors to retire rigs from the fleet and a large number of dead-
stacked rigs are in storage awaiting final disposition. As a result, rigs are rarely
scrapped unless they have sustained significant damage from storms, blowouts or
other accidents. Between 2005 and 2011, just seven rigs in the U.S. were sold for
scrap [16].
2.6.5 Value
Given the small number of rigs scrapped each year and their low value, the size of
the scrap market is for all practical purposes negligible relative to the other rig
markets. In many years, no rigs are scrapped, and when rigs are scrapped the value
of transactions are based on the rig weight and scrap metal price at the time of sale,
rarely exceeding $5 million per unit. The average size of the market is estimated to
be less than $50 million annually.
As the legacy fleet continues to age, scrapping activity will increase and the
market may grow, and since many aging rigs are in the GOM, most of these rigs are
likely to be processed by U.S. ship recyclers. While costs at U.S. ship recyclers
are high relative to world costs, they will likely be sustained by the high costs to
transport a rig from the GOM to Asia.
References
1. Association of Singapore Marine Industries (ASMI) (2011) Anchored in Singapore history: the
story of the marine industry. http://www.asmi.com/index.cfm?GPID¼31. Accessed 15 June
2012
2. Cole JC (1995) Replacement cost economics of offshore drilling rigs. Paper presented at the
SPE/IADC Drilling Conference, Amsterdam, 28 Feb–2 Mar 1995. SPE 28197-MS
3. Colledge KG (1994) The scrap and sale of six long-term stacked MODU’s. Paper presented at
the SPE/IADC Drilling Conference, Dallas, 15–18 Feb 1994. SPE 27442-MS
4. Corts KS (2008) Stacking the deck: idling and reactivation of capacity in offshore drilling.
J Econ Manag 17:271–294
References 49
5. Douglas-Westwood (2009) The world offshore drilling spend forecast: 2009–2013. Douglas-
Westwood, Canterbury
6. Dupuis D, Hancock S (2008) Ad-equation between a second generation semi and drilling
extended reach well in Tunisia. Paper Presented at the IADC/SPE Drilling Conference,
Orlando, 4–6 Mar 2008. IADC/SPE 112564
7. Grant P, Pangarkar S (1997) Rig modifications enhancing capabilities of third generation
semis. Paper presented at the SPE/IADC drilling conference, Amsterdam, 4–6 Mar 1997.
SPE/IADC 37661
8. Kaiser MJ (2008) A review of ship breaking and rig scrapping in the Gulf of Mexico. Ocean
Dev Int Law 39:178–199
9. Kaiser MJ, Pulsipher AG (2009) Scrap and storage markets in the Gulf of Mexico-II disposal
alternatives. Energy Sources, Part B 4:429–438
10. Kaiser MJ, Snyder B (2013) Capital investment and operational decision making in the
offshore contract drilling industry. Eng. Economist 58(1):35–58.
11. Lawrence SD, Gabrielsen G (1989) Forecast and review: offshore rig activity. Paper presented
at the SPE/IADC Drilling Conference, New Orleans, 28 Feb–3 Mar 1989. SPE/IADC 18644
12. Maksoud J (2002) Drilling companies strategize to navigate a capricious marketplace.
Offshore 63:96–98
13. Offshore Magazine (2001–2010) Worldwide MODU construction/upgrade survey. http://
www.offshore-mag.com/surveys.html. Accessed 10 June 2012
14. Paris C, Mukherji B (2013) A scrap over ‘beaching’ old ships. Wall Str J 13 June:B1
15. Rankin D (1981) The economics of the offshore contract drilling industry: implications for the
operator. Paper presented at the SPE Annual Technical Conference and Exhibition, San
Antonio, 4–7 Oct 1981. SPE 10329
16. RigLogix (2011) RigLogix: upstream intelligence system. www.riglogix.com. Accessed
30 May 2011
17. Robertson J (2003) Mobile offshore jackup units: a new innovation for the next frontier in the
Gulf of Mexico – deep drilling for natural gas on the shelf. Paper presented at the SPE Annual
Technical Conference and Exhibition, Denver, 5–8 Oct 2003. SPE 84356
18. Rystad Energy (2011) INTSOK annual market report (2012–2015). Norway
19. Saraf M, Stuer-Lauridsen F, Dyoulgerov M, Bloch R, Wingfield S, Watkinson R (2010) Ship
breaking and recycling industry in Bangladesh and Pakistan. The World Bank Washington
58275-SAS
20. Sawyer JF (2002) Shipbreaking and the north–south debate: economic development or envi-
ronmental and labor catastrophe. Penn St Int Law Rev 20:535–555
21. Snyder DL, Childers MA (1989) Offshore drilling rig modifications for deep well drilling: a
systematic and economical approach. Paper presented at the SPE/IADC Drilling Conference,
New Orleans, 28 Feb–3 Mar 1989. SPE 18662
22. Tsolakis SD, Cridland C, Haralambides HE (2003) Econometric modeling of second-hand ship
prices. Marit Econ Logist 5:347–377
23. Wahlberg M, Williams S (2010) Drilling rig updated with prepackaged “shipyard in a box”.
Offshore 70:60–61
50 2 The Five Offshore Drilling Rig Markets

http://www.springer.com/978-1-4471-5151-7