C h i l i (C a p s i c u ms p p . ) F o o d C h a i n A n a l y s i s : Setting Research Priorities...
260
Transcript of C h i l i (C a p s i c u ms p p . ) F o o d C h a i n A n a l y s i s : Setting Research Priorities...


Chili (Capsicum spp.) Food Chain Analysis:
Setting Research Priorities in Asia
Mubarik Ali(Editor)

AVRDC – The World Vegetable Center is an international not-for-profit organization committed to ensuring the world’s food security through research, development, and training.
AVRDC – The World Vegetable CenterP.O. Box 42, Shanhua, Tainan, Taiwan 74199, ROCTel: +886-6-583-7801Fax: +886-6-583-0009E-mail: [email protected]: http://www.avrdc.org
© 2006 AVRDC – The World Vegetable CenterISBN 92-9058-149-2
Ali, M. (ed.). 2006. Chili (Capsicum spp.) Food Chain Analysis: Setting Research Priorities in Asia. Shanhua, Taiwan: AVRDC – The World Vegetable Center, Technical Bulletin No. 38, AVRDC Publication 06-678. 253 pp.
*For more information contact Dr. Mubarik Ali, Agricultural Economist, AVRDC at <[email protected]>.
Publication Coordinator: Dr. Kathryn HamiltonEnglish Editor: Ms. Fezoil Luz DecenaEditorial Assistance: Ms. Christie ClaveroCover Design and Layout: Ms. Ivy PerochoPhoto Calibration and Editing: Mr. Ming-che ChenPhotos: Dr. Usman Mustafa and Dr. Paul Gniffke

Chili (Capsicum spp.) Food Chain Analysis:
Setting Research Priorities in Asia
TABLE OF CONTENTS
Foreword ii
Acknowledgement iii
Chili Fact Sheet in Asia iv-vi
Chili (Capsicum spp.) Food Chain Analysis for Setting Research Prioritiesin Asia: A Synthesis 1-56MubarikAli People’s Republic of China 57-96YongLiu,ZhanhongZhang,XinqiuTan,Mei-hueyWu,andMubarikAliIndia 97-144MaravalaluChandreGowda,Mei-hueyWu,andMubarikAli Indonesia 145-196UsmanMustafa,MubarikAli,andIr.HenyKuswanti
Thailand 197-245UsmanMustafa,MubarikAli,ThongchaiSatapornvorasak,andOrasaDissataporn

Foreword
Chili is an important commodity used as a vegetable, spice, medicinal herb, andornamentalplantbybillionsofpeopleeveryday.Itisalsousedasaningredientinindustrialproducts.Thediversityinitsuses,formsandshapesbringscomplexityintoitsproductionand distribution systems. Such diversity makes it difficult to implement a commodity-basedresearchanddevelopmentagenda,especiallyattheinternationallevel,sincethiswouldrequireinformationonallaspectsasthecommodityisproducedinthefarmers’field and moves to the consumers’ table. Understanding how various ecosystems and socioeconomicfactorsinteractinitsproduction,distribution,andconsumptionsystemsarealsoofutmostimportance.ThisstudyprovidessuchinformationbyanalyzingthechiliindustryatthevariousfoodchainlevelsinfourselectedmajorchiliproducingcountriesofAsia:China, India, IndonesiaandThailand.Extensivesurveysanddiscussionsofvariousstakeholdersinvolvedinthechilifoodchainwereconductedinthesecountries.Understanding the diversity in the ecosystem where these surveys were conducted is necessarytoappreciatetheroleofenvironmentalandsocioeconomicfactorsinthefoodchainstructureitselfaswellastheassociatedresearchanddevelopmentissues.
Thistechnicalbulletinanalyzesrecenttrendsinthechilisectorincludingproduction,trade,price,andpercapitaavailability.Itestimatesthefarmandretailvaluesofchili;provides information on the socioeconomic and physical environments where it isgrown;elaboratesitsproductionsystems,andprioritizestheproductionconstraints.Italsosynthesizesinformationaboutrecenttechnologicalinnovationsintheproductionof modern chili varieties and analyzes the economics of their production, identifies the attributespreferredbyconsumers,producersandmarketingagentsinselectingchiliandits products, depicts the market flow, and quantifies the consumption pattern for chili and its products. The comparative data from the four selected major chili-producing countriesofAsiaprovidesanimportantinsightintothevariationinthesocioeconomicenvironments where it is produced, marketed and consumed. The quantification of theroleofchiliinsocioeconomicdevelopmentisausefulcontributionofthestudy.Iwould like to thank the leaders of GTZ-chili project and all the members of the team forprovidingacomprehensivereviewofthechilisectorandIencourageresearcherstoconductsimilaranalysesforothervegetables.
Thomas A. Lumpkin DirectorGeneral AVRDC–TheWorldVegetableCenter
ii C h i l i ( C a p s i c u m s p p . ) F o o d C h a i n A n a l y s i s : Setting Research Priorities in Asia

iiiC h i l i ( Capsicum spp.) Food Chain Analysis: Setting Research Priorities in Asia
Acknowledgement
ThisreportisanoutcomeoftheresearchconductedundertheSocioeconomicsComponentof the GTZ-chili project of AVRDC-The World Vegetable Center. Our sincere and utmost gratitude goes to the thousands of chili and non-chili farmers and marketing agents who spent hours from their busy schedule with our survey teams to providedetailedinformationregardingtheirproduction,marketingandconsumptionactivities.Weappreciatethepatienceofthesurveyteamsincollectingsuchdetaileddatathatisundoubtedlynoteasytogather,andconvertingtheseintoelectronicform.Thehelpoftheextensionpersonnelineachcountrycoveredbythissurveyisalsoacknowledged.The constant encouragement as well as the logistical support of the GTZ-chili Project ManagerDr.SylviaGreenisalsohighlyappreciated.Withouthersupport,thisstudywould never have been printed. We highly appreciate the comments provided by Dr. Paul Gniffkeontheinitialdraftwhichimprovedthepresentationofthereport.TheauthorsalsoacknowledgethehelpofMs.Mei-huey WuforassistingintheanalysisandMs.Yu-man Liangfortheinitiallayouting.WewouldliketothankDr.KathrynHamiltonfortheoverallcoordinationofthepublication,Ms.FezoilLuzDecenaforEnglishediting,Ms. Christie Clavero for editorial assistance, Ms. Ivy Perocho for preparing the cover page and final layout, as well as Mr. Ming-che Chen for assisting in the publication of thereport.

iv C h i l i ( Capsicum spp.) Food Chain Analysis: Setting Research Priorities in Asia
Parameter (unit) ValueAREA, PRODUCTION, YIELD, AND FARM-LEVEL AVAILABILITYArea planted to chili, 2003 (million ha) 2.5Percentage of the world chili area in Asia, 2003 67Percentage of area Fresh 40.4 Pimento 59.6Total chili production, in 2003 (million t) 22.4Percentage of the world chili production in Asia, 2003 67.8Percentage of chili production, consumed as Fresh 66.7 Pimento 33.3Per ha yield of fresh and green chili, 2003 15.1Per ha yield of pimento (in fresh weight), 2003 5.1Annual average growth rate (%) of chili production, 1991-2003 6.4 Fresh 8.5 Pimento 3.5Annual average growth rate (%) of chili area, 1991-2003 2.7 Fresh 4.7 Pimento 1.7Annual average growth rate (%) of chili yield, 1991-2003 3.7 Fresh 3.8 Pimento 1.8Annual average growth rate (%) of per capita availability of chili, 1991-2003 4.1 Fresh 7.1 Pimento 0.9VALUE OF PRODUCTIONFarm value of chili, 2003 (billion US$) 4.8Percentage of farm value, consumed as Fresh 75.4 Pimento 24.6Retail value of chili (billion US$) 9.5IMPORT AND EXPORT IN 2003Total export of chili from Asia (thousand t) 1,210Total export value of chili from Asia (million US$) 396Total import of chili in Asia (thousand t) 773Total import value of chili in Asia (million US$) 268Export price of chili in Asia (US$ per t) 302
Chili Fact Sheet in Asia

vvC h i l i ( Capsicum spp.) Food Chain Analysis: Setting Research Priorities in Asia
Parameter (unit) ValueImport price of chili in Asia(US$ per t) 346Share of fresh chili in the total value of chili trade in Asia (%) 45Share of fresh chili in the total volume of chili trade in Asia (%) 16Share of fresh chili in the total value of chili trade in the world (%) 83Share of fresh chili in the total value of chili trade in the world (%) 52CHILI IN THE PRODUCTION SYSTEMAverage chili area per farm (ha) 0.72Chili area as a percentage of total area under all crops on chili-growing farms (ha) 36Total farm families engaged in chili production (million) 4.2Total full-time employment in chili production (million workers) 3.8Percentage of chili area intercropped (%) 20ADVANCED MANAGEMENT PRACTICES ADOPTED ON CHILIArea under open pollinated improved variety (% of total area) 15Area under hybrids (% of total area) 50Purchased seed (% of total) 59Seed treatment (% of farmers) 22Soil treatment in the field (% of chili farmer) 23Plowing with tractor (% of parcels) 51Raised bed or furrows (% of parcels) 65Straw and sawdust mulching (% of parcels) 11Plastic mulching (% of parcels) 10Sprinkle irrigation (% of parcels) 2Use of inorganic fertilizer (% of parcels) 96Irrigated parcels (% of parcels) 69Advanced method of inorganic fertilizer application (% of parcels) 70Use of pesticide (% of parcels) 100Number of harvesting 7PER HA FARM LEVEL YIELD OF CHILIHybrid (t) 20.9Open pollinated (t) 16.8Traditional varieties (t) 5INPUT USE IN CHILI PRODUCTIONSeed rate (kg/ha) 1.8Fertilizer (nutrient per ha) 472Manure (t per ha) 11Irrigation (number per ha) 18Pesticide (number of sprays) 20
Cont…, Fact sheet

vi C h i l i ( Capsicum spp.) Food Chain Analysis: Setting Research Priorities in Asia
Parameter (unit) ValueLabor (days per ha) 340 Land preparation (%) 13 Management (%) 51 Harvesting (%) 25 Post-harvesting (%) 11DEVELOPMENT IMPACT OF CHILIAdditional demand for seed (million US$) 150Additional demand for fertilizer (nutrient t) 511Additional demand for labor (million days) 2.49Additional demand for manure (million t) 19Additional demand for pesticide (million US$) 566Additional income generated (billion US$) 3.31Percentage of female labor used in chili cultivation 57.6IMPACT OF PRIVATE/PUBLIC RESEARCH (million US$ in 2003)Consumer surplus 776.9Producer surplus 248.6Total 1,025.5
Note: Chilies (including hot chili and bell pepper) and Jamaica pepper (allspice) are included in "fresh" grouping when they are harvested for consumption as vegetables and not processed into spices; dried or powdered products are considered to be spices and classified as "pimento". All production, yield, and trade quantity data related to pimento were multiplied by four to convert dry weight into fresh output. The study believes that Jamaica pepper has very small contribution to total production and trade.
Cont…,Fact sheet


Chili (Capsicum spp.) Food Chain Analysis for Setting Research Priorities in Asia: A Synthesis
Mubarik Ali
Importance
Depending upon its use, chilies are classified as vegetables, spices, medicinal herbs, or ornamentalplantsindifferentpartsoftheworld.Theycomeindifferentforms,shapes,sizes, and colors. Based on flower and fruit characteristics, cultivated chilies (Capsicumspp.) are classified into five main species, C.annuum,C. frutescens,C.chinense,C.pendulum,andC.pubescens; the first three being the most commonly-grown in Asia.The first species is divided into the non-pungent group, such as sweet bell pepper (used as fresh), and the pungent group called hot chili (used as fresh or dry and powder). The othertwospeciesarealwayspungentandcanbeusedinfreshordryform.Thesizeandcolorofchilivarydependinguponitstypeanduse.Chiliisusedasspice,salad,complementarydish,medicine,industrialproduct,orasdecoration.Itisconsumedinvariousformssuchasfresh,dry,powder,pasteandsauce.Itenhancesfoodpalatability,inducingtheconsumptionofotherfoods.ItisalsorichinVitaminC.ChiliisanimportantcomponentinthecroppingsysteminAsia.Intermsofarea,itisranked as first and third most important vegetable in Asia and the world, respectively (Table 1). Therefore, it has the potential to provide jobs to a large number of people in itsproduction,marketing,processing,anddistributionactivities.
Table 1. Area planted to important vegetables in the world and Asia, 2003
Source: FAOSTAT database.
TheimportanceofchiliintheAsiandietandproductionsystemnecessitatesresearchanddevelopmenteffortsforthesector.However,diversityinproductionandconsumptionacrossregionsaswellasinadequateinformationcomplicatestheseefforts.Thisstudyprovidesacomprehensiveanalysisof the issuesatvarious foodchain levels in fourselected major chili-producing countries of Asia: China, India, Indonesia, and Thailand.
Name of vegetablesArea (000 ha) Relative rank
World Asia World AsiaTotal vegetables 49,948 35,786 - -Green peas 6,509 2,036 1 4Tomato 4,201 2,385 2 2Chili (fresh and pimento) 3,668 2,458 3 1Cabbages 3,188 2,348 4 3Onion dry 3,006 2,025 5 5Cucumber 2,253 1,765 6 6Eggplant 1,647 1,547 7 7

4 C h i l i ( Capsicum spp.) Food Chain Analysis: Setting Research Priorities in Asia: A Synthesis
Objectives
Themainobjectivesofthisstudyweretoanalyzethechilifoodchainattheproduction,distribution, and consumption levels, and to prioritize its socioeconomic, biotic andabiotic constraints. More specifically, the study focused on:
Estimatingtrendsinchiliproduction,percapitaavailability,andtradeinselected major chili-producing countries in Asia;Characterizing chili farmers in comparison with non-chili farmers;Elaboratingmanagementpracticesadoptedinchiliproduction;Identifyingchilidiseases,insectsandweeds,andquantifyingyieldlossesduetoeach;Estimating the economic viability and efficiency of resources used in chiliproductionincomparisonwithcompetingcrops;Prioritize the biotic, abiotic and socioeconomic constraints at various foodchainlevels;Elucidatingthemarketingsystemforchili;Quantifyingtheconsumptionpatternforchilianditsproducts;Prioritizing important chili attributes in selection at the production,consumption,anddistributionlevels;Quantifyingthedevelopmentimpactsofthechilisector;andSuggesting policy measures to improve the efficiency of the sector and expandits poverty-reducing impact.
Data Collection
Toattaintheseobjectives,primaryandsecondarydatawerecollectedinclosecollaborationwithnationalpartnersineachtargetcountry.Secondarydataprovidedinsightsonthetrendsinarea,production,yield,percapitaavailability,regionaldistribution,seasonalityin prices, and international trade in chili. Primary sources collected through production, consumption,andmarketingsurveysprovidedacomprehensivesketchoftheproductiontotheconsumptionchainofthewholechilisector.
ItisexpectedthatthesecountrieswillprovideenoughcoverageandvariationsuchthattheresultscanbeappliedtothewholeofAsia.Wehopethatasaresultofthisanalysisthe efficiency of resource allocation in the chili sector will improve, which will in turn enhance the competitiveness of the sector and help millions of chili-growing farmers andbillionsofchiliconsumersallovertheworld.
AplanningworkshopattendedbyallcollaboratingresearchersofthechiliprojectwasheldinMay2002inBangkok,Thailand.Theworkshopdiscussedsamplingofrespondents,including,samplingsize,samplingtechniqueandstrategy,takingintoconsiderationtheresourcesavailableforthesurvey.
Sampling Design

5Mubarik Ali
Togeneratetherequiredinformation,separateinterviewschedulesweredesignedforeach of the five types of respondents:
- Producers
- Farm housewives
- Urban housewives
- Market agents
- Chili processors
Theinterviewschedulescontainstructuredandunstructuredquestions.AVRDCexpertsprovidedcommentsandsuggestionsbeforetheseweremailedtotheresearchersintheparticipating countries for their additional comments. Pre-testing was done before these were finalized.
One of the major objective of the survey was to identify and prioritize the insects and pests affecting chili production. To help farmers in the identification, colored photographs ofmajorinsectsanddiseaseswereprintedanddistributedtothemembersofthesurveyteam (Appendix 1). The interview schedule for the producers also contained questions on farm-related characteristics; farm management practices; input quantities and cost; outputharvestedbygrade,theirprices,andmarketingchannels;farmers’perceptionof
Survey Method
Each participating country had 250-300 farmers and their husbands/wives as respondents, identified via a purposive three-stage stratified random sampling technique. In the first stage, two to three major chili-growing regions/provinces or states were selected based on theirsharetothetotalchiliareaofthecountry,aswellastheirlogisticalconvenience.Thetotalsamplewasallocatedtoeachregionproportionatetotheirchiliarea.Inthesecondstage, two to five major chili growing districts or administrative units were selected. In the final and third stage, two to three main chili growing villagesfromeachdistrictoradministrativeunitwereselectedwiththeassistanceoftheextensionagents,andvillageleadersinthearea,aswellasresourcepersonsknowledgeableonthesites.
Ten (10) to twenty-five (25) chili farmers were randomly selected in the chosen village depending upon their availability. To compare chili and non-chili farmers, five to ten percent non-chili farmers were also randomly selected from the same village. This sampling methodenabledustobetterunderstandthedevelopmentimpactsofchilicultivation.Farmers’ housewives (defined as anyone responsible for family cooking, regardless of sex)wereinterviewedfordataonconsumption.About40to60urbanhousewiveswerealsorandomlyselectedfromnearby towns.Tounderstand themarketingsystemandthe preferred chili attributes, four to five market agents involved in the collection and marketing of chili from the selected villages and one to two chili-processors in the nearby townswererandomlyselectedandincludedinthesurvey.

production and marketing constraints; and farming-related information sources. Data on cropping patterns and variety were collected at the parcels level (defined as a contingent piece of land under one crop and its variety), but input-output data were collected and analyzedforonlyonemajorparcelofeachchiliandcompetingcrop. Inputuseandeconomicsofchilicultivationwerereportedforthoseparcelscultivatedassinglecroponly.
Theconsumptionsurveysoughtinformationformonthlyconsumptionandexpenditureonvariousfooditems,itemizedconsumptionandexpenditureonvariouschilitypesanditsproductsandtheirsourcesofsupply,consumerpreferencesforvariousattributesofdifferentchilitypesandthepackagingofvariouschiliproducts,andtheirreactioninchanging prices in terms of adjusting consumption (i.e. perceived demand elasticity).
Themarketandprocessingsurveyobtainedinformationonthesupplysources,businessconstraints, and the preferred attributes for various chili types in which they havebusiness.
The questionnaires were translated into the language of the participating country.Interviews were conducted by field enumerators at the respondents’ premises, except in Chinawheretheywereassembledatthecommunitycenters;theenumeratorsdistributedandexplainedthequestionnairestotherespondents,andlatercollectedfromthemoncethese were filled out. A "Survey Orientation Workshop”wasorganizedfortwotothreedays in each country to train the field teams with the sampling procedures, tools and techniquestobeadoptedduringthesurvey.Thisalsohelpedinbuildingteamspiritandenhancingmutualunderstandingamongteammembers.
ThedistributionofthesamplebytypeofrespondentpercountryispresentedinTable2.A total of 1,095 chili-producing farmers, 1,018 chili farmers’ housewives, 150 non-chili farmers, 168 non-chili farmers’ housewives, 212 city household wives, 77 market agents and 19 chili processors were interviewed.
Country Province/ State/ Region Chili
farmerCFHHW* Non-chili
farmerNCFHHW** CHHW+ Market
agentProcessor Total
China Hunan, Sichuan and Guangdong 293 300 29 29 60 45 6 762
Indonesia West, Central and East Java 256 243 50 46 62 16 6 679
India Karnataka and Andhra Pradesh 291 256 41 45 50 5 4 692
Thailand North, North-east & Central Thailand 255 219 30 48 40 11 3 606
Total 1,095 1,018 150 168 212 77 19 2,739
Sample type and size
* CFHHW = Chili farmer household wife; ** NCFHHW = Non-chili farmer household wife;+ CHHW = City household wife.
6
Table 2. Distribution of sample by respondent type and country
C h i l i ( Capsicum spp.) Food Chain Analysis: Setting Research Priorities in Asia: A Synthesis
This study covers only commercial production of chili. Commercial production is defined as a large-scale (>500m2) activity and produced mainly (>75%) for sale. Hence, chili production in the home garden and on the agricultural field sides were not included in thesurvey.Theprojectdoesnothavetheexactestimateofhomegardenproduction,however, it is safely assumed that this will not exceed more than five percent of chili productioninanyofthesurveyedcountry.
Commercial Production
Reporting Procedure
Based on its appearance, chili was first divided into hot-chili and sweet (bell) pepper, irrespectiveoftheconsumptionstyleoftheformerasfreshordried.1Afterconsultingwith breeders in each country, the hot-chili varieties grown by the sample farmers were grouped into hybrids, open pollinated (improved varieties by the public or private sector), and local (unimproved local races). Averages were computed for all variables (such as input use, costs, returns, and others.) and management practices for all four types.2 In countries where sweet pepper-growing farmers were included in the sample, theinputuseandeconomicsofchiliproductionforthesevarietieswerealsoaggregatedinto a category called "hot-chili", and reported separately from sweet pepper. In this report, unless otherwise indicated, the term "chili" is used to represent all of its forms andtypes.
Chili Types
Chili GradesThegradesofchilioutputandtheirrespectivepriceswereestimated.Althoughthesegradesweremainlybasedonfarmers’perception,farmerswerebriefedonthesegradesaccordingtothesetstandardsineachcountry.Nofurtheranalysisbasedongradeswaspursued.
Farm soils were classified into three groups based on farmers’ perceptions rather than laboratory tests. These classifications are light, medium, and heavy soils. Most farmers understoodthesesoilcategoriesintheirbroaderterms.Incasesofconfusion,thefollowingdefinition of soil categories were explained:
Soil Types
“Immediatelyafterheavyrainorirrigationwhenwaterhasjustdrainedoutfromthefield, take some soil and make a ball in your hand. If the ball disintegrates upon opening of the fist, it is light soil. If it stays balled up but disintegrates with a slight touch, the soilismedium.Ifitdoesnotdisintegratewithslighttouch,itisheavysoil".
1 The FAOSTAT-Agricultural data grouped chili based on the final consumption under pimento (FAOSTAT code 689) and green and fresh chilies (FAOSTAT code 0401). Pimento refers to dried hot-chili, while fresh and sweet chili include hot chili consumed as fresh as well as sweet pepper. In our classification sweet (bell) pepper is kept as a separate group from hot-chili.
7Mubarik Ali
2 The word "chili type" and "chili variety" are used interchangeably in this report.

The land type of a farm field was defined into three categories according to its drainage status. These included good, medium, and poor drainage. Well-drained lands are those in which water drains out from the field immediately after a heavy rain; medium-drained are those where water drains out within 24 hours; and poor-drained are those in which water takes more than 24 hours to drain from the field after rain stops. The purpose of comparing the drainage status between chili and non-chili farms was similar tothatofcomparingthesoiltypes.
Drainage Status of the Field
Quantification of Input Use
All the inputsandnumberofoperationsdoneonchilianditscompetingcropswererecordedforonecroppingseason.Incaseswherechiliwasintercropped,inputswereequallydividedforallthecropsplanted.
Fertilizerquantitiesappliedtochilitypesandtheircompetingcropswereconvertedintoactiveingredientsofnitrogen,phosphorus,andpotassiumusingthestandardnutrientconversion rates specific for each fertilizer type available in each country. Total soil nutrients applied were reported on a per ha basis. Organic fertilizer (manure) was not convertedintonutrients,andwasreportedinrawquantities.Applicationofzincwasincludedunderinorganicfertilizer.
Fertilizer and Manure
Pesticide
Pesticide use was reported as number of sprays and raw quantities applied on a per ha basis,andwasnotconvertedintoactiveingredients.
Labor Use by Type
Laboremployedincropproductionwasdividedintofourmajoractivities.Theseare:
• Landpreparationincludesplowing,furrowing,andharrowing; • Cropmanagementincludessowing;inputapplicationsuchasfertilizer (including manure), pesticide, and irrigation; and operations before cropmaturitysuchasweeding,staking,andmulching; • Harvestingincludesharvestingandseedextraction;and • Post-harvest, includes cutting, packing, grading, transporting, and selling (for activitiesperformedonthefarmonly).
Animalsworkingwithhumanlaborwerenotcountedaslabortime.
8
The distribution of soil types was compared between chili and non-chili farms. The purposewastotestifsuchdistributionisafactorintheadoptionofchilicultivationonthetwofarms.
C h i l i ( Capsicum spp.) Food Chain Analysis: Setting Research Priorities in Asia: A Synthesis

Monthly food consumption patterns of all households were quantified to see how chili-growing farmers differ from non-chili growing farmers and urban consumers. Food was dividedintosixmaingroups:cereals,livestockproducts,vegetables,fruits,seaandwaterfood, and others. The classification was made by the housewives. Hence, the classification mayvaryfromcountrytocountry,butwouldbeexpectedtobesimilarwithinagivensurveyarea.Themonthlyfoodconsumptionofthehouseholdwasreportedonapercapitabasisbydividingtotalhouseholdconsumptionbythenumberoffamilymembers.
Consumption by Major Food Groups
Food and Chili Consumption
Per Capita Consumption and Expenditure on Chili
Theconsumptionof chili and itsproductswas studied inmoredetail.Themonthlyconsumptionofandexpendituresfordifferenttypesofchilianditsproductswerereportedonapercapitabasisbydividingthesebythenumberoffamilymembersstayinginthehouse.
Demand Elasticities
Thedemandelasticity forchiliwasestimated through the farmers’perceptionabouttheir willingness to change the quantity of chili consumed with different changes (both increaseanddecrease)inpricelevel,expressedinpercentage.Simpleaveragesoftheseperceptionsweremadeacrossthewholesampletoestimatetheaverageelasticityoverthepricerangeofferedtotheconsumers.
Themacroandsurveydatawereenteredonspreadsheetsbythenationalcollaborator.They were cleaned, processed, and analyzed under the supervision of the senior socio-economistatAVRDC.
Inputquantities,costs,andreturnswereconvertedintoperhabasis.Simpleaverageswere then computed for each chili type and for the aggregate, as well as for the chili-competing crops. Frequencies of parcels receiving important inputs and operations (in percentage)werealsoestimated.
Data Processing and Descriptive Analysis
Trends and Growth RatesLineartrendsinchiliarea,production,andyieldfortheworld,Asia,andthefourselectedcountriesofAsiawerepresentedingraphicalform.Trendsinpercapitaavailabilityatthe farm level (estimated as total production divided by population), imports and exports were also estimated. Their growth rates were estimated by using the log-linear trends.
9Mubarik Ali

Cropping Intensity
Croppingintensityindicatestheextentbywhichcultivatedareawasusedforcropping,andwasestimatedinpercentageasfollows:
CI = {TCA/CA} x100
where
CI =Croppingintensityinpercentage
CA =Totalcultivatedarea
TCA =Areaofallcropsinoneyear
Scoring Orders for Pests and Production Constraints
In the questionnaire, chili farm-respondents were asked to identify the important pests. Respondents were also requested to rank separately the five most important diseases, insects,andweedsaccordingtotheaverageyearlymagnitudeoflossesincurredbyeach.The ranking order of a pest was recorded at the scale of 1-5: 1 being the most important and 5 the least important. The number of farmers who gave the rank of ‘1’, ‘2’, ‘3’, ‘4’, and‘5’foreachpestwerecounted.Theweightedaverageofthesefrequencieswereestimated by assigning the weights of ‘5’, ‘4’, ‘3’, ‘2’, and ‘1’ for each rank, respectively. Thehighestnumberobtainedwasconsideredasthemostimportantpest.
Thiscanbeexpressedinnotationformforthejthpestasfollows:
(1)
where
Wj =Weightedscoreofthejthpest
i = The ranking order (1 the most important rank and 5 the least important)
Xi =Frequencyoffarmerswhogavetheithranktothejthpest
Di = Weight of the ith rank, which is 5 for i=1, 4 for i=2, and so on.
Thehighertheweightedscoreofapest,thegreaterisitsimportance.Thesamemethodologywasusedinrankingthedifferentproductionconstraintsinchilicultivation.
∑=
=5
1.
iijij DXW
10 C h i l i ( Capsicum spp.) Food Chain Analysis: Setting Research Priorities in Asia: A Synthesis

Individual Input Costs
Theindividualcost itemsincludelabor,seed,fertilizer,manure, irrigation,pesticide,structures, and others (including land rent, taxes, and interest). Individual inputs are either purchased or family-owned. The family-owned inputs are valued at the market opportunity cost in the same village, district, province, or the whole sample leveldependingupontheavailabilityofthesemarketprices.Theindividualinputcostnotonlyincludesmarketprice,butalsoitsmarketandtransportationcost.Applicationcostwasincludedinthelaborcost.Thecostofirrigationwaterwasevaluatedatitsmarketrate if it is from the family-owned pump and charges or taxes paid to government for waterifitisfrompubliccanalorpump.Landrentwasestimatedbasedonthelengthoftimethecropwasplantedandalsothatofanothercropfortheremainingperiodoftheyear,ifany.Interestoncashcostwasincludedbasedontheprevailinginterestrateinthesurveyareaandthecropduration.
Total and Cash Cost
Totalproductioncostforeachcropwasestimatedbyaddingtheindividualcostitems.Cashcostincludesthecostoffertilizersandchemicals,hiredlabor,purchasedseedsandmaterials,andirrigation.Inthecountryreports,thecostwasreportedintheirlocalcurrency. For comparison purpose, these were converted into US dollars in the Synthesis chapter. The share of each cost item (factor share) in the total cost was estimated in percent.Thefactorsharesforlabor,seed,fertilizer,manure,irrigation,pesticide,andothers (including staking, mulching, land, and interest rate) were computed. In estimating theseshares,thecostoflaborusedtoapplyaninputwasexcludedandwasaggregatedintothelaborcost.
Gross and Net Revenues
Gross revenue was estimated as outputs (main and by-products) produced from a piece of land in a season multiplied by their respective market prices. Parallel to opportunity cost of family-owned inputs, family-consumed outputs were evaluated at their respective averagemarketpricesinadistrict,province,orwholesample.Netrevenueisestimatedasgrossrevenuelesstotalcosts.
Economic Efficiency in Production
Various measures of economic efficiency used in this study were:
•Input use efficiency or partial input productivity (PIP).Thisisestimatedas:
PIP = ( GR – VC ) / Q (2)
where GR=perhagrossrevenue
11Mubarik Ali

VC = perhavariableinputcost
Q=perhainputquantity.
Inestimatingthepartialproductivityofvariableinputs,saylabororfertilizer,thecostof all other inputs is assumed fixed; only the cost of that input is considered variable.
• Benefit-cost ratio. This was estimated as net return (as defined above) divided by all costs multiplied by one hundred. The costs of all inputs including family-owned resourcesweretreatedasvariableinthiscase.
• Costperunitofoutput.Thiswasestimatedasperhacostdividedbyperhayieldin kilograms. It is used to compare the relative efficiency of different chili types withinandacrosscountries.
Risk in Production
Risk in chili production was quantified by estimating the coefficient of variation (CV) oftheperhayield.Forcomparisonpurposes,theCVswereestimatedseparatelyforeach chili types.The CVs of major competing crops in the sample area were alsocompared.
Statistical Tests
Frequencies across crop and farmer groups were compared using the Chi-Square (χ2)Test. Farm characteristics of chili and non-chili farms having continuous parameter valueswerecomparedusingunpairedt-test. Per ha yield, input use, costs, and partial productivityofvegetableswerecomparedacrosschilivarietiesandaverageofchiliwithcompetingcropsusingthesamet-test. These parameters for major competing crops were also compared across farm types, i.e., chili and non-chili farms.
Estimation of Consumer and Producer Surplus
TheMarshallianconceptsofconsumerandproducersurpluscanbeappliedtoquantifythe welfare generated through research and development, in this case chili varietiesin a year, 2003. As a result of high-yielding technology developed by research, the aggregate supply curve in Figure 1 shifts from S0 toS1.Assuming linearsupplyanddemandfunctionsandaclosedeconomyregime3,aparallelshiftinthesupplycurvewillproduceachangeintheconsumers’surplusbytheareaP0abP1.Thesamesupplyshiftwillcauseachangeintheproducers’surplusbytheareaP1bI1minusP0aI0.Thetotal economic surplus (producers’ plus consumers’ surpluses) will be the shaded area ofaI0I1b.Theseeffectsduetotechnologicaldevelopmentcanbeexpressedalgebraicallyas follows (Alston et al. 1995):
3 Only a small proportion of chili production (3-4%) is traded in the world market. Moreover, estimates of the supply and demand elasticities for the global market, required in the estimation, are not available.
12 C h i l i ( Capsicum spp.) Food Chain Analysis: Setting Research Priorities in Asia: A Synthesis

Consumers’surplus=ΔCS=P0Q0Z (1+0.5Zη ) (3.1)
Producers’ surplus =ΔPS = P0Q0(k-Z)(1+0.5Zη ) (3.2)
Totalsurplus=ΔTS=ΔCS+ΔPS=P0Q0k(1+0.5Zη ) (3.3)
whereP0 andQ0 are original price and quantity (without technological innovation), respectively,Z=kε/(ε+η)isthedecreaseinpriceafterthesupplyshift,ηandεaretheabsolutevaluesofdemandandsupplyelasticities,respectively,andkisthedownwardverticalshiftinthesupplycurveexpressedasaproportionoftheinitialprice.ThekisestimatedastheproductofpcA,wherepistheprobabilityofsuccess,cisthenetpercentage decrease in the cost of producing one unit of output (cost saving per output equaltocpercentofinitialprice),andAistheadoptionrate.
In the above specifications of 3.1-3.3, the data for chili production and its prices beforetechnicalinnovationsareneeded,i.e.,productionandpriceshadtherebeennoinnovations.However,thesedataweregatheredwhenmodernvarietieshadalreadybeenintroduced.Theproductionandpriceswithoutinnovationswereestimatedbyspecifyingthelinearsupplyanddemandfunctionforafterinnovationperiodasfollows:
Supplyfunction:Qs1=a0 + β1PP1 (3.4)Demandfunction:Qc1 = γ0 + δ1PC1(3.5)
13
Source: Alston, J.M., G.W. Norton and P.G. Pardey. 1995. Science under Scarcity: Principles and Practice for Agricultural Research Evaluation and Priority Setting. Ithaca, NY: Cornell University Press.
Figure 1. A supply and demand model to measure the impact of modern technologies
Price
F
P0
P1
d
I0
I1
0
K
Q0 Q1 Quantity/Year
S0
S1
D
a
e
c
b
Mubarik Ali

Allparametersintheseequationsareforaftertheinnovationperiod.Theestimatedslopeandinterceptparametersoftheseequationsareasfollows:
Slopeofsupplyfunction (β1)=ε*Q1/PP1 (3.6)
Intercept of supply function (a1)=(1 - ε)*Q1 (3.7)
Slope of demand function (δ1)= η*Q1/PC1 (3.8)
Intercept of demand function (γ1)=(1 - η)*Q1 (3.9)
whereQs1andQc1 are quantity produced and consumed with innovations (they will be equalintheequilibriumsituation,soconnotedbyQ1inthelaterequations),respectively,ηandε are demand and supply elasticities as defined before, PP1 isproducers’priceandPC1is consumers’ price both after the innovations (the values of all these parameters except theslopeandinterceptofsupplyanddemandcurveswereeitherknownorassumed),so equation 3.6-3.9 can be solved for β1,a1,δ1,and γ1.Afterestimatingtheslopeandintercept of the supply and demand functions (with innovations), a1 was multipliedwith (1-k)togenerateaparallelsupplyfunctionbeforetheinnovations,whiledemandcurveandslopeofthesupplycurvewereassumedtobethesamebeforeandaftertheinnovation.Thesupplyanddemandfunctionsbeforetheinnovationswerethensolvedforthepriceandquantitywithoutinnovations.
Macro Data Analysis and TrendsThe analysis in the following section is based on FAOSTAT-Agricultural Data (Agricultural Production-Crops Primary, and Agriculture & Food Trade-Crops and Livestock Primary & Processed).
Extent and Spread of ProductionChili is cultivated on 3.7 million ha worldwide, producing about 33 million t in fresh weight output. About two-thirds of this area and production come from Asia. The annual farm value of chili production in Asia is estimated at US$4.8 billion. With the estimated ratiooffarmtoretailpricesattwo,theretailvalueofchilianditsproductsinAsiastandsat around US$ 9.6 billion.
About 45% of the world chili area grows the product that is freshly-consumed without anyprocessingordrying.Whenproductionofdryorgroundchiliisconvertedintofreshweight, the freshly consumed chili claims about 70% share in production. The area and production shares of this form of chili are almost equally divided in Asia (Table 3).
14 C h i l i ( Capsicum spp.) Food Chain Analysis: Setting Research Priorities in Asia: A Synthesis

Chili type Country/region Area1 (ha) Fresh production1 (t) Yield1 (t/ha) Value (000 US$)2
Fresh China 602,593 11,528,723 19.13 944,455Turkey 88,000 1,790,000 20.34 567,721Indonesia 176,264 552,679 3.14 593,568Korea (South) 63,150 350,174 5.55 148,514Japan 3,760 151,300 40.24 336,045Israel 2,300 117,700 51.17 81,168Iran 4,000 105,000 26.25 17,078Korea (North) 25,000 59,000 2.36 5,110Kazakhstan 3,000 54,000 18.00 7,887India 5,500 50,500 9.18 19,620Others 18,741 191,202 10.20 66,285Total for Asia 992,308 14,950,278 15.07 3,638,504Total for World 1,640,830 23,150,381 14.11 -
PimentoIndia 940,000 4,400,000 4.68 775,408China 36,000 920,000 25.56 140,188Bangladesh 169,970 548,000 3.22 101,359Pakistan 48,800 385,600 7.90 57,085Viet Nam 50,000 308,000 6.16 36,297Myanmar 108,000 280,000 2.59 13,098Thailand 24,000 152,000 6.33 17,913Turkey 9,000 80,000 8.89 21,217Nepal 17,500 56,000 3.20 3,958Others 62,108 342,824 5.52 13,226Total for Asia 1,465,378 7,472,424 5.10 1,184,061Total of World 2,027,059 9,926,612 4.90 -
Pimento + freshTotal for Asia 2,457,686 22,422,702 9.12 4,822,565Total for World 3,667,889 33,076,993 9.02 -
1Source: FAOSTAT data. 2Estimated using producers’ prices in 2002 as reported in FAOSTAT data (producer prices-crop primary). Local price units were converted into US$ by using the annual average exchange rate reported on www.fftc.agnet.org (various issues). Missing prices for some countries were approximated from the neighboring country or succeeding year.
Table 3. Area, production, yield and value of fresh and pimento chili by major producing countries of Asia in 2003
15Mubarik Ali

0
10000
20000
30000
40000
World Asia China India
Prod
uctio
n(0
00t)
199119972003
Chili is grown in most Asian countries. The continent contributes about 60% to the total world area and 65% of world production of fresh chili. The major producers are China, Turkey, and Indonesia, contributing an aggregate of around 87% of total area, 93% of production, and 58% of value. Asia also contributes about three-fourths of world area andproductionofpimentochilithatisconsumedeitherasdryorground.Indiaisthemajor producer, contributing about 64% of area and 59% of production. China is the next major producer, followed by Bangladesh and Myanmar (Table 3).
The per ha yield of freshly-consumed chili is higher than pimento with bell type sweet pepper constituting the major share compared to the freshly-consumed hot chili. Wide variationinyieldsofpimentoandfreshchilicanbeobservedacrosscountries.Japanhad the highest yield for fresh chili at 40 t/ha (mainly sweet bell pepper), while North Korea had the lowest yield at 2 t/ha. For pimento, the highest yield is attained in China at 25 t/ha, and lowest in Myanmar, Bangladesh and Nepal at 2-3 t/ha.
Trend in Production
The total world fresh weight production of chili in 2003 was 33.1 million t, up from 18.5 million t in 1991. Of this, 22.4 million t was produced in Asia, a rise from 11.0 million t in 1991 (Figure 2). These trends gave an average growth rate of 5.2% in the world and 6.4% in Asia. Due to these, the share of Asia in chili production increased from 59% to 68% in the same period.
Figure 2. Chili production in Asia and the world in 1991, 1997, and 2003
Source: FAOSTAT-Agricultural Data (Agricultural Production-Crop Primary)
TheincreasecamemainlyfromChinawhereproductionmorethantripledattherateof 9.7% per annum from 3.9 million t in 1991 to 12.4 million t in 2003. India, another major chili producing country, also increased its production from 2.5 million t in 1991 to 4.5 million t in 2003 at an annual rate of 3.7%.
16 C h i l i ( Capsicum spp.) Food Chain Analysis: Setting Research Priorities in Asia: A Synthesis

0
1000
2000
3000
4000
World Asia China India
Area
(000
ha)
1991
1997
2003
In Asia, about 33% of total chili production in 2003 was for pimento. This share, however, was decreasing due to fast increasing trend of fresh-chili production. In 1991-2003, the growth rate in fresh chili production was 8.5%, compared to 3.5% in pimento chili. At the world level, growth rates were 6.7% and 2.6% for fresh and pimento, respectively. The share of pimento was highest in India at 99% in 2003, where growth rates were 1.7% and 3.8%, respectively.
Trend in AreaIn 2003, 3.7 million ha were used for chili cultivation worldwide, an increase from 2.8 million ha in 1991 (Figure 3). Most of this area (2.5 million ha), was in Asia. Sixty and fifty-five percent of the total area were occupied by pimento type in Asia and in the world, respectively. Chili area increased at the annual rate of 2.7% in Asia and 2.4% in theworld.Halfoftheincreaseoftotalproductionworldwidewasduetoexpansioninareaandtheotherhalfduetoyieldimprovement,whileinAsiathecontributionsofareaand yield were at 42% and 58%, respectively. The fresh chili and pimento area increased at annual rate of 4.7% and 1.7%, respectively in Asia.
Source: FAOSTAT-Agricultural Data (Agricultural Production-Crop Primary)
Figure 3. Area under chili in Asia and the world in 1991, 1997, and 2003
DuetosimilartrendsinchiliareainAsiaandtheworld,therelativeshareofAsiaintotalchili area remained about the same at 65-67% in 1991-2003. The major source for the increase in area was China, where expansion was at the rate of 9.5% per annum during the said period. The share of China in total chili area in Asia increased from 12% in 1991 to 26% in 2003. On the other hand, the chili area in India increased only at the rate of 0.5% per annum, hence its share in area decreased from 47% in 1991 to 39% in 2003.
17Mubarik Ali
0
4000
8000
12000
16000
20000
World Asia China India
Yiel
d(k
g/ha
)
199119972003
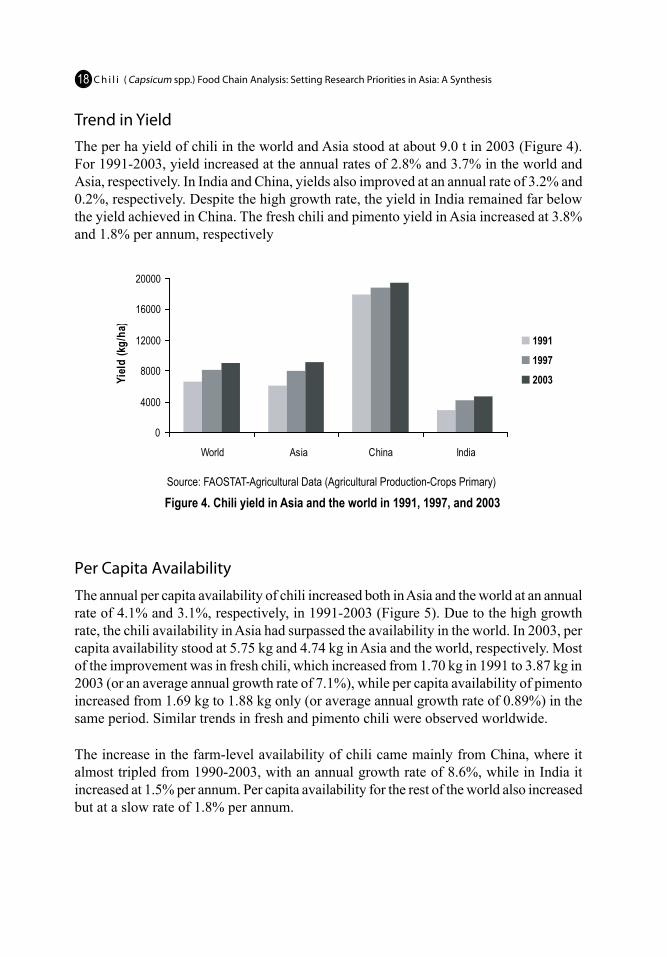
Trend in YieldThe per ha yield of chili in the world and Asia stood at about 9.0 t in 2003 (Figure 4). For 1991-2003, yield increased at the annual rates of 2.8% and 3.7% in the world and Asia, respectively. In India and China, yields also improved at an annual rate of 3.2% and 0.2%, respectively. Despite the high growth rate, the yield in India remained far below the yield achieved in China. The fresh chili and pimento yield in Asia increased at 3.8% and 1.8% per annum, respectively
Source: FAOSTAT-Agricultural Data (Agricultural Production-Crops Primary)
Figure 4. Chili yield in Asia and the world in 1991, 1997, and 2003
Per Capita Availability
TheannualpercapitaavailabilityofchiliincreasedbothinAsiaandtheworldatanannualrate of 4.1% and 3.1%, respectively, in 1991-2003 (Figure 5). Due to the high growth rate, the chili availability in Asia had surpassed the availability in the world. In 2003, per capita availability stood at 5.75 kg and 4.74 kg in Asia and the world, respectively. Most of the improvement was in fresh chili, which increased from 1.70 kg in 1991 to 3.87 kg in 2003 (or an average annual growth rate of 7.1%), while per capita availability of pimento increased from 1.69 kg to 1.88 kg only (or average annual growth rate of 0.89%) in the sameperiod.Similartrendsinfreshandpimentochiliwereobservedworldwide.
The increase in the farm-level availability of chili came mainly from China, where it almost tripled from 1990-2003, with an annual growth rate of 8.6%, while in India it increased at 1.5% per annum. Per capita availability for the rest of the world also increased but at a slow rate of 1.8% per annum.
18 C h i l i ( Capsicum spp.) Food Chain Analysis: Setting Research Priorities in Asia: A Synthesis

0
2
4
6
8
10
World Asia China India
Perc
apita
avai
labi
lity
(kg/
annu
m)
1991
1997
2003
Source: Estimated from the production data reported in FAOSTAT-Agricultural Data (Agricultural Production-Crop Primary), and population reported in FAOSTAT- Agricultural Data (Population)
Figure 5. Per capita availability of chili in Asia and the world in 1991, 1997, and 2003
Trade
Wide variations in producers’ prices (estimated from Table 3 by dividing value with production) for each type of chili can be observed,4 suggesting internationaldisconnectivity of chili markets on one hand, and big profits in trade on the other hand. Tradecanhelp toevenout thesepricesacrosscountriesby loweringprices insomecountrieslikeJapan,Indonesia,andIsraelandincreasingpricesinotherslikeMyanmar,Nepal,andVietnam.
Chili is traded in two forms: fresh green (including hot-chili and sweet pepper) and dry-red or ground (pimento). Asia is net exporter of both types. In terms of value, the sharesofpimentoandfreshgreenchiliinthetotalvaluetradedarealmostthesame;interms of volume, however, pimento (converted into fresh) takes about 83% share in the quantity traded from Asia in 2003. Japan, United Arab Emirates, and Singapore are the majorimportersoffreshgreenchili,whileMalaysia,SriLanka,andThailandarethemajor importers of pimento. On the other hand, China, Israel, and Turkey are the major exportersoffreshgreenchili,whileChinaandIndiaarethemajorplayersintheexportofpimento.
In 2003, a total of about 6.3 million t of fresh weight equivalent chili worth US$5.7 billion was traded internationally (Table 4). In terms of fresh quantity the share of Asia in chili trade was 31%, while it earns only 12% share in traded value implying that lowervaluechiliistradedfromAsia.
4 Some of the variation, of course, is due to difference in quality and water content in fresh output. The variations in producers price are smaller in case of pimento because of its long storability and transportability, and uniformity in output quality.
19Mubarik Ali

0
0.2
0.4
0.6
1991 1992 1993 1994 1995 1996 1997 1998 1999 2000 2001 2002 2003
Year
Price
(US$
/kg)
Import
Export
Year
Asia World trade1
Quantity(000t) Value (mil. US$) Total trade1 Price (US$/t
fresh weight) 2 Quantity Value Price (US$/t fresh weight)2
Import Export Import Export Quantity(000t)
Value (mil. US$) Fresh Pimento (000t) (million
US$) Fresh Pimento
1991 416 471 119 152 887 271 577 283 2,797 2,376 1,304 3951992 517 549 165 178 1,065 343 540 301 3,135 2,660 1,302 4051993 422 639 116 158 1,061 274 583 228 3,179 2,442 1,185 3361994 399 585 110 142 984 253 660 218 3,304 2,778 1,295 3261995 400 622 174 215 1,022 388 720 344 3,549 3,208 1,297 4281996 444 538 218 239 982 457 892 410 3,804 3,386 1,175 4921997 400 591 169 214 991 383 950 303 3,924 3,549 1,263 4291998 427 611 180 200 1,038 380 994 265 4,346 3,835 1,274 3771999 590 640 215 213 1,230 428 1,044 261 4,628 3,703 1,147 3552000 570 694 217 227 1,263 444 1,126 232 4,688 4,002 1,266 3392001 650 868 223 267 1,518 490 1,053 210 5,278 4,287 1,256 3152002 781 1,040 245 288 1,821 533 856 198 6,035 4,388 1,122 2972003 773 1,310 267 396 2,083 664 957 219 6,323 5,710 1,438 322
Growth rate (%) 5.1* 5.9* 6.4* 6.3* 5.6* 6.4* 5.6* -2.6* 6.5* 6.3* -0.1ns -1.9*
Table 4. Trend in international trade in chili, 1991-2003
Source: FAOSTAT data.1 The total trade was estimated as import plus export, both in quantity and value. The import and export quantities of pimento were multiplied by four to convert it into fresh weight equivalent.2 The average price was estimated as value of total trade divided by fresh-weight equivalent quantity of the trade separately for pimento and fresh chili.Note: The * on the growth rate figures imply that the growth is statistically significant, and ns implies that the parameter is not significant at 10% level.
Thetradeinchiliisonasteeprise.Thequantityandvalueofchilitradedinternationallygrew at the annual rates of 6.5% and 6.3%, respectively, from 1991 to 2003 (Table 4). The growthrateinquantityoftradeislowerinAsiathantherestoftheworld.
Source: Estimated from import and export quantity and value data in Table 4.Figure 6. Trend in import and export prices of chili in Asia, 1991-2003
20 C h i l i ( Capsicum spp.) Food Chain Analysis: Setting Research Priorities in Asia: A Synthesis

0
10
20
30
40
50
1991 1992 1993 1994 1995 1996 1997 1998 1999 2000 2001 2002 2003
Year
Perc
entag
esha
re
Value
Quantity
InAsia,thegrowthinquantityofchiliimportswaslowerthanexports,butthegrowthwas similar in terms of value (Table 4). This suggests that export price was falling relative to import price, as reflected by the widening gap in import and export prices since mid 1990’s (Figure 6). This implies that the continent was gaining in comparative advantage ininternationalchilitrade.
Despite the spectacular increase in international chili trade in the 1990s, the share of trade in total chili production was small both in Asia and the world at 8.8% and 19.1%, respectively.This suggests thatmostof the increase in chiliproduction inAsiawasconsumeddomestically.ThissuggeststhatmostoftheincreaseinchiliproductioninAsiawasconsumeddomestically.
Although no significant trend was observed in international chili prices in 1991-2003, bothimportandexportpriceswereonthedecliningtrendsincetheyreachedtheirpeakin 1996 (Figure 6). These trends may reflect improvements in chili production and marketingtechnologies,aswellasfreetraderegime.Ifsuchtrendscontinue,theshareofthecontinentinworldtradeisexpectedtoriseinthenearfutureasinternationaltradebecomesmoreliberalized.
Whattypesofchiliwillbetradedmorethanothersinthefuture?ThepasttrendsinAsiasuggestincreasingsharesoffreshchiliininternationaltradeanddecliningshareofpimento(Figure 7). The share of fresh chili in total quantity traded in Asia increased from 7.8% in 1991 to 15.7% in 2003, while its share in total value traded jumped from 14.7% to 44.8% in thesameperiod.Thehigherincreaseinvaluethaninquantityoffreshchilitradedsuggestsanimprovementinitspricesbothinabsoluteandrelativetermscomparedtopimentochiliprices. The prices of fresh chili traded from Asia (weighted average of import and export prices) steadily increased from US$ 0.58/kg in 1990 to around US$ 0.96/kg in 2003, while the price of pimento (in fresh weight) was fluctuating between US$ 0.20/kg to US$ 0.41/kg during this period without exhibiting any significant trend (Table 4). This also implies that fresh chili is increasingly becoming a high-value product in international market.5
5 These statistics, however, do not point the relative importance of fresh sweet bell pepper and hot-chili sold as fresh.
Figure 7. Share (%) of fresh chili in total chili traded in Asia, 1991-2003.Source: Estimated from import and export quantity and value for pimento and fresh chili trade data of FAO.
21Mubarik Ali

22
Farm Perspective (Summary of Survey Results)
Chili Farm Characterization
Chilifarmershadaverageresources.Theyhadsimilarfarmsfamiliesandhouseholdsizes with the non-chili farmers. Both had more or less the same level of schooling. The proportionofchilifarmerswhoownedwaterpumpforirrigation,aswellasfarmswithlight soils generally recommended for chili cultivation was not significantly higher than the non-chili farmers. Chili farmers were also not cultivating better-drained soils (Table 5).
Table 5. Chili farm characteristics in comparison with non-chili farms in selected chili- producing countries of Asia, 2002
Characteristics China India Indonesia ThailandLarger farm size No Yes No NoLarger family size No No Yes NoBigger house size No No No NoBetter education of household head No No No YesHigher percentage of farmers owning water pumps No No No YesHigher percentage of light soils No No No NoHigher percentage of land with good drainage No No No NoMore number of livestock owned Yes Yes No YesHigher off-farm income Yes - No YesHigher loan obtained - Yes No Yes
Then what makes them different from the non-chili growing farmers? Why do they choose chili cultivation, while others confine themselves to planting subsistence crops like riceorwheat?Twodifferenceswereobserved in this study.First, chili farmershad higher off-farm income than non-chili farmers, except in Indonesia where non-chilifarmersplantedothervegetables.Thisnotonlysuggeststhattheyhadbetterlinkswith the market, but also indicated their ability to take on higher risks. The off-farm cashincomeallowedthemtopurchasecashinputs,andimprovedtheirabilitytobearhighercostforimprovedmanagementpractices,aswellasmaterialssuchasstaking,mulching, etc. The higher off-farm income also improved their link with the markets, enabling them to better understand the input-output price regimes and thus enhanced their market efficiency. Second, chili farmers had better linkage with the government institutes as indicated by their ability to borrow higher amount of loans compared to non-chili farmers (again with the exception of Indonesia). This again indicated their ability tobetterunderstandthelocalinstitutions.Thesecharacteristicsprovidedchilifarmersenough resources and ability to take necessary risks and finances for chili cultivation. Aschilifarmersareopportunityseekers,theyownedmorelivestockthatenabledthemtoearnevenhigherincome.
C h i l i ( Capsicum spp.) Food Chain Analysis: Setting Research Priorities in Asia: A Synthesis
23
Chili in Farming System
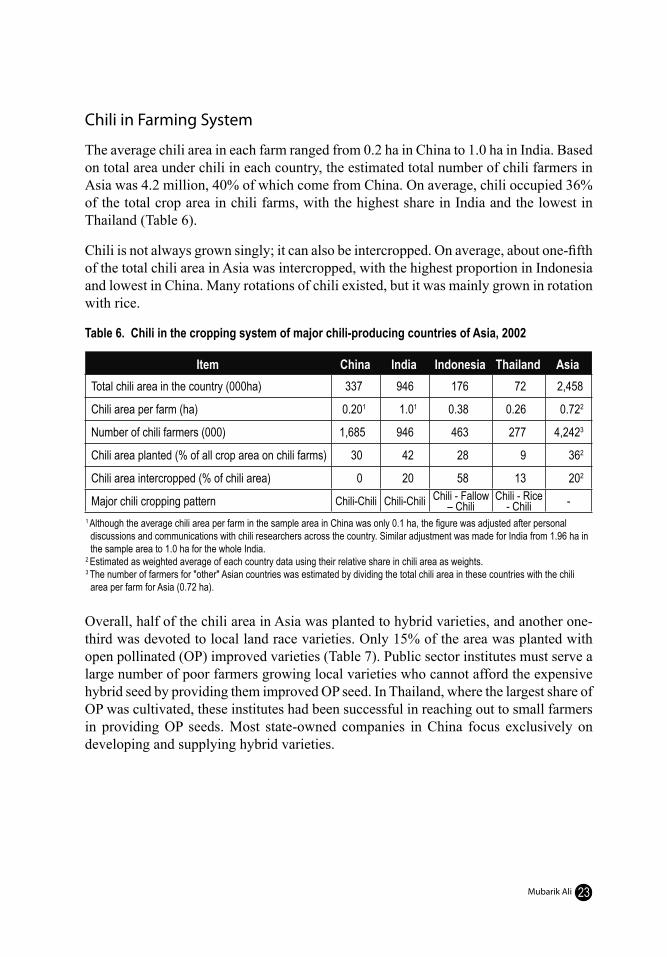
The average chili area in each farm ranged from 0.2 ha in China to 1.0 ha in India. Based ontotalareaunderchiliineachcountry,theestimatedtotalnumberofchilifarmersinAsia was 4.2 million, 40% of which come from China. On average, chili occupied 36% ofthetotalcropareainchilifarms,withthehighestshareinIndiaandthelowestinThailand (Table 6).
Chili is not always grown singly; it can also be intercropped. On average, about one-fifth ofthetotalchiliareainAsiawasintercropped,withthehighestproportioninIndonesiaandlowestinChina.Manyrotationsofchiliexisted,butitwasmainlygrowninrotationwithrice.
Table 6. Chili in the cropping system of major chili-producing countries of Asia, 2002
1 Although the average chili area per farm in the sample area in China was only 0.1 ha, the figure was adjusted after personal discussions and communications with chili researchers across the country. Similar adjustment was made for India from 1.96 ha in the sample area to 1.0 ha for the whole India.2 Estimated as weighted average of each country data using their relative share in chili area as weights.3 The number of farmers for "other" Asian countries was estimated by dividing the total chili area in these countries with the chili area per farm for Asia (0.72 ha).
Overall, half of the chili area in Asia was planted to hybrid varieties, and another one-third was devoted to local land race varieties. Only 15% of the area was planted with open pollinated (OP) improved varieties (Table 7). Public sector institutes must serve a largenumberofpoorfarmersgrowinglocalvarietieswhocannotaffordtheexpensivehybrid seed by providing them improved OP seed. In Thailand, where the largest share of OP was cultivated, these institutes had been successful in reaching out to small farmers in providing OP seeds. Most state-owned companies in China focus exclusively on developingandsupplyinghybridvarieties.
Item China India Indonesia Thailand AsiaTotal chili area in the country (000ha) 337 946 176 72 2,458
Chili area per farm (ha) 0.201 1.01 0.38 0.26 0.722
Number of chili farmers (000) 1,685 946 463 277 4,2423
Chili area planted (% of all crop area on chili farms) 30 42 28 9 362
Chili area intercropped (% of chili area) 0 20 58 13 202
Major chili cropping pattern Chili-Chili Chili-Chili Chili - Fallow – Chili
Chili - Rice - Chili -
Mubarik Ali

24
Table 7. Hot chili type and home-produced seed (% of parcels) in selected chili-growing countries of Asia, 2002
Chili type China India Indonesia Thailand Overall1
Hybrid 90 (0) 34 (8) 77 (34) 5 (0) 50 (9)
Open pollinated 10 (97) 14 (31) 5 (56) 86 (95) 15 (51)
Local land races - 52 (76) 18 (80) 9 (100) 35 (61)1Estimated by weighing each country figure with its relative share in total area under chili in four countries. Note: Figures in parentheses are percentage of parcels where home-produced seeds were used.
Insects and Diseases
Mites and thrips were the most devastating insects in chili fields, having been ranked as first or second important insect, except in China and Thailand where chili farmers ranked tobacco budworm and caterpillar as first. Another important insect was the aphid. Insect attackonchiliwasalmostaregularphenomenon,asseriousattackshappenedinalmostevery three to five out of five years. For 1998-2002, average annual losses due to insects as perceived by farmers varied from 7% in China to 56% in India. Good management practices could have resulted to low losses in China. One disturbing trend in chili produc-tion was a significant increase in yield –losses overtime due to insects, as perceived by farmers in all major chili-producing countries of Asia except China (Table 8).
Table 8. Major chili insects as perceived by farmers in selected chili-producing countries of Asia, 2002
CountryRank Occurrence
(year out of 5) Average annual losses (%)
1 2 3 4 1993-97 1998-2002 1993-97 1998-2002China W M A T 5 5 8 7
India M T C A 3 3 48 56
Indonesia T M A C 4 4 11 25
Thailand C T M A 5 4 13 24Note: A=Aphids (Aphis gossypii and Myzus persicae); C= Caterpillar (Helicoverpa armigera and Spodoptera litura); M=Mites (Polyphagotarsonemus latus); T=Thrips (Scirtothrips dorsalis); W=Tobbaco budworm (Heliothis sp.).
C h i l i ( Capsicum spp.) Food Chain Analysis: Setting Research Priorities in Asia: A Synthesis

25
6We asked farmers to provide a ranking for insects and diseases based on the average annual losses, however the climate conditions during the survey year influenced these rankings. This implies that changing environmental conditions can alter these ranking. For example, in India, relatively dry and hot climate during the last 2-3 years have contributed to the deviation from ranking anthracnose and phytophthora blight as the top diseases.
Differentchilidiseaseswererankeddifferentlyinthesurveycountries.ViruseswerethemostseriousprobleminIndonesia,anthracnose inThailand,powderymildewinIndia, and Phytophthora blight in China (Table 9).6Anthracnosewasrankedsecondinthediseaseprioritylistinallthesurveycountries,exceptinThailandwherefusariumwilt was the second-ranking disease. Viruses were ranked as number one in Indonesia, whilefarmersinothercountriesrankeditthird.Bacterialwiltwasrankedfourth,exceptinIndiawhereCercospora leafspotwasrankedfourth.
According to farmers, average losses due to disease infestation ranged from 7% in China to 43% in India from 1998-2002. Again, good management practices and relatively mod-eratetemperaturewherechiliwascultivatedmighthavecontributedtothelowlossesinChina.Averageannuallossesduetoseriousdiseaseattacks,asperceivedbyfarmers,increasedinallthesurveycountries,exceptChina.ThefrequencyofoccurrenceofseriousdiseaseattacksalsoincreasedinIndiaandThailand.Thesetrendsaremoredisturbingdespitetheincreaseduseofhybridsandimprovedopenpollinatedvarieties.
Table 9. Major chili diseases as perceived by farmers in selected chili-producing countries of Asia, 2002
CountryRank Occurrence (years) Average losses (%)
1 2 3 4 1993-97 1998-2002 1993-97 1998-2002China PH AN VR BW 5 5 8 7
India PM AN VR LS 2 3 34 43
Indonesia VR AN PH BW 4 4 29 38
Thailand AN FU VR BW 2 4 15 31Note: AN=Anthracnose (Colletotrichum acutatum, C. capsici and C. gloeosporioides); BW=Bacterial wilt (Ralstonia solanacear
um);FU=Fusarium wilt (Fusarium oxysporum f. sp. Capsici and Fusarium solani); PH=Phytophthora blight (Phytophthora capsici); VR=Viruses; PM=Powdery mildew (Leveillula taurica, asexual stage: Oidiopsis sicula); LS= Cercospora leaf spot (Cercospora capsici).
Weeds
The major weeds and their ranks of importance are reported in Table 10. The occurrence of weeds was a regular phenomenon in all chili-growing countries, although its intensity varied. It caused relatively more, and overtime increasing yield-losses in the tropics (Indonesia and Thailand) compared in the dry and sub-temperate climates of India and China (Table 10).
Mubarik Ali

26
Table 10. Major chili weeds as perceived by farmers in selected chili-producing countries of Asia, 2002
*EC=Echinochloa crusgalli; PO=Portulaca oleracea L.; DI=Digitaria sanguinalis; CY=Cyperus difformis; EL=Eleusine indica; CD=Cynodon dactylon; PH=Phalaris minor; PA=Parthenium hysterophorus; CO=Commelina sp; CR=Cyperus rotundus; DA=Dactyloctenium aegyptium; AM=Amaranthus gracilis; PE=Pennisetum polystachyon; TK=Cyperus sp.; AC=Ageratum conyzoides; UG=Unidentified grasses.
Farm Management Practices
Farm management practices greatly varied across major chili-producing countries in Asia (Table 11). These variations are explained in the following section.
Table 11. Advance management practices on hot chili in selected chili-growing countries of Asia, 2002
Farm management practices China India Indonesia Thailand Overall1
Purchased seed (overall) (% of chili farmers) 90 54 51 9 59Purchased seed for hybrid (% of hybrid farmers) 100 92 66 100 91Purchased seed for open pollinated (% of OP farmers) 3 69 44 5 49Purchased seed for local variety (% of local farmers) - 24 20 0 22Soil treatment in field (% of chili farmers) 36 23 8 6 23.3Seed treatment (% of chili farmers)2 23 17 45 18 21.6Plowing with tractor (% of parcels)3 4 73 14 70 50.9Raised bed or furrow (% of parcels) 100 47 96 66 65.2Straw and sawdust mulching (% of parcels) 14 7 22 32 11.4Plastic mulching (% of parcels) 19* 1 42 0 9.6Sprinkle irrigation (% of parcels) 1 2 1 6 1.9Use of organic manure (% of parcels) 98 82 76 28 82.3Use of inorganic fertilizer (% of parcels) 100 94 100 93 96.0Irrigated parcels (% of parcels) 84 64 79 41 69Advance method of inorganic fertilizer application (% of parcels) 63 -4 85 67 70.1Use of herbicide (% of parcels)5 100 0.3 24 50 27.3Use of insecticide (% of parcels) 100 75 100 75 83.4Use of fungicide (% of parcels) 98 70 94 41 77.2Number of harvesting 18 3 9 5 7.1Percentage of hired labor in harvesting6 0.4 91 36 31 61.8
1Estimated as weighted average of individual country data using their relative share in chili area of these four countries as weights; 2Includes both soaking and dusting; 3Includes tractor+hand and tractor+animal; 4Not available; 5Includes also chemical+manual weeding; 6Include family+hired;*This also includes straw+plastic mulching, sawdust+plastic mulching, and nylon net.
CountryRank* Occurrence Average loss (%)
1 2 3 4 5 1993-97 1998-2002 1993-97 1998-2002
China EC PO DI EL CY 5 5 2 2
India CD PA CR PH CO 5 5 3 2
Indonesia TK PO UG AC - 5 5 11 15
Thailand DA PE CR AM - 3 5 7 11
C h i l i ( Capsicum spp.) Food Chain Analysis: Setting Research Priorities in Asia: A Synthesis
27
Purchase of Chili Seed
Overall, 59% of chili seeds were purchased--91% of the hybrid, 49% of open pollinated, and only 22% of the local chili-variety seed. The percentage of purchased seed was highestinChinaandlowestinThailand.InThailand,nofarmerboughttheseedoflocalchilivariety.Aboutninepercentfarmerscultivatinghybridchilididnotbuyitsseed,butusedF2seedfromthepreviouscroptosavecost.InIndonesia,thepercentageofsuchfarmers was quite large at 34% (Table 11).
Soil and Seed Treatment
About one-fourth of the soils of chili fields were treated for soil-borne diseases, and a similar percentage of farmers treated their seeds to protect against seed-borne diseases. ThepercentageofsoiltreatmentwashighestinChina,whilethepercentageoffarmerstreatingchiliseedswashighestinIndonesia.
Land Preparation
About 70% chili fields in India and Thailand were plowed with tractor indicating high levelofmechanizationinchilicultivationinthesecountries.InChinaandIndonesia,such mechanization level was low.Almost all farmers in China and Indonesia, andtwo-thirds of farmers in Thailand made raised beds or furrows before planting chili in fields. These were less common in India (still about one-half had raised beds) because of relatively less risk of flooding in the dry region. On the whole, straw mulching and plastic mulching was practiced on about one-tenth of chili plots. Straw mulching was more commoninThailand,andthefrequencyofmulchingwithplasticsheetswasrelativelyhigherinIndonesia.
Seedling Nursery
Allfarmersinthesurveycountriespreparedseedlingnurseries,exceptinIndiawhereabout one-fourth of the farmers practiced direct seeding.
Irrigation and Fertilizer Application
Mostofthechiliareawasirrigated,exceptinThailand.Mostofthetime,thetraditionalmethod of gravitational flow of water in furrows was used to irrigate chili fields. Sprinkle irrigation was used only on less than 2% fields, and that was also mainly concentrated inThailand.
Most chili fields in Asia received organic and inorganic fertilizer. However, the application of manure was less spread on 28% fields in Thailand. All manure was applied by broadcast; 70% fields received inorganic fertilizer through advanced methods such as placement.
Mubarik Ali

28
Chemical Application
Almost all chili fields received manual weeding in all countries. Herbicide was also used on all fields in China, while only one-half and one-fourth of chili fields were applied withherbicidesinThailandandIndonesia,respectively.NoherbicidewasappliedinIndia. On the whole, 27% of chili fields in Asia received herbicides treatment during thesurveyyear.
Almost all chili fields in China and Indonesia received insecticide treatment to control insects, while about three-fourths of fields in India and Thailand also received this treatment. On the whole, over 83% of chili parcels in Asia were treated with insecticides duringthesurveyyear.
Similarly, almost all chili fields in China and Indonesia were treated with fungicides to control diseases; while over two-thirds of fields in India and two-fifths in Thailand also received this treatment. On the whole over three-fourths of chili fields received fungicide treatment.
Crop Duration
ChilicropdurationwashighestinChina,andlowestinIndonesia.Thecropwasgrownandharvested at different times of the year in different countries (Figure 8). These variations inharvestingscheduleprovideanimportantopportunityfortradeacrossAsiancountries.Forexample,inIndiathecropwasharvestedintheearlypartoftheyear,inThailandduring the later part of the year, and in China it was harvested during June-October. InIndonesia,theharvestingofthewetseasoncropstartsinMaywhennowhereinthesamplecountriesthefreshharvestwasavailable.
Figure 8. Chili crop schedule in major chili-growing countries of Asia
Theindividualcountryanalysissuggeststhatintroductionofmodernchilivarietieshadalso spread the cropcultivationandharvestingperiod.Thiswas expected to reduceseasonality of chili output. Appropriate trade links across countries will also helpreducesuchseasonality.
Jan Feb Mar Apr May Jun Jul Aug Sept Oct Nov Dec Jan Feb Mar
China
India
Indonesia
Thailand
= crop harvesting periodNote: = crop growth period
C h i l i ( Capsicum spp.) Food Chain Analysis: Setting Research Priorities in Asia: A Synthesis

29
Harvesting
The number of times the chili fields were harvested varied from three in India to 18 in Chinawithanaverageofsevenharvestings.Thelongercropdurationandhigheryieldin China compared to other countries partly explain this. Other factors responsible for more frequentharvesting inChina and Indonesiawas thegreennatureof chili fruitharvestedthere,whileinIndiaandThailandrelativelymaturefruitwasharvested.ThehighernumberofharvestingmightalsoexplainlowdiseaseandinsectincidenceinChina.HarvestingwasmainlyafamilyactivityinChina,IndonesiaandThailand,whileitwasmainlyperformedbyhiredlaborinIndia.
Input Use
Input use on chili crop varied across countries (Table 12). In the following subsections, these variations are discussed for hot-chili across the four countries where the farm surveyswereconducted.
Table 12. Input use (unit/ha) on chili in selected chili-growing countries of Asia, 2002
Input use China India Indonesia Thailand Overall1
Seed rate (kg) 0.4 2.4 1.1 2.6 1.8Total fertilizer nutrient (kg) 914 385 239 119 472Manure (t) 23.8 7.0 8.7 2.5 11Chemical spray (number) 14 17 53 12 21 Insecticide 7 10 21 5 10 Fungicide 5 7 29 5 9 Herbicide 2 - 3 2 2Manual weeding (number) 2 4 4 4 4Irrigation (number) 3 11 75 41 18Labor (days) 482 294 345 265 340 Land preparation (%) 11.8 14.0 12.9 12.4 13 Management (%) 47.2 50.6 55.5 55.1 51 Harvesting (%) 22.5 25.2 25.4 24.7 25 Post-harvesting (%) 18.4 10.2 6.2 7.8 11Full time labor force engaged (000 number)2 739 1,264 276 87 3,797
1This was estimated as weighted average of individual country input use with the relative share of each country in the total chili area of the four countries as weights.
2This was estimated by multiplying the per ha labor use with chili area in the respective country and then dividing it by 220. The overall figure in the last column of this row is for the whole of Asia, not just for the four countries.
Mubarik Ali

30
Seed Rate
Overall, 1.8 kg of seeds were used to cultivate one ha of chili field in Asia. The highest amount was used in Thailand and India. In both countries, high impurity in home-produced open pollinated seeds may have created low-germination risk and forced farmers to use highseedratetocovertherisk.InThailandtherainfedsituationmayalsohavecreatedthe low-germination risk. The lowest amount of seed was used in China because of the highcostofhybridseed.
Inorganic Fertilizer
An average of 472 kg of nutrients of inorganic fertilizer were applied to chili in Asia, withthehighestamountinChinaandthelowestinThailand.
Chemical to Control Pests
Overall, 21 chemical sprays were applied to chili crop in Asia per season; about one-half wereinsecticidesandanotherhalfwerefungicides.ThehighestnumberofspraysofinsecticideandfungicidewereappliedinIndonesiasuggestinghighinsectanddiseaseinfestationinthecountry.
Irrigation
About one-third of chili area was rainfed. The proportion of irrigated area was highest in China and lowest in Thailand. The number of irrigations varied from three in China to75 in Indonesia.InThailandandIndonesia,irrigationwasdonemanuallydailyoreveryotherday.
Labor
On average, 340 labor days per ha were needed in chili cultivation from seed to market operations. This implies that chili cultivation provided full-time year-round jobs to 3.8 millionpeople inAsia.Theuseof laborperhawashighest inChina,and lowest inThailand.Manuallandpreparation,intensiveinputapplicationespeciallyofmanure,andfrequentharvestingcontributedthehighestlaboruseinChina,whilelowinputintensityundermainlyrainfedsituationresultedtolowestlaboruseinThailand.
About one-half of the total labor went to crop management operations like manuring, planting, weeding, fertilizer and chemical application, irrigation, etc. Twelve to 14% of labor went to land preparation. About one-third of the total labor was used in the harvesting and post-harvest operations.
Per Hectare Yield
The per-ha yield of chili in fresh weight in Asia, estimated in this study, was 15.9 t. This is higher than what was estimated in the Food and Agricultural Statistics (FAO) at about 9.1 t (Table 3). In case of China, the FAO multiplied the total chili area with two
C h i l i ( Capsicum spp.) Food Chain Analysis: Setting Research Priorities in Asia: A Synthesis

31
tocountfortheareainwinterandsummerseasons,evenifthesamechilicropcontinuedin both seasons (personal communication with Dr. Liu Yong). While this doubled the area, it reduced the yield for China in FAO statistics. In the other three countries, the higheryieldestimatedinthisstudycouldbebecauseoftheconcentrationofthisstudyon commercial farms in main chili-growing areas.
Table 13. Yield (t/ha) of chili in selected chili-growing countries of Asia, 2002
Chili type/environment/cropping pattern China India Indonesia Thailand Overall1
Overall 36.5 10.0 12.6 5.8 15.9By chili type Hybrid 37.0a 16.6a 13.9a 19.1a 20.9 Open pollinated 31.0b 13.7b 11.0b 5.3b 16.8 Local - 4.1c 10.0b 4.6b 5.0By irrigation type Irrigated 36.9a 14.3a 15.6a 10.4a 19.2 Rainfed 34.3b 3.2b 7.3b 2.9b 10.5By cropping pattern type Sole 36.6a 12.4a 15.6a 10.4a 18.0 Mix cropping (relay and intercropping) 26.8b 1.0b 10.3b 5.4b 8.0
*Different superscript on figures under a main category implies that they are statistically different across sub-categories. 1This was estimated as weighted average of individual country input use with the relative share of each country in the total chili area of the four countries as weights.
Per hectare yield of chili was highest in China at 36.5 t, and lowest in Thailand at 5.8 t (Table 13). Some of this difference may be due to output quality. For example, Chinese hybridvarietiesarelargeandsucculentwithhighwatercontentwhilepopularvarietiesinothercountriesareoftenhigherinsolidsordryproducts.Someofthevariationinyield,however, was due to production efficiency, illustrating the potential in chili production onceappropriatemanagementpracticeswereadoptedandfavorableenvironmentswereprovided. The use of high-yielding varieties, high input intensity, appropriate management practices,andfavorableclimaticconditionswithregularwatersupplyexplainedthehighyieldinChina,whilelowinputintensitywithrelativelyunfavorablerainfedclimaticsituationexplainedthelowyieldinThailand.
One way to improve the chili yield is to replace the local chili area with modern varieties, both hybrids and open pollinated types. However, the open pollinated yields weresignificantly higher than local types only in India. In Thailand and Indonesia, the difference in the yield of open pollinated and local types was not significant. The economics of differentchilitypeswillbediscussedinalatersectiontoseetheeconomicallyviableoptions available to small farmers for improving chili productivity and profitability.
Mubarik Ali

32
Astransientdroughtcangreatlydamagecrops,betteraccesstoirrigationwatercanhelpnotonlyinimprovingyieldsbutalsoreducingrisks.However,exceptinThailand,mostchiliareaswerecultivatedunderirrigatedconditions;thereforethisoptionmaynothelpenhanceoverallchiliproductivityinAsia.
Chiliyieldwasalsoreducedwhenitwasgrownasrelayorintercrop.Thereductioninchili yield was more than 34% in Indonesia, although some of it was compensated, may be partly, by the productivity of the other crops. As a significant proportion of chili area was intercropped in Asia, converting it into a sole crop will significantly improve its productivity.
Output Prices and Chili Grades
Exceptremovinginfectedanddamagedoutput,gradingbyqualitywasnotdoneatthefarmlevel.However,a largepercentageofchilioutputwasofoneoranothergradeaccordingtothecriteriasetbythemarketagents,exceptinChinawhereallchilieswereof mix grade. In other countries, about 40-50% chili output was sold as mix grade. In India, grade1 and mix grade had the highest and about equal percentage of output, while inIndonesiagrade2hadthehighestproportion.InallmajorchiliproducingcountriesofAsia, better grade output fetches significantly higher prices (Table 14).
Table 14. Chili production grades and prices in selected chili-growing countries of Asia, 2002
CountryPercentage Price of fresh chili (US$/100kg)
Grade1 Grade2 Grade3 Grade mix Grade1 Grade2 Grade3 Grade mix Overall
China - - - 100 - - - - 13.4India 40 14 7 40 20.0 15.5 8.9 17.8 17.3Indonesia 6 42 9 43 71.3 50.3 21.7 36.7 43.2Thailand 20 13 12 53 37.1 29.7 22.3 27.2 27.2
Overall, the farm gate prices ranged between US$13/100kg in China to US$43/100kg in Indonesia. Some of the differences were due to the variation in quality. Prices in India wereslightlyhigherthaninChina.ThehighestpricesinIndonesiamayalsobeduetolack of competition, as it is difficult and costly to import from other countries fresh chili whichwasthemajorformconsumedthere.HighchilipriceinThailandcomparedtoIndiaandChinawasinducingimportsfromothercountries.
C h i l i ( Capsicum spp.) Food Chain Analysis: Setting Research Priorities in Asia: A Synthesis

33
Economics of Chili Production
Factor Share
TheperhacostofchiliproductionwashighestinChinaandlowestinIndiaandThailand.Thestructureofperhavariedfromcountrytocountry.Laborclaimedthemajorsharein China and Thailand, contributing about one-half and two-thirds of the total cost, respectively, while the share was 26% and 18% in India and Indonesia. Pesticide was themajorcostinIndonesia,andoneofthemajorcostitemsinIndia.Thefertilizershareranged from three percent in Thailand and 17% in India. Irrigation cost claimed only a small share in China and India, while it contributed about 10% in Indonesia and Thailand. The fixed cost ranged from 30% in India and 15% in Thailand. The share of seed ranged from two percent in Indonesia and seven percent in China (Table 15).
Table 15. Total cost (US$/ha) and factor share (%) of chili cultivation in selected chili-producing countries of Asia, 2002
CountryTotal cost Factor share (%)
(US$/ha) Labor Seed Fertilizer Irrigation Pesticide Others1
China 2,730 49.4 6.8 12.4 0.2 8.4 22.8 India 1,110 26.0 5.0 17.0 2.0 20.0 30.0Indonesia 1,974 18.0 2.0 14.0 10.0 37.0 19.0
Thailand 1,168 63.0 3.0 3.0 9.0 7.0 15.01This includes land rent, taxes, interest and structure costs.
Unit Output Cost
Overall, per unit production cost of chili was lowest in China, and highest in Thailand. By chili type, hybrids had the lowest unit output-cost. However, the unit output-cost of open pollinatedincomparisonwithlocaltypevariedacrosscountries.ItwaslowerthanlocalchiliinIndiabecauseofbetterperformanceoftheformerintermsofyield.However,inIndonesiaandThailand,theunitcostforopenpollinatedwashighercomparedtolocaltype because of insignificant difference in yield between the two, and higher cost of the former (Table 16).
Table 16. Unit cost (US$/t) of chili cultivation in selected chili-producing countries of Asia, 2002
Chili type China India Indonesia ThailandHybrid 80.1 120.3 134.3 136.0
Open pollinated 84.2 168.4 203.1 212.7
Local - 205.6 156.5 202.8
Overall 80.5 162.2 144.3 201.3
Mubarik Ali

34
Benefit-Cost Ratio
Chili type China India Indonesia Thailand
Hybrid 83 79 251 117Open pollinated 73 111 116 42Local - 40 115 40Overall 82 70 209 51
Table 17. Benefit-cost ratio (%) for chili cultivation by chili type in major chili-producing countries of Asia, 2002
The benefit-cost ratio in chili cultivation was highest in Indonesia and lowest in Thailand. TheratioforhybridwashigherthanforlocalandopenpollinatedtypesinIndonesiaand Thailand, while in India the open pollinated gave the highest benefit-cost ratio. No significant difference between open pollinated and hybrid in China was observed (Table 17).
Resource Use Efficiency
Resourceproductivityforfertilizerandlaborwasgenerallyhigherwhentheywereusedinmodernchilivarietiescomparedtowhentheywereappliedinlocaltypeinallthesurveycountries.Amongmodernvarieties,productivitywashigherinhybridscomparedtoopenpollinatedtypesinallcountries,exceptinIndiaandfertilizerproductivityinIndonesiawherethereversewastrue.ItshowedthesuccessofopenpollinatedvarietiesinIndia,whileinothercountriesthehybridtypesprovidedmoreeconomicallyviableoptions.Infact,laborandfertilizerproductivityinopenpollinatedchilitypeinThailandand labor productivity in Indonesia was either lower or insignificantly different than in local chili type (Table 18).
Table 18. Partial resource productivity in chili cultivation by chili type in selected chili producing countries of Asia, 2002
Chili typeChina India Indonesia Thailand
Labor(US$/day)
Fertilizer(US$/kg)
Labor(US$/day)
Fertilizer(US$/kg)
Labor(US$/day)
Fertilizer(US$/kg)
Labor(US$/day)
Fertilizer(US$/kg)
Hybrid 8.2 10.1 6.9 6.5 19.0 21.9 16.7 37.9Open pollinated 7.7 5.2 8.4 7.1 12.7 24.1 3.2 12.9Local - - 5.6 4.1 11.1 16.1 3.2 13.6Overall 8.1 9.6 6.7 5.7 16.6 20.9 3.6 17.2
DespitehighreturnonopenpollinatedvarietiesinIndia,theseedofthesevarietieswasnot generally available, implying that success on the experiment fields in the public sectorresearchinstituteshadnotbeentransferredtothefarmers,andalargegroupofchilifarmershadtodependontheexpensiveandrelativelylesseconomicallyviablehybridtype.
C h i l i ( Capsicum spp.) Food Chain Analysis: Setting Research Priorities in Asia: A Synthesis

Theproducers’choicesfordifferentattributesinvarietyselectionfortwoformsofchilioutput (i.e., green and red) are presented in Table 20. In general, high market price and yieldwerethetwohighestrankedcriteriaoffarmersinvarietyselection,exceptforgreeninIndonesiaandThailand.Diseaseandinsectresistanceattributesweregenerallyrankedthirdorfourth,orevensixth.Thisisdespitethefactthatfarmersinallsurveyedcountriesconsidereddiseasesandinsectsasmajorconstraints.Thisclearlysuggeststhatresearchoninsectanddiseaseresistancecannotbesoldtofarmerswithoutenhancementofyieldandincorporationoftheattributesthatconsumerspreferinchilisothatproducerscanhavehighpricesfortheiroutputs.
35
FertilizerproductivitywashighestinIndonesiaandThailandwhilelaborproductivitywaslowestinThailand,exceptinhybridtype.ThismaybeexplainedintermsoflowfertilizerperunitofoutputusedinIndonesiaandThailandandhighlaborperunitofoutputappliedinThailand.
Farmers' Constraints
In all the surveyed countries, diseases and insects were ranked first or second constraint seriouslylimitingchiliproduction.EventhoughthelossesduetodiseasesandinsectswerelowinChina,farmersstillconsideredthisasthemostimportantconstraint.Lowand variable price was ranked third in China andThailand, while market problemsand the environment (mainly drought) were the number three priority constraints in IndonesiaandIndia,respectively.LowandvariablepricesinIndia,marketproblemsinChina, environmental problems (mainly floods) in Indonesia and Thailand were at the fourthpriorityconstraints.LowyieldvarietyinThailand,poorqualityseedinIndonesia,environmentalproblemsinChina,andweedsinIndiawerealsothecauseofconcernsoffarmers (Table 19). It should be noted that high cash required for chili cultivation was notnotedasamajorconstraint,atleastforthosefarmerswhowerealreadycultivatingchili.Itisperhapsagreatbarrierfornewentrants,especiallysmallfarmers.
Table 19. Rank of contraints faced by chili farmers in selected chili-growing countries of Asia, 2002
Constraint China India Indonesia ThailandDiseases 1 1 2 1Insects 2 2 1 2Low price/variability in chili price 3 4 - 3Market problems 4 - 3 -Low yield/variety - - - 5Poor quality seed/high seed cost - - 5 -Environment (drought/flooding) 5 3 4 4
Attributes for Chili Selection
Note: Highest rank = 1 and lowest rank = 5.
Mubarik Ali
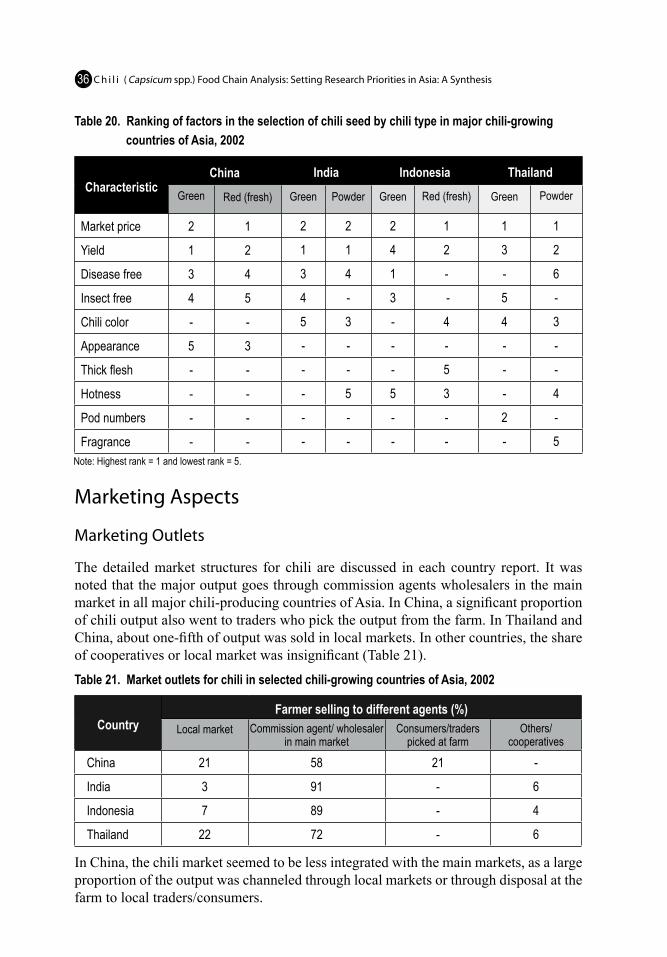
36
Marketing Outlets
Table 20. Ranking of factors in the selection of chili seed by chili type in major chili-growing countries of Asia, 2002
Marketing Aspects
Thedetailedmarket structures for chili are discussed in each country report. Itwasnotedthatthemajoroutputgoesthroughcommissionagentswholesalersinthemainmarket in all major chili-producing countries of Asia. In China, a significant proportion ofchilioutputalsowenttotraderswhopicktheoutputfromthefarm.InThailandandChina, about one-fifth of output was sold in local markets. In other countries, the share of cooperatives or local market was insignificant (Table 21).
CountryFarmer selling to different agents (%)
Local market Commission agent/ wholesaler in main market
Consumers/traders picked at farm
Others/cooperatives
China 21 58 21 -
India 3 91 - 6
Indonesia 7 89 - 4
Thailand 22 72 - 6
InChina,thechilimarketseemedtobelessintegratedwiththemainmarkets,asalargeproportionoftheoutputwaschanneledthroughlocalmarketsorthroughdisposalatthefarm to local traders/consumers.
Table 21. Market outlets for chili in selected chili-growing countries of Asia, 2002
CharacteristicChina India Indonesia Thailand
Green Red (fresh) Green Powder Green Red (fresh) Green Powder
Market price 2 1 2 2 2 1 1 1
Yield 1 2 1 1 4 2 3 2
Disease free 3 4 3 4 1 - - 6
Insect free 4 5 4 - 3 - 5 -
Chili color - - 5 3 - 4 4 3
Appearance 5 3 - - - - - -
Thick flesh - - - - - 5 - -
Hotness - - - 5 5 3 - 4
Pod numbers - - - - - - 2 -
Fragrance - - - - - - - 5Note: Highest rank = 1 and lowest rank = 5.
C h i l i ( Capsicum spp.) Food Chain Analysis: Setting Research Priorities in Asia: A Synthesis
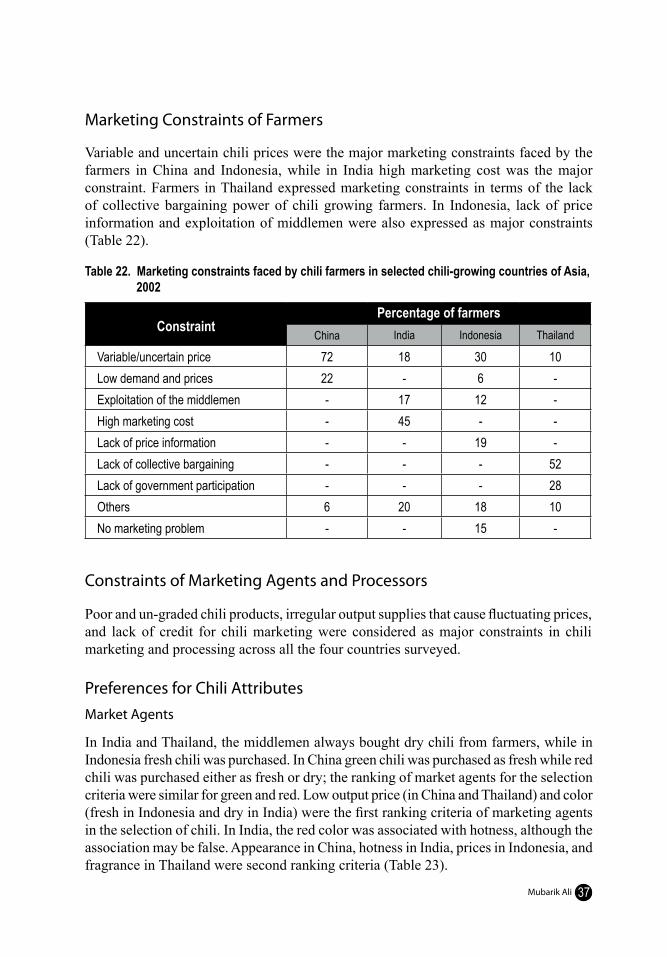
37
Marketing Constraints of Farmers
Variableanduncertainchilipriceswerethemajormarketingconstraintsfacedbythefarmers in China and Indonesia, while in India high marketing cost was the majorconstraint.Farmers inThailandexpressedmarketingconstraints in termsof the lackof collective bargaining power of chili growing farmers. In Indonesia, lack of priceinformationandexploitationofmiddlemenwerealsoexpressedasmajorconstraints(Table 22).
Table 22. Marketing constraints faced by chili farmers in selected chili-growing countries of Asia, 2002
ConstraintPercentage of farmers
China India Indonesia Thailand
Variable/uncertain price 72 18 30 10Low demand and prices 22 - 6 -Exploitation of the middlemen - 17 12 -High marketing cost - 45 - -Lack of price information - - 19 -Lack of collective bargaining - - - 52Lack of government participation - - - 28Others 6 20 18 10No marketing problem - - 15 -
Constraints of Marketing Agents and Processors
Poor and un-graded chili products, irregular output supplies that cause fluctuating prices, and lack of credit for chili marketing were considered as major constraints in chilimarketingandprocessingacrossallthefourcountriessurveyed.
Preferences for Chili AttributesMarket Agents
InIndiaandThailand,themiddlemenalwaysboughtdrychilifromfarmers,whileinIndonesiafreshchiliwaspurchased.InChinagreenchiliwaspurchasedasfreshwhileredchiliwaspurchasedeitherasfreshordry;therankingofmarketagentsfortheselectioncriteria were similar for green and red. Low output price (in China and Thailand) and color (fresh in Indonesia and dry in India) were the first ranking criteria of marketing agents intheselectionofchili.InIndia,theredcolorwasassociatedwithhotness,althoughtheassociationmaybefalse.AppearanceinChina,hotnessinIndia,pricesinIndonesia,andfragrance in Thailand were second ranking criteria (Table 23).
Mubarik Ali

38
Table 23. Ranking of chili attributes preferred by market agents (middlemen) in selected chilling- growing countries of Asia, 2002
CharacteristicsChina India Indonesia Thailand
Green Red - - -Low output price 1 1 4 2 1
Disease/insect free - - 4 3 5
Appearance 2 2 3 - -
Freshness 3 3 5 5 -
Chili color - 5 1 1 -
Fruit surface 5 - - - 4
Fragrance - - - - 2
Hotness - - 2 4 3
Softness 3 4 - - -
Thick mesocarps 4 - - - -Note: Highest rank=1 and lowest rank=5.
Processors
Processors buy dried chili to process it into powder which is generally used in making hot food, or give red color to dishes. Processors looked for chili color or pungency as first ranking criterion. Low output price in China, pungency in India, less number of seed (to have attractive red color) in Thailand, and chili color in Indonesia were second rankingcriteria.ChilicolorinChinaandThailand,pricesinIndonesia,andattractiveappearanceinIndiawerethirdrankingcriteria.FragrancewasrankedfourthinChina,India, and Indonesia and while prices were fourth in Thailand (Table 24).
Note: Highest rank=1 and lowest rank=5.
Characteristics China India Indonesia ThailandPrices 2 - 3 4Appearance - 3 - -Softness 5 - - -Freshness - 5 5 -Chili color 3 1 2 3Fragrance 4 4 4 5Pungency 1 2 1 1Number of seed - - - 2
Table 24. Ranking of chili attributes preferred by processors in selected chili-growing countries in Asia, 2002
C h i l i ( Capsicum spp.) Food Chain Analysis: Setting Research Priorities in Asia: A Synthesis

39
Ingeneral,criteriausedforredandgreenchiliweresimilar.Asattributesselectedforoneproductcanalsobesoldinotherproducts,thismadetheresearchers’jobeasier.InChina, overall appearance and market prices were first and second most important criteria consumerslookforinbothredandgreenchili;inIndia,pungencyandmaterialwithoutblemishesweremostpreferred;inIndonesia,consumerslookforfreshnessandnumberof seeds in the pod (perhaps a measure for hotness); and in Thailand both hotness and freshness were top attributes in consumers selection of chili (Table 25).
Selection criteriasPrices
China India Indonesia ThailandGreen Red Green Red Green Red Green Red
Hotness 4 4 1 1 4 5 1 1Disease/insect free - - 2 2 3 4 5 4Overall appearance 1 1 - 5 - - - -Number of seeds - - - - 2 2 - -Market price 2 2 4 3 - - - -Freshness 3 3 3 - 1 1 2 2Color - 5 5 4 5 3 3 3Fragrance - - - - - - 4 -
Note: Highest rank=1 and lowest rank=5.
Consumption Aspects
Consumption Pattern
TheaverageannualpercapitaconsumptionofchiliinAsia,asestimatedthroughthissurvey, was 11.8 kg of fresh weight (Table 26).7ConsumptionwashighestinChina,whereitwasconsumedasasupplementvegetableandlowestinIndiaandIndonesia.
Table 25. Ranking of chili attributes by consumers in selected chili-producing countries of Asia, by chili type, 2002
Consumers
7 This estimate, however, is biased toward higher consumption level in the chili growing areas surveyed.
In Asia, the average annual per capita expenditure on chili stood at about US$4.3 (Table 27).8TheexpenditurewashighestinIndonesiawherechilipriceswererelativelyhigherthan in otherAsian countries, while in China the high consumption level explainedthe high expenditure despite low unit prices. One-fifth of the total chili consumption was for green fresh, while another one-tenth for red fresh. The share of dried red chili (ungrounded) was 12%, while 36% was consumed as chili powder. About 16% of the freshweightwasconsumedintheformofprocessedproducts.
8 Consumption in the survey areas may be high and expenditures may not be because chili prices in the non-survey areas may be higher than in the survey areas.
Mubarik Ali

40
Table 27. Relative share of expenditure (%) of different chili types in selected chili-growing countries in Asia, 2002
Type of chili China India Indonesia Thailand Overall1
Green fresh 28.1 17.8 33.0 14.1 21.7Red fresh 30.6 0.9 40.0 14.5 12.6Sweet fresh 0.8 2.0 - 0.3 1.4Dry chili 6.4 17.4 - 4.0 12.3Chili powder 9.9 52.4 - 39.4 36.4Other chili products2 24.2 9.5 27.0 27.7 15.6Annual per capita expenditure (US$) 5.0 3.3 7.1 6.3 4.3Retail to farmgate price ratio 1.99 1.99 1.71 2.04 1.96Total retail value of chili (million US$) 2,712 1,727 1,157 276 9,4533
1This was estimated by weighing the shares of each country with its population share in the four project countries.2Others include chili pickle, paste, curry and other products.3This is the value for whole Asia
ChiliconsumptionpatternvariedacrossAsiancountries.InIndonesia,chiliwaseitherconsumed as fresh or processed (pickle, paste, curry, and other products); no powder ordrychiliwasconsumed.InChina,theshareoffreshchilitototalconsumptionwasalso quite high. On the other hand, more than one-half of total consumption in India and two-fifth in Thailand was consumed as chili powder. The share of chili processed items ranged from 9.5% in India to 27.7% in Thailand (Table 27).
Table 26. Relative share (percentage) of different chili types (fresh form) in total chili consumption in selected chili-producing countries of Asia, 2002
1This was estimated by weighing the shares of each country with its population share in the four project countries.2Others include chili pickle, paste, curry, and other chili product.3The figures in this row are average annual per capita chili consumption in kg. Note: The dry chilies and chili powder were converted into fresh by multiplying the weight of the former with 4. Similarly, chili pickles, chili paste, chili curry and other chili products were converted into chili fresh weight by multiplying the later with 2.
Type of chilis China India Indonesia Thailand Overall1
Green fresh 35.1 26.9 33.6 14.2 28.9Red fresh 25.5 0.3 39.3 14.7 11.0Sweet fresh 0.5 2.7 - 0.5 1.88Dry chili 5.6 19.3 - 3.7 13.3Chili powder 9.3 46.5 - 39.4 32.3Other chili products2 24.0 4.3 27.1 27.5 12.4Overall (kg/annum)3 18.9 9.7 9.6 11.3 11.8
C h i l i ( Capsicum spp.) Food Chain Analysis: Setting Research Priorities in Asia: A Synthesis

41
Retail Value
Thepercapitaexpenditureandconsumptionallowedustoestimatetheaveragepricesof chili and its products at the retail level in the survey area. Using the farmgate prices reported in Table 14, the ratio of retail to farmgate prices was estimated. This ratio was usedtoestimatetheretailvalueofchiliineachsurveycountry.Theweightedaverageofthese ratios (using production at each country as weight) was used to estimate the retail value for Asia from its farm value reported in Table 3. Our estimate suggests that total retail value of chili and its products in Asia stands at about US$9.5 billion. About 29% of this value was traded in China and another 18% in India (Table 27).
Demand Elasticity
Demandelasticitydepictsthepercentagechangeintheconsumptionofacommoditywithagivenpercentagechangeinitsprices.Consumers’perceivedresponsesforchiliwith various percentage change in its prices (increase and decrease) are discussed in each countryreport.Thechangeinconsumptionasaresultofthevariousincreasingpricelevels of green/red and dry/powder chili is discussed here.
The change in fresh chili (green/red) consumption ranged from 2.3% in Thailand to 17.1% in China, while demand elasticity for powder and dry chili ranged from 3.3% in Indonesia to 8.0% in China (Table 28). The elasticities were higher for green/red chili than for dry/powder chili except in Thailand. However, both were relatively low: about the same as that of cereals in case of green/red and even lower than cereals in case of dry/powder. This suggests that in general there is a little chance of improving the demand ofchilibyreducingitspricethroughtechnologicalchanges,althoughsuchpotentialsarehigherforfreshchili.Thesechancesaremuchhigherincaseofsweetpepperasindicatedby high elasticity (up to 0.62 as shown in India report).
In Thailand, however, the demand elasticities for both fresh chili and dry/powder were low, perhaps because both were consumed as spices and green/red chilies were not cooked assupplementdishlikeinsomeothercountries.
Price increase (%)
China India Indonesia ThailandGreen/ red
(fresh)Dry/
powderGreen/ red
(fresh)Dry/
powderGreen/red
(fresh) Product Green/red (fresh)
Dry/ powder
110 -0.35 -0.20 -0.05 -0.50 -3.16 0 -0.42 -0.81125 -2.45 -0.90 -0.50 -1.00 -4.65 -0.07 -0.65 -1.08150 -7.30 -3.30 -2.25 -2.80 -5.69 -0.08 -0.73 -2.17175 -12.45 -5.90 -6.20 -5.00 -8.13 -1.98 -1.85 -3.14200 -17.10 -8.00 -15.90 -7.90 -13.33 -3.32 -2.31 -4.21
Table 28. Demand elasticity of chili by product type in selected chili-producing countries in Asia, 2000
Mubarik Ali
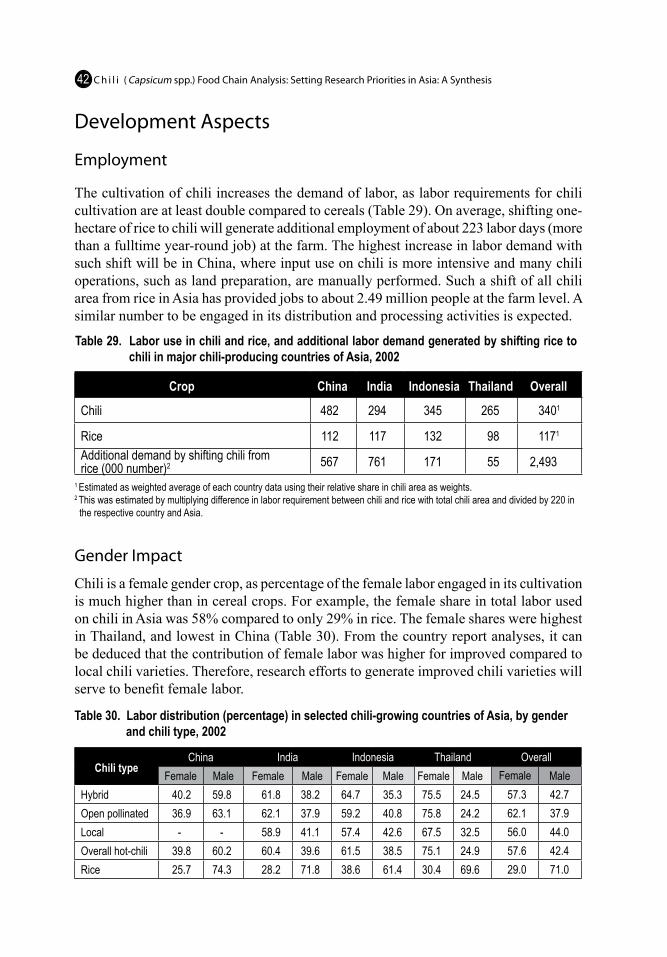
42
Development Aspects
Employment
Thecultivationofchiliincreasesthedemandoflabor,aslaborrequirementsforchilicultivation are at least double compared to cereals (Table 29). On average, shifting one-hectare of rice to chili will generate additional employment of about 223 labor days (more than a fulltime year-round job) at the farm. The highest increase in labor demand with suchshiftwillbeinChina,whereinputuseonchiliismoreintensiveandmanychilioperations,suchaslandpreparation,aremanuallyperformed.Suchashiftofallchiliarea from rice in Asia has provided jobs to about 2.49 million people at the farm level. A similarnumbertobeengagedinitsdistributionandprocessingactivitiesisexpected.
Table 29. Labor use in chili and rice, and additional labor demand generated by shifting rice to chili in major chili-producing countries of Asia, 2002
Crop China India Indonesia Thailand Overall
Chili 482 294 345 265 3401
Rice 112 117 132 98 1171
Additional demand by shifting chili from rice (000 number)2 567 761 171 55 2,493
1 Estimated as weighted average of each country data using their relative share in chili area as weights.2 This was estimated by multiplying difference in labor requirement between chili and rice with total chili area and divided by 220 in the respective country and Asia.
Gender Impact
Chiliisafemalegendercrop,aspercentageofthefemalelaborengagedinitscultivationismuchhigherthanincerealcrops.Forexample,thefemaleshareintotallaborusedon chili in Asia was 58% compared to only 29% in rice. The female shares were highest in Thailand, and lowest in China (Table 30). From the country report analyses, it can bededucedthatthecontributionoffemalelaborwashigherforimprovedcomparedtolocalchilivarieties.Therefore,researcheffortstogenerateimprovedchilivarietieswillserve to benefit female labor.
Table 30. Labor distribution (percentage) in selected chili-growing countries of Asia, by gender and chili type, 2002
Chili typeChina India Indonesia Thailand Overall
Female Male Female Male Female Male Female Male Female MaleHybrid 40.2 59.8 61.8 38.2 64.7 35.3 75.5 24.5 57.3 42.7Open pollinated 36.9 63.1 62.1 37.9 59.2 40.8 75.8 24.2 62.1 37.9Local - - 58.9 41.1 57.4 42.6 67.5 32.5 56.0 44.0Overall hot-chili 39.8 60.2 60.4 39.6 61.5 38.5 75.1 24.9 57.6 42.4Rice 25.7 74.3 28.2 71.8 38.6 61.4 30.4 69.6 29.0 71.0
C h i l i ( Capsicum spp.) Food Chain Analysis: Setting Research Priorities in Asia: A Synthesis

43
Agricultural Business ActivitiesChilicultivationrequiresmorepurchasedinputs,suchasfertilizer,pesticide,andirrigationwater compared to widely grown rice in the region (Table 31). For example, the current chili area in Asia created an additional demand of seed (US$150 million), fertilizer (511 thousand nutrient t), manure (19 million t), and pesticide (US$566 million).9Someof these inputs need more cash outlay, which generate demand for loans to finance chili production expenses, and more fertilizer and pesticide sales shops are needed.Moreover, increased input demands create employment opportunities in supply andservicessectors.
On average net return per ha on chili cultivation in Asia stood at US$1,437, which was US$1,348 higher than in rice cultivation. Assuming that 2.45 million ha of chili area was shifted from rice, it would have generated an additional net income of US$3.31 billion tothechilifarmersinAsia.
9 As sweet pepper cultivation is much more input intensive with higher economic returns, to the extent Asia data for green and fresh includes sweet pepper, these estimates are on the lower side.
Table 31. Non-labor input use in chili and rice, and additional input demand generated by shifting rice to chili in major chili-producing countries of Asia, 2002
Input/crop China India Indonesia Thailand Overall1
Seed (US$/ha) Chili 184.9* 54.2* 39.5* 35.0* 80 Rice 31.1 17.2 14.0 6.1 19 Additional demand by shifting rice to chili (million US$)2 51.9 35.0 4.5 2.1 150.0Fertilizer (kg/ha) Chili 914* 402* 239* 119* 483 Rice 434 252 169 86 275 Additional demand by shifting rice to chili (000t)2 161.9 141.8 12.3 2.4 511.2Manure (t/ha) Chili 23.8* 7.12* 8.7* 2.46* 11 Rice 0.8 4.33 2.0 0.96 3 Additional demand by shifting rice to chili (million t)2 7.8 2.6 1.2 0.1 18.8Pesticide (US$/ha) Chili 229* 226* 730* 82* 278*
Rice 43 27 167 47 48 Additional demand by shifting rice to chili (million US$)2 62.7 188.2 99.2 2.5 566.1Irrigation (no.) Chili 3.2* 11 75* 41* 18 Rice 7.8 12 18 18 12
Mubarik Ali

44
Inaddition,mostofthechilioutputwascommerciallyproducedforthemarket,whileamajorportionofthecerealoutputwaskeptforhomeconsumptioninAsia.Therefore,chilicultivationgeneratedadditionaldemandformarketactivities.Asfreshchilineedstobetransportedtothemarketsandprocessinglocationsassoonaspossible,theywillneed sophisticated marketing infrastructure, such as better roads, storage, etc. Once such infrastructure is available, the efficiency of the whole marketing system will improve.
Asthemajorityofchiliwasconsumedinpowder,dry,andprocessedformsinAsia,alarge number of people were engaged in its post-harvest activities. Drying and removal ofinfectedanddamagedchilieswereusuallydoneonthefarm.Doublingofthefarmtoretail prices (Table 27) in chili where post-harvest losses were not substantial indicated considerable post-harvest activities. Moreover, about 11% of the labor, ranging from 8-18%, used in chili production in Asia was in post-harvest activities (Table 12). In fact, substantial activities were performed on the farm for processing. This was reflected in thehighproportionofprocessedchili itemspreparedwithin the farmhouseholds ineverycountrysurveyed.
Thelargelycommercialnatureofchiliproductionincreasedincomeandemploymentof the people in peripheral communities not engaged directly in its production andmarketingthroughamultipliereffectasitpassesthroughmorehandsuntilitreachestoconsumers.
Economic Efficiency
Economic efficiency of resources allocated in chili production, such as labor and fertilizer, was higher than those in rice production, a major cereal crop in these countries (Table 32). The benefit-cost ratio was also higher in chili production compared with rice except in Thailand. Despite these benefits, however, chili was not as extensively grown. The economicanalysispointedtwomajorconstraints:
1. Higher per ha production cost and more percentage of it was cash (except in China) comparedtorice.
2. Highvariabilityinchiliyieldandthereforeriskinvolvedinitsproductioncomparedto more stable yield of rice. The market variance in terms of fluctuating market
Input/crop China India Indonesia Thailand Overall1
Net income (US$/ha) Chili 2,064* 735* 4,351* 591* 1437 Rice 121 40 229 231 89Additional income generated to chili farmers (million US$) 655.4 657.1 726.6 25.9 3314.7
1 This was estimated as weighted average of individual country input use using the relative share of each country in the total chili area of the four countries as weights.
2 This was estimated by multiplying the difference in chili and rice estimates in each country with the total chili area of the respective country. Note: The * in the chili row suggests that that input use on chili is significantly different than in rice.
Cont...,Table 31
C h i l i ( Capsicum spp.) Food Chain Analysis: Setting Research Priorities in Asia: A Synthesis

45
Table 32. Input use efficiency in chili and rice in selected chili-producing countries of Asia, 2002
Note: The * in chili row implies that the figure is different than the corresponding figure for rice at the 10% level.
Chili cultivation not only improved the efficiency of resources engaged in its production, but also enhanced the efficiency of resources engaged in the production of cereal crops. Aschiliisacommercialcrop,farmersengagedinitsproductionhadbetterconnectionwith the market (as reflected by their higher off-farm earning and loan-seeking behavior compared to non-chili farmers, Table 5). Therefore they can better understand the fluctuations in the market than farmers engaged in subsistence crops such as rice. They buyinputsontimeandhavetofollowthestipulatedtiminginthecontractforoutputdelivery. Once they know the importance of timing of different production and marketing operationsinchiliproduction,theyenforcethetimelinessofoperationincerealcropsaswell. This improves the productivity and resource use efficiency of cereal crops cultivated by chili farmers compared to non-chili farmers.
This higher efficiency in cereal cultivation was achieved either through obtaining higher yield of cereals (except in case of Indonesia), or by saving costs as in case of China, or both. This improved net return, benefit-cost ratio, and labor and fertilizer productivity of rice cultivated by chili growing farms compared to the one grown by non-chili farmers (Table 33).
Input/crop China India Indonesia ThailandTotal cost (US$/ha)Chili 2,731* 1,109* 1,974* 1,168*
Rice 665 364 438 306Cash cost (percentage of total cost)Chili 37.9 74.7* 65.4 31.9Rice 44.7 58.4 50.2 25.5Labor (US$/labor day)Chili 8.1* 6.7* 16.6* 3.6*
Rice 4.8 3.2 4.0 3.0Fertilizer (US$/kg nutrient)Chili 9.6* 5.7* 20.9* 17.2*
Rice 2.1 1.6 2.7 6.0Benefit-cost ratio (%)Chili 82* 70* 209* 51*
Rice 23 11 52 76Variance in yieldChili 0.25 0.81 0.91 1.19Rice 0.17 0.29 0.37 0.06
prices,comparedtomostlystablericepricesmanagedthroughgovernmentsupportsfurtherexaggeratedtherelativeriskinvolvedinchiliproduction.
Mubarik Ali

46
Table 33. Economics of rice cultivation of chili and non-chili farms in selected chili-producing countries of Asia, 2002
Parameter/type of farm China India Indonesia ThailandYield (t/ha) Chili farm 6.59 3.82 5.00 4.75 Non-chili farm 6.47 3.11 5.20 3.97Total cost (US$/ha) Chili farm 658 374 402 327 Non-chili farm 734 361 445 266Net return (US$/ha) Chili farm 130 46 264 244 Non-chili farm 30 31 247 191Benefit-cost ratio (US$/100US$) Chili farm 24 12 66 75 Non-chili farm 10 8 56 72Labor (US$/day) Chili farm 4.9 3.3 4.2 2.5 Non-chili farm 4.0 3.2 4.0 2.5Fertilizer (US$/kg nutrient) Chili farm 2.1 1.7 3.0 5.8 Non-chili farm 1.5 1.5 2.8 5.3
Impact on Consumption
Chilicultivationimprovedtheincomeoffarmers,therefore,theirabilitytogenerallyincrease spending, especially to buy more and/or better foods, also improved. Except in Indonesia where non-chili farmers also planted other vegetables or cash crops, the total household incomes of chili farmers were statistically higher than non-chili farmers. The overallexpenditureonfoodfollowedthesamepattern.ThetotalquantityoffoodwashigheronlyinChinaandIndia,butthequalityoffoodintermsofhighvalueproductssuch as fruits, vegetables, and/or livestock products was generally improved on chili farms in all the surveyed countries (Table 34).
Miracle of Modern Varities
The specifications in 3.1-3.3 were used to estimate the annual economic surplus generated due to modern varieties in 2003 in the survey countries and in Asia. The study estimated the surplus for hybrid varieties, as open pollinated (improved) varieties didnothaveclearadvantageovertraditionallandracesintermsofunitproductioncost(see Table 16). The data used in this estimation are reported in Table 35.
C h i l i ( Capsicum spp.) Food Chain Analysis: Setting Research Priorities in Asia: A Synthesis

47
Table 34. Effect of chili cultivation on food consumption and expenditure by farmer group in major chili-producing countries of Asia, 2002
ItemChina India Indonesia Thailand
Chili Non-chili Chili Non-chili Chili Non-chili Chili Non-chiliFamily income (US$/month) 157.8a 137.5b 122.5a 72.3b 27.5b 39.7a 226.5a 176.3b
Family expenditure (US$/month) All expenditure 91.9a 85.6b 61.5a 57.0b 15.6b 22.2a 110.7a 91.8b
On food 53.3a 48.8b 42.2a 39.0b 10.4b 15.8a 48.0a 44.3b
Total Food (g/day) 968a 912b 920a 847b 995b 1,032a 1,147a 1,189a
Cereals 445a 416b 377a 360a 374a 362a 422b 532a
Vegetables 342a 329b 185a 151b 210a 195b 229a 188b
Fruits 49a 34b 40b 90a 91a 96a 146a 126b
Livestock products 71a 64a 242a 211b 116a 132a 126a 118a
Seafood 15a 17a - - 80a 93a 70a 58b
Others 47a 53a 76a 35b 134a 154a 156b 167a
Note: Different superscripts on figures in the chili and non-chili columns implies that the figures are statistically different across the two groups.
Parameter China India Indonesia Thailand Overall1. Production without innovation (000t)1 11,899 4,388 1,052 420 21,821
2. Farm price without innovation (US$/t)1 173 204 488 278 208
3. Demand elasticity2 0.15 0.08 0.11 0.03 0.13
4. Supply elasticity3 0.40 0.40 0.40 0.40 0.40
5. Probability of success (proportion) 1 1 1 1 1
6. Adoption rate (proportion)4 0.9 0.34 0.77 0.05 0.74
7. Reduction in cost (proportion)5 0.3 0.41 0.14 0.33 0.328. k (proportion of farm price decrease estimated as 6*7) 0.27 0.14 0.11 0.02 0.22
1 These values were generated using equations 3.4-3.9, and the explanation after these specifications. 2 Weighted average elasticities reported in each country chapters for different types of chili products. 3 Estimated from the review of literature. 4 Table 7.5 Percentage difference in unit cost of production between hybrid and local land races reported in Table 16.
Table 35. Parameter values for producer and consumer surplus analysis for chili cultivation in selected countries in Asia
Mubarik Ali

48
Over US$ one billion per annum were being generated due to the use of hybrid varieties in chili production in Asia. However, about 75% of the benefits went to consumers and remaining 25% to producers. This is because of the low demand elasticity of chili, i.e., additionalproductiongeneratedbymodernvarietiesdramaticallyreducedchiliprices,which lowered the benefits of these varieties to farmers (Table 36).
Table 36. Producers and consumers surplus generated by modern technologies in chili production in 2003 in selected countries in Asia
Parameter China India Indonesia Thailand OverallConsumers surplus (Million US$) 411.28 105.46 44.13 1.79 776.92
Producers surplus (Million US$) 154.23 21.09 12.13 0.13 248.62
Total (Million US$) 565.50 126.55 56.26 1.92 1,025.54
MorethanonehalfofthesurplusgeneratedduetohybridvarietieswasinChinawhereadoption rate for these varieties was highest.This was remotely followed by India,where hybrids were adopted only on 34% of the area. The lowest surplus benefits of hybrid varieties were achieved in Thailand where only 5% farmers used these varieties.
Summary and Policy Implications
ChiliisanimportantvegetableorspiceinAsiaintermsofproductionarea,farmandretailvalue,andpeopleengagedinitsproduction,processingandmarketingactivities.In 2003, it was cultivated on a total area of 2.5 million ha which produced 22.4 million t of fresh weight output having a farm value of US$4.8 billion and a retail value of chili and its products at US$9.5 billion. It engaged about 4.2 million farm families in Asia. The value of its international trade (both import and export) reached US$5.6 billion, and US$664 million of it was for Asia. It provided full time yearly jobs to 3.8 million people atthefarmlevel,andasimilarnumberwasengagedinitsmarketingandprocessingactivities.
WiththerisingimportanceofchiliinAsiabothintermsofdomesticproductionandtrade,thisstudyprovidedatimelyanalysisofthechilisectorinselectedcountriesaswellasworldwide,explainingvariousissuesinthefoodchainasthecommoditypassesfromtheproducerstotheconsumersthroughvariousintermediaries.Itishopedthattheinformation generated will be used in research prioritization to improve the efficiency ofthewholechilisector.Comprehensivesurveysanddiscussionswereconductedwithdifferent stakeholders along the food chain in selected major chili-producing countries of Asia,includingChina,India,Indonesia,andThailand.Thesurveyswereconductedamong
C h i l i ( Capsicum spp.) Food Chain Analysis: Setting Research Priorities in Asia: A Synthesis

49
farmers,marketingagents,processors,andconsumersinthesecountriescoveringatotalof 2,750 respondents. The data collected from these surveys and from secondary sources provided a comprehensive analytical look of the sector. Constraints were analyzed,and policy measures to improve its efficiency at the country levels were forwarded. Moreover, across-country comparisons provided a unique comparative picture of the sectoroperatingundervariousecoregionsandsocioeconomicsetupsandhowvariousstakeholdersinteractwitheachotherundertheseenvironments.Itisexpectedthattheanalyseswillbeusedas anexample toanalyze the foodchainofother agriculturalcommodities,especiallyvegetables.
During the 1990s and early part of the first decade of the 21stcentury,chiliproductionandpercapitaavailabilityincreasedinAsiaaswellasintheworldthroughexpansioninareaaswellasimprovementinyields.Mostofthisincreasewasinthechiliconsumedasfresh,ratherthaninitsdryorpowderedform.Thisisinlinewiththedemandelasticityanalysis,whichsuggestedrelativelyhighelasticityforchiliconsumedasfresh,andaveryinelasticdemandfordryandpowderedchili.Theresearchimplicationsarethatresources allocated to enhance production for dry powdered chili will mainly benefit consumers in terms of low prices, while most of the benefits of enhanced production in freshchiliwillstayatthefarmlevel.Moreover,withincreasedsupply,thechanceofexpandingfreshchiliconsumptionishigher,whichwillhelpmitigatingthemicronutrientdeficiency.
TheinternationaltradeofchiliinAsiaisontheriseaswell,butitstillconstitutedasmallpartofthetotaltradeonchili.ThereweresignsthatrelativecompetitivenessofchilitradeinAsiawasimproving,especiallyinfreshchili,suggestingimprovementsinitsproductionandmarketingsystems.However,withtheopeningupofmarketsandincreasingfreetraderegime,tradecompetitionisstiffening.Therefore,smallercountriesneedtoimprovetheirproductionandmarketingsystemstokeeptheircompetitivenessintheinternationalmarket.Thesecountriesshouldfocusonfreshchilitypesasbothitspricesanddemandhavebeenincreasingatamuchfasterratethanpimentochili.However, thefourAsiancountries includedin thesurveyarenotcurrentlyrealizingthispotentialsincetheywouldratherexpandtheirtradeinpimento.Tomakethisshift,thesecountrieshavetomakechangesintheirproductionsystemsandimprovetheirmarketinginfrastructure.
Estimates suggest that about one-third of chili produced in Asia was consumed as dried and ground mainly for spice, and the remaining two-thirds was consumed as fresh. However,thesesharesvariedacrosscountries.SouthAsiawasthemainconsumerofred,dryandgroundchili,wheretheirshareinthetotalconsumptiongoesashighastwo-thirds. In Southeast Asia, except in Thailand, chili was mainly consumed as fresh.
Mubarik Ali

50
Recentdevelopmentsinchiliproductionpracticeshavetransformeditfromsubsistencetoacommerciallyandeconomicallyviablecrop.Thetransformationstartedwiththeadoptionofimprovedchilivarietiesintheformsofhybridsandopenpollinated.In2002,more than one-half of the chili area was planted to modern varieties. Except in Thailand, theshareofhybridsinthemodernvarietyareadominated.
Alongwiththemodernvarietiescametheintensiveandimprovedcropmanagementpracticesincludinghigheruseofirrigation,fertilizerandpesticide.Inaddition,higherpercentageof seedof thesevarietieswaspurchased,making itmore likely tomeetcommercial quality and sanitation standards. Chili now receives a treatment befitting a commercial crop. For example, most chili fields received fertilizer, manure, and chemical treatments against insects and pests, one-fourth were treated against soil-and seed-borne diseases, one-half were plowed with tractor, 65% had raised beds or furrow, 11% were using straw and another 10% were using plastic sheet mulching. In addition, input use suchasfertilizerandpesticidewascomparabletoanycommercialcrop,andthemajorityofchiliparcels,eveninthedryregionsofIndia,wereirrigated.
Thesetechnologicalinnovationsinchiliproductionhavegeneratedenormouswelfaretofarmersandconsumers.Estimatessuggestthatspreadofhybridchilivarietiesandassociated improved management practices in chili cultivation have generated over US$ 1 billion worth of surplus to consumers and producers. Three-forth of this surplus went to consumers as they enjoyed the lower price of chili and another one-forth to producers asmodernvarietieshadreducedproductioncostforexpandedproduction.
Thevariationinthesemanagementpracticesacrosscountriesandchilitypesprovideampleopportunities to transfersuccessfulexperience inonecountry toanother,andstudytheirimpactonproduction.Forexample,astudyonthefactorsbehindawiderscaleadoptionofseedtreatmentandplasticmulchinginIndonesiaandsoiltreatmentinChinacanhelptopromotethesepracticesinothercountries.Moreimportantly,chilicultivationindifferentcountriesatdifferenttimesoftheyearcanprovideanexcellentopportunityforregionaltrade,whichiscurrentlyatlowlevelwithinAsia.
Byusingthephotosof insectsanddiseasesduringthesurveys, thestudyprioritizedfarmers’perceptionsonmajorinsects,diseases,andweedsinchilicropineachcountry.Tobacco budworm in China, mites in India, thrips in Indonesia, and caterpillar inThailand were the most devastating insects in chili fields; Phytophthora blight, viruses, and anthracnose were considered high-ranking diseases by chili farmers. From the analysis of the disease-infected chili material collected from all over Asia, the virology departmentofAVRDCfoundthatcucumbermosaicvirusandchiliveinalmottleviruswerethemostcommoninthecontinent.Thissurveynoticedotherimportantdiseasespreviously consideredunimportant, such aspowderymildew in India, and fusarium
C h i l i ( Capsicum spp.) Food Chain Analysis: Setting Research Priorities in Asia: A Synthesis

51
wilt in Thailand. The weeds in chili fields were less common across countries. The locallyimportantinsectsanddiseasesshouldbegivenprioritiesinsettingtheresearchanddevelopmentagendaforchiliineachregion.Noteverycountryhastoworkonthetheoreticalaspectofeachdiseaseandinsect.Eachcountryshouldfocusonitsmajordisease, and can benefit from other countries’ work for their major insects and diseases. TheAVRDCshouldfocusonadoptingandpromotingtheintegratedmanagementdiseasesapproaches,andpyramidingtheresistanceformultiplepeststhroughbreeding.
The use of chemicals on chili crop was quite high. On average, 21 sprays were made by chili-growing countries in Asia, with the highest of 53 in Indonesia. Despite an increasinguseof chemicalsonchili, theyield lossesdue to insects anddiseases asperceivedbyfarmersdidnotdecrease;ratherindicationswerethatsuchlossesinfactincreased overtime. For 1998-2002, average losses due to insects and diseases stood at 24% each, the highest in India and lowest in China. The losses were generally higher in openpollinatedimprovedvarieties.Thishasraisedaseriouschallengefortheresearchersandpolicymakersespeciallyinthewakeofincreasedadoptionofmodernvarieties.The need to develop integrated pest management strategies to minimize the use ofpesticide, or improve the efficacy of the pesticide use has never been this important. Identification of appropriate pesticide and fungicide to control major insects and diseases, optimizeapplicationrateandschedule,anddevelopmentofalternativepestmanagementapproachescanreducepesticideuse,andatthesametimehelpreduceyieldlossesduetoinsects and diseases. Such identification is urgently needed in Indonesia and India, where themisguideduseofsamechemicalasfungicideandinsecticidewasverycommon.
Despitethefactthatinsectsanddiseasesareseriousconstraintsinchiliproduction,pestresistancewasnotthetopcriterionforfarmersinselectingchilivarieties.Instead,highyieldandoutputpriceswerethetwomostimportantcriteriaforthefarmersinmakingthisselection.Thisimpliesthatresearchoninsectanddiseaseresistancecannotbesoldtofarmerswithoutenhancementinyieldandincorporationofattributesconsumerspreferinchilisothatproducerscanhavehighpricesfortheiroutputs.Effectivepestanddiseaseresistancevarietieswillservetoincreasethepercentageofthetotalharvestedcropthatismarketable,improvingnetyieldsandproductivity.
The first and second ranking constraints identified by chili farmers in Asia were insects and diseases. Other high-ranking constraints were low and variable prices (variable prices were also partly related with insect and diseases infestation), market problems (like high market and transportation costs) and environment (mainly drought in India and flooding inThailandandIndonesia).Themarketagentsconsideredirregularoutputsuppliesandlackofcapitalasmajormarketingconstraints.Economicanalysispointedouthighcashcosts and high risk involved in chili cultivation as major constraints. Not many chili-growingfarmers,however,mentionedcashrequirementasaconstraint;perhapstheywereabletoovercomethisthroughborrowingorotherincomesources.Reductioninchilicashcosts,suchasforfertilizerandpesticidemayhoweverhelpsmallfarmersto
Mubarik Ali

52
enter in this high-value cultivation. In addition, improved access to credit will not only expand chili production on more efficient farmers, it will bring investment to modernize itsmarketingandprocessingchains.
Theeconomicanalysesacrossvarietiesperformed in thisstudysuggested that localvarietieswereeconomicallylessviablethanmodernvarietiesintermsofnetreturn,benefit-cost ratio, and per-unit output cost in all the survey countries. Among modern varieties,thechoicebetweenopenpollinatedandhybridswaslessclear.InIndia,openpollinatedwaseconomicallyabetteroption,whileinThailandandIndonesiahybridsproduced greater returns and lower per-unit output costs. The success of releasing low-cost economically-competitive open pollinated improved varieties in India was not widely transferred to small farmers. On the other hand, not very successful open pollinated improved varieties were available in Thailand and Indonesia (as benefit-cost ratio and per-unit production cost of these varieties were not significantly different than thelocalraces),hencefarmersresortedtoexpensivehybridschiliseed.Thediffusionof open pollinated (improved) varieties in India need to be enhanced, while in Indonesia and Thailand, the efficiency of research institutes should be improved to enable them to develop economically-competitive open pollinated varieties.
We conclude that expansion of chili cultivation on a large number of farms willhave positive impact on overall rural development through enhanced employmentand income effect, improved resource use efficiency, spill-over effect to other crops, induced agricultural business activities in rural areas, and improved diet. Moreover,the development benefit will trickle down to socially disadvantaged groups, such as women. However, expansion of chili cultivation has limitations because of its lowelasticity.Thissuggeststhatstrategiestoincreasethevolumeofproductionshouldbecarefullyimplemented,asthiswilldramaticallydecreaseitspricesthereforeaffectingthe profitability of chili farmers. However, research and policy should continuefocusingonreducingtheproductioncostandvariabilityinchiliyieldandprices.Theaccompanyingincreaseinproductionwillbeadjustedwiththeadjustmentinareaunderchilicultivationinafewyearstime.Thestrategiessuchasappropriatelytailoringitsproductioncharacteristicstomeetconsumerstastewithinthecounty,andbyexploringforeignmarketscanalsoimprovefarmers’income.Gradingoftheproducttoimproveitsuniformityandqualitycanexpandinternationaldemandandincreasemarketvalueof the output as culls may find its use in processed products.
C h i l i ( Capsicum spp.) Food Chain Analysis: Setting Research Priorities in Asia: A Synthesis

BacterialWilt
Appendix 1. Photos of Pest and Diseases
BacterialSpot
Bacteria
Fungus
Anthracnose Phytopthora blight
53Mubarik Ali
Jaw
-fen W
ang (
AV
RD
C)
Jaw
-fen W
ang (
AV
RD
C)
Tie
n-c
hen W
ang (
AV
RD
C)
Tie
n-c
hen W
ang (
AV
RD
C)

Virus
Cucumber Mosaic Virus
Chili Veinal Mottle Virus
54 C h i l i ( Capsicum spp.) Food Chain Analysis: Setting Research Priorities in Asia: A Synthesis
Sylv
ia G
reen (
AV
RD
C)
Sylv
ia G
reen (
AV
RD
C)

Leafcurl Virus
Tomato Spotted Wilt Virus
Tobamo Virus Potato Virus Y
55Mubarik Ali
Sylv
ia G
reen (
AV
RD
C)
Sylv
ia G
reen (
AV
RD
C)
J.K
. B
row
n (
Univ
ers
ity o
f A
rizo
na)
John C
ho (
Univ
ers
ity o
f H
aw
aii)

Insect
Aphids
Thrips
Mites
56 C h i l i ( Capsicum spp.) Food Chain Analysis: Setting Research Priorities in Asia: A Synthesis
Low
el B
lack
(AV
RD
C)
Low
el B
lack
(AV
RD
C)
Low
el B
lack
(AV
RD
C)


Introduction
People’s Republic of China
Yong Liu, Zhanhong Zhang, Xinqiu Tan, Mei-huey Wu, and Mubarik Ali
Chili (Capsicumannum) was introduced in China by Spanish and Portuguese traders more than 400 years ago (Chen 2000). Since then, it has become a popular vegetable crop throughout the country. In 2003, chili (greenand pimento) was cultivated on 337thousand ha, with a total production of 12.4 million t (FAOSTAT 2004). The total trade of chili to and from China reached US$128million.Arecentboostinchiliproductionand trade has placed China at the top position in the list of chili-producing and trading countriesoftheworld.ChiliisnowbecomingoneofthemosteconomicallyviablecropsinsomeprovincesofChina.Withitsincreasingimportanceintheproductionsystemofsomeprovinces,astudytocapturethefarm,market,andhouseholdperspectivesisneeded.Thisstudywasconductedtoprovideacomprehensivepictureoftheissuesaschilimovesfromthefarmtothehouseholdtable.Thedatafromsecondarysourcesaswellasthroughsurveysfromvariousstakeholdersalongthechilifoodchainwereusedintheanalysis.AlongwiththeexpansioninchiliproductioninChina,amajorshiftisoccurringacrosschili producing areas. Until 1995, Hunan province was the main chili production area with 70,000 ha, accounting for almost 80% of the total chili production of China. Since then, the production of chili has spread throughout the country. In 2003, Hainan became the top chili-producing province (Table 1). One of the reasons for this shift was the higher yieldobtainedinHainanbecauseofitstropicalclimatethatallowsgrowingtwochilicropsperyear.Generally,yieldishigherintheSouthernprovincesthanintheNorthernprovinces.
Table 1. Regional shares in area, production, and per ha yield of chili in China, 2003
Province Share in area (%) Share in production (%) Fresh yield (t/ha)Hainan 43.3 64.7 70.0Hunan 20.0 12.8 30.0Sichuan 12.0 7.4 29.0Guangdong 10.0 5.8 27.0Jiangxi 5.3 3.5 31.0Jiangsu 3.3 2.0 28.0Shanxi 3.3 2.1 29.0Other provinces 2.7 1.8 31.0
Total* 150 7,034 46.9Source: Official file data from Hunan Vegetable Institute.*1000 ha unit in area and 1000 t unit in production.

Collection of Farm Data Results
The data for this study was gathered from various stakeholders involved in chiliproduction and marketing. Respondents were chili and non-chili farmers, housewives of thefarminghouseholdsandcitydwellers,chiliprocessors,andmarketingagents.ThesedataweregatheredfrommajorchiliproducingprovincesofChina,i.e.Hunan,SichuanandGuangdong.1Threehundredfarmersequallydistributedacrossthethreeprovinceswere proposed to be interviewed. To provide flexibility for outlier farmers, however, a total of 322 farmers, comprising of 293 (91%) of chili-growing and 29 (9%) of non-chili farmers were randomly selected and interviewed in a three-stage random sampling process explained in the Synthesis chapter (Table 2).
Three hundred and twenty-nine women of farming households and sixty city households were interviewed on chili consumption. Six chili processors and forty-five chili marketing agentswereincludedinthesurvey.
1 Despite the recent increase in chili production in Hainan province, it was not included in the survey because of the logistic reasons as it lies far away from the collaborating partners based in Hunan.
Table 2. Distribution of sample size by province and type of respondents in China, 2002
Respondent Hunan Sichuan Guangdong Total
Farmers 105 107 110 322
Chili grower 96 97 100 293
Non-chili grower 9 10 10 29
Farm household wife 110 109 110 329
City household wife 20 20 20 60
Processor 2 2 2 6
Market agent 15 15 15 45
Macro Trends
Domestic Production
Chili production in China increased from 3.9 to 12.4 million t at the rate of 9.7% from 1991-2003. Most of this increase came from the expansion in area from 122 to 337 thousandhaduringthesameyearsatanaverageannualrateof8.9% (Table 3). The per-ha yieldremainedalmoststagnant.Acorrespondingincreaseinthevalueofchiliproductionfrom US$359 to 1,365 million was observed, although the price remained fluctuating between US$92 and US$125 per t of fresh weight chili equivalent.
59Yong Liu, Zhanhong Zhang, Xinqiu Tan, Mei-huey Wu, and Mubarik Ali

Table 3. Area, production, and yield of chili in China, 1991-2003
Year Area (ha)1 Production (t of fresh weight)2 Fresh yield (kg/ha) Farm value
(million US$)3
1991 121,936 3,880,656 31,825 358.801992 115,227 4,097,187 35,558 489.701993 153,672 5,013,744 32,626 481.071994 173,495 5,740,603 33,088 649.821995 181,216 6,192,178 34,170 772.591996 206,235 7,245,360 35,132 767.631997 224,582 7,833,114 34,879 739.281998 234,645 8,103,127 34,534 754.621999 255,869 8,701,175 34,006 881.082000 286,609 10,284,452 35,883 988.652001 301,544 10,743,584 35,629 1,084.592002 322,000 11,414,871 35,450 1,244.862003 337,297 12,448,723 36,907 1,364.83
Growth rate (%) 8.9 9.7 0.8 9.6
Source of basic data: FAOSTAT database, 2004.
1 Area under fresh and green chili reported in FAO statistics was divided by two to represent the year-round area, rather than area under each season.
2 Area and production include fresh chili and pimento. The production of the latter was reported in ground or dry form, and was converted into fresh weight by multiplying with four.
3 Estimated using the producers’ prices reported in FAO-Agricultural data (producers prices). Prices in local currency were converted into US$ by using the annual average exchange rates reported in [email protected] (various issues).
http://faostat.fao.org/faostat/form?collection=Trade.CropsLivestockProducts&Domain=Trade&servlet=1&hasbulk=0 version=ext&language=E
International Trade
The country’s international trade in chili increased exponentially (Table 4). The total volume of trade increased from 134 to 547 thousand t from 1991 to 2003, with the rate of increase in export volume and value higher than that of imports, increasingChina’s trade surplus. In 2003, the country experienced the largest trade surplus at 524 thousand t earning US$121 million net of import cost. Despite all these positive trends ininternationaltrade,mostofthechiliproducedinChinawasforlocalconsumption,withlessthanfivepercentforexport.
Thetradesurpluswas the result of improved terms of trade for chili as reflected by the widening gap between import and export prices (Figure 1). In the early 1990s, export priceswerehigherthanorequaltoimportprices.Theformerjumpedtorecordlevelin 1996. Since then it continuously declined, finally reaching an even lower level than in 1990. On the other hand, import prices were generally rising. Consequently, export prices fell significantly lower than the import prices. The drop in export prices since 1996 may reflect improvements in chili production and marketing technologies, while
60 People's Republic of China

0
0.2
0.4
0.6
1991 1992 1993 1994 1995 1996 1997 1998 1999 2000 2001 2002 2003
Year
Price
(US$
/kg) Import
Export
increase in import prices may reflect shift in consumers’ taste and preferences for betterqualitychiliwithimprovementintheirincome.Ifthesetrendscontinue,Chinaisexpectedtosoonbecomeamajorplayerininternationalchilitrade,especiallywiththetradeliberalizationregime.
Table 4. International trade in fresh chili, China, 1991-20031
YearImport Export Total trade Trade surplus
Quantity(t)
Value(1000US$)
Quantity(t)
Value(1000US$)
Quantity(t)
Value(1000US$)
Quantity(t)
Value(1000US$)
1991 9,416 1,978 125,002 34,668 134,418 36,646 115,586 32,6901992 48,021 10,767 138,386 45,405 186,407 56,172 90,365 34,6381993 5,614 1,044 195,236 43,039 200,850 44,083 189,622 41,9951994 8,540 2,142 243,210 50,160 251,750 52,302 234,670 48,0181995 9,664 1,872 167,749 68,891 177,413 70,763 158,085 67,0191996 12,929 4,341 138,064 76,010 150,993 80,351 125,135 71,6691997 8,507 3,603 212,952 72,603 221,459 76,206 204,445 69,0001998 7,117 2,899 237,736 57,886 244,853 60,785 230,619 54,9871999 9,359 3,346 205,665 47,696 215,024 51,042 196,306 44,3502000 9,713 3,764 259,982 51,366 269,695 55,130 250,269 47,6022001 11,235 5,364 352,174 68,820 363,409 74,184 340,939 63,4562002 10,873 3,280 389,980 78,671 400,853 81,951 379,107 75,3912003 11,413 3,654 535,289 124,342 546,702 127,996 523,876 120,688
Growth rate (%) -2.1 3.7 9.6 6.2 8.6 5.8 10.9 6.7
Source: FAOSTAT Agricultural data.http://faostat.fao.org/faostat/form?collection=Trade.CropsLivestockProducts&Domain=Trade&servlet=1&hasbulk=0&version=ext&language=EN1 Includes fresh chili and pimento. The production of latter was reported in grounded form, which was converted into fresh weight by multiplying it by four.
Source: Estimated from import and export quantity and value figures in Table 4.Figure 1. Trend in import and export prices of chili in China, 1991-2003
61Yong Liu, Zhanhong Zhang, Xinqiu Tan, Mei-huey Wu, and Mubarik Ali

Climate of the Study Area
The climate in the study areas can be classified as sub-tropical in Guangdong province but sub-temperate in Hunan and Sichuan. The monthly average temperature in Hunan and Sichuan can go near freezing point during winter (although the daily temperature can be as low as 15 below freezing). Low temperatures below 10oCprevailforalongperiod,in November-March in Hunan and Sichuan making crop production activity, especially chili, difficult. In Guangdong, the temperature rarely falls below 15oC.InAugust,themaximumtemperaturereaches25oC in all the three provinces (Figure 2).
InGuangdong,therainyseasonislongandprecipitationrateishigh.TherainyseasoninSichuanisshortandcomeslateinJulyandAugust,whileprecipitationrateinHunanand Guangdong comes early in May and June. Very little precipitation (including snow) is experienced in Sichuan province in November-March. This precipitation gradually increases and reaches 240-250 mm in July-August. In Hunan and Guangdong, some precipitation or snow starts in February and reaches maximum in May-June. In Guangdong, the high rainfall continues in July-August (Figure 2). This broader rainfall pattern can helpspreadchilicultivationovertimeandreduceseasonalityinchilisupply.
Figure 2a. Mean temperature in the study areas in China
Figure 2b. Mean rainfall in the study areas in China
Source: Downloaded from “http://www.weatherbase.com/weather/city.php3?c=ID&refer=” and then city name
5
10
15
20
25
30
Jan Feb Mar Apr May Jun Jul Aug Sep Oct Nov Dec
Tem
pera
ture
(o C)
Guangdong Hunan Sichuan
0
100
200
300
Jan Feb Mar Apr May Jun Jul Aug Sep Oct Nov Dec
Rain
fall(
mm
)
Guangdong Hunan Sichuan
62 People's Republic of China

63
Farm and Farmer Characteristics
Socioeconomics Characteristics
On average, chili farmers had slightly bigger farm size (although the difference is not significant) as they own slightly more land but had lower percentage of cultivable area and land use intensity.Thus, cropping intensity was the same on both farms. Landfragmentation was higher on chili-growing farms. Surprisingly, the education of the chili household head was slightly lower compared to their counterparts in non-chili-growing families. The chili and non-chili farmers were similar with respect to family size,ageoffarmer,lengthoffarmingexperience,anddistanceoftheirfarmstopavedroad (Table 5).
Characteristic Chili farmer Non-chili farmerFarm size (ha) 0.39 0.30Owned area (ha) 0.39 0.30Cultivated area (% of farm size) 87 97Chili area (ha) 0.10 -Land use intensity (%) 87.7* 97.3Cropping intensity (%) 101 102Land fragmentation (no.) 2.0* 1.8Farmers have some tenanted land (%) 5.1 6.7Age of the farmer (year) 40.6 41.2Education of family (year) 6.8 7.3Education of household head (year) 7.6* 8.5Family size (no.) 4.0 3.6Family labor availability (number) 1.80 1.61Farmer experience in agriculture (year) 21.3 20.6Farmer experience in chili production (year) 12.6 0.0Distance from paved road (km) 0.6 0.5Distance from vegetable market (km) 3.5 2.9Off-farm income (Yuan/year) 9,487* 5,986
Table 5. Characteristics of farmers in the sample areas, by farmer type, China, 2002
* implies that the values across the two groups of farmers are significantly different at 10% level.
In terms of living conditions, both chili and non-chili farm households were quite similar intermsofthegeneralconditionofthehome,constructionmaterialsused,houseareaand area covered, source of drinking water, and means of transportation owned (Table 6). Similarproportionoffarmersownedhouseholdappliancesliketelevisionandrefrigerator.This indicated that both chili and non-chili farmers in the sample had similar living standards.
Yong Liu, Zhanhong Zhang, Xinqiu Tan, Mei-huey Wu, and Mubarik Ali

64
Table 6. Household living conditions and possession of appliances of farmers in the sample areas, by farmer type, China, 2002
Assets/appliances Chili farmer Non-chili farmerHouse condition (% of farmers) Below average 7 7 Average 64 69 Above average 30 24House construction (% of farmers) Mud, local stone 7 0 Bricked, cemented 93 100House area (m2) 237 204Covered area (m2) 136 132Source of drinking water (% of farmers) Government water supply 25 31 Private pump 12 7 Open well/artesian well/others 63 62Transportation (% of farmers own) Motor vehicles 54 62 Bicycle 97 100Home appliance (% of farmers own) TV 97 100 Refrigerator 30 24 Radio/cassette player 44 34
Assets and Farm Machineries
Themostcommonlyavailablemachineryintheareawassprayerfollowedbytillagemachine and water pump (Table 7). In general, both groups possessed similar number of farm machinery, but chili farmers kept more animals, especially pigs, than non-chili farmers.
Table 7. Ownership of farm machinery and livestock inventory of farmers in the sample areas, by farmer type, China, 2002
Farm machinery/livestock inventory Chili farmer Non-chili farmerFarm machinery (number) Tractor 0.01 0.00 Water pump 0.26 0.21 Sprayer 1.09 1.07 Tillage machines 0.32 0.21Livestock (number) Bullock and calf 0.29* 0.10 Hen and duck 14.13 15.59 Pigs 3.91* 2.34 Standard Animal Unit (SAU)** 7.50 6.48
* implies that the values across the two groups of farmers are significantly different at the 10% level.** The SAU was estimated as: 0.93 buffalo + 1.08 cow + 0.5 pig + 0.19 goat + 0.4 young sock+ 0.75 donkey.
People's Republic of China

65
Land and Soil
The majority of the sample farms were in the plain fields, irrespective of farm types. They were located away from the river, although a significant proportion was also along the riverbank (Table 8). A relatively higher proportion of non-chili farms had fields away from theriverbank.Basedonfarmers’perception,mostsoilsinthestudyareaweremediumin texture and were well-drained. The distribution of soil texture across the two groups did not vary significantly, although more non-chili farmers had better drained soils.
Land and soil type Chili farm Non-chili farm
Land form (% of parcels) Slope with terrace 4.3 0
Slope without terrace 15.9 18.9
Plain on the river bank 37.8* 24.5
Plain away from the river bank 42.1* 56.6
Soil texture (% of parcels) Heavy 0.5 0
Medium 58.5 66.0
Light 41.0 34.0
Drainage (% of parcels) Well drained 66.0* 83.0
Medium drained 32.9* 17.0
Poor drained 1.1 0* implies that the values across the two groups of farmers are significantly different at 10% level.
Table 8. Land form, drainage, and soil texture in the sample areas by farm type, China, 2002
Varieties and Cropping Patterns
Chili Varieties
The sample farmers planted a number of varieties. Majority of the sample parcels (over 90%) were planted to hybrids (Table 9); Xiangyan19 was the major hybrid variety while Panjiadajiao and Qinyeguangpi were the dominant open pollinated varieties.
Yong Liu, Zhanhong Zhang, Xinqiu Tan, Mei-huey Wu, and Mubarik Ali

66
Table 9. Chili varieties grown in the sample areas, by chili type,China, 2002
Hybrid Open pollinatedName of variety Percentage of parcels Name of variety Percentage of parcels
Xiangyan19 40.5 Panjiadajiao 50.0Xiangyan5 14.1 Qinyeguangpi 46.9Xiangyan9 13.4 Suanjiaoguangpi 3.1Xiangyan15 11.7 Total 9.7Hangyou1 3.7Jianggan2 3.7Xiangyan21 3.7Ningjiao5 2.3Xiangyan10 1.7Xiangyan11 1.7Xiangyan1 1.3Xiangyan4 1.0Xiangyan2 1.0Xuefeng2 0.3 Total 90.3
Intercropping in Chili Fields
Almost all hybrid chili growers practiced single cropping, while open-pollinated growers practiced intercropping and relay cropping on a very limited scale only (less than one percent).
Cropping Pattern
Only one crop per year was planted in the chili fields. Farmers usually follow chili-chili rotation for many years (Table 10). Hybrids were planted and harvested earlier than the open pollinated varieties - cultivation period (from nursery to harvest) was last week of December to the second week of October in hybrids, compared to the third week of February to the fourth week of November in open-pollinated varieties.
Chili farmer Planting time (week and month)
Harvesting time (week and month)
Starting date Ending date
Hybrid 4th December 4th May 2nd October
Open pollinated 3rd February 1st July 4th November
Overall 2nd January 1st June 2nd October
Table 10. Chili-based crop rotations in the sample areas, by chili type, China, 2002
People's Republic of China

67
Chili was one of the major crops grown on chili farms, occupying about one-third of thefarmarea,whichreducestheareaallocatedforothercropsonthesefarms.Hence,the shares of cereals, other economic crops, and vegetables were significantly lower on chili-growing farms compared to the non-chili farms (Table 11).
Crop
Chili farmer Non-chili farmer
Area (ha) Share (%) Area (ha) Share (%)
Chili 0.10 30.0 0.00 0.0Cereals 0.14 41.0 0.16 53.0Commercial crop 0.01 4.3 0.04 12.2Other vegetables 0.05 16.5 0.07 25.2Beans 0.00 0.0 0.00 0.8Others 0.03 8.2 0.03 8.8Total 0.34 100.0 0.30 100.0
Note: Cereals include rice, potato, corn, taro; Commercial crops comprise of cotton, and sugarcane; Beans include French bean; Other vegetables are brassica, watermelon, eggplant, lettuce, bitter gourd, pumpkin, fragrance melon, sponge gourd, cucumber, rape, and other unspecified vegetables; Others include fruit trees, and horticulture seedling.
Table 11. Cropping pattern in the sample areas, by farmer type, China, 2002
Source of Information and Chili Variety Selection
Seed
Themajorsourceofinformationonnewvarietiesofseedswasfellowfarmers,extensionagents and seed retailers (Table 12). There is a need to improve farmers’ contact with extensionagentssothatthefarmerscangetunbiasedinformationonvarieties.
Table 12. Source of information on seed by farmers in the sample areas, by chili type, China, 2002
Source of informationChili farmer (%)
Hybrid Open pollinated
Extension agent 28 0Farmer 31 0Seed center 17 0Seed retailer 24 0Own farm 0 100
Yong Liu, Zhanhong Zhang, Xinqiu Tan, Mei-huey Wu, and Mubarik Ali

68
Selection of Chili Variety
Variety selection was affected by many factors. Farmers ranked five major factors accordingtodegreeofimportance;marketpriceandperhayieldswereconsideredthemost important irrespective of chili types (Table 13). In case of green and powder type chilies,perhayieldwasgiventhehighestpriority,whileinredandsweetchiliesmarketprice was the most important factor. Other factors having importance in variety selection wereresistancetodiseaseandinsectattack,appearance,hardnessandthicknessoftheflesh.
Table 13. Ranking of factors in the selection of chili variety in the sample areas, China, 2002
Characteristics Overall rank
Green Red Sweet Powder
Market price 2 1 1 2
Yield 1 2 2 1
Disease free 3 4 3 -
Insect free 4 5 4 -
Appearance 5 3 5 3
Thick flesh - - - 5
Hardness - - - 4
Chili Market Information
Farmersobtaininformationonchilioutput,suchaspriceandtechnology,mainlyfromneighboring farmers and traders (Table 14). Government agencies were also important sources,particularlyforopenpollinatedchili.Televisionandcooperativeswererelativelylessimportantinformationsources.
Table 14. Source of chili marketing information of farmers in the sample areas, by variety, China, 2002
Chili Variety
Source (% of farmers) Rank
Neighbor farmer
News-paper
Trader
TV
Radio
Other
Neighbor farmer
News-paper
Trader
TV
Radio
Other
Hybrid 37 29 13 9 5 6 1 2 3 4 5 6OP* 30 30 23 11 5 0 1 2 3 4 5 0Overall 36 29 15 9 5 6 1 2 3 4 5 6
*OP= open pollinated.
Note: Highest rank =1; lowest rank =5.
People's Republic of China

69
Insect and Disease Problem
Insects
Allfarmersreportedinsectsasaprobleminbothopenpollinatedandhybridchilitypes.Intermsoffrequencyofoccurrenceaswellasfarmers’perception,tobaccobudwormwasthemostimportantinsectinbothfarmtypes,followedbymitesinhybridandaphidsin open pollinated varieties (Table 15). Other important insects on hybrid type chili were aphidsandthrips,whilemiteswerethethirdrankinginsectsinopenpollinatedtype.Average losses due to insect attack were relatively low at 6.5% per crop season compared tothatinothercountrieslikeIndia,IndonesiaandThailand.Althoughtheselosseshadreduced from eight percent in the last five years, insect phenomenon remained a regular occurrencethroughouttheperiod.
Table 15. Major insects in chili as perceived by farmers in the sample areas, by chili type, China, 2002
Chili variety
Farmers reporting insect attack (%) Rank1
Occurrence (year out
of 5)Average
losses (%)
Thrips Aphid Mites Tobacco budworm
Other 1 2 3 4 1993-97
1998-2002
1993-97
1998-2002
Hybrid 6.4 18.9 23.8 50.5 0.5 C M A T 5 5 8.2 6.5
Open pollinated 0.0 26.8 17.0 56.3 0.0 C A M - 5 5 6.8 6.6
Overall 5.7 19.7 23.1 51.1 0.4 C M A T 5 5 8.0 6.5
Note: A=Aphid (Aphis gossypii and Myzus persicae); C= Tobacco budworm (Heliothis sp.); M=Mites (Polyphagotarsonemus latus); T=Thrips (Scirtothrips dorsalis).1 The rank of 1 is the most devastating and 4 the least devastating insect.
Diseases
All farmers also reported disease epidemic on their chili fields. Most farmers identified theinfestationofPhytophthorablight,anthracnoseandviruses2 in chili fields ranked in that order of importance both in open pollinated and hybrid varieties (Table 16). Similar withinsectattack,averagelossesduetodiseasesalsodecreasedfromabouteightpercentin 1993-1997 to seven percent in 998-2002 mainly in hybrid type chili. However, these lossesshouldbecarefullyextrapolatedforwholeChina,asthesampledidnotincludethemainchiligrowingareas in thetropics likeHainanwherelossesmaybehigher.Occurrence of diseases remained a regular phenomenon every year.
2 Farmers were not able to identify the specific virus or its principal vector attacking their chili crops.
Yong Liu, Zhanhong Zhang, Xinqiu Tan, Mei-huey Wu, and Mubarik Ali

70
Chili varietyFarmers reporting
diseases (%) Rank1 Occurrence (years)
Average losses (%)
PH AN VR BW Other 1 2 3 4 1993-97 1998-2002 1993-97 1998-2002
Hybrid 30 26 20 13 12 PH AN VR BW 5 5 8.3 6.9
Open pollinated 34 33 28 1 4 PH AN VR - 5 5 6.5 6.9
Overall 30 26 21 12 11 PH AN VR BW 5 5 8.1 6.9
Table 16. Major diseases in chili as perceived by farmers in the sample areas, by chili type, China, 2002
Note: AN= Anthracnose (Colletotrichum acutatum, C. capsici and C. gloeosporioides); BW=Bacterial wilt (Ralstonia solanacearum); PH=Phytophthora blight (Phytophthora capsici); VR=Viruses.1 The rank of 1 is the most devastating, and 4 the least devastating disease.
Farm Management Practices
Similarwithinsectsanddiseases,farmersalsofacedweedproblemseveryyear.Theaverage loss due to weeds was about two percent, and remained the same over time (Table 17). The most common weed, both in hybrid and open pollinated types was Echinochloacrusgalli. This weed was also ranked first in terms of its devastating effect on chili, followedbyPortulaca oleracea inhybrid,andCyperusdifformis inopenpollinatedchilitype.
Table 17. Major weeds found in chili fields in the sample areas, by chili type, China, 2002
Chili varietyFarmers reporting (%)* Rank1 Occurrence Average loss (%)
EC PO DI CY SE OT 1 2 3 4 1993-97 1998-2002 1993-97 1998-
2002
Hybrid 20.3 17.6 16.0 11.7 11.7 22.6 EC PO DI EL 5.0 5.0 2.2 2.1
Open pollinated 25.4 13.1 10.7 18.9 2.5 29.5 EC CY PO EQ 5.0 5.0 2.7 2.4
Overall 20.8 17.1 15.4 12.5 10.8 23.3 EC PO DI EL 5.0 5.0 2.3 2.2Note: EC=Echinochloa crusgalli; PO=Portulaca oleracea L.; DI=Digitaria sanguinalis; CY=Cyperus difformis; EL=Eleusine indica; EQ=Equisetum ramosissimum desf; SE=Setaria viridis; OT=Other.1 The rank of 1 is the most devastating, and 4 the least devastating weed.
Preparation of Seedling Nursery
Allrespondentfarmerspreparednurseriesorpurchasedseedlingsandnoneuseddirectseedingmethod togrowchili.Nurserywas started inwinter inDecember and tookuntilMarchtoattaintherequiredsizeduetolowtemperature.Nurserieswerepreparedin specialhouseswith specialheating facilities, tremendously increasing thecostofseedlinginChina.
People's Republic of China
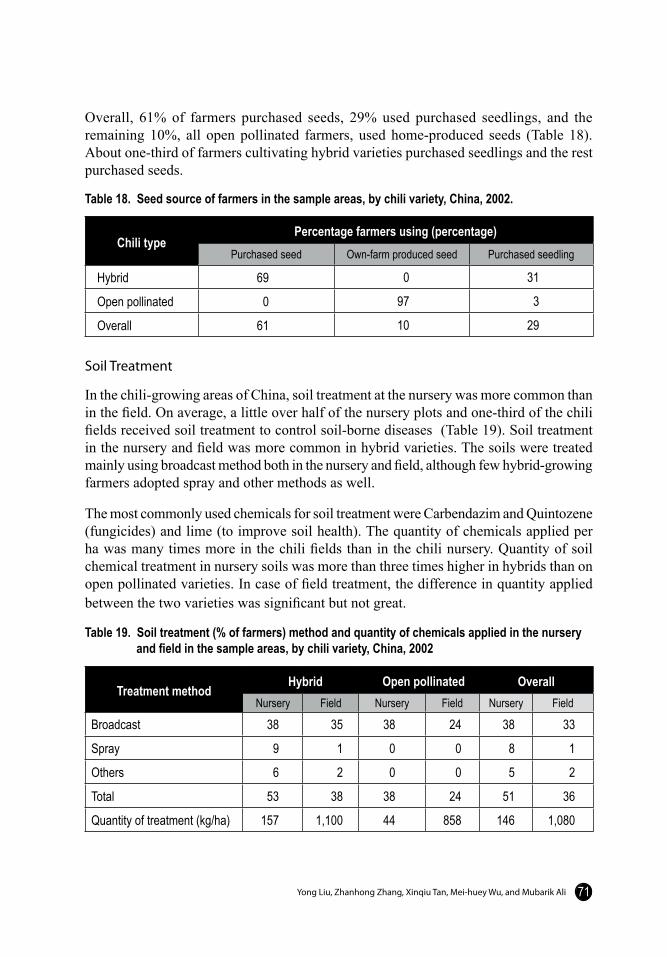
71
Overall, 61% of farmers purchased seeds, 29% used purchased seedlings, and the remaining 10%, all open pollinated farmers, used home-produced seeds (Table 18). About one-third of farmers cultivating hybrid varieties purchased seedlings and the rest purchasedseeds.
Table 18. Seed source of farmers in the sample areas, by chili variety, China, 2002.
Chili typePercentage farmers using (percentage)
Purchased seed Own-farm produced seed Purchased seedling
Hybrid 69 0 31
Open pollinated 0 97 3
Overall 61 10 29
Soil Treatment
In the chili-growing areas of China, soil treatment at the nursery was more common than in the field. On average, a little over half of the nursery plots and one-third of the chili fields received soil treatment to control soil-borne diseases (Table 19). Soil treatment in the nursery and field was more common in hybrid varieties. The soils were treated mainly using broadcast method both in the nursery and field, although few hybrid-growing farmersadoptedsprayandothermethodsaswell.
ThemostcommonlyusedchemicalsforsoiltreatmentwereCarbendazimandQuintozene(fungicides) and lime (to improve soil health). The quantity of chemicals applied per ha was many times more in the chili fields than in the chili nursery. Quantity of soil chemicaltreatmentinnurserysoilswasmorethanthreetimeshigherinhybridsthanonopen pollinated varieties. In case of field treatment, the difference in quantity applied between the two varieties was significant but not great.
Table 19. Soil treatment (% of farmers) method and quantity of chemicals applied in the nursery and field in the sample areas, by chili variety, China, 2002
Treatment method Hybrid Open pollinated Overall
Nursery Field Nursery Field Nursery Field
Broadcast 38 35 38 24 38 33
Spray 9 1 0 0 8 1
Others 6 2 0 0 5 2
Total 53 38 38 24 51 36
Quantity of treatment (kg/ha) 157 1,100 44 858 146 1,080
Yong Liu, Zhanhong Zhang, Xinqiu Tan, Mei-huey Wu, and Mubarik Ali

72
Seed Treatment
Overall, less than one-fourth of farmers treated chili seeds (Table 20). The treatment wasmorecommoninopenpollinatedthaninhybridchilitype.Theseedwassoakedforabout five hours in hybrids and less than two hours in open pollinated varieties. A few farmersalsodustedchiliseedwithfungicideorinsecticide.ThemostcommonlyusedchemicalfordustingwasFludioxonil,afungicide.
Table 20. Seed treatment (% of farmer) method in the sample areas, by chili variety, China
Chili variety Soaking Dusting Overall
Hybrid 17 6 23
Open pollinated 29 3 32
Overall 18 5 23
Plowing
All chili farmers plowed their fields before cultivation (Table 21). Majority of the fields wereplowedmanuallyorbyanimals.Theuseoftractorwasrare.Thefrequencyofanimal use for land preparation was highest for open-pollinated chili type. On average, onlyoneplowingwasdone.
Table 21. Land preparation method practiced in the sample areas, by chili type, China, 2002
Chili type
Percentage of parcels Number of operation
Plowing Harrowing Plowing HarrowingHand Animal Tractor Others1 Total Hand Animal Others2 Total
Hybrid 52 43 5 * 100 66 6 1 73 1.0 0.8
OP3 23 74 0 3 100 74 13 0 87 1.1 0.9
Overall 49 46 4 1 100 67 6 1 75 1.0 0.8* implies less than 0.5 percent. 1This includes hand+animal and hand+tractor; 2This includes tractor and hand+animal; 3Open pollinated.
Harrowingwasdonemainlybyhandbothintheopenpollinatedandhybridchilitypes.The use of animals or other draft power for harrowing was very limited. On average, onlyoneharrowingwasdone.
Bed Type
All sample farmers planted the crop in furrows or on raised beds. About one-half of the hybrid parcels had raised-beds and the remaining were of furrow type, while the majority of open pollinated fields had raised-beds. The plant-plant distance in open pollinated chili wasalsomorethandoublethatinthehybridtypepossiblyduetothebushynatureofopen
People's Republic of China

73
pollinated chili plants and straight and less vegetative nature of hybrid varieties. (Tale 22). The average height of raised-bed and furrows was estimated at 26 cm and width at 158 cm. There was no difference in the dimensions between raised-bed and furrows. Average inter-plant distance was estimated at 29 cm. The growers of open pollinated varieties makerelativelybiggerseedbedcomparedwiththosemadeforhybridvarieties.
Table 22. Bed type, dimensions, and inter-plant distance of chili plants in the sample areas, by chili variety, China, 2002
Chili varietyBed type (% of farmer)
Height (cm) Width (cm) Plant to plant distance (cm)Furrow Raised bed
Hybrid 48 52 25 158 26
Open pollinated 10 90 32 165 54
Overall 43 57 26 158 29
Mulching, Staking, and Tunneling
About one-third of chili farmers practiced mulching, both in hybrid and open pollinated type of chilies (Table 23). In open pollinated chili type, simple straw was used as mulching material, while in hybrid different mulching materials were used. One-third of the mulching materials was nylon net or black poly-woven fabrics. Foil or plastic sheetingwasalsousedinhybridchilitypeeitheraloneorincombinationwithstraworsawdust.Afewhybridparcelsreceivedonlystraworsawdustmulch.Theaveragelifeoffoilandnylonnetwasaboutoneyear.
Table 23. Use of mulching material (% of farmer) in chili cultivation in the sample areas, by chili variety, China, 2002
Material type Hybrid Open pollinated Overall Farmer used mulching 33.5 30.0 33.2 Rice straw 3.6 30.0 6.8 Sawdust 8.6 0 7.6 Foil (plastic sheeting) 5.0 0 4.4 Nylon nets 11.3 0 10.0 Straw + foil 3.2 0 2.8 Sawdust + foil 1.8 0 1.6
Yong Liu, Zhanhong Zhang, Xinqiu Tan, Mei-huey Wu, and Mubarik Ali
Very few farmers (3 out of 322) used bamboo sticks or wooden stakes for the hybrid varieties (Table 24). These were nearly half meter long and pegged at a 38-cm distance, thusthenumberofsticksusedperhectarewasmorethan52thousand.Thestickslastedforonlyoneyear.

74
Plastic films and plastic nets were used for making tunnel in chili fields in the study areas. The use of plastic films was more common among hybrid chili growing farms while plastic nets were more commonly used for open pollinated variety fields. The size (height, width and length) of tunnels was bigger in hybrid than in open-pollinated chili fields. The average lifespan of the tunnels for hybrid and open pollinated variety was threeyearsandoneyear,respectively.
Mulching and tunnel construction mostly went together. For example, only 10% of parcels had tunnels without mulch, while 37% of fields had tunnels with mulch. About 29% of the fields were mulched without tunnels, and 24% parcels had no tunnels and nomulching.
Table 24. Tunnel material type, life, and size used in the sample areas, by chili variety, China, 2002
Chili varietyTunnel material type (% of parcels) Tunnel life
(year)Tunnel size (m)
Plastic film Plastic nets Height Width Length
Hybrid 46.9 6.6 3.2 1.7 3.9 13.4
Open pollinated 10.0 36.7 1.0 0.4 1.7 4.8
Overall 42.6 10.2 3.0 1.6 3.6 12.5
Fertilizer Application
In China, almost all chili farmers applied both organic and inorganic fertilizers. Poultry manurefollowedbygreenmanurewerethemostcommonappliedorganicfertilizers.(Table 25). Only a very small percentage of farmers in hybrid fields (less than one percent) usedcattlemanure.Allfarmersappliedmanurebeforetransplantingofseedling.
Differentmethodsofinorganicfertilizerapplicationwereused.Inhybridchili,halfofthefarmersusedfertilizerplacementmethod,whilebroadcastwasthedominantmethodinopenpollinatedchili.
Table 25. Use of manure types and method of inorganic fertilizer application (% of farmer) in the sample areas, by chili variety, China, 2002
Chili varietyOrganic fertilizer or manure
(% of farmers)Method of inorganic fertilizer application
(% of farmers)Cattle Poultry Green Mixed Total Broadcast Placement Irrigation Total
Hybrid 0.4 76.7 15.7 5.0 97.7 37 48 15 100
Open pollinated 0 93.6 3.2 3.2 100.0 44 27 29 100
Overall 0.3 78.5 14.3 4.8 98.0 37 46 17 100
People's Republic of China

75
Weeding
Weeds were removed manually from all open pollinated and 85% of hybrid chili fields (Table 26). On average, weeding in open-pollinated fields was done thrice, and twice in hybrid type fields. Most farmers (about two-thirds) believed that manual weeding is only partially effective, controlling 50% of weeds. Only three percent of farmers in hybrid and no one in open-pollinated fields believed that the weeding method they use was 100% effective.
Table 26. Extent, method, and perceived effectiveness of non-chemical weeding in the sample areas, by chili variety, China, 2002
Chili variety Parcels received
weeding (%)Number of weeding
Method (% of farmers)
Effectiveness (% of farmers)
Manual weeding Others 100% 75% 50%
Hybrid 85 2.1 98.7 1.3 2.9 26.3 69.8
Open pollinated 100 3.2 100.0 0 0 51.6 48.4
Overall 87 2.3 98.8 1.2 2.5 29.7 67.0
All farmers also used herbicide to control weeds. Over 90% of farmers applied herbicide (generally Glyphosate) using backpack sprayers (Table 27). Majority of farmers (97%) thought that the use of herbicide was only 75% effective.
Table 27. Method of herbicide application and its perceived effectiveness in the sample areas, by chili variety, China, 2002
Chili varietyMethod of application (% of farmers) Effectiveness (% of farmers)
Broadcast Spray Other 100% 75%
Hybrid 1.9 92.7 5.4 2.9 97.1
Open pollinated 9.7 90.3 0.0 3.2 96.8
Overall 2.7 92.5 4.8 2.9 97.1
Irrigation
InChina,chiliesweregenerallygrownundergoodirrigatedenvironment.However,morethan one-fourth of open pollinated and 14% of hybrid chili parcels were rainfed (Table 28). The main sources of irrigation were natural flow mainly in mountainous areas and near the riverbanks and built canals. Open pollinated varieties were irrigated mainly through builtcanalsystems,whilebothbuiltandnaturalcanalsystemswereusedinhybrids.Around 60% of chili fields were irrigated by flooding method but without making ridges, and almost all the remaining parcels were irrigated by flooding with ridges. Only a few parcels in hybrid varieties received manual or sprinkle+trickle irrigation.
Yong Liu, Zhanhong Zhang, Xinqiu Tan, Mei-huey Wu, and Mubarik Ali

76
Table 28. Irrigation methods and sources in the sample areas, by chili variety, China, 2002
Chili varietyMethod (% of parcels) Source (% of parcels)
Flooding with-out ridges
Flooding with ridges
Others1 Rainfed Natural canal
Built canal
Tube well
Tank Others2
Hybrid 61 22 3 14 39 30 5 11 2Open pollinated 58 13 0 29 3 48 13 0 6Overall 61 21 2 16 35 32 5 10 2
1Others include manual and sprinkle+trickle. 2Others include combined source, such as built canal+natural canal+tube well.
Insect Control
All parcels were applied with insecticides using backpack sprayers, suggesting theseriousness of insect problem in chili production. On average, insecticide applications were found to be only 75% effective. The most commonly applied insecticides are shown in Table 29. The list of other types of insecticides, used by about one-third of sample chili growers, and their frequencies are reported in Appendix 1. On average, each farmer usedthreedifferenttypesofpesticides,oftenasingleproductperspray,asmixingofinsecticideisnotcommoninChina.
Table 29. Application of major insecticide in chili fields in the sample areas, by farmer type in China, 2002
ItemFarmer type
Hybrid Open pollinated OverallInsecticide use (% of parcels) 100 100 100Effectiveness (%) 75 75 75Major insecticide (% of parcels) Methomyl 15 9 15 Dicofol 14 18 15 Chlorfluazuron 14 20 15 Chlorpyrifos+cypermethrin 12 12 12 Chlorfenapyr 12 16 13 Others 32 24 31
Disease Control
Overall, only two percent of chili parcels, or 13% of open pollinated chili type fields, did notreceivefungicideapplication,againemphasizingtheimportanceofdiseasescontrolinchili cultivation. Average number of sprays received by each parcel was around five.
InChina,unlikeinothercountries,fungicidesweredistinctlydifferentfrominsecticides.Five chemicals were the most commonly applied fungicides (Table 31). About one-third of sample chili growers applied other fungicides other than these five (Appendix 2).
People's Republic of China

Management practicePercentage of farmers Effectiveness (% of farmers)
Hybrid Open pollinated Overall Hybrid Open pollinated OverallOften picking 29.0 22.6 28.3 38 25 36Early sowing 8.4 0 7.5 49 - 49Weed control 0.8 3.2 1.0 25 25 25Increase irrigation 0.4 0 0.3 25 - 25Decrease irrigation 3.8 0 3.4 20 - 20Rotation 0.4 32.3 3.8 25 25 25Others 0.4 6.5 1.0 25 25 25Combine 9.2 12.9 9.6 32 31 32Overall adoption 52.3 77.4 54.9 36 26 35
77
Table 30. Extent of fungicide use and its perceived effectiveness on chili in the sample areas, by farmer type, China, 2002
ItemFarmer type
Hybrid Open pollinated OverallFungicide application (% of parcels) 100 87 98Effectiveness (%) 75 75 75Major fungicide (% of parcels)Carbendazim 17 10 16Mancozeb 15 18 15Thiophanate-methyl 13 12 13Moroxydine hydrochloride+copper acetate 12 7 11Metalaxyl 12 8 11
Traditional Method of Pest Control
More than one-half of farmers growing hybrids and three-fourths of farmers growing openpollinatedvarietiesusedtraditionalmethodofinsectanddiseasecontrol,themostcommonofwhichweremorefrequentpickingandadjustingcroprotation,respectively(Table 31). More frequent picking in open pollinated-type chili and early sowing in hybrid chiliwerealsopopular.Acombinationofseveralmanagementpracticeswasadoptedby a significant number of farmers.
Farmers’ perceived 20-49% effectiveness of various traditional methods in controlling the insects and diseases. Overall, they perceived that it could control 36% of insects and diseases in hybrids and 26% in open pollinated varieties.
On average, each farmer used three different fungicides. Mixing of fungicide in single spraywasalsonotcommoninChina.Again,farmersperceivedthataverageeffectivenessof fungicide application in controlling diseases was only 75% (Table 30).
Table 31. Traditional farm management practices and their perceived effectiveness to control pests in the sample areas, by chili type, China, 2002
Yong Liu, Zhanhong Zhang, Xinqiu Tan, Mei-huey Wu, and Mubarik Ali

78
Havesting
On average chili were harvested 18 times in hybrid and about 16 times in open pollinated type chili. Almost 100% labor for harvesting was family labor (Table 32).
Table 32. Number of harvests and type of labor used in chili harvesting in the sample areas, by chili variety, China, 2002
Type of chili Number of harvestLabor type (% of parcels)
Family Hired Both
Hybrid 18.4 99.2 0.4 0.4
Open pollinated 16.2 100.0 0.0 0.0
Overall 18.1 99.4 0.3 0.3
Marketing
Farmers
About one-half of chili harvest of both open pollinated and hybrid types was sold directly to middlemen who collected these from farmers’ fields (Table 33). A significant proportion oftheoutput,particularlyinopenpollinatedtype,wasalsodirectlysoldtoconsumers.About one-fourth of the hybrid and seven percent of open pollinated chili was sold in the local market. Only a small proportion of the output went directly to the main market. Thissuggestedthatchilifarmerswerepoorlyconnectedwiththemainmarketsofurbanareasandreliedmainlyonmiddlemen.
Table 33. Market outlet for chili (% of farmer) in the sample areas, by chili variety, China, 2002
Chili type Local market Main market Middlemen Consumer picked at farm Others
Hybrid 23 2 51 19 5
Open pollinated 7 4 51 38 0
Overall 21 2 51 21 5
Uncertain and low chili prices (and demand) were the major marketing constraints expressed by about 72% and 22% of farmers, respectively.
Market Agents and Processors
Market agents look at chili price as the first criterion, followed by appearance, and freshness, while processors who make chili powder use hotness as the first criterion, followed by price and color attributes, in that order (Table 34).
People's Republic of China

79
Table 34. Ranking of chili characteristics preferred by market agents and processors in the sample areas, China, 2002
CharacteristicsMarket agent Processor
(for chili powder)Green (for fresh) Red (for powder)
Price 1 1 2
Appearance 2 2 -
Freshness 3 3 -
Softness 3 4 5
Thick flesh 4 - -
Fruit surface 5 - -
Color - 5 3
Fragrance - - 4
Hotness - - 1Note: Highest rank =1; lowest rank =5.
Input Use
Seed Rate
Open pollinated chili farmers used about 1 kg/ha of seeds while hybrid farmers used only 300 grams per ha (Table 35). Similarly, for farmers using seedling, more were needed foropenpollinatedcomparedtohybridchili.Highcostandbettergerminationrateofhybridseedanddifferenceinthenatureofplantineachvarietymighthavecontributedtothese.
Table 35. Seed rate and seedling number used in the sample areas, by chili variety, China, 2002
Chili varietySeed rate (kg/ha) Seedling
(number of plants/ha)Owned Purchased Average
Hybrid - 0.3 0.3 45,757
Open pollinated 1.0 - 1.0 54,000
Overall 1.0 0.3 0.4 45,855
Fertilizer Use
On average, 24 t/ha of farm manure was applied to chili, 23 t of which was poultry manure. Open pollinated chili varieties applied 73% more manure than hybrids (Table 36).
Yong Liu, Zhanhong Zhang, Xinqiu Tan, Mei-huey Wu, and Mubarik Ali

80
Overall, 914 kg/ha of inorganic fertilizer nutrients were applied on the sample chili farms. Open pollinated fields were applied with significantly higher amounts of phosphorus. However,thedifferenceintheuseofoverallfertilizernutrientacrossthetwovarietieswas insignificant. As plant population in hybrid variety fields was lower that in open pollinated chili fields, the hybrid type may be receiving higher fertilizer nutrient quantities perplant.
Table 36. Organic and inorganic fertilizer types and quantity used in chili fields in the sample areas, by chili variety, China, 2002
Chili variety Organic fertilizer or manure (kg/ha) Inorganic fertilizer (kg/ha)
Cattle Poultry Green Mixed Total N P K Total
Hybrid 29 21,077* 131* 858 22,094* 455 282* 164 901
OP1 0 36,895 24 1,200 38,119 488 345 192 1025
Overall 26 22,751 119 894 23,790 458 289 167 914The * on the figures in the hybrid row implies that these figures are significantly different than that of the corresponding figure in the OP row at 10 percent level. 1Open pollinated.
Use of Chemicals
Growersofopenpollinatedchilivarietiesappliednearlytwiceasmuchinsecticideasthehybrid growers. The number of sprays was also significantly higher in open pollinated type chili (Table 37).
Table 37. Quantity of pesticides and number of sprays used in chili fields in the sample areas, by chili variety, China, 2002
Chili varietyInsecticide Fungicide Herbicide
Quantity (kg/ha) Spray (no.) Quantity (kg/ha) Spray (no.) Quantity (kg/ha) Spray (no.)
Hybrid 21.6 6.5 17.3 5.2 19.1 2.09
OP1 42.2* 7.5* 25.3* 4.7ns 17.5ns 1.68*
Overall 23.8 6.8 18.2 5.1 19.0 2.05* implies the number is significantly different across the two varieties, and ns implies the values are similar at least at 10 percent level.1Open pollinated.
The average quantity of fungicide applied to chili was also significantly higher in open pollinatedthaninhybridchili.However, thedifferencein thenumberofsprayswasnot statistically significant at 5% level. Again, the difference in fungicide use for the twotypesofchiliremainedstrikingevenwhenquantitieswereestimatedonperplantbasis.Thismeansthattheopenpollinatedchilivarietiesmayalsobemorevulnerabletodiseaseattack.
People's Republic of China

81
On average, 19 kg/ha of herbicide was used. No significant difference in the application ofherbicidequantitiesonhybridandopenpollinatedchiliwasobserved.However,thenumber of herbicide sprays was significantly higher on hybrid than in open pollinated varieties.
Irrigation
On average, hybrid chili fields were irrigated three times and only twice in open pollinated fields for the whole duration of the chili-growing season
Labor
On average, 482 labor days/ha were required for chili cultivation (table 38). Hybrids required 15% more labor than the open pollinated type, mainly for harvest and post-harvestoperations.Laborrequirementsinchilicultivationwerefourtimesmorethanthat in rice, especially in harvest and post-harvest operations. In land preparation and cropmanagementoperations,thepercentagesharesoflaborrequirementswerelowerin chili than that in rice, but higher in terms of actual man-days.
In chili operations, about 50% of labor was devoted to management, 20% each for harvest and post-harvest, and 12-14% for land preparation.
Table 38. Distribution of labor among different activity groups in chili and rice production in the sample areas, China, 2002
Chili variety/rice
Percentage distribution Total labor(day/ha)Land preparation Management Harvesting Post-harvesting
Hybrid 11.6* 46.9 23.0* 18.6 489Open pollinated 14.0 50.1 18.8 17.1 425Overall 11.8* 47.2* 22.5* 18.4* 482*
Rice 20.4 58.3 9.3 12.0 112The * in hybrid row implies that the value for hybrid is significantly different from that of open pollinated at 10% level. Similarly, the * in the overall row compares the values of chili and rice. Note: For the definition of activities included in each group, please see the synthesis chapter.
ChilicultivationinChinawasmainlyafamilyaffair,hence,sourceoflaborwasmostlythe family. In hybrids, about 15% of labor for land preparation and five percent for crop management was hired (Table 39). Surprisingly, the proportion of hired labor in chili waslowerthaninrice.
Yong Liu, Zhanhong Zhang, Xinqiu Tan, Mei-huey Wu, and Mubarik Ali

82
Table 39. Source of labor in the sample areas, by chili and operation type, China, 2002
Chili typePercentage distribution1
Land preparation Management Harvesting Post-harvesting OverallHired Family Hired Family Hired Family Hired Family Hired Family
Hybrid 15.5 84.5 4.9 95.1 0.5 99.5 0 100.0 4.2 95.8
Open pollinated 10.7 89.3 0.8 99.2 0 100.0 0 100.0 1.9 98.1
Overall 14.9 85.1 4.5 95.5 0.4 99.6 0 100.0 4.0 96.0
Rice 33.7 66.3 4.2 95.8 12.5 87.5 0.3 99.7 10.5 89.51The distribution between family and hired labor under each operation adds up to 100.
Production
Per Ha Yield
Asalreadydiscussed,chiliwasplantedmainlyasasolecropinChina;intercroppingandrelaycroppingwerepracticedataverylimitedscale.However,forcomparisonpurpose,theyieldsofchiliasasolecrop,intercropandrelaycroparereportedinTable40.
The overall per-ha yield of chili in the sample area was 37 t, lower than the national average yield of 47 t. These estimates of yield, however, were higher than that reported in macro statistics for these provinces (Table 1). The yield of hybrid chili was significantly higher (about 20%) than that of open pollinated. Regardless of variety planted, yield from chili as an intercrop or relay crop was nearly 20% less than sole-crop chili (Table 40).However,itisnotcertainhowthecombinedyieldofchiliandthecropwithwhichitwasintercroppedwasaffectedbyintercropping.
Table 40. Chili yield (t/ha) in various production systems in the sample areas, by chili variety, China, 2002
Chili type Sole Intercrop Relay Overall
Hybrid 37.1 (0.30) - 28.5 37.0* (0.30)
Open pollinated 31.6 (0.24) 26.3 (0.14) - 31.0 (0.24)
Overall 36.6 (0.30) 26.3 (0.14) 28.5 36.5 (0.30)The * in hybrid chili row implies that the difference in chili yield of hybrids is significantly different that of open pollinated yield at 10 % level. The figures in parenthesis are coefficient of variation in yield.
People's Republic of China

83
Grades of Chili and Prices
Chili prices varied depending on the production areas and market types, and fluctuated overseasons.Ingeneral,marketpricewashigherinSouthernChinathaninNorthernChina and for hot chili than for sweet pepper (Liu et al. nd). In the survey areas, chili prices averaged at Yuan 1,107/t, with open pollinated chili of Yuan 1,069/t lower than that of hybrid chili at Yuan 1,112/t, although the difference was insignificant. Grading wasnotpracticedinChinaandalmostalloutputwassoldasmixed.
Economics of Chili Production
Cost and Factor Share
The per ha cost of production of hybrid chilies was 21% higher than the open pollinated varieties (Table 41). Labor accounts for major share in total production cost in both varieties.Theshareofseedcostwasabouteightpercentforhybrids,whileitwaslessthanonepercentforopenpollinatedchili,signifyingthehighcostofhybridchiliseed.On the other hand, the shares of fertilizer, pesticide, and manure in hybrids were less thanthatinopenpollinatedchili;thisdidnotmean,however,thatquantitiesoftheseinputswerelowerinhybrids.Thecostofproductionperkgofchiliwasaboutthesameforbothopenpollinatedandhybridvarieties.
Table 41. Cost of production and factor share of chili in the sample areas, by chili variety, China, 2002
Chili variety Total cost(Yuan/ha)
Factor share (%) Output cost(Yuan/kg)Labor Seed Fertilizer Manure Irrigation Pesticides Others
Hybrid 23,024* 49.5 7.5* 9.6* 2.2* 0.2* 8.1* 22.9 0.66
Open pollinated 19,076 48.0 0.8 13.9 4.2 0.1 10.8 22.2 0.70
Overall 22,607 49.4 6.8 10.0 2.4 0.2 8.4 22.8 0.67
The * in the hybrid row implies that the figure is significantly different with the corresponding figure in the open pollinated row at 10% level.
Returns and Resource Use Efficiency
The per ha gross and net returns from hybrid chili production were 30% and 45% higher than that of open pollinated chili (Table 42). Fertilizer productivity was significantly higher, while the benefit-cost ratio was not significantly higher on hybrids compared to open pollinated type. This meant that fertilizer was more efficient when applied to hybrid varieties.However,additionalinvestmentsonhybridoropenpollinatedtypeprovidedalmostequalreturns.
Yong Liu, Zhanhong Zhang, Xinqiu Tan, Mei-huey Wu, and Mubarik Ali

84
Table 42. Economics of chili cultivation in the sample areas, by chili type, China, 2002
Chili type Gross return(Yuan/ha)
Net return(Yuan/ha)
B-C ratio(%)
Labor productivity(Yuan/day)
Fertilizerproductivity(Yuan/ kg)
Hybrid 40,687* 17,663* 83 68 84*
Open pollinated 31,222 12,147 73 64 43Overall 39,686 17,079 82 67 80
The * in the hybrid row implies that the figures is significantly different with the corresponding figure in the open pollinated row at 10% level.
Attractions and Constraints in Chili Production
The major attractions in chili production as perceived by farmers were its profitability, adaptabilitytoclimateandsoil,farmers’experienceinchiligrowing,traditioninthelocality, incentive from the government, and labor availability (Table 43). The ranking of these attractions by farmers revealed that overall profitability, adaptability to climate, andadaptabilitytosoilswerethetopthreereasonsforchilicultivationinthestudyareas.Thesamewastrueforgrowinghybridchilies.Inthecaseofopenpollinatedvarieties,profitability, followed by tradition and labor availability were the top three reasons for chilicultivation.
Table 43. Ranking of attraction for chili cultivation in the sample areas, by chili variety, China, 2002
TraitRanking
Hybrid Open pollinated OverallProfitability 1 1 1Adaptability to climate 2 - 2Adaptability to soil 3 - 3Farmers’ experience - 4 -Tradition of the locality 4 2 4Government incentive - 5 -Labor availability 5 3 5
Note: Highest rank = 1 and lowest rank = 5.
Themajorconstraintstochiliproductionreportedbyfarmerswereincidenceofinsectsanddiseases,lowpricesreceived,poorseedquality,environmentallimitations,marketingproblems, and inadequate guidance from the Department of Agricultural Extension (Table 44).Theoverallrankingoftheseconstraintsbyfarmersrevealedthatdiseases,insectsandlowpricesoftheproducewerethetopthreeconstraints.Thesewerealsothethreemajorconstraintsintheproductionofhybridchilitype,whileinsects,diseases,andlowpriceswerethethreemainconstraintsinopenpollinatedchilicultivation.
People's Republic of China

85
Table 44. Ranking of constraints to chili production faced by sample farmers in the sample areas, by chili variety, China, 2002
Constraint Hybrid Open pollinated OverallDiseases 1 2 1Insects 2 1 2Low price/variability in chili price 3 3 3Poor quality seed 5 - -Environment - - 5Market problem 4 5 4Inadequate extension - 4 -
Note: Highest rank = 1 and lowest rank = 5.
Chili Consumption
Per Capita Consumption and Expenditure
Overall per capita consumption of chili in the survey area stood at 363 g per week in fresh weight, or 52 g per day (Table 45). This amounted to more than three times of available amountfromdomesticproductioninwholeChina,implyingthatconsumptioninthesurvey area was significantly higher than in other places in China. This was because chili wasconsumedasavegetablesupplementdishinthispartofthecountry.Theconsumptionof chili among the chili-growing families was significantly higher than that of non-chili growing farm families and urban dwellers. No significant difference in chili consumption was observed between non-chili growing families and urban dwellers.
Table 45. Relative share of different chili forms and products to total consumption in the sample areas, by consumer type, China, 2002
Type of chiliQuantity share (%) as consumed Quantity share (%) after converting
into fresh weight3
Chili farmer Non-chili farmer
Urban consumer Overall4 Chili
farmerNon-chili farmer
Urban consumer Overall4
Green fresh 56.7 46.9 43.5 45.7 46.1 36.7 32.5 35.1
Red fresh 30.1 33.7 32.6 33.2 24.5 26.3 24.4 25.5
Sweet fresh 0.0 0.0 1.7 0.7 0.0 0.0 1.3 0.5
Dry chili 2.6 1.7 2.1 1.8 8.3 5.2 6.2 5.6
Chili powder 2.4 2.6 3.7 3.0 7.8 8.0 11.2 9.3
Chili paste 1.1 3.9 2.9 3.4 1.7 6.0 4.3 5.3
Chili sauce 4.5 4.4 7.0 5.4 7.2 6.9 10.4 8.3
Chili dipping 0.5 0.4 1.4 0.8 0.7 0.7 2.1 1.3
Chili pickle 2.1 5.5 4.4 5.0 3.4 8.6 6.6 7.7
Yong Liu, Zhanhong Zhang, Xinqiu Tan, Mei-huey Wu, and Mubarik Ali

86
In the survey areas, about one-third of the fresh chili consumed was green fresh and 25% wasredfresh.Chilipowder,sauce,andpickleswerethemainprocessedchiliproducts,contributingabouteighttoninepercentofthefreshweightconsumption.Drychiliandchilipastecontributedlessthansixpercentofthefreshweightconsumption.Surprisingly,the share of sweet fresh chili in total chili consumption was insignificant.
On average, Chinese consumers in the sample area spent about Yuan 41/year for chili. There was no significant difference in the expenditure on chili across the three consumer groups. However, chili-growers were making significantly higher expenditure on green fresh and dry chili and lower expenditure on chili paste than that of non-chili growers andurbandwellers.Againthecombinedexpenditureforgreenfreshandredfreshchiliaccounted for more than 50% of the total budget for chili (Table 46).Table 46. Relative share of expenditure (%) of different chili forms and products in the sample areas, by consumer type, China, 2002
Type of chili Chili farmer Non-chili farmer Urban consumer Overall2
Green fresh 37.5 29.2 26.5 28.1Red fresh 28.5 30.7 30.5 30.6Sweet fresh 0.0 0.0 2.0 0.8Dry chili 11.2 6.0 6.8 6.4Chili powder 9.8 8.5 11.7 9.9Chili paste 2.6 11.7 4.8 8.7Chili sauce 6.6 5.5 7.5 6.4Chili dipping 1.2 1.6 5.1 3.0Chili pickle 1.9 3.1 3.3 3.2Other chili products1 0.8 3.8 1.8 2.9Overall annual expenditure (Yuan/capita) 45.5a 39.0a 44.7a 41.3
1Others include chili curry, chili oil, Sambal and others.2The overall chili consumption in China was estimated assuming 1%, 60%, and 39% weights for the chili producer, non-chili producer, and urban consumer, respectively.Note: The different superscript in a row implies that the figures are significantly different across consumer types.
Type of chiliQuantity share (%) as consumed Quantity share (%) after converting into
fresh weight3
Chili farmer Non-chili farmer
Urban consumer
Overall4 Chili farmer
Non-chili farmer
Urban consumer
Overall4
Other chili products1 0.1 1.0 0.7 0.9 0.2 1.6 1.0 1.4Overall (kg/year)2 20.4a 14.2b 14.8b 14.5 25.1a 18.2b 19.8b 18.9
Cont...,Table 45
1Others include chili curry, chili oil, Sambal and others.2Figures in this row are average per capita chili quantities consumed (kg) over one year. The different superscript in a row implies that the figures are significantly different across consumer types.3Dry and powder chilies were converted into fresh by using the conversion factor of 4. Similarly, chili pickles and paste were converted into chili fresh weight by multiplying the latter with 2.4Overall chili consumption in China was estimated assuming 1%, 60%, and 39% weights for the chili producer, non-chili producer, and urban consumer, respectively.
People's Republic of China

87
Retail Value of Chili and its Products
TheaveragepriceperkgoffreshweightchilianditsproductswascomputedtobeYuan2.2 (US$0.265). This was computed by dividing the expenditure on chili (Table 46) by the amount consumed (Table 45). This amount was about double the farm gate price of Yuan 1.1 estimated earlier. Using the ratio between retail and farmgate prices, the farm gate value of chili in the country at US$1.365 billion (Table 3) was converted into retail value of chili and its products at US$2.71 billion.
Response to Price Changes
Chilipowderandchiliproductshadrelativelowresponsetopricechangescomparedtoredandgreenchilies.Doublingthepricesofchilipowderandchiliproductswillbringonlyeightpercentdecreaseinthequantityconsumed,whiledoublingthepricesofgreenand red chili will bring 18 and 16% decrease in the quantity consumed, respectively (Table 47). Similarly, decreasing the prices of chili powder and product by 50% will increaseconsumptionbyonlyaboutthreepercent,whileasimilardecreaseinthepricesofgreen and red chili will increase consumption by eight and 12%, respectively. Consumer responsetopricechangesinredandgreenchiliwassimilartocerealcrops,whiletheresponseforchilipowderandchiliproductswasevenlowerthanincereals.
Table 47. Demand elasticity as perceived by respondent-consumers in the sample areas, by chili type and product, China, 2002
Change in price (%) Green Red Powder Products
Increase in price 110 -0.4 -0.3 -0.2 -0.2125 -2.7 -2.2 -0.9 -0.9150 -7.8 -6.8 -3.3 -3.3175 -13.4 -11.5 -5.9 -5.5200 -18.2 -16.0 -8.0 -7.8
Decrease in price90 0.9 1.2 0.0 0.075 2.6 5.0 0.6 0.950 8.1 11.5 2.9 3.3
Source of Supply
Forfarmers,green,red,andsweetfreshchilies,drychili,andotherchiliproductsweremainly home-produced or purchased from the local market; chili powder was purchased mainly from the local market, while chili sauce was mainly home-produced (Table 48). On the other hand, urban consumers source chili and its products mainly from local market. However, significant proportions of various chili products were also obtained fromcooperativeshopsorsupermarketsinurbanareas.Thesourceofalargeproportion
Yong Liu, Zhanhong Zhang, Xinqiu Tan, Mei-huey Wu, and Mubarik Ali

88
Table 48. Chili buying place (% of total purchase) in the sample areas by consumer type, China, 2002
Chili typeFarmer Urban consumer
Home produced
Local market Supermarket Others Home
madeLocal
market Supermarket Others
Green 39.9 54.6 0.2 5.3 0 89.2 10.0 0.8Red 42.9 52.3 0.2 4.6 0 89.2 10.0 0.8Sweet 62.5 37.5 0.0 0.0 0 66.7 33.3 0Dry chili 55.4 41.7 0.0 2.9 0 87.5 10.4 2.1Chili powder 6.4 90.1 0.5 3.0 0 88.0 12.0 0Chili sauce 87.9 6.6 1.7 3.8 17.5 41.2 24.6 16.7Other chili products 53.0 30.8 12.6 3.6 10.7 33.3 51.8 4.2Overall 45.8 47.9 2.3 4.0 4.5 69.7 22.4 3.4
Chili Attractions in Consumption
Consumers consider good appearance and market price as the first and second criterion, respectively, in buying fresh green and red chili (Table 49). For sweet chili and other products, consumers look at market price first then good appearance second. Other criteria suchaspungency,freshnessandfragrancewerealsotakenintoaccount,butwererankedlowerinselectingchilianditsproducts.
Table 49. Ranking of chili characteristics preferred by consumers in the sample areas, by chili type, China, 2002
Selection criteria Green chili Red chili Sweet pepper Powder Other productMarket price 2 2 1 1 1Overall appearance 1 1 2 2Hotness/pungency 4 4 3 2 3Freshness 3 3 3 3Fragrance 4 4 4
Note: Highest rank=1 and lowest rank=4.
Consumers’ Preference for PackagingConsumers prefer fresh chilies (like green, red) and powder unpacked (Table 50). The mainreasonsforthisincludedretainingproductfreshness,visibility,andconvenience.Plastic bag packaging was preferred for sweet chili mainly because of its convenience andproductvisibility.Majorityofconsumerspreferredchiliproductsinglasspackagingbecause of better storability, handling convenience, and product visibility. About 10% of consumersalsopreferredplasticandtinpackagingforvariousreasons.
ofprocessedchiliwashome,especiallyamongfarmfamilies,indicatingthattherewasa significant small-scale chili-based processing activities going in the rural areas of China.
People's Republic of China

89
Table 50. Consumer preferences for different types of chili packaging in the sample areas, by chili type, China, 2002
Chili type
Packing Preference(%)
Reason (%) Freshness Best image Convenience Storability Presentation Visibility Other
Green/red Unpacked 89 34 1 26 1 0 37 1 Paper 3 35 4 39 7 0 11 4 Glass 0 13 25 13 0 25 25 0 Plastic 8 20 1 39 4 0 35 2 Tin 0 0 0 0 100 0 0 0
Sweet Plastic 100 0 0 50 0 0 50 0
Powder Unpacked 73 17 2 42 1 0 36 2
Paper 5 0 0 50 6 0 44 0Glass 6 9 0 24 42 3 18 3Plastic 16 13 1 43 9 1 29 4Tin 1 0 0 0 60 20 0 20
Product Unpacked 1 33 0 0 17 0 50 0
Paper 1 25 0 25 25 0 25 0Glass 77 12 1 28 39 1 17 1Plastic 11 20 2 33 10 5 29 2Tin 10 20 1 29 37 8 3 2
Development Impact of Chili Cultivation
Input Demand
Chili cultivation increases demand for labor compared to other field crops like rice. A shift of one hectare of rice to chili cultivation will generate demand for 370 labor days, or an equivalent of 1.7 full-year job (Table 51). This is only for production and does not includethelaborrequirementforprocessing.Thecostofchiliseedwasaboutsixtimeshigherthanthatonrice.Similarly,fertilizerandpesticideusewasaboutdouble,andmanureusewasmanytimesmoreonchilithatonrice.However,riceusedmorethandoublenumberofirrigationthanchili.
The use of fertilizer in rice by chili farmers was significantly lower than that by non-chili farmers.This partially helped chili farmers spare resources to meet high inputdemandinchiliproduction.Generally,theuseofallotherinputsinricewasalsolowin chili-growing farms, although the difference in the use between the two groups was not statistically significant.
Yong Liu, Zhanhong Zhang, Xinqiu Tan, Mei-huey Wu, and Mubarik Ali

90
Table 51. Relative per ha input use and cost of chili and its competing crops, China, 2002
Crop Labor(days)
Seed(Yuan)
Fertilizer(kg)
Manure(t)
Irrigation (number)
Pesticides spray (number)
Chili 482a 1,530a 914a 23.8a 3.2a 13.9a
Rice 112 257 434 0.8 7.8 8.1 Chili farmers 111 255 423* 0.7 7.8 8.1
Non-chili farmers 121 268 535 1.4 7.7 8.0
The superscript a in different columns of chili row implies that the mean value of the parameter for chili is significantly different than for rice at 10% level. The superscript * in chili farmer row implies that the figure is significantly different from the corresponding figure for non-chili farmers at the 10% level.
Resource Use Efficiency
Compared to rice, chili cultivation entailed substantial higher input requirements,especiallythosepurchasedinthemarket.Thehigherproductioncostandmoreliquiddemand for chili production than rice limited its cultivation to farmers who has theresourcesandwilltotakerisks.Althoughproductioncostofchiliwasaboutfourtimeshigherthanthatofrice,grossrevenuewasalsohigherbymorethansixtimes,providingabetter benefit-cost ratio for investments in chili than in rice (Table 52). Similarly, although individual input-use in chili production was higher than in rice, the efficiency of inputs suchaslaborandfertilizerwasalsohigher.
Chili cultivation improved efficiency of resources allocated for production, as well as resource use efficiency in other major crops planted in chili farms. This was evidenced by higher efficiency of fertilizer and higher benefit-cost ratio in rice, compared with non-chili farms. Despite similar yields and gross revenues on chili and non-chili farms, low inputcostespeciallyduetojudiciousapplicationoffertilizerbychilifarmersexplainedthe difference in resource use efficiency across the two groups.
Table 52. Resource use efficiency in chili and competing crops in the sample areas, by farmer type, China, 2002
Crop Yield (kg/ha)
Total cost
(Yuan/ha)
Gross return
(Yuan/ha)Net return(Yuan/ha)
B-C ratio(%)
Labor productivity(Yuan/day)
Fertilizerproductivity
(Yuan/kg)
Chili 36,955a 22,607a 39,686a 17,079a 82a 67 a 80a
Rice 6,576 5,505 6,505 1,000 23 40 17 Chili farmers 6,587 5,447* 6,525 1,077* 24* 40 18*
Non-chili farmers 6,467 6,072 6,318 246 10 33 12The superscript a in different columns of chili row implies that the mean value of the parameter for chili is significantly different than for rice at the 10% level. The superscript * in chili farmer row implies that the figure is significantly different than the corresponding figure for non-chili farmer at the 10% level.
People's Republic of China

91
Impact on Gender
Overall, about 40% of the labor used in chili production in China were female compared to only 26% in rice, with their contributions in land preparation, crop management, and harvest and post-harvest operations higher than those in rice (Table 53). The percentage of female labor in different operation was generally higher in hybrids than in openpollinatedchilitype.
Table 53. Labor distribution (percentage) by gender in the sample areas, by chili and operation type, China, 2002
Chili typeLand preparation Management Harvest Post-harvest OverallFemale Male Female Male Female Male Female Male Female Male
Overall chili 37.2 62.8 28.4 71.6 56.2 43.8 51.0 49.0 39.8 60.2 Hybrid 38.0 62.0 28.3 71.7 56.7 43.3 51.0 49.0 40.2 59.8 Open pollinated 31.9 68.1 28.7 71.3 50.3 49.7 50.3 49.7 36.9 63.1Rice 24.1 75.9 22.2 77.8 50.9 49.1 47.4 52.6 25.7 74.3
The distribution between male and female under each operation adds up to 100.
Impact on Consumption
Higherincomefromchiliproductioninducedhigherfoodandtotalexpendituresbychilifarmers than non-chili farmers, with the former spending nine percent more on food and seven percent on total expenditures than the latter (Table 54). However, the average monthlyincome,aswellasfoodandoverallexpendituresofchilifarmerswerestillwaybelowtheurbandwellers.
Table 54. Average monthly household income and expenditure in the sample areas, by consumer type, China, 2002
Consumer type Expenditures (Yuan) Average monthly income
(Yuan)Food TotalChili farmers 441b 761b 1,306b
Non-chili farmers 404c 709c 1,138c
Urban consumers 579a 1,258a 3,166a
Overall 461 834 1,581The different superscripts in a column imply that the figures are significantly different across consumer groups at 10% significance level.
Chili farm families spent more on food compared to non-chili farm families (Table 55). Thisenabledchili farmers to improve theirconsumptionpatterns in the formofen-hancedconsumptionofvegetables,cereals,andfruits,henceimprovingmicronutrientavailabilityfortheirfamilies.Theconsumptionofallotherfooditems,however,wassimilarinthetwogroups.
Yong Liu, Zhanhong Zhang, Xinqiu Tan, Mei-huey Wu, and Mubarik Ali

92
Table 55. Average daily consumption of different food groups in the sample areas, by consumer type, China, 2002.
Food groupQuantity (g/capita)
Chili farmer Non-chili farmer Urban consumer Overall1
Cereals 445a 416b 344c 388Vegetables 342a 329b 331b 330Fruits 49b 34c 72a 49Livestock products 71b 64b 125a 88Seafood 15b 17ab 24a 20Others 47b 53b 72a 60Total 968a 912b 969ab 935
Different superscripts in a row imply that the figures are significantly different across consumer groups at 10% level.1The overall chili consumption in China was estimated by assuming 1, 60, and 39 percent weight for the chili producer, non-chili producer, and urban consumer, respectively.
Summary and Conclusion
About 12.4 million t of fresh weight chili was produced in China valued at US$1.4 billion atthefarmlevel.Basedontheconsumptionsurvey,theestimatedchilisectoroutputwasworth US$2.7 billion at the retail level. The production of chili in the country increased rapidly in the 1990s’ mainly because of expansion in area while yield remained almost stagnant.ThisexpansionindomesticproductionboostedChina’sinternationaltradeinchili. In 2003, China traded (both import and export) US$128 million worth of chili, and earned US$121 million net of import. The opening up and reform of the Chinese economy andtheimprovementinthefreeinternationaltraderegimehelpedbringaboutthisboost.InthewakeofincreasingimportanceofchiliinseveralsouthernprovincesofChina,thisstudywasconductedtoprovideacomprehensivelookofthechilisectorbyconductingextensivefarm,household,andmarketsurveysinmajorchiligrowingareas.
Farmers in the traditional chili-growing areas had similar characteristics with those of non-chili farmers. Hybrid varieties of chili were mostly used, and single chili crop rotation completedinoneyearwaspracticed.Managementpracticesadoptedonchilicultivationwere quite advanced. For example, unlike in other Asian chili-growing countries, all farmersproperlypreparedraisedbedsorfurrowsbeforetransplanting;soiltreatmentwaspracticedonalargenumberoffarms;almostallfarmersusedpesticideforinsectanddiseasecontrolaswellasherbicideforweedcontrol.Farmersalsousedtraditionalmethodof insect anddiseasecontrol, suchas crop rotationand frequentharvesting.Almosteveryfarmerappliedmanuretochilicropinlargequantities.Farmersmostlyhadaccesstoirrigationandcanals.
People's Republic of China

93
TheuseofhybridstransformedchilicultivationinChina,inducinghigherinputuse,andimproving farm management practices. For instance, more hybrid fields had soil treatment, mulchedwithcommercialmaterials,appliedwithgreenmanure,andused improvedmethods of irrigation. These fields were more frequently harvested at shorter intervals betweenharvests.Althoughhybridsweretreatedwithfewerchemicalsperplantperhapsbecausetheywerelesspronetoinsectanddiseaseinfestation,theyhadmoreirrigationandmorelaborrequirementduetohigheryield.Mostofall,thecostofhybridseedwassignificantly higher than that of open pollinated type chili varieties. Hence, cultivation of hybridsincurredhighercosts,butproducedhigherreturnsaswell.Infact,theresourceuse efficiency of investment (benefit-cost ratio), and labor and fertilizer productivity were allhigherforhybridchilicomparedtotheopenpollinatedimprovedchilivarieties.Improvedmanagementpractices,useofhybridseeds,andrelativelylowtemperatureled to relatively low losses of yield as a result of insect and disease infestations inChina.Thecostofraisingseedlings,however, increaseddramaticallyunder thecoldtemperature.Farmersrankdiseasesandinsectsasthetopproductionconstraints,withtobacco budworm, Phytophthora blight, and anthracnose as the major insect pests and virusasthemaindisease.Farmersperceivedlowandvariablepricesofchiliasthethirdconstraint.Thus,farmers’preferrednewvarietiesthatcangivehighyieldandcanfetchhighprices.
ChiliismainlyconsumedasfreshinChina.Consumers’responseintermsofchangingchili consumption with a hypothetical change in chili prices was low (even lower than the elasticity for cereal) implying that it is an integral part of their diet. Overall appearance of greenandredchiliwasanimportantcriterionofconsumersinmakingitspurchase.Thus,improvingtheappearanceofchiliwillhelpfarmersobtainhigherpricesandenhanceprofitability. Producers and marketing agencies enhanced their profits by tailoring the packagingofvariouschiliproductsaccordingtoconsumerpreferencesasenumeratedinthisstudy.
ChilicultivationcanhaveimportantimpactontheruraldevelopmentinChina.Basedonthe average farm size, it was estimated that about 1.7 million farm families were engaged initsproductionthroughoutthecountry.Chiliproductiongenerated a significant demand forinputs,especiallyfertilizer,pesticide,seed,andirrigationwater,therebyencouragingagriculturalbusinessactivitiesinruralareas.Theshiftoffarmresourcesfromtraditionalcrops such as cereals to chili cultivation significantly improved resource use efficiency. Farmers also benefited from chili cultivation through improved income and diet. Chili was considered to be a gender-friendly crop.
Despitetheseadvantages,however,expansionofchilicultivationhaslimitationsbecauseofitslowelasticity.Demandmaybeexpandedtoacertainlevelbyappropriatelytailoringitsproductioncharacteristicstomeetconsumerstastewithinthecounty,andbyexploringforeignmarkets.Gradingofproduce to improveuniformityandqualitycan increaseinternationaldemandandmarketvalueascullsmaybeusedinprocessedproducts.
Yong Liu, Zhanhong Zhang, Xinqiu Tan, Mei-huey Wu, and Mubarik Ali

94
References
Chen Shiru. 2000. Vegetable Breeding (2ndEdition). Agricultural Press (China) pp: 257.
FAO (Food and Agricultural Organization of the United Nations). 2004. FAOSTAT database.<http://faostat.fao.org/faostat/collections?version=ext&hasbulk=0 >. Accessed in 2004.
People's Republic of China

95
Appendix 1. Frequency of insecticides used on chili, China, 2002
Common name Number of farmer Percentage of occurrence Chlorfluazuron 145 14.8Dicofol 145 14.8Methomyl 144 14.6Chlorfenapyr 125 12.7Chlorpyrifos+cypermethrin 121 12.3Deltamethrin 113 11.5Imidacloprid 73 7.4Tebufenozide (Mimian) 26 2.6(Qinchonlike) 19 1.9(Bisultap) 14 1.4(Difhlorvos) 13 1.3(Sumieshading) 11 1.1Methomyl (Kuailin) 10 1.0Abamectin (A’weijunshu) 7 0.7Indoxacarb 6 0.6Methamidophos 5 0.5(Yashijing) 2 0.2(Shamiejuzhi) 2 0.2(Suanlin) 1 0.1Phoxim 1 0.1
Note: The names in brackets are brand or local names.
Yong Liu, Zhanhong Zhang, Xinqiu Tan, Mei-huey Wu, and Mubarik Ali
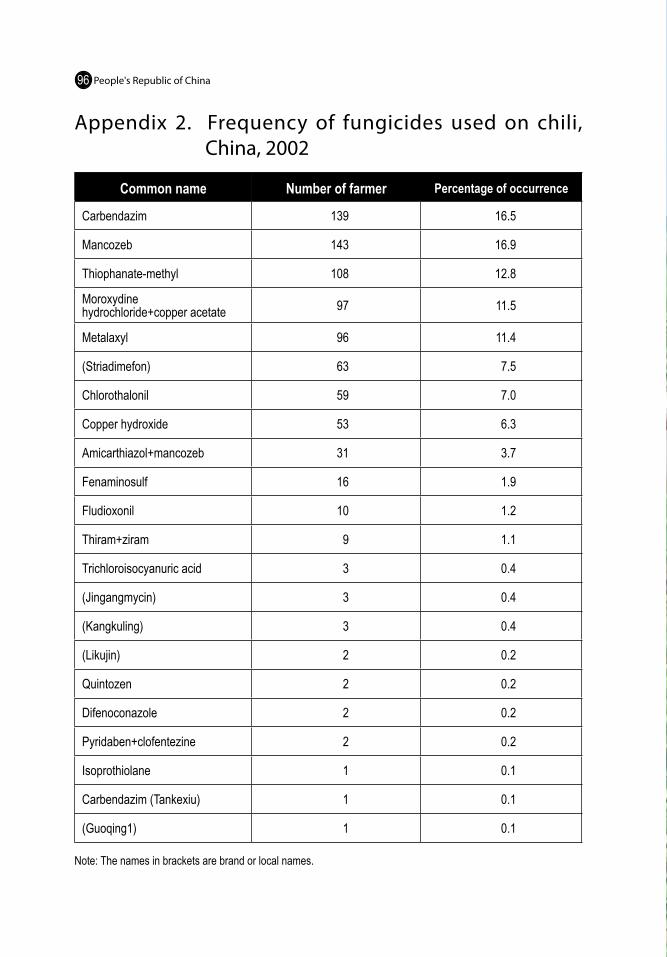
96
Appendix 2. Frequency of fungicides used on chili, China, 2002
Common name Number of farmer Percentage of occurrence
Carbendazim 139 16.5
Mancozeb 143 16.9
Thiophanate-methyl 108 12.8
Moroxydine hydrochloride+copper acetate 97 11.5
Metalaxyl 96 11.4
(Striadimefon) 63 7.5
Chlorothalonil 59 7.0
Copper hydroxide 53 6.3
Amicarthiazol+mancozeb 31 3.7
Fenaminosulf 16 1.9
Fludioxonil 10 1.2
Thiram+ziram 9 1.1
Trichloroisocyanuric acid 3 0.4
(Jingangmycin) 3 0.4
(Kangkuling) 3 0.4
(Likujin) 2 0.2
Quintozen 2 0.2
Difenoconazole 2 0.2
Pyridaben+clofentezine 2 0.2
Isoprothiolane 1 0.1
Carbendazim (Tankexiu) 1 0.1
(Guoqing1) 1 0.1
Note: The names in brackets are brand or local names.
People's Republic of China


IndiaMaravalalu Chandre Gowda, Mei-huey Wu, and Mubarik Ali
Introduction
Chili is grown all over India. In 2003, it was grown on an area of 945.5 thousand ha with an annual production of 4.5 million t in fresh weight (FAOSTAT-Agriculture). India is one of the largest producers of pimento chili in the world, accounting for over 46% and 44% of its total area and production, respectively. However, its per ha productivity is quite low at 4.7 t in fresh weight compared to China, Turkey, and Pakistan at 25.6 t/ha, 8.9 t/ha, and 7.9 t/ha, respectively. India exported 349 thousand t of fresh weight equivalent chili worth US$62 million. This leaves a net annual per capita availability from domestic sources at about 3.9 kg in fresh weight. Despite the importance of chili in the production systemofcertainstatesandIndiandiet,nocomprehensivestudyisavailableontheissuesand constraints at its various food chain levels. This study aimed to fill this information gapbyconductinginterviewsandsurveysfromdifferentstakeholdersinvolvedinthefoodchain,andanalyzingsecondarydatarelatedtoitsproduction,consumption,anddistribution.
In 1999, Andhra Pradesh, Karnataka, Maharastra, Orissa, Tamil Nadu, West Bengal, Madhya Pradesh, and Rajastan accounted for 90.8% of total area and 92.9% of the total production of pimento chili in the country (Table 1). Its yield in fresh weight ranged from 1.5 t/ha in Madhya Pradesh to 9.4 t/ha in Andhra Pradesh.
Table 1. Area, production and yield of pimento chili by region in India in 1998-1999
Region Area (1000 ha)Production (1000 ton) Yield (kg/ha)Dry Fresh Dry Fresh
All India 891.2 1,043.2 4,172.8 1,171 4,682Andhra Pradesh 222.5 525.0 2,100.0 2,360 9,438Karnataka 170.3 146.6 586.4 861 3,443Maharastra 101.1 57.7 230.8 571 2,283Orissa 90.0 76.0 304.0 844 3,378Tamil Nadu 77.2 43.0 172.0 557 2,228West Bengal 64.4 51.3 205.2 797 3,186Rajastan 33.9 49.9 199.6 1,472 5,888Madhya Pradesh 50.0 19.3 77.2 386 1,544Uttar Pradesh 19.6 15.5 62.0 791 3,163Gujarat 18.1 18.2 72.8 1,006 4,022Assam 14.7 9.7 38.8 660 2,639Bihar 6.1 4.7 18.8 770 3,082Punjab 4.7 8.0 32.0 1,702 6,809Manipur 8.8 5.3 21.2 602 2,409Others 10.4 9.7 38.8 933 3,730
Source: Ministry of Agriculture (2003).

99Maravalalu Chandre Gowda, Mei-huey Wu, and Mubarik Ali
Macro Trends
Domestic Production
Production of fresh weight chili increased from 2.5 million t in 1991 to 4.5 million t in 2003 at an average annual growth rate of 3.3% (Table 3). Most of the increase in production (82%) came from yield enhancement, from 3.0 t/ha to 4.7 t/ha at an average growth rate of 3.2% during the same years. The remaining increase (18%) was attributed to area expansion from 851 thousand ha to 946 thousand ha with an average annual growth rate of 0.5%. The farm value of chili output did not increase at the rate corresponding toproduction,suggestingsomedecreaseinitsnominalprice.
Table 3. Trends in area, production, yield, and farm value of chili, India, 1991-2003
Year Area harvested(ha) Fresh production (t)1
Yield (kg/ha) Farm value2
(million US$)Fresh1 Dry
1991 851,383 2,512,230 2,951 738 850.961992 966,900 3,491,400 3,611 903 873.051993 934,830 3,243,900 3,470 868 629.211994 834,000 3,222,800 3,864 966 742.361995 888,000 3,285,500 3,700 925 931.481996 949,200 4,311,000 4,542 1,135 1,331.301997 846,300 3,528,000 4,169 1,042 768.521998 896,400 4,221,000 4,709 1,177 1,028.031999 964,400 4,257,000 4,414 1,104 917.572000 913,500 3,930,000 4,302 1,076 847.892001 945,500 4,210,500 4,453 1,113 791.602002 945,500 4,450,500 4,707 1,177 794.492003 945,500 4,450,500 4,707 1,177 866.57
Note: Total area and production includes sweet pepper, which fluctuated between 4.7-5.5 thousand ha and 42-50 thousand t.
1This was estimated by multiplying the dry weight reported in the statistics by four.2Estimated using the FAOSTAT-Agriculture (producers’ price) data for pimento. The prices of green chili were taken from Sri Lanka prices reported in the same source, as data for India were missing. The prices in local currency were converted using the exchange rate reported in www.fftc.agnet.org (various issues).Source: FAOSTAT-Agricultural Data (Crop Production).

Primary Data Collection
Table 2. Sample size by type of respondents and province, India, 2002
Type of respondents Karnataka Andhra Pradesh TotalTotal farmers 169 163 332 Chili grower 154 137 291 Non-chili grower 15 26 41Farmer’s household wife 154 147 301City household wife 50 - 50Processor 2 2 4Market agent 2 3 5
The survey was conducted in Karnataka and Andhra Pradesh, the two major chili-growing states in India, covering 160 farmers from each state. Five districts in Karnataka (Bellary, Haveri, Gadag, Dharwad, Belgaum) and three districts in Andhra Pradesh (Guntur, Warangal, Khammam) were selected since they had the highest chili growing acreageineachstate.Thetotalsampleforeachstatewasproportionatelyallocatedtoeachdistrictdependingupontheirtotalchiliarea.ThreevillagesfromeachdistrictinKarnataka and four villages in each district of Andhra Pradesh having the highest number of chili-growing farmers were selected in consultation with extension agents in the area. Theallocatedsamplewithineachdistrictwasdistributedtoeachvillagedependingonthe total number of chili-growing farmers in each village. Ten to twenty percent of the sample in each village was allocated for non-chili growing farmers depending on the relative share of chili and non-chili crops grown. The chili and non-chili growing sample farmers were randomly selected from each group. Input-output data for all crops grown duringoneyearatthetimeoftheinterviewwererecordedbasedonfarmers’memory.Tounderstandtheroleofchilianditsroleintheoverallfoodconsumptionpattern,farmers’housewiveswerealsointerviewed.
A total of 332 farmers were interviewed in the two states (Table 2). Over 90% of farmers’ housewiveswereinterviewedforfamilyconsumptionpattern.FiftyurbanhousewivesfromKarnatakawereinterviewedtocomparetheconsumptionpatternsandconsumerpreferences in rural and urban areas. Four processors and five market agents were also includedinthesurvey.
100 India
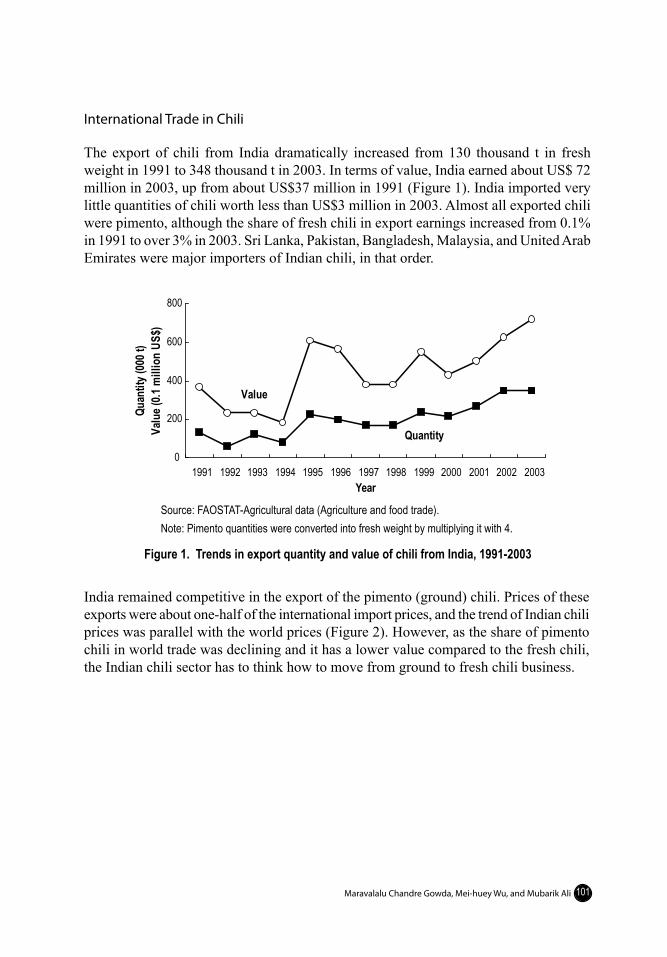
0
200
400
600
800
1991 1992 1993 1994 1995 1996 1997 1998 1999 2000 2001 2002 2003Year
Quan
tity(
000t
)Va
lue(
0.1m
illio
nUS
$)
Value
Quantity
101
International Trade in Chili
The export of chili from India dramatically increased from 130 thousand t in fresh weight in 1991 to 348 thousand t in 2003. In terms of value, India earned about US$ 72 million in 2003, up from about US$37 million in 1991 (Figure 1). India imported very little quantities of chili worth less than US$3 million in 2003. Almost all exported chili were pimento, although the share of fresh chili in export earnings increased from 0.1% in 1991 to over 3% in 2003. Sri Lanka, Pakistan, Bangladesh, Malaysia, and United Arab EmiratesweremajorimportersofIndianchili,inthatorder.
Source: FAOSTAT-Agricultural data (Agriculture and food trade).Note: Pimento quantities were converted into fresh weight by multiplying it with 4.
Figure 1. Trends in export quantity and value of chili from India, 1991-2003
India remained competitive in the export of the pimento (ground) chili. Prices of these exports were about one-half of the international import prices, and the trend of Indian chili prices was parallel with the world prices (Figure 2). However, as the share of pimento chiliinworldtradewasdecliningandithasalowervaluecomparedtothefreshchili,theIndianchilisectorhastothinkhowtomovefromgroundtofreshchilibusiness.
Maravalalu Chandre Gowda, Mei-huey Wu, and Mubarik Ali

0
100
200
300
400
Jan Feb Mar Apr May Jun Jul Aug Sep Oct Nov Dec
Rainf
all(m
m) Kranataka
Andhra Pradesh
0.00
0.25
0.50
0.75
1991 1992 1993 1994 1995 1996 1997 1998 1999 2000 2001 2002 2003
Year
Price
(US$
/kg) World import prices
India export prices
102
Source: Estimated from import quantities and values for India and World in FAOSTAT-Agricultural data (Agriculture and food trade). Both values are fresh weight form.
Figure 2. Trends in export and import prices of pimento chili in India , 1991-2003
Climatic Situation
The annual average rainfall in Karnataka and Andhra Pradesh is about 1330 and 750 mm, respectively. Most of the rains come in June-October, while remaining parts of the year is almost dry in both areas (Figure 3).
Source: Official file data from India Meteorological Department, Meteorological Centers of Bangalore and Hyderabad.
Figure 3. Monthly average rainfall in sample states
India

103
Seasonality in Chili Supply
Overall seasonality, defined as maximum minus minimum value divided by minimum and multiplied by one hundred, was over 64% and 45% in the market prices and market arrival of chili, respectively.The movement in seasonal prices was mirror image ofmarket arrivals: the chili market arrival was highest in May-September and lowest in October-November. Conversely, the price of chili was highest in October-December, and lowest in April (Figure 4). These patterns matched with the harvesting pattern of thecropdiscussedinalatersection.
Source: Subramanian, Varadarajan, and Asokan (2000).
Figure 4. Seasonality in chili prices and market arrivals in India
Farm and Farmers Characteristics
Socioeconomic Characteristics
Chili farmers had significantly bigger farm size than non-chili growers. One of the reasons for this was that the chili-growing farmers augmented their land holdings with rented land; chili farmers rented about 16% of the land compared to only six percent by non-chili farmers. One-fifth of the chili farmers had both owned and rented land, compared to only seven percent among the non-chili group. The land use intensity, number of fragments and cropping intensity were similar in both groups (Table 3).
50
70
90
110
130
Jul Aug Sep Oct Nov Dec Jan Feb Mar Apr May Jun
Chili
price
and
mar
keta
rriva
lindi
ces
Price
Arrival
Maravalalu Chandre Gowda, Mei-huey Wu, and Mubarik Ali

104
Table 3. Characterization of farmers in the sample areas, by farmer type, India, 2002
Characteristic Chili farmer Non-chili farmerFarm size (ha) 3.91* 2.87Owned area (ha) 3.28 2.69Rented area (ha) 0.63* 0.18Cultivated area (ha) 3.83* 2.65Chili area (ha) 1.96 0.00Land use intensity (%) 98.71 96.32Cropping intensity (%) 114.94 117.32Land fragmentation (number) 2.18 2.22Tenure status (% farmer) Owner 70.07 90.24 Tenant 9.51 2.44 Owner-cum-tenant 20.42 7.32Age of the farmer (year) 43.84 41.73Average education of the family (year) 5.57 5.49 Household head 6.42 6.49Family size (no.) 5.11 5.49 Adult members 3.63 3.83 Children 1.48 1.66Farmer experience (year) in agriculture 15.76 19.59Farmer experience (year) chili production 15.19* 10.51Distance from paved road (km) 0.58* 0.95Distance from vegetable market (km) 14.96* 20.93Family labor available for agriculture (number) 2.23 2.81
* implies that the value is significantly different across the two farmer groups at least at 10% level.
Familycharacteristics,suchasfamilysizecomposition,age,andeducationofhouseholdhead, were similar for both groups. However, chili farmers had more experience ingrowingchili.Moreover,theywerelocatednearertoagriculturalmarketandpavedroadcompared to the non-chili farms.
Average size of chili area, both single and intercropped, was about 1.96 ha per farm. Chili was the major crop on chili-growing farms, suggesting that chili farmers in the studyareaweremorespecializedinchiliproductionthaninanyothercrop.
India

105
Assets and Machinery
More farmers in chili-growing group had access to transportation and communication equipments. For example, more farmers own motor vehicle, and radio/cassette players (Table 4). However, more farmers in the non-chili growing group had private pumps for drinking water, while chili-growing farmers rely mainly on the government supply. Most farmersinbothgroupshadtheirownhouses;thehouseconditionwasaverageincaseof chili-growing farmers, and above average in case of non-chili growing farmers.
Table 4. House-hold living conditions and home appliances owned by farmers in the sample areas, by farmer type, India, 2002
Assets/appliances Chili farmer Non-chili farmerHouse area (m2) Total area 185 236 Covered area 101* 149House condition (% of farmers) Below average 16 21 Average 52* 34 Above average 33 45House construction (% of farmers) Mud, local stone 58* 39 Bricked, cemented 42* 61Source of light (% of farmers) Government electricity 96 100 Others 4 0Source of drinking water (% of farmers) Government water supply 71* 37 Private pump 10* 41 Open well/artesian well/others 20 22Transportation (% of farmers own) Motor vehicles 20* 7 Bicycle 66 71Home appliance (% of farmers own) TV 56 59 Refrigerator 6 5 Radio/cassette player 38* 17
* implies that the value is significantly different across the two farmer groups at least at 10% level.
Maravalalu Chandre Gowda, Mei-huey Wu, and Mubarik Ali

106
Chili-growing farmers owned more tractors and sprayers than non-chili growing farmers, while the latter group owned more water pumps and other small machineries (Table 5). The chili-growing farmers also owned more livestock. The numbers of calf, sheep andgoat,andotheranimalsownedbythisgroupwereallhigherwhilethenumberofmilking cows was lower compared to non-chili growing farmers. Number of hens and ducksweresimilaroneachgroupoffarms.
Table 5. Ownership of farm machinery and livestock inventory in the sample areas, by farm type, India, 2002
Farm machinery/livestock inventory Chili farmer Non-chili farmerFarm machinery (number)
Tractor 1.28* 0.12Water pump 0.15* 0.37Sprayer 0.78* 0.12Mold board plow 0.25 0.29Others 0.29* 0.59
Livestock (number)
Milk cow 0.66* 1.05Bullock and calf 1.82* 0.39Sheep and goat 1.38* 0.51Hen and duck 0.90 1.54Others 2.29* 0.54Standard animal unit (SAU) 2.77* 2.20
* implies that the value is significantly different across the two farmer groups at least at the 10% level.
Land and Soils
Chili farmers had slightly but insignificantly higher proportion of light soils compared to non-chili farmers (Table 6). However, chili-growing farmers had a higher proportion of land with slope/terraces and less proportion of plain lands away from the river bank. However, the soil drainage condition was not significantly different across the two groups.
Table 6. Land form, drainage, and soil texture in the sample areas, by farmer type, India, 2002Characteristic Chili farmer Non-chili farmer
Soil texture (% of parcels) Heavy 34 38 Medium 51 55 Light 15 7Land form (% of parcels)
Slope with terrace 19* 11 Slope without terrace 30* 18 Plain near the river bank 14 14 Plain away from the river bank 36* 56
India

107
Characteristic Chili farmer Non-chili farmerDrainage (% of parcels)
Well drained 39 34 Medium drained 44 55 Poor drained 17 11
Credit Source
About two-thirds of farmers obtained loans from various sources, and there was little difference between the access to credit between chili and non-chili farmers (Table 7). Average loan size was about INR 43,000 for chili farmers and INR 21,000 for non-chili farmers.Thehigherloansizethatchilifarmersneededwasperhapsduetothehigherproductioncostinvolvedinchilicultivation.Amongchilifarmers,hybridfarmershadtheir own resources to finance chili production, hence the amount of loans availed was onlyhalfthatoftheotherchilifarmers.Mostofthefarmersobtainedloanfromthegov-ernment banks, with an interest rate ranging from 1.0-1.3% per month and most were usedtobuyagriculturalinputs.
Table 7. Source, duration, interest rate, and purpose of loans of farmers in the sample areas, by farmer type, India, 2002
Type of growerLoan
(% farmer)
Average loan
(INR*)
Source (% of farmers) Duration(years)
Interest rate
(%/month)
PurposeGovt.Bank
Co-op
Mer-chants Others Inputs Tractor Others
Hybrid 52 21,309 38 57 2 2 9 1.2 100 0 0
Open pollinated 67 41,250 79 21 0 0 14 1.1 90 0 0
Local 75 46,822 48 43 4 6 15 1.3 86 6 8
Overall 67 42,954 52 38 4 6 13 1.3 92 3 5
Non-chili farmers 68 21,118 48 45 6 0 11 1.2 93 0 7* One US$ = 45 INR (Indian Rupee).
Varieties and Cropping Pattern
Chili Varieties
About one half of chili farmers grew local varieties, and another one-third grew hybrid types; the remaining 14% used improved open pollinated varieties (Table 8). The major localvarietiesgrownwereByadagiKaddiandSankeshwara,while themajorhybridvarietieswereTejaswiniandNamdhari.Themajoropenpollinatedvarietyinthesamplearea was Guntur (G-4). The other varieties grown in the sample area are reported in Table 8.
Cont...,Table6
Maravalalu Chandre Gowda, Mei-huey Wu, and Mubarik Ali

108
Table 8. Chili variety grown in the sample areas, by chili type, India, 2002
Local Hybrid Open pollinated Name of variety % of parcels1 Name of variety % of parcels1 Name of variety % of parcels1
Byadagi Kaddi 34.1 Tejaswini 30.0 Guntur (G-4) 43.7Sankeshwara local 12.8 Namdhari 25.4 LCA 334 30.9Warangal Paprika 11.9 Wonder Hot 17.7 LCA 960 10.9Dyavanur 9.4 Roshini 5.4 LCA 206 7.2Nagaram 8.4 Festival 5.4 Chilli-275 5.5Byadagi Dabbi 5.9 INDAM – 5 4.6 LR-1 1.8Dyavanur Kaddi 4.0 Alankar 4.6 Overall 14.2Nerli local 3.0 Dilli Hot 3.1Nulvi Dabbi 2.5 Madhubala 2.3Nulvi Kaddi 2.0 AgniRekha 1.5Annigeri 2.0 Overall 33.6Sweet / Bajji type 1.0 Sada Dabbi 1.0
Benthur deluxe 1.0Prakasham 0.5Bombay Dabbi 0.5Overall 52.2
1Total number of parcels is 399.
Cropping Pattern
Over 80% of chili fields were grown as single crop, and 18% were intercropped with one crop mainly cotton (Table 9). Very few parcels were intercropped with two crops, likeonionandcotton.Intercroppingwasmorecommoninlocalchili.
Table 9. Intercropping in the sample areas, by chili type, India, 2002
Intercrop % of parcelsHybrid Open pollinated Local Overall1
Chili alone 43 16 41 80Chili with one other crop - 6 94 18
Cotton - 5 95 79Onion - - 100 5Tobacco - - 100 10Maize - - 100 3Groundnut or cowpeas - 50 50 3
Chili with two other crops - - 100 2Onion and cotton - - 100 38Cotton and other crop - - 100 50
Onion and sorghum - - 100 121Total number of parcels is 399.
India

109
Whenchilicropwascultivatedalone,morethanhalfofthetotalareaunderallcrops(cropped area) was devoted to chili (Table 10). This implied that the sample farmers wereprofessionalchiligrowerswhoplantchilionacommercialscale.Mostchiliareacame from cereals as its area was reduced to half when compared with non-chili farmers. Some area also came from beans and pulses. However, chili-growing farmers had to reducesomeareaunderothervegetables.Theproportionofareaundercommercialcropon chili farms and non-chili farms was similar.
Table 10. Cropping pattern in the sample areas, by farmer type, India, 2002
Crop groupChili farmers Non-chili farmers
Without intercropping With intercropping1 Area (ha) Share (%)
Area (ha) Share (%) Area (ha) Share (%)
Chili 1.65 52.2 2.87 32.5 0.00 0.0Cereals 0.73 23.2 1.28 14.5 1.27 49.8Commercial crops 0.40 12.6 2.89 32.7 0.32 12.5Other vegetables 0.03 1.0 0.26 3.0 0.16 6.4Beans and pulses 0.28 8.8 1.52 17.2 0.66 25.6Others 0.07 2.3 0.01 0.1 0.15 5.7Total 3.16 100 8.84 100 2.56 100
1When crop A is intercropped with crop B, the given area was counted for each A and B, separately.Note: Cereals include maize, sorghum, rice, and wheat; Commercial crops include cotton, sugarcane, tobacco, and sunflower;
Beans and pulses comprises of groundnut, soybean, red gram, Bengal gram, cowpea, greengram, and horsegram; Other vegetables are onion, watermelon, tomato, cauliflower, garlic; and other crops are Jute, crotalaria, pomegranate, banana, jasmine, crossandra, and marigold.
Cultivation Time
Inthesamplearea,hybridandopenpollinatedchilieswerecultivatedassoonasmonsoonstartstorecedefrommiddletoendofSeptember,whilelocalchiliwasgrownmorethana month earlier, mostly in the middle of the rainy season in early July (Table 11).
ThestartofharvestingoflocalvarietieswasalittleearlyinmiddleofDecember,whilehybridsandopenpollinatedvarietieswerestartedinthelateDecemberandearlyJanuary,respectively. The last harvesting of modern varieties of chilies (hybrid and open pollinated) wascompletedinthethirdandfourthweekofMarch,whiletheharvestingoflocaltypewas finished in February. There was not much difference in the total duration of the crop across different chili varieties. Harvesting in March causes a significant drop in prices in March and April (Figure 4).
Usually, chili-chili-chili rotation was followed for many years. The ground was left fallowforafewdrymonths,fromtheendofharvestuntilthecultivationofthenextchilicrop.
Maravalalu Chandre Gowda, Mei-huey Wu, and Mubarik Ali

110
Table 11. Cultivation and harvesting time of chili in the sample areas, by chili type, India, 2002
Chili farmer Planting time (week and month)Harvesting time (week and month)
Start EndHybrid 4th September 3rd December 4th MarchOpen pollinated 2nd September 1st January 3rd MarchLocal 1st August 2nd December 1st FebruaryOverall 4th August 3rd December 1st March
Information Source and Chili Variety Selection
Seed
The dominant information source on seed for all chili types was the seed dealer (Table 12). Village shops and neighbor-farmers were also significant sources of seed information for open pollinated and local types of chili. Sivanarayana and Bhupal Reddy (2002) also revealed the same pattern of information-seeking behavior of the chili farmers wherein theinputdealerswerethemajorsourcesofinformationinWarangaldistrictofAndhraPradesh.
Table 12. Seed information source by chili type, India, 2002
Item Hybrid Open Pollinated Local Overall
Source of information (%)Village shop 22 24 19 22
Neighbor farmer 17 22 23 19
Seed dealer 50 38 40 46
Govt. department 5 8 2 5
Other 4 5 9 5Note: The figures in a column do not add up to one hundred because some farmers did not use any seed information source.
Selection of Chili Variety
Farmers consideredperhayield tobe the topcriterion in the selectionofvarieties,followedbyhighmarketprices,whichwasacompositemeasureofallgoodappearancecharacteristics.Diseaseandinsectresistancewasrankedthirdorfourthingreenchili,while chili color was ranked third in red chili (Table 13).
India

111
Table 13. Ranking of factors in the selection of chili seed in the sample areas, by chili type, India, 2002
CharacteristicsOverall rank
Green (for fresh) Red (for powder)
Market price 2 2
Yield 1 1
Disease free 3 4
Insect free 4
Chili color 5 3
Hotness 5Note: highest rank=1; lowest rank=5.
Overall Chili Market
Farmers got information on chili market (prices, demand, etc.) from neighboring farmers, newspapers, and traders (Table 14). Hybrid chili-growing farmers considered traders to be themostimportantsourceofinformation.Alltheotherchiligrowersrankedneighboringfarmersasnumberoneimportantinformationsourceonchilimarketing.Itisimportanttonotethattelevisionandradiowererankedrelativelylow,despitefarmers’ownershipoftheseelectricdevices.Thissuggestedthatnotmuchinformationregardingchilipriceswas relayed through media, or the information relayed was not specific to the varieties andthequalityofproducegrownbychilifarmersinthesamplearea.Theseresultswereconsistent with the survey findings of Sivanarayana and Bhupal Reddy (2002) where the T.V.andradiowerethelastrankedsourcesofinformationofchilifarmers.
Table 14. Source of chili marketing information and their rank in the sample areas, by farmer type, India, 2002
Chili farmer
Source (% of farmer) RankNeighbor
farmerNews-paper
Trader
TV
Radio
Other
Neighbor farmer
News-paper
Trader
TV
Radio
Other
Hybrid 22 22 22 13 3 18 2 3 1 4 - 5
Open pollinated 25 23 20 6 11 15 1 3 2 4 5 -
Local 25 24 20 4 12 15 1 2 3 - 4 5
Mixed 23 21 21 13 5 17 1 3 2 4 - 5
Overall 24 23 21 9 8 16 1 3 2 4 - 5
Maravalalu Chandre Gowda, Mei-huey Wu, and Mubarik Ali
Note: highest rank=1; lowest rank=5.

112
Insect and Pest Problem
Insects
About 95% of the farmers reported insect problem in all types of chilies (Table 15). Majority reported thrips, mites, and borers in the chili fields. In terms of importance, majorityoffarmersrankedborerasthenumberonedamaginginsectinhybrid,thripsinopen pollinated, and mites in local chili fields.
Table 15. Major insects found in chili in the sample areas, by farmer type, India, 2002
Farmer typeFarmers reporting (%) Rank1 Occurrence
(years out of 5)Average losses
(%)
T A M C Other 1 2 3 4 1993-97 1998-2002 1993-97 1998-2002
Hybrid 29.7 10.1 28.2 28.7 3.3 C T M A 2 3 26 14Open pollinated 36.1 2.8 33.3 27.8 0 T M C A 4 4 58 67Local 27.8 16.6 29.0 24.6 2.0 M T C A 2 2 58 64Mixed 30.6 7.7 31.1 27.6 3.0 T M C A 4 3 39 41Overall 29.3 12.3 29.5 26.4 2.5 M T C A 3 3 48 56
A=Aphids(Aphis gossypii and Myzus persicae);C=Caterpillar(Helicoverpa armigera and Spodoptera litura);M=Mites(Polyphagotarsonemus latus); T=Thrips(Scirtothrips dorsalis).1The rank of 1 is the most devastating, and 4 the least devastating insect.
On average, serious insect infestation occurred every three to five years. The highest losses due to insects in 1998-2002 were in open pollinated and local chili varieties where up to two-thirds of the crop were lost. Average loss due to insect attack on all types of chili crop in 1998-2003 was 56% implying that if insects were properly controlled chili yields could easily be increased by 50%. Average losses due to insects increased from 48% in 1993-97. Increasing losses was observed in all chili types, except in hybrid probably becauseofshorthistoryofuseofhybridvarieties.Moreover,hybridfarmersprotectedtheir crops from insects with more sprays. The decline in production of Bydagi (local) chiliinKarnatakawasattributedtohighintensityofmosaicvirustransmittedbythrips(Koshy 2000).
Diseases
Over 92% of farmers reported disease infections in their chili crops. Diseases were unidentified in most cases, except in local chili type where powdery mildew and anthracnose dominated. Overall, more farmers reported incidence of anthracnose and powdery mildew (Table 16). According to Hingole and Kurundkar (2004), powdery mildewwasan importantdiseasecausingwidespread loss inMaharashtraandotherpartsofIndia.
India

113
Table 16. Major chili diseases in the sample areas, by farmer type, India, 2002
Farmer typeFarmers reporting (%) Rank1 Occurrence
(years)Average losses
(%)
AN LS PM VR UI 1 2 3 4 1993-1997
1998-2002
1993-1997
1998-2002
Hybrid 23.2 12.6 17.4 8.7 38.2 AN PM DB LS 3 3 21 12
Open pollinated 16.2 18.9 29.7 5.4 29.7 PM AN LS DB 2 4 35 50
Local 23.5 13.8 25.8 19.4 17.6 PM AN VR LS 2 3 40 49
Mixed 20.7 13.4 17.3 15.1 33.5 AN PM DB VR 2 3 33 35
Overall 22.5 13.6 22.0 15.1 26.9 PM AN VR LS 2 3 34 43
AN=Anthracnose (Colletotrichum acutatum, C. capsici and C. gloeosporioides); LS=Cercospora leaf spot (Cercospora capsici); PM=Powdery mildew (Leveillula taurica, asexual stage: Oidiopsis sicula); DB=Die back (Colletotrichum) or yellowing due to unidentified disease factor; VR=Viruses; UI=Other unidentified.1The rank of 1 is the most devastating, and 4 the least devastating disease.
Anthracnose was ranked as the number one disease in hybrid and mixed-type farm, and powdery mildew by open pollinated and local-type farm. Overall, powdery mildew wasthenumberonediseaseintermsofyieldloss.Itshouldbenoted,however,thatunprecedenteddroughtwasexperiencedduringthesurveyyearandtheyearprecedingit,whichmighthavereducedthedevastationcausedbythetropicaldiseases.
The average losses due to diseases in 1998-2003 were 43% for all chili types. This implied that yield can be increased by 50% if diseases were effectively controlled. The lossesduring theseyearswerehighest inopenpollinated and local chili types, andlowestinhybridchili.Thelossesduetodiseaseswerelessthanthoseduetoinsects,probably due to difficulties in accurately attributing the losses to diseases or insects. Serious disease occurrence in chili increased from two to three in every five years from 1993-1997 to 1998-2002. The average yield losses also increased from 34% to 43% duringthesametime.
Weeds
Almost all farmers reported weed problems, although these were generally unidentified (Table 17). The number one weed was Cynodondactyloninhybridandopenpollinated,Cyperusrotundusinmixedchili,andParthenium hysterophorus by local chili fields. The secondrankingweedswereCynodondactyloninlocalchili,Cyperusrotundusinopenpollinated,andParthenium in hybrid and mixed chili fields. The other important weeds reportedby farmerswerePhalaris minor, Commelina sp.,Amaranthus and Sonchusarvensis and were ranked depending on the chili field type. Occurrence of weeds was a regular phenomenon, and average losses ranged from 2-3% per season.
Maravalalu Chandre Gowda, Mei-huey Wu, and Mubarik Ali

114
Table 17. Major chili weeds in the sample areas, by farmer type, India, 2002
Farmer typeFarmers reporting (%) Rank1 Occurrence
(years)Average losses
(%)CD CR PH PA CO OT 1 2 3 4 1993-97 1998-2002 1993-97 1998-2002
Hybrid 17 13 13 15 13 29 CD PA CR PH 5.0 5.0 2.2 2.1Open pollinated 20 19 8 11 9 32 CD CR PA SO 5.0 5.0 2.7 2.4Local 18 16 11 19 8 28 PA CD CR PH 5.0 5.0 2.3 2.2Mixed 13 17 11 15 11 32 CR PA CD PH 5.0 5.0 2.2 2.1Overall 17 16 12 17 10 29 CD PA CR PH 5.0 5.0 2.7 2.4
Note: CD=Cynodon dactylon; CR=Cyperus rotundus; PH=Phalaris minor; PA= Parthenium hysterophorus; CO=Commelina sp.; AM=Amaranthus; SO=Sonchus arvensis; OT=Other.
1The rank of 1 is the most devastating, and 4 the least devastating weed.
Farm Management Practices
Preparation of Seedling Nursery
About three-fourths of farmers prepared nurseries, while the rest practiced direct seeding. The percentage of direct seeding was lowest in hybrid chili (12%), highest in local type (23%) and in between the two in open pollinated improved varieties (23%).
In most cases, seedling nursery was in flat beds where seeds were broadcasted. Seedlings may be thinned if germination was good and plant population was heavy. One or two weedings may be done if weed infestation was heavy. Otherwise seedlings were not disturbeduntiltheywerereadyfortransplanting.
In very few exceptional cases, nurseries were established on raised seedbeds (about 10~15 cm height and 100 cm wide and of appropriate length) with seeds either broadcasted or line-sown at 10 cm apart. This was done only in hybrids.
Soil Treatment
A significant proportion of chili fields, especially those planted to hybrid, and three percent of nursery parcels, were treated for soil-borne diseases and pre-sowing insects (Table 18). Parcels under local chili had less soil treatments. Soil treatment was done by broadcasting. The quantity of materials used for field soil treatment, usually the insecticide Methomyl, ranged from 61 kg/ha in local to 101 kg/ha in open pollinated variety fields.
India

115
Table 18. Soil treatment method (% of farmers) and quantity in the sample areas, by chili type, India, 2002
MethodHybrid Open
pollinated Local Overall
Nursery Field Nursery Field Nursery Field Nursery Field
Broadcast 2 27 7 22 1 12 2 19Placement 0 3 2 2 0 0 0 1During land preparation - 6 - 2 - 1 - 3Others 2 - 0 - 0 - 1 -Total 4 36 9 26 1 13 3 23Quantity of treatment (kg/ha) 350 69 64 101 0 61 242 72
Seed Treatment
While 16% of farmers treated seeds by dusting, a few farmers also practiced soaking to control seed-borne diseases (Table 19). About one-fourth of farmers applied dusting toseedofhybridchili,andonlyninepercenttolocalvarieties.ThemajorchemicalsusedforseeddustingwereCarbendazimandMancozeb.
Table 19. Farmers (percentage) reporting seed treatment in the sample areas, by chili type, India, 2002
Chili typePercentage of farmers
Soaking Dusting
Hybrid 1 27
Open pollinated 2 17
Local 1 9
Overall 1 16
Plowing
Almost every chili field was plowed before planting. On average, 42% of chili parcels were plowed by tractor; 20% by animals; and 29% combination of both (Table 20). Tractor alone was less frequently used in local chili. On average, three to four plowings were done on different types of chili fields before transplanting.
On the whole, harrowing was done in 61% of chili parcels. Local and open pollinated (improved varieties) chili types had the highest number of harrowing. The main source ofpowerforharrowinginlocalchiliparcelswereanimals,andtractorinhybridandopen pollinated fields.
Maravalalu Chandre Gowda, Mei-huey Wu, and Mubarik Ali

116
Table 20. Land preparation method in the sample areas, by chili type, India, 2002
Chili typePercentage of parcels
Number of operation
Plowing HarrowingPlowing Harrowing
Animal Tractor Combined Others1 Total Animal Tractor Hand Others2 Total
Hybrid 12 60 23 3 98 17 26 3 9 55 3.4 1.0
Open pollinated 21 50 21 5 98 16 27 9 16 68 2.8 1.4
Local 25 27 36 4 91 24 10 14 15 63 3.0 1.3
Overall 20 42 29 4 94 20 18 9 13 61 3.1 1.21This include hand, hand+animal, hand+tractor, and hand+animal+tractor.2This include hand+animal, hand+tractor, animal+tractor, and hand+animal+tractor.
Bed Type
Chilies are either planted in furrows or on flat beds. Very few farmers used raised beds in the study area. Overall, about one-half of parcels were flat beds and the remaining were furrows (Table 21). Slight variation in bed types across chili type can be seen: for example, 70% hybrid was grown on flat beds compared to only 41% in local chili.
The average furrow size was estimated to be 12 cm tall and 20 cm wide. Average inter-plant distance was estimated at 41 cm. While the height of furrows does not vary across varieties,thesewererelativelynarrowerinopenpollinatedtype.
The plant-plant distance was lowest in open pollinated at 32 cm and highest in local varieties at 43 cm. Farooqi et al. (2003) observed a spacing of 45 x 45 cm or even closer than this in Andhra Pradesh.
Table 21. Bed type, dimensions and inter-plant distance in the sample areas, by chili types, India, 2002
Chili type
Bed type (% of parcels) Furrow Plant to plant Furrow Flat bed Height (cm) Width (cm) distance (cm)
Hybrid 30 70 13 21 41
Open pollinated 47 53 11 14 32
Local 59 41 12 20 43
Overall 47 53 12 20 41
India

117
Mulching, Staking and Shading
Only seven percent farmers used mulch, and these were mainly in hybrid chili fields. Farmersusedricestraw,whileplasticsheetingwasusedonlyontwopercentparcelsoflocal varieties (Table 22). The life of foil was about one year. No field was staked in the studyareaandnoshadeortunnelwasusedtoprotectchilicrop.
Table 22. Mulching material type in the sample areas, by chili type, India, 2002
Material typeChili type (% of parcels)
Hybrid Open pollinated Local Overall
Rice straw 13.1 5.5 2.5 6.6
Reflective foil (plastic sheets) 0 0 1.5 0.8
Overall 13.1 5.5 4.0 7.4
Fertilizer Application
In India, about 80% of chili-growing farmers applied organic fertilizers, mostly farm manure. Most of these were not properly decomposed, with only 0.5% of farmers practicing proper composting (Table 23). A few farmers used red earth or soil from uncultivated fields which were assumed to be more fertile. All farmers broadcast manure before sowing of seeds or transplanting of seedlings in the field. Inorganic fertilizers werealsoappliedusingthebroadcastingmethod.
Table 23. Organic fertilizer type used in the sample areas, by chili type, India, 2002
Chili farmerOrganic fertilizer type (% of farmer)
Farm manure Poultry manure Compost Red earth Total
Hybrid 75.9 - 0.7 - 76.6
Open pollinated 70.9 - - - 70.9
Local 87.9 0.5 0.5 0.5 89.4
Overall 81.3 0.3 0.5 0.3 82.4
Non-chemical Weeding
Almostallchiliparcelswereweededeithermanuallyorcombiningmanualweedingwithharrowing. On average, weeding was done four times (Table 24). Farmers’ perception abouttheeffectivenessoftheirweedingmethodswashigh,exceptinlocalchiliwhereoverone-fifth of farmers thought that the weeding operation controlled only 75% weeds.
Maravalalu Chandre Gowda, Mei-huey Wu, and Mubarik Ali

118
Table 24. Non-chemical weeding and its perceived effectiveness by farmers in the sample areas, by chili type, India, 2002
Chili type Parcels received weeding
(%)
Number of weeding
Method (% of parcels) EffectivenessManual weeding
Harrowing Both 100% 75% 50%
Hybrid 99 4.4 49 4 47 97 2 1Open pollinated 100 4.3 47 6 47 90 8 2Local 98 4.0 40 17 43 78 22 1Overall 99 4.2 44 11 45 87 12 1
Irrigation
Chilicropwascultivatedunder irrigatedaswellas rainfedconditions in thesampleareas. Over one-third of chili fields, mainly local type, were rainfed (Table 25). Over half of the chili parcels were flooded, mainly through ridges. A small percentage was irrigatedmanually, and an even smaller percentagewas irrigatedusing sprinkle andtricklemethods.Theopenpollinatedandlocalchilitypesweremainlyirrigatedthroughcanals,andhybridchilitypewasirrigatedfromothersources.
Table 25. Irrigation methods and source in the sample areas, by chili type, India, 2002
Chili type
Irrigation method (% of parcels) Irrigation source (% of parcels)Flooding
Manual Sprinkle + trickle
Rainfed Canal Tube well
Tank Others* Without ridges
With ridges
Hybrid 20 61 15 4 0 34 19 9 38Open pollinated 18 45 9 4 24 53 10 1 13Local 5 31 1 1 63 16 5 5 12Overall 12 43 7 2 36 28 10 5 21
*Others include open wells, shallow open wells, streams and farm ponds.
Insect Control
Overall, three-fourths of chili farmers used insecticides, suggesting the intensity of insect problem in chili cultivation (Table 26). Pesticide coverage was 50% in local chili, more than 80% in open pollinated, and almost 100% in hybrid chili. A large percentage ofparcelswastreatedwithcocktail,amixtureoftwoormorepesticides.Incocktail,morenumberofchemicalswasusedthanwhenitwas singly applied. On average, seven to nine different types of pesticides were applied. Over 98% of farmers sprayed the insecticides, and only less than 2% used other methods like dusting and mixing pesticide withirrigationwater.
India

119
Overall, three-fourths of chili farmers used insecticides, suggesting the intensity of insect problem in chili cultivation (Table 26). Pesticide coverage was 50% in local chili, more than 80% in open pollinated, and almost 100% in hybrid chili. A large percentage ofparcelswastreatedwithcocktail,amixtureoftwoormorepesticides.Incocktail,more number of chemicals was used than when it was singly applied. On average, seven to nine different types of pesticides were applied. Over 98% of farmers sprayed the insecticides, and only less than 2% used other methods like dusting and mixing pesticide withirrigationwater.
Table 26. Extent of insecticide use and its perceived effectiveness by farmers in the sample areas, by farmer type, India, 2002
Chili type Percentage of parcels Number of chemicals Effectiveness (%)Single Cocktail Overall Single Cocktail Overall
Hybrid 63 36 99 7.4 9.2 8.0 77Open pollinated 32 51 83 7.4 9.4 8.6 69Local 22 23 45 5.4 8.7 6.7 51Overall 44 31 75 6.6 9.0 7.6 64
Disease Control
Overall, three-fourths of farmers used fungicide to control disease infestation in chili. Thepatternoffungicideuseamongdifferenttypesoffarmerswassimilartoinsecticidesuggestingthattheapplicationsofbothwerelinked.Similarwithinsectcontrol,morenumber of chemicals was used in cocktail than in single application. On average, six to seven different types of fungicides were applied (Table 27). Over 93% of farmers sprayedthefungicideandlessthansevenpercentusedothermethodslikeplacement,broadcast,andothers.
Perceived effectiveness of fungicide ranged from 64% in local chili to 81% in hybrid, or an average of 75%. Many types of fungicides were available in the market, Mancozeb and Bavistin being the more popular (Appendix 1).
Table 27. Extent of fungicide use and their effectiveness on chili in the sample areas, by farmer type, India, 2002
Chili typePercentage of parcels Number of chemicals Effectiveness
(%)Single Cocktail Overall Single Cocktail Overall
Hybrid 80 20 99 5.5 7.3 5.8 81Open pollinated 35 46 81 5.5 6.6 6.1 79Local 29 20 49 4.8 6.4 5.5 64Overall 47 23 70 5.3 6.8 5.8 75
Maravalalu Chandre Gowda, Mei-huey Wu, and Mubarik Ali

120
Non- chemical/Conventional Method of Pest Control
Only a few farmers (not more than three percent), mostly of local chili, indicated that they used non-chemical methods to control insects and diseases. These methods included earlysowingandmorefrequentpicking.Thesewerelinkedwiththeavailabilityoflaborandland,whichinmanycaseswerelimited.
Harvesting
On average, harvesting was done three times (Table 28). In hybrids and open pollinated, it was done more than three times and less than three times in local types. About one-third oflocalchili,andonehalfofotherchilitypeswereharvestedusingfamilylaboronly.Bothfamilyandhiredlaborwereusedtoharvestasubstantialproportionofchiliparcels,especiallyinlocalchili,whileveryfewparcelswereharvestedusinghiredlaboronly.
Table 28. Number of harvest and type of labor used in chili harvesting in the sample areas, by chili type, India, 2002
Chili type Number of harvestPercentage of parcels
Family Hired BothHybrid 3.6 48.9 0.7 50.4Open pollinated 3.1 45.5 1.8 52.7Local 2.3 31.2 2.2 66.7Overall 2.9 39.6 1.6 58.8
Marketing
Farmers
Farmerssoldchilimainlyinpowderordryform.Thechiliwasdriedbeforebroughtto crushing machines within their own or nearby villages, or these were crushed athome. Overall, 15% of output, mostly of local variety, was sold in green form. With the introduction of modern varieties, the share of chili sold as green has increased(Table 29).
Table 29. Form of chili sold by farmers in the sample areas, by chili type, India, 2002
Variety Green Powder or dryHybrid 18.0 81.7Open pollinated 6.0 93.1Local 59.5 40.5Overall 15.4 83.6
India

121
Inmostcases,farmersbroughttheoutputtothemainmarketwhereitwassoldtoretailersthrough commission agents (Table 30). Eight percent of hybrid chili farmers sold to commission agents who directly picked up the products from farmers’ field, and another eightpercentsoldtothelocalvillagemarket.
Producers and village merchants did not practice grading. They did, however, remove discolored,damaged,androttenchiliesduringdryingprocess.Thewholesalemerchants,however,generallysortedoutdamagedanddiscoloredchilibeforetheproducewassoldorsent to theconsumingmarkets.Chiliwasmostcommonlypackedingunnybags.‘Toddy mats’ were used in Andhra Pradesh. Green chilies were sometimes brought to marketinbasketsmadeofsplitbamboosandwicker.
A largemajorityof farmers stated thathighmarket cost, uncertaintyof chili prices,andexploitationofthemiddlemenintermsofhighcommissionweremajormarketingconstraints.
Table 30. Market outlets for chili in the sample areas, by chili type, India, 2002
Chili typeFarmer selling (%)
Local market Commission agent Main market Assembler in village
Hybrid 8 8 69 15Open pollinated 0 0 95 5Local 3 0 93 4Overall 3 1 90 6
Marketing Agents and Processors
In general, traders classified chili into four grades using the following criteria: i) color (red was better), ii) size (big was better), iii) shape (long conical shape was preferred), iv) seed content (higher seed content was preferred), v) pungency (strong was better), vi) presence of dirt and other foreign matter (lower presence was given higher grade), vii) damaged by insects and diseases (less was preferred), and viii) moisture content (drier was better) (Table 31).
On the other hand, market agents for dry or powder chili ranked these characteristics in the following order: 1--color, 2--hotness, and 3--appearance. Disease and insect infection werenotconsideredaswellaspurchasepricesincetheagentscanadjusttheirsellingpricesaccordingly.
Forprocessors,chilicolorwasthenumberonecriterioninselectingbothprocessedchilias well as fresh red chili for processing. Pungency was second. Other criteria were number ofseeds;diseasesandinsectinfestation,andfreshnessrankedinthatorder.
Maravalalu Chandre Gowda, Mei-huey Wu, and Mubarik Ali

122
Table 31. Ranking of chili characteristics preferred by market agents and processors in the sample areas by chili type, India, 2002
CharacteristicsMarket agent ProcessorDry or powder Red Product
Prices 4Disease/insect free 4 4Appearance 3 3Color 1 1 1Fragrance 4Pungency 2 2 2Number of seeds 3Freshness 5 5
Note: Highest rank=1, and lowest rank=5.
Marketingagentsrankedthefollowingmarketingconstraintsintheorderofimportance:1--poor quality produce, 2--inadequate storage facilities, and 3--no government support and incentive for setting up chili marketing structure. (Table 32).
Table 32. Major constraints faced by market agents in the sample areas, India, 2002
Constraints Percent reporting Rank
Poor quality produce 25 1
Inadequate storage facilities 25 2
No government incentive/support 25 3
Low price/variability in chili price 13 5
Other marketing problem 12 4Note: Highest rank=1 and lowest rank=5.
Input Use
Seed Rate
The rate of seed used per ha ranged from 3.1 kg in local to 1.6 kg in hybrid chili, or an average of 2.4 kg (Table 33). The average seed rate used in hybrids was high because of F2 seeds. However, farmers who grew F1 seeds of the hybrids actually used only 0.3 kg/ha and paid Rs 25,054/kg. Almost all hybrid and two-thirds of the open pollinated seedswerepurchased.Amongthefarmerswhogrewhybrids,46purchasedandusedF2 seeds at the rate of 2.5 kg/ha at Rs 409/kg. The percentage of seeds purchased was relativelylowinlocalchilitypes.Inopenpollinatedvarieties,fourfarmersboughtandused seedlings (not reported in the table) at an average of 107,878 seedlings/ha. The majorsourceofseedswereseeddealersfollowedbyneighboringfarmers,exceptinlocalchilitypewhereneighboringfarmerswasthemajorsource.
India

123
Table 33. Seed rate and seed source of farmers in the sample areas by chili type, India, 2002
Chili typeSeed rate (kg/ha) Parcels
using purchased seed (%)2
Seed source (% parcels)
Own produced1
Seeddealer
Villageshop Others3Own farm
produced1 Purchased Average
Hybrid 3.8 1.4 1.6 92 27 55 6 12Open pollinated 2.4 2.1 2.2 69 33 47 3 17Local 3.2 2.9 3.1 24 59 15 13 13Overall 3.2 1.8 2.4 54 35 45 7 13
1 Includes seed obtained from neighboring farmers.2 Includes purchased seedlings. 3 Others include extension agents, government departments, etc.
Fertilizer Use
Almostallfarmersusedinorganicfertilizersinallchilitypes,withanoverallnutrientapplication rate of 385 kg/ha (Table 34). Application was highest in hybrids, and lowest in local chili. The most economical NPK levels were 90:52:30 kg/ha under rainfed conditions (Singh and Singh 1996).
Local chili types were applied with the highest amounts of organic fertilizers. On average, use of manure ranged from 6.1 t/ha in local chili to 8.4 t/ha in hybrids of which only 0.07 t/ha and 0.12 t/ha were compost manure, respectively. Small quantities of red earth (soil from uncultivated land believed to be more fertile) were also used to enhance land productivity.
Table 34. Quantity of organic and inorganic fertilizer application in chili farm in the sample areas by chili type, India, 2002
Chili type
Nutrients from inorganic fertilizer (kg/ha) Type of manure applied (t/ha)
N P K Total Farm Poultry Compost Red earth
Total
Hybrid 263 187 82 532 8.27 - 0.12 - 8.39Open pollinated 205 146 48 399 6.33 - - - 6.33Local 134 101 45 280 6.00 0.06 0.07 0.01 6.15Overall 190 137 58 385 6.84 0.03 0.08 0.01 6.96
Maravalalu Chandre Gowda, Mei-huey Wu, and Mubarik Ali

124
On average, 11 kg or liters of insecticide were used in all chili types. The amount of insecticide use was highest in hybrids, and lowest in local chili. A total of 41 different chemicalswereusedasinsecticideinthesurveyarea;sometimesthesamechemicalwassold with different brand names. About 40% of these were also used as fungicide. The majorinsecticidesusedinthestudyareawereMonocrotophos,Fipronil,Cypermethrin,Dicofol and Chlorpyrifos (Appendix 1).
Ahigherquantityofpesticidewasusedincocktailcomparedtotheoneinsinglepesticideapplication, except in open pollinated fields. Total number of sprays ranged from seven in local chili to 15 in hybrids (Table 35). The high number of sprays also indicated the seriousnessofinsectinfestationproblemonchili.
Insecticide
Table 35. Quantity of insecticide used and number of sprays on chili farms in the sample areas by chili type, India, 2002
Chili typeQuantity (kg or liter/ha) Total number of
spraysSingle Cocktail Overall
Hybrid 17.1 20.8 18.2 15Open pollinated 18.8 15.2 13.7 13Local 8.3 12.4 5.6 7Overall 13.7 16.4 11.0 10
Fungicide
On average, 9.3 kg or l/ha of fungicide was used on chili(Table 36). The highest use was on hybrid, while the lowest use was on local chili. A total of 36 chemicals were used as fungicide; sometimes the same chemical was sold with different brand names; two-thirds ofthesefungicideswerealsousedasinsecticides.Themajorfungicidesusedinthestudyarea were Mancozeb and Carbendazim. Unlike insecticide, fungicide quantities were generallyreducedwhencocktailwasmade.Theaveragenumberoffungicidespraywasseven,thehighestbeingappliedtohybridsandlowesttolocalchili.
Table 36. Quantity of fungicide use and number of sprays in chili farms in the sample areas by chili type, India, 2002
Chili type
Quantity (kg or liter/ha)Total number of
spraysSingle Cocktail Overall
Hybrid 16.7 7.3 16.2 13Open pollinated 14.3 6.6 9.9 6Local 9.9 9.0 4.7 3Overall 14.3 6.8 9.3 7
India

125
Irrigation
On average, chili fields were irrigated 11 times with hybrid chili fields having the highest number of irrigations at 21 and local chili fields receiving the lowest of only five; open pollinated chili fields were irrigated 12 times. Other studies estimated eight to nine number of irrigations which was close to the estimates in this study (Singh and Singh 1996).
On average, chili cultivation in India used 294 labor days/ha. The lowest number of labor wasusedinlocaltypewhilethehighestinhybridfollowedbyopenpollinatedtypes,implying that improved varieties were labor intensive, as they require 48-112% more labor compared to local chili (Table 37).
Excessiveapplicationof inputs like seeds,potash fertilizers andhuman labor in thechili-based mixed cropping systems had been previously documented (Korikanthimath etal.2000).
Labor
Table 37. Distribution of labor among different activity groups in the sample areas by chili type, India, 2002
Chili typePercentage distribution Total labor
(day/ha)Land preparation Management Harvesting Post-harvestingHybrid 11.9 53.1 26.4 8.6 426Open pollinated 14.3 47.2 29.9 8.7 298Local 15.4 49.9 23.0 11.7 201Overall 14.0 50.6 25.2 10.2 294
Chili management accounts for nearly one-half of the total labor used. Harvesting used one-fourth of the total labor requirement, land preparation 12-16%, and post-harvesting 10%. The share of the post-harvest and land preparation to total labor was surprisingly highestinlocalchilitype.Similar to rice, about three-fourths of the labor used on chili was hired. The proportion of hired labor was highest in harvesting operation and lowest in crop managementoperations. Improved chili varieties did not have significant impact on hired labor utilization (Table 38).
Maravalalu Chandre Gowda, Mei-huey Wu, and Mubarik Ali

126
Table 38. Source of labor in the sample areas by operation and chili type, India, 2002
Chili typePercentage distribution1
Land preparation Management Harvesting Post-harvesting OverallHired Family Hired Family Hired Family Hired Family Hired Family
Hybrid 84.3 15.7 61.9 38.1 92.4 7.6 84.7 15.3 74.6 25.4Open pollinated 83.2 16.8 63.7 36.3 92.6 7.4 83.7 16.3 76.8 23.2Local 75.4 24.6 72.9 27.1 89.1 10.9 72.9 27.1 77.0 23.0Overall 79.2 20.8 67.6 32.4 90.9 9.1 77.8 22.2 76.1 23.9Rice - - - - - - - - 79.8 20.2
1The distribution between family and hired labor under each operation adds up to 100.
Production
Per ha Yield
The overall per ha yield of chili in the study area was about 10 t/ha in fresh weight (Table 39). This estimate was higher than the national average as well as the estimate of Farooqi et al. (2003) at 7.5 t/ha. This may be due to the concentration of our survey inmajorchiligrowingareas.
Table 39. Chili yield (fresh weight in t per ha) in various intercrops in the sample areas, by chili type, India, 2002
Chili type Chili (alone)Chili
(intercrops with other crop) Relay with another crop Overall
One intercrop Two intercropsHybrid 16.6 (0.61) - - - 16.6a (0.61)Open pollinated 14.2 (0.76) 7.6 (1.51) - - 13.7b (0.79)Local 6.4 (0.88) 0.6 (0.94) 0.7 (1.12) 0.7 (1.04) 4.1c (1.27)Overall 12.4 (0.81) 1.2 (2.96) 0.7 (1.12) 0.7 (1.04) 10.0 (1.01)
Note: The figures in brackets are coefficients of variation (CV). In a column, chili yield followed by a different superscript are statistically different at 10% level across chili types.
Yieldwashighestinhybrid,andlowestinlocalchilitypesduetoitsstumpypotential,low intensity of inputs applied, and traditional management practices used in itscultivation. The two to three times difference in yield in local and improved (hybrid and openpollinated)chilivarietiessuggeststhatthereisabigpotentialfortheimprovementofthefarmers’yieldbyintroducingimprovedvarieties,improvingfarmers’accesstotheinputsrequiredinthesevarieties,andprovidingthemtrainingforthemanagementpracticesassociatedwiththesevarieties.
India

127
Theyieldofchiliasanintercropwaslowerthanitsyieldasasinglecrop.Sheshadri(2000) also found in that the intercropping of hybrid cotton significantly reduced the dry chili yield. Similarly, Manjunatha et al. (2001) found lower yield levels of intercropped chilithanthesolecropofchili.However,itisnotcertainhowthecombinedyieldofchiliandthecropwithwhichitwasintercroppedwasaffectedbyintercropping.
Intercropping not only decreased yield but also increased risk as reflected by the higher coefficient of variation (CV) in the system compared to the one in sole crop.
Theavailabilityofwatercandramatically increasechiliyield,regardlessof its type.The variation in chili yield was also lower in the irrigated system compared to the non-
Table 40. Chili yield in fresh weight of sole crop (t/ha) in the sample areas, by irrigation and chili types, India, 2002
Chili type Irrigated Un-irrigatedHybrid 16.6 (0.61) -Open pollinated 16.5a (0.59) 6.2b (1.71)Local 8.7a (0.63) 2.3b (1.26)Overall 14.3a (0.67) 3.2b (1.81)
Note: The figures in brackets are coefficient of variation (CV). In a row, chili yields followed by different superscripts are statistically different at 10% level across irrigation types.
Grades of Chili and Prices
Although farmers do not practice grading using the quality criteria defined earlier, they classified about two-fifths of their output as high grade (grade1) and another two-fifths of mix grade (Table 41). There were only relatively few that were classified as grade2 and grade3, except in local chili where 23% of the product was of grade2. There was not much incentive for grading, as price differential between grade1 and mix grade was insignificant . This explained why a large percentage of farmers sold their output without grading.
Table 41. Chili grades and prices in the sample areas, by chili type, India, 2002
Chili type Percentage Price of fresh chili (INR/kg)Grade1 Grade2 Grade3 Grade mix Grade1 Grade2 Grade3 Grade mix Overall
Hybrid 41 5 8 46 9 7 3 7 7.1Open pollinated 42 13 5 40 8 8 4 8 7.4Local 36 23 8 33 9 7 5 9 8.5Overall 40 14 7 40 9 7 4 8 7.8
Theoverallpriceof localchiliwashigher thanother improvedvarieties.Therefore,farmersattachspecialpreferencestotheattributesinlocalchilitype.Theopenpollinated(improved) varieties also fetched significantly higher prices than hybrid varieties.
Maravalalu Chandre Gowda, Mei-huey Wu, and Mubarik Ali

128
Economics of Chili Cultivation
Cost and Factor Share
Per ha cost of chili cultivation was highest in hybrid, yet cost per unit of output was lowest because of its high productivity (Table 42). On the other hand, the per ha cost oflocalchiliwaslowest,butitsperkgcosthighestamonghotchilitypesbecauseofitslowproductivity.Thisimpliesthatmodernchilivarietiesneedhighinvestment,butitshighproductivityreducestheperunitcostofoutput.Therefore,localchilicannotcompetewithhybridandopenpollinatedcrops,unlessithasspecialattributespreferredbyconsumerstoattracthigherprice.Theperhaandperkgcostofopenpollinatedtypewasinbetweenhybridandlocaltypes.However,thedifferenceinperunitcostofhybridand open pollinated was not significant.
After fixed costs such as land rent and machinery cost, labor was the next major input in chili cultivation, accounting for at least one-fourth of the total cost followed by pesticide. Theshareoflaborintotalcostwaslowerinhybridandopenpollinatedchilicomparedto local chili, suggesting that farmers applied traditional labor-intensive technologies in local chili. The share of pesticide ranged from 19% in local to about 21% in open pollinatedandhybridchilitypes,respectively.Fertilizerwasalsooneofthemajorcostitems in chili cultivation accounting for 11-13% of total cost in different chili types.
Table 42. Cost of production and factor share in the sample areas, by chili type, India, 2002
Chili type
Cost of production Factor share (%)
Total(INR/ha)
Per unit output(INR/kg)1 Labor Seed Fertilizer Manure Irrigation Pesticides Others2
Hybrid 64,816a 5.4b 25 8 11 5 3 21 27
Open pollinated 45,229b 7.6b 25 2 13 4 2 21 33
Local 34,635c 9.3a 27 2 13 6 1 19 31
Overall 49,957 7.3 26 5 12 5 2 20 301Output cost is based on fresh form of chili.2Others include land rent, machinery cost, and interest cost.Note: The different superscript in a column indicates that the figures are statistically different across chili types.
Economics of Chili Cultivation
Totalcostandnetreturnseemstobepositivelyrelatedacrosschilitypes.Ingeneral,netreturnwashighwheretotalcostwashigh.Ironically,highcostwasassociatedwithmodernvarieties,althoughthiswasaworthyinvestmentsinceitgeneratedhighratesofreturn (Table 43). This implied that high return in chili cultivation was obtained only by those making high investments, hence limiting its cultivation to the resource-rich farmers.
India

129
Reducingthecostofchilicultivationespeciallyforimprovedvarietiesisachallengeforresearchers,whileincreasingchilifarmers’accesstocreditachallengeforpolicymakers. This will expand chili cultivation to resource-poor farmers.
Table 43. Economics of cultivation of chili in the sample areas, by chili type, India, 2002
Chili type Gross return (INR/ha)
Net return (INR/ha)
B-C ratio (%)
Labor productivity (INR/day)
Fertilizer productivity (INR/kg)
Hybrid 103,038a 38,222a 79b 309ab 292a
Open pollinated 97,639a 52,410a 111a 380a 320a
Local 52,636b 18,001b 40c 253b 185b
Overall 83,054 33,097 70 300 256Note: The different superscript in a column indicates that the figures are statistically different across chili types.
Modernvarietiesnotonlyprovidedhighrateofreturnoninvestment,theyalsoimprovedresource productivity, such as labor and fertilizer.Among modern varieties, openpollinatedchiligavelowerperhayield,butincurredlowerproductioncostcomparedtohybridvarieties.Infact,openpollinatedvarietiesinIndiawasmorecompetitivethanhybrid types, as it produced output at lower cost, and had higher resource efficiency, such as fertilizer and labor (Table 43).
Attractions and Constraints in Chili Production
Farmers considered profitability as the main attraction in chili cultivation, except those growingopenpollinatedvarietieswhoconsidereditasecondconsideration.Adaptabilityof chili cultivation to local climate was their main attraction. Other considerations for chilicultivationwereadaptabilitytosoils,experienceinchilicultivation,andtraditionof growing chili (Table 44).
Table 44. Ranking of attraction attributes in chili cultivation (%) in the sample areas, by chili type, India, 2002
Attraction attributesRanking*
Hybrid Open pollinated Local Mixed
Profitability 1 2 1 1
Adaptability to climate 4 1 3 2
Adaptability to soil 2 3 4 4
Experience 3 5 5 3
Tradition 5 4 2 5*Highest rank=1 and lowest rank=5.
Maravalalu Chandre Gowda, Mei-huey Wu, and Mubarik Ali

130
Overall, farmers viewed disease infestation and insect attack as the most important constraints in chili cultivation (Table 45). In different chili farmer types, disease infestation or insect attack was ranked either the first or second major constraints. Except in local chilifarmertype,thethirdmajorconstraintfacedbyfarmerswaslowandvariableprices.Unpredictable environment was the third major constraint in local chili, while it had relativelylowpriorityinothertypes.Surprisingly,lowyieldandweedswereconsideredtoberelativelylowrankingconstraints.
Table 45. Ranking of constraints faced by chili farmers in the sample areas, by chili type, India, 2002
Constraints
Type of farmerHybrid Open pollinated Local Mixed Overall
Diseases 1 2 1 1 1
Insects 2 1 2 2 2
Low price/variability in chili price 3 3 4 3 4
Environment 4 5 3 5 3
Weeds 5 4 5
Low yield variety 4 5Note: Highest rank=1 and lowest rank=5.
Chili Consumption
Per Capita Consumption of Chili
Amongthevariousspicesproducedinthecountry,percapitaconsumptionwashighestfor chilies (Farooqi et al. 2003). It was consumed either in green or powder forms. Very littleotherformofprocessedchiliproductswereusedinIndia.Whenallconsumedchiliitems were converted into fresh weight, about two-thirds of the consumption by chili farmers, one-half by non-chili farmers and one-third by urban consumers were in chili powder form. Chili farm families consumed about one-fifth of the fresh chili weight in green fresh form, while the ratio for the non-chili growing farm and urban families was aboutonefourth.Theshareintheconsumptionofotherchiliformsandproductswererelatively small (Table 46).
India

131
Table 46. Relative share of different chili types in total consumption in the sample areas, by consumer type, India, 2002
Type of chili
Quantity share (%) as consumed Quantity share (%) after converting into fresh weight3
Chili farmer
Non-chili farmers
Urban consumer
Overall4 Chili farmer
Non-chili farmers
Urban consumer
Overall4
Green fresh 45.3 60.0 48.2 55.4 18.4 29.1 23.7 26.9
Red fresh 0.9 0.1 1.7 0.7 0.4 0.0 0.9 0.3
Sweet fresh 2.4 0.0 15.0 5.5 1.0 0.0 7.3 2.7
Dry chili 8.4 6.8 15.2 9.9 13.7 13.3 29.8 19.3
Chili powder 38.9 26.4 19.1 24.0 63.2 51.2 37.6 46.5
Other products1 4.1 6.6 0.8 4.4 3.4 6.4 0.8 4.3
Overall (g/week)2 182.4a 92.3b 85.3b 90.5 448.8a 190.5b 173.8b 186.61Others include chili pickle, paste, curry and other chili products mostly prepared at home by chili-growing families.2The figures in this row are average per capita chili consumption. The different superscript on the figures across this row implies that they are significantly different at the 10% level.
3Dry chilies and powder chili were converted into fresh by multiplying their weight with 4. Similarly, chili pickles, paste, curry and other products were converted into chili fresh weight by multiplying with 2.
4Chili consumption in India was estimated assuming 1%, 60%, and 39% weights for the chili producer, non-chili producer, and urban consumer, respectively.
On average, per capita weekly consumption of chili in India was about 186.6 g or 27 g daily of fresh weight equivalent. This consumption was higher than the per capita availability figure estimated from production. The reasons may be due to inclusion of the fresh market and home garden-produced chili in this estimate which was excluded from themacro statistics forproduction.Resultsmayalsobebiasedbecauseof theconcentration of this survey in the main chili-producing areas.
Thehighestconsumptionofchiliwasbyfamiliesengagedinitscultivationcomparedtothosewhowerenotengagedinitsproductionorlivinginurbanareas.Theconsumptionof non-chili growing farmers was similar to urban consumers.
In India, about three rupees per week per person were spent on chili. More than 50% of this was spent on chili powder and 17% on dry chili. The green fresh constitute 18% of the total expenditure on chili (Table 47).
Maravalalu Chandre Gowda, Mei-huey Wu, and Mubarik Ali

132
Table 47. Relative share of expenditure (%) of consumers on different chili types in the sample areas, India, 2002
Type of chili Chili farmer
Non-chili farmer
Urban consumer Overall1
Green fresh 14.8 18.2 17.3 17.8Red fresh 0.7 0.1 2.1 0.9Sweet fresh 1.7 0.0 4.8 2.0Dry chili 8.1 12.2 25.1 17.4Chili powder 70.1 54.2 48.8 52.4Other chili products2 4.7 15.2 1.8 9.5Overall weekly expenditure (INR)3 6.4a 2.7b 3.0b 2.9
1The chili consumption in overall India was estimated assuming 1%, 60%, and 39% weights for the chili producer, non-chili producer, and urban consumer, respectively.
2Others include chili pickle, paste, curry and other chili products mostly prepared at home by chili-growing families.3The different superscript on the figures across this row implies that they are significantly different at the 10% level.
Retail Value of Chili and its Products
Using the per capita weekly expenditure in Table 46 and per capita weekly consumption inTable45,theestimatedaverageperkgpriceofchilianditsproductsinfreshweightwas INR15.5 (US$0.345) at the retail level. This price was about double the farm gate price in the survey area reported in Table 41. Applying this proportion, the farm value of chili in India at US$867 million was converted into the retail value of chili and its products at US$1.727 billion.
Response to Price Changes
Powder chili had the lowest response when prices were changed; doubling its prices will decrease consumption by only eight percent and decreasing the prices by 75% will increase consumption by only 10%. The responses for red and green fresh chilies were slightly higherthanforpowderchili.Thehighestresponsecamefromsweetchili–doublingtheprice will decrease consumption by 62% and decreasing the price by 75% will increase consumption by 63% (Table 48). Therefore, red, green, and processed chili is an essential ingredientofeverymeal,whilesweetchiliisconsideredanormalvegetableinIndia.
India

133
Table 48. Effect of price changes on chili consumption in the sample areas, by chili type and product, India, 2002
Change in price (%)Hot chili SweetGreen Red Powder Product
Increase in price Change in demand (%)110 -0.1 0.0 -0.5 -1.0 -10.0125 -0.3 -0.7 -1.0 -3.2 -15.3150 -1.5 -3.0 -2.8 -6.0 -37.7175 -7.4 -5.0 -5.0 -10.7 -50.2200 -19.3 -12.5 -7.9 -17.8 -61.7
Decrease in price 90 5.1 4.0 0.7 2.0 10.875 7.2 6.8 1.5 5.7 25.750 10.3 10.0 3.2 9.8 46.325 11.4 14.8 10.0 15.0 63.0
Source of Supply
Farmers mainly got fresh and dry chili from their own farm, although a significant portion ofthesealsocamefromthelocalmarket.Chilipowderandproducts,suchaspickleandpaste, were also homemade suggesting significant on-farm processing activities in rural areas (Table 49).
Urban consumers bought fresh chili paste mainly from local market, and sweet chili from local and cooperative/supermarkets. About one-half of dry chili came from the local marketandtheremaininghalfwasdistributedacrossvarioussources.Thesourcesforchili product were the main markets and cooperative shops/supermarkets. A significant portionofredchiliconsumedasfreshcamefromhomesources,suggestingproductioninhomegardensinurbanareas.Mosturbanconsumersalsomadetheirownchilipowderto ensure quality from purchased or home garden-produced chili.
Maravalalu Chandre Gowda, Mei-huey Wu, and Mubarik Ali

134
Chili type
Farmer Urban consumer
Farm supply
Home-made
Local or main market Others Home-
madeLocal or
main marketCo-op. shop or
supermarketOthers
Hot chili Green 46 0 24 30 0 57 34 9 Red 63 0 14 23 10 74 0 16 Dry chili 70 16 4 10 3 50 0 47 Chili powder 0 78 6 16 91 0 5 4Sweet chili 50 0 36 14 0 50 50 0Chili products 4 61 16 19 0 60 40 0Overall 31 34 13 22 29 38 16 17
Table 49. Chili purchasing place by type of farmer and consumer in the sample areas, by chili type, India, 2002
Chili Attractions in Consumption
Infreshgreenandredchilies,hotnesswasthenumberoneattributetheconsumerslookedforwhenbuying.Inchilipowderandproducts,redcolorortheimpressionofthecolorthattheproductwillgivetotheirfoodwasthemaincriteriontheconsumerslookfor.Insweetchili,appearanceorfreshnesswasthetoprankingcharacteristics.Assweetchiliwas most responsive to prices (Table 48), it became the number 2 ranking criterion. Surprisingly, pest infestation (disease and insect) was the second ranking criterion in fresh hot chili (green and red) (Table 50). It means that pests not only reduce yield, they mayalsodecreasepricesoftheoutput.
Table 50. Consumers’ ranking for chili characteristics in the sample areas by chili type, India, 2002
Selection criteria Hot chili Sweet chiliGreen Red Powder ProductMarket price 4 3 4 3 2Disease free 2 2 5 4Insect free 2Overall appearance 5 3 1Color 5 4 1 1Pungency 1 1 2 2 3Shape 3Freshness 3
Note: Highest rank=1 and lowest rank=5.
India

135
Consumers’ Preference for Packaging
Greenandredchilieswerepreferredunpackedandsweetchiliwaspreferredinpaperwrapping. Consumers thought that these products remained fresh in this way - the most preferredattributeinsweetchili.Chilipowderwaspreferredunpacked,inpaperandglasswrappingswithalmostequalproportioneachforvariousreasons,whilechiliproductswere mainly preferred in plastic and glass packaging (Table 51). However, for tropical conditions, it is recommended that High Density Poly Ethylene (HDPE) films are suitable for packaging Guntur (OP) and Byadagi (local) whole chilies in unit packs of 250 grams (Pura Naik et al. 2001).
Table 51. Consumer preferences for chili packaging in the sample areas, by chili type, India, 2002
Chili type
Packing type
Preference (%)
Reason (%)
Freshness Best image Cheap Providing
variety Ideal* Visibility Other
Green/red Unpacked 65 69 5 1 3 4 16 2 Paper 18 19 13 9 22 23 13 1 Glass 8 19 8 2 66 4 2 0 Plastic 6 20 10 7 50 10 3 0 Tin 4 17 26 22 26 9 0 0
Sweet Unpacked 18 64 9 0 0 0 27 - Paper 70 37 5 5 28 5 21 - Glass 10 25 13 13 13 13 25 - Plastic 2 100 0 0 0 0 0 -
Powder Unpacked 33 38 16 5 4 13 23 0 Paper 27 4 17 7 50 20 2 1 Glass 23 6 14 23 23 13 20 1 Plastic 11 10 13 8 40 15 15 0 Tin 6 33 13 8 25 17 4 0
ProductUnpacked 12 0 22 22 0 22 33 -Glass 35 0 16 27 8 16 32 -Plastic 53 2 12 35 8 15 28 -
* Ideal means ideal for active and modern people.
Maravalalu Chandre Gowda, Mei-huey Wu, and Mubarik Ali

136
Development Impact of Chili Cultivation
Input Demand
Chili cultivation increased the demand for almost all inputs compared with other field crops. For example, on average, 177 and 227 more labor days/ha were employed on chili compared to rice and maize, respectively (Table 52). This implied that, on average, one full yearjobwascreatedwhenonehectareofcerealwasconvertedintochilicultivation.Withonemillionhadevotedforchiliinthecountry,thisimpliedthatchilicultivationgeneratesonemillionadditionaljobsinIndiawhenconversionismade.Thisdoesnotincludetheadditionallaborneededforchiliprocessing,packaging,andotheractivities.
Table 52. Relative per ha input use and cost of chili and its competing crops in the sample areas, India, 2002
Crop Labor (days)
Seed (INR)
Fertilizer (kg) Manure (t) Irrigation
(number)Pesticides
spray (number)
Chili 294a 2,444a 402a 7.12a 11a 18a
Rice 117b 774b 252b 4.33b 12a 3b
Chili farmer 120 819* 272* 4.34 13 3 Non-chili farmer 112 705 221 4.32 11 3Maize 67c 710b 224b 1.18c 1b 2c
Chili farmer 62* 778* 230 0.98 1* 2*
Non-chili farmer 77 546 210 1.64 4 3Note: The different superscript in a column for overall row of a crop implies that the mean value of that crop is different than the
other crops. The * in chili farmer row implies that the figure is significantly different than the corresponding figure for non-chili farmer at 10% significance level.
Similarly,theamountofinorganicfertilizerandmanureappliedwasalsohigheronchilicompared with rice and maize. Using a conservative estimate, transferring one million ha from rice to chili cultivation will generate more than 150,000 t of additional demand forfertilizerinIndia.
Application of farm manure on chili was also much higher when compared withcereals. This generates additional demand for on-farm livestock to get manure supply. Theadditionalincomefromchilicultivationcanalsoprovidethenecessaryresourcestoestablishlivestockonthefarm,whichthenfurthergeneratesincomeandemployment.
Themorenumberofspraysonchilicomparedtoriceandmaizeemphasizedtheneedfor developing pest-resistant chili varieties. The average number of irrigations in chili cultivationasasolecropwasfoundtobelittlelessthanthatofricebutmorethanthatofmaize,althoughthenumberofirrigationsinchiliplantedwithricewassimilarbutfarmorethaninchiliplantedwithmaize.Chilimaynotrequirealotofwater,asirrigationonchiliisrelativelythinlydistributed,however,additionofnumberofirrigationforchilimeansmorelaborrequirementforitsapplicationwhencomparedwiththeirrigationonmaize.
India

137
The input use on rice by chili farmers was comparable or higher with non-chili farmers. However, for maize, chili farmers invested significantly higher amount on seed and less on manure and irrigation than their counterpart non-chili farmer.
Resource Use Efficiency
On average, chili production was more profitable than production of other field crops, suchasriceandmaize.However,toattainhigherreturnsfromchili,threetosixtimesmore costs were incurred (Table 53). The benefit-cost ratio was also significantly higher in chili production than in other field crops. This implied that shifting resources from field crops to chili production will improve the rate of return on the employed resources. However, the variability in return in chili cultivation was also higher (not reported in thetable)implyingthatchiliwasamoreriskycrop.Chiliproductionalsoimprovedtheresourceproductivityofindividualinput,suchaslaborandfertilizer.
Table 53. Resource use efficiency in chili and competing crops in the sample areas, by farmer type, India, 2002
Crop Yield (t/ha)
Total cost
(INR/ha)
Gross return (INR/ha)
Net return
(INR/ha) B-C
ratio (%)Labor
productivity (INR/day)
Fertilizerproductivity
(INR/kg)Chili 12,290a 49,957a 83,054a 33,097a 70a 300a 256a
Rice 3,539b 16,422b 18,235b 1,813b 11b 145b 73b
Chili farmer 3,818* 16,864 18,928* 2,064* 12* 147 76*
Non-chili farmer 3,113 16,273 17,651 1,378 8 143 67Maize 2,299c 11,210c 11,119c -90c -1c 128b 38c
Chili farmer 2,290 10,906 11,190 274* 3* 139* 39 Non-chili farmer 2,318 12,831 10,948 -1,883 -15 102 36Note: The different superscript in a column for overall row of a crop implies that the mean value of that crop is different than the other crops. The * in chili farmer row implies that the figure is significantly different than the corresponding figure for non-chili farmer at 10% significance level.
Chilicultivation,especiallytheimprovedtype,wasnotonlymoreeconomicaltogrow,italsoimprovedtheeconomicandmanagerialcapabilitiesoffarmerssuchthattheywereable to apply more inputs and/or use better management practices in field crops. This was reflected in either higher yield or better returns from field crops on the chili farms compared to non-chili farms. For example, benefit-cost ratio in rice was significantly higheronchili farmsbecause theygethigheryield, althoughproductioncostswerethe same. Similarly, net returns and fertilizer productivities were significantly higher onchilifarms.Therefore,spreadinchiliproductionwillhaveapositiveimpactontheproductivity of other field crops. Similarly, labor productivity in maize on chili farms was higher than on non-chili farms.
Maravalalu Chandre Gowda, Mei-huey Wu, and Mubarik Ali

138
Impact on Gender
Alargeproportionof labor inchilicultivation,especially inharvesting,wasfemale.Overall, female labor contributed about 60% in chili cultivation compared to less than 30% in rice (Table 54). The contribution was relatively small in local chili type. This implied thatchiliisafemalegendercrop.Moreover,improvedchilitypeshelpedincreasingthecontributionoffemalelabor.
Table 54. Gender distribution of labor in the sample areas, by operation and chili type, India, 2002
Chili typePercentage distribution1
Land preparation Management Harvesting Post-harvesting OverallFemale Male Female Male Female Male Female Male Female Male
Hybrid 64.0 36.0 45.5 54.5 90.4 9.6 71.3 28.7 61.8 38.2Open pollinated 59.4 40.6 44.2 55.8 87.9 12.1 74.7 25.3 62.1 37.9Local 52.6 47.4 49.1 50.9 84.7 15.3 59.1 40.9 58.9 41.1Overall 57.0 43.0 47.1 52.9 87.4 12.6 64.7 35.3 60.4 39.6Rice - - - - - - - - 28.2 71.8
1The distribution between male and female under each operation adds up to 100. The proportion for rice was available only for overall labor use, not for individual activities.
Impact on Consumption
Vegetablecultivationimprovedoverallfamilyincome,inducingfoodconsumptionandoverallexpenditures.However,incomeandfoodconsumptionofchilifarmerswasstillway below than that of urban consumers (Table 55). Therefore, chili farmers need new incomesourcestobringthematparwiththeurbanconsumers.Introductionofimprovedproductiontechnologiestofarmersmaybeaneffectivemeanstoachievethisgoal.
Table 55. Monthly household income and expenditures by consumer type in the sample areas, India, 2002
Consumer type
Expenditures (INR) Average monthly income (INR)Food Overall
Chili farmer 1,902b 2,771b 5,517b
Non-chili farmer 1,759c 2,567c 3,256c
Urban consumer 2,840a 5,130a 11,340a
Overall 1,931 3,050 6,010Note: The different superscript in a column implies that the figures are significantly different across consumer types.
India
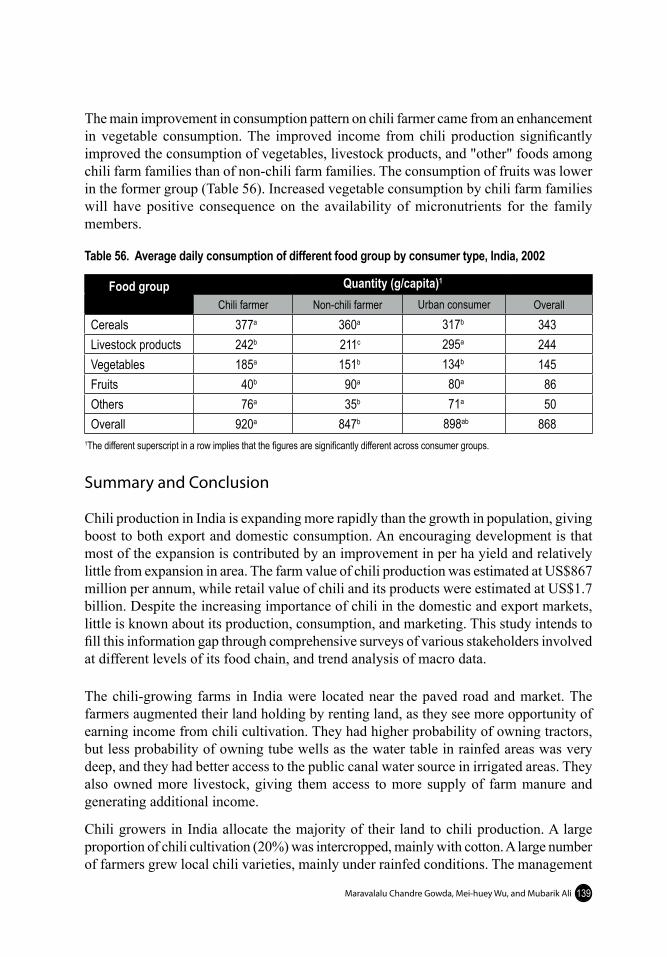
139
Themainimprovementinconsumptionpatternonchilifarmercamefromanenhancementin vegetable consumption. The improved income from chili production significantly improved the consumption of vegetables, livestock products, and "other" foods among chili farm families than of non-chili farm families. The consumption of fruits was lower in the former group (Table 56). Increased vegetable consumption by chili farm families will have positive consequence on the availability of micronutrients for the familymembers.
Table 56. Average daily consumption of different food group by consumer type, India, 2002
Food group Quantity (g/capita)1
Chili farmer Non-chili farmer Urban consumer OverallCereals 377a 360a 317b 343Livestock products 242b 211c 295a 244Vegetables 185a 151b 134b 145Fruits 40b 90a 80a 86Others 76a 35b 71a 50Overall 920a 847b 898ab 868
1The different superscript in a row implies that the figures are significantly different across consumer groups.
Summary and Conclusion
ChiliproductioninIndiaisexpandingmorerapidlythanthegrowthinpopulation,givingboosttobothexportanddomesticconsumption.Anencouragingdevelopmentisthatmostoftheexpansioniscontributedbyanimprovementinperhayieldandrelativelylittle from expansion in area. The farm value of chili production was estimated at US$867 million per annum, while retail value of chili and its products were estimated at US$1.7 billion.Despitetheincreasingimportanceofchiliinthedomesticandexportmarkets,littleisknownaboutitsproduction,consumption,andmarketing.Thisstudyintendstofill this information gap through comprehensive surveys of various stakeholders involved atdifferentlevelsofitsfoodchain,andtrendanalysisofmacrodata.
The chili-growing farms in India were located near the paved road and market. The farmersaugmentedtheirlandholdingbyrentingland,astheyseemoreopportunityofearningincomefromchilicultivation.Theyhadhigherprobabilityofowningtractors,butlessprobabilityofowningtubewellsasthewatertableinrainfedareaswasverydeep,andtheyhadbetteraccesstothepubliccanalwatersourceinirrigatedareas.Theyalsoownedmore livestock,giving themaccess tomore supplyof farmmanureandgeneratingadditionalincome.
Chiligrowers inIndiaallocate themajorityof their landtochiliproduction.Alargeproportion of chili cultivation (20%) was intercropped, mainly with cotton. A large number offarmersgrewlocalchilivarieties,mainlyunderrainfedconditions.Themanagement
Maravalalu Chandre Gowda, Mei-huey Wu, and Mubarik Ali

140
practicesinchilicultivationwereold,andneedtoberevitalized.Forexample,agreatmajorityofchili seedlingswerepreparedwithoutanyprotectionagainst insectsanddiseases; very few treat seeds and fields against infection; majority of chili fields had flat fields without any shading, tunnel, or staking; few farmers did mulching; and fertilizer is mainly broadcasted. Despite high losses due to insects and diseases about one-fourth offarmersdidnotapplypesticideoranyothercontrolmeasures,andfewharvestingswerepracticed.
Low-technology input in chili cultivation in India resulted to high losses in yield due to insect and disease infestation. Despite this, farmers gave low priority to the insect- and disease-resistant varieties in making variety selection. Clearly, farmers were dissatisfied with the yield potential of existing varieties, and gave top priority to the high-yielding varieties while making variety selection.They give second priority to the ability ofvarietytofetchhighprices.Theimportantconclusionisthatdespitehighyieldlosses,farmers will not accept any disease- or insect-resistant material for its own sake unless it isassociatedwithhigheryield,andabilitytofetchhighpricesbyhavingattractivechilicolor,pungency,andothercharacteristics.
Introductionofhybridchiliandopenpollinatedimprovedvarietieschangedthesituationtosomeextent.Sincehybridseedwasexpensive,farmersresortedtoF2progenyseedsselected from their own crop or from the neighboring farmers’ fields. The F1-growing farmerstriedtomaximizethereturnonseedinvestmentbyadoptingimprovedmanagementpractices. For example, less hybrid fields were intercropped, more seeds were treated with dust, more fields received soil treatment with higher quantities of chemical application and straw mulching, and higher proportion of fields were constructed with irrigation ridges andtreatedwithpesticides.Theinputquantitiesforfertilizer,insecticideandfungicide,andthenumberofirrigationwerehigherforthehybridandimprovedpollinatedvarieties.Thesepesticidesprayswereinjudiciousanddetrimentaltotheenvironment.Laborusefor land preparation, crop management, and harvesting and post-harvesting operations alsoincreasedsuggestingthatfarmersreallytookgoodcareofthesevarieties.Thishaddramaticallyreducedtheyieldlossesduetoinsectandpestinfestationinhybridtype,butthelosseswerestillsubstantialinopenpollinatedandlocalchilitypes.
Open pollinated varieties were economically more viable than hybrids. It incurred lower cost, and per unit output cost was not statistically significant across the two varieties. On the other hand, resources engaged in open pollinated varieties had higher economic efficiency than those in hybrid. Open pollinated modern varieties were distributed by the public sector institutes and covered a significant proportion of chili area. This attested to thesuccessofthepublicsectorinstitutesindistributingthesevarietiestochilifarmers.Howevermoreneedstobedonetoreachouttoalargesegmentofpoorfarmerswhoarestillgrowingtraditionalvarieties,anddonothaveresourcestobuytheexpensivehybridseedoraccesstopublicsectorseedsupply.Improvingaccesstotheseinstituteswillhelppoorfarmersgetoutofpovertyandultimatelyenhancethecompetitivenessofthechilisector.
India

141
Despite some improvements due to the introduction of hybrid and open pollinatedchili varieties by the private sector, chili production in India still has a lot of roomfor improvements. Even in improved varieties, more fields need to be protected from insectattackanddiseaseinfestation,andmanagementpracticescanstillbeimproved;specifically, seedling management and irrigation methods have to be improved, crop protectionpracticeshavetobemodernized,inputusehastobeoptimized,andharvestingand post-harvesting systems have to be upgraded. Above all, the access of farmers to improvedhybridandopenpollinatedvarietieshastobeimproved.Withoutthese,morecompetitiveplayerslikeChinamaythreatenIndiaintheinternationalchilimarket.Withthe opening of markets under WTO, even local markets may be threatened with cheaper chilisupplyfromtheinternationalmarket.
Chili is mainly consumed in powder form in India. About one-half of the total consumption (after converting all consumption in fresh) is in powder form. Except for sweet chili, the demand elasticity is low (even lower than the elasticity for cereal) implying that it isanintegralpartoftheconsumers’diet.Chilicolorinpowderchiliandpungencyingreenandredfreshchiliwerefoundtobeimportantcriteriaofconsumersinmakingchilipurchasedecisions.Therefore,improvingtheseattributesindifferentchilitypescanhelp farmers get higher prices and enhance their profitability. Producers and marketing agentscanalsotailorthepackagingofvariouschiliproductsaccordingtoconsumerspreferencesenumeratedinthisstudy.
Chili cultivation can have important impact on rural development. Chili productiongenerates a significant demand for inputs, especially fertilizer, pesticide, seed, and irrigation water, which encourages agricultural business activities in rural areas.Moreover, shift of farm resources from traditional crops, such as cereals, to chilisignificantly improves their efficiency. Chili cultivation has positive spillover effects on the production efficiency of other crops. It is considered to be a gender friendly crop. Farmers also benefit from chili production through improved income and diet. Despite these benefits, however, expansion of chili cultivation has limitations because of its low demandelasticity.Thestrategiestoimprovechiliproductqualitybytailoringtheproducetothedemandattributesandexpansionofitsinternationalmarketwillhelptoexpandthechilisectorandsimultaneouslyincreasefarmers’income.
Maravalalu Chandre Gowda, Mei-huey Wu, and Mubarik Ali

142
References
Farooqi, A.A., K.N. Srinivasappa, and B.S. Sreeramu. 2003. Tropical spice crops. Indian Institute of Plantation Management. Bangalore.
Hingole, D.G. and B.P. Kurundkar. 2004. Field investigation and economics of fungicidal control of powdery mildew of chillies. Journal of Soil Crop 14(1):131-136.
Korikanthimath, V.S., R. Govardhan, G.M. Hiremath, and K.V. Peter. 2000. Resource productivities and their optimum utilization pattern in chilli-based mixed cropping system – an economic analysis. Indian Journal of Horticulture 57(1): 83-86.
Koshy, J. 2000. Promotional activities of spices board on paprika. Indian Journal of Spices and Medicinal Plants 2(1):47-49.
Manjunatha, M., S.G. Hanchinal, and S.V. Kulkarni. 2001. Effect of intercropping on incidenceofmiteandthripsinchilli.KarnatakaJournalofAgriculturalSciences14(2): 493-95.
Ministry of Agriculture. 2003. Indian Agriculture 2003. Ministry of Agriculture, GovernmentofIndia.
Pura, N.J., S. Nagalakshmi, N. Balasubramanyam, S. Dhanaraj, and N.B. Shankaracharya. 2001. Packaging and storage studies on commercial varieties of Indian chillies. J. Food Sci. & Technology 38(3):227-250.
Singh, V.B. and K. Singh. 1996. Spices. Indian Institute of Plantation Management, Bangalore.
Subramanian, S.R., S. Varadarajan, and M. Asokan. 2000. India. In: Ali, M. (ed.). Dynamicsofvegetableproduction,distributionandconsumptioninAsia.AVRDCPublication No. 00-498. Asian Vegetable Research and Development Center, Shanhua, Taiwan. p. 99-138.
Sivanarayana,G.andT.BhupalReddy.2002.SourcesofinformationutilizedbycottonandchillifarmersofWarangaldistrict.JournalofResearch,Andhra Pradesh Agriculture University, Hyderabad, India.
India

Common name Percentage distributionInsecticide Fungicide
Monocrotophos 11.71 1.95Acephate (Asataf) 9.97 0.57Chlorpyrifos (Coroban/Sitara) 8.84 0.57Cypermethrin (Magister) 7.93 -Fipronil (Regent) 7.78 0.23Dicofol (Kelthane) 6.57 0.23Spinosad (Tracer) 5.59 0.11Phosalone (Zolone) 4.98 0.34Dimethoate (Rogor) 4.98 0.11Endosulfan 3.85 -Imidacloprid (Confidor) 3.70 0.23Quinalphos 3.25 0.11Indoxacarb (Avaunt) 2.87 0.11Triazophos (Hostothion) 2.64 0.11Lamda Cyhalothrin (Karate) 2.11 -Methomyl (Larvin/ Thiodicarb/Lannate) 1.82 0.34Sulphur (Sulfex) 1.66 7.90Mancozeb (Dithane M-45) 1.21 18.67Unnamed 1.06 1.49Ethion (Phosmid) 0.98 -Methyl parathion (Metacid) 0.76 -Deltamethrin + Triazophos (Spark) 0.76 -Malathion 0.60 -Carbendazim (Bavistin) 0.60 16.95Phosphamidon (Demecron) 0.45 -Acetapride (Pride) 0.45 -Novulorun (Remon)(Insect growth regulator) 0.38 -Copper Oxychloride (Blitox/Fytolan) 0.38 13.41Bacillus Thuringiensis (B.t) 0.38 -Hexaconazole (Contaf) 0.30 6.41Phorate (Thimet) 0.23 0.46Oxydemeton-Methyl (Metasystox) 0.23 -Carbofuran (Furadon) 0.23 -Decamethrin (Diceys) 0.15 -Azadirachtin (Neem oil) 0.15 -Carbaryl (Sevin) 0.08 -Ziram (Cuman L) 0.08 1.15Triadimefon (Bayleton) 0.08 3.89Penconazole (Topas) 0.08 2.18Mexacarbate (Zetran) 0.08 0.11
143
Appendix 1. Frequency of use of different pesticide on chili in the sample areas, India, 2002
Maravalalu Chandre Gowda, Mei-huey Wu, and Mubarik Ali

144
Dinocap (Kerathane) 0.08 0.57Streptocmcine (Spectramycin) - 3.78Metalaxyl + Mancozeb (Ridomil) - 3.09Captan (Captaf) - 3.09Chlorothalonil (Kavach) - 2.75Benomyl (Benlate) - 2.63Zineb (Dithane Z-78) - 2.41Carbendazim + Iprodione (Quinta) - 1.95Carbendazim + Mancozeb (Saaf) - 1.37Propiconazole (Tilt) - 0.34Fosetyl-Al (Aliette) - 0.23Bitertanol (Baycor) - 0.11
Note: The names in brackets are brand or local names.
Cont..., Appendix 1
India


IndonesiaUsman Mustafa, Mubarik Ali, and Ir. Heny Kuswanti
Introduction
ChiliisanimportantandessentialcomponentofthedailyIndonesiandiet.Itismainlyconsumed in fresh semi crushed form, locally known as "Sambals" (RIV 1996). It is also an important commercial crop grown year-round mainly by small farmers both in high and lowlands under rainfed as well as irrigated conditions. In 2003, it was cultivated on a total area of 176 thousand ha producing about 1.1 million t of fresh weight with an average yield of 6.1 t/ha. The importance of chili in the Indonesian diet and cropping systems in certainareasdemandssystematiceffortsinunderstandingtheproduction,consumption,andmarketingaspectsofthewholesector.Lackofinformationatthenationallevelwillhamperappropriateplanningofthesector,andkeepitfarbelowitspotential.Thisstudywas designed to fill the information gaps, and to provide an analytical look of various issuesatdifferentfoodchainlevelsinIndonesia.Thedatausedinthisanalysiswerecollectedfromsecondarysourcesaswellasthroughsurveysfromvariousstakeholdersalongthechilifoodchain.
Indonesiaislocatedatthecrossroadsoftheancientworld,spanningthetraderoutesbetweentheMiddleEastandAsia.Thecountryisthelargestarchipelagointheworldwith 33 provinces and approximately 13,000 islands. It is not surprising that traders, immigrants, and even pirates were enticed by the riches of these "Spice Islands". During the 1st to 7thcenturiesAD,IndiantradersnotonlyintroducedtheSankrit,BuddhismandHinduism,theyalsobroughtwiththemcucumber,eggplant,andcowpeasandassimilatedcurries into the native cuisine. Europeans, including the Dutch, Portuguese, Spanish, and British, in their search for spices, began arriving in the early 16thcenturyandintroducedtemperate vegetables like tomato, chili, pepper, squash and pumpkin. (Recipes4us 2003; Freeman2005).
TheterritoryoftheRepublicofIndonesiastretchesfromlatitudes6oN to 11oSandfromlongitudes 95oW to 141oE. Indonesia consists of five big islands: Java, Sumatra, Sulawesi, Kalimantan,andIrianJaya.ChiliisgrownmainlyinEastJava,CentralJava,WestJavaand North Sumatra. More than 23% of chili production was harvested from West Java followed by 19% and 12% from East and Central Java, respectively (Table 1).

Usman Mustafa, Mubarik Ali, and Ir. Heny Kuswanti
Table 1. Chili area and production by province, Indonesia, 2003
Province Harvested area Production in fresh weight Yield in fresh weight
(ha) (%) (t) (%) (t/ha)East Java 40,553 23.0 197,989 18.6 4.9Central Java 26,900 15.3 127,149 11.9 4.7West Java 20,304 11.5 247,300 23.2 12.2North Sumarta 17,345 9.8 132,943 12.5 7.7West Sumarta 8,260 4.7 49,073 4.6 5.9Aceh 10,304 5.8 42,836 4.0 4.2Bengkulu 8,782 5.0 32,639 3.1 3.7South sulawesi 7,031 4.0 31,929 3.0 4.5Other 36,785 20.9 204,864 19.2 5.6Total 176,264 100.0 1,066,722 100.0 6.1
Source: Directorate General of Food Crops and Horticulture (2004).
Primary data on various aspects related to production, consumption, marketing, and processingofchiliandproductionaspectsofcompetingcropwerecollectedfromthreemajor chili-producing provinces of the country, namely West Java, Central Java and East Java (Table 2). In each province, three to four districts or sub-districts were chosen in consultation with the provincial Department of Agricultural Extension (DAE). These districts or sub-districts include Wanasari, Peservani, and Cikajaing from West Java; Brebes, Tanjung and Kersana from Central Java province; and Pelem, Singnalan, Kepuh, and Nagnanpal from East Java. One or two major chili-growing villages were selected from each district/sub-district, again in consultation with DAE. Depending upon the availability of farmers, 10 to 25 chili and two to five non-chili farmers and their wives were randomly selected from each village. The survey team visited 14 villages. The survey was conducted during the months of September and October 2002 and the production datacoveredthecropharvestedinthesameyear.
Table 2. Frequency distribution of the sample respondents by region and province, Indonesia, 2002
Type of respondent West Java Central Java East Java TotalChili farmers 86 84 86 256Non-chili farmers 17 16 17 50Chili farmer housewives (HW) 75 84 84 243Non-chili farmer housewives 16 13 17 46City housewives (Jakarta) 62Market agents (Jakarta, Pedagang Pengumpul Desa, Karamat Jati) 16Chili processors (Jakarta, Tanjung, Cirebon) 6
Primary Data Collection
147

148
A total of 256 chili-growing farmers and 50 non-chili growing farmers were interviewed on management practices, input use, outputs and input-output prices, and marketing channelsofchili,andonemajorcompetingcropofchiligrownduringthesurveyyear.Sixteen market agents from Jakarta, Pedagang Pengumpul Desa, Karamat Jati and six chiliprocessorsfromJakarta,Tanjung,andCirebonwerealsointerviewedtounderstandthechilimarketsystemsandprocessing.Intheproductionsurvey,thehouseholdmemberresponsible for cooking for the family (for convenience they will be called housewives, regardlessoftheirsex)werealsointerviewedonconsumptionpatterns.Twohundredforty-three and 46 chili- and non-chili farmer-housewives and 62 urban housewives (mainly from Jakarta) were also interviewed to inquire about consumption of chili and otherfooditemsandpreferredchilitraits.
Macro Trends
Domestic Production
Chili production in Indonesia fluctuated from 581 to 1,102 thousand t, while area under chili varied from 143 to 183 thousand ha in 1991-2003 (Table 3). Chili production reached the record level of 1,067 thousand t in 2003 because of the increase in both area and yield. Sustaining such sudden jump in production may, however, be difficult. Thefarmvaluesofchiliproductionweremorevariablethanproduction,suggestingbiggerfluctuation in farm prices. The maximum value reached US$929.4 million in 1999, more than double the value in the previous year. Similar fluctuations happened in the past such as in 1995 to 1996. These fluctuations are indications of unstable chili markets and lack ofinformationbyfarmersaboutitspotentialdemand.
Table 3. Area, production, and yield of chili in Indonesia, 1991-2003
Year Area (ha) Fresh production (000 t) Yield (kg/ha) Farm value (million US$)1
1991 168,061 984.2 5,856 482.4 1992 162,519 970.3 5,971 315.2 1993 157,499 946.2 6,007 374.71994 177,600 1,042.0 5,867 445.31995 182,263 1,102.3 6,048 469.11996 169,764 1,043.8 6,149 876.71997 161,602 801.8 4,962 820.21998 164,944 848.5 5,144 415.21999 183,347 1,007.7 5,496 929.42000 174,708 727.7 4,165 568.62001 142,556 580.5 4,072 428.12002 150,598 635.1 4,217 593.62003 176,264 1,066.7 6,052 676.3
Source: FAOSTAT database and official files of Agricultural Statistics Office, Jakarta.1It was estimated using the FAOSTAT-Agriculture (producers’ price) data. The prices in local currency were converted using the exchange rate reported in www.fftc.agnet.org (various issues).
Indonesia

149
International Trade
The total trade (import plus export) of Indonesia gradually increased from 5.9 thousand t (fresh weight chili) worth US$1.2 million in 1991 to a record of 32.5 thousand t worth over US$5.1 million in 2002, then experienced a decline in 2003 (Table 4). Throughout these years, however, the country generally remained in deficit in chili trade, as quantity andvalueofimportswerehigherthanthecorrespondingvaluesofexport.Thetradedeficit reached its maximum in 2002 when the country had a net import of over 26,000 t of fresh weight costing US$3.3 million. The import of chili has risen from just 5 thousand to over 29 thousand t, while export increased from 0.8 thousand t to 3.3 thousand t in 1991-2002. Both import and export declined in 2003, although export value was higher thanimport.
Indonesiaismainlyanimporterofpimentochilitobeusedforchiliproducts,suchassauce and paste. Its share in the total imports (in terms of fresh weight and value) was over 87%. Indonesia also exports pimento chili, but its share in the total export ranged from around 54% to 98% in quantity and 36% to 96% in value from 1991-2003.
Indonesia exported high value chili and imported low-priced ones (Figure 1). The difference reached the highest level in 1996 when export prices reached its peak and then declined to its lowest level in 2001. Although there was declining trend in export prices since 1996, it remained higher than the import prices. Indonesia should try to bring its export prices significantly lower than its import prices to become competitive in the internationalmarket.Toachievethis,thecountryneedstoimproveproductivityinchiliproduction and efficiency in its marketing system.
Table 4. International trade in chili from Indonesia, 1991-2003
YearImport Export Total trade Net trade balance
Quantity (t)
Value (1000$)
Quantity (t)
Value (1000$)
Quantity (t)
Value (1000$)
Quantity (t)
Value (1000$)
1991 5,188 936 753 264 5,941 1,200 -4,435 -6721992 4,181 841 1,412 412 5,593 1,253 -2,769 -4291993 11,430 2,309 1,438 368 12,868 2,677 -9,992 -1,9411994 19,598 3,633 1,878 696 21,476 4,329 -17,720 -2,9371995 6,382 1,519 2,862 1,742 9,244 3,261 -3,520 2231996 7,826 1,914 2,834 3,037 10,660 4,951 -4,992 1,1231997 16,695 3,374 1,607 1,631 18,302 5,005 -15,088 -1,7431998 11,902 1,887 1,033 618 12,935 2,505 -10,869 -1,2691999 13,290 2,620 2,506 1,392 15,796 4,012 -10,784 -1,2282000 22,959 2,972 2,511 1,101 25,470 4,073 -20,448 -1,8712001 26,241 3,970 4,190 1,000 30,431 4,970 -22,051 -2,9702002 29,289 4,187 3,257 915 32,546 5,102 -26,032 -3,2722003 26,418 3,031 2,890 924 29,308 3,955 -23,528 -2,107
Source: FAO-Agricultural data (Agriculture and Food Trade-Crop and Livestock Primary and Processed). The source reports the trade quantity of fresh chili and pimento as separate groups. The later was converted into fresh weight by multiplying it with a factor of four. The value of trade includes both for fresh and powder chili.
Usman Mustafa, Mubarik Ali, and Ir. Heny Kuswanti

0.0
0.5
1.0
1.5
1991 1992 1993 1994 1995 1996 1997 1998 1999 2000 2001 2002 2003
Year
Price
(US$
/kg)
Export
Import
150
Source: Estimated from import and export quantity and value figures in Table 4.
Figure 1. Trend in import and export prices of chili in Indonesia, 1991-2003
Climatic Situation
The climate of the study area is tropical with annual average rainfall ranges of 1480-1790 mm. Most of the rains come in November-March, while July-September is almost dry.ThedryspellislongerandmoresevereinSurabayaofEasternJavathaninCentralandWesternJava.CentralJavaalsoexperiencesrelativelyhigherrainsduringtherainyseason compared to the other two sample regions (Figure 2a). In this study, November to April will be considered as wet season, and May-October as dry season for all sites.
0
100
200
300
400
500
Jan Feb Mar Apr May Jun Jul Aug Sep Oct Nov Dec
Rain
fall(
mm
)
Surabaya (Eastern Java) Semarang (Central Java) Bandung (Western Java)
Indonesia
Figure 2a. Mean rainfall in the study areas in Indonesia
Source: Downloaded from “http://www.weatherbase.com/weather/city.php3?c=ID&refer=” and then type city name

17
21
25
29
33
Jan Feb Mar Apr May Jun Jul Aug Sep Oct Nov Dec
Tem
pera
ture
(ºC)
Surabaya (Eastern Java) Semarang (Central Java) Bandung (Western Java)
151
Source: Downloaded from “http://www.weatherbase.com/weather/city.php3?c=ID&refer=” and then type city name
Figure 2b. Mean temperature in the study areas in Indonesia
The temperature in Central and Eastern Java ranges between 27-29oC,whileinWesternJava it is much cooler, ranging between 20-23oC throughout the year (Figure 2b). The low temperature in Western Java is due to the high elevation of Bandung city (where temperaturesarerecorded)inWesternJava.Therefore,uplandchiliproductionfacessignificantly low temperature compared to the production in lowland areas. Technology developmentforvariousecoregionshould takesuchdifferences inclimaticsituationintoconsideration.
Farmers Characterization
Socioeconomic Characteristics
Whilechilifarmersweretypicallyyoungerandhadlessfarmingexperiencethantheircounterpart non-chili farmers, they still averaged ten years experience of growing chili crop (Table 5). Interestingly, they have bigger family size, but no significant difference intheeducationlevelofthehouseholdheadsofthetwogroupswasobserved.Theyhadsimilar earnings from non-agricultural income as they spent almost the same time in agriculture as that of non-chili farmers. They also borrowed similar agricultural loans compared to non-chili farmers, as many of the non-chili farmers were vegetable or cash crop (such as cotton) farmers.
Usman Mustafa, Mubarik Ali, and Ir. Heny Kuswanti

152
Table 5. Household characteristics of chili and non-chili farmers in the sample areas, Indonesia, 2002
Characteristics Chili farmer Non-chili farmerAge of the farmer (years) 40b 45a
Agricultural experience (years) 15.1b 19.1a
Chili production experience (years) 10.3 -Family size (no.) 4.54a 3.24b
Education (schooling years) 7.3a 8.8a
Farm size (ha) 0.56b 0.72a
Owned 0.36b 0.50a
Rented 0.20a 0.22a
Number of fragments (no.) 1.53a 1.35b
Off-farm income (000 IDR/year*) 2,717a 3,171a
Time spend in agriculture (%) 90.0a 89.1a
Cultivated area (ha) 0.49b 0.71a
Land use intensity (%) 94b 97a
Cropping intensity (%) 282a 177b Chili area (ha) 0.38 -Distance from paved road (km) 0.8a 0.7a
Distance from nearest vegetable market (km) 2.9a 3.2a
Agricultural loan (000 IDR/year) 1,568a 1751a
Farm equipments (average number) Small farm equipment 1.11a 1.37a
Water pump 0.2a 0.2a
Sprayer 1.3a 1.5a
Livestock (average number)Hen and duck 6.8a 6.7a
Cow 0 1.63Animal (SAU**) 0.1b 2.0a
* One US$ = 9,012 IDR** The standard animal units (SAU) was estimated as: SAU = 0.93 buffalo + 1.08 cow + 0.4 young stock.Note: Different superscripts in a row imply that the values are different between chili and non-chili farmers at least at 10% significance level.
The farms of the chili farmers were smaller and more fragmented than that of the non-chili farmers. However, they allocated two-thirds of their farm area to chili. The typical field size allocated for chili production was 0.38 ha. No significant difference in the ownershipoffarmmachinerywasobserved.Thecroppingintensityonchilifarmswashigher compared to non-chili farms, but land use intensity was almost similar. This was mainly because most chili farmers cultivated more crops at a time than the non-chili farmersimplyingthattheywereusingshorterdurationcrops.
Indonesia

153
The farms of the chili farmers were smaller and more fragmented than that of the non-chili farmers. However, they allocated two-thirds of their farm area to chili. The typical field size allocated for chili production was 0.38 ha. No significant difference in the ownershipoffarmmachinerywasobserved.Thecroppingintensityonchilifarmswas
House and Household Belongings
On average, three of every ten farmers keep one motorbike in their house, which was the main source of transportation between farms to their houses (Table 6). All non-chili farmer-respondents owned houses, while one percent of chili farmers were renting. A higher percentage of chili farmers had brick and cemented houses as compared to non-chili-farmers. Both groups had similar house covered area, although chili farmers had slightlylargertotalareaofthehouse.Thehouseholdbelongingsacrossthetwogroupsweresimilar.
Note: Different superscripts in a row imply that the values are different between chili and non-chili farmers at least at 10% significance level.
Land Form, Drainage and Soil Texture
The soil texture reported by chili and non-chili farmers was almost similar (Table 7). On eachfarmtype,thedominantsoilswerelight.Inthesurveyarea,themajorityofsoilsonchili and non-chili farms were well-drained, and the distribution with respect to drainage of land was not significantly different across the two groups. The majority of both chili and non-chili farmers were on flat land either on the riverbed or away from the riverbed side,andonlyasmallpercentagewereonslopewithandwithoutterraces.
Table 6. Household living conditions and home appliances of respondents in the sample areas, by farmer type, Indonesia, 2002
Characteristic Chili farmer Non - chili farmerHouse construction (%)
Mud, local stone 11b 37a
Bricked, cemented 89a 63b
Source of drinking water (% of farmers) Government water supply 8a 8a
Private pump 37a 28b
Open well/artesian well/others 55a 64a
House covered area (m2) 100a 87a
Total area of house (m2) 192a 165b
Household belonging (% of farmers) Motor Bike Car/pickup/jeep Television 85a 94a
Radio and cassette player 100a 100a
Refrigerator 9a 2a
Stove 98a 88a
30a
540a
-
Usman Mustafa, Mubarik Ali, and Ir. Heny Kuswanti

154
Table 7. Land form, drainage, and soil texture of farms in the sample areas, by farmer type. Indonesia, 2002
Character Chili farmer Non-chili farmerSoil texture (%)
Heavy 26 30 Medium 29 29 Light 45 41Drainage (%)
Well drained 45 38 Medium drained 34 35 Poorly drained 21 27Land form (%)
Slope with terrace 17 12 Slope without terrace 12 12 Plain on the river bed 36 28 Plain away from the river bank 35 48
Varieties and Cropping Pattern
Chili Varieties
Inthesamplearea,threequartersofthechiliparcelswereplantedwithhybridvarieties,however, 34% of these were planted with the second year progeny of hybrid seed (F2)(Table 8). The local and open pollinated (improved) varieties were grown only on 17% and 6% parcels, respectively, while only 3% parcels were found growing sweet pepper (hybrid). Similar distribution was observed based on area under different varieties. The hybridchiliwasmainlyconcentratedinCentralandWestJava.ThemajorityoftheopenpollinatedandlocalchiliesweregrownintheNorthernshoreofCentralJava.SweetchilieswerefoundonlyinWestJava.
Among the hybrid chili-growing farmers the most popular variety reported was "TM999". The other common hybrid varieties were "Prabu", "Gada", and "Super". The most common local variety cultivated was "Segitiga" followed by "Helm" and "Titrandu". A substantial percentage of parcels (15%) were planted with unidentified "Local" varieties. In case of open pollinated, "Titsuper" was indicated as the most common variety followed by "Cakra", "Select Tam", and "Bendot". "Spartacus" (green-red) and "Gold Flame" (green-yellow)weretheonlytwosweetpepperhybridvarietiesreportedbythefarmers.
Indonesia

155
Table 8. Distribution of chili varieties grown in the sample areas, by region, Indonesia, 2002
Type Name of varietyPercentage of parcels
West Java Central Java East Java Overall (%)
Hybrid + 38 52 10 75TM999: Hung Nong/annum 80 20 - 43Prabu: East West/annum - 100 - 22Gada:East West/annum - 100 - 12Lado: East West/annum - 100 - 4Taro:East West/annum - 100 - 3CTH: Chis Tai/annum (wrinkle type) 100 - - 2Super - - 100 8Others 50 21 29 6
Open pollinated (improved) 11 67 22 5Titsuper: East West/annum - - 100 52Cakra: Cakra Hijau - 100 - 21Select Tam 67 33 - 21Bendot: annum 100 - - 7
Local 20 79 1 17Segitiga - 100 - 69Helm - 100 - 10Titrandu - 100 - 5Local (unidentified) 41 - 59 16
Sweet (hybrid) 100 - - 3Spartacus: de Ruiter/green-red 100 - - 75Gold Flame: de Ruiter/green-yellow 100 - - 25
+ = Thirty four percent hybrid chili growing farmer used his or her own produced seed.
Note: The percentages for different varieties within one chili type add up to 100. The percentage of the four chili types adds up to 100. The regional distribution of each variety adds up to 100. Total number of parcels was 387.
Intercropping
In Indonesia, the majority of chili parcels (58.4%) in the sample area were intercropped mostlywithonecrop.Ahigherpercentageofhybridchiliparcelsweregrownasasinglecrop compared to local chili, while all the open pollinated and sweet chili fields were singlecropped.Thehybridchiliwasintercroppedwithshallot,tomato,andcabbage,while local type chili was mainly intercropped with red shallot (Table 9). Adiyoga et al. (undated) also found a large proportion of chili fields intercropped with similar types of vegetables. The extent of intercropping in their study varied from 38% to 97% in variousregions.
Usman Mustafa, Mubarik Ali, and Ir. Heny Kuswanti

156
Table 9. Intercropping (percentage of parcels) in the sample areas, by chili type, Indonesia, 2002
Intercrop Hybrid Open pollinated Local Sweet Overall
Chili alone 28.3 3.5 6.7 3.1 41.6Chili with one other crop 29.1 - 24.1 - 53.2Tomato 10.6 - 1.6 - 12.2Maize 0.8 - - - 0.8Red shallot (onion) 11.0 - 21.3 - 32.3Coriander 1.6 - - - 1.6Cabbage 2.8 - - - 2.8Other 2.3 - 1.2 - 3.5
Chili with two other crops 4.8 - - - 4.8Tomato and onion 1.6 - - - 1.6Tomato and other 2.4 - - - 2.4Others 0.8 - - - 0.8
Chili with three other crops 0.4 - - - 0.4Tomato, onion, and cabbage 0.4 - - - 0.4
Note: Total number of parcels was 387.
Crop Rotation
About two-fifths of the chili-growing farmers in the sample area practiced chili-fallow-chilirotation,andthemajorityofthemcultivatedasinglecropinoneyearleavingtheland fallow during one crop season (Table 10). However, some planted two chili crops in a year. The rest of the chili fields come with different crops in the rotation. Tomato andshallotwerethemostcommoncropscultivatedinrotationwithchili.
Table 10. Chili-based crop rotation in the sample areas, by chili type, Indonesia, 2002
Chili farmer Crop rotation Percentage of parcels
Hybrid Shallot (RC*with chili) – Tomato – Shallot (RC* with chili) 3Tomato – Chili – Tomato 16Cabbage – Chili – Cabbage 5Corn – Chili – Corn 3Shallot – Chili – Shallot 7Chili – Fallow – Chili 46Other (RC* with chili) – Fallow – Other (RC* with chili) 9Chili – Other – Chili 11
Indonesia
Open pollinated Shallot (RC* with chili) – Fallow – Shallot (RC* with chili) 51Onion – Onion (RC* with chili) – Onion 12Maize – Chili – Maize 12Paddy – Chili – Paddy 25

157
Local Shallot (RC* with chili) – Paddy – Shallot (RC* with chili) 9Brassica – Chili – Brassica 11Cabbage – Chili – Cabbage 13Corn – Chili – Corn 14Paddy – Chili – Paddy 34Other crop– Chili – Other crop 9Chili – Fallow – Chili 10
Sweet (hybrid) Chili – Fallow – Chili 100Overall Shallot – Chili – Shallot 6
Chili – Fallow – Chili 40Other (RC* with chili) – Fallow – Other (RC* with chili) 15Tomato – Chili – Tomato 12Shallot (RC* with chili) – Other crop – Shallot (RC* with chili) 7Chili – Other crop – Chili 20
Cont...,Table 10
Note: Total number of parcels was 387.* RC = Relay crop.
Cropping Pattern
About three-fourths of the area under all crops on chili-growing farms in the sample area went to vegetable cultivation including chili, while 28% of the area went to chili cultiva-tion (Table 11). Percentage of the area under vegetables, including chili, was higher on chili farm than on non-chili farm. However, the latter group had higher proportion of areaunderothervegetables.Thepercentageoftheareaundercereals,beansandpulses,and commercial crops was higher among the non-chili farmers.
Table 11. Cropping pattern in the sample areas, by farmer type, Indonesia, 2002
Crop group
Chili farmer Non-chili farmerArea (ha) Share (%) Area (ha) Share (%)
Chili 0.38 28 - -Other vegetables 0.61 44 0.69 55Cereals 0.17 12 0.33 26Beans and pulses 0.03 2 0.05 4Commercial 0.11 8 0.18 14Others 0.08 6 0.01 1Total cropped area 1.38 100 1.26 100
Note: Cereals = paddy and corn; Beans and pulses = red bean, soybean, and peas; Other vegetables = shallot, tomato, cabbage, leaf onion, brassica, cauliflower, onion, egg plant, carrot, etc.; Commercial = potato, and groundnut; Others mainly are fruits such as papaya, banana, orange, mango, alpucat, jumbo, etc.
Usman Mustafa, Mubarik Ali, and Ir. Heny Kuswanti

158
Cultivation Time
Allsamplechilifarmerssowchiliinnurseryseedbeds,andlatertransplanttheseedlingsin the fields. Sample farmers reported variation in the sowing and harvesting time depending upon the mode of irrigation and type of chili. Chili is grown throughoutthe year in Indonesia (Table 12). The improved varieties of hot chili (hybrid and open pollinated)matureinshorterduration,especiallybecausetheyhaveshorterharvestingspancomparedtolocalchili.Inaddition,thesevarietieshadchangedthecroppingseasonof chili, which might enable the farmers to bring their outputs during the off-season and earnhigherprices.
Table 12. Cultivation and harvesting time (week and month) by season and chili type, Indonesia, 2002
Chili farmerWet season Dry season
Planting time Start of harvesting
End of harvesting Planting time Start of
harvestingEnd of
harvestingHybrid 1st Mar 1st May 3rd Jun 4th Jun 2nd Aug 3rd OctOpen pollinated - - - 1st Jul 3rd Aug 4th OctLocal 3rd Jan 3rd Mar 2nd Jul 2nd Sep 4th Nov 4th FebSweet 2nd Feb 2nd May 2nd Aug 3rd Oct 3rd Dec 4th FebOverall 4th Feb 1st May 3rd Jun 2nd Jul 1st Sep 2nd Nov
Information Source
Seed
The majority of farmers obtained seed-related information from neighboring farmers or friendsfollowedbyvillageretailers,extensionworkersandgovernmentseedcenters(Table 13). The farmers growing sweet pepper got seed-related information from village cooperativeandgovernmentcenters.Therewaslittleconnectionbetweenfarmersandextensionagentstosupplyindependentinformationaboutseedquality.
Table 13. Source of information on seed and variety satisfaction of respondents in the sample areas by chili type, Indonesia, 2002
Chili farmerSource of information about seed (%)1 Satisfaction (%)
Extension worker
Village retailer
Neighboring farmer
Gov. seed
centerOthers High
yieldGood price Purity All
Hybrid 2 14 57 8 7+ 2 8 19 38Open pollinated - - 22 11 - - - - 44Local 13 24 33 - - 1 3 3 12Sweet - - - 38 62** - - - 100Overall 5 11 48 5 4 2 5 15 32
1The row sum of information source is not equal to 100 because some farmers do not use any information source.+ Mixed source; ** Village co-operative
Indonesia

159
Overall, only a third of farmers were contented with their chili seed with respect to price, yield, and purity, while another 22% were satisfied with only one or another criterion. The remaining, about one-half of the farmers, were looking for better varieties. Users of local varieties were the least satisfied, while the growers of sweet pepper hybrids were completelycontented.Thisanalysissuggeststhatvarietieswithhigheryieldpotentialand better quality to fetch higher prices have high demand in chili-growing areas of Indonesia.
Market
Efficient marketing depends upon the access to accurate, appropriate, and timely informationorintelligence.Therewasnoformalsourceofmarketinformationforchiliinthe study area. Farmers obtained information mainly through private sources (Table 14). The major sources were traders and neighbor farmers ranked as the first and second mostimportantinformationsource,respectively.Forthefarmersusinglocalvarieties,neighboringfarmerswerethemostimportantsource.
Table 14. Market information sources and their rank by type of farmers in the sample areas, Indonesia, 2002
Chili farmer
Sources of market Information (%) RankTrader Neighbor
farmerFarmer asso-ciation
Govt. depart-ment
Radio Other Trader Neighbor farmer
Farmer asso-ciation
Govt.depart-ment
Radio News-paper
Hybrid 28 27 17 7 7 14 1 2 3 4 5 -
Open pollinated 45 35 15 10 10 0 1 2 4 3 - -
Local 18 30 19 17 14 2 2 1 3 4 5 -
Sweet 29 33 19 9 0 11 1 2 3 4 - 5
Overall 32 30 14 6 4 14 1 2 3 4 5 -
Factors in Chili Variety Selection
Themostimportantfactorconsideredbyfarmersintheselectionofredchiliandsweetpeppervarietieswasthepricesoftheharvestedfruit,whileingreenchilidiseaseresistancewasthemaincriterion.Marketpriceingreen,yieldinred,andcolorinsweetpepperwere the second most important criteria. Other less important factors in the selection of chili varieties are reported in Table 15.
Usman Mustafa, Mubarik Ali, and Ir. Heny Kuswanti

160
Table 15. Relative ranking of factors considered in the selection of chili seed by farmers in the sample areas, by chili type, Indonesia, 2002
Factors Green Red SweetMarket price 2 1 1Yield 4 2 4Disease 1 - 5Insect free 3 - -Appearance - - 3Chili color - 4 2Flesh thickness - 5 -Pungency 5 3 -
Note: 1 = highest rank, and 5 = lowest rank.
Insects and Pests Problem
Insects
All the surveyed farmers reported insect as a problem in their fields. Overall, aphid, mites, and thrips were main insects reported by 26%, 23%, and 20% chili farmers, respectively (Table 16). Interestingly, the insects causing major problems varied across chili type. In hybrid cultivation, thehighest ranking insectswere thrips andmite,whilemealybugandaphidweremajorinsectsinlocal.Cultivationofsweetpepperundershades,houses/tunnels did not reduce the insect attack and all farmers reported the presence of allmajorinsects,similarinotherchilitypes,exceptmealybugs.
Table 16. Major insects reported in chili fields in the sample areas, by chili type, Indonesia, 2002
Chili type
Farmers reporting insects as problem (%) Rank1 Occurrence
(years out of 5)Average losses
(%)A M T C MB Other 1 2 3 4 1993-97 1998-2002 1993-97 1998-2002
Hybrid 21 29 22 23 3 2 T M A C 3.9 3.8 13 27
Open pollinated 36 11 16 5 31 1 T A M C 4.4 4.0 9 34
Local 38 12 5 8 33 4 MB A M T 3.8 4.7 8 17
Sweet 8 33 25 33 0 1 C M T A 3.8 4.2 19 24
Overall 26 23 20 18 11 2 T M A C 4.0 4.0 11 25
Note: A=Aphids (Aphis gossypii and Myzus persicae); C=Caterpillar (Helicoverpa armigera and Spodoptera litura); M=Mites (Polyphagotarsonemus latus); MB= Mealy bug (Planococcus sp. and/or Pseudococcus sp) or White fly (Aleurodicus dispersus); T=Thrips (Scirtothrips dorsalis).
1The rank of 1 is the most devastating, and 4 the least devastating insect.
Indonesia

161
On average, severe attack of insects occurred four out of every five years, and this frequencywassimilaracrosschilivarietiesanddidnotchangeovertime.Theyearlyyield loss due to insect was highest at 34% in open pollinated varieties from 1998-2002, followedbythelossesinhybridandsweetchilitypes.Theestimatesofaverageyieldlosses due to insect attack increased from 11% in 1993-97 to 25% in 1998-2002. The majorincreasehappenedinhybridandopenpollinatedvarieties.
Diseases
Almost all farmers reported the infestation of diseases on chili fields. Overall, viruses, anthracnose, and Phytophthora blight were the major diseases reported by 37%, 27%, and 21% farmers, respectively (Table 17). Viruses were problems in all chili types; anthracnose infested a large number of hybrid fields, while Pytophthora blight heavily infestedopenpollinatedandlocalchilitypes.
Overall, viruses were ranked to be the most devastating disease, and anthracnose got the second highest rank followed by Phytophthora blight and bacterial wilt. Viruses got the highestrankbyallchilitypesexcepthybridswhereanthracnosewasgiventhehighestrank. Open pollinated and local chili-growing farmers ranked Phytophthora blight as thesecondimportantdisease,whilehybridchiliandsweetpepperfarmersgavesecondranktovirusesandanthracnose,respectively.Thethirdandfourthrankingdiseasesfordifferent varieties can be seen in Table 17.
Table 17. Major chili diseases in the sample areas, by chili type, Indonesia, 2002
Chili typeFarmers reporting diseases
(%) Rank1 Occurrence (years)
Average losses (%)
VR AN PH BW BS OT 1 2 3 4 1993-97 1998-2002 1993-97 1998-2002
Hybrid 29 36 14 11 3 7 AN VR PH BW 4 3.4 21 20
Open pollinated 48 5 42 5 0 0 VR PH BW AN 4.1 3.4 35 50
Local 50 9 38 2 1 0 VR PH AN BW 3.6 3.8 41 49
Sweet 54 21 12 0 13 0 VR AN BS PH 5 4 25 -
Overall 37 27 21 8 3 4 VR AN PH BW 4 3.6 29 38
Note: VR=Viruses; AN=Anthracnose (Colletotrichum acutatum, C. capsici and C. gloeosporioides); PH=Phytophthora blight (Phytophthora capsici); BW=Bacterial wilt (Ralstonia solanacearum); BS=Bacterial spot (Xanthomonas campestris pv. Vesicatoria); OT=Other.
1The rank of 1 is the most devastating, and 4 the least devastating disease.
The average annual losses due to diseases of 29% reported by chili farmers in 993-1997 had increased to 38% in 1998-2002. The losses had increased in open pollinated from 35% in 1993-1997 to 50% in 1998-2002; it stayed at about 21% in hybrid, and increased from 41% to 49% in local chili during these years.
Usman Mustafa, Mubarik Ali, and Ir. Heny Kuswanti

162
Weeds
All the sample farmers reported weeds in chili fields. A large proportion of farmers could not identify the weed present in their fields. The most commonly identified weed was Cyperussp. reported by 31% farmers; its infestation was lowest in open pollinated and highest in hybrid chili (Table 18). This was followed by Portulaca oleraceaereportedby 24% of farmers. Its infestation was highest in local and lowest in hybrids. Weed infestationwasaregularphenomenon,occurringalmosteveryyear.Dependinguponthe variety, 14-18% losses were estimated due to weed infestation. The yield losses due toweedsincreasedovertime.
Table 18. Major chili weeds in the sample areas, by chili type, Indonesia, 2002
Chili typeFarmers reporting weeds
(%) Rank1Occurrence
(years during every 5 yrs)
Average losses (%)
TK PO AC CD UG OT 1 2 3 4 1993-97 1998-2002 1993-97 1998-2002
Hybrid 36 13 10 7 18 16 TK UG PO AC 5 5 10 15
Open pollinated 17 39 - - 39 6 PO UG TK - 5 5 11 14
Local 21 44 1 - 26 7 PO TK UG - 5 5 13 18
Sweet - - - - - - - - - - - - - -
Overall 31 24 7 4 22 13 TK PO UG AC 5 5 11 15Note: TK = Cyperus sp.; PO = Portulaca oleraceae; AC = Ageratum conyzoides; CD = Cynodon dactylon;
UG = Unidentified grasses; OT = Other.1The rank of 1 is the most devastating, and 4 the least devastating disease.
Farm Management Practices
Preparation of Nursery Seedling
Most chili fields were transplanted. However, some farmers sow seed directly in the field especiallywhenitwasplantedasrelaycropwithshallotoronion.Thechilitransplantbed size was about 1-1.2 m long and 0.3 m wide covered with straw-mulch. In general theygrowtheseedlingnurserynearorwithinthevicinityoftheirhouseforprotectionand better irrigation access. The seedlings were transplanted when they are about five to eight weeks old, with height of about 10 cm and with 2-4 leaves.
Seed Treatment
Seedsoakingbeforesowingwasnotcommon;onlythreepercentoffarmers,mainlyinlocal and open pollinated chili types, practiced seed soaking for an average of 1.2 hours. More common was dusting of seed with chemicals practiced by 44% farmers. All farmers ofsweetpepperandthemajorityofopenpollinatedandlocalchilireportedtreatingtheseedwithfungicidebeforesowingitinthenurserybed.Themainpurposeofthistreatment
Indonesia

163
was to control ‘dampling off’ (Pythium). Only one third of the hybrid-growing farmers treatedseedwithchemicalsexpectingthatitwasalreadytreatedbytheseedcompany(Table 19). The main chemicals used for seed treatment were Carbosulfan (insecticide) and Dithane (a fungicide). Similar frequency of farmers giving seed treatment was found by Adiyoga et al. (undated). Table 19. Seed treatment by farmers in the sample areas, by chili type, Indonesia, 2002
Chili farmer Farmer soaked the seed (%)
Duration of seed soaking (hrs)
Farmer applied chemicals to
seed (%)
Chemicals applied
(kg or l/ha)Hybrid 2 1.1 33 0.01Open pollinated 10 1 67 0.36Local 8 1.5 74 0.35Sweet 0 0 100 0.33Overall 3 1.2 44 0.16
Nursery and Field Soil Treatment
Asmallpercentageoffarmers,onlyinhybridandlocalchilitypes,appliedsoiltreatmenton chili nursery and main field to control the soil-borne diseases. In local chili, broadcast wasthemainmethodofsoiltreatment,whilebroadcast,placementandsprayallwereused for soil treatment in hybrid fields. Average per ha quantity of chemicals used in the field was 48 kg/l. The chemical used in nursery field was 2.4 kg-l/ha in case of hybrid and 17.5 kg-l/ha in case of local chili (Table 20). The main chemicals used for field soil treatment was Furadan (a fungicide) and for nursery Furadan and Sulfur (used to fumigate thesoiltocontrolinsectsanddiseases).
Table 20. Nursery and field soil treatment in the sample areas by chili type, Indonesia, 2002
Chili typeMethod of soil treatment (%) Stage of treatment (%) Quantity applied/ha
(kg/lit)Broadcast Placement Spray Nursery Field Nursery Field
Hybrid 11 5 7 14 9 2 48Open pollinated 0 0 0 0 0 0 0Local 7 1 5 5 8 18 51Sweet 0 0 0 0 0 0 0Overall 9 4 6 11 8 4 48
Land Preparation
The main means of land preparation was manual labor. Only 14% used power tiller or tractor. Adiyoga et al. (undated) found only three percent of the chili fields plowed by tractor. Farmers mostly applied single plowing including planking/leveling and seedbed preparation. Harrowing was done three to five times (four on average) during
Usman Mustafa, Mubarik Ali, and Ir. Heny Kuswanti

164
theseasontocontrolweeds.Assweetpepperwascultivatedunderhydroponicssystem,land was prepared and leveled only once without any plowing (Table 21).1
Table 21. Land preparation method in the sample areas, by chili type, Indonesia, 2002
Chili type
Percentage of parcels Number of operationPlowing Harrowing
Plowing HarrowingHand Animal Power tiller1 Total Hand Animal Power
tiller1 Total
Hybrid 78 9 13 100 96 1 3 100 1 4.7Open pollinated 88 0 12 100 98 0 2 100 1 3.1Local 80 0 20 100 98 0 2 100 1 3.6Sweet2 - - - - - - - - - -Overall 79 7 14 100 96 1 3 100 1 4.4
1 Including tractor.2 All sweet chilies in the sample were cultivated under hydroponics system.
Bed Types
A large majority of farmers grow chili on raised beds and only five percent used furrows; all sweet pepper fields were flat because they were in the hydroponics system. On average, furrows or raised beds were of 34 cm height and 118 cm wide (Table 22). The crop was planted in double rows with 59 cm average distance between rows and 43 cm average distance between plants within a row. The plant-to-plant distance was equal and highest in thecaseofhybridandsweetchilitypes,butlowestandequalinlocalandopenpollinatedtypes. The sweet pepper farmers reported the largest row-to-row distance, while other varietieshadalmostsimilardistance.
Table 22. Bed types, height, width, plant-to-plant and row-to-row distance of chili in the sample areas, by chili type, Indonesia, 2002
Chili farmerBed type (%) Furrow or raised bed (cm)
Furrow Raised Flat Height Width Plant-to-plant distance
Row-to-row distance
Hybrid 7 92 1 34 103 51 57Open pollinated 11 89 0 43 133 27 53Local 3 97 0 35 128 27 57Sweet 0 0 100** 0 0 51 119Overall 5 91 4 34 118 43 59
** Hydroponics system.1Hydroponics system is probably the most intensive method of crop production. It adopts advanced technology, is highly productive, skilled, and is often capital-intensive. Since regulating the aerial and root environment is a major concern in such agricultural system, production takes place inside enclosures that give control of air and root temperature, light, water, plant nutrition, and protect against adverse climatic conditions (Jensen, 1991). Plants are grown in nutrient solutions (water and fertilizers) via drip irrigation in a plastic green house type structure with the not reusable artificial medium (such as burned rice peal).
Indonesia

165
Mulching, Staking, and Shading
Use of plastic sheet as mulching material was very common among sweet and hybrid chili farmers, but less common for growers of local varieties. All sweet pepper fields were covered with plastic sheets in the hydroponics system while 64% hybrid fields were covered with plastic sheets as mulching material (Table 23). Twenty five percent of the openpollinatedchiliandonlyfourpercentlocalchilifarmersreportedtheuseofplasticsheetformulchingpurposes.Strawasmulchingmaterialwasalsocommonlyusedintheproductionofopenpollinatedandlocalchilitypes.
Themajorityofthesamplefarmersusedsilverblackplasticsheetsasmulchingmaterial.The life of plastic sheet ranged from 15 to 36 months with an average of 24 months or twosucceedingcroppings.
Table 23. Mulching material type and life span, in the sample areas, by chili type, Indonesia, 2002
Chili farmerType of material
(% of farmer)Type of foil (% of farmer) Life of
sheeting (month)
Staking (% of
farmer)Plastic Straw Reflective Silver black
Black Other
Hybrid 64 17 13 55 2 30 31 87Open pollinated 25 66 50 - - 50 36 25Local 4 32 50 50 - - 15 13Overall 42 22 14 50 2 32 24 61Sweet 100 - - 100 - - 24 100*
* String.
In the overall hot chili sample, 61% of farmers used staking to support the chili plant. This practice was more common in hybrids and sweet pepper than in other chili types. Only sweetpepperfarmersusedplasticshadehousesmadeofbambootobuildthehydroponicssystemandusedstringwhileotherchilifarmersusedbambooasstakingmaterial.
Fertilizer Application
All the sample farmers applied inorganic fertilizer to their fields, and a great majority of them also used organic fertilizer (Table 24). However, none of the sweet pepper fields received manure because of their special production system. Poultry manure followed by mixed/compost and cattle manures were the main types used.
Generally, three applications of inorganic fertilizer split equally over the 3rd, 6th and9th weeks after transplantation were applied to chili fields, regardless of variety. Some farmers also applied TSP (Triple Super Phosphate) with manure as basal application. A large proportion of the farmers also applied Zinc (Zn).
Usman Mustafa, Mubarik Ali, and Ir. Heny Kuswanti

166
A great majority of chili fields were applied with fertilizer through placement method, andonlyasmallproportionthroughbroadcastormixingfertilizerwithirrigation.Thesweetpepperfarmersappliedliquidfertilizerbymixingitwithirrigationwaterinthehydroponicssystem.
Table 24. Organic fertilizer type and method of inorganic fertilizer application (% of parcels) in the sample areas, by chili type, Indonesia, 2002
Chili farmerOrganic fertilizer type Method of inorganic fertilizer application Inorganic
application (no.)Cattle Poultry Mixed Total Broadcast Placement Irrigation
Hybrid 9 45 33 87 10 67 23 3.1OPa - 33 22 55 11 89 - 3.4Local 33 33 8 74 27 73 - 3.5Overall 9 42 25 76 15 69 16 3.3Sweet - - - - - - 100* *
a OP - Open pollinated.* Hydroponics system.
Irrigation
Majority of the chili fields received irrigation, and only 21% were rainfed (Tale 25). The major irrigation source was canal covering more than one-half of the chili fields. Tube wells/pumps and tanks (ponds, reservoir, lake) covered only a small area. In case of sweetpepper,waterwasstoredinwatertanksandlaterpumpedthroughpipes.Irrigationsourceswerealmostsimilaracrossallotherchilitypesexceptthatnotankandmixedsources were used in open pollinated fields.
Floodingwasthemainmethodofirrigation.Inlocalandopenpollinatedchilitypes,itwasmainlydoneinridges,whileinhybriditwasappliedwithandwithoutridges.
Table 25. Method and sources of irrigation in the sample areas, by chili type, Indonesia, 2002
Chili typeIrrigation method (% of parcel) Irrigation source (% of parcel)
Flooding Manual Sprinkle+ trickle
Rainfed Canal Tube well
Tank/lake
Mixed RainWithout ridge With ridge
Hybrid 35 30 12 2 21 55 9 7 8 21Open pollinated 21 44 13 - 22 67 11 0 0 22Local 35 43 3 - 19 61 16 4 0 19Overall 34 33 10 2 21 57 10 6 6 21Sweet - - - 100 - 0 0 0 100** -
** Implies a method where water is stored in a tank and later pumped through pipe for irrigation purposes.
Indonesia
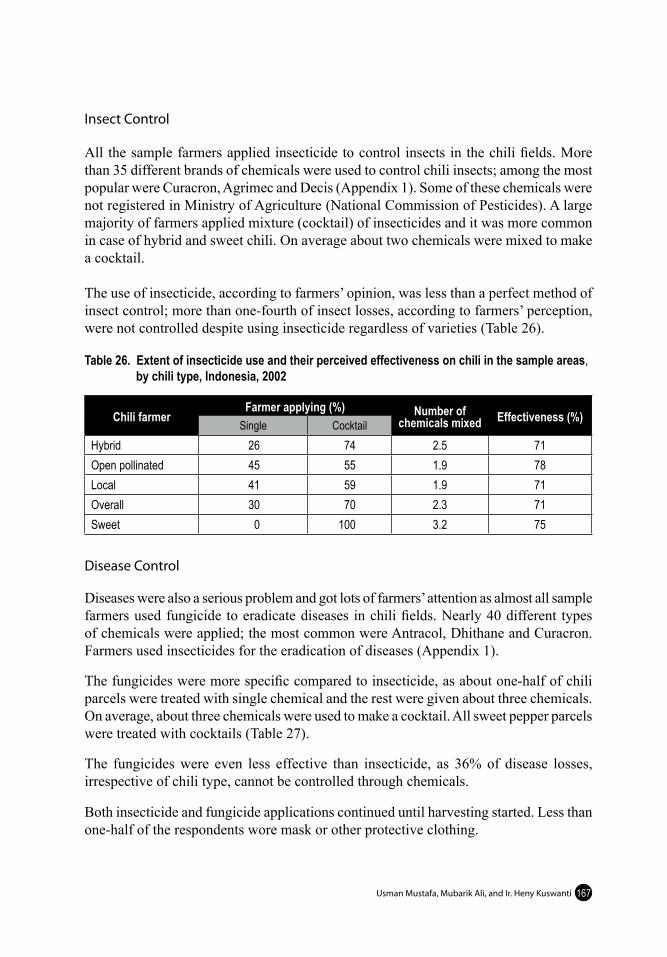
167
Insect Control
All the sample farmers applied insecticide to control insects in the chili fields. More than 35 different brands of chemicals were used to control chili insects; among the most popular were Curacron, Agrimec and Decis (Appendix 1). Some of these chemicals were not registered in Ministry of Agriculture (National Commission of Pesticides). A large majority of farmers applied mixture (cocktail) of insecticides and it was more common in case of hybrid and sweet chili. On average about two chemicals were mixed to make acocktail.
Theuseofinsecticide,accordingtofarmers’opinion,waslessthanaperfectmethodofinsect control; more than one-fourth of insect losses, according to farmers’ perception, were not controlled despite using insecticide regardless of varieties (Table 26).
Table 26. Extent of insecticide use and their perceived effectiveness on chili in the sample areas, by chili type, Indonesia, 2002
Chili farmerFarmer applying (%) Number of
chemicals mixed Effectiveness (%)Single Cocktail
Hybrid 26 74 2.5 71Open pollinated 45 55 1.9 78Local 41 59 1.9 71Overall 30 70 2.3 71Sweet 0 100 3.2 75
Disease Control
Diseaseswerealsoaseriousproblemandgotlotsoffarmers’attentionasalmostallsamplefarmers used fungicide to eradicate diseases in chili fields. Nearly 40 different types ofchemicalswereapplied;themostcommonwereAntracol,DhithaneandCuracron.Farmers used insecticides for the eradication of diseases (Appendix 1).
The fungicides were more specific compared to insecticide, as about one-half of chili parcelsweretreatedwithsinglechemicalandtherestweregivenaboutthreechemicals.On average, about three chemicals were used to make a cocktail. All sweet pepper parcels were treated with cocktails (Table 27).
The fungicides were even less effective than insecticide, as 36% of disease losses, irrespectiveofchilitype,cannotbecontrolledthroughchemicals.
Bothinsecticideandfungicideapplicationscontinueduntilharvestingstarted.Lessthanone-half of the respondents wore mask or other protective clothing.
Usman Mustafa, Mubarik Ali, and Ir. Heny Kuswanti

168
Table 27. Extent of fungicide and their perceived effectiveness on chili in the sample areas, by chili type, Indonesia, 2002
Chili farmerFarmer applying1 (%) Number of chemical
mixedEffectiveness (%)
Single Cocktail Total Hybrid 45 50 95 3.0 63Open pollinated 55 33 88 2.5 70Local 59 32 91 2.5 63Overall 50 44 94 2.8 64Sweet - 100 100 3.2 66
1The sum of the two columns is not equal to 100 because some farmers were not applying chemical for disease control.
Weed Control
Allchilifarmers,exceptthosewhogrewsweetpepper,practicedweeding.Almostallfarmers applied manual weeding regardless of variety (Table 28). In addition, three percent of farmers applied herbicide while 21% used both manual as well as herbicide for weed eradication. No cocktail (mix of herbicide) was reported. Gramoxon, and Roundup were themostcommonproductsusedtocontrolweeds.
On average, farmers had four manual weeding operations and applied three chemical sprays to control weeds. However, some farmers applied as many as 12 weedings because of recurrence of weeds. The sample farmer of hot chili revealed that weeding was 76% effective,onaverage,withslightvariationacrossvarieties.
Table 28. Weeding, number, type and their perceived effectiveness in the sample areas by chili type, Indonesia, 2002
Chili typePercentage of farmer Farmers
using weeding(%)
Weeding number Effectiveness (%)Manual Chemical Manual+
chemical Manual Chemical
Hybrid 77 4 19 100 4.3 4.3 76
Open pollinated 67 - 33 100 2.0 2.2 81
Local 74 - 26 100 3.4 3.0 75
Overall 76 3 21 100 4.2 3.2 76
Sweet - - - - - - -
Other Methods of Pest Control
Inthesampleareas,abouttenpercentoffarmersreportedthatsanitation,mulching,croprotation,intercropping,earlysowing,morepicking,andweedinghelpedincontrollingpests in chili field. However, the quantitative effectiveness of these methods was not indicated.
Indonesia

169
Adiyoga et al. (undated) found manual methods of controlling insects, such as removing the insect eggs, killing the insect, and removing the infected leaf/branch or even the whole plant,quitepopularintheirstudyarea.Accordingtotherespondentsintheirstudy,themechanical method of pest and disease control sufficiently helped when conducted at the righttime.However,themethodbecameineffectivewhentheattackintensityincreases.Fieldobservation,primarilytonotetheattackincidenceandtoestimatetheintensityofattackwasregularlyconductedbymostrespondents.Nevertheless,thisactivityapparentlytendedtobefollowedbythedecisiontospray.
Harvesting
On average, farmers reported nine harvestings for hot chili. The highest number of harvestwasforsweetpepperandlowestforopenpollinatedchili.Majorityoffarmers,regardless of chili type, combined family and hired labor in harvesting the crop. Only 11% of fields in hot-chili were harvested using only family labor, and ten percent using only hired labor (Table 29).
Table 29. Number of harvests and type of labor used (%) in chili harvesting in the sample areas, by chili type, Indonesia, 2002
Chili type Number of harvest
Type of labor used (% of farmers)Family labor Hired labor Both
Hybrid 10 12 13 75Open pollinated 7 25 - 75Local 8 8 4 88Overall 9 11 10 79Sweet 35 22 - 78
Marketing
Channels
Farmer sold chili output mainly to local trader/commission agents (72%), wholesale market at district level (17%), local market at sub-district level (7%) and farmer’s associations (4%) (Figure 4). In case of sweet pepper, farmers sold all the products to theirassociation,whichwasdirectlylinkedwithamultinationalcompany.
From the local trader, 74% of the chilies were directly sold to the wholesalers at the provincelevelandtheresttothewholesalersatthedistrictlevel.Whilethefarmer’sassociation sold to wholesalers at the district level, wholesalers at sub-district level, wholesalersbasedatJakarta,localtraderanddirectlytoconsumers.Thelocalmarketat sub-district level sold 60% to retailer, 24% to wholesaler at district level and the remaining 16% to processors.
Usman Mustafa, Mubarik Ali, and Ir. Heny Kuswanti
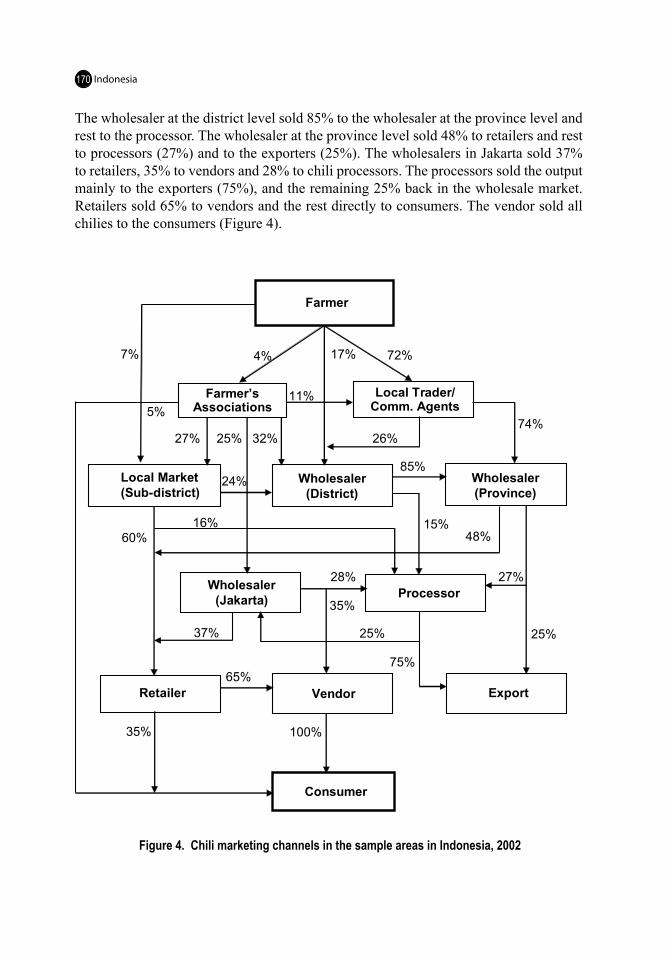
170
The wholesaler at the district level sold 85% to the wholesaler at the province level and rest to the processor. The wholesaler at the province level sold 48% to retailers and rest to processors (27%) and to the exporters (25%). The wholesalers in Jakarta sold 37% to retailers, 35% to vendors and 28% to chili processors. The processors sold the output mainly to the exporters (75%), and the remaining 25% back in the wholesale market. Retailers sold 65% to vendors and the rest directly to consumers. The vendor sold all chilies to the consumers (Figure 4).
Figure 4. Chili marketing channels in the sample areas in Indonesia, 2002
Farmer
Farmer’sAssociations
Local Trader/Comm. Agents
Local Market(Sub-district)
Wholesaler(District)
Processor
Wholesaler(Province)
Wholesaler(Jakarta)
Retailer Vendor Export
Consumer
72%17%4%
11%
26%32%25%27%
5%
7%
24%
16%60%
28%
35%
15%
25%
75%65%
37%
27%
85%
25%
48%
100%35%
74%
Indonesia

171
Constraints
Alargemajorityoffarmerswerenothappywiththeprevailingchilimarketingsysteminthe country, and only 15% were satisfied with the existing market structure (Table 30). Uncertain market prices were the major marketing constraint expressed by a large number ofthefarmers,whilelackofpriceinformationanditsunreliabilityanduntimeliness,eveniftherewasany,werethesecondmajormarketingconstraints.However,lowchilipricewasnotaconcernforalargemajorityofchilifarmers.
About one-half of the sample farmers were not satisfied with the middlemen/commission agent’srole.Theycomplainedabouttheirexploitationsintheformoflowweighting,lowerprice,littlepremiumforquality,andlackofgradingsystem.
Table 30. Farmer’s perception about constraints on chili marketing in the sample areas, Indonesia, 2002
Market constraints Percentage of farmersPrice uncertainty 30Lack of price information 19No market problem 15Exploitative role of middlemen 12Low price 6Weak bargaining power of farmer 3No farmer organization 2Others 13
Input Use
Seed Rate and Treatment
Eighty percent local and 56% open pollinated chili parcels were planted using home-produced seed, while all sweet pepper seeds were purchased (Table 31). Thirty four percent of hybrid-chili farmers used own-farm produced seed or they took it from neighboring farmers. Farmers applied higher seed rate for home-produced compared to purchased seeds,mainlybecausetheformerhadbettergerminationrateandpurchasedseedwasusuallytakenbettercaredofbeforepacking.
Higherseedratewasusedtoplantlocalandopenpollinatedcomparedtohybridchiliandsweetpepper.Specialcarewastakenforsweetpeppernurserybyapplyingmoretreatments to it. The higher seed rate for local and open pollinated types helped to refill the dead or weak seedling in the field.
Usman Mustafa, Mubarik Ali, and Ir. Heny Kuswanti

172
Direct seeding was not practiced; seeds were first sown in the nursery and then transplanted in the field. Similarly, there was no practice of purchasing or selling of seedling. In a fewcases,farmerssharedseedlingwithneighboringfarmers.
Table 31. Seed rate (kg/ha) in the sample areas, by source and chili type, Indonesia, 2002
Chili typeSeed rate (kg/ha) Farmers using (%)
Self produced Purchased Average Own-farm produced seed* Purchased seedHybrid 0.91 0.26 0.48 34 66Open pollinated 2.55 1.05 1.89 56 44Local 1.48 4.95 2.17 80 20Overall 1.29 0.86 1.07 49 51Sweet 0 0.23 0.23 0 100
* Also include seed taken from neighbor farmer.
Fertilizer Use
On average, 8.7 t/ha organic fertilizer (manure) was applied to chili crop (Table 32). None of sweet pepper fields received manure. The highest amount of manure was applied in hybrid fields. Overall, about 279 kg/ha of all nutrients (from inorganic source including zinc)wasusedonhotchili.Theamountofnitrogenwasslightlyhigherthaneachdosesofphosphorus,potash,orzinc.
Table 32. Fertilizer use in the sample areas, by chili type, Indonesia, 2002
Chili typeOrganic fertilizer (t/ha) Total fertilizer nutrient (kg/ha)
Cattle manure
Poultry manure Mixed Total N P K Zn
Hybrid 0.93 4.84 3.53 9.3 93 93 91 62 Open pollinated 0.00 2.76 1.84 4.6 67 40 52 19 Local 2.83 2.84 0.63 6.3 81 44 50 13 Overall 1.45 4.49 2.72 8.7 88 75 76 40 Sweet 0 0 0 0 187 104 112 0
Thehighestdoseofinorganicnutrientswasappliedtosweetpepperfollowedbyhybrids.Thetotalnutrientsappliedtoopenpollinatedandlocalchilitypesweresimilar,althoughthemixofnutrientswasdifferent.Thefarmersinthesampleareasgenerallyappliedmore than the recommended level of fertilizer to chili crop, which was 69 N, 36-54 P, and 60-90 K (DAE 2002).
Indonesia

173
Insecticide
On average, nearly 31 liters-kg/ha chemicals (single as well as cocktail form) were used to control insects in chili fields (Table 33). Farmers mostly mixed as many as seven different chemicals to prepare a "cocktail". About two-thirds of the total pesticide applied was in the form of cocktail. On average, 21 sprays of insecticide were applied on hot chili and 25onsweetpepperinacropgrowingseason.Thequantityofinsecticideappliedwasrelativelyhigherforhybridchiliandsweetpepper,butnumberofsprayswashighestinopenpollinatedchili.
Table 33. Quantity of insecticide and number of sprays in the sample areas, by chili type, Indonesia, 2002
Chili typeInsecticide (Single) Insecticide (Cocktail) Overall insecticide
applied (kg/ha)aNumber of sprayLit/ha Kg/ha Overalla Lit/ha Kg/ha Overalla
Hybrid 7.2 5.4 12.6 21.0 3.4 24.4 37.1 21 Open pollinated 12.0 0 12.0 17.0 0.0 17.0 29.1 29 Local 8.5 4.0 12.5 7.6 2.4 10.0 22.5 19Overall 7.8 3.7 11.5 16.9 3.0 19.9 31.4 21 Sweet 0 0 0 20.7 14.6 35.3 35.3 25
a Liquid and solid pesticide were combined by assuming one liter is equal to one kg.
Fungicide
On average, 59 kg/ha of chemicals (liquid and powder) were applied to control diseases in chili (Table 34). The quantities of pesticide applied were highest for local chili and lowest forsweetpepperbutthenumbersofsprayswashighestinopenpollinatedchili.
Table 34. Quantity of fungicide and number of sprays in the sample areas, by chili type, Indonesia, 2002
Chili typeChemical (Single) Chemical (Cocktail) Overall pesticide
applied (kg/ha)aNumber of sprayLit/ha Kg/ha Overalla Lit/ha Kg/ha Overalla
Hybrid 6.2 7.3 13.5 32.0 14.7 46.7 60.2 24Open polinated 10.7 3.6 14.1 12.9 7.1 20.0 34.1 40Local 8.2 7.2 15.4 32.0 14.0 54.0 69.4 39Overall 6.6 7.1 13.7 31.2 14.2 45.4 59.1 29Sweet - - - 5.0 17.5 22.5 22.5 13
a Liquid and solid fungicide were combined by assuming one liter is equal to one kg.
Usman Mustafa, Mubarik Ali, and Ir. Heny Kuswanti

174
Herbicide
On average, 1.63 kg/ha of herbicide (liquid and powder) were applied (Table 35). The quantitiesofherbicideaswellasnumbersofsprayswerehighestforhybrid.
Table 35. Quantity of herbicide and number of sprays in the sample areas, by chili type, Indonesia, 2002
Chili type Overall herbicide applied (kg/ha)a Number of sprayHybrid 3.05 4.3Open pollinated 1.69 2.2Local 0.31 3.0Overall 1.63 3.2Sweet - -
a Liquid and solid herbicide were combined by assuming one liter is equal to one kg.
Irrigation
Overall, the chili fields received an average of 75 irrigations. The sweet pepper fields wereirrigatedwithdripirrigationinthehydroponicssystem.Amonghotchilitypes,thehybrid type received 82 irrigations, while open pollinated and local chili types received 67 and 58 irrigations, respectively.
Labor
On average, 345 labor days/ha were used for land preparation, crop management, harvesting, and post harvest operations of hot chili in the sample areas (Table 36). Sweet pepper utilized the highest labor (425 days/ha) and local chili the lowest (265 days/ha).
More than one-half of labor went to crop management activities, regardless of variety. Depending upon the variety, another 9-14% of labor went to land preparation, about 25% for harvesting, and another 6-7% for post-harvesting.
Table 36. Distribution of labor among different activity groups in the sample areas, by chili type. Indonesia, 2002
Chili typePercentage distribution Total labor
Land preparation Management Harvesting Post-harvesting (day/ha)Hybrid 12.6 56.0 25.3 6.1 385Open pollinated 14.1 55.4 24.7 5.8 330Local 13.3 54.9 25.4 6.4 265Overall 12.9 55.5 25.4 6.2 345Sweet (hybrid) 9.2 64.3 19.7 6.8 425
Indonesia

175
Credit
In Indonesia, only 21% of farmers had access to loan facility (Table 37). The major source of credit and loan was informal, mainly from relatives/friends, merchants, shopkeepers, etc.TheaverageloanamountforhotchilifarmerswasIDR656thousandforaperiodof only seven months with 11% interest rate per annum. About 92% availed of loans to purchase inputs, while three percent purchased tractor/power tiller; only one percent usedtheloantopurchasemachineryandtheremainingfourpercentforotherpurposeswhichincludedmarketing,social,constructionofshedortunnel,etc.
Table 37. Loan source, duration, interest rate and purposes by farmer type in the sample areas, Indonesia, 2002
Type of grower Loan(%
farmer)
Average loan
(000IDR)
SourcesDuration (month)
Inte-rest (%)
Purposes
Govt. bank
Friends & relatives
Mer-chants
Shop keeper
Others* Input Ma-chinery
Trac-tor
Other
Hybrid 17 803 4 56 11 11 18 9 8 96 - 4 -Open pollinated 11 11 - - 100 - - 6 10 100 - - -
Local 31 499 9 76 - 5 10 5 16 74 4 - 22Overall 21 656 5 56 14 9 16 8 11 92 1 3 4Sweet 25 26,250 100 - - - - 24 13 - - - 100+
* Private bank, commission agents, etc.+ Construct shed house and other material.
Sweetpepperproductionsystemwascapitalintensive.Therefore,farmerssoughtmoreloansforlongerperiodforitscultivationthanforothertypes:anaverageofIDR26,250thousandforthedurationof24months.Themajorpurposeoftheloansforsweetpeppercultivationwasfortheconstructionofshedandothermaterials.
Production
Chili Yield
On an average, per ha yield of hot chili was 12.6 t in the sample areas (Table 38). Sweet pepper produced the highest yield with low coefficient of variation (CV). Among hot chilitypes,hybridsproducedthehighestyieldbutalsogavehighestCV.Variationsinthemanagementpracticesforhybridtype,whichwasrelativelyanewvariety,explainedhighvariationinitsyield.CultivationofF2andF3seedfrompreviousyears’cropsalsoincreased the CV. Overall yield of open pollinated and local varieties were similar, but thelatterwasmoreriskytoproduceasithashigherCV.
Usman Mustafa, Mubarik Ali, and Ir. Heny Kuswanti

176
Table 38. Chili fresh yield (t/ha) by irrigation source in the sample areas, and by chili type, Indonesia, 2002
Chili farmer Irrigated Non-irrigated OverallHybrid 17.9a (0.87) 9.4b (1.23) 13.9b (0.95)Open pollinated 12.2a (0.53) 6.6b (0.73) 11.0c (0.61)Local 11.2a (0.85) 3.0b (0.94) 10.0c (0.88)Overall 15.6a* (0.82) 7.3b (1.35) 12.6* (0.91)Sweet pepper 64.2 (0.69) - 64.2a (0.69)
Note: Figures in parenthesis are coefficients of variation in yield.The different superscripts across a row imply that the yields are significantly different across the two environments at the 10% level of significance. The different superscripts in the overall column imply that the yield is different across different chili types. The * in the overall row implies the statistical difference between the average of hot-chili types and sweet chili.
TheyieldofchiligrownunderirrigatedconditionwasaboutdoublewithalowerCVthantheyieldunderrainfedcondition.TheyieldofopenpollinatedandlocaltypesweresimilarbutthelatterhadhigherCV.
Yield andnumberof intercropswerenegatively correlated, regardlessof chili types(Table 39). The CV in yield also increased with higher number of intercrops. Although yieldandnumberofintercropswerenegativelycorrelated,thereturntotheproductionsystemincludingreturnfromtheintercropswerenot.
Table 39. Chili yield (t/ha) by number of intercrops and by type of chili in the sample areas, Indonesia, 2002
Chili typeNumber of crops intercropped
Zero One Two Three Overall
Hybrid 17.3 (0.86) 11.6 (1.02) 8.9 (1.55) 4.5 13.9 (0.95)Open pollinated 11.0 (0.61) - - - 11.0 (0.61)Local 11.1 (0.81) 9.7 (0.89) - - 10.0 (0.88)Overall 15.6 (0.84) 10.4 (0.95) 9.1 (1.09) 4.5 12.6 (0.91)Sweet pepper 64.2 (0.69) - - - 64.2 (0.69)
Note: Figures in parenthesis are coefficients of variation in yield.
One can perceive of a number of pros and cons of inter/multiple cropping. It reduces theriskoflosses:incaseonecropfails,revenuesfromothercropsprovidethebuffer;seasonalityinlabordemandcanbeevenedout;somecroprotationsreducepestattack;multiple cropping increases food security for small producer; cash-flow evened out and income from one crop can be a source of capital for the other, etc (Table 40). There are also some disadvantages of inter/multiple cropping such as cultivating more crop requires more knowledge and skill; labor planning become difficult if crops overlaps;
Indonesia

177
morecapitalandinputsareneeded;numberofpestsmayincreasesodoestheriskoffailure of individual crops, etc. The efficiency in land use and maintenance cost and reducedriskofobtainingadditionalincomewerecitedasmainreasonsforintercroppingby farmers in the Adiyoga et al. (undated) study.
Table 40. Advantages and disadvantages of inter/relay/multiple cropping as perceived by the authors
Advantages DisadvantagesLow prices or failure of one crop may not result in total
loss (reduction in risk). Also provide food security for small farmers.
The risk of failure of individual crop increases, although total risk of income from all crops in the system decreases.
May be possible to keep labor employed for a longer time period, thus increasing the chances of obtaining the needed hired labor.
Farmers become specialized in the cultivation of one crop, which improve efficiency in production.
Labor planning and management may become more difficult if planting and harvesting period overlap for different crops.
Growing more than one crop requires more man-agement skills and knowledge about each crop’s cultural practices.
Some crop rotation may decrease pest build-up.
More than one crop per year may be obtained from the same field.
Low pre-harvest capital requirement crop may be used to provide cash for a high pre-harvest capital requirement crop
Some crop rotation may increase pest buildup
More than one crop may increase the amount of field machinery and /or packing equipment needed which would increase the capital investment re-quirement.
Number of pest problems may increase.If using direct marketing, the ability to sell more than
one product in the market might increases traffic to the market, generate repeat customers, and allow the market to stay open over a longer season.
Chili Grades and Prices
Thepercentageofchilioutputproducedaccording todifferentgradewasestimated.Before presenting the results of the estimation, the specification of different grades are elaborated in Table 41.
Table 41. Specification of chili grades at the farm level in the sample areas, Indonesia
Grade Quality Characteristics
1 High Fresh, highest number of seeds, long and straight, shiny and smooth surface, high fragrance, and dark red or green color.
2 Medium Fresh, high number of seeds, medium size, clean surface, medium fragrance, and red or green color.
3 Normal Average number of seeds, normal size, rough or wavy surface, little fragrance, light color.
4 Mix Poor quality chilies mixed with different varieties.
Usman Mustafa, Mubarik Ali, and Ir. Heny Kuswanti

178
Thesurveyresultssuggestedthatmajorityofthehybridchilimarketedinthesampleareas were of grade 2, while the majority of other chili types were of mixed grade(Table 42).
Table 42. Chili production grades and prices in the sample areas, by chili type, Indonesia, 2002
Chili farmerPercentage of output Price (000 IDR/kg)
Grade 1 Grade 2 Grade 3 Mix grade Grade 1 Grade 2 Grade 3 Mix grade Overall
Hybrid 5 56 3 36 7.10 4.80 2.00 3.50 4.36b
Open pollinated 12 11 11 66 7.00 3.50 1.50 2.50 3.69c
Local 5 17 22 56 5.00 4.10 2.00 3.03 3.08c
Overall 6 42 9 43 6.43 4.53 1.96 3.31 3.89*
Sweet 26 25 12 37 8.00 7.50 5.00 6.50 6.96a
Different superscripts in a column imply that the figures are statistically different at 10% level across chili type. The * in the overall row implies that average prices of hot-chili and sweet chili are significantly different.
The overall average hot chili prices received by the sample farmers were IDR 3,890/kg of fresh weight. The maximum price of IDR 6,960/kg was fetched for sweet pepper and the lowest of IDR 3,080/kg for local chili. The highest prices for hybrid chili among hot chilitypeswerepartlybecauseofitsqualitysuchasattractivecolorandsize,andpartlybecause of the difference in the growing season. Open pollinated improved varieties were also grown during the off-season, therefore fetching higher prices than local type butlowerthanhybrids.
Economics of Chili Cultivation
The overall per ha total cost of production of hot chili was calculated at IDR 17.79 million and per kg output cost at IDR 1.30 thousands (Table 43). The respective total and per unit costs for sweet pepper were IDR 133.2 million and IDR 2.76 thousand, respectively. Total per ha cost of chili was significantly lower in case of local chili, but the per kg costsoflocalandhybridvarietieswerestatisticallysimilar.Althoughtotalperhacostsofopenpollinatedandhybridweresimilar,perkgcostofopenpollinatedvarietieswashigherthanthehybridsbecauseoftheloweryieldoftheformer.Thefactorshareofchemicalswashighestinallhotchilitypes,whilestructuresclaimedthehighestshareinsweetpepperbecauseofitspeculiarproductionsystemthatrequiredlargeamountofinitialinvestmentonitsbasicinfrastructuraldevelopment.Thelowestfactor share of 4% of labor was found in sweet pepper production. In all hot chili types, the labor share ranged from 16-17% in hybrid and open pollinated to 23% in local chili. Fertilizerwasthenextimportantinput,exceptinsweetpepperwhereirrigationshareexceededthatoffertilizer.Itisworthmentioningthatseedsplayedthemajorroleinproductivitybuthadthelowestfactorshare,i.e.,onlyonepercentorlessincaseoflocalchiliandsweetpepper,totwopercentinhybridandopenpollinatedchilitypes.
Cost and Factor Share
Indonesia
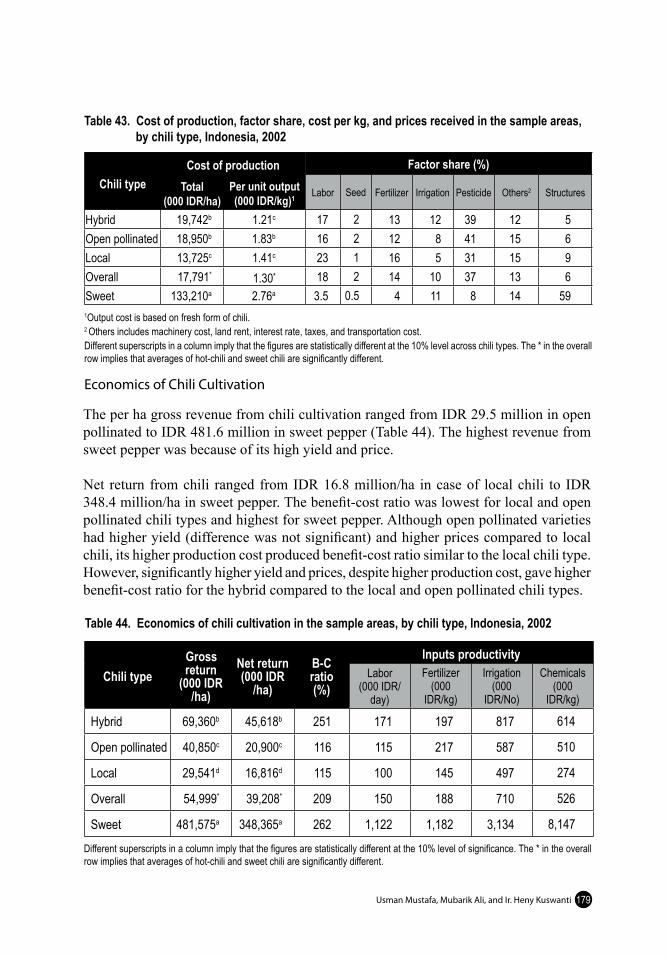
179
Table 43. Cost of production, factor share, cost per kg, and prices received in the sample areas, by chili type, Indonesia, 2002
Chili type
Cost of production Factor share (%)Total
(000 IDR/ha)Per unit output(000 IDR/kg)1 Labor Seed Fertilizer Irrigation Pesticide Others2 Structures
Hybrid 19,742b 1.21c 17 2 13 12 39 12 5Open pollinated 18,950b 1.83b 16 2 12 8 41 15 6Local 13,725c 1.41c 23 1 16 5 31 15 9 Overall 17,791* 1.30* 18 2 14 10 37 13 6Sweet 133,210a 2.76a 3.5 0.5 4 11 8 14 591Output cost is based on fresh form of chili.2 Others includes machinery cost, land rent, interest rate, taxes, and transportation cost.Different superscripts in a column imply that the figures are statistically different at the 10% level across chili types. The * in the overall row implies that averages of hot-chili and sweet chili are significantly different.
Economics of Chili Cultivation
The per ha gross revenue from chili cultivation ranged from IDR 29.5 million in open pollinated to IDR 481.6 million in sweet pepper (Table 44). The highest revenue from sweetpepperwasbecauseofitshighyieldandprice.
Net return from chili ranged from IDR 16.8 million/ha in case of local chili to IDR 348.4 million/ha in sweet pepper. The benefit-cost ratio was lowest for local and open pollinatedchilitypesandhighestforsweetpepper.Althoughopenpollinatedvarietieshad higher yield (difference was not significant) and higher prices compared to local chili, its higher production cost produced benefit-cost ratio similar to the local chili type. However, significantly higher yield and prices, despite higher production cost, gave higher benefit-cost ratio for the hybrid compared to the local and open pollinated chili types.
Table 44. Economics of chili cultivation in the sample areas, by chili type, Indonesia, 2002
Chili typeGross return
(000 IDR/ha)
Net return(000 IDR
/ha)
B-C ratio(%)
Inputs productivity Labor
(000 IDR/day)
Fertilizer (000
IDR/kg)
Irrigation(000
IDR/No)
Chemicals (000
IDR/kg)
Hybrid 69,360b 45,618b 251 171 197 817 614
Open pollinated 40,850c 20,900c 116 115 217 587 510
Local 29,541d 16,816d 115 100 145 497 274
Overall 54,999* 39,208* 209 150 188 710 526
Sweet 481,575a 348,365a 262 1,122 1,182 3,134 8,147
Different superscripts in a column imply that the figures are statistically different at the 10% level of significance. The * in the overall row implies that averages of hot-chili and sweet chili are significantly different.
Usman Mustafa, Mubarik Ali, and Ir. Heny Kuswanti

180
Hybridchiliandsweetpepperproductionwerecapitalintensivebutgenerategenerallyhigher benefit-cost ratio and resource use efficiencies compared with the other chili types. The benefit-cost ratio and labor, fertilizer, irrigation, and pesticide use productivities wereallhigherinsweetpepperthaninhybrids.
Many farmers used home-produced hybrid seeds from previous years’ F2andF3progeniestosaveonseedcost.TheaverageyieldperhaofF1,F2,andF3 was 16.9 t, 8.5 t, and 4.5 t, respectively (Table 45). It is worth noting that the yield of F2iscomparablewiththeyieldofopenpollinatedandlocaltypes.ThequalityoftheF2andF3 outputwasalsoreducedasfarmersobtainedloweroutputpricesthusfurtherreducingthecorrespondinggrossreturns.Farmersalsousedlessinputsespeciallyfertilizerandpesticide,butpartialinputproductivitieswerelowerinbothF2andF3comparedtoF1.
TheeconomicsofF1andF2withrespecttolocalandopenpollinatedvarietieshoweverwas not as bad. In fact, net returns for F2werevery similar to openpollinated, buthigher than local varieties. Input productivities including benefit-cost ratio of F2werecomparableor higher than local varieties, but lower than in openpollinated, exceptpesticideproductivity.TheF3 seed produced lower return, benefit cost ratio, and input productivitiescomparedtobothopenpollinatedandlocaltypevarietiesexceptpesticideproductivityinlocaltypes.
Table 45. Economics of cultivation of chili in the sample areas, by hybrid type, Indonesia, 2002
Hybrid typeGross return
(000 IDR/ha) Total cost
(000 IDR/ha)Net return
(000 IDR/ha) B-C ratio
(%)
Inputs productivity Labor (000 IDR/day)
Fertilizer (000
IDR/kg)
Irrigation(000
IDR/No)
Pesticide (000
IDR/kg)
Hybrid F1 88,635 23,630 65,005 275 199 224 991 1978Hybrid F2 38,425 18,868 19,557 104 93 159 465 764Hybrid F3 17,892 11,761 6,131 52 42 114 256 416
Attraction and Constraints in Chili Production
Major Attraction
The profitability in chili cultivation was ranked as number one attraction in hybrid chili andsweetpepper,whiletraditionofgrowingchiliwasnumberonerankingattractioninopen pollinated and local chili (Table 46). Other attractions in chili cultivation included personal motivation, experience in cultivation, and adaptability of the crop in localenvironmentandcroppingsystem.
Indonesia

Table 46. Ranking of attraction in chili cultivation in the sample areas, by chili type, Indonesia, 2002
Chili farmer Profitable Traditional Well experience Personal motivation Well adopted Others
Hybrid 1 2 5 3 4 -Open pollinated 2 1 4 3 - -Local 2 1 3 4 5 -Sweet 1 - 4 2 3 5*
Overall 1 2 4 3 5 -* Availability of enough labor.Note: 1 is the highest attraction; 5 is the lowest.
Major ConstraintsInsectsordiseaseswerenumberoneortworankingconstraintsinallchilitypes,exceptin local where low yield potential was the second-ranking and insects the third-ranking constraints (Table 47). It seemed that even in sweet pepper, where hybrid varieties were used, disease and insect resistance were not foolproof. Difficulty in marketing was ranked asthirdconstraintinhybridandopenpollinatedchilies,whileinsweetpepperthehighseedcostwasrankedasthirdconstraint.2 Unstable environment was ranked as fourth constraintinallexcepthybridtypes.
2It should be noted that the ranking of seed cost constraints also connote the difficulty in getting modern seed varieties. In hybrid and open pollinated, the share of seed cost was two percent, while in sweet pepper it was only 0.5%. Despite this, the rank of seed constraint was lower in hybrid and open pollinated compared to sweet pepper because a significant proportion of farmers produced their own seed in the former.
Table 47. Ranking of major constraints faced by farmers in the sample areas, by chili type, Indonesia, 2002
Chili farmer Disease Insects High seed cost Low yield Environment Market OthersHybrid 2 1 5 - - 3 4+
Open pollinated 2 1 - 5 4 3 -
Local 1 3 - 2 4 5 -
Sweet 1 2 3 - 4 - -
Overall 2 1 5 - 4 3 -+ Low priceNote: 1 is the highest rank; 5 is the lowest.
Chili ProcessingAt the local and district levels, small processing units of the trader/commission agents were usedtodrychiliesbeforemarketing.ItisimportanttomentionthatallfarmersinIndonesiasoldchiliinfreshformimmediatelyafterharvest.Inthecountry,thereweregenerallysmall chili-processing units, as well as very large multinational chili processing factories mainlyforexports.FourchiligradesweremostcommoninIndonesiaasindicatedbyprocessors (Table 48). Chili with dark red color, good pungency, less seeds, and of course withoutanyinfectionwereconsideredhighgrade.Intheirselection,smallchilieswith
Usman Mustafa, Mubarik Ali, and Ir. Heny Kuswanti 181

182
high pungency, good fragrance, and lower prices were given first, second, and third rank, respectively.Thechilientrepreneursexpressedtheirconcernsaboutpoorgradingandquality of chili supplied by the farmers, price fluctuation, inadequate supply, and lack of capital.TheyalsopreferredtoimportchiliesfromIndia,China,Thailand,andBurma,whichwerecheapandofhighquality.
Table 48. Dry chili grade in the sample areas, Indonesia, 2002
Grade Quality Characteristics
A Super Processed only fresh chili (mesocarp) without seed and stalk.
B Medium Processed fresh chili (mesocarp) without seed but there are still some stalk.
C Normal Processed whole chili (mesocarp, seed and stalk).
D Mix Poor quality chili processed with seed and stalk.
Chili Consumption
Per Capita Consumption and Expenditure
Overall, per capita weekly consumption of chili and its products converted into fresh weight was 185 g (Table 49). The consumption was higher among the chili farmers and their families than the other consumer groups. The "Sambals" (home-made crude chili sauce)was themajor formofchiliconsumedinIndonesia.Noneof therespondentsintheentiresampleindicatedconsumptionofdryorpowderformofchiliincooking.However, in preparing ready-made noodles, some consumers made available powder chili as well as chili paste in the noodle’s packet. Urban dwellers consumed substantially higher amount of chili sauce, a substitute for sambals, and "other" chili products than otherconsumergroups.
Table 49. Relative quantity share (%, converted into fresh weight) of different chili types in total consumption in the sample areas, by consumer type, Indonesia, 2002
Type of chili/products Chili farmer Non-chili farmer Urban consumer Overall1
Green 33.5 31.3 35.9 33.6Red 54.6 43.8 34.4 39.3Chili sauce 5.5 9.0 12.1 10.5Chili dipping sauce - 6.6 5.5 6.0Other chili products 6.4 9.3 12.1 10.6Total (g/week) 201.5 188.5 181.7 185.3
1 Chili consumption in overall Indonesia was estimated assuming 1%, 50%, and 49% weights for the chili producer, non-chili producer, and urban consumer, respectively.
Indonesia

183
On average, Indonesian consumers spent about IDR 1,234/week on chili consumption (Table 50). Despite less quantity of chili consumed by urban consumers than their counterpart farmer groups, they spent more money on chili consumption, as theyconsumed more high-value chili products and purchased at the end of the retail marketing chain. While red fresh chili was the main product consumed on chili and non-chili farms, greenandredfreshchiliandchiliproducts,includingsauce,claimedalmostequalshareintheexpenditureonchilibyurbanconsumer.
Table 50. Relative share of expenditure (%) on different chili types in the sample areas, by consumer type, Indonesia, 2002
Type of chili/products Chili farmer Non-chili farmer Urban consumer Overall3
Green fresh 33 31 36 33
Red fresh 55 44 34 40
Other chili products1 12 25 30 27Overall weekly per capita expenditure (IDR)2 949b 1,007b 1,472a 1,234
1 Other chili products include grounded dry and processed chili products. 2 The different superscript on the figures across this row implies that they are significantly different at the 10% level.3 The chili consumption in overall Indonesia was estimated assuming 1%, 50%, and 49% weights for the chili producer, non-chili producer, and urban consumer, respectively.
Retail Value of Chili and its Products
Expenditure divided by per capita consumption of chili multiplied by one thousandgenerated an average per kg price of chili and its products of IDR 6,659 at the retail level. This price was about 71% higher than the farm gate price of IDR 3,890 reported inTable42.Thisratiowasusedasfactorinconvertingtheannualfarmgatevalueofchili production in Indonesia of US$676 million during 2003 (Table 1) into retail prices of chili and its product at US$1,157 million.
Demand Elasticity
Anincreaseinthepriceofchilihadverylittleeffectonitsdemand.Evenifpricesweredoubled the consumers would continue eating chili and there would only be a 13-14% decrease in the consumption of green and red chilies (Table 51). The decrease in chili products would only be around three percent. Conversely, a 50% reduction in chili prices wouldincreaseconsumptionofchilianditsproductsbylessthanonlytwopercent.
Usman Mustafa, Mubarik Ali, and Ir. Heny Kuswanti

184
Table 51. Consumer response to changes in chili prices in the sample areas, by chili product, Indonesia, 2002
Change in price (%)Percentage change in consumption
Green Red Product
Increase in price 110 -4.19 -2.12 0 125 -4.59 -4.70 -0.07 150 -5.80 -5.58 -0.08 175 -7.62 -8.64 -1.98 200 -13.95 -12.71 -3.32Decrease in price 90 0 0.24 0 80 0 0.24 0 70 0.03 0.29 0.14 60 0.05 0.72 0.95 50 0.53 1.56 1.15
Chili Purchasing Source
Respondentspurchasedchilimainlyfromthelocalmarketorvegetableshops,followedby main markets and wholesale markets (Table 52). A significant portion of chili was alsopurchasedfromothersourcesespeciallybyurbanconsumers,whichincludedspecialdaymarkets,superstore,orcombinationofdifferentsources.Forfarmers,othersourcesincluded own-farm harvest, gift from friends, and others.
Table 52. Sources of purchased chili (% of consumer) by consumer and chili type in the sample areas, Indonesia, 2002
Chili type
Chili farmer Non-chili farmer Urban consumer
Local market
Main market
Whole-sale
market
Other Local market
Main market
Whole-sale
market
Other Local market
Main market
Whole-sale
market
Other
Green 68 2 6 24 71 8 10 11 73 11 4 12
Red 54 3 4 39 68 9 12 11 59 9 6 26
Sweet 13 13 - 74 - - - - 28 31 4 37Chili sauce 65 19 12 4 72 27 - 1 50 3 14 33
Indonesia

185
Consumers’ Preference for Chili Attributes
Urban consumers ranked freshness as number one characteristic in purchasing both green and red chilies (Table 53). The second factor considered for all green, red, and chili products was higher number of seeds. This may be because they prepared "Sambals" from freshchiliesandhavingmorechiliseedsmadeithotterandtastier.Colorwasrankedas third among red chili and fifth for green chili. For chili product, hotness was the most importantfactor,andmarketpricesgotthethirdrank;fragranceandpackagingofchiliproducts scored fourth and fifth ranks, respectively.
Table 53. Factor considered in the purchase of chili by urban consumers in the sample areas, Indonesia, 2002
CharacteristicsOverall rank
Green Red Product
Freshness 1 1 -Number of seeds 2 2 2Market price - - 3 Packaging - - 5 Disease/insect free 3 4 -Color 5 3 -Fragrance - - 4Pungency 4 5 1
Consumers’ Preference for Packaging
Majority of consumers preferred unpacked green/red chilies or in paper package mainly because of their high consideration for freshness (Table 54). They also preferred sweet pepperunpackedorinpaperpackagingmainlyforfreshness,cheapprice,numberofvarietiesavailableinpaperpackaging,andvisibilityofquality.Incaseofchiliproductthemostpreferredpackagingwasinplasticbecauseitgavethebestimageoftheproduct,andwasidealforactiveandmodernpeoplebecauseofitsconvenienceinstorageandpreservation,visibility,andcheapprice.
Usman Mustafa, Mubarik Ali, and Ir. Heny Kuswanti
Note: Highest rank = 1 and lowest rank = 5

186
Chili type Packing type
Preference(%)
Main reason (% of consumer) Freshness Presentability Cheapness Variety Ideal* Visibility Other
Green/redUnpacked 44 92 1 1 - - 2 4Paper 37 80 1 7 - 7 - 5Glass 9 14 28 - - - 1 57Plastic++ 6 7 - 36 - - 36 21Tin 4 - - - - 25 - 75
SweetUnpacked 40 50 25 - - - 25 -Paper 32 - - 25 25 50 - -Plastic 24 100 - - - - - -Glass 4 - 50 - - - 25 25
ProductUnpacked 16 - - - - 25 75 -Paper 15 - 20 - 80 - - -Glass 10 6 35 - - - - 59+
Plastic 45 5 50 10 - 15 15 5Tin 14 - - - - 100 - -
Table 54. Consumer preferences for different types of chili packaging by chili type in the sample areas, Indonesia, 2002
Development Impact of Chili Cultivation
* Ideal for active and modern people, + Good presentation, ++ Grocery ‘bags’ in various sizes.
Thissectioncomparedthedevelopmentimpactofhotchiliandsweetpepperwithriceandtomato.
Input Demand
The cultivation of chili, like other vegetables, was labor-intensive as it required many times more labor than rice. For example, hot chili production, which was less labor-in-tensivethansweetpepper,neededalmost2.6timeshigherlabordaysthanriceandaboutsimilar with tomato (Table 55). Sweet pepper cultivation engaged more labor than rice, tomato,andhotchili.Ingeneral,invegetablesandparticularlyinchiliproduction,laborwas engaged throughout the production period compared with other field crops. Therefore, expansioninchiliareawillgenerateemploymentopportunitiesintheruralareas.
Theapplicationoffertilizersonsweetpepperwasalsohigherthanincompetingcrops;the difference was significant when both hot chili and sweet pepper were compared with rice and tomato, but not significant when hot chili was compared with tomato. Similarly, theapplicationofmanureinhotchiliwasmorethanfourtimeshighercomparedtoriceand 74% higher than in tomato. Chili attracted more insects and pests than rice that was
Indonesia

why it received more than 13 times pesticides spray than rice. It also needed many times moreirrigationcomparedtorice.3Seedcostofbothhotandsweetchiliwasalsohigherthanriceandtomato.
187
Table 55. Relative per ha input use of chili and its competing crops in the sample areas, by farmer type, Indonesia, 2002
Crop Labor (days) Seed (000 IDR)
Fertilizer (Nutrient
kg)Manure (t) Irrigation
(number)Pesticides
spray (number)
Hot-chili 345b 356b 239b 8.7a 75b 53a
Sweet pepper 425a 666a 403a 0.0 149a 38b
Rice 132c 126d 169c 2.0c 18d 4d
Chili framer 125 112 156* 1.0* 14* 4 Non-chili farmer 135 129 170 2.5 20 4Tomato 350b 274c 215b 5.0b 66c 15c
Chili framer 356 312 236* 6.0* 72* 18*
Non-chili farmer 343 256 195 4.0 21 13Different superscripts in a column of the rows of hot-chili, sweet chili, rice and tomato suggest that the value of the parameter is significantly different at the 10% level. The * in the row of chili farmer suggests that the parameter value is significantly different from the non-chili farmer at 10% level.
However,generallyhigherinputuseforchilithanricewasnottrueforlocalchilitype.Thelowinputsusedbyresourcepoorfarmersonlocalchiliwasmainlyduetohighcost of modern technologies, non-responsive varieties, and inefficient credit distribution system.Infact,theinputuseintensityinchilicanbefurtherincreasediftheseinputswereavailable at low cost to local chili growers and if credit was financed through efficient financial institutions.Chilifarmersappliedlesserinputstotheirricecrop,butmoreinputstotheirtomatofields compared to non-chili farmers.
Resource Use Efficiency
Farmersobtainedhighergrossandnetreturnsforchiliesthanforitscompetingcrops,although the differences in gross return between hot chili and tomato was not significant (Table 56). Both hot chili and sweet pepper required higher cost than its competing rice crop. However, net returns in hot chili were about 19 times the returns in rice. The benefit-cost ratio was more than four times higher in hot chili production compared to rice and 67% higher compared to tomato production. The resource productivity, such as for laborandfertilizer,wasalsohigherinbothhotchiliandsweetpeppercomparedtoriceproduction.However,fertilizerproductivityintomatowashigherthaninhotchili.
Usman Mustafa, Mubarik Ali, and Ir. Heny Kuswanti
3 Although number of irrigation applied on chili crop were higher than rice suggesting higher labor needs to operate these irrigations, quantity of water on chili may not be higher as rice needs continuous application of water during its growth cycle.

188
Interestingly, rice and tomato production by chili farmers was more efficient than by non-chili farmers. This was reflected by higher benefit-cost ratio in rice, and higher fertilizer andlaborproductivitiesforbothriceandtomatoproducedonchilifarmscomparedtothose in non-chili farms. In rice cultivation, however, the difference in efficiency was not so great because many of the non-chili farmers grew highly profitable crops like othervegetablesorcotton.
Table 56. Resource use efficiency in chili and competing crop cultivation in the sample areas, by farmer type, Indonesia, 2002
Crop Yield (t/ha)
Total cost(000
IDR/ha)Gross return(000 IDR/ha)
Net return(000 IDR/ha)
B-C ratio(%)
Labor productivity
(000 IDR/day)
Fertilizer productivity(000 IDR/kg)
Hot-chili 12.6 17,791b 54,999b 39,208b 209 150 188Sweet chili 64.2 133,210a 481,575a 348,365a 262 1,122 1,182Rice 5.01 3,950c 6,012c 2,062d 52 36 24 Chili farmer 5.00 3,621* 6,000 2,379 66 38 27 Non-chili farmer 5.20 4,012 6,240 2,228 56 36 25Tomato 13.21 21,439b 48,283b 26,844c 125 128 213 Chili farmer 15.56 26,731* 53,238* 26,507* 99 145 216 Non-chili farmer 12.78 21,371 43,895 22,524 105 113 211
Different superscripts in a column of hot-chili, sweet chili, rice and tomato rows suggest that the value of the parameter is significantly different at 10% level. The * in the row of chili farmer suggests that the parameter value is significantly different from the non-chili farmer at 10% level.
Impact on Gender and Poverty
About 63% of the labor force engaged in hot chili production was composed of women (Table 57). Sweet pepper and hybrid chili production engaged higher female labor than do open pollinated and local chili types. The share of female labor was 89% and 85% in harvestingandpostharvestingoperationsforhotchili,respectively,andsimilarorevenhigherproportionswereobservedincaseofsweetpepper.Managementactivitiesseemtobeequallysharedbymenandwomen,althoughitwashigherformeninchilithanin rice. The share of women was less than 50% only in land preparation, but still higher than rice. The study can therefore conclude that chili production is a female-gender friendlycrop.
Indonesia
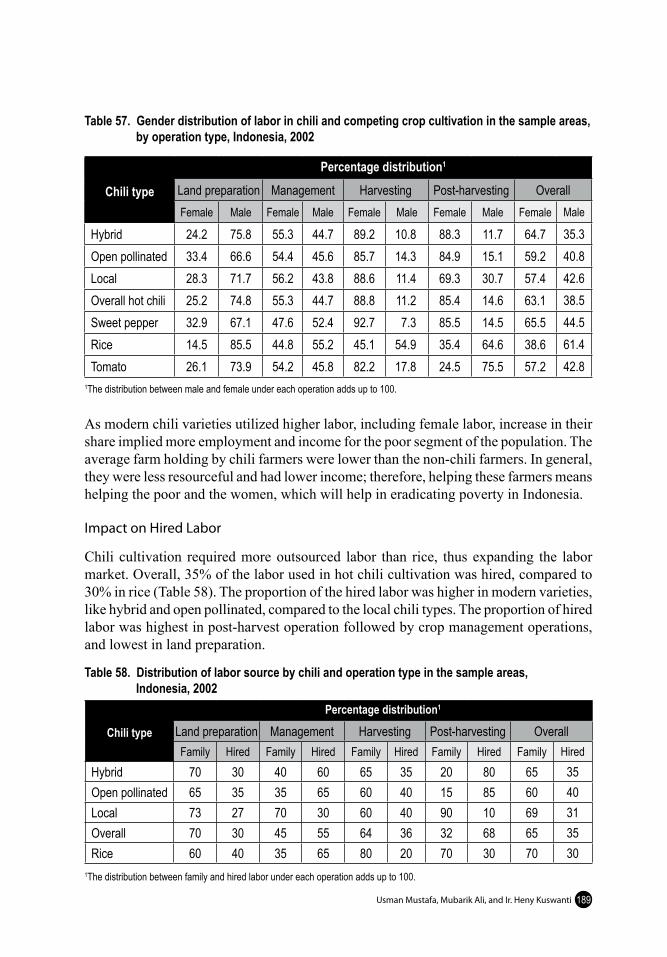
189
Table 57. Gender distribution of labor in chili and competing crop cultivation in the sample areas, by operation type, Indonesia, 2002
Chili type
Percentage distribution1
Land preparation Management Harvesting Post-harvesting OverallFemale Male Female Male Female Male Female Male Female Male
Hybrid 24.2 75.8 55.3 44.7 89.2 10.8 88.3 11.7 64.7 35.3Open pollinated 33.4 66.6 54.4 45.6 85.7 14.3 84.9 15.1 59.2 40.8Local 28.3 71.7 56.2 43.8 88.6 11.4 69.3 30.7 57.4 42.6Overall hot chili 25.2 74.8 55.3 44.7 88.8 11.2 85.4 14.6 63.1 38.5Sweet pepper 32.9 67.1 47.6 52.4 92.7 7.3 85.5 14.5 65.5 44.5Rice 14.5 85.5 44.8 55.2 45.1 54.9 35.4 64.6 38.6 61.4Tomato 26.1 73.9 54.2 45.8 82.2 17.8 24.5 75.5 57.2 42.8
1The distribution between male and female under each operation adds up to 100.
Asmodernchilivarietiesutilizedhigherlabor,includingfemalelabor,increaseintheirshareimpliedmoreemploymentandincomeforthepoorsegmentofthepopulation.Theaverage farm holding by chili farmers were lower than the non-chili farmers. In general, theywerelessresourcefulandhadlowerincome;therefore,helpingthesefarmersmeanshelpingthepoorandthewomen,whichwillhelpineradicatingpovertyinIndonesia.
Impact on Hired Labor
Chili cultivation requiredmoreoutsourced labor than rice, thusexpanding the labormarket. Overall, 35% of the labor used in hot chili cultivation was hired, compared to 30% in rice (Table 58). The proportion of the hired labor was higher in modern varieties, likehybridandopenpollinated,comparedtothelocalchilitypes.Theproportionofhiredlabor was highest in post-harvest operation followed by crop management operations, andlowestinlandpreparation.
Table 58. Distribution of labor source by chili and operation type in the sample areas, Indonesia, 2002
Chili type
Percentage distribution1
Land preparation Management Harvesting Post-harvesting OverallFamily Hired Family Hired Family Hired Family Hired Family Hired
Hybrid 70 30 40 60 65 35 20 80 65 35Open pollinated 65 35 35 65 60 40 15 85 60 40Local 73 27 70 30 60 40 90 10 69 31Overall 70 30 45 55 64 36 32 68 65 35Rice 60 40 35 65 80 20 70 30 70 30
1The distribution between family and hired labor under each operation adds up to 100.
Usman Mustafa, Mubarik Ali, and Ir. Heny Kuswanti

190
Impact on Consumption
Overall, income as well as expenditures of chili farm families were less compared with urban and non-chili farm families (Table 59). Chili production was profitable and more efficient in using resources. However, other farms had bigger land area, and non-farm groupshadhigherincomesfromvarioussources.Moreover,manyofthemplantedothercrops such asvegetable and cotton and thesemaybe equallyormore remunerativecompared to chili. The gap between chili and non-chili farmer’s income and expenditure can be reduced through the introduction of modern varieties and cost-efficient chili production technologies. There is a large room for the introduction of pest-resistant high yieldingchilivarieties.Chilifarmersspentsubstantialamountsonpesticide,whichcanbesaved.
Table 59. Monthly per capita household income and expenditure in the sample areas, by farmer and consumer type, Indonesia, 2002
Consumer type
Expenditures (000 IDR) Average income(000 IDR)Food Overall including food
Chili farmer 93.9c 140.8c 248.0c
Non-chili farmer 142.0b 200.5b 357.6b
Urban consumer 174.1a 268.4a 502.7a
Overall 110.8 168.0 297.4The different superscripts in a column implies that the figures are significantly different across consumer groups.
Overall, chili farmers spent less on food items compared with urban household and non-chili farmers, because of their overall lower income (Table 60). Interestingly, chili farmersconsumedmorevegetablesastheyhadhigherproportionofareaundervegetablethan non-chili farmers as shown in Table 11.
Table 60. Average daily consumption of different food, by consumer group in the sample areas, Indonesia, 2002
Food groupQuantity (g/capita)
Chili farmer Non-chili farmer Urban consumer Overall
Cereals 374a 362a 331b 356Livestock products 116a 132a 140a 136Vegetables 210a 195b 189c 207Fruits 91b 96b 116a 98Seafood 80a 93a 105a 98Others 134a 154a 168a 148Overall 995b 1,032a 1,049a 1,022
Indonesia
The different superscripts in a row means that figures are significantly different across consumer groups.

191
Summary and Policy Implications
Chili is a high-value commercial vegetable crop in Indonesia. The semi-crushed fresh chili in the form of “Sambals” is an essential ingredient of the daily diet. In 2003, its farm value was estimated at US$676 million, and the retail value of chili and its products at US$1,157 million. Based on average chili area on each farm, over 463 thousand farm familiesareestimatedtobeengagedinitsproduction,anditcanbespeculatedthatasimilarnumbermaybeengagedintheprocessingandmarketingactivities.Inviewoftheroleofchiliinprovidinglivelihoodtoalargenumberofruralandurbanhouseholds,this study provided a comprehensive overview of the production, consumption, anddistributionaspectsofchiliinIndonesia.
ChiliproductionisalaborintensiveandsmallfarmeractivityinIndonesia.Chilifarmersare younger with larger family size and smaller landholding than non-chili farmers. Being smalllandholders,theyareengagedinmorecropactivitiesandpossessedfeweranimals,but attain higher cropping intensity compared to their non-chili counterparts.
Chili farmers allocated a substantial part of their land to chili (28%) and other vegetables (44%). Chili management practices in Indonesia were dominantly traditional and the institutional setup was not very conducive for its development. Nearly 60% of farmers obtained seed-related information from their neighboring farmers and village retailers. Connectionbetweenfarmersandextensionagentstoseekindependentinformationaboutseed quality was rather weak. A very small percentage treated nursery or field soil. A large majority of farmers cultivated their land manually. As alternative risk-covering mechanisms were not available, a large percentage (58%) used intercropping as a tool tocoverrisk,althoughthepracticeproducedloweryield.Tosavehighseedcost,alargeproportion of hybrid seed (34%) was F2 saved from the previous crop. Only one-fifth of thefarmersavailedcredit,mainlyfrominformalsources.Atthesametime,however,advancedsweetpeppercultivationsystemunderhydroponicshadalltheingredientsofgoodcropmanagement.
Largequantitiesofinsecticidesandfungicideswereappliedbothassingleandincocktailformbutwithinappropriatebrandsanddoses.Theavailabilityofalargenumberofpesticidebrandsinthemarketandthepracticeofmakingcocktailsuggestthatpesticideuse was not targeted to specific disease or insect. Many pesticides were used as insecticide aswellasfungicide;therefore,itseffectivenesswasverylow.Despitehighpesticideuse, the average losses due to insects and diseases were as high as 63%. This worrying phenomenonwasassociatedwiththeincreaseinlossesovertimedespitetheadoptionofmodernchilivarieties.Allthesemadeinsectanddiseasesthenumberoneconstraintinchiliproduction.
Farmers in Indonesiahadquicklyadoptedmodernvarietiesofchili.Amongmodernvarieties,hybridstypesweremorecommon.Thesevarietiesbroughtalongimprovedmanagementpractices,andrevolutioniziedthechiliproductionsysteminthecountry.For example, a great majority of these fields had plastic mulching and were given
Usman Mustafa, Mubarik Ali, and Ir. Heny Kuswanti

192
higher number of harrowing. They were also given higher doses of fertilizer, pesticides/fungicides and irrigations. Partly due to better resistance and partly because of better pest management practices, the yield losses due to diseases were much lower in hybrid fields. Themodernhybridvarietiesalsoengagedmorelabor,especiallywomenandhired,indifferentoperationscomparedtootherhotchilitypes.
Allthesemanagementpracticesproducedhigheryield.This,alongwithbetterqualityattributes in hybrid seed (which enabled farmers to fetch higher prices), made its productioneconomicallymoreviablethanotherchilitypesandcompetingcrops.Thebenefit-cost ratio and resource use efficiency were generally higher in hybrid than other hot-chili types. However, underpinning financial constraints forced the farmers to use F2andF3ofhybrids,whichreducedquality,yieldsandeconomicviability.Alesscostlyand low input-demanding improved open pollinated varieties could help small poor farmers.Although certain open pollinated improved varieties were available to thefarmers,itseconomicviabilitywasequalonlytothelocalunimprovedvarieties.Lowyieldpotentialdespitehighinputuseresultedtoloweconomiccompetitivenessofthesevarieties.Collaborationwithappropriateinternationalorganizationscangreatlyhelptoimprove efficiency of research institutes and enable them to develop open pollinated varietieswithhighyieldpotentialanddesiredattributes.
Chili cultivation in Indonesia covers different agro-climatic and cropping system domains.Intercroppingofchiliwithdifferentcropsaddsintothecomplexity.Thereisaneedtodevelopseparatechiliproductionrecommendationpackagesfordifferentdomains.The extension services should demonstrate the application of judicious, timely, andproper doses of fertilizers and pesticides. Besides, there are a number of non-production constraintssuchasunpredictabilityofprices,lackofpriceinformation,andexploitationbymiddlemen.Strengtheningmarketinfrastructureandinformationnetworkcanhelpresolvetheseissues.
Improvement in chili production and distribution systems will benefit the poor segment of the farming community, especially women and hired labor. The efficiency of resources engaged in chili production was comparable, if not better, with high-value vegetables such astomatobutbetterthancerealcropsuchasrice.However,aschiliisanintegralpartofIndonesiandietassuggestedbylowdemandelasticity,expansioninchiliproductionshouldbecarefullyplanned.Incorporationofconsumers’preferredtraitsinchilivarietiesas identified in this study (such as freshness, more number of seeds, attractive color, and pungency)willimproveitspriceandenhancefarmerincome.Stabilizingchiliproductionby developing pest-resistant varieties and reducing environment stresses can reduce risk in chili production which will provide benefits for small poor farmers. Reducing production cost through judicious use of inputs, especially fertilizers and chemicalswillnotonlyreducethecashrequirementsandenablesmallfarmerstoengageinhighlyprofitable chili cultivation, but can also reduce environmental costs. In order to meet the cashrequirementsofmoderntechnologies,farmers'accesstocreditshouldbeimproved.In this connection, the role of government and non-government financial institutes, private lenders,traders,andfarmer’sassociationiscritical.
Indonesia

193
ThelinkofchiliproducerswiththemarketwasrelativelypoorinIndonesia.Mostofthefarmoutputwassoldtothelocaltradersandverylittlewentdirectlytothewholesalemarketatthedistrictorprovinciallevels.Traders,intheabsenceofsophisticatedmarketinfrastructure,providedfarmerslinkstoseveralmarkets.Moreover,theysupplyliquidityin the absence of appropriate financial institutions. But the involvement of middlemen inmanyagricultural functions reduced farmersshare inconsumersprice.Therefore,improvements in market infrastructure and financial institutions can help farmers supply chiliasdesiredbytheconsumers,andalsoimprovetheirshareinconsumersprice.
Indonesians consumed mainly fresh chilies; only one-fifth of total chilies consumed were in dry form. Farmers sold fresh chili while local traders/commission agents dried a part ofpurchasedchiliundersunatopenplaces.Moreover,nochiliprocessingactivitywaspracticed at the farm-level thus reducing their capacity of holding output for a longer period.Iffarmerscarryouttheseactivitiesbythemselves,theirshareintheretailpriceofchiliwillbeincreasedandtheirnegotiationpowerwillbeenhanced.Theextensiondepartmentandprocessingunitsshouldmotivatefarmersonthesepractices.Cooperativemarketingcanalsoimprovefarmers’negotiationpowers.Thesuccessfuloperationofsomecooperativesincertainareasneedstobeupscaledinotherareas.
Usman Mustafa, Mubarik Ali, and Ir. Heny Kuswanti

194
References
Adiyoga, W., B.R. Sinung, Y. Hilman, and B.K. Udiarto. (undated). Baseline study on identification and development of integrated pest control technology for chili plant in West Java. Unpublished report.
DAE (Department of Agriculture Extension). 2002. Recommended plant-to-plant and row-to-row distance, seed rate, fertilizer and expected yield Kg/ha. Department of AgricultureExtension,DiKabupatenDistrictII,Garut,WestJava,Indonesia.
Directorate General of Food Crops and Horticulture. 2004. Production Information on FoodCropsandHorticulture.MinistryofAgriculture.Jakarta.
FAO (Food and Agricultural Organization of the United Nations). 2004. FAOSTAT database. <http://faostat.fao.org/faostat/collections?version=ext&hasbulk=0>. Accessedin2004.
Freeman,N.2005.Indonesia.Sally’splace.<http://www.sallys-place.com/food/ethnic_cuisine/indonesia.htm>. Accessed in 2005.
Jensen, Merle H. 1991. Hydroponic culture for the tropics: opportunities and alternatives. Department of Plant Sciences, University of Arizona, USA. <http://www.agnet.org/library/article/eb329.html>. Accessed in 2004.
Recipes4us. 2003. Cooking by country: Indonesia. Indonesia recipes culinary history and information. <http://www.recipes4us.co.uk/Cooking%20by%20Country/Indonesia.htm>. Accessed in 2004.
Research Institute for Vegetable (RIV). 1996. Per capita consumption of fresh chilies (1980-1990). Research Institute for Vegetable, Lembang, Indonesia.
Indonesia

195
Appendix 1. Frequency of different insecticide and fungicide used on chili, in the sample areas, Indonesia, 2002
Brand name
Chemical name
Frequency Brand name Chemical name
Frequency
Insecticide Fungicide Insecticide Fungicide
Agrimec Abamectin 12.95 6.61 Polyram Metiram - 0.44
Rotraz Amitraz 0.55 0.66 Metindo Metomil 0.55 0.66
Brent Barium hydrox-ide octahydrate - 0.44 Pounce Permethrin 1.65 0.66
Bulldock Beta-cyfluthrin 2.38 1.10 Folirfos Phosphite acid 0.37 0.44
Spontan Bisultap - 0.66 Daitona Poksim 0.37 -
Baycor Bitertanol - 0.44 Sportak Prokloraz 1.10 -
Derosal Carbendazim 0.37 3.52 Previcur Propamocarb hydrochloride - 1.32
Daconil Chlorothalonil - 0.44 Curacron Prophenophos 21.75 12.59
Dursban Chlorpyrifos 6.95 4.85 Antracol Propineb 2.93 16.42
Kuproxat Copper oxysulphate 0.55 0.88 Castle Protiophos - 0.44
Matador Cyhalothrin 0.55 0.44 Larvin Thiodicarb 4.02 3.52
Arrivo Cypermetrin 0.55 0.44 Dilkran Unknown 0.37 -
Trigard Cyromazine 1.10 1.10 Dvsh Unknown 0.37 -
Decis Deltamethrin 8.91 6.39 Hik Kwang Unknown 4.96 1.76
Pegasus Diafenthiuron 3.47 2.86 Kampung Unknown 0.37 -
Score Difenoconazole 1.28 - Kavidor Unknown 0.55 0.66
Proclaim Emamektin benzoat 4.57 2.64 Ousban Unknown 0.55 0.44
Thiotan Endosulfan 0.37 - Phitan Unknown - 1.98
Rubigan Fenarimol - 1.10 Pilaan Unknown - 0.66
Regent Fipronil 1.65 0.66 Pitvan Unknown - 0.44
Confidor Imidacloprid 3.29 0.66 Suks Unknown - 0.44
Dhithane Mancozeb 4.02 15.30 Supergo Unknown 2.56 1.98
Pilaram Maneb 0.73 - Vegsus Unknown 0.55 0.44
Ridomil Metalaxyl - 0.66 Vitame Unknown - 0.44
Tamaron Methamidophos 0.55 - Unnamed Unknown 2.19 2.42
- implies that the chemical was not used for the purpose specified in that column.
Usman Mustafa, Mubarik Ali, and Ir. Heny Kuswanti


ThailandUsman Mustafa, Mubarik Ali, Thongchai Satapornvorasak,
and Orasa Dissataporn
Introduction
ChiliisoneofthemajorandessentialingredientsinthedailyThaidiet.Thaislovespicyandhotfood.Thetrendforspicefoodisrisingfastinthecountry.Somefoodsaresohotthateventhemarketingresearchsectionwondershowpeoplecaneatthembuttheproducts are becoming very popular (Atthakor 2003).
Chiliisnotanativecrop,anddifferenthypothesisarepresentedaboutitsintroductionin the country. Some believe that Portuguese traders imported it during the Ayutthaya Period, in early 1511. Another assumed that chili came in the region during the King Songtham and King Narai era (1723), when trade was active with many countries such as China, India, Malaysia and western countries (WSN 2001).
Thailand has vast natural resources; it consists of a land area of 51.3 million ha, of which about 19.4 million ha (37.7%) is under permanent crops (OAE 2001). In 2003, the total area under chili was about 72 thousands ha with a total production of 420 thousands t (Table 1). Chili occupies 17.6% of the total area under vegetables including spices.
The country is geographically divided into four regions and 76 administrative provinces. These regions are Northern, Northeastern, Central Plains, and Southern. The Central Plain region is the largest region; therefore, the Department of Agricultural Extension foritsadministrativefunctionhasdivideditintoCentral,EasternandWesternregions(Dissataporn 2002). The major production areas of chili are in the Northeastern and Northern parts of Thailand, which comprise 59.4% and 18.5% respectively of the total productionareaofthecountry.TheproductionareasintheWestern,SouthernandCentralparts make up 15.4%, 2.5%, and 3.4% respectively, of the total production area. The majorchiligrowingprovincesareNakhonRatchasima,Chaiyaphum,SiSaKetinthenortheastern, Kanchanaburi and Ratchaburi in the western, and Phetchabun and Chiang MaiintheNorthernprovince.
Growing chilies is a labor-intensive activity; it provides employment to families who are engagedinallaspectsoftheenterprise:propagation,production,harvesting,marketingpreparation and even selling (FAO 1999). It is the only high-value crop grown in the rainfedareasbya largenumberofpoor farmers; therefore,allof itsproductionandmarketing aspects are crucial for their livelihood. Chili production is increasinglyshiftingfromanessentiallysubsistencefarmingtoacommercialventureandbecominga source of revenue for thousands of families in urban, peri-urban and rural communities inThailand.

199
DespitetheimportanceofchilianditsproductsintheThaidietandtheirroleingeneratingincomeforfarmersandotherstakeholdersinthefoodchain,nocomprehensivestudywasavailableontheissuesinthechilisectorasthecommoditymovesfromthefarmto consumers table. This study intended to fill this gap by conducting comprehensive surveysfromvariousstakeholdersinthefoodchainandanalyzingthedatafromsecondarysources.
Table 1. Chili area, production, and yield, by province, Thailand, 2002Region/province Area (ha) Production (t) Yield (kg/ha)
Northern 13,937 119,759 8.6Phetchabun 2,509 14,819 5.9Chiang Mai 2,334 23,779 10.2Nakhon Sawan 2,000 20,981 10.5Sukhothai 1,621 11,291 7.0Others 5,472 48,889 8.9Northeastern 44,735 229,270 5.1Nakhon Ratchasima 17,510 54,287 3.1Chaiyaphum 11,747 62,444 5.3Si Sa Ket 6,135 32,485 5.3Others 9,343 80,054 8.6Central Plain 2,595 14,131 5.4Eastern 597 3,333 5.6Western 11,575 70,195 6.1Kanchanaburi 5,968 18,242 3.1Ratchaburi 2,692 30,665 11.4Others 2,915 21,288 7.3Southern 1,888 7,775 4.1Total (2002) 75,327 444,463 5.9Total (2003) 72,000 420,000 5.8
Source: Official files of Department of Agricultural Extension (DOAE), Statistics of Individual Vegetable Growing for the Year 2001- 2003, Bangkok, Thailand.
Primary Data Collection
The total sample of 250 farmers was proportionately allocated to the three major chili-producing regions based on the share of each region in the total chili area. Primary data on variousaspectsrelatedtoproduction,consumption,marketing,andprocessingofchiliandproductionofcompetingcropswerecollectedfromChiangMaiandSukhothaiprovincesof Northern Region, Ubon Ratchathani, Si Sa Ket and Chaiyaphum of Northeastern Region and Suphan Buri and Kanchanaburi of Central Plain Region of the country.
Usman Mustafa, Mubarik Ali, Thongchai Satapornvorasak, and Orasa Dissataporn

200
One to two major chili-growing districts were chosen from each province and at least twotothreevillageswereselectedfromeachdistrictinconsultationwiththeprovincialDepartment of Agricultural Extension. In each village, 10-25 chili and two to five non-chili farmers and housewives were interviewed. A total of 21 villages were visited by the survey team. The survey was conducted in December 2002 and January 2003 covering the2002cropproductionaspects.
A total of 255 chili and 30 non-chili adjacent farmers were interviewed (Table 2).1
Production data were collected by parcel covering a total of 486 chili and 52 non-chili parcels. A total of 267 housewives in rural areas and 40 housewives in urban areas were interviewedon theirpreferences for chili and itsproducts.Three chili processors inBangkok, and 11 marketing agents were also interviewed to study the chili marketing channelsandprocessingpractices.
1 We took five extra sample to cover unsatisfactory case, if any.
Table 2. Frequency distribution of the sample farmers and parcels by farmer type and region, Thailand, 2002
Type of respondent Northern region Northeastern region Central Plain region Total
Chili farmer 45 191 19 255
Non-chili farmer 14 13 3 30
Farmers housewives 42 195 30 267
City housewives (Bangkok) 40
Chili processors (Bangkok) 3
Market agents 2 8 1 11
Macro Trends
Production
The annual growth in chili production was at around two percent per annum from 1991-2003 (Table 3). The growth in area contributed mainly to this increase while per ha yield remained almost stagnant over this period at a low level of around 6.0 t/ha. The value of chili fluctuated between THB 2.5 billion in 1993 to THB 12.7 billion in 1999, suggesting large variations in production and farm prices. The farm value in 2003 was THB 5.5 billion (US$136 million).
Thailand

201Usman Mustafa, Mubarik Ali, Thongchai Satapornvorasak, and Orasa Dissataporn
0
20
40
60
Shar
e(%
)
Bird chilies (length <=2 cm) Chilies (length 2-5 cm)
Long chilies (length >5 cm) Bell or sweet pepper
Table 3. Chili area, production, yield, and farm value, Thailand, 1992-2003
Crop yearPlanted area
(ha)Production (fresh weight) 1
(t)Yield/ha (fresh weight) 1
(kg/ha)Farm value2
(Million THB)1991 73,542 488,310 6.6 4,9321992 77,357 454,633 5.9 5,2281993 66,212 393,350 5.9 2,5171994 68,248 369,176 5.4 4,3191995 75,237 358,731 4.8 3,9101996 81,644 398,655 4.9 3,7071997 98,545 511,312 5.2 6,7491998 110,678 620,409 5.6 9,9271999 125,875 744,700 5.9 12,6602000 96,573 602,430 6.2 10,1812001 89,833 538,127 6.0 8,3952002 75,327 444,463 5.9 5,6892003 72,000 420,000 5.8 5,460
Annual growth (%) 1.83 1.98 0.15 6.45
Source: Official files of DOAE, Statistics of Individual Vegetable Growing (various issues), Bangkok, Thailand.1The area and production include small, bird, big chili and sweet pepper. The pimento production reported in dry weight was converted into fresh weight by multiplying it with four. 2Estimated using the FAOSTAT-Agriculture (producers’ price) data. The prices for sweet chili were taken from Indonesia data. The prices in local currency were converted using the exchange rate reported in www.fftc.agnet.org (various issues).
Production Types
Medium-sized chili with a length of more than two to five cm is the major form produced in Thailand contributing more than one-half of the total production. This is followed by long-sized and bird chili with the size of greater than five cm and less than or equal to two cm contributing 24% and 17% in total production, respectively. The contribution of sweet pepper in the total production is small at less than 3% (Figure 1).
Source: Department of Agriculture, Ministry of Agriculture & Co-operatives, Bangkok, Thailand, 2002.
Figure 1. Distribution of chili production by shape/length in 2001-2002

202
International Trade in Chili
The international trade of chili from Thailand experienced a turnover in 1991-2003. While its imported quantities and values increased at 17.3% and 16.4% per annum, respectively, no significant trend was observed in exported quantities and values during these years (Table 4). These trends converted the country into a net importer from a net exporter of chili in the early 1990s. The highest positive trade surplus of US$4.5 million was achieved in 1992. In 2003, it exported 16.1 thousand t of fresh chili worth of US$4.1 million, and imported 76.2 thousand t worth US$11.1 million. This left a trade gap of US$7.1 million. The major chili exporting countries to Thailand in 2000-2002 were MalaysiaandSingapore.Interestingly,MalaysiawasalsothemajorimportingcountryofThaichiliin2002.
Althoughthecountrybecameanetimporteroffreshchili,ithasexpandeditstradeinvalue-added products such as chili sauce. For example, in 2001, the country exported 14.8 thousand t of chili sauces worth US$16 million, up from 7.4 thousand t worth US$8 million in 1997 (DOA 2001). If processed chili items are included, the country is consideredanetexporterinchilitrade.
Table 4. International trade in chili, Thailand, 1991-2003
YearImport Export Total trade Trade surplus
Quantity(t)
Value (1000 $)
Quantity(t)
Value(1000 $)
Quantity(t)
Value(1000 $)
Quantity(t)
Value(1000 $)
1991 8,792 1,432 12,407 3,761 21,199 5,193 3,615 2,329
1992 7,104 1,119 16,099 5,606 23,203 6,725 8,995 4,487
1993 10,542 1,648 19,921 5,759 30,463 7,407 9,379 4,111
1994 21,720 3,452 16,743 4,209 38,463 7,661 -4,977 757
1995 8,201 1,404 12,722 4,392 20,923 5,796 4,521 2,988
1996 13,750 2,298 10,689 4,302 24,439 6,600 -3,061 2,004
1997 20,339 2,691 14,198 4,296 34,537 6,987 -6,141 1,605
1998 16,337 2,254 12,603 3,458 28,940 5,712 -3,734 1,204
1999 18,602 2,554 17,183 4,571 35,785 7,125 -1,419 2,017
2000 31,315 4,549 12,615 3,781 43,930 8,330 -18,700 -768
2001 37,055 5,787 14,546 4,000 51,601 9,787 -22,509 -1,787
2002 58,953 9,097 13,172 3,385 72,125 12,482 -45,781 -5,712
2003 76,234 11,129 16,103 4,053 92,337 15,182 -60,131 -7,076
Growth rate (%) 17.3* 16.4* -0.4ns -2.2 ns 10.0* 6.1* - -
Source: FAO-Agricultural data (Agriculture and Food Trade-Crop and Livestock Primary and Processed). The trade quantity of dry chili and allspice was converted into fresh weight by multiplying it with a factor of four. The * on the figures in the last row suggest that the growth is significant, while ns implies that these growth is not significant at 10% level.
Thailand

203Usman Mustafa, Mubarik Ali, Thongchai Satapornvorasak, and Orasa Dissataporn
80
100
120
140
Jan Feb Mar Apr May Jun Jul Aug Sep Oct Nov Dec
Aver
age
pric
ein
dex
0.1
0.2
0.3
0.4
1991 1992 1993 1994 1995 1996 1997 1998 1999 2000 2001 2002 2003
Year
Price
(US$
/kg) Export
Import
Thailand is exporting high-value chili products, while importing low-priced chilies. However,Thailand’scompetitivenessintheexportmarketofchiliisimprovingwiththedeclineinitsexportpriceswhileimportpricesremainedstagnantovertheperiod(Figure 2). Although export prices are still higher than import prices, most of the difference maybeduetodifferenceinquality.
Source: Estimated from import and export quantity and value figures in Table 4.
Figure 2. Trend in import and export prices of chili in Thailand, 1991-2003
Seasonality in Supply
TheindexofretailpricesofchilistartsincreasinginMarchandreachesitsmaximumin June when it starts declining (Figure 3). The extent of seasonality, defined as the percentage difference in the maximum and minimum prices, stands at 25%. The seasonality in chili prices in 1998-2000 dropped dramatically from 94% from 1989-1993 as reported by Sootsukon et al. (2000). This may be due to the spread of cultivation time andimprovementinthetransportandstorageinfrastructure.
Source: Estimated from the retail price data reported at http://www.dit.go.th
Figure 3. Seasonality in chili retail prices in Thailand, 1998-2000

204
Climatic Situation
The rainfall patterns are very similar across the sample regions. May to October is heavilyrainy,FebruarytoAprilmoderatelyrainy,andDecemberandJanuaryisalmostdry season (Figure 4a). The Northeastern Region has lower and almost constant (22oC)temperature, while the temperature in the Central and Northern Region ranges 27~29
oC (Figure 4b).
Source: Downloaded from "http://www.weatherbase.com/weather/city.php3?c=ID&refer=" and then type city name
Figure 4. Mean monthly rainfall and temperature in the study areas in Thailand
Farm and Farmer Characteristics
Socioeconomic Characteristics
The household head of chili farms in the sample areas were slightly younger than non-chili farms, although the difference was not statistically significant; both groups had almost the same family size and had similar available family labor force in the farm (Table 5). Theyalsohadsimilarfarmsize,althoughchilifarmersownedlargerareabutrentedsmallerfarms,hadmorefragmentedfarms,andlowerlanduseandcroppingintensities,although the difference was not statistically significant in the later two parameter values. Interestingly, chili farmers’ level of education was higher than non-chili farmers, had higher source of non-agricultural income and their farms were farther from paved roads. Bothtypesoffarmspossessedsimilaragriculturalexperience,butchilifarmersownedmorewaterpumpsandsprayers.
0
400
800
1200
1600
2000
Jan Feb Mar Apr May Jun Jul Aug Sept Oct Nov Dec
Rain
fall(
mm
)
Central Northern Northeastern
20
22
24
26
28
30
Jan Feb Mar Apr May Jun Jul Aug Sep Oct Nov Dec
Tem
pera
ture
(o C)
Central Northern Northeastern
Thailand
a. Rainfall
b. Temperature

205Usman Mustafa, Mubarik Ali, Thongchai Satapornvorasak, and Orasa Dissataporn
Table 5. Household characteristics of chili and non-chili growing farm in the sample areas, Thailand, 2002
Characteristics Chili farmer Non-chili farmer
Age of the farmer (years) 46.8a 49.3a
Family size (number) 3.8a 4.1a
Time spent in agriculture (%) 77.5a 75.5a
Farm size (ha) 4.1a 4.2a
Owned 3.6a 2.9b
Rented 0.5b 1.3a
Fragment (number) 2.1a 1.7b
Cultivated area (ha) 2.8a 3.2a
Chili area (ha) 0.26 -
Land use intensity (%) 73a 78a
Cropping intensity (%) 103a 115a
Education (schooling years, head of the household) 5.2a 4.0b
Off-farm income (000 THB/year1) 425 a 1,679a
Distance from paved road (km) 1.5a 0.6b
Distance from nearest vegetable market (km) 9.2a 8.3a
Agricultural experience (years) 27.4a 30.0a
Chili production experience (years) 11.2 -
Ownership of farm equipment (% of farmers)
Water pump 57a 40b
Sprayer 69a 53b
Power tiller and tractor 60a 43a
Ownership of motorbike (% of farmers) 68a 70a
Ownership of car (% of farmers) 37a 47a
Ownership of livestock (number)
Hen and duck 11.8a 1.3b
Cow and draft bullocks 1.10a 0.16b
Standard Animal Unit (SAU2) 2.81a 1.51b
1 One US$= 40.43 THB.2 The SAU was estimated as: 0.93 buffalo +1.08 cow + 0.5 pig + 0.19 goat + 0.4 young sock+ 0.75.donkey. Different superscripts in a row imply significant difference between chili and non-chili farmers at 10% level.
Thepercentageoffarmershavingmotorbike,themainsourceoftransportationinthearea,wassimilaracrossthetwogroups.

206
House and Household Belongings
Only two percent of the chili farmers and 10% of non-chili farmers rented houses (Table 6). The total house area was higher but cover area was almost the same in the formergroup.Alowerpercentageofchilifarmershadbrickedorcementedhouse,butthey generally possessed more household belongings compared to non-chili farmer. They alsohadloweraccesstogovernmentwatersupplysystemandprivatepumps.
Table 6. Household living conditions and home appliances owned by chili and non-chili farmers in the sample areas, Thailand, 2002
Characteristics Chili farmer Non-chili farmerHouse status (%) Own 98 90 Rented 2 10House area (m2) Covered area 207 206 Total area 887 795House condition (%) Below average 20 20 Average 61 70 Above average 19 10House construction (%) Mud, local stone 67 40 Bricked, cemented 33 60Household belonging (no.) TV 1.09 0.87 Radio 0.39 0.90 Cassette player 0.69 0.40 Refrigerator 0.78 0.70 Stove 0.82 0.43Source of drinking water (% of farmers) Government water supply 12 27 Private pump 9 27 Open well/artisan well/others 79 46
Thailand

207Usman Mustafa, Mubarik Ali, Thongchai Satapornvorasak, and Orasa Dissataporn
Land Form, Drainage, and Soil Texture
Thedistributionofsoilstructure,landdrainagesituation,andslopeofthelandwerenotsignificantly different across chili and non-chili farms (Table 7).
Table 7. Land form, drainage, and soil texture in the sample areas by chili type, Thailand, 2002
Characteristics Chili farmer Non-chili farmer
Soil texture (%) Heavy 49 33 Medium 44 57 Light 7 10Drainage (%) Well drained 51 47 Medium drained 35 44 Poorly drained 14 9Land form (%) Slope with terrace 7 3 Slope without terrace 17 4 Plain on the river bed 27 53 Plain away from the river bank 49 40
Varieties and Cropping Pattern
Chili Varieties
The majority of the sample chili farmers (81%) cultivated improved open pollinated varieties, which include Jin-da, Yod-son and Hua-rea (Table 8). Only eight percent of farmers, concentrated mainly in Nakhon Phan province of Northeastern and Chiang Mai province of Northern Regions, used local varieties, which include Rod, Tae, Sai-pla-rai and Doikai;sixpercentcultivatedsweetpeppervarietiesofGadaandHotBeauty.Themainhybrid varieties were Tango, Jomthong and Mon cultivated by five percent of farmers. All the sweet pepper and 90% of hybrid chili farmers in the sample areas were found in ChiangMaiprovinceofNorthernRegion.Allthesweetchilifarmerswerefromthesamelocality. They were all organized into a co-operative that purchased inputs collectively andsupplyoutputstosupermarketsandThaiAirLines.

208
Table 8. Chili varieties planted in the sample areas, by chili type, Thailand, 2002
Chili type Name of variety Percentage of parcels1
Hybrid 5Tango 2Jomthong 2Mon 1
Open pollinated 81Jin-da 35Yod-son 30
Local 8Rod 4Tae 2Sai-pla-rai 1Doikai 1
Sweet 6Gada 4Hot Beauty 2
1 Total number of parcels is 486.
Intercrops and Crop Rotation
In Thailand chili was mainly cultivated as a single crop. About 86.9% parcels were single cropped, and 13.1% of only open pollinated type was intercropped. Red shallots and maize were the main crops used for intercropping (Table 9). Table 9. Intercropping in the sample areas, by chili type, Thailand, 2002
IntercropPercentage of parcels1
Hybrid Open pollinated Local Sweet OverallChili alone 4.0 68.3 8.3 6.3 86.9Chili with one other crop - 13.1 - - 13.1
Red shallot (onion) - 6.3 - - 6.3Maize - 2.4 - - 2.4Cabbage - 0.8 - - 0.8Coriander - 1.2 - - 1.2Soybean - 0.8 - - 0.8Garlic - 0.8 - - 0.8Other - 0.8 - - 0.8
Total 4.0 81.4 8.3 6.3 100.01 Total number of parcels is 486.
Thailand

209Usman Mustafa, Mubarik Ali, Thongchai Satapornvorasak, and Orasa Dissataporn
The main chili-based rotations in the sample area were chili-rice-chili, chili-fallow-chili, and chili-corn-chili (Table 10). The major rotation in hybrid was chili-corn-chili, while chili-rice-chili was the major rotation in open pollinated and local chili types.
Table 10. Chili-based crop rotation in the sample areas, by chili type, Thailand, 2002
Chili farmer Crop rotation Percentage of parcel1
Hybrid Chili – Fallow – Chili 10Chili – Rice – Chili 30Chili – Corn – Chili 50Chili – Other – Chili 10
Open pollinated Chili – Fallow – Chili 18Chili – Rice – Chili 56Chili – Red shallot – Chili 7Chili – Corn – Chili 11Chili – Other – Chili 8
Local Chili – Rice – Chili 38Chili – Corn – Chili 33Chili – Other – Chili 20Chili – Fallow – Chili 9
Sweet pepper Chili – Fallow – Chili 100
Overall Chili – Rice – Chili 53Chili – Fallow – Chili 17Chili – Other – Chili 16Chili – Corn – Chili 14
1 Total number of parcels is 486.
Cropping Pattern
Commercial crops occupied the majority of area on both chili and non-chili farms (38% and 57%) (Table 11). Chili farmers allocated more area under vegetables including chili (9+7=16%) but less to commercial crops compared to non-chili farmers (5%). They also allocatedproportionatelymoreareaforcereal,whichincludedmainlycornforchiliandrice for non-chili farmers.

210
Table 11. Cropping pattern in the sample areas, by chili type, Thailand, 2002
Crop group1 Chili farmer Non-chili farmer
Area (ha) Share (%) Area (ha) Share (%)Chili 0.26 9 - -Other vegetables 0.20 7 0.18 5Cereals 0.64 22 0.33 9Commercial crop 1.10 38 2.11 57Beans and pulses 0.26 9 0.22 6Others 0.43 15 0.85 23Total cropped area (ha) 2.89 100 3.69 100
1Cereals include rice and corn; Commercial crops include flower, cassava, sugarcane; Beans and pulses include soybean; Others include fruits, tobacco, and cassava.
Cultivating and Harvesting Time
Thechilicultivatingandharvestingtimesvariedgreatlydependinguponthegeographicalarea,irrigationcondition,andseasons.ThemajorgrowingseasonstartedinMay,exceptfor hybrid chilies where planting time on average started at the end of August (Table 12). Harvesting started in October for open pollinated and local type chili, September for sweetpepper,andJanuaryforhybrids.Amonghotchilies,localvarietieshadthelongestspan.Thehybridsnotonlyreducedthegrowingseasonandharvestingspan,butalsoenabled farmers to produce chili during the off-season for higher prices
Table 12. Cultivation and harvesting time (week and month) in the sample areas, by chili type, Thailand, 2002
Chili farmer Planting time Start of harvesting time End of harvesting time
Hybrid 3rd August 1st February 2nd AprilOpen pollinated 3rd May 4th October 4th JanuaryLocal 1st May 2nd October 1st FebruaryOverall 2nd May 2nd October 4th JanuarySweet 2nd May 3rd September 2nd December
Thailand

211Usman Mustafa, Mubarik Ali, Thongchai Satapornvorasak, and Orasa Dissataporn
Information Source
Seed
Overall, the major sources of seed-related information were the neighboring farmers, friends, village retailers, and extension workers (Table 13). In sweet pepper, village cooperatives,extensionworkers,andvillageretailerswereallimportantsources,whilevillageretailersandneighboringfarmerswerethemajorsourcesforfarmersofopenpollinatedandhybridvarieties.Forlocalvarietiesfewfarmersgotinformationonlyfromgovernmentseedstore.
Table 13. Seed-related source of information in the sample areas, by farmer type, Thailand, 2002
Chili farmerSource of information about seed (% of farmer)
Extension worker Village retailer Neighboring farmer Government seed store
Hybrid 10 25 50 15
Open pollinated 17 42 33 8
Local 0 0 0 5
Sweet 31 25 44** 0
Overall 21 32 37 10** Village cooperative.
Market Information
Allfarmerswhogrowhotchilirankedtradersormiddlementowhomtheyalsoselltheir chili output as the number one source of information (Table 14). They ranked neighboringfarmersasthesecondmajorsourceofinformationfollowedbyfarmercooperativeassociations,governmentdepartmentsandradios.Sweetpeppergrowersrankedfarmers’associationsastoprankinginformationsourcefollowedbytradersandneighboringfarmers.
Table 14. Ranking of market information sources in the sample areas by farmer type, Thailand, 2002
Chili farmer Trader Neighboring farmer
Farmers’ association
Government department Radio
Hybrid 1 2 3 4 -
Open pollinated 1 2 4 3 -
Local 1 2 - 3 4
Sweet 2 3 1 4 -
Overall 1 2 3 4 5Note: 1=highest rank, and 5=lowest rank

212
Seed Selection
Abilitytofetchhighmarketpriceswasthenumberonecriterionintheselectionofchiliseed, regardless of its type (Table 15). The second characteristics preferred were high yield,alsoinallchilitypes,exceptingreenwherefarmersconsideredhighnumberofpodsassecondmostdesirablecharacteristic.Attractivechilicolorwasplacedasthirdrankingcriterionbyalltypesofchilifarmers,againexceptingreenchiliwhereyieldwasrankedfourth.Itshouldbenotedthatinsectsanddiseaseswererankedverylow.
Table 15. Ranking of factors considered in the selection of chili seed in the sample areas, by chili type and product, Thailand, 2002
Characteristics Green Red Sweet Powder
Market price 1 1 1 1Yield 3 2 2 2Disease - - - 6Insect free 5 4 4 -Chili color 4 3 3 3Number of pods 2 - - -Fragrance - - - 5Hotness 6 5 - 4Freshness - - 5 -
Insect and Pest Problem
Insects
A vast majority of farmers reported insect problems.The insect problem was moresevere in hybrid than other chili types (Table 16). Sweet pepper grown in shade houses/tunnels had the lowest insect problem. Overall, thrips and caterpillar were reported as most frequently-occurring insects by 30% and 27% farmers, respectively. Either one of these two insects was more widely-spread regardless of varieties. Mite was also widely encountered by more than 20% hybrid chili and sweet pepper farmers.
Thrips was ranked as the most problematic insect in all chili types, except in openpollinated where caterpillar was ranked as number one insect. Number two rankinginsectwasmiteinlocalchiliandsweetpepper,caterpillarinhybrid,andthripsinopenpollinatedtype.Thenumberthreerankinginsectwasmitesinhybridandopenpollinated,andaphidsinlocalchiliandsweetpepper.
Insectswereaprobleminchilicultivationalmosteveryyear.Averageannuallossesdueto insect were 24% in 1998-2002. The losses were lowest in sweet pepper and highest in hybrid.According to farmers’ perception, the losses due to insect had increasedovertime.
Note: 1=highest rank, and 6=lowest rank.
Thailand

213Usman Mustafa, Mubarik Ali, Thongchai Satapornvorasak, and Orasa Dissataporn
Table 16. Major insects and extent of losses due to insects in chili in the sample areas, by chili type, Thailand, 2002
Chili typeInsect
problem (%)
Farmers reporting insects as problem (%) Rank1 Occurrence
(years out of 5)Average losses
(%)
T C M A MB Other 1 2 3 4 1993-1997 1998-2002 1993-1997 1998-2002Hybrid 90 19 35 27 8 4 7 T C M - 4.6 4.8 18 28
Open pollinated 70 31 27 16 17 3 6 C T M A 4.6 4.4 13 25
Local 75 29 23 17 13 6 12 T M A C 4.7 4.7 10 20
Sweet 69 32 26 24 15 3 0 T M A - - 2.0 - 12
Overall 71 30 27 17 16 3 7 C T M A 4.6 4.3 13 24
Note: A=Aphids (Aphis gossypii); C=Caterpillar (Helicoverpa armigera and Spodoptera litura); M=Mites (Polyphagotarsonemus latus); MB= Mealy Bug (Planococcus sp. and/or Pseudococcus sp.) or White fly (Aleurodicus dispersus); T=Thrips (Scirtothrips dorsalis).
1The rank of 1 is the most devastating, and 4 the least devastating insect.
Diseases
Themajorityoffarmersalsoreporteddiseasesasaseriousproblem.However,theproblemwas less serious in sweet pepper than in other chili types (Table 17). Anthracnose, Fusariumwilt,viruses,bacterialspotandbacterialwiltwerethemostcommonlyoccurringdiseasesinthesampleareas.
Anthracnosewasrankedmostdevastatingdiseaseinallchilitypes,exceptinhybridwhereFusariumwiltwasrankedasnumberone.Fusariumwiltwasthesecondrankingdiseasein all chili types except in hybrids where anthracnose was ranked second (Table 17). Virusesinhybridsandopenpollinatedandbacterialspotinlocalchiliandsweetpepperwererankedthird.Thelossduetodiseaseswasaregularphenomenaoccurringevery
Table 17. Major chili diseases and extent of yield losses due to diseases in the sample areas, by chili type, Thailand, 2002
Chili typeDisease problem
(%)
Farmers reporting diseases (%) Rank1 Occurrence (yrs) Average losses
(%)
AN FU VS BS BW OT 1 2 3 4 1993-1997 1998-2002 1993-1997 1998-2002
Hybrid 80 20 27 23 17 13 0 FU AN VS BW 2.5 4.1 16.2 31.1
Open pollinated 82 39 22 14 11 8 6 AN FU VS BW 2.5 4.1 15.7 31.5
Local 75 38 17 14 7 14 10 AN FU BS VS 2.2 4.2 15.7 41.0
Sweet 50 26 16 10 9 13 26 AN FU BS - 0 1.1 0 13.2
Overall 78 37 22 14 11 9 7 AN FU VS BW 2.3 3.9 15.0 30.8Note: AN=Anthracnose (Colletotrichum acutatum, C. capsici and C. gloeosporioides); FU= Fusarium wilt (Fusarium
oxysporum f. sp. Capsici and Fusarium solani); VS= Virus; BW=Bacterial wilt (Ralstonia solanacearum); BS=Bacterial spot (Xanthomonas campestris pv. Vesicatoria); OT=Other.
1The rank of 1 is the most devastating, and 4 the least devastating disease.

214
Weeds
Almost all farmers reported weed problems in chili fields. Overall, Dactylocteniumaegyptium,Pennisetumpolystachyon,AmaranthusgracilisandCyperusrotunduswereidentified as most commonly occurring weeds (Table 18).
Table 18. Major weeds and extent of losses due to weeds in chili in the sample areas, by chili type, Thailand, 2002
Chili typeWeed problem
(%)Farmers reporting
weed (%)Rank Occurrence
(yrs)Average losses
(%)
DA AM PE CR OT 1 2 3 4 1993-1997 1998-2002 1993-1997 1998-2002
Hybrid 100 6 60 5 10 19 AM CR DA PE 3.6 4.6 3.1 3.9
Open pollinated 92 22 7 12 9 50 DA PE CR AM 3.2 4.7 7.1 11.2
Local 90 22 7 2 6 63 DA AM PE CR 3.1 4.2 7.0 15.0
Sweet 93 40 13 - - 47 DA AM - - - 5.0 - 10.0
Overall 97 24 9 12 8 47 DA PE CR AM 3.1 4.6 6.7 10.8
Note: DA=Dactyloctenium aegyptium, AM=Amaranthus gracilis, PE=Pennisetum polystachyon, CR=Cyperus rotundus, OT=Other weeds.
Dactylocteniumaegyptiumwasrankedasthemostdevastatingweedinallchilitypes,exceptinhybridwhereitwasrankedthirdandAmaranthusgracilis was ranked first. Amaranthus gracilis was ranked as second in local and sweet pepper, Pennisetumpolystachyon in open pollinated, and Cyperus rotundus in hybrid. Dactylocteniumaegyptium belongs to the monocotyledonous weeds type family while Amaranthusgracilis belongs to dicotyledonous family of weeds. Other weeds found in chili fields in the study area are reported in Appendix 1.
Weedsarebecomingaregularprobleminchilicultivation.Averageweedlossesinoneseason were reported at 11%, which had increased from 7% in the last five years.
Farm Management Practices
Preparation of Nursery Seedling
All farmers in the sample area practiced transplanting and none used direct-seeding to growchilicrop.Therefore,allfarmerspreparednurseries.Forthispurpose,seedbedsof size 1 x 5-20 m depending upon the area to be cultivated, were prepared in fields close to a water source. Approximately 10-15 m2ofseedbedareawasneededforonerai (0.16 ha) of planting. The soil was broken into small granules using broad blade hoe.
four in five years. The average loss in a season, as perceived by farmers, was 31% in 1998-2002, which had increased from 15% from 1993-1997. The frequency of occurrence hadalsoincreasedovertime.
Thailand

215Usman Mustafa, Mubarik Ali, Thongchai Satapornvorasak, and Orasa Dissataporn
Itwasploughed;thesurfacewassmoothedandallowedtodryforthreetosevendays.Seeds were broadcasted, then mulched with rice stubs and dry rice-straw. The bed was watereddaily.Themulchwasremovedsevendaysaftersowing.
Seed Treatment
Seed soaking or dusting was not common; 12% sample farmers, only in open pollinated and local types, practiced seed soaking before sowing for an average of 0.3 hours (Table 19). Only 6% of farmers used seed dusting mainly in open pollinated chili type using an average of 0.11 kg chemical for one ha seed. Copper Hydroxide, Mancozeb, Captan (all fungicides)werethemainchemicalsusedinseedtreatment.
Table 19. Seed treatment by chili type, Thailand, 2002
Chili farmer Soaking Dusting
% Farmer Hours % Farmer Chemical (kg)Hybrid 0 - 0 -Open pollinated 13 0.32 7 0.11Local 18 0.38 1 0.60Sweet 0 - 0 -Overall 12 0.33 6 0.11
Nursery and Field Soil Treatment
Only 19% chili nursery and six percent chili fields were treated with chemicals to control soil-borne diseases, such as damping off (Table 20). No soil treatment was applied to local chili fields. Farmers mainly mixed the chemical with irrigation water for soil treatment. However,placementinopenpollinatedandbroadcastinlocalchilitypeswerethemainmethods of chemical application for soil treatment. An average of five kg or liter per ha of chemical was used for soil treatment in nursery, and 233 kg- or liter/ha for chili fields with some variation across chili types. The most commonly used chemicals were lime (to improve soil health), Methomyl (insecticide), and Lambda Cyhalothrin (insecticide).
Table 20. Nursery and field soil treatment in the sample areas, by farmer type, Thailand, 2002
Chili farmerFarmers using
the treatment (%)Chemical used
(kg or l/ha)Method of soil treatment
(%)Nursery Field Nursery Field Broadcast Placement Mixed with irrigation Spray
Hybrid 10 10 19 40 10 20 60 10Open pollinated 21 6 4 212 10 50 30 10Local 13 0 5 0 83 0 0 17Sweet* 14 10 13 342 20 6 74 0Overall 19 6 5 233 11 22 59 8
* Only for nursery soil, crop is in the hydroponics system.

Chili farmerBed type (% of parcels) Furrow or raised bed structure (cm)
Furrow Raised Flat Height Width Plant-to-plant distance
Row-to-row distance
Hybrid 0 80 20 39 106 43 49Open pollinated 14 51 35 24 260 38 75Local 5 57 38 24 138 37 89Sweet 0 0 100 0 0 48 111Overall 13 53 34 25 217 38 75
216
Land Preparation
Tractorsandanimalswerethemainsourceofpowerforplowing.Somesmallfarmersalso prepared land manually. On average, farmers made 1.4 plowings (Table 21). In sweetchilinolandpreparationwasdone,becauseitwascultivatedunderhydroponicssystem on flat land which was prepared only once; the same bed may be used for the subsequentcroppings.
Chili typePercentage of parcels Number of
operationsPlowing Harrowing
Plowing HarrowingHand Animal Tractor Others1 Total Hand Animal Tractor Power tiller Total
Hybrid - 10 90 - 100 70 5 15 10 100 1.5 9.1Open pollinated 5 20 70 5 100 80 8 9 5 100 1.3 8.2Local 5 25 65 5 100 85 5 5 5 100 1.4 7.3Sweet - - - - - - - - - - - -Overall 3 17 68 2 100 75 6 14 5 100 1.4 7.9
1Others mean tractor+animal.
Allchilifarmerspracticedaroundeightharrowings,mainlybyhand,followedbytractors,animals,andpowertillers.Thehighestnumberofharrowingswerepracticedinhybridsfollowedbyopenpollinatedandlocalchilies.Duetothepeculiarcharacteristicsofsweetpeppercultivation,noharrowingwaspracticed.
Bed Type
Majority of chili fields, especially hybrid, had raised beds. However, one-third of the chili fields were flat, and 13% mainly in open pollinated had furrows (Table 22). All sweet chili fields were flat in the hydroponics system.
On average, the furrow or raised bed height, width, plant-to-plant and row-to-row distances were 25, 217, 38 and 75 cm, respectively with some variation across chili types. The row-row and plant-plant distance was highest in sweet chili.
Table 22. Bed type, height, width, plant–to-plant and row-to-row distance used in the sample areas, by farmer type, Thailand, 2002
Table 21. Land preparation method used in the sample areas, by chili type, Thailand, 2002
Thailand

217Usman Mustafa, Mubarik Ali, Thongchai Satapornvorasak, and Orasa Dissataporn
Mulching Material
Plastic sheets with an average life of two years were used only in sweet pepper fields in its hydroponics system. About one-third chili fields, mainly in hybrid and open pollinated, were mulched with straw (Table 23).
Table 23. Mulching material type and life used in the sample areas, by chili type, Thailand, 2002
Chili farmerPlastic sheet Rice straw
Farmer using (% of parcels) Life (months) (% of parcels)
Hybrid 0 0 40Open pollinated 0 0 34Local 0 0 14Overall 0 0 32Sweet 100 24 0
Irrigation Sources
Chili cultivation in Thailand is mainly under rainfed condition; only 40% chili fields received supplemental irrigation (Table 24). The main supplemental irrigation sources were tube well, tank/lake and canal. A significant proportion of parcels were irrigated usingacombinationofallthesesources.
Localandopenpollinatedvarietiesweremainlycultivatedundertherainfedsituationastheyweremoretoleranttowaterstress.However,hybridchiliandsweetpepperweremainlycultivatedunderirrigatedconditions.Themainsourcesofirrigationforhybridchiliwerecanalsandtubewellswhileirrigationforsweetpepperwasprovidedthroughthehydroponicssystem.
Manualpumpwasthemainmethodofirrigationfollowedbysprinkleirrigation;thelatterwasthesolemethodinsweetpepper.Floodingwithridgesandmanualpumpwerethemainirrigationmethodsforhybridchili.Manualpumpdominatedinopenpollinated,and flooding with and without ridges was used in equal proportion in local chili type.
Table 24. Irrigation methods and sources used in the sample areas, by chili type, Thailand, 2002
Chili farmer
Irrigation method (% of parcels) Irrigation source (% of parcels)Flooding
Manual (pump)
Sprinkle + trickle Canal Tube well Tank/
lake Rain MixedWithout ridges With ridges
Hybrid 11 56 33 0 30 40 0 10 20Open pollinated 0 6 78 16 3 9 10 60 18Local 53 47 0 0 5 0 0 81 14Overall 2 12 70 15 5 10 9 59 18Sweet 0 0 0 100 0 0 0 0 100**
** Hydroponics system.

218
Fertilizer Application
Only 28% of chili fields, mainly of hybrid and open pollinated types, were applied with organic fertilizers (Table 25). The low application may be due to the rainfed condition in which most chili fields were cultivated. The major organic fertilizer used was poultry manure, followed by cattle manure and mixed/compost.
Table 25. Organic fertilizer type and method of inorganic fertilizer application used in the sample areas, by chili type, Thailand, 2002
Chili type
Farmers using
manure (%)
Manure type (% of farmer)
Farmers using
inorganic fertilizer
(%)
Method of inorganic fertilizer application (% of farmer) Inorganic
fertilizer(number)Cattle Poultry Mixed Broadcast Placement Irrigation
Hybrid 31 60 14 26 100 10 50 40 3.5Open pollinated 30 33 57 10 94 31 43 26 3.3Local 10 33 - 67 81 64 24 12 3.2Overall 28 34 53 13 93 33 42 25 3.3Sweet - - - - 100 - - 100 *
* Hydroponics system.
Over 90% of farmers applied inorganic fertilizers to chili, while all hybrid and sweet pepper fields received inorganic fertilizers. In general, three applications of inorganic fertilizer were done which were equally split over 3rd,5th and 9thweeksaftertransplantation.Theapplicationof inorganic fertilizerwasmainly throughplacement inhybridandopenpollinated,broadcastinlocalandwithirrigationinsweetpepper.
Insect Control
All hybrid and sweet chili fields were sprayed with chemicals to control insects, and 76% and 55% open pollinated and local chili fields were also sprayed, respectively (Table 26).Avastmajorityoffarmersprayedsinglepesticide;lessthanonepercentonlyinopen pollinated applied mixture (cocktail) using an average of three pesticides. A total of 23 pesticides were used in the study area, each having a well-specified names of active ingredient.ThemostcommoninsecticidesreportedintheareawereMethamidophosandParathion methyl (Appendix 2). The use of insecticide was found to be partially effective at around 70% with little variation across chili types.
Table 26. Extent of insecticide use and their perceived effectiveness in the sample areas, by chili type, Thailand, 2002
Chili farmerFarmer applying (%) Effectiveness
(%)Single Cocktail
Hybrid 100 - 72
Open pollinated 75 0.8 70
Local 55 - 62
Overall 74 0.7 69
Sweet 100 - 75
Thailand

219Usman Mustafa, Mubarik Ali, Thongchai Satapornvorasak, and Orasa Dissataporn
Disease Control
Overall, more than half of chili fields were sprayed with fungicide to control diseases. Thefrequencyoffungicideapplicationtocontroldiseaseswashighestamongthehybridand sweet pepper farmers. A total of 13 chemicals with well-specified ingredient names wereappliedasfungicides,althoughsomeofthemwereinfactinsecticides.Themostcommon fungicide reported in the study area was Carbendazim and Mancozeb (Appendix 3). The effectiveness of fungicide was even less than the insecticide at 55% with little variation across chili types (Table 27).
Table 27. Extend of fungicide use and their perceived effectiveness in the sample areas, by chili type, Thailand, 2002
Chili farmerFarmer applying (%) Effectiveness
(%)Single Cocktail
Hybrid 90 - 69
Open pollinated 37 1 54
Local 45 - 58
Overall 40 1 55
Sweet 88 - 66
Weed Control
All chili fields were weeded except sweet chili because of their peculiar cultivation system.Bothmanualremovalandchemicalsprayswereusedtocontrolweeds,althoughmanual weeding dominated. Overall, 22% of parcels were treated with chemicals alone while 28% had both manual weeding and chemical treatments to eradicate weeds (Table 28). Seventy percent of hybrid fields had chemical treatments while 30% also had manual weeding. On average, four manual weedings and two chemical sprays were done in chili fields. Some farmers practiced up to eight weedings because of recurrence of weeds after each operation. The most commonly applied herbicides were Paraguat, Glayphosate,Difenoconazole,andAlachor.Theseweedingoperationswereveryeffectiveand controlled more than 90% of weeds.Table 28. Number of weeding, type, and their perceived effectiveness in the sample areas, by chili type, Thailand, 2002
Chili farmerPercentage of farmers Number of
weeding applications Effectiveness (%)Chemical Manual Chemical
+ manual Chemical
spray (no.) Manual (no.)
Hybrid 70 - 30 3.3 3.6 92Open pollinated 18 52 30 2.2 3.8 91Local 38 57 5 1.8 4.7 94Overall 22 50 28 2.2 3.9 91Sweet - - - - - -

220
Other Methods of Pest Control
Around 15% of farmers also reported that picking and destroying the plants with disease, weeding,intercropping,andfrequentpickinghelpedincontrollingtheinsectsanddiseasesin chili fields, although their effectiveness was not indicated.
Harvesting
On average, hot chili fields were harvested five times, while sweet pepper fields were harvested 41 times (Table 29). In general, family members did the harvesting; only one percent hot chili fields were harvested by hired labor, and 17% were harvested by engagingbothfamilyandhiredlabor.
Only sweet pepper fields (about one-third) were harvested exclusively using hired labor; other one-third of sweet pepper fields were harvested by family labor, and remaining one thirdbyengaginghiredlaboralongwithfamilylabor.
Table 29. Number of harvest and type of labor used in harvesting in the sample areas, by chili type, Thailand, 2002
Chili farmer Number ofharvest
Type of labor used (% of farmers)
Family labor Hired labor Both
Hybrid 13.0 50 - 50Open pollinated 3.8 86 3 11Local 16.1 60 - 40Overall 5.2 82 1 17Sweet 40.7 34 33 33
Chili Marketing
Marketing played a very significant role in the economic viability of various farm enterprises.This affected farmer’s production decisions. Marketing inThailand wasinfluenced by the product type, consumer’s preferences (reflected in terms of price) and geographic specialization of production (Kohls and Uhl 1998). These in turn affected the qualityoftheproduct,marketprices,andseasonalityintheavailabilityoftheproduct.
Marketing Constraints
Over 90% of sample farmers believed that middlemen exploited them because of their weak bargaining power. They believed that middlemen/commission agents were gettinghigherthanwhatwasduemarginsfortheservicestheyrenderedtofarmers.Theexploitationswereintheformoflowpriceandlittlepremiumforqualityandgrading.
Thailand

221Usman Mustafa, Mubarik Ali, Thongchai Satapornvorasak, and Orasa Dissataporn
Lackofcollectivebargainingpowerwasconsideredasthemajorchilimarketingconstraintby more than one-half of the sample farmers. Lack of active government participation in chili markets was considered a major constraint by another 28%. About 10% of farmers were not satisfied with the fluctuation of chili prices. The remaining farmers expressed otherconstraintssuchaslowprices,confusedmarketchannels,andothers.
The majority of farmers engaged in chili marketing were males, and only 16% were females.
Marketing Channels
Farmerssoldtheirchiliesmainlytolocaltraders,localmarkets,andfarmer’sassociations(Figure 5). In sweet chili, farmers sold all their products to their associations which directly sold the same to consumers (In Chiang Mai the association supplied a major portion of theirproducttoThaiAirLinescateringservicesinBangkok).
From the farmer’s association 60% of chilies were directly sold to the processing units while the remaining 40% went to the wholesalers at the province level. The local traders or commission agents sold 65% and 35% of their products to wholesalers at the province and district levels, respectively. From the local markets, 80% of chili flow to wholesale markets at the district level while the remaining 20% was distributed between retailers (90%) and directly to consumers (10%). The wholesalers from the provinces sold 75% to the processors and 25% to wholesalers in Bangkok. The wholesalers from the districts sold a major part (70%) to their counterparts in the provinces and the remaining 30% was distributed between wholesalers (65%) and retailers (35%) in Bangkok.
TheBangkokwholesalemarketisthebiggestinThailandwherechilifromthroughoutthecountry is brought. From this market, a major (90%) portion was sold to retailers while five percent each was sold to processors and exported to other countries. The processors exported a major portion (55%) of their products while a substantial amount (45%) was channeledtothewholesalermarketinBangkok.Fromthismarkettheproductsreachedconsumersthroughretailers.

Consumer
70%
55%
75%
60%30%
5%
65% 25%35%
5%
10%
90%90% 45%
20% 65%80%
6%72%22%
35%
40%
Local Market
Farmer
Local Trader/Comm. Agents Farmer’s Associations
Wholesaler(District)
Wholesaler(Province)
Wholesaler(Bangkok)
Processor
Export
Retailer
222
Figure 5. Chili marketing channels in the sample areas in Thailand, 2002
Thailand
Input Use
Seed Rate
Overall, 91% of hot-chili farmers produced seed in their own farms (Table 30). All hybrid and sweet chili seeds were purchased, while all local-type chili seeds were home-produced. Farmers used higher rate of their own-produced seeds compared to the purchased seeds in refilling the dying or weak seedling. It was highest for the open pollinated chili produced atownfarmandlowestforthepurchasedopenpollinatedchilies.

223Usman Mustafa, Mubarik Ali, Thongchai Satapornvorasak, and Orasa Dissataporn
Table 30. Seed rate and seed source in the sample areas, by chili type, Thailand, 2002
Chili farmerSeed rate (kg/ha) Seed source (% of farmers)
Own Purchase Total Own Purchase
Hybrid - 0.52 0.52 0 100
Open pollinated 2.74 1.60 2.68 95 5
Local 2.32 - 2.32 100 0
Overall 2.70 1.00 2.55 91 9
Sweet - 0.36 0.36 0 100
Fertilizer Use
The use of organic fertilizer in chili fields was not common in Thailand. Overall, 2.46 t/ha of organic fertilizer was used (Table 31). The highest quantity was used in open pollinated,andnomanurewasusedinsweetpepper.Cattlemanurewasmainlyused;poultry manure was used only in open pollinated, and a significant quantity of mixed manurewasalsousedinallchilitypes.
Inorganicfertilizersconsistingofnitrogen,phosphate,andpotash,wereappliedattherateof 61, 28 and 30 kg/ha, respectively, on hot-chili fields. Overall, the quantity of fertilizer appliedtochiliwaslessthaninothercountries,andlowerthantherecommendedlevel.Sweetchilireceivedthehighestamount,followedbyhybridandopenpollinatedchilitypes.Thelocalchili,expectedtobelessresponsivetofertilizer,receivedthelowestquantityofinorganicfertilizer.
Table 31. Extent and quantity of organic and inorganic fertilizer use in the sample areas, by chili type, Thailand, 2002
Chili farmerManure (t/ha) Inorganic fertilizer nutrient (kg/ha)
Cattle Poultry Mixed Total N P K Total
Hybrid 1.03 0.02 0.11 1.16 70 42 45 157Open pollinated 1.06 1.35 0.24 2.65 60 29 30 119Local 1.17 - 0.07 1.24 65 15 18 98Overall 1.06 1.17 0.23 2.46 61 28 30 119Sweet* - - - - 140 80 130 350
*Sweet chili was given liquid fertilizer because of its hydroponics system of cultivation. The amount applied was adjusted to dry form.

224
Insecticide
Overall, 2 kg or liter per ha of insecticide was applied to hot-chili fields and five sprays were done during the whole chili season (Table 32). The amount of insecticide applied washighestonsweetpepperandlowestonthelocalchilitype.However,numberofsprayswashighestforhybrid,andlowestforopenpollinatedchili.Themostcommoninsecticides used by the farmers were methamidophos, parathion methyl and Sulfur(Appendix 2).
Table 32. Quantity and number of sprays of insecticide used in the sample areas, by chili type, Thailand, 2002
Chili typeInsecticide
Total number of sprayL/ha Kg/ha Overall (kg or l/ha)a
Hybrid 1.8 1.6 3.4 16.6
Open pollinated 1.2 0.9 2.1 4.2
Local 0.4 1.1 1.4 5.2
Overall 1.2 1.0 2.0 4.8
Sweet 0.7 14.6 15.3 8.3a liquid and solid insecticide were combined by assuming one liter is equal to one kg.
Fungicide
Overall, 1.63 kg/l per ha of fungicide was used to control diseases in hot-chili by making about five sprays (Table 33). The application of fungicide by chili type was similarwithinsecticides;thehighestquantitywasappliedonsweetpepperandloweston open pollinated chili type. However, hybrid chili fields received the highest number of fungicidesprays.Themajor fungicidesappliedwerecarbendazim,mancozebandmetalaxyl (Appendix 3).
Table 33. Quantity and number of sprays of fungicide in the sample areas, by chili type, Thailand, 2002
Chili typeChemical
Total number of sprayL/ha Kg/ha Overall (kg or l/ha)a
Hybrid 1.16 2.10 3.26 23.2
Open pollinated 0.65 0.90 1.55 3.7
Local 1.00 0.60 1.60 4.0
Overall 0.93 0.70 1.63 4.6
Sweet 3.50 1.10 4.60 5.2a liquid and solid fungicide were combined by assuming one liter is equal to one kg.
Thailand

225Usman Mustafa, Mubarik Ali, Thongchai Satapornvorasak, and Orasa Dissataporn
Herbicide
On average, 10.3 kg or liter per ha of herbicide was used in chili fields (Table 34). The quantitiesofherbicideaswellasthenumbersofsprayswerehighestforhybridchili.No cocktail was reported. Paraquat, glyphosate, and alachor were the most common herbicidesusedtoeradicateweeds.Table 34. Quantity and number of sprays of herbicide in the sample areas, by chili type, Thailand, 2002
Chili typeChemical
Total number of sprayL/ha Kg/ha Overall (kg or l/ha)a
Hybrid 21.55 - 21.55 3.3
Open pollinated 9.82 0.10 9.92 2.2
Local 8.52 - 8.52 1.8
Overall 10.20 0.08 10.28 2.2
Sweet - - - -a liquid and solid herbicide were combined by assuming one liter is equal to one kg.
Irrigation
When water was available, farmers irrigated their fields regularly. An irrigated chili farm typically received 41 irrigations. Sweet pepper was irrigated daily in the hydroponics system.Among hot chili, hybrids received the highest number of irrigations of 50,followed by open pollinated at 42 irrigations. The lowest number of irrigations of 23 wasgiventolocalchili.
Labor
On average, 265 labor days/ha were used for hot chili cultivation, management, picking, post-harvest handling and marketing (Table 35). The highest labor use was 394 days in sweet pepper and the lowest of 235 days was used in local chili type.
Table 35. Distribution of labor among different activity groups in the sample areas, by chili type, Thailand, 2002
Chili typePercentage distribution Total labor
(day/ha)Land preparation Management Harvesting Post-harvesting
Hybrid 11.2 53.5 25.6 9.7 315
Open pollinated 12.2 55.4 24.5 7.9 266
Local 14.6 52.9 26.4 6.1 235
Overall 12.4 55.1 24.7 7.8 265
Sweet 4.9 64.6 24.7 5.8 394

226
Overall in hot chili, crop management activities utilized more than one-half of the total labor, harvesting consumed another one-fourth; while land preparation and post-harvesting claimed 12% and 8%, respectively. The share of crop management labor varied a little acrosschilitypes;itwashighestforsweetpepper,andlowestforlocalchilitypes.Theland preparation in sweet pepper claimed significantly lower share compared to hot chili types. The harvesting share did not vary so much across variety. The labor share for post-harvestingoperationwashighestforhybridchili,andlowestforsweetpepper.
Credit
More than two-thirds of chili farmers obtained loans in Thailand with little variation across varieties (Table 36). The average size of the loans of hot chili-farmers was THB 34,660 for an average period of 18 months, while it was many times more for longer duration incaseofsweetpeppergrowers.Bankswerethemainsourcefortheseloans.
Table 36. Loan source, duration, interest rate, and purposes by farmer type, Thailand, 2002
Type of grower Loan
(%farmer)
Average loan
(THB)1
Source (% of farmers)Duration(years)
Interest rate (%)
Purpose (% of farmers)
Bank Coopera-tive
Mer-chants
Others Inputs Machin-ery
Other
Hybrid 80 46,800 66 23 11 - 3.4 9.4 100 - -
Open pollinated 66 33,887 61 29 6 4 1.4 7.4 77 10 13
Local 75 36,430 80 20 - - 2.2 8.9 87 6 7
Overall 67 34,660 63 28 6 3 1.5 7.6 79 9 12
Sweet 75 196,875 77 8 7 8 4.5 9.0 23 23 541 One US$ = 40.43 THB.
The average interest rate was 7.6% per annum with little variation across chili types. About three-fourths of hot chili farmers obtained loans to purchase inputs, while more than half of the sweet pepper farmers used it to build fixed infrastructure (classified in "others"). Only 9% of hot chili but 23% of sweet pepper farmers borrowed money for machinery.
Production
Chili Yield
On average, yield of hot chili (hybrids, open pollinated and local varieties) in fresh weight was 5.8 t/ha. This yield is similar to the one reported in the DOAE statistics for the whole of Thailand (see Table 3). However, this is about half the potential yield reported in the experiment stations (DOAE 2005).
The yield under irrigated condition was many times higher compared to that underrainfed, regardless of chili type. Generally, the coefficient of variation for irrigated yield was also lower (Table 37). Despite these advantages, many chili farmers did not have accesstoirrigation.
Thailand

227Usman Mustafa, Mubarik Ali, Thongchai Satapornvorasak, and Orasa Dissataporn
The highest yield of 32.3 t/ha was obtained from sweet pepper under irrigation while the yield was lowest at 2.81 t/ha for open pollinated under rainfed condition. Among hot chili,hybridsproducedthehighestyieldunderirrigatedcondition,andthedifferencebetweenirrigatedandrainfedyieldswasalsohighestinhybrids.
Table 37. Chili yield in fresh weight (t/ha) in the sample areas, by mode of irrigation and chili type, Thailand, 2002
Chili type Irrigated Non-irrigated OverallHybrid 20.81 (0.51)a 3.38 (0.00)b 19.07 (0.59)b
Open pollinated 9.85 (0.59)a 2.81 (0.76)b 5.27 (0.96)c
Local 10.47 (0.33)a 3.25 (0.60)b 4.62 (0.79)c
Overall 10.37 (0.64)a 2.87 (0.74)b 5.80 (1.19)*
Sweet 32.26 (0.22) - 32.26 (0.22)a
Note: The figures in parenthesis are coefficients of variation in yield.The different superscripts in a row of first two columns imply that the figures are statistically different across the two groups at least at 10% level. In the last column the different superscripts indicate the statistical difference across different chili types. The * indicates that overall hot-chili yield is statistically different than sweet chili.
Product Quality and Prices
Thissurveyestimated thepercentageofchilioutputproducedaccording todifferentgrades. The specification of each grade in Thailand is given in Table 38.
Table 38. Specification of chili grades at the farm level in Thailand
Grade Quality Characteristics
1 HighFresh, very hot with high fragrance, higher number of seed, straight, shine and smooth surface, red or green color, and small size in case of local species while long for improved varieties.
2 Medium Fresh, hot, and medium fragrance, higher number of seed, medium size (small size in case of local species), clean surface, and red or green color.
3 Normal Fresh, not so hot, with little fragrance, good number of seed, normal size, rough or wave surface, and light color.
4 Mix Poor quality chilies with mixture of different varieties.
ThesurveyresultssuggestedthatmajorityofthechilibroughttothemarketsinThailandwas of mixed grade followed by grades 1 and 2 (Table 39). This was generally true across chilitypes,exceptforhybridwherenearlyhalfoftheproductwasofgrade2followedby the mixed grade. Open pollinated and local chili types had the highest mixed grade of 66% and 56%, respectively.
The average price of hot chili received by the sample farmers was THB 11/kg. Sweet pepper of grade1 fetched the highest price of THB 65/kg and open pollinated of grade

228
Table 39. Chili grades and prices in the sample areas, by chili type, Thailand, 2002
Chili farmerPercentage Price (THB/kg)
Grade1 Grade2 Grade3 Mix grade Grade1 Grade2 Grade3 Mix grade Overall
Hybrid 12 47 12 29 22 14 10 12 13
Open pollinated 22 11 11 66 14 12 9 11 11
Local 5 17 22 56 20 13 10 13 12
Overall 20 13 12 53 15 12 9 11 11
Sweet 26 25 12 37 65 55 40 50 50
Economics of Chili Cultivation
Cost and Factor Share
The overall total cost of production for hot chili was estimated at THB 47.21 thousands/ha and per unit output cost was THB 8.1/kg. The labor share in total cost was highest followed by irrigation, "others", and pesticide (Table 40).
The highest cost of production was for sweet pepper and lowest for local chili. About two-thirds of the total cost in local and open pollinated types and two-fifth in hybrids was for labor.Thelaborcostconsumedonlyeightpercentofthetotalcostinsweetpepper.Thefixed cost had the highest share in sweet chili because of its peculiar production system which required large amount of initial investment on fixed infrastructure development. Itisworthmentioningthattheshareofseedrangedonlyfromonetothreepercentandfertilizersharefromthreetofourpercentacrossdifferentvarieties.Theshareofpesticidein total cost was highest at 11% in hybrid chili. The factor share for irrigation was lowest at three percent in local chili and ranged 9-13% in other chili types.
Table 40. Total and per unit cost of chili production and factor share in the sample areas, by chili type, Thailand, 2002
Chili typeCost of production Factor share (%)
Total(THB 000/ha)
Per unit output(THB/kg)1 Labor Seed Fertilizer Irrigation Pesticide Others Fixed
Hybrid 104.88b 5.5 42 3 4 11 11 18 11Open pollinated 45.31c 8.6 64 3 3 9 7 9 5
Local 38.08d 8.2 66 1 4 3 7 10 9Overall 47.21* 8.1 63 3 3 9 7 9 6Sweet 594.20a 18.4 8 1 4 13 7 14 53
1Output cost is based on fresh form of chili.Note: The different superscript in a column suggests statistical difference across chili types at 10% level of significance. The * in overall row implies that the value is statistically different with the sweet pepper in the respective column.
Thailand
3 the lowest at THB 9/kg. Interestingly, local chili attracted higher prices compared to openpollinated typesdue to itshotness,pungency,andotherattributespreferredbyconsumers.

229Usman Mustafa, Mubarik Ali, Thongchai Satapornvorasak, and Orasa Dissataporn
Economics of Chili Cultivation
Amongdifferentchilitypes,sweetpeppercultivationgeneratedthehighestgrossandnetrevenues while local chili the lowest (Table 41). This is understandable because sweet pepperfetchednotonlythehighestpricebutalsoproducedthehighestyield.Hence,sweet pepper showed the highest benefit-cost ratio followed by hybrid, open pollinated andlocaltypes.
Hybridchiliandsweetpepperproductionwerecapitalintensivebutprovidedhighestbenefit-cost ratios and resource productivities compared to other chili types. The pesticide productivity was highest across all chili types indicating the significance of pest control inchiliproduction.Theoveralleconomicperformanceofopenpollinatedvarieties,asmeasured by economic indicators such as benefit-cost ratio and resource productivity, was notveryimpressivewhencomparedtolocalchili.Therefore,improvementisneededinthesecultivars.Besidesloweryield,openpollinatedalsofetchedlowerpricescomparedtothelocallandraces.
Table 41. Economics of cultivation in the sample areas, by chili type, Thailand, 2002
Chili typeGross
revenue (THB/ha)
Net return(THB/ha)
B-C ratio(%)
Inputs productivityLabor (THB/
day)Fertilizer (THB/kg)
Irrigation(THB/no.)
Pesticide (THB/lit)
Hybrid 247,910b 123,030b 117 674 1,532 4,727 10,188
Open pollinated 63,240c 18,930c 42 129 520 1,408 15,017
Local 55,440c 15,360c 40 129 550 2,361 13,192
Overall 70,344* 23,886* 51 146 694 1,431 2,862
Sweet 1,613,000a 918,800a 155 3,974 4,540 7,678 302,194Note: The different superscripts in a column suggest statistical difference across chili types at 10% level of significance. The * in overall row implies that the value is statistically different with sweet pepper in the respective column.
Constraints in Chili Production
Major Constraints
Disease and insect infestation were ranked as first and second constraints, except in hybrid chili where marketing was ranked as number one constraint (Table 42). Insects werealsoreportedasthemajorconstraintsinopenpollinatedandsweetpepper,whiledroughtandlowoutputpricewererankedassecondconstraintinlocalandhybridchilitypes,respectively.Hybridseedswereconsideredtobeofgoodqualitywithgooddiseaseandinsectpestresistancebutstilldiseasesandinsectswererankedasthirdandfourthlevelconstraints.

Consumption Pattern
Per Capita Consumption
On average, per capita weekly consumption of all chili types and its products converted into fresh weight was 218 g (Table 43). About 30% of this was consumed as fresh, 43% in dry and powder forms, and the remaining 27% in processed forms. These estimates for dry and powder chili were higher than the estimates of DoH (1995) at 14.7 g/week ofdryweightofdryandpowderchili.Theconcentrationofoursurveyinthemajorchiliproducingareasmayhaveproducedtheseresults.
Themajorformofconsumptionwaschilipowderforallconsumertypes,followedbygreenfreshexceptforurbanconsumer.Freshchiliwasconsumedraw,cooked,orincrushform (sauce). Thai people love hot foods; they also put semi crushed dry chili in their foodforhotness.Chiliinfreshandsemicrushedformsaswellasinvariousprocessedproducts,i.e.chilipaste,sauce,dippingsauce,amongothers,canbefoundinallhotels,restaurantsorfoodstalls.
The total consumption of chili was significantly higher among the chili farm families thanwithothergroups,mainlybecauseofhigherconsumptionofgreenfreshchiliandchilipowderbythisgroup.Theurbandwellersconsumedsubstantiallyhigherlevelofchilisauceanddippingsaucethanothergroups.
230
Table 42. Ranking of major constraints faced by farmer in the sample area, by chili type, Thailand, 2002.
Chili farmer Diseases Insects Low yield variety Drought Others
Hybrid 3 4 - - 1a, 2b
Open pollinated 1 2 5 4 3c
Local 1 3 4 2 5d
Sweet 1 2 4 - 3b
Overall 1 2 5 4 3a Marketing, b Low price, c Weeds, d Poor plant stand.Note: The rank of 1 is the most devastating, and 5 the least devastating constraint.
Chili Processing
In Thailand, chili-processing units are generally small. Some very large multinational chili-processing factories are located in Bangkok mainly to produce export quality products. The processors preferred chilies that were hot and with less number of seeds (to givechilianattractivecolorincooking)andredshiningsurface.Thechilientrepreneursshowedtheirconcernsaboutpoorgradingandqualityofchilisuppliedbythefarmers,price fluctuation, inadequate supply, and lack of capital among others.
Thailand

231Usman Mustafa, Mubarik Ali, Thongchai Satapornvorasak, and Orasa Dissataporn
Table 43. Average weekly per capita consumption of chili and its products (g of fresh weight) in the sample areas, by consumer type, Thailand, 2002
Type of chili/products Chili farmer Non-chili farmer Urban consumer Overall*
Green fresh 50a 38b 24c 31Red fresh 34a 32a 32a 32Sweet fresh 0a 0a 1a 1Dry chili 8a 8a 8a 8Chili powder (crushed) 136a 104b 68c 86Chili paste 4a 0a 4a 2Chili sauce 22b 23b 40a 32Chili dipping sauce 3b 4b 28a 16Chili curry 17a 14a 7b 10Total 274a 223b 212b 218
* The overall consumption for the whole country was estimated assuming 1%, 48%, and 51% weight of population for chili producer, non-chili producer, and urban consumer, respectively.Note: The different superscript on the figures in a row implies that they are significantly different at least at 10% level of significance.
On average, THB 4.9 per person/week was spent on chili (Table 44). The total expenditure onchiliconsumptionbyurbanconsumersandchilifarmfamilieswasalmostthesame,despitetheloweramountofchiliconsumptionintheformer.Thiswasbecauseurbanconsumers spent more on high value chili products grouped in "other" products such as chilidippingandchilisauce.Chilifarmfamiliesspentmoreonchilipowderandgreenfreshchili.
Table 44. Relative share of expenditure (%) on different chili types in the sample areas, by consumer type, Thailand, 2002
Type of chili Chili farmer Non-chili farmer Urban consumer Overall1
Green fresh 18 17 11.3 14.1Red fresh 12 14 15.0 14.5Sweet fresh 0 0 0.5 0.3Dry chili 3 4 4.0 4.0Chili powder 50 47 32.0 39.4Other chili products 17 18 37.2 27.7Overall weekly expenditure (THB)2 5.59a 4.68b 5.18a 4.9
1The shares and consumption for overall Thailand was estimated assuming 1%, 48%, and 51% weights of population for chili producer, non-chili producer, and urban consumer, respectively.
2The different superscript on the figures in this row implies that they are significantly different at the 10% level of significance.

232
Retail Value of Chili and its Products
Theexpendituredividedbypercapitaconsumptionmultipliedbyonethousandgeneratedthe average price of THB 22.48/kg of fresh weight chili and its products at the retail level. This is about 104% higher than the average farmgate price (THB 11/kg) reported in Table 39. Applying this ratio, the annual farmgate value of THB 5.46 billion (US$135 million) in 2003 (Table 3) was converted into the annual retail value of chili and its products at THB 11.16 billion (US$276 million).
Demand Elasticity
Accordingtoconsumerperception,decreaseinthepricesofchiliwillhavelittleimpactonitsconsumption.Evenifchilipriceswerereducedtohalf,itsconsumptionwillincreasevery little in percentage terms (Table 45). The highest increase in consumption will be in powder form at 2.52%. Similarly, increase in chili prices will not have any significant impact on its consumption. A 100% increase in prices will have strongest impact on powder chili by decreasing its consumption of about 4.2%.
Table 45. Effect of change in chili consumption due to change on its price by chili type and product, Thailand, 2002
Decrease90 0 0 1.82 080 0 0 1.82 070 0 0 1.85 060 0.31 0 1.85 050 0.31 0.32 2.52 0.32
Change in price (%) Green Red Powder ProductIncrease Change in consumption (%)
110 - 0.16 - 0.67 - 0.81 - 0.32125 - 0.47 - 0.83 - 1.08 - 0.40150 - 1.02 - 0.43 - 2.17 - 0.86175 - 1.74 - 1.95 - 3.14 - 1.69200 - 2.06 - 2.56 - 4.21 - 2.58
Chili Purchasing Place
Themajorityofchilifarmersconsumedgreen,red,andsweet,dryandpowderwhichwere produced on their own farms, and a significant portion of chili sauce, chili curry and other chili products were also prepared at home suggesting significant processing activities at the farm households (Table 46). However, majority of chili sauce, and about one-fourth of green and red chilies were purchased from local market; a smaller percentage ofdryandpowderchilieswereobtainedfromlocalandwholesalemarketswhenfarmharvestwasnotavailable.
Thailand

233Usman Mustafa, Mubarik Ali, Thongchai Satapornvorasak, and Orasa Dissataporn
Non-chili farmers bought majority of different chili forms (green, red, sweet, and dry) fromlocalmarket.Althoughmajorityofchiliproductsalsocamefromthelocalmarkets,a significant proportion of chili powder, curry powder, and other chili products were also prepared at home, suggesting significant chili processing activities taking place in the non-chili farm families. A very small proportion of green, red, and dry chilies also came fromthehomegarden.Thewholesaleandmainmarketswereonlyaminorsourceforchili products for non-chili farmers.
Forurbanconsumers,wholesalemarketwasthemajorsourceforgreen,redandsweetchilies,andchilicurrypowder.However,mainmarketwasthemainsourcefordrychili,chili sauce and other chili products. Local market was also a significant source for fresh chiliandotherchiliproducts.
Table 46. Chili purchasing place in the sample area, by chili and consumer type (% of farmers), Thailand, 2002
Chili typeChili farmer Non-chili farmer Urban Consumer
Local market
Main market
Whole-sale
Farm/home
Local market
Main market
Whole-sale
Farm/home
Local market
Main market
Whole-sale Others**
Fresh
Green 29 2 7 60 82 4 9 5 23 11 58 8
Red 26 1 3 70 77 8 8 7 23 18 56 3
Sweet 26 0 13 61 100 0 0 0 22 22 44 12
Dry chili 16 1 4 79 94 0 0 6 5 40 35 20
Chili powder 15 3 2 78 50 0 10 40 9 39 39 13
Chili sauce 61 5 7 27 67 17 5 11 11 75 13 1
Curry powder 34 3 4 59 50 13 12 25 10 20 55 15
Others 65 4 0 31 67 11 0 22 21 45 31 3** Includes other market places, such as street vendor, street market, etc.
Consumers’ Preferences for Chili Attributes
Thaislovehotfoodthatiswhyconsumersrankedpungencyasthenumberonedesirablecharacteristicforthepurchaseofgreen,red,andchiliproductswhileitwasrankedthirdfor powder chili (Table 47). Freshness was ranked first for sweet and second for green and red chilies. Color was the first-ranked characteristic for chili powder and third for bothgreenandredchiliamongtheurbanconsumers.Fragrancewasthesecondmostattractivecharacteristicforchiliproduct,thirdforsweetpepper,andfourthforgreenandpowdertypeofchilies.Consumersdidnotlikeanyinsectordiseaseinchiliproducts.Thiswasrankedsecondandthirdcriterion,respectivelyforchilipowderandchiliproducts,fourth in red chili and sweet pepper, and fifth for green chili.

234
Table 47. Ranking of the factors considered important in the selection of chili by urban consumers in the study areas, Thailand, 2002
Characteristics Green Red Sweet Powder ProductPungency 1 1 3 1
Freshness 2 2 1 5
Chili color 3 3 1
Disease/insect free 5 4 4 2 3
Overall appearance 5
Pod shape 5 2 4
Fragrance 4 3 4 2
Consumers’ Preference for Packaging
Overall a large number of consumers preferred unpacked or paper-packed green/red chilies mainly because they can see the product and it remains fresh (Table 48). In case ofsweetpepper,alargenumberofconsumerspreferreditunpackedbecauseitkepttheoutputfresh,gavethebestimageoftheproduct,andtheproductcouldbeseen.Thesecondpreferencewaspaperpackagingbecauseitwasconsideredidealforactiveandmodern people. Paper packaging was preferred for powder form because it was cheaper thanotherpackaginganditwasidealforcarrying.Incaseofchiliproductsthepackaginginplasticwasmostpreferredbytheconsumers.
Table 48. Consumer preferences for different types of packaging by chili type, Thailand, 2002
Sweet
Unpacked 46 38 28 9 - 25 - Paper 32 - - 25 50 - 25 Glass 3 - 35 - - 35 30 Plastic 19 - 29 14 - 26 31
Chili type Packing Preference (%)
Reason (%)Fresh Best image Cheap Ideal* Visibility Other
Green/red
Unpacked 49 35 6 - - 52 7 Paper 38 58 5 6 6 3 22 Glass 4 13 22 4 9 13 39 Plastic 9 24 27 - - - 49
Thailand
Note: Highest rank = 1 and lowest rank = 5.

235Usman Mustafa, Mubarik Ali, Thongchai Satapornvorasak, and Orasa Dissataporn
Cont…Table 48
Chili type Packing Preference (%)
Reason (%)
Fresh Best image Cheap Ideal* Seen Other
Powder Unpacked 35 10 6 20 - 52 12 Paper 46 - - 38 53 - 9 Glass 8 - 41 1 23 34 1 Plastic 11 - - 36 45 12 7
Product Unpacked 17 4 4 - - 46 46 Paper 4 - - 67 - - 33 Glass 26 - 9 - 33 - 58+
Plastic 34 3 19 - - - 78 Tin 19 - - 15 85 - -
* Ideal for active and modern people, + Good presentation.
Development Impact of Chili Cultivation
Input Demand
Substantiallyhigheramountsofinputswereusedonchilicomparedtoitscompetingcrops. Chili production is labor-intensive as it involves many times more labor than rice (Table 49). On average, 167 additional labor days will be required if one ha of rice is converted to hot-chili production, and nearly 300 additional days in case of conversion tosweetpepper.Ingeneral,laborforceisengagedthroughouttheproductionperiodinvegetablesincludingchiliproduction.
Table 49. Relative per ha input use of chili and its competing crops, Thailand, 2002
Farmer type Labor (days)
Seed(THB)
Fertilizer (nutrient kg)
Manure(t)
Irrigation (number)
Pesticide (number)
Hot-chili 265b 1,416b 119b 2.46a 41b 12a
Sweet pepper 394a 5,942a 350a - 300a 14a
Rice 98c 246c 86c 0.96b 18c 3a
Chili farmers 114* 265* 95 1.44 22* 4*
Non-chili farmers 91 215 82 1.54 15 3
Note: Different superscripts in a column of the rows of hot chili, sweet pepper and rice suggest that the value of the parameter is significantly different at 10% level; The * in the row of chili farmer suggests that the parameter value is significantly different from the non-chili farmer at the 10% level.

236
Thecostofseedwashigherinchilithaninrice,eventhoughthemajorityoffarmersused relatively low-cost open pollinated chili seed. The application of fertilizer, manure, andnumberofspraysonchiliwasalsohighercomparedtoitscompetingcrops.Thehotchili fields had more than twice as many irrigations as rice, while in sweet chili irrigation operation was done almost daily (Table 49).2All these implied that chili cultivationrequiresmuchmore input, and thereforegenerates demand for agricultural businessactivities in rural areas. On the other hand, its successful cultivation requires more cash liquiditythaninothercrops,whichmanysmallfarmerscouldnotafford.
Chilifarmersnotonlyappliedmoreinputstochilibuttheyalsogavemoreinputstoricecrop compared to their counterpart non-chili farmers.
2 Higher number of irrigation on chili crop does not necessarily imply that it requires more water. As rice fields are flooded while chili fields receive only surface irrigation, chili crop may require less amount of water than rice. Nevertheless, higher number of irrigation in chili implies more labor requirement for crop management.
Resource Use Efficiency
Although input use on chili crops was higher than other field crops, the differences in both gross and net returns between the two crops were even bigger (Table 50). This resulted to an improved efficiency of resources when shifted from other crops to chili. For example, resourceproductivitiesforlaborandfertilizerwerehigherinchiliproduction.However,benefit-cost ratio of hot chili was lower, but sweet pepper was double than rice.
Table 50. Resource use efficiency in chili and competing crops in the sample area, by farmer type, Thailand, 2002
Crop/farmer type Yield (t/ha)
Total cost(000 THB
/ha)
Gross return(000 THB
/ha)
Net return(000 THB
/ha)
B-C ratio(%)
Labor productivity(THB/day)
Fertilizer productivity
(THB/kg)
Hot-chili 5.80 47.21 70.34 23.90 51 146 694
Sweet pepper 32.30 594.20 1,613.00 918.80 155 3,974 4,540
Rice 4.31 12.39 21.74 9.35 76 122 243
Chili farmer 4.75 13.22 23.09 9.87 75 102 233
Non-chili farmer 3.97 10.74 18.46 7.72 72 103 215
Resources used in chili cultivation not only had higher efficiency than those in rice, its presence on the farm improved the efficiency of resources engaged in other crops. This was indicated by higher fertilizer use efficiency and benefit-cost ratio in rice cultivation on chili as compared to non-chili farms. These results were attributed to higher input use andyieldobtainedbytheformergroup.Asfarmerslearnmoresophisticatedmanagementtechniquesinchilicultivationandmarketing,theyappliedtheseforriceaswell.
Thailand

237Usman Mustafa, Mubarik Ali, Thongchai Satapornvorasak, and Orasa Dissataporn
Impact on Gender and Poverty
Chili production involved more than three-fourths of female labor compared to less than one-third in rice cultivation (Table 51). This can help in eradicating rural poverty as women arethemostvulnerableandpoorestsectionofruralpoor.Theshareoffemalelaborwashigher for harvesting and post-harvesting operations than in land preparation.
Modern chili varieties utilize higher labor, including more female labor.Therefore,expansioninchiliareawillgeneratenotonlyadditionalemploymentandincome,butmost of the benefits will go to the neglected segment of the society, such as women.
Table 51. Gender distribution of labor used in chili and rice in the sample areas, by crop and operation type, Thailand, 2002
Crop type
Percentage distribution1
Land preparation Management Harvesting Post-harvesting Overall
Female Male Female Male Female Male Female Male Female Male
Hybrid 34.8 65.2 66.6 33.4 89.9 10.1 90.3 9.7 75.5 24.5
Open pollinated 43.5 56.5 65.3 34.7 87.3 13.7 86.8 13.2 75.8 24.2
Local 38.3 61.7 63.4 36.6 88.3 11.7 79.4 20.6 67.5 32.5
Overall 42.7 57.3 65.2 34.8 87.5 12.5 86.3 13.7 75.1 24.9
Sweet 32.8 67.2 56.6 43.4 91.6 8.4 86.5 13.5 76.4 23.6
Rice 31.3 68.7 36.1 63.9 25.5 74.5 35.6 64.4 30.4 69.61 The distribution between male and female under each operation adds up to 100.
Impact on Hired Labor
Chili cultivation helps in expanding labor market as it demands more hired labor. Overall, 46% of the labor force engaged in chili cultivation was hired while 25% of the labor was hired in rice (Table 52). The use of modern varieties in chili cultivation enhanced the demand for hired labor. The proportion of hired labor was highest in post-harvest and cropmanagementoperations,andlowestinlandpreparationandharvesting.
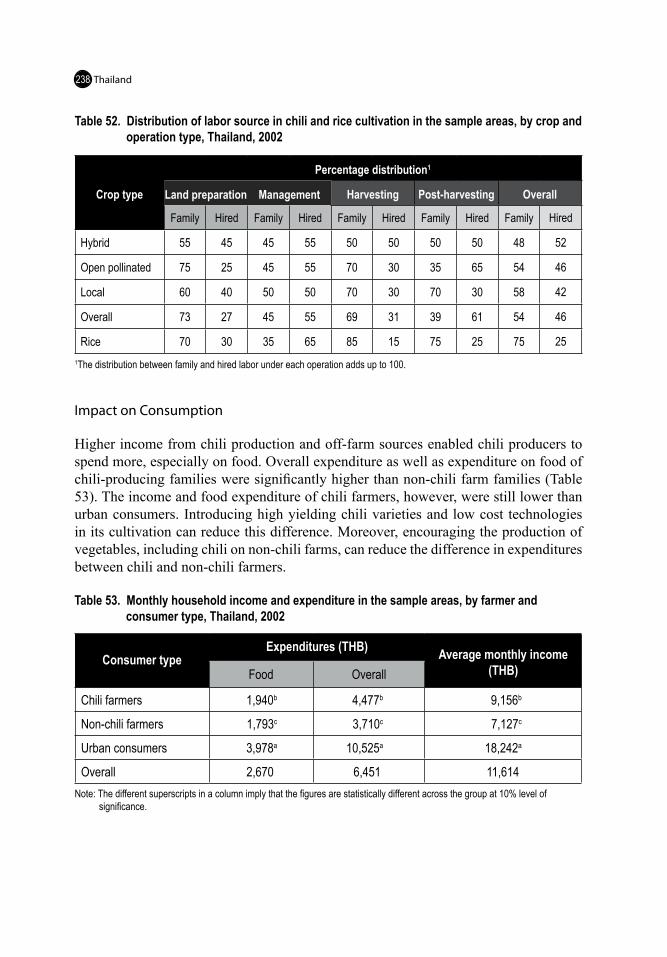
238
Table 52. Distribution of labor source in chili and rice cultivation in the sample areas, by crop and operation type, Thailand, 2002
Crop type
Percentage distribution1
Land preparation Management Harvesting Post-harvesting Overall
Family Hired Family Hired Family Hired Family Hired Family Hired
Hybrid 55 45 45 55 50 50 50 50 48 52
Open pollinated 75 25 45 55 70 30 35 65 54 46
Local 60 40 50 50 70 30 70 30 58 42
Overall 73 27 45 55 69 31 39 61 54 46
Rice 70 30 35 65 85 15 75 25 75 251The distribution between family and hired labor under each operation adds up to 100.
Impact on Consumption
Higher income from chili production and off-farm sources enabled chili producers to spend more, especially on food. Overall expenditure as well as expenditure on food of chili-producing families were significantly higher than non-chili farm families (Table 53). The income and food expenditure of chili farmers, however, were still lower than urbanconsumers.Introducinghighyieldingchilivarietiesandlowcost technologiesinitscultivationcanreducethisdifference.Moreover,encouragingtheproductionofvegetables, including chili on non-chili farms, can reduce the difference in expenditures between chili and non-chili farmers.
Table 53. Monthly household income and expenditure in the sample areas, by farmer and consumer type, Thailand, 2002
Consumer typeExpenditures (THB) Average monthly income
(THB)Food Overall
Chili farmers 1,940b 4,477b 9,156b
Non-chili farmers 1,793c 3,710c 7,127c
Urban consumers 3,978a 10,525a 18,242a
Overall 2,670 6,451 11,614Note: The different superscripts in a column imply that the figures are statistically different across the group at 10% level of significance.
Thailand

239Usman Mustafa, Mubarik Ali, Thongchai Satapornvorasak, and Orasa Dissataporn
The difference between chili and non-chili farm families in terms of overall quantity of food consumed was not significant (Table 54). However, chili farm families consumed better quality food as reflected in higher consumption of vegetables and seafood and lesscereals.Higherproportionofareaundervegetablecropsthatcangeneratemoreincomecontributedtothese.Thiswouldimprovethesupplyofmicronutrientsamongchilifarmfamilies.
Table 54. Average daily consumption of different food types in the sample areas, by consumer groups, Thailand, 2002
Food groupQuantity (g/capita)
Chili farmer Non-chili farmer Urban consumer Overall*
Cereals 422c 532a 490b 509
Livestock products 126a 118a 104b 111
Seafood 70b 58c 107a 83
Vegetables 229a 188b 210a 200
Fruits 146a 126b 159a 143
Others 156b 167a 178a 173
Overall 1,147b 1,189b 1,239a 1,214*The overall consumption was estimated assuming 1, 48, and 51 percent weight for chili producer, non-chili producer, and urban consumer, respectively.Note: The different superscripts in a row imply that figures are statistically different across the consumer group at 10% level.
Summary and Recommendation
ChiliisoneofthemajorandessentialconstituentsoftheThaidiet.Thaislovespicyandhot food. Most of the consumption is in dry, powder or processed form, while 30% is consumedasfresh.ThetrendforspicefoodisrisingfastinThailand.Alargesegmentofruralandurbanpopulationisengagedinitsproduction,marketing,andprocessing.Based on average chili area on each farm, it was estimated that about 277 thousand farm familiesaredirectlyengagedinitsproduction.Thereisalargescopeforboostingchiliproductionandincomeofthesegroups.Accordingtoestimatesofthisstudy,farmvalueof chili production was US$135 million, and the retail value of chili and its products at US$276 million in 2003.
Thedemandforchiliisontherise.However,domesticproductionfailedtorespondtothe increasing demand including demand for processing. This is reflected by the slow increaseinitsareaandyield,whiletherewassurgeinitsimport.Thisstudywasdesignedtoprovideinformationonvariousaspectsofchiliproduction,consumption,andmarketinginThailandtoovercomethesupplyconstraintsinthecountry,helpsmallchilifarmersto meet the consumers’ demand, and improve the efficiency of the whole sector.

240
Farm size of the chili farmer was typical of the survey area. However, the level ofeducation of these farmers was higher compared to non-chili farmers, and they had more sources of non-agricultural income. They possesed higher number of farm equipment including water pumps for timely irrigation.They enjoyed better life conditions asreflected by higher income and expenditure of these farmers compared to their counterpart non-chili farmers.
ChiliproductioninThailandwasataprimitivelevelinthesurveyyear.Mostly,openpollinatedwithlowqualityandlocallyproducedseedwasusedinitsproduction.Alargemajority of farmers (82%) used own-farm produced seed. A very small portion of farmers treatedchiliseedandsoilforpestcontrol.Thenurserieswerepoorlymanagedusingprimitivemethods.Themajorityofchilicropwascultivatedunderrainfedcondition,and input level was low, therefore its per ha yield was lower compared to other chili- producingcountries.However,thefarmersgrowingsweetpepperunderthehydroponics’systemadoptedadvancedmanagementpracticesandobtainedhighyieldsandreturns.Thecooperativemarketingandadvancedcontractusedinthissystemhelpedtoovercomemarketing risk, financial constraints, and economies of scale problem in the small farms. Thissystemneedstobefurtherstudiedtoextendittoothertypesofchilifarms.
Thais love hot food that is why hotness/pungency was ranked as the number one desirable characteristicforthepurchaseofgreenandredchilitypesandtheirproducts.Freshnessofchiliwasalsoaveryattractivecharacteristicforthepurchaseofchilies.Itwasrankedfirst for sweet pepper and second for red and green chili. On the other hand, farmers rankedhighestthosecriteriaofseedwhichcanfetchhighmarketprices,buthadvagueideaofconsumerpreferences.Forexample,pungencyandfreshnesshardlysurfacedasseedselectioncriteriaamongfarmers.Therefore,thereisaneedtoimprovemarketawarenessamongfarmers.
Insectsanddiseaseswererankedasnumberoneconstraintamongfarmers.Despitethehigh use of chemicals, the annual losses due to insects and diseases averaged at 24% and 31% respectively. Insect and disease occurrences were regular phenomena happening in three to four in every five years. The major cause of concern was increasing frequency andintensityofpestattack,andtheconsequentlossesinyieldandrevenues.Thiswasdespitetheadoptionofimprovedchilivarieties.Therefore,thereisaneedtoimprovethe farm management practices aimed to control insects and diseases in chili fields.
Anthracnose was ranked as the most difficult disease among the entire chili-growing fields, followed by fusarium wilt, viruses, and bacterial wilt. The major insects in chili fields as identified by farmers were caterpillars, thrips, and mites. There is a need to identify appropriate chemicals to control these insects and diseases and specify thedoses for each. The varietal research should also be targeted to develop multiple insect- and disease-resistant varieties. However, insect and disease resistance was not a major criterionforfarmersinseedselection.Therefore,untiltheseresistantcharacteristicsarecomplementedwithothercriteriaimportantforfarmersinseedselection,suchashighyieldandabilityoftheoutputtofetchhighprices,outputsofresistanceresearchcannotbesoldtofarmers.
Thailand

241Usman Mustafa, Mubarik Ali, Thongchai Satapornvorasak, and Orasa Dissataporn
ThepublicsectorvarietalimprovementresearchinchiliinThailandhadlimitedimpact.Whilemostfarmershadadoptedopenpollinatedvarietiesreleasedbythepublicsectorresearch institutes, the yield and price differences of these varieties was insignificant comparedtothelocalunimprovedvarieties.Allthesefactorsproducedsimilarnetreturn,unit-output cost, and resource use efficiency for improved open pollinated varieties. On the other hand, the adoption of hybrid varieties that produced significantly higher yield, lower cost per unit of output, and higher resource use efficiency, was very limited. High productioncostespeciallyofseedandlimitedaccesstoreliableirrigationsourceswerethemainfactorsinthelimitedadoptionofhybridvarieties.Therefore,publicsectorresearchinstitutes should try to improve their efficiency by developing economically viable chili varieties.Thiscouldbeachievedthroughcollaborationwithappropriateinternationalorganizations.ExtensionofchilicultivationinirrigatedareascanalsoimproveThailand’scompetitivenessinchiliproductionintheinternationalmarket.
Chiliproductionrequireshigherinputsthandoothercrops;therefore,thereisaneedtohelpthesefarmersbyprovidingcreditforthepurchaseofinputsthroughgovernmentloaning agencies or farmers’ cooperative organizations. In some areas, farmer’sassociationsplayedverypositiveroleinchiliproductionandmarketing.Thereisaneedtoencouragetheseorganizationsinotherareas.
Farmerssoldchilioutputmainlytolocaltraders,whointurnbroughttheoutputtothewholesalemarket.Therewasnoformalsourcefromwherefarmerscanseekinformationonchilimarkets.Thesefactorshinderedthedirectlinkoffarmerswiththemainmarketsandconsumers.Thisnotonlyreducedfarmersshareinconsumerprice,butalsoreducedtheirabilitytoadjustoutputqualityaccordingtoconsumerpreferences.Therefore,mostof the chili produce was sold as ungraded. On the other hand, farmers had complaints against middlemen/commission agent’s exploitation in the form of cartel for lower price, and little premium for quality and grading. The middlemen/commission agents obtained highmarginsfortheservicestheyrenderedtofarmers.
Chili cultivation provided an economically better option compared to cereal cropsgrown under similar conditions. This was reflected by higher net returns, resource use efficiency, engagement of more women and hired labor in chili cultivation compared tocerealcrops.Moreover,ithadaspilloverimpactontheproductivityofothercrops.Anotherdevelopmentimpactofchilicultivationwasthroughimproveddietaryhabits.Therefore,ifchiliareawasexpandedandthenumberofchilifarmerswereincreased,itwill have positive impact on the overall resource use efficiency in the agriculture sector andstimulatedevelopmentinruralareas.However,chiliexpansionstrategiesshouldbecarefullyimplementedasithaslowdemandelasticities.Incorporatingtheconsumers’attributesinchilianditsproductswillnotonlyshiftitsdemandbutalsoimproveincomeofvariousstakeholdersinvolvedinitsfoodchain.

242
References
Atthakor, P. 2003. Thais like hotter than ever. Bangkok Post. Monday 13th January2003.
Dissataporn, O. 2002. Vegetable production in Thailand. Vegetable Sub-division, Horticultural Crop Promotion Division, Department of Agricultural Extension, Bangkok,Thailand.
DOA (Department of Agriculture). 2001. Project on Production Technology of Chilli for Exportation. Planning and Technical Division, Department of Agriculture, Bangkok. 158 pp. (In Thai).
DOAE (Department of Agricultural Extension). 2005. Experiment Versus Farm Yield. <http://www.doae.go.th/>.AccessedinAugust2005.
DoH (Department of Health). 1995. The third national nutrition survey of Thailand 1986. Nutrition Division, Department of Health, Ministry of Public Health and School of Public Health, Mahidol University. Thailand.
FAO (Food and Agricultural Organization of the United Nations). 1999. Regional office for Asia and Pacific. RAP Publication: 1999/38. Bangkok.
Kohls, R.L. and J.N. Uhl. 1998. Marketing of agricultural products. 8th ed. Prentice Hall. USA.
OAE (Office of Agricultural Economics). 2001. Agricultural statistics of Thailand crop
year 2000/2001. Agricultural Statistics No. 9/2001, OAE, Ministry of Agriculture and Co-operatives, Bangkok, Thailand.
Sootsukon, B., S. Dechates, and M.H. Wu. 2000. Thailand. In: Ali, M. (ed.). Dynamics of vegetable production, distribution and consumption in Asia. AVRDC Publication No. 00-498. Asian Vegetable Research and Development Center, Shanhua, Taiwan. p.417-443.
WSN. 2001. Chilies: Multipurpose notebook. Sangdad Publishing Co. Ltd. 320 Lat Phrao 94. Wangthonglang, Bangkok 10310, Thailand.
Thailand

243Usman Mustafa, Mubarik Ali, Thongchai Satapornvorasak, and Orasa Dissataporn
Appendix 1. Major weeds found in chili fields, Thailand
No. Type Scientific Name Common name1 1 Eleusine indica Goose grass, Crowfoot grass2 1 Dactyloctenium aegyptium
3 1 Cyperus rotundus
4 2 Amaranthus gracilis
5 2 Potulaca oleracea Common purslane6 2 Gynandropsis gynandra
7 1 Echinochloa sp.
8 2 Eupatorium adenophorum
9 1 Pennisetum polystachyon Mission grass10 1 Ischaemum rugosum
11 1 Imperata cylindrica Cogon grass, lalang grass12 2 Ageratum conyzoides Goat weed13 1 Phragmites karka Flute reed14 2 Heliotropium indicum
15 1 Cyperus cyperoides
16 2 Aerva sanguinolenta
17 1 Aristida cumingiana
18 2 Erechtites hieracifolia
19 2 Merremia hastata
20 1 Leersia hexandra
21 2 Canthium dicoccum var. umbellatum
22 2 Spilanthes paniculata Para grass
Type of weed Type 1 = Monocotyledonous weeds
Type 2 = Dicotyledonous weeds
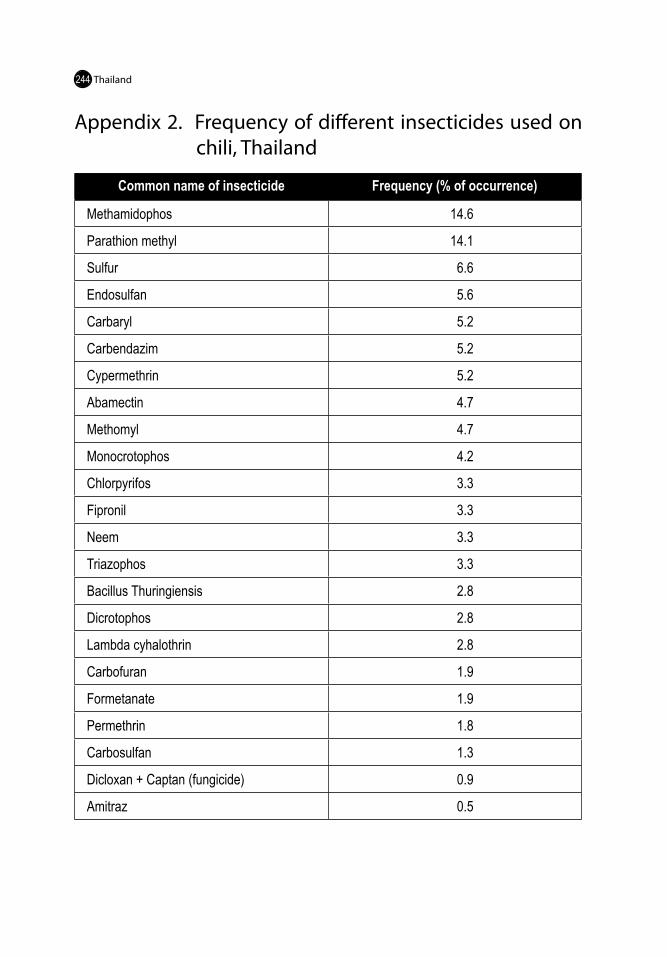
244
Appendix 2. Frequency of different insecticides used on chili, Thailand
Common name of insecticide Frequency (% of occurrence)
Methamidophos 14.6
Parathion methyl 14.1
Sulfur 6.6
Endosulfan 5.6
Carbaryl 5.2
Carbendazim 5.2
Cypermethrin 5.2
Abamectin 4.7
Methomyl 4.7
Monocrotophos 4.2
Chlorpyrifos 3.3
Fipronil 3.3
Neem 3.3
Triazophos 3.3
Bacillus Thuringiensis 2.8
Dicrotophos 2.8
Lambda cyhalothrin 2.8
Carbofuran 1.9
Formetanate 1.9
Permethrin 1.8
Carbosulfan 1.3
Dicloxan + Captan (fungicide) 0.9
Amitraz 0.5
Thailand

245Usman Mustafa, Mubarik Ali, Thongchai Satapornvorasak, and Orasa Dissataporn
Appendix 3. Frequency of different fungicides used on chili, Thailand
Common name of fungicides Frequency (% of occurrence)
Carbendazim 37.3
Mancozeb 23.9
Metalaxyl 9.0
Methamidophos 6.7
Benomyl 5.2
Chitozan 3.8
Copper hydroxide 3.7
Prochloraz 3.7
Captan 2.2
Copper oxychloride 1.6
Endosulfan (insecticide) 1.5
Propamocarb 0.7
Propineb 0.7