Burton, John E. 1983. ‘A dysentery epidemic in New Guinea and its mortality.’ Journal of Pacific...
27
The Journal of Pacific History Inc A Dysentery Epidemic in New Guinea and Its Mortality Author(s): John Burton Source: The Journal of Pacific History, Vol. 18, No. 4 (Oct., 1983), pp. 236-261 Published by: Taylor & Francis, Ltd. Stable URL: http://www.jstor.org/stable/25168530 . Accessed: 23/07/2013 09:38 Your use of the JSTOR archive indicates your acceptance of the Terms & Conditions of Use, available at . http://www.jstor.org/page/info/about/policies/terms.jsp . JSTOR is a not-for-profit service that helps scholars, researchers, and students discover, use, and build upon a wide range of content in a trusted digital archive. We use information technology and tools to increase productivity and facilitate new forms of scholarship. For more information about JSTOR, please contact [email protected]. . Taylor & Francis, Ltd. and The Journal of Pacific History Inc are collaborating with JSTOR to digitize, preserve and extend access to The Journal of Pacific History. http://www.jstor.org This content downloaded from 130.56.64.29 on Tue, 23 Jul 2013 09:38:26 AM All use subject to JSTOR Terms and Conditions
Transcript of Burton, John E. 1983. ‘A dysentery epidemic in New Guinea and its mortality.’ Journal of Pacific...
The Journal of Pacific History Inc
A Dysentery Epidemic in New Guinea and Its MortalityAuthor(s): John BurtonSource: The Journal of Pacific History, Vol. 18, No. 4 (Oct., 1983), pp. 236-261Published by: Taylor & Francis, Ltd.Stable URL: http://www.jstor.org/stable/25168530 .
Accessed: 23/07/2013 09:38
Your use of the JSTOR archive indicates your acceptance of the Terms & Conditions of Use, available at .http://www.jstor.org/page/info/about/policies/terms.jsp
.JSTOR is a not-for-profit service that helps scholars, researchers, and students discover, use, and build upon a wide range ofcontent in a trusted digital archive. We use information technology and tools to increase productivity and facilitate new formsof scholarship. For more information about JSTOR, please contact [email protected].
.
Taylor & Francis, Ltd. and The Journal of Pacific History Inc are collaborating with JSTOR to digitize,preserve and extend access to The Journal of Pacific History.
http://www.jstor.org
This content downloaded from 130.56.64.29 on Tue, 23 Jul 2013 09:38:26 AMAll use subject to JSTOR Terms and Conditions
johnburton
Text Box
Burton, John E. 1983. ‘A dysentery epidemic in New Guinea and its mortality.’ Journal of Pacific History 18(4):236‑61

A Dysentery Epidemic in New Guinea and its
Mortality* JOHN BURTON
WHEN JAPANESE FORCES LANDED IN RABAUL IN JANUARY 1942, MOST EXPAT
riate civilians withdrew from the mandated territory of New Guinea, and
Australia's administration of the territory was virtually nominal for almost a
year. The Australian New Guinea Administrative Unit (ANGAU) came into
being in February 1942, and replaced civilian administration until the end of
the war (Figures 1 & 2). By the end of September 1942 it had nine officers and
other ranks near Madang, three officers and five privates on or near the north
coast, and 110 members of the Royal Papuan Constabulary (RPC) and
labourers at their disposition. Medical officers and medical assistants could not
continue the patrols which they had undertaken regularly before the war. The
condition of minimal administration persisted until well into 1943 when an
epidemic of bacillary dysentery began in the highlands. The impact of this
epidemic on village populations has not previously been described and assess
ed.
The sudden outbreak of the epidemic came as a surprise to ANGAU.
There were observers at Hagen, Wabag, Kundiawa, Bena Bena and Aiyura, who could have raised the alarm if an epidemic had struck any earlier. During
1943 European Medical Assistants (EMAs) were also found to take charge of
rural hospitals at Bena Bena and at Mt Hagen. They compiled lists of cases
treated in these two hospitals during October, but there was no entry in the
column provided for dysentery. At Bena Bena many of the hospital patients
may well have been contract labourers employed by ANGAU; but at Hagen at
least a significant proportion of patients must have been villagers. It is further
stated that 58 Hageners were treated during medical patrols.1
Among ANGAU's facilities was a Pathology Laboratory on Gemo Island in
Port Moresby. On 1 December 1943 Lieutenant S. H. Christian, the officer in
charge, reported an increase in the number of dysentery specimens submitted
for examination; and for the first time he reported that Shiga dysentery had
* I am extremely grateful for the comments and information from Bryant Allen, Donald Denoon, Jack
Golson, Paul Gorecki, Robin Hide, Ken Logan and Neil Ryan. I also thank the staff of Kerowil Council
Chambers, the National Archives, Port Moresby, and the Australian War Memorial. Financial support for field work was provided by the Research School of Pacific Studies, Australian National University. I
gratefully acknowledge the backing of the Department of Anthropology and Sociology, University of Papua New Guinea, and the hospitality of the people of Tun and Aviamp. Unless otherwise stated, archival sources form part of the ANGAU War Diary, kept at the Australian War Memorial, Canberra.
1 Medical Appreciation for month of October 1943, Lt-Col. J. M. Mack, HQ ANGAU, Port Moresby.
236
This content downloaded from 130.56.64.29 on Tue, 23 Jul 2013 09:38:26 AMAll use subject to JSTOR Terms and Conditions

A DYSENTERY EPIDEMIC IN NEW GUINEA 237
SEPIK /\ S^ \ PAPUA NEW GUINEA
^\t
| T" J ^"S "^ ̂ ^^^ - Highlands Provinces MJ I
I J /X""*-^^ \ ^^ ̂ V - ANGAU District boundaries J\ I I | f \^_ _
v ^ v^ in September 1944 I\ I
h^V / BENA r^\ \^\ ^~V 1'2'3'4: dVsenterv If I
I \^^-L c^^^^L?r^^C^x? / J/s. ^\ MADANG I
J\ S \ ( ̂>viHa9#n _' I ^ V \ B,na / 3 y^ f I
FLY ! ^v t^^ ~>-r~^ >C"-V MOROBE S I
I ( .^ "
v>. WAHGI VALLEY places mentioned in text I I j Mbukl ^\ r I
I \ \ ~X / 10 km I I
j Mabulga ) \7 I
| l / Elti tribe or phratry I
I Kumdi I \ I
I s^ Kimga J \^ ^J>^~-??n_ J I
J _s^r^^K Wah9' I Kope cw??w^T /^~^ '-rIVWv/vx^>^>,; I
Koibuga, ^S^ ^J ( U ̂ I Kumunga
{ C
Onembc\ L-u, .Banz
'Kaliia ge' / \ A? Tun8e' VU Ogelbeng Elti
yA Ko.bera
V-.^^ % \% .Av.amp /^ V
. HAGEN /^ / D0bmd0p
<N% V Kudjip./ ^ f-^L Mogei . + -^i L-^^ Kuli-Pin A
* \-, (
.. ^^ 1J
I \ YVother -\ ) * \ I Minj-A I / 1\ Ki,'9a \ / * \ \ /I
\ \ ] 1 Kuli
?y%, V / / /
Figure 1
E2
This content downloaded from 130.56.64.29 on Tue, 23 Jul 2013 09:38:26 AMAll use subject to JSTOR Terms and Conditions

238 THE JOURNAL OF PACIFIC HISTORY
j^ *- I ?*?? 23-24th January. Japanese occupy Rabaul
W ""-I ^ suspension of civilian government > =* I
^ *m I ? 17th March. MacArthur's arrival in Australia
q >" **- 10tn ApriL NGAU * PAU *W* to form ANGAU
S ft - T
2 - ? * o * 8.
cm - ? as z ?
w ? I 5 y ""I ?
a =
? s S| 2 > ? I 2 si ? ? > * s
?- . ^ **
& C M oo ** t! rc "I ? 13 1 * " 2 ** L ? O to o ** * < I I
JL 3 o" 3 *** k
* o S>> >>/ > I **** ? 8
c 2.r * 5* i > I ^?/) ? ********* J.
2 *- I i x ? ***********
J> c_ I ^ o *********
> I X^VI - H-4 8" **********
w j 0 )f \ 3 _^ ************* >
o h M S ********** J3 Z II \~ 3 ^ ************ ?
D [V ^ ^ 3 *********** I o " h*
M\\ si ! \ s ^ > * ? SI V c i C/3 ^" ********** I 3
> I 1 ** |_t CD ********** I ?
* * i ̂ - ? ? "I-1*
- "S 7n ?- I ^ *********** 2>.
> j. ̂ *^
* Imperial surrender **
I TJ o I j?
-1 ?*- 30th October > Parts of territories south of the Markham Z I C/2 returned to civil administration. -I W HQ ANGAU moved to Lae.
SJ < Figure 2
This content downloaded from 130.56.64.29 on Tue, 23 Jul 2013 09:38:26 AMAll use subject to JSTOR Terms and Conditions

A DYSENTERY EPIDEMIC IN NEW GUINEA 239
been identified in the laboratory.2 December's Monthly Report of the Medical
Section of ANGAU indicates the abrupt and massive nature of the outbreak.3
Reports from the Chimbu-Bena Bena region during November indicated some
4,000 cases and 200 deaths. A Hygiene Officer had been detached from New
Guinea Force to cope with this new and alarming situation. Reinforcement was
badly needed. There were still only two hospitals, those at Hagen and Bena
Bena, staffed by two EMAs each. On the other hand the new drug
sulphaguanadine was readily available, and was thought to have been decisive
in controlling mortality rates. Introduced after 1941, its effects appeared dramatic. One member of ANGAU Medical Section reported 9,186 cases in
and around Chimbu, with 262 deaths. He declared that, if the epidemic had
broken out a year earlier, before sulphaguanadine had become available, the
mortality might have reached 2,000. In hindsight the drug was probably less
important than prompt and supervised care for the sick, but it had already ac
quired a reputation among highlanders, comparable to the reputation of
novarsenobillon in curing yaws; consequently they reported promptly to the
hospitals.4 The optimistic tone of that report was misplaced. A staggering number of
patients were admitted during 1944, to an increasing number of emergency
hospitals (Figure 3). The March report recorded dysentery cases from 'prac
tically every district' of the highlands, with highlanders concealing the disease
for so long that they were critically ill on admission.5. In May the disease was
still widespread; and as one area was brought under control, another would be
affected.6 In September, an official report provided the following summary:
80 . . A major epidemic of bacillary dysentery was begun by the arrival, in the
area, of a US unit from Port Moresby, on 1st August 1943, with two of its members suffering from the disease.
81 The epidemic spread rapidly and to date about 10,000 cases have been treated
82 More than one million tablets of sulphaguanadine have been used in the treat
ment of natives in the District.7
2 Report for the month of Nov. 1943, ANGAU Pathological Laboratory, Gemo Island, Port Moresby,
1/12/43. The report refers to Shigella shigae bacteria. Shigella flexneriae had already been found. No later
reports identify the specific form responsible for the epidemic. 3 Monthly Report Medical Section, December 1943, Lt-Col. J. M. Mack, HQ ANGAU, 1/1/44.
Monthly Report Medical Services January 1944, Lt-Col. J. M. Mack, HQ ANGAU, 1/2/44. The previous treatment for dysentery was the preparation M & B 693, or pyridine. One circular, known as a Technical Instruction, was sent to medical orderlies in November 1942. It stated that (i) no purgative was to be given, (ii) 24 to 36 hours of starvation was to be enforced, with the Very minimum of fluid' given, (iii) M & B 693
was to be administered {War Diary 27/10/42 to 30/11/42 Appendix B). In June 1943 this instruction was
replaced by instructions which included the use of sulphaguanadine. 5 Monthly Report March 44 -Medical Services ANGA U, Major W. A. Hugh Smith, HQ ANGAU, 4/4/44. 6 Monthly Report May 44-Medical Section ANGAU, Major W. A. Hugh Smith, HQ ANGAU, 5/6/44. 7 Commonwealth of Australia, Report on the Activities of ANGAU (Port Moresby, 1944).
This content downloaded from 130.56.64.29 on Tue, 23 Jul 2013 09:38:26 AMAll use subject to JSTOR Terms and Conditions

240 THE JOURNAL OF PACIFIC HISTORY
0 s: >
- p
0 > o
w ^ g o
1 B '
__ a 1 W - i?'?i >2 ^
5 i Si c? o
-j. o 3
3 z" s s R" !> ? (3D *> **
1 < 5. 2 cr
? > p _ - T*
^ 2 - ? sr - i-1-1 i '-1
6 > n> O w - >
n> O ho -? . ? 2 To
?.2-3 ? g
=-?inTTTT - c ? * > * * o
v. 3 2 16 = c y
I I 1 | i = |T*TjT* s I s * " ? 1 = 1
? <- = sis. s ! 3 .5- T E
> f x a a I | St is Q. o? co ;_
? ? -1 A X T T
zj_ _ _T_,_ ?- I I ? T?l t |T>T, :?. ?*. :?. 3 = . c a q o
-I I I s i 1 ? * i I * -n 2- -r Q- a A 5 2. _ ? = = 3 8 " ? Tf? Tf? * ? E 2. g fr K
:?. - * * 2 2 ? 2 3 r ^ ^
3 >a> goo goo cd-* ?.- ? SM>fc 3 -aT?
I 22 S- 8" & % ~ * 3 |
Is-' s = i ? E & *
2. g_A._
1 j. ? r ^ partial end of ANGAU ? *
z_ -
<
o
Figure 3
This content downloaded from 130.56.64.29 on Tue, 23 Jul 2013 09:38:26 AMAll use subject to JSTOR Terms and Conditions

A DYSENTERY EPIDEMIC IN NEW GUINEA 241
The report went on to calculate that the case mortality rate was 5.1%. By November 1944 it seemed that the epidemic had passed its peak.8 However, a
secondary wave of infection immediately caught hold, in villages which were
typically just beyond the hospital catchment areas, or beyond the sweep of
previous hygiene patrols. Dysentery was first reported to the west near Wabag, in November 1944, although that post had been manned by ANGAU since
November 1942. Among the Enga people? as ignorant of the cause of their
troubles as Hagen, Wahgi and Chimbu people had been a year earlier ? the cy cle repeated itself: outbreak, concealment of the sick, and setting up outpost
hospitals. The medical officers reported that there were too many paths
through the mountains for the police cordon to be effective. They also believed
that people would not voluntarily report to hospitals until they had seen
evidence that hospital patients could be cured and released.9
Meanwhile at the original centres of infection the statistics supported the
view that the epidemic was locally under control. At Palinga hospital, a few
kilometres southwest of Hagen, dysentery admissions declined from 153 in
August, to 89 in September, 93 in October, and 15 in November.10 The
hospital closed in January 1945, after three weeks without fresh cases.11 At the
same time there was a similar decline in cases at Hagen itself, and at Mabulga at the entrance to the Baiyer Valley.1* The evidence is less clear from some
other areas. There had been no consistently available hospital in the Minj area
throughout 1944, and the hospital that opened at Banz in May 1944 was closed
during November and December for no discernible reason. It reopened in
January 1945, and admitted an increasing number of patients, which sug
gested that the sick were not being concealed from the authorities.13 A hospital with an EM A operated at Kuli in March, April and May 1944. This is a matter
of some interest, because census figures for Kuli survive from before the
epidemic. My analysis of these appears below.
Little can be said about conditions in the hinterland beyond the temporary
hospitals. From July to October 1944 medical patrols fanned out from Minj and Banz: elsewhere it was the job of the RPC to locate sick people and bring them in from the villages. The place names of villages are rarely mentioned,
and, for example, the Jimi Valley was then classified as 'partly controlled' and
8 Hygiene-summary of activities to 24 Nov. 44, HQ ANGAU, 29/11/44.
9 Northern Region Monthly Medical Report, Dec. 1944, Major W. H. Perl, 1/1/45: extract from DO Wabag's report of 1/12/44.
10 Ibid. 11 Monthly Report, Medical Section, Jan. 1945, Capt. W. M. McLaren, HQ Northern Region (Lae),
1/2/45. 12 Ibid. 13 Ibid.
This content downloaded from 130.56.64.29 on Tue, 23 Jul 2013 09:38:26 AMAll use subject to JSTOR Terms and Conditions

242 THE JOURNAL OF PACIFIC HISTORY
left alone, with the notable exception of a police post at Kamuk on the Ganz
River, looking out for Japanese patrols. One patrol from Kinjibi near the
Kimil River to the Baiyer River found no single case of dysentery in March
1945. Lieutenant Bell was impressed by the physique and healthiness of the
people, including women and children; and he noted the large number of aged
people in evidence.14 Unfortunately, it is not clear whether his remarks apply to the Wahgi side of the Sepik-Wahgi divide, or to the Jimi side as well. During the same month,
It was reported that the area between KUP and KUDJIP in the MINJ side of the
valley is at present free from dysentery . . . Figures from Banz hosp. show 105 ad missions for the month. This includes a pocket of 45 from OBI where S/Sgt Barham (Hygiene) set up a temporary hosp. . . Gradual control of the dysentery is
being achieved but as OBI is outside the limit of patrol, the question is now being raised as to the policy in regard to how far the dysentery is to be pursued. It is con
sidered with present staff available it will not be practicable to go far into the un
controlled areas.15
A new problem emerged when the first cases came in from other such areas,
particularly around Wabag: any attempt to enter a new area might tend to
spread disease rather than bring it under control.16 Nowhere was it ever possi ble to state the number of deaths that occurred before treatment stations were
established. In areas where dysentery was otherwise dormant, it might also
flare up once again.17 It was therefore September 1945 before the 'all clear' was
sounded. ANGAU was by that time only a month away from the first stages of
dismantling its operations:
For the first time in 24 months dysentery is not the main disease, only 445 cases be
ing reported for the month. This compares with 688 in June and 1017 in May. There were 31 deaths from dysentery in the month under review, compared with
59 and 51 in the previous two months.18
ANGAU records consist of week-to-week perceptions made by an ad hoc ad
ministrative structure. When the job was done, the structure was dismantled
and no overall picture was given. ANGAU's capacity to monitor the disease
was in any case incomplete. Their statistics are therefore an unsatisfactory measure of the incidence of the disease, especially during the months of 1943
and early 1944. Figure 2 summarizes the qualitative assessments made at the
time, and is not based directly on figures for hospital admissions (Figure 4).
14 Lieutenant W. T. Bell, Patrol Report, Mt Hagen, No 1 of 44/45, Port Moresby, National Archives of
Papua New Guinea (hereinafter NA). 15 Northern Region Medical Monthly Report, Mar. 1945, 31/3/45. 16 Monthly Report, Medical Section ANGAU, September 1944, Lt-Col. J. M. Mack, 10/10/44.
17 Hygiene Report for April 1945, 8/5/45.
"Monthly Report, Medical Section ANGAU-August 1945, Lt-Col. W. A. Hugh Smith, HQ ANGAU, 10/9/45.
This content downloaded from 130.56.64.29 on Tue, 23 Jul 2013 09:38:26 AMAll use subject to JSTOR Terms and Conditions

A DYSENTERY EPIDEMIC IN NEW GUINEA 243
o
J "z ? II i > f
- -V^ v\ > ;
^^"^^^ \ _" ?
\^ 1 -? s ^^"S^ 1 ??
15 ^ 1 < rt
.?? X / ? * S '5 .* o .^ _* ? >^ < -o
_' _"5 s ????????-???--??-???_____ - c u. <u
60
-1-1-1-1-1 '
| I 1 1 1 l> | z &
"o ^
/ ' 2
-***--?> i I
___ ? <
/ 8 f
en X
\ . td
_> ? o _ - I
-1-1-1-1-1 '
1 1 I I I Figure 4
This content downloaded from 130.56.64.29 on Tue, 23 Jul 2013 09:38:26 AMAll use subject to JSTOR Terms and Conditions

244 THE JOURNAL OF PACIFIC HISTORY
Phase I. Threshold: April-October 1943. Dysentery was probably present in the
Enga-Wahgi-Chimbu area before the first Australian patrols of 1933 and
1934,19 but epidemics would have required some form of social breakdown or a
radical change in inter-group communications. It is unlikely that highlanders
developed adaptive physical or social responses towards such epidemics.20
Phase II. Outbreak: November 1943-February 1944. The first cases occurred in
the Kundiawa and Bena Bena areas in early November. By late February the
epidemic was in full swing and medical services were overwhelmed. An early report states baldly that 4,996 in-patients were treated at Chimbu Post in
December 1943, with 63 deaths.
Phase III Primary epidemic raging: March-November 1944. New hos
pitals?rows of huts made of local materials ?were built in many population centres (Figures 1 and 3). They were staffed by EM As, and each accom
modated several hundred in-patients. RPC constables toured villages seeking the concealed sick and bringing them in for treatment. Many villagers
suspected the hospitals, and many patients were extremely ill when they were
admitted. Infection spread unchecked, and the infrequent hygiene patrols could not enforce the construction and maintenance of latrines, nor instruct
people in the need to use them.
Phase IV. Secondary epidemic: December 1944-June 1945. In the main valleys, a
measure of control was achieved by late 1944. Parts of the primary epidemic
area?Chimbu, Banz and Kerowagi?were apparently re-infected, and the
disease was transmitted to new areas, especially Enga.
Phase V. Quiescence: after July 1945. Effective sanitary measures, readily available treatment, and simply the decay of the epidemic as a system of infec
tion, brought the crisis to an end. Patrol officers remained vigilant for some
years, and the neglect of latrines earned villagers a spell in gaol. By the end of
1945, only endemic levels of dysentery were reported anywhere in New
Guinea.
Bacillary dysentery is described by Bryant Allen (this volume). It is
transmitted by faecally infected water, by faecal-oral contact, and quite easily
by flies which carry viable bacilli externally. The Administration's chief
response was therefore to insist upon the construction and maintenance of
latrines. Bacillary dysentery epidemics in the tropics are more common in the
rainy season than in the dry. In wet weather people are reluctant to defaecate
19 Georg Vicedom mentioned it for the pre-war Hagen area, under the Melpa term, mema klatep ronom,
and described it as uncommon. G. Vicedom and H. Tischner, Die Mbowamb, 3 vols (Hamburg 1940-43). 20 Ibid., II, 260-1.
This content downloaded from 130.56.64.29 on Tue, 23 Jul 2013 09:38:26 AMAll use subject to JSTOR Terms and Conditions

A DYSENTERY EPIDEMIC IN NEW GUINEA 245
at a safe distance from houses, and dysentery bacilli survive in water-logged
ground. In the Wahgi, well-used paths saturate very quickly, and some never
dry out even in the dry season (June to September). Heavy rains were recorded
in the Wahgi-Chimbu area just before the outbreak there, and a wet-season
outbreak must have occurred. Different risks may be associated with the dry season, such as more concentrated pollution of streams.21
Table I summarizes hospital returns for the Hagen area for a seven month
period in 1944 when the breakdown of sicknesses treated was being given. Gross figures are available for the 19 months up to the end of ANGAU in Oc
tober 1945, for many more hospitals, and these have been plotted as smoothed
monthly figures, pooled from five groups of hospitals, in order to remove ir
regularities in the reporting procedure (Figure 4).22 Dysentery was by far the
most important reason for admission to hospital, and the cause of virtually all
deaths there. This means that admissions are a good guide to the incidence of
dysentery, and hospital deaths reflect dysentery deaths. The mean death rate
for 58 available months at the five hospital groups was 2.85%, while Table I
shows that case-mortality for dysentery ran at about 4.7%. Elsewhere an
overall figure of 5% was cited. Unfortunately there is no way of knowing what
the death rate was in out-patients, who appear in large numbers in the monthly
table i? Dysentery in the vicinity of Mt Hagen during 1944: six months for which detailed figures are available. Hagen, Kuli, Kuma, Kimga, Palinga and Mabulga
hospital statistics combined
dysentery dysentery all dysentery cases as % dysentery % case all deaths as %
Month in-patients* cases of all cases deaths mortality deaths of all deaths
March 900 812 90.22 31 3.82 31 100.00
April 584 412 72.09 11 2.61 13 84.62
May 666 556 83.48 26 4.68 27 96.30
June 558 523 93.70 28 5.35 31 90.32
July 351 296 84.33 20 6.76 22 90.91
August 353 330 93.48 18 5.45 20 90.00
September 316 251 79.43 16 6.37 16 100.00
Total 3728 3189 85.54 150 4.70 160 93.75
* in-patients as sum of individual sickness totals (undifferentiated in-patient totals are mostly higher)
Source: monthly returns.
21 On the other hand, Bowers states that dysentery in the Upper Kaugel, a small valley connected to the western end of the Wahgi valley, is a dry season phenomenon. N. Bowers, 'Demographic problems in mon tane New Guinea', in Steven Polgar (ed.), Culture and Population (Cambridge, Mass. 1971), 17.
22 Using the moving average formula, new nth value X'n
- (Xn., + 2Xn + Xn+,)/4.
As separate returns were sent in, listing the total numbers of in-patients, out-patients, and deaths from all
causes, the figures in Table 1 do not exactly match those plotted in Figure 4.
This content downloaded from 130.56.64.29 on Tue, 23 Jul 2013 09:38:26 AMAll use subject to JSTOR Terms and Conditions

246 THE JOURNAL OF PACIFIC HISTORY
returns, nor how they were in fact treated. Similarly, nowhere do ANGAU
reports discuss mortality in infants, or any after-effects in adults which may have jeopardized their care. It would be surprising if babies did not die in
rather larger numbers than did adults.
THE MOGEI AND KULI CENSUSES OF 1945
A restricted amount of census work was done before the Pacific War in the area
around Mt Hagen, but no'figures are thought to have survived directly. Ac
cidental or intentional destruction of records occurred during the war, and
changes in local government structure over time have also resulted in the loss of
Village Books and patrol records.23 However two large censuses (each of over
2,000 persons) carried out in 1945 use 1940-41 figures to state the numbers of
births, deaths, and people moving in and out of the census units in the census
interval. In both cases the earlier compilations were made by Dal Chambers, an Australian patrol officer.
The groups listed in census reports can be readily identified, and are to be
found in the Papua New Guinea Village Directory, 1973. The present-day Mogei census points for the 'Nambuga' and 'Komunuga' sections are within one
kilometre of Hagen town, while the 'Kwibi' section is censused at Kumunga,
approximately 10 kilometres to the north. The other two tribes, Elti ('Helte') and Kope ('Korbe'), are censused at Kelua and Koibuga respectively. All three
tribes would have been living in the same areas in 1940-41, that is around the
present-day township (then patrol post) of Mt Hagen, at Ogelbeng, the
Lutheran mission station where Georg Vicedom lived before the outbreak of
war, and at Kelua, the site of the first Hagen airstrip. It is therefore safe to say that the census population had, by 1943, a full 10 years familiarity with Euro
pean ways. They would also have had access to the medical services ? albeit
limited ? provided at Mt Hagen. At the time the only area in the modern
Western Highlands considered to have been under full administrative control
was a circle 10 miles in any direction from Hagen.24 When the epidemic struck the area in February 1944, Hagen hospital had
been staffed by two EM As since May 1943; they should have been able to gain the trust and respect of local villagers by the time of the outbreak. In fact
dysentery struck first in Chimbu and was discussed in the ANGAU Medical
Report before cases were seen in Hagen. Sulphaguanadine would undoubtedly have been stocked at Hagen in anticipation of the eventual outbreak there, after its successful use in Chimbu.
23 Cf. R. Hide, 'Aspects of pig production and use in colonial Sinasina, Papua New Guinea', PhD thesis, Columbia University (New York 1981), 64.
24 Captain A. A. Bloxham, Patrol Report, Ramu, No. R5 of 1942/43.
This content downloaded from 130.56.64.29 on Tue, 23 Jul 2013 09:38:26 AMAll use subject to JSTOR Terms and Conditions

> W z H M W 2 3 w o 5 as w o 2 w > ?>
table il ?Census figures from Lieut. W. T. Bell,
Patrol
Report, Hagen No. 2 of 1944/45, NA (facsimile)
Date Tribe, Clan Births Deaths New Migrations
TOTAL
GRAND TOTAL 1940-41 GRAND % Increase (excl. mig
and Group M F M F Names IN OUT Child Adult TOTAL Child Adult TOTAL rations and new names)
MFMFMFMFMF 1945 MFMF 1940-1 and date last census
MOGEI-NAMBUGA
26.2.45 Andagalimbo 23 30 10 18 - - 6 3 5 10 59 73 97 101 330 58 62 86 101 307 9.4% 11.12.40
19.4.45 Milimbo & Pan
gambo Groups 60 54 22 29 3 2 17 54 35 50 164 158 193 270 785 139 123 193 275 730 8.8% 13.12.40
MOGEI-KWIBI
23.4.45 Ogubuga 13 12 6 6 7 2 5 18 16 24 46 30 79 66 221 40 29 83 65 217 5.5% 10.9.41
Korlga 7 16 3 4 5 3 - 10 6 8 27 27 60 48 162 25 18 55 44 142 11.3%
MOGEI-KOMUNUGA
Eldembu 9 5 1 4 1 6 7 12 7 12 28 20 47 45 140 15 19 51 40 125 9.6%
HELTE
Paragembu 1 3 - ' - - - 13 5 3 5 10 8 13 7 38 2 7 11 5 25 12.0%
KORBE
24.4.45 Kerega 17 14 4 8 7 3 2 7 4 10 39 30 41 51 161 20 17 43 57 137 13.8% 23.7.41
Kangambo 22 14 8 12 2 1 8 25 5 18 52 36 80 87 255 31 33 83 81 228 6.1%
152 148 54 81 25 17 58 134 81 137 425 382 610 675 2092 330 308 605 668 1911 8.7%
This content downloaded from 130.56.64.29 on Tue, 23 Jul 2013 09:38:26 AMAll use subject to JSTOR Terms and Conditions

CD H w c as & o 3 3 a o 5
table iii ?Census figures from Sgt P. R. Coote,
Patrol
Report, Hagen No. 3 of 1945/46, NA (facsimile) _____ DISTRICT: Hagen
SUB-DISTRICT:
Hagen SUB-DIVISION: Eastern
Date of this census: September
1945.
Date of last census: August 1941.
Births. Deaths. Migrations
Migrations
New Names Population Totals Excl.
In Out I/L's Grand Total I/L's.**
Children
Adults
Total.
VTTTT M. F. M. F. M. F. M. F.
M. F. M. F. M. F. M. F._M. F.
Tribe: KULI. - Clan: KULI.
Groups: PORGETABI 10 6 20 19 1 9 10 1 3 27 44 83 74 110 118 228
KINDIMBI 1 7 21 21 3 18 2 11 - - 13 21 83 58 96 79 175 WARAKE 1 3 10 12 2 6 5 18 4 1 13 11 49 25 62 36 99 1
NORBOROBI 6 4 15 8 - 9 5 10 7 12 14 39 36 51 50 101
KURAKIDJIMBO 17 13 22 18 4 28 2 10 8 8 36 44 101 78 137 122 265 6
35 33 88 78 10 70 9 54 23 13 101 134 355 271 456 405 868 7
Clan: AGILIGA.
Groups: KELIMBO 18 15 26 25 2 20 10 18 4 4 55 45 94 85 149 131 283 4
KUNDIMBO 13 11 23 17 3 16 3 14 9 8 45 56 95 100 140 156 307 11 TENGAPBO 2 5 14 13 2 4 2 9 4 2 15 16 33 28 48 44 94 2
33 31 63 55 7 40 15 41 17 14 115 117 222 213 337 330 684 17
Clan: KONDA.
Groups: WULINGBI 14 13 7 11 2 20 1 6 1 2 41 44 76 63 117 107 227 3
RAGALBI 10 6 6 11 - 5 3 18 - - 20 21 39 38 59 69 119 1 PORGETABI 7 10 4 8 1 8 2 7 - - 30 20 33 40 63 60 125 2
PELDAGA 7 8 8 5 - 5 4 11 - - 31 24 44 42 75 66 142 1
38 37 25 35 3 38 10 42 1 2 122 109 192 183 314 292 613 7
Total of KULI tribe: 106 101*176 168 20 148 34 137 41 29 338 360 769 667 1107 1027 2165 31
*This figure was originally given as 141
**
Indentured
labourers
This content downloaded from 130.56.64.29 on Tue, 23 Jul 2013 09:38:26 AMAll use subject to JSTOR Terms and Conditions

A DYSENTERY EPIDEMIC IN NEW GUINEA 249
By contrast, the Kuli census, again of about 2,000 people, was taken in an
area which suffered ?in part ?heavy casualties:
KULI was a 'hot spot' of infection during the dysentery epidemic. A few cases were
found after the CCS [Casualty Clearing Station] was established there two months
ago but no cases have been admitted during the past four weeks.25
It may be noted that the figures for 'Deaths' are exceptionally high in comparison with the 'Births' for both the KULI and AGILIGA clans. This is the result of a
Dysentery epidemic . . . which is the cause of a
considerably lower population
total than what it normally would have been. The KONDA clan, which is situated around the headwaters of the GORMAN river, and separated from the rest of the tribe by the GORMAN Divide, escaped this epidemic, as, being considerably
nearer to this DO, it was under constant supervision.26
Cadet Patrol Officer Coote revisited the area a few weeks later to do an initial
census of the Mengka, Andakelka and Onembe groups living between the
Tungei at Aviamp, and Kuli. There was already a Rest House and Police
Quarters at the Tuman River (on Mengka ground), and a police sergeant was
living at Aviamp, although no census had been done there:
Pigs are plentiful, also poultry, and European vegetables such as cabbages, corn
and peanuts are also being planted in small quantities. MARITA (Fruit of the PANDANUS Palm) and KARUKA (similar to MARITA but of a different
variety) which is grown up in the foothills of the KUBOR Range and which is looked upon as a luxury by these people, will be ready for picking within the next two months . . .
The health of the three tribes in the TUMAN valley may almost be termed 100%. Not one case of sores or skin diseases were seen while compiling the census, and no
case of sickness was reported. All latrines inspected were found to be satisfactory, except some in the ONOMBE area, which were immediately filled in on
discovery. It is surprising to note that exactly the reverse occurs on the eastern side
of the TUMAN River, in the MONGER tribal area. Many latrines were found to be unsatisfactory. All that were discovered were burnt immediately, and this con
dition was reported to the OIC Chimbu Sub-District on arrival at Minj . . .
The Dysentery epidemic which raged along the WAHGI valley in 1941 also resulted in the loss of many lives of these three tribes, so that the totals are natural
ly smaller than what they normally would have been. It may be noted that the total females represent only 43% of the grand total, and that the total children amount to only 397 out of a total of 787 adults, which leaves no room for anticipation of an increased population in future years.27
The Kuli statistics support what Coote wrote about the high level of mortality, 25 Lieutenant W. T. Bell, Station Correspondence, 2/10/45, Mt Hagen, NA. 26
Sgt P. R. Coote, Patrol Report, Hagen No. 3 of 1945/46, NA. Note that 'GORMAN River' refers to the Komun River.
27 Sgt P. R. Coote, Patrol Report, Hagen No. 5 of 1945/46, NA.
This content downloaded from 130.56.64.29 on Tue, 23 Jul 2013 09:38:26 AMAll use subject to JSTOR Terms and Conditions

250 THE JOURNAL OF PACIFIC HISTORY
but his remarks also show that a short time after the epidemic the Kuli's eastern
neighbours were a picture of perfect health.28 The three groups Kuli, Agiliga and Konda are also readily identified. Kuli and Agiliga are loosely known as
Kuli-Pin, because they live in the Pin River valley; Konda refers to the re
mainder of Kuli tribe who live west of the Kuli Gap, a mountain spur crossed
by the Highlands Highway, in the Komun River valley. The complexity of
segmentation and large size of the tribe means that an anthropologist's version
of Kuli tribe sections, clans and sub-clans would differ in detail from that given
by Coote. However, the tribal structure is in broad agreement with that used
for census in 1968, when Konda were censused at Kiliga, and the Kuli-Pin
groups at Dobindop and Koibera.
The methods used to transform the Kuli and Mogei censuses into estimates
of mortality and annual rates of growth are demographically unorthodox but
they do have the advantage in producing results from population data which
violate the normal assumptions of analysis: that the populations are closed; that uniform rates of births and deaths have pertained throughout the census
interval; and that vital events have all been recorded. Patrol-type census, discussed at length by van de Kaa, has numerous drawbacks. In the present
case, migration in and out of each of the groups has been significant. In all
cases the major component was the movement of women between clans at mar
riage, divorce, or widowhood. Uniform rates of change may have happened in
Mogei, but certainly did not in Kuli. About two-thirds of the way through the
census interval in Kuli the epidemic struck; it may have been an 'instantaneous'
cause of deaths, on the four year time scale of the census interval. Lastly, an
important category of vital events is not recorded. This was the births of
children who died before the interval was completed.29 The 1945 figures can be seen to include five main categories of people:
births, deaths, migrations in, migrations out, and new names. An additional
category is indentured labourers, working away from home, but they were not
included in the totals for adults and children. They may well have been listed
as resident villagers in 1941, and could therefore be added to 1941 counts. But
we cannot tell when they began their contracts and how they relate to the re
mainder of the population, and they need not be considered further. The new
names can be set aside too, because they play no discernible part in population
changes, entering the censused population unit only at the end of the census
interval.
The basic analysis of these figures is shown in Table IV. The columns
28 Ibid. 29 D. J. van de Kaa, 'The Demography of Papua New Guinea's Indigenous Population', PhD thesis,
Australian National University (Canberra 1971), 30, 68, 123.
This content downloaded from 130.56.64.29 on Tue, 23 Jul 2013 09:38:26 AMAll use subject to JSTOR Terms and Conditions

A DYSENTERY EPIDEMIC IN NEW GUINEA 251
table iv ?Basic analysis of Mogei and Kuli census figures d
1 Th ~H ID g <y> *> <+ bo ?-? ct> &> ^
3 *?> Z Z ? S "S fc 5 5 s
POPULATION UNIT g ? *.*>t'3S:bp3"? "? "?
o .5 CC-QrtoCTJ o u o
Months Years a b c d e f(d + e + f)(b + c + d)
KULI 49 4.0833 M ? 10 35 456 388^
88 90g 825 _2?%
AGILIGA 49 4.0833 ̂f \] "* 33
111 [5. tl 699 636 -2.29%
KONDA 49 4.0833 *? J J ?? 2iJ ?!? 12 ?? 599 603 0.16% F 2 38 37 292 215 42 35
MOGEI-NAMBUGA w n e 00 iC^ ,0, c ,n
A?dagalimbo 50 4.166 ? JJ J
* J* j* ,J \\
311 330 1.43% Milimbo ? , qo? M 3 17 60 357 277 35 22 7,t 7ftn t ciqr
Pangambo l *"*"
F 2 54 54 428 318 50 29 /J1 /W 1D1/?
MOGEI-KWIBI
MOGEI-KOMUNUGA 43 3.583 jf ~
f" ^* f** ~
J" 498 529 1.70% pj TI F 11 45 36 244 152 49 14
KOPE 45 3.750 9A i?n H 2n]}A }** J* H 363 403 2.83% F 4 32 28 204 140 28 20
*carry overs (persons not entering or leaving the population) = total adults + children 1945 -
(a + b + c)
marked a-c and e-f are extracted directly from the original censuses, while the
1945 total of adults and children sums the relevant sub-totals in the censuses. A
new column, d, comprises persons who did not enter (new names added to the
rolls, immigrants, births) or leave (emigrants, deaths) the population in the
census interval. These are the carry overs. Since the leavers are already absent, column d is calculated as the total for each sex, less the persons of that sex
entering the population. Crude figures for the 1941 populations can therefore
be found (they are not given directly) and crude rates of annual growth calculated.30
However the bias of migration has distorted the picture of population
30 Demography texts usually recommend the use of logarithms to extract annual rates of growth from
non-annual census material. Most statistical calculators now have a key for multiple roots and powers. In the present case, a useful formula is:
. . r . W pop. at end of interval intrinsic rate of growth, r =_
pop. at beginning ot interval
percentage annual rate of growth ?
100(r- 1), where I is the length of the census interval in years.
This content downloaded from 130.56.64.29 on Tue, 23 Jul 2013 09:38:26 AMAll use subject to JSTOR Terms and Conditions

252 THE JOURNAL OF PACIFIC HISTORY
change, for which reason it is necessary to make special corrections. The case of
Kuli has been chosen to illustrate the problem and one solution to it.
The figures in columns a-f of Table IV are visually displayed in Figure 5 for
Kuli (seven indentured labourers are noted separately, as in the census). The
two left-hand bars show the rows of the table for each sex; the third bar shows
the sums for both sexes. Those figures which must be added together to pro duce the crude 1941 and 1945 totals are marked with arrows; they show a
population decline at an annual rate of - 2.27% (Table IV).
As can be seen from Figure 5, there was a net gain of 17 people ?
mainly women (bar sections b and e)
? to Kuli population unit. The Kuli census as a
whole (including Agiliga and Konda) is approximately in balance ?there were
168 immigrants and 179 emigrants ?so it is reasonable to average the migra tion figures for the individual units. In Kuli, the mean number of migrants was
therefore (80 -h 63)/2 = 71.5. The migration-free totals for 1941 and 1945 are
shown in the fourth bar of Figure 5, and the migration-free rate of growth was -
2.74% p.a., rather more than the crude rate (Table IV). The same correc
tion can be made for the other population units (Table V). From either the crude rates of growth (Table IV) or the migration-free rates
of growth (Table V), it can be seen that Kuli and Agiliga were badly hit by the
dysentery, both declining at the rate of over 2.0% p.a., and that Konda seems
to have escaped, growing at the positive rate of about 0.5% p.a. The epidemic free Hagen tribes, on the other hand, grew at much higher rates, probably be
tween 1.5% and 2.5% p.a. (Tables IV and V). This compares very favourably with the 1950s and 1960s growth of 1.75-2.25% p.a. in the Wahgi Valley.31
How many deaths resulted from epidemic dysentery in each group? Two
models of'normality' can be used as reference; the first are the deaths expected at the rate they occurred in Konda, the only Kuli group not to decline in
numbers, and the second is the rate at which they occurred in Mogei (including Elti and Kope). This is shown in Table VI. Two ways of calculating the rates
are given, but they agree, to a small tolerance. Both methods take the number
of deaths occurring to 1941 base populations, over the census interval, and ap
ply this 'expected' rate to the three Kuli population units. Some 75 'surplus' deaths were sustained by Kuli, and 48 by Agiliga, at the Konda rate, which
was simply 60 deaths to 599 persons alive in 1941 (from Table IV). This would
mean that by Konda standards, the Kuli-Pin groups lost 7-8% of their 1941
populations in the epidemic. However, at the Mogei rate, which was 135
deaths to 1,903 persons, there were 100 and 67 surplus deaths, or population losses of the order of 10-11 %. At this rate also, Konda losses were about 2.7%.
31 J. Burton, in preparation.
This content downloaded from 130.56.64.29 on Tue, 23 Jul 2013 09:38:26 AMAll use subject to JSTOR Terms and Conditions

A DYSENTERY EPIDEMIC IN NEW GUINEA 253
^ indentured labour I
a co I co I new names I 36
LJD L_J models
Konda Mogei
l_. cI I
I I l I-1 I ~ 71 * 71.6
. ! ̂ t migration 80 i 71.5 E I ' ? in '
J ' i [*~ | '
j I * i il m I I | | i is j |
"8 no 132 I c j ? I co births 68 68 | |
I !*> x| l?J I?I I_I I I_j to !_I I_| 00 II
Ml .1 ? .1 3 l j
: i I I ! Is ! I s I d g ; carry overs 677 2 677 | g
? 677 677
8 t * I w \l - l
j j | ?
r I ' I
' ' ; ! ! II I
U | ! ! i?: I ! I r?I _ '"7 '_ ,27 L _
I I a??j i, i a??^
f ? a??j a??'
?| ! ! " I ! ? ; I :
j ai I I S j migration ; | S I j 2 -Si i j LJ I | out
j 63 -
j 71.5
,g j 75 100 i CO j
. I ?fc "EL j l : trr } i? I ?.J g g_
' ? I
" I f B
J cleath, J166 | |g |166
|
'-'U I_I* I_I ) M F total
1. 1945 census 2. migration free 3. reconstructions
adjustment without epidemic
KULI POPULATION UNIT analysis of census figures Figure 5
This content downloaded from 130.56.64.29 on Tue, 23 Jul 2013 09:38:26 AMAll use subject to JSTOR Terms and Conditions

254 THE JOURNAL OF PACIFIC HISTORY
table v ?Mogei and Kuli censuses: corrections for migration and numbers of females
at various times in the census intervals
5 ^
5 s I 1 i 2 2 *~ ~ 2 ~ Z ? 5 5 S 5 2 2 E ?^
2 2 2 ~
i2 ^
t> a; a; ? <l> p ? 22 2f ?& w S
POPULATION UNIT *T *T *T u *r ̂ bb bb bb "? bb 3 E E E ts E "S
KULI 914.5 816.5 -2.72% 421 429.0 271
AGILIGA 694.5 640.5 -1.96% 341 340.5 213
KONDA 593.5 608.5 0.63% 292 290.0 183
MOGEI-NAMBUGA Andagalimbo 308.0 333.0 1.89% 169 165.5 101
J^lhmbo 724.0 787.0 1.94% 397 399.0 270 rangambo
MOGEI-KWIBI
MOGEI-KOMUNUGA 492.5 534.5 2.31% 215 213.0 166
ELTI KOPE 365.5 400.5 2.47% 188 190.0 138
totals for all Mogei, 96g. %7 5| 675J Kope and Elti: === =====
* In accordance with the method of calculation for the Kuli groups, the figure of 969 is obtained by sum
ming females in columns d, e & f of Table IV.
t Figures obtained by adding females from Table IV from columns d + f + (b + e).
2
J Figures from relevant columns in Tables II and III.
As already stated this type of census fails to register children born in the in
terval who die before its end. Some estimate of their number can be made by
calculating the shortfall in births by the same means as used to find the excess
number of deaths. This is shown in Table VII. In this case the expected rates
are calculated against females only; in addition the stated numbers of 'adult
females' in 1945 have been used to provide a slightly different estimate.32 At the
Konda rate of 75 births to 292 women Kuli and Agiliga had shortfalls of about
42 and 24 births, and at the Mogei rate of 300 births to 969 women, shortfalls
of about 64 and 41 births. At the Mogei rate, Konda had a shortfall of about 15
births. These figures are averages of the three different methods of calculation.
The net effect could have been produced in three ways. Either the shortfall
is the result of fewer conceptions, or deaths to potential parents, or it represents
32 Age estimates in village censuses were (and are) notoriously unreliable, and even the division into
children and adults may be regarded as suspect.
This content downloaded from 130.56.64.29 on Tue, 23 Jul 2013 09:38:26 AMAll use subject to JSTOR Terms and Conditions

A DYSENTERY EPIDEMIC IN NEW GUINEA 255
TABLE VI
CALCULATION OF EPIDEMIC DEATHS against KONDA against MOGEI
I. Deaths to crude 1941 totals
total exp. exp. actual surplus % of 1941 exp. exp. surplus % of 1941
Pop. unit 1941 rate deaths deaths deaths total rate deaths deaths total
KULI 906 60/599 91 166 75 8.31 * 139.2/1903 66 100 11.01 AGILIGA 699 60/599 70 118 48 6.86 139.2/1903 51 67 9.57 KONDA 599 60 139.2/1903 44 16 2.70
II. Deaths to migration free 1941 totals
total exp. exp. actual surplus % of 1941 exp. exp. surplus % of 1941
Pop. unit 1941 rate deaths deaths deaths total rate deaths deaths total
KULI 914.5 60/593.5 92 166 74 8.04 139.2/1890 67 99 10.79 AGILIGA 694.5 60/593.5 70 118 48 6.88 139.2/1890 51 67 9.63 KONDA 593.5 60 139.2/1890 44 16 2.74
* 135 Mogei deaths over equivalent interval length of 3.96 years *(4.0833/3.96)-5- 139.2 deaths over the
Kuli interval of 4.0833 years.
TABLE VII
CALCULATION OF SHORTFALL IN BIRTHS against KONDA against MOGEI
I. Births to crude 1941 totals
fern. exp. exp. actual short- exp. exp. short
Pop, unit 1941 rate births births fall % of exp. rate births fall % of exp.
KULI 421 75/292 108 68 40 37.11 *309.3/969 134 66 49.40 AGILIGA 341 75/292 88 64 24 26.93 309.3/969 109 45 41.20 KONDA 292 75 309.3/969 93 18 19.53
II. Births to migration free 1941 totals
fern. exp. exp. actual short- exp. exp. short
Pop, unit 1941 rate births births fall % of exp. rate births fall % of exp.
KULI 429.0 75/290.0 111 68 43 38.71 309.3/967.5 137 69 50.42
AGILIGA 340.5 75/290.0 88 64 24 27.32 309.3/967.5 109 45 41.21
KONDA 290.0 75 309.3/967.5 93 18 19.10
III. Births to 1945 adult female totals
adult fern. exp. exp. actual short- exp. exp. short
Pop, unit 1945 rate births births fall % of exp. rate births fall % of exp.
KULI 271 75/183 111 68 43 38.77 309.3/675 124 56 45.24 AGILIGA 213 75/183 87 64 23 26.69 309.3/675 98 34 34.43 KONDA 183 75 309.3/675 84 9 10.56
* 300 Mogei births over equivalent interval length of 3.96 years *(4.0833/3.96)^ 309.3 births over the Kuli
interval of 4.0833 years.
children that were actually born during the first two-thirds of the census inter
val, but succumbed to dysentery during the last third. A mix of the three is
likely.
This content downloaded from 130.56.64.29 on Tue, 23 Jul 2013 09:38:26 AMAll use subject to JSTOR Terms and Conditions

256 THE JOURNAL OF PACIFIC HISTORY
What would have happened had the epidemic not taken place? Using
migration-free totals Table VIII shows how Kuli and Agiliga would have fared
on the Konda model of light mortality, and how all three would have fared on
the Mogei model. The reconstruction for Kuli is also shown in Figure 5. To the
constant number of carry overs is added the surplus deaths ? people who would
have been alive if there had been no epidemic ?the expected births (actual births plus shortfalls in births) and the constant number of migrants. All
groups would have grown at a rate of about 0.6% p.a. on the Konda model
and at about 1.8% on the Mogei model, slightly less for Kuli.
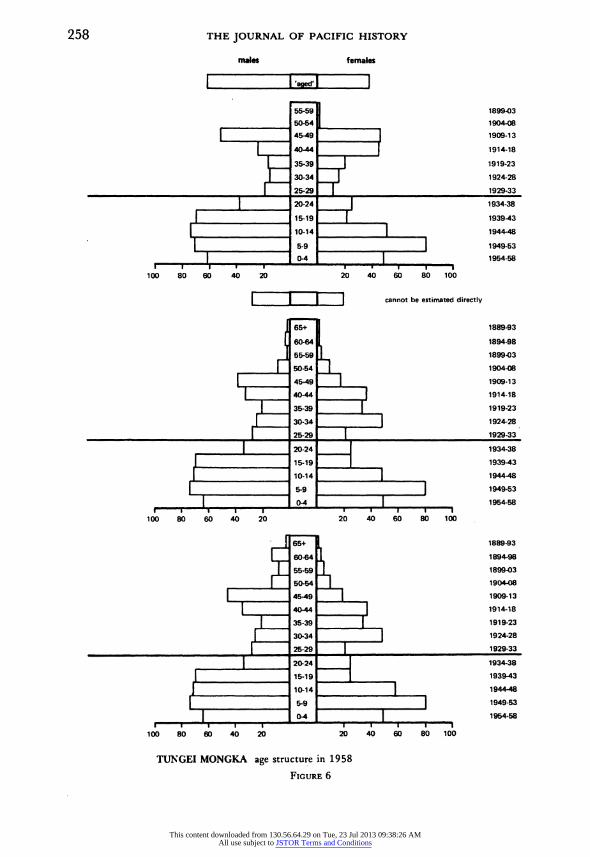
following fieldwork with Tungei tribe in 1980-81, I have prepared three
population pyramids for the 910 persons recorded in the 1958 Aviamp Village Book. This document recorded names and age estimates by clan, and was
prepared by a single patrol officer, D. J. Hook, probably from earlier rolls
which cannot today be found. The age estimates were largely guesses and con
tain systematic errors ofa number of kinds; for example, many older people were simply listed as 'aged'. Figure 6, upper, shows the structure of Tungei
population according to Hook. Other authors, notably Nancy Bowers, who us
ed a 1959 census, have taken the waisted appearance of such pyramids to
witness population losses to epidemics.33 One observation may be made here:
the Aviamp book shows waisting before the coming of Europeans to the Wahgi in 1933, unlike the pyramids prepared by Bowers.
Using corrections justified elsewhere, I have redistributed persons among the age classes to produce a first improvement on the population pyramid
(Figure 6, middle). Many of the 'aged' were still alive in 1980-81 and their ages could be estimated from interviews, especially by reference to the coming of
white men, which was extremely well remembered.34 By this means it was
TABLE VIII
RECONSTRUCTION OF 1945
populations, without epidemic* against konda against MOGEI
mig. niig. rate of mig. rate of
free total mean carry surplus exp. free total growth surplus exp. free total growth
Pop. unit 1941 mig- overs deaths births 1945 p.a. deaths births 1945 p.a.
KULI 914.5 71.5 677 75 110 933.5 0.50% 100 132 980.5 1.72% AGILIGA 694.5 51.5 525 48 88 712.5 0.63% 67 105 748.5 1.85% KONDA 593.5 46.5 487 0.61% 16 90 639.5 1.84%
* best estimates or mean values for expected births and surplus deaths used.
33 Bowers, 'Demographic problems in montane New Guinea', Figures 1 and 2.
34 The first white men to be seen, J. L. Taylor and D. Leahy, camped on the ground of Tungei Eska clan on 2 May 1933; cf. J. L. Taylor, Patrol Diary of 1933, Upper Purari Headwaters Area, NA.
This content downloaded from 130.56.64.29 on Tue, 23 Jul 2013 09:38:26 AMAll use subject to JSTOR Terms and Conditions

A DYSENTERY EPIDEMIC IN NEW GUINEA 257
possible to distribute the remaining 'aged' among likely age classes (Figure 6,
lower).
Dysentery was well-known to Tungei informants, who used the term enj
miem, 'faeces blood' (this may or may not be a derivation from the Pidgin term
pekpek blut). Despite intensive genealogical inquiries amongst men I found that
as few as four grown men died during the epidemic. Nevertheless one
men's-house-group was unlucky to suffer the deaths of three of its men; it was
given thereafter the sub-clan name eingal kanem, meaning 'obscured kind'.35 If
the Tungei had suffered as badly as the Kuli-Pin, few births should have been
ascribed to the years around 1944. However neither of the two age classes
which border on 1943/44 show depletions in this way. A large number of men
born in the 1909-18 period came to maturity some 25 years later, in the
1934-43 period. Statistics show that the most fertile years for Tungei men over
a recent 14 year period (1958-72) were the late 20s to middle 30s. The 1944-48
cohort is therefore large because of an irregularity in the Tungei age structure.
The irregularity is a real one verified by the presence today of numerous elderly men among the Tungei, rather few in their 50s, and many 30-40 year olds.
The 1939-43 cohort had the seemingly impossible number of 70 boys to 25
girls in 1958. The possible explanation is that many girls of this age group, 15-19 year olds, left the Tungei to marry, and that their numbers were not
replenished by brides from outside. The average age of women at the birth of
their first child 1958-72 was 20.3 ?1.8 years for women, and it was 25.5 ? 4.4
years for men.36 As can be seen from Figure 6, the male cohorts for ages 20-24
and 25-29, the prime years for male marriage, are much smaller than the age classes below them; they would not have been able to marry as many 15-19
year olds as there were leaving.37 It is difficult to see by what mechanism the
ratio could have been produced in 1944-45 in the dysentery epidemic, when
this cohort would have been aged 0-5 years. In conclusion the evidence for
cohort depletions in Tungei is not present, or else it has been heavily obscured
by more marked effects. A point of some significance may be that the Tungei would have been a very 'young* population in 1944-45, with many 25-29 and
30-34 year old men, who would arguably have been most able to withstand
35 In the Tuman language, Ek Nii. Eingal is used for afternoon haze which makes the far side of the
Wahgi valley difficult to see. 36 These are based on samples of 41 women and 223 men, listed in the Aviamp Village Book, for whom
age estimate corrections could be made. Fewer women than men were included because of an effect ob served in the age estimates made by Australian patrol officers. The 41 women were Tungei by birth; new estimates made when they moved to their husbands' clans showed that brides usually 'gained' about four
years in the process. The childhood estimates for these women were taken to be more correct. Similar estimates were not available for the remainder of the women in the census book.
37 The Tungei included in this census come from seven clans joined into three intermarrying units. In the period from approximately 1943 until the 1958 census, 60% of marriages to men were contracted from outside these clans.
F
This content downloaded from 130.56.64.29 on Tue, 23 Jul 2013 09:38:26 AMAll use subject to JSTOR Terms and Conditions
258 THE JOURNAL OF PACIFIC HISTORY
males females
I- Iwl I 55-59 1899-03
50-54 ________ 1904-08
| 45-49 | 1909-13
| 40-44 [ 1914-18 I 35-39 I 1919-23
I 30-34 I 1924-28 | 25-29 | 1929-33
| 120-24 | 1934-38
| : 15-19 | _ 1939-43 I i 10-14 | 1944-48 I I 5-9 j 1949-53
I 0-4 I 1954-58 I-1-T-1 I -1 I '-1 | |
100 80 60 40 20 20 40 60 80 100
j j j_j cannot be estimated directly
I 65+ 1889-93
I 60-64 1894-98
I 55-59 I 1899-03
_L_ 50-54 | 1904-08
I 45-49 I 1909-13
I 40-44 | 1914-18
| 35-39 | 1919-23 | 30-34 | 1924-28
I 25-29 I 1929-33
I 20-24 _ 1934-38
j 15-19_ 1939-43
| 10-14 I_ 1944-48
| 5-9 j 1949-53
I 0-4 | 1954-58 i i-h-1-1
' '-1-r?1?i-1 i
100 80 60 40 20 20 40 60 80 100
_[ 65+ 1889-93
i~ 60-64 I 1894-98
j 55-59 H 1899-03
_[_ 50-54 | 1904-08
| 45-49 | 1909-13
I 40-44 1 1914-18 | 35-39 | 1919-23
| 30-34 | 1924-28
I 25-29 | 1929-33 | 20-24 _ 1934-38
j 15-19 ̂______ 1939-43
] i 10-14 I_
1944-48
I ""
5-9 | 1949-53 I 0-4 I 1954-58
I I 'l I I -1 I ' I-1 I 100 80 60 40 20 20 40 60 80 100
TUNGEI MONGKA age structure in 1958
Figure 6
This content downloaded from 130.56.64.29 on Tue, 23 Jul 2013 09:38:26 AMAll use subject to JSTOR Terms and Conditions
A DYSENTERY EPIDEMIC IN NEW GUINEA 259
dysentery and, with their young wives, to recover and have children to replace infants they may have lost in the epidemic. It is probable that the Tungei fit the
Konda model better than the Kuli-Pin model, but remembering that they had
no hospital close by at the time, some intermediate experience seems likely. Post-infant deaths at most of 5% might have been the case, compared with the
2.7% of Konda and 10-11% of Kuli-Pin.
one objective of this paper has been to document the geographical spread of
epidemic dysentery in the New Guinea highlands in 1943-45, but information
on many areas is sadly lacking. Hospital returns give a good idea of when the
epidemic was worst in the main parts of the Wahgi Valley, Chimbu and
eastern Enga, but it is almost impossible to say whether bordering areas, large
ly unvisited by observers, were affected or not. On one hand, they should have
been spared because traffic between them and the infected parts of the
highlands was small in comparison to the wartime patrol traffic plying the main
valleys, and the direct contact that the latter had with military areas through air transport. On the other hand, once infected some of the highly populated side valleys and remoter parts of Simbu and Enga Provinces, for example,
would have had little access to medical care. Local inquiries may be able to
resolve this issue. In the case of my own research at Aviamp, the Tungei ap
pear to fit the epidemic model of the Komun River Kuli rather better than they do that of the hard-hit Kuli-Pin. Only a few adults are known to have died
from dysentery ?at least only a few adult males.
A point so far not considered is the likely pattern of infection. From the few
clues given in the War Diaries, and from the statistical evidence that mortality could vary greatly even within one tribe, it is improbable that infection was
uniform on a highlands-wide scale. I have not considered the Eastern
Highlands; judging by the distribution of hospitals and the comments in
reports, ANGAU was not so concerned about the state of health there. Against this many areas were classified as 'uncontrolled', but they did not escape infec
tion and many deaths occurred.38 Regionally, in the Wahgi Valley for exam
ple, it is also improbable that all groups were equally affected. Cultural factors
are thought by some to play an important part in the spread of epidemic disease
of this kind. Over millenia, highlanders have been insulated from external
events, and very probably from external sources of infection. But at the tribal
level the typical dispersed hamlets of the Western Highlands, Simbu and Enga are also likely to dampen rapid contagion. This can be upset in times of social
stress, as Feachem illustrates: the Raiapu Enga gather together after a death to
cry and wail, comfort the bereaved in crowded houses, and finally congregate 38 Cf. S. Lindenbaum, Kuru Sorcery (Palo Alto 1979), 31, 58.
This content downloaded from 130.56.64.29 on Tue, 23 Jul 2013 09:38:26 AMAll use subject to JSTOR Terms and Conditions

260 THE JOURNAL OF PACIFIC HISTORY
to share wealth and food; 'all these aspects of kumanda (the Raiapu response to
death) facilitate the rapid spread of an epidemic and destroy the advantages
gained from dispersed dwelling patterns'.39 In Tungei society, clans gather for anange nonmen (gather and wail). In addi
tion, traditionally inspired efforts to avert death during the dysentery epidemic included collecting faeces on banana leaves for diagnostic purposes, and killing a pig, which was shared with close sub-clan relatives, for magico-religious reasons. In combination this was obviously extremely dangerous. Had the at
tack of the disease been as sudden as some other contagious epidemic diseases
to strike at tribal populations, a level of crisis of a different order altogether could have been induced. Neel argues, for example, that the high death rates in
newly contacted South American Indians are the result of the collapse of village
life, rather than a lack of resistance to the new disease in itself.*0 Lack of im
munity, rather, has the side effect that everyone is attacked at the same time, and no one is left to care for the sick or feed small children. Similarly, Linden
baum states that the Eastern Highlands Fore feared in 1943 that the dysentery
epidemic would cause a collapse of organized labour, and that crops would rot
in the ground, causing mass starvation.41 Significantly, the Fore saw the
epidemic as a temporary malady, rather as a form of sorcery.42 Clarke, on the
other hand, says the epidemic incited the Simbai Valley Bomagai-Angoiang to
disperse their houses and move away from 'bad' places.43 I do not believe dysentery caused social collapse in the main valleys of the
highlands in 1943-45. The patrol reports from 1945 described healthy popula tions shortly after the epidemic; moreover, the populations affected in New
Guinea were otherwise in a good state of health, and were adequately nourish
ed. With few purely dietary and medical changes to their lifestyle, they have
grown consistenUy at 1.75-2.25% p.a. in the post-war period. At no time dur
ing the epidemic did bush hospital death rates rise above 5-7%; this is about
the same as the case-mortality rates of Australians at Gallipoli (about 5%), and
is much better than those of the British soldiers in the Crimea (about 27%).
However, the recovery of patients in hospital probably owed more to the type of care received than to the use of any particular drug.
In the Western Highlands, in Simbu, and in Enga, where approximately
39 R. Feachem, 'Environmental health engineering as human ecology: an example from New Guinea', in T. Bayliss-Smith and R. Feachem (eds), Subsistence and Survival: rural ecology in the Pacific (London 1977), p.
166. 40
J. Neel, 'Health and Disease in unacculturated Amerindian populations', in P. Hugh-Jones et al., Health and Disease in Tribal Societies (Amsterdam 1977), 162.
41 Lindenbaum, op. cit., 116.
42 Ibid., 58.
43 W. C. Clarke, Place and People (Canberra 1971), 102.
This content downloaded from 130.56.64.29 on Tue, 23 Jul 2013 09:38:26 AMAll use subject to JSTOR Terms and Conditions

A DYSENTERY EPIDEMIC IN NEW GUINEA 261
300,000 people44 are thought to have been living in 1943-45, a general death
rate of 5% would have caused 15,000 deaths, as opposed to the official 262
deaths in Chimbu by 1 February 1944, and about 510 for the highlands as a
whole by September 1944. How many people were really affected, and to what
extent peripheral groups like the Maring speaking Bomagai-Angoiang or
Tsembaga suffered, is frankly unknown.45 A lower death rate, perhaps
equivalent to 2.5% of the general population in the main valleys, however, would better satisfy the balance of probabilities arising from the evidence
available.
44 The population of Western Highlands (then including Enga) and Chimbu Districts passed 500,000 in the late 1960s. At a rate of growth of 2% p.a., it would therefore have been about 305,000 25 years earlier.
At a rate of growth of 1.75% p.a., it would have been 324,000 at the earlier date; and at a rate of growth of 1.5% p.a., 345,000.
45 R. Rappaport, Pigs for the Ancestors: ritual in the ecology of a New Guinea people (New Haven, 1968), 9.
MELANESIAN ARCHIVE
The goal of the Melanesian Archive is to assemble the most comprehensive collection of unpublished
papers on Melanesian topics by scholars in any field. The Archive will be concerned only with the
unpublished literature' in Melanesian studies that is often inaccessible to scholars. The Archive
will maintain both physical and computer files of contributed papers, will generate periodic com
prehensive and specialized topical bibliographies, and will provide both bibliographies and
microfiche copies of holdings to the academic institutions of Melanesia (gratis) and to subscribers
to the Archive (at nominal cost). The Archive now requests copies of all unpublished papers on
Melanesian ethnography in any field. Please send all papers and inquiries to: Melanesian Archive,
Department of Anthropology C-001, University of California at San Diego, La Jolla, California
92093 U.S.A.
THE FORTUNES OF CHARLES W. ABEL OF KWATO: A NOTE
I wish to call attention to four matters of detail which appeared in my article in The Journal of
Pacific History, XVII: 4(1982), 195-212. The errors, which arose from transcription or reliance on
a document supplied by an informant, came to light after the article was printed. The corrections are as follows:
p. 195 line 17: 1862 p. 205 line 26: June p. 209 line 1: 60
p. 212 line 18: 1900 DAVID WETHERELL
This content downloaded from 130.56.64.29 on Tue, 23 Jul 2013 09:38:26 AMAll use subject to JSTOR Terms and Conditions
![Labirinti immaginari. Su Borges [Imaginary Labyrinths. On Borges], Mimesis, Milano-Udine 2011 (236 pp.).](https://static.fdokumen.com/doc/165x107/6322be73078ed8e56c0a8bc3/labirinti-immaginari-su-borges-imaginary-labyrinths-on-borges-mimesis-milano-udine.jpg)