Building up of an Efficient Marketing System to Obviate the ...
176
22 Research Report: IX/ADRT/104 BUILDING UP OF AN EFFICIENT MARKETING SYSTEM TO OBVIATE THE NEED FOR LARGE SCALE STATE INTERVENTION IN KARNATAKA R S Deshpande J Prachitha Agricultural Development and Rural Transformation Unit Institute for Social and Economic Change Nagarbhavi, Bangalore-560 072 June 2004
-
Upload
khangminh22 -
Category
Documents
-
view
1 -
download
0
Transcript of Building up of an Efficient Marketing System to Obviate the ...

22
Research Report: IX/ADRT/104
BUILDING UP OF AN EFFICIENT MARKETING SYSTEM TO OBVIATE THE
NEED FOR LARGE SCALE STATE INTERVENTION IN KARNATAKA
R S Deshpande
J Prachitha
Agricultural Development and Rural Transformation Unit Institute for Social and Economic Change
Nagarbhavi, Bangalore-560 072
June 2004

23
CONTENTS
TITLE
FOREWORD PREFACE CHAPTER I INTRODUCTION
1.1 Market and The State 1.2 The Problem 1.3 Objectives and Scope 1.4 The Survey 1.5 Chapter Scheme
CHAPTER II PRODUCTION, MARKETING AND MARKET REGULATIONS OF AGRICULTURAL MARKET
2.1 Introduction 2.2 Rules, Procedures and Modalities of
Regulation of Agricultural Markets 2.3 Agricultural Marketing System at The Primary
Level 2.4 Marketing Structure and Market Institutions 2.5 Market Infrastructure 2.6 Regulated Markets and Market Yards 2.7 Storage Capacity 2.8 Cost of State Intervention in Market 2.9 Cropping Pattern 2.10 Irrigation 2.11 Area, Production and Yield of Rice and Wheat 2.12 Production, Market Arrivals and Procurement 2.13 Price Movement of Selected Commodities 2.14 Concluding Remarks
Annexure 2.1
CHAPTER III SALIENT AGRO-ECONOMIC CHARACTERISTICS
OF SELECTED DISTRICTS
3.1 Introduction 3.2 Raichur District 3.3 Agricultural Economy of Raichur 3.4 Chitradurga District 3.5 Market Arrivals, Procurement and Marketed
Surplus in Chitradurga 3.6 Concluding Remarks

24
CHAPTER NO. TITLE
CHAPTER IV SAMPLE PROFILES OF THE SELECTED REGIONS
4.1 Introduction 4.2 Raichur District 4.3 Davangere District 4.4 Summary
CHAPTER V MARKETING IN RAICHUR DISTRICT
5.1 Introduction 5.2 Production and Marketing of Crops in Raichur 5.3 Seasonality in Marketing 5.4 Market Arrivals and Prices Received in Raichur 5.5 Transportation of Marketed Surplus 5.6 Farmers’ Responses about Marketing 5.7 Conclusions
CHAPTER VI MARKETING IN DAVANGERE DISTRICT
6.1 Introduction 6.2 Production and Marketing of Crops in Davangere 6.3 Seasonality in Marketing 6.4 Market Arrivals and Prices Received in Davangere 6.5 Transportation of Marketed Surplus 6.6 Farmers’ Responses about Marketing 6.7 Conclusions
CHAPTER VII SUMMARY AND CONCLUSIONS
7.1 Introduction 7.2 The Canvass 7.3 Market Regulations and Institutions 7.4 Marketing Paddy in Raichur District 7.5 Marketing in Davangere District 7.6 Towards an Efficient Marketing System
REFERENCES
25
FOREWORD
Recent changes in economic policy and the liberalisation of the economy placed domestic market reforms high on the agenda in the present market restructuring. In this process of compliance to the requirement of the WTO and also dealing with the domestic market infrastructure, agricultural marketing continued to occupy an incidental place in almost all policy debates. The Agriculture Produce Marketing Acts passed by various States to mete out the inadequacies in agricultural marketing proved vain despite numerous amendments, as they were tuned to the situation prevalent then. Hence, the farmers remained deprived of enjoying the long-term benefits of these measures. The Minimum Support Price Scheme is in operation in Karnataka, but without any significant procurement and administrative infrastructure. In the present context of an open economy and with the emerging challenges on the fore, apprehensions are expressed about the impact of fluctuations in international prices on the domestic production, which in turn depends on the functioning of the domestic markets. In view of these, a study on examining the functioning of the domestic markets in the case of important commodities in Karnataka has assumed importance. It is also necessary to analyse the marketing environment of the farmer for want of improving the marketing efficiency. The major focal point of the study being the marketing system in the State, attention has been paid to examining the deficiencies in the factors impacting market efficiency of a few important agricultural commodities like Paddy and Maize in selected districts of Raichur and Davangere and exploring the possibilities of adoption and developing of future markets in the case of these commodities. The study reveals that the major constraints confronting the farmers in marketing their produce is the lack of infrastructure facilities in the market yards and its neighbourhood. Procurement operations are observed to be almost absent with inadequate administrative support. Commission agents function at a low key and the concept of Commission agent appears to be quite different in Karnataka as they procure directly from the villages and perform an overlapping dual role of an agent and moneylender. Future markets could be one of the possibilities in the State and the study confirms that the farmers are unaware of these but may welcome the idea. Overall, the marketing system in Karnataka is lagging behind in all requisites like procurement, operating functionaries in the market and the institutional and infrastructure facilities in contrast to the systems existing in a few other states. The study suggests a few steps to re-energise the marketing system in tune with the changing economic environment. The study also suggests quite a few policy steps for developing an efficient marketing system. I believe that the results of the study will be of great use to the policy makers and academicians.
R S Deshpande Professor and Head
Agricultural Development & Rural Transformation Unit Institute for Social and Economic Change Bangalore

26
PREFACE
Agricultural marketing in Karnataka, even though mostly regulated by the State, has
a long way to go in its process of development as compared to the systems that exist in
agriculturally forward states of Punjab, Haryana, Maharashtra, Andhra Pradesh and Tamil
Nadu. The region of Karnataka is primordially not a grain-marketing region. It is only
recently that Asizeable marketable surplus is finding its way to the formal marketing
systems. Karnataka, as known has specialized in the marketing of commercial crops, and
adequate provisions have been made to regulate and improve the marketing of these cash
crops. In recent years, the increased production of foodgrains in the State has created a
marketable surplus and the commercialization of these crops has been steered up. Hence,
grain-marketing remains only an emerging field and not a well-developed one.
The markets in the State are scantily distributed throughout and the infrastructure and
other facilities available in them are still pathetic. Even after five decades of continuous policy
intervention, unscrupulous practices like late payment to the farmers, under-pricing, arbitrary
grading and non-issue of sale slips by the traders continue to dog the markets. Lack of proper
infrastructure in the market yards mounts congestion and create inconvenience to the
farmers. Owing to these, the marketable surplus that arises does not reach the market yards
and is sold outside the markets. Markets are yet to be developed by warding off these
inefficiencies.
The procurement of foodgrains in Karnataka is also very low. There are only a few
procurement agencies functioning in the State and these are confined to specific crops. The
procurement of grains takes place only in the case of rice and that too through the
processing mills. The Commission agents do not operate in the similar manner in which
they operate in the other well-developed areas like Haryana and Punjab where a farmer
necessarily depends on the commission agent for the sale of his produce. In Karnataka, the
situation is quite contrary as the commission agents operate at a very low key and they
procure from the farmers directly from the fields.
On the whole, the marketing system in Karnataka is rudimentary and
comprehensive policies have to be implemented to develop it into an effective, efficient and
well-developed one. This study thus examines the functioning of the domestic markets in

27
the case of important commodities in Karnataka to throw light into the inefficiencies
confronting the farmer and to prescribe necessary measures.
The project has been co-ordinated by Prof. J. P. Singh of the Agro-Economic
Research Centre, University of Delhi, and owes a great deal to his in-depth understanding
of the subject. The study was totally conceived by him and he constantly supported it by
steering all through the process. In fact, he provided material for the study right from the
proposal, schedule and the scheme stages. It is our privilege to thank him for all his
earnest efforts and also appreciate his deep understanding and wider foresight of the
subject, which has contributed substantially to the study.
We are thankful to Mr. Vivekananda, who was in-charge of this project and had
taken all pains to collect the necessary information required for the study. He retired in the
meantime and in the process he handed over only the tables. The data collected were not
handed over and hence, some issues could not be incorporated in the study. Therefore,
the study has been carried out with these constraints as we did not have access to the
original data.
At the Institute level, we thank our colleagues Dr. Bhende, Dr. Thippaiah, for
suggestions and Mr. Muddu Krishna, Mr. Rajendra B Desai for their help at various stages.
The study cut through many hurdles including crashing of hard disk containing the data
and the missing tables. But, with help from Mr. Muddu Krishna and Mr Rajendra Desai we
could complete the work. Mr. M.K. Mohan Kumar as usual carried out the word-processing
unmindful of various drafts and illegible handwritten manuscripts. His help is gratefully
acknowledged.
Needless to add that the errors of commission and omission are ours.
R S Deshpande
J Prachitha

28
CHAPTER I
INTRODUCTION 1.1 Market and The State
Sizeable amount of work in development economics literature has been devoted to
the debate on the role of state as against the role of market as a catalytic institution in the
aggregate development process. The debate began with the early theories of economic
development, where it was argued that failure of allocation of investment to the deserving
developmental sectors created structural imbalances in the process of development. A
group of theoreticians blamed it on the failure of the state whereas, a few others held
market responsible for that. One common understanding, however, which emerged in this
debate was that the role of the state as against that of the market had to be pursued
differently in the context of developing and developed world (Chenery and Srinivasan,
1989).
Recently, again, the debate came alive in the context of the process of
liberalization, where it is argued that the role of the state should be minimised over time so
as the market forces create a proper atmosphere for economic growth. It is currently
believed that rational and most desirable resource allocation takes place through the
market forces. We find a strong rejection of these views also. An inherent assumption of
this argument is that the structure as well as quality of growth will be automatically taken
care of, moreover, the aggregate process will help in correcting the distribution
parameters. In view of this new thinking in the context of developing countries, it is
essential to look into the basic tenets of the role of state and that of the market in the
process of development in India. Anne Krueger (1990: p 22) while arguing on the platform
of the symposium on the State and Economic Development concluded that “At a general
level there are innumerable questions as to how political and economic markets interact.
At more mundane levels, there are endless opportunities for research, analysing the
functioning of alternative policies and institutions, documenting and hopefully quantifying
policy interventions, the response to them, and their evolution over time.” But at the same
time we find a strong opposition to this view emerging not only from the Indian academic
field but vehemently supported by well-known development economists. In the words of
Byres, “The current orthodoxy, to the effect that ‘rolling back the State’ and the full
blooded operation of markets are appropriate to India’s problems, lacks historical warrant

29
and intellectual justification” (1997: p 37). This signifies that the scene of argument is not
very clear in the minds of development economists, especially speaking in the context of
India, viz., Pranab Bardhan, Terence Byres, Amit Bhaduri, Mrinal Datta Choudhury, Arvind
Pangaria etc.
After the Second World War and with the emergence of strong socialist block, the
role of State in the policy making in the developing countries became very strong. This
was intense in the case of democratic countries and the countries that had achieved
freedom during that period. The role of State was envisioned, as a body fully aware of the
welfare needs of its constituents (Boeninger, 1991, p.268). This amorphous institution was
visualised through a collective group of individuals representing various strata in the
society. Therefore, it was quite natural to expect that these groups would have full
knowledge about the welfare of the society at large and thus, the decisions taken by them
would be welfare enhancing for the society. Under this assumption the process of
‘Statisation’ became very strong during the late 40s and was consolidated during the
following decades. Till the mid-seventies, this process had concretised in the socialist
countries as well as in the countries that were favourably placed with socialistic ideas.
However, the failure of the State came to light when the bureaucratisation increased
substantially in some of the countries and controls took an enormous form, creating huge
transaction costs. In India, controls in terms of Government planning on one hand, and
the myopic view of the peoples’ representatives on the other, directed the State policies.
As a result, the State policies lacked a long-term consistent directions and the belief that all
sectors and sub-sectors of the economy could be maneuvered through plan allocations.
Most of these directions were derived from the bodies, which were outside the country, and
at times operated from the precincts of favourite themes of the people who mattered. The
private sector initiatives in the process were curbed through controls and licenses. This
helped consolidate the State’s power but finally provided an undue advantage to the
bureaucrats representing the State. Different levels and parts of the Government were
poorly coordinating among themselves and that caused poor reading of the initial signals of
failures. The controls also created lobbying, corruption and unproductive investment with
full support from the State bureaucracy. The limitations of the State came to the fore
during the early eighties and these were strongly put forward by various authors during
that period. As Pranab Bardhan (1990:Pp 3) puts it, “The literature in development
economics has now turned full circle from the unquestioning dirigisme of the early 1950s to
the gory neoclassical accounts in recent years of the failures and disasters of regulatory,

30
interventionist states”. The forces of development were formulated in such a way that even
in the mixed economies the market operations were strongly influenced through the State
policies (Regulated Market Act, Movement of Commodities, price dictations in factor and
product markets, etc.).
1.1.1 A Systemic View and Failure Paradigm
In a systemic approach the state is visualised as the provider of basic public goods
(merit goods) and organizes the production process through incentives and allocations
while operating through monetary and fiscal policies. Thus, coordination becomes an
underlined function of the state. But the failure of such coordination due to the emergence
of transaction costs and rent-seeking attitude of the polity and bureaucracy together have
undermined ney distorted the image of the State. More often, the distortions are
recognised as the functional failures on the part of the State or the quality of the State. If
the role of the state has to be defined clearly it comes out fewer than six important
categories cross-classified in terms of the functions of the state (see, Table 1.1). Two broad
aspects of the functions of the state pertain to its addressing to market failure and to the
distribution parameters, keeping in view its role as a welfare State.
Table 1.1: Role of the State
Addressing Market Failure Improving Equity Minimal Functions
Providing Pure Public Goods Defense Law and Order Macro Economic Management Property Rights Public Health
Protecting the Poor Anti-Poverty Programmes Disaster Relief
Intermediate Functions
Addressing Externalities
Basic Education, Market Infrastructure
Regulating Monopoly Regulations for Control of Imperfections Anti-thrust Policy
Overcoming Imperfect Information
Market Information, Insurance (Health, Life, Pensions). Financial Regulations, Consumer Protection
Providing Social Insurance
Pensions, Family Allowances, Unemployment Insurance,
Activist Functions
Coordinating Coordinating/Regulating Private Activities
Markets and Addressing Market Imperfections Cluster Initiatives
Redistributive Redistribute for Assets and Access to Resource
Source: Based on World Bank Development Economics Conference (1991) and Journal of Economic Perspective (1990).
These two broad aspects are cross-classified with three levels of function from a
view point of intensity, viz., minimal, intermediary and activist functions of the state. In

31
this framework, the question does not remain to be state or market as the major or leading
catalyst but the debate reflects itself in Ostrom’s and Walker’s framework of neither of the
two playing leading role in a long term perspective.
The problems of the State intervention can be listed in the best possible manner
under following categories:
Individuals may know better about their requirement and preferences and state fails in
aggregating such behaviour.
State planning may increase the aggregate risk of failure by pointing every policy in the
same direction. State may make bigger mistakes with little chance for on-line
corrections.
State centralised planning may be more rigid, inflexible and location non-specific.
The institutions indicate incapability in administering a detailed plan.
State may curb private sector’s initiative through bureaucratic procedures.
Organisations and individuals require incentives to work, innovate, control and allocate
efficiently. Rewards or shocks of market cannot be replicated under the State control.
Different levels and parts of State usually coordinate poorly. Lack of correcting signals
and structural information mars the results of the interventions.
Controls create lobbying, corruption, unproductive activities.
Vested interests of bureaucrats, industrialists and rich can manipulate State planning,
whereas rural planning may intensify and consolidate the power of interest groups.
Market, on the other hand, is usually visualised as an alternative institution that
optimises the welfare function of the stake-holders through price mechanism. Behind the
free market ideology, often, Adam Smith’s famous quotation is given, viz., ‘market having
profit motives drive the economy to an efficient solution as if achieved with an invisible
hand’. It is strongly believed that markets as an invisible hand operates the economic
forces augmenting welfare of all the players. The Pareto optimality in arriving at the
optimal aggregate gains by optimising welfare of all the stakeholders became the theme
behind market fundamentalism. It is argued that the interest of the stakeholders criss-
cross each other to iron out the inefficiencies in the transactions and thereby the profits will
be optimally distributed in proportion to the efforts of the individual members in the
production process. Many challenged this view in no uncertain terms. Prof Stiglitz wrote
very recently, ”The rhetoric of market fundamentalism asserts that privatisation will reduce

32
what economists call the `rent-seeking’ activity of government officials who either skim-off
the profits of government enterprises or award contracts and jobs to their friends. But in
contrast to what it was supposed to do, privatisation has made matters so much worse that
in many countries today privatisation is jokingly referred to as ‘briberization’. If a
government is corrupt, there is little evidence that privatisation will solve the problem”
(2002:Pp 55). Markets thus have palpable problems and especially so in a country which
has inadequate infrastructure. Inequalities in terms of non-players provide wrong signals
emerging out of the market and such signals end up in either monopolistic or oligopolistic
behaviour in the market. The market failures are usually not insured and thus the
institutions are governed largely by the State bureaucracy, which remain inflexible thereby
obtaining the worst out of the two domains of market and the State. The major reasons
for failure of markets are listed hereunder:
Externalities in terms of non-players are involved in the market but usually not
highlighted.
Market condition is usually Oligopolistic or Monopolistic.
Increasing returns to scale operate in the market institutions. The larger the share, the
larger is the control of the market forces. Thus big fishes dominate.
There is hardly any insurance of market failures. – Future markets are far from being
perfect.
Market adjustments may move slowly and institutions largely remain inflexible.
Information regarding the product and prices etc. is always imperfect and does not
reach the stakeholder without some time -lag. This time -lag provides the best scope
for manipulation.
Individuals may not necessarily act to maximize anything explicitly.
Government taxation is unavoidable and may affect the efficiency of the market.
In the context of the above arguments, it is essential to revisit the questions in a more
pragmatic manner, specifically in the context of individual policy interventions. Indian state
cannot be called as one among the strong states. Moreover, the kind of infrastructure that
we have at our disposal surely does not permit the markets to function at the optimal
efficiency level. No doubt, market-oriented policies and demand driven planning may have
added advantages in the present context of liberalisation, privatisation, globalisation and
good governance but the limitations imposed by market operators and operands are not
easily surmountable and hence, in this context, it becomes essential to view market as an

33
institution guided both by the price signals and the State policies. After a detailed analysis
of South Asian economies, Mrinal Datta-Chaudhuri warns that “Market failures present
serious obstacles to the growth process of a backward economy” (1990, p.37). The failure
of markets to protect the welfare of producers stems largely from the inadequacy of the
infrastructure as well as the huge market margins and the participation of the stakeholders.
These problems need to be examined in detail, if the markets have to function effectively
and the best combination of State and market emerges through a viewpoint of the
stakeholders.
1.2 The Problem
Agricultural marketing in India has grown in historical sense, mainly through State
regulations than market signals. This was necessitated as the existing mechanism was more
truncated against the sellers and favoured unhealthy practices. The hierarchical society and
the production relations were clearly reflected in the existing distortions in the market. The
history of regulated markets in India can be traced back to the Hyderabad Residency Order of
1886, which brought Cotton under regulation for marketing. This was followed by the Cotton
and Grain Market Act enacted in Berar region of the then Nizam State. The Indian Central
Cotton Committee recommended to enact the Cotton Markets Act of 1927. Followed by this,
the Royal Commission on Agriculture of 1928 strongly recommended the establishment of
regulated markets in the country. A few provinces in British India enacted the Regulated
Markets Act and thus by the time of independence, about 250 regulated markets existed in
different parts of the country. All these initiatives were directed more towards commercial
crop markets and in relatively better-off regions. It was during the First plan period that the
Planning Commission had directed the state governments to bring agricultural marketing
under specifically enacted Regulated Market Act (called as Agricultural Produce Marketing Act)
which most of the states complied with, though slowly. The problems of marketing failures
were highlighted and it was expected that the legal framework would take care of the
following problems:
i. Undercover Sale ii. Removal of large samples iii. Unwarranted trade allowances iv. Heavy market charges v. Unauthorised deductions vi. Incorrect weighing and multiple units of measurement vii. Absence of grading viii. Presence of touts

34
These problems compounded the market imperfections and therefore, a series of
steps were taken to deal with these. In view of these problems, agricultural marketing
after independence in India has been undergoing brisk changes over the last five decades.
The Regulated Market Acts enacted by various State governments incorporated a well
designed legal framework to deal with these issues. These changes can be classified in
four broad groups, namely: i. Introduction of Agricultural Marketing Institutions in India, ii.
Creation of marketing infrastructure, iii. Co-operative Marketing as an alternative to protect
weaker participants in the market, and iv. Emergence of the Regulated Market Act and
subsequent modifications in that. It is quite clear that these changes occurred due to the
prevailing circumstances and the ongoing reorganisation in the agricultural sector during
these early decades. Four components predominated the policy interventions viz.: i. Putting
in place regulation of marketing functions and removing imperfections; ii. Creating
infrastructure to facilitate the process of marketing; iii. Introduction of Price intervention
schemes; iv. Procurement and distribution of essential commodities. All these measures
were operating simultaneously and therefore, had a cumulative effect on marketing sector.
An institutional intervention in the agricultural price policy was introduced during
the late sixties in the form of Agricultural Prices Commission. It was set up to evolve a
balanced and integrated price structure in the perspective of the overall needs of the
economy. Initial emphasis of the Prices Commission was on reducing fluctuations in food
grain prices and making available foodgrains for the Public Distribution System. The
emphasis shifted from consumers to the producers during the mid-eighties and further, the
questions were raised about its role in changing international trade scenario.
Minimum Support Prices (MSP), as one of the tools of the price policy, worked as a
significant intervention measure in the functioning of the foodgrain markets. Similarly, the
price regimes prevailing under the Public Distribution System (PDS) also impacted the grain
prices and the market behaviour of foodgrains. Therefore, the price signals emerging from
the market (especially, for the foodgrains) were not real but truncated due to MSP or PDS
prices. The situation has been changing fast during the current decade. There are
sufficient stocks of foodgrains with the government and thus, the demand for PDS can be
met easily. Added to this, the targeted PDS has reduced the requirements through
procurement. At the same time, pressure is exerted by the international price trends on
the domestic market. Apprehensions are being expressed about the impact of fluctuations

35
in international prices on domestic production. All that, however, depends on the
functioning of the domestic markets.
The present study is undertaken to examine the functioning of domestic markets in
the case of these important agricultural commodities in Karnataka. The specific objectives
of the study are deliberated below.
1.3 Objectives and Scope
1. To examine the prevailing system of marketing of important agricultural
commodities in Karnataka
2. To examine the role of government and non-government agencies, such as FCI,
Food and civil Supplies Department, Cooperatives, NAFED and private marketing
agencies in the procurement /purchase, storage and marketing of Paddy and Maize
and to evaluate/ assess critically their financial and organizational constraints.
3. To examine deficiencies in factors impacting market efficiency, such as physical
infrastructure, market intelligence and trade practices for Paddy and Maize and
suggest measures to improve them.
4. To examine the possibility of adoption of future markets in the case of Paddy and
Maize. In case such markets are already operating for the commodity, then, to
examine their performance in price risk management and price discovery as well as
in handling the situation of surplus and shortages through coordination of storage
decisions of market participants.
5. To suggest measures to improve marketing efficiency.
This study is concerned with product markets only. The input markets though
important from the point of agriculture production, are out of the purview of this study.
This is being done to delimit the area of research of the study so that it can be completed
within stipulated time-frame. The study is based on both secondary and primary data and it
covers two important crops grown in the state. The primary survey for the study has been
carried out to obtain information on marketing of the produce of Kharif and Rabi of 2001-
2002 agricultural year using structural questionnaires.
1.3.1 Selection of Crops and Districts

36
As per the design of the study by the Co-ordinating Centre (AERC, University of
Delhi), the study has to cover two or three important crops of the state for primary
investigation using appropriate criteria from among the criteria listed, namely: (i) Crops
with state intervention, (ii) Area and production, (iii) Cash income to farmers, (iv) Export,
present and potential, and (v) Employment generation. The procurement in the state is
higher in the case of Rice and maize. There is hardly any significant and consistent
procurement in the case of other crops.
Table 1.2: Changes in Area, Production and Yield of Rice in Districts of Karnataka
District Area ( 000 Hectares ) Production ( 000 Tonnes ) Yield ( Kg/Hectare)
1989-90 to
1991-92
1994-95 to
1996-97
1997-98 to
1999-2000
1989-90to
1991-92
1994-95to
1996-97
1997-98 to
1999-2000
1989-90 to
1991-92
1994-95 to
1996-97
1997-98 to
1999-2000
Bangalore (U) 16.31 0.48 45.26 22.49 10.23 23.69 5.30 9.70 -14.85
Bangalore (R) 51.92 95.92 28.62 86.56 139.47 43.06 22.82 22.26 11.20
Belgaum -7.99 0.77 -0.51 14.22 0.71 30.39 24.12 -0.06 31.09
Bellary 11.06 -5.09 37.55 22.82 16.92 58.22 10.56 23.20 15.02
Bidar 21.16 -21.25 6.83 -40.49 157.12 37.11 -50.89 226.64 28.47
Bijapur -3.46 -38.66 -18.89 42.90 -49.89 -20.31 47.96 -18.30 -1.75
Chickmagalur -5.73 -9.37 3.22 -1.88 -13.52 3.53 4.09 -4.59 0.31
Chitradurga -25.17 5.65 -81.86 -22.65 2.20 -86.77 3.38 -3.26 -27.08
D.Kannada -0.63 -2.36 -52.28 -1.46 2.01 -49.43 -0.85 4.51 5.97
Dharwad 4.56 -6.70 -56.26 129.37 -44.11 -62.98 119.26 -40.10 -15.34
Gulbarga 12.68 105.99 120.59 -17.65 264.21 140.48 -26.89 76.86 8.99
Hassan 11.86 -4.14 -0.27 19.63 -18.15 -1.94 6.95 -14.61 -1.68
Kolar 46.73 81.05 -50.94 91.65 120.01 -57.56 30.60 21.49 -13.51
Mandya 2.23 11.94 -7.13 0.02 -0.64 3.09 -2.18 -11.22 11.01
Mysore 23.68 4.35 -12.49 30.13 -0.36 -13.69 5.22 -4.49 -1.38
Raichur 46.92 9.23 -14.20 76.68 9.80 -3.89 20.23 -0.48 12.02
Shimoga -5.45 2.64 -20.00 -2.95 -7.06 -21.74 2.66 -9.44 -2.19
Tumakur 17.82 87.12 19.15 29.63 120.12 17.10 10.01 17.60 -1.71
U.Kannada 0.32 3.35 -1.75 9.96 -9.09 7.77 9.60 -12.04 9.71
Coorg -1.86 -11.37 -9.65 8.65 -21.10 -6.71 10.71 -10.98 3.23
STATE 7.22 4.85 6.92 18.90 1.39 13.14 10.95 -3.28 5.73
Source: Computations based on the data collected from the Directorate of Economics and Statistics, Govt of Karnataka, Bangalore.

37
Table 1.3: Changes in Area, Production and Yield of Maize in Districts of Karnataka
Area ( 000 Hectares ) Production ( 000 Tonnes ) Yield ( Kg/Hectare ) District
1989-90 to
1991-92
1994-95 to
1996-97
1997-98 to1999-2000
1989-90 to
1991-92
1994-95 to
1996-97
1997-98 to1999-2000
1989-90 to
1991-92
1994-95 to
1996-97
1997-98 to1999-2000
Bangalore (U) 12.07 -14.63 5.30 16.03 41.33 5.27 3.52 65.51 -0.03Bangalore (R) 12.93 -0.19 4.11 9.85 42.83 13.62 -2.71 43.08 9.15Belgaum -3.41 16.59 32.49 8.82 16.43 29.77 12.66 -0.13 -5.84Bellary 10.05 42.42 -39.27 2.64 61.50 -34.14 -6.73 13.40 8.43Bidar -58.65 -8.76 73.85 -58.74 -0.99 109.86 -0.23 8.52 -3.12Bijapur 14.72 8.59 -69.95 43.08 40.03 -75.55 24.75 28.94 -18.79Chickmagalur 11.78 91.08 -37.65 -3.49 102.97 -34.10 -13.67 6.24 5.79Chitradurga 43.32 33.51 -56.31 26.83 45.67 -61.74 -11.49 9.11 -12.42D.Kannada … … … … … … … … …Dharwad 63.90 45.28 -82.93 112.68 11.92 -81.39 29.75 -22.95 9.02Gulbarga -53.67 38.01 36.09 -46.40 55.28 26.79 15.70 12.51 -7.73Hassan 11.76 -19.64 134.88 -2.31 -14.13 263.53 -12.60 6.84 54.81Kolar 2.47 59.97 10.79 59.60 144.35 -21.86 55.79 52.75 -29.48Mandya -70.11 -91.97 -55.88 -75.56 -84.70 -49.40 -18.21 90.59 12.20Mysore -9.24 12.66 -39.87 -22.52 33.76 -39.94 -14.63 18.72 -0.12Raichur -37.71 29.33 -98.54 -10.50 3.57 -98.78 43.71 -19.91 -16.79Shimoga 26.61 105.04 -75.42 21.96 163.58 -68.81 -3.67 28.55 26.88Tumakur -42.32 65.48 89.32 -42.19 147.74 76.30 0.23 49.71 -6.90U.Kannada -39.60 -54.74 -3.33 -44.81 -40.30 -1.11 -8.64 31.85 -6.23Coorg 58.08 3.60 -2.84 38.29 24.08 2.78 -12.52 19.77 5.79STATE 8.27 29.65 8.30 20.86 40.27 11.72 9.64 8.36 3.35 Source: Same as in Table 1.2
Each year, the Government of India announces MSP for a number of crops. In the
case of market prices falling below the MSP, the State government may announce
procurement of the crop from procurement centres. There is no crop in the State other
than rice (procured by FCI) that has direct and significant State intervention over time.
Hence, the first criterion listed above is not considered. As the study is on efficient
marketing system to obviate the need for a large-scale state intervention, the fourth and
fifth criteria may not be suitable for selecting the crops. One of the indirect state
interventions is provision of regulated markets. In Karnataka, among the crops, the
quantity of produce marketed in regulated markets is highest for rice and maize in the year
2000-01 (Table 1.4). The two crops also have higher production compared to other crops in
the state. Hence, the two crops were selected for the study.

38
Table 1.4: Details of Quantity Marketed, Production and Area of Important Crops
Average over 1997-98 to 2000-01
Crops Quantity Marketed in Regulated Markets
(in 000 Tonnes)
Production (in 000 Tonnes)
% Marketed
Area (in lakh
Hectares)
% of Area to GCA
Rice 1704.3 3531.0 48.23 14.02 11.63 Wheat 37.9 187.5 21.25 2.60 2.16 Jowar 111.2 1494.0 7.79 18.82 15.62 Bajra 35.9 224.8 15.45 3.81 3.16 Ragi 95.2 1543.5 6.29 9.67 8.02 Maize 700.2 1732.3 40.17 5.76 4.17 Tur 75.8 218.5 38.29 4.73 3.93 Groundnut 318.8 929.0 36.07 11.19 9.29 Cotton 311.1 789.5 40.20 5.59 4.64 Chillies 57.5 75.8 18.54 0.92 0.76 Tobacco 0 56.0 0.01 0.77 0.64 coconut 34118.1 120806.3 14.13 2.33 1.93 Arecanut 90.8 102.8 44.63 0.74 0.61 Total Foodgrains 3280.7 9490.5 34.58 73.47 60.97 Total Pulses 347.2 726.0 48.85 18.04 14.97 Total Oil-seeds 485.2 1373.0 35.46 22.17 18.40 Total 41770.0 143280.3 29.15 194.62 -- Average GCA 120.5 --
Note: Gross Cropped Area is for the year 1999-2000 Source: (1) Karnataka State Agriculture Marketing Board Annual Report 2000-01
(2) Karnataka Economic Survey 2000-01 Secondly, one district where state intervention is the highest with respect to a
selected crop was to be selected. After selecting Raichur and Chitradurga districts, two
blocks from the selected districts were selected on the basis of differences in their agro-
climatic conditions and cropping pattern so that, taken together, they could represent the
district. From the selected block three villages representing different levels of market
access, i.e., easy, moderate and difficult, would have to be selected. Finally, from each
selected village 10 farmers would have to be selected based on probability proportion to
the operational area of farmers by stratifying the farmers into five size groups viz., less
than 1 ha., 1 to 2 ha, 2 to 4 ha, 4 to 6 ha and 6 ha and above.
1.3.2 Sampling Design Based on the indirect state intervention, viz., quantity marketed in regulated
markets for the two crops, rice and maize, Raichur district was selected for rice and

39
Chitradurga district was selected for maize (Table 1.5). Among the districts in the state, the
highest quantity of paddy was marketed in Raichur regulated market and the highest
quantity of maize was marketed in Chitradurga regulated market.
Table 1.5: Details of Quantity Marketed and Production of Paddy and Maize for the Year 2000-01
Districts Quantity Marketed in regulated markets
(in 000 Tonnes)
Production (in 000 Tonnes)
% Marketed Area (in 000
Hectares)
%in Total Area
Paddy Maize Paddy Maize Paddy Maize Paddy Maize Paddy MaizeBangalore(U) .. 2.72 28.13 4.51 .. 60.26 6.97 1.45 0.47 0.22Bangalore(R) 4.53 15.93 85.62 16.69 5.29 95.42 22.43 5.25 1.51 0.78Bellary 205.20 47.18 410.21 164.32 50.02 28.71 84.05 53.28 5.67 7.97Belguam 4.55 78.15 157.78 285.98 2.88 27.33 63.81 113.23 4.30 16.93Bijapur .. 4.93 0.79 47.17 .. 10.46 0.34 15.94 0.02 2.38Bidar 1.43 .. 15.71 0.78 9.10 .. 11.52 0.36 0.78 0.05Chikkamangalur 13.17 0.30 18.62 1.24 70.73 24.15 49.24 0.37 3.32 0.06Chitradurga 180.78 177.18 684.24 583.18 26.42 30.38 131.95 174.8
2 8.89 26.13
D Kannada 12.76 .. 192.19 .. 6.64 .. 62.98 .. 4.25 ..Dharwad 1.38 26.43 83.86 77.04 1.65 34.31 39.50 23.13 2.66 3.46Gulburga 19.89 .. 91.89 6.49 21.65 .. 32.21 2.45 2.17 0.37Hassan 29.68 13.57 254.97 58.17 11.64 23.32 68.24 14.75 4.60 2.21Kodagu 19.33 .. 127.52 5.44 15.16 .. 36.96 1.65 2.49 0.25Kolar 2.14 27.68 90.06 42.54 2.37 65.08 22.76 16.43 1.53 2.46Mandya 349.14 0.10 350.07 1.03 99.74 10.01 78.78 0.31 5.31 0.05Mysore 133.32 56.87 486.13 64.80 27.42 87.75 109.01 21.68 7.35 3.24Raichur 625.35 0.02 667.73 0.62 93.65 3.89 141.55 0.19 9.54 0.03Shimoga 141.02 50.83 556.16 61.70 25.36 82.38 156.36 18.67 10.54 2.79Tumkur 17.98 1.70 228.22 29.16 7.88 5.83 56.92 10.45 3.84 1.56U.Kannada 15.01 .. 236.85 0.51 6.34 .. 90.49 0.17 6.10 0.03Koppal 84.98 44.85 380.16 46.10 22.36 97.28 73.41 11.73 4.95 1.75CR Nagar 29.43 5.69 73.13 55.21 40.25 10.30 18.78 20.22 1.27 3.02Bagalkote .. 42.06 0.47 155.57 .. 27.04 0.17 51.88 0.01 7.76Gadag .. 38.01 4.18 84.15 .. 45.17 1.15 26.74 0.08 4.00Haveri 11.55 189.97 175.98 343.25 6.56 55.34 56.74 83.74 3.83 12.52Udipi 3.25 .. 203.57 .. 1.60 .. 67.14 .. 4.53 ..Total 1905.87 824.15 5604.21 2135.64 34.01 38.59 1483.45 668.86 100.00 100.00Source: 1. "Karnataka at a Glance,1998-99," Directorate of Economics and Statistics 2. Karnataka State Agriculture Marketing Board
On the basis of differences in their agro-climatic conditions and cropping pattern,
two blocks from each district, namely, Gangavathi and Sindhanur from Raichur district and
Davangere and Harihara from Chitradurga district were selected. It may be noted here that
the district of Chitradurga was bifurcated into Davangere and Chitradurga recently and as
the sample region came in the newly formed Davangere district we are referring to
Davangere district. From each selected block, three villages representing different levels of

40
market access, i.e., easy, moderate and difficult were selected. The following is the list of
villages selected in the four selected blocks.
Table 1.6: Names of Villages Selected for the Study
Block Easy Access Moderate
Access Difficult Access
Gangavathi Waddarahatti Kesarahatti Hosakere Sindhanur Pagadadinni Jawalgera Jilihal Davangere Hebbala Chinnasamudra Hulikatte Harihara Kurlahalli Bilasanur Vaderhatti
From each selected village, 10 farmers are selected using PPS sampling procedure.
The operated area of the farmers is classified into five size groups viz., less than 1.0
hectares, 1.01-2.0 hectares, 2.01-4.0 hectares, 4.01-6.0 hectares and more than 6.0
hectares. Using operated area as the size, 10 farmers were selected from each selected
village using PPS sampling. Thus, for a crop and a season, 30 farmers from each block and
60 farmers from each district were selected. Rice has two seasons in Raichur district and
the total sample size of farmers for the two seasons, viz., Kharif and Rabi was 120. In
Chitradurga district Maize is grown in Kharif season only and hence, the sample size for
maize was 60 farmers. In all, 180 farmers were selected for the survey.
Table 1.7: Sample Farmers by Size Groups from Selected Districts
Raichur Chitradurga (Davanagere)
Farm Size
Kharif Rabi Kharif
Total
Less than 1.0 ha 19 27 27 73 1.01 ha to 2.0 ha 23 20 23 66 2.01 ha to 4.0 ha 15 9 7 31 4.01 ha to 6.0 ha 0 3 2 5
Above 6.01 ha 3 1 1 5 Total 60 60 60 180
1.3.3 Selection of Processing Units
Karnataka state marketing sector has low density of commission agents. In addition
to the farmers, information was collected from commission agents, retailers and processing
units who are in the chain of the marketing system. From each selected block for each
season, 18 commission agents and 12 processing units were covered for primary
investigation.

41
Table 1.8: Processing Units Selected for the Survey
Sl.No
Name
Market Area
1 Venkateswara Rice Mill Sri Ramnagar 2 Sri Ramachandra Rice Mill Oddarahatti 3 Sri Basaveswara Rice Mill Gangavathi 4 Jaya laksmi Rice Mill Buthaladinni 5 Hemanth Rice Mill Jawalgera 6 Amareswara Industries Kartgi 7 S.L.V Industries Gangavathi 8 Ramachandra Rice Mill Gangavathi 9 Laxmi Rice Mill Sindhanur 10 Shivashankar Idustries Sindhanur 11 Laxminarayana Idustries Kartgi
12 Laxmi Venkateswar Industires Kartgi
1.4 The Survey
The reference year for the collection of primary data was agricultural year 2001-02.
The fieldwork for Paddy was carried out in kharif and rabi season and that of maize was
done only in kharif season. The secondary data was utilized pertaining to the last two
decades and as the data for Davangere was not yet segregated from Chitradurga district
the data pertaining to Chitradurga district was used for the purpose of meso-level analysis.
1.5 Chapter Scheme We have followed here the chapter scheme suggested by the co-coordinating centre.
But wherever possible a few sections of interest from the viewpoint of Karnataka are
added. The second chapter includes macro level picture of the marketing and market
infrastructure at the State level, whereas chapter three contains the agro-climatic
characteristics of the selected districts. The socio-economic characteristics of the sample
farmers are discussed in chapter four. The fifth and sixth chapters include the marketing
scenario of paddy and maize based on the sample survey. The last chapter brings together
the findings of the study.

42
Appendix Table 1.1 (a): Five Yearly Average of Area, Production and Yield of Rice in Karnataka
Year Area
(000 hectares) Production
(000 Tonnes)Yield
(Kg/Hectare) 1980-81 -- 1984-85 1,151.2 2,268.0 1,972.0 1985-86 -- 1989-90 1,140.9 2,198.4 1,920.0 1990-91 -- 1994-95 1,285.6 2,932.1 2,276.0
1995-96 -- 1999-2000 1,370.2 3,348.0 2,438.8 Appendix Table 1.1 (b): Five Yearly Average of Area, Production and Yield of Maize in Karnataka
Year Area (000 hectares)
Production (000 Tonnes)
Yield (Kg/Hectare)
1980-81 -- 1984-85 162.6 409.4 2,520.01985-86 -- 1989-90 222.2 567.1 2,534.01990-91 -- 1994-95 301.6 881.0 2,948.0
1995-96 -- 1999-2000 498.5 1,479.6 2,994.0
Appendix Table 1.2 (a): Changes in Area, Production and Yield of Rice in Chitradurga District
Year Area (000 Hectares)
Production (000 Tonnes)
Yield (Kg/Hectare)
1990-92 -17,517 -72,087 -489 1995-97 5,789 18,884 21 1998-2000 3,829 5,281 -470 Compound Growth Rate
1.02 1.04 1.71
Appendix Table 1.2 (b): Changes in Area, Production and Yield of Maize in Chitradurga District
Year Area (000 Hectares)
Production (000 Tonnes)
Yield (Kg/Hectare)
1990-92 9,137 57,422 1,0791995-97 17,535 80,603 447 1998-2000 14,654 -4,731 -1,114 Compound Growth Rate
1.15 1.65 1.18

43
Appendix Table 1.2 (c): Changes in Area, Production and Yield of Rice in Raichur District
Year Area (000
Hectares)
Production (000 Tonnes)
Yield (Kg/Hectare)
1990-92 14640 70519 275 1995-97 10772 -25319 -426 1998-2000 30378 63582 -276 Compound Growth Rate 1.58 1.68 1.07
Appendix Table 1.2 (d): Changes in Area, Production and Yield of Maize in Raichur District
Year Area (000
Hectares)
Production (000 Tonnes)
Yield (Kg/Hectare)
1990-92 -1,085 418 564 1995-97 3,084 85 -1,041 1998-2000 -94 -376 -462 Compound Growth Rate 1.54 1.09 1.17
44
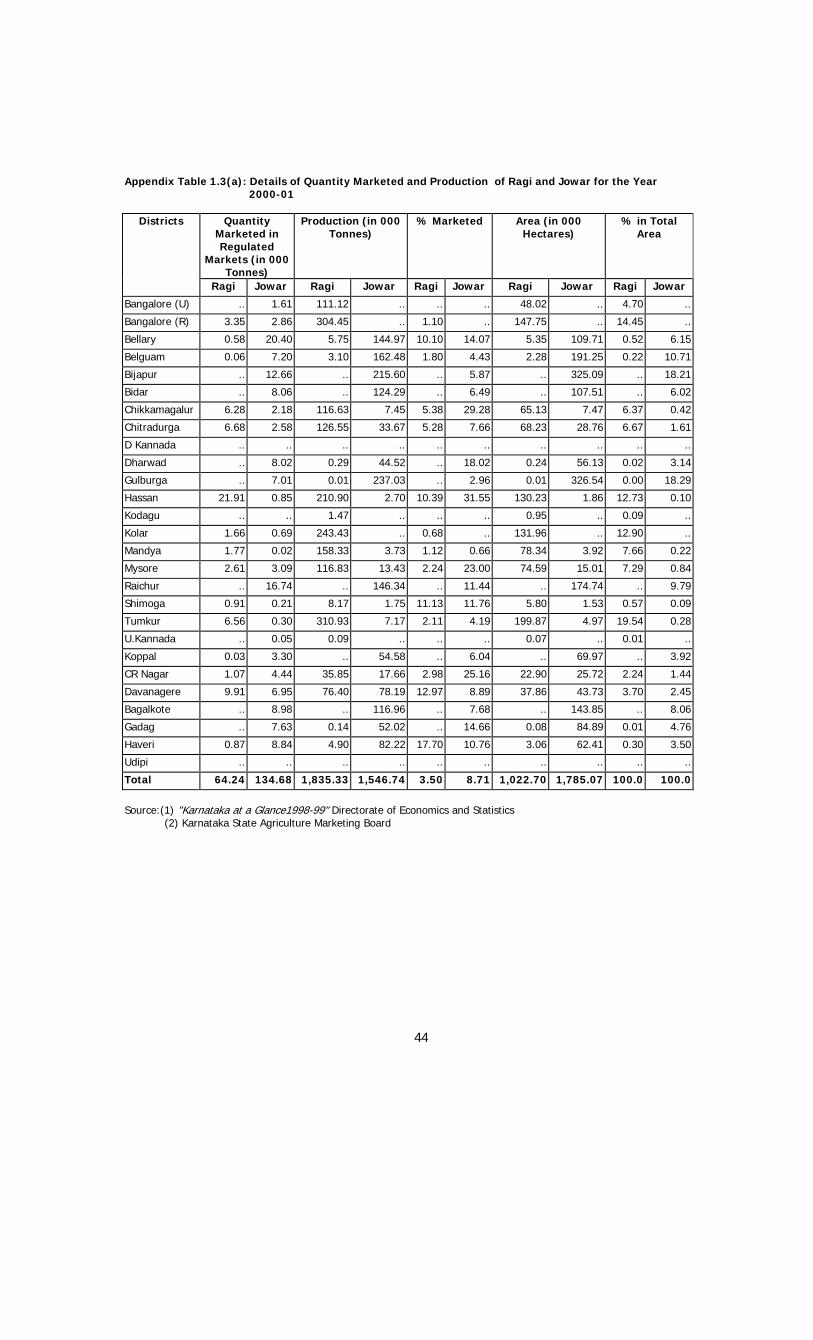
Appendix Table 1.3(a): Details of Quantity Marketed and Production of Ragi and Jowar for the Year 2000-01
Districts Quantity Marketed in Regulated
Markets (in 000 Tonnes)
Production (in 000 Tonnes)
% Marketed Area (in 000 Hectares)
% in Total Area
Ragi Jowar Ragi Jowar Ragi Jowar Ragi Jowar Ragi Jowar
Bangalore (U) .. 1.61 111.12 .. .. .. 48.02 .. 4.70 ..
Bangalore (R) 3.35 2.86 304.45 .. 1.10 .. 147.75 .. 14.45 ..
Bellary 0.58 20.40 5.75 144.97 10.10 14.07 5.35 109.71 0.52 6.15
Belguam 0.06 7.20 3.10 162.48 1.80 4.43 2.28 191.25 0.22 10.71
Bijapur .. 12.66 .. 215.60 .. 5.87 .. 325.09 .. 18.21
Bidar .. 8.06 .. 124.29 .. 6.49 .. 107.51 .. 6.02
Chikkamagalur 6.28 2.18 116.63 7.45 5.38 29.28 65.13 7.47 6.37 0.42
Chitradurga 6.68 2.58 126.55 33.67 5.28 7.66 68.23 28.76 6.67 1.61
D Kannada .. .. .. .. .. .. .. .. .. ..
Dharwad .. 8.02 0.29 44.52 .. 18.02 0.24 56.13 0.02 3.14
Gulburga .. 7.01 0.01 237.03 .. 2.96 0.01 326.54 0.00 18.29
Hassan 21.91 0.85 210.90 2.70 10.39 31.55 130.23 1.86 12.73 0.10
Kodagu .. .. 1.47 .. .. .. 0.95 .. 0.09 ..
Kolar 1.66 0.69 243.43 .. 0.68 .. 131.96 .. 12.90 ..
Mandya 1.77 0.02 158.33 3.73 1.12 0.66 78.34 3.92 7.66 0.22
Mysore 2.61 3.09 116.83 13.43 2.24 23.00 74.59 15.01 7.29 0.84
Raichur .. 16.74 .. 146.34 .. 11.44 .. 174.74 .. 9.79
Shimoga 0.91 0.21 8.17 1.75 11.13 11.76 5.80 1.53 0.57 0.09
Tumkur 6.56 0.30 310.93 7.17 2.11 4.19 199.87 4.97 19.54 0.28
U.Kannada .. 0.05 0.09 .. .. .. 0.07 .. 0.01 ..
Koppal 0.03 3.30 .. 54.58 .. 6.04 .. 69.97 .. 3.92
CR Nagar 1.07 4.44 35.85 17.66 2.98 25.16 22.90 25.72 2.24 1.44
Davanagere 9.91 6.95 76.40 78.19 12.97 8.89 37.86 43.73 3.70 2.45
Bagalkote .. 8.98 .. 116.96 .. 7.68 .. 143.85 .. 8.06
Gadag .. 7.63 0.14 52.02 .. 14.66 0.08 84.89 0.01 4.76
Haveri 0.87 8.84 4.90 82.22 17.70 10.76 3.06 62.41 0.30 3.50
Udipi .. .. .. .. .. .. .. .. .. ..
Total 64.24 134.68 1,835.33 1,546.74 3.50 8.71 1,022.70 1,785.07 100.0 100.0
Source:(1) "Karnataka at a Glance1998-99" Directorate of Economics and Statistics (2) Karnataka State Agriculture Marketing Board

45
Appendix Table 1.3(b): Details of Quantity Marketed and Production of Wheat and Bajra for the Year 2000-01
Districts Quantity Marketed in Regulated
Markets (in 000 Tonnes)
Production (in 000 Tonnes)
% Marketed Area (in 000 Hectares)
% in Total Area
Wheat Bajra Wheat Bajra Wheat Bajra Wheat Bajra Wheat Bajra
Bangalore (U) .. .. .. .. .. .. .. .. .. ..
Bangalore (R) 13.98 .. .. .. .. .. .. .. .. ..
Bellary 0.64 .. 2.66 22.17 24.06 .. 2.66 26.79 1.00 5.80
Belguam 4.33 0.43 72.49 18.19 5.97 2.38 56.78 42.29 21.32 9.15
Bijapur 7.57 8.31 48.03 89.58 15.75 9.28 51.28 111.74 19.26 24.18
Bidar 3.44 .. 9.38 7.44 36.71 .. 9.46 9.81 3.55 2.12
Chikkamagalur .. .. 0.01 .. .. .. 0.02 .. 0.01 ..
Chitradurga .. 0.02 1.10 3.92 .. 0.51 1.02 5.17 0.38 1.12
D Kannada .. .. .. .. .. .. .. .. .. ..
Dharwad 14.36 .. 27.69 0.02 51.86 .. 36.41 0.04 13.67 0.01
Gulburga 2.93 .. 23.66 77.25 12.39 .. 31.91 86.30 11.98 18.67
Hassan .. .. .. .. .. .. .. .. .. ..
Kodagu .. .. .. .. .. .. .. .. .. ..
Kolar .. .. .. 0.02 .. .. .. 0.04 .. 0.01
Mandya .. .. .. .. .. .. .. .. .. ..
Mysore .. .. .. 0.02 .. .. .. 0.02 .. 0.00
Raichur 0.85 .. 2.05 44.19 41.62 .. 3.57 75.78 1.34 16.40
Shimoga .. .. 0.00 .. .. .. 0.00 .. 0.00 ..
Tumkur .. 0.01 .. 0.14 .. 3.68 .. 0.31 .. 0.07
U.Kannada .. .. .. .. .. .. .. .. .. ..
Koppal 3.87 .. 5.45 35.28 71.02 .. 11.01 59.04 4.13 12.77
CR Nagar 0.00 .. 0.01 0.51 0.00 .. 0.02 0.68 0.01 0.15
Davanagere 0.02 0.18 0.76 0.37 3.28 48.64 0.86 0.63 0.32 0.14
Bagalkote 1.91 9.24 37.18 41.30 5.14 22.37 23.97 41.23 9.00 8.92
Gadag 11.21 .. 18.32 0.95 61.19 .. 35.66 1.86 13.39 0.40
Haveri 0.09 0.20 1.10 0.30 8.45 67.86 1.70 0.39 0.64 0.08
Udipi .. .. .. .. .. .. .. .. .. ..
Total 65.20 18.39 249.88 341.63 26.09 5.38 266.32 462.12 100.00 100.00
Source:(1) "Karnataka at a Glance,1998-99," Directorate of Economics and Statistics (2) Karnataka State Agriculture Marketing Board
46
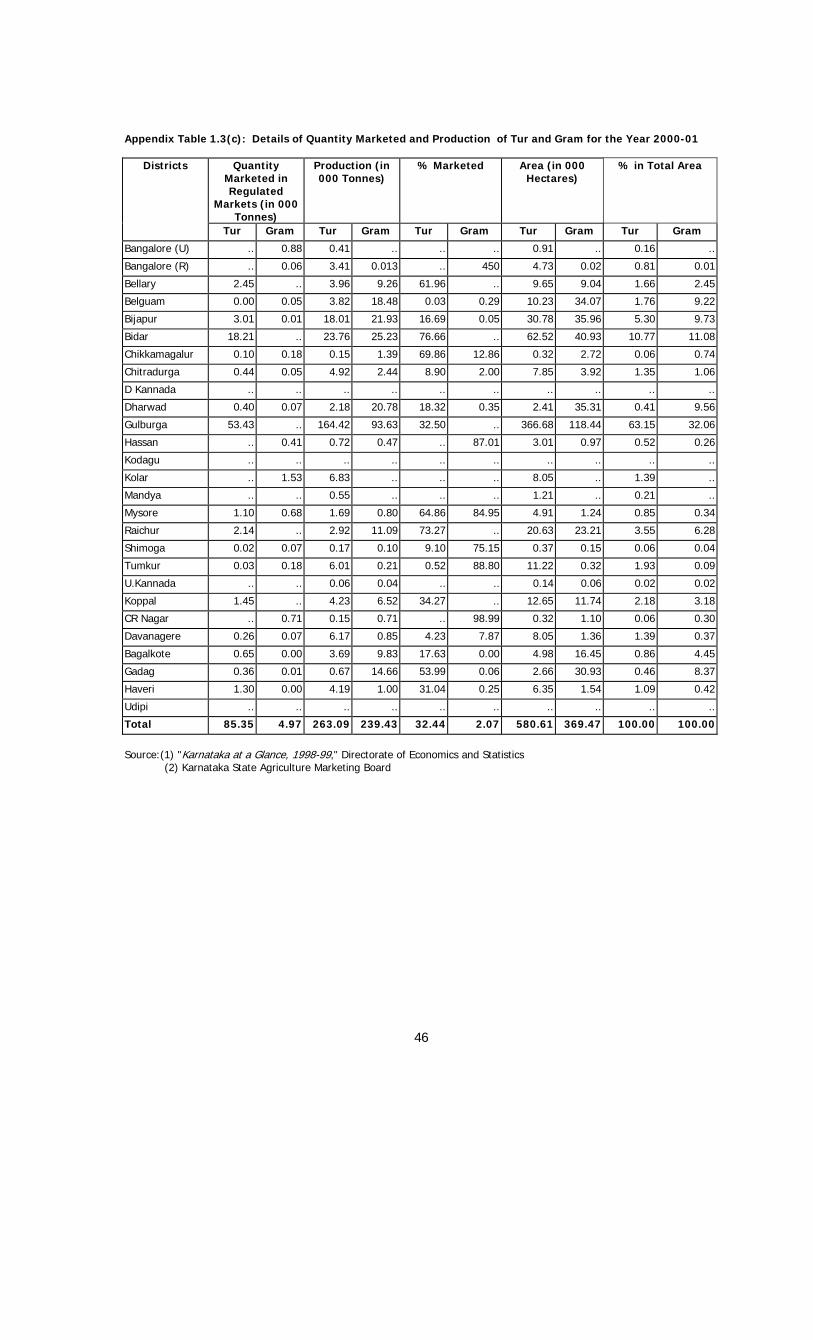
Appendix Table 1.3(c): Details of Quantity Marketed and Production of Tur and Gram for the Year 2000-01
Districts Quantity Marketed in Regulated
Markets (in 000 Tonnes)
Production (in 000 Tonnes)
% Marketed Area (in 000 Hectares)
% in Total Area
Tur Gram Tur Gram Tur Gram Tur Gram Tur Gram
Bangalore (U) .. 0.88 0.41 .. .. .. 0.91 .. 0.16 ..
Bangalore (R) .. 0.06 3.41 0.013 .. 450 4.73 0.02 0.81 0.01
Bellary 2.45 .. 3.96 9.26 61.96 .. 9.65 9.04 1.66 2.45
Belguam 0.00 0.05 3.82 18.48 0.03 0.29 10.23 34.07 1.76 9.22
Bijapur 3.01 0.01 18.01 21.93 16.69 0.05 30.78 35.96 5.30 9.73
Bidar 18.21 .. 23.76 25.23 76.66 .. 62.52 40.93 10.77 11.08
Chikkamagalur 0.10 0.18 0.15 1.39 69.86 12.86 0.32 2.72 0.06 0.74
Chitradurga 0.44 0.05 4.92 2.44 8.90 2.00 7.85 3.92 1.35 1.06
D Kannada .. .. .. .. .. .. .. .. .. ..
Dharwad 0.40 0.07 2.18 20.78 18.32 0.35 2.41 35.31 0.41 9.56
Gulburga 53.43 .. 164.42 93.63 32.50 .. 366.68 118.44 63.15 32.06
Hassan .. 0.41 0.72 0.47 .. 87.01 3.01 0.97 0.52 0.26
Kodagu .. .. .. .. .. .. .. .. .. ..
Kolar .. 1.53 6.83 .. .. .. 8.05 .. 1.39 ..
Mandya .. .. 0.55 .. .. .. 1.21 .. 0.21 ..
Mysore 1.10 0.68 1.69 0.80 64.86 84.95 4.91 1.24 0.85 0.34
Raichur 2.14 .. 2.92 11.09 73.27 .. 20.63 23.21 3.55 6.28
Shimoga 0.02 0.07 0.17 0.10 9.10 75.15 0.37 0.15 0.06 0.04
Tumkur 0.03 0.18 6.01 0.21 0.52 88.80 11.22 0.32 1.93 0.09
U.Kannada .. .. 0.06 0.04 .. .. 0.14 0.06 0.02 0.02
Koppal 1.45 .. 4.23 6.52 34.27 .. 12.65 11.74 2.18 3.18
CR Nagar .. 0.71 0.15 0.71 .. 98.99 0.32 1.10 0.06 0.30
Davanagere 0.26 0.07 6.17 0.85 4.23 7.87 8.05 1.36 1.39 0.37
Bagalkote 0.65 0.00 3.69 9.83 17.63 0.00 4.98 16.45 0.86 4.45
Gadag 0.36 0.01 0.67 14.66 53.99 0.06 2.66 30.93 0.46 8.37
Haveri 1.30 0.00 4.19 1.00 31.04 0.25 6.35 1.54 1.09 0.42
Udipi .. .. .. .. .. .. .. .. .. ..
Total 85.35 4.97 263.09 239.43 32.44 2.07 580.61 369.47 100.00 100.00
Source:(1) "Karnataka at a Glance, 1998-99," Directorate of Economics and Statistics (2) Karnataka State Agriculture Marketing Board

47
Appendix Table 1.3(d): Details of Quantity Marketed and Production of Groundnut and Sunflower the the
Year 2000-01
Districts Quantity Marketed in Regulated
Markets (in 000 Tonnes)
Production (in 000 Tonnes)
% Marketed Area (in 000 Hectares)
% in Total Area
Ground- nut
Sun- flower
Ground-nut
Sun-flower
Ground-nut
Sun- flower
Ground- nut
Sun-flower
Ground- nut
Sun- flower
Bangalore (U) 0.38 0.00 0.44 0.01 87.58 .. 0.43 0.01 0.04 0.00
Bangalore (R) 7.75 .. 17.65 0.11 43.91 .. 18.93 0.16 1.78 0.03
Bellary 10.97 7.78 68.01 20.16 16.13 38.61 72.27 42.25 6.80 8.84
Belguam 12.28 1.15 84.19 8.36 14.58 13.78 86.59 14.54 8.14 3.04
Bijapur 11.49 6.94 26.53 41.75 43.31 16.61 57.33 92.22 5.39 19.30
Bidar 0.37 0.22 1.85 2.46 19.97 9.09 2.97 6.80 0.28 1.42
Chikkamagalur 0.63 .. 4.92 5.02 12.87 .. 3.66 6.95 0.34 1.45
Chitradurga 58.66 7.86 181.81 16.38 32.27 48.01 156.73 29.86 14.74 6.25
D Kannada .. .. .. .. .. .. .. .. .. ..
Dharwad 9.74 .. 40.84 0.99 23.86 .. 36.14 1.83 3.40 0.38
Gulburga 8.57 0.53 72.63 7.13 11.80 7.41 91.83 15.60 8.64 3.26
Hassan 0.15 .. 4.59 4.02 3.18 .. 4.28 4.66 0.40 0.98
Kodagu .. .. 0.01 .. .. .. 0.01 .. 0.00 ..
Kolar 3.77 0.10 77.90 1.22 4.84 8.10 55.02 1.73 5.17 0.36
Mandya 0.23 .. 6.30 0.01 3.72 .. 8.24 0.02 0.77 0.00
Mysore 6.05 .. 7.02 0.28 86.25 .. 7.30 0.86 0.69 0.18
Raichur 27.00 23.46 41.95 37.16 64.35 63.13 52.88 92.04 4.97 19.26
Shimoga 0.07 .. 5.78 0.08 1.19 .. 4.14 0.13 0.39 0.03
Tumkur 16.83 0.23 236.26 1.96 7.13 12.01 171.64 2.77 16.14 0.58
U.Kannada 0.91 .. 5.08 0.02 17.83 .. 3.68 0.06 0.35 0.01
Koppal 3.93 1.03 46.08 12.87 8.53 8.00 55.75 32.53 5.24 6.81
CR Nagar 2.72 .. 8.65 1.30 31.43 .. 6.83 2.85 0.64 0.60
Davanagere 11.96 0.94 28.75 7.55 41.62 12.43 24.96 12.01 2.35 2.51
Bagalkote 22.05 11.87 26.97 38.94 81.77 30.49 26.36 64.65 2.48 13.53
Gadag 37.27 6.69 43.54 20.26 85.61 33.00 80.19 48.33 7.54 10.11
Haveri 11.44 0.19 39.42 3.00 29.02 6.29 32.56 4.96 3.06 1.04
Udipi 0.31 .. 3.97 .. 7.80 .. 2.69 .. 0.25 ..
Total 265.55 68.99 1,081.11 231.04 24.56 29.86 1,063.42 477.79 100.00 100.00
Source:(1) "Karnataka at a Glance1998-99" Directorate of Economics and Statistics (2) Karnataka State Agriculture Marketing Board

48
Appendix Table 1.4: Minimum Support Prices fixed by Government of India for Certain Crops in
Various Years
(Rs. Per Quintal; Tobacco & Sugarcane- Rs. Per Kg) Crop 91-
92 92-93
93-94
94-95
95-96
96-97
97-98
98-99
99-2000
2000-01
PADDY Common 230 270 310 340 360 380 415 440 490 510 F 240 280 330 360 375 395 445 470 520 540 SF 250 290 350 380 395 415 -- -- -- -- JOWAR/ BAJRA/RAGI
205 240 260 280 300 310 360 390 415 445
WHEAT 225 275 330 350 360 380 475 510 550 580 MAIZE 210 245 265 290 310 320 360 390 415 445 BARLEY 200 210 260 275 285 295 308 350 385 430 GRAM 450 500 600 640 670 700 740 815 895 1015 LENTIL -- -- -- -- -- -- -- -- -- -- TUR 545 640 700 760 800 840 900 960 1105 1200 MOONG 545 640 700 760 800 840 900 960 1105 1200 URAD 545 640 700 760 800 840 900 960 1105 1200 SUGARCANE 24 27 32.50 37 42.50 45.90 48.45 52.70 56.10 59.50 COTTON H4 840 950 1050 1200 1350 1380 1530 1650 1775 1825 F414/H777 695 800 900 1000 1150 1180 1330 1440 1575 1625 GROUNDNUT 645 750 800 860 900 920 980 1040 1155 1220 JUTE 375 400 450 470 490 510 570 650 750 785 RAPESEED/ MUSTARD
600 670 760 810 830 860 890 940 1000 1100
SUNFLOWER-SEED
670 800 850 900 950 960 1000 1060 1155 1170
SOYABEAN Black 395 475 525 570 600 620 670 705 755 755 Yellow 445 525 580 650 680 700 750 795 845 865 SAFFLOWER 670 800 850 900 950 960 1000 1060 1155 1170 TORIA 570 645 725 780 800 825 855 905 965 1065 TOBACCO F2 14.75 16 18 18.50 19 19 20.50 22.50 25 26 L2 16 17.50 20 21 21.50 22 23.50 25.50 27 28 COPRA Milling 1700 -- 2150 2350 2500 2500 2700 2900 3100 3250 Ball 1850 -- 2350 2575 2725 2725 2925 3135 3325 3500 SESAMUM -- -- -- -- 850 870 950 1060 1205 1300 NIGERSEED -- -- -- -- 700 720 800 850 915 1025 TIL - - - - 850 870 950 1060 1205 1300 Source: 1. Reports of the Commission for Agricultural Costs and Prices, Department of Agriculture and
Cooperation, Ministry of Agriculture, Govt of India. 2. Agricultural Research, Department of Agriculture and Cooperation, Ministry of Agriculture, Govt of
India.

49
Main Components of Agricultural Produce Marketing Act • Establishment of Markets • Constitution of Market Committees • Conduct of Business • Staff and Market Committees • Their Functions and Regulation of Trading • Market Funds • State Agricultural Marketing Board
CHAPTER II
PRODUCTION. MARKETING AND MARKET REGULATIONS OF AGRICULTURAL MARKETS
2.1 Introduction
Agricultural sector of Karnataka has been characterised by cycles of growth and
stagnation. It is a matter of deep concern as this sector relates directly to the overall growth
performance of the state economy. Efforts, both at policy and at implementation levels, are
undertaken to overcome the constraints and to encourage growth boosters. The constraints
mainly relate to proper incentive structure, imperfections in the product and factor market,
existing infrastructure facilities, forward and backward linkages, and allied supportive
activities. Besides these, current liberalization process has brought forth the prominent role of
market and consequently domestic market reform policies. If, on the policy front, proper
corrections are incorporated to deal with the market induced imperfections, and correct price
signals are created in the economy, it will help the state economy to get onto a better path of
development. Any analysis of the market structure, therefore, requires clear understanding of
the existing marketing infrastructure and the regulations on marketing. Further, it requires
knowledge of the agricultural marketing system at primary level to spot the imperfections and
structural fissures.
2.2 Rules, Procedures and Modalities of Regulation of Agricultural Markets
Box 2.1
Market Regulations can be grouped
under two broad categories, viz., regulations
governing the functioning of primary
agricultural produce markets, including a series
of legal instruments and the Market Committees
functioning as intermediaries. Regulation and
development of primary markets was taken up
as an institutional innovation and construction
of well laid-out market yards. These regulations provide a design for the conduct of the
agricultural market produce committee. The Directorate of Marketing and Inspection (DMI)
of Government of India and state level Directorate of Marketing play an important role in

50
functioning of these institutions. In order to remove the components causing market
imperfections and to bring the functions of agricultural marketing under a proper legal
framework, the State governments passed the Agricultural Produce Marketing Acts. The
Acts were passed in most of the states around the mid-sixties and revised subsequently.
The Acts incorporated seven major components dealing with the establishment, functioning
and conduct of the business (See Box 2.1).
The important general features of regulated markets include:
(i) monitoring of marketing practices by Regulated Market Committees;
(ii) licensing of functionaries;
(iii) open auction or close-tender system;
(iv) issue of sale slips showing quantity and price to the farmers;
(v) well-publicised time and days of sale;
(vi) correct weighment of the produce by licensed weighman;
(vii) prescription of rational market charges;
(viii) provision of payment to farmers within stipulated period;
(ix) mechanism of dispute settlement;
(x) dissemination of market related information;
(xi) provision of amenities to the farmers in market yards; and
(xii) reduction of physical losses during buying and selling.
In addition to these, the spread of market infrastructure also plays a significant role
in the marketing process. The number of regulated markets in the country which was only
286 at the time of independence, has now gone up to 7,062 and out of these, 2,354 places
have been developed as main yards and 4,708 as sub-yards. In addition to these, there are
27,294 periodic markets existing in rural areas, most of which are yet to be developed. The
National Commission on Agriculture recommended that the density of markets should be
increased significantly, but that did not happen in Karnataka.
Five decades of continuous policy intervention has not made any significant change
and a lot needs to be done. Even a cursory visit to any regulated market yards suggests
that we still have to achieve a lot out of this. Certain practices like late payment to farmers,
under-pricing, arbitrary grading, speed money and non-issue of sale slips by the traders
continue to dog the performance of markets. There is a considerable congestion and delays
in several markets resulting in long waiting periods for the farmers to receive their

51
payments. The traders have organised into informal cartels and these cartels squeeze the
farmers. There is also lack of understanding about the market regulations particularly those
relating to the sale of produce outside the market yards. Funds collected as cess and
market fees are not properly utilised. In the process, APMCs are emerging as some sort of
monopolistic centres of sale and purchase with the reigns in the hands of a few.
Apart from the market regulations the Government of India also initiated future or
forward trading. The Forward Markets Commission (FMC) was established under Forward
Contracts (Regulation) Act, 1952. The forward trading act guards against unhealthy
speculative practices and provides a firm price to the farmer. Forward trading in agricultural
commodities was suspended during the seventies due to various bottlenecks but resumed
again. There are now 20 exchanges registered with FMC undertaking futures trading in
agricultural commodities which include cotton lint, raw jute, jute goods, gur, coffee, potato,
turmeric, black pepper, rice bran, edible oils, oil-seeds and oil cakes. Recently, sugar has
also been permitted for future trading. Future trading provides an inbuilt insurance against
price risk and also helps retain a constant relationship with international markets.
2.3 Agricultural Marketing System at the Primary Level
Agricultural marketing system at the primary level in Karnataka involves four broad
marketing channels, viz., (i) direct to consumers; (ii) through private wholesalers and
retailers; (iii) through public agencies (regulated markets) or cooperatives; and (iv) through
processors. The share of these channels in total marketed surplus varies from commodity
to commodity and across regions. Marketing structure of the agricultural produce differs
according to products. Among these channels large quantity of produce is transacted
through the regulated market channel. It is necessary to understand the basic functioning
of the regulated markets at lower levels before one gets into analysing the reforms in
marketing. Foodgrains are mostly marketed at the primary village market or in the
regulated market yard. The procurement of grains takes place only in the case of rice and
through the processing mills. Oil-seeds are largely sold through the regulated markets and
directly to the processors. But other commercial crops like banana, arecanut, coconut,
sugarcane and cotton have developed specific marketing channels.

52
Due to the creation of marketing institutions and the infrastructure quite a few
changes have occurred in the agricultural marketing sector. These include: i. increase in
the market arrivals as per cent to total output; ii. reduction in the market inefficiencies in
terms of unauthorised charges and irrational grading; iii. dissemination of market
information at the regulated market yard; iv. better storage facilities and place to stay was
created for the farmers; marketing charges payable by farmers were either dropped,
standardized or liability shifted to the buyers; and v. villagers are not selling major portion
of their produce in the village and the proportion of distress sale reduced significantly.
2.4 Marketing Structure and Market Institutions
2.4.1 Marketing structure of agricultural commodities
The present regulated marketing System involves five stages. As a first step, the
farmer brings the produce at the market during harvest season. These are graded by the
graders and then heaped in different places in the market during the second stage. The
traders or their representatives enter the market and prepare a list of prices offered to
different heaps of commodities marking the third step. The slips are then processed and
the heaps of commodities are assigned to the highest bidder, which constitutes the next
stage. Finally, the trader settles the transactions and takes away the produce.
2.4.2 Market regulations:
The Karnataka Agricultural Produce Marketing (Regulation) act was passed by the
Karnataka State Legislature to provide for the better regulation of marketing of agricultural
produce through establishment and administration of markets for agricultural produce in the
State. It called on the State government for the establishment of the markets by declaring the
market area and its intention of regulating the marketing of specified agricultural produce. The
Act follows the model act given by Government of India and hence not very different in
content as against the other States.
The marketing practices in the Regulated markets are governed by the Market
Committees that have jurisdiction over the entire market area. The Committee is
empowered to implement the provisions of this Act and the rules and bye-laws made there
under in the market area. It grants or renews the licenses for use of any place in the

53
market area for the sale of the notified agricultural produce or for operating therein as
market functionaries in relation to marketing, after making such enquiries as it deems fit. It
has the power to levy market fee on the traders and also impose penalty where a trader
fails to pay. The Committee is also entrusted with the maintaining of proper checks on all
receipts and payments by its officers, proper execution of all works chargeable to the
market committee funds, maintaining register of arrivals and fees collected, preparing plans
and estimates for works, publishing a statement of assets and liabilities, preparing and
adopting budget for the ensuring year and regulating expenditure according to the budget,
providing Marketing information and arranging for temporary storage or stocking of notified
crops in the market yards.
(i) Sale of Agricultural Produce
As a measure to stop under cover sales, the sale price of agricultural produce sold
in the market area, according to the APM(R) Act, should be determined either by tender
system or by public auction or by open agreement or in such other manner with the
previous approval of the Director of Agricultural Marketing, by the market committees.
Present practice incorporates use of sale slips, which are to be issued by every licensed
buyer, showing quantity and price, to the farmers as a written agreement of sale in such
form as prescribed by the bye-laws. The Commission agents can recover his commission
only from the buyer at such rates not exceeding two per cent of the price for which the
agricultural produce is sold and no market functionary should receive commission, fees,
charges or any other form of remuneration except as prescribed by the rules or bye-laws.
The market functionaries as per the APM(R) Act shall make, give or allow no
deductions in weight or payment other than those specified in the rules or bye-laws, in
respect of any transaction relating to notified agricultural produce. The deductions that are
deemed to be permissible are deductions in the weight for the container, driage of
produce, deviation from sample or known standard and deduction in price on account of
the detection of adulteration not readily detectable on customary examination. These
deductions introduce significant transaction costs in the markets. There were attempts to
standardise these but have not succeeded significantly.
The Act makes provisions for the immediate payment in cash to the seller for the
goods sold in the market yards or in the sub-market, after making the deductions for fees,
market charges and taxes as per the rules or the bye-laws except in the case of a Commission

54
agent agreeing in writing to give delivery to the buyer on credit which shall in no case exceed
a maximum period of ten days as prescribed by the bye-laws. Again this stipulation is violated
in practice. The Committee appointed by Govt. of Karnataka, under the Chairmanship of Shri.
D. R. Patil, submitted its report in November, 2002. The Committtee tried to make the
stipulations more stringent.
Every licensed market functionary (trader, commission agent, ginner, presser,
processor, warehouseman, importer, exporter, stockist) operating in the market area shall
maintain accounts and submit to the market committees periodical reports and returns. They
are also supposed to render assistance in the collection and prevention of the evasion of
payment of fees or other amounts due under this Act.
(ii) Provision of infrastructure facilities in the market yards and outside
APMCs are required to provide with the facilities like approach road to the market
area, construction of covered auction platform and other infrastructure like drying platforms,
drinking water, godowns and common facility centres for hosing machinery for cleaning,
grading and other post-harvest operations.
(iii) Provision for Dispute Settlement
To settle the disputes arising between the producers, buyers and sellers or their
agents the Act provides a mechanism of dispute settlement by letting the Market Committee
of that area to appoint a panel of arbitrators periodically consisting of agriculturists, traders
and commission agents and constitute a Disputes Committee. Necessary rules are made for
regulating the procedure of settlement and the payment of fees by the parties for the
settlement.
(iv) Market Funds
All the money received by the APMCs by way of fees, cess, charges, loans raised and
grants and contributions made by the State government becomes part of the Market funds.
These funds are to be utilised for the purposes of making payments on behalf of the State
government and the State Agricultural Marketing Board for various activities undertaken. The
Market Committees having an income exceeding Rs. 5 lakhs and has the necessary
infrastructure facilities may provide short term advances to the producer sellers using the
excess funds at specified rates of interest. Preference should be given to small and marginal
farmers while advancing and the amount of advance should not exceed 60 per cent of the

55
market value of the produce pledged. The Committee under the chairmanship of Shri. D. R.
Patil dealt with the budgeting procedures and maintenance of accounts of the funds.
2.4.3 Institutions in Agriculture Marketing Sector:
As a strong support to the physical infrastructure, an institutional network has been
established during the last five decades to help the farmers to partake the advantages of a
fair marketing system. The institutions from public sector include:
• Food Corporation of India (FCI);
• Cotton Corporation of India (CCI);
• Jute Corporation of India (JCI);
• Commodity Boards for tea, coffee, tobacco, spices, rubber, cardamom, arecanut,
coconut, cashewnut, horticultural products, dairy products, and oil-seeds and
vegetables;
• Agricultural and Processed Food Products Export Development Authority (APEDA);
• State Trading Corporation (STC);
• Marine Products Export Development Authority (MPEDA);
• Directorate of Marketing and Inspection (DMI);
• Departments of Food and Civil Supplies at the Centre and state levels;
• Commission for Agricultural Costs and Prices (CACP);
• State Agricultural Marketing Boards; and
• Council of State Agricultural Marketing Boards (COSAMB); and Central and State
Warehousing Corporations;
These institutions function at the national level but many of them are the major
players at the state level. The Food and Civil Supplies Corporation has a strong link with the
Ministry of Food and Civil Supplies, the Co-operative Marketing network, National
Agricultural Marketing Federation (NAFED) and the commodity specific institutions are quite
active at the state level. Some of these institutions are involved in the process of
implementation of MSP at the State level. These include Karnataka Food and Civil Supply
Corporation, Karnataka State Co-operative Marketing Federation, Karnataka Oil-Seed
Growers Federation and the National Agricultural Co-operatives Marketing Federation
(NAFED). The procurement of foodgrains is entirely the responsibility of the Food and Civil
Supplies Corporation at the State level. Oilseed growers’ Federation deals with oil-seeds

56
whereas, NAFED has the responsibility of procuring other commodities. We give below a
brief description of their activities.
i. National Agricultural Co-operative Marketing Federation of India
This is an apex institution dealing with co-operative marketing in the country and it
came into existence on 2nd October 1985. NAFED was established to play an effective role
in the marketing of the agricultural produce within and outside the country in the fast
changing business environment. NAFED involves itself in five major activities (See Box 2.2).
Box 2.2
Major Activities of NAFED
• Providing market support to the farmers through its commercial purchase.
• Acting as the Central Nodal-Agency of the Government of India for undertaking
purchases of oil-seeds and pulses under the Price Support Scheme.
• Acting as one of the agencies of the Government of India for making purchases under
market intervention scheme.
• Acting as a channelising agency of the Government of India for select commodities.
• Assisting farmers to source various agricultural inputs.
NAFED undertakes its operations through two agencies, namely, Taluka Agricultural
Produce Cooperatives (TAPC) and Agricultural Produce Marketing Committee (APMC). The
regional office of NAFED is in Chennai and its head office is in New Delhi. NAFED decides
about the procurement mainly on the basis of the budget available: The regional office and
the branch offices will get the information from the State Marketing Boards whenever
prices slide down below MSP. It is only at the behest of the State Marketing Board, NAFED
begins its intervention in the market and starts procurement. The main APMCs send the
information of arrival and prices of the commodity to NAFED every day. But it does not act
suo motto. NAFED procures groundnut, soyabean, safflower, sunflower and sesamum,
gram, tur, black gram and copra. Information about the price situation takes about one
week to reach from regional or branch office to the Head office. It is only then the Head
Office makes available the required funds to the regional office and thus, NAFED can enter
into the market and start procuring.

57
NAFED has the following Charges
Service charges 2%
Sale charges 2%
Handling charges Rs 95/MT
Market Cess 0.8%
The market intervention operations of NAFED have been earning sufficient profits to
the organisation. In the year 2000, the profits of NAFED were Rs 1.99 crores and in the
following year it touched Rs 4.93 crores. This clearly indicates the profitability of its market
intervention operations and thus, it is clear that, on the one hand, even though the
interventions are beneficial for the procurement agency it does not meet the farmers
expectations, on the other. It does not meet the farmers’ expectation either about the
procurement at the right time or at the right price. NAFED has a reserve fund named as
Price Fluctuation Fund. This Fund was Rs 12.51 crores in 1999 and Rs 11.31 crores in the
following year. It is clear that the agency has the needed fund and the infrastructure for
the market intervention operations and even then the farmers are not the ultimate
beneficiaries. Our interview with the NAFED Manager revealed that if given free hand the
agency could easily increase its profits and effectively intervene in the market at the proper
time. In the context of liberalisation, it is quite prudent to allow free hand to agencies like
NAFED to undertake purchases through market interventions. We have presented in Table
2.1 the procurement effected by NAFED in the recent years and it can be observed that
there is a significant presence of the organisation in the market.
Table 2.1 on procurement operations by NAFED points towards three pertinent
observations. First, there is hardly any consistency in the MIS operations of NAFED.
Therefore, their presence or purchase operations is neither effective in reducing the price
risk, nor the variations. Thus, the operations do not even assure the farmers against
impending price risk. Second, the intervention is so diminutive compared with the marketed
surplus that this could hardly make any dent on the market and prices. But this is
interesting on the background of the fact that NAFED makes good profit. Third, the
operations of NAFED are confined only to a few crops leaving a large number of crops out
of its ambit. This policy was well suited when there was scarcity in the agricultural
production and supply bottlenecks were significant irritants. But now in the changed

58
circumstances it is expected that such institutional intervention be used to achieve positive
and long lasting results.
Table 2.1: Procurement of Agricultural Commodities by NAFED: 1990-1999
Commodity Year Support Price
Rs. P.Qtl (FAQ) Qty Procured MTs
Value Rs. In lakhs
Major States of Procurement
Potato 1997-98 125-130/350 4,697 159.27 Uttar Pradesh Karnataka
Onion 1990-91 (MIS 90) 1991-92 (MIS-91)
70 70K/75R 300
61,984 4,500 60
433.94 33.31 1.98
Gujarat Maharashtra Karnataka
Isabgol 1990-91 1,100 1,256 138.14 Gujarat Grapes 1990-91
1991-92
2,50B 300A. 300B 350A.
416 102
10.88 3.22
Haryana Punjab Haryana
Eggs (Qty. in lakh Nos.)
1990-91 1991-92 1992-93 1993-94 1994-95 1995-96 1996-97
65/100 65/100 65/100 75/100 75/100 82/100 110/100
38.20 20.16 26.99 91.02 28.21 34.82 141.43
15.28 13.11 17.94 61.63 37.61 32.96 137.51
Hyderabad/Del Andhra Pradesh Andhra Pradesh Andhra Pradesh Andhra Pradesh Andhra Pradesh, Punjab Andhra Pradesh, Punjab
Mushroom 1999-00 1990-91
100 220
85.89 46
86.95 10.01
Andhra Pradesh Haryana
Kinoo/Malta 1990-91 1991-92 1992-93 1993-94
250B 300A. 325A. 350A.
6,585 2,989 1,703 3,133
181.71 86.81 46.88 49.49
Rajasthan, Punjab, Haryana, Himachal Pradesh Punjab, Haryana Punjab, Haryana Himachal Pradesh, Haryana, Uttar Pradesh
Wet Ginger 1991-92 300A 21 0.06 Kerala Castor Seed 1990-91
1991-92 550 550
2,500 9.999
137.47 549.98
Gujarat Gujarat
Black Pepper 1993-94 3,300 1,491 495.25 Kerala Chillies 1993-94
1996-97 1997-98
1,500 2,200 2,250
5,000 126 8,123
806.64 29.48 19.01
Andhra Pradesh Andhra Pradesh Andhra Pradesh
Coriander 1998-99 1,250 378 45.88 Rajasthan Source: NAFED – Annual Reports for Various Years : A, B – Grades of Products The operations of NAFED in Karnataka during the decade of nineties have been
quite minimal due to the focus of the institution on commercial crops. The institution is not
geared to cover the commercial crops dominating in Karnataka except onion. Even though
it is a profit making body, its impact on the marketing sector in the State is quite
insignificant. Table 2.2 presents the objectives of NAFED and the operations undertaken by
the agency to meet these objectives. On the face of it, one can be satisfied that NAFED
effectively works on most of its set objectives. However, our interviews with the officers of
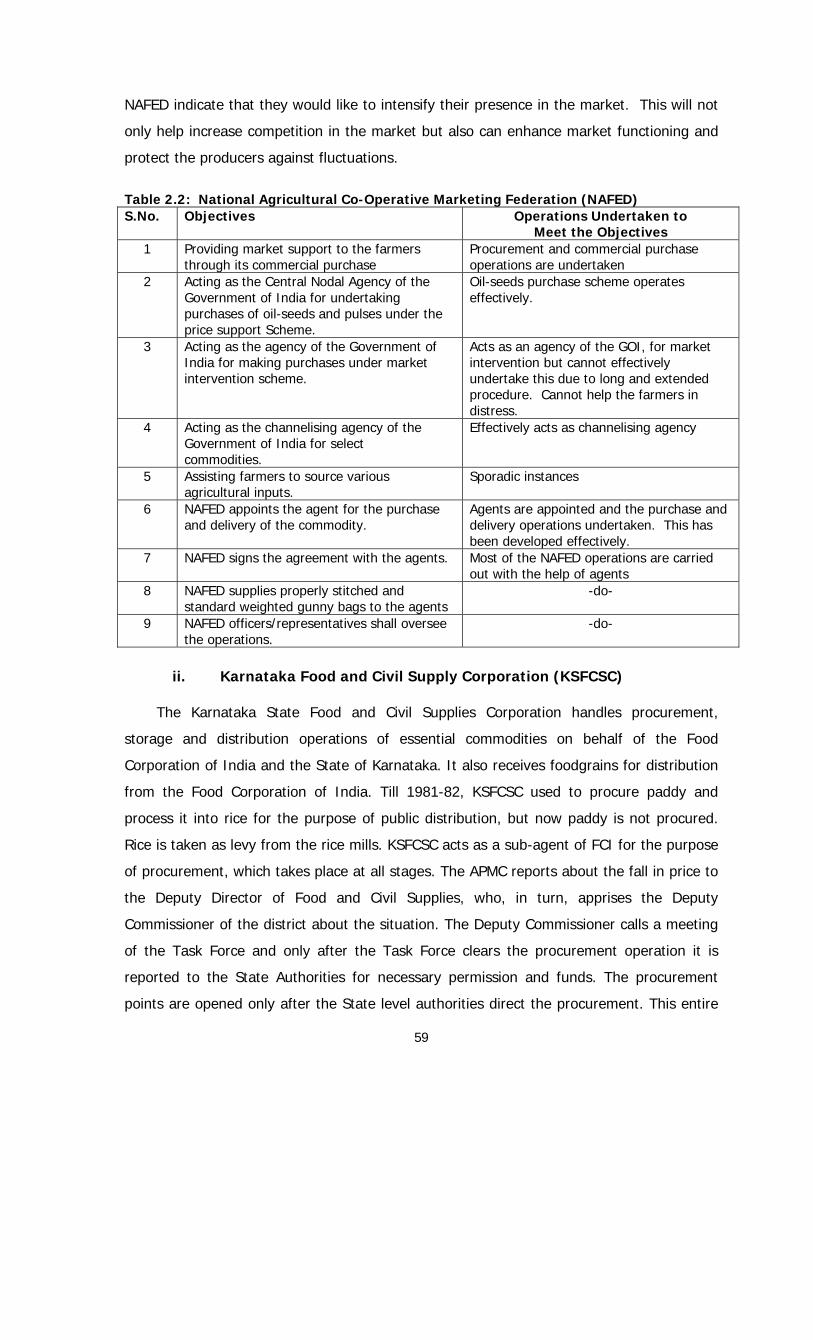
59
NAFED indicate that they would like to intensify their presence in the market. This will not
only help increase competition in the market but also can enhance market functioning and
protect the producers against fluctuations.
Table 2.2: National Agricultural Co-Operative Marketing Federation (NAFED) S.No. Objectives Operations Undertaken to
Meet the Objectives 1 Providing market support to the farmers
through its commercial purchase Procurement and commercial purchase operations are undertaken
2 Acting as the Central Nodal Agency of the Government of India for undertaking purchases of oil-seeds and pulses under the price support Scheme.
Oil-seeds purchase scheme operates effectively.
3 Acting as the agency of the Government of India for making purchases under market intervention scheme.
Acts as an agency of the GOI, for market intervention but cannot effectively undertake this due to long and extended procedure. Cannot help the farmers in distress.
4 Acting as the channelising agency of the Government of India for select commodities.
Effectively acts as channelising agency
5 Assisting farmers to source various agricultural inputs.
Sporadic instances
6 NAFED appoints the agent for the purchase and delivery of the commodity.
Agents are appointed and the purchase and delivery operations undertaken. This has been developed effectively.
7 NAFED signs the agreement with the agents. Most of the NAFED operations are carried out with the help of agents
8 NAFED supplies properly stitched and standard weighted gunny bags to the agents
-do-
9 NAFED officers/representatives shall oversee the operations.
-do-
ii. Karnataka Food and Civil Supply Corporation (KSFCSC)
The Karnataka State Food and Civil Supplies Corporation handles procurement,
storage and distribution operations of essential commodities on behalf of the Food
Corporation of India and the State of Karnataka. It also receives foodgrains for distribution
from the Food Corporation of India. Till 1981-82, KSFCSC used to procure paddy and
process it into rice for the purpose of public distribution, but now paddy is not procured.
Rice is taken as levy from the rice mills. KSFCSC acts as a sub-agent of FCI for the purpose
of procurement, which takes place at all stages. The APMC reports about the fall in price to
the Deputy Director of Food and Civil Supplies, who, in turn, apprises the Deputy
Commissioner of the district about the situation. The Deputy Commissioner calls a meeting
of the Task Force and only after the Task Force clears the procurement operation it is
reported to the State Authorities for necessary permission and funds. The procurement
points are opened only after the State level authorities direct the procurement. This entire

60
exercise takes at least two weeks, and till then the farmer cannot wait in the market yard.
Recently, the Government of Karnataka has taken a decision to open permanent
procurement centres in the APMC yards. KSFCSC makes significant profits in the
procurement and distribution operations. The profit recorded in 1996-97 was Rs 5 crores
and it went down to Rs 1.76 crores in 1998-99. The recent procurement of food
commodities are indicated below:
Commodities Procured by FCI: 2001
Maize 361,000 tonnes
Ragi 15,000 tonnes
Bajra 4,500 tonnes
Paddy 1,100 tonnes
Recently FCI procured directly 132,000 tonnes of Maize for Rs. 445/q and KFCSC
sold that at Rs 405/q and incurring a loss of Rs. 40 per tonne. However, it was pointed out
in a recent study by the Directorate of Agriculture that the procurement was largely from
the traders despite the restriction that procurement should not be made in the absence of
Land Records (Pahni or ROR) of the farmer. This happened due to three factors. First,
there was a sufficiently long time-gap between the price collapse of maize and opening of
the procurement centres. Second, the farmers who had brought their produce for sale
could not wait that long to sell their produce. They preferred to sell the produce
immediately and receive the cash. Third, traders were ready to purchase the produce at
lower than the MSP, and effected such purchases. Traders also obtained a copy of the
ROR to produce at the procurement centre for the purpose of procurement at MSP. In the
entire process, the traders could make profit.
The KSFCSC undertakes procurement and the stocks are handed over to the FCI.
After that the FCI holds these stocks in the godowns and the state has a good capacity for
stocking the grains. KSFCSC undertakes the distribution of rice, wheat, sugar and kerosene
to the BPL and APL under the PDS scheme. The PDS rates are almost closer to open
market rates and therefore, BPL households usually buy at the fair price shops. In any
given taluk, 65 per cent of the PDS allocation is managed by the KFCSC and another 35 per
cent is met from the co-operative societies.
61
iii. Karnataka State Co-operative Marketing Federation (KSCMF)
KSCMF is an institution financed by the State govt for the purpose of market
intervention. It is administered as an apex federation of co-operative societies and involves
in procurement operations. KSCMF gets the requests for procurement of commodities from
APMC or directly from the State. It is only then that KSCMF enters the market for
procurement. It also undertakes the market disposal of the procured commodities and
thus intervenes as seller as well as purchaser. Theoretically, KSCMF should make a
significant dent on the market operations and help in correcting price and market
distortions. But, in practice, this does not happen for various reasons. First, it is the co-
operative structure of the institution that hinders the working due to politicisation.
Members of the body are more concerned about strengthening the political linkages than
entering into procurement. Second, over the years KSCMF has neither developed
infrastructure nor the expertise and channels to effectively handle the procurement. Third,
a large part of the marketed surplus directly goes through the regulated market and
producers prefer to sell the product to the traders due to interlocking of credit and product
market. Finally, large numbers of societies are non-functional due to problems of elections
and hence, cannot participate in the process of marketing.
KSCMF is financially self-sufficient having 32 branches and well-established network
with APMCs in the State. The marketing federation usually procures commercial crops like
cotton, maize and tur and other pulses. These form nearly 10-15 per cent of the total
commodities procured. The preference for commercial crops is due to the fact that these
have longer shelf life and the proportion of wastage is quite low. Apart from that it was told
that KSCMF’s procurement is demand-oriented and their presence in the market was not
obligatory. KSCMF had procured huge quantities of cotton a few years back and in the
process incurred losses to the tune of Rs 5 crores. Experience suggests that marketing
federation should pre-plan their market intervention every year. The target fund provided
for procurement every year is approximately 250 crores and this should be utilised to
achieve the best results as well as profits.

62
Table 2.3: Karnataka State Co-Operative Marketing Federation (KSCMF)
Sl. No.
Objectives Meeting the Objectives
1 KSCMF purchases fertilizer and pesticides from the industry and provides that to the farmers at reasonable prices.
Usually this is the main function undertaken by the KSCMF. Fertilizers and pesticides are provided through Farmers’ Co-operative Society but their supply does not meet the total demand. Therefore, farmers have to buy that from the open market.
2 KSCMF maintains cold storages in different areas for farmer’s service.
The construction and maintenance of cold storages are the activities undertaken, but the capacity utilisation is quite low. Therefore, these activities are not financially viable.
3 KSCMF undertakes construction of cold storage at the necessary places.
---
4 KSCMF is required to procure/purchase agricultural produce under Minimum Support Prices.
Procurement operations are not immediately undertaken after the prices collapse. There is no set mechanism for this operation. This needs to be evolved.
5 KSCMF is required to maintain godowns for the storage of procured quantity.
Godowns are maintained but a good number of them are rented out.
6 KSCMF is required to maintain good relationship with APMC.
APMCs and KSCMF have very close ties and good working relationship
7 KSCMF takes loans from different Banks to distribute fertilizer to the farmers in advance in the season.
Activity is undertaken
8 The main objective of KSCMF is to give good price for farmer’s agricultural products, if the market price goes down.
This does not happen due to the lengthy procedure involved. KSCMF has sporadically participated in market intervention operations
9 If the seeds are not available in the sowing season then the KSCMF will provide the seeds to the farmers.
This activity is undertaken but it has little significance in meeting the overall demand.
Taluka Level Agricultural Produce Co-operative Marketing Societies (TAPCMS)
function in most of the talukas of the State. Largely the TPCMS provide/distribute inputs
like seeds/fertilisers and pesticides to the members. To meet the market needs of the
farmers 179 Taluk Agricultural Produce Co-operative Marketing Societies (TAPCMS) are
functioning in Karnataka. The aggregate turnover of all TAPCMS in the year 1996-97 was
Rs.39, 268 lakhs. In addition, there are 62 special agricultural produce-marketing societies
in existence in the State. The Karnataka State Co-operative Marketing Federation functions
as an Apex institution to the TAPCMS.

63
Box 2.3
Main Objectives of TAPCMS
• To provide suitable agricultural marketing facilities for agricultural produce grown by farmers and members.
• To undertake distribution of agricultural requisites and other essential commodities to its members.
• To recover loans by the farmer members of PACS under-linking credit with marketing.
• To provide godown facilities.
• To provide pledge loans on the pledge of agricultural produce till the produce required price.
Even though the objectives of TAPCMS provide for supporting the infrastructural
needs for marketing, it is seldom done. The focus of TAPCMS is more on distribution of
inputs and crop loans.
v. Karnataka Oil-Seed Growers Federation (KOF)
Karnataka Oil-Seed Growers Federation (KOF) is a sub-agency for procurement on
behalf of NAFED. KOF is authorised to procure oil-seeds in the state through the APMCs or
directly from the farmers. The procurement is usually done through the Oil-seed Growers
Co-operative Societies in different parts of the State. The network of these societies has
been widespread and even then the market intervention on behalf of the KOF has been not
so effective. KOF has developed good infrastructure and has 350 Oil-seed Growers Co-
operative Societies all over the State which are situated in the villages (14 major oil-seed
growing districts). Every season, KOF signs an agreement with the NAFED, and after that
the funds are given by NAFED to procure the commodities. There is a strict quality control
by NAFED and therefore, the procurement operation has to be carried out with due care.
Transport charges, gunny bags and labour charges are paid by KOF and reimbursed by
NAFED. Three regional unions (situated in Hospet, Raichur and Hubli) control the Oilseed
Growers Co-operatives in the State. In the recent years, KOF has procured substantial
quantity of oil-seeds from the open market as indicated in Table 2.4.

64
Table 2.4: Procurement of Oilseeds by Karnataka Oil-seed Growers’ Federation (Quantity in tonnes)
Commodity 1999-2000 2000-01 2001-02 Groundnut - 609 - Sunflower 17,680 23,000 40,000 Safflower - 2,440 10,650 Soybean 963 740 - Source: NAFED office, Bangalore. An analysis of the institutions involved in the market intervention operations
indicates five important issues. First, the multiplicity of the institutions complicates the
Market Intervention Scheme (MIS) operations and therefore, it cannot be effective.
Second, there is a considerable lag in the felt need about the operations and actual starting
of the procurement. The lapse of time between these two makes the intervention
ineffective. Third, the institutions are highly bureaucratic and therefore, involve long
procedures before entering into the market. Four, they certainly make profits out of their
operations but are rarely allowed to have freedom of intervention. Last, the infrastructure
provided to these agencies is not adequate, but these institutions have been over-staffed
both for the operations as well as infrastructure.
2.5 Market Infrastructure:
Inadequacy of market infrastructure has been the main reason for market
imperfection. A few studies have shown that owing to the new impetus on the
infrastructure front, there has been significant increase in horizontal and vertical integration
of agricultural markets. It has also been pointed out that now larger share of the
marketable surplus reaches the market and most of the markets have the needed basic
facilities. However, lot remains to be done in creating adequate marketing infrastructure in
rural areas. It is high time now that the investment in this section comes from private
sources. Conducive environment for attracting private investment needs to be created.
It has been estimated by the Expert Committee on Agricultural Marketing appointed
by the Ministry of Agriculture, Government of India, that to create adequate marketing
infrastructure, an investment of Rs. 268 thousand crores would be needed during the next
decade (GoI, 1997). It is essential that the private sector participates in this important
activity as the gains out of this will, otherwise, go to the undeserving traders due to lack of
competition. But the legal framework has to be more conducive for such initiative. In
some of the states, steps are taken to create an amalgam of cooperatives and private

65
traders. The scale of these schemes needs considerable expansion to realize the
investment potential in agricultural marketing infrastructure.
The agricultural market infrastructure in Karnataka has been inadequate to handle
the situation squarely. It comes out from Tables 2.5 and 2.6 that it is not only that the
infrastructure is inadequate but it also impacts the turnover from the markets. As can be
seen from the table, the State has only 1.08 main-markets per lakh hectares of gross
cropped area as against 3.7 markets in the country. The density of main and subsidiary
markets together works out as 3.74 markets per lakh hectares of ESA. But even that is
possibly spread, thinly.
Table 2.5: Regulated Agricultural Main Markets in Karnataka and India.
Number of Markets Total Per lakh Ha of GSA
Year
Karnataka India Karnataka India 1990-91 116
(1.75) 6,640 0.957 3.572
1991-92 116 (1.72)
6,738 0.986 3.697
1992-93 120 (1.72)
6,772 0.968 3.648
1993-94 122 (1.79)
6,809 0.983 3.653
1994-95 124 (1.81)
6,836 0.997 3.647
1995-96 131 (1.88)
6,968 1.053 3.718
1996-97 135 (1.94)
6,968 1.084 3.718
Note: 1) Figures in parenthesis are % to all India. 2) * Not available, hence/earlier figures taken Sources: 1. Statistical Abstract of Karnataka for various years, Directorate of Economics and Statistics, Bangalore. 2. Fertiliser Association of India, New Delhi. 1997. 3. GOI 1997b.

66
Table 2.6: Agricultural Marketing Activities in Karnataka: Some Indicators
Year Main Markets
(Nos)
Sub Markets
(Nos)
Total Markets
(Nos)
Total Markets per Lakh
ha. of GSA
As % of Main Markets in
India
Annual Turnover Value for Total Markets (Rs. in
Lakhs) 1990-91 116 295 411 3.392 1.747 595.63 1991-92 116 303 419 3.563 1.722 762.46
1992-93 120 304 424 3.421 1.772 745.82 1993-94 122 312 434 3.497 1.792 837.99 1994-95 124 312 436 3.504 1.814 NA 1995-96 131 325 456 3.665 1.880 NA 1996-97 135 331 466 3.745 1.937 NA 1997-98 NA NA NA NA NA NA 1998-99 143 NA NA NA NA 6,500.21 1999-00 143 NA NA NA NA 6,647.81 2000-01 143 NA NA NA NA 7,512.21 2001-02 143 NA NA NA NA 7,902.39
Sources: 1. Statistical Abstract of Karnataka for Various Years, Directorate of Economics and Statistics, Bangalore. 2. Fertilizer Association of India, 1997. 3. GOI 1997b 2.6 Regulated Markets and Market Yards
The Department of Agricultural Marketing is continuously engaged in improving the
functioning of the Agricultural Marketing System in the State. The main objective of the
Department is to regulate the marketing of agricultural produce and create a competitive
marketing environment for price stability of the notified agricultural produce in the State.
The Department of Agricultural Marketing has established 141 main markets and 342 sub-
markets in the State (see Table 2.7). These markets handled a turnover of Rs.7,512 crores
of agricultural produce during the year 2000-01. The regulated markets have their own
grading centres. The agriculture produce is put to sale after grading into different qualities.
But despite the interventions we cannot firmly say that all the imperfections are totally
eliminated. These include: (i) post-harvest glut in the market due to low and consequent
price collapse; (ii) inter-locking of credit and commodity markets; (iii) inefficiency in grading
and packaging; (iv) non-issue of sale-slips to the farmers in some markets; (v) high-
handedness of Agricultural Produce Market Committees (APMCs) in providing marketing
services; and (vi) creating conditions such that the farmer cannot go back from the market
yard without selling the product.

67
Table 2.7: Regulated Markets by Districts in the Year 2000-01
Districts Main Markets Sub Markets Total Turnover (Rs in Crores)
Bangalore (u) 2 6 8 1061.21 Bangalore (R) 3 11 14 45.31 Bagalkote 5 15 20 159.28 Bellary 6 14 20 229.33 Belagam 10 33 43 343.94 Bijapur 3 13 16 176.97 Bidhar 5 9 14 117.02 Chamrajanagara 3 4 7 64.21 Chikkamagalur 5 10 15 107.23 Chitradurga 4 10 14 218.91 Davangere 6 8 14 274.56 D Kannada 5 3 8 405.91 Dharwad 5 12 17 207.32 Gadag 5 17 22 166.45 Gulburga 7 22 29 183.74 Hassan 6 16 22 139.71 Haveri 6 12 18 410.74 Kodagu 3 3 6 109.18 Kolar 8 15 23 150.77 Koppal 4 13 17 587.37 Mandya 4 9 13 159.41 Mysore 7 7 14 315.70 Raichur 4 11 15 540.64 Shimoga 4 15 19 724.28 Tumkur 10 23 33 239.85 Udipi 3 4 7 64.73 U.Kannada 8 27 35 308.44 Total 141 342 483 7,512.21
Note: Data for two markets was not available. Source: Karnataka State Marketing Board, Bangalore. 2.7 Storage Capacity
The State has godowns to store about 3.40 lakh metric tonnes of grains. This is
neither sufficient nor well spread in the State (see Table 2.8). It can be seen from the
table that Kodagu and Chamarajanagar districts have the lowest capacity whereas
Bangalore, Gulbarga, Tumkur and Shimoga are among the highest capacity districts. Large
number of districts have the storage capacity between one to three thousand tonnes and
only a few have the capacity exceeding five thousand tonnes.

68
Table 2.8: Total Number of Godowns Owned, Hired, Govt. and Private. : 2000-01
(Capacity in MTs) Owned by KFCSC Govt. Godowns TAPCMS Godowns
Hired Private Godowns Hired Total Godowns
Districts Numbers Capacity Numbers Capacity Numbers Capacity Numbers Capacity Numbers Total Capacity
Bagalkote 0 0 0 0 4 1,000 3 750 7 1,750Bangalore 7 7,500 2 500 2 900 6 2,500 17 11,400Belgaum 0 0 5 3,150 0 0 1 250 6 3,400Bellary 0 0 1 1,000 7 2,650 0 0 8 3,650Bidar 2 800 1 350 2 1,650 1 600 6 3,400Bijapur 1 300 2 800 1 300 1 200 5 1,600Chamarajanagar 1 300 0 0 1 300 1 300 3 900
Chikmagalur 0 0 2 800 1 600 2 350 5 1,750Chitradurga 0 0 2 460 2 800 0 0 4 1,260D Kannada 0 0 0 0 4 1,200 0 0 4 1,200Davanagere 0 0 1 440 6 2,130 0 0 7 2,570Dharwad 0 0 1 500 4 1,050 0 0 5 1,550Gadag 0 0 0 0 5 1,420 2 600 7 2,020Gulbarga 3 900 4 3,400 3 2,100 1 200 11 6,600Hassan 0 0 0 0 8 3,040 1 400 9 3,440Haveri 0 0 1 600 2 540 2 600 5 1,740Kodagu 0 0 0 0 1 300 1 280 2 580Kolar 0 0 2 900 6 2,300 1 250 9 3,450Koppal 0 0 1 500 3 2,400 0 0 4 2,900Mandya 0 0 1 2,000 0 0 3 1,000 4 3,000Mysore 0 0 0 0 3 780 5 2,700 8 3,480Raichur 0 0 4 3,650 2 500 0 0 6 4,150Shimoga 2 10000 1 400 6 1,600 1 300 10 12,300Tumkur 0 0 2 2,000 3 900 4 3,100 9 6,000U Kannada 1 800 1 1,000 2 850 0 0 4 2,650Total 17 20,600 34 22,450 78 29,310 36 14,380 165 86,740
Source: Office of the Karnataka Food and Civil Supplies Corporation, Bangalore. FCI is the agency to procure major cereals, stock them and release to the public
distribution system in the State of Karnataka. These operations require huge capacity
godowns. In Karnataka, FCI has about 3.4 lakhs MT capacity of storage.. The location of
the FCI godowns and their capacity is given in Table 2.9.

69
Table 2.9: District-wise and Location-wise Godown Capacity in Karnataka: 2001 (Quantity in MT)
District Food corporation Owned Hired Total Bangalore Bangalore 1,37,090 1,37,090 Kolar KGF 6,250 6,250 Kodagu Madikere 13,500 13,500 Mandya Mandya 9,610 9,610 Mysore Mysore 13,000 13,000 Tumkur Tumkur 20,000 3,750 23,750 Chamrajanagar Chamarajanagar 11,640 11,640 Udupi Udupi 10,000 10,000 Dharwad Dharwad 42,400 42,400 Bellary Bellary 40,000 40,000 Raichur Raichur 3,700 3,700 Koppal Koppal 5,000 5,000 Shimoga Shimoga 19,620 5,000 24,620 Total 3,28,110 12,450 3,40,560
Source: Same as in Table 2.7 2.8 Cost of State Intervention in Market
The price intervention scheme in the form of Minimum Support Price (MSP) was
introduced during the mid-sixties. The scheme operated initially to procure grains for the
purpose of Public Distribution System (PDS). After the PDS became more reliable the
emphasis of MSP shifted to act as price insurance devise. This was to provide the farmers
a psychological back up. However, it failed this expectation miserably during the last five
years.
There has been a considerable increase in the quantities handled by the agricultural
marketing system during the last fifty years owing both to increase in output and increase
in the marketed surplus-output ratios of various agricultural commodities. The overall
marketed surplus-output ratio is estimated to have gone up from 33.4 per cent in 1950-51
to 64.1 per cent in 1999-00. During this period, the marketed surplus of cereals went up
from 11.5 million tonnes to 95.8 million tonnes, pulses 3.9 to 9.5 million tonnes, oilseeds
3.8 to 19.5 million tonnes, fruits and vegetables from 38.2 million tonnes (1980-81) to
118.6 million tonnes and of milk increased from 8.5 million tonnes to 48.6 million tonnes
(Acharya, 2000).
A large number of farmers’ cooperative marketing organizations have been
promoted for undertaking marketing and processing functions. These have played
important role in the improvement of the performance of domestic market of farm products

70
and inputs by increasing competition in the market. In addition to APMC, there are various
apex level cooperative bodies that work in the marketing sector. The main cooperative
organizations include National Agricultural Cooperative Marketing Federation (NAFED),
Tribal Cooperative Marketing Federation (TRIFED), National Cooperative Development
Corporation (NCDC), State Marketing Federations (general as well as commodity specific),
and district level marketing cooperatives and primary cooperative marketing societies
(general as well as commodity-specific).
Table 2.10: Procurement and Quantity Marketed in Regulated Markets – 2000-01
Crops Procurement (In 000 Tonnes)
Quantity Marketed in Regulated
Markets (in 000 Tonnes )
Production (in 000 Tonnes)
Procurement as % of
Production
% Produce Marketed in Regulated Markets
Maize 361 909.98 2059 17.53 44.20
Ragi 15 79.18 1736 0.86 4.56
Bajra 4.5 42.02 229 1.97 18.35
Rice 207.36 2198.73 3619 5.73 60.76
Groundnut 609 17.18 1026 0.06 1.67 Source: (1) Karnataka State Agriculture Marketing Board Annual Reports (2) Karnataka Economic Survey 2000-01 (3) Food and Civil Supply Department
With the 73rd Amendment to the Constitution, now another tier of institutional
framework is provided to deal with the problems at the village and taluka levels. We have
2.2 lakh gram panchayats, 4,567 block panchayats and 349 zilla parishads. Their role can
be quite significant in the development of primary markets removing the market
inadequacies, creating infrastructure marketing extension activities, and dissemination of
market information. This source, therefore, can provide a strong institutional platform.
However, the panchayats so far, have been trying to provide drinking water, drainage and
sanitation facilities, street lights, laying and repairing roads, repair of some old structures in
the village, etc., but not providing marketing facilities in any way. Therefore, their
involvement in providing marketing facilities is only recorded on paper, but in real terms
not even 1 per cent of these have been moving in that direction.
The credit cooperative societies provide a good back up support to the marketing
infrastructure. In fact, in the rural areas, credit cooperatives and market cooperatives work
hand in hand. The growth of credit cooperatives in agriculture in most of the states in
India as well as Karnataka has not been keeping pace with the marketing cooperatives.

71
The non-agricultural sector is taking a lead over agricultural sector and that creates
inequality between the two sectors.
2.9 Cropping Pattern
Karnataka State has a typical composition having a large share of its area under
severe climatic constraints with a highly diversified agricultural sector. The high density of
low value and high-risk crops typifies the State agriculture. On the contrary and at the
same time, the state has entered in a big way in the high-tech agriculture, only next to a
few other states in the country. Therefore, the price incentive structure becomes an
important component of agricultural policy in the State. The crop economy of the State has
a few typical characteristics. It has a predominantly cereal dominant crop pattern with
coarse grains having the largest share of area under them. These crops generally have low
yield rates and lower prices and thus commercial crops are reported to support the
agricultural economy. The growth pattern depends upon the performance of monsoon and
the availability of water.
The area under total cereals in the state stood at 45 per cent (1999-00) which came
down by 11 per cent from 56 per cent during 1955-58. The decline was mainly owing to
reduction in area under jowar and bajra. Incidentally, these two crops were among the
lowest priced crops under MSP. The area under paddy increased by 3 per cent, from 8.7 to
11.6 per cent between 1955-58 and 1990-93 and stabilized around that level after that.
The area under maize increased from about 0.1 per cent in 1955-58 to 2.5 per cent of the
gross cropped area in 1990-93 and further to 4.31 per cent. Though there is a decline in
the proportion of area under cereals, paddy, jowar, bajra, maize and wheat continued to be
the dominant cereal and millet crops in the State (Table 2.11).

72
Table 2.11: Changes in Cropping Pattern (Area as per cent to GCA)
Crops 1955-58 1979-82 1990-93 1997-00 Rice 8.68 10.41 10.86 11.60Wheat 2.91 3.17 1.80 2.16Jowar 25.45 19.04 17.76 15.61Bajra 5.11 5.67 2.98 3.04Ragi 8.64 10.15 8.71 7.95Maize 0.10 1.40 2.50 4.31Total Cereals 56.46 53.28 44.97 45.31Gram 1.55 1.32 1.90 --Tur 2.80 3.31 3.60 3.74Total Pulses 12.64 14.19 13.59 14.62Groundnut 8.80 7.74 10.53 9.95Sesamum -- 1.02 1.09 --Safflower -- 1.48 1.35 --Sunflower -- 1.00 10.22 --Total Oil-Seeds 12.08 12.56 24.39 19.56Cotton 10.21 9.31 4.88 4.83Sugarcane 0.52 1.50 2.32 2.71Chillies 1.03 1.40 1.36 --Tobacco 0.39 0.44 0.47 0.64Coconut 0.86 1.59 2.02 -Arecanut 0.29 0.50 0.55 -Banana -- 0.35 0.27 -Citrus -- 0.28 0.19 -Mango -- 0.42 0.45 -Coffee 0.61 1.03 1.19 -Mulberry -- 1.07 1.29 -
Others 16.27 13.47 9.51 -(Total GCA in Lakh ha) (104.3) (110.3) (121.9) (120.02)
Source: Directorate of Economics and Statistics, Govt. of Karnataka, Bangalore.
Cereals in general dominate the cropping pattern of the state. Rice is the major
cereal crop in the Coastal and Malnad districts whereas, jowar and ragi are important staple
food grains in northern and southern districts of Karnataka respectively. Area under pulses
has remained more or less unchanged (around 14 per cent) during the last four decades.
The introduction of technology mission for oil-seeds and favourable price regime helped in
the expansion of area under oilseeds. The area under oil-seeds in the State, which was
around 12 per cent till late 70s, increased to 24.4 per cent after 1980s but went down to
19.6 per cent in the 90s. The gains in the oil-seeds area during the eighties were at the
cost of cotton. The area under groundnut and sunflower in the state shared about 4.6 and
1 per cent of the total area under respective crops in the country. Cotton is an important
cash crop of the State. The area under cotton declined from 10 per cent to 5 per cent and
much of the decline came after 1980-81. The area under other cash crops such as
sugarcane, coconut, arecanut, etc., has increased over the years (See Table 2.12).

73
Table 2.12: Compound Annual Growth Rates of Area under the Crops from the Years 1955-58 to 1999-2000
Crops Compound Annual Growth Rate
Rice 0.96 Wheat -0.35 Jowar -0.77 Bajra -0.84 Ragi 0.13 Maize 9.06 Total Cereals -0.18 Gram 0.95 Tur 0.96 Total Pulses 0.64 Groundnut 0.59 Sesamum 1.20 Safflower 0.06 Sunflower 18.91 Total Oil-seeds 1.39 Cotton -1.34 Sugarcane 4.06 Chillies 1.15 Tobacco 1.42 Coconut 2.69 Arecanut 2.12 Banana -1.13 Citrus -2.03 Mango 1.21 Coffee 2.19 Mulberry 2.07 Others -1.00 Total GCA 0.31 Source: Based on the data collected from the Directorate of Economics
and Statistics, Govt. of Karnataka, Bangalore. 2.10 Irrigation
Karnataka is not among the States, which have sizeable area under irrigation.
Despite its predominant drought-prone characteristic the State has only about 26 per cent
of its gross areas sown under irrigation (See Table 2.13). Among the districts of
Karnataka, ten districts have the distinction of receiving irrigation to more than 30 per cent
of their Net Sown Area, a threshold indicated by the Second Irrigation Commission for
protective irrigation. Eight districts have more than 20 per cent of net sown area under
irrigation and the remaining nine districts have net irrigated area less than 20 per cent of

74
their net sown area. Quite ironically these nine districts are the core drought-prone areas
of the State.
Canal irrigation is the major source of irrigation in the State, followed by well
irrigation (including bore/tube wells). Across the districts canal irrigation is a prominent
source in about 10 districts where more than 50 per cent of their net sown area comes
through canal irrigation. Groundwater irrigation is popular in the drought-prone regions of
the State and these include Bidar, Bijapur, Chitradurga, Haveri, Kolar and Tumkur (see
Table 2.14). Tank irrigation has been losing ground very fast and it is a major source in
Shimoga, Hassan and Chickmagalur districts.
Table 2.13: District-wise Per cent of Net and Gross Irrigated Area: 1999-2000 District District % of Net Area Irrigated to
Net Area Sown % of Gross Irrigated Area to
Gross Cropped Area Bagalkote 42.42 41.21 Bangalore Rural 26.02 26.53 Bangalore Urban 17.59 23.41 Belgaum 40.71 39.98 Bellary 32.86 41.06 Bidar 10.22 9.32 Bijapur 17.23 18.35 Chamarajanagar 30.29 29.64 Chickmagalur 8.69 11.53 Chitradurga 15.54 15.45 D. Kannada 51.63 44.69 Davangere 34.4 42.8 Dharwad 13.14 12.1 Gadag 17.47 15.91 Gulbarga 13.67 12.44 Hassan 21.69 22.46 Haveri 20.79 18.35 Kodagu 2.1 2.29 Kolar 18.84 23.33 Koppal 30.55 34.81 Mandya 43.79 49.42 Mysore 29.24 28.34 Raichur 28.71 34.35 Shimoga 61.44 64.16 Tumkur 19.18 21.76 Udipi 35.27 28.38 U. Kannada 22.1 19.27 Karnataka 24.83 26.14 Source : Karnataka Socio-Economic Indicators 2001 & Past Issues, Directorate of Economics &
Statistics, Govt. of Karnataka.
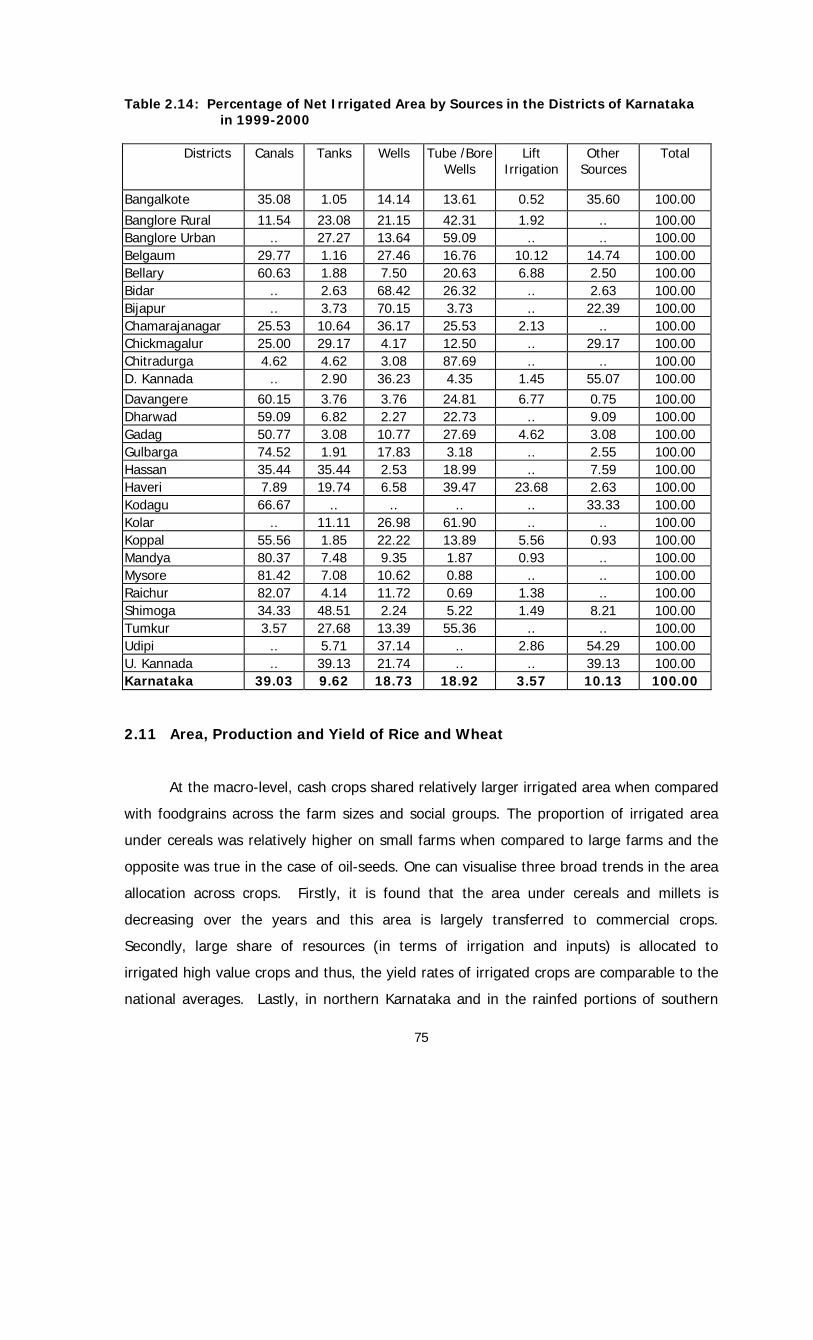
75
Table 2.14: Percentage of Net Irrigated Area by Sources in the Districts of Karnataka in 1999-2000
Districts Canals Tanks Wells Tube /Bore
Wells Lift
Irrigation Other
Sources Total
Bangalkote 35.08 1.05 14.14 13.61 0.52 35.60 100.00
Banglore Rural 11.54 23.08 21.15 42.31 1.92 .. 100.00 Banglore Urban .. 27.27 13.64 59.09 .. .. 100.00 Belgaum 29.77 1.16 27.46 16.76 10.12 14.74 100.00 Bellary 60.63 1.88 7.50 20.63 6.88 2.50 100.00 Bidar .. 2.63 68.42 26.32 .. 2.63 100.00 Bijapur .. 3.73 70.15 3.73 .. 22.39 100.00 Chamarajanagar 25.53 10.64 36.17 25.53 2.13 .. 100.00 Chickmagalur 25.00 29.17 4.17 12.50 .. 29.17 100.00 Chitradurga 4.62 4.62 3.08 87.69 .. .. 100.00 D. Kannada .. 2.90 36.23 4.35 1.45 55.07 100.00 Davangere 60.15 3.76 3.76 24.81 6.77 0.75 100.00 Dharwad 59.09 6.82 2.27 22.73 .. 9.09 100.00 Gadag 50.77 3.08 10.77 27.69 4.62 3.08 100.00 Gulbarga 74.52 1.91 17.83 3.18 .. 2.55 100.00 Hassan 35.44 35.44 2.53 18.99 .. 7.59 100.00 Haveri 7.89 19.74 6.58 39.47 23.68 2.63 100.00 Kodagu 66.67 .. .. .. .. 33.33 100.00 Kolar .. 11.11 26.98 61.90 .. .. 100.00 Koppal 55.56 1.85 22.22 13.89 5.56 0.93 100.00 Mandya 80.37 7.48 9.35 1.87 0.93 .. 100.00 Mysore 81.42 7.08 10.62 0.88 .. .. 100.00 Raichur 82.07 4.14 11.72 0.69 1.38 .. 100.00 Shimoga 34.33 48.51 2.24 5.22 1.49 8.21 100.00 Tumkur 3.57 27.68 13.39 55.36 .. .. 100.00 Udipi .. 5.71 37.14 .. 2.86 54.29 100.00 U. Kannada .. 39.13 21.74 .. .. 39.13 100.00 Karnataka 39.03 9.62 18.73 18.92 3.57 10.13 100.00 2.11 Area, Production and Yield of Rice and Wheat
At the macro-level, cash crops shared relatively larger irrigated area when compared
with foodgrains across the farm sizes and social groups. The proportion of irrigated area
under cereals was relatively higher on small farms when compared to large farms and the
opposite was true in the case of oil-seeds. One can visualise three broad trends in the area
allocation across crops. Firstly, it is found that the area under cereals and millets is
decreasing over the years and this area is largely transferred to commercial crops.
Secondly, large share of resources (in terms of irrigation and inputs) is allocated to
irrigated high value crops and thus, the yield rates of irrigated crops are comparable to the
national averages. Lastly, in northern Karnataka and in the rainfed portions of southern

76
Maidan the crop pattern is largely diversified whereas the coastal Karnataka and irrigated
regions seem to prefer mono cropping.
Production trends of important crops have been analysed here with the help of
compound rates of growth for production and productivity for the period 1955-56 to 1993-
94, and separately for 1990 to 2000. It is observed that the production of cereals in the
State has grown at 2.3 per cent per annum during the period 1955-56 and 1993-94. The
entire growth has been contributed by the yield as area under cereals in the State
decelerated during this period. The expansion in area under cereals during 1955-56
through 1967-68 resulted in significant growth in cereal production in the State (Tables
2.11 and 2.12). The cereal production in the State increased marginally (by 0.0116 per
cent per annum) between 1980-81 and 1990-91 and this miniscule growth was due to
lower levels of production during the late 1980s. Concerned with this, the State
government appointed an Expert Committee (under the Chairmanship of Sri T R Satish
Chandran) to probe into the factors responsible for stagnation in agricultural production.
However, there was a recovery during 1992-93 and an analysis of production data for
1980-81 through 1993-94 indicated a growth rate of around 1.78 per cent. It is essential to
underscore that the growth in production during this period came mainly through yield
improvements. But the deceleration was again visible during the nineties. The role of price
incentives is certainly important in this structure of growth.

50
Table 2.15: District-wise Growth Rates of Production under Principal Crops from 1990-91 to 1998-99
Paddy Ragi Jowar Tur High Growth Low Growth High Growth Low Growth High Growth Low Growth High Growth Low Growth
D. Kannada 21.69 U. Kannada 1.50 Mandya 10.76 Belgaum 1.08 U. Kannada 11.31 Gulbarga 1.83 D. Kannada 14.42 Kolar 1.55 Chitradurga 13.11 Kolar -0.09 Mysore 6.55 Chitradurga 1.01 D. Kannada 8.75 Chitradurga 0.93 Gulbarga 14.15 Chikmagalur 0.94 Raichur 9.61 Kodagu -0.37 Chikmagalur 4.88 Bidar 0.00 Bijapur 5.06 Belgaum -0.78 U. Kannada 4.74 Bidar -3.11 Bellary 9.26 Bidar -8.69 Bangalore 3.23 Bijapur 0.00 Bidar 3.82 Chikmagalur -1.97 Tumkur 3.76 Chitradurga -4.44 Tumkur 8.99 Dharwad -12.30 Hassan 2.80 Raichur 0.00 Raichur -2.63 Bangalore -5.42 Mysore 8.31 Bijapur -13.00 Tumkur 2.64 D. Kannada -0.66 Hassan -3.56 Mandya -5.65 Gulbarga 8.20 Kolar 2.56 Bellary -5.25 Bellary -3.73 Belgaum -5.66 Hassan 7.10 Dharwad -6.44 Mandya -5.50 Mysore -7.67 Mandya 4.34 U. Kannada -8.42 Mysore -6.93 Hassan -7.84 Shimoga 3.53 Shimoga -10.47 Dharwad -7.00 Raichur -8.44 Bangalore 3.12 Kodagu -16.12 Tumkur -12.31 Bijapur -10.06 Belgaum 2.68 Gulbarga -18.47 Shimoga -17.30 Bellary -12.93 Chikmagalur 2.41 Shimoga -16.03
Groundnut Sugarcane Maize High Growth Low Growth High Growth Low Growth High Growth Low Growth
Mysore 9.31 Bellary 1.73 Bijapur 14.64 Hassan 1.11 Chitradurga 20.32 Bidar 4.74 Hassan 6.01 Bangalore -0.99 Dharwad 12.09 Bidar 0.56 Raichur 15.14 Mandya 3.01 D. Kannada 4.65 Belgaum -2.39 Mysore 7.65 Raichur -0.64 Shimoga 15.03 Hassan 2.72 Chikmagalur 4.31 Kolar -3.11 Gulbarga 7.55 U. Kannada -0.79 Bellary 11.40 Chikmagalur 2.01 Chitradurga 4.31 U. Kannada -3.25 Belgaum 6.90 Chikmagalur -1.51 Tumkur 10.48 Coorg 1.96 Dharwad 4.18 Bijapur -6.46 Chitradurga 3.60 Bangalore -2.20 Kolar 9.83 U.Kannada -12.10 Gulbarga 2.56 Bidar -7.25 Bellary 2.10 Mandya -3.00 Mysore 9.65 Bangalore (u) -22.51 Tumkur 2.32 Raichur -7.35 Shimoga -4.15 Bijapur 7.50 Mandya -8.90 Tumkur -4.22 Dharwad 6.41 Shimoga -10.48 Kolar -7.15 Gulbarga 5.85 Kodagu -40.09 D. Kannada -12.24 Bangalore (R) 5.51 Kodagu -23.92 Belgaum 5.31

51
Table 2.16: District-wise Growth Rates of Area under Principal Crops from 1990-91 to 1998-99
Paddy Ragi Jowar Tur High Growth Low Growth Low Growth High Growth Low Growth High Growth Low Growth
Chitradurga 8.65 U Kannada 0.58 Mandya 0.98 U. Kannada 2.10 Bijapur 0.61 Tumkur 6.33 Gulbarga 0.23 Bellary 5.41 Shimoga 0.36 Tumkur 0.72 Bidar 0.28 Kolar 3.30 Chitradurga -0.09 Raichur 5.37 Belgaum 0.24 Kolar 0.16 Gulbarga 0.23 Bidar 2.77 Mandya -1.84 Mysore 4.85 Chikmagalur -0.58 Mysore 0.15 Dharwad -2.26 U. Kannada 2.20 Hassan -1.93 Hassan 3.62 D. Kannada -1.32 Chikmagalur -0.15 Chitradurga -2.75 Chikmagalur 2.08 Raichur -2.85 Tumkur 2.30 Kodagu -1.84 Bangalore -0.92 Raichur -3.10 Mysore 1.44 Belgaum -3.79 Mandya 1.98 Gulbarga -2.05 Hassan -0.98 Belgaum -3.11 Dharwad -4.67 Dharwad 1.25 Bangalore -2.56 Chitradurga -2.63 Chikmagalur -6.61 Bangalore -5.29 Kolar -5.09 Belgaum -5.57 Bellary -8.51 Bijapur -6.58 Bidar -10.95 Bellary -10.21 Mysore -9.23 Bellary -6.77 Bijapur -17.38 Dharwad -10.78 Mandya -9.35 Shimoga -8.42 Shimoga -11.27 Hassan -11.59 U. Kannada -13.49 Tumkur -12.29 Kodagu -17.39 Shimoga -18.43 Gulbarga -23.36
Groundnut Sugarcane Maize High Growth Low Growth High Growth Low Growth High Growth Low Growth
Mysore 2.94 Chitradurga 0.64 Bijapur 7.89 Bellary 0.11 Chitradurga 7.98 Hassan 0.89 Bellary 2.48 Chikmagalur 0.49 Dharwad 6.85 Bidar -0.13 Shimoga 5.24 Mandya 0.84 Hassan 2.07 Dharwad 0.46 Mysore 6.65 Hassan -0.15 Raichur 4.82 Chikmagalur 0.84 D. Kannada 0.31 Chitradurga 5.48 U. Kannada -1.69 Bellary 4.39 Gulbarga 0.75 Gulbarga -0.68 Gulbarga 3.80 Chikmagalur -2.32 Tumkur 3.98 Bangalore (R) 0.69 Bangalore -1.13 Belgaum 3.13 Bangalore -2.91 Kolar 2.63 Coorg -0.07 Kolar -2.05 Mandya -3.79 Bidar 2.47 Bangalore (U) -2.07 Bijapur -2.54 Kolar -4.82 Mysore 2.33 Bijapur -3.80 Belgaum -2.92 Raichur -5.58 Belgau,m 2.33 U. Kannada -4.30 Tumkur -2.94 Shimoga -6.58 Dharwad 2.29 Bangalore (R) 0.69 Raichur -3.11 D. Kannada -6.68 U. Kannada -5.39 Tumkur -7.32 Mandya -6.61 Shimoga -11.13 Bidar -11.57 Kodagu -39.56

108
Table 2.17: Growth Rates in Crop Economy: 1990-91 to 2000-01 (Per Cent Per Annum)
Crops Production. Productivity
Rice 3.04 1.72 Ragi 2.02 3.65 Jowar -0.25 1.77 Bajra -9.18 -7.89 Maize 6.86 -0.83 Wheat 4.78 0.77 Minor Millets -5.43 1.35 Total Cereals -0.03 -0.17 Tur 5.27 4.89
Total Pulses -1.11 -4.84 Total Foodgrains -0.12 -1.12 Groundnut -0.41 1.06 Total Oil-seeds -9.56 -5.98 Sugarcane 1.49 2.21 Cotton -3.42 -0.42 Tobacco 4.75 -0.93
Source: Based on the data collected from the Directorate of Statistics, Government of Karnataka.
The growth performance clearly indicates the slow growth of crops and crop
groups. The performance is influenced by technology, prices, marketability and relative
crop economy. Among these factors, the role of prices and not income, which is quite
crucial (Deshpande 1996). While explaining the performance of slow growth crops, the
role of relative prices as well as administered prices becomes crucial and significant. Even
between these two variables, the administered prices reflect the policy direction and a well
thought- over policy to influence the decision criteria. Therefore, the analysis of the role of
administered prices becomes pivotal to understand the growing imbalances.
2.12 Production, Market Arrivals and Procurement
In the state there is no procurement of agricultural produce on annual basis except
rice procured by FCI. Karnataka being a State with highly heterogeneous cropping system,
many crops that come under MSP operations are grown in the state and the produce of the
crops procured varied from year to year. Several attempts were made to collect time-series
data on procurement of produce of crops. But, no reliable data could be obtained from the
procurement agencies. Even the state government appointed Agricultural Price Commission
(under Chairmanship of Prof Bisaliah) also has its apprehension on the reliability of

109
procurement data. Hence, we have not presented any analysis over time of procurement
data except for rice.
The procurement of rice in the state varied from 2.84 per cent of production to 5.73
per cent of production during the period 1997-98 to 2000-01. Across the crops highest
procurement was effected for maize and rice. The procurement of other grains was
marginal (See Table 2.18). The quantity marketed in regulated markets ranged from 42
per cent to 61 per cent of production during the four-year period. The trend clearly shows
that farmers were increasingly relying on regulated markets.
Table 2.18: Procurement and Quantity Marketed : 2000-01
As Per cent of Production Crops Procurement (in Thousand
Tonnes)
Quantity Marketed
(in Thousand Tonnes)
Production (in Thousand
tonnes) Procurement Marketed
Maize 361.0 910.0 2059 17.53 44.2Ragi 15.0 79.2 1736 0.86 4.56Bajra 4.5 42.0 229 1.97 18.35Rice 207.6 220.0 3619 5.73 60.76Groundnut 0.6 17.2 1026 0.06 1.67 Source: (1) Karnataka State Agriculture Marketing Board Annual Reports (2) Karnataka Economic Survey 2000-01 (3) Food and Civil Supply Department Table 2.19: Procurement and Quantity Marketed in Regulated Markets – Rice
Year Procurement (in 000 Tonnes)
Quantity Marketed in Regulated
Markets (in 000 Tonnes)
Production (in 000 Tonnes)
% Procured % Marketedin Regulated
Markets
1997-98 91.24 1487.00 3213 2.84 46.28 1998-99 100.43 1552.83 3657 2.75 42.46
1999-2000 111.04 1578.53 3635 3.05 43.43 2000-01 207.36 2198.73 3619 5.73 60.76
Source: Same as in Table 2.18
The grains procured during the year 2000-01 included maize, ragi, bajra, rice and
groundnut (Table 2.18) and other oil-seeds (Table 2.19). The procurement as a percentage
of production was highest for maize (17.5 per cent). The procurement was less than 2 per
cent of the production for ragi, bajra and groundnut. The higher procurement for maize
was due to bumper production during the year and fall in prices. The production of maize
during 1998-99 was 16.7 lakh tonnes and it increased to 20.6 lakh tonnes during 2000-01.
The additional production was 3.9 lakh tonnes and the procurement was 3.6 lakh tonnes. It
is clear that the procurement helped to absorb the additional production. Direct

110
intervention of the government in the state in marketing of agricultural produce is only
when there is bumper production of a crop. In normal production years, there is hardly any
direct intervention of the government in the agricultural produce market.
Table 2.20: Procurement of Oil-seeds (in Tones)
Commodity 1999-2000 2000-01 20001-02 Groundnut - 609 - Sunflower 17,680 23,000 40,000 Safflower - 2,440 10,650 Soyabean 963 740 -
Source: Food and civil supplies Department The agricultural produce is mainly marketed in regulated markets (Table 2.21). In
1998-99, 42.5 per cent of rice production in the state was sold in regulated markets and the
percentage sold in the regulated markets increased to 60.8 per cent in the year 2000-01.
About 42.6 per cent of foodgrains production, 49.9 per cent of pulses production and 27.2
per cent of oil-seeds production in the state was marketed through regulated markets. The
commodities, which had lower dependency on regulated markets, were jowar and ragi.
Jowar and ragi are staple food for many people in the state, jowar in northern Karnataka and
ragi in southern Karnataka. These crops were mainly grown for domestic consumption and
the marketed surplus of these crops is in the local private trade.
Table 2.21: Percentage of Produce Marketed in Regulated Markets
Crop/Year 1997-98 1998-99 1999-2000 2000-01 Rice 46.28 42.46 43.43 60.76 Wheat 25.54 8.73 16.95 33.79 Jowar 8.56 6.08 5.53 10.97 Bajra 10.83 15.39 17.22 18.35 Ragi 7.24 6.17 7.17 4.56 Maize 38.84 41.53 36.12 44.20 Tur 60.50 23.40 34.67 34.58 Groundnut 49.72 27.26 39.05 28.27 Cotton 50.38 34.32 34.68 41.42 Total Food grains 34.60 30.51 30.67 42.55 Total Pulses 58.42 45.29 41.80 49.89 Total Oil-seeds 40.82 39.35 34.47 27.19
Source: Annual reports of Karnataka State Agricultural Marketing Board 2.13 Price Movement of Selected Commodities

111
The movements in wholesale prices of certain agricultural commodities over the
years 1989-99 are given in Table 2.22. The prices of all the commodities are seen to
increase over the period. The linear trend of the prices has been depicted in Figure 2.1,
which captures the movements in the prices for each commodity. The price of Rice has
been increasing over the years steadily until 1997-98, and in 1998-99, it has taken a wide
leap. In the case of Jowar, there has been a wide fluctuation in the prices over the period.
Bajra also showed a similar trend, with higher prices during 1992-93, a decline in the
following year and again it increased in the subsequent years. The price of Ragi had been
high during 1991-92 and later, a decline in 1992-93 was observed which remained more or
less constant during the remaining period. Wide increases in the prices of Tur had been
seen after 1994-95 and in 97-98 a decline was noticed. The price of groundnut has been
steady over the period except for a slight decline in 93-94. Maize price plunged severely
during 1992-93, which again shot up in the subsequent years and witnessing minor
downward fluctuations in 1996 and 1997.
Table 2.22: Annual Average Wholesale Prices of Some Important Agricultural Commodities (Rs. Per Quintal)
Year Rice Wheat Jowar Bajra Ragi Gram Tur Groundnu
t Maize 1989-90 491 392 286 213 228 875 737 630 225 1990-91 489 410 248 215 207 909 941 832 283 1991-92 607 522 388 327 376 910 1060 916 389 1992-93 719 605 489 396 313 975 1031 1034 254 1993-94 729 603 395 315 322 1367 1133 1012 374 1994-95 886 658 480 391 355 1474 1286 1151 465 1995-96 978 699 654 477 438 1303 1978 1277 463 1996-97 1105 880 663 468 480 1570 2075 1430 442 1997-98 1132 937 618 465 481 1796 1564 1448 419 1998-99 1559 997 739 520 515 1703 2058 1541 565
Source: Statistical Abstract of Karnataka

112
Figure 2.1: Wholesale Prices of Certain Agricultural Commodities
Rice
0
500
1000
1500
200019
89-9
019
90-9
119
91-9
219
92-9
319
93-9
419
94-9
519
95-9
619
96-9
719
97-9
819
98-9
9
Rs.
Per
Qui
ntal
Rice Linear (Rice)
Jowar
0100200300400500600700800
1989
-90
1990
-91
1991
-92
1992
-93
1993
-94
1994
-95
1995
-96
1996
-97
1997
-98
1998
-99
Rs.
Per
Qui
ntal
Jowar Linear (Jowar)
Bajra
0100200300400500600
1989
-90
1990
-91
1991
-92
1992
-93
1993
-94
1994
-95
1995
-96
1996
-97
1997
-98
1998
-99
Rs.
Per
qui
ntal
Bajra Linear (Bajra)
Ragi
0
100
200
300
400
500
600
1989
-90
1990
-91
1991
-92
1992
-93
1993
-94
1994
-95
1995
-96
1996
-97
1997
-98
1998
-99
Rs.
Per
Qui
ntal
Ragi Linear (Ragi)
Tur
0
500
1000
1500
2000
2500
1989
-90
1990
-91
1991
-92
1992
-93
1993
-94
1994
-95
1995
-96
1996
-97
1997
-98
1998
-99
Rs.
per q
uint
al
Tur Linear (Tur )
Groundnut
0200400600800
10001200140016001800
1989
-90
1990
-91
1991
-92
1992
-93
1993
-94
1994
-95
1995
-96
1996
-97
1997
-98
1998
-99
Rs.
Per
qui
ntal
Ground Nut Linear (Ground Nut)

113
Maize
0
100
200
300
400
500
600
1989
-90
1990
-91
1991
-92
1992
-93
1993
-94
1994
-95
1995
-96
1996
-97
1997
-98
1998
-99
Rs.
per
qui
ntal
Maize Linear (Maize)
2.14 Concluding Remarks
Karnataka being one among the states with significant share of its area under
rainfed condition also confronts droughts frequently. It has a large proportion of its area
categorised as drought-prone by the Second Irrigation Commission (1972) and the National
Commission on Agriculture (1976). Therefore, quite naturally foodgrains and self-
sustaining crop pattern dominates its agricultural economy. Commercialisation is emerging
at a very slow pace and sporadically across the districts. There are a few districts where
commercial crops dominate significantly and markets for these crops have developed. But
in the regions with foodgrain dominant cropping pattern, this is yet to happen at the
required pace. In fact, even in these regions the cropping pattern is turning towards
commercial non-food horticultural crops. Regulated markets have recorded their presence
in the rural areas but their density is not significant enough to map the marketable surplus.
As a result, large part of agricultural marketing takes place through the traditional
channels. Rice and maize are the two cereals that enter the markets significantly. But
again that is confined to a few districts. Procurement through different agencies is
sporadic and insignificant compared to the production as well as marketable surplus. As a
result, the movements in the prices are also not very significant.

114
Annexure 2.1
GOVERNMENT OF KARNATAKA ORDER
Sub: Procurement of food grains through Minimum Support Prices fixed by Government of India.
Ref : 1. Government of India letter number 06.01.2000 FES, ES Date :
01.09.2000. 2. Government order number , FCS 24 RPR 98 (P) 11 Date : 03.11.1998.
Preamble : According to the circular form Govt. of India. Dated 01.09.2000 MSP for Kharif crops for the year 2000-01 are fixed. As mentioned in the state Govt.(2) order, Task Force committee are set up at state and district level for procuring food grains through MSP. Government will take all the adequate steps through MSP for food grains: cotton, Oil seeds, Cereals and pulses are procuring through Karnataka Food and Civil Supply Corporation, Cotton Corporation of India (CCI), Karnataka cooperative Oil seed growers Federation (KOF), National Agricultural Co-operative Market Federation (NAFED) and Karnataka State Co-operative marketing federation are working as sub agency under FCI and NAFED. If market prices of food grains : cotton, oil seeds and cereals are less than the minimum support prices then the above federations (FCI/NAFED) are interfere in to the market and order to the sub agencies to procure food grains from the farmers as usual in the every year. So, Examine the proposal and ordered as,
GOVERNMENT ORDER NO. FCS 13 RPR 2000 BANGALORE DATE: 04.10.2000 As stated the above region the Government of India has fixed MSP for below mentioned
food grains. In the market, if market pries are less than the MSP for below mentioned crops & corresponding price then FCI order to sub agencies to procure.
Sl.no. Crops MSP Rs./quintal
1 Paddy ( common) 510.00 2 Paddy (Grade A.) 540.00 3 Maize (FAQ) 445.00 4 Jowar 445.00 5 Bajra 445.00 6 Ragi 445.00 7 Tur (Arhar) 1200.00 8 Green gram 1200.00 9 Urad 1200.00 10 Groundnut 1220.00 11 Soyabean (Black) 770.00 12 Soyabean (Yellow) 865.00 13 Sesamum (FAQ) 1300.00
14 Sunflower 1170.00 15 Niger seed (FAQ) 1025.00 16 Cotton (F414,H777 & J34) 1625.00 . 17 Cotton H4 1825.00
Contd…
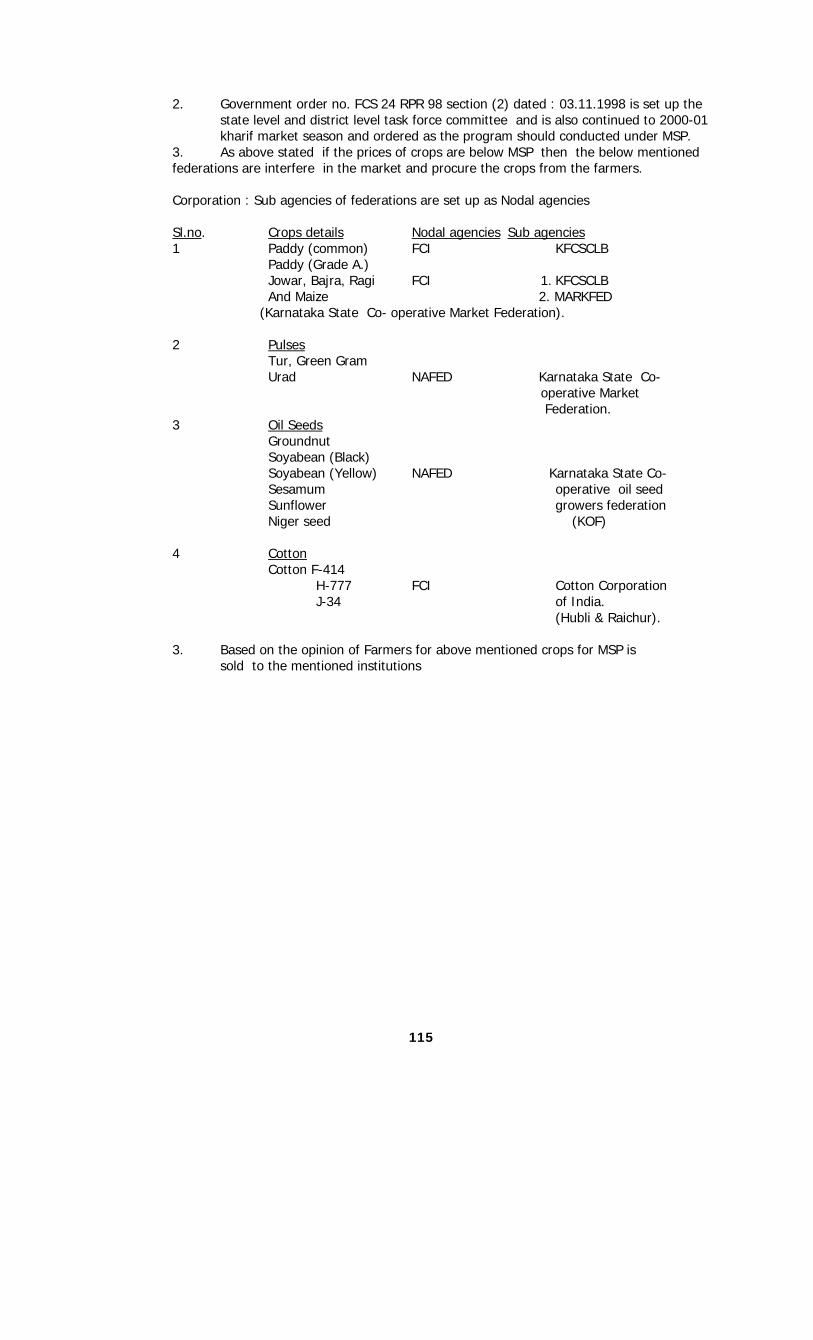
115
2. Government order no. FCS 24 RPR 98 section (2) dated : 03.11.1998 is set up the state level and district level task force committee and is also continued to 2000-01 kharif market season and ordered as the program should conducted under MSP.
3. As above stated if the prices of crops are below MSP then the below mentioned federations are interfere in the market and procure the crops from the farmers. Corporation : Sub agencies of federations are set up as Nodal agencies Sl.no. Crops details Nodal agencies Sub agencies 1 Paddy (common) FCI KFCSCLB Paddy (Grade A.) Jowar, Bajra, Ragi FCI 1. KFCSCLB And Maize 2. MARKFED (Karnataka State Co- operative Market Federation). 2 Pulses
Tur, Green Gram Urad NAFED Karnataka State Co-
operative Market Federation.
3 Oil Seeds Groundnut Soyabean (Black) Soyabean (Yellow) NAFED Karnataka State Co- Sesamum operative oil seed Sunflower growers federation Niger seed (KOF)
4 Cotton Cotton F-414 H-777 FCI Cotton Corporation J-34 of India.
(Hubli & Raichur).
3. Based on the opinion of Farmers for above mentioned crops for MSP is sold to the mentioned institutions

116
CHAPTER III
SALIENT AGRO-ECONOMIC CHARACTERISTICS OF SELECTED DISTRICTS
3.1 Introduction
As indicated earlier, two different districts were chosen for the purpose of primary
survey viz., Raichur and Chitradurga districts. The districts are situated in central
Karnataka region largely falling in the rainfed zone of Karnataka but in the region with
good potential for development of markets and commercial crops. The district of Raichur
is known for its agricultural predominance and despite adversely placed under climatic
constraints, the district has achieved very well in stepping up the growth of its agricultural
economy. Among the constraints, small and marginal farmers predominate the district’s
agrarian structure and this is further aggravated by the persistent drought situation in the
district. Raichur has some area under irrigation but a large part of the district falls in the
rain shadow zone. Markets for agricultural commodities are well developed in the district.
Chitradurga district is another major drought-prone areas of Central Karnataka having
persistent history of drought. The district has recorded moderate growth in the crop
economy. Food grains dominate its cropping pattern. Oil-seeds and cotton are the major
cash crops of the district. Agricultural markets are well developed in Chitradurga district
and the economy of the district is supported by cash crops especially from oil-seed
processing sector. We have taken these two districts for the purpose of our study based
on the criteria indicated by the coordinating centre. We are mapping out here the basic
characteristics of the selected districts.
3.2 Raichur District
3.2.1 Location
The district of Raichur is situated in the northeastern sector of the state, in the
proverbial Deccan Plains. It lies between 15° 10′ and 16° 34′- north latitudes and 75° 47′ and
77° 36′- east longitudes, with an average height from sea level as 1,311 feet. It shows typical
ecological and meteorological pattern of a drought-prone district. With a geographical area of
14,017 sq. kms in the undivided form it was the third largest district of the state. The district
falls under the “Rain- Shadow” region with the average annual rainfall of 599 mm (23.68″).

117
The general slope of the district is from the northwest towards the southeast. Roughly,
western portion of the district consists of plains and scanty vegetation, while the eastern
portion has a few hillocks and scrub jungles. This portion has undulating surfaces with a soil
red in colour and varying depths, while the plains of the western portion contain deep black
alluvial soil.
3.2.2 The History
The district of Raichur lies between two rivers of Krishna and Tungabhadra,
historically referred to as Raichur doab. It was a fertile area and many wars were fought
between the `Bahamani Kingdom’ and `Vijayanagara Empire’, for its occupancy. Western
part of the district has plain land and scanty vegetation, while the eastern part has a few
hillocks and shrub jungles. Eastern part of Raichur district was historically ruled by various
rulers and for a long period it was under the `Bahamani Kingdom’. The development of
agricultural market dates back to this period. With the re-organisation of states on linguistic
basis after independence, the region was aceeded to Karnataka state and became the
district headquarters called Raichur, comprising 9 taluks, viz., Raichur, Manvi, Deodurga,
Lingsugur, Sindhanur, Kushtagi, Gangavathi, Yelburga and Koppal. It was one of the
largest districts of the state with Raichur and Koppal as two growth centres. The district
was further bifurcated in 1998 for administrative convenience and Koppal district, covering
4 taluks of Gangavathi, Yelburga, Kushtagi and Koppal was carved out of the erstwhile
Raichur district, leaving Deodurga, Manvi, Sindhanur, Lingasugur and Raichur taluks in
Raichur district.
The backwardness of Raichur district within Karnataka state needs no emphasis.
Drought and famine situations have been frequently experienced by this region historically
during the Nizams rule and well after that. This is recorded in the district Gazeteers.
Raichur (including Koppal district) experienced several famines over the centuries. Ferishta
records a severe famine as early as 15th Century. He refers that in 1419, there was another
grievous famine and no rainfall throughout Deccan and Karnataka. In 1420, there was a
severe failure of rain and Bahamani Kingdom was quite disturbed in meeting the famine.
Again, the years of 1472 and 1473 were described as seasons of exceptional distress.
Ferishta observes that no rainfall and no crops were sown for two years - `many died,
many left home and in the third year when rainfall was scarce, there were hardly any left
behind to till the land’. Later, Abdul Hamid in his Badasha Nama records that famine

118
occurred in the 17th Century i.e., in 1659 when Raichur and parts of Hyderabad state
suffered from severe drought. Similar was the situation in British India. Even after
independence the droughts and famines were quite frequent in the district. But, the district
has recorded quite an impressive agricultural growth (Gazetteer of India, Mysore State,
Raichur District, 1967).
3.2.3 Area and Population
The district predominantly has rural under-developed characteristics with 90 per cent
of the area and more than 82 per cent of the population living in rural areas. The district has
a typical growth pattern like other districts of Northern Karnataka. But, interestingly, across
taluks the growth pattern of Liingsugur and Sindhnur were depicting higher rates of growth
during 1981-91 compared with the earlier decade (Table 3.1 and Figure 3.1)
Figure 3.1 Percentage Change in Raichur D istrict Population
0
10
20
30
40
50
60
70
80
Deodu
rg
Ganga
vati
Koppa
l
Kushta
gi
Lings
ugar
Manvi
Raichu
r
Sindhu
nur
Yelburg
a
Total Rural U rban

119
According to 1991 population census 2.61 lakh people were cultivators, 3.15 lakh people were
agricultural labourers. Females out numbered males as agricultural labourers (1.63 lakhs and
1.51 lakhs respectively). Almost 50,277 people lived as marginal workers and 94 per cent of
them were females. The changes in the population of the district in 1991 over the 1981
census are shown in the figure 3.1. There is a strong trend of urbanization across the talukas
and that is also indicative of larger job opportunities in the urban centres of the district.
Table 3.1: Population in Raichur District
(In Thousands) 1981 1991 Percentage Change Taluk
Total Rural Urban Total Rural Urban Total Rural UrbanDeodurg 141.21 129.28 11.94 176.88 161.93 14.95 25.26 25.26 25.26 Gangavati 257.19 198.46 58.74 320.39 239.23 81.15 24.57 20.54 38.16 Koppal 199.82 156.38 43.45 251.71 199.45 52.26 25.97 27.55 20.29 Kushtagi 136.86 125.08 11.78 189.89 175.23 14.65 38.74 40.09 24.35 Lingsugar 200.13 161.83 38.30 262.04 200.54 61.49 30.94 23.92 60.56 Manvi 201.31 179.97 21.35 269.27 241.19 28.08 33.76 34.02 31.55 Raichur 273.99 149.23 124.76 358.84 175.70 183.13 30.97 17.74 46.78 Sindhunur 218.96 193.08 25.88 284.75 240.38 44.37 30.05 24.50 71.48 Yelburga 154.34 146.79 7.55 196.08 196.08 0.00 27.04 33.58 Total 1783.82 1440.09 343.73 2309.85 1829.73 480.08 29.49 27.06 39.67
3.2.4 Climatic Conditions
The climate of the district is characterised by a typical rainfed/drought-prone climate for
the major part of the year and a very hot summer. Highly variable rainfall and ill- distribution
of rainfall renders the district susceptible to drought. Agricultural year of the district may be
divided broadly into four seasons. The summer season begins by about the middle of
February and extends ahead of the end of May. The southwest monsoon season is from June
to the end of September. October and November are the post monsoon or retreating
monsoon months and the period from December to the middle of February is the cold season.
Raichur district, on the whole, has a dry climate, the period from November to May is the
driest part of the year. Even during the southwest monsoon period the humidity is not very
high.
i. Rainfall Pattern
The region around Lingsugur gets the least amount of rainfall in the district, while
towards the south as well as the east, rainfall increases. During the southwest monsoon i.e.,

120
June to September, the district receives about 69 per cent of the annual rainfall, September is
the month with the highest rainfall in the district. In the post-monsoon months of October and
November, the district receives some rain. The variations in the annual rainfall from year to
year are quite large. On an average, there are 41 rainy days (i.e., days with 2.5 mm or more
of rain) in a year in the district.
ii. Mean Annual and Seasonal Rainfall
The analysis indicates that the mean annual rainfall of this district is 655 mm with a
standard deviation of 215.6mm and co-efficient of variation of 33 per cent. Devdurga taluk
recorded the highest mean annual rainfall of 738 mm and Lingsugur taluk recorded the lowest
average annual rainfall of 572mm. Table 3.2 shows the mean seasonal and annual rainfall of
different taluks of the district. Raichur district receives about 10 per cent of the annual rainfall
during pre-monsoon period. There is high variability in pre-monsoon rainfall in the taluks of
Devdurga, Lingsugur, Raichur and Sindhanur, and least variability in pre-monsoon is in Manvi
taluk. About 69 per cent of the annual rainfall is received in the district during southwest
monsoon period. Devdurga and Raichur taluks receive high rainfall during this period. In
Lingsugur, Manvi and Sindhanur taluks, southwest monsoon is below the district average,
which is 450mm. Northeast monsoon rainfall accounts for 21 per cent of the annual rainfall in
Raichur district. Low average rainfall occurs in Manvi taluk during this season. The least inter-
annual variability of rainfall is observed during this season in Lingsugur and Manvi taluk,
medium variability in Sindhanur and Raichur taluks. Slightly higher variability is observed in
Devdurga.
During the period 1958-99, Raichur district experienced 14 years of excess annual
rainfall, there were 12 years of normal annual rainfall, 12 years of moderately deficit annual
rainfall and 3 years were severely deficit annual rainfall. Frequency of below normal, normal
and above normal rainfall years in each of the taluks during 1958-1999 indicates that below
normal rainfall years were more than above normal rainfall years in Raichur and Manvi taluks.
It was almost equal in Lingsugur taluk. This shows high susceptibility of Raichur and Manvi
taluks.

121
Table 3.2: Average seasonal and annual rainfall and variation in Raichur district (Rainfall in mm.)
TALUK
Pre-
Monsoon [January-
May]
South-West
Monsoon [June-
September]
North-East Monsoon [October-
December]
Annual
[January-December]
DEVDURGA
AVERAGE S.D. C.V. (%) MIN. RAINFALL
MAX RAINFALL
61 48 78 0
203
523 186 36 195 1145
155 149 96 12 874
738 281 38 402
2,086
LINGSUGUR
AVERAGE S.D. C.V. (%) MIN. RAINFALL MAX RAINFALL
70 54 76 0
254
374 135 36 86 751
128 93 73 0 44
572 193 34 133
1,175
MANVI
AVERAGE S.D. C.V. (%) MIN RAINFALL MAX RAINFALL
62 40 65 0
153
444 148 33 171 902
122 92 76 0
448
628 162 26 374
1,150 RAICHUR
AVERAGE S.D. C.V. (%) MIN. RAINFALL MAX.RAINFALL
65 47 72 0
233
478 147 31 177 824
126 105 83 1
561
669 194 29 263
1,225 SINDHANUR
AVERAGE S.D. C.V. (%) MIN. RAINFALL MAX RAINFALL
71 51 72 0
232
430 174 40 94 824
166 136 82 13 690
667 248 37 121
1,518 RAICHUR DISTRICT
AVERAGE S.D. C.V. (%) MIN.RAINFALL MAX. RAINFALL
66 48 73 0
215
450 225 35 145 894
139 115 82 52 604
655 216 33 258
1,431 Source: Data compiled from Drought Monitoring Cell, Govt. of Karnataka, Bangalore.
3.2.5 Sectoral Contribution of Income
Given the dependency of 80 per cent of main workforce on the agricultural sector, it is
not surprising that the share of income originating from agricultural sector of the district is
high. Table 3.3 (Figure 3.2) gives sector-wise income share for different decades for the state
and the district. Two important observations can be made on the basis of this data. First and
foremost the share of primary sector to the total income was higher in the district, than the

122
other two sectors and the share is decreasing significantly. Secondly, the proportion of work
force in the sector was not decreasing (i.e., 80 per cent still depending on agriculture) over
the years, indicating further marginalization of the population depending on agriculture. In an
equally intriguing situation, the secondary sector of the district indicates a stagnant industrial
economy for the last two decades and a beleaguered tertiary sector, where the rate of growth
of tertiary sector was less than the growth recorded for the state as a whole. In totality, the
employment absorbing capacity of secondary and tertiary sectors had not improved much,
leaving a large share of population dependent on agriculture or primary sector obviously in a
deploring situation. Some support was available from the tertiary sector.
Figure 3.2: Sectorial GDP of Raichur District (At 1993-94 Prices)
Table 3.3: Sectoral Composition of District Income in Raichur District (Per Cent at Constant Prices)
Year 1970-71 1983-84 1992-93 1998-99
Primary
Raichur 78.7 57.7 53.1 41.03 State 59.6 42.1 37.7 29.61
Secondary
Raichur 5.4 18.2 13.5 17.75 State 18.6 27.9 25.5 27.91
Tertiary
Raichur 15.0 30.1 33.4 41.21 State 21.8 29.9 36.8 42.49
3.2.6.Infrastructure
0
200
400
600
800
1,000
1,200
1,400
Primary Secondary Tertiary
1993-94 1998-99

123
Table 3.4: Infrastructure of Raichur District
1995-96 1999-00 Components District % to
State District % to
State Veternary Institutions 122 3.84 167 4.43No of Factories 327 4.21 365 3.95Commercial Banks 79 2.30 82 2.27Grameena Banks 84 7.79 84 7.62Motor vehicles 53,409 2.37 48,411 2.01Railway Route (Kms) 106 3.32 106 0.16Road length (Kms) 5,988 4.43 6,166 4.32Post Offices 505 5.16 309 3.13Telephone Exchanges 100 4.95 110 4.67Primary Schools 1,614 3.80 1,226 2.48Hospitals (State) 9 5.11 9 5.08
The sectoral growth is largely dictated by the availability of infrastructure. Even the
intensity of market operations is also a function of infrastructure. Therefore, we have
charted out the present level of infrastructure in the district. Raichur district does not have
infrastructure to match its economic activities. Its contribution to the State income is much
higher than the share of its infrastructure. It is certainly well below the normative
requirements and in a comparative sense, Raichur comes as a district with less than
average infrastructure. The High Power Committee for Redressel and Regional Imbalances
in Karnataka, identified Sindhanur, Manvi, Lingasugur, Devadurga and Raichur talukas as
most backward to backward in terms of infrastructure.
3.3 Agricultural Economy of Raichur District
Raichur district is a predominantly agriculture based district with cereals dominating
its crop economy. Progress of irrigation has not been significant enough to pull the district
out of its dominant drought-prone characteristics. Technological inputs as represented by
use of HYV and fertilisers have not been significant. There was no procurement
undertaken in the district in recent years and as such the procurement data are not
available. In the paragraphs below we take a view of the agricultural economy of the
district.
3.3.1 Cropping Pattern

124
The district of Raichur and Koppal have a subsistence-oriented crop pattern and
commercial crops are showing their presence only in the irrigated patches. The productivity of
main crops of the districts is higher than that of the State. Jowar is a predominant subsistence
cereal of Raichur district covering 47.2 per cent of area under cereals. Paddy and bajra, cover
35 per cent and 16.8 per cent of area respectively, under cereals (Tables 3.5(a) and figure
3.3). Maize, wheat and minor millets also make their presence felt. The productivity of
cereals and especially jowar, maize and paddy are comparable with the State averages and
remained higher than the State averages. Among the pulses, tur, bengalgram, and
horsegram are the important pulses grown in the district. The productivity of tur and
bengalgram is quite satisfactory when compared with the State average (Table 3.5(b)). Oil-
seeds and sugar cane form the core of the commercial crop economy of the districts.
Groundnut and sunflower are the major contributors along with cotton. Sugar cane is taken in
the irrigated regions of the districts.
Table 3.5(a) : Average Area Under Crops in Raichur from 1998-99 to 2000-01
( In Hectares)
Crop Average Proportion* Paddy 1,35,539 12.39 Jowar 1,82,579 16.68 Bajra 65,189 5.96 Maize 197 0.02 Wheat 3,633 0.33 Small Millets 1,561 0.14 Cereals 3,87,137 35.38 Tur 17,399 1.59 Gram 17,477 1.60 Pulses 15,726 1.44 Food Grains 4,39,301 40.14 Groundnut 50,057 4.57 Castor Seed 1,682 0.15 Sesamum 7,010 0.64 Safflower 11,891 1.09 Oil-Seeds 1,62,199 14.82 Sugar Cane 743 0.07 Cotton 40,163 3.67 Sunflower 91,378 8.35 GCA 10,94,318 ---
Note: * Per cent to GCA Source: Based on the Data Collected from Directorate of Economics & Statistics, Govt. of Karnataka, Bangalore.

125
Figure 3.3: Cropping Pattern – Raichur District
Table 3.5(b): Average Production and Productivity of
Crops in Raichur District (1998-99 to 2000-01)
Crops Average
Production (in Tonnes)
Average Productivity (Kg/Hectare)
Paddy 6,49,623 5,063 Jowar 1,50,417 865 Bajra 36,187 573 Maize 626 3,307 Wheat 1,763 514 Small Millets 514 390 Cereals 6,22,280 1,691 Tur 2,949 386 Gram 9,478 303 Pulses 3,585 312 Food Grains 6,38,806 1,531 Ground Nut 32,145 671 Castor Seed 1,856 1,019 Sesamum 2,261 324 Safflower 7,113 633 Oil Seeds 73,697 477 Sugar Cane 9,281 73,646 Cotton 45,979 203 Sun Flower 30,238 353
PADDY
JOW AR
BAJRA
M AIZE
W HEAT
SM ALL M ILLET S
CEREALS T UR
G RAM
PULSES
CAST O R SEED
SESAM UM
OIL SEEDS
SUGAR CANE
COT T O N
GRO UNDNUT
SAFFLO W ER
SUNFLOW ER
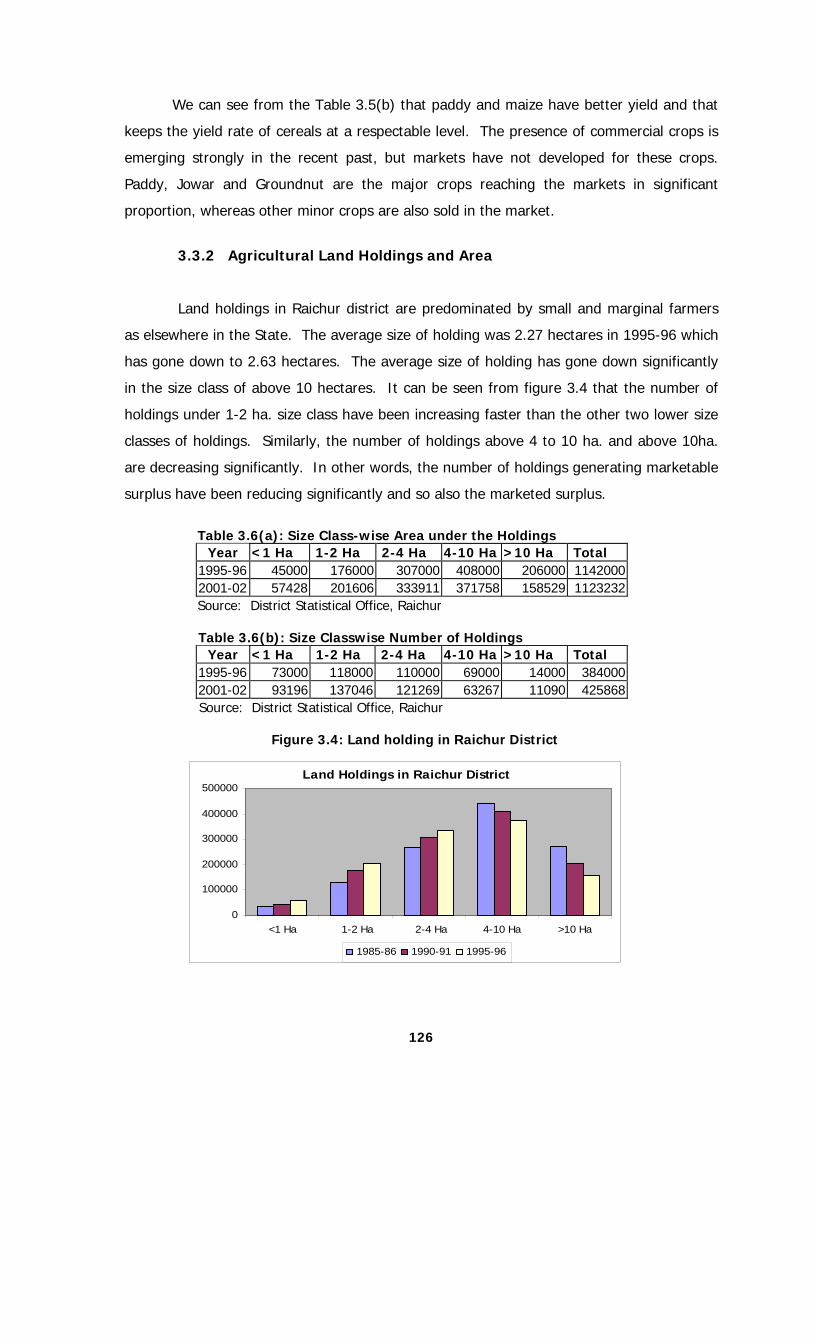
126
We can see from the Table 3.5(b) that paddy and maize have better yield and that
keeps the yield rate of cereals at a respectable level. The presence of commercial crops is
emerging strongly in the recent past, but markets have not developed for these crops.
Paddy, Jowar and Groundnut are the major crops reaching the markets in significant
proportion, whereas other minor crops are also sold in the market.
3.3.2 Agricultural Land Holdings and Area
Land holdings in Raichur district are predominated by small and marginal farmers
as elsewhere in the State. The average size of holding was 2.27 hectares in 1995-96 which
has gone down to 2.63 hectares. The average size of holding has gone down significantly
in the size class of above 10 hectares. It can be seen from figure 3.4 that the number of
holdings under 1-2 ha. size class have been increasing faster than the other two lower size
classes of holdings. Similarly, the number of holdings above 4 to 10 ha. and above 10ha.
are decreasing significantly. In other words, the number of holdings generating marketable
surplus have been reducing significantly and so also the marketed surplus.
Table 3.6(a): Size Class-wise Area under the Holdings
Year <1 Ha 1-2 Ha 2-4 Ha 4-10 Ha >10 Ha Total 1995-96 45000 176000 307000 408000 206000 1142000 2001-02 57428 201606 333911 371758 158529 1123232 Source: District Statistical Office, Raichur Table 3.6(b): Size Classwise Number of Holdings
Year <1 Ha 1-2 Ha 2-4 Ha 4-10 Ha >10 Ha Total 1995-96 73000 118000 110000 69000 14000 384000 2001-02 93196 137046 121269 63267 11090 425868
Source: District Statistical Office, Raichur Figure 3.4: Land holding in Raichur District
Land Holdings in Raichur District
0
100000
200000
300000
400000
500000
<1 Ha 1-2 Ha 2-4 Ha 4-10 Ha >10 Ha
1985-86 1990-91 1995-96

127
3.3.3 Irrigation in Raichur District Raichur district has only about 2.23 lakh hectares of area under irrigation and a
large part of this comes from canal irrigation. In the recent past, bore well irrigation has
been increasing substantially despite the pressure on groundwater table. Largely, bore well
irrigation is used for the purpose of commercial crops, and that is an indication that the
commercial crop economy is picking up in the district. After the bifurcation of the districts a
large portion of the irrigated area went to Davanagere and hence we find significant
decline during the last two years in Figure 3.5. Especially, the area under wells and bore
wells has gone down significantly.
Table 3.7: Irrigated area by Sources of Irrigation in Raichur District
(in Hectares)
Net Area Irrigated Year Canals Tanks Wells Bore wells Lift
IrrigationOther
Sources Total
1994-95 172,446 7,571 38,188 9,222 4,489 4,350 236,266 (%) (72.99) (3.20) (16.16) (3.90) (1.90) (1.84) (100.00)
1995-96 174,629 4,301 31,478 8,386 5,272 4,676 228,740 (%) (76.34) (1.88) (13.76) (3.67) (2.30) (2.04) (100.00)
1996-97 170,887 5,158 40,925 9,354 7,185 3,651 237,160 (%) (72.06) (2.17) (17.26) (3.94) (3.03) (1.54) (100.00)
1997-98 158,849 4,740 37,847 12,091 6,326 3,430 223,283 (%) (71.14) (2.12) (16.95) (5.42) (2.83) (1.54) (100.00)
1998-99 166,217 4,504 35,536 6,704 7,357 2,840 223,158 (%) (74.48) (2.02) (15.92) (3.00) (3.30) (1.27) (100.00)
1999-00 178,398 7,694 40,514 15,891 7,957 1,076 251,530 (%) (70.93) (3.06) (16.11) (6.32) (3.16) (0.43) (100.00)
Source: District Statistical Office, Raichur District.

128
Figure 3.5: Irrigated Area by Sources in Raichur District
Canal Irrigated Area in Raichur District
145000150000155000160000165000170000175000180000
1
Are
a(H
ecta
res)
1994-95 1995-96 1996-971997-98 1998-99 1999-00
Tank- Irrigated Area in Raichur District
0
2000
4000
6000
8000
10000
1
Are
a (H
ecta
res)
1994-95 1995-96 1996-971997-98 1998-99 1999-00
Wells-Irrigated Area in Raichur District
0
10000
20000
30000
40000
50000
1
Are
a (H
ecta
res)
1994-95 1995-96 1996-971997-98 1998-99 1999-00
Bore wells-Irrigated Area in Raichur District
02000400060008000
1000012000140001600018000
1
Are
a (H
ecta
res)
1994-95 1995-96 1996-971997-98 1998-99 1999-00
L ift - Ir r ig a ted Area in R a ich u r d is tr ic t
0
20 00
40 00
60 00
80 00
100 00
1
Are
a (H
ecta
res)
1994 -95 1995 -96 1 996 -971997 -98 1998 -99 1 999 -00

129
3.3.4 Fertiliser Use in Raichur District
Raichur district is one of the districts boasting early adoption of new technology.
The use of fertilisers has been in the same range as that in the year 1995-96. Largely,
fertilisers are used for paddy, sugarcane, cotton and groundnut. Other crops do not get
equal attention in the case of fertiliser use.
Table 3.8: Fertiliser Use in Raichur district (in Tonnes)
Fertiliser Year N P K Total
Fertiliser use Per Hectare
(Kgs./Ha.) 1995-96 72,000 25,400 13,100 110,500 101.69 1996-97 74,908 31,097 16,635 122,640 111.93 1997-98 72,121 35,034 17,712 124,867 132.42 1998-99 79,349 37,121 16,947 133,394 124.27 1999-00 93,961 49,297 29,902 173,160 162.35 2000-01 101,582 49,136 29,088 179,806 168.58 2001-02 94,184 43,599 27,312 165,095 154.79
Source: Fertiliser Statistics of India.
Figure 3.6: Fertiliser Use in Raichur District
020000400006000080000
100000120000140000160000180000200000
1
tonn
es
1995-96 1996-97 1997-98 1998-991999-00 2000-01 2001-02

130
3.3.5 Production, Market Arrivals and Procurement
Production and market arrivals in Raichur district are presented in Table 3.9, for two
years i.e., 1997-98 and 2000-01. Regulated markets in Raichur district also entertain
arrivals from neighbouring district. Therefore, the arrivals are at times exceed the
production in the district especially for commercially attractive commodities. This is noted
in the case of paddy, maize, tur and sunflower. Therefore, connecting the market arrivals
in the regulated markets in the district to the production of the commodity in the district
will not be prudent in this case. The procurement of rice or maize in Raichur district has
not been significant.
Table 3.9: Details of Quantity Marketed and Production of Different Crops in Raichur District
Crop Paddy Maize Ragi Jowar Wheat Year 1997-98 2000-01 1997-98 2000-01 1997-98 2000-01 1997-98 2000-01 1997-98 2000-01Quantity Marketed in Regulated Markets (in 000 Tonnes)
632.43 625.35 44.18 0.02 _ _ 5.04 16.74 3.40 0.85
Production (in 000 Tonnes)
477.62 667.73 36.11 0.62 _ _ 126.27 146.34 3.72 2.05
% of Production Marketed
132.41 93.65 122.35 3.89 _ _ 3.99 11.44 91.40 41.62
(Contd.)
Crop Bajra Tur Gram Groundnut Sunflower Year 1997-98 2000-01 1997-98 2000-01 1997-98 2000-01 1997-98 2000-01 1997-98 2000-01Quantity Marketed in Regulated Markets (in 000 Tonnes)
3.30 _ 4.66 2.14 2.04 _ 36.30 27.00 41.20 23.46
Production (in 000 Tonnes)
26.77 44.19 3.15 2.92 4.34 11.09 43.32 41.95 32.74 37.16
% of Production Marketed
12.33 147.94 73.27 47.00 85.78 64.35 125.84 63.13
Note: Marketed figures of Paddy, Maize, Tur & Sunflower are as per the available documents from the State Marketing Board

131
3.4 Chitradurga District
3.4.1 Physical Features
The district of Chitradurga is also situated in the Central region on the Deccan
Plateau. It lies between 13° 42’ to 15° 01’ of north latitude and 75° 43’ to 77° 02’ of east
longitude. It has a geographical area of 10,852 Sq. Kms and covers about 5.3 per cent
area of the State. The district is one of the biggest districts and hence, it was chosen for
bifurcation during the early nineties. The district was bifurcated into Chitradurga and
Devangere districts thereby reducing the size of the district. The general slope of the
district is from north-west towards south-east and it also comes under the rain shadow
region of the deccan plateau. It receives 565.5 mms of normal annual rainfail with the
standard deviation of 132.7 mm and CV of 23 per cent. It is a frequent drought visited
district. Davangere, Holakere and Chitradurga taluks receive high rainfall during south-west
monsoon.
The district has largely red to black soil and significant portion of deep black cotton
soils spread over Chitradurga, Challakere, Jagalur and Davanagere taluks. It has about 90
sq. ha. area covering about 9 per cent of the total geographical area under forest. The
forests are largely confined to Chitradurga, Hiriyur, Jagalur and Molakalmuru taluks. The
district falls under Krishna basin served by two major river systems, namely, Vedavathi and
Tungabhadra. The district is primarily an agriculture dependent district and that is reflected
in the work force composition. More than 70 per cent of the workers in the district are
engaged in agriculture as the main occupation. About 60 per cent of the districts’ total
geographical area (6.2 lakh ha) is under cultivation.
3.4.2 History
The district was ruled by various dynasties during different periods. Rashtrakutas
ruled during 775-780 A.C. This was followed by Chalukyan kings and Cholas, Vijaya
Pandya and Hoysalas. For some time, the district was also ruled by Yadavas during 1271-
1309. Vijayanagar kingdom controlled the district with the help of Beda or Boya Nayaks
and thereafter, Nayakas were ruling the region till the time Chitradurga came under the
rule of Hyder Ali and Tippu Sultan and remained with them up to 1799 till the third battle
of Serirangapatana. After that, it remained under the Wodeyars of Mysore but supported

132
by British administration (Satyan, 1967). Historically, the district suffered various changes
and therefore, economy of the district remained agriculture based. During the period of
Tipu Sultan, sericulture was introduced in a few talukas of the district.
3.4.3 Area and Population
The district is predominantly a rural district with about 6.2 lakh ha. of cultivated
area which forms about 60 per cent of the total geographical area. Chitradurga is not a
densely populated district and its population growth is about the same as that of the
State. Among the taluks, Davangere, Challakere and Chitradurga are growing much
faster. The urbanisation trend is also quite strong in these talukas of the district. The
population in urban areas increased by about 40 per cent as against 17 per cent increase
in rural population in the decade of eighties. The growth of population in the district has
been quite uneven across talukas and it is shown in the figure. The workforce is
concentrated in primary sector and the shifting of workforce from primary sector to any
other sector is hardly visible.
Figure 3.7: Percentage Population Change in Chitradurga District
0
10
20
30
40
50
60
Challa
kere
Chitrad
urga
Davan
agere
Hariha
r
Hiriyur
Holalke
re
Hosad
urga
Jaga
lur
Molaka
lmuru
Total Rural Urban

133
Table 3.10: Population in Chitradurga District (In Thousands)
Taluk 1981 1991 Percentage Change Total Rural Urban Total Rural Urban Total Rural Urban
Challakere 219.06 194.01 25.04 279.38 241.01 38.36 27.54 24.22 53.18Chitradurga 260.91 186.33 74.58 322.03 218.59 103.43 23.43 17.31 38.68Davanagere 403.61 202.35 201.26 514.16 221.70 292.46 27.39 9.56 45.31Harihar 173.32 120.99 52.33 216.79 150.14 66.64 25.08 24.10 27.34Hiriyur 196.20 171.05 25.15 228.70 191.19 37.50 16.56 11.77 49.10Holalkere 157.82 148.01 9.81 179.21 166.98 12.22 13.56 12.82 24.58Hosadurga 173.02 160.64 12.38 199.84 182.59 17.25 15.50 13.66 39.34Jagalur 111.26 101.52 9.74 136.76 124.66 12.09 22.91 22.79 24.10Molakalmuru 82.30 74.86 7.44 103.53 94.85 8.67 25.80 26.70 16.52Total 1,777.50 1,359.76 417.74 2,180.40 1,591.71 588.62 22.67 17.06 40.90
3.4.4 Climatic Conditions
The district receives 565.5 mm of annul rainfall. Among the taluks, Holalkere
receives the highest rainfall,l ie., 668.7 mm and Challakere is the lowest rainfall region of
the district. Table 3.11 shows taluk-wise seasonal rainfall and variations in the seasonal
rainfall. There is high variability in pre-monsoon rainfall in the taluks of Harihara,
Davanagere, Jagalur, Molakalmuru and Challakere and least variations in the Chitradurga
taluk. About 52 per cent of the annual rainfaill is received in the district during sough-
west monsoon. Davanagere, Holalkere and Chitradruga taluks largely receive their total
rainfall during this period, whereas, Hosadurga, Harihara, Challakere receive the south-
west monsoon much below the district average. During the period 1958-2000,
Chitradurga experienced 14 droughts and 28 years with normal annual rainfall. Remaining
years had moderate and deficit rainfall.

134
Table: 3.11: Mean Seasonal and Annual Rainfall and Variations in Chitradurga District (1901-1990) (in mms.)
TALUK Pre-Monsoon
(Jan-May)
S.W. Monsoon
(Jun-Sept)
N.E. Monsoon (Oct-Dec)
Annual (Jan-Dec)
CHALLAKERE Mean S.D. C.V. (%) Maximum Rainfall Minimum Rainfall
93.0 65.9
71 330.9
0.0
205.7 98.6
48 496.9 37.6
144.9 96.7
67 462.6
0.0
443.5 150.8
34 857.6 162.3
CHITRADURGA Mean S.D. C.V. (%) Maximum Rainfall Minimum Rainfall
117.7 54.4
46 313.9 19.1
308.3 106.9
35 583.9 117.9
182.0 113.2
62 601.6
3.7
608.0 180.2
30 1128.1 272.2
DAVANAGERE Mean S.D. C.V. (%) Maximum Rainfall Minimum Rainfall
115.8 73.0
63 421.1 13.1
347.1 108.5
31 602.6 121.9
168.2 105.4
63 457.4
3.8
63.1 163.9
26 1117.3 290.2
HARIHAR Mean S.D. C.V. (%) Maximum Rainfall Minimum Rainfall
104.6 69.4
66 481.8
0.0
299.3 98.1
33 608.7 94.3
150.3 88.3
59 401.0
3.8
554.3 147.8
27 921.1 277.9
HIRIYUR Mean S.D. C.V. (%) Maximum Rainfall Minimum Rainfall
115.9 63.4
55 320.2
5.9
252.1 109.0
43 931.7 81.5
162.1 97.6
59 420.0
6.4
533.2 161.5
30 1013.2 234.0
HOLALKERE Mean S.D. C.V. (%) Maximum Rainfall Minimum Rainfall
132.9 67.9
51 417.7 23.0
346.6 112.8
33 621.6 122.4
189.2 120.8
64 732.0
7.0
668.7 189.9
28 1386.6 344.9
HOSADURGA Mean S.D. C.V. (%) Maximum Rainfall Minimum Rainfall
118.8 70.2
59 295.7
0.0
271.2 123.3
45 614.5 11.5
188.8 113.4
60 443.5
0.0
578.8 203.3
35 1112.6
58.4 JAGALUR Mean
S.D. C.V. (%) Maximum Rainfall Minimum Rainfall
96.7 62.1
64 310.7
1.0
296.8 131.3
64 874.4 93.8
141.7 91.0
64 537.5
0.0
535.1 177.9
33 1150.6 213.2
MOLAKALMURU Mean S.D. C.V. (%) Maximum Rainfall Minimum Rainfall
88.5 53.8
61 275.1 10.8
298.4 133.5
45 687.1 44.1
155.7 97.9
63 502.6
0.0
542.6 168.9
31 1008.5
92.4 TOTAL Mean
S.D. C.V. (%) Maximum Rainfall Minimum Rainfall
109.2 44.5
41 277.7 32.3
291.4 88.9
30 489.1 116.3
164.9 86.2
52 387.4 12.1
565.5 132.7
23 919.2 288.3
Source: Drought Monitoring Cell, Govt. of Karnataka, Bangalore.

135
3.4.5 Sectoral Contribution of Income:
Chitadurga district depends on agriculture with predominantly 70 per cent of its
workforce being engaged in the agricultural sector. The major share of the district income
comes from the primary sector. In the recent past, the agro-processing sector has been
receiving larger attention and Devanagere as well as Chitradurga had developed into good
textile manufacturing centres till the early nineties. In the recent past, there has been a
slump in the manufacturing of textiles in the district both due to market prices and
production constraints in cotton. Falling in the similar pattern of that of the Raichur
district, but not with the same intensity, the share of district income generated from
agriculture is going down in the district. But, at the same time, the share of workforce in
agriculture was seen declining. But that does not mean that the income generated from
agricultural sector is declining. It is, in fact, increasing at a faster rate than the other two
sectors (Figure 3.8).
Table 3.12: Sectoral Contribution of Income of Chitradurga District (In Percentage)
Year 1970-71 1983-84 1992-93 1998-99
Primary Chitradurga 68.8 51.3 52.1 46.53 State 59.6 42.1 37.7 29.61
Secondary Chitradurga 9.2 23.9 15.2 16.91 State 18.6 27.9 25.5 27.91
Tertiary Chitradurga 22.0 24.8 32.6 36.55 State 21.8 29.9 36.8 42.49
Figure 3.8: Sectoral GDP of Chitradurga District(At 1993-94 Prices)
Sectorial GDP of Chitradurga District (At 1993-94 Prices)
0
200
400
600800
1000
1200
1400
Primary Secondary Tertiary
1993-94 1998-99

136
Ragi, Jowar, Paddy, Small millets are the major crops of the district. Among pulses,
horsegram and tur cover larger share of the area and groundnut, sunflower and cotton
serve as major cash crops in the district.
3.4.6 Infrastructure
Table 3.13: Infrastructure of Chitradurga District
1995-96 1999-00 Components District % to
State District % to
State Veterinary Institutions 193 6.08 296 7.85No of Factories 328 4.22 313 3.39Commercial Banks 105 3.06 135 3.74Grameena Banks 97 9.00 111 10.07Motor vehicles 84,861 3.77 1,00,179 4.17Railway Route (Kms) 219 6.86 219 6.70Road length (Kms) 7,156 5.30 7,173 5.02Post Offices 475 4.85 591 5.98Telephone Exchanges 98 4.85 113 4.80Primary Schools 2,310 5.44 3,349 6.78Hospitals(State) 7 3.98 9 5.08
Source: District Statistical Office, Chitradurga District. Chitradurga is one of the backward districts in terms of its infrastructure
(Venkatachalam, 2003). The Committee on Regional Imbalances in Karnataka has pointed
out that Hosadurga, Molakalmuru, Holalkere, and Challakere were backward in terms of
infrastructure (Report of the High Power Committee for Redressel of Regional Imbalances,
GoK, 2002: p167). It is well known that markets develop following the availability of
infrastructure and therefore, marketing facilities in Chitradurga have not developed
significantly.
3.4.7 Cropping Pattern
Cereals dominate the cropping pattern of Chitradurga district (Table 3.14(a) and
figure 3.9). Among the cereals, ragi and jowar are dominant. The cropping pattern is
undergoing change in the recent past. Oil-seeds are the traditional commercial crops
grown in Chitradurga district. The district also has a good number of oil-seeds processing
Table 3.14 (a): Average Area under Crops in Chitradurga District from 1998-99 to 2000-01
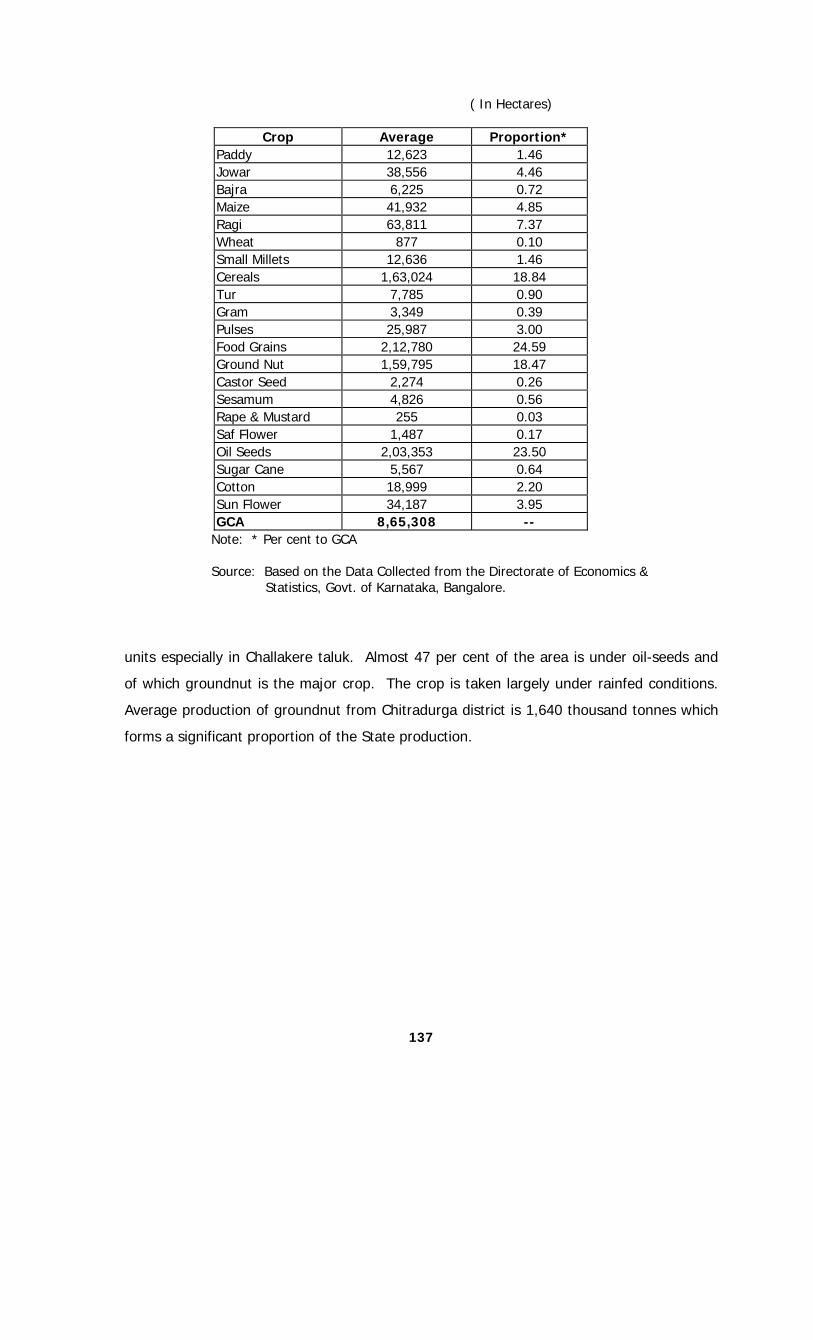
137
( In Hectares)
Crop Average Proportion* Paddy 12,623 1.46 Jowar 38,556 4.46 Bajra 6,225 0.72 Maize 41,932 4.85 Ragi 63,811 7.37 Wheat 877 0.10 Small Millets 12,636 1.46 Cereals 1,63,024 18.84 Tur 7,785 0.90 Gram 3,349 0.39 Pulses 25,987 3.00 Food Grains 2,12,780 24.59 Ground Nut 1,59,795 18.47 Castor Seed 2,274 0.26 Sesamum 4,826 0.56 Rape & Mustard 255 0.03 Saf Flower 1,487 0.17 Oil Seeds 2,03,353 23.50 Sugar Cane 5,567 0.64 Cotton 18,999 2.20 Sun Flower 34,187 3.95 GCA 8,65,308 --
Note: * Per cent to GCA Source: Based on the Data Collected from the Directorate of Economics & Statistics, Govt. of Karnataka, Bangalore. units especially in Challakere taluk. Almost 47 per cent of the area is under oil-seeds and
of which groundnut is the major crop. The crop is taken largely under rainfed conditions.
Average production of groundnut from Chitradurga district is 1,640 thousand tonnes which
forms a significant proportion of the State production.

138
Figure 3.9: Cropping Pattern: Chitradurga District
Table 3.14 (b): Average Production and Productivity of Crops in Chitradurga District(1998-99 to 2000-01)
Crops
Average Production
(in tonnes) Average
Productivity (Kg/Hectare)
Paddy 49,719 4,195 Jowar 39,644 1,156 Bajra 4,097 677 Maize 1,14,821 2,937 Ragi 1,02,155 1,674 Wheat 990 1,185 Small Millets 6,234 516 Cereals 2,94,867 1,915 Tur 3,818 516 Gram 1,773 550 Pulses 11,461 470 Food Grains 3,18,153 1,581 Groundnut 1,63,659 1,080 Castor Seed 2,126 1,162 Sesamum 2,408 511 Rape & Mustard 55 216 Safflower 972 643 Oil Seeds 1,85,987 965 Sugar Cane 4,27,208 96,000 Cotton 24,467 235 Sunflower 15,916 495
Source: Based on the Data Collected from Directorate of Economics & Statistics, Govt. of Karnataka, Bangalore.
C r o p p i n g P a tte r n : C h i tr a d u r g a D i str i c t
P A D D Y
J O W A R
B A J R A
M A IZ E
R A G I
W H E A T
S M A LL M IL L E T S
C E R E A L S
T U R
G R A M
P U L S E S G R O U N D N U T
C A S T O R S E E D
S E S A M U M
R A P E & M U S T A R D
S A F F L O W E R
O IL S E E D S
S U G A R C A N E
C O T T O N
S U N F L O W E R

139
3.4.8 Agricultural Land Holdings and Area Decreasing size of holding is common trend in the districts of Karnataka and
Chitradurga is not an exception. In 1995-96, the number of holdings below 1 ha. was 82
thousand and in a period of five years this increased to 101 thousand, whereas the area
under this size class increased by about 10 thousand hectares. A clear trend of
marginalisation of size of holding is visible from the data presented in Tables 3.15(a) and
3.15(b). The increase in the number of holdings up to 4 hectares is quite visible here. The
number of holdings above four hectares is going down and that indicates the shrinking of
the base for marketable surplus.
Table 3.15(a): Number of Agricultural Land Holdings : Chitradurga
Year <1 Ha 1-2 Ha 2 - 4 Ha 4 - 10 Ha >10 ha Total 1995-96 82,000 89,000 72,000 41,000 9,000 2,93,000 2001-02 1,01,000 99,626 75,713 38,939 7,793 3,23,436
Table 3.15(b): Area under Holdings: Chitradurga
Year <1 Ha 1-2 Ha 2-4 Ha 4-10 Ha >10 ha Total 1995-96 46,000 1,29,000 1,96,000 2,38,000 1,40,000 7,49,000 2001-02 1,56,919 1,44,260 2,04,114 2,27,583 1,17,350 7,50,226
Figure 3.10: Land Holdings in Chitradurga District
0
50000
100000
150000
200000
250000
300000
<1 Ha 1-2 Ha 2 - 4 Ha 4 - 10 Ha >10 ha
1985-86 1990-91 1995-96

140
3.4.9 Fertiliser Use Fertiliser use in Chitradurga district has been going down significantly. It has
reduced almost to half during the last five years and the reduction is mainly due to the area
shift from paddy to other crops. Chitradurga is one of the districts using fertilisers less
than the State average. It can also be observed from the table that the ratio of N:P:K has
been changing in favour of nitrogenous fertilisers and that is not a good trend.
Table 3.16: Fertiliser Use in Chitradurga District (in Tonnes)
Fertilizer Year N P K Total
Fertiliser Use Per Hectare (Kgs./Ha.)
1995-96 32,900 18,900 6,400 58,200 87.84 1996-97 35,620 19,460 8,683 63,763 90.67 1997-98 39,677 22,724 8,058 70,459 107.78 1998-99 50,905 27,051 9,171 87,127 90.17 1999-00 54,956 34,112 12,178 101,246 103.74 2000-01 58,986 32,375 12,736 104,097 106.66 2001-02 52,736 31,624 11,883 96,243 98.61
Source: Fetiliser Statistics of India.
Figure 3.11: Fertiliser Use in Chitradurga District
0
20000
40000
60000
80000
100000
120000
1
Tonn
es
1995-96 1996-97 1997-98 1998-991999-00 2000-01 2001-02

141
3.4.10 Irrigation in Chitradurga District Chitradurga is largely a rainfed district with only 122 thousand hectares of net sown
area receiving irrigation. The district has a very high density of wells and therefore,
groundwater is the major source of irrigation. Canal irrigation is the second largest source
of irrigation in the district. Irrigation is largely used for commercial crops and especially for
cultivation of paddy and sugarcane. The district has been facing a problem of groundwater
depletion and severe water scarcity is felt under well irrigated region.
Table 3.17: Area under Irrigation by Sources in Chitradurga District (in Hectares)
Net Area Irrigated Year Canals Tanks Wells Bore
wells Lift
IrrigationOther
Sources Total
1994-95 53,530 3,329 10,619 43,980 4,825 - 116,283(%) (46.03) (2.86) (9.13) (37.82) (4.15) - (100.00)
1995-96 53,457 1,396 6,021 46,025 5,407 102 112,408(%) (47.56) (1.24) (5.36) (40.94) (4.81) (0.09) (100.00)
1996-97 50,027 3,318 6,869 51,600 6,928 - 118,742(%) (42.13) (2.79) (5.78) (43.46) (5.83) - (100.00)
1997-98 50,502 320 3,217 61,633 6,674 - 122,346(%) (41.28) (0.26) (2.63) (50.38) (5.46) - (100.00)
1998-99 76,965 5,638 6,968 80,673 11,077 1676 182,997(%) (42.06) (3.08) (3.81) (44.08) (6.05) (0.92) (100.00)
1999-00 82,849 8,354 6,698 89,935 8,778 664 197,278(%) (42.00) (4.23) (3.40) (45.59) (4.45) (0.34) (100.00)
Source: District Statistical Office, Chitradurga District.

142
Figure 3.12: Irrigated Area by Sources – Chitradurga District
Canal-Irrigated Area in Chitradurga District
0
20000
40000
60000
80000
100000
1
Are
a (H
ecta
res)
1994-95 1995-96 1996-971997-98 1998-99 1999-00
Tank-Irrigated Area in Chitradurga District
0
2000
4000
6000
8000
10000
1
Are
a (H
ecta
res)
1994-95 1995-96 1996-971997-98 1998-99 1999-00
Wells-Irrigated Area in Chitradurga District
0
2000
4000
6000
8000
10000
12000
1
Are
a (H
ecta
res)
1994-95 1995-96 1996-971997-98 1998-99 1999-00
Borewells-Irrigated Area in Chitradurga District
0
20000
40000
60000
80000
100000
1
Are
a (H
ecta
res)
1994-95 1995-96 1996-971997-98 1998-99 1999-00
Lift-Irrigated Area in Chitradurga District
02000400060008000
1000012000
1
Are
a (H
ecta
res)
1994-95 1995-96 1996-971997-98 1998-99 1999-00

143
3.5 Market Arrivals, Procurement and Marketed Surplus in Chitradurga District Table 3.18: Quantity and Price of Produce Sold to Different Agencies: Rice
1998-99 1999-00 2000-01 Sl.No.
Agencies
Quantity Price/Qtl Quantity Price/Qtl Quantity Price/Qtl
1 Wholesale Market (Paddy)
15333 (63.3)
1200 17918 (65.8)
1273 20000 (70.81)
1300
2 Local Traders (Paddy)
5464 (22.6)
1010 5135 (18.86)
1170 4667 (16.52)
1200
3 Retailers (Rice) 2800 (11.6)
970 2217 (8.14)
1060 2556 (9.05)
1100
4 Consumers (Rice)
1250 (5.16)
1300 1063 (3.9)
1540 1113 (3.94)
1700
Note: Percentage in parenthesis for Quality sold to different agencies Chitradurga has been traditionally a good market for rice and groundnut. We have
presented in Table 3.18 the produce of rice sold through various channels. Large share of
the produce is sold through wholesale markets. Local traders and retailers take about 26
per cent of the share, whereas only about 4 per cent is directly sold to the consumers.
Table 3.19: Procurement and Quantity Marketed in Regulated Markets: Karnataka
State:- Rice
Year Procurement (in 000 Tonnes)
Quantity Marketed in Regulated
Markets (in 000 Tonnes)
Production (in 000 Tonnes)
% Procured
% Marketedin Regulated
Markets
1997-98 91.246 1487 3213 2.84 46.28 1998-99 100.43 1552 3657 2.75 42.46
1999-2000 111.04 1579 3635 3.05 43.43 2000-01 207.36 2199 3619 5.73 60.76
Source: (1) Karnataka State Agriculture Marketing Board Annual Reports (2) Karnataka Economic Survey 2000-01 (3) Food and Civil Supply Department Procurement of rice has been taken up in the State. About 2 to 5 per cent of the total
produce is procured and about 40-60 per cent is sold in the regulated market. District-wise
data on procurement is not separately maintained as the procurement operations are
sporadic and do not cover large number of commodities. But the data on the market

144
Table 3.20: Details of Quantity Marketed and Production of Different Crops in Chitradurga District
Crop Paddy Maize Ragi Jowar Wheat
Year 1997-98 2000-01 1997-98 2000-01 1997-98 2000-01 1997-98 2000-01 1997-98 2000-01
Quantity Marketed in Regulated Markets (in 000 Tonnes)
83.43 27.50 119.39 29.74 20.43 6.68 8.41 2.58 _ _
Production (in 000 Tonnes)
248.08 58.66 262.46 138.87 55.75 126.55 61.54 33.67 0.38 1.10
% of Production Marketed
33.63 46.88 45.49 21.42 36.65 5.28 13.67 7.66 _ _
(Contd.)
Crop Bajra Tur Gram Groundnut Sunflower
Year 1997-98 2000-01 1997-98 2000-01 1997-98 2000-01 1997-98 2000-01 1997-98 2000-01
Quantity Marketed in Rregulated Markets (in 000 Tonnes)
0.37 0.02 1.15 0.44 1.25 0.05 89.80 58.66 14.47 7.86
Production (in 000 Tonnes)
1.81 3.92 4.22 4.92 1.26 2.44 97.87 181.81 18.97 16.38
% of Production Marketed
20.44 0.51 27.25 8.90 99.21 2.00 91.75 32.27 76.28 48.01
Source: Department of Marketing, Govt. of Karnataka, Bangalore. arrivals is available at the district level. Unlike Raichur district, there is no evidence that
the produce is coming in the district from any other district. It is a common phenomenon
that market arrivals do not form a large proportion of the total production except for the
commercial crops like groundnut and sunflower. Paddy is, of course, an exception and we
find that about half of paddy production reaches the regulated markets.
3.6 Concluding Remarks

145
Raichur and Chitradurga are the districts with emerging commercial orientation in
their agricultural economy. Both districts are predominantly food grain growing districts,
but the commercial crops have made their presence felt in the region. Oil-seeds happen to
be major commercial crop but slowly and steadily cereals are also reaching the regulated
markets in a sizeable quantity. Among cereals, rice and jowar are the predominant crops
getting into regulated markets. Among the two districts, Raichur is yet to realise full
potential of its marketing operations and the regulated markets in the distinct have a good
amount of arrivals from neighbouring regions. Chitradurga, on the other hand, has a well-
developed oil-seed market economy. Infrastructural bottleneck is the major hurdle for both
districts and the districts are in disadvantageous position due to the low proportion of
irrigation.

146
CHAPTER IV
SAMPLE PROFILES OF THE SELECT REGIONS
4.1 Introduction
Marketing of agricultural produce is a function of the economic characteristics of the
region or the participating household. It begins with the intensity of efforts towards the
production activity and sustains through the economic viability parameters of the
household. As detailed in the opening chapter, we had selected 60 sample households from
each of the districts for a detailed study of the marketing activity at the micro level. We
preferred to keep the two districts separately during the analysis, not only on the
suggestion of the coordinating center but as located earlier, the two districts depict
different characteristics. We are attempting here an analysis of the basic economic
characteristics of the selected households. These include the socio-economic profile of the
household, its production and asset base, cropping pattern and the production
environment.
4.2. Raichur District
4.2.1 Distribution of Sample Farmers (a) By Size Group of Holdings The distribution of the selected sample farms is a typical representation of the profile
of the district. This clearly mirrors the land distribution pattern of the district. As we had seen
in chapter three, Raichur district has a very high concentration of small and marginal farmers
and over the agricultural censuses this concentration is increasing at a faster rate. At the same
time the number of holdings in the larger size classes of land holdings are declining, indicating
receding base of the marketable surplus. But, as if to subvert this phenomenon, the farmers
holding small, marginal and medium size of land are turning towards commercial crops. Added
to this even some of the traditional cereal crops (Paddy, Wheat, Maize and Jowar) are
assuming the role of a cash crop with larger share of the produce being sold in the market. In
Table 4.1, we have presented the distribution of the sample selected from Raichur district. We
observe that larger share of farmers (around 74%) are clustered in the first two lower size

147
groups, i.e., below 2 ha. Only about 6 per cent of the selected farmers fell in the size class of
above 4 hectares.
Table 4.1: Distribution of Sample Farmers by Size Groups in Raichur District
Farm Size Group Number Percentage
I (<1 Ha.) 46 38.33 II (1-2 Ha.) 43 35.83 III (2-4 Ha.) 24 20 IV (4-6 Ha.) 3 2.5 V (>6 Ha.) 4 3.33
Total 120 100
(b) By Castes
Connecting the social characteristics with the economic activity like marketing is
not a common point in any analysis. But here we have tried to look into the distribution of
the sample households across their castes, in order to locate, in our further analysis if caste
itself can serve as a facilitator in the marketing activity. Lingayaths and Vakkaligas are the
two important agricultural castes and 40.8 per cent of the sample farmers belong to these
two castes. We find from Table 4.2 that barring two larger size groups, the distribution of
farmers in the first three lower size groups is similar in the two castes (more than 90% in
these size groups). Only about 4 per cent in Lingayaths and 12 per cent in Vakkaligas were
in the larger groups of above 4 ha. Among other castes (SC, ST and Muslims) there are no
farmers having land above 4 ha.
Table 4.2: Distribution of Households By Castes and Farm Size Groups in Raichur District
Farm Size Group Lingayats Vakkaligas ST SC Muslims Others Total
I (<1 Ha.) 7 7 5 10 6 11 46 II (1-2 Ha.) 11 5 7 6 6 8 43 III (2-4 Ha.) 5 10 3 0 1 5 24 IV (4-6 Ha.) 1 2 0 0 0 0 3 V (>6 Ha.) 0 1 0 0 0 3 4
Total (%)
24 (20.0)
25 (20.83)
15 (12.50)
16 (13.33)
13 (10.83)
27 (22.50)
120 (100.00)
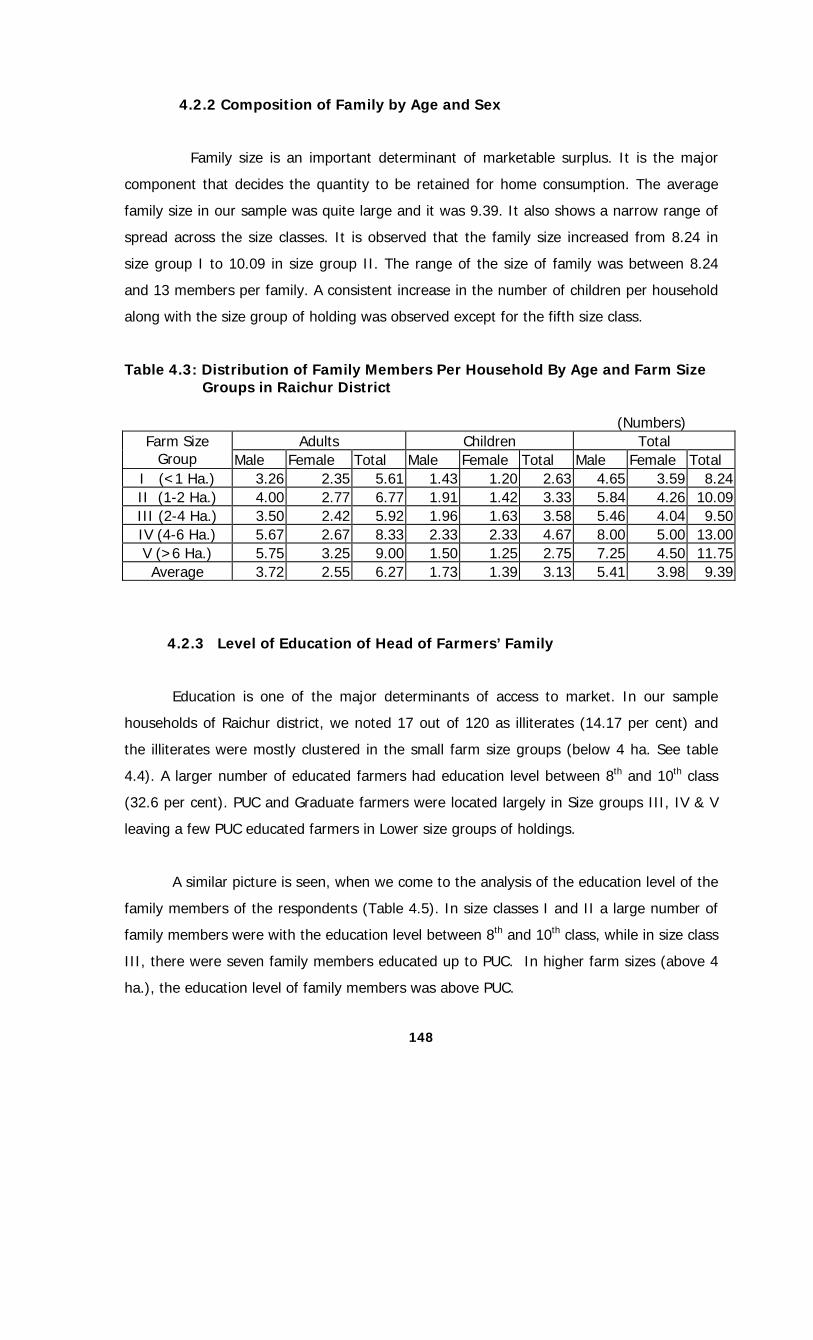
148
4.2.2 Composition of Family by Age and Sex
Family size is an important determinant of marketable surplus. It is the major
component that decides the quantity to be retained for home consumption. The average
family size in our sample was quite large and it was 9.39. It also shows a narrow range of
spread across the size classes. It is observed that the family size increased from 8.24 in
size group I to 10.09 in size group II. The range of the size of family was between 8.24
and 13 members per family. A consistent increase in the number of children per household
along with the size group of holding was observed except for the fifth size class.
Table 4.3: Distribution of Family Members Per Household By Age and Farm Size Groups in Raichur District
(Numbers)
Adults Children Total Farm Size Group Male Female Total Male Female Total Male Female Total
I (<1 Ha.) 3.26 2.35 5.61 1.43 1.20 2.63 4.65 3.59 8.24II (1-2 Ha.) 4.00 2.77 6.77 1.91 1.42 3.33 5.84 4.26 10.09III (2-4 Ha.) 3.50 2.42 5.92 1.96 1.63 3.58 5.46 4.04 9.50IV (4-6 Ha.) 5.67 2.67 8.33 2.33 2.33 4.67 8.00 5.00 13.00V (>6 Ha.) 5.75 3.25 9.00 1.50 1.25 2.75 7.25 4.50 11.75Average 3.72 2.55 6.27 1.73 1.39 3.13 5.41 3.98 9.39
4.2.3 Level of Education of Head of Farmers’ Family
Education is one of the major determinants of access to market. In our sample
households of Raichur district, we noted 17 out of 120 as illiterates (14.17 per cent) and
the illiterates were mostly clustered in the small farm size groups (below 4 ha. See table
4.4). A larger number of educated farmers had education level between 8th and 10th class
(32.6 per cent). PUC and Graduate farmers were located largely in Size groups III, IV & V
leaving a few PUC educated farmers in Lower size groups of holdings.
A similar picture is seen, when we come to the analysis of the education level of the
family members of the respondents (Table 4.5). In size classes I and II a large number of
family members were with the education level between 8th and 10th class, while in size class
III, there were seven family members educated up to PUC. In higher farm sizes (above 4
ha.), the education level of family members was above PUC.

149
Table 4.4: Distribution of Sample Households by Level of Education of Respondent Farmers in Raichur District
Farm Size Group Illiterate 1 to 4
Class 5 to 7 Class
8 to 10Class
PUC
Degree
Total
I (<1 Ha.) 8 8 13 14 3 0 46II (1-2 Ha.) 7 9 11 15 1 0 43III (2-4 Ha.) 2 4 3 10 4 1 24IV (4-6 Ha.) 0 0 2 0 1 0 3V (>6 Ha.) 0 0 2 0 2 0 4
Total (%)
17 (14.17)
21(17.5)
31(25.83)
39(32.5)
11 (9.17)
1 (0.83)
120(100)
Table 4.5: Distribution of Households by Highest Education Level of a Family Member in
Raichur District
Farm Size Group 5 to 7 8 to 10 PUC Graduate Post-
graduate Others Total
I (<1 Ha.) 6 22 9 9 0 0 46II (1-2 Ha.) 5 15 12 11 0 0 43III (2-4 Ha.) 1 6 7 6 2 2 24IV (4-6 Ha.) 0 0 1 1 1 0 3V (>6 Ha.) 0 0 2 2 0 0 4
Total (%)
12 (10)
43(35.83)
31(25.83)
29(24.17)
3 (2.5)
2 (1.67)
120(100)
4.2.4 Tennurial Status Average Size of Holdings and Distribution of Land
Land is the base for generating production and marketable surplus, but more than
that land is also an icon of the social and economic power in the villages. The size of
holding clearly dictates the access to the market not only due to the fact that they have the
marketable surplus but also these farmers face little hindrance in negotiating in the market.
We have presented the data on land distribution in Table 4.6. It is obvious that there is a
consistent increase in the land owned and operated per farm with farm size. The average
size of ownership holding worked out to be 3.90 ha. and operational holdings to 4.29 ha.
(see Table 4.6). The difference between the two was due to the larger extent of leasing in
(0.43) than leasing out (0.03). The leasing in of land was mainly in the smaller size groups,
i.e., below 4ha, while there was no leased in land in higher size groups. Leased out land
was very low and was mostly confined to Size-IV.

150
Table 4.6: Land Area Owned, Leased and Operated Per Farm by Size Groups in Raichur District
(in Hectares) Farm Size
Group Land
Owned Land
leased OutLand
leased inLand
Operated I (<1 Ha.) 1.71 0.04 0.17 1.84 II (1-2 Ha.) 2.88 0.00 0.74 3.63 III (2-4 Ha.) 6.46 0.00 0.46 6.92 IV (4-6 Ha.) 12.57 0.67 0.00 11.90 V (>6 Ha.) 17.99 0.00 0.00 17.99 Average 3.90 0.03 0.43 4.29
Even though tenancy is legally banned in Karnataka, it is prevalent under cover. We
saw concealed tenancy prevailing in Raichur district despite its predominant drought-prone
characteristics. We can see from table 4.7 the extent of tenancy across the size classes.
The share of owned, leased in and operated area were much lower for the first two size
groups than the share of sample farmers in them.
Table 4.7: Percentage Distribution of Sample Farmers and Area by Tennurial Status and Farm Size Groups in Raichur
District (in percentage)
Farm Size Group Sample Farmers
Area Owned
Area leased out
Area leased in
Area Operated
I (<1 Ha.) 38.33 16.85 50 15.69 16.48II (1-2 Ha.) 35.83 26.51 0 62.75 30.32III (2-4 Ha.) 20 33.18 0 21.57 32.28IV (4-6 Ha.) 2.5 8.06 50 0 6.94V (>6 Ha.) 3.33 15.39 0 0 13.99
Total 100 100 100 100 100
Distribution of leased in land was confined to small farm size groups-I to III (i.e.,
below 4 ha.). The area varied across farm sizes. It was 8 acres, 32 acres and 11 acres
respectively in successive farm sizes. Almost the entire portion of the leased in land was
irrigated.

151
Table 4.8: Distribution of Leased in Land by Size Groups in Raichur District
Area under Fixed Kind Rent (in Acres)
Average Amount of Produce Per Acre (in Qtls)
Farm Size Group
Irrigated Unirrigated Total Irrigated Unirrigated Total I (<1 Ha.) 8 0 8 16.13 0 16.13II (1-2 Ha.) 32 0 32 17.39 0 17.39III (2-4 Ha.) 11 0 11 7.77 0 7.77IV (4-6 Ha.) 0 0 0 0 0 0V (>6 Ha.) 0 0 0 0 0 0
Total 51 0 51 16.97 0 16.97
4.2.5 Irrigation
Raichur district does not have large irrigation facilities, but in the sample we had
about 89 percent of area under irrigation (Table 4.9). The irrigated area in all farm sizes
ranged between 75 per cent and 98.4 per cent. We observed a decline in irrigated area
with farm size. In farm size of less than 2 hectares, irrigated area was 97.37 per cent, on
an average, whereas in farms above 2 hectares only about 81 per cent area was irrigated.
4.2.6 Distribution of Animals
Assets holdings indicate the economic stability of the household, as these serve as
insurance against economic emergencies. Livestock holdings have been a traditional
accompaniment of the farming business. Among the sample households we noticed about
12 animals per farm that included milch animals, draught animals and the young stock.
Except for Size Class IV, we noticed a steady increase in the number of animals per farm
with size group. Average number of animals per farm was 12.2, of which 5.21 were milch
animals, 3.6 were draught animals and 3.38 young stock. Average number of draught
animals did not show any trend with the farm size, but varied in a narrow range. Average
draught animals per farm was 3.6 for all farm sizes, which indicates that many farmers
owned more than a pair of bullocks, that indicates slim possibility of mechanisation.

152
Table 4.9: Irrigated and Unirrigated Operated Area Per Farm in Raichur District (In Hectares)
Farm Size Group Irrigated Area
Unirrigated Area
Total Area
I (<1 Ha.) 1.81 0.03 1.84 (%) 98.41 1.59 100.00
II (1-2 Ha.) 3.49 0.13 3.63 (%) 96.34 3.66 100.00
III (2-4 Ha.) 5.95 0.97 6.92 (%) 85.93 14.07 100.00
IV (4-6 Ha.) 9.00 2.90 11.90 (%) 75.63 24.37 100.00
V (>6 Ha.) 14.74 3.25 17.99 (%) 81.93 18.07 100.00
Average 3.85 0.43 4.29 (%) 89.88 10.13 100.0
Table 4.10: Number of Animals Per Farm by Size Groups in Raichur District
Farm Size Group Milk animal
Draught animal
Young stock
Total
I (<1 Ha.) 3.89 3.12 2.93 9.94 II (1-2 Ha.) 5.43 3.9 3.13 12.45 III (2-4 Ha.) 6 4 4.2 14.2 IV (4-6 Ha.) 6 2 3.67 11.67 V (>6 Ha.) 7.33 4 4.33 15.66 Average 5.21 3.6 3.38 12.2
4.2.7 Distribution of Important Agricultural Assets
Among the other important assets included were tractors, tillers, bullock carts and
pump sets. We have presented the asset holdings of the sample household in Table 4.11.
Overall, only 12.5 per cent of the farmers owned tractors. The ownership of tractors was
highest in farm size-III. But, when expressed in terms of share only 33 percent of the
farmers in this size group owned tractor, whereas, 66 per cent in Size class IV and 100 per
cent in the highest size class of holding own tractors. The number of tillers owned by
farmers was very low. Around 42 per cent of the total farmers owned Bullock Cart. Farmers
in all categories except those with land holding less than 1-hectare owned bullock carts.
Around 72 per cent of farmers in size class-II, 62 per cent in size class-III and 66 per cent

153
in size class-IV owned it. Farmers in all categories except the lowest size class of holding
owned pump sets. The per cent of ownership increased with farm size.
Table 4.11: Distribution of Important Assets by Farm Size Groups and Their
Value Per Unit in Raichur District (Value in ,000 Rupees)
Tractor Tiller Bullock Cart Pumpset Farm Size Group
No. of Farmers No. Average
Value/UnitNo. Average
Value /unit
No. Average Value /Unit
No Average Value /Unit
I (<1 Ha.) 46 1 280 0 0 0 0 0 0 II (1-2 Ha.) 43 0 0 0 0 31 313 2 40 III (2-4 Ha.) 24 8 326 2 100 15 317 7 44 IV (4-6 Ha.) 3 2 325 0 0 2 30 2 43 V (>6 Ha.) 4 4 308 0 0 2 50 5 40
Total 120 15 322 2 100 50 320 16 44
4.2.8 Storage Facilities Available with the Farmers
Among the other favourable assets come the storage facilities. The storage
capacity increased with farm size except for farm size-IV. The number of storages was 74
out of 120 and the number of rooms used for storage was 45 for all size groups. Number of
rooms for storage was higher in the smaller farm sizes whereas, in bigger farm sizes the
capacity of the storages was quite high.
Table 4.12: Type of Storage Facility by Farm Size Groups in Raichur District Farm Size Group Room Shed No Storage Total Capacity (in Qntls)
I (<1 Ha.) 13 0 33 46 154 II (1-2 Ha.) 15 0 28 43 216 III (2-4 Ha.) 12 0 12 24 363 IV (4-6 Ha.) 2 0 1 3 275 V (>6 Ha.) 3 1 0 4 633
Total 45 1 74 120 315(weighted average)
The farmers were asked their opinion about the storage facilities. About 51 per cent
of farmers expressed their willingness to create additional storage facility. The positive
responses favouring creation of additional storage facilities ranged between 43.48 and 100
per cent across the size groups, and these responses were in a very narrow range. The
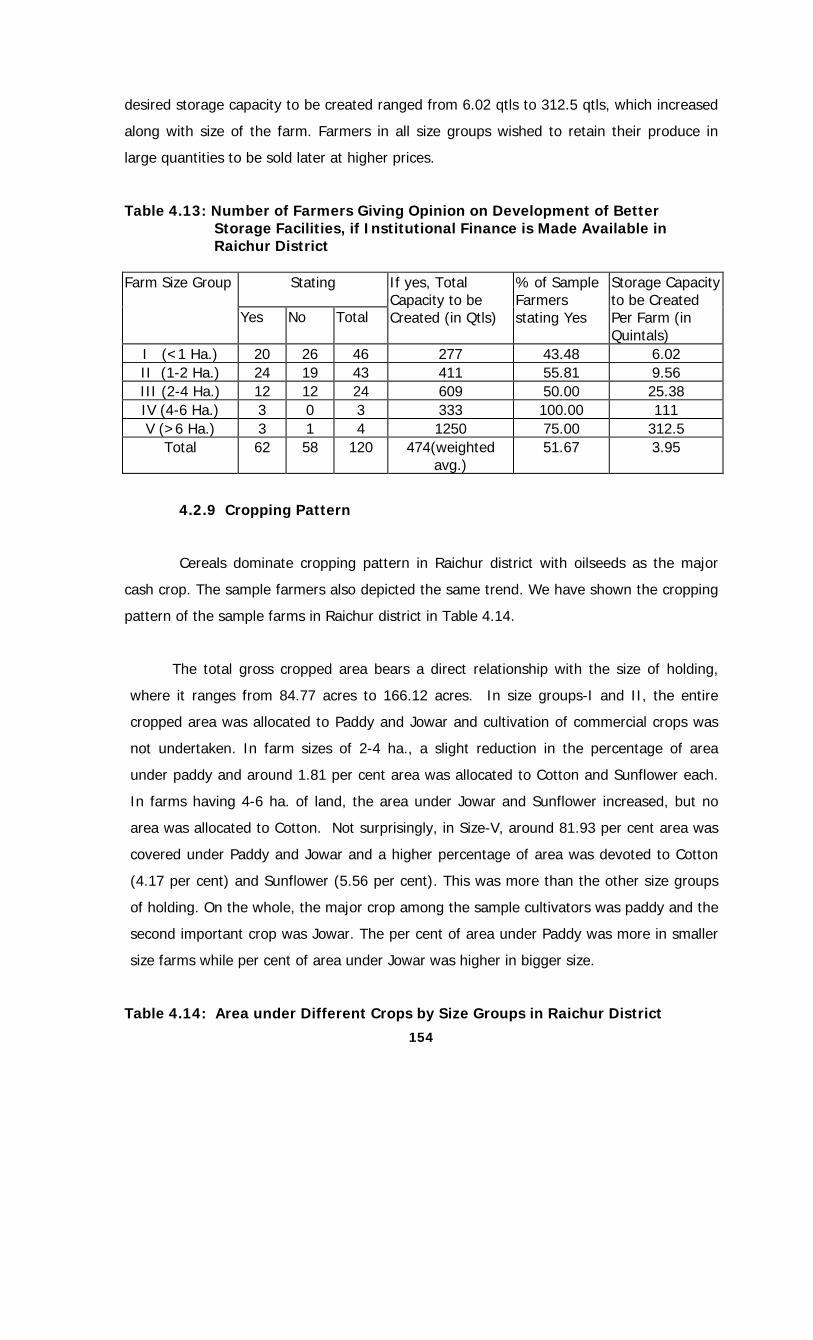
154
desired storage capacity to be created ranged from 6.02 qtls to 312.5 qtls, which increased
along with size of the farm. Farmers in all size groups wished to retain their produce in
large quantities to be sold later at higher prices.
Table 4.13: Number of Farmers Giving Opinion on Development of Better Storage Facilities, if Institutional Finance is Made Available in Raichur District
Stating Farm Size Group
Yes No Total
If yes, Total Capacity to be Created (in Qtls)
% of Sample Farmers stating Yes
Storage Capacity to be Created Per Farm (in Quintals)
I (<1 Ha.) 20 26 46 277 43.48 6.02 II (1-2 Ha.) 24 19 43 411 55.81 9.56 III (2-4 Ha.) 12 12 24 609 50.00 25.38 IV (4-6 Ha.) 3 0 3 333 100.00 111 V (>6 Ha.) 3 1 4 1250 75.00 312.5
Total 62 58 120 474(weighted avg.)
51.67 3.95
4.2.9 Cropping Pattern
Cereals dominate cropping pattern in Raichur district with oilseeds as the major
cash crop. The sample farmers also depicted the same trend. We have shown the cropping
pattern of the sample farms in Raichur district in Table 4.14.
The total gross cropped area bears a direct relationship with the size of holding,
where it ranges from 84.77 acres to 166.12 acres. In size groups-I and II, the entire
cropped area was allocated to Paddy and Jowar and cultivation of commercial crops was
not undertaken. In farm sizes of 2-4 ha., a slight reduction in the percentage of area
under paddy and around 1.81 per cent area was allocated to Cotton and Sunflower each.
In farms having 4-6 ha. of land, the area under Jowar and Sunflower increased, but no
area was allocated to Cotton. Not surprisingly, in Size-V, around 81.93 per cent area was
covered under Paddy and Jowar and a higher percentage of area was devoted to Cotton
(4.17 per cent) and Sunflower (5.56 per cent). This was more than the other size groups
of holding. On the whole, the major crop among the sample cultivators was paddy and the
second important crop was Jowar. The per cent of area under Paddy was more in smaller
size farms while per cent of area under Jowar was higher in bigger size.
Table 4.14: Area under Different Crops by Size Groups in Raichur District
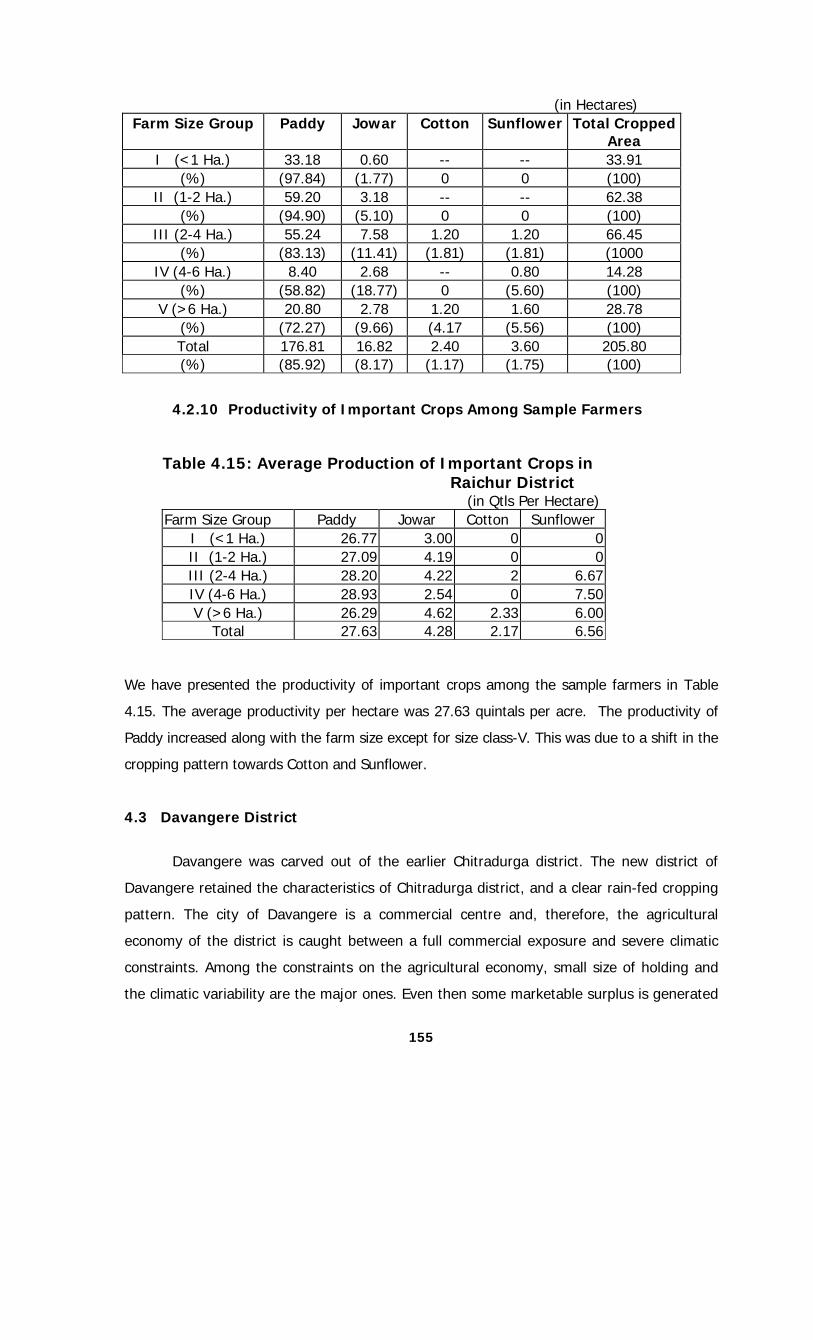
155
(in Hectares) Farm Size Group Paddy Jowar Cotton Sunflower Total Cropped
Area I (<1 Ha.) 33.18 0.60 -- -- 33.91
(%) (97.84) (1.77) 0 0 (100) II (1-2 Ha.) 59.20 3.18 -- -- 62.38
(%) (94.90) (5.10) 0 0 (100) III (2-4 Ha.) 55.24 7.58 1.20 1.20 66.45
(%) (83.13) (11.41) (1.81) (1.81) (1000 IV (4-6 Ha.) 8.40 2.68 -- 0.80 14.28
(%) (58.82) (18.77) 0 (5.60) (100) V (>6 Ha.) 20.80 2.78 1.20 1.60 28.78
(%) (72.27) (9.66) (4.17 (5.56) (100) Total 176.81 16.82 2.40 3.60 205.80 (%) (85.92) (8.17) (1.17) (1.75) (100)
4.2.10 Productivity of Important Crops Among Sample Farmers
Table 4.15: Average Production of Important Crops in Raichur District
(in Qtls Per Hectare) Farm Size Group Paddy Jowar Cotton Sunflower
I (<1 Ha.) 26.77 3.00 0 0 II (1-2 Ha.) 27.09 4.19 0 0 III (2-4 Ha.) 28.20 4.22 2 6.67 IV (4-6 Ha.) 28.93 2.54 0 7.50 V (>6 Ha.) 26.29 4.62 2.33 6.00
Total 27.63 4.28 2.17 6.56 We have presented the productivity of important crops among the sample farmers in Table
4.15. The average productivity per hectare was 27.63 quintals per acre. The productivity of
Paddy increased along with the farm size except for size class-V. This was due to a shift in the
cropping pattern towards Cotton and Sunflower.
4.3 Davangere District
Davangere was carved out of the earlier Chitradurga district. The new district of
Davangere retained the characteristics of Chitradurga district, and a clear rain-fed cropping
pattern. The city of Davangere is a commercial centre and, therefore, the agricultural
economy of the district is caught between a full commercial exposure and severe climatic
constraints. Among the constraints on the agricultural economy, small size of holding and
the climatic variability are the major ones. Even then some marketable surplus is generated

156
for the purpose of cash requirement. Traditionally, Davangere region had cotton as a major
cash crop, but our sample region had sugarcane and paddy as the major crops.
4.3.1 Distribution of Sample Farmers
(a) By Size Groups and Holdings
Sample farmers in Davangere were chosen using the sampling framework of the
study. Therefore, we had a large number of sample farmers with size of holding below 4
hectares. Only about 5 percent of the selected farm households had size of holding above 4
hectares. This can be seen from table 4.16.
Table 4.16: Sample Farmers by Size Groups in Davangere District
Farm Size Group Number Percentage I (<1 Ha.) 27 45.00 II (1-2 Ha.) 23 38.33 III (2-4 Ha.) 7 11.67 IV (4-6 Ha.) 2 3.33 V (>6 Ha.) 1 1.67
Total 60 100.00
(b) By Castes
Davangere is a region known for the concentration of Lingayat and Vakkaliga
castes. This is clearly depicted in the sample. About 51.7 percent of the sample farmers
belonged to Lingayat and Vakkaliga castes. About 95 per cent of the Lingayat cultivators
were in the three smaller groups of holdings whereas, around 88 per cent of Vakkaliga
farmers from the sample were in these size group of holdings. We had 17 farmers
belonged to Scheduled Castes and Scheduled Tribes. In other castes, no farmer operates
more than 4 hectares of land except one in ST.

157
Table 4.17: Number of Households by Castes and Farm Size Groups in Davangere District
Farm Size Group Lingayath Vakkaliga ST SC Muslim Others Total
I (<1 Ha.) 13 1 1 7 3 2 27 II (1-2 Ha.) 4 5 3 4 1 6 23 III (2-4 Ha.) 4 2 1 0 0 0 7 IV (4-6 Ha.) 0 1 1 0 0 0 2 V (>6 Ha.) 1 0 0 0 0 0 1
Total (%)
22 (36.67)
9 (15.00)
6 (10.00)
11 (18.33)
4 (6.67)
8 (13.33)
60 (100)
4.3.2 Composition of Family by Age and Sex
Table 4.18 includes the age distribution by farm sizes. Family size increased with
bigger farms except for size group-V. It was 8.41 in farm size-I and 14.50 in farm size-IV,
while in size class-V it was 13.00. The average size of family in the sample was 9.22.
Table 4.18: Distribution of Family Members Per Household By Age and Farm
Size Groups in Davangere District (in Numbers)
Adults Children Total Farm Size Group Male Female Total Male Female Total Male Female Total
I (<1 Ha.) 3.15 2.30 5.44 1.48 1.48 2.96 4.63 3.78 8.41II (1-2 Ha.) 3.39 2.35 5.74 1.70 1.57 3.26 5.09 3.91 9.00III (2-4 Ha.) 3.86 2.86 6.71 2.29 2.00 4.29 6.14 4.86 11.00IV (4-6 Ha.) 6.00 4.00 10.00 2.50 2.00 4.50 8.50 6.00 14.50V (>6 Ha.) 6.00 4.00 10.00 2.00 1.00 3.00 8.00 5.00 13.00Average 3.47 2.47 5.93 1.70 1.58 3.28 5.17 4.05 9.22
4.3.3 Level of Education of Head of Farmers’ Family Table 4.19: Distribution of Sample Households by Level of Education of
Respondent Farmers in Davangere District
Farm Size Group Illeterate 1 to 4 5 to 7 8 to 10 PUC Degree Total I (<1 Ha.) 4 5 8 10 0 0 27 II (1-2 Ha.) 1 7 7 7 1 0 23 III (2-4 Ha.) 1 2 1 3 0 0 7 IV (4-6 Ha.) 1 0 0 0 0 1 2 V (>6 Ha.) 0 0 0 1 0 0 1
Total 7 14 16 21 1 1 60 (%) 11.67 23.33 26.67 35.00 1.67 1.67 100.00

158
Only seven out of 60 (i.e., 11.67 per cent) farmers were illiterate and out of these
57 per cent were in small size group with less than 1 hectare. The remaining sample was
evenly distributed between the other three size groups and no illiterates in Size class -V.
Among literate farmers the highest number were in the education level 8 to 10 (21).
Farmers in lower size groups were mostly at education levels 1 to 4, 5 to 7 and 8 to 10. In
size class-IV, 50 per cent is illiterate and the rest were at a higher education level.
Table 4.20: Distribution of Households by Highest Education Level of a Family Member in Davangere District
Farm Size Group 5 to 7 8 to 10 PUC Graduate Total I (<1 Ha.) 7 12 5 3 27 II (1-2 Ha.) 2 13 3 5 23 III (2-4 Ha.) 0 2 5 0 7 IV (4-6 Ha.) 0 0 0 2 2 V (>6 Ha.) 0 0 0 1 1
Total (%)
9 (15.00)
27 (45.00)
13 (21.67)
11 (18.33)
60 (100.00)
We noted 11 graduates and 13 persons having entered college education in the
sample. Most of the highly educated persons seemed to be from the first two farm sizes. A
majority of these persons fell in the category of having educated up to 8th or 10th standard.
4.3.4 Tennurial Status, Average Size of Holdings and Distribution of Land
Land is the basic productive asset of the sample farmers. The increasing
demographic pressures as well as the trends in commercialization caused shrinkage in the
size of holding as a general phenomenon. Davangere is not an exception to this rule. The
average ownership size of holding among the sample farmers worked out to be 3.47,
whereas, the average operated area came to 3.68 hectares.
Table: 4.21: Land Area Owned, Leased in and Operated per Farm by Size Groups in Davangere District
Farm Size Group Land Owned Land leased Out
Land leased In
Land Operated
I (<1 Ha.) 1.38 0.00 0.15 1.61 II (1-2 Ha.) 3.32 0.00 1.44 3.61 III (2-4 Ha.) 7.07 0.00 3.11 7.07 IV (4-6 Ha.) 14.75 0.00 5.00 12.75 V (>6 Ha.) 19.45 0.00 8.00 19.45 Average 3.47 0.00 1.28 3.68

159
A few observations come out of Table 4.21. The land owned, leased in and operated
increased consistently with farm size. Despite the legal ban on tenancy, we noted the area
leased in accounts to almost 30 per cent of the size of operated holdings. The land leased
out was zero for all the farms sizes, but leased in land increased with size of farms. Of the
total leased in land, 73.48 per cent was in the two bigger farm sizes.
Table 4.22: Distribution of Leased in land by Size of Holdings in Davangere District
Area under Fixed Cash Rent (in acres)
Average Cash Rent Per Acre (in Rs.)Farm Size Group
Irrigated Unirrigated Total Irrigated Unirrigated Total I (<1 Ha.) 0 6.25 6.25 0 1720 1720
(%) 0 100 100 0 100 100II (1-2 Ha.) 2 4.5 6.5 2500 2000 2154
(%) 30.77 69.23 100 III (2-4 Ha.) 0 0 0 0 0 0
(%) IV(4-6 Ha.) 0 0 0 0 0 0
(%) V (>6 Ha.) 0 0 0 0 0 0
(%) Total 2 10.75 12.75 2500 1837 1941(%) 15.69 84.31 100
The tenurial contracts involved only fixed cash rent and there was not a single case
of contract involving ‘share of produce’. Average cash rent worked out to be Rs 1,941, and
that was higher for irrigated area (Rs 2,500). There was no evidence of cost sharing either
and most of the lessees used cash as well as other components of cost from their own
resources.
4.3.5 Irrigation
As mentioned earlier, Davangere is not a significantly irrigated region of the state.
The prevalence of small share of irrigated area was, therefore, not surprising. The sample
farms had about 35 per cent of their holdings under irrigation. On the whole, more than 60
per cent area remained unirrigated. The proportion of irrigated area was a bit higher in Size
class II (33.78%) than Size Class-I (9.09%).

160
Table: 4.23: Irrigated and Unirrigated Operated Area Per Farm in Davangere District
Farm Size Group Irrigated Area Unirrigated Area
Total Area
I (<1 Ha.) 0.15 1.47 1.61 (%) 9.09 91.10 100.00
II (1-2 Ha.) 1.44 2.17 3.61 (%) 39.78 60.12 100.00
III (2-4 Ha.) 3.11 3.96 7.07 (%) 43.95 56.03 100.00
IV(4-6 Ha.) 5.00 7.75 12.75 (%) 39.22 60.78 100.00
V (>6 Ha.) 8.00 11.45 19.45 (%) 41.13 58.87 100.00
Average 1.28 2.40 3.68 (%) 34.75 65.31 100.00
4.3.6 Distribution of Animals
Asset holding in Davangere district is not comparable with that of Raichur district. The
sample farmers did not maintain large livestock. As can be seen from Table 4.24, the average
number of animals per farm was 5.82, of which 3.23 were milch animals, 1.43 draught
animals and 2.07 were young stock. The livestock holding was directly proportional to the size
of land holdings. Even though the livestock holdings show an increase in draught animal along
with farm size, the average number of draught animals was 1.43, indicating that most of the
farmers did not own a pair of bullocks.
Table 4.24: Distribution of Animals Per Farm by Size Groups in Davangere District
Farm Size Group Milch Animal Draught Animal
Young Stock Total
I (<1 Ha.) 2.15 0.89 1.93 4.96 II (1-2 Ha.) 2.26 1.91 1.91 6.09 III (2-4 Ha.) 3 1.71 2.43 7.14 IV (4-6 Ha.) 3 2 2.5 7.5 V (>6 Ha.) 2 2 6 10 Average 2.32 1.43 2.07 5.82
4.3.7 Distribution of Important Agricultural Assets
As regards the other assets we found that only farmers in Size groups with above 2
hectares owned tractors. It is surprising that a large number of farmers from the size class II
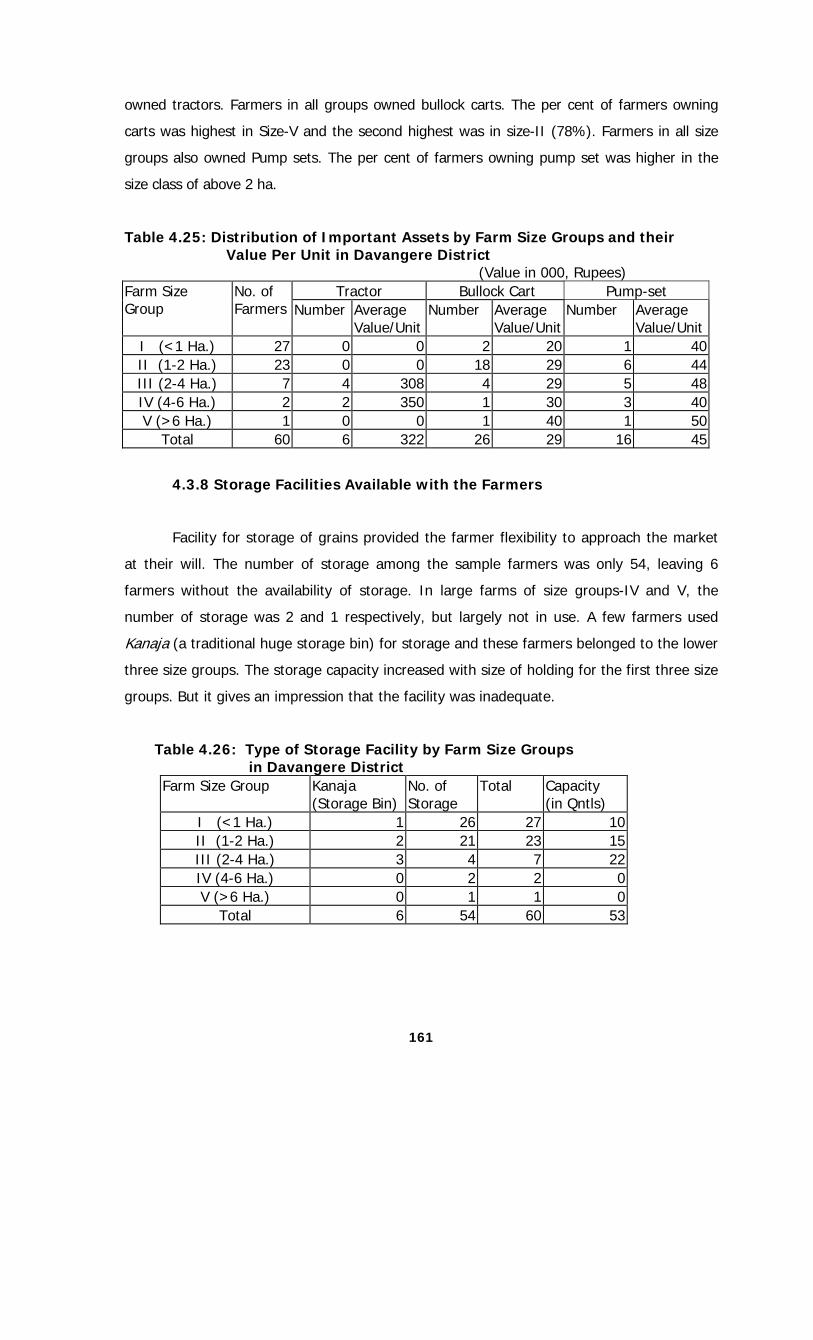
161
owned tractors. Farmers in all groups owned bullock carts. The per cent of farmers owning
carts was highest in Size-V and the second highest was in size-II (78%). Farmers in all size
groups also owned Pump sets. The per cent of farmers owning pump set was higher in the
size class of above 2 ha.
Table 4.25: Distribution of Important Assets by Farm Size Groups and their Value Per Unit in Davangere District
(Value in 000, Rupees) Tractor Bullock Cart Pump-set Farm Size
Group No. of Farmers Number Average
Value/UnitNumber Average
Value/UnitNumber Average
Value/UnitI (<1 Ha.) 27 0 0 2 20 1 40II (1-2 Ha.) 23 0 0 18 29 6 44III (2-4 Ha.) 7 4 308 4 29 5 48IV (4-6 Ha.) 2 2 350 1 30 3 40V (>6 Ha.) 1 0 0 1 40 1 50
Total 60 6 322 26 29 16 45
4.3.8 Storage Facilities Available with the Farmers
Facility for storage of grains provided the farmer flexibility to approach the market
at their will. The number of storage among the sample farmers was only 54, leaving 6
farmers without the availability of storage. In large farms of size groups-IV and V, the
number of storage was 2 and 1 respectively, but largely not in use. A few farmers used
Kanaja (a traditional huge storage bin) for storage and these farmers belonged to the lower
three size groups. The storage capacity increased with size of holding for the first three size
groups. But it gives an impression that the facility was inadequate.
Table 4.26: Type of Storage Facility by Farm Size Groups in Davangere District
Farm Size Group Kanaja (Storage Bin)
No. of Storage
Total Capacity (in Qntls)
I (<1 Ha.) 1 26 27 10 II (1-2 Ha.) 2 21 23 15 III (2-4 Ha.) 3 4 7 22 IV (4-6 Ha.) 0 2 2 0 V (>6 Ha.) 0 1 1 0
Total 6 54 60 53

162
Table 4.27: Number of Farmers Giving Opinion on Development of Better Storage Facilities, If Institutional Finance Made Available in Davangere District
Stating Farm Size Group
Yes No Total If Yes, Total
Capacity to be Created (in
Qtls)
% of Sample Farmers
stating Yes
Storage Capacity to be Created per Farm (in Quintals)
I (<1 Ha.) 7 20 27 64 25.93 2.37 II (1-2 Ha.) 15 8 23 107 65.22 4.65 III (2-4 Ha.) 7 0 7 171 100.00 24.43 IV (4-6 Ha.) 2 0 2 225 100.00 112.50 V (>6 Ha.) 1 0 1 100 100.00 100.00
Total 32 28 60 119 53.33 1.98
More than half of the farmers indicated inadequacy of storage facility and indicated
to improve it. Almost all the farmers in three higher size groups had opted for improving
the storage facilities. The average capacity needed was only for about two quintals. The
requirement was highest in the larger size group of holding.
4.3.9 Cropping Pattern
The cropping pattern of the sample farms is presented in Table 4.28. It is quite
clear that Paddy, Maize and Sugarcane acted as cash crops. The major crop among the
sample farmers was Maize with 42 per cent share in total cropped area. The small farmers
had higher share of area under Maize than big farmers. In the case of Paddy, it was the
reverse. The small farmers had smaller share of the cropped area allocated to paddy.
Table 4.28: Area under Different Crops by Size Groups in Davangere District (in Hectares) Farm Size Group Paddy Maize Jowar Ragi Sugarcane Total Cropped
Area I (<1 Ha.) -- 11.22 4.62 0.48 0.80 17.42
(%) 0 (64.39) (26.54) (2.76) (4.59) (100) II (1-2 Ha.) 5.20 13.54 6.08 3.20 4.95 33.18
(%) (15.67) (40.82) (18.34) (9.64) (14.92) (100) III (2-4 Ha.) 3.20 7.96 3.43 1.30 3.60 19.79
(%) (16.17) (40.22) (17.34) (6.57 (18.19) (100) IV (4-6 Ha.) 1.60 2.80 1.40 -- 2.40 10.20
(%) (15.69) (27.450 (13.73) 0 (23.53) (100) V (>6 Ha.) 3.20 1.60 1.60 1.38 -- 7.78
(%) (41.13) (20.57) (20.57) (17.74) 0 (100) Total 13.20 37.12 17.14 6.36 11.75 88.37 (%) (14.94) (42.0) (19.40) (7.20) (13.3) (100)

163
Farmers with land size smaller than 1 hectare did not grow paddy. The area allocated to
paddy increased from 15.67 per cent in size class II to 41.13 per cent in size class V. In the
case of sugarcane as another cash crop, small farmers also had a little share while big farmers
allocated more shares to sugarcane. The share of area under sugarcane increased from 4.59
in size class-I to 23.53 in size class-IV.
4.3.10 Productivity of Important Crops Among Sample Farmers
Table 4.29 includes the productivity of the crops among the sample farmers.
Generally, there was a positive relationship between size and productivity, but the
performance of the size-class III was far better than the other groups. Paddy had good
productivity and so also sugarcane. Maize was used as a cash crop and its productivity was
about 16 quintals
Table 4.29: Productivity of Important Crops in Davangere District (in Qtls per Hectare)
4.4 Summary
The sample profiles of the two districts suggest quite a few interesting issues. First,
the land size was shrinking and that left a smaller base for farm production activities. Even
though tenancy is legally banned in Karnataka, the prevalence of leasing out operations
was seen among the sample farmers. In order to overcome the land based constraint, the
cultivators, leased in land. Second, oilseeds, sugarcane were the traditional cash crops. But
with the increased market operations in paddy and wheat, these cereals have also assumed
the role of cash crops. Maize is strongly emerging as a new cash crop. The processing units
largely procure it. Third, the asset position of the sample farmers was not very promising.
Some of the farmers owned tractors but these were largely used for transportation than
tillage or farm based activities. Many owned irrigation pump sets. Lastly, even though the
two sample regions have a commercial orientation, the production base did not allow for
scaling up of this operation.
Farm Size Group Paddy Maize Jowar Ragi Sugarcane I (<1 Ha.) 0 16.26 5.62 8.33 40II (1-2 Ha.) 27.31 16.45 6.38 4.13 54.52III (2-4 Ha.) 27.50 17.94 5.94 3.38 61.11IV (4-6 Ha.) 30 19.29 5.71 0 46.67V (>6 Ha.) 35 15.00 5 1.74 0
Total 29.55 16.86 5.9 3.77 53.95

164
CHAPTER V
MARKETING IN RAICHUR DISTRICT
5.1. Introduction Raichur district was chosen for the purpose of this study on the basis of the
multifarious marketing activities. Unlike other parts of the country, the districts of Deccan
Plateau do not specialize in marketing of single crop. In response to the frequent
occurrence of droughts, the cropping pattern is developed under risk spreading. The
commercialisation has been showing signs in the crop pattern changes. Oil-seeds had been
traditional commercial crops but in the recent past the surplus production of paddy and
other cereals has been entering the markets. The marketing activities are not at the peak
as still the farmers in Raichur as well as the state have to come out of the subsistence
orientation.
This chapter is based on data collected from the farmers and the other marketing
intermediaries in the district. As the marketing infrastructure is not well developed in the
state, the data from Commission agents is hardly of any use. The Commission agents
operate at a very low key and mostly procure from the individual farmers at the farm itself.
We have analysed here the production, quantity marketed and seasonality of quantity
marketed. Transportation of the produce, expenditure on transportation and the marketing
process formed part of our analysis. There was no direct sale to the millers and therefore,
the intricacies of this sale could not be investigated. The rice mills are very few and most of
the millers from different districts procure from the market directly. Similarly, the presence
of commission agents is most illusive and no information was available on this aspect.
Farmers’ opinion about the marketing structure and bottlenecks forms an important part of
this chapter.
5.2 Production and Marketing of Crops in Raichur Paddy being one of the major food crops of the district we have taken the
production and marketing of paddy here. Table 5.1 gives the production and marketed
surplus of paddy across the size classes of holdings. For the sample as a whole, the per
cent of marketed surplus of paddy worked out to 83.9 per cent. A steady and consistent
increase was seen in the quantity marketed of paddy with the increase in the size of farm.

165
It ranged from 72.92 per cent in lowest farm size to 93.15 in the farm size above 6
hectares. Even though paddy is one of the major food consumption items, only a small per
cent of the produce was retained for home consumption and for seeds. In the case of
quantity retained for consumption it was 31 quintals per farm in aggregate. As the farm
size increased the per cent of quantity retained for this purpose decreased, i.e., from 27.08
quintals in first size class to 6.37 per cent in the last. Of the total produce, only 1 quintal
were set aside for seeds. Hence, on the whole, a major share of the produce of paddy was
marketed; the percentage marketed by big farmers was higher.
Table 5.1: Production and Quantity Marketed Per Farm of Paddy in Raichur District
(in quintals)
Farm Size Group Production
Home Consumption Seed
Quantity Marketed
Percentage of Quantity Marketed
to Production I (<1Ha.) 96 26 0 70 72.98
II (1-2 Ha.) 174 32 1 141 81.25 III (2-4 Ha.) 307 37 1 269 87.62 IV (4-6 Ha.) 203 25 0 178 87.68 V (>6 Ha.) 628 40 3 585 93.15 Weighted Average 199 31 1 166 83.92
Jowar is another important food crop grown by the farmers of Raichur district. It
was being grown largely for home consumption but recently some portion of the produce
is marketed. Even though production per farm of Jowar increased with size, the first two
smaller groups and farmers in size class of above 6 hectares did not have surplus for
marketing. In these groups, Jowar production was completely utilised for home
consumption and animal feed. The quantity consumed increased from 3 quintals in the
lowest size class to 8 quintals in the next group, but a decrease in the quantity used as
animal feed from 2 quintals to 1 quintal in size-III was seen. Only farmers in III & IV
groups marketed their produce. In size group III, the per cent marketed was 7.69 per
cent, while it was 45.5 per cent in size group IV. On an average only 1 quintal of Jowar
was marketed. The amount utilised for consumption and for animal feed added up to 12
quintals per farm for the sample while the production being 13 quintals. Hence, the
marketed quantity was only a meagre amount.

166
Table 5.2: Production and Quantity Marketed Per Farm of Jowar in Raichur District (in Quintals)
Farm Size Group Production
Home Consumption
Animal Feed
Quantity Marketed
Percentage of Quantity Marketed
to Production I (<1Ha.) 5 3 2 0 0
II (1-2 Ha.) 9 8 1 0 0 III (2-4 Ha.) 13 11 1 1 7.69 IV (4-6 Ha.) 11 5 1 5 45.45 V (>6 Ha.) 20 14 6 0 0 Weighted Average 13 11 1 1 7.69
Sunflower is an emerging commercial crop in the district. The entire quantity
produced was marketed. Only the farmers with land size above 2 hectares undertook
production of this crop. It increased with farm size and hence, the quantity marketed.
The production and marketed quantity was 10 quintals in Size class of holding
between 2 and 4 hectares and it increased to 24 quintals in the last size class.
Table 5.3: Production and Quantity Marketed Per Farm of Sunflower in Raichur District
Farm Size Group Production Quantity Marketed
Percentage of Quantity Marketed
to Production I (<1Ha.) 0 0 0
II (1-2 Ha.) 0 0 0 III (2-4 Ha.) 10 10 100.00 IV (4-6 Ha.) 15 15 100.00 V (>6 Ha.) 24 24 100.00
Weighted Average 15 15
The disposal of the produce for various use including marketing in terms of
quantity was noted above. The percent distribution is given below in Table 5.4. In the case
of paddy, the share in output was higher than share in quantity marketed in the smallest
size class of holding. In other groups, the latter was higher than the former. Farmers
marketed relatively larger proportion of the produce in the land size above 1 hectare while
farmers with land size below 1 hectare (small farmers) retained a relatively larger
proportion of the produce. More than 90 per cent of the production of Jowar was from the
first two lower size groups, but no quantity was marketed. In Size-classes of 2 to 6
hectares, the share of quantity marketed was much higher than the share in output. The
combined share of output of these two groups was only 33.11 per cent while the entire
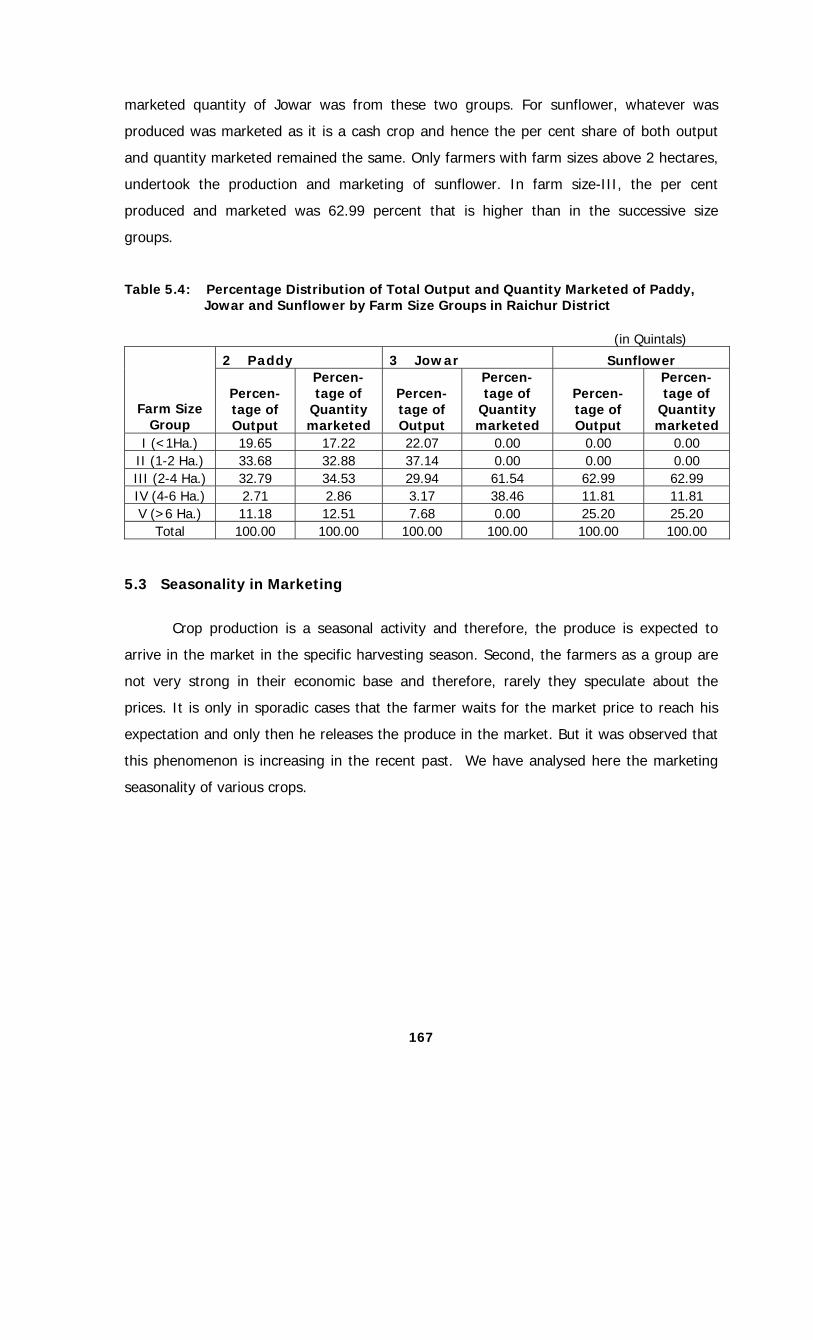
167
marketed quantity of Jowar was from these two groups. For sunflower, whatever was
produced was marketed as it is a cash crop and hence the per cent share of both output
and quantity marketed remained the same. Only farmers with farm sizes above 2 hectares,
undertook the production and marketing of sunflower. In farm size-III, the per cent
produced and marketed was 62.99 percent that is higher than in the successive size
groups.
Table 5.4: Percentage Distribution of Total Output and Quantity Marketed of Paddy, Jowar and Sunflower by Farm Size Groups in Raichur District
(in Quintals)
2 Paddy 3 Jowar Sunflower
Farm Size Group
Percen-tage of Output
Percen-tage of
Quantity marketed
Percen-tage of Output
Percen-tage of
Quantity marketed
Percen-tage of Output
Percen-tage of
Quantity marketed
I (<1Ha.) 19.65 17.22 22.07 0.00 0.00 0.00 II (1-2 Ha.) 33.68 32.88 37.14 0.00 0.00 0.00 III (2-4 Ha.) 32.79 34.53 29.94 61.54 62.99 62.99 IV (4-6 Ha.) 2.71 2.86 3.17 38.46 11.81 11.81 V (>6 Ha.) 11.18 12.51 7.68 0.00 25.20 25.20
Total 100.00 100.00 100.00 100.00 100.00 100.00 5.3 Seasonality in Marketing
Crop production is a seasonal activity and therefore, the produce is expected to
arrive in the market in the specific harvesting season. Second, the farmers as a group are
not very strong in their economic base and therefore, rarely they speculate about the
prices. It is only in sporadic cases that the farmer waits for the market price to reach his
expectation and only then he releases the produce in the market. But it was observed that
this phenomenon is increasing in the recent past. We have analysed here the marketing
seasonality of various crops.

168
Table 5.5: Percentage Quantity Marketed Per Farm of Paddy in Different Months by Size groups in Raichur District
(in Quintals) Kharif Rabi Farm Size
Group November December January March April May Total I (<1Ha.) 16 23 0 5 19 7 70
(%) 22.86 32.86 0.00 7.14 27.14 10.00 100.00 II (1-2 Ha.) 26 39 6 5 49 16 141
(%) 18.44 27.66 4.26 3.55 34.75 11.35 100.00 III (2-4 Ha.) 37 103 21 9 58 41 269
(%) 13.75 38.29 7.81 3.35 21.56 15.24 100.00 IV (4-6Ha.) 0 0 0 0 35 143 178
(%) 0.00 0.00 0.00 0.00 19.66 80.34 100.00 V (>6 Ha.) 0 100 335 0 150 0 585
(%) 0.00 17.09 57.26 0.00 25.64 0.00 100.00 Average 24 53 24 5 38 22 166
(%) 14.46 31.93 14.46 3.01 22.89 13.25 100.00
We have presented in Table 5.5, the marketing calendar of paddy. It may be noted
that dry paddy can be stored and marketed at an opportune time. The pressure of
marketing was highest in the month of December (harvest season) with a quantity of 53
quintals on an average, followed by 38 quintals in April, 24 quintals each in November and
January and 22 quintals in May. The pressure was lowest in March with the lowest
marketed quantity of 5 quintals. In the months of December and April, the percentage of
quantity marketed of paddy depicted a small range across the farm sizes. In December, it
ranged from 27.66 quintals to 38.29 quintals and in April from 19.66 to 34.75 quintals. A
declining trend was seen with the increase in farm sizes in the month of November. In
November, the proportion of marketed surplus in the smallest size class was 22.86 per
cent, which fell to 13.8 per cent in the third size class of holding. In January, the quantity
marketed began only in the Size group of 1-2 hectares. In the month of March, a declining
trend was noticed with the bigger size groups (7.14 percent in Size-class I to 3.35 in Size
class –III). On the whole, during the months of November, December, March and April, it
was the small farmers with less than 4 hectares of land, who undertook most of the paddy
marketing. In January, May and to an extent in April the big farmers dominated.

169
Table 5.6: Percentage Quantity Marketed Per Farm of Jowar in Different months by Size Groups in Raichur District
Farm Size Group May Total I (<1Ha.) 0 0
(%) 0.00 0.00II (1-2 Ha.) 0 0
(%) 0.00 0.00III (2-4 Ha.) 1 1
(%) 100.00 100.00IV (4-6 Ha.) 5 5
(%) 100.00 100.00V (>6 Ha.) 0 0
(%) 0.00 0.00Weighted Average 1 1
(%) 100.00 100.00
We have seen above that not a large share of Jowar is marketed. The important
month for marketing of Jowar is May. Farmers cultivating less than 2 hectares of land did
not participate in the marketing of jowar and it was confined to farmers in Size groups-III
and IV (farmers with land size 2-6 hectares). The quantity marketed by farmers in size
group-III was 1 quintal while that marketed by farmers in Size group-IV was 5 quintals.
The average quantity marketed per farm for the sample was 1 quintal.
Table 5.7: Percentage of Quantity Marketed Per Farm of Sunflower by Size
Groups in Raichur District (in Quintals)
Farm Size Group April May Total I (<1Ha.) 0 0 0
(%) 0.00 0.00 0.00 II (1-2 Ha.) 0 0 0
(%) 0.00 0.00 0.00 III (2-4 Ha.) 0 10 10
(%) 0.00 100.00 100.00 IV (4-6 Ha.) 15 0 15
(%) 100.00 0.00 100.00 V (>6 Ha.) 24 0 24
(%) 100.00 0.00 100.00 Total 39 10 49
(%) 79.6 20.4 100.00
Sunflower being a cash crop, the total produce is marketed. Two important
months for marketing of Sunflower is April and May. In these two months, the pressure
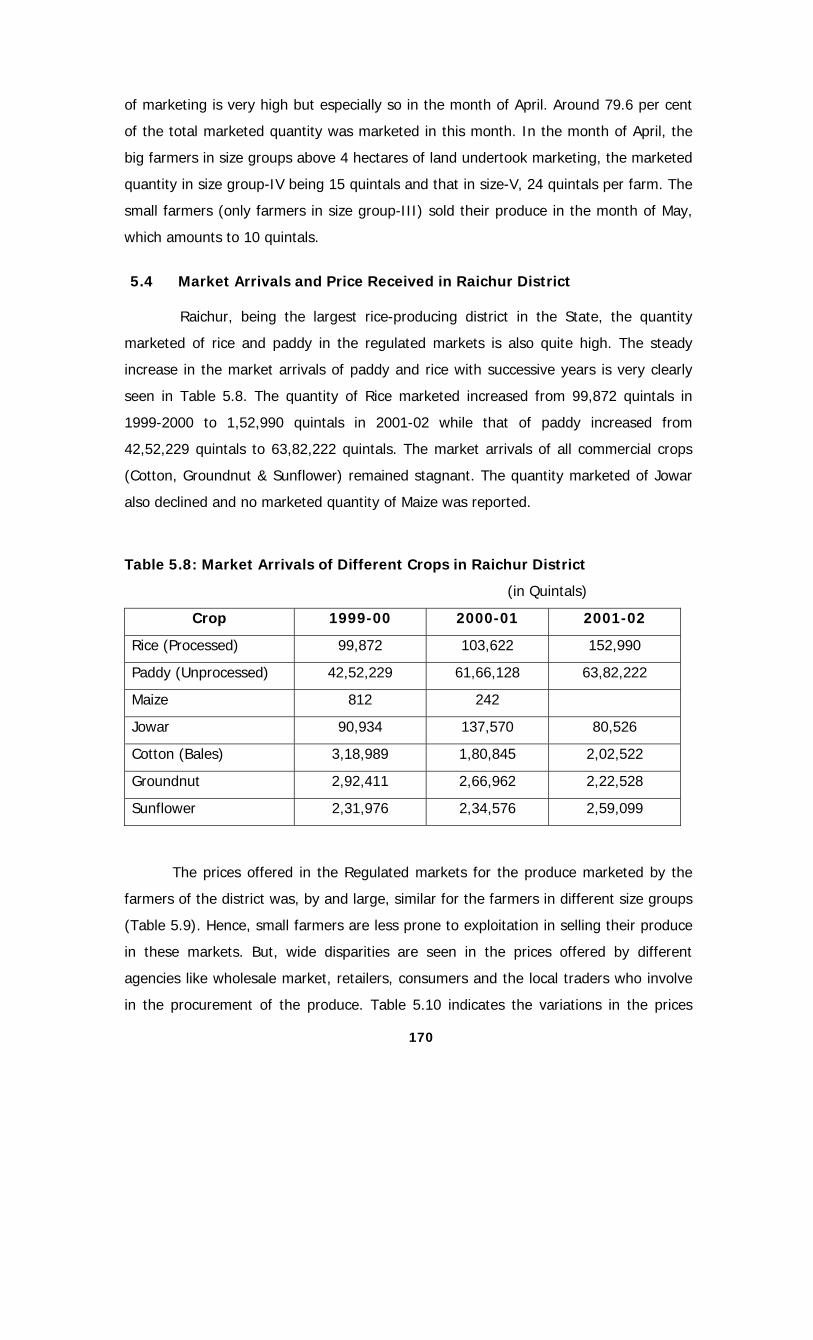
170
of marketing is very high but especially so in the month of April. Around 79.6 per cent
of the total marketed quantity was marketed in this month. In the month of April, the
big farmers in size groups above 4 hectares of land undertook marketing, the marketed
quantity in size group-IV being 15 quintals and that in size-V, 24 quintals per farm. The
small farmers (only farmers in size group-III) sold their produce in the month of May,
which amounts to 10 quintals.
5.4 Market Arrivals and Price Received in Raichur District
Raichur, being the largest rice-producing district in the State, the quantity
marketed of rice and paddy in the regulated markets is also quite high. The steady
increase in the market arrivals of paddy and rice with successive years is very clearly
seen in Table 5.8. The quantity of Rice marketed increased from 99,872 quintals in
1999-2000 to 1,52,990 quintals in 2001-02 while that of paddy increased from
42,52,229 quintals to 63,82,222 quintals. The market arrivals of all commercial crops
(Cotton, Groundnut & Sunflower) remained stagnant. The quantity marketed of Jowar
also declined and no marketed quantity of Maize was reported.
Table 5.8: Market Arrivals of Different Crops in Raichur District
(in Quintals)
Crop 1999-00 2000-01 2001-02
Rice (Processed) 99,872 103,622 152,990
Paddy (Unprocessed) 42,52,229 61,66,128 63,82,222
Maize 812 242
Jowar 90,934 137,570 80,526
Cotton (Bales) 3,18,989 1,80,845 2,02,522
Groundnut 2,92,411 2,66,962 2,22,528
Sunflower 2,31,976 2,34,576 2,59,099
The prices offered in the Regulated markets for the produce marketed by the
farmers of the district was, by and large, similar for the farmers in different size groups
(Table 5.9). Hence, small farmers are less prone to exploitation in selling their produce
in these markets. But, wide disparities are seen in the prices offered by different
agencies like wholesale market, retailers, consumers and the local traders who involve
in the procurement of the produce. Table 5.10 indicates the variations in the prices
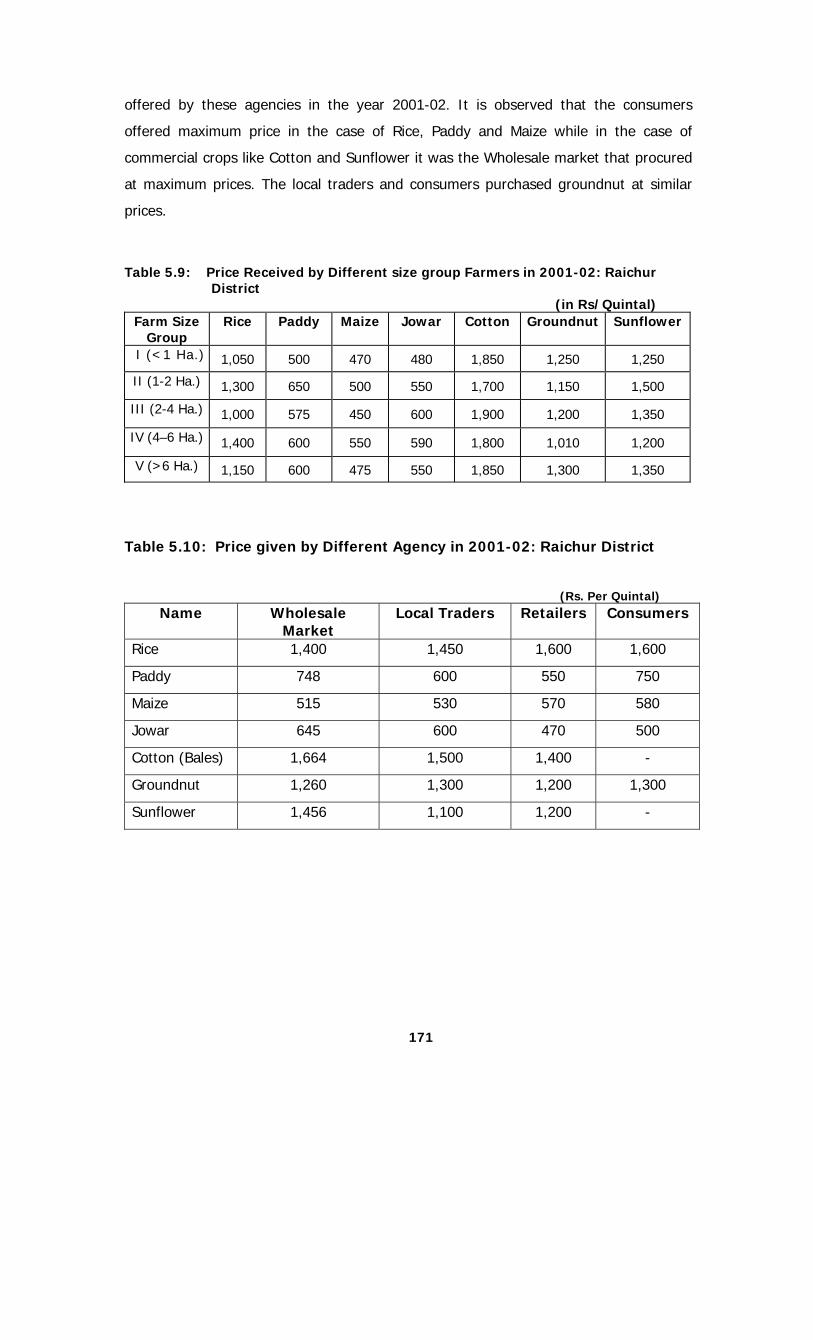
171
offered by these agencies in the year 2001-02. It is observed that the consumers
offered maximum price in the case of Rice, Paddy and Maize while in the case of
commercial crops like Cotton and Sunflower it was the Wholesale market that procured
at maximum prices. The local traders and consumers purchased groundnut at similar
prices.
Table 5.9: Price Received by Different size group Farmers in 2001-02: Raichur
District (in Rs/Quintal)
Farm Size Group
Rice Paddy Maize Jowar Cotton Groundnut Sunflower
I (<1 Ha.) 1,050 500 470 480 1,850 1,250 1,250
II (1-2 Ha.) 1,300 650 500 550 1,700 1,150 1,500
III (2-4 Ha.) 1,000 575 450 600 1,900 1,200 1,350
IV (4–6 Ha.) 1,400 600 550 590 1,800 1,010 1,200
V (>6 Ha.) 1,150 600 475 550 1,850 1,300 1,350
Table 5.10: Price given by Different Agency in 2001-02: Raichur District
(Rs. Per Quintal) Name Wholesale
Market Local Traders Retailers Consumers
Rice 1,400 1,450 1,600 1,600
Paddy 748 600 550 750
Maize 515 530 570 580
Jowar 645 600 470 500
Cotton (Bales) 1,664 1,500 1,400 -
Groundnut 1,260 1,300 1,200 1,300
Sunflower 1,456 1,100 1,200 -

172
Table 5.11: Price of Different Commodities in Various Years - Raichur District
(Rs. Per Quintal, Modal Rate) Crop 1997-98 1998-99 1999-00 2000-01 2001-02
Rice 1,150 1,300 1,350 1,400 1,450
Paddy 520 600 569 515 748
Maize 430 420 612 515 -
Jowar 515 881 650 445 645
Cotton (Bales) 2,059 1,939 1,769 1,765 1,664
Groundnut 1,160 1,239 1,250 1,239 1,260
Sunflower 1,140 1,275 1,220 1,140 1,456
Table 5.12: Price in Different Months of sale in 2001-02: Raichur District
(Rs.Per Quintal, Modal Rate) Crop Nov
2001 Dec 2001
Jan 2002
Feb 2002
Mar 2002
April 2001
May 2001
June 2001
July 2001
Aug 2001
Sept 2001
Oct 2001
Rice 850 850 760 850 830 960 950 1,000 940 950 900 900
Paddy 627 720 786 792 693 590 612 675 601 766 681 695
Maize 515 530 - - - - - - - - - -
Jowar 505 596 625 573 645 481 479 488 557 587 565 536
Cotton
(Bales)
1,619 1,869 1,876 1,564 1,534 1,725 1,819 1,869 1,759 1,925 1,965 1,796
Groundnut 1,260 1,228 1,183 1,276 1,385 1,188 1,520 1,434 1,331 1,281 1,165 1,127
Sunflower 1,595 1,439 1,441 1,465 1,409 1,159 1,169 1,369 1,129 1,201 1,550 1,489
Note: Modal price for Rice – April-Oct 2001; Modal price for Paddy – Dec2001-Feb2002; Modal price for Jowar – Jan & Mar 2002; Modal price for Cotton – Aug-Sept 2001; Modal price for Groundnut – May & June 2001; Modal price for Sunflower – Sept-Nov 2001.
5.5 Transportation of Marketed Surplus As mentioned earlier, a sizeable amount of marketable surplus is
marketed in the village itself, but some portion reaches the market. Two major
means of transport used by farmers to transport their produce of paddy to market yards
are Lorry and Tractors. For the sample as a whole, the Lorries accounted for 88.3 per cent
of the paddy transport and only 11.67 per cent was transported through tractor trolleys.

173
Table 5.13: Percentage Share of Paddy Transported by Different Modes of Transport in Raichur District Mode of Transportation
Farm Size Group Lorry Tractor Total I (<1Ha.) 84.78 15.22 100.00
II (1-2 Ha.) 86.05 13.95 100.00 III (2-4 Ha.) 95.83 4.17 100.00 IV (4-6 Ha.) 100.00 0.00 100.00 V (>6 Ha.) 100.00 0.00 100.00
Weighted Average 88.33 11.67 100.00
It can be seen from the Table above that the use of Lorry for transportation of
paddy increased with farm size. It can also be seen that farm sizes above 4 hectares
transported almost their entire marketable produce through Lorries, whereas in smaller size
farms around 89 per cent on an average was transported through Lorries. Thus, it is seen
that the use of Lorries was predominant in all size groups. The transport of rest of the
produce was done using tractor trolleys. Only small farmers used a tractor for transporting
the produce to the market that was clearly visible with the decrease in the use of tractors
with subsequent farm sizes (from 15.22 per cent in Size-I to 4.17 per cent in Size-III).
Table 5.14: Marketing Charges for Sale of Paddy to Private traders Borne by Farmers in Raichur District
(Rs. Per quintal of paddy)
Farm Size Group Transport Charges
Loading & Unloading
Gunny bags Total
I (<1Ha.) 0.52 0.11 0.64 1.27II (1-2 Ha.) 0.58 0.12 0.79 1.43III (2-4 Ha.) 0.41 0.05 0.46 0.92
IV (4-6 Ha.) 0.00 0.00 0.00 0.00V (>6 Ha.) 0.00 0.00 0.00 0.00
Weighted Average 0.13 0.02 0.17 0.33
Marketing charges in Karnataka are fixed by the Agricultural Produce Market
Committees for each of the commodities. The APMC Act provides only the upper limit and
the Regulated Market Committees are given freedom to fix the marketing rates. The
average expenses borne by the farmer in marketing per quintal of paddy is 33 paise, of
which 13 paise is towards the transport charges, 2 paise for loading and unloading and 17
paise for the gunny bags. The farmers in the higher size groups reported none of these
charges and the purchaser as a favour to the farmer usually met these. Only farmers in
Size groups-I, II & III bore these marketing charges. The marketing charge in farm size-II
was Rs.1.43, which was slightly higher than that for the other two groups (Rs.1.21 for size
group-I and Rs.0.92 for size group-III).

174
Table 5.15: Mode of Transport and Marketing Charges for Sale of Jowar to Private Traders in Raichur District
Mode of Transport
Marketing Charges (Rs. Per Quintal of Jowar)
Farm Size Group
Tractor (No. of Qtls.)
Transport Charges
Loading& Unloading Gunny bags Total
I (<1Ha.) 0 0 0 0 0 II (1-2 Ha.) 0 0 0 0 0 III (2-4 Ha.) 1 3.33 0.83 6.25 10.42 IV (4-6Ha.) 1 17.33 4.27 32.00 53.60 V (>6 Ha.) 0 0.00 0.00 0.00 0.00 Weighted Average
2 (total) 4.36 1.08 8.10 13.54
Jowar being an inferior cereal in the hierarchy of the marketed crops, tractor
trolleys were the only means used for transporting Jowar to the markets and the quantity
transported through tractors was about 2 quintals per farm for the whole sample. This
phenomenon was confined to farms with size 2-6 hectares. The average marketing charges
borne by the farmers in the sample added up to Rs.13.54, the composition being Rs.4.36
for transport charges, Rs.1.08 for loading and unloading and Rs.8.10 for gunny bags. It is
observed that the marketing charges borne by farmers in size class-IV were much higher
than that in size class-III. In farm size-III the total charge was Rs.10.42 while in farm size-
IV it was Rs.53.60, that is, five times of that in III. It is not surprising that Jowar had
higher marketing charges compared to Paddy/rice. This was due to the very reason that
usually the purchasers of jowar were largely the ultimate consumers, buying it in bulk. But,
in the case of paddy, the purchasers were usually traders/ processors/ agents (not
commission agents as defined in the APMC Act).
Table 5.16: Mode of Transport and Marketing Charges for Sale of Sunflower to
Private Traders in Raichur District Mode of
Transport 4 Marketing Charges
(Rs. Per Quintal of Sunflower) Farm Size
Group Tractor
(No. of Qtls.) Transport Charges
Loading& Unloading Gunny bags Total
I (<1Ha.) 0 0 0 0 0 II (1-2 Ha.) 0 0 0 0 0 III (2-4 Ha.) 1 0.83 0.17 1.00 2.00 IV (4-6Ha.) 1 10.67 2.22 16.00 28.89 V (>6 Ha.) 1 2.71 0.67 4.69 8.06 Weighted Average
3 (total) 0.82 0.18 1.23 2.24
175
Most of the Sunflower produced goes to market yard for the purpose of sale.
Always tractor trolleys are used to transport sunflower to market yard. The amount taken
to the markets through tractors is 3 quintals, the three big farm sizes equally contributing
to it. The average transport charges are 82 paise, 18 paise for landing and unloading. The
cost of gunny bags is Rs.1.23 and thus the average cost of marketing for all farm sizes
comes to Rs.2.24. Among the three bigger farm sizes farmers with 4-6 hectares (ie., in size
group-IV) incurred a cost much higher than the farmers in other two size groups. The total
cost in size class- IV is Rs.28.89 while it was only Rs.2 in Size Class-III and Rs.8 in size
class-V.
5.6 Farmers’ Responses about Marketing
We obtained the responses of the farmers about various constraints and the present
status of marketing in the state. The responses included their difficulties in marketing,
weighments, and market charges. We also obtained information about the channels
through which they obtained the price and marketing information. The relationship of the
farmers with the commission agents and other market functionaries formed part of this
analysis.
Table 5.17 summarises the farmers’ responses regarding difficulties faced by them in
marketing their produce to different traders-private traders, village traders, local market
and the wholesale market. It is important to note that the small farmers, in general, were
very much prone to most of the difficulties compared to large farmers. Mostly the farmers
preferred the sale at the village and, the distance of the market was a problem. Regarding
the problems faced in selling their produce to private traders, it is noted that 76 out of 120
farmers stated that the price paid for their produce was lower. Among them, an
overwhelming majority of 72 belonged to the size groups operating with less than 4
hectares of land. About 115 out of 120 farmers reported delayed payment for their
produce marketed to private traders. Farmers in almost all the categories faced this
problem alike. Seventy-two out of 120 farmers told that they were paid lower prices for
the produce they sold to village traders. Again, a majority who faced this problem
belonged to the groups with farm size lower than 4 hectares of land except for 2 in the
higher size groups. Eleven reported of a difference in the weights. Except one in the larger
size groups, all the farmers who faced this problem came from the first three size-groups
having land holdings below4 hectares. The farmers who were not interested to sell their

176
Table 5.17: Farmers’ Responses on the Difficulties in Marketing Their Produce to
Private& Village traders, Local Market and Wholesale Market in Raichur District
(No. of Farmers) Farm Size Groups
Particulars
I (<1Ha.)
II (1-2 Ha.)
III (2-4 Ha.)
IV (4-6 Ha.)
V (>6 Ha.) Total
1.No. of Sample Farmers 46 43 24 3 4 1202.Difficulties Faced from Private traders a) Low Price 31 24 17 2 2 76 b) Payment Delayed 45 39 24 3 4 1153.Difficulties Faced from Village Traders a) Low Price 31 27 12 - 2 72 b) Difference in Weighment 4 3 3 - 1 11 c) Not Interested 3 8 3 2 1 17 d) Delay in Payment 5 2 4 - - 8 e) Low Price/Delay in
Payment - 1 1 1 - 3 f) Low Price & Difference in
Weighment - - 1 - - 1 g) No Village Trader 3 2 - - - 54.Difficulties Faced in Local Markets a) Not Interested 2 2 4 - 1 9 b) No Local Market 44 41 20 3 3 1115.Difficulties in Wholesale
Market a) Long Distance 19 15 5 2 1 42 b) High Transport Cost 14 19 13 1 2 49 c) Market Fee 1 - - - - 1 d) Not Interested 1 2 2 - - 5 e) Transport Cost & Market
Fee 2 1 - - - 3 f ) Transport Cost/
Loading/Unloading Charges 1 1 1 - 1 4
g) Delay in Payment 5 3 3 - - 11 h) Low Price 1 1 - - - 2 i) No Proper Weighment 2 1 - - - 3
produce to village traders were only 17 in number. That indicates the predominance of
sale within the village. These farmers were spread over all size groups. Eight farmers
faced delay in the payment by village traders, and these were located among the smaller
size groups. The number of farmers who were not interested to sell in local markets were
9 and the rest 111 farmers said there were no local (regulated) markets. As regards
marketing in the wholesale market were concerned, 42 out of 120 farmers said that the

177
markets were at long distances. About 46 farmers belonging to smaller size groups stated
that the transport costs were high. These may be those farmers who hired vehicles for
transport of their produce. Only 1 farmer operating less than 1 hectare of land said that
the market fee was high in the wholesale market. Three farmers reported high transport
cost and market fees. On the whole, it was the small farmers, operating less than 4
hectares of land, and did not own the necessary infrastructure needed for marketing their
produce, who faced most of the problems.
Farmers stating problems with the marketing of their produce were largely confined
to the smaller groups operating less than 4 hectares of land (Table 5.18(a)). Three
farmers complained of high rate of transport. Only nine farmers reported that transport
was easily available and there was timely loading and unloading. The rest 111 expressed
difficulties in availing transport and were dissatisfied with the loading and unloading
facilities. Small farmers who had to resort to hiring basically related all these problems to
the lack of ownership of resources. Regarding problems about the facilities in the market
yards, only 7 farmers reported that there was enough space for exhibiting their produce
and parking their carts. These farmers mostly belonged to the smaller size groups and
Table 5.18 (a): Farmers’ Responses regarding Problems in Marketing, Market Yard, Weighment and Payment in Raichur District
(No. of Farmers) Particulars I
(<1Ha.)II
(1-2 Ha.)III
(2-4 Ha.) IV
(4-6 Ha.) V
(>6 Ha.)Total
1.No. of Sample Farmers 46 43 24 3 4 1202.Problems with Marketing a)High Rate of Transport 2 1 0 0 0 3 b)Easy Availability of Transport 3 5 1 0 0 9 c)Timely Loading/Unloading 3 5 1 0 0 93.Problems with Market yard a)Enough Space 3 3 1 0 0 7 b)Enough Parking Place 3 3 1 0 0 7 c)Enough Staying Arrangements
0 0 0 0 0 0

178
Table 5.18 (b): Farmers’ Responses regarding Problems in Weight and Payment in Raichur District
(No. of Farmers) Farm Size Groups Particulars
I (<1Ha.)
II (1-2 Ha.)
III (2-4 Ha.)
IV (4-6 Ha.)
V (>6 Ha.)
Total
1.Weighment Problems a)Timely Weighment 43 42 24 3 4 116 b)Arbitrary Reduction from
Weight for Lower Quality 5 7 4 0 0 16
c)Reduction in Price due to Lower Quality
13 7 2 0 0 22
2.Payment Problems
a)Immediately after Weighment
1 5 0 0 0 6
b)After one Week 9 7 7 1 1 25 c)After Two Weeks 19 19 9 2 2 51 d)After Three Weeks 2 3 3 0 0 8 e)After a Month 15 9 5 0 1 30
farmers in larger size groups were not satisfied with these arrangements. While no farmers
conveyed that adequate staying arrangements have been made for over-night stay and sell
their produce the next day. Hence, the facilities in market yards were the major
constraints. On the issue of weights of the produce, out of the total sample of 120, 116
stated of a timely weighment of their produce (table 5.18(b). While 16 farmers (all in lower
size groups) indicated of an arbitrary reduction from weight for lower quality of their
produce the others either did not follow the process or did not face such difficulty. Small
farmers owing to lower quality of their produce mostly experienced reduction in weight and
price. In the context of payment, only six farmers confirmed that payment was made
immediately after weighing and these farmers were from the small size group. Twenty-five
farmers grumbled about the payment after a week’s time, 51 after two weeks, 8 after three
weeks and 30 farmers received the payments after a month.
Table 5.19: Number of Farmers Replying about Collusion between Purchaser and
Commission Agent in Raichur District (No. of Farmers)
Farm Size Group Collusion on I
(<1Ha.) II
(1-2 Ha.) III
(2-4 Ha.) IV
(4-6 Ha.) V
(>6 Ha.) Total
1.Price Fixation 36 33 19 3 2 932.Grading/Quality
of produce 40 37 20 3 0 100
3.Weighment 35 34 20 3 3 954.Payment 13 14 8 2 0 375.Bidding 9 7 5 2 0 23

179
Farmers in all size groups were very well aware of the collusion between their
Commission agents and the purchaser, which could greatly harm their interests. From the
sample group 93 out of 120 farmers thought that commission agents colluded in price
fixation. Most of the sample farmers (100) thought that collusion took place in grading of
their produce for quality variations. 95 farmers doubted complicity in weighment and 37
thought of the involvement in the payment made to them. 23 of the farmers were aware of
collusion on bidding of their produce. All these stood in the way of the farmer receiving a
justified price for his produce. Therefore, the farmers largely preferred to sell at the village
itself.
The price expectations were formed on the basis of the information received by the
farmers. These expectations also affected the area allocation, adoption of technology and
the intensity of input use. It is seen that a farmer received information about prices from
more than one source. Commission agents were the first source of information to 118
farmers. Apart from that they also received information from other sources, out of them,
99 farmers received information from their personal visit to the market place, 78 from the
neighbour and 9 from Radio/ T.V./Newspaper. This information was then transmitted into
decision-making criteria. The allocation of area, adoption of technology and input use were
Table 5.20: Number of Farmers Responding on the Channels of Price Signals and its
Effect on Cropping Pattern, Production and Marketing in Raichur District (No. of Farmers)
Particulars I (<1Ha.) II (1-2 Ha.)
III (2-4 Ha.)
IV (4-6 Ha.)
V (>6 Ha.)
Total
1.No. of Sample Farmers 46 43 24 3 4 1202.Channels of Price Signals a)Message Given by C.A. 45 43 23 3 4 118 b)Personal Visit 32 37 23 3 4 99 c)Radio/TV/Newspaper 6 1 1 1 0 9 d)Information from Neighbour 31 29 12 3 3 78 e)Local Trader 22 23 11 3 3 623.Effect of Price Signals a)Change in Area 11 20 11 3 3 48 b)Adoption of Improved
Technology 23 20 17 2 2 64
c)Intensive Input Use 34 35 22 3 2 96 d)Sale of Produce 17 11 8 1 3 40
taken based on this. Regarding the effect of price signals on the decision-making, only 48
of the farmers confirmed the impact on their cropping pattern, whereas 96 farmers
corroborated that price signals influenced their use of intensive inputs. Sixty-four farmers
substantiated the impact of price signals on the adoption of new technology and 40
attributed changes in marketing of their produce to these expectations.

180
Table 5.21: Channels of Receiving Information about Technical Change in
Raichur District (No. of Farmers) Channels Farm Size Groups
I (<1Ha.)
II (1-2 Ha.)
III (2-4 Ha.)
IV (4-6 Ha.)
V (>6 Ha.)
Total
1.Block Authorities 32 27 15 1 3 78 2.Village President 0 1 0 0 0 1 3.Neighbour 28 31 15 3 1 78 4.Input Marketing Agencies 40 39 23 3 4 109
Farmers had good access to the information on technical change as it was seen in
the sample that a farmer received information from multiple sources. The most important
source of information about technical change was provided by the Input Marketing
agencies. About 109 of the sample farmers received information from this source.
Neighbours and Block Development Authorities informed seventy-eight farmers about the
components of technical changes.
Table 5.22: Farmers’ Knowledge of Future Markets in Raichur District
(No. of farmers)
Farm Size Groups Particulars I
(<1Ha.) II
(1-2 Ha.)III
(2-4 Ha.) IV
(4-6 Ha.) V
(>6 Ha.) Total
1.No. of Sample Farmers 46 43 24 3 4 120 2.Farmers Having Knowledge of Future Markets
Yes 6 3 9 0 2 20 No 40 40 15 3 2 100 3.Is it Helpful Not Helpful 5 3 8 0 1 17 No Such Practice 1 0 1 0 1 3
Future markets have not emerged in the sample region. A majority of the farmers in
the sample region did not have any knowledge of the future market. Only 20 farmers
stated that they knew the future markets. Among the farmers who had knowledge, 17
farmers said that it was not helpful to them in any way and 3 stated that they had no
practice of using this knowledge in their marketing decisions.

181
Table 5.23: Farmers' Reply on Taking Recourse to Distress Sale in Raichur
district (No. of Farmers)
Farm Size Groups I
(<1Ha.)II
(1-2 Ha.)III
(2-4 Ha.)IV
(4-6 Ha.) V
(>6 Ha.)Total
1.No. of Sample Farmers 46 43 24 3 4 120 2.Farmers Taking Recourse
to Distress Sale
Yes 4 2 1 0 0 7 No 42 41 23 3 4 113 3.Reasons for Taking
Recourse to Distress Sale
a) Financial Problem 3 2 1 0 0 6 b) Low Quality 1 0 0 0 0 1
Any climatically constrained region has distress sale as a mechanism operating to
alleviate the cash crunch. Raichur is not an exception. Out of the sample farmers seven
farmers replied in affirmative, on taking recourse to distress sale and these farmers had
been mostly in the smaller three size groups. The sole reason for distress sale of their
produce had been the urgent need for money except for one case who resorted to sale due
to low quality.
Table 5.24: Farmers’ Opinion on Institutional Credit and Pledge Financing in Raichur
District (No. of farmers)
Farm Size Groups Particulars
I (<1Ha.)
II (1-2 Ha.)
III (2-4 Ha.)
IV (4-6 Ha.)
V (>6 Ha.)
Total
1.No. of Sample Farmers 46 43 24 3 4 1202.Has the Sale been Delayed with
the Availability of Institutional Credit
Yes 24 26 13 2 0 65 No 22 17 11 1 4 553.If yes, by How Many Months a)Two Months 2 0 1 0 0 3 b)Three Months 9 6 2 1 0 18 c)Four Months 6 5 2 0 0 13 d)Above Four Months 5 6 6 1 0 184.Desire to Avail Pledge Financing Yes 19 18 9 2 0 48 No 27 25 15 1 4 725.If yes, What Would be the
Reasonable Rate of Interest
a)2% 9 9 5 2 0 25 b)3% 10 9 4 0 0 23

182
Institutional credit is one of the major determinants of the marketing behaviour of
the farmers. We have noted that 65 out of 120 farmers delaying the sales of their produce
due to the non-availability of institutional credit (Table 5.24). These farmers were spread
across the size groups I to IV. Of these 65, 35 farmers replied that the delay had been
between 2-4 months, while 18 farmers replied a delay of above four months. On the
question of availing the facility of pledge financing, 48 of the sample farmers favoured the
suggestion and 72 rejected it. Among farmers willing to avail this facility, 37 were in farm
sizes less than 2 hectares. Hence, it is the relatively smaller size group of farmers who may
opt to go in for pledge financing.
Regarding influence of price increase on area allocation and input use, 61 farmers
in all size classes replied an increase in area allocation (See Tables 5.25 and 5.26) and 76
farmers stated an increase in input use. The share of farmers stating an increase in area
allocation and input use had been higher in higher farm size groups. In the case of area
allocation the per cent of farmers stating an increase in area rose from 44.65 per cent in
the smallest size class to 62.50 per cent in the Size class-III and 75 per cent in size class-
V. Among the large farm category, all the farmers said that the price increase led to an
increase in area allocation. The per cent of farmers stating an increase in input use also
increased with farm size from 58.70 per cent in size group-I to 100 per cent in size
groups-IV and V. Concerning the influence of technical changes on area allocation and
input use, 59 farmers felt the effect of an increase in area allocation and 73 farmers of an
increase in input use. The per cent of farmers in each size group stating an increase in
area allocation fluctuated widely with the size groups. It ranged between 41.9 per cent
and 100 per cent among the size groups, while the per cent of farmers stating an increase
in input use showed a direct increase from 54.35 per cent in size group-I to 100 per cent
in size groups IV and V.
5.6 Conclusions
Raichur is a typical drought - prone district of Deccan Plateau falling in Karnataka.
The climatic constraints and frequent visitation of droughts, made the farmers risk averse.
In the recent past and specifically in the decades of eighties and nineties, the cropping
pattern of the district was leaning towards commercialisation. But, here, the
commercialisation is of a different kind with a clear preference towards cash crops. There
is a clear emergence of marketable surplus in the food-grains sector but largely marketing

183
takes place in the village. The Commission Agent here usually visits the village to buy the
commodities, and therefore, only some portion of the produce reaches the regulated
market. Only one channel of marketing functions for the food-grain crops whereas, there
are a few channels for commercial crops like oil-seeds. Added to this, the marketing
infrastructure is not well developed which also acts as a strong repellent for the surplus to
reach the market. The farmers indicated the significant inadequacies in the marketing
structure. The questions of ‘J’ form (no such forms are given under APMC Act of
Karnataka) or the marketing charges do not arise at all as the market participation is quite
inadequate. There is no procurement under MSP both due to the administrative
inadequacies and the infrastructure. Even though the price expectations influence the
cropping pattern, adoption of technology and input use, this largely happens in the cash
crop sector. As it is, the farmers do not cultivate more than one variety of rice, and that is
the one used locally for consumption. Therefore, the differential markets have not
developed for the varieties of crops. Rather the markets are developing initially in a
generalised manner and may further mature for any specific varieties that will be adopted
by the farmers. This has happened in the case of arecanut, sericulture, horticultural crops
and some of the oil-seeds. In conclusion, we must mention here that the markets in
Raichur district are still in the phase of development and will require some time to come
up to the level of markets in the states like Punjab, Haryana, Andhra Pradesh and Tamil
Nadu

184
Table 5.25: Farmers' Responses about the Influence of Price Increase on Area Allocation and Input Use in Raichur District
Price increase
Area Allocation Input Use Farm Size
Group Increase % to
Total Remaining Same
% to Total
Increase % to Total
Remaining Same
% to Total
% of Farmers stating an Increase in Area Allocation
% of Farmers stating an Increase in Input Use
I (<1Ha.) 21 34.43 25 42.37 27 35.53 19 43.18 45.65 58.70 II (1-2 Ha.) 19 31.15 24 40.68 24 31.58 19 43.18 44.19 55.81 III (2-4 Ha.) 15 24.59 9 15.25 18 23.68 6 13.64 62.50 75.00 IV (4-6 Ha.) 3 4.92 0 0.00 3 3.95 0 0.00 100.00 100.00 V (>6 Ha.) 3 4.92 1 1.69 4 5.26 0 0.00 75.00 100.00
Total 61 100.0 59 100.0 76 100.0 44 100.0 50.83 63.33
Table 5.26: Farmers’ Responses about the Influence of Technical Change on Area Allocation and Input Use in Raichur District
Technical Change
Area Allocation Input Use Farm Size
Group Increase % to
Total Remaining Same
% to Total
Increase % to Total
Remaining Same
% to Total
% of Farmers stating an Increase in Area Allocation
% of Farmers stating an Increase in Input Use
I (<1Ha.) 21 35.59 25 40.98 25 34.25 21 44.68 45.65 54.35 II (1-2 Ha.) 18 30.51 25 40.98 24 32.88 19 40.43 41.86 55.81 III (2-4 Ha.) 14 23.73 10 16.39 17 23.29 7 14.89 58.33 70.83 IV (4-6 Ha.) 3 5.08 0 0.00 3 4.11 0 0.00 100.00 100.00 V (>6 Ha.) 3 5.08 1 1.64 4 5.48 0 0.00 75.00 100.00
Total 59 100.0 61 100.0 73 100.00 47 100.0 49.17 60.83

CHAPTER VI
MARKETING IN DAVANGERE DISTRICT 6.1 Introduction The district of Davangere was a part of Chitradurga district till recently. It was carved
out of Chitradurga but mostly retained the basic economic characteristics of the mother
district. Davangere is called Manchester of Karnataka, with its large textile-manufacturing
sector. Over the years the textile sector has vanished to give way to other commercial
activities. A good number of commercial crops are grown in the district beginning with food-
grains like paddy, wheat, and jowar to oil-seeds, sugarcane and sericulture. Largely, the
emphasis is on cash crops like sugarcane, sericulture and coconut. Marketing activities have
developed accordingly favouring markets for these crops. The constraints on the agricultural
economy are quite strong in terms of unfavourable climate and underdeveloped infrastructure.
The marketing activity is still concentrated on informal channels and organised marketing is
not preferred.
This chapter is based on the micro level data of the households and the other
marketing functionaries. As the marketing infrastructure is not well developed in the state,
the data from the Commission agents were not of any use. The connotation of the
‘Commission Agent’ itself is different in Karnataka. The person representing the trader
‘Adtya’ comes to the village and purchases the grain, which has to be delivered at a
specified place. This person receives his wages from the trader and also some money from
the farmer. The Commission agents operate at a very low key and mostly procure from
the individual farmers at the farm itself. We have analysed here the production, quantity
marketed and seasonality of quantity marketed. Transportation of the produce,
expenditure on transportation and the marketing process also form part of our analysis.
There was no direct sale to the millers and therefore, the intricacies of this sale could not
be investigated. The rice mills are very few and most of the millers from different districts
procure from the market directly. Similarly, the presence of commission agents is most
illusive and no information was available on this aspect. Farmers’ opinion about the
marketing structure and bottlenecks forms an important part of this chapter.

6.2 Production and Marketing of Crops in Davangere Paddy is also an important crop in Davangere district. Largely ‘Sona Masoori’ or
‘Jaya’ variety of paddy is grown and the preference is for those used largely for home
consumption. The data on marketed surplus and utilisation of paddy output per farm for
different purposes by farm size groups are presented in Table 6.1. A perusal of the table
indicates that leaving a minimum amount of 22 per cent, on an average, for consumption
purposes the rest of the paddy was completely marketed. The marketed surplus as well as
the quantity retained for consumption shows an increasing trend with increase in the farm
size with an exception of the farmers holding land below 1 hectare. These sample farmers
did not cultivate paddy and hence there was no production. The quantity consumed
increased from 9.11 quintals in Size-group-II to 20 quintals in Size-group-V, whereas the
increase in quantity marketed showed a wider range, starting from 27 quintals in Size-
group-II to 40 quintals in Size-group-IV and 260 quintals in Size-group-V. The percentage
of quantity marketed to production also shows an increasing trend with the increase in
farm sizes, but in the size-group-IV where a decrease was noticed. It increased from 72.22
per cent in Size group-II to 90 per cent in Size group-III and went down to 66.67 per cent
in Size-IV. In Size-V the percentage was again as high as 92.86 percent. Overall the major
proportion of the quantity produced of paddy was marketed.
Table 6.1: Production and Quantity Marketed Per Farm of Paddy in Davangere District
(in Quintals) Farm Size
Group Production Home
Consumption Quantity Marketed
Percentage of Quantity Marketed to
Production I (<1Ha.) 0.00 0.00 0.00 0.00
II (1-2 Ha.) 36.11 9.11 27 72.22 III (2-4 Ha.) 40 4 36 90.00 IV (4-6 Ha.) 60 20 40 66.67 V (>6 Ha.) 280 20 260 92.86 Weighted Average
54.0 1.20 43.20 77.78
Table 6.2: Production and Quantity Marketed Per Farm of Maize in Davangere District (In quintals) Farm Size Group
Production Home Consumption
Animal Feed
Quantity Marketed
Percentage of Quantity Marketed to Production
I (<1Ha.) 17.31 0 1.08 16.23 62.96 II (1-2 Ha.) 24.38 0 2.99 21.39 87.50 III (2-4 Ha.) 51.03 0 4.18 46.85 92.16 IV (4-6 Ha.) 68 0 7.5 60.5 89.17 V (>6 Ha.) 60 0 0.00 60 100.00 Weighted Average
25.80 0 1.80 23.98 92.31

The district of Davangere is known for its production and marketing of maize. Table
6.2 shows the production of Maize and its utilisation patterns. A direct indication from the
table is that no part of the produce of Maize was retained for home consumption or seeds
by any of the size groups. An average amount of 1.80 quintals was used as feed, which
was 6.97 per cent of the total produce. The quantity used as feed increased from 1.08
quintals in Size-group I to 7.5 quintals in Size-group IV. In Size-group V, the entire quantity
produced was marketed. The quantities marketed also show a consistent increase with
farm sizes. It was 16.23 quintals in Size-group I and increased to 21.39 quintals in Size-
group II, 46.85 quintals in Size-group III, 60.5 quintals in Size-group IV and 60 quintals in
Size-group V. But, the marketed quantity when viewed in relative terms, that is, as per cent
of the total quantity produced a decline was observed in Size-group IV. The per cent
increased from 62.96 per cent in Size-group I to 92.16 percent in Size-group III; whereas
in Size-group IV it declines to 89.71 per cent and in Size-group V the share increased to
100 per cent of the produce being marketed. On an average, the share of marketed surplus
was 92.31 of the total quantity produced for the sample as a whole.
The production, utilisation patterns and the per cent of quantity marketed of Jowar in
Davangere district is shown in Table 6.3. The marketed surpluses here arise after making
provisions for both home consumption and animal feed. It is very clearly seen from the table
that a major portion of the produce of Jowar was used for home consumption, while the
quantity marketed was only a small portion.
Table 6.3: Production and Quantity Marketed Per Farm of Jowar in Davangere District
(In Quintals)
Farm Size Group
Production Home Consumption
Animal Feed
Quantity Marketed
Percentage of Quantity Marketed to
Production I (<1Ha.) 4.05 4.05 0 0 0.00
II (1-2 Ha.) 6.9 5.9 0 1 14.29 III (2-4 Ha.) 9.03 6.02 0.98 2.03 22.22 IV (4-6 Ha.) 10 9 1 0 0.00 V (>6 Ha.) 20 5 0 15 75.00 Weighted Average
6 4.80 0 1.20 16.67
About 80 per cent of the produce of all the farmers in the sample was utilised for home
consumption. It increased steadily with farm sizes and ranged from 4.05 quintals in Size-
group I to 10 quintals in Size-group V. In Size-group I, the entire produce was retained for
home consumption. Only farmers in Size-group III and IV retained their produce to be
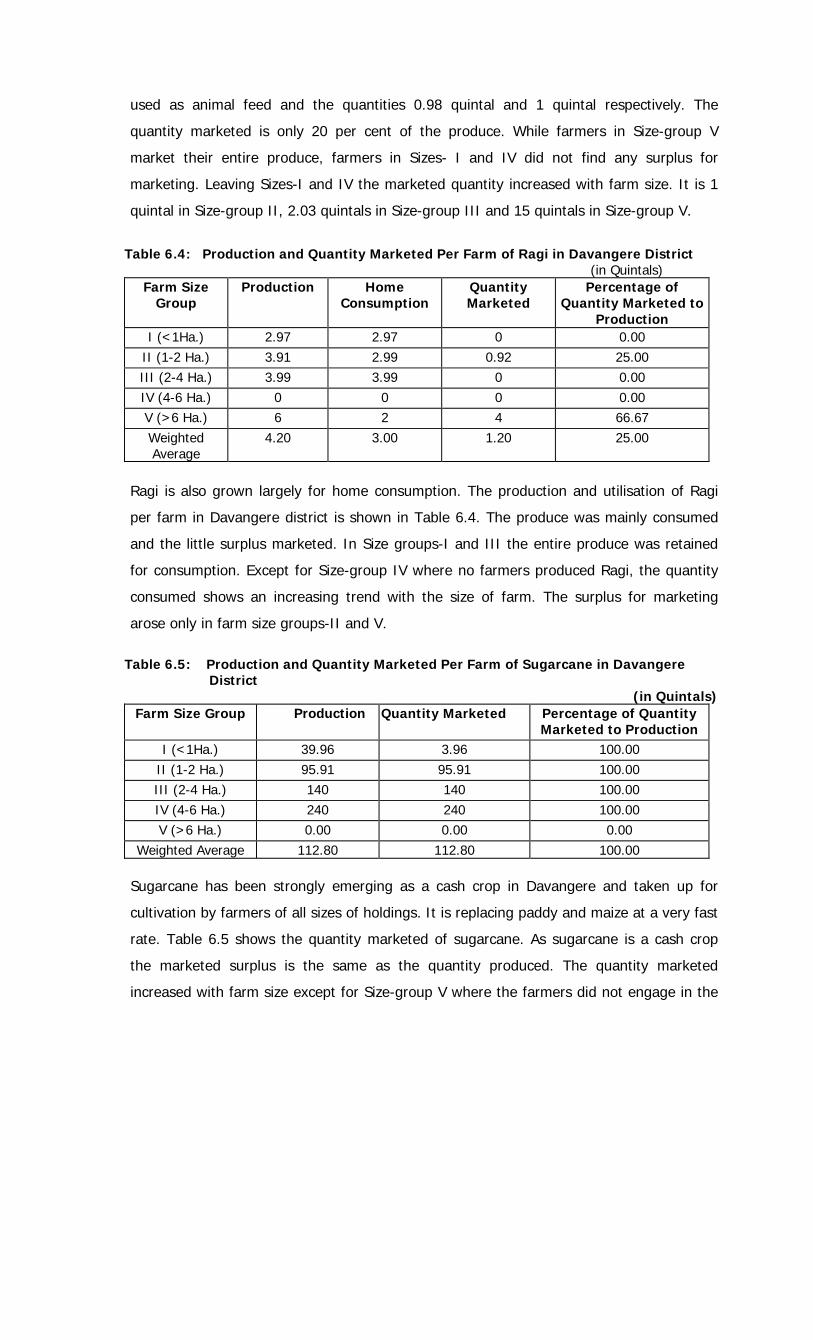
used as animal feed and the quantities 0.98 quintal and 1 quintal respectively. The
quantity marketed is only 20 per cent of the produce. While farmers in Size-group V
market their entire produce, farmers in Sizes- I and IV did not find any surplus for
marketing. Leaving Sizes-I and IV the marketed quantity increased with farm size. It is 1
quintal in Size-group II, 2.03 quintals in Size-group III and 15 quintals in Size-group V.
Table 6.4: Production and Quantity Marketed Per Farm of Ragi in Davangere District (in Quintals)
Farm Size Group
Production Home Consumption
Quantity Marketed
Percentage of Quantity Marketed to
Production I (<1Ha.) 2.97 2.97 0 0.00
II (1-2 Ha.) 3.91 2.99 0.92 25.00 III (2-4 Ha.) 3.99 3.99 0 0.00 IV (4-6 Ha.) 0 0 0 0.00 V (>6 Ha.) 6 2 4 66.67 Weighted Average
4.20 3.00 1.20 25.00
Ragi is also grown largely for home consumption. The production and utilisation of Ragi
per farm in Davangere district is shown in Table 6.4. The produce was mainly consumed
and the little surplus marketed. In Size groups-I and III the entire produce was retained
for consumption. Except for Size-group IV where no farmers produced Ragi, the quantity
consumed shows an increasing trend with the size of farm. The surplus for marketing
arose only in farm size groups-II and V.
Table 6.5: Production and Quantity Marketed Per Farm of Sugarcane in Davangere
District (in Quintals)
Farm Size Group Production Quantity Marketed Percentage of Quantity Marketed to Production
I (<1Ha.) 39.96 3.96 100.00 II (1-2 Ha.) 95.91 95.91 100.00 III (2-4 Ha.) 140 140 100.00 IV (4-6 Ha.) 240 240 100.00 V (>6 Ha.) 0.00 0.00 0.00
Weighted Average 112.80 112.80 100.00 Sugarcane has been strongly emerging as a cash crop in Davangere and taken up for
cultivation by farmers of all sizes of holdings. It is replacing paddy and maize at a very fast
rate. Table 6.5 shows the quantity marketed of sugarcane. As sugarcane is a cash crop
the marketed surplus is the same as the quantity produced. The quantity marketed
increased with farm size except for Size-group V where the farmers did not engage in the

production of sugarcane. In Size-group I the quantity produced and marketed was 39.96
quintals, which increased to 95.91 quintals in Size-group II, 140 quintals in Size-group III
and 240 quintals in Size-group IV.
6.3 Seasonality in Marketing Davangere is a business centre and one can expect prudent marketing strategies in
the district. But probably crop husbandry is an exception and the farmers face resource,
cash and infrastructure as major constraints. That squeezes their marketing activities
around the harvest season. Lack of storage and development of market yards also act as
strong constraints. We are analyzing here the seasonality in marketing of crops in
Davangere district.
Table 6.6: Proportion of Quantity Marketed Per Farm of Paddy in Different Months by Size Groups in Davangere District
(in Quintals) Farm Size Group November December January Total
I (<1Ha.) 0 0 0 0 (per cent) 0.00 0.00 0.00 0.00
II (1-2 Ha.) 8 17 2 27 (per cent) 30.00 63.00 7.00 100.00
III (2-4 Ha.) 26 10 0 36 (per cent) 72.41 27.59 0.00 100.00
IV (4-6 Ha.) 15 25 0 40 (per cent) 37.50 62.50 0.00 100.00 V (>6 Ha.) 0 260 0 260 (per cent) 0.00 100.00 0.00 100.00
Weighted Average 12.00 30.00 1.20 43.20 (per cent) 27.91 69.77 2.32 100.00
The quantity of paddy marketed in different months in Davangere district is shown in
Table 6.6. The concentration of marketing was highest in the month of December with
69.77 per cent of the total marketed quantity being marketed in this month. The share of
various farm sizes in the produce marketed in this month indicated a wide range as
farmers in Size-group II marketed 63 per cent share while farmers in Size-group III
contributed only 27.59 per cent. In Size-group IV, 62.50 per cent of the output was
marketed in December and in Size-group V, the entire produce was marketed in this
month. The second important month for paddy marketing in Davangere was November.
About 28 per cent of the total marketing of paddy was undertaken in this month. Only
farmers in size groups-II, III and IV marketed their produce in this month. In the month
of January, the marketing activity in paddy was very low compared to other two months.

In this month 2.32 per cent of paddy was marketed and it was seen that only farmers in
smaller size groups opted for marketing in this month.
Table 6.7: Proportion of Quantity Marketed Per Farm of Maize in Different
Months by Size Groups in Davangere District (in Quintals)
Farm Size Group
November December January February Total
I (<1Ha.) 0.3 2.19 7.96 5.78 16.23 (Percent) 1.85 13.49 49.04 35.62 100
II (1-2 Ha.) 0 0.65 9.13 11.61 21.39 (Percent) 0 3.04 42.68 54.28 100
III (2-4 Ha.) 0 7.14 19.57 20.14 46.85 (Percent) 0 15.24 41.77 42.99 100
IV (4-6 Ha.) 0 0 15.5 45 60.5 (Percent) 0 0 25.62 74.38 100
V (>6 Ha.) 0 60 0 0 60 (Percent) 0 100 0 0 100
Weighted Average 0.13 3.07 9.88 10.9 23.98 (Percent) 0.54 12.8 41.21 45.45 100
Maize requires some time after the harvest to get ready for marketing. It is dried for
a few weeks and then sold. Therefore, maize marketing does not coincide with the
harvesting season. Table 6.7 shows the percentage share of different months in the total
quantity marketed of Maize. The important months for marketing of Maize in Davangere
district are January and February. The pressure of maize marketing was highest in the
month of February when farmers in all categories, except Size-group V, actively
participated in selling their produce. The farmers in Size-group I marketed 35.62 per cent
of their produce in this month, farmers in Size-group II sold 54.28 per cent of their
produce. About 43 per cent of the produce of the farmers in Size-group III and 74 per
cent in Size-group IV were sold in this month. In the month of January, the marketing
activity was relatively at low key. About 41 per cent of the average marketed quantity of
all farms was marketed in this month. The farmers in lower size groups sold their produce
even immediately after harvesting which is very clearly evident from the table. In
Decembe,r only 12.8 per cent of the total marketing was done. In this month, the farmers
in Size-group V marketed their entire produce along with smaller quantities marketed by
the small farmers.
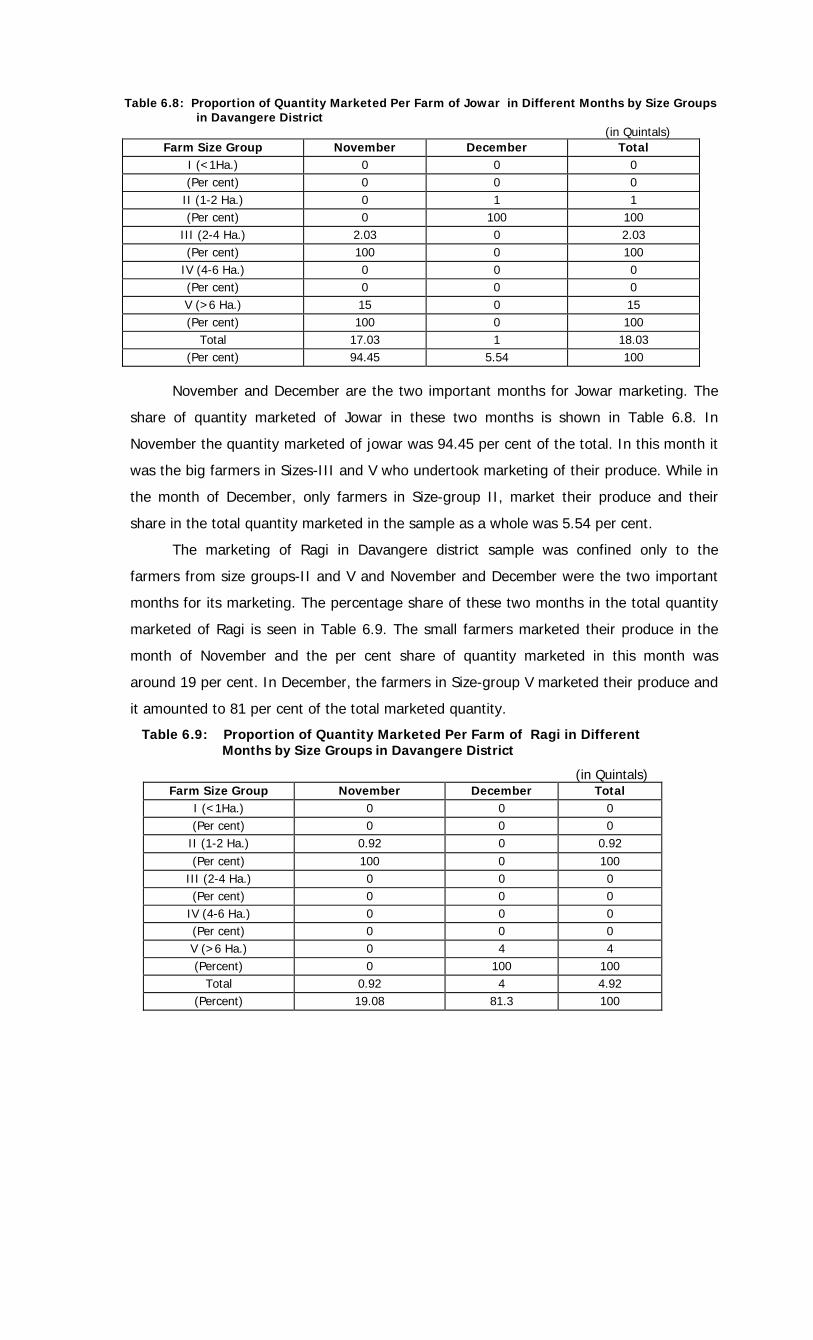
Table 6.8: Proportion of Quantity Marketed Per Farm of Jowar in Different Months by Size Groups in Davangere District
(in Quintals) Farm Size Group November December Total
I (<1Ha.) 0 0 0 (Per cent) 0 0 0
II (1-2 Ha.) 0 1 1 (Per cent) 0 100 100
III (2-4 Ha.) 2.03 0 2.03 (Per cent) 100 0 100
IV (4-6 Ha.) 0 0 0 (Per cent) 0 0 0 V (>6 Ha.) 15 0 15 (Per cent) 100 0 100
Total 17.03 1 18.03 (Per cent) 94.45 5.54 100
November and December are the two important months for Jowar marketing. The
share of quantity marketed of Jowar in these two months is shown in Table 6.8. In
November the quantity marketed of jowar was 94.45 per cent of the total. In this month it
was the big farmers in Sizes-III and V who undertook marketing of their produce. While in
the month of December, only farmers in Size-group II, market their produce and their
share in the total quantity marketed in the sample as a whole was 5.54 per cent.
The marketing of Ragi in Davangere district sample was confined only to the
farmers from size groups-II and V and November and December were the two important
months for its marketing. The percentage share of these two months in the total quantity
marketed of Ragi is seen in Table 6.9. The small farmers marketed their produce in the
month of November and the per cent share of quantity marketed in this month was
around 19 per cent. In December, the farmers in Size-group V marketed their produce and
it amounted to 81 per cent of the total marketed quantity.
Table 6.9: Proportion of Quantity Marketed Per Farm of Ragi in Different Months by Size Groups in Davangere District
(in Quintals) Farm Size Group November December Total
I (<1Ha.) 0 0 0 (Per cent) 0 0 0
II (1-2 Ha.) 0.92 0 0.92 (Per cent) 100 0 100
III (2-4 Ha.) 0 0 0 (Per cent) 0 0 0
IV (4-6 Ha.) 0 0 0 (Per cent) 0 0 0 V (>6 Ha.) 0 4 4 (Percent) 0 100 100
Total 0.92 4 4.92 (Percent) 19.08 81.3 100

6.4 Market Arrivals and Prices Received in Davangere District
Davangere District has the highest quantity of Maize marketed in regulated markets
among all the districts in the State. Rice, Paddy and Groundnut are some of the other
important crops that are marketed in large quantities in these markets. Table 6.10 shows the
market arrivals of different agricultural commodities in the district. The quantity marketed of
Rice and Paddy has been increasing steadily from 1999 to 2002, whereas, in the case of Maize
it stagnated in 2001-02 after an increase in the previous year. The market arrival of Jowar
continuously declined from a marketed quantity of 81,624 quintals in 1999-00 to 59,615
quintals in 2001-02. Market arrivals of cash crops like Groundnut and Sunflower decreased
and remained stagnant.
Table 6.10: Market Arrivals of Different Crops in Davangere District (In Quintals)
Crop 1999-00 2000-01 2001-02
Rice (Processed) 255,611 335,697 452,029
Paddy (Paddy) 11,78,588 12,44,953 13,72,374
Maize 10,59,955 14,74,371 10,25,692
Jowar 81,624 69,495 59,615
Cotton (Bales) 22,388 8,183 23,218
Groundnut 208,521 1,11,626 1,05,290
Sunflower 5,455 9,390 4,300
The prices received by farmers in different categories for their marketed surplus
showed slight variations (Table 6.11). Big farmers received higher prices only for a few
commodities like Rice, Cotton and Groundnut. For other commodities on the whole, the
farmers in all categories received more or less the same price. Hence, the degree of
exploitation of small farmers was not intense in Regulated markets.
In selling their produce to different agencies, the farmers received maximum price in
the wholesale market for most of the commodities. Still, the consumers who purchased
directly from the producers paid higher prices for Rice and Groundnut than that received in
the wholesale market. A perusal of Table 6.12 also shows that the Local traders pay higher
prices per quintal for the quantities of Maize and Jowar sold to them.

Table 6.11: Price Received by Different size groups Farmers in 2001-02:
Davangere District (in Rs/Quintal)
Farm Size Group Rice Paddy Maize Jowar Cotton Ground
nut Sunflower
I (<1 Ha.) 1,200 650 450 500 1,800 900 1,100 II (1-2 Ha.) 1,100 500 500 550 1,150 1,200 1,150 III (2-4 Ha.) 1,400 600 500 400 1,850 1,100 1,200 IV (4–6 Ha.) 1,500 650 400 500 2,200 990 1,100 V (>6 Ha.) 1,300 600 550 450 1,800 1,300 1,300
Table 6.12: Price given by Different Agency in 2001-02: Davangere District
(Rs. Per Quintal) Crop Wholesale
Market Local Traders Retailers Consumers
Rice 1300 1200 1100 1700 Paddy 625 575 600 575 Maize 450 500 400 460 Jowar 390 450 400 390 Cotton (Bale) 1529 1300 1200 - Groundnut 1109 1100 950 1200 Sunflower 1369 1200 1100 - Table 6.13: Price of Different Crops in Various Years - Davangere District
(Rs. Per Quintal Modal Rate) Crop 1997-98 1998-99 1999-2000 2000-01 2001-02
Rice 1,100 1,205 1,151 1,063 1,300
Paddy 600 690 672 571 625
Maize 480 422 472 365 450
Jowar 500 470 565 408 390
Cotton (Bales) 2,400 1,952 2,105 2,205 1,529
Groundnut 1,343 1,210 1,090 1,050 1,109
Sunflower 1,287 1,952 1,140 1,058 1,369

Table 6.14: Modal Price in Different Months of sale in Davangere District – 2001 - 02
(Rs. Per Quintal, Modal Rate)
Note: Modal price for Rice – August-December 2001; Modal Price for Paddy – Aug-Sept 2001 & Feb-Mar 2002;
Modal Price for Maize – Feb-Mar 2002; Modal Price for Jowar – Nov2001 to Jan 2002; Modal Price for Cotton – July-Sept 2001; Modal Price for Groundnut – July-Aug 2001 & Jan-Feb 2002; Modal Price for Sunflower – Sept – Nov 2001
6.5 Transportation of Marketed Surplus A sizeable amount of marketable surplus is marketed in the village itself, but some
portion reaches the market. The farmers, to transport their produce of paddy to the
market yards use two major means of transport. These are Lorry and Tractor trolleys. But
unlike Raichur, tractor trolleys are the major mode of transport. For the sample as a
whole, the Lorries accounted for 29.4 per cent of the paddy transport and the bulk of the
produce 70.59 per cent was transported through tractor trolleys.
Table 6.15: Proportion Share of Paddy Transported by Different Modes
of Transport in Davangere District (Per cent)
Mode of Transportation Farm Size Group Lorry Tractor Total
I (<1Ha.) 0.00 0.00 0.00 II (1-2 Ha.) 20.00 80.00 100.00 III (2-4 Ha.) 50.00 50.00 100.00 IV (4-6 Ha.) 50.00 50.00 100.00 V (>6 Ha.) 0.00 100.00 100.00 Average 29.41 70.59 100.00
The sample farmers in Davangere district used two means of transport to transport
their produce of paddy to the market yards. These were lorry and tractor. The percentage
Crop Nov 2001
Dec 2001
Jan 2002
Feb 2002
Mar 2002
April 2001
May 2001
June 2001
July 2001
Aug 2001
Sept 2001
Oct 2001
Rice 1,400 1,400 1,400 1,400 1,350 1,000 1,150 1,250 1,300 1,450 1,450 1,400
Paddy 625 625 680 765 765 520 615 615 610 745 750 765
Maize 415 450 455 480 520 340 361 440 415 475 422 405
Jowar 400 410 415 420 425 290 315 325 370 390 365 375
Cotton (Bales)
1,741 1,659 1,529 1,365 1,109 1,551 1,716 1,952 2,389 2,089 2,069 1,890
Groundnut 1,129 1,198 1,255 1,286 965 795 1,109 1,119 1,225 1,208 851 1,029
Sunflower 1,490 1,212 1,390 1,421 1,390 1,080 1,301 1,421 1,262 1,241 1,441 1,369

share of these two modes of transport in transporting paddy is seen in Table 6.15. More
than 70 percent of the paddy was transported by tractors and around 29 per cent through
Lorries. It is necessary to caution here that all this produce was not sent to the market but
represented transportation out of the village. This wide variation in the percentage was
because it was observed that the farmers in higher size groups use tractors on a large scale
for transportation. In Size-group V, the entire produce was transported through tractors. In
Size-group III and IV, half of the marketed quantity was transported through tractors
whereas, in Size-group II, 80 per cent were transported using tractors. Hence, tractors
remained the major means for transporting paddy to the markets in Davangere.
The Karnataka Agricultural Produce Marketing Committee fixes different rates for
different commodities, which enter the market, based on the rates inscribed in the Karnataka
Agricultural Produce Marketing Act. The Act states, “The market committee shall levy and
collect market fee from every buyer in respect of agricultural produce brought by such buyer
in the market area, at such rate as may be specified in the bye-laws (it shall not be more than
two rupees per one hundred rupees of the value of such produce bought except in case of
livestock where the market fee shall not be more than five rupees per head of cattle other
than sheep or goat, and in the case of sheep or goat, such fee shall not be more than one
rupee per head ) in such a manner and at such times as may be specified in the bye-laws.”
Table 6.16: Marketing Charges for Sale of Paddy Borne by Farmers in
Davangere District (Rs. Per Quintal of Paddy)
Farm Size Group Transport Charges
Loading& Unloading
Gunny bags Total
I (<1Ha.) 0 0 0 0 II (1-2 Ha.) 2.04 0.59 2.63 5.26 III (2-4 Ha.) 1.80 0.83 4.88 7.51 IV (4-6 Ha.) 4.00 1.00 12.50 17.50 V (>6 Ha.) 20.00 3.90 0 23.90 Average 3.66 0.94 3.61 8.21
The transportation and marketing expenses are borne by the farmers in marketing
paddy are presented in Table 6.16. The average total expense per quintal of paddy was
Rs.8.21 for the whole sample. Of this, Rs. 3.66 was towards transport charges, Rs.94 paise
loading and unloading charges and Rs. 3.61 for the cost of gunny bags. A perusal of the
table indicates a narrow range followed in all the charges with farm sizes, making an
exception of Size-group V where all these charges were the lowest.

Similarly, lorries and tractors are used to transport Maize. From Table 6.17 it is seen that
tractors were the main source of transport as 73.33 per cent of the total quantity was
transported using them. This high percentage share was due to the higher usage by
farmers in bigger size groups apart from a higher usage by the small farmers.
Table 6.17: Proportion Share of Maize Transported by Different Modes of Transport in Davangere District (Per cent)
Mode of Transportation Farm Size Group Lorry Tractor Total
I (<1Ha.) 22.22 77.78 100.00 II (1-2 Ha.) 21.74 78.26 100.00 III (2-4 Ha.) 57.14 42.86 100.00 IV (4-6 Ha.) 50.00 50.00 100.00 V (>6 Ha.) 0.00 100.00 100.00 Average 26.67 73.33 100.00
Table 6.18: Marketing Charges for Sale of Maize Borne by Farmers in Davangere District (Rs. Per Quintal of Maize)
Farm Size Group Transport Charges
Loading& Unloading
Gunny Bags
Total
I (<1Ha.) 1.73 0.44 2.10 4.27 II (1-2 Ha.) 2.26 0.61 3.62 6.49 III (2-4 Ha.) 5.53 1.71 14.03 21.27 IV (4-6 Ha.) 7.20 2.70 14 23.90 V (>6 Ha.) 4.80 1.80 10 16.60 Average 2.40 0.68 3.99 7.07
The average transport charges and market expenses borne by farmers in transporting per
quintal of maize was Rs.7.07. Table 6.18 shows the various charges that includes Rs. 2.40
for transportation, Rs. 0.68 for loading and unloading and Rs. 3.99 for the cost of gunny
bags. Except for the transport charges, a little variation can be observed in the costs of
loading and unloading and for gunny bags across the farm sizes. The transport charges
indicate an increasing trend with the increase in farm sizes that means the transport costs
were higher in the higher farm sizes with Size group-V an exception.
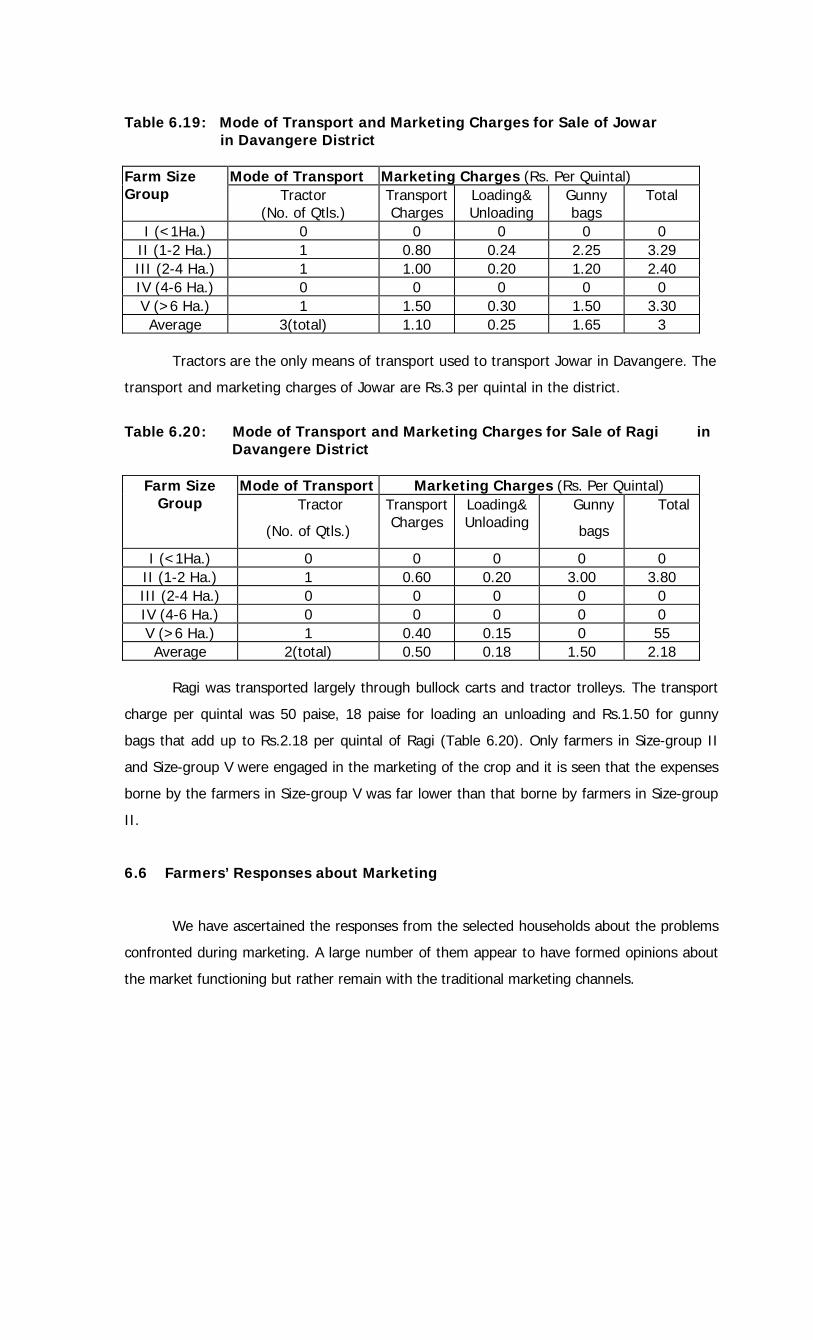
Table 6.19: Mode of Transport and Marketing Charges for Sale of Jowar
in Davangere District
Mode of Transport Marketing Charges (Rs. Per Quintal) Farm Size Group Tractor
(No. of Qtls.) Transport Charges
Loading& Unloading
Gunny bags
Total
I (<1Ha.) 0 0 0 0 0 II (1-2 Ha.) 1 0.80 0.24 2.25 3.29 III (2-4 Ha.) 1 1.00 0.20 1.20 2.40 IV (4-6 Ha.) 0 0 0 0 0 V (>6 Ha.) 1 1.50 0.30 1.50 3.30 Average 3(total) 1.10 0.25 1.65 3
Tractors are the only means of transport used to transport Jowar in Davangere. The
transport and marketing charges of Jowar are Rs.3 per quintal in the district.
Table 6.20: Mode of Transport and Marketing Charges for Sale of Ragi in
Davangere District
Mode of Transport Marketing Charges (Rs. Per Quintal) Farm Size Group Tractor
(No. of Qtls.)
Transport Charges
Loading& Unloading
Gunny
bags
Total
I (<1Ha.) 0 0 0 0 0 II (1-2 Ha.) 1 0.60 0.20 3.00 3.80 III (2-4 Ha.) 0 0 0 0 0 IV (4-6 Ha.) 0 0 0 0 0 V (>6 Ha.) 1 0.40 0.15 0 55 Average 2(total) 0.50 0.18 1.50 2.18
Ragi was transported largely through bullock carts and tractor trolleys. The transport
charge per quintal was 50 paise, 18 paise for loading an unloading and Rs.1.50 for gunny
bags that add up to Rs.2.18 per quintal of Ragi (Table 6.20). Only farmers in Size-group II
and Size-group V were engaged in the marketing of the crop and it is seen that the expenses
borne by the farmers in Size-group V was far lower than that borne by farmers in Size-group
II.
6.6 Farmers’ Responses about Marketing
We have ascertained the responses from the selected households about the problems
confronted during marketing. A large number of them appear to have formed opinions about
the market functioning but rather remain with the traditional marketing channels.

Table 6.21: Farmers' Responses on the Issue of Marketing Their Produce to Procurement Agencies in Davangere District
(No. of Farmers) Farm Size Groups Particulars
I (<1Ha.)
II (1-2 Ha.)
III (2-4 Ha.)
IV (4-6 Ha.)
V (>6 Ha.)
Total
1.No. of Sample Farmers 27 23 7 2 1 60 2.Reasons for Preferring to
Sell to Public Agencies
a) Better Price 25 22 7 2 1 57 b) Quick Disposal 2 3 0 0 1 6 c) Honest Weighing 7 9 3 2 0 21 d) Immediate Payment 1 0 0 0 0 1 e) Help in Inputs 2 0 0 0 0 2
Farmers’ responses on their preference to sell their produce to public agencies are
presented in Table 6.21. Around 95 per cent (that is 57 out of 60) of the farmers preferedr
to sell their produce to public agencies because of the better prices they offeed. About
one-third farmers stated honest weighment as the main reason for preferring public
agencies. Hence, farmers had multiple reasons for opting to sell through public agencies.
But they also indicated the problems faced by them during the actual operations. In other
words, the answers above were of normative nature but the practical difficulties came up
subsequently.
Table 6.22(a): Farmers’ Responses on the Difficulties in Marketing their Produce to
Private and Village traders, Local Market in Davangere District. (No. of Farmers)
Farm Size Groups Particulars
I (<1Ha.)
II (1-2 Ha.)
III (2-4 Ha.)
IV (4-6 Ha.)
V (>6 Ha.)
T
ot
al
1.No. of Sample Farmers 27 23 7 2 1 60 2.Difficulties faced from Private Traders
a)Low Price 18 17 5 2 0 42 b)Payment Delayed 27 22 7 2 1 59 3.Difficulties Faced from Village Traders
a)Low Price 9 16 1 0 0 26 b)Difference in Weighment 4 1 2 0 0 7 c)Not Interested 3 1 2 1 0 7 d)No Village Trader 11 5 2 1 1 20 4.Difficulties Faced in Local Markets a)Not interested 4 1 0 1 0 6 b)No local market 23 22 7 1 1 54

Tables 6.22(a) and 6.22(b) presents the number of farmers who faced various kinds
of problems in marketing their produce to private and village traders and also in the local
and wholesale markets. In the case of selling to private traders almost all the sample
farmers faced the problem of delayed payment. Out of 60, 42 farmers faced the problem
of low prices. These 42 were spread out across size groups-I to IV. Hence, it is visible that
selling to private traders was not satisfying to the farmers in all size groups. But the very
fact that they had strong opinion of the operations confirmed their sale to these private
traders. The farmers referring to the difficulties faced with village traders were mostly
small farmers while the big farmers responded that there were no village traders. Twenty-
six out of 60 farmers reported that they were paid low prices and 7 farmers complained of
the difference in weighment. The victims of both these problems were confined to the first
three size groups, which meant that the small farmers were largely at a disadvantageous
position, and got exploited by the village traders.
Table 6.22(b): Farmers’ Responses on the Difficulties in Marketing Their Produce in Wholesale Market and Public Agencies in Davangere District.
(No. of Farmers) Farm Size Groups Particulars
I (<1Ha.)
II (1-2 Ha.)
III (2-4 Ha.)
IV (4-6 Ha.)
V (>6 Ha.)
Tota
l
Difficulties in Wholesale Market a) Long Distance 8 5 1 0 0 14 b) Transport Cost 16 14 5 2 1 38 c) Market Fee 0 1 0 0 0 1 d) Not Interested 1 0 0 0 0 1 e) Delay in Payment 0 1 0 0 0 1 f) Low Price 2 2 1 0 0 5 Difficulties faced in Marketing to Public Agency
a) Delay in Payment 7 5 2 0 0 14 b) Delay in Disposal 0 3 1 0 0 4 c) No Procurement 17 13 4 1 1 36 d) Delay in Payment & Disposal 3 2 0 1 0 6
Regarding formal local markets, the farmers’ conveyed that they were not interested in
selling their produce in these markets. Six farmers replied that they were not interested
and 54 out of the 60 farmers stated that there were no formal markets in their locality. In
selling their goods in the wholesale market, a maximum number of farmers faced high
transport costs. Their numbers were 38 and were spread over all the size groups. All the
farmers in Size-group IV and V replied of facing the problem of high transport cost. The

other difficulties like long distance, high market fee, delay in payment and low prices were
faced only by farmers in the smaller size groups. Out of 60, 14 farmers complained of
longer distances to the wholesale market and 1 each reported of a higher market fee and
delay in payment. A few farmers also reported low payment for their produce in the
wholesale market and they were confined to the smaller three size groups. In the case of
marketing their goods to the public agencies, a maximum number (36) of farmers
complained that there was no procurement by these agencies in their locality.
Table 6.23: Farmers Responses Regarding Problems in Marketing, Market Yard,
Weighment and Payment in Davangere District. (No. of Farmers)
Farm Size Groups Particulars I
(<1Ha.)II
(1-2 Ha.) III
(2-4 Ha.) IV
(4-6Ha.) V
(>6 Ha.)
Total
1.No. of Sample Farmers 27 23 7 2 1 60
2.Problems with Marketing a) High Rate of Transport 13 9 2 1 0 25 b) Easy Availability of Transport 21 18 3 1 1 44 c) Timely Loading/Unloading 20 15 3 1 1 40 3.Problems with Market yard a) Enough Space 17 15 3 1 1 37 b) Enough Parking Place 17 15 3 1 1 37 c) Enough Staying Arrangements 8 7 1 0 0 16 4.Weighment problems a) Timely Weighment 23 18 6 1 1 49 b) Arbitrary Reduction from Weight
for Lower Quality 2 1 1 0 0 4
c) Reduction in Price due to Lower Quality
5 5 0 0 0 10
5.Payment problems a) Immediately after Weighment 0 1 0 0 0 1 b) After One Week 4 5 1 1 0 11 c) After Two Weeks 9 11 4 0 0 24 d) After Three Weeks 3 0 0 0 1 4 e) After a Month 11 6 2 1 0 20
The details of the existence of various problems related to Marketing, Market yards,
Weighment and Payment faced by the sample farmers are also shown in Table 6.23.
These were the responses of the farmers to the directed question. Regarding problems
related to marketing, a maximum number of farmers said that transport was easily
available and also there was timely loading and unloading of their produce. High rates of
transport cost was reported by 25 out of the 60 farmers, while 44 farmers conveyed that
there was easy availability of transport facilities. Forty out-of 60 farmers revealed that
there was timely loading and unloading facilities for their produce. In troubles related to

facilities in the market yards, 37 farmers maintained that there was enough space to
exhibit their produce and enough parking place available to park their bullock carts.
Around 40 per cent of the farmers were not satisfied with these facilities available in the
market yards. Only 16 farmers reported the adequacy of the staying arrangements made
available to them in the market yards. Hence, the facilities in the market yards needed to
be improved. In the context of weighment of their produce only a few farmers faced
problems because 49 out of the 60 farmers recounted that there was timely weighment of
their produce and only 4 farmers stated arbitrary reduction in weight for lower quality of
their produce. Ten farmers faced a reduction in price due to lower quality of their produce.
Almost all farmers faced delay in payment after they marketed their produce. Only one
farmer informed of immediate payment and 11 farmers expressed that they were paid
after a week’s time, while 24 said of delay of two weeks, 4 pronounced a delay of three
weeks and 20 testified that payment was delayed by a month.
Table 6.24: Number of Farmers Responding about Collusion between Purchaser and Commission Agent in Davangere District
Farm Size Group Collusion on
I (<1Ha.)
II (1-2Ha.)
III (2-4 Ha.)
IV (4-6 Ha.)
V (>6Ha.)
Total
1.Price Fixation 26 23 7 2 1 59 2.Grading/Quality of
Produce 25 18 7 2 1 53
3.Weighment 26 23 7 2 1 59 4.Payment 10 6 3 1 1 21 5.Bidding 7 3 2 0 0 12
The replies given by farmers regarding their impressions about collusion between
their purchaser and commission agents is summarized in Table 6.24. A perusal of the table
indicates that farmers did not trust the agents fully, as they had knowledge of the
collusion of their agents with their purchaser in certain matters relating to price fixation,
grading, weighment, payment and auctioning or bidding their produce. Almost all farmers
conveyed that they had knowledge of the collusion in price fixation and weighment. Fifty-
three farmers were aware of collusion in grading and 23 were aware of collusion in
payment and 12 of that in bidding their produce.
The channels through which the farmers’ receive price signals and farmers
responses on the effects of these price signals on the cropping pattern, adoption of
improved technology, the input use and their marketing activities are covered in Table

6.25. It is very clearly indicated in the table that the farmers accessed multiple sources of
information regarding price changes. All the farmers in the sample received information
from their Commission agents. Apart from this, they received information from the
personal visit to their neighbouring villages and block centres. Ten out of 60 farmers
received information through Radio/TV/newspapers, 36 from neighbours and 30 from local
traders.
Table 6.25: Number of Farmers Responding on the Channels of Price Signals and its
Effect on Cropping Pattern, Production and Marketing in Davangere District
(No. of Farmers) Farm Size Groups Particulars
I (<1Ha.)
II (1-2 Ha.)
III (2-4 Ha.)
IV (4-6 Ha.)
V (>6 Ha.)
Total
1.No. of Sample Farmers 27 23 7 2 1 60 2.Channels of Price Signals a) Message given by C.A. 27 23 7 2 1 60 b) Personal Visit 25 22 7 2 1 57 c) Radio/TV/Newspaper 4 2 2 1 1 10 d) Information from
neighbour 14 16 4 1 1 36
e) Local trader 16 9 3 1 1 30 3.Effect of Price Signals a) Change in area 9 15 4 2 1 31 b) Adoption of Improved
technology 9 12 4 1 0 26
c) Intensive input use 19 21 6 2 1 49 d) Sale of produce 7 10 1 1 0 19 In looking into the views of farmers on the effect of price signals on their decisions, the
highest number of farmers (49) replied that the price signals had an effect on the input
use. More than half of the farmers reported of influence on the cropping pattern, twenty-
six connected adoption of improved technology and 19 farmers of an effect in the sale of
their produce.
Table 6.26: Channels of receiving Information about Technical Change in Davangere
District (No. of Farmers)
Farm Size Groups Channels I
(<1Ha.) II
(1-2Ha.) III
(2-4Ha.) IV
(4-6Ha.) V
(>6 Ha.)Total
1.Block Authorities 13 11 5 2 1 32 2.Village President 1 1 0 0 0 2 3.Neighbour 20 14 4 1 0 39 4.Input Marketing Agencies 26 22 7 2 1 58

Among the sample farmers indicating the sources of information about technical
change, 58 farmers stated to have received information from input marketing agencies, 39
got it from neighbours, 32 with the help of block authorities and 2 from the Village
president. On the whole, farmers were well informed of the present technological
requirements in crop production and it is also noted that they had access to multiple
sources of information.
Only 11 farmers stated that they had the knowledge of future markets while 49
stated no knowledge of such phenomenon (Table 6.27). Of these 11, 3 farmers said that it
was not helpful in any of their decision-making process and 8 farmers affirmed that they
had no practice of using the knowledge of future markets in their decision-making.
Table 6.27: Farmers’ Knowledge of Future Markets in Davangere District (No. of Farmers)
Farm Size Groups Particulars I
(<1Ha.)II
(1-2 Ha.) III
(2-4 Ha.) IV
(4-6 Ha.) V
(>6 Ha.)Total
1.No. of Sample Farmers 27 23 7 2 1 60 2.Farmers having knowledge of Future Markets
Yes 2 5 3 1 0 11 No 25 18 4 1 1 49 3.Is it Helpful Not helpful 0 3 0 0 0 3 No such practice 2 2 3 1 0 8
The number of farmers who had taken recourse to distress sale was quite small (Table
6.28). Of the total 8 farmers, 6 stated that there was urgent need for cash and that was
the main reason for resorting to distress sale. Only two farmers confirmed advance
Table 6.28: Farmers' Responses on Taking Recourse to Distress Sale in Davangere District
(No. of Farmers) Farm Size Groups Particulars
I (<1Ha.)
II (1-2 Ha.)
III (2-4 Ha.)
IV (4-6 Ha.)
V (>6 Ha.)
Total
1.No. of Sample Farmers 27 23 7 2 1 60 2.Farmers taking Recourse to Distress Sale
Yes 6 2 0 0 0 8 No 21 21 7 2 1 52 3.Reasons for taking recourse to Distress Sale
a) Financial problem 4 2 0 0 0 6 b) Advance from Agent 2 0 0 0 0 2

payment received from the Commission agents. However, we located that this
phenomenon was quite prevalent in the region and farmers were reluctant to tell, as all
these agents were non-licensed moneylenders. Cumbersome procedures and timely non-
availability of institutional credit allowed proliferation of this phenomenon.
Table 6.29: Farmers' Opinion on Institutional Credit and Pledge Financing in Davangere District (No. of Farmers)
Farm Size Groups Particulars I
(<1Ha.)II
(1-2 Ha.) III
(2-4 Ha.) IV
(4-6 Ha.) V
(>6 Ha.)Total
1.No. of Sample Farmers 27 23 7 2 1 60 2.Has the Sale Delayed with the
Non-availability of Institutional Credit
Yes 16 17 4 1 1 39 No 11 6 3 1 0 21 3.If yes, by how many months a) Two Months 1 4 0 0 0 5 b) Three Months 6 1 1 0 0 8 c) Four Months 3 5 0 0 0 8 d) Above Four Months 6 7 3 1 1 18 4.Desire to Avail Pledge Financing Yes 12 13 4 1 1 31 No 15 10 3 1 0 29 5.If yes, What Would be the Reasonable Rate of Interest
a) 2 per cent per Month 4 9 1 1 1 16 b) 3 per cent per Month 8 4 3 0 0 15
The farmers’ reactions on the availability and usefulness of institutional credit and
their views on Pledge financing are presented in Table 6.29. It can be seen that 39 out of
60 farmers blamed that their sale had been delayed due to timely non-availability of the
institutional credit. These farmers were from all size groups of holdings. Most of these
farmers stated that the sale of their produce had been delayed between 2-4 months, while
18 farmers said it had been delayed for more than four months. On the suggestion to the
farmers to avail of the facility of pledge financing, 31 of the farmers preferred the idea and
29 did not opt for it. Among the farmers who were willing to avail of pledge financing, 16
indicated a 2 per cent rate of interest, while 15 of them indicated 3 per cent rate for the
finance to be made available through pledge financing.
When asked on how they weighed the influence of price change and technical
change on their decision on area allocation and input use, the number stating an increase
in area allocation and input use owing to the two variables- price change and technical

change had been similar (Tables 6.30 and 6.31). Thirty-five farmers stated an increase in
area allocation and 44 an increase in input use. When analyzed in percentage terms, the
per cent of farmers replying an increase in both the variables increased with farm sizes and
100 per cent of the farmers in bigger farms had opined of an increase in both area
allocation and input use.
6.7 Conclusions Davangere is a commercially-oriented district in Central Karnataka. But the process
of commercialisation emerged under the shadow of frequent visitation of droughts coupled
with other infrastructure bottlenecks. Even now not all marketable surplus reaches the
market and the regulated markets are far from perfect. Largely the process of
commercialisation is directed more towards the non-food crops but in the recent past a
sizeable portion of the marketable surplus of foodgrains was sold in the markets. Two
marketing channels are prevalent. First, the marketing takes place at the village itself and
the purchaser is usually an agent of some wholesaler in the town. A large portion of the
commodities is sold through this agent and therefore, the farmers have confusion about
the usual Commission Agent in the market yard and the agent who visits the village. It is
also interesting that the same person is frequently present in the Regulated market.
Second channel is the marketing by groups. The grains are taken to the market by a few
farmers together and sold together. The proceeds are shared in proportion to the quantity
of the produce. Maize is usually marketed in this manner.


Table 6.30: Number of Farmers Responding about the Influence of Price Increase on Area Allocation and Input Use in Davangere District
Price Increase Area Allocation Input Use
Farm Size Group
Increase Percent to Total
Remain-ing Same
Percent to total
Increase Percent to Total
Remain- ing Same
Percent to Total
Percent of Farmers stating an Increase in Area Allocation
Percent of Farmers stating an Increase in Input Use
I (<1 Ha.) 10 28.57 17 68.00 16 36.36 11 68.75 37.04 59.26 II (1-2 Ha.) 16 45.71 7 28.00 18 40.91 5 31.25 69.57 78.26 III (2-4 Ha.) 6 17.14 1 4.00 7 15.91 0 0.00 85.71 100.00 IV (4-6 Ha.) 2 5.71 0 0.00 2 4.545 0 0.00 100.00 100.00 V (>6 Ha.) 1 2.86 0 0.00 1 2.273 0 0.00 100.00 100.00
Total 35 100 25 100 44 100 16 100 58.33 73.33
Table 6.31: Number of Farmers Responding about Influence of Technical Change on Area allocation and Input Use in Davangere District
Technical Change
Area allocation Input use Farm Size
Group
Increase Percent to Total
Remaining Same
Percent to Total
Increase Percent to Total
Remaining Same
Percent to Total
Percent of Farmers stating an Increase in Area Allocation
Percent of Farmers stating an Increase in Input Use
I (<1 Ha.) 10 28.57 17 68.0 16 36.36 11 68.75 37.04 59.26 II (1-2 Ha.) 16 45.71 7 28.0 18 40.91 5 31.25 69.57 78.26 III (2-4 Ha.) 6 17.14 1 4.00 7 15.91 0 0.00 85.71 100.0 IV (4-6 Ha.) 2 5.71 0 0.00 2 4.54 0 0.00 100.00 100.0 V (>6 Ha.) 1 2.86 0 0.00 1 2.27 0 0.00 100.00 100.0
Total 35 100 25 100 44 100 16 100 58.33 73.33

CHAPTER VII
SUMMARY AND CONCLUSIONS
7.1 Introduction Domestic market reforms are high on the agenda of the present economic
restructuring. It has acquired two different connotations in the academic discussions.
First, it stems out of the intended compliance to the requirement of the WTO and
therefore, largely focuses on the trade distorting measures, whereas the second is more
fundamental dealing with the domestic market infrastructure. The issues pertaining to
the second aspect have been discussed at various forums and specifically focus on the
working of the product market. The Agricultural Produce Market Acts passed by various
states attempted to deal with the inadequacies present during the sixties. At that time it
had focussed on dealing with the scarcity situation and distribution of grains. Naturally,
the Act as well as the policies were tuned to the situation prevalent then. Even though
the act is being modified concurrently, the basic structure remained the same. More
than that the market shortcomings remained unattended. Agricultural marketing also
remained at the second level on the research agenda of academics and found only an
incidental place in the policy debates. The current issue, therefore, is of an urgent
nature and focuses on four components for discussion. First, the adequacy of the rural
grain market as a component infrastructure and as a supporting institution is under
discussion. It is claimed that the shortcomings during the sixties continued to dog the
sector even in the nineties. Second, the question is raised about the incentives created
by the price intervention scheme as well as the prices received by the producers. In this
context, the role of the State vis-a-vis the role of the market came under discussion.
Third, with the increased pressure of commercialisation various currents are visible in
the markets across regions. These have emerged under different situations, and
therefore, call for a systematic documentation. Lastly, we have a very devious situation
wherein the organised market structures are performing much less than the
expectations, the market intervention schemes are performing only in a few selected
regions, the intermediaries are usurping significant margins, and at the same time, the

economic forces require the farmer to participate in the market albeit pro-actively. This
called for a thorough study of the marketing environment of the farmer. Rightly, the
study was initiated and the design covered all these issues.
Karnataka is a state with a slow emergence of commercialisation on the screen.
Unlike some other States, the process of commercialisation here did not tread the path
through foodgrain marketing. It is well known that the marketable surplus of foodgrains is
sold in the market, but largely the farmers prefer to take other non-food crop as the
supporting cash crop. The State has distinct product markets developed for cash crops over
the years. The coastal region of Karnataka has the markets and market channels
developed for Arecanut, Coconut, Cashew and Spices. The south interior Karnataka is
known for plantation crop marketing, sericulture and horticultural crops. Northern
Karnataka is directed towards sugarcane, cotton, pulses and oilseeds. It is in this region
that the foodgrains also come under commercial production. This is also true about the
districts on the Deccan Plateau and some of the southern Karnataka district. Rice is on the
rise as a cash crop and so also maize. We have chosen two districts of Central Karnataka to
analyse the marketing systems in these districts, under the constraint that the results are
solely confined to these crops and districts. The generalisation for the State will be difficult
due to the extreme regional specificity and crop features.
7.2 The Canvass
The study made use of the secondary and primary data from the districts of
Chitradurga and Raichur. It is interesting that these two districts were reorganised
recently and the districts of Koppal and Davangere were carved out. Both the districts
do not have adequately developed marketing infrastructure. The primary data were
collected from the following villages.
Waddarhatti, Kesarhatti and Hosakere of Gangavathi Block, Raichur
District.
Pagadadinni, Jawalgera and Jilihal of Sindhanur Block
Hebbala, Chinnasamudra and Hulikere of Davangere Block
Kurlahalli, Bilasnur and Vaderhatti of Harihara Block

We selected 120 farm households from Raichur district for covering cultivation of
Paddy in two seasons and 60 farm households from Davangere (earlier, part of
Chitradurga) district. These were selected in relation to the probability proportion to
their size class of holdings. The reference year for the primary data was agricultural year
2001-02. It may be noted that the State interventions was extremely sporadic and not
consistent in any of the districts of Karnataka. Rice is procured from the mills and there
was one instance of procurement of maize in Dharwad district. The procurement thus
took place as an exception and not as any routine operation. Raichur is a paddy growing
area and recently the procurement of rice from the millers was more from Raichur
district, and that was not in response to the price collapse, but more due to a political
decision. The concept of Commission Agent is quite different in Karnataka. Commission
Agent is a person who acts as an agent of the trader, and he is usually an employee of
the trader with the responsibility to purchase grains from the village or market on behalf
of the traders. He visits the village quite often for advancing loans during sowing and
growing seasons when the cultivators are under economic stress. He functions as agent
and moneylender which are overlapping.
As indicated earlier, two different districts were chosen for the purpose of
primary survey, viz., Raichur and Chitradurga districts. The districts are situated in
central Karnataka region largely falling in the rainfed zone of Karnataka but in the
region with good potential for development of markets and commercial crops. The
district of Raichur is known for its agricultural predominance and despite adversely
placed under climatic constraints, the district has done well in stepping up the growth
of its agricultural economy. Among the constraints, small and marginal farmers
predominate the district’s agrarian structure and this is further aggravated by the
persistent drought situation in the district. Raichur has some area under irrigation but
a large part of the district falls in the rain shadow zone. Markets for agricultural
commodities are well developed in the district. Chitradurga district is also a drought-
prone area of Central Karnataka having persistent history of drought. The district has
recorded moderate growth in the crop economy. Food grains dominate its cropping
pattern. Oil-seeds and cotton are the major cash crops of the district. Agricultural
markets are well developed in Chitradurga district and the economy of the district is

supported by cash crops especially from oil-seed processing sector. We have taken
these two districts for the purpose of our study based on the criteria indicated by the
coordinating centre. We are mapping out here the basic characteristics of the selected
districts.
Raichur and Chitradurga are the districts with emerging commercial orientation in
their agricultural economy. Both districts are predominantly food grain growing districts,
but the commercial crops have made their presence felt in the region. Oil-seeds happen
to be major commercial crop but slowly and steadily cereals are also reaching the
regulated markets in a sizeable quantity. Among cereals, rice and jowar are the
predominant crops getting into regulated markets. Among the two districts, Raichur is
yet to realise full potential of its marketing operations and the regulated markets in the
distinct have a good amount of arrivals from neighbouring regions. Chitradurga, on the
other hand, has a well-developed oil-seed market economy. Infrastructural bottlenecks
are the major hurdle for both districts and they are in disadvantageous position due to
the low proportion of irrigation.
The sample profiles of the two districts suggest quite a few interesting issues.
First, the land size has been shrinking and that leaves a smaller base for farm
production activities. Even though tenancy is legally banned in Karnataka, the
prevalence of leasing out operations is seen among the sample farmers. In order to
overcome the land based constraint, the cultivators lease in land. Second, oilseeds,
sugarcane are the traditional cash crops. But with the increased market operations in
paddy and wheat, these cereals have also assumed the role of cash crops. Maize is
strongly emerging as a new cash crop. The processing units largely procure it. Third,
the asset position of the sample farmers was not very promising. Some of the farmers
owned tractors but these were largely used for transportation than tillage or farm
based activities. Many owned irrigation pump sets. Lastly, even though the two sample
regions had a commercial-orientation, the production base did not allow for scaling up
of this operation.

7.3 Market Regulations and Institutions
Market Regulations can be grouped into two broad groups viz., regulations
governing functioning of primary agricultural produce markets, including a series of
legal instruments and the Market Committees functioning as intermediaries. Regulation
and development of primary markets was taken up as an institutional innovation and
construction of well laid-out market yards. These regulations provided a design for the
conduct of the agricultural market produce committee. The Directorate of Marketing
and Inspection (DMI) of Government of India and state level Directorate of Marketing
play an important role in the functioning of these institutions. In order to remove the
components causing market imperfections and to bring the functions of agricultural
marketing under a proper legal framework, the State governments passed the
Agricultural Produce Marketing Acts. The Acts were passed in most of the states around
mid-sixties and revised subsequently. The Acts incorporated seven major components
dealing with the establishment, function and conduct of the business.
The important general features of regulated markets include: Monitoring of
marketing practices by Regulated Market Committees; Licensing of functionaries; Open
auction or close-tender system; Issue of sale slips showing quantity and price to the
farmers; Well-publicised time and days of sale; Correct weighment of the produce by
licensed weighman; Prescription of rational market charges; Provision of payment to
farmers within stipulated period; Mechanism of dispute settlement; Dissemination of
market related information; Provision of amenities to the farmers in market yards and
Reduction of physical losses during buying and selling.
Five decades of continuous policy intervention has not made significant changes
and a lot needs to be done. Even a cursory visit to any regulated market yards suggests
that we still have to achieve a lot on this count. Certain practices like late payment to
farmers, under-pricing, arbitrary grading, speed money and non-issue of sale slips by
the traders continue to dog the performance of markets. There is a considerable
congestion and delays in several markets resulting in long waiting periods for the
farmers to receive their payments. The traders have organised into informal cartels and
these cartels squeeze the farmers. There is also lack of understanding about the market

regulations particularly those relating to the sale of produce outside the market yards.
Funds collected as cess and market fees are not properly utilised. In the process,
APMCs are emerging as some sort of monopolistic centres of sale and purchase with the
reigns in the hands of a few.
Agricultural marketing system at primary level in Karnataka involves four broad
marketing channels, viz., (i) direct to consumers; (ii) through private wholesalers and
retailers; (iii) through public agencies (regulated markets) or cooperatives; and (iv)
through processors. The share of these channels in total marketed surplus varies from
commodity to commodity and across regions. Marketing structure of the agricultural
produce differs according to products. Among these channels large quantity of produce
is transacted through the regulated market channel. It is necessary to understand the
basic functioning of the regulated markets at lower level before one gets into analysing
the reforms in marketing. Foodgrains are mostly marketed at the primary village market
or in the regulated market yard. The procurement of grains takes place only in the case
of rice and through the processing mills. Oil-seeds are largely sold through the
regulated markets and directly to the processors. But other commercial crops like
banana, arecanut, coconut, sugarcane and cotton have developed specific marketing
channels.
Due to the creation of marketing institutions and infrastructure a few changes
though sporadic have occurred in the agricultural marketing sector. These include: i.
Increase in the market arrivals as per cent to total output; ii. Reduction in the market
inefficiencies in terms of unauthorised charges and irrational grading; iii. Dissemination
of market information at the regulated market yard; iv. Better storage facilities and
place to stay was created for the farmers; marketing charges payable by farmers were
either dropped, standardized or liability shifted to the buyers; and v. Villagers are not
selling major portion of their produce in the village and the proportion of distress sale
reduced significantly.

7.4 Marketing Paddy in Raichur District
7.4.1 Process of Marketing
Paddy being one of the major food crops of Raichur district we have taken the
production and marketing of paddy here for analysis. Even though paddy is one of the
major food consumption items, only a small percent of the produce is retained for home
consumption and for seeds. There is a steady and consistent increase in the quantity
marketed of paddy with the increase in the size of farm. A major share of the produce of
paddy is marketed and the proportion of marketed surplus by the big farmers is higher.
The marketing infrastructure is not well developed in Raichur district. Therefore, the
data obtained from the Commission agents were hardly of any use. The Commission
agents operate at a very low key and mostly procure from the individual farmers at the
farm itself. The presence of Commission agents is most illusive and no information was
available on this aspect. There was no direct sale to the millers and therefore, the
intricacies of this sale could not be investigated. The rice mills are very few and most of
the millers from different districts procure from the market directly. The mills are also
operating at lower than their capacity as there is tough competition from the millers of
the neighbouring districts. In the case of paddy, surprisingly, the share in output is
higher than the share in quantity marketed in the smallest size class of holding. This is
due to the wages in kind received by many of them. In other groups the latter is higher
than the former. Farmers market relatively larger proportion of the produce in the land
size above 1 hectare while farmers with land size below 1 hectare (small farmers) retain
a relatively larger proportion of the produce.
Jowar is another important food crops grown by the farmers of Raichur district.
It was being grown largely for home consumption but recently some portion of the
produce is marketed. Even though production per farm of Jowar increased with size, the
first two smaller groups and farmers in size class of above 6 hectares does not have
surplus for marketing. Only farmers in III & IV groups marketed their produce. Hence,
the marketed quantity was only a meagre amount. More than 90 per cent of the
production of Jowar was from the first two lower size groups, but no quantity was

marketed. In Size-classes of 2 to 6 hectares, the share of quantity marketed was much
higher than the share in output. The combined share of output of these two groups was
only 33.11 per cent while the entire marketed quantity of Jowar was from these two
groups. More than 90 per cent of the production of Jowar was from the first two lower
size groups, but no quantity was marketed. Sunflower is an emerging commercial crop
in the district. Only the farmers with land size above 2 hectares undertook production of
this crop. It increased with farm size and hence, the quantity marketed. For sunflower,
whatever was produced was marketed as it is a cash crop and hence, the per cent share
of both output and quantity marketed remained the same.
7.4.2 Seasonality in Marketing
It was observed that the phenomenon of ‘the farmer waiting for the market price
to reach their expectation and then releasing their produce in the market’ has been
increasing in the recent past. It may be noted that dry paddy can be stored and
marketed at an opportune time and therefore, the sale of paddy is spread over a longer
period. The pressure of marketing had been highest in the month of December (harvest
season), followed by April and January. Farmers also sold paddy as late as in May. The
pressure has been lowest in March with the lowest marketed quantity. The small
farmers with less than 4 hectares of land undertook most of the paddy marketing during
the months of November, December, March and April, whereas, farmers from higher
size group also sold in January, April and even up to May. We observed that not a large
share of Jowar was marketed. The important month for marketing of Jowar was May.
Farmers cultivating less than 2 hectares of land did not participate in marketing of
jowar. Sunflower being a cash crop the total produce was marketed. Two important
months for marketing Sunflower were April and May. In these two months the pressure
of marketing was very high but especially so in the month of April. In the month of April,
the big farmers in size groups above 4 hectares of land undertook marketing whilst, the
small farmers preferred to sell their produce in the month of May.
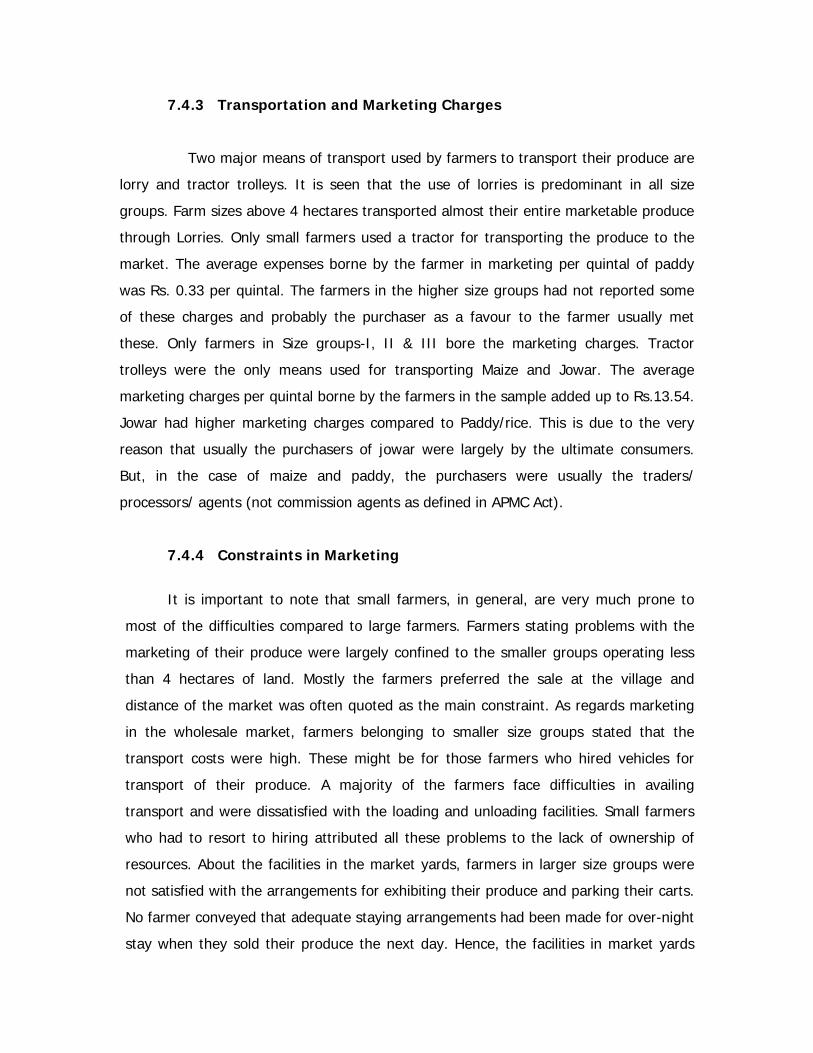
7.4.3 Transportation and Marketing Charges
Two major means of transport used by farmers to transport their produce are
lorry and tractor trolleys. It is seen that the use of lorries is predominant in all size
groups. Farm sizes above 4 hectares transported almost their entire marketable produce
through Lorries. Only small farmers used a tractor for transporting the produce to the
market. The average expenses borne by the farmer in marketing per quintal of paddy
was Rs. 0.33 per quintal. The farmers in the higher size groups had not reported some
of these charges and probably the purchaser as a favour to the farmer usually met
these. Only farmers in Size groups-I, II & III bore the marketing charges. Tractor
trolleys were the only means used for transporting Maize and Jowar. The average
marketing charges per quintal borne by the farmers in the sample added up to Rs.13.54.
Jowar had higher marketing charges compared to Paddy/rice. This is due to the very
reason that usually the purchasers of jowar were largely by the ultimate consumers.
But, in the case of maize and paddy, the purchasers were usually the traders/
processors/ agents (not commission agents as defined in APMC Act).
7.4.4 Constraints in Marketing
It is important to note that small farmers, in general, are very much prone to
most of the difficulties compared to large farmers. Farmers stating problems with the
marketing of their produce were largely confined to the smaller groups operating less
than 4 hectares of land. Mostly the farmers preferred the sale at the village and
distance of the market was often quoted as the main constraint. As regards marketing
in the wholesale market, farmers belonging to smaller size groups stated that the
transport costs were high. These might be for those farmers who hired vehicles for
transport of their produce. A majority of the farmers face difficulties in availing
transport and were dissatisfied with the loading and unloading facilities. Small farmers
who had to resort to hiring attributed all these problems to the lack of ownership of
resources. About the facilities in the market yards, farmers in larger size groups were
not satisfied with the arrangements for exhibiting their produce and parking their carts.
No farmer conveyed that adequate staying arrangements had been made for over-night
stay when they sold their produce the next day. Hence, the facilities in market yards

were the major constraints. Small farmers owing to lower quality of their produce
mostly experienced reduction in weight and price. A majority grumbled about delayed
payment. Farmers in all size groups, were very well aware of the collusion between
their Agents and the purchaser in price fixation, grading, weighing their produce and
bidding, which stood in the way of the farmer receiving a justified price for the
produce. Therefore, the farmers largely preferred to sell at the village itself.
7.4.5 Farmers Responses
A farmer receives information about prices from more than one source, the
Agents being the first important source followed by the personal visit of the farmer to
the market places, which had a considerable but, moderate influence on their decisions
related to cropping pattern, their use of intensive inputs, adoption of new technology
and changes in marketing of their produce. Farmers had good access to the information
on technical change as it is seen in the sample that a farmer received information from
multiple sources. The most important source of information about technical change was
provided by the Input Marketing agencies. Share of farmers stating an increase in area
allocation and input use as a result of price increase and technical change had been
higher in higher farm size groups (almost all farmers stating an increase). Future
markets had not emerged in the sample region. A majority of the farmers in the sample
region did not have any knowledge of the future markets. Farmers who had knowledge
also had no practice of using these in their marketing decisions. Farmers replied in
affirmative, on taking recourse to distress sale and these farmers had been mostly in the
smaller three size groups. The sole reason for distress sale of their produce had been
the urgent need for money except for one case that resorted to sale due to low quality.
7.5 Marketing in Davangere District
7.5.1 Process of Marketing
The constraints on the agricultural economy of Davangere district are quite
strong in terms of unfavourable climate and underdeveloped infrastructure. The
marketing activity is still concentrated through the informal channels and the organised
marketing is not so much preferred. The district of Davangere is known for its

production and marketing of Maize. No part of the produce of Maize is retained for home
consumption or seeds by any of the size groups, but for a small amount is reserved for
animal feed. The marketed quantity when viewed in relative terms, that is, as percent of
the total quantity produced a decline is observed in Size-group IV. On an average, 92.31
per cent share of the produce was sold in the market. Sugarcane has been strongly
emerging as a cash crop in Davangere and taken up for cultivation by farmers of all
sizes of holdings except farmers in the highest size group. It is replacing paddy and
maize at a very fast rate. The Commission agents operate at a very low key and mostly
procure from the individual farmers at the farm itself. There was no direct sale to the
millers and therefore, the intricacies of this sale could not be investigated. The rice mills
are very few and most of the millers from different districts procure from the market
directly.
7.5.2 Seasonality in Marketing
Davangere is a business centre and one can expect prudent marketing strategies in
the district. But probably crop husbandry is an exception and the farmers face resource,
cash and infrastructure as major constraints. Lack of storage and development of market
yards also act as strong constraints. The concentration of marketing of Maize is highest in
the months of January and February. The pressure of maize marketing is highest in the
month of February when farmers in all categories, except those with higher size of
holdings, actively participate in selling their produce. In the month of January, the
marketing activity is relatively at low key while in December.
7.5.3 Transportation and Marketing Charges
Farmers transport their produce of paddy to market yards using two major
means of transport- lorry and tractor trolleys. But unlike Raichur, tractor trolleys are the
major mode of transport for Maize. It is observed that the farmers in higher size groups
use tractors on a large scale for transportation. The average transport charges and
market expenses borne by farmers per quintal of maize is Rs.7.07. The transport
charges indicate an increasing trend with the increase in farm sizes that means the
transport costs are higher in the higher farm sizes with Size group-V an exception.

Around 95 per cent (that is 57 out of 60) of the farmers preferred to sell their
produce to public agencies because of the better prices they offered. But not many of
them did due to poor infrastructure. About one-third of the farmers stated that honest
weighment was the main reason for preferring public agencies. Hence, farmers had
multiple reasons for opting to sell through public agencies. But they also indicated the
problems faced by them during the actual operations.
7.5.4 Constraints in Marketing
In the case of selling to private traders almost all the sample farmers faced the
problems of delayed payment and quite a lot complained of low prices. It was visible
that selling to private traders was not satisfying to the farmers in all size groups.
Regarding formal local markets the farmers’ conveyed that they were not interested in
selling their produce in these markets and many highlighted the absence of local
markets in their locality.
In selling their goods in the wholesale market, a number of farmers conveyed
high transport costs. The farmers in all the size groups faced other difficulties like long
distance, high market fee, and delay in payment and low prices. In the case of
marketing their products to the public agencies, a maximum number of farmers
complained that there was no procurement by these agencies in their locality.
7.5.5. Farmers Responses
Almost all farmers are aware of the collusion between their agents and the
purchasers of their produce. It is very clearly indicated that the farmers have access to
multiple sources of information regarding the price changes. All the farmers in the
sample received information from their Commission agents. Most of the farmers
experienced an effect of it on their decisions on the input use and a few others
experienced an influence on their cropping pattern. The most important source of
information regarding technical change was the input marketing agencies. Only a few
farmers showed some knowledge of future markets and they had no practice of using it
in their decision-making. The number of farmers who had taken recourse to distress sale

was quite small. Only two farmers confirmed the advance payment received from the
Commission agents. However, we observed that this phenomenon was quite prevalent
in the region and farmers were reluctant to reveal, as all these agents were non-licensed
moneylenders. Cumbersome procedures and timely non-availability of institutional credit
allowed proliferation of this phenomenon. Thus, farmers blamed that their sale had been
delayed due to timely non-availability of the institutional credit and those who were
willing to avail of pledge financing belonged to all size groups of holdings and not
especially small farmers.
7.6 Towards an Efficient Marketing System
Historically agricultural marketing structure in the country began specifically for
the commercial commodities. The commercial culture has always been in the
background of these institutions. The real boost in the development of marketing
infrastructure came after the advent of ‘Green Revolution’. It was during the seventies
and eighties that a sizeable quantum of marketable surplus was generated and this
required the facilities for marketing. It was under this supply pressure that the
establishment of Regulated Market Yards was undertaken. At the same time there was
also the pressure from the farm lobby, protesting against the exploitation by the market
intermediaries like Adatya or middlemen. Primitive exploitative systems like Hattha
system were in operation. In this context the step towards establishment of formal
marketing institutions in the form of Regulated Market Yards was a welcome step. It
was envisioned that this facility would wipe out the inadequacies. Keeping in tune with
the economic philosophy of those years, the Market structure was placed under the
control of a cooperative body called Agricultural Produce Market Committee, with proper
assistance from an official, acquainted with the intricacies. The market intermediaries in
the form of Adatyas were formalized and named as Commission Agents. It did not take
much time or efforts for the erstwhile Adtyas to don the clothes of the newly created
nomenclature of Commission Agent. In the initial euphoria the regulated markets were
established almost at each taluk level and also at the big towns below the taluka level.
But the density of Regulated markets was far short of the requirements and even now
the farmers of Karnataka have to travel an average distance of 50 kms to reach a

Regulated Market. In the absence of the adequate density of markets and the
infrastructure to reach the market, it is quite expected that a large portion of the
marketable surplus generated be sold locally to the Agents in the village. In
consequence, the low density kept alive the inefficiencies in the marketing and
enhanced the lack of access to market.
7.6.1 Long-term Measures
The Agricultural Produce Marketing Act made provisions for the regulation,
establishment and administration of markets for agricultural produce. It constituted the
Market Committees in these regulated markets and entrusted it with the formulation of
rules in the market yards and monitor the functioning and conduct of business. But, in
the process, the APMCs are emerging as monopolistic centres and the market system is
left with major inadequacies like lack of proper infrastructure (including density) to
satisfactorily provide clear access to markets for all the farmers, difficulties in the mode
of payment as well as storage and transport facilities in the market yards, domination of
‘under-cover’ Commission Agents in the operations inside the market yard and
inadequate dissemination of market information to the farmers. Hence, measures have
to be taken for proper monitoring of the implementation process of the provisions of the
Act.
Market intervention in Karnataka through the State agencies has been at a very
low key. It is taken up sporadically and at times under pressure from the farm lobby.
Market Intervention Scheme, thus, requires arrangements for a permanent institution.
But, the time lag between the signals originating from the distress caused due to price
and the initiative of action, defeats the very purpose of the action. More than the
financial constraints the MIS operations require adequate autonomy to the agencies and
a business culture like that of NAFED.
Sufficient funds has to be placed with the agencies designated for administering
the Market Intervention Scheme so that it can carry on its operations (procurement) as

and when the need arises without delay. It should also be ensured that these agencies
are located in the market yards and APMC yards.
There has been asymmetry in the dissemination of knowledge about prices, the
market and various other schemes, among the farmers. Awareness has to be created
about the latest market developments among the farmers to sell their produce such that
they reap the maximum benefits out of their sale. Market information has to be provided
at the market itself and these information centres should be linked to the Raitha
Samparka Kendras (RSKs), making the farmers well-informed of the day to day
fluctuations and movements in the market.
Market imperfection is an important factor that obstructs the path to a developed
marketing system. Farmers have to be encouraged by providing the necessary shield
against these imperfections and safeguard their interests. Establishment of separate
Commodity Boards for specific agricultural commodities can effectively circumvent the
market imperfections.
7.6.2 Conclusions
Market as the invisible hand to correct the mismatch between demand and
supply and act as price fixing institution depends heavily on the assumption of a well-
organised institution. Unfortunately, the present day institutions in domestic market are
far from efficient. The first problem crops up in terms of the infrastructure within the
markets. The farmers in the sample study voiced their views about the insufficiency of
the facilities provided and the operational problems in the access to these facilities. The
police firing on the agitating farmers at Sira Regulated Market Yard (in which a few
farmers died) in Tumkur district in the state is a case emanated from such inadequacy.
The imperfection exists in weighing, grading, providing gunny bags, market cartels,
interlocking of the product and the credit market and above all the elected
representatives of the farmers siding the traders in the event of the disputes. The
Agricultural Produce Market Committee is a politically connected organization and
hence, discrimination against a group exists by design than by chance. Therefore, the
inefficiencies in the functioning of the market is the main reason distancing the farmer
from the market and allowing a free hand to the middleman. This was attempted to be
corrected through the Agricultural Produce Marketing Act.
The Agricultural Produce Marketing Act was created during the late sixties on the
lines of the model act circulated to the State governments. Agricultural Marketing is a
subject in the State list and therefore, the Act was passed by each of the State
governments differently. The Act provided for better regulation of marketing of
agricultural produce and the establishment and administration of markets for
agricultural produce. It was amended from time to time to make it more effective. In
practice, however, the law is being circumvented to accommodate the imperfections. In
the letter it exists but not in spirit and this fact was reported by many of the
respondents in the survey. The APMCs are more absorbed in managing the funds and
their disposal. The members are rarely aware of the problems and even when they are,
it is always beneficial for them to side the trader or the Commission Agent. The
Commission Agent is a licensed functionary of the APMCs but in the Markets that we
visited the licensed functional Commission Agents were rarely to be seen and others
transacted most of the business. As a result the farmers did not get the price that they
should have received legitimately. There is hardly any protection for this loss to the
farmer in terms of insurance or other schemes.
Market intervention scheme was introduced way back in the late sixties in the
State. But the scheme was never in its full operation in the state. Initially when the
compulsory procurement was undertaken through the Rice Mills there was significant
procurement in the State. After the closure of the compulsory procurement scheme the
quantity procured came down gradually. In the State, the Food Corporation of India
undertakes the procurement. Similarly, the scheme of Minimum Support prices is in
operation in the State but there is hardly any significant procurement under the
scheme. The procurement of paddy during the year of reference was less than .05
percent of the produce and that of maize was about 20 per cent of the produce. In a
recent study it was clearly brought out that the market intervention schemes through
MSP was ineffective in Karnataka. The sample farmers also revealed no awareness of

the MSP scheme. But in the wake of farmers unrest the State government has
undertaken various steps to alleviate the situation.
Institutional innovations in the State of Karnataka include the setting up of
Agricultural Commission to look into the problems of low productivity. Another
important step taken was the establishment of the State Agricultural Prices Commission
under the Chairmanship of an eminent agricultural economist. The APC has been
assigned the tasks of advising the state government on issues pertaining to price
policy, to recommend MSP for crops not covered by CACP and to analyse the
agricultural price policy in the context of the state. The APC has submitted its reports to
the State government. One of the important steps taken by the State government is
the setting up of a special fund to finance market intervention schemes at the shortest
notice. An amount of Rs 100 crores has been set-aside for this purpose. In addition to
these steps, the State government has also taken steps to begin the direct farmers’
markets (Raithara Santhe). In these markets, the farmers can directly come and sell
their produce to the purchaser eliminating the role of the Commission Agent. But these
markets are largely confined to vegetables and fruits and have not yet covered the
grains.

REFERENCES
Acharya, S.S. (2000). Domestic Agricultural Marketing Policies , Incentives and
Integration. In S.S. Acharya & D.P. Chaudhuri (eds.). Indian Agricultural Policy at the
Crossroadss. New Delhi: Rawat Publications.
Bardhan, Pranab (1990). Symposium on the State and Economic Development, Journal
of Economic Perspectives, 4 (3): 3-7.
Boeninger, Edardo (1991). Governance and Development: Issues and Constraints,
Proceedings of the World Bank Annual Conference on Development Economics,
Washington D. C.: The World Bank.
Byres, Terence J. (1997). The State Development and Liberalisation in India. New Delhi:
Oxford University Press.
Chenery, Hollis and T.N. Srinivasan (eds.) (1989). Handbook of Development
Economics. New York: Elsevier Science Publishers.
Datta-Chaudhuri, Mrinal (1990). Market failure and Government Failure, Journal of
Economic Perspectives, 4 (3): 25-39.
Deshpande, R. S. (1996). Demand and Supply of Agricultural Commodities – A Review.
Indian Journal of Agricultural Economics, 15(1 and 2): 270.
Government of Karnataka (2000). The Karnataka Agricultural Produce and Marketing
(Regulation) Act. Bangalore: Karnataka Law Journal Publications.
Government of Karnataka (various years). Economic Survey of Karnataka, Bangalore:
Department of Planning and Statistics, Directorate of Economics and Statistics.

Government of Karnataka (various years). Karnataka at a Glance, Bangalore:
Department of Planning and Statistics, Directorate of Economics and Statistics.
Krueger, Anne O. (1990). Government Failures in Development”. Journal of Economic
Perspectives, 4 (3): 9-23.
Mueller, Dennis C. (1996). Perspective on Public Choice: A Handbook, New York:
Cambridge University Press.
Satyan, B. N. (ed.) (1967). Mysore State – Chitradurga District, Gazetteer of India, Govt.
of Karnataka.
Shleifer, Andrei. (1998). State versus Private Ownership, Journal of Economic
Perspectives, 12 (4): 133-150.
Stiglitz, Joseph (2002). Globalisation and its Discontents, London: Allen Lane-Penguin
Books.
Venkatachalam, L. (2003). Infrastructure and Agricultural Development in Karnataka
State. Bangalore: ADRT Unit, Institute for Social and Economic Change.
World Bank (1991). Proceedings of the World Bank Annual Conference on Development
Economics, Washington D. C. : The World Bank.