Building a Strong Foundation. With You. - PNB MetLife
211
2017-18 Annual Report Building a Strong Foundation. With You.
-
Upload
khangminh22 -
Category
Documents
-
view
2 -
download
0
Transcript of Building a Strong Foundation. With You. - PNB MetLife

2017-18Annual Report
Building a Strong Foundation. With You.


Contents
02 Overview
03 Our Competitive Strengths
08 Our Strategies
12 Our Products
16 Distribution
26 Information Technology and Digitization
28 Operations
34 Customers
34 Reinsurance
36 Investments
40 Risk Management
42 Competition
43 Brand Strength and Marketing
43 Accreditations, Awards and Achievements
45 Employees
45 Corporate Governance
45 Intellectual Property
45 Ethics and Compliance
46 Legal Proceedings
46 Properties
46 Corporate Social Responsibility
48 Board of Directors
52 Management Team
55 Directors’ Report
66 Corporate Governance Report
68 Annexures to the Directors’ Report
Corporate Overview Statutory Reports
100 Independent Auditors Report
106 Balance Sheet
107 Revenue Accounts
109ProfitandLossAccount
110 Receipt and Payments Account
128 Notes to Accounts
140 Annexures
204 Management Report
Financial Statements
For more details, please visit:www.pnbmetlife.com
OverviewWe were one of the top 10 private life insurance companies in India based on total new business premium in Fiscal 2018 and are growing rapidly with a compounded annual growth rate of 19.85% in total new business premium from Fiscal 2015 to Fiscal 2018, according to CRISIL (CRISIL Research, “Analysis of Life Insurance Industry in
India”, July 10, 2018). From Fiscal 2017 to Fiscal 2018, our total new business premium increased at a compounded annual growth rate of 24.23%, compared to the total new business premium for the Indian life insurance sector increasing at a compounded annual growth rate of 10.77% (Source: CRISIL). Our history and relationships with MetLife and PNB have enabled us to become a strong, professionally managed company with the capabilities necessary to take advantage of significant opportunities in the fast growing Indian life insurance market. We have a pan-India, multi-channel distribution network and a comprehensive product portfolio
and provide an end-to-end customer-centric service experience. We believe this positions us well to access a broad Indian customer base and address the diverse and evolving needs of Indian customers. We seek to leverage our capabilities through our scalable platform to generate profitable growth, particularly in underpenetrated segments of India’s life insurance market.
The Indian life insurance market is the tenth largest life insurance market in the world and the fifth largest in Asia in terms of total premium in Fiscal 2017, according to Swiss Re Institute, sigma No 3/2017. Total new business premium in the Indian life insurance market grew at a compounded annual growth rate of 19.66% between Fiscal 2015 and Fiscal 2018 and 10.77% from Fiscal 2017 to Fiscal 2018 (Source: CRISIL). However, India continues to be an underpenetrated insurance market with a life insurance penetration of only 2.7% in Fiscal 2016, compared to a global average of 3.5% (Source: CRISIL). In
addition, the protection gap in India, which is the difference between the insurance protection cover required and the cover actually insured in a particular period, is amongst the highest globally at US$8.5 trillion in 2014 (Source: CRISIL).
In Fiscal 2018, we had the fourth highest individual product mix based on total new business premium in India (Source: CRISIL). Our individual new business premium accounted for 92.12%, 89.74% and 87.90% of our total new business premium in Fiscal 2016, Fiscal 2017 and Fiscal 2018, respectively. Our individual new business premium increased at a compounded annual growth rate of 20.25% from Fiscal 2015 through Fiscal 2018. In Fiscal 2018, our embedded value growth was 17.5%, our operating return on embedded value was 16.1% and our value of new business margin was 17.1%. Our profit before tax was ` 677.11 million, ` 1,034.22 million and ` 1,416.92 million in Fiscal 2016, Fiscal 2017 and Fiscal 2018, respectively.
Our distribution network consists of our bancassurance, direct sales, agency and other distribution channels, through which we generated 65.02%, 27.53%, 4.80% and 2.65% of our total new business premium, respectively, and 64.59%, 29.48%, 5.43% and 0.51% of our individual new business premium, respectively, in Fiscal 2018. Our product portfolio covers three principal customer needs – savings, protection and pension, which in Fiscal 2018 accounted for 82.10%, 14.89% and 3.01% of our total new business premium, respectively, and 93.41%, 4.09% and 2.51% of our individual new business premium, respectively.
Our two Promoters, MIHL and PNB, hold 26% and 30% of our Equity Shares, respectively. MetLife, including its subsidiaries and affiliates, is a leading global insurance company with a presence in more than 40 countries. MIHL, a subsidiary of MetLife, has been our shareholder since August 2001. PNB is the second largest bank in India based on total branches as of December 31, 2017 (Source: CRISIL). PNB has been our distribution partner since October 2011 and our shareholder since January 2013.
Our individual new business premium increased at a compounded annual growth rate of 20.25% from Fiscal 2015 through Fiscal 2018. In Fiscal 2018, our embedded value growth was 17.5%, our operating return on embedded value was 16.1% and our value of new business margin was 17.1%.
2

Our Competitive StrengthsWe expect the following competitive strengths will enable us to continue growing our business while delivering value to our shareholders:
• Our pan-India, multi-channel distribution network positions us to access a demographically and geographically broad customer base across India.
• Our comprehensive product portfolio addresses the diverse and evolving needs of Indian customers, and is complemented by an end-to-end customer-centric service experience.
• Our scalable platform positions us for profitable growth.
• Our experienced management team.
Pan-India multi-channel distribution network with strong bancassurance partners
We have established a pan-India, multi-channel distribution network that includes productive bancassurance relationships with our bancassurance partners, as well as strong direct sales and agency channels that we actively manage through a consolidated operating model. Our pan-India distribution presence enables us to access a geographically and demographically broad Indian customer base, including a wide set of under-penetrated customer segments. Our distribution network allows
us to have a balanced geographic business mix. In Fiscal 2018, we generated 42.47%, 39.30% and 18.23% of our individual new business premium from metro, urban and semi-urban, and rural geographies in India, respectively.
Bancassurance
As of December 31, 2017, we had the second largest bancassurance platform in India based on number of scheduled bank branches across India (Source: CRISIL). Our key bancassurance partners include PNB, the second largest bank in India based on total branches as of December 31, 2017 (Source: CRISIL), as well as Jammu and Kashmir Bank Limited (“JKB”) and Karnataka Bank Limited (“KBL”), which together with our other bancassurance partners, provided us access to 11,239 branches as of December 31, 2017.
• PNB
PNB is our largest bancassurance partner with 7,059 bank branches located across India and more than 100 million banking customers as of December 31, 2017. PNB has been exclusively distributing our life insurance products since October 2011. As of December 31, 2017, 18.8% of PNB’s branches were located in metro areas, 44.8% were located in urban and semi-urban areas and 36.4% were located in rural areas, providing us access to a large number of India’s geographic market segments (Source: CRISIL). In Fiscal 2018, 36.11%, 42.96% and
Financial StatementsStatutory ReportsCorporate Overview
3

20.93% of our individual new business premium generated through PNB were from branches located in metro, urban and semi-urban and rural geographies, respectively. From Fiscal 2015 through Fiscal 2018, the total new business premium and individual new business premium that we generated through PNB grew at a compounded annual growth rates of 30.80% and 27.32%, respectively. We generated a total new business premium of ̀ 7,530.76 million and individual new business premium of ` 6,636.47 million through PNB in Fiscal 2018.
• Other key bancassurance partnerships
In addition to PNB, we also have other bancassurance partnerships, which include JKB and KBL, both of which have been our partners for more than 14 years each. These other relationships complement the PNB branch network. JKB has 940 bank branches as of December 31, 2017 (Source: CRISIL). JKB had a 44.1% share of all bank branches in Jammu and Kashmir state, which is highest among all banks in that state as of December 31, 2017 (Source: CRISIL). JKB holds 5.08% of our equity shares and exclusively distributes our life insurance products. KBL had 806 bank branches as of December 31, 2017. We benefit from the strong market position of KBL in South India (Source: CRISIL). We also have relationships with five Regional Rural Banks (“RRBs”), which are sponsored by PNB. We have also partnered with American Express Banking Corporation since July 2012 to distribute our life insurance products.
Direct sales and agency
We also have direct sales and agency sales channels that complement our bancassurance channel by allowing us to target more affluent metro, and urban and semi-urban customers through a sales process adapted to their needs.
• Direct sales
As of March 31, 2018, our direct sales channel included 4,048 insurance managers, who are experienced insurance sales professionals employed by the Company to market and sell our products to new customers through their own networks. As of March 31, 2018, we also had 225 loyalty managers who focus on servicing existing policies and cross selling products to our existing customers with the support of our lead management systems. Our insurance managers are generally located across urban areas and are present in 92 cities in India. In contrast, our loyalty managers focus on 18 key Indian cities and have a strong presence in metro areas. From Fiscal 2015 through Fiscal 2018, total new business premium and individual new business premium that we generated through our direct sales channel grew at a compounded annual growth rate of 18.53% and 25.72%, respectively. We generated 31.16%, 29.03% and 27.53% of our total new business premium and 31.84%, 30.29% and 29.48% of our individual new business premium through our direct sales channel in Fiscal 2016, Fiscal 2017 and Fiscal 2018, respectively.
• Agency
Our agency sales channel comprises 6,452 exclusive agents as of March 31, 2018. These exclusive agents are not our employees but have contracts in place with us to sell only our life insurance products. We compensate our agents based on their performance. We seek to ensure that our agents provide quality services to our customers and source business efficiently. As of March 31, 2018, our agency force is present in 92 cities. We generated 9.30%, 5.65% and 4.80% of our total new business premium and 10.04%, 6.27% and 5.43% of our individual new business premium
4

through our agency sales channel in Fiscal 2016, Fiscal 2017 and Fiscal 2018, respectively.
We employ a consolidated operating model with a common group of sales managers to manage our insurance managers, loyalty managers and our exclusive agents in order to increase sales productivity and efficiency. We had an average of 890 sales managers dedicated to this operating model for Fiscal 2018. Our sales manager productivity, which we measure as total new business premium divided by the average number of sales managers for the period, increased from ` 1.79 million in Fiscal 2015 to ` 4.74 million in Fiscal 2018.
For reporting purposes, our direct sales channel also includes our website, through which we sell individual life insurance products. In addition, we have direct agreements with 627 corporate groups to provide them with group life insurance products to meet their employee benefit needs. In Fiscal 2018, direct sales of group life insurance products, which are primarily protection products, constituted 1.62% of our total new business premium.
Comprehensive product portfolio addressing the diverse and evolving needs of Indian customers and end-to-end customer-centric service experience
Comprehensive product portfolio
We have developed a comprehensive product portfolio that addresses the diverse and evolving needs of the various customer segments that we access through our pan-India multi-channel distribution network. Our product portfolio is focused on providing protection, savings and pension products that cater to customers’ needs through various stages of their lives. We complement our broad product offering with an end-to-end customer-centric service experience. The alignment between our broad product portfolio and the diversity of our customers’ needs, combined with our approach to customer service, is aimed at creating a longer-term value proposition for our customers. We are able to offer this proposition across our various market segments.
Within each product category, we target our products at attractive customer segments that we can effectively and efficiently access through each of our distribution channels. We offer savings products to a wide range
of customers to fulfil their needs across different life-stages. We offer protection products, such as credit life, individual term and health insurance products, to bancassurance customers; individual term and health insurance products to our direct sales and agency sales channel customers; and group term products to our corporate customers. There is a growing need for protection products across various customer segments in India. Our targeted approach enables us to capture a greater portion of this attractive market segment. Consequently, we have consistently written a high proportion of protection products, which accounted for 17.14%, 15.75% and 14.89% of our total new business premium in each of Fiscal 2016, Fiscal 2017 and Fiscal 2018, respectively. As of March 31, 2018, we offer 9 protection products, and believe we are well positioned to continue to focus on products that meet India’s growing protection needs.
Similarly, our unit-linked segments cater to the specific customer needs of the more affluent metro and urban customers that we are able to access through our distribution network. In metro areas, our unit-linked segments accounted for 25.57% of our individual new business premium in Fiscal 2018, as compared to 15.10% in urban and semi-urban areas and 16.73% in rural areas, respectively.
End-to-end customer-centric service experience
We complement our product portfolio with an end-to-end customer-centric service experience enhanced by digitization and technology and support processes. We have an integrated approach to on-boarding customers through simplified underwriting and “straight-through processing” of customer proposal forms, which does not involve any manual underwriting. Once an application is logged in, it is processed through an automated underwriting engine. One of our key initiatives has been to streamline our pre-sales and sales processes through “e-branch”, our digital platform officially launched in 2016. Our e-branch platform aims to provide a seamless, user-friendly customer experience from the prospective customer stage to policy issuance. It also helps us enhance our customer relationships and improve customer retention through customer
From Fiscal 2015 through Fiscal 2018, the total new business premium and individual new business premium that we generated through PNB grew at a compounded annual growth rates of 30.80% and 27.32%, respectively.
Financial StatementsStatutory ReportsCorporate Overview
5

interaction histories, calendars that manage customer engagement, analytics for customer funnel analysis, which analyzes the on-boarding process at various stages to target prospective customers, and alerts and notifications on various customer life events, policy anniversaries, birthdays and appointments. We have also created an online portal that provides customers access to their policy and fund information and allows them to pay their premium through their internet banking platform. We also have our Met Care Kit, which has the aim of simplifying the claims process by providing the customer with a comprehensive list of documents and forms required for processing a claim.
The alignment between our broad product portfolio and the diversity of our customers’ needs, combined with our approach to customer service, has been a key contributor to improvements in our persistency ratios. Our 13th month persistency ratio has improved from 67.99% in Fiscal 2016 to 71.78% in Fiscal 2017 and 77.03% in Fiscal 2018. We expect that our product portfolio and our customer services will continue to drive improvements in our persistency ratios over the longer-term, including for subsequent premium.
Scalable platform, well-positioned for profitable growth
We have undertaken a series of initiatives involving both targeted investment and cost reduction measures in order to create an efficient, scalable platform that positions our business for profitable growth. Our initiatives have focused on investing in processes, technology, training and people to achieve higher revenue growth with limited additional net investment.
In relation to our bancassurance distribution network, we have invested in technologies such as sales force automation tools and our e-branch platform, which are intended to integrate seamlessly with the systems and processes of PNB to improve productivity and realize scale in our business. Our investment in this technology supports deployment across additional PNB branches, as well as deployment in other bancassurance partners. We have also successfully implemented digitization of our training
content on PNB’s internal portal, including our life insurance training program. This investment in training facilitates growth of the number of PNB bank sales persons, who are PNB employees qualified to sell our products in PNB’s branch network, which will also increase sales productivity.
We manage our bancassurance channel through our bancassurance relationship managers. We increased the number of our PNB bancassurance relationship managers from an average of 1,708 in Fiscal 2015 to an average of 2,350 in Fiscal 2018, while the number of PNB’s sales persons licensed to sell our products increased from 2,821 as of March 31, 2015 to 5,929 as of March 31, 2018. The productivity of this structure, which we measure as our total new business premium divided by the average number of PNB bancassurance relationship managers for the period, increased from ` 1.97 million per annum in Fiscal 2015 to ` 3.20 million per annum in Fiscal 2018. Given the scalability of our existing network of relationship managers, we have the capacity to efficiently support and manage additional increases in the number of PNB qualified bank sales persons, allowing greater penetration of our PNB bancassurance channel.
The consolidated operating model for the management of our direct sales and agency sales channels is designed to efficiently scale our business. Our sales manager productivity, which we measure as total new business premium divided by average number of sales managers for the year, increased at a compounded annual growth rate of 38.25% from ` 1.79 million in Fiscal 2015 to ` 4.74 million in Fiscal 2018.
We have also made other investments in information technology to develop a resilient information technology architecture, which can support significant additional business without additional investment. In particular, we have invested in digitization across our business to improve productivity by reducing turnaround times, simplifying processes and reducing our dependence on paperwork and physical infrastructure. We have also made investments that improve our ability to use and process internal and external data effectively and have created an enterprise data warehouse in order to improve the overall quality of our data.
The alignment between our broad product portfolio and the diversity of our customers’ needs, combined with our approach to customer service, has been a key contributor to improvements in our persistency ratios.
6
We have also undertaken other initiatives focused on reducing costs and exercised strong control over expense in order to support profitable growth over the longer-term. In particular, we have undertaken a number of cost control measures, including reducing the number of our Company branches from 161 as of March 31, 2014 to 110 as of March 31, 2018, reducing the number of our administrative and management employees in our consolidated operating model from 77 as of March 31, 2015 to 50 as of March 31, 2018 and reducing the number of our sales managers from 1,868 as of March 31, 2015 to 836 as of March 31, 2018.
As a result of our initiatives, we have improved our operating expense ratio from 24.53% in Fiscal 2015 to 20.61% in Fiscal 2018, while growing total new business premium at a compounded annual rate of 19.85% during the same period. Similarly, we grew our individual new business premium at a compounded annual growth rate of 20.25% between Fiscal 2015 and Fiscal 2018, while our expenses have increased by only 10.52% during the same period. Our operating return on embedded value has increased from 14.0% for the 12 month period ended September 30, 2017, as reported by the Company, to 16.1% for Fiscal 2018. Our value of new business margin increased from
16.1% for the 12 month period ended September 30, 2017, as reported by the Company, to 17.1% in Fiscal 2018.
As our pan-India multi-channel distribution network and our comprehensive product portfolio enable us to drive further revenue growth, we expect that the scalability of our platform will enable us to reduce our operating expense ratio and continue to improve our profitability.
Experienced management team
Our experienced senior management team has in-depth industry knowledge and experience across each key functional area within our business. As of March 31, 2018, our Key Managerial Personnel had an average of approximately 20 years of experience. We have continually augmented our management team to bring new perspectives to our business. Our approach has enabled us to successfully implement the initiatives across our business that have increased our operational efficiencies, improved our financial performance and now position us to deliver profitable growth. We believe that our management team’s vision and experience will enable us to capitalize on our strengths and implement our strategies in order to take advantage of significant opportunities in the fast growing Indian life insurance market.
Financial StatementsStatutory ReportsCorporate Overview
7

Our StrategiesOur strategy is to leverage our competitive strengths to continue to grow our business while delivering value to our shareholders. We will seek to achieve this by:
• Increasing the activation of the PNB branch network and deepening our penetration of the PNB customer base.
• Growing and diversifying our multi-channel distribution footprint to strengthen our position in various geographies and customer segments.
• Deliver products aligned to the diverse needs of Indian customers supported by an end-to-end customer-centric service experience.
• Driving profitability by leveraging scale and increasing persistency.
• Utilizing information technology and implementing digitization to drive efficiencies.
Increase the activation of the PNB branch network and deepening our penetration of the PNB customer base
We intend to realize further potential in the PNB distribution network by increasing activation in the PNB branch network and deepening our penetration of the PNB customer base of activated branches. Activation occurs when a PNB branch sells at least one of our products in each month of a given period. We will continue to actively
collaborate with PNB through a steering committee in order to identify high potential branches for activation, and pursue branch activation in phases based on our assessment of the relative potential of each branch. Once a branch has been identified, we are able to leverage our technology to provide the necessary training to PNB employees to enable them to obtain the license necessary to sell our products and the skills required to do so effectively. We are also able to deploy our e-branch technology in the branch to augment productivity. For Fiscal 2017 and for Fiscal 2018, our PNB branch activation was 34% and 38%, respectively, of all PNB branches. Consequently, our continued activation of PNB branches is expected to enable us to accelerate growth through the PNB distribution network.
More broadly, we intend to leverage our investments in our relationship with PNB to deepen our overall penetration of the PNB customer base across its branch network. Our strategy focuses on people, training, technology and products.
People: The number of PNB employees that are qualified to sell our insurance products increased from 2,821 as of March 31, 2015 to 5,929 as of March 31, 2018. We intend to continue to increase the number of qualified PNB bank sales persons through training and licensing to more fully penetrate the PNB customer base. As the number of PNB bank sales persons grows, we expect we will be able to leverage our existing bancassurance relationship managers to drive productivity with limited incremental cost.
Training: We will also continue to focus on training in order to drive the productivity of the PNB branch network. In particular, we are undertaking training initiatives to enable PNB to more effectively identify sales opportunities and sales training to enable its employees to better market, cross-sell and up-sell our products. In addition, we have digitized our training content on PNB’s internal portal, which has helped facilitate the increase in the number of bank sales persons who are qualified to sell our products in PNB’s branch network.
Technology: We will continue to adapt and deploy technologies, such as sales force automation tools and our e-branch platform, that integrate with the systems and processes of PNB in order to deepen our penetration of the PNB customer base, increase the productivity of its sales force and enhance the PNB customer experience. As of March 31, 2018, 75% of new business sourced through PNB was through our e-branch platform.
Products: The PNB branch network provides us access to India’s geographic market segments. We will continually develop and adapt our products to complement PNB’s products and address the diverse and evolving needs of its customers with, for example, products such as credit life insurance products.
Grow and diversify our multi-channel distribution network to strengthen our position in various geographies and customer segments
5,929The number of PNB employees that are qualified to sell our insurance products increased from 2,821 as of March 31, 2015 to 5,929 as of March 31, 2018.
8

We intend to grow and diversify our distribution network to expand our geographic and customer reach in order to generate new business, consistent with our profitability objectives. We plan to achieve this by strengthening our other existing bancassurance partner relationships and entering into new bancassurance partnerships and other relationships, as well as enhancing our direct sales and agency capabilities.
Strengthen other key bancassurance partnerships: We intend to strengthen our key bancassurance partnerships with JKB, which has a dominant market position in the state of Jammu and Kashmir and KBL, which has a strong market position in South India (Source: CRISIL). We will strengthen these relationships by leveraging the expertise and technology we have developed to increase the number of employees at JKB and KBL that are qualified to sell our insurance products, enhance productivity, integrate processes and enhance customer experience, while offering complementary products appropriate for their respective customer bases.
New bancassurance partnerships and other relationships: We will also continue to explore new bancassurance partnerships that provide us access to attractive geographies and customer segments and enable us to leverage our existing expertise and technology. In July 2017, we entered into a memorandum of understanding with India Post Payments Bank Limited (“IPPB”) to provide group term life insurance cover to the account holders of IPPB pursuant to Pradhan Mantri Jeevan Jyoti Beema Yojna, a government-designed life insurance scheme in India, which was launched under the Government of India (“GoI”) initiative to offer affordable protection to the mass segment of the Indian population. This relationship represents a significant opportunity for future cooperation with IPPB to offer our insurance products across India. In addition,we also recently entered into a distribution arrangement with Bank of Bahrain & Kuwait (“BBK”) for distribution of our products to their customers through BBK’s branches in India. We have also entered into insurance brokering arrangements with Marsh India Insurance Brokers Private Limited, a global insurance broker, and Coretree Insurance Brokers (India) Private
Limited, an insurance broker, to sell our life insurance products. In addition, we are currently in advanced stages of executing a distribution agreement with a financial services company. We will continue to look for similar opportunities while we seek to develop these new relationships.
Focus on key markets for direct sales and agency distribution: We intend to leverage our consolidated operating model to further deepen our penetration in key metro areas and cities in which our insurance managers, loyalty managers and individual agents have a strong presence. Our consolidated operating model enables us to attract insurance managers, loyalty managers and exclusive agents, while enabling us to actively manage productivity through our existing network of sales managers.
Deliver products aligned to customer needs supported by an end-to-end customer-centric service experience
Our product strategy is to deliver products that are aligned to the needs of the Indian customer base in each of our distribution channels and across different geographic market segments. As we implement our strategies to access and penetrate attractive customer segments through our distribution network, we will continue to align our products by developing needs-based solutions supported by research across different life stages. We will implement our product strategy to create a longer-term value proposition for our customers and deliver profitable growth.
Our product strategy is to deliver products that are aligned to the needs of the Indian customer base in each of our distribution channels and across different geographic market segments.
Financial StatementsStatutory ReportsCorporate Overview
9
We will focus on catering to opportunities in the protection segment in India by providing differentiated products based on the customer segments we access through our different distribution channels:
• Bancassurance: We will focus on protection products that are complementary to our bancassurance partners’ products and services.
• Direct and agency: We will focus on higher cover term plans and critical illness health cover that cater to more affluent metro and urban and semi-urban-based customers.
• Online: We will continue to offer innovative protection products with tailor-made options, such as life-stage based cover, child education support, joint life protection and whole life coverage.
• Group: We have a profitable and large group term life portfolio based on agreements we have with 627 corporate groups to provide them with group life insurance products, which are primarily protection products, to meet their employee benefit needs. We will selectively pursue additional agreements with quality corporate groups with the aim of achieving profitable growth.
In addition, we will continue to offer savings products across the unit-linked and non-unit-linked categories, based on the needs of our various customer segments and geographic market segments that we access through our distribution network.
Drive profitability by leveraging scale and improving persistency
We are focused on continually improving our financial results and delivering shareholder value by leveraging our scale and improving our persistency, which is the proportion of customers who continue to maintain their policies with us over certain defined periods as measured in terms of premium. A key aspect of our competitive strengths is the scalability of our platform and our strategy is aimed at enabling us to achieve the benefits of scale in order to drive profitability. In particular, the consolidated operating model we have implemented for our direct sales and agency channels, as well as our management structure for
our bancassurance channel, enable us to increase the number of insurance managers, loyalty managers, individual agents and qualified bank sales persons across our key distribution channels to drive revenue growth with limited incremental investment. We plan to continue to improve efficiencies in customer on-boarding through process re-engineering and automation, including by increasing sales through our e-branch platform, auto-issuance of policies, risk-based underwriting and tele-medicals. Additionally, our investment in technologies enables us to continue to activate additional PNB branches efficiently, as well as deploy similar technology at our other bancassurance partners to realize scale in our business. As we realize the benefits of increased scale, we intend to continually calibrate our organizational structure and cost base in order to deliver profitable growth.
We also intend to achieve improvements in persistency by enhancing an end-to-end customer-centric service experience across the entire customer life cycle. In particular, we plan to drive persistency through targeted customer communications and by focusing on customer engagement and retention levels. We plan to increase customer engagement by increasing our responsiveness to them and through the use of a portal for accessing policy information and managing policies, a dedicated toll-free helpline for customers and services through short message service (“SMS”), and by providing multiple payment options to our customers, while increasing the use of auto-debit payments. In addition, we intend to increase the utilization of self-service transactions, which was 27% in Fiscal 2018, by managing the number of self-service options available to our customers, as well as of our customer engagement calendar to regularly reach out to our existing customers. In addition, increasing customer contactability, which we measure as the number of customers we were able to contact relative to the number of customers to whom we have sold our products for a given period, is a key factor in our ability to increase customer engagement with larger numbers of customers. In Fiscal 2018, our customer contactability was 94%. We also plan to continue to use analytics to improve our customer service and increase our renewal premium. For example, we have built propensity models that give lead
As we realize the benefits of increased scale, we intend to continually calibrate our organizational structure and cost base in order to deliver profitable growth.
10

indicators into customer preferences and segment the “insurability” of customers, which has helped to improve our customer engagement model and increase the productivity of our distribution and retention teams. In addition, we have increased the weight of subsequent premium persistency in our performance evaluation criteria of our management team and sales employees for incentives and career progression. With these initiatives, we aim to improve the satisfaction of our customers, the quality of our business and our persistency.
Utilize information technology and implement digitization to drive efficiencies
We have invested in advanced technologies to develop a flexible information technology architecture, which can accommodate significant increases in business. Our service-oriented technology architecture helps us interact with our customers, bancassurance partners, agents, employees and other intermediaries. These capabilities will become increasingly important as new technologies within our industry evolve and traditional ways of selling insurance and servicing customers evolve. We expect that our information technology systems and our commitment to continue to improve and utilize new technologies will be an important driver to achieving our targeted performance goals. Our information technology strategy is structured around three key concepts: “Data”, “Digitize” and “Disrupt”.
• Data: One of our key strategies is to improve our ability to process and leverage our data effectively in order to generate meaningful and actionable insights, such as predicting the behaviour of our existing and prospective customer base and segmenting our customers and business. We will continue to use data analytics to develop strategies to improve our persistency rates, reduce policy surrenders, help mitigate frauds and manage mortality experience. We will also continue to leverage our data analytics capabilities to improve the productivity and efficiency of our business operations.
• Digitize: We will continue to invest in digitization across our business to improve operational efficiencies, productivity and the scalability of our operations on a selective basis. These
efforts are aimed at helping us to improve our sales productivity, operations and servicing through improved turnaround times, streamline processes and reduce our dependence on paperwork and physical infrastructure, as well as improve our end-to-end customer-centric service experience.
• Disrupt: Participants in the Indian life insurance industry are increasingly looking to increase sales and increase operational efficiencies (Source: CRISIL). We aim to develop disruptive technology to differentiate our business from our competitors. In 2016, we partnered with MetLife’s innovation center for Asia, LumenLab, to launch conVRse, a service application that provides a differentiated, immersive and personalized experience to customers through a virtual reality platform. We are currently piloting Khushi, a virtual assistant based on an artificial intelligence framework that can chat with an existing or prospective customer and help respond to queries related to their policies.
We plan to accelerate our digitization efforts and will explore innovative digital platforms, as well as utilizing artificial intelligence, machine learning, blockchain technology, robotic process automation, chatbot platforms and natural language processing.
Financial StatementsStatutory ReportsCorporate Overview
11

Our Products Our product strategy is to deliver products that are aligned to the needs of our customer base in each of our distribution channels. With our product portfolio, our focus is on providing protection, savings and pension products that cater to customers’ needs across various stages in their lives. Our product portfolio covers three principal customer needs—savings, protection and pension, which accounted for 82.10%, 14.89% and 3.01% of our total new business premium, respectively, and 93.41%, 4.09% and 2.51% of our individual new business premium, respectively, for Fiscal 2018. We feel this positions us well to access a broad Indian customer base and address the diverse and evolving needs of Indian customers.
As of March 31, 2018, we offered our customers 15 savings products, nine protection products and five pension products, along with eight optional product riders. The following table sets forth our new business premium for each of our savings, protection and pension product categories as a percentage of total new business premium by product category for the periods indicated:
Our savings and pension product portfolios comprise three principal product segments: participating, non-participating and unit-linked insurance segments, while all of our protection products fall in the non-participating product segment:
• The participating segment comprises insurance products in which policyholders participate in the profits and losses arising from an underlying participating fund. In accordance with IRDAI regulations, asset allocation in
Fiscal Year ended March 31,
2016 2017 2018
(` in millions)
(%) (` in millions)
(%) (` in millions)
(%)
New business premium
Savings 8,230.11 82.04% 9,368.71 81.55% 11,716.85 82.10%
Protection 1,719.53 17.14% 1,809.08 15.75% 2,124.67 14.89%
Pension 82.02 0.82% 310.06 2.70% 429.29 3.01%
Total 10,031.66 100.00% 11,487.85 100.00% 14,270.81 100.00%
participating funds is made by our investment team and any surplus generated from the participating fund is shared between policyholders and shareholders based on a 90:10 ratio. The objective of a participating product is to provide stable, medium to long-term returns, through a combination of guaranteed and non-guaranteed benefits. The profits shared in the participating products are called “bonuses”, which are declared annually and are discretionary. Bonuses are payable only on maturity or earlier upon death or surrender of the policy. Once declared, bonuses get attached to the policy;
• The non-participating segment comprises products that provide guaranteed benefits to the customer. The policy provides guaranteed benefits on death, survival and maturity to the customer; and
• The unit-linked insurance segment comprises products that offer a combination of insurance and investment, where investment decisions and risks associated with such investments are borne by the policyholders, and non-investment risks, such as mortality and morbidity risks, are borne by us. Asset allocation in unit-linked funds are decided by policyholders, who may choose from specific types of funds, including equity funds, debt funds or hybrid funds.
Savings products
Our savings products offer a safe and stable avenue of investment with the added protection of life cover benefit. Through our savings products, our customers are able to manage their wealth creation objectives, such as for regular income, savings and child education support, through different product alternatives. Our savings portfolio comprised 42.39% participating, 36.36% non-participating and 21.25% unit-linked segments as a percentage of our total savings new business premium in Fiscal 2018.
As of March 31, 2018, we offered individual customers 15 savings products, comprising five participating savings products, four non-participating savings products and six
12

Protection products
Our protection products offer customers financial security at times of loss, such as death, critical illness, disability or an accident. They cater to the specific protection needs of customers during each stage of their lives—from young adult, unmarried, newly married, married with young children, married with grown-up children and elderly. Our protection products include individual term insurance plans that provide lump-sum benefits to the beneficiary on the occurrence of covered events like death, disability or illness and fixed-benefit health insurance plans that provide benefits on the occurrence of covered illness events during the period of the policy. We also offer protection products that are complementary to our bancassurance partners’ products and services. These include income replacement products which can be paired with a bank savings account, as well as credit life products that provide coverage against loans. We also have direct agreements with 627 corporate groups to provide them with primarily group life insurance protection products to meet their employee benefit needs.
Although the majority of our protection policies expire without value at the end of the coverage period, there are policy variations that offer a refund of premium to the policyholder if the relevant covered event does not occur. All of our protection products fall into the non-participating product segment, where the benefits on death, disability or illness are guaranteed,
and include the following principal product categories:
• Individual term products offer a guaranteed lump-sum benefit or an income stream for specified periods on the occurrence of contingent event like death, disability or illness of an individual during the period of coverage.
• Individual health insurance products offer fixed benefit coverage against covered critical illnesses.
• Credit life term products offer liability protection to our customers by covering repayment of outstanding loan in the event of death of the individual borrower.
• Group term products offer life cover on a yearly renewable basis to both employer-employee and non-employer-employee groups.
• Protection riders offer supplementary cover that can be attached to individual and group insurance products, on payment of additional premium. Riders provide additional death, disability or critical illness benefits to beneficiaries.
As of March 31, 2018, we offered customers nine non-participating protection products, comprising five individual protection products and four group protection products. In addition, we offered eight optional protection product riders, comprising four individual insurance riders and four group insurance riders as of March 31, 2018. Since March 31, 2018, we have also launched one additional group credit life protection product. In Fiscal 2018, 24.12%,
Savings portfolio Fiscal Year ended March 31,
2016 2017 2018
(` in millions)
(%) (` in millions)
(%) (` in millions)
(%)
New business premium
Participating 4,567.86 55.50% 4,950.82 52.84% 4,966.79 42.39%
Non-Participating 912.66 11.09% 3,403.72 36.33% 4,260.80 36.36%
Unit-Linked 2,749.59 33.41% 1,014.17 10.83% 2,489.27 21.25%
Total 8,230.11 100.00% 9,368.71 100.00% 11,716.85 100.00%
unit-linked savings products. The following table sets forth total new business premium generated from savings products by product segment for the periods indicated:
Note: Total new business premium for product segments include premium generated through sale of riders (if any).
Financial StatementsStatutory ReportsCorporate Overview
13

56.39% and 19.49% of our total new business premium generated from the sale of protection products were from the sale of individual products, credit life and group term life products, respectively.
The following table sets forth total new business premium for our protection products and riders for the periods indicated:
Protection portfolio
Fiscal Year ended March 31,
2016 2017 2018
(` in millions)
(%) (` in millions)
(%) (` in millions)
(%)
New business premium
Non- Participating
1,719.53 100.00% 1,809.08 100.00% 2,124.67 100.00%
Total 1,719.53 100.00 1,809.08 100.00 2,124.67 100.00
Note: Total new business premium for product segments include premium generated through sale of riders (if any).
Pension portfolio Fiscal Year ended March 31,
2016 2017 2018
(` in millions)
(%) (` in millions)
(%) (` in millions)
(%)
New business premium (Total)
Participating 43.96 53.60% 194.56 62.75% 228.78 53.29%
Non-Participating 31.18 38.02% 105.65 34.07% 94.21 21.95%
Unit-Linked 6.87 8.38% 9.86 3.18% 106.29 24.76%
Total 82.02 100.00% 310.06 100.00% 429.29 100.00%
Note: Total new business premium for product segments include premium generated through sale of riders (if any).
Pension products
Our pension products are designed to offer individuals financial support after retirement by supplementing their retirement income. Depending on their life-stage and financial planning priorities, our customers may choose from participating, non-participating and unit-linked pension products. Our participating pension products include deferred pension plans, which assist our customers to accumulate money in order to secure post-retirement income. Our non-participating pension products include products such as our immediate annuity product which provides immediate guaranteed income post payment of single lump-sum. We also offer fund-based group pension products, which our corporate customers use as investment vehicles to back their pension and gratuity liabilities towards their employees on both traditional and unit-linked platforms.
As of March 31, 2018, we offered five pension products, comprising three non-participating products, one participating product and one unit-linked product. The following table sets forth total new business premium for our pension products by product segment for the periods indicated:
Individual and group products
As of March 31, 2018, we offered 22 individual products, seven group products and eight optional product riders. Since March 31, 2018, we have also launched one additional group credit life protection product. In Fiscal 2018, participating, non-participating and unit-linked products comprised 36.41%, 45.41% and 18.19% of our total new business premium, respectively. The tables below set forth the products we offer by product category, product and rider type and primary customer need addressed as of March 31, 2018:
14

Individual Products
Product Category Segment/rider type Primary customer need addressed/(number of products)
Savings Participating Wealth Creation (2)
Income/Savings (1)
Child Education (2)
Non-Participating Income/Savings (3)
Wealth Creation (1)
Unit-Linked Wealth Creation (5)
Child Education (1)
Protection Non-Participating Protection (Term) (2)
Protection - Income replacement (1)
Protection (Mass segment) (1)
Protection (Term plus Health) (1)
Protection (Individual) (1)*
Health (Individual) (3)*
Pension Participating Deferred pension (1)
Non-Participating Immediate Annuity (1)
* Optional riders, which offer supplementary cover that can be attached to individual insurance products, on payment of additional premium.
Group Products
Product Category Segment/rider type Primary customer need addressed/(number of products)
Protection Non-Participating Protection (Group Term) (3)
Protection (Group Credit Life) (1)*
Health (Group) (4)**
Pension Non- Participating Traditional EB (1)
Superannuation (1)
Unit-Linked Unit-Linked EB (1)
* Since March 31, 2018, we have also launched one additional group credit life protection product.
** Optional riders, which offer supplementary cover that can be attached to group insurance products, on payment of additional premium.
The table below sets forth the first-year premium, single premium and renewal premium for our individual and group products for the periods indicated:
Pension portfolio Fiscal Year ended March 31,
2015 2016 2017 2018(` in millions)
First-year premiumIndividual products 7,144.55 9,138.10 10,115.02 12,173.93Group products 984.45 443.41 543.15 437.08Total 8,129.00 9,581.51 10,658.17 12,611.01
Single premiumIndividual products 70.00 103.17 194.49 370.20Group products 91.62 346.98 635.19 1,289.60Total 161.62 450.15 829.68 1,659.80
Renewal premiumIndividual products 15,136.52 16,581.05 19,457.08 23,816.35Group products 1,184.71 1,665.63 1,415.87 1,447.95Total 16,321.24 18,246.68 20,872.95 25,264.30
Total 24,611.86 28,278.34 32,360.80 39,535.11
Financial StatementsStatutory ReportsCorporate Overview
15

Distribution
We have a pan-India multi-channel distribution network that includes productive bancassurance relationships and strong direct sales and agency channels that we manage through a consolidated operating model. Our distribution presence enables us to access a geographically and demographically broad Indian customer base, including a wide set of attractive, under-penetrated customer segments. As of March 31, 2018, our distribution network comprised the following channels:
• Our bancassurance channel, which includes our key partnerships with PNB, as well as JKB and KBL, which together with our other bancassurance partners, provided us access to 11,239 branches as of December 31, 2017.
• Our direct sales and agency channels, which complement our bancassurance channel by allowing us to target more affluent, metro- and urban-based customers through a sales process adapted to their needs:
• Our direct sales channel, which included 4,048 insurance managers as of March 31, 2018, who are experienced insurance sales professionals employed by the Company to market and sell our products to new customers through
their own networks and 225 loyalty managers who focus on servicing existing policies and cross selling additional products to our existing customers with the support of our lead management systems as of March 31, 2018, as well as sales of individual products online through our website and group sales; and
• Our agency channel, which comprised 6,452 exclusive agents as of March 31, 2018. We compensate our agents based on their performance. We seek to ensure that our agents provide quality services to our customers and source business efficiently.
• Our other distribution channel, which includes insurance marketing firms, micro insurance and licensed insurance brokers.
Through our bancassurance, direct sales, agency and other distribution channels, we generated 65.02%, 27.53%, 4.80% and 2.65% of our total new business premium, respectively, and 64.59%, 29.48%, 5.43% and 0.51% of our individual new business premium, respectively, in Fiscal 2018.
The following table sets forth the contributions of each of our distribution channels to our individual new business premium for the periods indicated:
Fiscal Year ended March 31,
2016 2017 2018
(` in millions)
(%) (` in millions)
(%) (` in millions)
(%)
Bancassurance
PNB 3,882.24 42.01% 5,069.51 49.17% 6,636.47 52.90%
JKB 686.38 7.43% 551.03 5.34% 686.04 5.47%
KBL 690.76 7.47% 749.15 7.27% 656.54 5.23%
Other banks 109.02 1.18% 144.42 1.40% 123.52 0.98%
5,368.40 58.09% 6,514.11 63.19% 8,102.57 64.59%
Direct Sales
Insurance Manager 2,484.43 26.88% 2,415.25 23.43% 2,908.05 23.18%
Loyalty Manager 386.97 4.19% 536.78 5.21% 621.95 4.96%
Direct Sales - others 70.65 0.76% 170.39 1.65% 167.47 1.34%
2,942.06 31.84% 3,122.41 30.29% 3,697.47 29.48%
Agency 928.11 10.04% 646.16 6.27% 680.62 5.43%
Others 2.69 0.03% 26.82 0.26% 63.47 0.51%
Total 9,241.26 100.00% 10,309.51 100.00% 12,544.13 100.00%
Retail as % of total new business premium
- 92.12% - 89.74% - 87.90%
16

Fiscal Year ended March 31,
2016 2017 2018
(` in millions)
(%) (` in millions)
(%) (` in millions)
(%)
Bancassurance
PNB 3,924.27 40.77% 5,086.20 47.35% 6,544.33 51.22%
JKB 705.22 7.33% 567.16 5.28% 710.63 5.56%
KBL 691.93 7.19% 750.43 6.99% 659.99 5.17%
Other banks 130.24 1.35% 164.74 1.53% 127.43 1.00%
5,451.67 56.63% 6,568.53 61.15% 8,042.38 62.94%
Direct Sales
Insurance Manager 2,437.50 25.32% 2,345.94 21.84% 2,847.87 22.29%
Loyalty Manager 376.68 3.91% 509.11 4.74% 609.00 4.77%
Direct Sales - others 239.42 2.49% 369.95 3.44% 323.40 2.53%
3,053.61 31.72% 3,225.01 30.02% 3,780.27 29.59%
Agency 917.41 9.53% 626.80 5.84% 618.97 4.84%
Others 203.84 2.12% 320.80 2.99% 335.36 2.62%
Total 9,626.53 100.00% 10,741.13 100.00% 12,776.99 100.00%
The following table sets forth the contributions of each of our distribution channels to our weighted received premium for the periods indicated. Weighted received premium is defined as 100% of first year premium plus 10% of single premium.
Geographic mix
Our distribution network provides us with a balanced geographic business mix. In Fiscal 2018, we generated 42.47%, 39.30% and 18.23% of our individual new business premium from metro, urban and semi-urban, and rural geographies in India, respectively.
We focus on targeting our products at the respective customer segments that we can access through each of our distribution channels. For example, we offer credit life and individual term products to bancassurance customers, individual term products to our direct sales and agency sales customers and group term products to our corporate customers. We do this in order to capture the growing need for protection products across various customer segments in India. Consequently, we have consistently written a high proportion of protection products, which accounted for 17.14%, 15.75% and 14.89% of our total new business premium in Fiscal 2016, Fiscal 2017 and Fiscal 2018, respectively. As of March 31, 2018, we offer 9 protection products aimed at helping to address India’s growing protection needs.
Similarly, our unit-linked segments cater to the specific customer needs of the more affluent metro- and urban customers that we are able to access through our loyalty manager channel due to its focus on 18 key Indian cities and its strong presence in metro areas. In metro areas, unit-linked segments accounted for 25.57% of our individual new business premium in Fiscal 2018, while unit-linked segments accounted for 15.10% in urban and semi-urban areas and 16.73% in rural areas, respectively. In urban and semi-urban areas, our bancassurance channel is a high proportion of our distribution mix and we offer a balanced mix of participating and non-participating products while our unit-linked product mix is significantly lower in urban and semi-urban areas relative to our unit-linked segment in metro areas. In rural areas, our bancassurance channel is a relatively high proportion of our distribution mix and we offer a balanced mix of participating and non-participating products while our unit-linked product mix is low.
Financial StatementsStatutory ReportsCorporate Overview
17

Average ticket size
For Fiscal 2016, Fiscal 2017 and Fiscal 2018, our average ticket size (“ATS”) based on individual new business premium was ` 38,412.12, ` 47,589.97 and ` 57,105.48, respectively. Our ATS has increased at a compounded annual growth rate of 16.39% and our number of individual policies (“NOP”) has increased at a compounded annual growth rate of 3.32% between Fiscal 2015 to Fiscal 2018.
The following table sets forth the NOP and ATS based on individual new business premium for our bancassurance, direct sales channel (including insurance managers, loyalty managers and others) and agency channels for the periods indicated:
Fiscal Year ended March 31,
Channel 2016 2017 2018
NOP ATS NOP ATS NOP ATS
Bancassurance 153,437 34,987.65 148,097 43,985.44 153,939 52,634.95
Direct Sales
Insurance manager
43,845 56,664.00 37,669 64,117.58 38,538 75,459.41
Loyalty manager 5,073 76,281.20 5,182 103,584.95 5,990 103,831.18
Others 5,650 12,504.87 10,727 15,884.45 9,541 17,552.58
54,568 53,915.49 53,578 58,277.93 54,069 68,384.34
Agency 32,423 28,625.05 13,658 47,309.86 9,940 68,472.43
Others 154 17,489.14 1,299 20,650.26 1,718 36,945.15
Total 240,582 38,412.12 216,632 47,589.97 219,666 57,105.48
Our average ticket sizes are highest in metro areas, followed by urban and semi-urban areas, while average ticket sizes in rural areas are the lowest. As of March 31, 2018, our average ticket sizes were ` 75,249.70, ` 58,661.84 and ` 35,275.95 in metro, urban and semi-urban, and rural areas, respectively.
Bancassurance channel
Bancassurance is our largest distribution channel, generating 58.09%, 63.19% and 64.59% of individual new business premium for Fiscal 2016, Fiscal 2017 and Fiscal 2018, respectively. Individual new business premium generated by our bancassurance channel grew at a compounded annual growth rate of 22.40% between Fiscal 2015 and Fiscal 2018. As of December 31, 2017, we had the second largest bancassurance platform in India based on number of scheduled bank branches across India and our bancassurance platform was supported by PNB, the second largest bank in India based on total branches (Source: CRISIL).
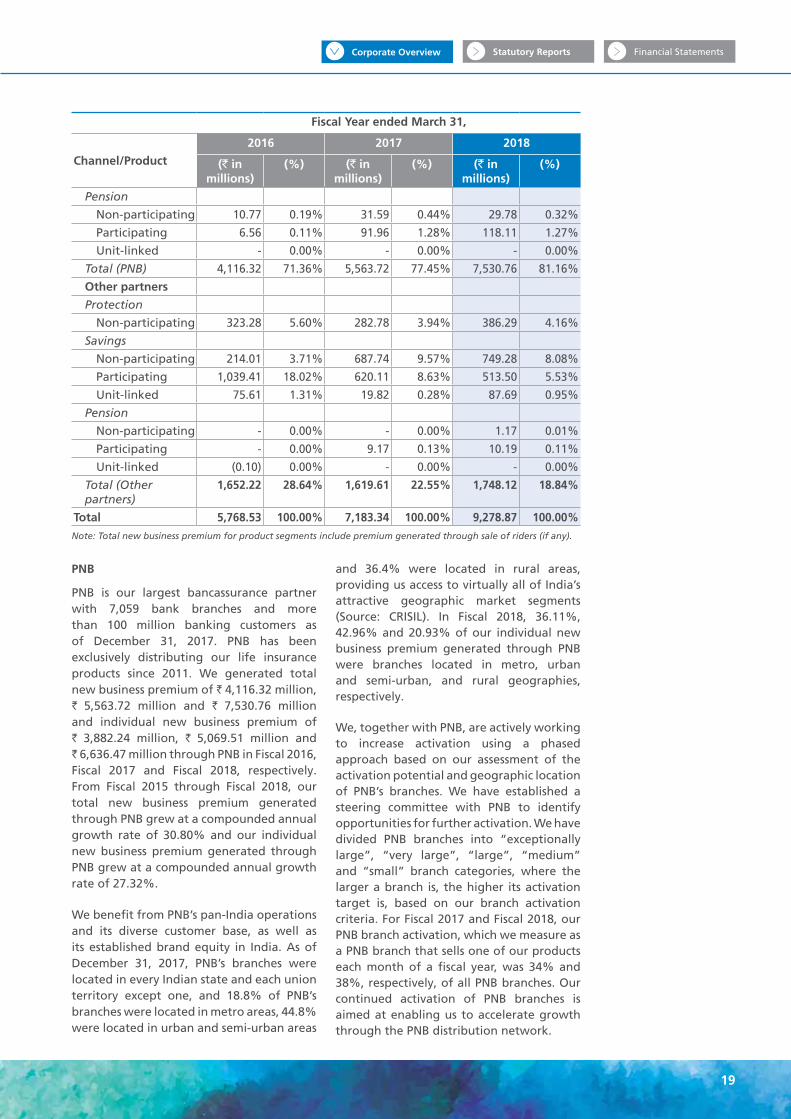
Our key bancassurance partners include PNB, as well as JKB and KBL, which together with our other bank bancassurance partners, provided access to 11,239 branches as of December 31, 2017. In Fiscal 2018, savings, protection and pension products comprised 83.54%, 14.75% and 1.72% and participating, non-participating and unit-linked products comprised 29.60%, 54.34% and 16.06% of our product mix for our bancassurance partners based on total new business premium, respectively. The following table sets forth our product mix for PNB and our other bancassurance partners based on total new business premium for the periods indicated.
Fiscal Year ended March 31,
Channel/Product
2016 2017 2018
(` in millions)
(%) (` in millions)
(%) (` in millions)
(%)
Bancassurance
PNB
Protection
Non-participating 648.40 11.24% 680.68 9.48% 982.22 10.59%
Savings
Non-participating 531.39 9.21% 2,219.84 30.90% 2,893.66 31.19%
Participating 1,736.95 30.11% 2,263.51 31.51% 2,104.77 22.68%
Unit-linked 1,182.24 20.49% 276.15 3.84% 1,402.23 15.11%
18
Fiscal Year ended March 31,
Channel/Product
2016 2017 2018
(` in millions)
(%) (` in millions)
(%) (` in millions)
(%)
Pension
Non-participating 10.77 0.19% 31.59 0.44% 29.78 0.32%
Participating 6.56 0.11% 91.96 1.28% 118.11 1.27%
Unit-linked - 0.00% - 0.00% - 0.00%
Total (PNB) 4,116.32 71.36% 5,563.72 77.45% 7,530.76 81.16%
Other partners
Protection
Non-participating 323.28 5.60% 282.78 3.94% 386.29 4.16%
Savings
Non-participating 214.01 3.71% 687.74 9.57% 749.28 8.08%
Participating 1,039.41 18.02% 620.11 8.63% 513.50 5.53%
Unit-linked 75.61 1.31% 19.82 0.28% 87.69 0.95%
Pension
Non-participating - 0.00% - 0.00% 1.17 0.01%
Participating - 0.00% 9.17 0.13% 10.19 0.11%
Unit-linked (0.10) 0.00% - 0.00% - 0.00%
Total (Other partners)
1,652.22 28.64% 1,619.61 22.55% 1,748.12 18.84%
Total 5,768.53 100.00% 7,183.34 100.00% 9,278.87 100.00%Note: Total new business premium for product segments include premium generated through sale of riders (if any).
PNB
PNB is our largest bancassurance partner with 7,059 bank branches and more than 100 million banking customers as of December 31, 2017. PNB has been exclusively distributing our life insurance products since 2011. We generated total new business premium of ` 4,116.32 million, ` 5,563.72 million and ` 7,530.76 million and individual new business premium of ` 3,882.24 million, ` 5,069.51 million and ` 6,636.47 million through PNB in Fiscal 2016, Fiscal 2017 and Fiscal 2018, respectively. From Fiscal 2015 through Fiscal 2018, our total new business premium generated through PNB grew at a compounded annual growth rate of 30.80% and our individual new business premium generated through PNB grew at a compounded annual growth rate of 27.32%.
We benefit from PNB’s pan-India operations and its diverse customer base, as well as its established brand equity in India. As of December 31, 2017, PNB’s branches were located in every Indian state and each union territory except one, and 18.8% of PNB’s branches were located in metro areas, 44.8% were located in urban and semi-urban areas
and 36.4% were located in rural areas, providing us access to virtually all of India’s attractive geographic market segments (Source: CRISIL). In Fiscal 2018, 36.11%, 42.96% and 20.93% of our individual new business premium generated through PNB were branches located in metro, urban and semi-urban, and rural geographies, respectively.
We, together with PNB, are actively working to increase activation using a phased approach based on our assessment of the activation potential and geographic location of PNB’s branches. We have established a steering committee with PNB to identify opportunities for further activation. We have divided PNB branches into “exceptionally large”, “very large”, “large”, “medium” and “small” branch categories, where the larger a branch is, the higher its activation target is, based on our branch activation criteria. For Fiscal 2017 and Fiscal 2018, our PNB branch activation, which we measure as a PNB branch that sells one of our products each month of a fiscal year, was 34% and 38%, respectively, of all PNB branches. Our continued activation of PNB branches is aimed at enabling us to accelerate growth through the PNB distribution network.
Financial StatementsStatutory ReportsCorporate Overview
19

We have strived to increase PNB branch access and sales productivity by increasing activation, offering complementary products, training and leveraging technology. Internally, we manage our bancassurance channel through our bancassurance relationship managers. We increased the number of our PNB bancassurance relationship managers from an average of 1,708 in Fiscal 2015 to an average of 2,350 in Fiscal 2018, while the number of PNB’s bank sale persons licensed to sell our products increased from 2,821 as of March 31, 2015 to 5,929 as of March 31, 2018. The productivity of this structure, which we measure as our total new business premium divided by the average number of PNB bancassurance relationship managers for the period, increased from ` 1.97 million per annum in Fiscal 2015 to ` 3.20 million per annum in Fiscal 2018. Given the scalability of our existing network of PNB bancassurance relationship managers, we have the capacity to efficiently support and manage additional increases in the number of PNB qualified bank sales persons, allowing greater penetration of our PNB bancassurance channel.
We have also continually developed and adapted our products to complement PNB’s products, such as by offering our protection products with PNB’s savings accounts and
our coverage against loan products with certain types of PNB’s loans. We have also successfully implemented digitization of our training content on PNB’s internal portal for our life insurance training program. This investment facilitates growth throughout PNB’s branch network, which will enable us to continually increase the number of PNB bank sales persons qualified to sell our products in PNB’s branch network, and assist us in increasing their sales productivity. As the number of PNB bank sales persons grows, we
aim to leverage our existing bancassurance relationship managers in order to drive productivity with limited incremental cost. In addition, we have invested in integrating technologies such as sales force automation tools and our e-branch platform with the systems and processes of PNB to improve productivity and realize scale in our business. Our investment in this technology supports continued deployment across additional PNB branches.
As a result of these and other measures, the sales productivity of PNB’s branches, which we measure as our total new business premium generated through PNB divided by the number of PNB branches, increased at a compounded annual growth rate of 28.10%, from ` 0.51 million per annum in Fiscal 2015 to ` 1.08 million per annum in Fiscal 2018.
Other bancassurance partners
We have productive bancassurance relationships of more than 14 years with each of JKB and KBL that complement the PNB branch network, as well as relationships with five RRBs.
JKB
JKB is one of our shareholders. JKB holds 5.08% of our equity shares. JKB has 940 bank branches as of December 31, 2017 (Source: CRISIL). JKB had a 44.1% share of all bank branches in Jammu and Kashmir state, which is highest among all banks in that state (Source: CRISIL). The individual new business premium and total new business premium that we generated through JKB branches grew at a compounded annual growth rate of 11.13% and 20.71%, respectively, between Fiscal 2015 and Fiscal 2018. We generated 5.47% of our individual new business premium through JKB branches in Fiscal 2018.
The productivity of our bancassurance relationship managers at JKB branches, which we measure as our total new business premium divided by the average number of bancassurance relationship managers for the period, increased from ` 1.46 million per annum in Fiscal 2015 to ` 2.79 million per annum in Fiscal 2018. In Fiscal 2018, our JKB branch activation, which we measure as a JKB branch that sells one of our products in each month of a given period, was 59% of all JKB branches.
KBL
We also benefit from the strong presence of KBL in south India with a total of 806 branches as of December 31, 2017. In addition to a strong market position in the state of Karnataka, KBL also has balanced geographic mix with 29.4%, 49.9% and 20.7% branches in metro, urban and semi-urban, and rural areas as of December 31, 2017 (Source: CRISIL). Our
Our direct sales and agency sales channels complement our bancassurance channel by allowing us to target more affluent metro and urban and semi-urban customers through a sales process adapted to their needs.
20

individual new business premium from KBL distribution grew at a compounded annual growth rate of 0.27% between Fiscal 2015 and Fiscal 2018. We generated 5.23% of our individual new business premium from KBL branches in Fiscal 2018.
The productivity of our bancassurance relationship managers at KBL branches, which we measure as our total new business premium divided by the average number of bancassurance relationship managers for the period, increased from ` 2.70 million per annum in Fiscal 2015 to ` 3.40 million per annum in Fiscal 2018. In Fiscal 2018, our KBL branch activation, which we measure as a KBL branch that sells one of our products in each month of a given period, was 55% of all KBL branches.
The following table sets forth our productivity from PNB, JKB and KBL bank branches, which we measure as total new business premium generated from a given bank divided by the number of its bank branches on March 31 of the relevant period.
Bancassurance partner
Fiscal Year ended March 31,
Channel 2016 2017 2018
(` in millions)
PNB 0.61 0.80 1.08
JKB 0.97 0.81 1.03
KBL 0.95 0.98 0.87
We have also partnered with American Express Banking Corporation since July 2012 to distribute our life insurance products.
RRBs
We have relationships with five RRBs, which include Sarva Haryana Gramin Bank, Himachal Pradesh Gramin Bank, Sarva Uttar Pradesh Gramin Bank, Punjab Gramin Bank and Madhya Bihar Gramin Bank. Our relationships with RRBs are sponsored by PNB. In Fiscal 2018, we generated 0.98% of our individual new business premium through RRB branches. The products we sell through RRBs are primarily lower ticket size savings products.
New bancassurance partnerships
We are continually exploring new bancassurance partnerships and other new relationships. In July 2017, we entered into a memorandum of understanding with IPPB to provide group term life insurance cover to the account holders of IPPB pursuant to Pradhan Mantri Jeevan Jyoti Beema Yojna, a government-designed life insurance scheme in India, which was launched under a GoI initiative to offer affordable protection to the mass market segment of the Indian population. As of March 31, 2014, IPPB was backed by India’s postal network of over 154,882 post offices as of March 31, 2014, 89.86% of which were in rural areas (Source: Department of Posts (Ministry of Communications), CRISIL). Our relationship with IPPB represents an opportunity to offer our insurance products across India in the future. In November 2017, we also entered into a distribution arrangement with BBK for distribution of our products to their customers through BBK’s branches in India. We will continue to look for similar opportunities while we seek to develop these new relationships.
Direct sales and agency channels
Our direct sales and agency sales channels complement our bancassurance channel by allowing us to target more affluent metro and urban and semi-urban customers through a sales process adapted to their needs.
• Direct sales
As of March 31, 2018, our direct sales channel included 4,048 insurance managers, who are experienced
Financial StatementsStatutory ReportsCorporate Overview
21
insurance sales professionals employed by the Company to market and sell our products to new customers through their own networks, and 225 loyalty managers who focus on servicing existing policies and cross selling additional products to our existing customers with the support of our lead management systems. Our insurance managers are generally located across urban areas and are present in 92 cities in India. Our loyalty managers focus on 18 key Indian cities and have a strong presence in metro areas. Our direct sales channel also comprises our group sales channel and our online sales channel.
• Agency
Our agency sales channel comprised 6,452 exclusive agents as of March 31, 2018. We compensate our agents based on their performance. We seek to ensure that our agents provide quality services to our customers and source business efficiently. As of March 31, 2018, our agency force is present in 92 cities.
We actively manage our insurance managers, loyalty managers and our exclusive agents under a consolidated operating model with a common group of sales managers to manage our insurance managers, loyalty managers and our exclusive agents in order to drive sales productivity and efficiency. For Fiscal 2018, we had an average of 890 sales managers dedicated to this operating
model. Our sales manager productivity, which we measure as total new business premium divided by the average number of sales managers for the period, increased from ` 1.79 million in Fiscal 2015 to ` 4.74 million in Fiscal 2018.
Direct sales channel
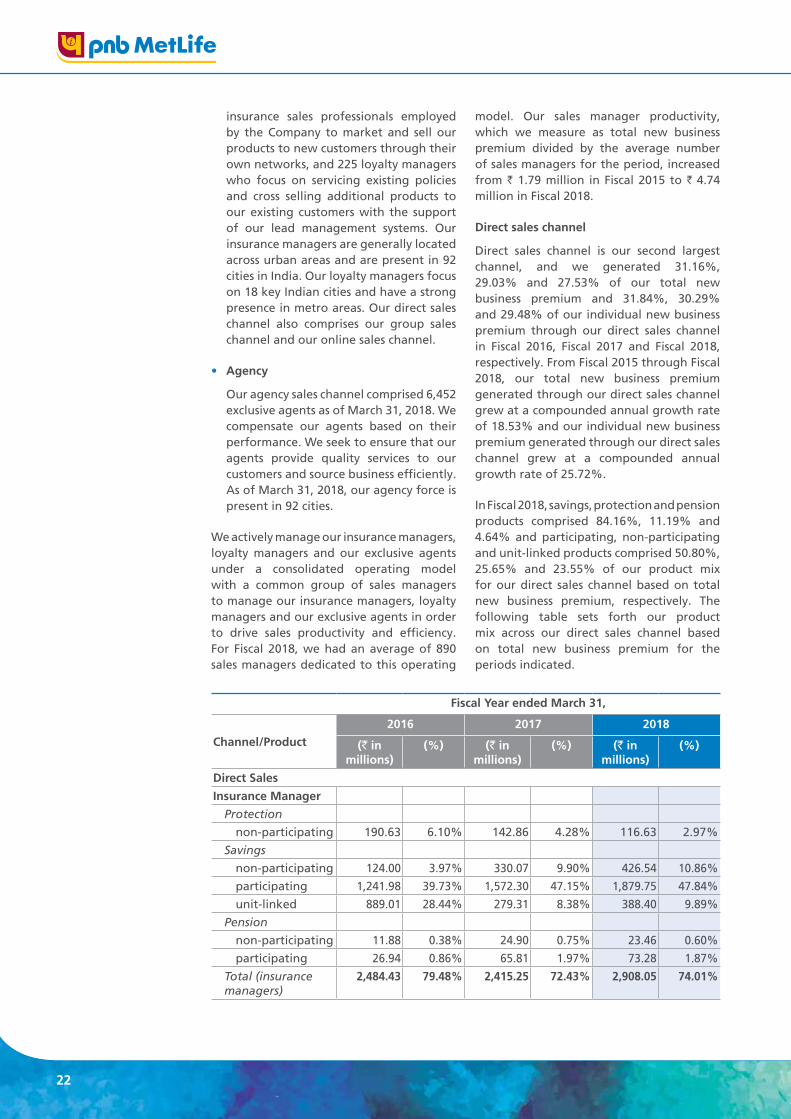
Direct sales channel is our second largest channel, and we generated 31.16%, 29.03% and 27.53% of our total new business premium and 31.84%, 30.29% and 29.48% of our individual new business premium through our direct sales channel in Fiscal 2016, Fiscal 2017 and Fiscal 2018, respectively. From Fiscal 2015 through Fiscal 2018, our total new business premium generated through our direct sales channel grew at a compounded annual growth rate of 18.53% and our individual new business premium generated through our direct sales channel grew at a compounded annual growth rate of 25.72%.
In Fiscal 2018, savings, protection and pension products comprised 84.16%, 11.19% and 4.64% and participating, non-participating and unit-linked products comprised 50.80%, 25.65% and 23.55% of our product mix for our direct sales channel based on total new business premium, respectively. The following table sets forth our product mix across our direct sales channel based on total new business premium for the periods indicated.
Fiscal Year ended March 31,
Channel/Product
2016 2017 2018
(` in millions)
(%) (` in millions)
(%) (` in millions)
(%)
Direct Sales
Insurance Manager
Protection
non-participating 190.63 6.10% 142.86 4.28% 116.63 2.97%
Savings
non-participating 124.00 3.97% 330.07 9.90% 426.54 10.86%
participating 1,241.98 39.73% 1,572.30 47.15% 1,879.75 47.84%
unit-linked 889.01 28.44% 279.31 8.38% 388.40 9.89%
Pension
non-participating 11.88 0.38% 24.90 0.75% 23.46 0.60%
participating 26.94 0.86% 65.81 1.97% 73.28 1.87%
Total (insurance managers)
2,484.43 79.48% 2,415.25 72.43% 2,908.05 74.01%
22

Fiscal Year ended March 31,
Channel/Product
2016 2017 2018
(` in millions)
(%) (` in millions)
(%) (` in millions)
(%)
Loyalty Manager
Protection
non-participating 5.46 0.17% 3.95 0.12% 2.35 0.06%
Savings
non-participating 2.72 0.09% 80.48 2.41% 102.94 2.62%
participating 34.02 1.09% 35.26 1.06% 32.46 0.83%
unit-linked 332.05 10.62% 376.59 11.29% 464.95 11.83%
Pension
non-participating 8.28 0.26% 22.85 0.69% 8.65 0.22%
participating 4.44 0.14% 17.65 0.53% 10.61 0.27%
Total (loyalty managers)
386.97 12.38% 536.78 16.10% 621.95 15.83%
Others1
Protection
non-participating 248.13 7.94% 365.35 10.96% 320.87 8.17%
Savings
unit-linked - 0.00% 1.83 0.05% 11.84 0.30%
Pension
non-participating 0.12 0.00% 6.08 0.18% 6.21 0.16%
unit-linked 6.34 0.20% 9.22 0.28% 60.15 1.53%
Total (Others) 254.59 8.14% 382.47 11.47% 399.07 10.16%
Total 3,126.00 100.00% 3,334.49 100.00% 3,929.07 100.00%
Note: Total new business premium for product segments include premium generated through sale of riders (if any).(1) Includes our direct group sales channel and our online channel.
Insurance manager channel
Our insurance manager channel comprises a productive employee force spread across 92 cities as of March 31, 2018. As of March 31, 2018, we had 4,048 insurance managers who are experienced insurance sales professionals employed by the Company to market and sell our products to new customers through their own networks. Insurance managers have a wide geographical reach and a higher non-unit-linked savings mix than our other channels. For Fiscal 2018, our insurance managers generated 86.64% of their individual new business premium from the sale non-unit-linked products. For Fiscal 2018, 51.95%, 32.33% and 15.72% of our individual new business premium generated by our insurance manager channel was in metro, urban and semi-urban, and rural, respectively.
Our insurance manager distribution channel generated 23.18% of our individual new business premium in Fiscal 2018. Individual new business premium generated from our insurance manager channel grew at
a compounded annual growth rate of 17.18% between Fiscal 2015 and Fiscal 2018. We are focused on continuing to grow this channel through quality hiring and increasing productivity.
Loyalty manager channel
Our loyalty manager channel is focused on 18 key Indian cities with a strong presence in metro areas. Loyalty managers typically have a higher unit-linked mix to cater to more affluent customer segments with more sophisticated insurance needs. They focus primarily on follow-up sales to, and generating leads from, our existing customer base. Our loyalty manager team also works closely with our branch operations units to identify and recommend appropriate products for walk-in customers and their referrals. For Fiscal 2018, 81.34%, 14.83%, and 3.83% of our individual new business premium generated by our loyalty manager channel was in metro, urban and semi-urban, and rural, respectively. Our loyalty manager team had 225 front line sales staff as of March 31, 2018 and is also supported by a lead management system.
Financial StatementsStatutory ReportsCorporate Overview
23

Our loyalty manager channel generated 4.96% of our individual new business premium in Fiscal 2018. Individual new business premium generated from our loyalty manager channel grew at a compounded annual growth rate of 126.53% between Fiscal 2015 and Fiscal 2018.
Group sales channel
Our direct sales channel also comprises group sales channel where our employees market and distribute our group products, which include primarily group term insurance products. Our group sales channel is a proprietary channel in which our employees directly solicit business from corporations seeking to provide for their employee benefit needs. Our employees in this channel are typically located across
larger cities within our network. We also actively seek opportunities to partner with banks, housing finance companies and non-banking financial companies to offer credit-linked life insurance and other products to their customers through our group sales channel. In Fiscal 2018, protection products comprised 71.35% of our group sales channel business.
Online channel
Our direct sales channel also comprises our online channel through which our customers
can purchase our products directly through our website. Since Fiscal 2016, we have been gradually increasing the number of policies we sell and process online. Sales through our online channel comprised 1.33% of the individual new business premium that we generated in Fiscal 2018. In Fiscal 2018, protection products comprised 92.94%, respectively, of our online channel business. We also have an online presence for our key product segments. Our digital marketing team utilizes various tools (including search engine optimization and email, content and mobile marketing) to attract new customers.
Agency channel
We generated 9.30%, 5.65% and 4.80% of our total new business premium and 10.04%, 6.27% and 5.43% of our individual new business premium through our agency sales channel in Fiscal 2016, Fiscal 2017 and Fiscal 2018, respectively.
In Fiscal 2018, savings, protection and pension products comprised 87.20%, 7.10% and 5.70% and participating, non-participating and unit-linked products comprised 58.05%, 22.28% and 19.66% of our product mix for our agency channel based on total new business premium, respectively. The following table sets forth our product mix across our agency channel based on total new business premium for the periods indicated.
Fiscal Year ended March 31,
Channel/Product
2016 2017 2018
(` in millions)
(%) (` in millions)
(%) (` in millions)
(%)
AgencyProtection
non-participating 101.06 10.83% 42.35 6.53% 48.62 7.10%Savings
non-participating 39.80 4.27% 78.61 12.12% 81.70 11.92%participating 515.69 55.27% 441.56 68.07% 381.23 55.63%unit-linked 270.17 28.96% 62.09 9.57% 134.65 19.65%
Pensionnon-participating 0.14 0.01% 14.03 2.16% 22.39 3.27%participating 6.02 0.65% 9.97 1.54% 16.60 2.42%unit-linked 0.10 0.01% 0.11 0.02% 0.09 0.01%
Total 932.98 100.00% 648.72 100.00% 685.27 100.00%
Note: Total new business premium for product segments include premium generated through sale of riders (if any).
Our digital marketing team utilizes various tools (including search engine optimization and email, content and mobile marketing) to attract new customers.
24

We are focused on selling individual non-unit-linked savings, term and health insurance products through this channel, with a wider geographical reach leading to higher non-unit-linked savings mix.
Other distribution channel
Our other distribution channel includes Insurance Marketing Firms (“IMFs”), micro insurance and licensed insurance brokers through which we sell our products. As of March 31, 2018, we had agreements with 45 IMFs through which we sell our products and 103 insurance brokers.
Our individual new business premium generated by our other distribution channel was 0.51% of our total individual new business premium in Fiscal 2018. In Fiscal 2018, savings, protection and pension products comprised 16.23%, 70.89% and 12.87% and participating, non-participating and unit-linked products comprised 14.59%, 73.34% and 12.07% of our product mix for our other distribution channel based on total new business premium, respectively.
New relationships
We have recently entered into insurance brokering arrangements with Marsh India Insurance Brokers Private Limited, a global insurance broker, and Coretree Insurance Brokers (India) Private Limited, an insurance broker, to sell our life insurance products.
Geographical Distribution of PremiumThe following table sets forth the distribution of our individual new business premium across the metro, urban and semi-urban, and rural regions for the periods indicated.
Fiscal Year ended March 31, 2018
(` in millions)
%
Metro 5,327.23 42.47
Urban and semi-urban
4,929.82 39.30
Rural 2,287.08 18.23
Total 12,544.13 100.00
The following table sets forth the geographical distribution of our individual new business premium by Indian states where our individual new business premium was the highest for the periods indicated.
Fiscal Year ended March 31, 2018
Indian state (` in millions)
%
Uttar Pradesh 2,002.95 15.97%
Delhi 1,848.64 14.74%
Punjab 1,348.46 10.75%
Karnataka 883.47 7.04%
Maharashtra 801.77 6.39%
Jammu & Kashmir
667.36 5.32%
West Bengal 661.24 5.27%
Himachal Pradesh
604.16 4.82%
Bihar 512.78 4.09%
Haryana 461.44 3.68%
Total 9,792.28 78.06%
Financial StatementsStatutory ReportsCorporate Overview
25
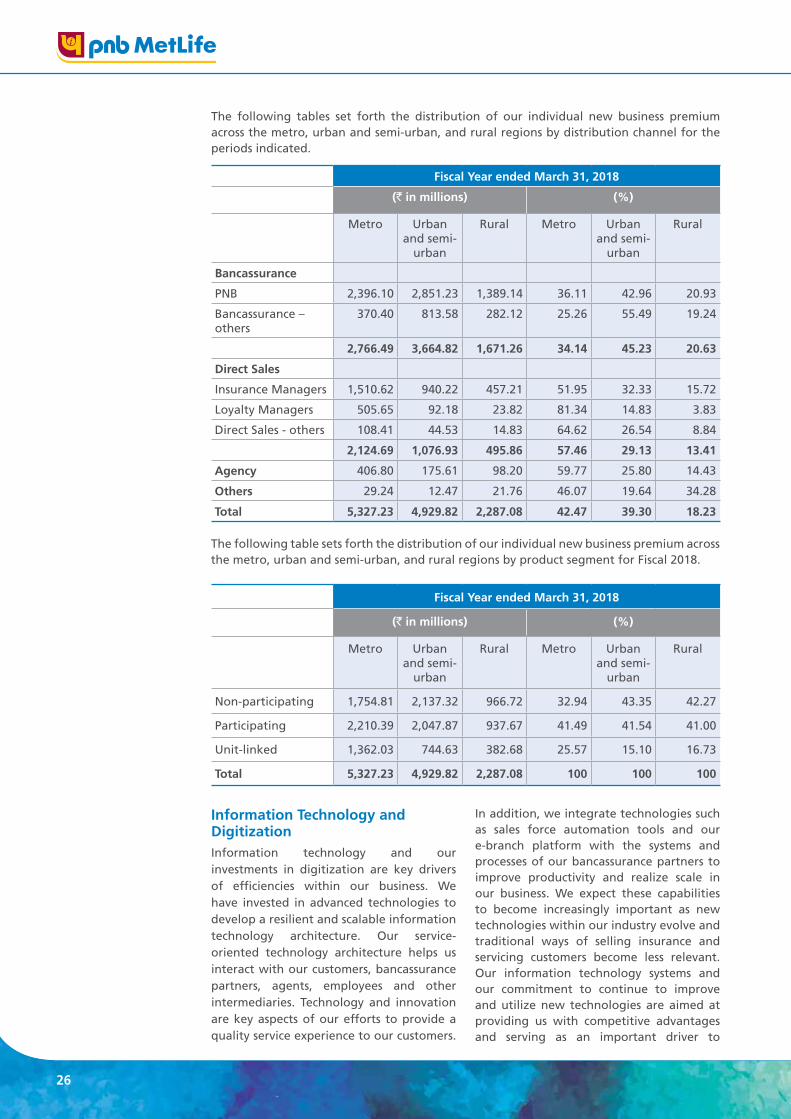
The following tables set forth the distribution of our individual new business premium across the metro, urban and semi-urban, and rural regions by distribution channel for the periods indicated.
Fiscal Year ended March 31, 2018
(` in millions) (%)
Metro Urban and semi-
urban
Rural Metro Urban and semi-
urban
Rural
Bancassurance
PNB 2,396.10 2,851.23 1,389.14 36.11 42.96 20.93
Bancassurance – others
370.40 813.58 282.12 25.26 55.49 19.24
2,766.49 3,664.82 1,671.26 34.14 45.23 20.63
Direct Sales
Insurance Managers 1,510.62 940.22 457.21 51.95 32.33 15.72
Loyalty Managers 505.65 92.18 23.82 81.34 14.83 3.83
Direct Sales - others 108.41 44.53 14.83 64.62 26.54 8.84
2,124.69 1,076.93 495.86 57.46 29.13 13.41
Agency 406.80 175.61 98.20 59.77 25.80 14.43
Others 29.24 12.47 21.76 46.07 19.64 34.28
Total 5,327.23 4,929.82 2,287.08 42.47 39.30 18.23
The following table sets forth the distribution of our individual new business premium across the metro, urban and semi-urban, and rural regions by product segment for Fiscal 2018.
Fiscal Year ended March 31, 2018
(` in millions) (%)
Metro Urban and semi-
urban
Rural Metro Urban and semi-
urban
Rural
Non-participating 1,754.81 2,137.32 966.72 32.94 43.35 42.27
Participating 2,210.39 2,047.87 937.67 41.49 41.54 41.00
Unit-linked 1,362.03 744.63 382.68 25.57 15.10 16.73
Total 5,327.23 4,929.82 2,287.08 100 100 100
Information Technology and DigitizationInformation technology and our investments in digitization are key drivers of efficiencies within our business. We have invested in advanced technologies to develop a resilient and scalable information technology architecture. Our service-oriented technology architecture helps us interact with our customers, bancassurance partners, agents, employees and other intermediaries. Technology and innovation are key aspects of our efforts to provide a quality service experience to our customers.
In addition, we integrate technologies such as sales force automation tools and our e-branch platform with the systems and processes of our bancassurance partners to improve productivity and realize scale in our business. We expect these capabilities to become increasingly important as new technologies within our industry evolve and traditional ways of selling insurance and servicing customers become less relevant. Our information technology systems and our commitment to continue to improve and utilize new technologies are aimed at providing us with competitive advantages and serving as an important driver to
26

achieving targeted performance goals. Our information technology architecture is structured around three key concepts: “Data”, “Digitize” and “Disrupt”.
• Data
One of our key business objectives is to improve our ability to use and process internal and external data effectively. Being able to analyze a large amount of data to generate meaningful and actionable insights is key to us building a strong tech-driven distribution structure. We use data analytics to develop strategies to improve our persistency rates, reduce policy surrenders, help mitigate frauds and manage mortality experience. Together with our business teams, we have developed propensity scoring models that use statistics to predict the behaviour of our existing and prospective customer base and to segment our customers and business. We use these scores to adapt our approach to each customer segment in order to tailor targeted communications to different customer segments. We have also used propensity scoring models to segment the “insurability” of customers, ranking them from high to low risk, and to assist underwriters to segment risk and adopt the appropriate underwriting methodologies for different risk segments. We also use a similar scoring model to identify potential claims fraud. We have created an enterprise data warehouse in order to refine data, eliminate excess or redundant information and improve the overall quality of our data.
• Digitize
We have invested in digitization across our business to improve operational efficiencies, productivity and the scalability of our operations. These efforts have helped us to improve our turnaround times, simplify processes and reduce our dependence on paperwork and physical infrastructure. In addition, we have used digitization to make our customer experience more user-friendly and deliver a quality customer service experience. One of our key information technology initiatives has been to digitize our pre-sales and sales processes. Our digital platform, e-branch, aims to provide a seamless, user-friendly customer experience from the prospective customer stage to policy issuance. Our
e-branch provides a customized and simplified customer on-boarding process. In addition, it helps to facilitate need-based selling by analysing the products that customers select and uses a financial planning module to aid customers in selecting the most appropriate insurance solution based on their needs. It also nurtures prospective sales through customer interaction histories, calendars that manage customer engagement, analytics for customer funnel analysis and alerts and notifications on various customer life events, policy anniversaries, birthdays and appointments. These help us to enhance our customer relationships. Our e-branch has a scalable platform that can be extended to our distribution partners quickly, as required. It is also integrated with our other core systems to enable real time data transfer and information exchange, which helps to improve our overall sales productivity by reducing processing time. It also interfaces with our bancassurance partners and government authorities to facilitate data pre-population and e-KYC.
• Disrupt
Life insurance providers in the Indian life insurance industry are increasingly looking to increase sales and increase operational efficiencies (Source: CRISIL). This creates potential challenges and opportunities for us and the industry. We aim to develop disruptive technology in order to differentiate our business from our competitors. In 2016, we partnered with MetLife’s innovation center for Asia, LumenLab, to launch conVRse, a service application that provides a differentiated, immersive and personalized experience to customers through a virtual reality platform. ConVRse is an award winning and pioneering virtual reality service platform that has been well received by our customers. We are currently piloting Khushi, which is based on an artificial intelligence framework. Khushi is a virtual assistant that can chat with an existing or prospective customer and help respond to queries related to their policies. It has real-time access to policy-related information and is generally available online at any time. This is a pre-emptive, proactive and predictive application that aims to understand customers’ requirements in order to provide customized responses to their queries.
Financial StatementsStatutory ReportsCorporate Overview
27
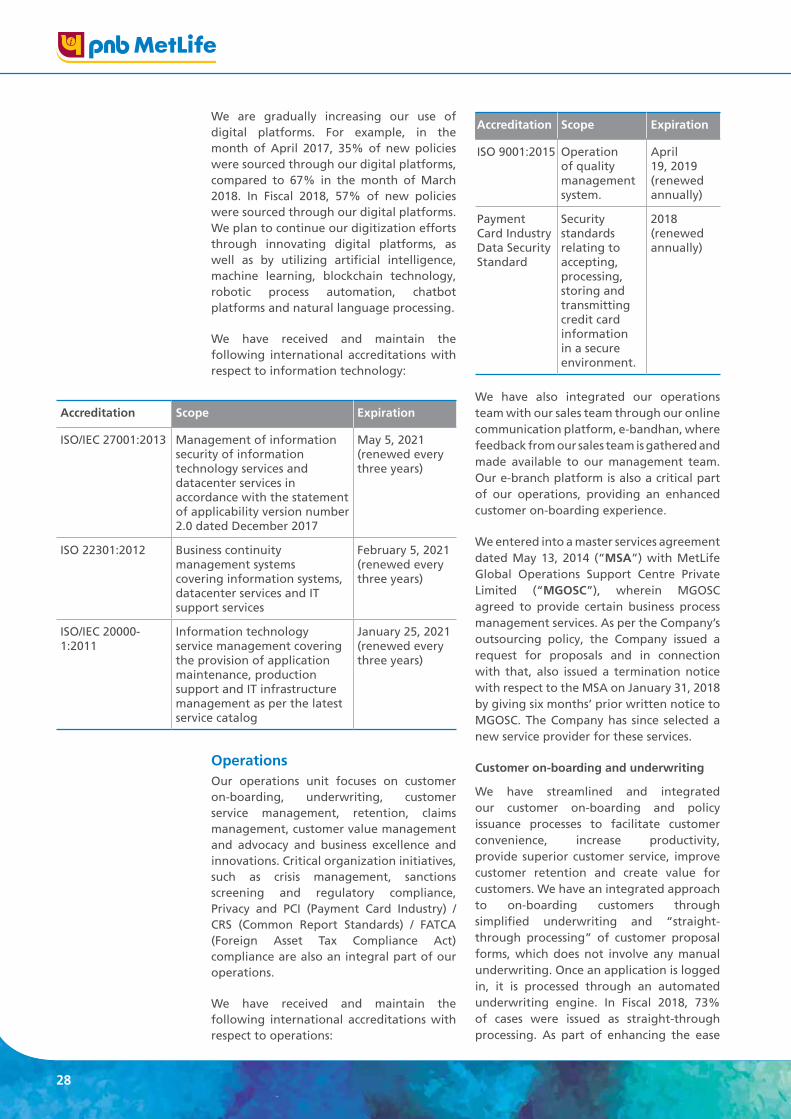
We are gradually increasing our use of digital platforms. For example, in the month of April 2017, 35% of new policies were sourced through our digital platforms, compared to 67% in the month of March 2018. In Fiscal 2018, 57% of new policies were sourced through our digital platforms. We plan to continue our digitization efforts through innovating digital platforms, as well as by utilizing artificial intelligence, machine learning, blockchain technology, robotic process automation, chatbot platforms and natural language processing.
We have received and maintain the following international accreditations with respect to information technology:
Accreditation Scope Expiration
ISO/IEC 27001:2013 Management of information security of information technology services and datacenter services in accordance with the statement of applicability version number 2.0 dated December 2017
May 5, 2021 (renewed every three years)
ISO 22301:2012 Business continuity management systems covering information systems, datacenter services and IT support services
February 5, 2021 (renewed every three years)
ISO/IEC 20000-1:2011
Information technology service management covering the provision of application maintenance, production support and IT infrastructure management as per the latest service catalog
January 25, 2021 (renewed every three years)
Operations Our operations unit focuses on customer on-boarding, underwriting, customer service management, retention, claims management, customer value management and advocacy and business excellence and innovations. Critical organization initiatives, such as crisis management, sanctions screening and regulatory compliance, Privacy and PCI (Payment Card Industry) / CRS (Common Report Standards) / FATCA (Foreign Asset Tax Compliance Act) compliance are also an integral part of our operations.
We have received and maintain the following international accreditations with respect to operations:
Accreditation Scope Expiration
ISO 9001:2015 Operation of quality management system.
April 19, 2019 (renewed annually)
Payment Card Industry Data Security Standard
Security standards relating to accepting, processing, storing and transmitting credit card information in a secure environment.
2018 (renewed annually)
We have also integrated our operations team with our sales team through our online communication platform, e-bandhan, where feedback from our sales team is gathered and made available to our management team. Our e-branch platform is also a critical part of our operations, providing an enhanced customer on-boarding experience.
We entered into a master services agreement dated May 13, 2014 (“MSA”) with MetLife Global Operations Support Centre Private Limited (“MGOSC”), wherein MGOSC agreed to provide certain business process management services. As per the Company’s outsourcing policy, the Company issued a request for proposals and in connection with that, also issued a termination notice with respect to the MSA on January 31, 2018 by giving six months’ prior written notice to MGOSC. The Company has since selected a new service provider for these services.
Customer on-boarding and underwriting
We have streamlined and integrated our customer on-boarding and policy issuance processes to facilitate customer convenience, increase productivity, provide superior customer service, improve customer retention and create value for customers. We have an integrated approach to on-boarding customers through simplified underwriting and “straight-through processing” of customer proposal forms, which does not involve any manual underwriting. Once an application is logged in, it is processed through an automated underwriting engine. In Fiscal 2018, 73% of cases were issued as straight-through processing. As part of enhancing the ease
28
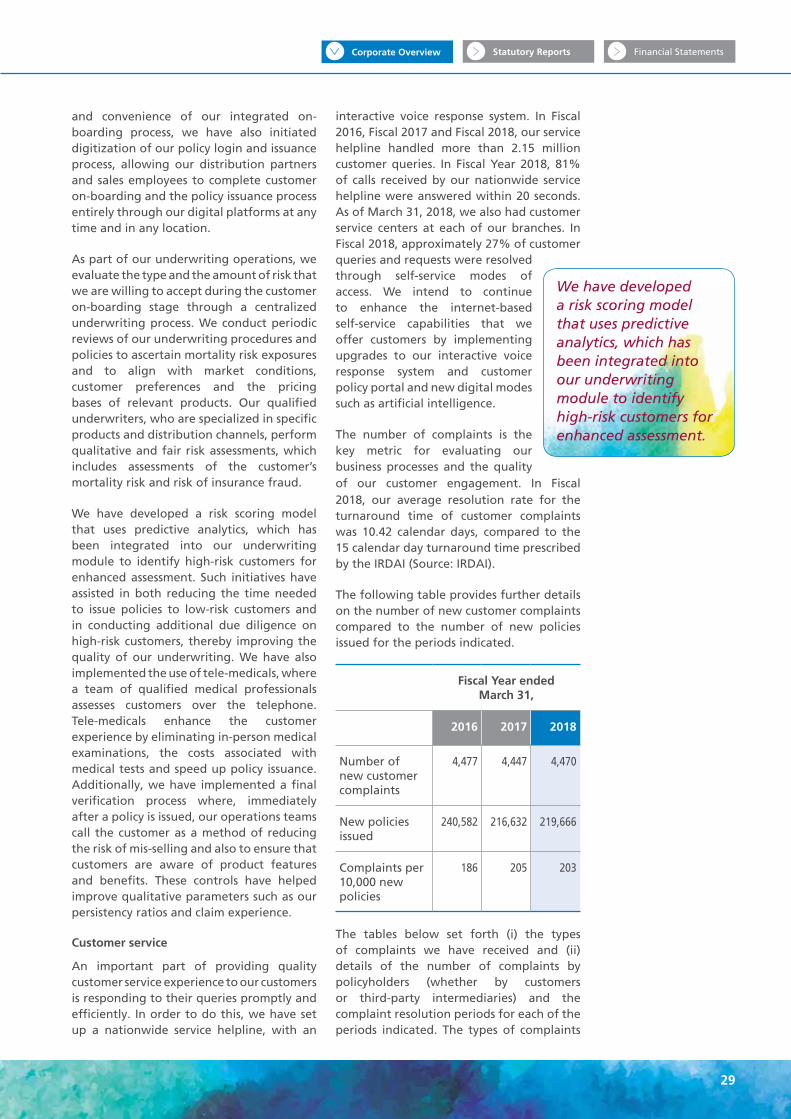
and convenience of our integrated on-boarding process, we have also initiated digitization of our policy login and issuance process, allowing our distribution partners and sales employees to complete customer on-boarding and the policy issuance process entirely through our digital platforms at any time and in any location.
As part of our underwriting operations, we evaluate the type and the amount of risk that we are willing to accept during the customer on-boarding stage through a centralized underwriting process. We conduct periodic reviews of our underwriting procedures and policies to ascertain mortality risk exposures and to align with market conditions, customer preferences and the pricing bases of relevant products. Our qualified underwriters, who are specialized in specific products and distribution channels, perform qualitative and fair risk assessments, which includes assessments of the customer’s mortality risk and risk of insurance fraud.
We have developed a risk scoring model that uses predictive analytics, which has been integrated into our underwriting module to identify high-risk customers for enhanced assessment. Such initiatives have assisted in both reducing the time needed to issue policies to low-risk customers and in conducting additional due diligence on high-risk customers, thereby improving the quality of our underwriting. We have also implemented the use of tele-medicals, where a team of qualified medical professionals assesses customers over the telephone. Tele-medicals enhance the customer experience by eliminating in-person medical examinations, the costs associated with medical tests and speed up policy issuance. Additionally, we have implemented a final verification process where, immediately after a policy is issued, our operations teams call the customer as a method of reducing the risk of mis-selling and also to ensure that customers are aware of product features and benefits. These controls have helped improve qualitative parameters such as our persistency ratios and claim experience.
Customer service
An important part of providing quality customer service experience to our customers is responding to their queries promptly and efficiently. In order to do this, we have set up a nationwide service helpline, with an
interactive voice response system. In Fiscal 2016, Fiscal 2017 and Fiscal 2018, our service helpline handled more than 2.15 million customer queries. In Fiscal Year 2018, 81% of calls received by our nationwide service helpline were answered within 20 seconds. As of March 31, 2018, we also had customer service centers at each of our branches. In Fiscal 2018, approximately 27% of customer queries and requests were resolved through self-service modes of access. We intend to continue to enhance the internet-based self-service capabilities that we offer customers by implementing upgrades to our interactive voice response system and customer policy portal and new digital modes such as artificial intelligence.
The number of complaints is the key metric for evaluating our business processes and the quality of our customer engagement. In Fiscal 2018, our average resolution rate for the turnaround time of customer complaints was 10.42 calendar days, compared to the 15 calendar day turnaround time prescribed by the IRDAI (Source: IRDAI).
The following table provides further details on the number of new customer complaints compared to the number of new policies issued for the periods indicated.
Fiscal Year ended March 31,
2016 2017 2018
Number of new customer complaints
4,477 4,447 4,470
New policies issued
240,582 216,632 219,666
Complaints per 10,000 new policies
186 205 203
The tables below set forth (i) the types of complaints we have received and (ii) details of the number of complaints by policyholders (whether by customers or third-party intermediaries) and the complaint resolution periods for each of the periods indicated. The types of complaints
We have developed a risk scoring model that uses predictive analytics, which has been integrated into our underwriting module to identify high-risk customers for enhanced assessment.
Financial StatementsStatutory ReportsCorporate Overview
29

have been classified into five categories as follows:
• “sales related”, which includes complaints such as those related to mis-selling, misrepresentation of facts, fraud and forgery of documents.
• “new business related”, which includes complaints such as those related to issuance of policy, proposal processing, policy dispatch, decline and refunds.
Fiscal Year 2016 Opening balance
Additions Fully accepted
Partially accepted
Rejected Complaints pending
Particulars
Sales related 16 2,699 951 0 1,742 22
New business related 1 749 641 0 105 4
Policy servicing related 0 282 213 0 63 6
Claims related 2 454 349 0 102 5
Others 0 293 204 0 88 1
Total 19 4,477 2,358 0 2,100 38
Fiscal Year 2016 Complaints made by
customers
Complaints made by
intermediaries
Total
Duration pending
Less than 15 days 38 0 38
More than 15 days 0 0 0
Total 38 0 38
Fiscal Year 2017 Opening balance
Additions Fully accepted
Partially accepted
Rejected Complaints pending
Particulars
Sales related 22 3,022 1,218 0 1,788 38
New business related 4 328 274 0 57 1
Policy servicing related 6 633 433 0 204 2
Claims related 5 364 268 0 98 3
Others 1 100 56 0 45 0
Total 38 4,447 2,249 0 2,192 44
Fiscal Year 2017 Complaints made by
customers
Complaints made by
intermediaries
Total
Duration pending
Less than 15 days 43 0 43
More than 15 days 1 0 1
Total 44 0 44
• “policy servicing related”, which includes post-issuance servicing related complaints, such as surrender not processed and pay-out not done.
• “claims related”, which includes complaints such as death and survival claims; and
• “others”, which includes a mix of sales and service complaints, including spurious calls and unit-linked product-related concerns, such as those related to policy value and net asset value.
30
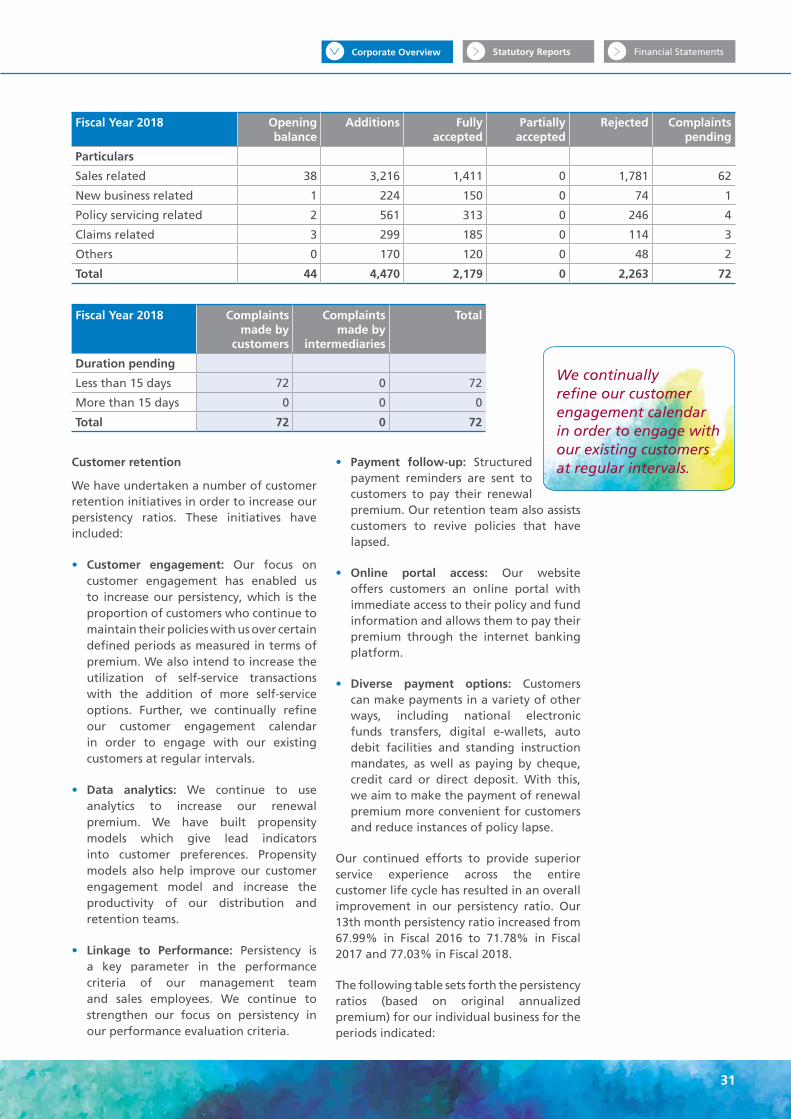
Fiscal Year 2018 Opening balance
Additions Fully accepted
Partially accepted
Rejected Complaints pending
Particulars
Sales related 38 3,216 1,411 0 1,781 62
New business related 1 224 150 0 74 1
Policy servicing related 2 561 313 0 246 4
Claims related 3 299 185 0 114 3
Others 0 170 120 0 48 2
Total 44 4,470 2,179 0 2,263 72
Fiscal Year 2018 Complaints made by
customers
Complaints made by
intermediaries
Total
Duration pending
Less than 15 days 72 0 72
More than 15 days 0 0 0
Total 72 0 72
Customer retention
We have undertaken a number of customer retention initiatives in order to increase our persistency ratios. These initiatives have included:
• Customer engagement: Our focus on customer engagement has enabled us to increase our persistency, which is the proportion of customers who continue to maintain their policies with us over certain defined periods as measured in terms of premium. We also intend to increase the utilization of self-service transactions with the addition of more self-service options. Further, we continually refine our customer engagement calendar in order to engage with our existing customers at regular intervals.
• Data analytics: We continue to use analytics to increase our renewal premium. We have built propensity models which give lead indicators into customer preferences. Propensity models also help improve our customer engagement model and increase the productivity of our distribution and retention teams.
• Linkage to Performance: Persistency is a key parameter in the performance criteria of our management team and sales employees. We continue to strengthen our focus on persistency in our performance evaluation criteria.
• Payment follow-up: Structured payment reminders are sent to customers to pay their renewal premium. Our retention team also assists customers to revive policies that have lapsed.
• Online portal access: Our website offers customers an online portal with immediate access to their policy and fund information and allows them to pay their premium through the internet banking platform.
• Diverse payment options: Customers can make payments in a variety of other ways, including national electronic funds transfers, digital e-wallets, auto debit facilities and standing instruction mandates, as well as paying by cheque, credit card or direct deposit. With this, we aim to make the payment of renewal premium more convenient for customers and reduce instances of policy lapse.
Our continued efforts to provide superior service experience across the entire customer life cycle has resulted in an overall improvement in our persistency ratio. Our 13th month persistency ratio increased from 67.99% in Fiscal 2016 to 71.78% in Fiscal 2017 and 77.03% in Fiscal 2018.
The following table sets forth the persistency ratios (based on original annualized premium) for our individual business for the periods indicated:
We continually refine our customer engagement calendar in order to engage with our existing customers at regular intervals.
Financial StatementsStatutory ReportsCorporate Overview
31

Persistency (by premium) Fiscal Year ended March 31,
2016 2017 2018
13th month 67.99% 71.78% 77.03%
25th month 47.85% 53.15% 58.30%
37th month 41.38% 41.62% 46.00%
49th month 36.67% 37.84% 37.10%
61st month 20.20% 27.34% 27.72%
The following tables set forth our individual persistency ratios by the product categories saving, protection and pension for the periods indicated:
Persistency (by premium) Fiscal Year ended March 31,
2016 2017 2018
Saving products
13th month 68.27% 71.47% 76.88%
25th month 47.86% 53.05% 57.76%
37th month 41.43% 41.66% 45.92%
49th month 37.59% 37.88% 37.05%
61st month 20.34% 27.10% 27.69%
Protection products
13th month 65.60% 74.90% 79.14%
25th month 56.81% 54.35% 63.46%
37th month 41.11% 46.32% 46.61%
49th month 35.77% 38.05% 42.00%
61st month 26.22% 33.52% 35.20%
Pension products(1)
13th month N.A. 66.80% 79.20%
25th month N.A. N.A. 51.21%
37th month N.A. N.A. N.A.
49th month 24.77% N.A. N.A.
61st month 10.11% 6.34% N.A.
(1) Periods for which no premium was due to be collected have been indicated with “N.A.”
32

The following tables set forth our individual persistency ratios by our distribution channels for the periods indicated:
Persistency (by premium) Fiscal Year ended March 31,
2016 2017 2018
Bancassurance
13th month 67.44% 71.25% 76.09%
25th month 51.30% 56.53% 59.19%
37th month 44.85% 45.63% 49.65%
49th month 37.78% 41.36% 40.80%
61st month 22.57% 26.96% 30.96%
Direct Sales
13th month 69.11% 72.60% 78.71%
25th month 39.16% 46.68% 56.88%
37th month 31.01% 32.52% 39.13%
49th month 62.65% 28.23% 28.33%
61st month 17.50% 59.53% 20.71%
Agency
13th month 68.24% 72.46% 79.02%
25th month 46.01% 50.96% 57.91%
37th month 38.41% 38.55% 43.10%
49th month 35.34% 34.53% 34.14%
61st month 19.57% 25.84% 25.12%
Others
13th month 75.20% 75.75% 79.66%
25th month 71.36% 65.42% 66.54%
37th month 61.21% 58.56% 57.90%
49th month 50.34% 58.75% 53.36%
61st month 20.50% 39.66% 46.96%
Claims management
We are committed to providing our customers with a superior claims settlement experience. Claims that we receive are processed and investigated in a standardized manner. We have established claims settlement procedures and formulated various claims settlement guidelines, which we update on a regular basis. In order to streamline these procedures and guidelines for customers, we also have our Met Care Kit, which has the aim of simplifying the claims process by providing the customer with a comprehensive list of documents and forms required for processing a claim.
Claimants can submit claims through various channels, including our existing branches, the branches of our distribution partners, through our call center and by direct courier. We use a data analytics-based
model to categorize claims for processing investigative claims, assisting in detecting and reducing the risk of fraudulent claims. We have implemented a tiered authorization system to manage claims of differing value and to facilitate rapid claims processing.
The efficiency of our claims settlement improved from Fiscal 2017 to Fiscal 2018, with the average turnaround time for death claims decreasing from four days in Fiscal 2017 to two days in Fiscal 2018, upon receipt of all supporting documentation. Our overall claims settlement ratio for Fiscal 2018 was 92.36%.
The following table sets forth our settlement ratio (representing the number of claims that are settled as a percentage of the number of claims received) for the periods indicated.
Financial StatementsStatutory ReportsCorporate Overview
33

Claims occurring after issuance
Fiscal Year ended March 31,
2016 2017 2018
Individual Group Total Individual Group Total Individual Group Total
Less than one year 68.43% 99.22% 84.78% 77.48% 96.66% 85.30% 81.19% 95.20% 85.81%
One to three years 92.30% 99.63% 94.35% 89.62% 96.49% 91.99% 91.35% 96.10% 92.73%
Over three years 99.48% 100.00% 99.57% 98.20% 98.37% 98.22% 99.04% 99.53% 99.10%
Total 85.36% 99.38% 90.74% 87.14% 96.79% 90.20% 91.12% 96.19% 92.36%
We are currently piloting our “Claims Promise” initiative, which we launched in April 2018. Under the “Claims Promise” initiative, we aim to process all “non-early” death claims, which are claims that fall after three years from issuance of a relevant life insurance policy or from the date of declaration of good health reinstatement, within a turnaround time
of five days upon receipt of all supporting documentation.
CustomersThe following table sets forth the number of lives insured (individual and group) and the number of new business policies held by our individual customers as of the dates indicated:
Fiscal Year ended March 31,
2016 2017 2018
Number of individual lives insured
235,001 210,133 215,455
Number of lives insured (Group customers)
1,022,530 1,433,642 743,110
Number of new business policies (individual customers)
240,582 216,632 219,666
The following table sets forth the number of individual lives insured, number of individual new business policies, number of unique customers with more than one policy since inception
and cross-sell percentage for individual customers for the periods indicated:
Fiscal Year ended March 31,
2016 2017 2018
Number of individual lives insured
235,001 210,133 215,455
Number of individual new business policies
240,582 216,632 219,666
Unique customer with more than one policy since inception
13,342 18,976 14,213
Cross sell ratio 5.68% 9.03% 6.60%
ReinsuranceReinsurance is the insurance cover that is purchased by an insurance company (the “cedant”) in order to share risks such as mortality and morbidity with another insurer (the “reinsurer”). Such arrangements help insurers manage their risk profile by limiting the financial impact
of claims fluctuation, minimizing exposure to large individual claims, expanding their underwriting capacity and managing their capital efficiently. We have surplus risk and proportional reinsurance arrangements on a risk premium basis with varying retention levels by product classes. These retention levels are determined in accordance
34

Rating As of March 31,
Reinsurer Rating Agency 2016 2017 2018
Munich Re S&P AA- (Very Strong) AA- (Very Strong) AA- (Very Strong)
RGA S&P AA- (Very Strong) AA- (Very Strong) AA- (Very Strong)
AXA Vie S&P A+ AA- AA-
Swiss Re S&P AA- (Very Strong) AA- (Very Strong) AA- (Very Strong)
Gen Re S&P AA+ AA+ AA+
Hannover Re S&P AA- (Very Strong) AA- (Very Strong) AA- (Very Strong)
GIC Re A.M. Best A- (Excellent) A- (Excellent) A- (Excellent)
HCC S&P AA- AA- AA-
Arch Re S&P A+ A+ A+
with IRDAI regulations and take into consideration our experience. We also enter into catastrophe reinsurance arrangements on an excess-of-loss basis, which mitigates the potential concentration risks that may arise if a localized event affects the workplace of one or more of our group insurance customers. We review these arrangements on a regular basis.
Our total reinsurance ceded, in terms of sum at risk, to third-party reinsurers in Fiscal 2016, Fiscal 2017 and Fiscal 2018 was ` 1,768,070 million, ` 1,427,544 million, ` 1,519,356 million, respectively. The share of total reinsurance ceded on sum assured in Fiscal 2016, Fiscal 2017 and Fiscal 2018 was 51.09%, 41.94% and 42.96%, respectively. As of March 31, 2018, our proportion of reinsurance ceded based on the sum at risk, with our largest reinsurance counterparty, Munich Re and its subsidiaries was ` 613,544
million, which accounted for 40.38% of our total reinsurance ceded.
Our criteria for selecting reinsurers are based on relevant regulations and the assessment of the reinsurer’s financial strength, terms of arrangement including limits for underwriting and claims, capacity of the reinsurer to write the risk, expertise provided by the reinsurer and past claims payment history. We also strategically diversify our reinsurance book to minimize third party credit risk. We monitor the financial condition of our third-party reinsurers on a regular basis and have not experienced any third-party reinsurer default since our inception.
The following table sets out the Standard & Poor’s (“S&P”) ratings for the periods indicated therein for the reinsurers with whom we have reinsurance arrangements:
S&P’s “AA” range (“AA+”, “AA”, “AA-”) is the second highest of nine ratings ranges and applies to an insurer that S&P regards as having very strong financial security characteristics that outweigh any vulnerabilities and likely to have the ability to meet financial commitments, differing only slightly from those rated higher. The “A” range (“A+”, “A”, “A-”) is the third highest of nine ratings ranges and applies to an insurer that S&P regards as having strong financial security characteristics, but is somewhat more likely to be affected by adverse business conditions than are higher rated insurers. A plus (+) or minus (-) shows relative standing in a rating
category. S&P and other agency ratings are not designed to be, and do not serve as, measures of protection or valuation offered to investors and such financial strength ratings are not to be relied upon with respect to making any investment.
The following table sets out the nature of our reinsurance arrangements with each reinsurer as well as the reinsurance premium paid to them in Fiscal Year 2018.
Financial StatementsStatutory ReportsCorporate Overview
35

Reinsurer Type of reinsurance arrangement
(surplus / quota share)*
Type of reinsurance arrangement (obligatory /
facultative)**
Reinsurance premium ceded for
Fiscal 2018 (` millions)
Munich Re Surplus and quota share
Obligatory and facultative
359.85
RGA Surplus and quota share
Obligatory and facultative
214.16
AXA Vie Surplus Facultative 211.67Swiss Re Surplus and quota
shareObligatory and
facultative106.86
Gen Re Surplus Obligatory and facultative
13.36
Hannover Re Surplus Obligatory and facultative
16.98
GIC Re Surplus and quota share/Catastrophe
Obligatory and facultative
1.87
HCC Surplus/Catastrophe Obligatory 4.52Arch Re Surplus/Catastrophe Obligatory 0.70
* A quota share arrangement is an arrangement under which the reinsurer covers a specified percentage of the sum at risk. A surplus reinsurance arrangement is an arrangement under which the reinsurer covers the surplus of the sum at risk exceeding the ceding company’s retention limits as laid out in the agreement between the reinsurer and the ceding company.
** An obligatory arrangement is an arrangement under which both the insurer and reinsurer are obliged to place and accept the risk. A facultative arrangement is an arrangement under which the insurer is free to place the reinsurance with any reinsurer. Similarly, the reinsurer may accept or reject the reinsurance offered.
Investments Our total assets under management (“AUM”) were ` 172.4 billion as of March 31, 2018, of which 39.9% was held in participating policyholders investments, 17.6% was held in non-participating policyholder investments, 36.4% was held in unit-linked policyholders’ fund and 6.1% was held in shareholders’ fund. As of March 31, 2018, 76.8% of total AUM was invested in fixed income instruments, 22.6% was invested in equities and ETF mutual funds and 0.6% in other investments.
Our investment function plays a crucial role in creating value for policyholders and shareholders. We invest the premium we receive from policies sold and income generated from existing investments in various asset classes. This is done with the objective of meeting future liabilities of the business underwritten as well as to generate superior risk-adjusted returns over the medium to long-term. Strong investment performance has the potential to lead to wealth creation for policyholders and shareholders in the medium to long-term. Additionally, it also enhances the competitiveness of our product offerings.
Investment Objectives and Processes
Our investment management is governed by an investment policy that is approved by our Board of Directors. We established
an Investment Committee on January 5, 2002, which assists the Board of Directors in fulfilling its oversight responsibility for the investment assets. Our Investment Committee formulates the investment policy and establishes a framework for investment management and operations with adequate risk management controls. Our Investment Committee is responsible for ensuring adherence to our investment policies and other matters covered under the Investment Procedures Manual and reviewing modifications from time to time.
Our investment team, led by our Chief Investment Officer, performs day-to-day investment activities, such as developing and implementing strategies for managing our fixed income and equity portfolios based on the current market environment. The Chief Investment Officer is responsible for presenting investment performance to the Investment Committee and reporting on all credit-related and investment-related issues. The team consists of experienced fund managers, research analysts and dealers. Every investment is analyzed rigorously from a company, sector, as well as portfolio perspective before we make such an investment. There is a strong focus on ethics, compliance and risk management at every stage of the investment process. Regulatory compliance and risk limits are independently monitored by the investment team’s middle-office function.
36
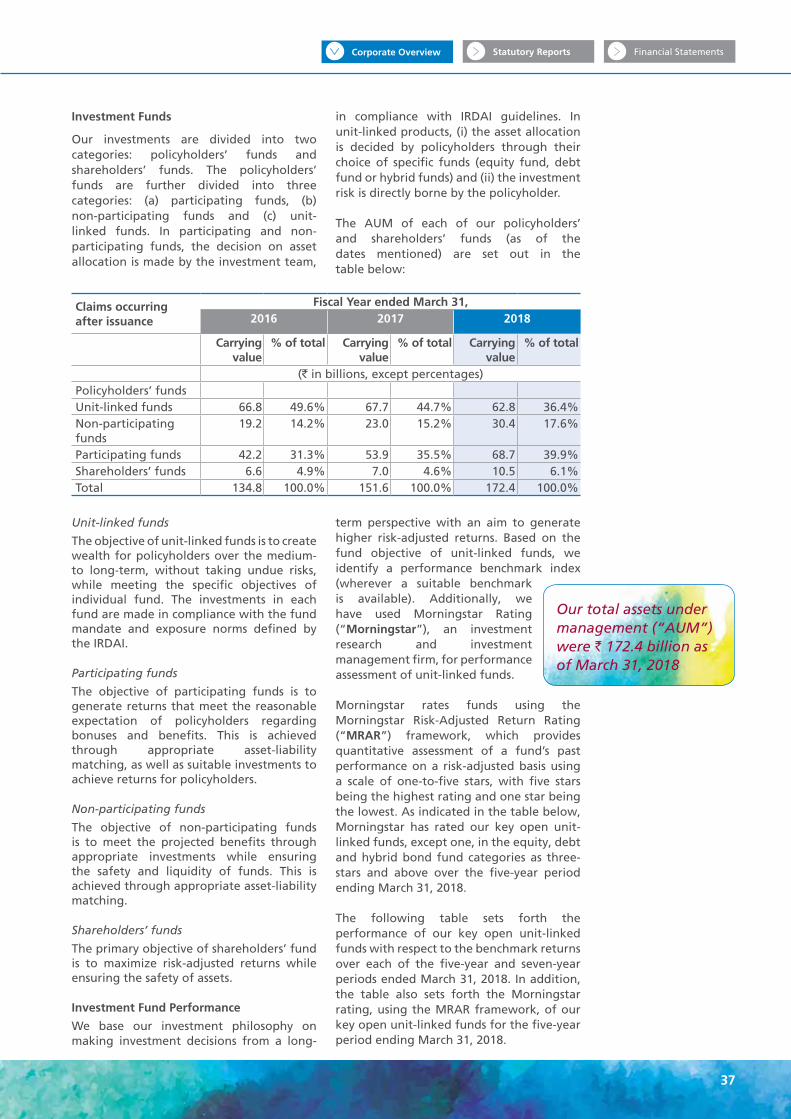
Investment Funds
Our investments are divided into two categories: policyholders’ funds and shareholders’ funds. The policyholders’ funds are further divided into three categories: (a) participating funds, (b) non-participating funds and (c) unit-linked funds. In participating and non-participating funds, the decision on asset allocation is made by the investment team,
in compliance with IRDAI guidelines. In unit-linked products, (i) the asset allocation is decided by policyholders through their choice of specific funds (equity fund, debt fund or hybrid funds) and (ii) the investment risk is directly borne by the policyholder.
The AUM of each of our policyholders’ and shareholders’ funds (as of the dates mentioned) are set out in the table below:
Our total assets under management (“AUM”) were ` 172.4 billion as of March 31, 2018
Claims occurring after issuance
Fiscal Year ended March 31,2016 2017 2018
Carrying value
% of total Carrying value
% of total Carrying value
% of total
(` in billions, except percentages)Policyholders’ fundsUnit-linked funds 66.8 49.6% 67.7 44.7% 62.8 36.4%Non-participating funds
19.2 14.2% 23.0 15.2% 30.4 17.6%
Participating funds 42.2 31.3% 53.9 35.5% 68.7 39.9%Shareholders’ funds 6.6 4.9% 7.0 4.6% 10.5 6.1%Total 134.8 100.0% 151.6 100.0% 172.4 100.0%
Unit-linked funds
The objective of unit-linked funds is to create wealth for policyholders over the medium- to long-term, without taking undue risks, while meeting the specific objectives of individual fund. The investments in each fund are made in compliance with the fund mandate and exposure norms defined by the IRDAI.
Participating funds
The objective of participating funds is to generate returns that meet the reasonable expectation of policyholders regarding bonuses and benefits. This is achieved through appropriate asset-liability matching, as well as suitable investments to achieve returns for policyholders.
Non-participating funds
The objective of non-participating funds is to meet the projected benefits through appropriate investments while ensuring the safety and liquidity of funds. This is achieved through appropriate asset-liability matching.
Shareholders’ funds
The primary objective of shareholders’ fund is to maximize risk-adjusted returns while ensuring the safety of assets.
Investment Fund Performance
We base our investment philosophy on making investment decisions from a long-
term perspective with an aim to generate higher risk-adjusted returns. Based on the fund objective of unit-linked funds, we identify a performance benchmark index (wherever a suitable benchmark is available). Additionally, we have used Morningstar Rating (“Morningstar”), an investment research and investment management firm, for performance assessment of unit-linked funds.
Morningstar rates funds using the Morningstar Risk-Adjusted Return Rating (“MRAR”) framework, which provides quantitative assessment of a fund’s past performance on a risk-adjusted basis using a scale of one-to-five stars, with five stars being the highest rating and one star being the lowest. As indicated in the table below, Morningstar has rated our key open unit-linked funds, except one, in the equity, debt and hybrid bond fund categories as three-stars and above over the five-year period ending March 31, 2018.
The following table sets forth the performance of our key open unit-linked funds with respect to the benchmark returns over each of the five-year and seven-year periods ended March 31, 2018. In addition, the table also sets forth the Morningstar rating, using the MRAR framework, of our key open unit-linked funds for the five-year period ending March 31, 2018.
Financial StatementsStatutory ReportsCorporate Overview
37

The following table sets forth the net investment income yield by fund category for the periods indicated:
As of March 31,2016 2017 2018
With unrealized
gains
Without unrealized
gains
With unrealized
gains
Without unrealized
gains
With unrealized
gains
Without unrealized
gainsPolicyholders’ fundsUnit-linked funds (4.1)% 9.6% 13.6% 12.7% 8.1% 15.8%Non-participating funds 7.8% 8.9% 11.6% 8.4% 5.3% 8.3%Participating funds 8.0% 9.0% 12.4% 8.9% 5.2% 9.0%Shareholders’ funds 8.2% 8.8% 11.2% 8.7% 5.8% 8.4%
Note: Yield is computed using Time Weighted Rate of Return as per modified dietz method.
Linked % of total
Non-par-ticipating
% of total
Partici-pating
% of total
Share-holders
% of total
Total % of total
(` in billions, except percentages)Government securities
5.6 8.9% 16.6 54.7% 35.7 51.9% 6.3 60.4% 64.2 37.2%
Corporate bondsAAA 10.5 16.7% 12.5 41.1% 30.0 43.7% 2.9 27.8% 55.9 32.4%AA+/AA 1.1 1.7% 0.4 1.5% 0.3 0.4% 0.1 0.5% 1.9 1.1%AA- or below 0.0 0.0% 0.2 0.5% 0.4 0.6% 0.3 2.8% 0.8 0.5%Equity Shares(1) 36.5 58.1% 0.3 0.9% 2.1 3.1% 0.0 0.1% 39.0 22.6%Money market instruments
8.1 13.0% 0.4 1.3% 0.2 0.3% 0.9 8.4% 9.6 5.6%
Others(2) 1.0 1.6% 0.0 0.0% 0.0 0.0% 0.0 0.0% 1.0 0.6%Total 62.8 100.0% 30.4 100.0% 68.7 100.0% 10.5 100.0% 172.4 100.0%
(1) Equity shares include listed equity, exchange traded funds and additional tier-one bonds.
(2) Others include net current assets for linked funds.
Investment Portfolio
Our diversified investment portfolio primarily comprises of equities, government securities and corporate debt. Additionally, we also invest in fixed deposits, exchange traded funds (ETFs), liquid mutual fund units and ‘other investments’.
As of March 31, 2018, the total AUM was ` 172.4 billion, including 37.2% in government securities, 34.0% in corporate debt and 22.6% in equities (including ETFs).
The following table sets forth, as of March 31, 2018, the composition of AUM across different asset classes:
Five-year performance Seven-year performance
Fund Fund returns (annualized)
Benchmark returns
(annualized)
Morningstar rating (MRAR
Rating)
Fund returns (annualized)
Benchmark returns
(annualised)
Flexi Cap 14.6% 14.1% *** (3-star) 10.0% 9.3%
Balancer II 10.6% 10.5% *** (3-star) 8.6% 8.4%
Protector II 7.6% 8.6% ** (2-star) 8.6% 8.6%
Virtue II 17.4% N.A. ***** (5-star) 11.6% N.A.
N.A. = Benchmark not available.
Note: Morningstar Rating is based on MRAR, which is a measure of a fund’s past performance after adjusting for risk. Morningstar sets the distribution of funds across the rating levels, assigning five-year star ratings as follows:
1. All funds in the category are sorted by MRAR % Rank for the respective time period in descending order.
2. Starting with the highest MRAR % Rank, those in the top 10% of such funds receive a 5-star rating.
3. The next 22.5% (i.e., ranking below the top 10% and up to the top 32.5%) of funds receive a 4-star rating, and the following 35% (i.e., ranking below the top 32.5% and up to the top 67.5%) of funds receive a 3-star rating.
4. The next 22.5% (i.e., ranking below the top 67.5% and up to the top 90%) of funds receive a 2-star rating.
5. The remaining funds (i.e., the bottom 10% of the category) receive a 1-star rating.
38

As of March 31,2016 2017 2018
(` in billions)
Balance sheet value
Market value
Balance sheet value
Market value
Balance sheet value
Market value
“Held to maturity” investments in non-linked and shareholder funds
67.9 70.5 83.4 88.6 107.6 109.9
As required by the Insurance Regulatory and Development Authority in India (Preparation of Financial Statements and Auditor’s Report of Insurance Companies) Regulations 2002, as amended, all our investments in debt securities are considered as “held to maturity”.
The following table sets forth, as of the dates mentioned, the book value and market value of these investments.
Equity investments
Our equity portfolio is well diversified and consists of investments in high-quality stocks with an adequate blend of growth and value stocks. The stock selection is based on rigorous and thorough research and analysis, in accordance with the investment framework. As per IRDAI regulations, we are not permitted to invest in equity derivatives.
As of March 31, 2018, 91% of our equity investment was in companies forming part of the NIFTY 50 Index. The following table sets forth, as of March 31, 2018, the breakdown of equity investments by sectors that accounted for more than 5% of total equity investments:
As of March 31,
2016 2017 2018
Equity investment*
% of total Equity investment*
% of total Equity investment*
% of total
Sector** (` in billions, except percentages)
Financial and insurance activities
10.3 25.7% 10.5 25.7% 10.4 29.0%
Computer programming, consultancy and related activities
7.1 17.7% 4.8 11.8% 4.6 12.9%
Manufacture of motor vehicles, trailers and semi-trailers
3.7 9.2% 4.0 9.9% 3.5 9.8%
Manufacture of coke and refined petroleum products
3.4 8.4% 3.7 9.1% 3.5 9.7%
Infrastructure sector 1.6 3.9% 2.7 6.7% 2.2 6.1%
Civil engineering 2.1 5.3% 1.8 4.3% 2.1 5.9%
Manufacture of tobacco products
2.6 6.5% 2.8 6.8% 1.9 5.2%
Manufacture of pharmaceuticals, medicinal, chemical and botanical products
2.5 6.2% 2.7 6.5% 1.5 4.1%
Manufacture of chemicals and chemical products
1.3 3.2% 2.1 5.1% 1.3 3.6%
(*) Equity investments include listed equity securities and additional tier-1 (AT1) bonds.
(**) Industrial sectors as defined under National Industrial Classification (NIC) 2008.
Financial StatementsStatutory ReportsCorporate Overview
39

Fixed income investments
Our fixed income portfolio consists of government securities, corporate debt and money market instruments. We aim to maintain a fixed income portfolio of high asset quality. As of March 31, 2018, sovereign debt and AAA bonds constituted 98% of the AUM of our fixed income portfolio, based on ratings provided by SEBI-registered rating agencies. We have not had any defaults or delayed payments in our fixed income portfolio.
The following table shows the breakdown of fixed income portfolio by credit rating:
As of March 31,
2016 2017 2018
Carrying value
% of total Carrying value
% of total Carrying value
% of total
(` in billions, except percentages)
Government securities 49.3 61.7% 52.3 53.2% 64.2 52.3%
Corporate bonds
AAA 28.6 35.7% 42.7 43.5% 55.9 45.5%
AA+/AA 2.0 2.5% 3.2 3.3% 1.9 1.5%
AA- or below 0.0 0.1% 0.0 0.0% 0.8 0.7%
Total 79.9 100.0% 98.2 100.0% 122.9 100.0%
As of March 31,
2016 2017 2018
Corporate debt
investment
% of total Corporate debt
investment
% of total Corporate debt
investment
% of total
(` in billions, except percentages)
Financial and insurance activities
8.6 27.2% 15.3 33.4% 22.8 38.8%
Infrastructure sector 13.6 43.1% 18.5 40.3% 22.3 38.0%
Housing sector 7.6 23.9% 10.3 22.3% 11.4 19.4%
Our corporate debt portfolio constituted 22.8%, 30.3% and 34.0% of the total AUM as of March 31, 2016, March 31, 2017 and March 31, 2018, respectively. Our corporate bond investments are diversified across industries as well as issuers. All investments are in compliance with the IRDAI prescribed limits with
respect to single company, group and sector exposure.
The following table sets forth, as of March 31, 2018, the breakdown of our corporate debt holdings by sectors that constituted more than 5% of total investments in corporate debt:
Risk Management We are exposed to different types of internal and external risks. Our Lines of Businesses assess our risks, together with advisory review from Enterprise Risk Management, Ethics & Compliance, Internal Audit, Legal and Information Security functions
(collectively, “Control Functions”). All the Heads of Control Functions have direct reporting relationship to the Managing Director to maintain the autonomy of these functions. Process Risks are identified through:
40
• Standards Operating Procedures (“SOP”) review and assessment by the Risk, Compliance, and Legal Management teams before implementation;
• Self-Risk and Control assessment carried out by each Line of Business function for appropriate Risk Identification Treatment and Mitigation; and
• Compliance reviews, which include regulatory compliance checks across enterprise and Branch Office reviews and which are included in our Enterprise Risk Management reports.
Our Enterprise Risk Management Policy sets out our approach to risk management, recognizing that each individual member of our businesses has a role to play in risk management. It specifically defines the roles and respective accountabilities of our Board of Directors, Audit Committee, Management Risk committees, Control Functions, Management and Internal Audit teams. The policy outlines the businesses risk criteria and appetite which is to be applied when assessing adverse events and considering the impact of these on the businesses ability to achieve their objectives.
We base our risk appetite on a set of criteria defined in relation to a set of consequences and the likelihood of these events occurring. We assess risks as critical, high, medium or low in significance and such risks are subsequently managed according to these ratings. The assigned risk criteria is approved by the Board of Directors and reviewed to reflect any changes in the internal and external environment, which may alter our tolerance to risk events.
Our risk mitigation plan is continuously tracked through a risk register. The risk register indicates the level of risks faced by the organization identified through functional key risk indicators for areas exposed to critical and high risks, as well as the consequences, exposure and identified mitigants of the risks, in order to control the risks. These risks are derived from our discussions with various stakeholders and internal reviews. Our Enterprise Risk function continuously monitors these risks and also presents these risks to our Board of Directors in the quarterly held board meetings.
Our approach to risk management includes three “lines of defense”. Firstly, we have functional teams that have ownership, responsibility and accountability for directly assessing, controlling and mitigating risks. Secondly, we have functional governance and advisory teams, such as our Enterprise Risk Management and other Control Functions, that provide oversight and assist management in implementing, monitoring and reporting on operational risk programs. Thirdly, we conduct internal audits that provide an independent review of the efficacy of our risk assessment and management.
Risk Management Committees
Our Investment Committee of our Board of Directors monitors the suitability of assets and liabilities under traditional lines of business, and our Asset Liability Management and Risk Management (“ALMR”) Committee of our Board of Directors reviews, on at least a quarterly basis, the ALM position of each of the funds under our general account and provides advice regarding possible measures to be taken to minimize any duration mismatch between assets and liabilities. Our Board has approved an ALM policy in accordance with the guidelines issued by the IRDAI and in view of the nature of our liabilities and invested assets.
Additionally, our ALMR Committee reviews on a quarterly basis the completeness of the risk assessments performed at Company level and advises our senior management on the appropriateness of the management action plans developed to mitigate the top and emerging risks at an enterprise level.
Our Executive Risk Management Committee (“RMC”), which meets on a quarterly basis,
Our Enterprise Risk Management Policy sets out our approach to risk management, recognizing that each individual member of our businesses has a role to play in risk management.
Financial StatementsStatutory ReportsCorporate Overview
41

reviews and assesses the risk impact on the Company’s defined risk tolerance limit, approves the Company’s risk management structure and operational framework within the Enterprise Risk Management scope and framework and approves implementation of strategies to be undertaken to reduce risk exposures over time. The RMC also considers emerging risks across the industry and reviews the appropriateness of new mitigation programs. Various sub-committees, including our Information Security Committee, Underwriting and Claims Committee, Outsourcing Committee, Investment Monitoring Committee have been set up for specific risk assessment and mitigation plans.
Competition The Indian insurance industry is highly competitive, with 24 public and private life insurance companies operating in India as of March 31, 2018, according to CRISIL. We track the progress of the top ranked private life insurance companies in India across key metrics.
The key metrics on which we compare ourselves with our competition are growth, product mix, expense efficiency, quality (as measured by persistency), value of new business margin and operating return on embedded value.
According to CRISIL, we were one of the top 10 private life insurance companies in India based on total new business premium in Fiscal 2018 and are growing rapidly with a compounded annual growth rate of 19.85% in total new business premium from Fiscal 2015 to Fiscal 2018. In addition, our product mix had a higher share of non-linked products amongst our primary competitors (Source: CRISIL).
The following table sets forth total new business premium growth, individual new business premium growth, non-linked product mix based on new business premium, expense ratio based on new business premium, persistency, operating return on embedded value and value of new business margin for the top 10 private sector life insurance companies, based on individual new business premium, in India for Fiscal 2018. However, the order in which PNB MetLife and the other top 10 private sector life insurance companies are presented in the table below is not meant to reflect their ranking among private sector life insurance companies, either based on individual new business premium or with respect to any of the metrics presented in the table below.
Fiscal Year ended March 31, 2018
Company Total new business premium
growth
Individual new
business premium
growth
Non-Linked Product
Mix based on new
business premium
Operating Expense
Ratio based
on new business premium
Persistency (13th
month based on premium)
Operating Return on
Embedded Value
Value of new
business margin
PNB MetLife 24.2% 21.7% 81.8% 57.1% 77.0% 16.1.% 17.1%SBI Life 8.1% 29.9% 44.1% 15.7% 83.0% 17.9% 16.2%ICICI Prudential 17.1% 20.4% 23.6% 22.0% 86.8% 22.7% 16.5%HDFC Standard 30.5% 41.5% 65.7% 27.8% 87.1% 21.5% 23.2%Max Life 18.6% 20.4% 67.3% 37.0% 81.0% 20.6% 20.2%Kotak Mahindra Life Insurance Company*
19.5% 37.3% 55.9% 32.6% 85.5% N.A. N.A.
Bajaj Allianz 30.4% 36.6% 59.4% 28.1% 77.2% N.A. N.A.Tata AIA 31.5% 33.4% N.A.% 56.0% 81.2% N.A. N.A.Birla Sunlife 5.1% 19.9% N.A.% 30.7% 75.3% N.A. N.A.Canara HSBC OBC Life 24.9% 32.5% N.A. 29.8% 77.9% N.A. N.A.
* Formerly known as Kotak Mahindra Old Mutual Life Insurance Ltd.Note: N.A.: not availableSource: IRDAI, company reports, CRISIL, except with respect to operating return on embedded value and value of new business margin for PNB MetLife, which are contained in the Embedded Value Report
42

Brand Strength and MarketingWe benefit from the brand equity of PNB, which is the second largest bank in India by number of branches, and MIHL, which is a subsidiary of MetLife. MetLife, including its subsidiaries and affiliates, is a leading global insurance company with a presence in more than 40 countries.
We believe the PNB MetLife brand name is associated with attributes such as trust and empathy. Through continued marketing activities and need-based media campaigns, our marketing function aims to reinforce these attributes and position us as the most trustworthy and customer-centric brand choice for life insurance products in India. For example, we promoted need-based selling through our “Circle of Trust” campaign across our bancassurance partners’ branches and in 2016 we launched a film called Magician, which focuses on the uncertainty of life and the need to be insured. The film was widely viewed and won a Bronze at the Spikes Asia 2016 Awards. In 2018, we also launched a film called Joy Da, which promotes extending life insurance coverage to the age of 99 years, which has generated 8 million views through digital platforms.
In addition, in our view there is a strong link between health, fitness and the well-being of individuals and the growth of our business. We actively promote and support various sporting events, including badminton and marathons in India, which we associate with the promotion of healthy living. For example, in conjunction with MetLife, we have been sponsors of the badminton BWF Superseries for the past four years and have conducted other nation-wide badminton events to promote health and fitness among consumers, including the PNB MetLife Junior Badminton Championship, which is the largest national badminton program for school children in India. The third season of our PNB MetLife Junior Badminton Championship marked the launch of our “3D Pro Badminton Challenge” app, which had more than 1 million downloads. In addition, we have promoted numerous walkathons and marathons through our ‘#RunForHappiness’ platform, including the Satara Hill Half Marathon, which draws participants from across India and around the world.
As part of our efforts to offer superior customer experience and promote our products through digital platforms, in 2016 we launched the PNB MetLife Infinity application. The PNB MetLife Infinity application is a secure digital hub that allows users to create a digital legacy by enabling them to share important documents, images, videos and memories with their nominees in case something were to happen to them. To drive awareness and get people to experience the application, we launched a campaign called #AnythingCanHappen which focuses on the unpredictability of life and reinforces the need for insurance and the importance of safeguarding important documents and memories. This application won the Finnoviti award for innovation in the Banking, Financial Services and Insurance sector in 2017.
We have also actively aimed at increasing our promotion of various products online. For example, in order to promote our critical illness plan PNB MetLife Mera Heart and Cancer Care, we introduced “Dr. Jeevan”, an artificial intelligence-powered interactive chatbot solution on the Facebook Messenger platform for a limited time.
Accreditations, Awards and Achievements Various industry organizations and other bodies have conferred awards to us in recognition of our achievements across several domains. The following table sets forth examples of the awards we have won in the categories of innovation, products and marketing, beyond business, digital, website and training:
We believe the PNB MetLife brand name is associated with attributes such as trust and empathy.
Financial StatementsStatutory ReportsCorporate Overview
43

Category Award
Innovation Banking Frontiers Finnoviti Award (2018) for our conVRse platform
Best Use of Technology to Enhance Customer Experience, for conVRse customer service platform at the Zendesk Customer Experience Awards (2018)
Innovation of the Year, 21st Annual Asia Insurance Industry Awards (2017) for conVRse customer service platform (together with LumenLab)
Best Technology Innovation, Fintelekt Insurance Awards (2017) for conVRse
Digital Innovation Award, in the Virtual Reality category at the BFSI Digital Innovation Awards (2017) hosted by Indian Express Group for our conVRse platform
Products and Marketing Best Use of Social Media in Marketing, Global Marketing Excellence Awards (2017) for our #MakeTime social media campaign
Best Product Innovation Award for Mera Heart and Cancer Care (MHCC), National Awards for Excellence in Insurance (2017)
Best Product Innovation, Life Insurance Leadership Awards (2017) for Mera Heart and Cancer Care (MHCC)
Spikes Asia Bronze Award (2016) for our Life Mein Twist campaign
Best Use of Social Media in Marketing, ABP News (2016) for #AnythingCanHappen social media campaign
Beyond Business Best Employee Diversity & Inclusion Company, Employee Engagement Leadership Awards (2018)
100 Best Companies for Women, Working Mother and AVTAR (2017 and 2016)
ACEF for the CSR programme, CSR Excellence Awards (2016)
Most Sustainable Company of India, India Sustainability Leadership Summit (2015)
Digital/ Information Technology
CIO Crown (2017), Digital Innovation – Inclusive Awards for our Next Gen IT backbone
Dell EMC Transformer Award (2016) for IT transformation
Express Intelligent Enterprise Award (2016) for data center
Website Celent Model Insurer Asia Award (2016) as a model insurer in Asia
Website of the Year, E-Commerce Summit (2016)
Training National Award for Best Use of Technology in Training and Development, World HRD Congress (2017)
Best Education Training Campaigns, Asia Training & Development Excellence Awards (2016)
Best Sales Development Program, Asia Training & Development Excellence Awards (2016)
Risk Management Special Commendation for Golden Peacock Award for Risk Management (2016)
44

Mark Application Number Class Date filed
CIRCLE OF TRUST and Logo in English
2641386 36-INSURANCE AND FINANCIAL SERVICES Dec 12, 2013
CIRCLE OF TRUST and Logo (in Hindi)
2638052 36-INSURANCE AND FINANCIAL SERVICES Dec 5, 2013
CIRCLE OF TRUST 2581134 36-INSURANCE AND FINANCIAL SERVICES Aug 16, 2013
Employees As of March 31, 2018, we had 9,845 employees, including 4,052 part-time employees, in over 100 cities in India. Our individual agents are not our employees. We have competitive financial rewards in line with our philosophy of pay for performance. Our compensation program differentiates pay increases based on performance. We aim to differentiate ourselves with an open, ethical and performance based culture and pride ourselves with rewarding talent through principles of meritocracy. In addition to a fixed salary, all employees have an opportunity to earn variable pay, such as performance bonuses or sale incentives. We have an annual variable incentive program that is applicable to all roles in the company that are not sales related, while all sales roles have sales incentive programs. The annual variable incentive program is calculated based on a combination of organizational performance and individual performance criteria. Both of these programs are directly linked to achievement of key business targets and regulatory requirements. Annual pay increases are also based on employee performance and market benchmarking,
designed to provide fair compensation while also encouraging productivity and self-motivation. We have also instituted an employee stock option plan.
We promote learning and leadership by our employees and emphasize thought leadership, with the aim of strengthening our Company and the “PNB MetLife” brand. We also offer our employees an opportunity for long-term career development by providing a platform for their learning and growth based on merit. We also seek to foster an inclusive, supportive work environment for our employees, with diversity and inclusion key to our core values. We continue to work with our stakeholders to improve our talent management framework and strengthen our organizational capabilities.
Intellectual Property PNB MetLife India Insurance Company Limited has pending applications with the Trade Marks Registry in India for the following trademarks:
Pursuant to the PNB Trademark Agreement, PNB has granted us a non-exclusive right to use the term “PNB” in the corporate name and brand of our Company. Pursuant to the IIPLA, our Company has been granted a royalty free, non-exclusive and non-transferable right to use the “MetLife” trademark and logo, along with other intellectual properties covered under the agreement, in India.
Corporate Governance Our Board of Directors is at the center of our Corporate Governance and oversees the management’s efforts to serve and safeguard the interest of our stakeholders. The Board requires that we make timely disclosures and share accurate information regarding our financials and performance, as
As of March 31, 2018, we had 9,845 employees, including 4,052 part-time employees, in over 100 cities in India.
well as our leadership and governance. We have also put in place various policies which aid us in ensuring effective governance and which help us achieve our Corporate Governance objectives.
Ethics and Compliance Our Board of Directors, through our Audit Committee, oversees our compliance framework. We have implemented various internal policies, such as our employee code of conduct, general administrative policy on ethical sales practices, policy to prevent and redress sexual harassment at work, employee grievance management policy, anti-bribery and anti-corruption policy, privacy policy, whistle-blower policy, actuarial development program
Financial StatementsStatutory ReportsCorporate Overview
45

policy, policy on Anti-Money Laundering (“AML”) and code of conduct for personal investments to ensure compliance with relevant laws and regulations issued. We have an Ethics and compliance team and a Chief Compliance Officer who reports to the Board Audit Committee on various compliance matters.
Our compliance team identifies, and disseminates to all relevant functions, all relevant and applicable laws, regulations and circulars issued by the IRDAI and monitors the adequacy of our compliance framework. We have a well-defined Compliance Risk Management Program (“CRMP”), which monitors Compliance risks associated with our business and addresses any such risks through implementing our Compliance policies and procedures. Our Compliance function has also established a certification process, whereby the head of each Company department certifies, on a quarterly basis, that their department is in compliance with statutory and regulatory guidelines and our internal policies. Our Compliance function also conducts Branch Office reviews, to monitor the compliance activities at the branch level. On a quarterly basis, our Chief Compliance Officer updates the Audit Committee on any compliance failures, regulatory actions, key regulatory developments and key steps taken to ensure compliance.
Complaints or grievances of malpractice against both sales and non-sales persons, employees or agents are investigated by the relevant functional teams, such as our human resources or Compliance function. The investigating team makes a determination and then proposes an appropriate response by the Company. Any disputed cases are presented to our Malpractice Actioning Committee. Our Malpractice Actioning Committee, which consists of the head of each of our human resources department and our compliance and legal departments, is authorized to make the final decision with regard to the recommendations on each disputed case made by the relevant functional team.
Our compliance efforts are further supported through a risk-based internal audit approach, which is aimed to provide reasonable assurance to the Audit Committee and the senior management regarding the adequacy and effectiveness of
the Company’s risk management and control framework. Key internal audit observations and recommendations are reported to the Audit Committee on a quarterly basis and implementation of such recommendations is actively monitored.
Legal Proceedings We are a party to certain legal actions and regulatory proceedings, including criminal matters related to contested insurance claims, allegations of mis-selling, disputes with customers on sale practices and related disputes.
Properties
We have three corporate offices, located in Lower Parel in Mumbai, Goregaon in Mumbai and Gurgaon. We are headquartered in Mumbai, India.
As of March 31, 2018, we own one property in Bangalore (our registered office in Bangalore) and one property in Mumbai (Lower Parel) and have leased 108 properties across India.
Corporate Social Responsibility Initiatives We have constituted a Corporate Social Responsibility (“CSR”) Committee in accordance with the Companies Act requirements. The duties and responsibilities of the CSR Committee include formulating and recommending our CSR Policy to our Board of Directors, monitoring the implementation of the CSR Policy and setting the budget for our CSR activities. In addition, we have a CSR Management Committee, which monitors the progress and completion of CSR projects, reviews CSR plans and goals, determines whether proposed additional CSR spending will be presented to our Board of Directors for approval, audits CSR spending and presents progress reports to our Board of Directors.
The key focus areas of our CSR Program are:
• Financial Inclusion: Providing low-income families and individuals with the financial tools to improve their lives in identified segments, including (a) unorganized sector – daily wage earners, (b) women’s rights and (c) small-scale farmers.
• Health Initiatives: Undertaking initiatives on preventative healthcare, raising awareness and working with relevant
46
partners and Swachh Bharat Abhiyan, a cleanliness campaign by the GoI.
• Education and Vocational Training: Providing opportunities for children in identified locations to get access and help in getting education in schools, helping those who have withdrawn from the school system with skills training.
• Disaster Relief and Rehabilitation activities: Providing medical aid, food supply, supply of clean water, rebuilding of houses or any other activity that can be aligned to relief and rehabilitation efforts.
• Promotion of nationally recognized sports, such as badminton: Providing scholarships for talented underprivileged children to pursue their dream of excelling in the sport.
• Insurance awareness initiatives
We have undertaken a number of insurance awareness initiatives across India in order to demystify insurance, including workshops for customers, publishing insurance awareness leaflets and thought pieces and digital initiatives and campaigns such as #DoubleSureForTomorrow and #KhushiyonKiSuraksha.
In line with our CSR objectives, we focus on women’s health and skill development, child education and sports. We have undertaken a number of initiatives across India to improve access to education and children’s rights. For example, working with Child Rights and You (“CRY”), an Indian non-profit, and in conjunction with the Jammu Kashmir Association of Social Workers, we have helped facilitate the creation of youth
activity centers and computer labs to provide opportunities for children to gain access to education and learn computer skills. Through our association with CRY, we have provided opportunities, through annual scholarships for training and coaching, to underprivileged children to learn to play badminton and participate in the PNB MetLife Junior Badminton Championship. The PNB MetLife Junior Badmintonship tournaments are being conducted in 10 cities across India. In the city of Varanasi, we launched, in partnership with Drishtee, a non-governmental organization, a project called “Sakhi Swavlamban”, which aims to help rural women and widows bridge the opportunity gap by teaching them practical skills. The program is intended to improve the financial capacity and access to opportunities of marginalized women, allowing them to become self-reliant and entrepreneurial.
Financial StatementsStatutory ReportsCorporate Overview
47

Mr. Lyndon Emanuel Oliver is the Chairman and Non-Executive Director of our Company. He holds a bachelor’s degree in science and a master’s degree in business administration from the University of Alabama, USA. He has qualifiedwiththeBoardofAccountancyasaCertifiedPublicAccountantintheStateofFlorida,USA.Hehasbeenon the Board since August 10, 2016 and was re-appointed as a Director on August 10, 2017. He was appointed as our Chairman pursuant to a board resolution dated January 28, 2018, with effect from January 9, 2018. He has heldanumberofexecutive,managerialandfinancialmanagementrolesinvariouscompanies,withfinancial,productpricing,tax,financialplanningandmanagementanalysisexperience.
Mr. Ashish Kumar Srivastava is theManaging Director and Chief Executive Officer (“MD and CEO”) of ourCompany. He holds a post graduate diploma in personnel management from Xavier Institute of Social Service, Ranchi.HehasalsoattendedadvancedcertificatecoursesfromRichardIveySchoolofBusiness,MichiganRossSchool of Business and Cornell University. He joined our Company as Head of Human Resources in 2013. He was then associated as Vice President, Head of Human Resources with MetLife for Middle East and Africa from October 1, 2015 to December 31, 2016. He was then re-appointed as our Managing Director and Chief Executive OfficeronOctober1,2017.Hehasover26yearsofexperienceinarangeofindustriesincludingbankingandfinancialservicessectorinAsia,MiddleEastandAfrica,withexperienceinbuildingsustainablestrategies,changemanagement, transforming and enhancing leadership capabilities. He has also been with the IBL Group, Mauritius as its head of human resources and communications between December 2012 and June 2013. Prior to joining our Company, he was working with Canara HSBC Life Insurance from April 2008 to November 2012. He has also worked at Hindustan Coca Cola Beverages and the Taj Group. He has also served as a director on the board of HSBC Operations & Processing India Private Limited from June 28, 2004 to May 30, 2008.
Mr. Sunil Mehta is a Non-Executive Director of our Company. He holds a master’s degree in business administration infinance.HehasbeenonourBoardsinceAugust2,2017.Hehasmanyyearsofexperienceinadministrativeandfunctionalcapacitiesinofficesforagriculture,retail,creditandplanninganddevelopment.PriortojoiningourCompany, he was an executive director at Corporation Bank. He has served as the general manager of Allahabad BankandiscurrentlythechiefexecutiveofficerandmanagingdirectorontheboardofPNB.Hehasparticipatedin a seminar on ‘Economic Challenges by developing Economics’ in Turkey.
Mr. Bharat Raj Kannan is a Non-Executive Director of our Company. He holds a bachelor’s degree in business administration from Temple University, Philadelphia, Pennsylvania, USA and a master’s of science degree in human resources from Kellstadt Graduate School of Business, DePaul University, Chicago, Illinois, USA. He has also attended INSEAD’s Management Acceleration Program. He has been on our Board since August 2, 2017. He has many years of experience in employee management and distribution. He was the head of Employee BenefitsforAsia,focusedonenhancingMetLife’semployeebenefitscapabilitiesacrosstheregion,beforebeingappointedastheseniorvicepresident,chiefdistributionofficerofAsiafromSeptember1,2015.Priortojoiningour Company, Mr. Bharat Raj Kannan spent over 11 years at Aon from February 2004 to March 2015. He also served as director, Aon Risk Solutions Japan Limited where he lead their foreign local client division while directly managingtheirlargescaleinternationalrelationshipsandwasalsothechiefexecutiveofficerofAonInsuranceBrokers (Malaysia), Kuala Lumpur.
Board of Directors
48

Mr. Lingam Venkata Prabhakar is a Non-Executive Director of our Company. He has been on our Board since July 19, 2018. He has many years of professional experience. He is an executive director of PNB.
Mr. Pheroze Kersasp Mistry is a Non-Executive Director of our Company. He holds a bachelor’s degree in science from University of California and a master’s degree in business administration from Cornell University. He is also a fellow of the Institution of Engineers (India). He has been on our Board since April 20, 2001 and was reappointed for a period of one year with effect from August 10, 2017. He has many years of experience in business administration. He is the director of M. Pallonji & Co. Private Limited, which is engaged in providing logistics, industrial coating and painting on a contract basis and setting up wind turbines.
Mr. Surbhit Dabriwala is a Non-Executive Director of our Company. He holds a bachelor’s degree in arts from University of Pennsylvania. He has been on our Board since August 1, 2004, and was reappointed for a period of one year with effect from August 10, 2017. He is a promoter and non-executive non-independent director on the board of EIL. He has many years of experience in manufacturing and real estate sectors.
Mr. Erach Kotwal is a Non-Executive Director of our Company. He holds a master’s degree in law from University of Cambridge. He has been on our Board since November 23, 2016, and was reappointed for a period of one year with effect from August 10, 2017. He is an Advocate, practicing in the High Court at Mumbai since 1984 and has 31 years of legal experience.
Ms. Anisha Motwani is an Independent Director of our Company. She holds a bachelor’s degree in science from University of Rajasthan, Jaipur and a master’s degree in business administration from University of Rajasthan. She hasmanyyearsofexperienceinmarketing,brandanddigitalstrategies,managementandfinancialservices.Priorto joining our Company, she worked with McCann Erickson from 1991 to 1993 and Leo Burnett from December 1, 2000 to December 31, 2003. She is also associated with marketing for several known companies. She has won manyawardsforhercreativeexcellence.SheisalsoacolumnistatHuffingtonPostandregularlypublishesherpoint of view on many subjects including gender diversity, social marketing, business and consumer trends in leading publications.
Financial StatementsStatutory ReportsCorporate Overview
49

Mr. Neeraj Swaroop is an Independent Director of our Company. He holds a bachelor’s degree in mechanical engineering from Indian Institute of Technology, Delhi and a post graduate diploma in business administration from Indian Institute of Management, Ahmedabad. He also holds a post-graduation degree in retail bank managementfromUniversityofVirginia.Hehasmanyyearsofexperience infinancialservicesandconsumergoods industry. Prior to joining our Company, he was the country head for India of the Singapore Exchange from January 2017 to June 2018. Mr. Neeraj Swaroop has been associated with Standard Chartered Bank, in various capacities, includingbeingthechiefexecutiveofficerof itsSingapore franchise from2014 to2015, thechiefexecutiveofficerforninesouth-eastAsiancountriesfrom2012to2013andthechiefexecutiveofficerfor itsIndia, Bangladesh, Sri Lanka, Nepal and Afghanistan franchise from 2005 to 2011.
Mr. Sunil Gulati is an Independent Director of our Company. He holds a bachelor’s degree in electrical engineering from the Indian Institute of Technology, Delhi and a master’s degree in business administration from the Indian Institute of Management, Ahmedabad. He also completed a course on ‘Governing the Corporation: Global Perspectives in the Indian Context’ from The Wharton School, University of Pennsylvania. He has 29 years of experienceinthebankingindustryacrossinvestmentbanking,corporatefinance,relationshipmanagement,riskmanagement and corporate strategy. He is the non-executive chairman of Merisis Advisors, a boutique investment bank. He is an advisor to Ambit Finvest, Insense Analytics and WEH Ventures. Prior to joining our Company, he wasworkingwiththeRBLBankforsixyears,from2010to2016asthechiefriskofficer,heldvariouspositionsatYesBankbetween2006and2010,andwasthechiefoperatingofficerforGECapitalServicesIndiafrom2004.Hewas alsodesignatedas theheadof investmentbankingandmanagingdirector in the corporatefinancedepartment at ING Bank. He was also the executive vice president in ING Vysya Bank Limited. He was also on the board of trustees for ING Investment Management in India between 2012 and 2014 and was associated with Bank of America, in India and Hong Kong from 1989 to 2001. Mr. Sunil Gulati is also a charter member of TiE and their fintechspecialinterestgroup.HeisalsoamemberoftheadvisoryboardofS.P.JainGlobalManagementSchooland a visiting faculty to Goa Institute of Management.
Board of DirectorsDr. Archana Niranjan Hingorani is an Independent Director of our Company. She holds a bachelor’s degree in arts from the University of Mumbai, a master’s degree in business administration from the Graduate School of Business, University of Pittsburgh, USA and a doctorate degree in philosophy from the Joseph M. Katz Graduate SchoolofBusiness,UniversityofPittsburgh,USA.Shehas23yearsofexperienceinfinancialservicesandprivateequity fund investment. Prior to joining our Company, she was associated with the IL&FS Group for 22 years, in various capacities, including being the CEO of IL&FS Investment Managers Limited. She has been the recipient ofvariousawardssuchas‘Tenmostinfluentialwomeninprivaterealestateinvesting’byPEREin2010,‘MostPowerful Women’ in 2014, 2015, 2016 and 2017 by Fortune India, ‘Most Powerful Women’ in 2011, 2012 and 2013 byBusinessToday,‘25MostInfluentialWomeninAsiaAssetManagement’byAsianInvestorinMay,2014,and‘Distinguished International Alumnus’ in the year 2016 by the Katz Graduate School of Business, University of Pittsburgh, USA.
50

Mr. Joginder Pal Dua is an Independent Director of our Company. He holds a bachelor’s degree in law from Meerut University and a master’s degree in economics from Punjab University. He has many years of experience inbanking,financeandfinancialreconstruction.HehasservedasamemberofthegoverningboardofIndianInstitute of Banking and Finance and Xavier Institute of Management, Bhubaneshwar. Prior to joining our Company, he was the member of the Board of Industrial and Financial Reconstruction between January 2013 and May 2015 and its chairman from May 2015 to January 2016. He was also the executive director of Allahabad Bank between November 2007 and December 2009 and chairman and managing director between December 2009 and August 2012. Prior to joining Allahabad Bank, he was the general manager at Oriental Bank of Commerce.
Mr. Abhaya Prasad Hota is an Independent Director of our Company. He holds a bachelor’s and master’s degree inEnglishliteraturefromSambalpurUniversityandisaCertifiedAssociateoftheIndianInstituteofBankers.Hehas many years of experience in banking technology and regulatory compliance. He is currently on the boards of Federal Bank, IDBI Intech and Motilal Oswal Asset Management Company. Mr. Abhaya Prasad Hota is also a part time consultant to World Bank, as an expert on national payment system to World Bank missions. Prior to joining our Company, he has worked for 28 years with the Reserve Bank of India in the areas of operating payments system platforms and payment system policy and for eight years as the managing director and chief executive officerofNationalPaymentsCorporationofIndia.
Ms. Sonu Bhasin is an Independent Director of our Company. She holds a bachelor’s degree of science in mathematics from St. Stephen’s College, Delhi University and a master’s degree in business administration from Faculty of Management Studies, Delhi University. She has many years of experience in business, retail and banking. Prior to joining our Company, she has worked with various Tata companies such as Tata Housing Development CompanyLimited,RallisIndiaLimitedandTataPressLimited.ShewasalsothechiefoperatingofficerofTataCapital Limited. Ms. Sonu Bhasin was also the group president, branch banking at Yes Bank between August 2011 and October 2012, president, retail banking and business head at Axis Bank between July 2005 and July 2011. She is also the author of the book ‘The Inheritors – Stories of Entrepreneurship and Success’.
Mr. Nitin Chopra is an Independent Director of our Company. He holds a bachelor’s degree in mechanical engineering from the Indian Institute of Technology, Kanpur and a post graduate diploma in management from the Indian Institute ofManagement, Ahmedabad.He hasmany years of experience in thefinancial servicesindustry. Prior to joining our Company, he was associated with RBL Bank from 2010 to 2015, as its head of retail and consumer banking, where he oversaw business banking, retail branch banking, retail assets and liabilities, credit cards, HNI business and marketing functions. Mr. Nitin Chopra was also associated with Bharti AXA Life Insurance,asitschiefexecutiveofficerfromMay2006toApril2010.Hehasbeenanindependentdirectorontheboards of various companies, including Vodafone m-pesa Limited and Vodafone Business Services Limited.
Financial StatementsStatutory ReportsCorporate Overview
51

Mr. Khalid Ahmad, aged 38 years, joined our company on September 1, 2015 and was appointed as the Head – Products on December 1, 2016. He holds a bachelor’s degree in science from University of Calcutta and a post graduate diploma in management studies from Management Development Institute, Gurgaon. He has 15 years of experience in insurance, banking and logistics. Prior to joining our company, he was associated with ICICI Prudential Life Insurance Company Limited. He has also been associated with Reliance Nippon Life Insurance Company Limited from May 2013 to August 2015.
Mr. Sanjay Kumar, aged 48 years, joined our company on February 1, 2008 and was appointed as the Chief InvestmentOfficeronJune3,2015.Heholdsabachelor’sdegreeinchemicalengineeringfromJadavpurUniversityand master’s degree in business administration from Faculty of Management Studies (FMS), University of Delhi. Hehas22yearsofexperienceinfinancialservices.
Mr. P. K. Dinakar, aged 52 years, joined our company on July 31, 2013 and was appointed as the Appointed Actuary on August 23, 2013. He holds a bachelor’s degree in science from Calicut University and a master’s degree in statistics from Cochin University of Science and Technology and is a fellow of the Institute of Actuaries of India. He has 28 years of experience in life insurance industry and handling actuarial functions.
Mr. Samrat Ashim Das, aged 47 years, joined our company on April 18, 2016 and was designated as the Chief InformationOfficerofourCompanyonMay18,2016.Heholdsamaster’sdegreeofbusinessadministrationfromPune University. He has 22 years of experience across industries like pharmaceuticals, IT consulting, insurance and investment management and mutual funds.
Vijaya Sanjay Nene, aged 51 years, joined our company on January 12, 2006 and was designated as the Director & Head - Operations and Services of our Company on May 18, 2016. She holds an advanced diploma in management from ICFAI University. She has 27 years of experience in the life insurance industry in the areas of regulatory, compliance, risk, underwriting, claims and operations. Prior to joining our Company she was associated with Birla Sun Life Insurance Company Limited.
Mr. Bhawani Singh Pathania, aged 43 years, joined our company on April 1, 2015 and was designated as the Director & Head – Direct, Agency and Alternate on May 18, 2016. He holds a post graduate diploma in business management from the Institute of Management and Technology, Ghaziabad. He has 19 years of experience in sales.
Mr. Sameer Bansal, aged 44 years, joined our company on February 1, 2007 and was designated as the Director& Head - Bancassurance on May 18, 2016. He holds a bachelor’s degree in engineering from Mangalore University and post graduate diploma in management from the International Management Institute, New Delhi. He has 19 years of experience in management.
Mr. Niraj Ashwin Shah, aged 43 years, joined our company on May 4, 2015 and was appointed as the Chief FinancialOfficeronJuly21,2016.HeholdsapostgraduatediplomainmanagementfromIndianInstituteofManagement, Bangalore and is a chartered accountant, registered with the Institute of Chartered Accountants ofIndia.Hehas20yearsofexperienceininsuranceandbankingindustriesinareasincludingfinance,strategy,products, marketing, business analytics, investment banking and audit. Prior to joining our Company he was associated with ICICI Prudential Life Insurance Company Limited.
Management Team
52

Ms. Yagya Turker, aged 37 years, joined our company on July 12, 2017 and was appointed as the Company Secretary on August 10, 2017. She is a company secretary, registered with the Institute of Company Secretaries of India. She has 14 years of experience in company secretarial services.
Mr. Shishir Vijaykumar Agarwal, aged 48 years, was appointed as the Director and Head - Human Resources of our Company on May 2, 2018. He holds a bachelor’s degree in engineering in industrial electronics from University of Pune and a post graduate diploma in personnel management and industrial relations from XLRI, Jamshedpur. He has 22 years of experience in human resource management, employee relations and talent management.
Ms. Viraj Taneja, aged 40 years, joined our company on February 8, 2016 and was appointed as the Head – Internal Audit. She holds a bachelor’s degree in commerce from University of Mumbai and is a chartered accountant, registered with the Institute of Chartered Accountants of India. She has 17 years of experience in strategic audit planning, internal auditing methodologies, risk assessment and assurance.
Mr. Anjan Bhattacharya, aged 37 years, joined our company on October 15, 2013 and was appointed as the Chief RiskOfficer.Heholdsabachelor’sdegreeinsciencefromUniversityofDelhiandapostgraduatediplomainmanagement from International Management Institute, Delhi. He has 17 years of experience in internal audit, enterprise risk management, governance and controls, forensics and business advisory.
Mr. Sarang Kamalkishore Cheema, aged 37 years, joined our company on April 1, 2016 and was appointed as the ChiefComplianceOfficeronApril20,2016.Heholdsabachelor’sdegreeincommerceandisaqualifiedcharteredaccountant.HehasalsoclearedtheCertifiedInformationSystemsAuditorexamination.Hehasmorethan13years of experience in compliance, internal audit, risk management and forensics. Prior to joining our Company, he was associated with SBI Life Insurance Company Limited, KPMG India and ICICI Prudential Life Insurance Company Limited.
Mr. Agnipushp Singh, aged 43 years, joined our company on May 5, 2017 and was appointed as Head – Legal & Board Affairs. He holds a bachelor’s degree in commerce from University of Delhi and a bachelor’s degree in law from Symbiosis School of Law, Pune. He has 18 years of experience in legal advisory.
Mr. Hemant Khera, aged 46 years, joined our company on December 3, 2012 and was designated as the Head – EmployeeBenefits,AlliancesandSalesTrainingofourCompanyonMay18,2016.Heisacharteredaccountant,and has many years of experience in institutional business including public relations, NBFCs and life insurance.
Mr. Nipun Kaushal, aged 43 years, joined our company on March 7, 2018 and was appointed as Chief Marketing Officer. He holds a bachelor’s degree in mechanical engineering from Karnataka University and a post graduate diploma in management from International Management Institute, Delhi. He also holds a master’s degree in leadership and strategy from London Business School. He has 18 years of experience in marketing and corporate communications.
Financial StatementsStatutory ReportsCorporate Overview
53
54
Statutory Reports

Financial StatementsStatutory ReportsCorporate Overview
55
Dear Shareholders,PNB MetLife India Insurance Company Limited
Your Directors take pleasure in presenting the Seventeenth Annual Report for the year ended March 31, 2018 along with audited financial statements for the year ended March 31, 2018.
INDuStry PerforMaNCe
The Indian life insurance market is the tenth largest life insurance market in the world and the fifth largest in Asia in terms of total premium in Fiscal 2017, according to Swiss Re Institute, sigma No 3/2017. However, India continues to be an underpenetrated insurance market with a life insurance penetration of only 2.7% in Fiscal 2016, compared to a global average of 3.5% (Source: CRISIL). In addition, the protection gap in India, is amongst the highest globally at US$8.5 trillion in 2014 (Source: CRISIL).
The key drivers of growth for the Indian life insurance industry are strong GDP growth and rising incomes, low insurance penetration and density, increasing household and financial savings, increasing insurable population, rise in urbanization, increasing demand from urban, semi-urban and rural areas and digitization.
In Fiscal 2018, the life insurance industry grew by 10.77% year-on-year on total new business premium (NBP) basis to ` 1,938.7 billion and by 18.58% year-on-year on individual NBP basis to ` 921.1 billion.
CoMPaNy PerforMaNCe
We were one of the top 10 private life insurance companies in India based on total NBP in Fiscal 2018 and grew at an annual growth rate of 24.23% in total NBP from Fiscal 2017 to Fiscal 2018.
Our history and relationships with MetLife and PNB have enabled us to become a strong, professionally managed company with the capabilities necessary to take advantage of significant opportunities in the fast growing Indian life insurance market. MetLife, including its subsidiaries and affiliates, is a leading global insurance company with a presence in more than 40 countries. MetLife International Holdings, LLC, a subsidiary of MetLife, has been our shareholder since August 2001. PNB is the second largest bank in India based on total branches as of December 31, 2017 (Source: CRISIL). PNB has been our distribution partner since October 2011 and our shareholder since January 2013.
We have a pan-India, multi-channel distribution network, a comprehensive product portfolio and provide an end-to-end customer-centric service experience. We believe this positions us well to access a broad Indian customer base and address the evolving needs of Indian customers. We seek to leverage our capabilities through our scalable platform to generate profitable growth, particularly in underpenetrated segments of India’s life insurance market.
Directors’ report
Key performance metrics fiscal 2017 fiscal 2018
Value
Operating return on embedded valueNot published
16.1%*
VNB margin 17.1%*
Shareholders’ profit 103.42 141.69 (37.00%)**
Growth
Individual NBP 1,030.95 1,254.41 (21.68%)**
Total NBP 1,148.78 1,427.08 (24.23%)**
Total premium 3,236.08 3,953.51(22.17%)**
efficiency and quality
Operating expenses to total premium 23.07% 20.61%
13th month persistency 71.78% 77.03%
All numbers in crore; *
* As per Independent Actuary’s Report on Indian Embedded Value as at March 31, 2018 by Willis Towers Watson Actuarial Advisory LLP
** Growth over previous year

56
In Fiscal 2018, we had the fourth highest individual product mix based on total NBP in India (Source: CRISIL). Our individual NBP accounted for 87.90% of our total NBP in Fiscal 2018. Our individual NBP increased at an annual growth rate of 21.68% in Fiscal 2018. Our total premium increased by 22.17% in Fiscal 2018. We have improved our operating expense ratio from 23.07% in Fiscal 2017 to 20.61% in Fiscal 2018. In Fiscal 2018, our embedded value growth was 17.5%, our operating return on embedded value was 16.1% and our value of new business margin was 17.1%. Our shareholders’ profits increased by 37.00% in Fiscal 2018.
Our distribution network consists of our bancassurance, direct sales, agency and other distribution channels, through which we generated 65.02%, 27.53%, 4.80% and 2.65% of our total NBP, respectively, and 64.59%, 29.48%, 5.43% and 0.51% of our individual NBP, respectively, in Fiscal 2018. Our product portfolio covers three principal customer needs – savings, protection and pension, which in Fiscal 2018 accounted for 82.10%, 14.89% and 3.01% of our total NBP, respectively, and 93.41%, 4.09% and 2.51% of our individual NBP, respectively. In Fiscal 2018, we launched 4 new products and modified 9 products.
The alignment between our broad product portfolio and the diversity of our customers’ needs, combined with our approach to customer service, has been a key contributor to improvements in our persistency ratios. Our 13th month persistency ratio has improved from 71.78% in Fiscal 2017 to 77.03% in Fiscal 2018. We expect that our product portfolio and our customer services will continue to drive improvements in our persistency ratios over the longer-term, including for subsequent premium. Our overall claims settlement ratio for Fiscal 2018 was 92.36%; 91.12% for individual segment and 96.19% for group segment.
We expect the following competitive strengths will enable us to continue growing our business while delivering value to our shareholders:
• Ourpan-India,multi-channeldistributionnetworkpositionsus to access a demographically and geographically broad customer base across India.
• Our comprehensive product portfolio addresses thediverse and evolving needs of Indian customers, and is complemented by an end-to-end customer-centric service experience.
• Ourscalableplatformpositionsusforprofitablegrowth.
• Ourexperiencedmanagementteam.
Our strategy is to leverage our competitive strengths to drive profitable growth. We will seek to achieve this by:
• IncreasingtheactivationofthePNBbranchnetworkanddeepening our penetration of the PNB customer base.
• Growing and diversifying our multi-channel distributionfootprint to strengthen our position in various geographies and customer segments.
• DeliveringproductsalignedtothediverseneedsofIndiancustomers supported by an end-to-end customer-centric service experience.
• Driving profitability by leveraging scale and increasingpersistency.
• Utilizing information technology and implementingdigitization to drive efficiencies.
DIVIDeND & reSerVeS
The Company reported profits during the year. However, the directors did not recommend any dividend in view of the accumulated losses.
PartICuLarS of LoaNS, INVeStMeNtS aND GuaraNteeS
The provisions of Section 186(4) of the Companies Act, 2013 (CA2013) requiring disclosure in the financial statements of the full particulars of the loans given, investment made or guarantee given or security provided and the purpose for which the loan or guarantee or security is proposed to be utilised by the recipient of the loan or guarantee or security, are not applicable to an insurance company.
SuBSIDIary / aSSoCIate CoMPaNy / JoINt VeNture CoMPaNy
Your Company does not have any subsidiary or associate or Joint Venture company.
DetaILS of SIGNIfICaNt aND MaterIaL orDerS PaSSeD By tHe reGuLatorS or CourtS or trIBuNaLS IMPaCtING tHe GoING CoNCerN StatuS aND CoMPaNy’S oPeratIoNS IN future.
There are no material orders passed by the Regulators or courts or tribunals impacting the going concern status and Company’s operations in future.
DIreCtorS aND otHer Key MaNaGerIaL PerSoNNeL
DirectorsThe Directors on the Board of the Company have been appointed in accordance with the provisions of the Companies Act and in line with the provisions contained in the Articles of Association of the Company. As on March 31, 2018, Your Board comprised thirteen directors, with three being Independent Directors, one being the Managing Director & Chief Executive Officer and others being representatives of various shareholder groups. The criterion for selection of Independent Directors as well as the desired skill set, experience and competency profile is set and discussed by the Nomination & Remuneration Committee (“NrC”) and the Shareholders’ Directors Committee and thereafter by the Board. Further, the NRC evaluates the candidature of all the directors by scrutinizing the declarations received from the directors before their appointment. None of the directors are related to each other. All Independent directors have given declarations that they meet the criteria of independence as laid down under Section 149 of Companies Act, 2013.

Financial StatementsStatutory ReportsCorporate Overview
57
Change in composition of the Board of directors during the year 2017-18:
Name of the Director appointment/resignation/Cessation of tenure/ Withdrawal of Nomination/vacation of office
With effect from
Mr. M Balachandran Vacated his office as Director on his retirement as Director at Punjab National Bank
April 23, 2017
Ms. Usha Ananthasubramanian Vacated her office as Director on her retirement as Director at Punjab National Bank
May 05, 2017
Mr. Sanjiv Sharan Appointment May 08, 2017
Ms. Kastity Ha Vacated her office as Director on her retirement as Director at MetLife International Holding LLC
May 19, 2017
Dr. Archana Hingorani Appointment as Independent Director June 30, 2017
Mr. Bharat Kannan Appointment as Nominee Director August 02, 2017
Mr. Sunil Mehta Appointment as Nominee Director August 02, 2017
Mr. V K Chopra Vacated his office as Independent Director August 05, 2017
Mr. Doulat Raj Mohnot Appointment September 12, 2017
Mr. Ashish Kumar Srivastava Managing Director & CEO October 01, 2017
Mr. Neeraj Swaroop Appointment as Independent Director October 10, 2017
Mr. Christopher Townsend Vacated his office as Director on his retirement as Director at MetLife International Holding LLC
January 08, 2018
Mr. Sanjiv Sharan Nomination withdrawal by Punjab National Bank May 30, 2018
Mr. Doulat Raj Mohnot Nomination Withdrawal by Punjab National Bank May 29, 2018
Mr. Gaurav Deepak Resignation May 28, 2018
The Board places on record their sincere appreciation for the valuable services and guidance provided by the Directors during their tenure as Directors of the Company and welcome on the Board the Directors appointed during the year to guide us going forward.
further, the following changes in the Board occurred post March 31, 2018 but before the date of the report:
Name of the Director appointment With effect fromMr. Abhaya Prasad Hota Appointed as Independent Director and
appointed as a Chairperson of Investment Committee and member of Nomination and Remuneration Committee
May 28, 2018
Mr. Sunil Gulati Appointed as Independent Director and as a Chairperson of Corporate Social Responsibility Committee and member of Nomination and Remuneration Committee
May 28, 2018
Mr. Nitin Chopra Appointed as Independent Director and appointed as a Chairperson of With Profits Committee and member of ALM and Risk Management Committee
May 28, 2018
Ms. Sonu Halan Bhasin Appointed as Independent Director and appointed as a Chairperson of Stakeholders Relationship Committee and customer representative of Policyholders Protection Committee
May 28, 2018
Mr. Joginder Pal Dua Appointed as Independent Director and appointed as a Chairperson of ALM and Risk Management Committee and member of With Profits Committee
May 28, 2018
Mr. Lingam Venkat Prabhakar* Appointment as Nominee Director and a member of Investment Committee, ALM and Risk Management, Policyholders Protection Committee and Audit Committees
Approval by the Board by circular resolution dated July 07, 2018
*subject to the IRDAI approval and approval of the members at the Company’s ensuing Annual General Meeting, whichever is later

58
None of the Directors of the Company is disqualified to hold office of a Director under the provisions of Section 164 of the Companies Act 2013. The Company has received declarations from all the Independent Directors that they meet the criteria of independence as laid down under Section 149(6) of the Companies Act, 2013.
The Company does not pay any remuneration to any of its Directors other than the Managing Director and payment of sitting fee to the Independent Directors. The Non-Executive directors of the Company do not hold any shares and convertible instruments of the Company. The Company has a well-defined compensation policy and performance management philosophy for its employees. It believes in developing talented and motivated employees, with clear objectives, driven to achieve superior results and giving them opportunities for personal growth. Equal attention is applied to the results achieved and the behaviours exhibited when determining the overall assessment. The compensation philosophy is transparent, market aligned and driven by the values of the Company.
The details of sitting fees paid to the Directors are provided in the Corporate Governance report of the Company that forms part of this report.
Separate Meeting of Independent Directors:
As stipulated by the Code for Independent Directors under Schedule IV of the Companies Act, 2013, a separate meeting of the Independent Directors of the Company was held on February 7, 2018 to review the performance of the Board as a whole, all Directors, including the Managing Director and the Chairman of the Board and its various Committees. The Independent Directors also reviewed the quality, content and timeliness of the flow of information between the Management and the Board and its Committees which is necessary to effectively and reasonably perform and discharge their duties. The evaluation was undertaken by way of a questionnaire in line with the performance evaluation policy approved by the Board.
the manner in which formal annual evaluation has been made by the Board of its own performance and that of its committees and individual directors
For the FY 2018, in accordance with Section 134(3)(p) of the Companies Act, 2013, formal annual performance evaluation of the Board, its Committee and the Directors individually has been carried out in the following manner:
a) Questionnaires were circulated and sheets were filled by each of the Directors with regard to evaluation of performance of the Board, its Committees and Individual Directors (except for the Director being evaluated) for the year under review.
b) A consolidated summary of the ratings given by each of the Directors was prepared, based on which a report of performance evaluation was prepared by the Chairman in respect of the performance of the Board, its Committees and Directors individually.
c) The report of performance evaluation so arrived at was then discussed by the Nomination & Remuneration Committee and Board at their meetings held on February 7, 2018
Further, the Independent Directors met separately, in absence of non-independent Directors and Members of the Management, to discuss and review the performance of non-independent Directors, Board and of the Chairperson. They further assessed the quality, quantity and timelines of flow of information between the Company Management and the Board.
retirement by rotation
As per Article 7.26 of the Articles of Association of the Company, the term of office of all the Directors, other than the Managing Director and the Independent Directors expire at the ensuing Annual General Meeting and all the retiring directors are eligible for re-appointment.
Key Managerial Personnel
1. Mr. Tarun Chugh, Ex-CEO and Managing Director of the Company resigned from the services of the Company w.e.f March 31, 2017 and Mr. Ashish Kumar Srivastava was appointed in his place as Interim CEO and Principal Officer of the Company from March 31, 2017 till September 30, 2017. Mr. Ashish Kumar Srivastava was appointed as MD & CEO of the company w.e.f. October 1, 2017 pursuant to the approval from IRDAI.
2. Rashmi Sharma, Ex-Company Secretary of the Company resigned from the services of the Company w.e.f. April 13, 2017 and Ms. Yagya Turker was appointed as a Company Secretary w.e.f August 10, 2017 under the provisions of the Companies Act, 2013.
3. Mr. Niraj Shah, Chief Financial Officer is the designated Key Managerial Person as per the provisions of the Companies Act 2013 and is continuing his office.
auDItorS
Statutory auDItorS
Thakur Vaidyanath Aiyar & Co., Chartered Accountants and K S Aiyar & Co, Chartered accountants, are the joint statutory auditors of the Company.
The joint statutory auditors have not made any qualification, reservation or adverse remark in their audit report for FY 2017-18 except “Matter of Emphasis” relating to the absorption of the accumulated deficit of ̀ 1,300.35 crore as at March 31,2017 in the Revenue Account (Policyholder’s Account) pertaining to non-par segments in the Shareholder’s Funds, Reserves and Surplus, Balance of Profit at the year end and in the balance sheet as at March 31, 2018 in the auditor’s report for the year ended on March 31, 2018
The report of the joint statutory auditors is attached to this report and there has been no revision of financial statements or Board Report during the FY 2018-19.

Financial StatementsStatutory ReportsCorporate Overview
59
Thakur Vaidyanath Aiyar & Co and K.S. Aiyar & Co, statutory auditors, retire at the ensuing Annual General Meeting, and being eligible, have offered themselves for reappointment to hold office from the conclusion of the ensuing annual general meeting until the next annual general meeting of the Company. The Audit Committee has recommended the re-appointment of Thakur Vaidyanath Aiyar & Co. and K.S. Aiyar & Co., being eligible, as the statutory auditors of the Company to hold office from the conclusion of the ensuing annual general meeting until the conclusion of the next annual general meeting of the Company.
SeCretarIaL auDIt
Pursuant to the provisions of Section 204 of the Companies Act, 2013 and the Companies (Appointment and Remuneration of Managerial Personnel) Rules, 2014, the Company has appointed BMP & Co. LLP, Company Secretary in Practice to undertake the Secretarial Audit of the Company. The Report of the Secretarial Audit Report is annexed herewith as “annexure a”. There is no qualification made by the Secretarial Auditors in their Report.
MaNaGeMeNt rePort
Pursuant to the provisions of Regulation 3 of The Insurance Regulatory and Development Authority of India (Preparation of Financial Statements and Auditors’ Report of Insurance Companies) Regulation 2000, the Management Report is placed separately and forms part of this Annual Report.
eXtraCt of aNNuaL returN
As per the provisions of the Companies Act, 2013, an extract of the Annual Return in prescribed form MGT 9 is annexed herewith as “annexure B”.
PartICuLarS of eMPLoyeeS
The Company’s employee strength was 9845 employees including 5793 full-time employees and 4052 part-time employees as on March 31, 2018. As required by the provisions of Section 197 read with Rule, 5 of The Companies (Appointment and Remuneration of Managerial Personnel) Rules, 2014, read with the Companies (Particulars of Employees) Rules, 1975, as amended, the names and other particulars of the employees are available with the Company Secretary. The detailed list of Key Managerial Personnel along with their remuneration is as attached as per “annexure C”.
ruraL aND SoCIaL BuSINeSS
The Company complied with the Rural and Social Sector obligations as prescribed under the IRDAI Regulations.
SHare CaPItaL
The Authorised Share Capital of the Company has remained at the same level as that of previous year at ` 3,000 crore. The Issued, Subscribed and Paid-up share capital of the Company, has also remained at the same level as that of previous year at ` 2,012.88 crore.
PuBLIC DePoSItS
The Company has not accepted deposits from the public falling within the ambit of Section 73 of the Companies Act, 2013 and The Companies (Acceptance of Deposits) Rules, 2014.
INItIaL PuBLIC offerING ProPoSaL
During the period under review the Board of Directors of the Company approved taking steps to initiate the process for an initial public offering of the Company by way of an offer for sale.
CorPorate SoCIaL reSPoNSIBILIty (CSr) INItIatIVeS
We strongly believe that an organisation’s long-term success depends on the progress of the communities and the people it serves. At PNB MetLife, Corporate Social Responsibility (CSR) is a vital pillar which will help us establish a bond between our community and our stakeholders.
Our CSR journey began in the year 2014, when we undertook initiatives, on multiple thrust areas of education, health, livelihood, sanitation, nutrition and sports. After three years of successful and satisfactory completion of the CSR programmes. We have taken the opportunity to move towards `Shared Value,’ based projects. This would mean, not just taking a pure philanthropy route but working to create deeper impact on the communities we serve.
the key focus areas of our CSr Program have been:
• financial Inclusion: Providing low-income families and individuals with the financial tools to improve their lives in identified segments, including (a) unorganized sector – daily wage earners, (b) women’s rights and (c) small-scale farmers.
• Health Initiatives: Undertaking initiatives on preventative healthcare, raising awareness and working with relevant partners and Swachh Bharat Abhiyan, a cleanliness campaign by the GoI.
• education and Vocational training: Providing opportunities for children in identified locations to get access and help in getting education in schools, helping those who have withdrawn from the school system with skills training.
• Disaster relief and rehabilitation activities: Providing medical aid, food supply, supply of clean water, rebuilding of houses or any other activity that can be aligned to relief and rehabilitation efforts.
• Promotion of nationally recognized sports, such as badminton: Providing scholarships for talented underprivileged children to pursue their dream of excelling in the sport.
• Insurance awareness initiatives: We have undertaken a number of insurance awareness initiatives across India in order to demystify insurance, including workshops for

60
customers, publishing insurance awareness leaflets and thought pieces and digital initiatives and campaigns such as #DoubleSureForTomorrow and #KhushiyonKiSuraksha.
We revamped our CSR approach in the year 2017-18 to focus on a few areas to create deeper impact and have sustainable focus on women’s health and skill development, child education and sports. Basis this, we have undertaken a number of initiatives across India to improve access to education, sports and children’s rights.
We have, in conjunction with CRY (Child Rights and You), an Indian non-profit, and the Jammu Kashmir Association of Social Workers (JKASW), helped facilitate the creation of youth activity centers and computer labs to provide opportunities for children to gain access to education and learn computer skills.
Through our association with CRY, we have also helped provide opportunities, through annual scholarships for training and coaching, to underprivileged children to learn to play badminton and participate in the PNB MetLife Junior Badminton Championship, held in 8 cities across India.
Keeping in mind women empowerment, we have launched a project called “Sakhi Swavlamban” in the city of Varanasi, in partnership with Drishtee, an NGO, which aims to help rural women and widows bridge the opportunity gap by teaching them practical skills. The program is intended to improve the financial capacity and access to opportunities of marginalized women, allowing them to become self-reliant and entrepreneurial.
CSr spend:
• Anamountof` 0.87 crore has been paid / provided for on various CSR activities during the year, as against the budgeted amount of ` 2.74 crore.
• Out of the budget, ` 0.87 crore has been charged to the Profit and Loss Account in FY 2017-18 based on the services rendered during the current financial year.
During the year Company was unable to spend the budgeted amount on CSR as per Section 135 the unspent budget amount of ` 1.87 crore on account of:
• Rationalizing the education project with Child Activitycenters (CACs) bringing them down from 28 to 16 center’s in Jammu & Kashmir which considerably reduced the budget allocation for the project.
• Simultaneously, the Company had to exit the Crècheproject in Karnataka, as the state government had stepped up to take full responsibility of the project.
At PNB MetLife, we will continue to embrace our corporate social responsibility with a focused approach thereby integrating ourselves into the very fabric of our society.
Being engaged with projects that empower those not in the mainstream of society, working with underprivileged children, trying to change their lives, has been, and continues to be pivot of our CSR initiatives.
PartICuaLrS of CoNtraCtS or arraNGeMeNtS WItH reLateD PartIeS
The particulars of contracts or arrangements with related parties in the prescribed Form AOC -2 are annexed herewith as “annexure e”. All the related party transactions have been entered into in the ordinary course of business of the Company and on arms-length basis.
The Company has a Board approved policy on Related party transactions, which has been hosted on the website of the Company.
StateMeNt IN reSPeCt of aDeQuaCy of INterNaL fINaNCIaL CoNtroLS WItH refereNCe to tHe fINaNCIaL StateMeNtS
The Company has established a governance framework and a control environment, commensurate with the size, scale and complexity of its operations. The corporate governance framework of the Company is based on an effective independent Board, separation of Board’s supervisory role from the executive management and constitution of Board Committees, generally comprising a majority of independent/non-executive directors and chaired by independent directors to oversee critical areas. The Board committees are supported by executive committees to oversee at an operational level. All employees are bound by the Code of business conduct and ethics approved by the Board of Directors.
The Company has a reporting and review framework comprising quarterly reporting and review of audited financials and investment returns to regulators and shareholders. The financials prepared are audited by joint statutory auditors, and are reviewed by Audit Committee on a quarterly basis. They are also submitted to IRDAI. The Company has in place adequate internal financial controls across all major processes with respect to financial statements. There are processes in place to continuously monitor the adequacy of such controls. These controls were also tested for operating effectiveness and no material weaknesses were observed. The results of review were placed before the Audit Committee. The Company follows a strong 3 lines of defence model, wherein the business functions form the first line of defence, the compliance and risk functions form the second line of defence and the internal audit function forms the third line of defence. Internal audit team exercises independent control over operational and financial processes and significant internal audit observations and corrective actions thereon are presented to the Audit Committee of the Board. Investment operations are subject to concurrent audit certification on a daily basis.
INterNaL auDIt aND CoNtroLS
The Company has in place an internal audit framework with a risk based audit approach. The basic philosophy of risk based internal audit is to provide reasonable assurance to the Audit Committee and top management about the adequacy and effectiveness of the risk management and control framework in the Company. The scope and authority of the Internal Audit (IA) function is defined in the Internal Audit Charter. To maintain

Financial StatementsStatutory ReportsCorporate Overview
61
its objectivity and independence, the Internal Audit function reports to the Chairman of the Audit Committee of the Board.
The Internal Control System of the company is commensurate with the size, scale and complexity of its operations. Review of controls is undertaken by internal audit through execution of internal audits as per risk based audit plan. The internal audit covers auditing of processes, transactions and systems, monitoring and evaluating the efficacy and adequacy of internal control system in the Company, its compliance with operating systems, accounting procedures and policies at all locations of the Company. Based on the report of internal audit function, process owners undertake corrective action in their respective areas and thereby strengthen the controls. Significant audit observations and recommendations made and corrective actions thereon are presented to the Audit Committee of the Board every quarter. Implementation of the recommendations is actively monitored.
IND aS IMPLeMeNtatIoN
The Ind AS implementation for insurance sector in India has been deferred for a period of two years (to be implemented from FY 2020-21). In the interim, the pro-forma Ind AS financial statements continue to be submitted to IRDAI on a quarterly basis in the prescribed format.
Update on the Ind AS implementation is submitted to the Board on a quarterly basis. The frequency of the Ind AS steering committee meeting to discuss on the Ind AS implementation progress has been changed from quarterly to half yearly considering the deferment of the Ind AS implementation timelines.
The Company has filed its pro-forma financial statements on a quarterly basis within prescribed timelines upto March 31, 2018, in compliance with Para 4 of IRDAI circular no. IRDA/F&A/ CIR/IFRS/038/03/2016 dated March 01, 2016. The pro-forma financial statements were prepared in accordance with guidance and format available in “Report of the Implementation group of Ind AS in Insurance Sector” issued by IRDAI through its circular no. IRDA/F&A/CIR/ACTS/ 262/12/2016 dated December 30, 2016.
Exposure draft on Ind AS 117 - Insurance Contracts has been released by ICAI for comments from industry.
eNterPrISe rISK MaNaGeMeNt
The Company is committed to integrate and strengthen the role of risk management in business processes and decisions.
In compliance with the Corporate Governance Guidelines issued by IRDAI, the risk governance structure of the Company consists of
i) the Board
ii) the Asset Liability Management and Risk Management Committee of the Board (ALMR)
iii) the Executive level Risk Management Committee (RMC) and its supporting committees.
the Charter of the aLMr is twofold
i) This is a supervisory body to set up the Company’s risk/reward objectives to formulate and implement optimal ALM strategies so as to meet these objectives,
ii) Lay down the Company’s Risk Management Strategy
The Board approved Enterprise Risk Management policy (“the Policy”) details assessment and control standards relating to the various individual risks. The Policy is aligned with COSO® framework and covers aspects related to:
i) Financial Risk Management or Asset Liability Management (‘ALM’): covering market risk, credit risk, liquidity risk and insurance risk
ii) Operational Risk Management
the key objectives of the Policy are as follows:
• Determining the risk profile of the Company i.e. theaggregate level of risks that the Company has undertaken in pursuit of profitable business.
• Identification,measuring,monitoringandcontrolofriskforthe purpose of protecting the interests of key stakeholders.
• Enhancing the Company’s ability to identify and pursueopportunities that offer attractive risk-adjusted returns by providing transparent, accurate and timely risk information.
• Embeddingrisk-baseddecisionmakinginkeymanagementprocesses and fostering a culture of risk awareness.
• Limiting the Company’s exposure to adverse outcomesthrough risk limits. The Company has established a comprehensive Risk Appetite Statement to achieve its strategic objectives operating within the agreed risk limits.
• Ensuringcompliancewithregulatoryrequirements.
• Focusing on ensuring that it possesses the appropriatecapabilities and experience in managing and transferring risks.
• Minimizingreputationalrisk.
The risk management function is headed by the ‘Chief Risk Officer’ and is responsible for establishing sound risk management practices by proactively identifying, measuring, mitigating and monitoring the organization’s risk exposures. The risk management framework of the Company is based on four guiding principles viz. ‘Controlled Risk-Taking’, ‘Ownership, Accountability & Authority’, ‘Specialization’ & ‘Change Management’.
The Company’s risk exposure could also be in the areas of adverse claims experience, shortfall in investment performance and high expense levels. Mitigation steps in each of these areas have been taken as below:-
- The Company’s underwriting policy and implementation of the same are subject to continuous monitoring and review. Adequate and suitable reinsurance treaties are in force with internationally reputed and highly rated reinsurers.

62
- The investments of the Company are in accordance with IRDAI guidelines and as per the Investment Policy approved by the Investment Committee of the Board which stipulates appropriate risk exposures. For achieving the objectives, Credit, Liquidity and Market risks are evaluated on a continuous basis. The assets of the Company are invested in accordance with the requirements prescribed by the IRDAI.
- Expenses are continuously monitored to ensure that the expense levels are commensurate with the level of operations of the Company.
Key PoLICIeS & fraMeWorK
a. Whistle Blower Policy/Vigil Mechanism
The Company has a Whistle Blower policy in place which encourages its employees to report matters without the risk of subsequent victimisation. It provides a mechanism to employees and other persons dealing with the Company to report any instance of actual or suspected fraud, raise concerns internally about possible irregularities, governance weakness, financial reporting issues or other such matters. Access to the Chairman of the Audit Committee is also provided to the employees under the policy to report any matter as well as a direct hotline number to raise any concerns. During the time period April 2017 to March 2018, the Company received 10 whistle blower complaints of which 7 have been disposed of and actions have been recommended as per company’s policies and 3 complaints are under investigations.
B. Policy on Directors’ remuneration
The remuneration and compensation for Directors, Key Managerial personnel and other employees is guided by the provisions of Section 178 (4) of the Companies Act, 2013 and the requisite Policy.
The Policy on remuneration of Non-executive Directors, Managing Director, CEO and Whole Time Directors (“Policy”) has been framed in line with the requirement under Section 179 of the Companies Act, 2013 and has been recommended by the Nomination and Remuneration Committee, and approved by the Board of Directors.
The Company has formulated this policy in terms of the IRDAI Guidelines on remuneration of Non-executive Directors, Managing Director, CEO and whole time Directors and also in compliance with the provisions of the Companies Act 2013. The philosophy for remuneration is based on the commitment of fostering a culture of leadership with trust, and the policy is aligned to this philosophy. The policy clearly defines the design and structure of remuneration processes and governs the overall remuneration structure for the MD & CEO of the Company, including processes for performance based pay structure as determined by the Nomination & Remuneration Committee and the Board of the Company.
The details of components of the remuneration paid to the MD & CEO of the Company is as produced under MGT-9.
C. Prevention of Sexual Harassment at Workplace Policy
The Sexual Harassment of Women at Workplace (Prevention, Prohibition and Redressal) Act, 2013 provides protection against sexual harassment of women at workplace and for the prevention and redressal of complaints of sexual harassment. The Company has a laid down policy on sexual harassment at work place and has communicated to all its employees about the same. The Company believes in providing a safe working environment at the workplace. On an ongoing basis, the Company creates education & awareness amongst employees through training program/seminars, e-mail campaigns.
Disclosure under the sexual harassment of women at workplace (prevention prohibition and redressal) act, 2013
As an Organisation, PNB MetLife is committed to provide a safe and conducive work environment for all employees. We have our Prevention of Sexual Harassment Policy in line with the requirements of the Sexual Harassment of Women at the Workplace (Prevention, Prohibition & Redressal) Act, 2013. PNB MetLife has a robust process in place to provide protection against sexual harassment at workplace for both women and men. This also includes points on unwelcome sexually determined behaviours, defined responsibilities of Individual and Manager at workplace, Redressal procedure and the enquiry process and the detail on constituents of Internal Complaints Committee (IC) members. Zonal committees have been constituted and members have been provided mandatory annual training by External Counsel.
Regular communications are shared/ distributed amongst all employees educating them about what amounts to SH, who they can reach out to in case they observe/ are subject to SH and actions that will be initiated by the Organisation, if case is proven correct/ malicious complaint is raised.
The following is a summary of sexual harassment complaints received and disposed of during the year FY 2017-18:
• No.ofcomplaintsreceived: 5
• Noofcomplaintsdisposedof:4
• No of complaints Open / in process : 1 (Theinvestigation for the case reported in Mar’18, was closed and report was circulated to the Internal committee for further action)
aDDItIoNaL INforMatIoN
CertIfICate of reGIStratIoN
Pursuant to the provisions of the Insurance Laws Amendment Act, 2015, the process of annual renewal of Certificate of

Financial StatementsStatutory ReportsCorporate Overview
63
Registration issued to Insurers u/s 3 of the Insurance Act, 1938 has been dispensed with and Certificate of Registration issued in 2014, pursuant to our payment of relevant fees for FY 2018-19, continues to remain valid.
DeMaterIaLISatIoN of eQuIty SHareS
The Company’s equity shares are admitted on the records of National Securities Depository Limited and Central Depository Services (India) Limited (“CDSL”). Members may note that the Company, being an unlisted Company and considering the provisions of the Articles of Association read with the Insurance Act, 1938, as amended, has kept its ISIN with CDSL and NSDL under frozen/ suspended status.
aMeNDMeNt IN tHe artICLeS of aSSoCIatIoN
In light of the proposed initial public offering of the Equity Shares of the Company by way of offer for sale, the Articles of Association of the Company was amended by the shareholders at their Extra Ordinary General Meeting held on May 26, 2018, to reflect the requirements of the Companies Act, 2013, SEBI (Listing Obligations and Disclosure Requirements) Regulations, 2015 and other regulations applicable to the Company post listing. The AOA currently consists of two parts - Part A covers the provisions which will be applicable to the Company post listing and Part B, is the current set of Articles that would continue to be applicable until listing of the shares on the Stock Exchanges.
CoNSerVatIoN of eNerGy & teCHNoLoGy aBSorPtIoN
In view of the nature of business activity of the Company, the requirements of disclosure in terms of Section 134(3)(m) of the Companies Act, 2013 read with Rule 8 of The Companies (Accounts) Rules, 2014, do not apply to the Company. Since the Company does not own any manufacturing facility, the other particulars in the Companies (Disclosure of Particulars in the Report of the Board of Directors) Rules, 1988, are not applicable and hence are not provided.
foreIGN eXCHaNGe earNING & outGo
There is a foreign exchange outgo of ` 51.71 crore during the year under review (including expenditure of earlier years). The outgo consists of ` 20.72 crore on account of reinsurance premium, `. 25.90 crore on account of outsource service, ` 2.13 crore on account of Information technology expenses, ` 0.15 crore on account of training expenses and ̀ 2.80 crore on account of consultancy & others.
eVeNtS after BaLaNCe SHeet
There have been no material changes and commitments, if any, affecting the financial performance of the Company which have occurred between the end of the financial year to which the Balance Sheet relates to and date of this report.
SoLVeNCy
The IRDAI requires life insurers to maintain a minimum Solvency Ratio of 150%. The Solvency Ratio is calculated as prescribed
under Section 64VA of the Insurance Act, 1938 and the IRDA (Assets, Liabilities, and Solvency Margin of Insurers) Regulations, 2000. As compared to the minimum requirement of 150%, the Company’s Solvency Ratio, as on March 31, 2018, was at 202%.
ISSue of eQuIty SHareS WItH DIffereNtIaL rIGHtS, SWeat eQuIty, eSoP
The Shareholders of the Company have, in their meeting dated December 13, 2017, approved the Employee Stock Option Plan for the Company to create, offer, and grant not more than 19,927,554 (One Crore Ninety Nine Lacs Twenty Seven Thousand Five Hundred And Fifty Four) employee stock options to the eligible employees of the Company, as determined in terms of ESOP 2017, from time to time, in one or more tranches, exercisable in aggregate into not more than 19,927,554 (One Crore Ninety Nine Lacs Twenty Seven Thousand Five Hundred And Fifty Four) equity shares of the Company, with each such option would be exercisable for one equity share of a face value of ` 10/- each fully paid-up on payment of the requisite exercise price to the Company, and on such terms and conditions as may be determined by the Board or a delegated Committee thereof in accordance with the provisions of the ESOP 2017 and provisions of applicable law as may be prevailing at that time. As per the said ESOP 2017, 19,140,000 employee stock options have been granted to the eligible employees of the Company on January 01, 2018 and an additional 500,000 stock options on May 2, 2018. None of the option was vested as on the date of this Report.
CoMPeNSatIoN PoLICy aND PraCtICeS
The appointment and remuneration of managerial personnel was made in accordance with the requirements of Section 34A of the Insurance Act, 1938 as amended from time to time including amendment brought by the Insurance laws (Amendment) Act, 2015 and has been approved by the IRDAI.
The Managerial remuneration details form part of financial statement for the financial year ended March 31, 2018 and included in MGT-9.
Information relating to the design and structure of remuneration processes:
QuaLItatIVe MeaSureS
(i) Information relating to the design and structure of remuneration processes and the key features and objectives of remuneration policy
The Nomination & Remuneration Committee of the Board (NRC) oversees the remuneration aspects and the functions of NRC include reviewing and approving, on an annual basis, measures to carry out evaluation of Board and Director’s performance; to determine, review and formulate on behalf of the Board the Company’s policy on remuneration for the CEO, Executive Directors and Key Management Persons (KMPs); to scrutinize application and details for appointment as KMPs including doing independent reference checks and recommending their appointment; to review the talent management and

64
succession process to ensure business continuity and roll out and administer any Share based employee benefit scheme including ESOP, ESPS, ESOS etc. as may be approved by the Shareholders of the Company and further subject to statutory and regulatory approvals including that of the Insurance Regulatory and Development Authority or such other body or authority as may be applicable.
The key principles guiding the design of the Company’s compensation program are as follows:
Performance: Rewards are linked to organizational and individual performance against both qualitative and quantitative goals and objectives.
Values: Rewards are also linked to how employees go about their work or, more specifically, their demonstration of the PNB MetLife Values which are essentially the behaviours expected of the company’s employees.
Market aligned: Reward opportunities are competitive with the external labour market in order to ensure parity. Market analysis should involve comparing jobs in the Company to similar jobs in similar companies in a recognized market survey.
Internal equity: Reward opportunities are internally equitable, subject to the individual’s experience, performance and other relevant factors.
Prudent risk: Rewards, particularly in the form of incentive compensation, must not encourage excessive risk and should be based in part on the long-term performance outcomes of risks taken. Risk should always be taken within approved policies, limits and Organisation’s ability to effectively identify and manage such risk.
Also, while designing the remuneration policy / processes, it is ensured that it is not only a proper balance between fixed pay and variable pay but is also based on performance as evaluated by the Board or the NRC and approved by the Board. The deterioration in the financial performance of PNB MetLife and the other parameters would be considered by the NRC/ Board while deciding on the total amount of variable remuneration to be paid.
(ii) Description of the ways in which current and future risks are taken into account in the remuneration processes
PMLI policy ensures that the remuneration is in line with the overall enterprise risk framework of the organisation
and also the variable pay schemes are designed to ensure applicability over a time period thereby covering the associated risks.
• Theannualcompensationislinkedtoachievementofpredefined and Board approved financial parameters covering the Growth, Value metrics, Efficiency and Quality parameters of the organisation
• SignificantcomponentoftheremunerationlikeShortterm and Long Term incentives (including ESOPs) are spread across a certain time period and linked to financial performance of the company to take care of the inherent risk
Additionally, Incentive compensation awards (either cash or equity based) provided to any current or former employee may be reduced prospectively and/or retrospectively in the event of one or more of the following circumstances:
- It is determined that an employee has engaged in conduct, detrimental to PNB MetLife either through direct action or failure to act in carrying out his/her responsibilities;
- There is evidence of a serious breach of internal risk management or compliance procedures on the part of the employee;
- There is evidence of a serious breach of internal risk management or compliance procedure
(iii) Description of the ways in which the insurer seeks to link performance during a performance measurement period with levels of remuneration
PNB MetLife follows a compensation philosophy of pay for performance and aligns the company’s compensation plans with its short and long term business strategies. Our compensation philosophy reinforces the company’s pay for performance culture by making a material portion of total compensation variable and differentiating awards based on individual and company performance. Our performance management process requires goals to be defined on an annual basis with the evaluation having equal emphasis on ‘What is achieved’ and ‘How it is achieved’. For senior management, the variable payouts are largely dependent upon the achievement of company’s financial performance where each manager considers the performance during the annual pay for performance process and makes recommendations for each element of pay.

Financial StatementsStatutory ReportsCorporate Overview
65
QuaNtItatIVe MeaSureS
Disclosure Interim Ceo Ceo
Number of MD/CEO/WTDs having received a variable remuneration award during the financial year
Nil Nil
Number and total amount of sign on awards made during the FY
Nil Nil
Details of guaranteed bonus, if any, paid as joining /signing bonus
Nil One (` 68.56 laKh)
Total amount of outstanding deferred remuneration, split into cash, shares and share linked instruments and other forms
LtI units : 1579 (MetLife LTI Units)
eSoPs 4 : 3,273,000 (ESOP Units) LtI Cash 1* : ` 22.68 Lakh
annual Bonus 2* : ` 134.79 Lakh
Total amount of deferred remuneration paid out in the FY
Nil Nil
Breakup of amount of remuneration awarded for the FY to show fixed and variable, deferred and non-deferred
fixed 3 : ` 66.82 Lakh
Variable : Nil
Non-deferred : ` 68.56 Lakh
fixed : ` 90.35 Lakh
Variable : Nil
Deferred : Nil
Non-deferred : ` 68.56 Lakh1 Has not yet been paid. Was to be paid in March 2018, however on hold for requirement of IRDA approval
2 Has not yet been paid. Was to be paid in March 2018, however on hold for requirement of IRDA approval
3 Fixed pay includes basic salary, Special Allowance, Taxable Reimbursements, Per diem, Special bonus, contribution to National Pension Scheme,
Employer contribution to PF, Non-taxable reimbursement and value of perquisites
4 ESOPs are options granted by PNB MetLife India Insurance under the PMLI ESOP scheme.
Note: The above total compensation also includes information for the period when Ashish was Interim CEO
NuMBer of MeetINGS of tHe BoarD
The Board of Directors met five times during the year. Detailed information about dates of meetings and attendance of Directors thereat is given in the annexed Corporate Governance Report in annexure f. Further, post March 31, 2018 but before the date of the Report the Board of Directors constituted the Stakeholders Relationship Committee (SRC) as a Committee of the Board to assist the Board and the Company to oversee the existing redressal mechanisms in relation to Stakeholders of the Company. The term “Stakeholder” shall include shareholders, debenture holders, other security holders, vendors, customers, other persons and employees.
The Committee shall receive reports from designated personnel responsible for each of these mechanisms, and from any other Company personnel that the Committee deems necessary. The Committee shall also review the number of unresolved issues during the course of a quarter. The Committee shall have the authority to make recommendations to resolve any such issues.
The Committee consist of 2 Independent Directors and a Managing Director & CEO of the Company.
functions & responsibilities of Stakeholders relationship Committee:
• The Committee shall consider and oversee the implementation of the objectives stated in this Charter.
• The Committee shall resolve complaints related to transfer of shares, non-receipt of annual report and non-receipt of declared dividends, issue of duplicate certificates and new certificates on split/consolidation / renewal etc., transfer / transmission, dematerialization and rematerialization of equity shares and oversee the performance of the Register and Transfer Agents and recommend measures for overall improvement in the quality of investor services.
• The Committee shall review the Company’s obligations towards meeting environment, health and safety requisites for the benefit of Stakeholders.
• The Committee shall periodically provide updates to the Board.
• To Committee may consult with other committees of the Board, if required, while discharging its responsibilities.
• The Committee shall monitor and review on an annual basis the Company’s performance in dealing with Stakeholder grievances.
• The Committee shall review and reassess the adequacy of this Charter periodically and recommend any proposed changes to the Board for approval.
• The Committee shall have access to any internal information necessary to fulfill its role.
• The Committee shall also have authority to obtain advice and assistance from internal or external legal, accounting or other advisors.

66
CorPorate GoVerNaNCe rePort
The Corporate Governance philosophy of the Company was to comply with not only the statutory requirements, but also to voluntarily formulate and adhere to a strong set of corporate governance practices which includes code of business conduct, corporate ethics, values, risk management etc. It has been our constant endeavour to enhance the economic value, trust and confidence of all the stakeholders through good corporate governance practices. A report on compliance with Corporate Governance Guidelines issued by IRDAI is contained as annexure f along with the Certificate from the Company Secretary of the Company.
aDDItIoNaL DISCLoSureS uNDer CorPorate GoVerNaNCe GuIDeLINeS
In response to point no. 9 “Disclosure requirements” of CorPorate GoVerNaNCe GuIDeLINeS for INSuraNCe CoMPaNIeS, following are the additional disclosures:
(i) Quantitative & qualitative information on the insurer’s financial and operating ratios, namely, incurred claim, commission and expenses ratios:-
Particulars year ending March, 2018
year ending March, 2017
(1) Claims Ratio :
a. Claims as % of Gross Premium
(Claims does not include Surrender, Annuity, Maturity, Health and Survival Benefits)
8.0% 10.7%
b. Surrender, Annuity, Maturity, Health, Survival and other benefits as % of Gross Premium
47.5% 46.6%
(2) Commission Ratio :
a. New Business Commission as a % of New Business Premium 11.2% 12.1%
b. Total Commission as a % of Gross Premium 5.5% 5.6%
(3) Expenses Ratio :
a. Operating Expenses (excluding commission) as a % of Gross Premium 20.6% 23.1%
b. Ratio of expenses of management
(Commission + Operating Expenses) /Gross Premium
26.1%
28.6%
(ii) actual Solvency margin details vis-à-vis the required margin:-
Particulars year ending March, 2018
year ending March, 2017
Actual 2.02 2.03
Required 1.50 1.50
(iii) Policy Lapse ratio:-
Particulars year ending March, 2018
year ending March, 2017
Lapse Ratio 15.0% 12.5%
Conservation Ratio = Current Year Renewals / (Previous Year New Business + Previous year Pure Renewal)
80.1% 75.0%
(iv) financial performance including growth rate and current financial position of the insurer:-
Covered under Financial Results section of this Report.
(v) a description of the risk management architecture:-
Forms part of the Management Report

Financial StatementsStatutory ReportsCorporate Overview
67
(vi) Details of number of claims intimated, disposed of and pending with details of duration:-
Death Claims Summary March 2018 March 2017
Claims Outstanding at start of year 112 27
Claims intimated 5291 5663
Claims settled 5021 5177
Claims repudiated 368 401
Claims Written Back - -
Claims Outstanding from date of intimation at end of the year 14 112
ageing of Claims o/S from date of inception at end of year
Less than 3 month 6 100
3 months and less than 6 months 7 10
6 months and less than 1 year 1 2
1 year and above - -
total 14 112
(vii) elements of remuneration (including incentives) for Key Managerial Personnel as per Corporate Governance guidelines 2016
elements of remuneration# Ceo KMP* total
Basic 14,104,530 105,708,768 119,813,298
Non-taxable Reimbursement 33,200 1,069,462 1,102,662
Bonus 13,712,590 86,842,699 100,555,289
Retirals (PF + NPS) 838,878 6,737,203 7,576,081
Allowances (CCA)/ Perq / Per diem 740,704 839,592 1,580,296
LTI - 5,941,620 5,941,620
total 29,429,902 207,139,344 236,569,246
* KMP numbers excluding the CEO remuneration
* KMP details included as defined in IRDAI Corporate Governance guidelines 2016
DIreCtorS’ reSPoNSIBILIty StateMeNt
In accordance with the requirements of Section 134(5) of the Companies Act, 2013, the Board of Directors confirm the following:
- that in preparation of the annual accounts, the applicable accounting standards have been followed along with proper explanation relating to material departures;
- that the directors have selected such accounting policies and applied them consistently and made judgements and estimates that are reasonable and prudent so as to give a true and fair view of the state of affairs of the Company as on March 31,2018 and of the profit or loss of the Company for the year ended March 31,2018;
- that the directors have taken proper and sufficient care for the maintenance of adequate accounting records in accordance with the provisions of the Act for safeguarding the assets of the Company and for preventing and detecting fraud and other irregularities;
- that the directors have prepared the annual accounts on a going concern basis;
- The directors have devised proper systems to ensure compliance with the provisions of all applicable laws and that such systems were adequate and operating effectively.
aCKNoWLeDGeMeNtS
The Directors are grateful for the support, guidance and the co-operation received from the Insurance & Regulatory Authority of India and Life Council. The Directors also wish to express their gratitude to its shareholders for their continued trust and support.
The Directors also take this opportunity to thank all Financial Advisors, Corporate Agents, Bank partners, Brokers and other business associates and the employees for their continued support during the year.
The Directors would also like to take this opportunity to express sincere thanks to its valued customers and policyholders for their continued patronage.
For and on behalf of the Board of Directors
Place : Mumbai Lyndon oliverDate : July 12, 2018 Chairman

68
To,The Members,PNB MetLIfe INDIa INSuraNCe CoMPaNy LIMIteDRegistered Office : Unit No. 701, 702 & 703,7th Floor, West Wing Raheja Towers,26/27 M G Road, Bangalore - 560001
forM Mr-3
We have conducted the secretarial audit of the compliances of applicable statutory provisions and the adherence to the good corporate secretarial practices by PNB MetLife India Insurance Company Limited (herein after called “the Company”). Secretarial Audit [hereinafter referred to as audit] was conducted in a manner that provided us a reasonable basis for evaluating the corporate conducts/ statutory compliances expressing our opinion thereon.
Based on our verification of the Company’s books, registers, papers, minute books, forms and returns filed and other records maintained by the company and also the information provided by the company, its officers, agents and authorized representatives during the conduct of the audit, We hereby report that our my opinion, the company has, during the audit period covering the financial year ended on March 31, 2018 complied with the statutory provisions listed hereunder and that the company has proper Board processes and compliance mechanism in place to the extent, in the manner and subject to the reporting made hereinafter:
We have examined the books, registers, papers, minute books, forms and returns filed and other record maintained by the company for the financial year ended on March 31, 2018, according to the provisions of:
(i) The Companies Act, 2013 (the Act) and the rules made thereunder;
(ii) The Securities Contracts (Regulation) Act, 1956 (‘SCRA’) and the rules made thereunder to the extent of its applicability to unlisted Company;
(iii) The Depositories Act, 1996 and the regulations and Bye-laws framed thereunder;
(iv) Foreign Exchange Management Act, 1999 and the rules and regulations made thereunder to the extent of Foreign Direct Investment, Overseas Direct Investment and External Commercial Borrowings;
(v) Securities and Exchange Board of India Act, 1992 (‘SEBI Act’) and the regulations framed thereunder to the extent of its applicability to unlisted Company;
(vi) The Insurance Act, 1938
(vii) Insurance Regulatory and Development Authority Act, 1999 and the regulations framed thereunder;
(viii) Reserve Bank of India Act, 1934 and the rules, regulations, directions and orders made thereunder;
(ix) The Contract Labour (Regulation and Abolition) Act, 1970 & its Central Rules/ Concerned State Rules.
We have also examined compliance with respect to the following:
i. Secretarial Standards issued by The Institute of Company Secretaries of India: -The secretarial Standards applicable to the Company has been duly complied.
ii. The Listing Agreements entered into by the Company with Stock Exchange : - Not Applicable as unlisted Company
We further report that
a. The Board of Directors of the Company is duly constituted with proper balance of Executive Directors, Non-Executive Directors and Independent Directors. The changes in the composition of the Board of Directors that took place during the period under review were carried out in compliance with the provisions of the Act.
b. Adequate notice is given to all the Directors to schedule the Board Meetings, agenda and detailed notes on agenda were sent at least seven days in advance, and a system exits for seeking and obtaining the further information and clarification on the agenda items before the meeting and for meaning full participation at the meeting.
c. Majority decisions is carried through by consent of all the members of the Board and are captured and recorded as part of the minutes including the recording of the names of director/s who had dissented/ not concurred with the resolution.
We further report that there are adequate systems and processes in the company commensurate with the size and operations of the Company to monitor and ensure compliances with the applicable laws rules, regulations and guidelines.
• We noted that IRDAI, in its onsite inspection conductedin November 2013, covering the period April 2011 to March 2013, had made certain observations, including reinstatement of policies after the date of maturity, and use of external service providers. The Company had furnished its responses to IRDAI on all observations including the aforementioned observations. In March 2017, IRDAI asked the Company to pay ` 10,00,000/-(Rupees Ten Lakh Only), in compliance with its decisions per the applicable regulations and guidelines. The Company complied with IRDAI’s decision and paid the amount in April 2017.
aNNeXure a
SeCretarIaL auDIt rePortSECRETARIAL AUDIT REPORT FOR THE FINANCIAL YEAR ENDED 31st MARCH 2018[PURSUANT TO SECTION 204(1) OF THE COMPANIES ACT 2013 AND RULE NO 9 OF THE COMPANIES ACT (APPOINTMENT AND REMUNERATION OF MANAGERIAL PERSONNEL) RULES, 2014]

Financial StatementsStatutory ReportsCorporate Overview
69
We further report that Company has not carried out any major actions / events viz., Public issue, Rights issue, redemption/ buy back of shares, merger/ amalgamation/ reconstruction or foreign collaboration.
This report is to be read with my letter of even date which is annexed as Annexure A and forms an integral part of this report.
for BMP & Co.,Company Secretaries
Pramod S M Partner
Place : Bangalore FCS No: 7834Date : June 01, 2018 CP No: 13784
annexure a
To,The Members,PNB MetLIfe INDIa INSuraNCe CoMPaNy LIMIteDRegistered Office : Unit No. 701, 702 & 703,7th Floor, West Wing Raheja Towers,26/27 M G Road, Bangalore - 560001
Our report of even date is to be read along with this letter.
1. Maintenance of Secretarial record is the responsibility of the management of the Company. My responsibility is to express an opinion on these secretarial records based on my audit.
2. We have followed the audit practices and process as were appropriate to obtain reasonable assurance about the correctness of the contents of the Secretarial records. The verification was done on test basis to ensure that correct facts are reflected in secretarial records. We believe that the processes and practices that we followed provide a reasonable basis for my opinion.
3. We have not verified the correctness and appropriateness of financial records and Books of Accounts of the Company.
4. Where ever required, we have obtained the Management representation about the compliance of laws, rules and regulations and happening of events etc.
5. The compliance of the provisions of other applicable laws, Rules, Regulations, standards is the responsibility of management. Our examination was limited to the verification of procedures on test basis.
6. The Secretarial Audit report is neither an assurance as to the future viability of the Company nor of the efficacy or effectiveness with which the management has conducted the affairs of the Company.
7. We further report that the compliance by the Company of applicable financial laws like Direct & Indirect tax laws and Service Tax has not been reviewed in this audit since the same has been subject to review by the statutory financial audit and other designated professionals.
for BMP & Co.,Company Secretaries
Pramod S M Partner
Place : Bangalore FCS No: 7834Date : June 01, 2018 CP No: 13784
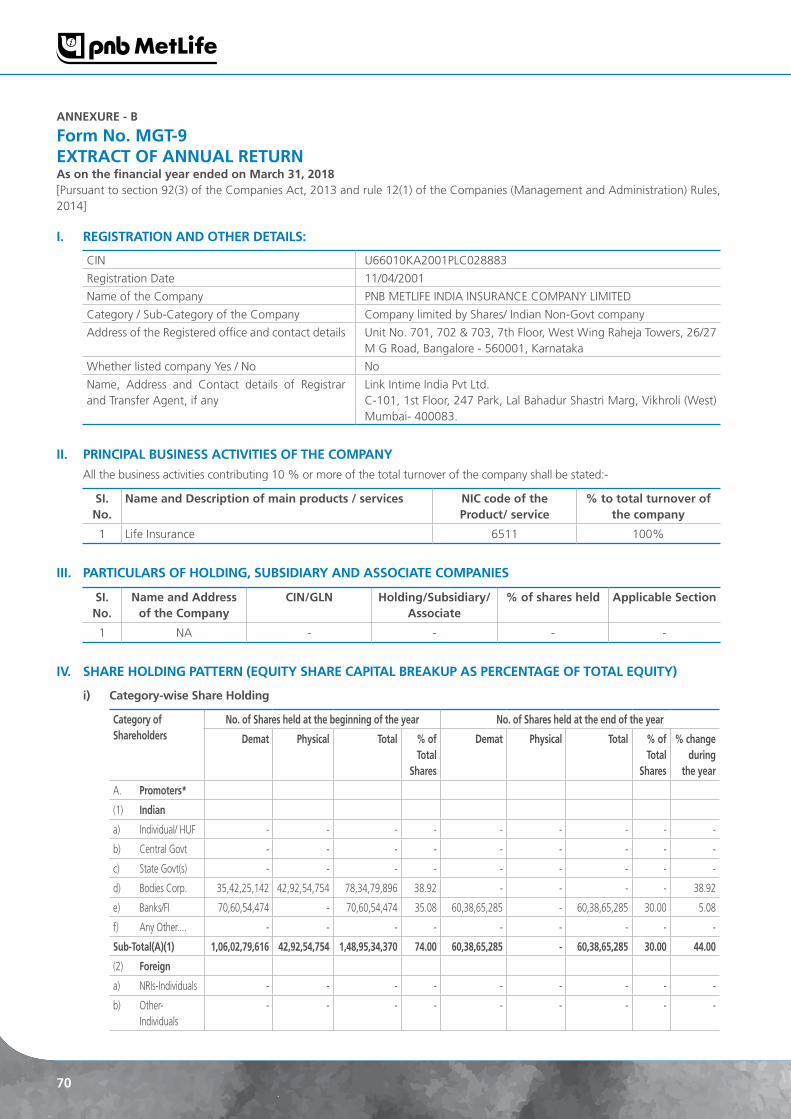
70
aNNeXure - B
form No. MGt-9eXtraCt of aNNuaL returNas on the financial year ended on March 31, 2018[Pursuant to section 92(3) of the Companies Act, 2013 and rule 12(1) of the Companies (Management and Administration) Rules, 2014]
I. reGIStratIoN aND otHer DetaILS:
CIN U66010KA2001PLC028883
Registration Date 11/04/2001
Name of the Company PNB METLIFE INDIA INSURANCE COMPANY LIMITED
Category / Sub-Category of the Company Company limited by Shares/ Indian Non-Govt company
Address of the Registered office and contact details Unit No. 701, 702 & 703, 7th Floor, West Wing Raheja Towers, 26/27 M G Road, Bangalore - 560001, Karnataka
Whether listed company Yes / No No
Name, Address and Contact details of Registrar and Transfer Agent, if any
Link Intime India Pvt Ltd.C-101, 1st Floor, 247 Park, Lal Bahadur Shastri Marg, Vikhroli (West) Mumbai- 400083.
II. PrINCIPaL BuSINeSS aCtIVItIeS of tHe CoMPaNy
All the business activities contributing 10 % or more of the total turnover of the company shall be stated:-
SI. No.
Name and Description of main products / services NIC code of the Product/ service
% to total turnover of the company
1 Life Insurance 6511 100%
III. PartICuLarS of HoLDING, SuBSIDIary aND aSSoCIate CoMPaNIeS
SI. No.
Name and address of the Company
CIN/GLN Holding/Subsidiary/ associate
% of shares held applicable Section
1 NA - - - -
IV. SHare HoLDING PatterN (eQuIty SHare CaPItaL BreaKuP aS PerCeNtaGe of totaL eQuIty)
i) Category-wise Share Holding
Category of Shareholders
No. of Shares held at the beginning of the year No. of Shares held at the end of the year
Demat Physical total % of total
Shares
Demat Physical total % of total
Shares
% change during
the year
A. Promoters*
(1) Indian
a) Individual/ HUF - - - - - - - - -
b) Central Govt - - - - - - - - -
c) State Govt(s) - - - - - - - - -
d) Bodies Corp. 35,42,25,142 42,92,54,754 78,34,79,896 38.92 - - - - 38.92
e) Banks/FI 70,60,54,474 - 70,60,54,474 35.08 60,38,65,285 - 60,38,65,285 30.00 5.08
f) Any Other.... - - - - - - - - -
Sub-total(a)(1) 1,06,02,79,616 42,92,54,754 1,48,95,34,370 74.00 60,38,65,285 - 60,38,65,285 30.00 44.00
(2) foreign
a) NRIs-Individuals - - - - - - - - -
b) Other-Individuals
- - - - - - - - -

Financial StatementsStatutory ReportsCorporate Overview
71
Category of Shareholders
No. of Shares held at the beginning of the year No. of Shares held at the end of the year
Demat Physical total % of total
Shares
Demat Physical total % of total
Shares
% change during
the year
c) Bodies Corp. 52,33,49,913 - 52,33,49,913 26.00 52,33,49,913 - 52,33,49,913 26.00 -d) Banks/FI - - - - - - - - -e) Any Other..... - - - - - - - - -Sub-total(a) (2) - - - - 52,33,49,913 - 52,33,49,913 26.00 -total shareholding of Promoter (a) = (a)(1)+(a)(2)
1,06,02,79,616 42,92,54,754 2,01,28,84,283 100.00 1,12,72,15,198 - 1,12,72,15,198 56.00 44.00
B. Public Shareholding
1. Institutionsi) Mutual Funds - - - - - - - - -ii) Banks/FI - - - - - - - - -iii) Central Govt - - - - - - - - -iv) State Govt(s) - - - - - - - - -v) Venture Capital
Funds- - - - - - - - -
vi) Insurance Companies
- - - - - - - - -
vii) FIIs - - - - - - - - -viii) Foreign Venture
Capital Funds- - - - - - - - -
ix) Others (specify) - - - - - - - - -Sub-total (B) (1):- - - - - - - - - -2. Non-
Institutionsa) Bodies Corp.i) Indian - - - - 45,64,14,331 42,92,54,754 88,56,69,085 44.00 44.00ii) Overseas - - - - - - - - -b) Individualsi) Individual
shareholders holding nominal share capital upto ` 1 lakh
- - - - - - - - -
ii) Individual shareholders holding nominal share capital in excess of ` 1 lakh
- - - - - - - - -
iii) Others (Specify) - - - - - - - - -Sub-total (B) (2):- - - - - 45,64,14,331 42,92,54,754 88,56,69,085 44.00 44.00total Public Shareholding (B)=(B)(1)+ (B)(2)
- - - - 45,64,14,331 42,92,54,754 88,56,69,085 44.00 44.00
C. Shares held by Custodian for GDrs & aDrs
- - - - - - - - -
Grand total (a+B+C) 1,06,02,79,616 42,92,54,754 2,01,28,84,283 100.00 1,58,36,29,529 42,92,54,754 2,01,28,84,283 100.00 44.00
*The Board vide its resolution passed on February 7, 2018 and as subsequently amended by circular resolution no. 02/2018-19 dated May 18, 2018, has identified Punjab National Bank Limited and MetLife International Holdings LLC to be the Promoters of the Company, going forward.

72
ii) Shareholding of Promoters*
SI No.
Shareholders’ Name Shareholding at the beginning of the year
Shareholding at the end of the year % change in share holding during
the year
No. of Shares % of total
Shares of the
Company
% of shares pledged/
encumbered to total shares
No. of Shares % of total
Shares of the
Company
% of shares pledged/
encumbered to total shares
1. Punjab National Bank 60,38,65,285 30.00 0.00 60,38,65,285 30.00 0.00 0.00
2. MetLife International Holding LLC
52,33,49,913 26.00% 0.00 52,33,49,913 26.00% 0.00 0.00
3. Elpro International Limited
25,66,33,397 12.75% 0.00 - - - -
4. M. Pallonji & Company Private Limited
20,08,35,377 9.98% 0.00 - - - -
5. IGE (India) Ltd 17,26,21,357 8.57% 0.00 - - - -
6. M. Pallonji Enterprises Private Limited
14,44,04,821 7.17% 0.00 - - - -
7. The Jammu & Kashmir Bank Limited
10,21,89,189 5.08% 0.00 - - - -
8. Manimaya Holdings Private Limited
89,84,944 0.45% 0.00 - - - -
total 2,01,28,84,283 100.00 0.00 1,12,72,15,198 56.00 0.00 0.00
*The Board vide its resolution passed on February 7, 2018 and as subsequently amended by circular resolution no. 02/2018-19 dated May 18, 2018, has identified Punjab National Bank Limited and MetLife International Holdings LLC to be the Promoters of the Company, going forward.
iii) Change in Promoters’ Shareholding (please specify, if there is no change)
SI No.
Shareholding at the beginning of the year
Cumulative Shareholding during the year
No. of shares
% of total shares of the company
No. of shares
% of total shares of the company
At the beginning of the year
Date wise Increase /Decrease in Promoters Shareholding during the year specifying the reasons for increase/decrease(e.g. allotment/transfer/bonus/sweat equity etc):
There has been no change in the Promoters’ shareholding during the year under review. However, the Board of Directors has vide its resolution passed on February 7, 2018 and as subsequently amended by circular resolution no. 02/2018-19 dated May 18, 2018, identified Punjab National Bank Limited and MetLife International Holdings LLC to be the Promoters of the Company, going forward.
At the end of the year

Financial StatementsStatutory ReportsCorporate Overview
73
iv) Shareholding Pattern of top ten Shareholders (other than Directors, Promoters and Holders of GDrs and aDrs):
SI No.
for each of the top 10 Shareholders Shareholding at the beginning of the year
Cumulative Shareholding during the year
No. of shares
% of total shares of the
company
No. of shares
% of total shares of the
company
At the beginning of the year - - - -
Date wise Increase /Decrease in Shareholding during the year specifying the reasons for increase/decrease (e.g. allotment/transfer/bonus/sweat equity etc):
- - - -
At the end of the year (or on the date of separation, if separated during the year)
- - 88,56,69,085 44%
v) Shareholding of Directors and Key Managerial Personnel:
SI No.
for each of Directors and KMP Shareholding at the beginning of the year
Cumulative Shareholding during the year
No. of shares
% of total shares of the
company
No. of shares
% of total shares of the
company
At the beginning of the year - - - -
Date wise Increase /Decrease in Shareholding during the year specifying the reasons for increase/decrease (e.g. allotment/transfer/bonus/sweat equity etc):
- - - -
At the end of the year (or on the date of separation, if separated during the year)
- - - -
V. INDeBteDNeSS
Indebtedness of the Company including interest outstanding/accrued but not due for payment
Secured Loans excluding deposits
unsecured Loans
Deposits total Indebtedness
Indebtedness at the beginning of the financial year NIL NIL NIL NIL
i) Principal Amount
ii) Interest due but not paid
iii) Interest accrued but not due
total (i+ii+iii)
Change in Indebtedness during the financial year NIL NIL NIL NIL
• Addition
• Reduction
Net Change
Indebtedness at the end of the financial year NIL NIL NIL NIL
i) Principal Amount
ii) Interest due but not paid
iii) Interest accrued but not due
total (i+ii+iii) NIL NIL NIL NIL

74
VI. reMuNeratIoN of DIreCtorS aND Key MaNaGerIaL PerSoNNeL
a. remuneration to Managing Director, Whole-time Director and/or Manager:
SI. No.
Particulars of remuneration(ashish Kumar Srivastava)
total amount
1. Gross Salary
(a) Salary as per provision contained in section 17(1) of the Income-tax Act, 1961 1,53,44,099
(b) Value of perquisites u/s 17(2) Income-tax Act, 1961 41,416
(c) Reimbursement 14,100
(d) Profits in lieu of salary under section 17(3) Income-tax Act, 1961 -
2. Stock Option* -
3. Sweat Equity -
4. Commission
- as % of profit -
- Others, specify... -
5. Others, please specify (including contribution to PF) - Employer Contribution to PF and NPS 4,92,000
total (a) 1,58,91,615
Ceiling as per the Act#
* During the FY 2018, Company has granted 32,73,000 units of stock option to Mr. Ashish Kumar Srivastava. Perquisite value of stock options will be calculated at the time of exercise.
# The remuneration paid to the MD & CEO is within the limits prescribed under section 197 of the Companies Act, 2013.
B. remuneration to other directors:
SI. No.
Particulars of remuneration
Name of Director total amount
1. Independent Directors Mr. Vijay Kumar Chopra
Dr. archana Niranjan Hingorani
Mr. Neeraj Swaroop
Ms. anisha Motwani
• Feeforattendingboard/ committee meetings
5,00,000 12,00,000 4,00,000 14,50,000 34,50,000
• Commission - - -
• Others,pleasespecify - - -
total (1) 5,00,000 12,00,000 4,00,000 14,50,000 35,50,000
2. Other Non-Executive Directors
Mr. Doulat raj Mohnot
• Feeforattendingboard/ committee meetings
3,00,000
• Commission -
• Others,pleasespecify -
total (2) 3,00,000 3,00,000
total (B)=(1+2) 38,50,000
total Managerial remuneration
- - - - -
Overall Ceiling as per the Act - - - - -
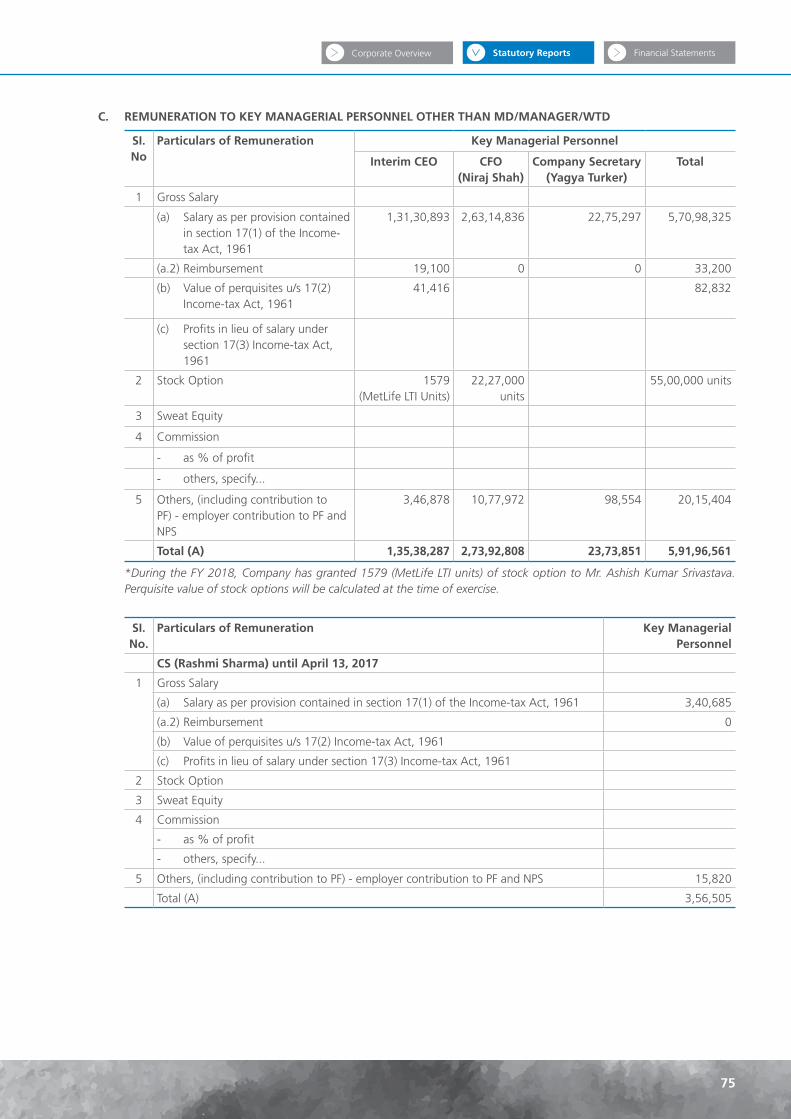
Financial StatementsStatutory ReportsCorporate Overview
75
C. reMuNeratIoN to Key MaNaGerIaL PerSoNNeL otHer tHaN MD/MaNaGer/WtD
SI. No
Particulars of remuneration
Key Managerial Personnel
Interim Ceo Cfo (Niraj Shah)
Company Secretary (yagya turker)
total
1 Gross Salary
(a) Salary as per provision contained in section 17(1) of the Income-tax Act, 1961
1,31,30,893 2,63,14,836 22,75,297 5,70,98,325
(a.2) Reimbursement 19,100 0 0 33,200
(b) Value of perquisites u/s 17(2) Income-tax Act, 1961
41,416 82,832
(c) Profits in lieu of salary under section 17(3) Income-tax Act, 1961
2 Stock Option 1579 (MetLife LTI Units)
22,27,000 units
55,00,000 units
3 Sweat Equity
4 Commission
- as % of profit
- others, specify...
5 Others, (including contribution to PF) - employer contribution to PF and NPS
3,46,878 10,77,972 98,554 20,15,404
total (a) 1,35,38,287 2,73,92,808 23,73,851 5,91,96,561
*During the FY 2018, Company has granted 1579 (MetLife LTI units) of stock option to Mr. Ashish Kumar Srivastava. Perquisite value of stock options will be calculated at the time of exercise.
SI. No.
Particulars of remuneration Key Managerial Personnel
CS (rashmi Sharma) until april 13, 2017
1
Gross Salary
(a) Salary as per provision contained in section 17(1) of the Income-tax Act, 1961 3,40,685
(a.2) Reimbursement 0
(b) Value of perquisites u/s 17(2) Income-tax Act, 1961
(c) Profits in lieu of salary under section 17(3) Income-tax Act, 1961
2 Stock Option
3 Sweat Equity
4
Commission
- as % of profit
- others, specify...
5 Others, (including contribution to PF) - employer contribution to PF and NPS 15,820
Total (A) 3,56,505
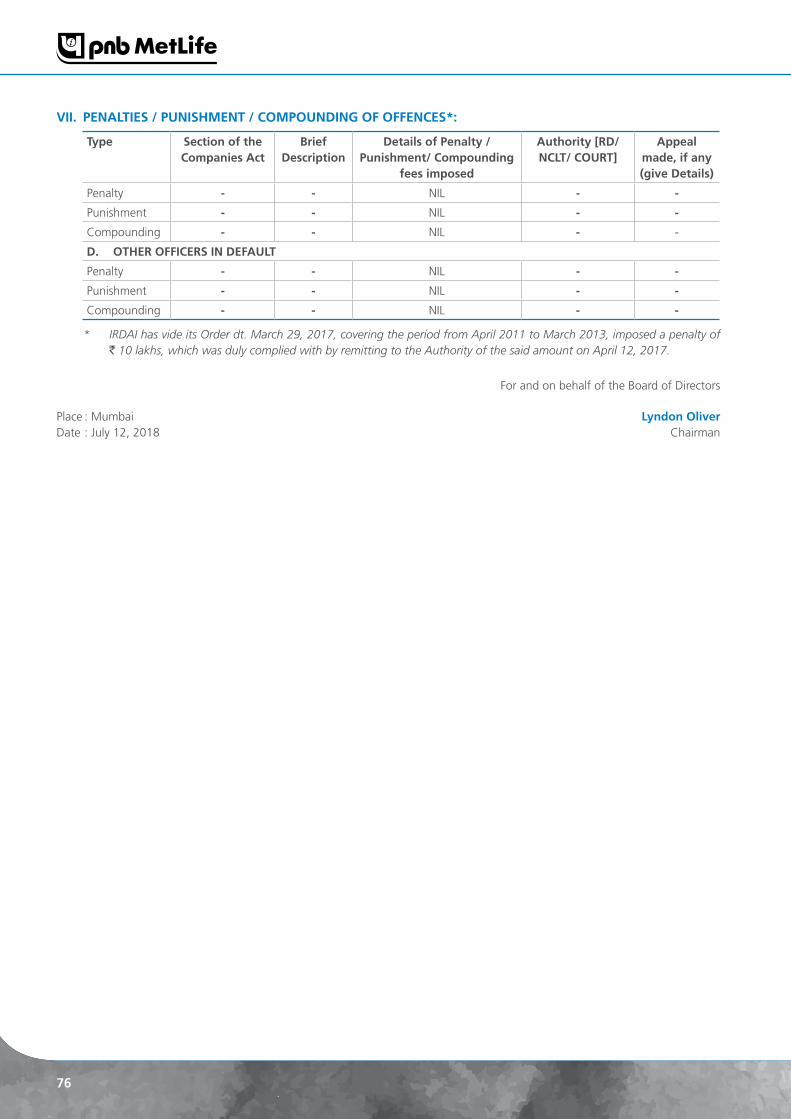
76
VII. PeNaLtIeS / PuNISHMeNt / CoMPouNDING of offeNCeS*:
type Section of the Companies act
Brief Description
Details of Penalty / Punishment/ Compounding
fees imposed
authority [rD/NCLt/ Court]
appeal made, if any (give Details)
Penalty - - NIL - -
Punishment - - NIL - -
Compounding - - NIL - -
D. otHer offICerS IN DefauLt
Penalty - - NIL - -
Punishment - - NIL - -
Compounding - - NIL - -
* IRDAI has vide its Order dt. March 29, 2017, covering the period from April 2011 to March 2013, imposed a penalty of ` 10 lakhs, which was duly complied with by remitting to the Authority of the said amount on April 12, 2017.
For and on behalf of the Board of Directors
Place : Mumbai Lyndon oliverDate : July 12, 2018 Chairman

Financial StatementsStatutory ReportsCorporate Overview
77
an
nex
ure
– C
Part
icu
lars
of
emp
loye
es a
s p
er p
rovi
sio
ns
of
Sect
ion
197
rea
d w
ith
ru
le,
5 o
f th
e C
om
pan
ies
(ap
po
intm
ent
and
r
emu
ner
atio
n o
f M
anag
eria
l Per
son
nel
) r
ule
s, 2
014
emp
IDN
ame
Des
ign
atio
n L
ast
fisc
al
year
to
tal
rem
un
erat
ion
Nat
ure
of
emp
loym
ent
edu
cati
on
al
Qu
alifi
cati
on
exp
erie
nce
(y
ears
)D
ate
of
Join
ing
ag
eLa
st e
mp
loym
ent
3067
872
Ash
ish
Kum
ar S
rivas
tava
Man
agin
g D
irect
or &
C
EO 2
8,59
4,99
2 F
ull t
ime
PGPM
261-
Jul-1
352
Irela
nd B
lyth
Lim
ited,
Mau
ritiu
s
3158
963
Nira
j Ash
win
Sha
hC
hief
Fin
anci
al O
ffice
r 2
6,80
4,82
0 F
ull t
ime
PGD
BM +
CA
204-
May
-15
43IC
ICI
Prud
entia
l Li
fe I
nsur
ance
C
ompa
ny L
imite
d
1018
668
Sam
eer
Bans
alD
irect
or &
Hea
d -
Banc
assu
ranc
e 2
3,82
3,12
1 F
ull t
ime
PGD
M21
1-Fe
b-07
44Bh
arti
Axa
Life
Insu
ranc
e
3156
299
Bhaw
ani S
ingh
Pat
hani
aD
irect
or &
Hea
d -
Dire
ct, A
genc
y &
A
ltern
ate
20,
495,
628
Ful
l tim
e PG
DBM
191-
Apr
-15
43IC
ICI
Prud
entia
l Li
fe I
nsur
ance
C
ompa
ny L
imite
d
1027
625
Sanj
ay K
umar
Chi
ef In
vest
men
t O
ffice
r 1
9,25
9,16
9 F
ull t
ime
MBA
221-
Feb-
0848
KPM
G
1020
334
Din
akar
P K
App
oint
ed A
ctua
ry 1
9,07
1,98
4 F
ull t
ime
Post
Gra
duat
e an
d Fe
llow
2731
-Jul
-13
51A
egon
Rel
igar
e Li
fe I
nsur
ance
C
ompa
ny L
td.
1007
913
Vija
ya S
anja
y N
ene
Dire
ctor
& H
ead
- O
pera
tions
& S
ervi
ces
18,
937,
318
Ful
l tim
e PG
DM
2712
-Jan
-06
51Bi
rla S
unlif
e In
sura
nce
3233
420
Agn
ipus
hp S
ingh
Hea
d -
Lega
l & B
oard
A
ffai
rs 1
3,05
9,88
4 F
ull t
ime
LLB
185-
May
-17
43D
BOI
Glo
bal
Serv
ices
Pr
ivat
e Li
mite
d
3198
256
Sam
rat
Ash
im D
asC
hief
Info
rmat
ion
Offi
cer
12,
954,
480
Ful
l tim
e M
BA21
18-A
pr-1
647
TATA
A
IA
Life
In
sura
nce
Co.
Lt
d.
3045
472
Hem
ant
Khe
raH
ead
- Em
ploy
ee
Bene
fits,
Alli
ance
s &
Sa
les
Trai
ning
12,
048,
070
Ful
l tim
e C
A22
3-D
ec-1
246
Avi
va L
ife I
nsur
ance
Com
pany
In
dia
Ltd.
3172
472
Kha
lid A
hmad
Hea
d -
Prod
ucts
10,
296,
200
Ful
l tim
e PG
DM
141-
Sep-
1538
Relia
nce
Nip
pon
Life
insu
ranc
e C
o. L
td.

78
aNNeXure D
aNNuaL CorPorate SoCIaL reSPoNSIBILIty (CSr) rePort for tHe fy 2017-18
1) CSr PoLICy
PNB MetLife believes in corporate citizenship and is committed towards development of the disadvantaged and underprivileged communities in the needy locations of the country. The company begun its CSR initiatives in the year 2014 with its programmes in Education, Healthcare, Nutrition, Sanitation and Promotion of Sports in alignment with the CSR mandate under Section 135 of the Companies Act 2013.
Post three years of successful CSR implementation the company decided to revamp its CSR approach to take up focussed programmes in few thrust areas, which are impactful and sustainable. Thus, it was decided by the board in the years 2017-18 to have programmes in Livelihood, Financial Inclusion, Education and Promotion of Sports.
We continued our support to promote Badminton to nurture fresh talent through JBC 3 (PNB MetLife Junior Badminton Championships) which has given exposure and training to underprivileged children, who are promising players for competing in national and international tournaments.
We continued our support for education of underprivileged children in 16 Child Activity Centres (CAC) across Bandipora and Baramulla in Jammu & Kashmir. The goal was to ensure mainstreaming of the children who are drop outs or have never been to school, enhancing enrolment, retention and participation.
We also launched our third computer Lab in the Achan region of Pulwama district in our continued effort to drive digital literacy in the state.
Furthering our CSR goal of livelihood and financial inclusion, the PNB Metlife CSR team identified the project ‘Sakhi Swavalmvan’ in association with Drishtee Foundation for empowerment of underprivileged rural women, with special focus on widows, through skill training, livelihood generation and establishing micro enterprises in Varanasi district.
2) CSr CoMMIttee MeMBerS
As on March 31, 2018, the Company’s CSR Committee comprised of Four (4) Committee Members including Two Independent Directors, including the chairperson of the Committee. The composition of the Committee as of March 31, 2018 is as below:
a) Ms Anisha Motwani (Independent Director and Chairman of the CSR Committee)
b) Mr. Erach Kotwal
c) Mr. Surbhit Dabriwala
d) Ms. Archana Hingorani
3) Average net profit of the company for last three financial years: ` 77.88 crore
4) Prescribed CSR expenditure (2 percent of last three years average profit): 1.56 crore
5) Carry forward from last budget – 1.18 crore
6) Total CSR budget for 2017-18 – (what got approved)- ` 2.74 crore
7) Details of the CSR expenditure during the financial year:
a) Total amount to be spent: ` 2.74 crore
b) Amount spent: ` 0.87 crore (approx.)

Financial StatementsStatutory ReportsCorporate Overview
79
c) Manner in which the amount was spent during FY2017-18 is detailed below:
Amount in `
Sr. Nos.
Project/activities Sector Locations (States and Districts)
amountoutlay
(Budget) Project or program
wise
amountspent on the
project or programs
Cumulative expenditure
upto reporting
period
1. Education & Development of underprivileged children (CRY)
Literacy Jammu & Kashmir 39,24,467 39,24,467 39,24,467
2. Education & Development of underprivileged children- Digital Literacy (CRY)
Literacy Achan – Pulwama District in Jammu &
Kashmir
7,35,800 7,35,800 7,35,800
3. Promotion of Badminton in India (CRY)
Sports All India Initiative 17,47,689 17,47,689 17,47,689
4. Comprehensive Livelihood programme for Marginalised Women (Drishtee)
Financial Inclusion
Varanasi 18,38,706 18,38,706 18,38,706
5. Charges for Management of CSR programme capped at 5%(Soulace)*
NA NA 10,55,125 4,64,470 4,64,470
totaL 93,01,787 87,11,132 87,11,132
8) eXPLaNatIoN for tHe uNSPeNt aMouNt
PNB MetLife began its CSR activities in the year 2014 on multiple thrust areas of education, health, livelihood, sanitation, nutrition and sports. After three years of successful and satisfactory completion of the CSR programmes, the company revamped the CSR approach in the year 2017-18 to focus on few thrust areas which are impactful and sustainable.
Taking up a long term approach with focus, the company decided to cut down the Education project with Child Activity centers (CACs) in Jammu & Kashmir being brought down from 28 to 16 centers which considerably reduced the budget allocation for the project. Simultaneously PNB MetLife had to exit from the Creche project in Karnataka as the state government took the entire responsibility of the project.
Boarding on a long term project on Financial Inclusion ‘Sakhi Swalamvan’ took more than six months due to finalization of NGO partner, contractual delay and time taken in funds disbursement.
9) reSPoNSIBILIty StateMeNt of tHe CSr CoMMIttee
The implementation and monitoring of the CSR Policy, is in compliance with CSR objectives and Policy of the company.
Ms anisha Motwani Mr. ashish Kumar SrivastavaChairman – CSR Committee Managing Director & CEO
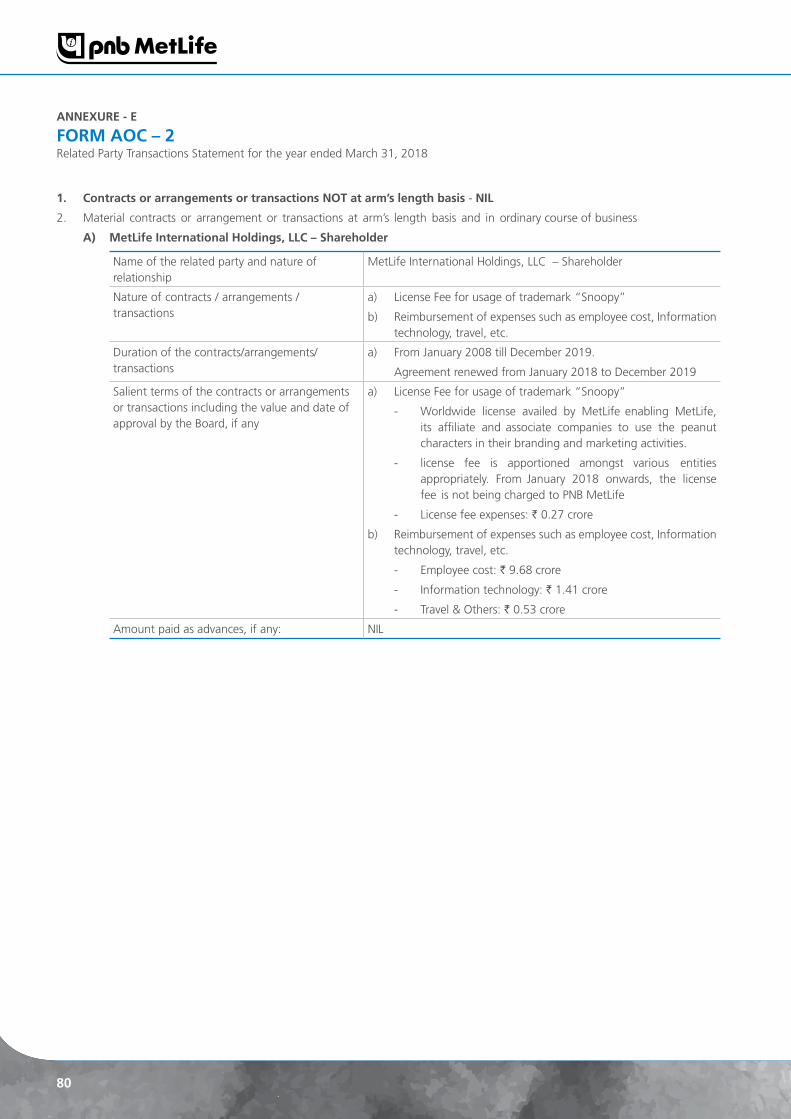
80
aNNeXure - e
forM aoC – 2Related Party Transactions Statement for the year ended March 31, 2018
1. Contracts or arrangements or transactions Not at arm’s length basis - NIL
2. Material contracts or arrangement or transactions at arm’s length basis and in ordinary course of business
a) MetLife International Holdings, LLC – Shareholder
Name of the related party and nature of relationship
MetLife International Holdings, LLC – Shareholder
Nature of contracts / arrangements / transactions
a) License Fee for usage of trademark “Snoopy”
b) Reimbursement of expenses such as employee cost, Information technology, travel, etc.
Duration of the contracts/arrangements/transactions
a) From January 2008 till December 2019.
Agreement renewed from January 2018 to December 2019
Salient terms of the contracts or arrangements or transactions including the value and date of approval by the Board, if any
a) License Fee for usage of trademark “Snoopy”
- Worldwide license availed by MetLife enabling MetLife, its affiliate and associate companies to use the peanut characters in their branding and marketing activities.
- license fee is apportioned amongst various entities appropriately. From January 2018 onwards, the license fee is not being charged to PNB MetLife
- License fee expenses: ` 0.27 crore
b) Reimbursement of expenses such as employee cost, Information technology, travel, etc.
- Employee cost: ` 9.68 crore
- Information technology: ` 1.41 crore
- Travel & Others: ` 0.53 crore
Amount paid as advances, if any: NIL

Financial StatementsStatutory ReportsCorporate Overview
81
B) Punjab National Bank – Shareholder & Corporate agent
Name of the related party and nature of relationship
Punjab National Bank – Shareholder & Corporate Agent
Nature of contracts / arrangements / transactions a) Payment of commission as per Corporate Agency agreement
b) Investment in the ordinary course of business in the Equity shares/Fixed Deposit (FD) / Bonds in line with the investment philosophy of the Company and dividend earned thereon.
c) Current account balance/FD with the bank and interest earned thereon.
d) Bank charges levied in the normal course of business
e) Receipt of premiums/payment of claims in respect of group policies
f) Bank Guarantee issued on behalf of PNB MetLife
Duration of the contracts/arrangements/transactions
a) From October 14, 2011 onwards, unless terminated by either party as per the terms & conditions of the agreement.
b) Ongoing
c) Ongoing
d) Ongoing
e) Ongoing
f) Ongoing
Salient terms of the contracts or arrangements or transactions including the value and date of approval by the Board, if any
a) Commission as per the Corporate Agency Agreement
- Agreement entered into in ordinary course of business
- Commission terms as per product File and Use documents filed with IRDAI
- Expenses incurred: `146.32 crore
b) Investment in equity shares / FD / Bonds
- In line with the investment philosophy of the Company
- purchased from the market at market rates in the ordinary course of business
- Amount invested in Equity shares: NIL
- Amount invested in FD/Bonds:`25.02 crore
c) FD/current account balance with the bank and interest earned thereon.
- Current account/FD balance: `130.59 crore
- Interest /Dividend earned: ` 2.12 crore
d) Bank charges levied in the normal banking transactions
- Expenses incurred: ` 1 crore
e) Receipt of premium/ payment of claims in respect of group policies
- Premium received: NIL
- Claims settled: ` 0.02 crore
f) Bank guarantee issued
- Bank guarantee of ` 25 lakh has been issued by PNB to UIDAI towards availment of Aadhar authentication services
Amount paid as advances, if any: NIL

82
C) Jammu & Kashmir Bank Limited – Shareholder & Corporate agent
Name of the related party and nature of relationship
Jammu & Kashmir Bank Limited – Shareholder & Corporate Agent
Nature of contracts/arrangements/transactions a) Payment of commission as per the Corporate Agency Agreement
b) Receipt of premium / payment of claims in respect of mortgage protection plans for the customers of Jammu & Kashmir Bank Limited offered under a group policy.
c) FD / current account balance with the Bank / interest earned thereon
d) Bank charges levied in the normal course of business
Duration of the contracts/arrangements/transactions
a) From 01/04/13 till 31/03/19
b) Ongoing
c) Ongoing
d) Ongoing
Salient terms of the contracts or arrangements or transactions including the value and date of approval by the Board, if any
a) Commission as per the Corporate Agency agreement
- Agreement entered into in ordinary course of business
- Commission terms as per product File and Use document filed with IRDAI
- Expenses incurred : ` 19.37 crore
b) Receipt of premium/ payment of claims in respect of mortgage protection plans for the customers of Jammu & Kashmir Bank Limited offered under a group policy.
- Agreement entered into in ordinary course of business
- Premium received: ` 2.66 crore
- Claims settled: ` 2.52 crore
c) Fixed Deposits/current account balance with the bank and interest earned thereon.
- Current account balance: ` 12.79 crore
- Interest / dividend earned: ` 0.17 crore
d) Bank charges levied in the normal banking transactions
- Expenses incurred: ` 0.008 crore
Amount paid as advances, if any: NIL
Note: During the year ended March 31, 2018, the Company has incurred expenditure of ` 3.39 crore towards proposed Initial Public Offering (IPO) of PNB MetLife through an offer for sale. Such expenditure would be recovered from the selling shareholder’s in FY 2018-19.

Financial StatementsStatutory ReportsCorporate Overview
83
CoMPaNy’S PHILoSoPHy oN CorPorate GoVerNaNCe
Your Company remains committed to transparency in all its dealings and places high emphasis on business ethics and principles. It strongly believes that good governance goes beyond working results and financial propriety and is a pre-requisite for attainment of excellence in performance. Your company adheres to the philosophy of ethical corporate behaviour and fairness in its dealings with all its stakeholders, comprising policyholders, banks, regulatory authorities, employees and society at large. Your Company and your Board of Directors are committed to following the best corporate governance practices in all their dealings.
GoVerNaNCe StruCture
PNB MetLife’s Governance structure broadly comprises of the Board of Directors and the Committees of the Board at the apex level and the Management structure at the operational level. This layered structure brings about a harmonious blend in governance as the Board sets the overall corporate objectives and gives direction and freedom to the Management to achieve these corporate objectives within a given framework, thereby bringing about an enabling environment for value creation through sustainable profitable growth.
BoarD of DIreCtorS
The PNB MetLife Board plays a pivotal role in ensuring that the Company runs on sound and ethical business practices and that its resources are utilized for creating sustainable growth and societal wealth. The Board operates within the framework of a well-defined responsibility matrix which enables it to discharge
aNNeXure f
rePort oN CorPorate GoVerNaNCethe Directors present the Company’s report on Corporate Governance for the year ended March 31, 2018.
its fiduciary duties of safeguarding the interests of the Company; ensuring fairness in the decision making process, integrity and transparency in the Company’s dealings with its Members and other stakeholders.
CoMPoSItIoN of tHe BoarD
The Composition of the Board of Directors of the Company is governed by the provisions of the Companies Act, 2013 and Clause 5.1 of the Corporate Governance Guidelines issued by the IRDAI. The Board of Directors of the Company are from diverse backgrounds and enjoy a wide range of experience and expertise in various fields. The Board oversees the Company’s overall business affairs, its strategic direction, reviews corporate performance, authorizes and monitors investments, keeps an oversight on regulatory compliance and corporate governance matters. The Board is responsible for overall corporate strategy and other responsibilities as laid down by the IRDAI under the Corporate Governance guidelines and the Companies Act, 2013. The Board’s actions and decisions are aligned with the Company’s best interests. It oversees implementation of strategy, achievement of the business plan and day-to-day operations.
BoarD StruCture
The Board of Directors of the Company represents an optimum combination of Executive and Non-Executive Directors for its independent functioning. The Board of Directors are eminent personalities with significant expertise in the fields of finance, insurance, strategy etc. As on March 31, 2018, the Board has strength of Thirteen (13) Directors comprising of One (1) Managing Director & CEO, Three (3) Independent Directors and Nine (9) Non-Independent Non-Executive Directors.

84
The Chairman of the Board, Mr. Lyndon Oliver, is a Non-Executive Director. The composition of the Board of Directors as on March 31, 2018 is as under:
Composition, Brief Profile of the Board of Directors as on March 31, 2018
Names of directors Designation Qualification Specialisation Category No. of other Directorship
(Indian & foreign)
DIN
Mr. Lyndon Emanuel Oliver Chairman MBA from University of
Alabama
Financial Management
Non-Executive, Non-Independent
Director
5 07561067
Mr. Ashish Kumar Srivastava Managing Director and
CEO
PGPM Insurance & Business
Management
Executive, Director
0 00355075
Mr. Bharat Raj Kannan Director Bachelor of Business
Administration &
Master of Science
Distribution channels
Non-Executive, Non-Independent
Director
3 07893143
Mr. Sunil Mehta Director M.Sc. (Agri), MBA, CAIIB
Banker Non-Executive, Non-Independent
Director
5 07430460
Mr. Sanjiv Sharan Director CAIIB Banker Non-Executive, Non-Independent
Director
2 07340257
Mr. Doulat Raj Mohnot Additional Director
FCA, B.Com Chartered Accountant
Non-Executive, Non-Independent
Director
0 06468778
Mr. Surbhit Dabriwala Director Bachelor of Arts & Science
Businessman. Non-Executive, Non-Independent
Director
5 00083077
Mr. Gaurav Deepak Director B. Tech (IIT) & PGDM (IIM)
Investment Banking.
Non-Executive, Non-Independent
Director
2 00153524
Mr. Pheroze Kersasp Mistry Director MBA Businessman Non-Executive, Non-Independent
Director
13 00344590
Mr. Erach Homi Kotwal Director LLB & LLM (Cambridge,
England)
Law Non-Executive, Non-Independent
Director
0 07617479
Ms. Anisha Motwani Independent Director
MBA, BSc Marketing & Investment.
Non-Executive, Independent
Director
4 06943493
Dr. Archana Niranjan Hingorani Independent Director
PhD in Corporate Finance
Financial Markets
Non-Executive, Independent
Director
5 00028037
Mr. Neeraj Swaroop Independent Director
B. Tech, MBA Financial Services
Non-Executive, Independent
Director
1 00061170

Financial StatementsStatutory ReportsCorporate Overview
85
Details of Change in Directorship during the year 2017-18:
Sr. No.
Name of Director Change
1. Mr. M Balachandran Resigned as Director w.e.f. April 23, 2017
2. Ms. Usha Ananthasubramanian Resigned as Director w.e.f. May 5, 2017
3. Mr. Sanjiv Sharan Appointed as Additional Director w.e.f. May 8, 2017Change in Designation as Director w.e.f. August 10, 2017
4. Ms. Kastity Ha Resigned as Director w.e.f. May 19, 2017
5. Dr. Archana Niranjan Hingorani Appointed as Additional Independent Director w.e.f. June 30, 2017.Change in Designation as Director w.e.f. August 10, 2017
6. Mr. Bharat Kannan Appointed as Additional Director w.e.f. August 2, 2017Change in Designation as Director w.e.f. August 10, 2017
7. Mr. Sunil Mehta Appointed as Additional Director w.e.f. August 2, 2017Change in Designation as Director w.e.f. August 10, 2017
8. Mr. Vijay Kumar Chopra Resigned as Independent Director w.e.f August 5, 2017
9. Ms. Anisha Motwani Change in Designation as Director w.e.f. August 10, 2017
10. Mr. Erach Kotwal Change in Designation as Director w.e.f. August 10, 2017
11. Mr. Doulat Raj Mohnot Appointed as Additional Director w.e.f. September 12, 2017
12. Mr. Ashish Kumar Srivastava Resigned as Interim CEO and Principal Officer w.e.f. September 30, 2017Appointed as Additional Director w.e.f. October 1, 2017Appointed as Managing Director and CEO w.e.f. October 1, 2017
13. Mr. Neeraj Swaroop Appointed as Additional Independent Director w.e.f. October 10, 2017Change in Designation as Director w.e.f. December 13, 2017
14. Mr. Christopher Townsend Resigned as Director w.e.f. January 8, 2018
BoarD MeetINGS
Notice, agenda and Minutes
The Board meets 4 times during the year. Additional meetings are held as and when necessary. The Board Meetings are governed by a structured Agenda. The Agenda along with detailed explanatory notes and supporting material are circulated in advance before each meeting to all the Directors for facilitating effective discussion and decision making. The proceedings of each meeting of the Board and its Committees are conducted in accordance with the provisions of the Companies Act, 2013 and rules made thereunder.
The Companies Act, 2013 read with rules issued thereunder, allows conducting of meetings through audio-visual means or video-conferencing. Accordingly, the Directors are given an option to participate at the meetings through video conferencing mode. In case of a special and urgent business need, the Board’s approval is taken by passing resolutions by circulation, as permitted by law, which is confirmed in the next Board Meeting. The Company Secretary is responsible for collation, review, preparation and distribution of the Agenda papers submitted to the Board and preparation of minutes. The Head of Legal & Board Affairs and the Company Secretary attend all the meetings of the Board and its Committees.
MeetINGS of tHe BoarD:
Board Meetings held during the year
The dates on which the Board Meetings were held is given below:
Dates on which the Board Meetings were held total Strength of the Board No. of Directors present
May 9, 2017 12 8
August 10, 2017 12 9
October 10, 2017 12 12
November 15, 2017 14 12
February 7, 2018 13 12

86
The attendance record of the Directors at the Board Meetings during the year ended on March 31, 2018, and at the last AGM is as under:-
Name of Director Category No. of Board Meetings attended during the year
attendance at Last aGM
Mr. Christopher George Townsend Chairman of the Board & Non-Executive Director 3/4 Yes
Mr. Lyndon Emanuel Oliver Chairman of the Board & Non-Executive Director 5/5 Yes
Mr. Ashish Kumar Srivastava Managing Director & CEO 2/2 Yes*
Mr. Bharat Raj Kannan Non-Executive Director 4/4 Yes
Mr. Sunil Mehta Non-Executive Director 4/4 Yes
Mr. Sanjiv Sharan Non-Executive Director 4/5 No
Mr. Doulat Raj Mohnot Non-Executive Director 3/3 NA**
Mr. Surbhit Dabriwala Non-Executive Director 5/5 Yes
Mr. Gaurav Deepak Non-Executive Director 3/5 No
Mr. Pheroze Kersasp Mistry Non-Executive Director 5/5 No
Mr. Erach Homi Kotwal Non-Executive Director 3/5 Yes
Ms. Anisha Motwani Independent Director 5/5 Yes
Dr. Archana Niranjan Hingorani Independent Director 4/4 Yes
Mr. Neeraj Swaroop Independent Director 2/2 NA**
Mr. Vijay Kumar Chopra Non-Executive Director 1/1 NA**
Ms. Kastity Ha Non-Executive Director 0/1 NA**
* in the capacity of Interim CEO of the Company
** They were not directors on the Board as on the date of AGM
Induction & training of Board Members:
The Company has a robust process for induction of new members on the Board. As per the requirements of the Companies Act 2013, the Independent Directors are issued Letters of Appointment upon their appointment, setting out in detail, the terms of appointment, duties, responsibilities and expected time commitments. Each newly appointed Independent Director is taken through a formal induction program including the presentation from the Managing Director & CEO on the Company’s important aspects. The Company Secretary briefs the Director about their legal and regulatory responsibilities as a Director. The induction for Independent Directors include interactive sessions with Management Committee Members, Business and Functional Heads, etc.
CoMMItteeS of tHe BoarD
The Committees constituted by the Board play a very important role in the governance structure of the Company and they deal in specific areas/ activities that need closure review. The Committees have been set up under the formal approval of the Board to carry out pre-defined roles and responsibilities. The terms of reference of these Committees are in line with the requirements of the Companies Act, 2013 and Corporate Governance Guidelines issued by the IRDAI. The minutes of all the Committee meetings are placed before the Board of Directors and the Chairperson of each Committee briefs the Board on the important deliberations and decisions of the respective Committees
In line with the regulatory requirements and with a view to have more focused attention on various aspects of business and for
better accountability, the Board has constituted the following committees viz. Audit Committee, ALM & Risk Management Committee, Corporate Social Responsibility Committee, Investment Committee, IPO Committee, Nomination and Remuneration Committee, With Profits Committee, Policyholders Protection Committee. Each of these Committees has been mandated to operate within a given framework through its Charter.
(a) auDIt CoMMIttee
Audit Committee is established as a sub-committee of the Board in compliance with the Corporate Governance Guidelines issued by IRDA and the provisions of section 177 of the Companies Act, 2013 read with the Companies (Meetings of the Board and its Powers) Rules, 2014.
functions and responsibilities:
• Overseeing and examination of the financialstatements and the Auditors report thereon, financial reporting and disclosure processes.
• Oversightontheproceduresandprocessesestablishedto attend to issues relating to maintenance of books of account, administration procedures, transactions and other matters having a bearing on the financial position of the insurer, whether raised by the auditors or by any other person.
• To recommend the appointment, remunerationand terms of appointment of the auditors (internal/statutory/concurrent/secretarial/any other Auditor required to be appointed as per applicable regulations).
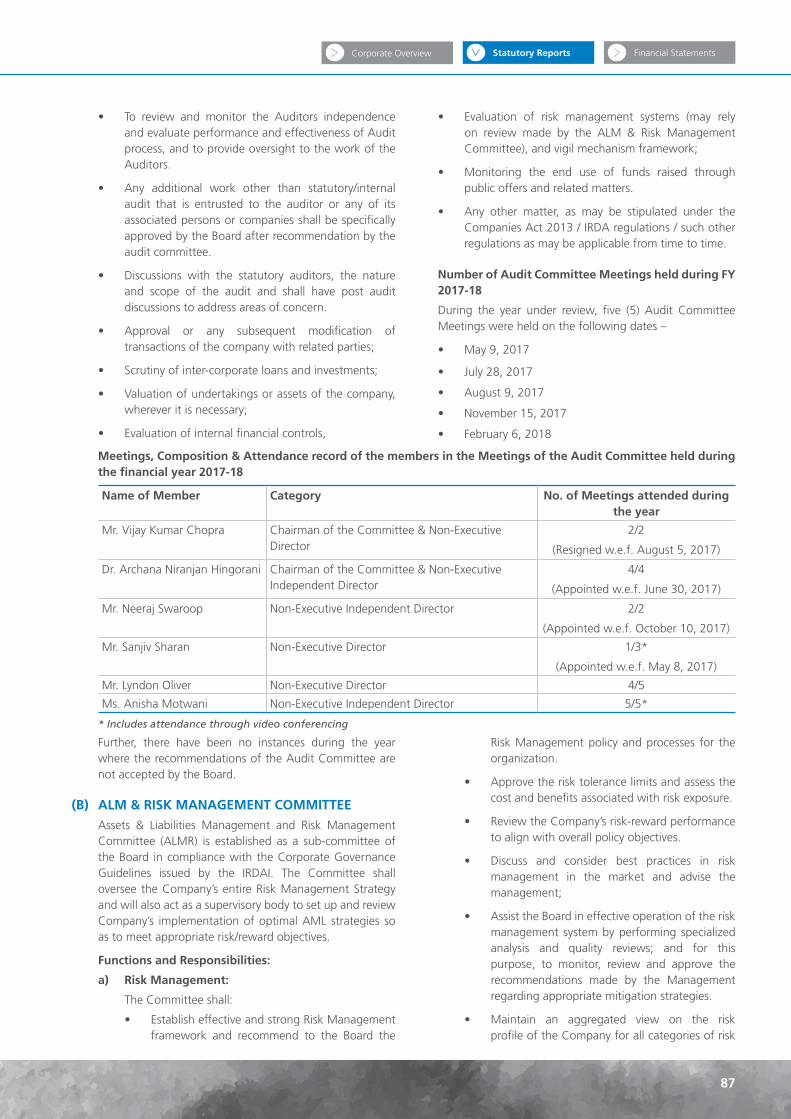
Financial StatementsStatutory ReportsCorporate Overview
87
• To review and monitor the Auditors independenceand evaluate performance and effectiveness of Audit process, and to provide oversight to the work of the Auditors.
• Any additional work other than statutory/internalaudit that is entrusted to the auditor or any of its associated persons or companies shall be specifically approved by the Board after recommendation by the audit committee.
• Discussions with the statutory auditors, the natureand scope of the audit and shall have post audit discussions to address areas of concern.
• Approval or any subsequent modification oftransactions of the company with related parties;
• Scrutinyofinter-corporateloansandinvestments;
• Valuationofundertakingsorassetsofthecompany,wherever it is necessary;
• Evaluationofinternalfinancialcontrols,
• Evaluation of risk management systems (may relyon review made by the ALM & Risk Management Committee), and vigil mechanism framework;
• Monitoring the end use of funds raised throughpublic offers and related matters.
• Any other matter, as may be stipulated under theCompanies Act 2013 / IRDA regulations / such other regulations as may be applicable from time to time.
Number of audit Committee Meetings held during fy 2017-18
During the year under review, five (5) Audit Committee Meetings were held on the following dates –
• May9,2017
• July28,2017
• August9,2017
• November15,2017
• February6,2018
Meetings, Composition & attendance record of the members in the Meetings of the audit Committee held during the financial year 2017-18
Name of Member Category No. of Meetings attended during the year
Mr. Vijay Kumar Chopra Chairman of the Committee & Non-Executive Director
2/2
(Resigned w.e.f. August 5, 2017)
Dr. Archana Niranjan Hingorani Chairman of the Committee & Non-Executive Independent Director
4/4
(Appointed w.e.f. June 30, 2017)
Mr. Neeraj Swaroop Non-Executive Independent Director 2/2
(Appointed w.e.f. October 10, 2017)
Mr. Sanjiv Sharan Non-Executive Director 1/3*
(Appointed w.e.f. May 8, 2017)
Mr. Lyndon Oliver Non-Executive Director 4/5
Ms. Anisha Motwani Non-Executive Independent Director 5/5*
* Includes attendance through video conferencing
Further, there have been no instances during the year where the recommendations of the Audit Committee are not accepted by the Board.
(B) aLM & rISK MaNaGeMeNt CoMMIttee
Assets & Liabilities Management and Risk Management Committee (ALMR) is established as a sub-committee of the Board in compliance with the Corporate Governance Guidelines issued by the IRDAI. The Committee shall oversee the Company’s entire Risk Management Strategy and will also act as a supervisory body to set up and review Company’s implementation of optimal AML strategies so as to meet appropriate risk/reward objectives.
functions and responsibilities:
a) risk Management:
The Committee shall:
• EstablisheffectiveandstrongRiskManagementframework and recommend to the Board the
Risk Management policy and processes for the organization.
• Approvetherisktolerancelimitsandassessthecost and benefits associated with risk exposure.
• ReviewtheCompany’srisk-rewardperformanceto align with overall policy objectives.
• Discuss and consider best practices in riskmanagement in the market and advise the management;
• AssisttheBoardineffectiveoperationoftheriskmanagement system by performing specialized analysis and quality reviews; and for this purpose, to monitor, review and approve the recommendations made by the Management regarding appropriate mitigation strategies.
• Maintain an aggregated view on the riskprofile of the Company for all categories of risk

88
including insurance risk, market risk, credit risk, liquidity risk, operational risk, compliance risk, legal risk, reputation risk, etc.
• AdvisetheBoardwithregardtoriskmanagementdecisions in relation to strategic and operational matters such as corporate strategy, mergers and acquisitions and related matters.
• ReporttotheBoard,detailsontheriskexposuresand the actions taken to manage the exposures; review, monitor and challenge where necessary, risk mitigation undertaken by the Company.
• ReviewthesolvencypositionoftheCompanyona regular basis.
• Monitorandreviewregularupdatesonbusinesscontinuity.
• Formulation of a Fraudmonitoring policy andframework for approval by the Board.
• MonitorimplementationofAnti-fraudpolicyforeffective deterrence, prevention, detection and mitigation of frauds.
• Review compliance with the guidelines onInsurance Fraud Monitoring Framework as may be issued by the IRDAI from time to time.
• SuchothermattersasmaybedelegatedbytheBoard from time to time.
b) assets Liabilities Management
ALM is an ongoing process of formulating, implementing, monitoring and revising strategies related to assets and liabilities to achieve an organization’s financial objectives, given the organization’s risk appetite, risk tolerances, and business profile. It lays down the framework to ensure that the insurer invests in a manner which would enable it to meet its cash flow needs and capital requirements at a future date to mitigate liquidity risk and solvency stipulations. As part of its ALM responsibilities, the functions of the Committee shall include:-
• Setting the insurer’s risk/reward objectives andaccess policyholder expectations.
• Quantifying the level of risk exposure andassessing the expected rewards and costs associated with the risk exposure.
• Formulating and implementing optimal ALMstrategies and meeting risk/reward objectives.
• Thestrategiesmustbelaiddownbothatproductlevel and enterprise level.
• Ensuringthatliabilitiesarebackedbyappropriateassets and manage mismatches between assets and liabilities to ensure they remain within
acceptable monitored tolerances for liquidity, solvency and the risk profile of the entity.
• Monitoring risk exposure at periodic intervalsand revising ALM Strategies where required.
• Reviewing, approving andmonitoring systems,controls and reporting used to manage balance sheet risks including any mitigation strategies.
• Regular review and monitoring of mismatchbetween assets and liabilities and the acceptable tolerance limits for mismatch, if any.
• Ensuring that management and valuation ofall assets and liabilities comply with standards, prevailing legislation and internal and external reporting requirements.
• Submitting the ALM information before theBoard at periodic intervals. Annual review of strategic asset allocation.
• Reviewingkeymethodologiesandassumptionsincluding actuarial assumptions, used to value assets and liabilities.
• Managingcapitalrequirementsatthecompanylevel using the regulatory solvency requirements
• Reviewing, approving and monitoringcapital plans and related decisions over capital transactions (e.g. dividend payments, acquisitions, disposals, etc.)
• SuchothermattersasmaybedelegatedbytheBoard from time to time.
c) For discharging its responsibilities, the Committee shall formulate, review and recommend various Policies and processes as may be directed and delegated to it by the Board such as Outsourcing Policy, Financial Condition Report, Report on data errors and Boundary conditions, System Certifications before product launches, Annual Persistency Report, Underwriting and Reinsurance Policies, Anti-Fraud Policy, Policy on Expense of Management, Policies on ALM and Capital Management, various IT, Risk Management and Security Policies etc.
Number of aLM & risk Management Committee Meetings held during fy 2017-18
During the year under review, five (5) ALM & Risk Management Committee Meetings were held on the following dates –
• May8,2017
• June29,2017
• August9,2017
• November6,2017
• February6,2018

Financial StatementsStatutory ReportsCorporate Overview
89
Meetings, Composition & attendance record of the members in the Meetings of the aLM & risk Management Committee held during the year 2017-18
Name of the Member Category No. of Meetings attended during the year
Ms. Kastity Ha Chaiperson of the Committee & Non-Executive Director
0/1
(Resigned w.e.f. May 19, 2017)
Mr. Vijay Kumar Chopra Chairman of the Committee & Non-Executive Independent Director
2/2
(Resigned w.e.f. August 5, 2017)
Mr. Bharat Kannan Chairman of the Committee & Non-Executive Director
3/3*
(Appointed w.e.f. August 2, 2017)
Ms. Anisha Motwani Non- Executive Independent Director 5/5*
Mr. Erach Kotwal Non-Executive Director 4/5*
Mr. Gaurav Deepak Non-Executive Director 0/5
Dr. Archana Niranjan Hingorani Non- Executive Independent Director 3/3
(Appointed w.e.f. June 30, 2017)
Mr. Doulat Raj Mohnot Non-Executive Director 2/2
(Appointed w.e.f. September 12, 2017)
Mr. Ashish Kumar Srivastava Managing Director and CEO 1/2
(Appointed w.e.f. October 1, 2017)
* Includes attendance through video conferencing
(C) CorPorate SoCIaL reSPoNSIBILIty CoMMIttee
The Corporate Social Responsibility Committee of the Board has been set up in compliance of the provisions of Section 135 of the Companies Act 2013 read with the IRDAI Guidelines on Corporate Governance that mandates forming this Committee for Companies earning a Net Profit of ` 5 crore or more during the preceding financial year. The Net Profits for this purpose will be calculated as mentioned in the IRDAI Guidelines read with Companies Act 2013 as may be amended from time to time.
functions and responsibilities:
a) Formulation and recommendation to the Board, of the “Corporate Social Responsibility Policy” which shall indicate the activities to be undertaken by the Company as specified in Schedule VII of the Companies Act 2013;
b) Review and recommend the amount of expenditure to be incurred on the activities referred to in clause (a);
c) Monitoring the Corporate Social Responsibility Policy of the Company from time to time;
d) Reviewing the progress made in each of the CSR areas identified by the company and impact created and updating the Board on a regular basis;
e) Ensuring that the CSR activities and the calculation of CSR expenditure are in line with the IRDAI regulatory Guidelines and the Companies Act 2013, and rules framed therewith;
f) Any other item, as may be directed by the Board from time to time.
Number of Corporate Social Responsibility Management Committee Meetings held during FY 2017-18
During the year under review, three (3) Corporate Social Responsibility Committee Meetings were held on the following dates –
• May8,2017
• August9,2017
• February6,2018

90
Meetings, Composition & attendance record of the members in the Meetings of the Corporate Social responsibility Committee held during the year 2017-18
Name of the Member Category No. of Meetings attended during the year
Ms. Anisha Motwani Chairperson & Non-Executive Independent Director 3/3*
Mr. Vijay Kumar Chopra Non-Executive Independent Director 1/1
(Resigned w.e.f. August 5, 2017)
Mr. Surbhit Dabriwala Non-Executive Director 3/3*
Mr. Erach Kotwal Non-Executive Director 2/3
Dr. Archana Niranjan Hingorani Non-Executive Independent Director 2/2
(Appointed w.e.f. June 30, 2017)
* Includes attendance through video conferencing
D) INVeStMeNt CoMMIttee
Investment Committee is established as a mandatory sub-committee of the Board in line with the requirements prescribed under the IRDAI (Investment) Regulations 2000, and Corporate Governance Guidelines issued by IRDAI.
functions and responsibilities:
The Committee plays a crucial role in managing investments out of policyholders’ funds and shareholders’ funds of the Company, and shall be responsible for :-
a) Recommending the investment policy and laying down and monitoring the operational framework for the investment operations of the Company. The policy should focus on a prudential Asset Liability Management (ALM) supported by robust internal control systems.
The Investment Policy and operational framework should, inter alia, encompass aspects concerning liquidity for smooth operations, compliance with prudential regulatory norms on investments, risk management / mitigation strategies to ensure commensurate yield on investments and above all protection of policyholders’ funds.
b) Implementing the Investment Policy duly approved by the Board, and to review it from time to time based on the performance of investments and evaluation of dynamic market conditions.
c) Formulation of an effective reporting system to ensure compliance with the policy set out by it apart from Internal /Concurrent Audit mechanisms for a sustained and ongoing monitoring of Investment Operations.
d) Such other matters as may be specified by the IRDAI and as directed by the Board from time to time.
For assessment of credit risk and market risk, the members of the Committee should not be influenced only by the credit rating. The Committee should independently review their investment decisions and ensure that support by the internal due diligence process is an input in making appropriate investment decisions.
Number of Investment Committee Meetings held during fy 2017-18
During the year under review, four (4) Investment Committee Meetings were held on the following dates –
• May8,2017
• August9,2017
• November6,2017
• February6,2018

Financial StatementsStatutory ReportsCorporate Overview
91
Meetings, Composition & attendance record of the members in the Meetings of the Investment Committee held during the year 2017-18
Name of the Member Category No. of Meetings attended during the year
Mr. Lyndon Oliver Chairman of the Committee & Non-Executive Director
4/4*
Mr. Vijay Kumar Chopra Non-Executive Independent Director 1/1(Resigned w.e.f. August 5, 2017)
Mr. Surbhit Dabriwala Non-Executive Director 4/4**
Mr. Sanjiv Sharan Non-Executive Director 0/2(Appointed w.e.f. May 8, 2017)
Dr. Archana Niranjan Hingorani Non-Executive Independent Director 2/2(Appointed w.e.f. June 30, 2017)
Mr. Niraj Shah Chief Financial Officer 4/4
Mr. Sanjay Kumar Chief Investment Officer 4/4
Mr. P K Dinakar Appointed Actuary 4/4
Mr. Anjan Bhattacharya Head- Risk Management 4/4
Mr. Ashish Kumar Srivastava Managing Director and CEO 2/3***(Appointed w.e.f. October 1, 2017)
* Includes attendance through video conferencing
** present by electronic mode on August 9, 2017 and November 6, 2017
*** member in the capacity of Interim CEO & Principal officer on August 9, 2017
(e) NoMINatIoN & reMuNeratIoN CoMMIttee
The Nomination and Remuneration Committee has been constituted in line with the provisions of Section 178 of the Companies Act, 2013 and the IRDAI Guidelines on Corporate Governance and shall also act as Compensation Committee under the SEBI Regulations.
functions and responsibilities:
a) To identify persons who are qualified to become directors in accordance with laid down criteria (determining qualifications, positive attributes and independence of a director), to scrutinize their declarations before appointment / reappointment and recommend to the Board their appointment and removal.
b) To scrutinize the applications and details submitted by the aspirants for appointment as the Key Managerial Persons (as defined under the IRDAI Guidelines and the Companies Act), make independent reference checks to verify the accuracy of their information and credentials and to recommend their appointment / termination to the Board for its approval and to ensure that such proposed appointments/ re-appointments of KMPs are in conformity with the Board approved policy on retirement/ superannuation.
c) To determine, review and formulate on behalf of the Board and on behalf of the shareholders with agreed terms of reference, the Company’s policy on remuneration packages and any compensation payment, for the CEO, the Executive Directors, Key Management Persons (KMPs) of the Company.
Further to ensure that the remuneration package is aligned appropriately with the performance objectives laid down and as per the Remuneration Policy of the Company.
d) To ensure that the level and composition of remuneration is reasonable and sufficient to attract, retain and motivate directors of the quality required to run the Company successfully; relationship of remuneration to performance is clear and meets appropriate performance benchmarks; and remuneration to directors, key managerial personnel and senior management involves a balance between fixed and incentive pay reflecting short and long-term performance objectives appropriate to the working of the company and its goals.
e) To develop measures to carry out evaluation of Board and Directors performance, and for this purpose, to formulate the Performance Evaluation Policy for the Board as a whole, its various Committees and individual Directors.
f) To review the talent management and succession process to ensure business continuity.
g) To make available its terms of reference, its role, the remuneration policy / philosophy of the company, the authority delegated to the Committee by the Board, and what it has done for the year under review to the shareholders in the Annual Report.
h) To formulate, review and recommend various Policies and processes as may be required under the IRDAI guidelines, the Listing regulations or under the

92
Companies Act or as may be directed and delegated to it by the Board from time to time.
i) Roll out, Administration & Superintendence of any Share based employee benefits scheme including ESOP, ESPS, ESOS etc as may be approved by the Shareholders of the Company in line with the provisions of the SEBI (Share Based Employee Benefits) Regulations, 2015; IRDAI Regulations; and the provisions of the Companies Act and any rules made thereunder, as may be amended from time to time.
j) To formulate the detailed terms and conditions of the schemes referred under i) as per the provisions specified by SEBI (including as amended from time to time) and frame suitable policies and procedures to ensure that there is no violation of securities laws, as amended from time to time, including Securities and Exchange Board of India (Prohibition of Insider Trading) Regulations, 1992 and Securities and Exchange Board of India (Prohibition of Fraudulent and Unfair Trade Practices Relating to the Securities
Market) Regulations, 2003 by the trust, the company and its employees, as applicable.
k) To devise a policy on diversity of board of directors;
l) To decide whether to extend or continue the term of appointment of the independent director, on the basis of the report of performance evaluation of independent directors.
m) Other terms as may be delegated to it by the Board of Directors or as may be specified under the Companies Act 2013 or IRDAI regulations or SEBI Guidelines.
Number of Nomination & remuneration Committee Meetings held during fy 2017-18
During the year under review, four (4) Nomination & Remuneration Committee Meetings were held on the following dates –
• May9,2017
• August10,2017
• October10,2017
• February7,2018
Meetings, Composition & attendance record of the members in the Meetings of the Nomination & remuneration Committee held during the year 2017-18
Name of the Member Category No. of Meetings attended during the year
Mr. Vijay Kumar Chopra Chairman of the Committee & Non-Executive Independent Director
1/1
(Resigned w.e.f. August 5, 2017)
Mr. Christopher Townsend Non-Executive Director 3/3*
(Resigned w.e.f. January 8, 2018)
Mr. Pheroze Mistry Non-Executive Director 4/4*
Ms. Anisha Motwani Chairperson & Non-Executive Independent Director 4/4
Mr. Surbhit Dabriwala Non-Executive Director 3/3*
Dr. Archana NIranjan Hingorani Non-Executive Independent Director 2/3
(Appointed w.e.f. June 30, 2017)
Mr. Neeraj Swaroop Non-Executive Independent Director 1/1
(Appointed w.e.f. October 10, 2017)
Mr. Lyndon Oliver Non-Executive Director 1/1
* Includes attendance through video conferencing
(f) WItH ProfItS CoMMIttee
The With Profits Committee has been constituted pursuant to Chapter XII of IRDAI (Non- Linked Insurance Products) Regulations, 2013 and other applicable provisions of the Insurance Act, 1938 & Regulations as amended from time to time.
functions and responsibilities:
a) The Committee shall carry out the functions of determining the following:-
• the share of assets attributable to thepolicyholders
• the investment income attributable to theparticipating fund of policyholders
• theexpensesallocatedtothepolicyholders
b) The Committee will review and approve
- manner in which asset shares are developed eg. Expense allocation, charges towards capital and taxes etc. and ensuring that the methods (allocation of expenses, investment income allocated, charges etc.), models and assumptions adopted by the Appointed Actuary are appropriate

Financial StatementsStatutory ReportsCorporate Overview
93
- if the reserves set up in respect of par policies are appropriate and consistent with the Asset shares estimated
- Bonus levels across different categories of policyholders and if the bonus declarations are in line with the policyholders’ reasonable expectations
- balance between regular and terminal bonuses
- annual report prepared on the With Profits Business every year
- any other related matters therein and as may be directed by the Board from time to time.
c) The Committee shall ensure appropriate process control to ensure the safety of the par fund assets and its separation and independence from the life company funds, and that the par fund is managed
equitably across the par policyholders and meets the policyholder reasonable expectations.
d) The Committee will prepare a report on the With Profits business every year which will be attached to the Actuarial Report and Abstract furnished by the Insurers to IRDAI.
e) The Committee will formulate various Policies and processes as may be required for discharging its responsibilities under this Charter.
Number of With Profits Committee Meetings held during fy 2017-18
During the year under review, three (3) With Profits Committee Meetings was held on the following date –
• May8,2017
• February6,2018
• March8,2018
Meetings, Composition & attendance record of the members in the Meetings of the With Profits Committee held during the year 2017-18
Name of the Member Category No. of Meetings attended during the year
Mr. Vijay Kumar Chopra Chairman & Non-Executive Independent Director 1/1
(Resigned w.e.f. August 5, 2017)
Mr. Vivek Jalan Independent Actuary 1/1**Mr. P K Dinakar Appointed Actuary 3/3Dr. Archana Niranjan Hingorani Chairperson & Non-Executive Independent
Director2/2
(Appointed w.e.f. June 30, 2017) Ms. Padmaja R Independent Actuary 2/2
(Appointed w.e.f. November 26, 2017)Mr. Ashish Kumar Srivastava Managing Director and CEO 2/2*
(Appointed w.e.f. October 1, 2017)Mr. Neeraj Swaroop Non- Executive Independent Director 2/2
(Appointed w.e.f. October 10, 2017)
* Includes attendance via video conferencing
** Mr. Vivek Jalan was functioning as the Independent Actuary for the Financial Year 2016-17, however due to other obligations he was
unable to continue for the Financial Year 2017-18. Ms. Padmaja R has been appointed in his place as the appointed Actuary on WPC for
FY 2017-18.
(G) PoLICyHoLDerS ProteCtIoN CoMMIttee
Policyholder Protection Committee (PPC) is established as a committee of the Board and also in compliance with the Corporate Governance Guidelines issued by IRDAI to protect the Policyholders Interest to address the various compliance issues relating to protection of their interests, as also relating to keeping the policyholders well informed of and educated about insurance products and complaint-handling procedures.
functions and responsibilities:
a) Adoption of standard operating procedures to treat the customer fairly including time-frames for policy and claims servicing parameters and monitoring implementation thereof.
b) Establish effective mechanism to address complaints and grievances of policyholders including mis-selling by intermediaries.
c) Put in place a framework for review of awards given by Insurance Ombudsman/Consumer Forums. Analyze the root cause of customer complaints, identify market conduct issues and advise the management appropriately about rectifying systemic issues, if any.
d) Review all the awards given by Insurance Ombudsman/Consumer Forums remaining unimplemented for more than three (3) months with reasons therefor and report the same to the Board for initiating remedial action, where necessary.
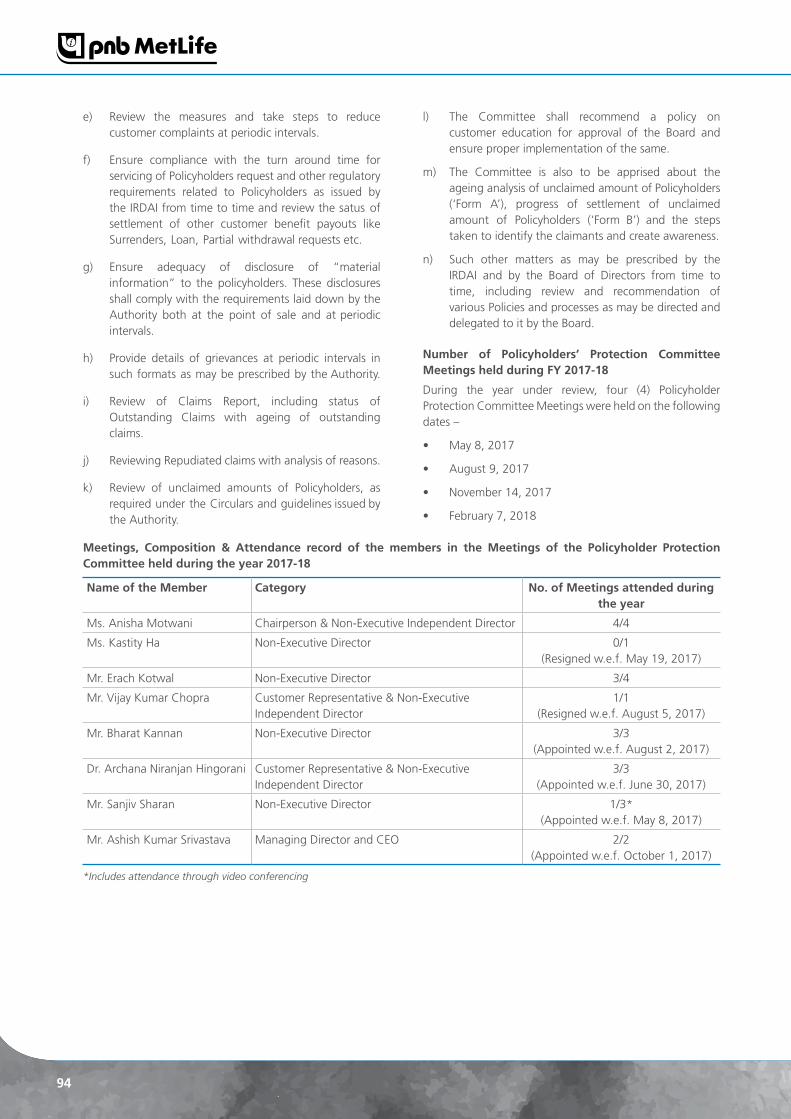
94
e) Review the measures and take steps to reduce customer complaints at periodic intervals.
f) Ensure compliance with the turn around time for servicing of Policyholders request and other regulatory requirements related to Policyholders as issued by the IRDAI from time to time and review the satus of settlement of other customer benefit payouts like Surrenders, Loan, Partial withdrawal requests etc.
g) Ensure adequacy of disclosure of “material information” to the policyholders. These disclosures shall comply with the requirements laid down by the Authority both at the point of sale and at periodic intervals.
h) Provide details of grievances at periodic intervals in such formats as may be prescribed by the Authority.
i) Review of Claims Report, including status of Outstanding Claims with ageing of outstanding claims.
j) Reviewing Repudiated claims with analysis of reasons.
k) Review of unclaimed amounts of Policyholders, as required under the Circulars and guidelines issued by the Authority.
l) The Committee shall recommend a policy on customer education for approval of the Board and ensure proper implementation of the same.
m) The Committee is also to be apprised about the ageing analysis of unclaimed amount of Policyholders (‘Form A’), progress of settlement of unclaimed amount of Policyholders (‘Form B’) and the steps taken to identify the claimants and create awareness.
n) Such other matters as may be prescribed by the IRDAI and by the Board of Directors from time to time, including review and recommendation of various Policies and processes as may be directed and delegated to it by the Board.
Number of Policyholders’ Protection Committee Meetings held during fy 2017-18
During the year under review, four (4) Policyholder Protection Committee Meetings were held on the following dates –
• May8,2017
• August9,2017
• November14,2017
• February7,2018
Meetings, Composition & attendance record of the members in the Meetings of the Policyholder Protection Committee held during the year 2017-18
Name of the Member Category No. of Meetings attended during the year
Ms. Anisha Motwani Chairperson & Non-Executive Independent Director 4/4
Ms. Kastity Ha Non-Executive Director 0/1(Resigned w.e.f. May 19, 2017)
Mr. Erach Kotwal Non-Executive Director 3/4
Mr. Vijay Kumar Chopra Customer Representative & Non-Executive Independent Director
1/1(Resigned w.e.f. August 5, 2017)
Mr. Bharat Kannan Non-Executive Director 3/3(Appointed w.e.f. August 2, 2017)
Dr. Archana Niranjan Hingorani Customer Representative & Non-Executive Independent Director
3/3(Appointed w.e.f. June 30, 2017)
Mr. Sanjiv Sharan Non-Executive Director 1/3*(Appointed w.e.f. May 8, 2017)
Mr. Ashish Kumar Srivastava Managing Director and CEO 2/2(Appointed w.e.f. October 1, 2017)
*Includes attendance through video conferencing

Financial StatementsStatutory ReportsCorporate Overview
95
(H) IPo CoMMIttee
The IPO Committee has been constituted to explore liquidity options for the shareholders of the company in terms of the IPO agreement entered into between the shareholders.
Number of IPo Committee Meetings held during fy 2017-18
During the year under review, six (6) IPO Committee Meetings were held on the following dates –
• May9,2017
• August10,2017
• October10,2017
• November14,2017
• February6,2018
• March26,2018
Meetings, Composition & attendance record of the members in the Meetings of the IPo Committee held during the year 2017-18
Name of the Member Category No. of Meetings attended during the year
Mr. Christopher Townsend Chairman, Representing MetLife International Holdings LLC
4/4*(Resigned w.e.f. January 8, 2018)
Mr. Lyndon Oliver Chairman, Representing MetLife International Holdings LLC
6/6
Ms. Usha Ananthasubramanian Representing Punjab National Bank 0/1(Resigned w.e.f. May 5, 2017)
Mr. Surbhit Dabriwala Representing Elpro Group 6/6*
Mr. Pheroze Mistry Representing Pallonji Group 6/6*Mr. Sanjiv Sharan Representing Punjab National Bank 0/1
(Appointed w.e.f. May 8, 2017)Mr. Gaurav Deepak Representing Elpro Group 0/1
Mr. Sunil Mehta Representing Punjab National Bank 4/4(Appointed w.e.f. August 2, 2017)
* Includes attendance through video conferencing
(I) StaKeHoLDerS’ reLatIoNSHIP CoMMIttee
Stakeholders Relationship Committee (SRC) is established as a Committee of the Board to assist the Board and the Company to oversee the existing redressal mechanisms in relation to Stakeholders of the Company. The term “Stakeholder” shall include shareholders, debenture holders, other security holders, vendors, customers, other persons and employees.
The Committee shall receive reports from designated personnel responsible for each of these mechanisms, and from any other Company personnel that the Committee deems necessary. The Committee shall also review the number of unresolved issues during the course of a quarter. The Committee shall have the authority to make recommendations to resolve any such issues.
fuNCtIoNS aND reSPoNSIBILItIeS:
• The Committee shall consider and oversee theimplementation of the objectives stated in this Charter.
• The Committee shall resolve complaints related totransfer of shares, non-receipt of annual report and non-receipt of declared dividends, issue of duplicate certificates and new certificates on split/consolidation / renewal etc., transfer / transmission, dematerialization and rematerialization of equity shares and oversee the performance of the Register and Transfer Agents and recommend measures for overall improvement in the quality of investor services.
• The Committee shall review the Company’sobligations towards meeting environment, health and safety requisites for the benefit of Stakeholders.
• TheCommitteeshallperiodicallyprovideupdatestothe Board.
• To Committee may consult with other committeesof the Board, if required, while discharging its responsibilities.
• The Committee shall monitor and review on anannual basis the Company’s performance in dealing with Stakeholder grievances.

96
• The Committee shall review and reassess theadequacy of this Charter periodically and recommend any proposed changes to the Board for approval.
• The Committee shall have access to any internalinformation necessary to fulfill its role.
• The Committee shall also have authority to obtainadvice and assistance from internal or external legal, accounting or other advisors.
The Committee composes of four members constituting Ms. Sonu Bhasin as Chairperson, and Ms. Anisha Motwani and Mr. Ashish Kumar Srivastava as members.
aNNuaL PerforMaNCe eVaLuatIoN By tHe BoarD
In terms of the provisions of the Companies Act, 2013 read with rules made thereunder, the Board of Directors on
the recommendation of the Nomination & Remuneration Committee, have evaluated the effectiveness of the Board. Accordingly, the performance evaluation of the Board, each Director and Committees was carried out for the financial year ending March 31, 2017. The evaluation was based on various areas which included Board Structure and Governance, Conduct of Board meetings, Board strategy, performance review and Risk Management, Board and Management relations and Board Constituted Committees and was undertaken using a questionnaire to review the performance of the Board as a whole, all Directors, including the Managing Director and the Chairman of the Board and its various Committees. The Independent Directors also reviewed the quality, content and timeliness of the flow of information between the Management and the Board and its Committees which is necessary to effectively and reasonably perform and discharge their duties. The evaluation was undertaken by way of a questionnaire in line with the performance evaluation policy approved by the Board.
DetaILS of SIttING feeS PaID
The details of sitting fees paid, during the FY 2017-18, for attending Board and other Committee meetings are as under:
(Amount in `)
Meeting / Directors Vijay Kumar Chopra
archana Niranjan Hingorani
anisha Motwani
Neeraj Swaroop
Doulat raj Mohnot
Board Meeting 50,000 2,00,000 2,50,000 1,00,000 1,50,000
Audit Committee Meeting 1,00, 000 2,00,000 2,50,000 1,00,000 -
ALM & Risk Management Committee Meeting 1,00,000 1,50,000 2,50,000 - 1,00,000
CSR Committee Meeting 50,000 1,00,000 1,50,000 - -
Investment Committee Meeting 50,000 50,000 - - 50,000
Nomination & Remuneration Committee Meeting 50,000 1,00,000 2,00,000 50,000 -
With Profits Committee Meeting 50,000 1,00,000 - 1,00,000 -
Policyholder Protection Committee Meeting 50,000 1,50,000 2,00,000 - -
Independent Directors Meeting - 50,000 50,000 50,000 -
Extra-Ordinary General Meeting - 50,000 50,000 - -
Annual General Meeting - 50,000 50,000 - -
totaL 5,00,000 12,00,000 14,50,000 4,00,000 3,00,000
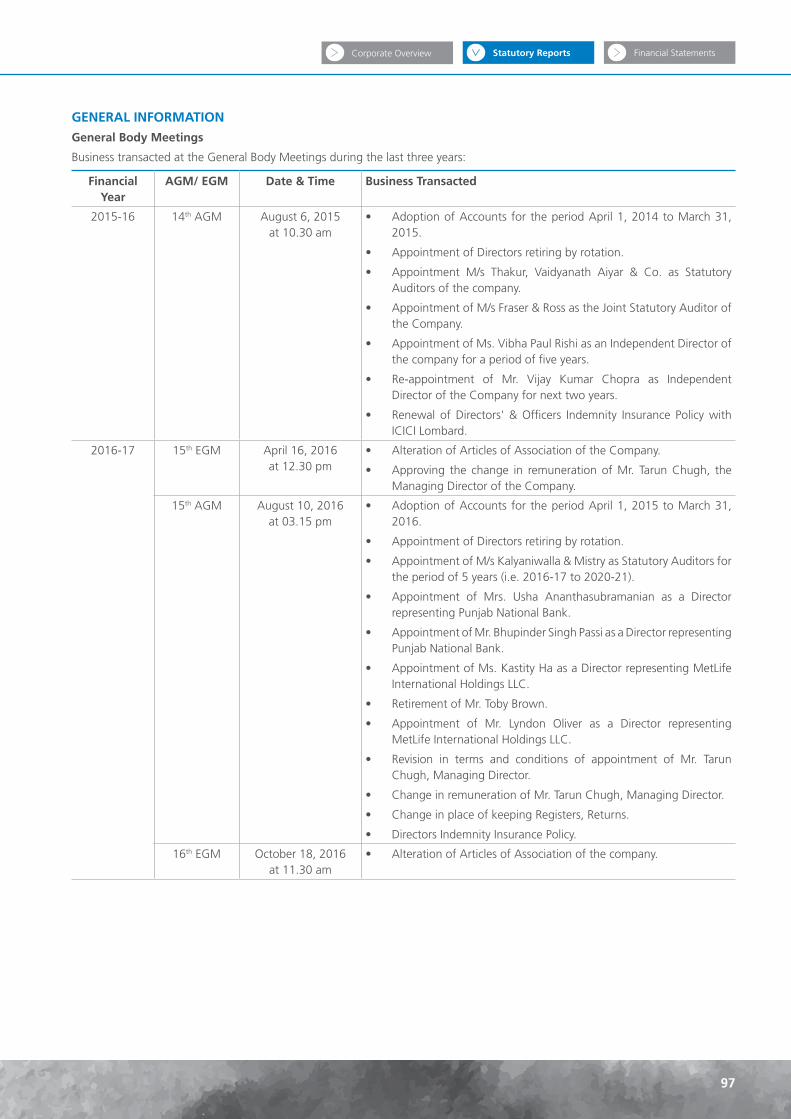
Financial StatementsStatutory ReportsCorporate Overview
97
GeNeraL INforMatIoN
General Body Meetings
Business transacted at the General Body Meetings during the last three years:
financial year
aGM/ eGM Date & time Business transacted
2015-16 14th AGM August 6, 2015at 10.30 am
• AdoptionofAccounts for theperiodApril1,2014toMarch31,2015.
• AppointmentofDirectorsretiringbyrotation.
• Appointment M/s Thakur, Vaidyanath Aiyar & Co. as StatutoryAuditors of the company.
• AppointmentofM/sFraser&RossastheJointStatutoryAuditorofthe Company.
• AppointmentofMs.VibhaPaulRishiasanIndependentDirectorofthe company for a period of five years.
• Re-appointment of Mr. Vijay Kumar Chopra as IndependentDirector of the Company for next two years.
• Renewal ofDirectors'&Officers Indemnity Insurance PolicywithICICI Lombard.
2016-17 15th EGM April 16, 2016 at 12.30 pm
• AlterationofArticlesofAssociationoftheCompany.
• Approving the change in remunerationofMr. TarunChugh, theManaging Director of the Company.
15th AGM August 10, 2016 at 03.15 pm
• AdoptionofAccounts for theperiodApril1,2015toMarch31,2016.
• AppointmentofDirectorsretiringbyrotation.
• AppointmentofM/sKalyaniwalla&MistryasStatutoryAuditorsforthe period of 5 years (i.e. 2016-17 to 2020-21).
• Appointment of Mrs. Usha Ananthasubramanian as a Directorrepresenting Punjab National Bank.
• AppointmentofMr.BhupinderSinghPassiasaDirectorrepresentingPunjab National Bank.
• AppointmentofMs.KastityHaasaDirectorrepresentingMetLifeInternational Holdings LLC.
• RetirementofMr.TobyBrown.
• Appointment of Mr. Lyndon Oliver as a Director representingMetLife International Holdings LLC.
• Revision in terms and conditions of appointment of Mr. TarunChugh, Managing Director.
• ChangeinremunerationofMr.TarunChugh,ManagingDirector.
• ChangeinplaceofkeepingRegisters,Returns.
• DirectorsIndemnityInsurancePolicy.
16th EGM October 18, 2016 at 11.30 am
• AlterationofArticlesofAssociationofthecompany.

98
financial year
aGM/ eGM Date & time Business transacted
2017-18 16th AGM August 10, 2017 at 4.00 pm
• AdoptionofAccounts for theperiodApril1,2016toMarch31,2017.
• AppointmentofDirectorsretiringbyrotation.
• AppointmentofM/sK.S.Aiyar&CompanyasStatutoryAuditorsfor the period of 5 years (i.e. 2017-18 to 2020-21).
• AppointmentofMs.AnishaMotwaniasIndependentDirector.
• Appointment of Dr. Archana Niranjan Hingorani as IndependentDirector.
• AppointmentofMr.SanjivSharanasDirectorrepresentingPunjabNational Bank.
• Appointment of Mr. Erach Kotwal as Director representing MPallonji and Company Private Limited.
• AppointmentofMr.BharatKannanasDirectorrepresentingMetLifeInternational Holdings LLC.
• AppointmentofMr.SunilMehtaasDirector representingPunjabNational Bank.
• DirectorsIndemnityInsurancePolicy
17th EGM August 10, 2017 at 3.30 pm
• AppointmentofM/sK.S.Aiyar&CompanyasStatutoryAuditorstofill the Casual Vacancy caused by resignation of M/s Kalyaniwalla & Mistry.
18th EGM December 13, 2017 at 2.00 pm
• Appointment of Mr. Ashish Kumar Srivastava as the ManagingDirector and CEO w.e.f. October 1, 2017.
• AlterationofMemorandumofAssociationofthecompany.
• AlterationofArticlesofAssociationofthecompany.
• PNBMetLifeIndiaInsuranceCo.Ltd.-EmployeeStockOptionPlan-2017.
• AppointmentofMr.NeerajSwaroopasIndependentDirectorw.e.f.October 10, 2017.
DIStrIButIoN of SHareHoLDING of tHe CoMPaNy
Name of Shareholder No. of Shares %
MetLife International Holdings LLC 52,33,49,913 26.00%
The Jammu & Kashmir Bank Limited 10,21,89,189 5.08%
M. Pallonji & Company Private Limited 20,08,35,377 9.98%
M. Pallonji Enterprises Private Limited 14,44,04,821 7.17%
Elpro International Limited 25,66,33,397 12.75%
IGE (India) Pvt. Ltd. 17,26,21,357 8.57%
Manimaya Holdings Private Limited 89,84,944 0.45%
Punjab National Bank 60,38,65,285 30.00%
total 2,01,28,84,283 100.00%
CertIfICatIoN for CoMPLIaNCe of tHe CorPorate GoVerNaNCe GuIDeLINeS
I, Yagya Turker, Company Secretary hereby certify that the Company has complied with the corporate governance guidelines for Insurance Companies as amended from time to time and formation as well as constitution of various committees, and nothing has been concealed or suppressed.
Date : yagya turkerPlace : Mumbai Company Secretary

Financial StatementsStatutory ReportsCorporate Overview
99
Financial Statements

100
Independent Auditors Report On Financial Statements for the year ended March 31, 2018
To,The Members of PNB MetLife India Insurance Company Limited
1. RepORT On The FInAncIAl STATeMenTS
We have audited the accompanying financial statements of PNB MetLife India Insurance Company Limited (“the Company”), which comprise the Balance Sheet as at March 31, 2018, the Revenue Account (also called the “Policyholders Account” or the “Technical Account”),the Profit and Loss Account (also called the “Shareholders Account” or the “ Non-Technical Account”) and the Receipts and Payments Account for the year ended on that date annexed thereto and a summary of the significant accounting policies and other explanatory information.
2. MAnAgeMenT’S ReSpOnSIbIlITy FOR The FInAncIAl STATeMenTS
The Company’s Board of Directors is responsible for the matters stated in Section 134(5) of the Companies Act,2013 (the “Act”) with respect to preparation of these Financial Statements that give a true and fair view of the Balance Sheet, the related Revenue Account, the Profit and Loss Account and the Receipts and Payments Account of the Company in accordance with accounting principles generally accepted in India and the Accounting Standards as specified under section 133 of the Act to the extent applicable, and in accordance with:
(a) The Insurance Act, 1938 (Act 4 of 1938) as amended by Insurance Laws (Amendment) Act, 2015 read with IRDAI circular no. IRDAI/ F&A/ CIR/ FA/ 059/ 03/ 2015 dated March 31, 2015 (the “Insurance Act”).
(b) the Insurance Regulatory and Development Authority Act, 1999 (the “IRDA Act”),
(c) IRDA (Preparation of Financial Statements and Auditor’s report of Insurance companies) Regulations, 2002 (the ”IRDA Financial Statements” Regulations),
(d) Orders / Directions / Circulars issued by the Insurance Regulatory and Development Authority of India (the “IRDAI”) in this regard.
This responsibility also includes maintenance of adequate accounting records in accordance with the provisions of the Act, for safeguarding the assets of the Company and for preventing and detecting frauds and other irregularities;
selection and application of appropriate accounting policies; making judgements and estimates that are reasonable and prudent; and design, implementation and maintenance of adequate internal financial controls, that were operating effectively for ensuring the accuracy and completeness of the accounting records, relevant to the preparation and presentation of the financial statements that give a true and fair view and are free from material misstatement, whether due to fraud or error.
3. AudITORS’ ReSpOnSIbIlITy
Our responsibility is to express an opinion on these financial statements based on our audit. We have taken into account provisions of the Act, the Insurance Act, the IRDA Act, the “IRDA Financial Statements Regulations” and Orders / Directions/ Circulars issued by the Insurance Regulatory and Development Authority of India (the “IRDAI”), the accounting and auditing standards and matters which are required to be included in the audit report under the provisions of the Act and the Rules made thereunder in this regard from time to time.
We conducted our audit of the financial statements in accordance with the standards on Auditing as specified u/s 143(10) of the Act. Those standards require that we comply with ethical requirements and plan and perform the audit to obtain reasonable assurance about whether the Financial Statements are free from material misstatement.
An audit involves performing procedures to obtain audit evidence about the amounts and the disclosures in the financial statements. The procedures selected depend on the auditor’s judgement, including the assessment of the risks of material misstatement of the financial statements, whether due to fraud or error. In making those risk assessments, the auditor considers internal financial control relevant to the Company’s preparation of the financial statements that give a true and fair view in order to design audit procedures that are appropriate in the circumstances. An audit also includes evaluating the appropriateness of the accounting policies used and the reasonableness of the accounting estimates made by the Management, as well as evaluating the overall presentation of the financial statements.
We believe that the audit evidence we have obtained is sufficient and appropriate to provide a basis for our audit opinion on the financial statements.

Financial StatementsStatutory ReportsCorporate Overview
101
4. OpInIOn
In our opinion and to the best of our information and according to the explanations given to us, the aforesaid financial statements comprising of the Balance Sheet, the Revenue Account, the Profit and Loss Account and the Receipts and Payment account read together with the significant accounting policies and notes thereon and attached thereto are prepared in accordance with the requirements of the Insurance Act, 1938 the IRDA Financial Statements Regulations, the orders/directions issued by the IRDAI and the Act, to the extent applicable and in the manner so required and give a true and fair view in conformity with the accounting principles generally accepted in India, as applicable to the insurance companies:
(a) In the case of Balance Sheet, of the state of affairs of the Company as at March 31, 2018;
(b) In the case of Revenue Account, of the surplus for the year ended on March 31, 2018;
(c) In the case of the Profit and Loss account, of the profit for the year ended on March 31, 2018; and
(d) In the case of the receipts and payments account, of the receipts and payment for the year ended on March 31, 2018,
5. MATTeR OF eMphASIS
Without modifying our opinion, we draw attention to Note No. 3.24(a) of Schedule 16 regarding the accumulated deficit of ̀ 13,003,351 thousands as at March 31, 2017 in the Revenue Account (Policyholders’ Account) pertaining to non-par segments which is now absorbed in the Shareholders’ funds- Reserves and Surplus- Balance of profit at the year-end in the Balance Sheet (Refer Schedule 6).
6. OTheR MATTeR
Without modifying our opinion, we draw attention to Note No. 3.2 of Schedule 16 regarding the actuarial valuation of liabilities for life policies in force and for policies in respect of which premium has been discontinued but liability exists as at March 31, 2018 is the responsibility of the Company’s Appointed Actuary (the “Appointed Actuary”). The actuarial valuation of these liabilities for life policies in force and for policies in respect of which premium has been discontinued but liability exists as at March 31, 2018 has been duly certified by the Appointed Actuary and in his opinion, the assumptions for such valuation are in accordance with the guidelines and norms issued by the IRDAI and the Institute of Actuaries of India in concurrence with the IRDAI. We have relied upon Appointed Actuary’s certificate in this regard for forming our opinion on the valuation of liabilities for life policies
in force and for policies in respect of which premium has been discontinued but liability exists in Financial Statements of the Company.
7. RepORT On OTheR legAl And RegulATORy RequIReMenTS:
1. As required by the IRDAI Financial Statements Regulations, we have issued a separate certificate dated June 01, 2018 certifying the matters specified in paragraphs 3 and 4 of Schedule C to the IRDAI Financial Statements Regulations.
2. As required by the IRDA Financial Statements Regulations, read with Section 143(3) of the Act, we report that:
(a) We have sought and obtained all the information and explanations, which to the best of our knowledge and belief were necessary for the purposes of the audit and have found them to be satisfactory.
(b) In our opinion, proper books of account as required by law have been kept by the Company, so far as it appears from our examination of those books.
(c) As the Company's financial accounting system is centralized, no returns for the purposes of our audit are prepared at the branches of the Company.
(d) The Balance Sheet, the Revenue Account, the Profit and Loss Account and the Receipts and Payments Account dealt with by this report are in agreement with the books of account.
(e) The actuarial valuation of liabilities is duly certified by the appointed actuary including to the effect that the assumptions for such valuation are in accordance with the guidelines and norms issued by the IRDAI (the Authority) and/or the Institute of Actuaries of India in concurrence with the Authority. In this regard, please refer to point no. 6 of this report i.e., Other matter.
(f) The accounting policies selected by the Company are appropriate, which along with the financial statements comply with the Accounting Standards specified under Section 133 of the Companies Act, 2013, to the extent not inconsistent with the accounting principles prescribed in the IRDAI Regulations and orders/directions issued by the IRDAI in this regard.
(g) on the basis of the written representations received from the directors of the Company as on March 31, 2018 and taken on record by the Board of Directors, none of the directors is disqualified as on March 31, 2018 from being appointed as a director in terms of section 164(2) of the Act.

102
(h) With respect to the adequacy the Internal Financial Controls Over Financial Reporting (IFCoFR) of the Company and the operating effectiveness of such controls Refer Annexure A annexed to this Report. Our report expresses an unmodified opinion on the adequacy and operating effectiveness of the Company’s internal financial controls over financial reporting.
(i) With respect to the other matters to be included in Auditor’s Report in accordance with Rule 11 of the Companies (Audit and Auditors) Rules, 2014, in our opinion and to the best of our information and according to the explanations given to us:
(a) The Company has disclosed the impact of pending litigations on its financial position in its financial statements - Refer Note 3.1of Schedule16 to the financial statements
(b) The company does not have any long term contracts including derivative contracts wherein there were any material foreseeable losses.
(c) There were no amounts which were required to be transferred to the Investor Education and Protection Fund by the Company.
For K.S.AIyAR & co. For Thakur Vaidyanath Aiyar & co.Chartered Accountants Chartered Accountants FRN:100186W FRN: 000038N
Rajesh S Joshi K.n.guptaPartner PartnerM. No.38526 M. No. 09169
Place: Mumbai Place: MumbaiDate: June 01, 2018 Date: June 01, 2018

Financial StatementsStatutory ReportsCorporate Overview
103
Annexure - A Referred to in paragraph 7(2)(h) under Report on Other legal and Regulatory Requirements of our report of even date.
Report on the Internal Financial controls under clause (i) of Sub-section 3 of Section 143 of the companies Act, 2013 (“the Act”)
We have audited the internal financial controls over financial reporting of pnb Metlife India Insurance company limited (“the Company”) as of March 31, 2018 in conjunction with our audit of the financial statements of the Company for the year ended on that date. The actuarial valuation of liabilities for life policies in force and policies where premium is discontinued is required to be certified by the Appointed Actuary as per the Insurance Regulatory and Development Authority (Preparation of Financial Statements and Auditor’s Report of Insurance Companies) Regulations, 2002 (the “IRDA Financial Statements Regulations”), and has been relied upon by us, as mentioned in “Other Matter” para of our audit report on the financial statements of the Company as at and for the year ended March 31, 2018. Accordingly, we have not audited the internal financial controls over financial reporting in respect of the valuation and accuracy of the aforesaid actuarial valuation.
MAnAgeMenT’S ReSpOnSIbIlITy FOR InTeRnAl FInAncIAl cOnTROlS
The Company’s management is responsible for establishing and maintaining internal financial controls based on the internal control over financial reporting criteria established by the Company considering the essential components of internal control stated in the Guidance Note on Audit of Internal Financial Controls over Financial Reporting (‘the Guidance Note”) issued by the Institute of Chartered Accountants of India (‘ICAI’). These responsibilities include the design, implementation and maintenance of adequate internal financial controls that were operating effectively for ensuring the orderly and efficient conduct of its business, including adherence to company’s policies, the safeguarding of its assets, the prevention and detection of frauds and errors, the accuracy and completeness of the accounting records, and the timely preparation of reliable financial information, as required under the Companies Act, 2013. including the provisions of the Insurance Act, 1938 as amended by the Insurance Laws (Amendment) Act, 2015 read with Insurance Regulatory and Development Authority of India circular IRDA/F&A/CIR/CPM/059/03/2015 dated March 31, 2015 (the “Insurance Act”), the Insurance Regulatory and Development Authority Act, 1999 (the “IRDA Act”), the IRDA Financial Statements Regulations, orders/directions issued by the Insurance Regulatory and Development Authority of India (the “IRDAI”) in this regard.
AudITORS’ ReSpOnSIbIlITy
Our responsibility is to express an opinion on the Company's internal financial controls over financial reporting based on our audit. We conducted our audit in accordance with the Guidance Note on Audit of Internal Financial Controls over Financial Reporting (the “Guidance Note”) and the Standards on Auditing, issued by ICAI and deemed to be prescribed under section 143(10) of the Companies Act, 2013, to the extent applicable to an audit of internal financial controls. Those Standards and the Guidance Note require that we comply with ethical requirements and plan and perform the audit to obtain reasonable assurance about whether adequate internal financial controls over financial reporting was established and maintained and if such controls operated effectively in all material respects.
Our audit involves performing procedures to obtain audit evidence about the adequacy of the internal financial controls system over financial reporting and their operating effectiveness. Our audit of internal financial controls over financial reporting included obtaining an understanding of internal financial controls over financial reporting, assessing the risk that a material weakness exists, and testing and evaluating the design and operating effectiveness of internal control based on the assessed risk. The procedures selected depend on the auditor’s judgment, including the assessment of the risks of material misstatement of the financial statements, whether due to fraud or error.
We believe that the audit evidence we have obtained is sufficient and appropriate to provide a basis for our audit opinion on the Company’s internal financial controls system over financial reporting.
MeAnIng OF InTeRnAl FInAncIAl cOnTROlS OVeR FInAncIAl RepORTIng
A company's internal financial control over financial reporting is a process designed to provide reasonable assurance regarding the reliability of financial reporting and the preparation of financial statements for external purposes in accordance with generally accepted accounting principles. A Company's internal financial control over financial reporting includes those policies and procedures that:
(1) pertain to the maintenance of records that, in reasonable detail, accurately and fairly reflect the transactions and dispositions of the assets of the company;

104
(2) provide reasonable assurance that transactions are recorded as necessary to permit preparation of financial statements in accordance with generally accepted accounting principles, and that receipts and expenditures of the company are being made only in accordance with authorisations of management and directors of the company; and
(3) provide reasonable assurance regarding prevention or timely detection of unauthorised acquisition, use, or disposition of the company's assets that could have a material effect on the financial statements.
InheRenT lIMITATIOnS OF InTeRnAl FInAncIAl cOnTROlS OVeR FInAncIAl RepORTIng
Because of the inherent limitations of internal financial controls over financial reporting, including the possibility of collusion or improper management override of controls, material misstatements due to error or fraud may occur and not be
detected. Also, projections of any evaluation of the internal financial controls over financial reporting to future periods are subject to the risk that the internal financial control over financial reporting may become inadequate because of changes in conditions, or that the degree of compliance with the policies or procedures may deteriorate.
OpInIOn
In our opinion, to the best of our information and according to the explanations given to us, the Company has in all material respects, an adequate internal financial controls system over financial reporting and such internal financial controls over financial reporting were operating effectively as at March 31, 2018, based on the internal control over financial reporting criteria established by the Company considering the essential components of internal control stated in the Guidance Note on Audit of Internal Financial Controls Over Financial Reporting issued by the Institute of Chartered Accountants of India.
For K.S.AIyAR & co. For Thakur Vaidyanath Aiyar & co.Chartered Accountants Chartered AccountantsFRN:100186W FRN: 000038N
Rajesh S Joshi K.n.guptaPartner PartnerM. No.38526 M. No. 09169
Place: Mumbai Place: MumbaiDate: June 01, 2018 Date: June 01, 2018

Financial StatementsStatutory ReportsCorporate Overview
105
Independent Auditor’s certificate
(Referred to in paragraph 7 (1) of our Report on Other Legal and Regulatory Requirements forming part of the Independent Auditor’s Report dated June 01, 2018)
This certificate is issued to PNB MetLife India Insurance Company Limited (the Company) to comply with the provisions of paragraph 3 and 4 of Schedule C of the Insurance Regulatory and Development Authority (Preparation of Financial Statements and Auditor’s Report of Insurance Companies) Regulations 2002, (“the IRDAI Financial Statements Regulations”) read with Regulation 3 of the IRDAI Financial Statements Regulations and is not intended to be used or distributed for any purpose.
The Company’s Board of Directors is responsible for complying with the provisions of the Insurance Act, 1938 as amended by the Insurance Laws (Amendment) Act, 2015 read with Insurance Regulatory and Development Authority of India circular IRDAI/F&A/CIR/FA/059/03/2015 dated March 31, 2015 (the “Insurance Act”), the Insurance Regulatory and Development Authority Act, 1999 (the “IRDAI Act”), the IRDAI Financial Statements Regulations, orders/directions issued by the Insurance Regulatory and Development Authority of India (the “IRDAI”) which includes the preparation of the Management Report. This includes collecting, collating and validating data and designing, implementing and monitoring of internal controls suitable for ensuring compliance as aforesaid.
Our responsibility for the purpose of this certificate is limited to certifying matters contained in paragraphs 3 and 4 of Schedule C of the Regulations. We conducted our examination in accordance with the Guidance Note on Audit Reports and Certificates for Special Purposes issued by the Institute of Chartered Accountants of India (the ‘ICAI’), which include the concepts of test checks and materiality.
In accordance with the information and explanations given to us and to the best of our knowledge and belief and based on our examination of the books of account and other records maintained the Company for the year ended March 31, 2018, we certify that:
1. We have reviewed the Management Report attached to the financial statements for the year ended March 31, 2018, and on the basis of our review, there is no apparent mistake or material inconsistencies with the financial statements as adopted by the Board of Directors and our Report thereon;
2. Based on the management representations and compliance certificates submitted to the Board of Directors by the officers of the Company charged with compliance and the same being noted by the Board, we certify that the Company has complied with the terms and conditions of registration stipulated by IRDAI;
3. We have verified the cash balances by the actual inspection, to the extent considered necessary or on the basis of certificate/confirmations received from the Branches and on the basis of subsequent deposit thereof in the Banks and Securities relating to the Company’s investments as at March 31, 2018, on the basis of certificates/confirmations received from the Custodian and/ or Depository Participants appointed by the Company, as at March 31, 2018, the Company does not have reversions and life interests;
4. The Company is not a trustee of any trust; and
5. No part of the assets of the Policyholders’ Funds has been directly or indirectly applied in contravention to the provisions of the Insurance Act, 1938 as amended by the Insurance Laws (Amendment) Act, 2015 relating to the application and investments of the Policyholders’ Funds.
For K.S.AIyAR & co. For Thakur Vaidyanath Aiyar & co.Chartered Accountants Chartered Accountants FRN:100186W FRN: 000038N
Rajesh S Joshi K.n.guptaPartner PartnerM. No.38526 M. No. 09169
Place: Mumbai Place: MumbaiDate: June 01, 2018 Date: June 01, 2018
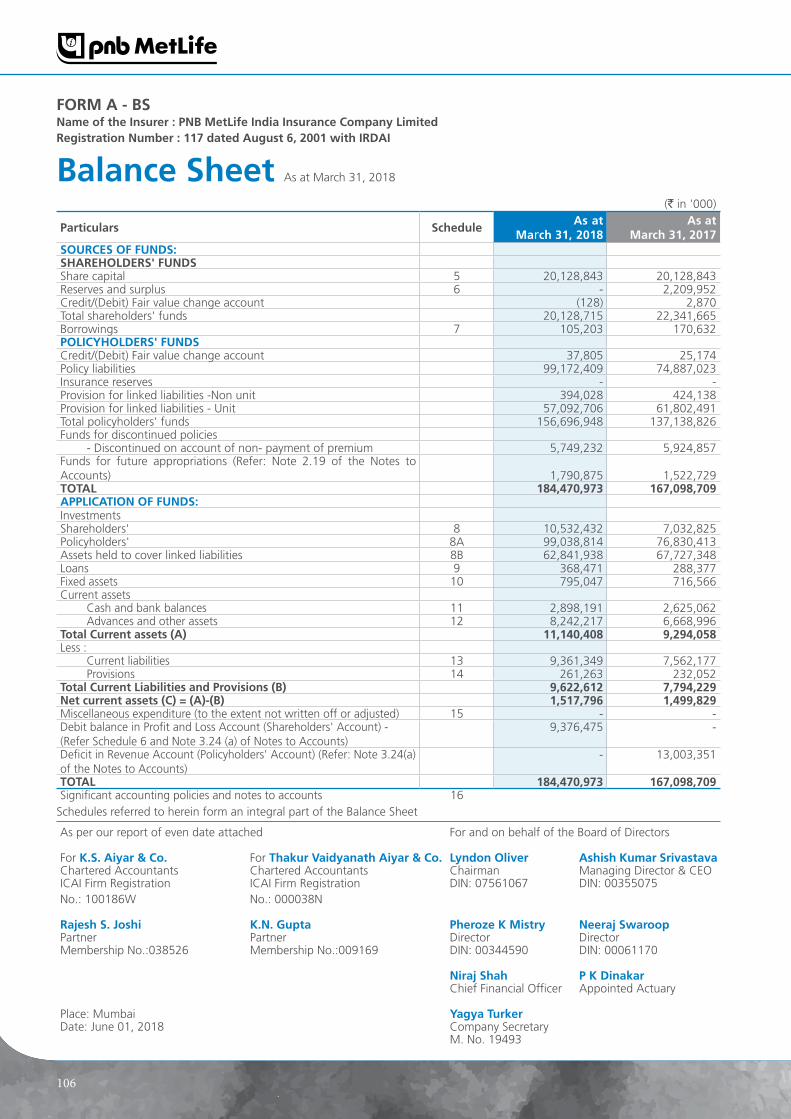
106
(` in '000)
particulars ScheduleAs at
March 31, 2018 As at
March 31, 2017 SOuRceS OF FundS:ShARehOldeRS' FundSShare capital 5 20,128,843 20,128,843 Reserves and surplus 6 - 2,209,952 Credit/(Debit) Fair value change account (128) 2,870 Total shareholders' funds 20,128,715 22,341,665 Borrowings 7 105,203 170,632 pOlIcyhOldeRS' FundSCredit/(Debit) Fair value change account 37,805 25,174 Policy liabilities 99,172,409 74,887,023 Insurance reserves - - Provision for linked liabilities -Non unit 394,028 424,138 Provision for linked liabilities - Unit 57,092,706 61,802,491 Total policyholders' funds 156,696,948 137,138,826 Funds for discontinued policies
- Discontinued on account of non- payment of premium 5,749,232 5,924,857 Funds for future appropriations (Refer: Note 2.19 of the Notes to Accounts) 1,790,875 1,522,729 TOTAl 184,470,973 167,098,709ApplIcATIOn OF FundS:InvestmentsShareholders' 8 10,532,432 7,032,825 Policyholders' 8A 99,038,814 76,830,413 Assets held to cover linked liabilities 8B 62,841,938 67,727,348 Loans 9 368,471 288,377 Fixed assets 10 795,047 716,566 Current assets
Cash and bank balances 11 2,898,191 2,625,062 Advances and other assets 12 8,242,217 6,668,996
Total current assets (A) 11,140,408 9,294,058 Less :
Current liabilities 13 9,361,349 7,562,177 Provisions 14 261,263 232,052
Total current liabilities and provisions (b) 9,622,612 7,794,229 net current assets (c) = (A)-(b) 1,517,796 1,499,829 Miscellaneous expenditure (to the extent not written off or adjusted) 15 - - Debit balance in Profit and Loss Account (Shareholders' Account) - (Refer Schedule 6 and Note 3.24 (a) of Notes to Accounts)
9,376,475 -
Deficit in Revenue Account (Policyholders' Account) (Refer: Note 3.24(a) of the Notes to Accounts)
- 13,003,351
TOTAl 184,470,973 167,098,709 Significant accounting policies and notes to accounts 16
Schedules referred to herein form an integral part of the Balance Sheet
balance Sheet As at March 31, 2018
As per our report of even date attached For and on behalf of the Board of Directors
For K.S. Aiyar & co. For Thakur Vaidyanath Aiyar & co. lyndon Oliver Ashish Kumar SrivastavaChartered Accountants Chartered Accountants Chairman Managing Director & CEOICAI Firm Registration No.: 100186W
ICAI Firm RegistrationNo.: 000038N
DIN: 07561067 DIN: 00355075
Rajesh S. Joshi K.n. gupta pheroze K Mistry neeraj SwaroopPartner Partner Director DirectorMembership No.:038526 Membership No.:009169 DIN: 00344590 DIN: 00061170
niraj Shah p K dinakarChief Financial Officer Appointed Actuary
Place: Mumbai yagya TurkerDate: June 01, 2018 Company Secretary
M. No. 19493
FORM A - bSname of the Insurer : pnb Metlife India Insurance company limitedRegistration number : 117 dated August 6, 2001 with IRdAI

Financial StatementsStatutory ReportsCorporate Overview
107
policyholders' Account (Technical Account) (` in '000)particulars Schedule March 31, 2018 March 31, 2017
Premiums earned - net
(a) Premium 1 39,535,108 32,360,801
(b) Reinsurance ceded (929,955) (971,742)
(c) Reinsurance accepted - -
38,605,153 31,389,059
Income from Investments
(a) Interest, dividends and rent - net of accretion/amortisation of discount/ premium 9,580,866 8,108,623
(b) Profit on sale/redemption of investments 7,582,879 5,675,410
(c) (Loss) on sale/ redemption of investments (815,765) (513,220)
(d) Transfer/gain on revaluation/change in fair value * (2,871,673) 1,935,283
Other Income
(a) Interest on policy loans 34,359 28,756
(b) Miscellaneous income 185,430 143,683
Contribution from the Shareholders' Account (Refer :Note 3.24 of the Notes to Accounts) 484,308 -
Total (A) 52,785,557 46,767,594
Commission 2 2,154,760 1,796,521
Operating expenses related to Insurance business 3 8,148,395 7,466,339
Service tax /Goods and Services tax on charges 385,921 358,458
Provision for doubtful debts - -
Bad debts written off - -
Provision for Income Tax (Refer: Note 3.9 of the Notes to Accounts) - -
Provisions (other than taxation) - -
(a) For diminution in the value of investments (Net) - -
(b) Advances & Recoveries (4,690) 48,463
Total (b) 10,684,386 9,669,781
Benefits paid (net) 4 21,084,349 17,690,827
Interim & Other bonuses paid 25,930 16,813
Change in valuation of liability in respect of life policies
(a) Gross** 21,758,555 20,253,402
(b) Amount ceded in reinsurance (2,388,689) (1,269,189)
(c) Amount accepted in reinsurance - -
Total (c) 40,480,145 36,691,853
Surplus/(deficit) (d) = (A) - (b) - (c) 1,621,026 405,960
Revenue Account For the year ended March 31, 2018
FORM A - RAname of the Insurer : pnb Metlife India Insurance company limitedRegistration number : 117 dated August 6, 2001 with IRdAI
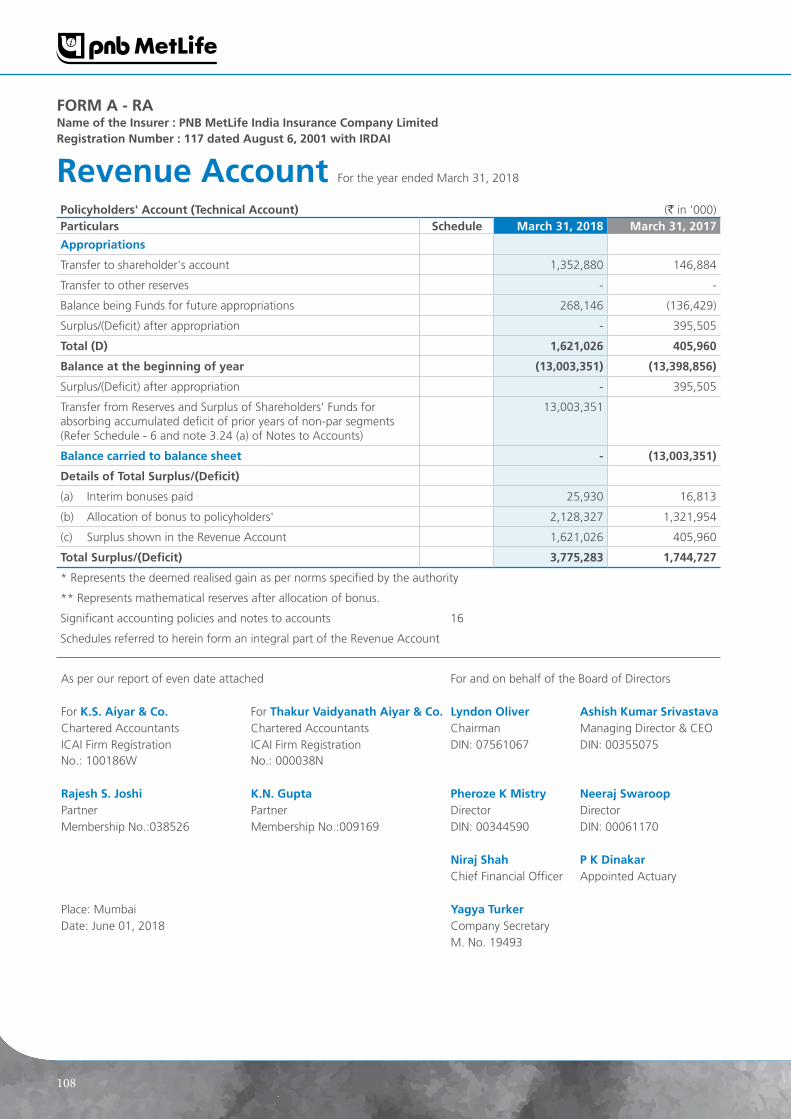
108
policyholders' Account (Technical Account) (` in '000)particulars Schedule March 31, 2018 March 31, 2017
Appropriations
Transfer to shareholder's account 1,352,880 146,884
Transfer to other reserves - -
Balance being Funds for future appropriations 268,146 (136,429)
Surplus/(Deficit) after appropriation - 395,505
Total (d) 1,621,026 405,960
balance at the beginning of year (13,003,351) (13,398,856)
Surplus/(Deficit) after appropriation - 395,505
Transfer from Reserves and Surplus of Shareholders' Funds for absorbing accumulated deficit of prior years of non-par segments (Refer Schedule - 6 and note 3.24 (a) of Notes to Accounts)
13,003,351
balance carried to balance sheet - (13,003,351)
details of Total Surplus/(deficit)
(a) Interim bonuses paid 25,930 16,813
(b) Allocation of bonus to policyholders' 2,128,327 1,321,954
(c) Surplus shown in the Revenue Account 1,621,026 405,960
Total Surplus/(deficit) 3,775,283 1,744,727
* Represents the deemed realised gain as per norms specified by the authority
** Represents mathematical reserves after allocation of bonus.
Significant accounting policies and notes to accounts 16
Schedules referred to herein form an integral part of the Revenue Account
As per our report of even date attached For and on behalf of the Board of Directors
For K.S. Aiyar & co. For Thakur Vaidyanath Aiyar & co. lyndon Oliver Ashish Kumar SrivastavaChartered Accountants Chartered Accountants Chairman Managing Director & CEOICAI Firm Registration No.: 100186W
ICAI Firm RegistrationNo.: 000038N
DIN: 07561067 DIN: 00355075
Rajesh S. Joshi K.n. gupta pheroze K Mistry neeraj SwaroopPartner Partner Director DirectorMembership No.:038526 Membership No.:009169 DIN: 00344590 DIN: 00061170
niraj Shah p K dinakarChief Financial Officer Appointed Actuary
Place: Mumbai yagya TurkerDate: June 01, 2018 Company Secretary
M. No. 19493
Revenue Account For the year ended March 31, 2018
FORM A - RAname of the Insurer : pnb Metlife India Insurance company limitedRegistration number : 117 dated August 6, 2001 with IRdAI

Financial StatementsStatutory ReportsCorporate Overview
109
Shareholders' Account (non-technical Account) (` in '000)particulars Schedule March 31, 2018 March 31, 2017 Amount transferred from the Policyholders' Account (Technical Account) 1,352,880 146,884
Income from Investments(a) Interest, dividends and rent - net of accretion/amortisation of
discount/ premium) 645,983 566,901(b) Profit on sale/redemption of investments - -(c) Loss on sale/redemption of investments - -Total 645,983 566,901Other income - -Total Income (A) 1,998,863 713,785
Expenses other than those directly related to the insurance business 3A 97,631 75,075Bad debts written off - -Transfer to Policyholders' fund - -Provisions (other than taxation)(a) For diminution in the value of investments - -(b) Provision for doubtful debts - -(c) Others - -Contribution to the Policyholder's Account 484,308 -Total (b) 581,939 75,075
profit / (loss) before tax 1,416,924 638,710
Provision for taxation (Refer: Note 3.9 of the Notes to Accounts) - -
profit / (loss) after tax 1,416,924 638,710
Appropriations(a) Balance at beginning of the year 2,209,952 1,571,242(b) Interim dividends paid during the year - -(c) Proposed final dividend - -(d) Dividend distribution tax - -
profit / (loss) carried forward to balance sheet 3,626,876 2,209,952earning / (loss) per Share (basic) 0.70 0.32earning / (loss) per Share (diluted) 0.70 0.32Significant accounting policies and notes to accounts 16Schedules referred to herein form an integral part of the Profit & Loss Account
profit and loss Account For the year ended March 31, 2018
As per our report of even date attached For and on behalf of the Board of Directors
For K.S. Aiyar & co. For Thakur Vaidyanath Aiyar & co. lyndon Oliver Ashish Kumar SrivastavaChartered Accountants Chartered Accountants Chairman Managing Director & CEOICAI Firm Registration No.: 100186W
ICAI Firm RegistrationNo.: 000038N
DIN: 07561067 DIN: 00355075
Rajesh S. Joshi K.n. gupta pheroze K Mistry neeraj SwaroopPartner Partner Director DirectorMembership No.:038526 Membership No.:009169 DIN: 00344590 DIN: 00061170
niraj Shah p K dinakarChief Financial Officer Appointed Actuary
Place: Mumbai yagya TurkerDate: June 01, 2018 Company Secretary
M. No. 19493
FORM A - plname of the Insurer : pnb Metlife India Insurance company limitedRegistration number : 117 dated August 6, 2001 with IRdAI

110
(` in '000)particulars Schedule March 31, 2018 March 31, 2017 cash Flows from the Operating Activities:Premium received from policyholders, including advance receipts 40,150,438 33,678,690 Other receipts 219,646 196,088 Payments to the re-insurers, net of commissions and claims/ benefits (122,820) (162,205)Payments of claims/benefits (21,427,895) (18,624,135)Payments of commission and brokerage (2,088,727) (1,753,271)Payments of other operating expenses (7,917,529) (9,767,255)Preliminary and pre-operative expenses - - Deposits, advances and staff loans (49,351) (25,928)Income taxes paid (Net) - - Service tax/Goods Services Tax paid (1,282,786) (1,232,226)Other payments - - Cash flows before extraordinary items 7,480,976 2,309,758 Cash flow from extraordinary operations - - net cash flow from operating activities (A) 7,480,976 2,309,758 cash flows from Investing Activities:Purchase of fixed assets (247,796) (199,839)Proceeds from sale of fixed assets 2,019 22,539 Purchase of Investements (77,008,195) (68,208,909)Loans disbursed (85,125) (45,876)Loans against policies - - Sales/ Maturity of investments 59,334,522 53,625,202 Repayments received - - Rents/Interests/ Dividends received 9,460,805 8,024,838 Investments in money market instruments and in liquid mutual funds (Net)
1,335,923 4,872,482
Expenses related to investments - - net cash flow from investing activities (b) (7,207,847) (1,909,563)cash flows from Financing Activities:Proceeds from issuance of share capital - - Proceeds from borrowing - - Repayments of borrowing - - Interest/dividends paid - - net cash flow from financing activities (c) - - Effect of foreign exchange rates on cash and cash equivalents, net - - net increase/(decrease) in cash and cash equivalents: (A+b+c) 11 273,129 400,195 cash and cash equivalents at the beginning of the year 11 2,625,062 2,224,867 cash and cash equivalents at the end of the year 2,898,191 2,625,062
Schedules referred to above form an integral part of the Balance Sheet
Receipts and payments Account For the year ended March 31, 2018
As per our report of even date attached For and on behalf of the Board of Directors
For K.S. Aiyar & co. For Thakur Vaidyanath Aiyar & co. lyndon Oliver Ashish Kumar SrivastavaChartered Accountants Chartered Accountants Chairman Managing Director & CEOICAI Firm Registration No.: 100186W
ICAI Firm RegistrationNo.: 000038N
DIN: 07561067 DIN: 00355075
Rajesh S. Joshi K.n. gupta pheroze K Mistry neeraj SwaroopPartner Partner Director DirectorMembership No.:038526 Membership No.:009169 DIN: 00344590 DIN: 00061170
niraj Shah p K dinakarChief Financial Officer Appointed Actuary
Place: Mumbai yagya TurkerDate: June 01, 2018 Company Secretary
M. No. 19493
name of the Insurer : pnb Metlife India Insurance company limitedRegistration number : 117 dated August 6, 2001 with IRdAI

Financial StatementsStatutory ReportsCorporate Overview
111
Schedule 1 - pReMIuMS
(` in '000)particulars March 31, 2018 March 31, 2017 First year Premiums 12,611,007 10,658,166 Renewal Premiums 25,264,302 20,872,955 Single Premiums 1,659,799 829,680 Total premiums 39,535,108 32,360,801
premiums Income from business written:In India 39,535,108 32,360,801 Outside India - - Total premiums 39,535,108 32,360,801
Schedule 2 - cOMMISSIOn expenSeS
(` in '000)particulars March 31, 2018 March 31, 2017 CommissionDirect - First year Premiums 1,543,092 1,388,999- Renewal Premiums 550,296 404,746- Single Premiums 61,372 2,776gross commission 2,154,760 1,796,521Add: Commission on re-insurance accepted - -Less: Commission on re-insurance ceded - -net commission 2,154,760 1,796,521
break-up of gross commission expenses/ Referral feesAgents 224,474 210,910Brokers 37,866 17,456Corporate agency 1,892,527 1,577,861Referral (107) (226)Others (Direct Sales) - (9,480)Total 2,154,760 1,796,521
Note: Commission expenditure is net of recovery on account of "customer default charges", if any.
Schedule 3 - OpeRATIng expenSeS RelATed TO InSuRAnce buSIneSS
(` in '000)particulars March 31, 2018 March 31, 2017 Employees' remuneration and welfare benefits 5,410,699 4,704,224Travel, conveyance and vehicle running expenses 123,882 103,906Training expenses 39,074 17,419Rents, rates and taxes 427,552 418,902Repairs 58,283 47,967Printing and stationery 39,885 40,758Communication expenses 148,074 156,143Legal & professional charges 99,725 114,893Medical fees 54,691 49,785Auditors' fees, expenses, etc.
(a) as auditor 6,000 4,600(b) other services 134 -(c) out of pocket expenses 1,205 848
Advertisement and publicity 229,188 218,878Business Development,Sales promotion & Sales conference 744,609 858,434

112
(` in '000)particulars March 31, 2018 March 31, 2017 Interest and bank charges 73,400 59,191Recruitment expenses 70,561 47,738Information technology expenses 238,339 273,223Office expenses 125,252 115,563Others 36,736 18,113Depreciation 226,225 220,007Excess of expenses of management (EOM) transferred to Profit and Loss Account-(Refer: Note 3.33 of the Notes to Accounts) (5,119) (4,253)Total 8,148,395 7,466,339
Schedule 3A - expenSeS OTheR ThAn ThOSe dIRecTly RelATed TO The InSuRAnce buSIneSS
(` in '000)particulars March 31, 2018 March 31, 2017 Employees' remuneration and welfare benefits 28,361 25,095Travel, conveyance and vehicle running expenses 26 2Training expenses 21 1Rents, rates and taxes - -Repairs - -Printing and stationery - 1Communication expenses 5 5Legal and professional charges 557 428Medical fees - -Auditors' Fees, expenses, etc.
(a) as auditor - -(b) other services - -(c) out of pocket expenses - -
Advertisement and publicity - -Business Development, Sales promotion & Sales conference - -Interest and bank charges 350 284Recruitment expenses 1 -Information technology expenses - -Office expenses - -Others 54,480 31,691Depreciation - -Corporate Social Responsibility 8,711 13,315Excess of expenses of management (EOM) transferred from revenue account-(Refer: Note 3.33 of the Notes to Accounts) 5,119 4,253Total 97,631 75,075
Schedule 4 - beneFITS pAId (neT)
(` in '000)particulars March 31, 2018 March 31, 2017 1. Insurance claims(a) Claims by death 3,168,596 3,470,445 (b) Claims by maturity 801,321 890,259 (c) Annuities/ Pension payment 201,838 235,604 (d) Other benefits -
(i) Surrenders 16,258,559 13,213,633 (ii) Periodical benefit 1,344,666 618,959 (iii) Health 60,498 48,411 (iv) Others (Interest on unclaimed amount of policyholders) 116,523 73,710

Financial StatementsStatutory ReportsCorporate Overview
113
(` in '000)particulars March 31, 2018 March 31, 2017 2. (Amount ceded in reinsurance)(a) Claims by death (834,942) (822,486)(b) Claims by maturity - - (c) Annuities/ Pension payment - - (d) Other benefits -
(i) Surrenders - - (ii) Periodical benefit - - (iii) Health (32,710) (37,708)
3. Amount accepted in reinsurance(a) Claims by death - - (b) Claims by maturity - - (c) Annuities/ Pension payment - - (d) Other benefits -
(i) Surrenders - - (ii) Periodical benefit - - (iii) Health - -
Total 21,084,349 17,690,827
Schedule 5 - ShARe cApITAl
(` in '000)
particulars As at
March 31, 2018 As at
March 31, 2017Authorised capital 30,000,000 30,000,000 3,000,000,000 (Previous year - 3,000,000,000) equity shares of `10/- each
Issued capital 20,128,843 20,128,843 2,012,884,283 (Previous year - 2,012,884,283) equity shares of `10/- each
Subscribed, called-up and paid up capital 20,128,843 20,128,843 2,012,884,283 (Previous year - 2,012,884,283) equity shares of `10/- each fully paid up
TOTAl 20,128,843 20,128,843
Note: No part of the capital is held by a holding company.
Schedule 5A - pATTeRn OF ShARehOldIng (AS ceRTIFIed by MAnAgeMenT)
particulars As at March 31, 2018 As at March 31, 2017
number of shares
% of holdingnumber of
shares% of holding
Promoters
Indian 1,489,534,370 74% 1,489,534,370 74%Foreign 523,349,913 26% 523,349,913 26%
TOTAl 2,012,884,283 100% 2,012,884,283 100%

114
Schedule 6 - ReSeRVeS And SuRpluS
(` in '000)
particulars As at
March 31, 2018 As at
March 31, 2017
Capital Reserve - -
Capital Redemption Reserve - -
Share Premium - -
Revaluation Reserve - -
General Reserves - -
Less: Debit balance in Profit and Loss Account - -
Less: Amount utilized for Buy-back - -
Catastrophe Reserve - -
Other Reserves - -
Balance of profit in Profit and Loss Account - 2,209,952
Opening balance 2,209,952 - -
Add: Profit for the year 1,416,924 - -
Total 3,626,876 - -
Less: Transfer to Revenue Account (Policyholders' Account) for absorbing accumulated deficit of prior years of non-par segments (refer Note 3.24 (a) of Notes to Accounts) (13,003,351) - -
Net balance in Profit and Loss Account* (9,376,475) - -
TOTAl - 2,209,952
* Negative balance in Reserves and Surplus is shown as Debit balance in Profit and Loss account(Shareholder's Account) in Balance sheet
Schedule 7 - bORROwIngS
(` in '000)
particulars As at
March 31, 2018 As at
March 31, 2017
Debentures/Bonds - -
Banks - -
Financial Institutions - -
Others 105,203 170,632
For Information technology equipments and software [Borrowing for information technology equipments is secured against said assets. Net book value as at March 31, 2018 of these equipments is `97,854 (As at March 31, 2017- `130,472)]
TOTAl 105,203 170,632
Note: Amount due within 12 months from balance sheet date is ` 42,989 (Previous year `51,704)

Financial StatementsStatutory ReportsCorporate Overview
115
Schedule 8 - InVeSTMenTS - ShARehOldeRS'
(` in '000)
particulars As at
March 31, 2018 As at
March 31, 2017
lOng TeRM InVeSTMenTS
Government securities and Government guaranteed bonds including Treasury bills 5,956,577 3,093,390
Other approved securities 404,773 405,418
Other Investments
(a) Shares
(aa) Equity 13,350 16,348
(bb) Preference - -
(b) Mutual funds - -
(c) Derivative instruments - -
(d) Debentures/Bonds 1,092,466 1,037,368
(e) Other securities - -
(f) Subsidiaries - -
Investment properties - Real estate - -
Investments in Infrastructure and Social Sector - Debt Securities (including Housing) 1,404,599 1,184,881
Other than Approved investments 249,804 -
Total 9,121,569 5,737,405
ShORT TeRM InVeSTMenTS
Government securities and Government guaranteed bonds including Treasury bills 717,361 765,815
Other Approved Securities - -
Other Investments
(a) Shares
(aa) Equity - -
(bb) Preference - -
(b) Mutual funds - -
(c) Derivative instruments - -
(d) Debentures/Bonds 90,020 110,013
(e) Other securities - CP/CBLO/Bank Deposits 167,660 71,115
(f) Subsidiaries - -
Investment properties - Real Estate - -
Investments in Infrastructure and Social Sector - Debt Securities (including Housing) 385,822 348,477
Other than Approved Investments - -
- Debentures/ Bonds 50,000 -
- Mutual Funds - -
Total 1,410,863 1,295,420
grand total 10,532,432 7,032,825
note
The market value of the above total investment is `10,620,436 (As at March 31, 2017 - `7,301,673)

116
Schedule 8A - InVeSTMenTS - pOlIcyhOldeRS'
(` in '000)
particulars As at
March 31, 2018 As at
March 31, 2017
lOng TeRM InVeSTMenTS
Government securities and Government guaranteed bonds including Treasury bills 52,154,659 41,461,662
Other Approved Securities 69,466 69,189
Other Investments
(a) Shares
(aa) Equity 2,301,105 385,428
(bb) Preference - -
(b) Mutual funds - -
(c) Derivative instruments - -
(d) Debentures/Bonds 16,882,852 11,382,813
(e) Other Securities - -
(f) Subsidiaries - -
(g) Investment Properties - Real Estate - -
Investments in infrastructure and social sector - Debt Securities (including Housing) 22,972,083 19,750,143
Other than approved investments - -
- Equity 15,912 -
- Debt 500,000 49,241
Total 94,896,077 73,098,476
ShORT TeRM InVeSTMenTS
Government securities and Government guaranteed bonds including Treasury bills 103,967 708,872
Other Approved Securities - -
Other Investments - -
(a) Shares - -
(aa) Equity - -
(bb) Preference - -
(b) Mutual funds - -
(c) Derivative instruments - -
(d) Debentures/Bonds 2,160,078 1,600,970
(e) Other Securities - CP/Bank Deposits/CBLO 482,749 1,128,983
(f) Subsidiaries - -
(g) Investment Properties - Real Estate - -
Investments in Infrastructure and Social Sector - Debt Securities (including Housing) 1,346,153 293,112
Other than approved investments-Debenture / Bonds 49,790
Total 4,142,737 3,731,937
grand total 99,038,814 76,830,413
note
The market value of the above total investment is ` 101,232,207 (As at March 31, 2017 - ` 81,741,131)

Financial StatementsStatutory ReportsCorporate Overview
117
Schedule 8b - ASSeTS held TO cOVeR lInKed lIAbIlITIeS
(` in '000)
particulars As at
March 31, 2018 As at
March 31, 2017lOng TeRM InVeSTMenTS
Government securities and Government guaranteed bonds including Treasury bills 5,568,596 6,421,007
Other Approved Securities 8,333 8,515
Other Investments -
(a) Shares -
(aa) Equity 30,734,028 36,217,394
(bb) Preference - -
(b) Mutual Funds - -
(c) Derivative Instruments - -
(d) Debentures/Bonds 3,349,681 2,831,227
(e) Other Securities - -
(f) Subsidiaries - -
(g) Investment Properties - Real estate - -
Investments in Infrastructure and Social Sector -
- Debt Securities (including Housing) 7,480,959 6,575,475
- Equities 2,069,438 2,700,338
Other than Approved Investments -
(a) Equity 592,656 1,435,436
(b) Mutual Fund (ETF) 3,121,769 -
(c) Bonds/Debentures - -
Total 52,925,460 56,189,392
ShORT TeRM InVeSTMenTS
Government securities and Government guaranteed bonds including Treasury bills 5,621,826 5,890,854
Other Approved Securities - -
Other Investments -
(a) Shares -
(aa) Equity - -
(bb) Preference - -
(b) Mutual funds - -
(c) Derivative instruments - -
(d) Debentures/Bonds 554,475 201,465
(e) Other securities - -
(f) Subsidiaries - -
(g) Fixed deposits - -
(h) Other securities - CP/CBLO/Bank Deposits 2,565,630 2,473,325
(i) Investment properties - Real Estate - -
Investments in Infrastructure and Social Sector - Debt Securities (including Housing) 152,532 627,934
Other than Approved Investments -
(a) Mutual funds - 1,076,424
(b) Debentures/Bonds - -
Total 8,894,463 10,270,002
Other net current assets 1,022,015 1,267,954
grand total 62,841,938 67,727,348

118
Schedule 9 - lOAnS
(` in '000)
particulars As at
March 31, 2018 As at
March 31, 2017
SecuRITy-wISe clASSIFIcATIOn
Secured
(a) On mortgage of property
(aa) In India - -
(bb) Outside India - -
(b) On Shares, Bonds, Government securities etc. - -
(c) Loans against policies 368,471 288,377
(d) Others - -
Unsecured - -
Total 368,471 288,377
bORROweR-wISe clASSIFIcATIOn
(a) Central and State Governments - -
(b) Banks and Financial Institutions - -
(c) Subsidiaries - -
(d) Companies - -
(e) Loans against policies 368,471 288,377
(f) Others - -
Total 368,471 288,377
peRFORMAnce-wISe clASSIFIcATIOn
(a) Loans classified as standard
(aa) In India 368,471 288,377
(bb) Outside India - -
(a) Non-standard loans less provisions
(aa) In India - -
(bb) Outside India - -
Total 368,471 288,377
MATuRITy-wISe clASSIFIcATIOn
(a) Short-Term 29,268 7,389
(b) Long-Term 339,203 280,988
TOTAl 368,471 288,377
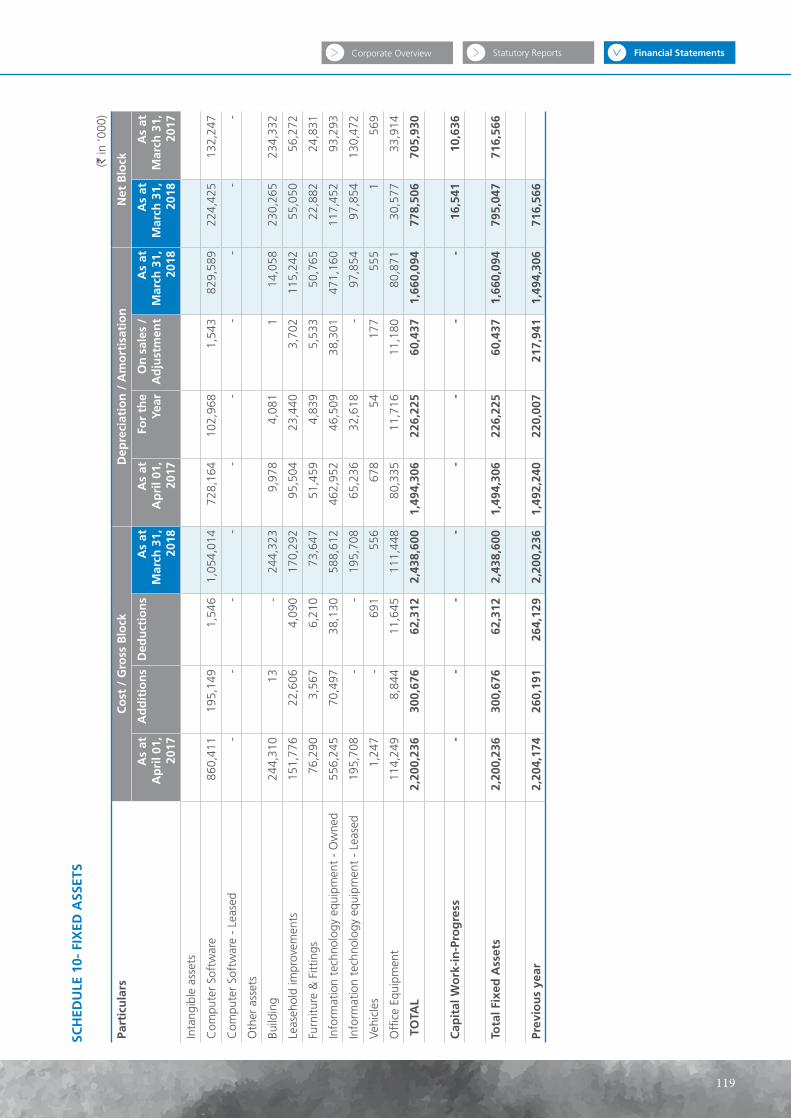
Financial StatementsStatutory ReportsCorporate Overview
119
Sch
edu
le 1
0- F
Ixed
ASS
eTS
(` in
'000
)
part
icu
lars
co
st /
gro
ss b
lock
dep
reci
atio
n /
Am
ort
isat
ion
net
blo
ck
As
at
Ap
ril 0
1,
2017
Ad
dit
ion
sd
edu
ctio
ns
As
at
Mar
ch 3
1,
2018
As
at
Ap
ril 0
1,
2017
For
the
year
On
sal
es /
A
dju
stm
ent
As
at
Mar
ch 3
1,
2018
As
at
Mar
ch 3
1,
2018
As
at
Mar
ch 3
1,
2017
Inta
ngib
le a
sset
s
Com
pute
r So
ftw
are
860,
411
195,
149
1,54
61,
054,
014
728,
164
102,
968
1,54
382
9,58
922
4,42
513
2,24
7
Com
pute
r So
ftw
are
- Le
ased
--
--
--
--
--
Oth
er a
sset
s
Build
ing
244,
310
13-
244,
323
9,97
84,
081
114
,058
230,
265
234,
332
Leas
ehol
d im
prov
emen
ts15
1,77
622
,606
4,09
017
0,29
295
,504
23,4
403,
702
115,
242
55,0
5056
,272
Furn
iture
& F
ittin
gs76
,290
3,56
76,
210
73,6
4751
,459
4,83
95,
533
50,7
6522
,882
24,8
31
Info
rmat
ion
tech
nolo
gy e
quip
men
t -
Ow
ned
556,
245
70,4
9738
,130
588,
612
462,
952
46,5
0938
,301
471,
160
117,
452
93,2
93
Info
rmat
ion
tech
nolo
gy e
quip
men
t -
Leas
ed19
5,70
8-
-19
5,70
865
,236
32,6
18-
97,8
5497
,854
130,
472
Vehi
cles
1,24
7-
691
556
678
5417
755
51
569
Off
ice
Equi
pmen
t11
4,24
98,
844
11,6
4511
1,44
880
,335
11,7
1611
,180
80,8
7130
,577
33,9
14
TO
TAl
2,20
0,23
630
0,67
662
,312
2,43
8,60
01,
494,
306
226,
225
60,4
371,
660,
094
778,
506
705,
930
cap
ital
wo
rk-i
n-p
rog
ress
--
--
--
--
16,5
4110
,636
Tota
l Fix
ed A
sset
s2,
200,
236
300,
676
62,3
122,
438,
600
1,49
4,30
622
6,22
560
,437
1,66
0,09
479
5,04
771
6,56
6
prev
iou
s ye
ar2,
204,
174
260,
191
264,
129
2,20
0,23
61,
492,
240
220,
007
217,
941
1,49
4,30
671
6,56
6
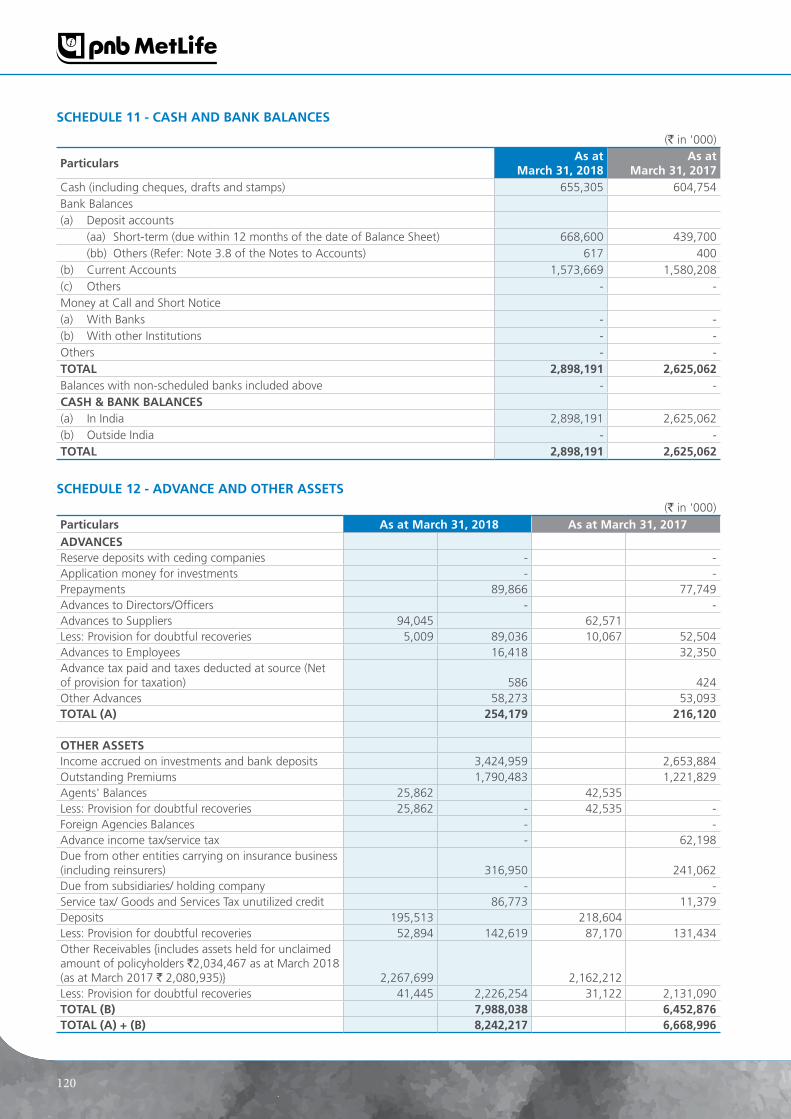
120
Schedule 11 - cASh And bAnK bAlAnceS
(` in '000)
particulars As at
March 31, 2018 As at
March 31, 2017Cash (including cheques, drafts and stamps) 655,305 604,754Bank Balances(a) Deposit accounts (aa) Short-term (due within 12 months of the date of Balance Sheet) 668,600 439,700 (bb) Others (Refer: Note 3.8 of the Notes to Accounts) 617 400(b) Current Accounts 1,573,669 1,580,208(c) Others - -Money at Call and Short Notice(a) With Banks - -(b) With other Institutions - -Others - -TOTAl 2,898,191 2,625,062Balances with non-scheduled banks included above - -cASh & bAnK bAlAnceS(a) In India 2,898,191 2,625,062(b) Outside India - -TOTAl 2,898,191 2,625,062
Schedule 12 - AdVAnce And OTheR ASSeTS(` in '000)
particulars As at March 31, 2018 As at March 31, 2017AdVAnceSReserve deposits with ceding companies - -Application money for investments - -Prepayments 89,866 77,749Advances to Directors/Officers - -Advances to Suppliers 94,045 62,571Less: Provision for doubtful recoveries 5,009 89,036 10,067 52,504Advances to Employees 16,418 32,350Advance tax paid and taxes deducted at source (Net of provision for taxation) 586 424Other Advances 58,273 53,093TOTAl (A) 254,179 216,120
OTheR ASSeTSIncome accrued on investments and bank deposits 3,424,959 2,653,884Outstanding Premiums 1,790,483 1,221,829Agents' Balances 25,862 42,535Less: Provision for doubtful recoveries 25,862 - 42,535 -Foreign Agencies Balances - -Advance income tax/service tax - 62,198Due from other entities carrying on insurance business (including reinsurers) 316,950 241,062Due from subsidiaries/ holding company - -Service tax/ Goods and Services Tax unutilized credit 86,773 11,379Deposits 195,513 218,604Less: Provision for doubtful recoveries 52,894 142,619 87,170 131,434Other Receivables {includes assets held for unclaimed amount of policyholders `2,034,467 as at March 2018 (as at March 2017 ` 2,080,935)} 2,267,699 2,162,212Less: Provision for doubtful recoveries 41,445 2,226,254 31,122 2,131,090TOTAl (b) 7,988,038 6,452,876TOTAl (A) + (b) 8,242,217 6,668,996
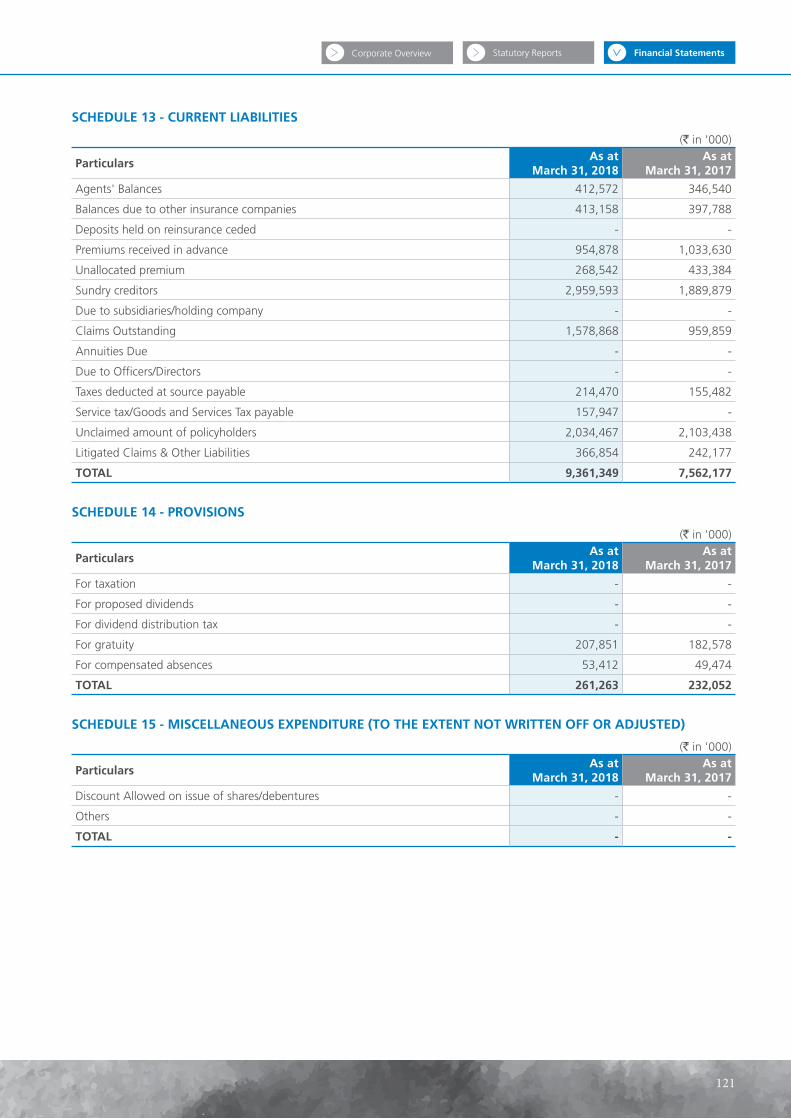
Financial StatementsStatutory ReportsCorporate Overview
121
Schedule 13 - cuRRenT lIAbIlITIeS
(` in '000)
particulars As at
March 31, 2018 As at
March 31, 2017
Agents' Balances 412,572 346,540
Balances due to other insurance companies 413,158 397,788
Deposits held on reinsurance ceded - -
Premiums received in advance 954,878 1,033,630
Unallocated premium 268,542 433,384
Sundry creditors 2,959,593 1,889,879
Due to subsidiaries/holding company - -
Claims Outstanding 1,578,868 959,859
Annuities Due - -
Due to Officers/Directors - -
Taxes deducted at source payable 214,470 155,482
Service tax/Goods and Services Tax payable 157,947 -
Unclaimed amount of policyholders 2,034,467 2,103,438
Litigated Claims & Other Liabilities 366,854 242,177
TOTAl 9,361,349 7,562,177
Schedule 14 - pROVISIOnS
(` in '000)
particulars As at
March 31, 2018 As at
March 31, 2017
For taxation - -
For proposed dividends - -
For dividend distribution tax - -
For gratuity 207,851 182,578
For compensated absences 53,412 49,474
TOTAl 261,263 232,052
Schedule 15 - MIScellAneOuS expendITuRe (TO The exTenT nOT wRITTen OFF OR AdJuSTed)
(` in '000)
particulars As at
March 31, 2018 As at
March 31, 2017
Discount Allowed on issue of shares/debentures - -
Others - -
TOTAl - -

122
Schedule – 16 SIgnIFIcAnT AccOunTIng pOlIcIeS And nOTeS TO AccOunTS
1. corporate Information
PNB MetLife India Insurance Company Limited (‘the Company’) was incorporated in India on April 11, 2001 as a Private Limited Company and was converted into a Public Limited Company effective from January 9, 2008 under the Companies Act, 1956. On August 6, 2001, the Company obtained the certificate of registration to engage in the business of life insurance from the Insurance Regulatory and Development Authority of India (‘IRDAI’). The certificate of registration continues to be in force as at March 31, 2018.
The Company offers life insurance, pension, health, retirement and investment products to individual and group segments. The products sold under these business segments comprise participating, non-participating, pension, health and unit linked products. Some of these products have riders attached to them such as Accident and Disability Benefit, Waiver of Premium, Level Term and Critical Illness.
2. SIgnIFIcAnT AccOunTIng pOlIcIeS
2.1 basis of preparation
The accompanying financial statements have been prepared under the historical cost convention and on the accrual basis of accounting in accordance with the Generally Accepted Accounting Principles in India (Indian GAAP) in compliance with the applicable accounting standards as specified under section 133 of the Companies Act, 2013 (the 2013 Act) read with the Rule 7 of the Companies (Accounts) Rules 2014 and as prescribed by the Insurance Regulatory and Development Authority (Preparation of Financial Statements and Auditor’s Report of Insurance Companies) Regulations, 2002 (‘the IRDAI Financial Statements Regulations’), provisions of the Insurance Regulatory and Development Authority Act, 1999, the Insurance Act, 1938, the Insurance Laws (Amendment) Act 2015, to the extent applicable and the relevant provisions of the Companies Act, 2013.
2.2 use of estimates
The preparation of the financial statements in conformity with Indian GAAP requires that the Company’s management make estimates and assumptions that affect the reported amount of income and expense for the year, reported balances of assets and liabilities and disclosures related to contingent liabilities and contingent assets as at the date of the financial statements. Examples of such estimates include valuation of policy liabilities, provisions for doubtful debts, valuation of unlisted securities, if any, future obligations under employee retirement benefits plans and useful lives of fixed assets, etc. The estimates and assumptions used in the accompanying financial statements are based upon management’s evaluation of
the relevant facts and circumstances as at the date of the financial statements. Management believes that the estimates used in preparation of the financial statements are prudent and reasonable. Actual results may differ from the estimates and assumptions used in preparing the financial statements. Any differences of actual to such estimates are recognised in the year in which the results are known or materialised.
2.3 Revenue recognition
premium:
New business premium in respect of non-linked policies including rider premium is recognised on acceptance of risk. For all the policies which are in force as at the Balance Sheet date, subsequent premium of the first year and renewal premium are recognised as income when due. In respect of linked policies, premium income including rider premium is recognised when the associated units are allotted.
Premium on lapsed policies are recognised as income when such policies are reinstated. Top up premiums are considered as single premium.
Income from unit linked policies:
Income from unit linked policies, which includes fund management charges, policy administration charges, mortality charges, etc., are recovered from the unit linked funds in accordance with the terms and conditions of policies issued and are recognized when due.
Income earned on Investments:
Interest income is recognized on an accrual basis for all funds.
Amortization of premium or accretion of discount at the time of purchase of debt securities is recognized over the remaining period of maturity on a straight line basis.
Dividend income is accounted for on “ex-dividend” date in case of listed equity and preference shares and in case of unlisted shares, income is recognized when the right to receive the dividend is established.
In case of linked business, profit or loss on sale / redemption of investment securities is calculated as the difference between net sale proceeds and weighted average cost on the date of sale. In case of other than linked business, profit or loss on sale / redemption of equity shares, preference shares and units of mutual fund includes the accumulated changes in the fair value previously recognized under “Fair Value Change Account” in the Balance Sheet. In case of Debt securities, the profit or loss on sale / redemption is calculated as the difference between net sales proceeds and weighted average amortized cost on the date of sale.

Financial StatementsStatutory ReportsCorporate Overview
123
Unrealized gains and losses arising out of valuation of Linked – Policyholders’ Investments are recognized in the respective fund’s Revenue Account.
2.4 Income from loans against policies
Interest income on loans against policies is accounted for on an accrual basis.
2.5 Reinsurance premium
Reinsurance premium ceded is accounted for on due basis at the time of recognition of premium income basis the treaty arrangement with the reinsurers.
2.6 Acquisition costs
Acquisition costs are the expenses which are incurred to source and issue the insurance contract. These costs are expensed in the year in which they are incurred.
2.7 benefits paid (including claims settlement costs)
Death, health and surrender claims are accounted for on receipt of intimation subject to eligibility as per policy terms and conditions. Maturity claims & periodical benefits are accounted when due for payment. Surrenders, lapses (after expiry of lock in period) and withdrawals under linked policies are accounted in the respective funds when the associated units are deallocated.
Reinsurance recoverable is accounted for when the corresponding claim expenditure is recognized
2.8 liability for life policies in force and paid up policies
Liabilities for life policies in force and also policies in respect of which premium has been discontinued but a liability exists, is calculated by the Appointed Actuary on the basis of gross premium valuation method in accordance with accepted actuarial practice, professional guidance notes issued by the Institute of Actuaries of India, provisions of the Insurance Act, 1938 (as amended in 2015) and the relevant regulations notified by the IRDAI from time to time. The liabilities are calculated in a manner that together with estimated future premium income and investment income, the Company can meet estimated future claims (including bonus entitlements to policyholders) and expenses. The linked policies carry two types of liabilities – unit liability representing the fund value of policies and non-unit liability to meet any likely deficiencies in the charges under the policy which might arise on account of mortality, expenses and other elements.
Actuarial method and assumptions are given in note 3.2
2.9 Investments:
Investments are made in accordance with the Insurance Act, 1938 (as amended in 2015), the Insurance Regulatory and Development Authority (Investment) Regulations, 2016, and other circulars/notifications issued by the IRDAI in this context from time to time.
Investments are recognised at cost on the date of purchase which includes brokerage and related taxes and excludes pre-acquisition interest accrued, if any.
classification:
Investments maturing within twelve months from Balance Sheet date and investment made with the specific intention to dispose them off within twelve months from Balance Sheet date are classified as short term investments. Investments other than short term investments are classified as long term investments. Equity shares are classified as long term investment.
Valuation – Shareholders’ investments and non-linked policyholders’ investments:
All debt securities, including Government securities, are considered as ‘held to maturity’ and accordingly stated at amortized cost.
The difference between the acquisition price and the face value of treasury bills, certificate of deposits, commercial papers and Collateral Borrowing and Lending Obligation (CBLO) is amortised and recognized as income/expenses over the remaining term of these instruments, on a straight line basis. In case of zero coupon bonds, redemption value is considered as the face value.
As prescribed by IRDAI, for valuation of listed equity shares and equity exchange traded fund (ETF), the Company has selected National Stock Exchange (NSE) as the primary exchange and the Bombay Stock Exchange (BSE) as the secondary exchange. Accordingly, the closing price of NSE is used for the purpose of valuation of equity shares and equity ETF. If the security is not listed/not traded on NSE but traded on the BSE, then the closing price of BSE is used. Additional Tier I Bonds (AT-1 Bonds) are stated at market value, using applicable market yield rates published by SEBI registered rating agency (Credit Rating Information Services of India Ltd. (CRISIL)) Bond Valuer.
Mutual fund units as at the Balance Sheet date are valued at the previous business day’s net asset values (NAV).
Unrealised gains/losses arising due to changes in the fair value of mutual funds, listed equity shares and AT-1 Bonds are taken to “Fair value change Account” in the Balance Sheet. In case of diminution, other than temporary, the amount of diminution is recognised as an expense in the Revenue/Profit and Loss Account, as applicable.
Fixed deposits with banks are valued at cost.
Valuation – Assets held to cover linked liabilities:
All debt securities, including Government securities, are valued at market value using CRISIL Bond Valuer / CRISIL Gilt Prices, as applicable.
Money market instruments – Treasury bills, certificate of deposits, commercial papers, CBLO are being stated at amortized cost.

124
As prescribed by IRDAI, for valuation of listed equity shares and equity ETF, the Company has selected NSE as the primary exchange and BSE as the secondary exchange. Accordingly, the closing price of NSE is used for the purpose of valuation of equity shares and ETF. If the security is not listed/not traded in NSE but traded in the BSE, then the closing price of BSE is used for valuation.
Mutual fund units as at the Balance Sheet date are valued at the previous business day’s NAV.
Rights/Bonus entitlements, if any, are accounted on ex-rights/ex-bonus date of the principal stock exchange.
Fixed deposits with banks are valued at cost.
Transfer of Investments:
Transfer of investments from Shareholders to Policyholders to meet the deficit in the Policyholders fund account are effected at lower of cost (for debt securities net amortized cost) or market value on the previous day. The transfer of Investment between unit linked funds is done at the prevailing market price.
Impairment of Investment
The Company periodically assesses using internal and external sources and at each Balance Sheet date whether there is an indication of impairment of investment. In case of impairment, other than temporary, the carrying value of such investment is reduced to its fair value and the impairment loss is recognised in the Revenue/Profit and Loss Account, as applicable. However, at the Balance Sheet date if there is an indication that a previously recognised impairment loss no longer exists, then such loss is reversed and the investment is restated to that extent.
provision for non-performing Assets (npA)
In accordance with the IRDAI regulations on “Prudential norms for income recognition, asset classification, provisioning and other related matters in respect of debt portfolio” vide circular no. 32/2/F&A/Circulars/169/Jan 2006-07 dated January 24, 2007, adequate provisions have been made to cover amounts outstanding in respect of all NPA and standard assets. All assets where the interest and / or instalment of principal repayment remain overdue for more than 90 days (i.e., one quarter) are classified as NPA at the Balance Sheet date.
2.10 Fixed assets and depreciation/amortisation
Tangible Assets:
An item of property, plant & equipment that qualifies for recognition as an asset is stated at cost less accumulated depreciation and impairment losses, if any. Cost includes the purchase price and any cost directly attributable in bringing the asset to its working condition for its intended use.
Subsequent expenditure related to an item of asset is added to its book value only if such expenditure results
in an increase in the future economic benefit from the existing assets. All other expenditure on existing assets is charged to the Revenue Account/ Profit & Loss Account, as the case may be, for the period during which such expenditure is incurred. Any additions to the original fixed assets are depreciated over the remaining useful life of the original asset.
Depreciation is charged on pro-rata basis from the date of such addition or, as the case may be, up to the date on which such asset has been sold or discarded.
Advances paid towards the acquisition of fixed assets as at the Balance Sheet date and cost of fixed assets, which are not ready for its intended use as at such date are disclosed as capital work in progress.
Depreciation is provided on the straight line method (SLM) as per the useful life of the assets as specified in Schedule II of the Companies Act, 2013. Any assets costing `5,000 or less are fully depreciated in the year of purchase. The estimated useful life of assets is as follows:
Asset class estimated useful lifeBuilding 60 yearsLeasehold improvements Lease period, not exceeding
5 yearsFurniture and fittings 10 yearsInformation technology equipment
3 years
Leased Information technology equipment
3 years
Information technology server and network equipment
6 years
Leased vehicles Primary lease period, not exceeding 5 years
Office equipment 5 years
The residual value and the useful life of an asset is reviewed at each Balance Sheet date and if expectations differ from the previous estimates, the change is accounted for as a change in accounting estimate in accordance with AS 5 - Accounting for net profit or loss for the period, prior period items and changes in accounting policies.
Intangible Assets:
Intangible assets comprising software are stated at cost less amortisation. Significant expenditure on improvements to software are added to its book value only when it is probable that such expenditure will enable the asset to generate future economic benefits in excess of its originally assessed standards of performance and such expenditure can be measured and attributed to the asset reliably.
Software expenses are amortised using straight line method over license period not exceeding 3 years. Subsequent expenditures are amortised over the remaining useful life of the original software.

Financial StatementsStatutory ReportsCorporate Overview
125
2.11 leases:
Finance leases:
Leases where lessor effectively transfers, substantially all the risks and benefits incidental to ownership of the leased assets, are capitalized at the lower of the fair value and present value of the minimum lease payments at the inception of the lease term and disclosed as leased assets. Lease payments are apportioned between the finance charges and reduction of the lease liability based on the implicit rate of return. Finance charges are charged to the Revenue Account.
Operating leases:
Leases, where the lessor effectively retains substantially all the risks and benefits of ownership of the leased asset, are classified as operating leases. Operating lease rentals including escalations are recognized as an expense in the Revenue Account on a straight-line basis over the lease period.
2.12 Impairment of assets
The Company periodically assesses, using internal and external sources, whether there is an indication that an asset may be impaired. Impairment occurs where the carrying value exceeds the present value of future cash flows expected to arise from the continuing use of the asset and its eventual disposal. The impairment loss to be expensed is determined as the excess of the carrying amount over the higher of the asset’s net sales price or present value as determined above.
2.13 policy loans
The loans against policies are stated at historical cost (less repayments), subject to provision for impairment, if any.
2.14 Foreign currency transactions
Transactions in foreign currency are recorded at the rate of exchange prevailing on the date of transaction. Monetary assets and liabilities denominated in foreign currencies are translated at the closing rate as at the Balance Sheet date. The resulting exchange gain or loss is reflected in the Revenue Account or Profit and Loss Account, as applicable.
2.15 Taxation
A. direct Taxes:
(i) current taxes:
Current tax expense is determined on estimated taxable income in accordance with the provisions of the Income-tax Act, 1961, as amended from time to time, applicable to life insurance companies.
(ii) deferred taxes:
Deferred tax is recognised on timing differences, being the difference between the taxable income and the accounting income that originate in one period
and are capable of reversal in one or more subsequent periods. Deferred tax is measured using the tax rates and the tax laws enacted or substantively enacted as at the reporting date. Deferred tax liabilities are recognised for all timing differences. Deferred tax assets are recognised for timing differences of items other than unabsorbed depreciation and carry forward losses only to the extent that reasonable certainty exists that sufficient future taxable income will be available against which these can be realised. However, if there is unabsorbed depreciation and carry forward of losses and items relating to capital losses, deferred tax assets are recognised only if there is virtual certainty supported by convincing evidence that there will be sufficient future taxable income available to realise the assets.
Deferred tax assets and liabilities are offset if such items relate to taxes on income levied by the same governing tax laws and the Company has a legally enforceable right for such set off. Deferred tax assets are reviewed at each Balance Sheet date for their realisation.
b. Indirect Taxes
Service tax/GST liability is set-off against eligible tax credits available from tax paid on input services. Unutilized credits, if any, are carried forward for future set-off under “Advances and other assets”.
2.16 employee benefits
Short-term employee benefits:
All employee benefits payable within twelve months of rendering the service are classified as short-term employee benefits. These benefits include performance incentives, short term compensated absence, etc. The undiscounted amount of short-term employee benefits expected to be paid are recognised during the period when the employee renders the service.
defined contribution plans:
The Company's contribution to provident fund and employee state insurance scheme are considered as defined contribution plans and are charged as an expense as they fall due based on the amount of contribution required to be made during the period when service is rendered by the employees.
defined benefit plans:
For defined benefit plans in the form of gratuity fund, the cost of providing benefits is determined using the projected unit credit method, with actuarial valuation being carried out at each Balance Sheet date. Actuarial gains and/or losses are recognised in the Revenue Account in the period in which they occur. The retirement benefit obligation recognised in the Balance Sheet represents the present value of the defined benefit obligation and

126
same is determined based on the actuarial valuation at the Balance Sheet date using the projected unit cost method.
long-term employee benefits:
Compensated absences which are not expected to occur within twelve months after the end of the period in which the employee renders the related service are recognised as a liability at the present value of the defined benefit obligation as at the Balance Sheet date. Actuarial gains and/or losses due to change in actuarial valuation of such employee benefit plans are recognised in the period of occurrence for all employee benefits.
long term Incentive plan (lTIp):
Performance stock units (PSU) and restricted stock units (RSU) were granted to eligible employees’ basis defined parameters until December 2016. The vesting of these stock units was based on common stock (share) price of MetLife Inc. as at the vesting date. The liability and corresponding expense is accounted for on the basis of actuarial valuation carried out by an independent actuary at the Balance Sheet date and is trued-up at the time of vesting/payment.
Basis the IRDAI guidelines on ‘Indian Owned and Controlled’ in 2016, a new LTI program was introduced effective January 2017. The said program is a deferred cash plan and the quantum of grant to eligible employees is based on performance of the Company. The proportionate liability and corresponding expense is accounted for in line with the vesting period.
eSOp & cash lTI Scheme 2017:
The Company has introduced an ESOP scheme in December 2017 wherein certain eligible employees are granted options to subscribe to equity shares of the Company which vest in a graded manner. The vested options may be exercised within a specified period. The grant is conditional and contingent upon listing of shares of the Company by December 31, 2018.
In accordance with the Guidance Note on Accounting for Employee Share-based payments, the Company follows the intrinsic value method to account for its share based employee compensation plan. Compensation cost is measured as the excess, if any, of the fair market price of the underlying stock over the exercise price on the grant date and amortised over the vesting period.
A Cash LTI scheme was introduced for eligible employees who are not covered under the ESOP 2017 scheme. The scheme is also contingent upon listing of the shares of the Company by December 31, 2018. The proportionate liability and corresponding expense is accounted for in line with the vesting period.
2.17 Statement of Receipts and payments
The statement of receipts and payments has been prepared in accordance with the direct method prescribed in Accounting Standard 3, ‘Cash Flow Statement’.
2.18 Segment Reporting
As per Accounting Standard 17 on ‘Segment Reporting’ read with the IRDAI Regulations, the Company is required to report segment results separately for the participating, non-participating, health, unit linked and pension business segments (‘the business segments’). Accordingly, the Company has provided primary segment information for the business segments, as disclosed in Annexure 4.
There are no reportable geographical segments since the Company provides services to customers in the Indian market only and does not distinguish any reportable regions within India.
The following basis has been used for allocation of revenue, expenses, assets and liabilities to the business segments:
(a) Premium income, commission, benefits paid, operating expenses, investments and policyholders’ liabilities which are directly identifiable with business segments are disclosed under respective business segment.
(b) Fixed assets, current assets, current liabilities and provisions, which cannot be directly attributable to the business segments, are allocated to the business segments on the basis of one of the below mentioned factors as deemed appropriate considering the nature of item:
- Average in-force policies
- New business premium
(c) Expenses which are not directly attributable to the business segments are apportioned on the basis of following factors as deemed appropriate considering the nature of expenses.
- Average in-force policies
- New business premium
(d) The method of allocation of operating expenses has been decided based on the nature of the expense and its logical correlation with various business segments as was done in the previous year.
2.19 Funds for Future Appropriations (FFA)
The Funds for Future Appropriations (FFA) represents the surplus in participating segment which is not allocated to policyholders or shareholders as at the Balance Sheet date. Transfers to and/or from the fund reflect the surplus/

Financial StatementsStatutory ReportsCorporate Overview
127
deficit of income over expense of par segment. The cost of bonus to policyholders and shareholders is transferred to/from the FFA through a charge or credit to the Revenue Account at the year end.
The FFA in the linked business represents surplus on the lapsed policies unlikely to be revived. This surplus is required to be held within the policyholders’ fund till the time policyholders are eligible for revival of their policies. After expiry of the revival period, the FFA would be appropriated towards the surplus.
2.20 earnings per share (AS 20)
As required by AS 20, basic earnings per share are calculated by dividing the net profit or loss for the year available to equity shareholders by the weighted average number of equity shares outstanding during the year. Further, for the purpose of calculating diluted earnings per share, the weighted average number of shares outstanding during the year including that of subscription received against rights issue (pending allotment) is adjusted for the effects of all dilutive potential equity shares.
2.21 provisions, contingent liabilities and contingent assets
The Company creates a provision for claims, litigation, assessment, fines, penalties, etc. when there is present obligation as a result of a past event that probably requires an outflow of resources and a reliable estimate can be made of the amount of the obligation. A disclosure for contingent liability is made when there is a possible obligation or a present obligation that may, but probably will not, require an outflow of resources. When there is a possible obligation in respect of which the likelihood of outflow of resources is remote, no provision or disclosure is made.
Contingent assets are not recognized in the financial statements since they may result in the recognition of income that may never be received unless it becomes virtually certain that an inflow of economic benefits will arise and accordingly the asset and the related income shall be recognized in the financial statements of the period in which the change occurs.

128
3. nOTeS TO AccOunTS
3.1 contingent liabilities
(` in '000)particulars March 31, 2018 March 31, 2017(a) Partly paid up investments Nil Nil(b) Claims, other than those under policies, not acknowledged as debts 69,108 58,722(c) Claims under policies not acknowledged as debts 328,378 265,787(d) Underwriting commitments outstanding (in respect of shares and securities) Nil Nil(e) Guarantees given by or on behalf of Company 2,500 Nil(f) Statutory demands/liabilities in dispute not provided for* 1,566,348 1,324,850(g) Reinsurance obligations to the extent not provided for in accounts Nil Nil(h) Unclaimed amount of policyholders transferred to Senior Citizens’ Welfare Fund 782 Nil
*represents statutory demands and liabilities in dispute, not provided for, relating to the show cause cum demand notices/assessment orders
received by the Company from the various tax authorities.
• ̀ 1,457,208 thousands (` 1,307,875 thousands as at March 31, 2017) pertain to demand from Service Tax authorities towards disallowance of CENVAT credit,
• DemandtowardsTaxDeductedatSourcenotprovidedfor`Nil (` 16,975 thousands as at March 31, 2017)
• TheIncomeTaxauthoritieshavemadeanappealof` 109,140 thousands (` Nil as at March 31, 2017) for the assessment year 2010-11
3.2 Actuarial method and assumptions underlying the valuation of policy liabilities
The actuarial value of the policy liabilities as at March 31, 2018 has been estimated using actuarial assumptions and methods which are consistent with:
(a) generally accepted actuarial practices;
(b) the provisions of The Insurance Act, 1938 and any amendments thereof;
(c) regulations and guidelines issued by the IRDAI; and
(d) the relevant guidance notes issued by the Institute of Actuaries of India
The assumptions are based on prudent estimates of the future experience, and hence include margins for adverse deviations over and above the best estimate assumptions. A brief of the assumptions used in actuarial valuation is as below:
• Valuationofrateofinterest:Thevaluationrateofinteresthasbeentakenas6percent(previousfinancialyear6percent)per annum for participating products excluding below listed products where 6.25 per cent (previous financial year 6 per cent) per annum is used:
o Met Suvidha Par (UIN 117N017V01)
o Met Monthly Income 15 Pay (UIN 117N070V01)
o Met Monthly Income 7 Pay (UIN 117N064V01)
o Met Monthly Income Plan (UIN 117N050V01)
For non-participating products, valuation interest rate is set to 5.5 per cent (previous financial year 5.5 per cent) per annum. These interest rates reflect the expected long term yields on the investments backing these liabilities with a margin for adverse deviations.
• Mortality:MortalityassumptionsaresetinaccordancewithClause5(2)ofScheduleIIoftheIRDAI(Assets,LiabilitiesandSolvency Margin of Life Insurance Business) Regulations, 2016. The mortality rates used are basis the published Indian Assured Lives Mortality (IALM) table (2006-08) in line with latest experience analysis of the business. In the case of annuity benefits for non-participating policies, mortality assumption is based on the LIC Annuitants (1996-1998) table including mortality improvement. Morbidity rates used are based on CIBT 93 table, adjusted for expected experience.
• Expenses: The allowance for commissions is on the basis of the actual rates of renewal commission payable to thefinancial advisors. The renewal expenses are allowed in the valuation both as a percentage of premium and on per policy basis. Claim related expenses have also been factored for all the individual products. The expense inflation is taken as 5.8 per cent (previous financial year 5.5 per cent) per annum.

Financial StatementsStatutory ReportsCorporate Overview
129
• Persistency:TheexpectedpersistencyhasbeenassumedbasedontheexperienceoftheCompanyandvariesbydurationof the policy and by nature of products.
• FutureBonuses:Provisionmadeforfuturebonusesbasedontheestimatedexpectedbonuspayouts,allowingforthereserving interest rate.
The policy liability for the Group one year renewable business has been calculated as the unexpired premium reserve. In case of group products with term more than one year, Gross Premium Valuation method has been used. For group products administered as cash accumulation account, the account values of the policies are considered as reserve.
In addition to the estimated policy liabilities based on the above methodology and assumptions, additional provision has been made for IBNR claims.
The reserves for unit-linked life and pension business comprise two parts - unit reserves and non-unit reserves. Unit reserves represent the value of units attached to the unit linked policies as on the valuation date. Non-unit reserves are calculated taking into consideration the future expected cash outgoes and incomes in respect of all in-force unit linked policies.
The reinsurance credit has been appropriately factored into the calculation of the reserves by projecting the expected mortality benefits that would arise on account of reinsurance net of the expected reinsurance premiums payable.
Other provisions include –
• Provisionsforfreelookcancellationshavebeenallowedforindividualnon-linked,linkedandgroupcreditlifeproductsbased on experience.
• ProvisionhasbeenmadeforanyadditionalexpensesthattheCompanymayhavetoincurifitweretoclosethenewbusiness within twelve months from the valuation date.
• Reserveshavebeenkeptforlapsedandreducedpaiduppolicieseligibleforrevivals.
• Extramortalityriskpremiumschargedforextrariskhavebeensetasideasreserve.
• Adequateriderreserveshavebeensetaside
• Additionalreserveshavebeensetwheredeathshavealreadyoccurredbutliabilitycontinuestoexist,likecaseswhereinwaiver of premium option has been availed
Adequate margins for adverse deviations are taken in the valuation assumptions as per the regulations and guidelines issued by IRDAI and the guidance note issued by Institute of Actuaries of India. All in-force policies as per the policy administration database have been considered for the estimation of policy liabilities.
3.3 encumbrances on assets
Assets of the Company are free from encumbrances. There are no assets including loans subjected to restructuring (as at March 31, 2017 – ` Nil).
3.4 capital commitments
There are no commitments made and outstanding for loans and investments as at March 31, 2018 (as at March 31, 2017 – `Nil). The estimated amount of commitments made by the Company and not provided (net of advances) for fixed assets as at March 31, 2018 aggregate to `83,870 thousands (as at March 31, 2017 - `115,803 thousands).
3.5 lease commitments
As stated in paragraphs 2.11 above, the Company acquired information technology equipment and computer software under finance lease. The minimum amounts payable in future on finance leases and their present value are as follows:
Total (` ‘000) not later than 1 year (` ‘000)
1 to 5 years (` ‘000)
later than 5 years (` ‘000)
March 31, 2018Minimum lease payments (‘MLPs’) outstanding 115,295 49,412 65,883 -Less: Finance charges 10,093 6,423 3,669 -Present value of MLPs outstanding 105,202 42,989 62,214 -
March 31, 2017 Minimum lease payments (‘MLPs’) outstanding 197,649 65,883 131,766 -Less: Finance charges 27,017 14,179 12,838 -Present value of MLPs outstanding 170,632 51,704 118,928 -

130
The Company has acquired premises (office and residential), fit outs, computers and motor vehicles on operating lease. Lease payments on cancellable and non-cancellable lease arrangements were charged to the Revenue Account/ Profit and Loss Account, as the case may be. The future minimum lease payments in respect of non- cancellable operating leases as at the Balance Sheet date are as follows:
(` in '000)
March 31, 2018 March 31, 2017
Not later than 1 year 20,024 35,748
1 to 5 years 9,246 23,354
Later than 5 years - -
Total Mlps outstanding 29,270 59,102
The total of operating lease payments recognized in the Revenue Account for the year ended March 31, 2018 is ` 189,395 thousands (Previous year – ` 173,355 thousands).
There are no transactions in the nature of sub-lease.
3.6 death claims outstanding
The Company has claims settled and unpaid for more than six months amounting to ̀ 34,654 thousands as at March 31, 2018 (as at March 31, 2017 – ` 24,338 thousands).
3.7 Value of investment contracts where settlement or delivery is pending:-
(` in '000)
particulars As at March 31, 2018 As at March 31, 2017
linked business
non-linked business
linked business
non-linked business
Purchases where deliveries are pending 128,320 579,773 564,030 Nil
Sales where receipts are pending * 227,248 114,823 1,110,965 Nil
* There are no investment contracts where sales have been made and payments are overdue.
3.8 deposits under local laws:
The Company does not have any assets that are required to be deposited under local laws or otherwise encumbered in or outside India as required under Para C of Part II of Schedule A of IRDA (Preparation of Financial Statements and Auditors report) Regulations, 2002. However, an amount of `617 thousands as at March 31, 2018 (as at March 31, 2017 - ` 400 thousands) has been held as security deposit with J&K State Commercial Tax department.
3.9 Taxation
In view of the carry forward accumulated losses, the Company has not made any provision towards current tax. Deferred tax asset has not been recognized in the absence of virtual certainty of future taxable income against which the deferred tax asset can be realized.
3.10 Managerial Remuneration
a) The Managing Director & CEO of the Company resigned effective March 31, 2017 and in his place, an interim CEO and Principal Officer was appointed w.e.f. March 31, 2017 for a period of 6 months (i.e., upto September 30, 2017). Necessary approvals from IRDAI are in place for the same. The remuneration (including allowances and special bonus) of INR 21,788 thousands paid to the interim CEO & Principal Officer during the half year ended September 30, 2017 has been debited to Employees’ remuneration and welfare benefits in Schedule 3 of the Revenue Account.
b) The interim CEO and Principal Officer was appointed as Managing Director and CEO of the Company w.e.f. October 1, 2017 for a period of five years as approved by IRDAI.

Financial StatementsStatutory ReportsCorporate Overview
131
c) Details of the managerial remuneration (Managing Director & CEO) are as follows:
(` in '000)year ended
March 31, 2018 *year ended
March 31, 2017Salary & Allowances 28,047 25,471Contribution to provident fund 432 1,106Value of perquisites 41 812Total 28,520 27,389Charged to Revenue Account 7,500 10,000Charged to Shareholder’s Account 21,020 17,389
*There was no Managing Director during the period April 1, 2017 to September 30, 2017.
notes:
(i) The remuneration of `7,500 thousands for the half year ended March 31, 2018 (Previous year ended March 2017 ` 10,000 thousands) has been charged to the Revenue Account and the balance in excess, is debited to the Profit and Loss Account as per IRDAI approval.
(ii) An amount of `3,150 thousands towards LTIP payable to the former Managing Director and CEO of the Company, which was charged to the Profit and Loss Account in the previous financial year, has been paid during year and the same has also been recovered from MetLife International Holdings LLC in line with approval from IRDAI.
(iii) An amount of ` 2,268 thousands towards PSU and RSU stock units vested during the year is outstanding as payable to the Managing Director & CEO as at March 31, 2018 (Previous year ` Nil) pending IRDAI approval.
(iv) The above figures do not include provision for employee benefits, which are actuarially determined for the Company as a whole in accordance with AS 15 Employee benefits
d) Sitting fees paid to directors during the year was `3,850 thousands (previous year - `3,250 thousands).
3.11 historical cost of investments
As at March 31, 2018, the aggregate cost and market value of investments which are valued on fair value basis is `55,570,143 thousands and ` 65,286,496 thousands (as at March 31, 2017 - `55,581,244 thousands and ` 68,159,635 thousands) respectively.
3.12 Statutory investments
All investments have been made in accordance with the Insurance Act, 1938 (as amended in 2015), the Insurance and Regulatory Development Authority (Investment) Regulations 2016 and various other circulars, guidelines and notifications issued by the IRDAI in this context from time to time.
3.13 non-performing investments
None of the investments of the Company has been classified as non-performing investments as at March 31, 2018 (as at March 31, 2017 – Nil) as per the income recognition norms issued by the IRDAI.
3.14 Repo / Reverse Repo Transactions
There was no exposure towards repo / reverse repo transactions during the year ended March 31, 2018 (for the year ended March 31, 2017 – ` Nil)
3.15 Allocation of investments and income
The Company is maintaining separate funds for shareholders and policyholders as per Sec. 11(1B) of the Insurance Act, 1938 (as amended in 2015). The Company transfers the investments from the shareholders account to the policyholder’s account, to the extent required to cover the incremental liabilities for life policies in force. Investments held on behalf of the shareholders and the policyholders are included in Schedules 8, 8A and 8B of the financial statements. The investment income arising from the investments held on behalf of shareholders is recognized in the Profit and Loss Account and those held on behalf of policyholders in the Revenue Account respectively.

132
3.16 Sector-wise percentage of business
For the year ended March 31, 2018 For the year ended March 31, 2017
no. of policies
issued
no. of lives
covered
First year premium income
(` ‘000)
no. of policies
issued
no. of lives
covered
First year premium income
(` ‘000)
Total business 219,805 962,776 14,270,806 216,802 1,650,274 11,487,844
Rural sector 64,834 NA 3,185,738 59,914 NA 2,210,643
As % of total business of current year 29.50% NA 22.32% 27.64% NA 19.24%
Social sector 51 86,327 6,154 29 67,720 4,225
As % of total business
- of current year 0.02% 8.97% 0.04% 0.01% 4.10% 0.04%
- of previous year 0.02% 5.23% 0.05% 0.01% 5.36% 0.04%
3.17 Foreign exchange transactions
Transactions in foreign currencies are recorded at exchange rate prevailing on the date of transaction. The exchange difference between the rate prevailing on the date of transaction and on the date of settlement is recognised as income or expense, as the case may be. The net foreign exchange gain/(loss) in Revenue Account for the year ended March 31, 2018 is ` (172) thousands (for the year ended March 31, 2017 - `122 thousands)
3.18 Summary of financial statements
The summary of financial statements of the Company as prescribed by the IRDAI in its circular dated April 29, 2003 is presented in Annexure 1.
3.19 Accounting ratios
The accounting ratios as prescribed by the IRDAI in its circular dated January 28, 2010 are presented in Annexure 2.
3.20 Risk retained and risk ceded
Extent of risk retained and risk ceded based on the sum insured is given below:
particularsAs at
March 31, 2018As at
March 31, 2017
Individual business
Risk retained 56% 59%
Risk ceded 44% 41%
group business
Risk retained 58% 58%
Risk ceded 42% 42%
Total
Risk retained 57% 58%
Risk ceded 43% 42%
3.21 Related party disclosure
Details of related party transactions as defined in Accounting Standard 18 on ‘Related Party Disclosures’ is presented in Annexure 3.
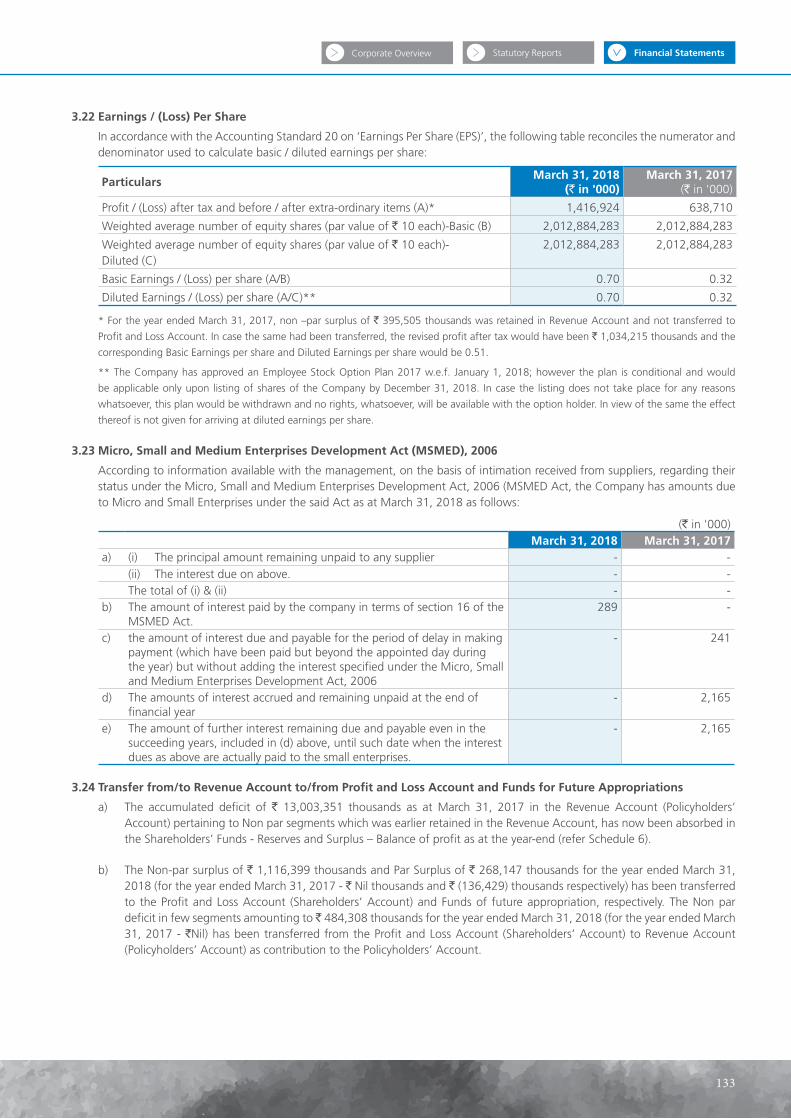
Financial StatementsStatutory ReportsCorporate Overview
133
3.22 earnings / (loss) per Share
In accordance with the Accounting Standard 20 on ‘Earnings Per Share (EPS)’, the following table reconciles the numerator and denominator used to calculate basic / diluted earnings per share:
particularsMarch 31, 2018
(` in '000)March 31, 2017
(` in '000)
Profit / (Loss) after tax and before / after extra-ordinary items (A)* 1,416,924 638,710
Weighted average number of equity shares (par value of ` 10 each)-Basic (B) 2,012,884,283 2,012,884,283
Weighted average number of equity shares (par value of ` 10 each)- Diluted (C)
2,012,884,283 2,012,884,283
Basic Earnings / (Loss) per share (A/B) 0.70 0.32
Diluted Earnings / (Loss) per share (A/C)** 0.70 0.32
* For the year ended March 31, 2017, non –par surplus of ` 395,505 thousands was retained in Revenue Account and not transferred to
Profit and Loss Account. In case the same had been transferred, the revised profit after tax would have been ` 1,034,215 thousands and the
corresponding Basic Earnings per share and Diluted Earnings per share would be 0.51.
** The Company has approved an Employee Stock Option Plan 2017 w.e.f. January 1, 2018; however the plan is conditional and would
be applicable only upon listing of shares of the Company by December 31, 2018. In case the listing does not take place for any reasons
whatsoever, this plan would be withdrawn and no rights, whatsoever, will be available with the option holder. In view of the same the effect
thereof is not given for arriving at diluted earnings per share.
3.23 Micro, Small and Medium enterprises development Act (MSMed), 2006
According to information available with the management, on the basis of intimation received from suppliers, regarding their status under the Micro, Small and Medium Enterprises Development Act, 2006 (MSMED Act, the Company has amounts due to Micro and Small Enterprises under the said Act as at March 31, 2018 as follows:
(` in '000)March 31, 2018 March 31, 2017
a) (i) The principal amount remaining unpaid to any supplier - -(ii) The interest due on above. - -The total of (i) & (ii) - -
b) The amount of interest paid by the company in terms of section 16 of the MSMED Act.
289 -
c) the amount of interest due and payable for the period of delay in making payment (which have been paid but beyond the appointed day during the year) but without adding the interest specified under the Micro, Small and Medium Enterprises Development Act, 2006
- 241
d) The amounts of interest accrued and remaining unpaid at the end of financial year
- 2,165
e) The amount of further interest remaining due and payable even in the succeeding years, included in (d) above, until such date when the interest dues as above are actually paid to the small enterprises.
- 2,165
3.24 Transfer from/to Revenue Account to/from profit and loss Account and Funds for Future Appropriations
a) The accumulated deficit of ` 13,003,351 thousands as at March 31, 2017 in the Revenue Account (Policyholders’ Account) pertaining to Non par segments which was earlier retained in the Revenue Account, has now been absorbed in the Shareholders’ Funds - Reserves and Surplus – Balance of profit as at the year-end (refer Schedule 6).
b) The Non-par surplus of ` 1,116,399 thousands and Par Surplus of ` 268,147 thousands for the year ended March 31, 2018 (for the year ended March 31, 2017 - ` Nil thousands and ` (136,429) thousands respectively) has been transferred to the Profit and Loss Account (Shareholders’ Account) and Funds of future appropriation, respectively. The Non par deficit in few segments amounting to ̀ 484,308 thousands for the year ended March 31, 2018 (for the year ended March 31, 2017 - `Nil) has been transferred from the Profit and Loss Account (Shareholders’ Account) to Revenue Account (Policyholders’ Account) as contribution to the Policyholders’ Account.
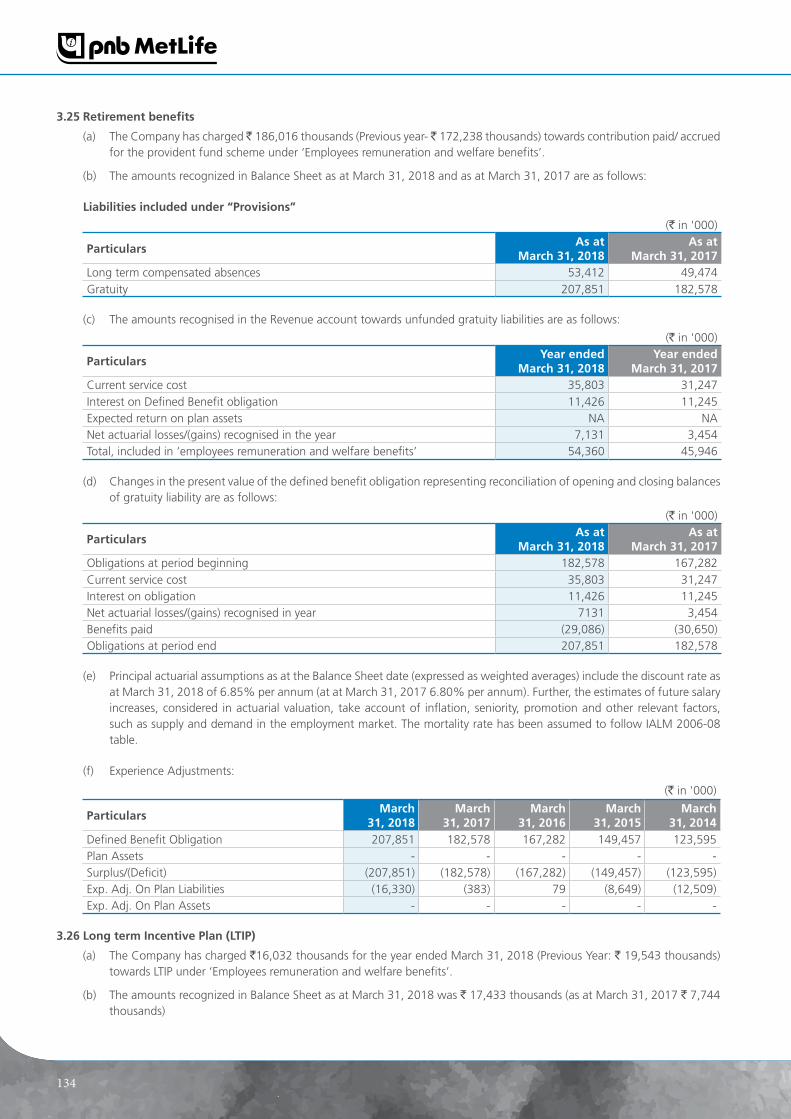
134
3.25 Retirement benefits
(a) The Company has charged ̀ 186,016 thousands (Previous year- ̀ 172,238 thousands) towards contribution paid/ accrued for the provident fund scheme under ‘Employees remuneration and welfare benefits’.
(b) The amounts recognized in Balance Sheet as at March 31, 2018 and as at March 31, 2017 are as follows:
liabilities included under “provisions”
(` in '000)
particularsAs at
March 31, 2018As at
March 31, 2017Long term compensated absences 53,412 49,474Gratuity 207,851 182,578
(c) The amounts recognised in the Revenue account towards unfunded gratuity liabilities are as follows:
(` in '000)
particularsyear ended
March 31, 2018year ended
March 31, 2017Current service cost 35,803 31,247Interest on Defined Benefit obligation 11,426 11,245Expected return on plan assets NA NANet actuarial losses/(gains) recognised in the year 7,131 3,454Total, included in ‘employees remuneration and welfare benefits’ 54,360 45,946
(d) Changes in the present value of the defined benefit obligation representing reconciliation of opening and closing balances of gratuity liability are as follows:
(` in '000)
particularsAs at
March 31, 2018As at
March 31, 2017Obligations at period beginning 182,578 167,282Current service cost 35,803 31,247Interest on obligation 11,426 11,245Net actuarial losses/(gains) recognised in year 7131 3,454Benefits paid (29,086) (30,650)Obligations at period end 207,851 182,578
(e) Principal actuarial assumptions as at the Balance Sheet date (expressed as weighted averages) include the discount rate as at March 31, 2018 of 6.85% per annum (at at March 31, 2017 6.80% per annum). Further, the estimates of future salary increases, considered in actuarial valuation, take account of inflation, seniority, promotion and other relevant factors, such as supply and demand in the employment market. The mortality rate has been assumed to follow IALM 2006-08 table.
(f) Experience Adjustments:
(` in '000)
particularsMarch
31, 2018March
31, 2017March
31, 2016March
31, 2015March
31, 2014Defined Benefit Obligation 207,851 182,578 167,282 149,457 123,595Plan Assets - - - - -Surplus/(Deficit) (207,851) (182,578) (167,282) (149,457) (123,595)Exp. Adj. On Plan Liabilities (16,330) (383) 79 (8,649) (12,509)Exp. Adj. On Plan Assets - - - - -
3.26 long term Incentive plan (lTIp)
(a) The Company has charged `16,032 thousands for the year ended March 31, 2018 (Previous Year: ` 19,543 thousands) towards LTIP under ‘Employees remuneration and welfare benefits’.
(b) The amounts recognized in Balance Sheet as at March 31, 2018 was ` 17,433 thousands (as at March 31, 2017 ` 7,744 thousands)

Financial StatementsStatutory ReportsCorporate Overview
135
3.27 eSOp & cash lTI scheme 2017
The intrinsic value of the options granted under ESOP scheme is ‘Nil’ as the exercise price of the option is lesser than the fair value of the underlying share on the grant date and accordingly, no expenses are recognised in the books.
The Company has charged an amount of ̀ 12,081 thousands for the year towards Cash LTI scheme and the same is outstanding in the books as at March 31, 2018
3.28 Additional disclosure of expenses:
As required by IRDAI’s circular no. 067/IRDA/F&A/CIR/MAR-08 dated March 28, 2008 the details of the following expenses are furnished below:
(` in '000)
heads of expenses* grouped underyear ended
March 31, 2018year ended
March 31, 2017Outsourcing Expenses (manpower) Employee’s remuneration and welfare
benefits375,282 347,292
Business Development Business Development, Sales promotion & Sales conference
(70,556) 225,993
Marketing Support Advertisement and publicity - (368)
*includes true up of provisions
3.29 discontinued Fund:
As required by IRDAI’s notification F No. IRDA/Reg/2/52/2010 dated July 01, 2010, the details of the discontinued fund are mentioned below:
(` in '000)
particularsyear ended
March 31, 2018year ended
March 31, 2017 Fund for Discontinued Policies Opening Balance of Funds for Discontinued Policies 5,924,857 5,242,323Add: Fund of policies discontinued during the year 3,064,195 2,867,482Less: Fund of policies revived during the year 958,408 925,745Add: Net Income/ Gains on investment of the Fund 401,466 370,057Less: Fund Management Charges levied 37,838 31,582Less: Amount refunded to policyholders during the year 2,645,039 1,597,678
Closing Balance of Fund for Discontinued Policies 5,749,232 5,924,857
(` in '000)
particularsyear ended
March 31, 2018year ended
March 31, 2017Other disclosuresNo. of policies discontinued during the year 17,601 30,968Percentage of discontinued policies to total policies (product-wise) during the year
Met Smart Platinum 38% 50%Met Easy Super 2% 1%Met Smart Child 59% 48%MetLife Mera Wealth Plan 1% 1%
No. of policies revived during the year 6,350 9,376Percentage of policies revived (to discontinued policies) during the year
Met Smart Platinum 38% 45%Met Easy Super 2% 2%Met Smart Child 59% 53%MetLife Mera Wealth Plan 1% 0%
Charges imposed on account of discontinued policies 32,479 62,613Charges readjusted on account of revival of policies 12,709 20,630

136
3.30 unclaimed Amount of policyholders
As required by IRDAI’s circular no. IRDA/F&I/CIR/CMP/174/11/2010 dated November 4, 2010, statement showing the age-wise analysis of the unclaimed amount of policyholders is as follows
As at March 31, 2018
(` in '000)
Ageing Analysis claims settled but not paid to the policyholders/insured due to
any reasons except under
litigation from the insured /
policyholders
Sum due to the insured /
policyholders on maturity or
otherwise
Any excess collection of the premium / tax or any other
charges which is refundable to the policyholders either
as terms of conditions of the policy or as per law or as may
be directed by the Authority but not refunded so far
cheques issued but
not encashed by the
policyholder / insured
0 - 6 Months 901 289,006 32,569 45,0377 - 12 Months 98 113,973 8,454 48,69713-18 Months 909 83,552 13,705 53,76019-24 Months 8,196 89,865 15,093 84,70625-30 Months 5,560 73,918 12,594 55,99731-36 Months 4,078 49,151 30,037 32,41336-120 Months 6,609 636,563 153,728 81,202Beyond 120 months - - 9 4,087grand Total 26,351 1,336,028 266,189 405,899
As at March 31, 2017
(` in '000)
Ageing Analysis claims settled but not paid to
the policyholders / insured due
to any reasons except under
litigation from the insured /
policyholders
Sum due to the insured /
policyholders on maturity or
otherwise
Any excess collection of the premium / tax or any other
charges which is refundable to the policyholders either as per terms &conditions of the
policy or as per law or as may be directed by the Authority
but not refunded so far
cheques issued but
not encashed by the
policyholder/ insured (Refer
note below)
0-1 Month 39,459 78,000 4,655 -1-6 Months 1,947 166,630 45,812 21,3247-12 Months 8,301 125,229 41,026 83,64713-18 Months 1,1078 73,862 76,219 10,70819-24 Months - 37,162 29,778 1,10225-30 months - 47,838 23,792 1,44131-36 months 11,070 142,054 30,494 228,579Beyond 36 months 626 583,123 132,867 45,615Total 72,481 1,253,898 384,643 392,416
3.31 In line with circular no. IRDA/F& I/CIR/CMP/174/11/2010 dated 04.11.2010, the details of unclaimed amounts and Investment Income is given below:
(` in Lakh)
particularsyear ended
March 31, 2018year ended
March 31, 2017Opening Balance 21,034 22,116Add: Amount transferred to unclaimed fund 12,824 30,728Add: Cheques issued out of the Unclaimed amount but not encashed by the policy holders (Stale cheques)
173 411
Add: Investment Income on Unclaimed fund 1,233 1,038Less: Amount of claims paid during the year 14,137 33,259Less: Amount transferred to SCWF 782 -closing balance of unclaimed Amount Fund 20,345 21,034

Financial StatementsStatutory ReportsCorporate Overview
137
3.32 Fines & penalties:
Sl. no.
Authoritynon-
compliance/ Violation
2017-18 (` in ‘000)
penalty Awarded
penalty paid
penalty waived/ Reduced
1 Insurance Regulatory and Development Authority of India Nil Nil Nil Nil
2 Service Tax Authorities Nil Nil Nil Nil
3 Income Tax Authorities Nil Nil Nil Nil
4 Any other Tax Authorities Nil Nil Nil Nil
5 Enforcement Directorate/ Adjudicating Authority/ Tribunal or any Authority under FEMA
Nil Nil Nil Nil
6 Registrar of Companies/ NCLT/ CLB/ Department of Corporate Affairs or any Authority under Companies Act, 1956
Nil Nil Nil Nil
7 Penalty awarded by any Court/Tribunal for any matter including claim settlement but excluding compensation
Nil Nil Nil Nil
8 Securities and Exchange Board of India Nil Nil Nil Nil
9 Competition Commission of India Nil Nil Nil Nil
10 Any other Central/State/Local Government/ Statutory Authority
Nil Nil Nil Nil
Sl. no.
Authoritynon-
compliance/ Violation
2016-17 (` in ‘000)
penalty Awarded
penalty paid
penalty waived/ Reduced
1 Insurance Regulatory and Development Authority of India Penalty by IRDAI
1,000 1,000 Nil
2 Service Tax Authorities Nil Nil Nil Nil
3 Income Tax Authorities Nil Nil Nil Nil
4 Any other Tax Authorities Nil Nil Nil Nil
5 Enforcement Directorate/ Adjudicating Authority/ Tribunal or any Authority under FEMA
Nil Nil Nil Nil
6 Registrar of Companies/ NCLT/ CLB/ Department of Corporate Affairs or any Authority under Companies Act, 1956
Nil Nil Nil Nil
7 Penalty awarded by any Court/Tribunal for any matter including claim settlement but excluding compensation
Nil Nil Nil Nil
8 Securities and Exchange Board of India Nil Nil Nil Nil
9 Competition Commission of India Nil Nil Nil Nil
10 Any other Central/State/Local Government/ Statutory Authority
Nil Nil Nil Nil
3.33 expenses of Management
As per the Expense of Management Regulations, 2016, the percentage of actual expense to allowable expense of the Company is within the defined limits as specified in the regulation.
An amount of ̀ 5,119 thousands for the year ended March 31, 2018 (for the year ended March 31, 2017 ̀ 4,253) being excess over allowable limit in a particular segment has been debited to Profit and Loss Account (Shareholder’s Account) in accordance with clause 16 of the regulations.

138
3.34 corporate Social responsibility (cSR)
As per section 135 of the Companies Act 2013, the Company needs to spend in every financial year, at least 2% of the average net profits of the Company made during the three immediate preceding financial years on CSR related activities. Accordingly, an amount of `15,577 thousands (previous year `20,568 thousands) is required to be spent by the Company towards CSR activities. The Company has spent `8,711 thousands (previous year `13,315 thousands) on various CSR initiatives:
(` in '000)
Sector in which the project is coveredyear ended
March 31, 2018year ended
March 31, 2017
Eradication hunger, poverty and malnutrition; promoting healthcare, including preventive health care; and sanitation, including contribution to the Swach Bharat Kosh set-up by the Central Government for the promotion of sanitation; and making available safe drinking water
- 1,937
Promoting education, including special education, and employment-enhancing vocational skills, especially among children, women, elderly, and the differently-abled; and livelihood enhancement projects
6,499 8,365
Training to promote rural sports, nationally-recognized sports, Paralympic sports and Olympic sports. Sports Infrastructure Support
1,748 2,018
Administration Charges 464 995
Total 8,711 13,315
The amount spent during the year is as follows:
(` in '000)
For the year ended March 31, 2018 For the year ended March 31, 2017
In cashyet to be
paid in cashTotal In cash
yet to be paid in cash
Total
(i) Construction/acquisition of any asset - - - - - -
(ii) On purpose other than (i) above 8,711 - 8,711 12,653 662 13,315
Total 8,711 - 8,711 12,653 662 13,315
Movement in provision for CSR activities
(` in '000)
particularsFor the year
ended March 31, 2018
For the year ended March
31, 2017
Balance at the beginning of the year 1,137 1,465
Additional provision made during the year - 662
Amount used during the year 641 990
Balance at the end of the year 496 1,137

Financial StatementsStatutory ReportsCorporate Overview
139
3.35 previous year comparatives:
Previous year figures have been reclassified/regrouped, wherever necessary & appropriate, to confirm to current year’s presentation.
(` in '000)
no. Regroup from Regroup to Amount Reason1 Annuities/ Pension payment Claims by death 4,813 For appropriate
presentation
As per our report of even date attached For and on behalf of the Board of Directors
For K.S. Aiyar & co. For Thakur Vaidyanath Aiyar & co. lyndon Oliver Ashish Kumar SrivastavaChartered Accountants Chartered Accountants Chairman Managing Director & CEOICAI Firm Registration No.: 100186W
ICAI Firm RegistrationNo.: 000038N
DIN: 07561067 DIN: 00355075
Rajesh S. Joshi K.n. gupta pheroze K Mistry neeraj SwaroopPartner Partner Director DirectorMembership No.:038526 Membership No.:009169 DIN: 00344590 DIN: 00061170
niraj Shah p K dinakarChief Financial Officer Appointed Actuary
Place: Mumbai yagya TurkerDate: June 01, 2018 Company Secretary
M. No. 19493

140
Annexure 13.18 Summary of financial statements
(` in '000)Sl. no.
particulars Fy 2017-18 Fy 2016-17 Fy 2015-16 Fy 2014-15 Fy 2013-14
pOlIcyhOldeRS' A/c1 Gross premium income 39,535,108 32,360,801 28,278,346 24,611,858 22,405,8652 Net premium income 38,605,153 31,389,059 27,272,281 23,655,445 21,752,5643 Income from investments (Net) 13,476,307 15,206,096 2,827,037 19,802,212 11,411,6384 Other income 219,789 172,439 128,664 138,823 107,1944A Contribution from the Shareholders' Account 484,308 - - - -5 Total income 52,785,557 46,767,594 30,227,982 43,596,480 33,271,3966 Commission 2,154,760 1,796,521 1,614,626 1,384,324 1,267,6747 Brokerage - - - - -
8Operating expenses related to the insurance business
8,148,395 7,466,339 7,493,299 6,036,495 5,449,427
8A Service tax / Goods and Services Tax on Charges 385,921 358,458 355,679 326,776 -9 Provision for Tax - - - - -9A Provision for Advances & Recoveries (4,690) 48,463 80,461 20,479 -10 Total expenses 10,684,386 9,669,781 9,544,065 7,768,074 6,717,10111 Payment to policyholders 21,110,279 17,707,640 14,316,852 18,688,299 16,046,27012 Increase in actuarial liability 24,285,385 17,990,983 12,017,732 8,229,722 9,236,41113 Provision for Linked Liabilities (4,915,519) 993,230 (6,207,064) 7,834,909 (201,154)
14 Surplus/(deficit) from operations 1,621,026 405,960 556,397 1,075,476 1,472,769
ShARehOldeRS' A/c15 Total income under Shareholders' Account 645,983 566,901 528,256 494,183 463,11416 Total expenses under Shareholders' Account 97,631 75,075 85,119 34,861 13,40916A Contribution to the Revenue Account 484,308 - - - -17 Profit/(Loss) before tax 1,416,924 638,710 536,260 524,268 489,05918 Provisions for tax - - - - -19 profit/(loss) after tax 1,416,924 638,710 536,260 524,268 489,059
20 profit/(loss) carried to balance Sheet (9,376,475) 2,209,952 1,571,242 1,034,982 510,714
MIScellAneOuS21 (A) Policyholders' account:
Total funds 162,446,180 143,063,683 124,054,296 118,243,628 102,178,997 Total investments 161,880,752 144,557,761 128,254,722 121,378,198 103,639,912 Yield on investments (%) (Annualised) 9.64% 12.55% 2.32% 21.36% 12.23%(B) Shareholders' account: Total funds 10,752,240 9,338,314 8,301,229 7,624,117 6,998,941 Total investments 10,532,432 7,032,825 6,499,122 5,983,836 5,652,165 Yield on investments (%) (Annualised) 7.94% 9.14% 9.25% 9.28% 9.18%
22 Yield on total investments (%) (Annualised) 9.55% 12.38% 2.61% 20.50% 12.08%23 Paid up equity capital 20,128,843 20,128,843 20,128,843 20,128,843 20,128,84324 Networth 10,752,240 9,338,314 8,301,229 7,624,117 6,998,94125 Total assets (Net of Current Liabilities) 175,094,498 154,095,358 134,232,400 127,204,480 109,605,050
26earnings/(loss) per share basic/ (`) (refer note 1 below)
0.70 0.32 0.27 0.26 0.24
27 book value per share (`) (refer note 2 below) 5.34 4.64 4.12 3.79 3.48
note 1 Earnings per share are calculated by dividing the net profit or loss after tax for the year attributable to equity shareholders by the weighted average number of equity shares outstanding during the year.
note 2Book Value per share = (Total Shareholders Funds-Debit balance in Profit and Loss Account-Debit balance in Revenue Account) Total number of shares

Financial StatementsStatutory ReportsCorporate Overview
141
Annexure 23.19 Accounting ratios (refer notes below)
Sl. no.
description March 31, 2018 March 31, 2017
1. New business premium income growth (segment-wise) Participating policies 0.3% 8% Non-participating policies 27% 127% Par Pension 18% 343% Non- Par Annuity -8% 340% Non- Par Pension -34% 28% Health -75% -45% Group - linked 992% 38% Individual Life - Linked 145% -63% Pension - linked NA -171%(current year new business premium -previous year new business premium)/previous year new business premium
2. net retention ratio 98% 97%(net premium/gross premium)
3. Ratio of expenses of management 26% 29%(expenses of management / total gross direct premium)
4. commission ratio 5% 6%(gross commission paid/gross premium)
5. Ratio of policyholders' liabilities to shareholders' funds 1527% 1548%(policyholders' liabilities / shareholders' funds)
6. growth rate of shareholders' funds 15% 12%[current year shareholders' funds - previous year shareholders' funds) / previous year shareholders' funds)
7. Ratio of surplus/(deficit) to policyholders' liability 1% 0%[surplus/(deficit) as per policyholders' liability]
8. change in net worth 1,413,926 1,037,085[current year shareholders' funds - previous year shareholders' funds]
9. profit (loss) after tax/Total income 2.65% 2.18%10. (Total real estate + loans)/cash & invested assets 0% 0%11. Total investments/[capital + Surplus [deficit]] 1603% 1624%12. Total affiliated investments/[capital + Surplus (deficit)] 2% 3%13 Investment yield (gross & net)
- Non linked Par (With unrealised gains/losses) 5% 12%- Non linked Par (With realised gains/losses) 9% 9%- Non linked Non Par (With unrealised gains/losses) 5% 12%- Non linked Non Par (With realised gains/losses) 8% 8%
14 conservation Ratio- Linked 76% 70%- Non Linked 81% 77%- Pension (both Linked and Non Linked) 74% 67%- Health 82% 78%
15 persistency RatioFor 13th month 77% 73%For 25th month 58% 53%For 37th month 46% 42%For 49th Month 37% 40%For 61st month 28% 27%
16 npA RatioGross NPA Ratio - -Net NPA Ratio - -
note:1 The above ratios have been calculated based on Revenue Account, Profit and Loss Account for the year ended March 31, 2018 and for the
year ended March 31, 2017 and the Balance Sheet as at March 31, 2018 and March 31, 2017.
2 Shareholders' funds are net of accumulated deficit in Profit & loss account and Reveneue Account, for the purpose of calculating relevant ratios.

142
An
nex
ure
3R
elat
ed p
arty
dis
clo
sure
s as
per
Acc
ou
nti
ng
Sta
nd
ard
18
Rel
ated
par
ties
an
d n
atu
re o
f R
elat
ion
ship
:
Sl n
on
ame
of
Rel
ated
par
ties
nat
ure
of
Rel
atio
nsh
ip
1Pu
njab
Nat
iona
l Ban
kSi
gnifi
cant
Influ
ence
2M
etLi
fe In
tern
atio
nal H
oldi
ngs,
LLC
(e
rstw
hile
Met
Life
Inte
rnat
iona
l Hol
ding
s, In
c)Si
gnifi
cant
Influ
ence
or
Con
trol
ling
Ente
rpris
e*
3A
shis
h K
umar
Sriv
asta
vaK
ey M
anag
emen
t Pe
rson
nel -
Inte
rim C
EO a
nd p
rinci
pal o
ffic
er (
From
31/
03/2
017
to 3
0/09
/201
7) &
Man
agin
g D
irect
or a
nd
CEO
(eff
ectiv
e fr
om O
ctob
er 0
1, 2
017)
4Ta
run
Chu
ghK
ey M
anag
emen
t Pe
rson
nel -
Man
agin
g D
irect
or (u
pto
Mar
ch 3
1, 2
017)
The
follo
win
g a
re t
he
tran
sact
ion
s b
etw
een
th
e c
om
pan
y an
d it
s re
late
d p
arti
es:
(` in
'000
)
Sl
no
nam
e o
f th
e re
late
d
part
y w
ith
wh
om
th
e tr
ansa
ctio
ns
hav
e b
een
mad
e
des
crip
tio
n o
f th
e R
elat
ion
ship
wit
h
the
part
y
nat
ure
of
Tran
sact
ion
cu
rren
t ye
arpr
evio
us
year
Am
ou
nt
Am
ou
nt
ou
tsta
nd
ing
as
reco
vera
ble
as
on
M
arch
31,
201
8
Am
ou
nt
ou
tsta
nd
ing
as
pay
able
as
on
M
arch
31,
201
8
Am
ou
nt
Am
ou
nt
ou
tsta
nd
ing
as
reco
vera
ble
as
on
M
arch
31,
201
7
Am
ou
nt
ou
tsta
nd
ing
as
pay
able
as
on
M
arch
31,
201
7
1M
etLi
fe In
tern
atio
nal
Hol
ding
s, L
LCSi
gnifi
cant
Influ
ence
or
Con
trol
ling
Ente
rpris
e*Re
ceiv
ed/R
ecei
vabl
e to
war
ds -
a) C
ompe
nsat
ion
96,7
53
33,8
09
NIL
115,
211
36,3
11
NIL
b) In
form
atio
n te
chno
logy
14
,078
96
5 N
IL1,
350
NIL
NIL
c) T
rave
l and
oth
ers
5,28
6 2,
180
NIL
11,3
46
2,24
6 N
IL
Paid
/Pay
able
tow
ards
-
a) C
onfe
renc
e/Tr
avel
N
ILN
ILN
IL5,
301
NIL
NIL
b) P
eanu
t Li
cens
e fe
e (In
clus
ive
of
fore
ign
exch
ange
flu
ctua
tions
)2,
665
NIL
927
3,61
0 N
IL78
8
2Pu
njab
Nat
iona
l Ban
kSi
gnifi
cant
Influ
ence
Rece
ived
/Rec
eiva
ble
tow
ards
-
a) P
rem
ium
NIL
NIL
NIL
4,53
6 N
ILN
IL
b) In
tere
st/D
ivid
end
21,2
16
3,02
2 N
IL41
,681
2,
963
NIL
c) B
ank
bala
nces
(Cur
rent
acc
ount
/sho
rt
term
dep
osit)
NIL
1,30
5,86
4 N
ILN
IL91
7,33
3 N
IL
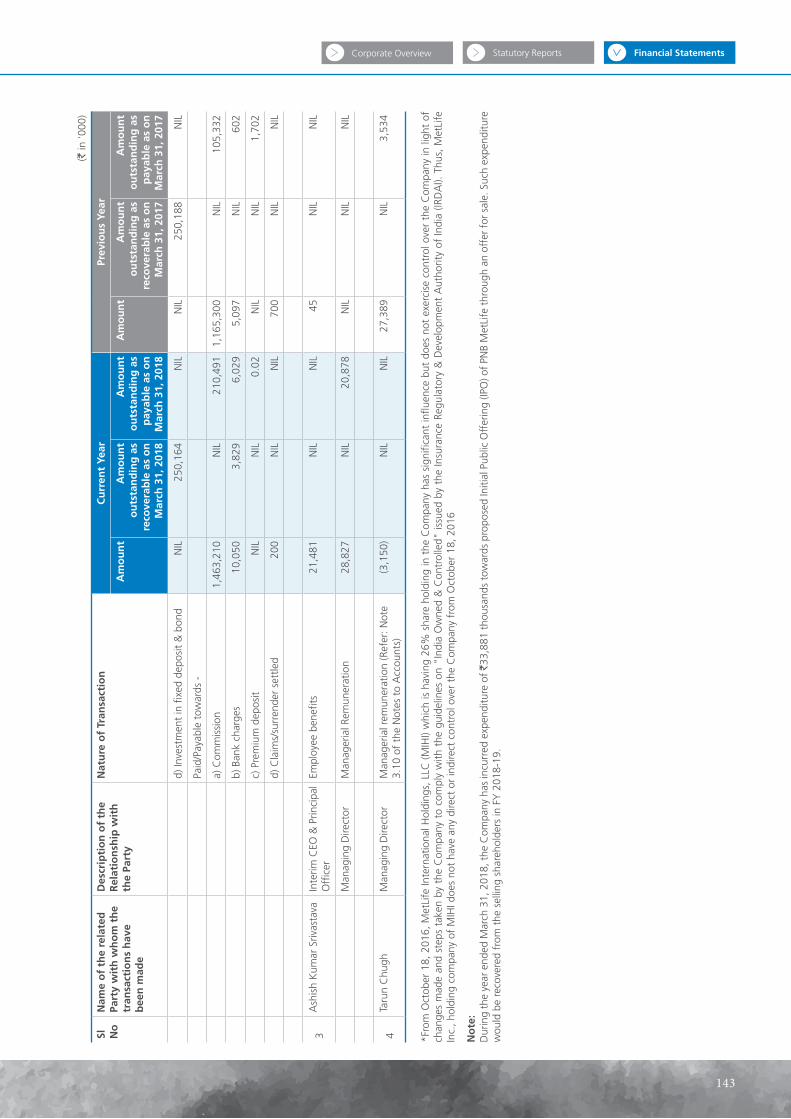
Financial StatementsStatutory ReportsCorporate Overview
143
(` in
'000
)
Sl
no
nam
e o
f th
e re
late
d
part
y w
ith
wh
om
th
e tr
ansa
ctio
ns
hav
e b
een
mad
e
des
crip
tio
n o
f th
e R
elat
ion
ship
wit
h
the
part
y
nat
ure
of
Tran
sact
ion
cu
rren
t ye
arpr
evio
us
year
Am
ou
nt
Am
ou
nt
ou
tsta
nd
ing
as
reco
vera
ble
as
on
M
arch
31,
201
8
Am
ou
nt
ou
tsta
nd
ing
as
pay
able
as
on
M
arch
31,
201
8
Am
ou
nt
Am
ou
nt
ou
tsta
nd
ing
as
reco
vera
ble
as
on
M
arch
31,
201
7
Am
ou
nt
ou
tsta
nd
ing
as
pay
able
as
on
M
arch
31,
201
7
d) In
vest
men
t in
fix
ed d
epos
it &
bon
dN
IL25
0,16
4N
ILN
IL25
0,18
8 N
IL
Paid
/Pay
able
tow
ards
-
a) C
omm
issi
on1,
463,
210
NIL
210,
491
1,16
5,30
0 N
IL10
5,33
2
b) B
ank
char
ges
10,0
50
3,82
9 6,
029
5,09
7 N
IL60
2
c) P
rem
ium
dep
osit
NIL
NIL
0.02
N
ILN
IL1,
702
d) C
laim
s/su
rren
der
sett
led
200
NIL
NIL
700
NIL
NIL
3A
shis
h K
umar
Sriv
asta
vaIn
terim
CEO
& P
rinci
pal
Off
icer
Empl
oyee
ben
efits
21,4
81
NIL
NIL
45
NIL
NIL
Man
agin
g D
irect
orM
anag
eria
l Rem
uner
atio
n28
,827
N
IL20
,878
N
ILN
ILN
IL
4Ta
run
Chu
ghM
anag
ing
Dire
ctor
Man
ager
ial r
emun
erat
ion
(Ref
er: N
ote
3.10
of
the
Not
es t
o A
ccou
nts)
(3,1
50)
NIL
NIL
27,3
89
NIL
3,53
4
*Fro
m O
ctob
er 1
8, 2
016,
Met
Life
Inte
rnat
iona
l Hol
ding
s, L
LC (M
IHI)
whi
ch is
hav
ing
26%
sha
re h
oldi
ng in
the
Com
pany
has
sig
nific
ant
influ
ence
but
doe
s no
t ex
erci
se c
ontr
ol o
ver
the
Com
pany
in li
ght
of
chan
ges
mad
e an
d st
eps
take
n by
the
Com
pany
to
com
ply
with
the
gui
delin
es o
n "I
ndia
Ow
ned
& C
ontr
olle
d" is
sued
by
the
Insu
ranc
e Re
gula
tory
& D
evel
opm
ent
Aut
horit
y of
Indi
a (IR
DA
I). T
hus,
Met
Life
In
c., h
oldi
ng c
ompa
ny o
f M
IHI d
oes
not
have
any
dire
ct o
r in
dire
ct c
ontr
ol o
ver
the
Com
pany
fro
m O
ctob
er 1
8, 2
016
no
te:
Dur
ing
the
year
end
ed M
arch
31,
201
8, t
he C
ompa
ny h
as in
curr
ed e
xpen
ditu
re o
f `3
3,88
1 th
ousa
nds
tow
ards
pro
pose
d In
itial
Pub
lic O
ffer
ing
(IPO
) of
PNB
Met
Life
thr
ough
an
offe
r fo
r sa
le. S
uch
expe
nditu
re
wou
ld b
e re
cove
red
from
the
sel
ling
shar
ehol
ders
in F
Y 2
018-
19.

144
An
nex
ure
4ST
ATe
Men
T O
F Se
gM
enTA
l A
SSeT
S A
nd
lIA
bIl
ITIe
S A
S A
T M
AR
ch
31,
201
8(`
in '0
00)
part
icu
lars
par
no
n p
arpa
r pe
nsi
on
no
n p
ar
An
nu
ity
no
n p
ar
pen
sio
nh
ealt
hg
rou
p
pen
sio
n
lin
ked
Ind
ivid
ual
li
fe l
inke
d
Ind
ivid
ual
pe
nsi
on
li
nke
dSh
areh
old
ers
Tota
l
SOu
Rc
eS O
F Fu
nd
S:Sh
AR
ehO
ldeR
S Fu
nd
SSh
are
capi
tal
--
--
--
--
-20
,128
,843
20,1
28,8
43Re
serv
es a
nd s
urpl
us-
--
--
--
--
--
Fair
valu
e ch
ange
acc
ount
- N
et-
--
--
--
--
(128
)(1
28)
Tota
l sh
areh
old
ers'
fu
nd
s-
--
--
--
--
20,1
28,7
1520
,128
,715
Borr
owin
gs43
,174
41,5
7320
465
381
546
19,2
7746
-10
5,20
3PO
LIC
YH
OLD
ERS'
FU
ND
SFa
ir va
lue
chan
ge a
ccou
nt40
,625
(2,8
20)
--
--
--
--
37,8
05Po
licy
liabi
litie
s67
,697
,985
29,3
09,3
4476
8,57
320
6,70
938
8,74
280
1,05
6-
--
-99
,172
,409
Insu
ranc
e re
serv
es-
--
--
--
--
--
Prov
isio
n fo
r lin
ked
liabi
litie
s- N
on u
nit
--
--
--
489
393,
190
349
-39
4,02
8Pr
ovis
ion
for
linke
d lia
bilit
ies
--
--
--
1,53
3,26
154
,464
,803
1,09
4,64
2-
57,0
92,7
06To
tal p
olic
yho
lder
s' f
un
ds
67,7
38,6
1029
,306
,524
768,
573
206,
709
388,
742
801,
056
1,53
3,75
054
,857
,993
1,09
4,99
1-
156,
696,
948
Fund
s fo
r di
scon
tinue
d po
licie
s-
Dis
cont
inue
d on
acc
ount
of
non-
pa
ymen
t of
pre
miu
m-
--
--
--
5,74
9,23
2-
-5,
749,
232
Fund
s fo
r fu
ture
app
ropr
iatio
ns
1,64
5,75
4-
145,
121
--
--
--
-1,
790,
875
TOTA
l69
,427
,538
29,3
48,0
9791
3,89
820
6,77
438
8,74
580
1,87
11,
533,
796
60,6
26,5
021,
095,
037
20,1
28,7
1518
4,47
0,97
3A
pplI
cA
TIO
n O
F Fu
nd
S:In
VeS
TMen
TSSh
areh
olde
rs'
--
--
--
--
-10
,532
,432
10,5
32,4
32Po
licyh
olde
rs'
67,8
85,5
7128
,456
,663
854,
304
202,
313
450,
774
795,
161
489
393,
190
349
-99
,038
,814
Ass
ets
held
to
cove
r lin
ked
liabi
litie
s-
--
--
-1,
533,
261
60,2
14,0
351,
094,
642
-62
,841
,938
Loan
s32
6,05
442
,417
--
--
--
--
368,
471
Fixe
d as
sets
231,
782
223,
182
1,09
435
118
4,37
324
510
3,48
724
923
0,26
679
5,04
7C
urre
nt a
sset
sC
ash
and
bank
bal
ance
s25
7,19
31,
597,
943
10,2
971,
019
7211
0,96
327
990
7,05
513
,370
-2,
898,
191
Adv
ance
s an
d ot
her
asse
ts3,
663,
674
3,91
9,23
459
,939
250
9,52
774
,528
6922
2,80
03,
284
288,
912
8,24
2,21
73,
920,
867
5,51
7,17
770
,236
1,26
99,
599
185,
491
348
1,12
9,85
516
,654
288,
912
11,1
40,4
08Le
ss :
Cur
rent
liab
ilitie
s2,
839,
123
4,75
0,97
515
,555
1,73
212
218
8,63
847
51,
542,
000
22,7
29-
9,36
1,34
9Pr
ovis
ions
101,
238
96,8
6655
562
46,
726
1754
,985
810
-26
1,26
32,
940,
361
4,84
7,84
116
,110
1,79
412
619
5,36
449
21,
596,
985
23,5
39-
9,62
2,61
2N
et c
urre
nt a
sset
s98
0,50
666
9,33
654
,126
(525
)9,
473
(9,8
73)
(144
)(4
67,1
30)
(6,8
85)
288,
912
1,51
7,79
6C
ontr
ol A
ccou
nt3,
625
(43,
501)
4,37
44,
635
(71,
520)
12,2
10(5
5)38
2,92
06,
682
(299
,370
)-
Mis
cella
neou
s ex
pend
iture
(to
the
ext
ent
not
writ
ten
off)
--
--
--
--
--
-
Def
icit/
(Sur
plus
) in
Polic
yhol
ders
acc
ount
-9,
376,
475
9,37
6,47
5D
ebit
bala
nce
in p
rofit
and
loss
acc
ount
--
--
--
--
--
-TO
TAl
69,4
27,5
3829
,348
,097
913,
898
206,
774
388,
745
801,
871
1,53
3,79
660
,626
,502
1,09
5,03
720
,128
,715
184,
470,
973

Financial StatementsStatutory ReportsCorporate Overview
145
An
nex
ure
4Se
gM
enTA
l R
eVen
ue
Ac
cO
un
T FO
R T
he
yeA
R e
nd
ed M
AR
ch
31,
201
8(`
in '0
00)
part
icu
lars
Sch
edu
lepa
rn
on
par
par
pe
nsi
on
no
n p
ar
An
nu
ity
no
n p
ar
pen
sio
nh
ealt
hg
rou
p
pen
sio
n
lin
ked
Ind
ivid
ual
li
fe l
inke
d
Ind
ivid
ual
pe
nsi
on
li
nke
dTo
tal
Prem
ium
s ea
rned
- n
et
(a)
Prem
ium
(net
of
serv
ice
tax)
116
,257
,185
14,0
27,6
9540
5,93
8.00
85,6
1115
,261
533,
965
171,
420
7,99
1,16
446
,869
39,5
35,1
08
(b)
Rein
sura
nce
cede
d34
7(7
93,7
99)
92.0
038
-(2
7,42
9)-
(109
,204
)-
(929
,955
)
(c)
Rein
sura
nce
acce
pted
16,2
57,5
3213
,233
,896
406,
030.
0085
,649
15,2
6150
6,53
617
1,42
07,
881,
960
46,8
6938
,605
,153
Inco
me
from
inve
stm
ents
(a)
Inte
rest
, div
iden
ds a
nd r
ent
- ne
t of
acc
retio
n/am
ortis
atio
n of
di
scou
nt/ p
rem
ium
)4,
969,
114
2,02
1,13
445
,528
.00
10,4
9338
,893
44,7
0910
2,46
32,
317,
886
30,6
469,
580,
866
(b)
Prof
it on
sal
e/re
dem
ptio
n of
in
vest
men
ts25
2,08
712
,843
--
--
27,6
337,
119,
870
170,
446
7,58
2,87
9
(c)
(Los
s) o
n sa
le/ r
edem
ptio
n of
in
vest
men
ts(1
,619
)(1
,177
)-
-(3
,556
)-
(18,
737)
(776
,842
)(1
3,83
4)(8
15,7
65)
(d)
Tran
sfer
/gai
n on
rev
alua
tion/
chan
ge in
fai
r va
lue
--
--
--
(21,
873)
(2,7
90,4
36)
(59,
364)
(2,8
71,6
73)
Oth
er In
com
e
(a)
Inte
rest
on
polic
y lo
ans
31,0
583,
301
--
--
--
-34
,359
(b)
Mis
cella
neou
s in
com
e24
,148
146,
338
146.
00-
11,
596
413
,004
193
185,
430
Con
trib
utio
n fr
om t
he S
hare
hold
ers'
A
ccou
nt
-48
3,27
0-
1,03
8-
--
--
484,
308
Tota
l (A
)21
,532
,320
15,8
99,6
0545
1,70
4.00
97,1
8050
,599
552,
841
260,
910
13,7
65,4
4217
4,95
652
,785
,557
Com
mis
sion
284
5,92
51,
025,
458
12,5
27.0
076
012
15,4
98(2
)25
4,48
210
02,
154,
760
Ope
ratin
g ex
pens
es r
elat
ed t
o in
sura
nce
busi
ness
33,
495,
737
3,21
9,81
820
,411
.00
4,67
752
875
,217
3,61
21,
324,
078
4,31
78,
148,
395
Serv
ice
tax
/Goo
ds a
nd S
ervi
ces
Tax
on
Cha
rges
834
--
--
-1,
960
382,
740
387
385,
921
Prov
isio
n fo
r do
ubtf
ul d
ebts
--
--
--
--
--
Bad
debt
s w
ritte
n of
f-
--
--
--
--
-
Prov
isio
n fo
r In
com
e Ta
x-
--
--
--
--
-
Prov
isio
ns (o
ther
tha
n ta
xatio
n)-
--
--
--
--
-
(a)
For
dim
inut
ion
in t
he v
alue
of
inve
stm
ents
--
--
--
--
--
(b)
Adv
ance
s &
Rec
over
ies
4,56
0(3
75)
61.0
086
1(6
1)17
7(8
,812
)(3
27)
(4,6
90)
Tota
l (b
)4,
347,
056
4,24
4,90
132
,999
5,52
354
190
,654
5,74
71,
952,
488
4,47
710
,684
,386

146
(` in
'000
)
part
icu
lars
Sch
edu
lepa
rn
on
par
par
pe
nsi
on
no
n p
ar
An
nu
ity
no
n p
ar
pen
sio
nh
ealt
hg
rou
p
pen
sio
n
lin
ked
Ind
ivid
ual
li
fe l
inke
d
Ind
ivid
ual
pe
nsi
on
li
nke
dTo
tal
Bene
fits
paid
(net
)4
1,86
3,11
52,
321,
913
13,9
758,
558
148,
748
27,8
6018
0,03
116
,146
,010
374,
139
21,0
84,3
49
Inte
rim b
onus
es p
aid
25,8
00-
130
--
--
--
25,9
30
Cha
nge
in v
alua
tion
of li
abili
ty in
re
spec
t of
life
pol
icie
s
(a)
Gro
ss14
,843
,709
11,2
02,1
8038
2,29
883
,099
(121
,807
)32
8,63
869
,442
(4,8
02,4
54)
(226
,550
)21
,758
,555
(b)
Am
ount
ced
ed in
rei
nsur
ance
(29,
685)
(2,4
11,2
51)
--
-8,
204
-44
,041
2(2
,388
,689
)
(c)
Am
ount
acc
epte
d in
rei
nsur
ance
--
--
--
--
--
Tota
l (c
)16
,702
,939
11,1
12,8
4239
6,40
391
,657
26,9
4136
4,70
224
9,47
311
,387
,597
147,
591
40,4
80,1
45
Surp
lus/
(def
icit
) (d
) =
(A
) -
(b)
- (c
)48
2,32
554
1,86
222
,302
-23
,117
97,4
855,
690
425,
357
22,8
881,
621,
026
Ap
pro
pri
atio
ns
Tran
sfer
to
shar
ehol
ders
' acc
ount
23
5,50
654
1,86
297
5-
23,1
1797
,485
5,69
042
5,35
722
,888
1,35
2,88
0
Tran
sfer
to
othe
r re
serv
es-
--
--
--
--
-
Fund
s fo
r fu
ture
app
ropr
iatio
ns24
6,81
9-
21,3
27-
--
--
-26
8,14
6
Surp
lus/
(Def
icit)
aft
er a
ppro
pria
ton
--
--
--
--
--
Tota
l (d
)48
2,32
554
1,86
222
,302
-23
,117
97,4
855,
690
425,
357
22,8
881,
621,
026
det
ails
of
Tota
l Su
rplu
s/(d
efic
it)
(a)
Inte
rim b
onus
es p
aid
25,8
00-
130
--
--
--
25,9
30
(b)
Allo
catio
n of
bon
us t
o po
licyh
olde
rs'
2,11
9,55
0-
8,77
7-
--
--
-2,
128,
327
(c)
Surp
lus
show
n in
the
Rev
enue
A
ccou
nt48
2,32
554
1,86
222
,302
-23
,117
97,4
855,
690
425,
357
22,8
881,
621,
026
Tota
l Su
rplu
s/(d
efic
it)
2,62
7,67
554
1,86
231
,209
-23
,117
97,4
855,
690
425,
357
22,8
883,
775,
283

Financial StatementsStatutory ReportsCorporate Overview
147
An
nex
ure
4ST
ATe
Men
T O
F Se
gM
enTA
l A
SSeT
S A
nd
lIA
bIl
ITIe
S A
S A
T M
AR
ch
31,
201
7(`
in '0
00)
part
icu
lars
par
no
n p
arpa
r pe
nsi
on
no
n p
ar
An
nu
ity
no
n p
ar
pen
sio
nh
ealt
hg
rou
p
pen
sio
n
lin
ked
Ind
ivid
ual
li
fe l
inke
d
Ind
ivid
ual
pe
nsi
on
li
nke
dSh
areh
old
ers
Tota
l
SOu
Rc
eS O
F Fu
nd
S:Sh
AR
ehO
ldeR
S Fu
nd
SSh
are
capi
tal
--
--
--
--
-20
,128
,843
20,1
28,8
43Re
serv
es a
nd s
urpl
us-
--
--
--
--
2,20
9,95
22,
209,
952
Fair
valu
e ch
ange
acc
ount
- N
et-
--
--
--
--
2,87
02,
870
Tota
l sh
areh
old
ers'
fu
nd
s-
--
--
--
--
22,3
41,6
6522
,341
,665
Borr
owin
gs79
,496
49,4
341,
859
94-
4,67
8-
34,6
4242
9-
170,
632
pOlI
cy
hO
ldeR
S' F
un
dS
Fair
valu
e ch
ange
acc
ount
20,8
824,
292
--
--
--
--
25,1
74Po
licy
liabi
litie
s52
,883
,961
20,5
18,4
1738
6,27
412
3,60
751
0,54
946
4,21
5-
--
-74
,887
,023
Insu
ranc
e re
serv
es-
--
--
--
--
--
Prov
isio
n fo
r lin
ked
liabi
litie
s- N
on u
nit
--
--
--
-42
1,62
82,
510
-42
4,13
8Pr
ovis
ion
for
linke
d lia
bilit
ies
--
--
--
1,46
4,30
959
,019
,153
1,31
9,02
9-
61,8
02,4
91To
tal p
olic
yho
lder
s' f
un
ds
52,9
04,8
4320
,522
,709
386,
274
123,
607
510,
549
464,
215
1,46
4,30
959
,440
,781
1,32
1,53
9-
137,
138,
826
Fund
s fo
r di
scon
tinue
d po
licie
s -
Dis
cont
inue
d on
acc
ount
of
non-
pa
ymen
t of
pre
miu
m-
--
--
--
5,92
4,85
7-
-5,
924,
857
Fund
s fo
r fu
ture
app
ropr
iatio
ns
1,39
8,93
3-
123,
796
--
--
--
-1,
522,
729
TOTA
l54
,383
,272
20,5
72,1
4351
1,92
912
3,70
151
0,54
946
8,89
31,
464,
309
65,4
00,2
801,
321,
968
22,3
41,6
6516
7,09
8,70
9A
pplI
cA
TIO
n O
F Fu
nd
S:In
VeS
TMen
TSSh
areh
olde
rs'
--
--
--
--
-7,
032,
825
7,03
2,82
5Po
licyh
olde
rs'
53,4
11,6
1921
,494
,794
414,
593
115,
765
542,
617
426,
887
-42
1,62
82,
510
-76
,830
,413
Ass
ets
held
to
cove
r lin
ked
liabi
litie
s-
--
--
-1,
464,
309
64,9
44,0
101,
319,
029
-67
,727
,348
Loan
s25
9,35
029
,027
--
--
--
--
288,
377
Fixe
d as
sets
227,
507
182,
317
874
363
3011
,430
235
59,0
8838
923
4,33
371
6,56
6C
urre
nt a
sset
sC
ash
and
bank
bal
ance
s47
7,55
41,
066,
955
5642
832
96,2
1416
396
8,00
815
,652
-2,
625,
062
Adv
ance
s an
d ot
her
asse
ts2,
922,
349
3,23
2,49
626
,986
9018
,689
47,3
1434
202,
302
3,27
121
5,46
56,
668,
996
3,39
9,90
34,
299,
451
27,0
4251
818
,721
143,
528
197
1,17
0,31
018
,923
215,
465
9,29
4,05
8Le
ss :
Cur
rent
liab
ilitie
s2,
079,
401
3,77
8,92
27,
098
673
5015
1,09
025
61,
520,
108
24,5
79-
7,56
2,17
7Pr
ovis
ions
88,3
9571
,225
302
292
6,42
311
64,6
201,
045
-23
2,05
22,
167,
796
3,85
0,14
77,
400
702
5215
7,51
326
71,
584,
728
25,6
24-
7,79
4,22
9N
et c
urre
nt a
sset
s1,
232,
107
449,
304
19,6
42(1
84)
18,6
69(1
3,98
5)(7
0)(4
14,4
18)
(6,7
01)
215,
465
1,49
9,82
9C
ontr
ol A
ccou
nt(7
47,3
11)
(1,8
14,3
66)
76,8
20(2
0,94
1)(9
2,96
7)(7
3,48
3)83
,367
(12,
715,
993)
445,
832
14,8
59,0
42-
Mis
cella
neou
s ex
pend
iture
(to
the
exte
nt
not
writ
ten
off)
--
--
--
--
--
-
Def
icit/
(Sur
plus
) in
Polic
yhol
ders
acc
ount
-23
1,06
7-
28,6
9842
,200
118,
044
(83,
532)
13,1
05,9
65(4
39,0
91)
-13
,003
,351
Deb
it ba
lanc
e in
pro
fit a
nd lo
ss a
ccou
nt-
--
--
--
--
--
TOTA
l54
,383
,272
20,5
72,1
4351
1,92
912
3,70
151
0,54
946
8,89
31,
464,
309
65,4
00,2
801,
321,
968
22,3
41,6
6516
7,09
8,70
9

148
An
nex
ure
4Se
gM
enTA
l R
eVen
ue
Ac
cO
un
T FO
R T
he
yeA
R e
nd
ed M
AR
ch
31,
201
7(`
in '0
00)
part
icu
lars
Sch
edu
lepa
rn
on
par
par
pe
nsi
on
no
n p
ar
An
nu
ity
no
n p
ar
pen
sio
nh
ealt
hg
rou
p
pen
sio
n
lin
ked
Ind
ivid
ual
li
fe l
inke
d
Ind
ivid
ual
pe
nsi
on
li
nke
dTo
tal
Prem
ium
s ea
rned
- n
et
(a)
Prem
ium
(net
of
serv
ice
tax)
113
,955
,457
10,0
27,5
2723
5,64
192
,675
14,5
5058
0,74
066
,072
7,32
4,35
763
,782
32,3
60,8
01
(b)
Rein
sura
nce
cede
d(1
9,41
1)(8
02,2
95)
1125
-(1
7,54
7)-
(132
,816
)29
1(9
71,7
42)
(c)
Rein
sura
nce
acce
pted
13,9
36,0
469,
225,
232
235,
652
92,7
0014
,550
563,
193
66,0
727,
191,
541
64,0
7331
,389
,059
Inco
me
from
inve
stm
ents
(a)
Inte
rest
, div
iden
ds a
nd r
ent
- ne
t of
acc
retio
n/am
ortis
atio
n of
di
scou
nt/ p
rem
ium
)3,
982,
817
1,53
4,31
525
,861
4,02
056
,034
18,8
5499
,889
2,34
8,55
838
,275
8,10
8,62
3
(b)
Prof
it on
sal
e/re
dem
ptio
n of
in
vest
men
ts2,
747
379
--
3,54
51,
200
40,0
185,
482,
004
145,
517
5,67
5,41
0
(c)
(Los
s) o
n sa
le/ r
edem
ptio
n of
in
vest
men
ts-
--
--
-(9
,974
)(4
93,8
30)
(9,4
16)
(513
,220
)
(d)
Tran
sfer
/gai
n on
rev
alua
tion/
chan
ge in
fai
r va
lue
--
--
--
31,9
741,
857,
207
46,1
021,
935,
283
Oth
er In
com
e
(a)
Inte
rest
on
polic
y lo
ans
26,0
262,
730
--
--
--
-28
,756
(b)
Mis
cella
neou
s in
com
e13
,666
119,
059
50-
-97
32
9,77
515
814
3,68
3
Con
trib
utio
n fr
om t
he S
hare
hold
ers'
A
ccou
nt
Tota
l (A
)17
,961
,302
10,8
81,7
1526
1,56
396
,720
74,1
2958
4,22
022
7,98
116
,395
,255
284,
709
46,7
67,5
94
Com
mis
sion
287
0,42
474
1,63
98,
522
787
111
40,8
5610
134,
007
165
1,79
6,52
1
Ope
ratin
g ex
pens
es r
elat
ed t
o in
sura
nce
busi
ness
33,
588,
186
2,82
9,03
016
,859
5,21
14,
072
195,
321
2,67
982
0,44
14,
540
7,46
6,33
9
Serv
ice
tax
on C
harg
es84
4-
--
14-
1,36
935
3,37
82,
853
358,
458
Prov
isio
n fo
r do
ubtf
ul d
ebts
--
--
--
--
--
Bad
debt
s w
ritte
n of
f-
--
--
--
--
-
Prov
isio
n fo
r In
com
e Ta
x-
--
--
--
--
-
Prov
isio
ns (o
ther
tha
n ta
xatio
n)-
--
--
--
--
-
(a)
For
dim
inut
ion
in t
he v
alue
of
inve
stm
ents
--
--
--
--
--
(b)
Adv
ance
s &
Rec
over
ies
17,7
8618
,709
380
1,10
4(1
07)
78(1
65)
12,0
58(1
,380
)48
,463
Tota
l (b
)4,
477,
240
3,58
9,37
825
,761
7,10
24,
090
236,
255
3,89
31,
319,
884
6,17
89,
669,
781

Financial StatementsStatutory ReportsCorporate Overview
149
(` in
'000
)
part
icu
lars
Sch
edu
lepa
rn
on
par
par
pe
nsi
on
no
n p
ar
An
nu
ity
no
n p
ar
pen
sio
nh
ealt
hg
rou
p
pen
sio
n
lin
ked
Ind
ivid
ual
li
fe l
inke
d
Ind
ivid
ual
pe
nsi
on
li
nke
dTo
tal
Bene
fits
paid
(net
)4
1,47
5,24
82,
164,
053
12,2
904,
813
418,
328
10,7
0312
5,54
113
,023
,722
456,
129
17,6
90,8
27
Inte
rim b
onus
es p
aid
15,6
254
1,18
4-
--
--
-16
,813
Cha
nge
in v
alua
tion
of li
abili
ty in
re
spec
t of
life
pol
icie
s
(a)
Gro
ss12
,052
,927
6,87
7,11
017
0,03
510
0,09
9(3
34,0
75)
393,
966
93,1
191,
100,
585
(200
,364
)20
,253
,402
(b)
Am
ount
ced
ed in
rei
nsur
ance
(17,
900)
(1,2
20,9
90)
--
-(3
0,18
9)-
(108
)(2
)(1
,269
,189
)
(c)
Am
ount
acc
epte
d in
rei
nsur
ance
--
--
--
--
--
Tota
l (c
)13
,525
,900
7,82
0,17
718
3,50
910
4,91
284
,253
374,
480
218,
660
14,1
24,1
9925
5,76
336
,691
,853
Surp
lus/
(def
icit
) (d
) =
(A
) -
(b)
- (c
)(4
1,83
8)(5
27,8
40)
52,2
93(1
5,29
4)(1
4,21
4)(2
6,51
5)5,
428
951,
172
22,7
6840
5,96
0
Ap
pro
pri
atio
ns
Tran
sfer
to
shar
ehol
ders
' acc
ount
14
6,43
0-
454
--
--
--
146,
884
Tran
sfer
to
othe
r re
serv
es-
--
--
--
--
-
Fund
s fo
r fu
ture
app
ropr
iatio
ns(1
88,2
68)
-51
,839
--
--
--
(136
,429
)
Surp
lus/
(def
icit
) af
ter
app
rop
riat
on
-(5
27,8
40)
-(1
5,29
4)(1
4,21
4)(2
6,51
5)5,
428
951,
172
22,7
6839
5,50
5To
tal (
d)
(41,
838)
(527
,840
)52
,293
(15,
294)
(14,
214)
(26,
515)
5,42
895
1,17
222
,768
405,
960
bal
ance
at
the
beg
inn
ing
of
year
-29
6,77
3-
(13,
404)
(27,
986)
(91,
529)
78,1
04(1
4,05
7,13
7)41
6,32
3(1
3,39
8,85
6)
Surp
lus/
(Def
icit)
aft
er a
ppro
pria
tion
-(5
27,8
40)
-(1
5,29
4)(1
4,21
4)(2
6,51
5)5,
428
951,
172
22,7
6839
5,50
5
bal
ance
car
ried
to
bal
ance
sh
eet
-(2
31,0
67)
-(2
8,69
8)(4
2,20
0)(1
18,0
44)
83,5
32(1
3,10
5,96
5)43
9,09
1(1
3,00
3,35
1)
det
ails
of
Tota
l Su
rplu
s/(d
efic
it)
(a)
Inte
rim b
onus
es p
aid
15,6
254
1,18
4-
--
--
-16
,813
(b)
Allo
catio
n of
bon
us t
o po
licyh
olde
rs'
1,31
7,87
0-
4,08
4-
--
--
-1,
321,
954
(c)
Surp
lus
show
n in
the
Rev
enue
A
ccou
nt(4
1,83
8)(5
27,8
40)
52,2
93(1
5,29
4)(1
4,21
4)(2
6,51
5)5,
428
951,
172
22,7
6840
5,96
0
Tota
l Su
rplu
s/(d
efic
it)
1,29
1,65
7(5
27,8
36)
57,5
61(1
5,29
4)(1
4,21
4)(2
6,51
5)5,
428
951,
172
22,7
681,
744,
727

150
An
nex
ure
4Sc
hed
ule
1 -
pR
eMIu
M
(` in
'000
)
part
icu
lars
Mar
ch 3
1, 2
018
par
no
n p
arpe
nsi
on
no
n p
ar
An
nu
ity
no
n p
ar
pen
sio
nh
ealt
hg
rou
p
pen
sio
n
lin
ked
Ind
ivid
ual
li
fe l
inke
d
Ind
ivid
ual
pe
nsi
on
li
nke
dTo
tal
Firs
t ye
ar P
rem
ium
s4,
967,
364
5,14
0,43
822
8,78
5-
8,59
959
,488
2,21
02,
204,
153
(30)
12,6
11,0
07
Rene
wal
Pre
miu
ms
11,2
90,4
007,
701,
718
177,
153
-6,
662
474,
477
65,2
035,
501,
893
46,7
9625
,264
,302
Sing
le P
rem
ium
s(5
79)
1,18
5,53
9-
85,6
11-
-10
4,00
728
5,11
810
31,
659,
799
Tota
l pre
miu
m16
,257
,185
14,0
27,6
9540
5,93
885
,611
15,2
6153
3,96
517
1,42
07,
991,
164
46,8
6939
,535
,108
Sch
edu
le 2
- c
OM
MIS
SIO
n e
xpe
nSe
S
(` in
'000
)
part
icu
lars
Mar
ch 3
1, 2
018
par
no
n p
arpe
nsi
on
no
n p
ar
An
nu
ity
no
n p
ar
pen
sio
nh
ealt
hg
rou
p
pen
sio
n
lin
ked
Ind
ivid
ual
li
fe l
inke
d
Ind
ivid
ual
pe
nsi
on
li
nke
dTo
tal
Com
mis
ion
paid
Dire
ct
-Firs
t ye
ar P
rem
ium
s57
4,49
177
9,27
710
,700
5612
7,35
2-
171,
204
-1,
543,
092
-Ren
ewal
Pre
miu
ms
271,
434
189,
548
1,82
7-
-8,
146
(2)
79,2
4310
055
0,29
6
-Sin
gle
Prem
ium
s-
56,6
33-
704
--
-4,
035
-61
,372
gro
ss c
om
mis
sio
n84
5,92
51,
025,
458
12,5
2776
012
15,4
98(2
)25
4,48
210
02,
154,
760
Add
: Com
mis
sion
on
Re-in
sura
nce
Acc
epte
d-
--
--
--
--
-
Less
: Com
mis
sion
on
Re-in
sura
nce
Ced
ed-
--
--
--
--
-
net
co
mm
issi
on
845,
925
1,02
5,45
812
,527
760
1215
,498
(2)
254,
482
100
2,15
4,76
0

Financial StatementsStatutory ReportsCorporate Overview
151
An
nex
ure
4Sc
hed
ule
3 -
Ope
RA
TIn
g e
xpe
nSe
S R
elA
Ted
TO
InSu
RA
nc
e b
uSI
neS
S
(` in
'000
)
part
icu
lars
Mar
ch 3
1, 2
018
par
no
n p
arpe
nsi
on
no
n p
ar
An
nu
ity
no
n p
ar
pen
sio
nh
ealt
hg
rou
p
pen
sio
n
lin
ked
Ind
ivid
ual
li
fe l
inke
d
Ind
ivid
ual
pe
nsi
on
li
nke
dTo
tal
Empl
oyee
s' r
emun
erat
ion
and
wel
fare
ben
efits
2,44
7,32
61,
997,
394
17,5
863,
267
396
50,8
672,
601
889,
037
2,22
55,
410,
699
Trav
el, c
onve
yanc
e an
d ve
hicl
e ru
nnin
g ex
pens
es50
,878
48,8
6824
277
695
859
22,7
3757
123,
882
Trai
ning
exp
ense
s16
,067
15,3
6977
253
302
217,
191
1939
,074
Rent
s, r
ates
and
tax
es11
3,98
125
4,43
285
615
614
3,96
111
152
,786
1,25
542
7,55
2
Repa
irs23
,919
23,0
3211
336
245
125
10,6
7926
58,2
83
Prin
ting
and
stat
ione
ry16
,369
15,7
6177
251
309
177,
308
1839
,885
Com
mun
icat
ion
expe
nses
60,7
7558
,499
287
925
1,14
665
27,1
3966
148,
074
Lega
l & p
rofe
ssio
nal c
harg
es
41,7
5337
,549
225
6942
745
158
19,0
8896
99,7
25
Med
ical
fee
s7,
474
38,5
7127
--
3,11
0-
5,50
81
54,6
91
Aud
itors
' Fee
s, e
xpen
ses,
etc
.
(a)
as a
udito
r2,
462
2,37
112
4-
463
1,09
93
6,00
0
(b)
othe
r se
rvic
es
5553
--
-1
-25
-13
4
(c)
expe
nses
49
447
62
1-
91
221
11,
205
Adv
ertis
emen
t an
d pu
blic
ity94
,057
90,5
6844
414
27
1,77
599
41,9
9510
122
9,18
8
Busi
ness
Dev
elop
men
t &
Sal
es p
rom
otio
n30
3,39
433
3,56
54,
069
299
35,
588
4597
,569
7774
4,60
9
Inte
rest
and
Ban
k C
harg
es30
,641
27,8
3916
250
2755
210
413
,960
6573
,400
Recr
uitm
ent
expe
nses
28,9
6027
,879
137
442
546
3112
,931
3170
,561
Info
rmat
ion
Tech
nolo
gy e
xpen
ses
97,8
1394
,182
462
148
81,
845
104
43,6
7210
523
8,33
9
Off
ice
expe
nses
51,4
0249
,496
243
784
970
5422
,950
5512
5,25
2
Oth
ers
15,0
7714
,517
7123
128
416
6,73
116
36,7
36
Dep
reci
atio
n92
,840
89,3
9743
814
17
1,75
298
41,4
5210
022
6,22
5
Exce
ss o
f ex
pens
es o
f m
anag
emen
t (E
OM
) tra
nsfe
rred
to
Pro
fit a
nd L
oss
Acc
ount
(Ref
er: N
ote
3.33
of
the
Not
es t
o A
ccou
nts)
--
(5,1
19)
--
--
--
(5,1
19)
TOTA
l3,
495,
737
3,21
9,81
820
,411
4,67
752
875
,217
3,61
21,
324,
078
4,31
78,
148,
395

152
An
nex
ure
4Sc
hed
ule
1 -
pR
eMIu
M
(` in
'000
)
part
icu
lars
Mar
ch 3
1, 2
017
par
no
n p
arpe
nsi
on
no
n p
ar
An
nu
ity
no
n p
ar
pen
sio
nh
ealt
hg
rou
p
pen
sio
n
lin
ked
Ind
ivid
ual
li
fe l
inke
d
Ind
ivid
ual
pe
nsi
on
li
nke
dTo
tal
Firs
t ye
ar P
rem
ium
s4,
950,
823
4,33
9,64
3 19
3,82
4 -
12
,663
23
8,27
3 9,
728
913,
212
-
10,
658,
166
Rene
wal
Pre
miu
ms
9,00
4,63
4 5,
053,
009
41,0
86
-
1,57
6 34
2,46
7 56
,344
6,
310,
187
63,6
52
20,
872,
955
Sing
le P
rem
ium
s -
63
4,87
5 73
1 92
,675
31
1 -
-
10
0,95
8 13
0 8
29,6
80
Tota
l pre
miu
m13
,955
,457
10
,027
,527
23
5,64
1 92
,675
14
,550
58
0,74
0 66
,072
7,
324,
357
63,7
82
32,3
60,8
01
Sch
edu
le 2
- c
OM
MIS
SIO
n e
xpe
nSe
S
(` in
'000
)
part
icu
lars
Mar
ch 3
1, 2
017
par
no
n p
arpe
nsi
on
no
n p
ar
An
nu
ity
no
n p
ar
pen
sio
nh
ealt
hg
rou
p
pen
sio
n
lin
ked
Ind
ivid
ual
li
fe l
inke
d
Ind
ivid
ual
pe
nsi
on
li
nke
dTo
tal
Com
mis
ion
paid
Dire
ct
-Firs
t ye
ar P
rem
ium
s65
4,21
766
0,94
38,
294
1311
135
,250
1030
,161
-1,
388,
999
-Ren
ewal
Pre
miu
ms
216,
207
79,4
9322
8-
-5,
606
-10
3,04
716
540
4,74
6
-Sin
gle
Prem
ium
s-
1,20
3-
774
--
-79
9-
2,77
6
gro
ss c
om
mis
sio
n87
0,42
474
1,63
98,
522
787
111
40,8
5610
134,
007
165
1,79
6,52
1
Add
: Com
mis
sion
on
Re-in
sura
nce
Acc
epte
d-
--
--
--
--
-
Less
: Com
mis
sion
on
Re-in
sura
nce
Ced
ed-
--
--
--
--
-
net
co
mm
issi
on
870,
424
741,
639
8,52
278
711
140
,856
1013
4,00
716
51,
796,
521

Financial StatementsStatutory ReportsCorporate Overview
153
An
nex
ure
4Sc
hed
ule
3 -
Ope
RA
TIn
g e
xpe
nSe
S R
elA
Ted
TO
InSu
RA
nc
e b
uSI
neS
S
(` in
'000
)
part
icu
lars
Mar
ch 3
1, 2
017
par
no
n p
arpe
nsi
on
no
n p
ar
An
nu
ity
no
n p
ar
pen
sio
nh
ealt
hg
rou
p
pen
sio
n
lin
ked
Ind
ivid
ual
li
fe l
inke
d
Ind
ivid
ual
pe
nsi
on
li
nke
dTo
tal
Empl
oyee
s' r
emun
erat
ion
and
wel
fare
ben
efits
2,36
3,95
31,
645,
241
13,6
303,
547
234
132,
191
1,83
054
0,54
03,
058
4,70
4,22
4
Trav
el, c
onve
yanc
e an
d ve
hicl
e ru
nnin
g ex
pens
es49
,020
39,2
8418
878
62,
463
5112
,732
8410
3,90
6
Trai
ning
exp
ense
s8,
218
6,58
632
131
413
82,
134
1417
,419
Rent
s, r
ates
and
tax
es12
3,14
925
2,04
591
818
13,
744
5,67
911
832
,872
196
418,
902
Repa
irs22
,630
18,1
3587
363
1,13
723
5,87
739
47,9
67
Prin
ting
and
stat
ione
ry19
,228
15,4
0974
313
966
204,
994
3340
,758
Com
mun
icat
ion
expe
nses
73,6
6559
,033
283
117
103,
701
7619
,132
126
156,
143
Lega
l & p
rofe
ssio
nal c
harg
es
54,2
0443
,438
208
867
2,72
356
14,0
7893
114,
893
Med
ical
fee
s4,
298
38,8
0936
3-
3,59
2-
3,04
7-
49,7
85
Aud
itors
' Fee
s, e
xpen
ses,
etc
.
(a)
as a
udito
r2,
171
1,73
98
3-
109
256
44
4,60
0
(b)
othe
r se
rvic
es
--
--
--
--
--
(c)
expe
nses
40
032
02
1-
20-
104
184
8
Adv
ertis
emen
t an
d pu
blic
ity10
3,26
182
,751
397
165
145,
188
107
26,8
1917
621
8,87
8
Busi
ness
Dev
elop
men
t &
Sal
es p
rom
otio
n41
7,78
234
8,79
73,
918
399
419
,746
3167
,632
125
858,
434
Inte
rest
and
Ban
k C
harg
es27
,925
22,3
7810
744
41,
403
297,
253
4859
,191
Recr
uitm
ent
expe
nses
22,5
2218
,049
8736
31,
131
235,
849
3847
,738
Info
rmat
ion
Tech
nolo
gy e
xpen
ses
128,
901
103,
298
495
205
176,
476
133
33,4
7822
027
3,22
3
Off
ice
expe
nses
54,5
2043
,691
210
877
2,73
956
14,1
6093
115,
563
Oth
ers
8,54
56,
848
3314
142
99
2,21
915
18,1
13
Dep
reci
atio
n10
3,79
483
,179
399
165
145,
215
107
26,9
5717
722
0,00
7
Exce
ss o
f ex
pens
es o
f m
anag
emen
t (E
OM
) tra
nsfe
rred
to
Pro
fit a
nd L
oss
Acc
ount
-(Re
fer:
Not
e 3.
33 o
f th
e N
otes
to
Acc
ount
s)-
-(4
,253
)-
--
--
-(4
,253
)
TOTA
l3,
588,
186
2,82
9,03
016
,859
5,21
14,
072
195,
321
2,67
982
0,44
14,
540
7,46
6,33
9

154
An
nex
ure
4Sc
hed
ule
4 -
ben
eFIT
S pA
Id (
neT
)
(` in
'000
)
part
icu
lars
Mar
ch 3
1, 2
018
par
no
n p
arpe
nsi
on
no
n p
ar
An
nu
ity
no
n p
ar
pen
sio
nh
ealt
hg
rou
p
pen
sio
n
lin
ked
Ind
ivid
ual
li
fe l
inke
d
Ind
ivid
ual
pe
nsi
on
li
nke
dTo
tal
1.
Insu
ranc
e cl
aim
s
(a)
Cla
ims
by d
eath
63
4,31
21,
971,
333
1,39
7-
--
(697
)55
8,56
03,
691
3,16
8,59
6
(b)
Cla
ims
by m
atur
ity18
1,25
120
5,81
62,
806
--
--
341,
077
70,3
7180
1,32
1
(c)
Ann
uitie
s/ P
ensi
on p
aym
ent
--
-8,
558
62,6
16-
130,
664
--
201,
838
(d)
Oth
er b
enef
its -
(i)
Su
rren
ders
293,
604
217,
288
9,77
2-
86,1
3272
50,0
6415
,301
,550
300,
077
16,2
58,5
59
(ii
) Pe
riodi
cal b
enef
it77
2,30
057
2,36
6-
--
--
--
1,34
4,66
6
(ii
i) H
ealth
--
--
-60
,498
--
-60
,498
(iv
) O
ther
s-
116,
523
--
--
--
-11
6,52
3
2.
(Am
ount
ced
ed in
rei
nsur
ance
)
(a)
Cla
ims
by d
eath
(18,
352)
(761
,413
)-
--
--
(55,
177)
-(8
34,9
42)
(b)
Cla
ims
by m
atur
ity-
--
--
--
--
-
(c)
Ann
uitie
s/ P
ensi
on p
aym
ent
--
--
--
--
--
(d)
Oth
er b
enef
its -
-
--
--
--
--
-
(i)
Su
rren
ders
--
--
--
--
--
(ii
) Pe
riodi
cal b
enef
it-
--
--
--
--
-
(ii
i) H
ealth
--
--
-(3
2,71
0)-
--
(32,
710)
3.
Am
ount
acc
epte
d in
rei
nsur
ance
(a)
Cla
ims
by d
eath
--
--
--
--
-
(b)
Cla
ims
by m
atur
ity-
--
--
--
--
-
(c)
Ann
uitie
s/ P
ensi
on p
aym
ent
--
--
--
--
--
(d)
Oth
er b
enef
its -
-
--
--
--
--
-
(i)
Su
rren
ders
--
--
--
--
--
(ii
) Pe
riodi
cal b
enef
it-
--
--
--
--
-
(ii
i) H
ealth
--
--
--
--
--
Tota
l1,
863,
115
2,32
1,91
313
,975
8,55
814
8,74
827
,860
180,
031
16,1
46,0
1037
4,13
921
,084
,349

Financial StatementsStatutory ReportsCorporate Overview
155
An
nex
ure
4Sc
hed
ule
4 -
ben
eFIT
S pA
Id (
neT
)
(` in
'000
)
part
icu
lars
Mar
ch 3
1, 2
017
par
no
n p
arpe
nsi
on
no
n p
ar
An
nu
ity
no
n p
ar
pen
sio
nh
ealt
hg
rou
p
pen
sio
n
lin
ked
Ind
ivid
ual
li
fe l
inke
d
Ind
ivid
ual
pe
nsi
on
li
nke
dTo
tal
1.
Insu
ranc
e cl
aim
s
(a)
Cla
ims
by d
eath
62
3,77
42,
203,
036
976
-18
8-
791
633,
170
8,51
03,
470,
445
(b)
Cla
ims
by m
atur
ity12
2,67
843
1,15
03,
584
--
--
243,
994
88,8
5389
0,25
9
(c)
Ann
uitie
s/ P
ensi
on p
aym
ent
--
-4,
813
116,
692
-11
4,09
9-
-23
5,60
4
(d)
Oth
er b
enef
its -
(i)
Su
rren
ders
212,
230
107,
831
7,73
0-
301,
448
-10
,651
12,2
14,9
7735
8,76
613
,213
,633
(ii
) Pe
riodi
cal b
enef
it53
3,30
685
,653
--
--
--
-61
8,95
9
(ii
i) H
ealth
--
--
-48
,411
--
-48
,411
(iv
) O
ther
s-
73,7
10-
--
--
--
73,7
10
2.
(Am
ount
ced
ed in
rei
nsur
ance
)
(a)
Cla
ims
by d
eath
(16,
740)
(737
,327
)-
--
--
(68,
419)
-(8
22,4
86)
(b)
Cla
ims
by m
atur
ity-
--
--
--
--
-
(c)
Ann
uitie
s/ P
ensi
on p
aym
ent
--
--
--
--
--
(d)
Oth
er b
enef
its -
-
--
--
--
--
-
(i)
Su
rren
ders
--
--
--
--
--
(ii
) Pe
riodi
cal b
enef
it-
--
--
--
--
-
(ii
i) H
ealth
--
--
-(3
7,70
8)-
--
(37,
708)
3.
Am
ount
acc
epte
d in
rei
nsur
ance
(a)
Cla
ims
by d
eath
--
--
--
--
-
(b)
Cla
ims
by m
atur
ity-
--
--
--
--
-
(c)
Ann
uitie
s/ P
ensi
on p
aym
ent
--
--
--
--
--
(d)
Oth
er b
enef
its -
-
--
--
--
--
-
(i)
Su
rren
ders
--
--
--
--
--
(ii
) Pe
riodi
cal b
enef
it-
--
--
--
--
-
(ii
i) H
ealth
--
--
--
--
--
Tota
l1,
475,
248
2,16
4,05
312
,290
4,81
341
8,32
810
,703
125,
541
13,0
23,7
2245
6,12
917
,690
,827

156
An
nex
ure
5ST
ATe
Men
T O
F n
eT A
SSeT
S A
S A
T M
AR
ch
31,
201
8(`
in '0
00)
part
icu
lars
Ind
ivid
ual
bal
ance
rM
ult
iplie
rA
ccel
rato
rpr
eser
ver
pro
tect
or
Mo
der
ato
rV
irtu
eb
alan
cer
2M
ult
iplie
r 2
pres
erve
r 2
Ass
ets
Inve
stm
ents
Gov
ernm
ent
secu
ritie
s an
d G
over
nmen
t gu
aran
teed
bon
ds49
6,07
0-
66,6
9557
3,34
645
8,53
540
,310
-50
0,31
3-
572,
073
Equi
ty S
hare
s/Pr
efer
ence
Sha
res
1,84
8,92
214
,491
,535
1,51
7,14
3-
-33
,740
854,
658
1,72
2,61
25,
710,
634
-C
orpo
rate
Bon
ds17
0,35
4-
29,7
13-
293,
134
9,27
0-
248,
111
--
Infr
astr
ctur
e Bo
nds
993,
231
-30
9,19
0-
613,
033
69,4
59-
992,
842
--
Mut
ual F
unds
-1,
739,
932
80,1
41-
-77
3-
-69
1,52
0-
Fixe
d D
epos
its-
--
--
--
--
-C
ash
347
2,20
021
57
1514
614,
784
901
8A
ccru
ed In
com
e55
,009
-18
,584
11,6
9747
,542
3,42
732
553
,662
-10
,674
Oth
er R
ecei
vabl
es18
,677
8216
,788
225
-24
6-
82,8
2446
,047
12,3
10O
ther
sec
uriti
es -
CP/
CBL
O/B
ank
Dep
osits
115,
564
548,
021
22,5
3840
,475
47,8
375,
383
55,2
1016
,801
171,
282
61,9
70
liab
iliti
esA
ccru
ed E
xpen
ses
--
--
--
--
--
Oth
er L
iabi
litie
s55
,407
81,8
4029
,822
101
12,1
2076
9,27
916
,728
13,0
4483
net
Ass
ets
3,64
2,76
716
,699
,930
2,03
1,18
562
5,64
91,
447,
976
162,
546
900,
975
3,60
5,22
16,
607,
340
656,
952
(` in
'000
)
part
icu
lars
Ind
ivid
ual
pro
tect
or
2V
irtu
e 2
Flex
i cap
Mu
ltip
lier
3li
qu
id F
un
dM
id c
ap
Fun
d
prem
ier
Mu
lti-
cap
Fu
nd
cre
st
(Th
emat
ic
Fun
d)
bal
ance
d
Op
po
rtu
nit
ies
Fun
d
bo
nd
O
pp
ort
un
itie
s Fu
nd
Ass
ets
Inve
stm
ents
Gov
ernm
ent
secu
ritie
s an
d G
over
nmen
t gu
aran
teed
bon
ds2,
458,
460
--
-2,
498
--
-79
264
4
Equi
ty S
hare
s/Pr
efer
ence
Sha
res
-86
1,04
85,
326,
867
36,2
06-
4,34
34,
709
9,04
81,
286
-C
orpo
rate
Bon
ds2,
953,
801
--
--
--
--
-In
fras
trct
ure
Bond
s3,
940,
369
--
--
--
--
-M
utua
l Fun
ds-
-53
0,36
83,
599
--
--
--
Fixe
d D
epos
its-
--
--
--
--
-C
ash
2,23
014
567
310
243
91,
151
838
245
3A
ccru
ed In
com
e32
0,35
224
930
9-
--
--
2117
Oth
er R
ecei
vabl
es41
8,89
868
,065
177,
898
10,5
3372
25,
839
11,3
1014
,729
3,74
12,
178
Oth
er s
ecur
ities
- C
P/C
BLO
/Ban
k D
epos
its60
4,19
513
9,54
920
1,28
06,
133
2,12
51,
699
1,89
93,
699
700
20
liab
iliti
esA
ccru
ed E
xpen
ses
--
--
--
--
--
Oth
er L
iabi
litie
s1,
350
5,61
434
,632
512
11,
976
2,75
34,
045
788
-n
et A
sset
s10
,696
,955
1,06
3,44
26,
202,
763
55,9
695,
346
10,3
4416
,316
24,2
695,
997
2,86
2

Financial StatementsStatutory ReportsCorporate Overview
157
An
nex
ure
5ST
ATe
Men
T O
F n
eT A
SSeT
S A
S A
T M
AR
ch
31,
2018
(` in
'000
)
part
icu
lars
Ind
ivid
ual
pen
sio
nn
AV
g
uar
ante
ed
isco
nti
nu
ed
Fun
db
alan
cer
Mu
ltip
lier
Acc
elra
tor
pres
erve
rpr
ote
cto
rM
od
erat
or
Vir
tue
bal
ance
r 2
Ass
ets
Inve
stm
ents
Gov
ernm
ent
secu
ritie
s an
d G
over
nmen
t gu
aran
teed
bon
ds-
5,57
6,86
026
,315
-2,
188
27,2
087,
359
3,74
3-
2,19
4
Equi
ty S
hare
s/Pr
efer
ence
Sha
res
--
98,0
8151
8,98
749
,779
--
3,13
341
,338
7,55
6C
orpo
rate
Bon
ds-
-9,
037
-97
5-
4,70
486
1-
1,08
8In
fras
trct
ure
Bond
s-
-52
,689
-10
,145
-9,
838
6,44
9-
4,35
5M
utua
l Fun
ds-
--
62,3
122,
629
--
72-
-Fi
xed
Dep
osits
--
--
--
--
--
Cas
h-
394
1879
7-
-1
321
Acc
rued
Inco
me
--
2,91
8-
610
555
763
318
1623
5O
ther
Rec
eiva
bles
--
991
355
111
-23
-36
3O
ther
sec
uriti
es -
CP/
CBL
O/B
ank
Dep
osits
-38
4,76
46,
130
19,6
2673
91,
921
768
500
2,67
074
liab
iliti
esA
ccru
ed E
xpen
ses
--
--
--
--
--
Oth
er L
iabi
litie
s-
212,
785
2,93
92,
931
978
519
57
449
73n
et A
sset
s-
5,74
9,23
319
3,24
059
8,07
666
,645
29,6
9023
,237
15,0
9343
,578
15,8
13
(` in
'000
)
part
icu
lars
pen
sio
ng
rou
p g
ratu
ity
Tota
l
Mu
ltip
lier
2pr
eser
ver
2pr
ote
cto
r 2
Vit
ue
2Fl
exi c
apM
ult
iplie
r 3
liq
uid
Fu
nd
deb
t Fu
nd
bal
ance
Fu
nd
Ass
ets
Inve
stm
ents
Gov
ernm
ent
secu
ritie
s an
d G
over
nmen
t gu
aran
teed
bon
ds-
136
1,14
2-
--
-25
5,46
612
6,40
811
,198
,755
Equi
ty S
hare
s/Pr
efer
ence
Sha
res
74,1
62-
-1,
193
14,4
81-
--
164,
661
33,3
96,1
22C
orpo
rate
Bon
ds-
-1,
372
--
--
151,
246
30,4
903,
904,
156
Infr
astr
ctur
e Bo
nds
--
1,83
0-
--
-42
2,94
420
7,11
87,
633,
492
Mut
ual F
unds
8,98
1-
--
1,44
2-
--
-3,
121,
769
Fixe
d D
epos
its-
--
--
--
--
-C
ash
12-
1-
2-
-15
4214
,883
Acc
rued
Inco
me
-3
149
-1
--
28,9
7911
,268
567,
683
Oth
er R
ecei
vabl
es59
83
195
9448
4-
-35
,956
-93
0,38
4O
ther
sec
uriti
es -
CP/
CBL
O/B
ank
Dep
osits
2,22
415
281
193
547
--
79,3
2019
,478
2,56
5,63
0
liab
iliti
esA
ccru
ed E
xpen
ses
--
--
--
--
--
Oth
er L
iabi
litie
s16
9-
18
94-
-79
5249
0,93
6n
et A
sset
s85
,808
157
4,96
91,
472
16,8
63-
-97
3,84
755
9,41
362
,841
,938

158
An
nex
ure
5ST
ATe
Men
T O
F n
eT A
SSeT
S A
S A
T M
AR
ch
31,
201
7
(` in
'000
)
part
icu
lars
Ind
ivid
ual
bal
ance
rM
ult
iplie
rA
ccel
rato
rpr
eser
ver
pro
tect
or
Mo
der
ato
rV
irtu
eb
alan
cer
2M
ult
iplie
r 2
pres
erve
r 2
Ass
ets
Inve
stm
ents
Gov
ernm
ent
secu
ritie
s an
d G
over
nmen
t gu
aran
teed
bon
ds85
1,49
3-
125,
136
598,
328
565,
689
75,9
72-
582,
740
-50
0,39
6
Equi
ty S
hare
s/Pr
efer
ence
Sha
res
2,36
3,13
118
,654
,284
1,88
6,32
6-
-45
,036
913,
469
1,96
8,50
67,
258,
083
-C
orpo
rate
Bon
ds48
,884
--
-37
9,93
99,
557
-86
,056
--
Infr
astr
ctur
e Bo
nds
859,
758
-30
4,73
0-
558,
394
29,3
77-
676,
985
--
Mut
ual F
unds
-52
2,76
5-
--
--
-29
2,39
2-
Fixe
d D
epos
its-
--
--
--
--
-C
ash
104
424
5655
6925
3014
974
68A
ccru
ed In
com
e60
,185
2,48
423
,186
11,2
9461
,531
2,29
873
447
,436
792
9,69
7O
ther
Rec
eiva
bles
202,
400
248,
192
14,4
4628
--
-13
2,58
616
6,71
258
,119
Oth
er s
ecur
ities
- C
P/C
BLO
/Ban
k D
epos
its12
1,06
455
,809
36,2
4910
8,35
813
2,48
738
,584
35,3
8129
8,89
714
7,73
212
6,47
8
liab
iliti
esA
ccru
ed E
xpen
ses
--
--
--
--
--
Oth
er L
iabi
litie
s20
6,03
557
,744
2,18
028
8,37
926
431
377
,222
130,
238
22n
et A
sset
s4,
300,
984
19,4
26,2
142,
387,
949
718,
035
1,68
9,73
020
0,58
594
9,30
13,
716,
133
7,73
5,54
769
4,73
6
(` in
'000
)
part
icu
lars
Ind
ivid
ual
pro
tect
or
2V
irtu
e 2
Flex
i cap
Mu
ltip
lier
3li
qu
id F
un
dM
id c
ap
Fun
d
prem
ier
Mu
lti-
cap
Fu
nd
cre
st
(Th
emat
ic
Fun
d)
bal
ance
d
Op
po
rtu
nit
ies
Fun
d
bo
nd
O
pp
ort
un
itie
s Fu
nd
Ass
ets
Inve
stm
ents
Gov
ernm
ent
secu
ritie
s an
d G
over
nmen
t gu
aran
teed
bon
ds2,
585,
095
--
--
--
--
-
Equi
ty S
hare
s/Pr
efer
ence
Sha
res
-49
2,09
55,
555,
129
20,9
39-
--
--
-C
orpo
rate
Bon
ds2,
326,
104
--
--
--
--
-In
fras
trct
ure
Bond
s4,
285,
323
--
--
--
--
-M
utua
l Fun
ds-
-23
6,89
292
6-
--
--
-Fi
xed
Dep
osits
--
--
--
--
--
Cas
h42
523
611
2-
--
--
Acc
rued
Inco
me
291,
086
242,
029
--
--
--
-O
ther
Rec
eiva
bles
251,
611
25,1
7820
4,74
62,
400
190
--
--
-O
ther
sec
uriti
es -
CP/
CBL
O/B
ank
Dep
osits
857,
142
36,6
3311
5,02
21,
021
3,71
4-
--
--
liab
iliti
esA
ccru
ed E
xpen
ses
--
--
--
--
--
Oth
er L
iabi
litie
s33
110
,834
81,7
8892
0-
--
--
-n
et A
sset
s10
,596
,455
543,
119
6,03
2,09
124
,367
3,90
6-
--
--

Financial StatementsStatutory ReportsCorporate Overview
159
An
nex
ure
5ST
ATe
Men
T O
F n
eT A
SSeT
S A
S A
T M
AR
ch
31,
201
7(`
in '0
00)
part
icu
lars
Ind
ivid
ual
pen
sio
nn
AV
g
uar
ante
ed
isco
nti
nu
ed
Fun
db
alan
cer
Mu
ltip
lier
Acc
elra
tor
pres
erve
rpr
ote
cto
rM
od
erat
or
Vir
tue
bal
ance
r 2
Ass
ets
Inve
stm
ents
Gov
ernm
ent
secu
ritie
s an
d G
over
nmen
t gu
aran
teed
bon
ds-
5,89
0,85
445
,216
-4,
069
35,2
8117
,307
5,87
3-
3,97
5
Equi
ty S
hare
s/Pr
efer
ence
Sha
res
--
125,
486
662,
333
61,3
41-
-3,
482
45,8
7813
,427
Cor
pora
te B
onds
--
2,59
6-
--
11,6
2473
9-
587
Infr
astr
ctur
e Bo
nds
--
45,6
54-
9,90
9-
17,0
842,
271
-4,
618
Mut
ual F
unds
--
-18
,561
--
--
--
Fixe
d D
epos
its-
--
--
--
--
-C
ash
-32
615
23
22
21
Acc
rued
Inco
me
--
3,19
688
754
666
1,88
217
837
324
Oth
er R
ecei
vabl
es-
-10
,748
8,81
247
02
--
-90
4O
ther
sec
uriti
es -
CP/
CBL
O/B
ank
Dep
osits
-62
,384
6,42
91,
982
1,17
96,
389
4,05
32,
983
1,77
72,
039
liab
iliti
esA
ccru
ed E
xpen
ses
--
--
--
--
--
Oth
er L
iabi
litie
s-
28,4
1210
,941
2,05
071
225
620
1652
7n
et A
sset
s-
5,92
4,85
822
8,39
068
9,74
177
,653
42,3
3951
,696
15,5
0847
,678
25,3
48
(` in
'000
)
part
icu
lars
pen
sio
ng
rou
p g
ratu
ity
Tota
l
Mu
ltip
lier
2pr
eser
ver
2pr
ote
cto
r 2
Vit
ue
2Fl
exi c
apM
ult
iplie
r 3
liq
uid
Fu
nd
deb
t Fu
nd
bal
ance
Fu
nd
Ass
ets
Inve
stm
ents
Gov
ernm
ent
secu
ritie
s an
d G
over
nmen
t gu
aran
teed
bon
ds-
557
1,63
2-
--
-26
5,16
816
5,59
512
,320
,376
Equi
ty S
hare
s/Pr
efer
ence
Sha
res
101,
636
--
4,23
518
,618
--
-15
9,73
440
,353
,168
Cor
pora
te B
onds
--
1,46
9-
--
-14
4,54
520
,592
3,03
2,69
2In
fras
trct
ure
Bond
s-
-2,
706
--
--
343,
963
62,6
377,
203,
409
Mut
ual F
unds
4,09
4-
--
794
--
--
1,07
6,42
4Fi
xed
Dep
osits
--
--
--
--
--
Cas
h1
--
--
--
8950
1,77
1A
ccru
ed In
com
e11
1118
4-
7-
-21
,262
5,67
554
7,05
1O
ther
Rec
eiva
bles
2,33
465
159
217
686
--
5,31
13,
629
1,33
9,94
5O
ther
sec
uriti
es -
CP/
CBL
O/B
ank
Dep
osits
2,06
914
154
131
538
5-
-17
1,66
994
,419
2,47
3,32
5
liab
iliti
es-
Acc
rued
Exp
ense
s-
--
--
--
--
-O
ther
Lia
bilit
ies
1,82
4-
-93
274
--
1910
620,
813
net
Ass
ets
108,
321
774
6,69
14,
674
20,2
16-
-95
1,98
851
2,32
167
,727
,348
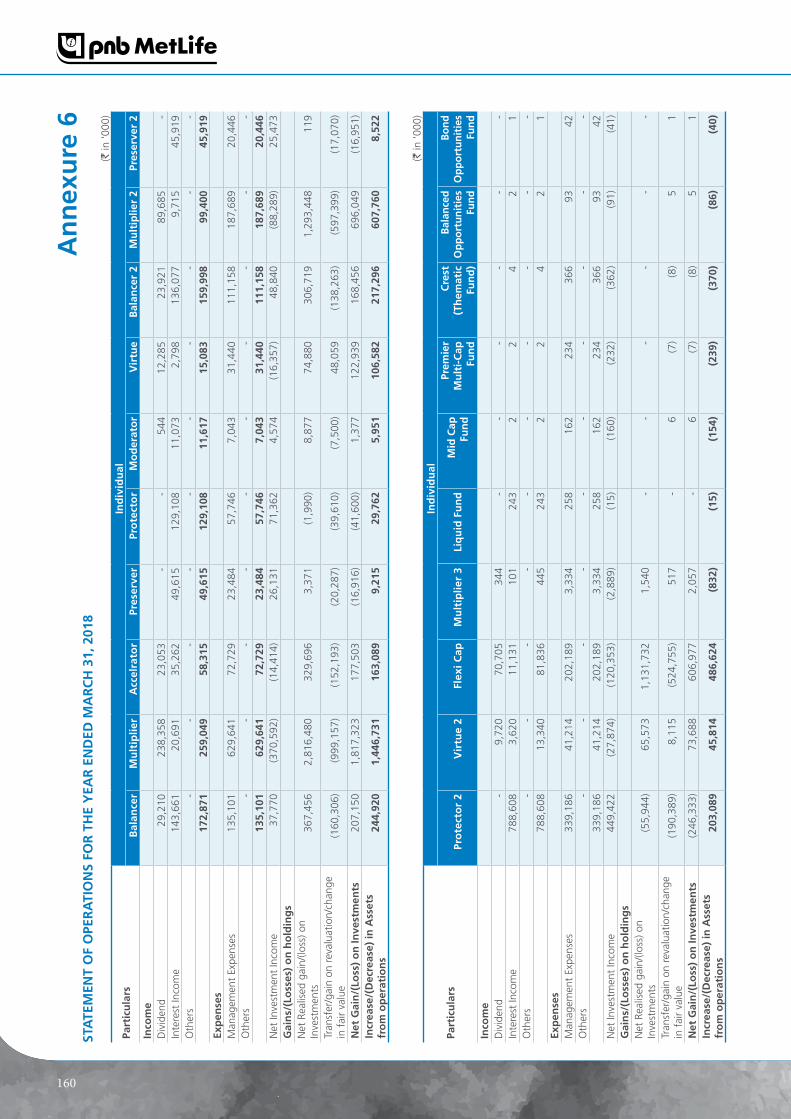
160
An
nex
ure
6ST
ATe
Men
T O
F O
peR
ATI
On
S FO
R T
he
yeA
R e
nd
ed M
AR
ch
31,
201
8(`
in '0
00)
part
icu
lars
Ind
ivid
ual
bal
ance
rM
ult
iplie
rA
ccel
rato
rpr
eser
ver
pro
tect
or
Mo
der
ato
rV
irtu
eb
alan
cer
2M
ult
iplie
r 2
pres
erve
r 2
Inco
me
Div
iden
d29
,210
238,
358
23,0
53-
-54
412
,285
23,9
2189
,685
-In
tere
st In
com
e14
3,66
120
,691
35,2
6249
,615
129,
108
11,0
732,
798
136,
077
9,71
545
,919
Oth
ers
--
--
--
--
--
172,
871
259,
049
58,3
1549
,615
129,
108
11,6
1715
,083
159,
998
99,4
0045
,919
exp
ense
sM
anag
emen
t Ex
pens
es13
5,10
162
9,64
172
,729
23,4
8457
,746
7,04
331
,440
111,
158
187,
689
20,4
46O
ther
s-
--
--
--
--
-13
5,10
162
9,64
172
,729
23,4
8457
,746
7,04
331
,440
111,
158
187,
689
20,4
46N
et In
vest
men
t In
com
e37
,770
(370
,592
)(1
4,41
4)26
,131
71,3
624,
574
(16,
357)
48,8
40(8
8,28
9)25
,473
gai
ns/
(lo
sses
) o
n h
old
ing
sN
et R
ealis
ed g
ain/
(loss
) on
Inve
stm
ents
367,
456
2,81
6,48
032
9,69
63,
371
(1,9
90)
8,87
774
,880
306,
719
1,29
3,44
811
9
Tran
sfer
/gai
n on
rev
alua
tion/
chan
ge
in f
air
valu
e(1
60,3
06)
(999
,157
)(1
52,1
93)
(20,
287)
(39,
610)
(7,5
00)
48,0
59(1
38,2
63)
(597
,399
)(1
7,07
0)
net
gai
n/(
loss
) o
n In
vest
men
ts20
7,15
01,
817,
323
177,
503
(16,
916)
(41,
600)
1,37
712
2,93
916
8,45
669
6,04
9(1
6,95
1)In
crea
se/(
dec
reas
e) in
Ass
ets
fro
m o
per
atio
ns
244,
920
1,44
6,73
116
3,08
99,
215
29,7
625,
951
106,
582
217,
296
607,
760
8,52
2
(` in
'000
)
part
icu
lars
Ind
ivid
ual
pro
tect
or
2V
irtu
e 2
Flex
i cap
Mu
ltip
lier
3li
qu
id F
un
dM
id c
ap
Fun
d
prem
ier
Mu
lti-
cap
Fu
nd
cre
st
(Th
emat
ic
Fun
d)
bal
ance
d
Op
po
rtu
nit
ies
Fun
d
bo
nd
O
pp
ort
un
itie
s Fu
nd
Inco
me
Div
iden
d-
9,72
070
,705
344
--
--
--
Inte
rest
Inco
me
788,
608
3,62
011
,131
101
243
22
42
1O
ther
s-
--
--
--
--
-78
8,60
813
,340
81,8
3644
524
32
24
21
exp
ense
sM
anag
emen
t Ex
pens
es33
9,18
641
,214
202,
189
3,33
425
816
223
436
693
42O
ther
s-
--
--
--
--
-33
9,18
641
,214
202,
189
3,33
425
816
223
436
693
42N
et In
vest
men
t In
com
e44
9,42
2(2
7,87
4)(1
20,3
53)
(2,8
89)
(15)
(160
)(2
32)
(362
)(9
1)(4
1)g
ain
s/(l
oss
es)
on
ho
ldin
gs
Net
Rea
lised
gai
n/(lo
ss) o
n In
vest
men
ts(5
5,94
4)65
,573
1,13
1,73
21,
540
--
--
--
Tran
sfer
/gai
n on
rev
alua
tion/
chan
ge
in f
air
valu
e(1
90,3
89)
8,11
5(5
24,7
55)
517
-6
(7)
(8)
51
net
gai
n/(
loss
) o
n In
vest
men
ts(2
46,3
33)
73,6
8860
6,97
72,
057
-6
(7)
(8)
51
Incr
ease
/(d
ecre
ase)
in A
sset
s fr
om
op
erat
ion
s20
3,08
945
,814
486,
624
(832
)(1
5)(1
54)
(239
)(3
70)
(86)
(40)

Financial StatementsStatutory ReportsCorporate Overview
161
An
nex
ure
6ST
ATe
Men
T O
F O
peR
ATI
On
S FO
R T
he
yeA
R e
nd
ed M
AR
ch
31,
201
8(`
in '0
00)
part
icu
lars
Ind
ivid
ual
pen
sio
nn
AV
g
uar
ante
ed
isco
nti
nu
ed
Fun
db
alan
cer
Mu
ltip
lier
Acc
elra
tor
pres
erve
rpr
ote
cto
rM
od
erat
or
Vir
tue
bal
ance
r 2
Inco
me
Div
iden
d-
-1,
550
8,53
675
6-
-51
594
105
Inte
rest
Inco
me
-40
1,78
37,
686
525
1,11
52,
869
2,87
887
815
977
4O
ther
s-
--
--
--
--
--
401,
783
9,23
69,
061
1,87
12,
869
2,87
892
975
387
9ex
pen
ses
Man
agem
ent
Expe
nses
-39
,424
3,56
012
,298
1,35
454
649
224
591
025
2O
ther
s-
--
--
--
--
--
39,4
243,
560
12,2
981,
354
546
492
245
910
252
Net
Inve
stm
ent
Inco
me
-36
2,35
95,
676
(3,2
37)
517
2,32
32,
386
684
(157
)62
7g
ain
s/(l
oss
es)
on
ho
ldin
gs
Net
Rea
lised
gai
n/(lo
ss) o
n In
vest
men
ts-
(122
)19
,632
98,5
1310
,580
195
(44)
709
3,73
71,
685
Tran
sfer
/gai
n on
rev
alua
tion/
chan
ge
in f
air
valu
e-
(195
)(8
,564
)(3
4,94
8)(4
,884
)(1
,173
)(8
83)
(599
)2,
398
(760
)
net
gai
n/(
loss
) o
n In
vest
men
ts-
(317
)11
,068
63,5
655,
696
(978
)(9
27)
110
6,13
592
5In
crea
se/(
dec
reas
e) in
Ass
ets
fro
m o
per
atio
ns
-36
2,04
216
,744
60,3
286,
213
1,34
51,
459
794
5,97
81,
552
(` in
'000
)
part
icu
lars
pen
sio
ng
rou
p g
ratu
ity
Tota
l
Mu
ltip
lier
2pr
eser
ver
2pr
ote
cto
r 2
Vit
ue
2Fl
exi c
apM
ult
iplie
r 3
liq
uid
Fu
nd
deb
t Fu
nd
bal
ance
Fu
nd
Inco
me
Div
iden
d1,
165
--
1319
2-
--
1,97
751
2,76
4In
tere
st In
com
e19
949
438
4667
--
72,1
5528
,331
1,90
7,58
5O
ther
s-
--
--
--
--
-1,
364
4943
859
259
--
72,1
5530
,308
2,42
0,34
9ex
pen
ses
Man
agem
ent
Expe
nses
1,42
19
6840
271
--
6,48
93,
702
1,93
4,63
6O
ther
s-
--
--
--
--
-1,
421
968
4027
1-
-6,
489
3,70
21,
934,
636
Net
Inve
stm
ent
Inco
me
(57)
4037
019
(12)
--
65,6
6626
,606
485,
713
gai
ns/
(lo
sses
) o
n h
old
ing
sN
et R
ealis
ed g
ain/
(loss
) on
Inve
stm
ents
17,7
50-
(31)
294
3,59
1-
-(5
,021
)13
,917
6,50
7,34
2
Tran
sfer
/gai
n on
rev
alua
tion/
chan
ge
in f
air
valu
e(8
,198
)(1
8)(1
06)
36(1
,665
)-
-(1
7,69
5)(4
,178
)(2
,871
,673
)
net
gai
n/(
loss
) o
n In
vest
men
ts9,
552
(18)
(137
)33
01,
926
--
(22,
716)
9,73
93,
635,
669
Incr
ease
/(d
ecre
ase)
in A
sset
s fr
om
op
erat
ion
s9,
495
2223
334
91,
914
--
42,9
5036
,345
4,12
1,38
2

162
An
nex
ure
6ST
ATe
Men
T O
F O
peR
ATI
On
S FO
R T
he
yeA
R e
nd
ed M
AR
ch
31,
201
7(`
in '0
00)
part
icu
lars
Ind
ivid
ual
bal
ance
rM
ult
iplie
rA
ccel
rato
rpr
eser
ver
pro
tect
or
Mo
der
ato
rV
irtu
eb
alan
cer
2M
ult
iplie
r 2
pres
erve
r 2
Inco
me
Div
iden
d28
,332
245,
958
24,6
43-
-58
313
,898
24,2
0310
7,62
4-
Inte
rest
Inco
me
172,
876
37,6
0443
,160
55,2
1814
1,08
612
,862
2,84
413
5,04
710
,662
51,3
31O
ther
s-
--
--
--
--
-20
1,20
828
3,56
267
,803
55,2
1814
1,08
613
,445
16,7
4215
9,25
011
8,28
651
,331
exp
ense
sM
anag
emen
t Ex
pens
es13
1,27
872
6,88
386
,796
28,9
3870
,073
7,93
333
,841
118,
571
246,
031
22,5
03O
ther
s-
--
--
--
--
-13
1,27
872
6,88
386
,796
28,9
3870
,073
7,93
333
,841
118,
571
246,
031
22,5
03N
et In
vest
men
t In
com
e69
,930
(443
,321
)(1
8,99
3)26
,280
71,0
135,
512
(17,
099)
40,6
79(1
27,7
45)
28,8
28g
ain
s/(l
oss
es)
on
ho
ldin
gs
Net
Rea
lised
gai
n/(lo
ss) o
n In
vest
men
ts27
8,09
32,
138,
629
259,
400
27,6
9832
,341
7,22
892
,168
232,
662
1,10
4,07
627
,008
Tran
sfer
/gai
n on
rev
alua
tion/
chan
ge
in f
air
valu
e11
5,61
774
5,72
955
,808
(1,4
00)
9,00
65,
002
59,1
0114
0,41
012
0,19
614
8
net
gai
n/(
loss
) o
n In
vest
men
ts39
3,71
02,
884,
358
315,
208
26,2
9841
,347
12,2
3015
1,26
937
3,07
21,
224,
272
27,1
56In
crea
se/(
dec
reas
e) in
Ass
ets
fro
m o
per
atio
ns
463,
640
2,44
1,03
729
6,21
552
,578
112,
360
17,7
4213
4,17
041
3,75
11,
096,
527
55,9
84
(` in
'000
)
part
icu
lars
Ind
ivid
ual
pro
tect
or
2V
irtu
e 2
Flex
i cap
Mu
ltip
lier
3li
qu
id F
un
dM
id c
ap
Fun
d
prem
ier
Mu
lti-
cap
Fu
nd
cre
st
(Th
emat
ic
Fun
d)
bal
ance
d
Op
po
rtu
nit
ies
Fun
d
bo
nd
O
pp
ort
un
itie
s Fu
nd
Inco
me
Div
iden
d-
5,21
870
,408
--
--
--
-In
tere
st In
com
e75
3,38
62,
662
13,9
6611
992
--
--
-O
ther
s-
--
--
--
--
-75
3,38
67,
880
84,3
7411
992
--
--
-ex
pen
ses
Man
agem
ent
Expe
nses
350,
056
22,1
5719
6,91
489
916
5-
--
--
Oth
ers
--
--
--
--
--
350,
056
22,1
5719
6,91
489
916
5-
--
--
Net
Inve
stm
ent
Inco
me
403,
330
(14,
277)
(112
,540
)(7
80)
(73)
--
--
-g
ain
s/(l
oss
es)
on
ho
ldin
gs
Net
Rea
lised
gai
n/(lo
ss) o
n In
vest
men
ts22
9,61
334
,208
524,
906
(21)
--
--
--
Tran
sfer
/gai
n on
rev
alua
tion/
chan
ge
in f
air
valu
e98
,019
33,4
3547
4,62
01,
440
--
--
--
net
gai
n/(
loss
) o
n In
vest
men
ts32
7,63
267
,643
999,
526
1,41
9-
--
--
-In
crea
se/(
dec
reas
e) in
Ass
ets
fro
m o
per
atio
ns
730,
962
53,3
6688
6,98
663
9(7
3)-
--
--

Financial StatementsStatutory ReportsCorporate Overview
163
An
nex
ure
6ST
ATe
Men
T O
F O
peR
ATI
On
S FO
R T
he
yeA
R e
nd
ed M
AR
ch
31,
201
7(`
in '0
00)
part
icu
lars
Ind
ivid
ual
pen
sio
nn
AV
g
uar
ante
ed
isco
nti
nu
ed
Fun
db
alan
cer
Mu
ltip
lier
Acc
elra
tor
pres
erve
rpr
ote
cto
rM
od
erat
or
Vir
tue
bal
ance
r 2
Inco
me
Div
iden
d-
-1,
504
8,73
380
1-
-45
698
165
Inte
rest
Inco
me
-36
8,78
29,
676
2,08
11,
486
3,09
34,
345
952
117
1,58
1O
ther
s-
--
--
--
--
--
368,
782
11,1
8010
,814
2,28
73,
093
4,34
599
781
51,
746
exp
ense
sM
anag
emen
t Ex
pens
es(1
)39
,886
4,55
716
,067
1,71
961
786
129
692
359
3O
ther
s-
--
--
--
--
-(1
)39
,886
4,55
716
,067
1,71
961
786
129
692
359
3N
et In
vest
men
t In
com
e1
328,
896
6,62
3(5
,253
)56
82,
476
3,48
470
1(1
08)
1,15
3g
ain
s/(l
oss
es)
on
ho
ldin
gs
Net
Rea
lised
gai
n/(lo
ss) o
n In
vest
men
ts-
163
15,4
5381
,559
8,75
21,
551
996
536
4,48
52,
551
Tran
sfer
/gai
n on
rev
alua
tion/
chan
ge
in f
air
valu
e-
756,
425
28,4
391,
883
(78)
277
371
2,87
61,
540
net
gai
n/(
loss
) o
n In
vest
men
ts-
238
21,8
7810
9,99
810
,635
1,47
31,
273
907
7,36
14,
091
Incr
ease
/(d
ecre
ase)
in A
sset
s fr
om
op
erat
ion
s1
329,
134
28,5
0110
4,74
511
,203
3,94
94,
757
1,60
87,
253
5,24
4
(` in
'000
)
part
icu
lars
pen
sio
ng
rou
p g
ratu
ity
Tota
l
Mu
ltip
lier
2pr
eser
ver
2pr
ote
cto
r 2
Vit
ue
2Fl
exi c
apM
ult
iplie
r 3
liq
uid
Fu
nd
deb
t Fu
nd
bal
ance
Fu
nd
Inco
me
Div
iden
d1,
507
--
4523
6-
--
1,91
953
6,52
0In
tere
st In
com
e35
374
616
3712
8-
-72
,632
25,3
391,
924,
207
Oth
ers
--
--
--
--
--
1,86
074
616
8236
4-
-72
,632
27,2
582,
460,
727
exp
ense
sM
anag
emen
t Ex
pens
es2,
261
1613
262
408
--
6,14
13,
249
2,12
0,82
5O
ther
s-
--
--
--
--
-2,
261
1613
262
408
--
6,14
13,
249
2,12
0,82
5N
et In
vest
men
t In
com
e(4
01)
5848
420
(44)
--
66,4
9124
,009
339,
902
gai
ns/
(lo
sses
) o
n h
old
ing
sN
et R
ealis
ed g
ain/
(loss
) on
Inve
stm
ents
17,3
6639
188
357
2,26
7-
-17
,001
13,0
435,
154,
316
Tran
sfer
/gai
n on
rev
alua
tion/
chan
ge
in f
air
valu
e1,
891
-80
349
2,05
0-
-13
,032
18,9
421,
935,
283
net
gai
n/(
loss
) o
n In
vest
men
ts19
,257
3926
870
64,
317
--
30,0
3331
,985
7,08
9,59
9In
crea
se/(
dec
reas
e) in
Ass
ets
fro
m o
per
atio
ns
18,8
5697
752
726
4,27
3-
-96
,524
55,9
947,
429,
501
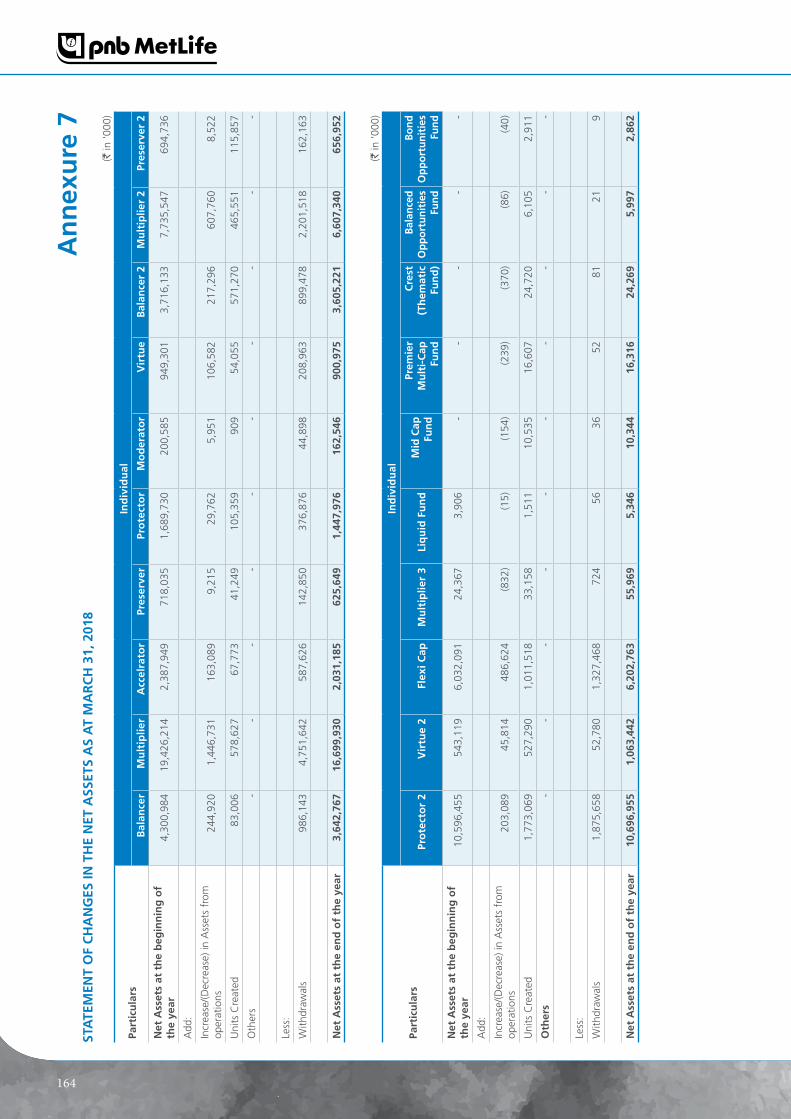
164
An
nex
ure
7ST
ATe
Men
T O
F c
hA
ng
eS In
Th
e n
eT A
SSeT
S A
S A
T M
AR
ch
31,
201
8(`
in '0
00)
part
icu
lars
Ind
ivid
ual
bal
ance
rM
ult
iplie
rA
ccel
rato
rpr
eser
ver
pro
tect
or
Mo
der
ato
rV
irtu
eb
alan
cer
2M
ult
iplie
r 2
pres
erve
r 2
net
Ass
ets
at t
he
beg
inn
ing
of
the
year
4,30
0,98
419
,426
,214
2,38
7,94
971
8,03
51,
689,
730
200,
585
949,
301
3,71
6,13
37,
735,
547
694,
736
Add
:
Incr
ease
/(Dec
reas
e) in
Ass
ets
from
op
erat
ions
244,
920
1,44
6,73
116
3,08
99,
215
29,7
625,
951
106,
582
217,
296
607,
760
8,52
2
Uni
ts C
reat
ed83
,006
578,
627
67,7
7341
,249
105,
359
909
54,0
5557
1,27
046
5,55
111
5,85
7
Oth
ers
--
--
--
--
--
Less
:
With
draw
als
986,
143
4,75
1,64
258
7,62
614
2,85
037
6,87
644
,898
208,
963
899,
478
2,20
1,51
816
2,16
3
net
Ass
ets
at t
he
end
of
the
year
3,64
2,76
716
,699
,930
2,03
1,18
562
5,64
91,
447,
976
162,
546
900,
975
3,60
5,22
16,
607,
340
656,
952
(` in
'000
)
part
icu
lars
Ind
ivid
ual
pro
tect
or
2V
irtu
e 2
Flex
i cap
Mu
ltip
lier
3li
qu
id F
un
dM
id c
ap
Fun
d
prem
ier
Mu
lti-
cap
Fu
nd
cre
st
(Th
emat
ic
Fun
d)
bal
ance
d
Op
po
rtu
nit
ies
Fun
d
bo
nd
O
pp
ort
un
itie
s Fu
nd
net
Ass
ets
at t
he
beg
inn
ing
of
the
year
10,5
96,4
5554
3,11
96,
032,
091
24,3
673,
906
--
--
-
Add
:
Incr
ease
/(Dec
reas
e) in
Ass
ets
from
op
erat
ions
203,
089
45,8
1448
6,62
4(8
32)
(15)
(154
)(2
39)
(370
)(8
6)(4
0)
Uni
ts C
reat
ed1,
773,
069
527,
290
1,01
1,51
833
,158
1,51
110
,535
16,6
0724
,720
6,10
52,
911
Oth
ers
--
--
--
--
--
Less
:
With
draw
als
1,87
5,65
852
,780
1,32
7,46
872
456
3652
8121
9
net
Ass
ets
at t
he
end
of
the
year
10,6
96,9
551,
063,
442
6,20
2,76
355
,969
5,34
610
,344
16,3
1624
,269
5,99
72,
862

Financial StatementsStatutory ReportsCorporate Overview
165
An
nex
ure
7ST
ATe
Men
T O
F c
hA
ng
eS In
Th
e n
eT A
SSeT
S A
S A
T M
AR
ch
31,
201
8(`
in '0
00)
part
icu
lars
Ind
ivid
ual
pen
sio
n
nA
V
gu
aran
tee
dis
con
tin
ued
Fu
nd
bal
ance
rM
ult
iplie
rA
ccel
rato
rpr
eser
ver
pro
tect
or
Mo
der
ato
rV
irtu
eb
alan
cer
2
net
Ass
ets
at t
he
beg
inn
ing
of
the
year
-5,
924,
858
228,
390
689,
741
77,6
5342
,339
51,6
9615
,508
47,6
7825
,348
Add
:
Incr
ease
/(Dec
reas
e) in
Ass
ets
from
op
erat
ions
-36
2,04
216
,744
60,3
286,
213
1,34
51,
459
794
5,97
81,
552
Uni
ts C
reat
ed-
2,06
2,95
98,
116
41,8
741,
959
836
(20,
305)
713
3,40
3(1
,183
)
Oth
ers
--
--
--
--
--
Less
:
With
draw
als
-2,
600,
627
60,0
0919
3,86
719
,181
14,8
309,
613
1,92
113
,481
9,90
5
net
Ass
ets
at t
he
end
of
the
year
-5,
749,
233
193,
240
598,
076
66,6
4529
,690
23,2
3715
,093
43,5
7815
,813
(` in
'000
)
part
icu
lars
pen
sio
ng
rou
p g
ratu
ity
Tota
l
Mu
ltip
lier
2pr
eser
ver
2pr
ote
cto
r 2
Vit
ue
2Fl
exi c
apM
ult
iplie
r 3
liq
uid
Fu
nd
deb
t Fu
nd
bal
ance
Fu
nd
net
Ass
ets
at t
he
beg
inn
ing
of
the
year
108,
321
774
6,69
14,
674
20,2
16-
-95
1,98
851
2,32
167
,727
,348
Add
:
Incr
ease
/(Dec
reas
e) in
Ass
ets
from
op
erat
ions
9,49
522
233
349
1,91
4-
-42
,950
36,3
454,
121,
382
un
its
cre
ated
12,1
82(1
63)
(398
)(2
,309
)1,
274
--
139,
933
32,5
847,
772,
555
Oth
ers
--
--
--
--
--
Less
:
With
draw
als
44,1
9147
61,
557
1,24
46,
542
--
161,
025
21,8
3616
,779
,347
net
Ass
ets
at t
he
end
of
the
year
85,8
0815
74,
969
1,47
216
,863
--
973,
847
559,
413
62,8
41,9
38

166
An
nex
ure
7ST
ATe
Men
T O
F c
hA
ng
eS In
Th
e n
eT A
SSeT
S A
S A
T M
AR
ch
31,
201
7(`
in '0
00)
part
icu
lars
Ind
ivid
ual
bal
ance
rM
ult
iplie
rA
ccel
rato
rpr
eser
ver
pro
tect
or
Mo
der
ato
rV
irtu
eb
alan
cer
2M
ult
iplie
r 2
pres
erve
r 2
net
Ass
ets
at t
he
beg
inn
ing
of
the
year
4,43
3,80
619
,765
,558
2,46
0,07
776
2,03
51,
740,
097
224,
871
936,
272
3,53
2,38
49,
046,
523
693,
633
Add
:
Incr
ease
/(Dec
reas
e) in
Ass
ets
from
op
erat
ions
463,
641
2,44
1,03
729
6,21
552
,579
112,
361
17,7
4213
4,17
041
3,75
21,
096,
528
55,9
84
Uni
ts C
reat
ed20
2,01
279
8,85
399
,842
40,6
5811
2,03
16,
538
52,4
0439
6,40
347
2,12
886
,392
Oth
ers
--
--
--
--
--
Less
:
With
draw
als
798,
475
3,57
9,23
446
8,18
513
7,23
727
4,75
948
,566
173,
545
626,
406
2,87
9,63
214
1,27
3
net
Ass
ets
at t
he
end
of
the
year
4,30
0,98
419
,426
,214
2,38
7,94
971
8,03
51,
689,
730
200,
585
949,
301
3,71
6,13
37,
735,
547
694,
736
(` in
'000
)
part
icu
lars
Ind
ivid
ual
pro
tect
or
2V
irtu
e 2
Flex
i cap
Mu
ltip
lier
3li
qu
id F
un
dM
id c
ap
Fun
d
prem
ier
Mu
lti-
cap
Fu
nd
cre
st
(Th
emat
ic
Fun
d)
bal
ance
d
Op
po
rtu
nit
ies
Fun
d
bo
nd
O
pp
ort
un
itie
s Fu
nd
net
Ass
ets
at t
he
beg
inn
ing
of
the
year
9,22
4,93
533
8,40
35,
529,
273
--
--
--
-
Add
:
Incr
ease
/(Dec
reas
e) in
Ass
ets
from
op
erat
ions
730,
963
53,3
6588
6,98
763
9(7
4)-
--
--
Uni
ts C
reat
ed1,
640,
289
213,
471
863,
875
24,0
094,
017
--
--
-
Oth
ers
--
--
--
--
--
Less
:
With
draw
als
999,
732
62,1
201,
248,
044
281
37-
--
--
net
Ass
ets
at t
he
end
of
the
year
10,5
96,4
5554
3,11
96,
032,
091
24,3
673,
906
--
--
-

Financial StatementsStatutory ReportsCorporate Overview
167
An
nex
ure
7ST
ATe
Men
T O
F c
hA
ng
eS In
Th
e n
eT A
SSeT
S A
S A
T M
AR
ch
31,
201
7(`
in '0
00)
part
icu
lars
Ind
ivid
ual
pen
sio
n
nA
V
gu
aran
tee
dis
con
tin
ued
Fu
nd
bal
ance
rM
ult
iplie
rA
ccel
rato
rpr
eser
ver
pro
tect
or
Mo
der
ato
rV
irtu
eb
alan
cer
2
net
Ass
ets
at t
he
beg
inn
ing
of
the
year
-5,
242,
322
262,
589
783,
886
83,3
7541
,062
58,2
2516
,696
45,0
4241
,762
Add
:
Incr
ease
/(Dec
reas
e) in
Ass
ets
from
op
erat
ions
-32
9,13
328
,502
104,
746
11,2
033,
948
4,75
81,
609
7,25
45,
244
Uni
ts C
reat
ed-
1,93
8,76
512
,434
23,8
144,
215
2,29
710
,527
762
863
4,40
3
Oth
ers
--
--
--
--
--
Less
:
With
draw
als
-1,
585,
362
75,1
3522
2,70
521
,140
4,96
821
,814
3,55
95,
481
26,0
61
net
Ass
ets
at t
he
end
of
the
year
-5,
924,
858
228,
390
689,
741
77,6
5342
,339
51,6
9615
,508
47,6
7825
,348
(` in
'000
)
part
icu
lars
pen
sio
ng
rou
p g
ratu
ity
Tota
l
Mu
ltip
lier
2pr
eser
ver
2pr
ote
cto
r 2
Vit
ue
2Fl
exi c
apM
ult
iplie
r 3
liq
uid
Fu
nd
deb
t Fu
nd
bal
ance
Fu
nd
net
Ass
ets
at t
he
beg
inn
ing
of
the
year
147,
063
1,19
810
,873
4,13
126
,001
--
909,
523
461,
668
66,8
23,2
83
Add
:
Incr
ease
/(Dec
reas
e) in
Ass
ets
from
op
erat
ions
18,8
5697
753
726
4,27
2-
-96
,524
55,9
947,
429,
508
un
its
cre
ated
4,10
675
404
334
1,04
6-
-55
,728
11,6
627,
084,
357
Oth
ers
--
--
--
--
--
Less
:
With
draw
als
61,7
0459
65,
339
517
11,1
03-
-10
9,78
717
,003
13,6
09,8
00
net
Ass
ets
at t
he
end
of
the
year
108,
321
774
6,69
14,
674
20,2
16-
-95
1,98
851
2,32
167
,727
,348

168
An
nex
uR
e TO
ReV
enu
e A
cc
Ou
nT-
bre
ak u
p o
f u
nit
lin
ked
bu
sin
ess
(ul)
Nam
e of
the
Insu
rer
: PN
B M
etLi
fe In
dia
Insu
ranc
e C
ompa
ny L
imite
d
An
nex
ure
8Re
gist
ratio
n N
o : 1
17
Dat
e of
Reg
istr
atio
n w
ith IR
DA
: A
ugus
t 6,
200
1
ReV
enu
e A
cc
Ou
nT
FOR
Th
e y
eAR
en
ded
MA
Rc
h 3
1, 2
018
polic
yho
lder
s’ A
cco
un
t (T
ech
nic
al A
cco
un
t)(`
in '0
00)
part
icu
lars
Sch
edu
le l
inke
d l
ife
lin
ked
pen
sio
n
lin
ked
gro
up
To
tal u
nit
li
nke
d n
on
-un
itu
nit
To
tal
no
n-u
nit
un
itTo
tal
no
n-u
nit
u
nit
Tota
l(1
)(2
)(3
)=(1
) +
(2)
(4)
(5)
(6)=
(4)
+ (
5)(7
)(8
)(9
)= (
7) +
(8)
(10)
=(3)
+ (6
)+(9
)pr
emiu
ms
earn
ed –
net
(a)
Prem
ium
41
4,24
17,
576,
923
7,99
1,16
475
646
,113
46,8
69-
171,
420
171,
420
8,20
9,45
3
(b)
Rein
sura
nce
cede
d(1
09,2
04)
-(1
09,2
04)
--
--
--
(109
,204
)
Inco
me
fro
m In
vest
men
ts(a
) In
tere
st, D
ivid
end
& R
ent
- G
ross
30,6
452,
287,
241
2,31
7,88
6-
30,6
4630
,646
-10
2,46
310
2,46
32,
450,
995
(b)
Prof
it on
sal
e/re
dem
ptio
n of
in
vest
men
ts1,
406
7,11
8,46
47,
119,
870
-17
0,44
617
0,44
6-
27,6
3327
,633
7,31
7,94
9
(c)
Loss
on
sale
/red
empt
ion
of
inve
stm
ents
(213
)(7
76,6
29)
(776
,842
)-
(13,
834)
(13,
834)
-(1
8,73
7)(1
8,73
7)(8
09,4
13)
(d)
Tran
sfer
/gai
n on
rev
alua
tion/
chan
ge
in f
air
valu
e-
(2,7
90,4
36)
(2,7
90,4
36)
-(5
9,36
4)(5
9,36
4)-
(21,
873)
(21,
873)
(2,8
71,6
73)
(e)
Oth
er M
isc
inco
me
33,7
89(2
0,78
5)13
,004
2,79
2(2
,599
)19
3(9
37)
941
413
,201
Oth
er in
com
e:-
(a)
Link
ed In
com
eU
L11,
902,
949
(1,9
02,9
49)
-21
,496
(21,
496)
-10
,191
(10,
191)
--
(b)
Con
trib
utio
n fr
om t
he
Shar
ehol
ders
' a/c
--
--
--
-
TOTA
l (A
)2,
273,
613
11,4
91,8
2913
,765
,442
25,0
4414
9,91
217
4,95
69,
254
251,
656
260,
910
14,2
01,3
08C
omm
issi
on
254,
482
-25
4,48
210
0-
100
(2)
-(2
)25
4,58
0
Ope
ratin
g Ex
pens
es r
elat
ed t
o In
sura
nce
Busi
ness
1,32
4,07
8-
1,32
4,07
84,
317
-4,
317
3,61
2-
3,61
21,
332,
007
Serv
ice
tax
on U
LIP
-38
2,74
038
2,74
0-
387
387
-1,
960
1,96
038
5,08
7
Prov
isio
n fo
r Ta
xatio
n -
--
--
--
--
-
Prov
isio
n fo
r A
dvan
ces
& R
ecov
erie
s(8
,812
)-
(8,8
12)
(327
)-
(327
)17
7-
177
(8,9
62)
TOTA
l (b
)1,
569,
748
382,
740
1,95
2,48
84,
090
387
4,47
73,
787
1,96
05,
747
1,96
2,71
2Be
nefit
s Pa
id (N
et)
UL2
306,
947
15,8
39,0
6316
,146
,010
227
373,
912
374,
139
(712
)18
0,74
318
0,03
116
,700
,180
Inte
rim B
onus
Pai
d-
--
--
--
--
-
Cha
nge
in V
alua
tion
Liab
ility
(28,
439)
(4,7
29,9
74)
(4,7
58,4
13)
(2,1
61)
(224
,387
)(2
26,5
48)
489
68,9
5369
,442
(4,9
15,5
19)
TOTA
l (c
)27
8,50
811
,109
,089
11,3
87,5
97(1
,934
)14
9,52
514
7,59
1(2
23)
249,
696
249,
473
11,7
84,6
61Su
Rpl
uS/
(d
eFIc
IT)
(d)
=(A
)-(b
)-(c
)42
5,35
7-
425,
357
22,8
88-
22,8
885,
690
-5,
690
453,
935
App
RO
pRIA
TIO
nS
Tran
sfer
to
Shar
ehol
ders
' a/c
425,
357
-42
5,35
722
,888
-22
,888
5,69
0-
5,69
045
3,93
5
Fund
s av
aila
ble
for
futu
re
appr
opria
tions
--
--
--
--
--
Tran
sfer
to
Def
icit
in R
even
ue A
ccou
nt-
--
--
--
--
-
Tota
l (d
)42
5,35
7-
425,
357
22,8
88-
22,8
885,
690
-5,
690
453,
935

Financial StatementsStatutory ReportsCorporate Overview
169
Nam
e of
the
Insu
rer
: PN
B M
etLi
fe In
dia
Insu
ranc
e C
ompa
ny L
imite
d
An
nex
ure
8Re
gist
ratio
n N
o : 1
17
Dat
e of
Reg
istr
atio
n w
ith IR
DA
: A
ugus
t 6,
200
1
ReV
enu
e A
cc
Ou
nT
FOR
Th
e y
eAR
en
ded
MA
Rc
h 3
1, 2
017
polic
yho
lder
s’ A
cco
un
t (T
ech
nic
al A
cco
un
t)(`
in '0
00)
part
icu
lars
Sch
edu
le l
inke
d l
ife
lin
ked
pen
sio
n
lin
ked
gro
up
To
tal u
nit
li
nke
d n
on
-un
itu
nit
To
tal
no
n-u
nit
un
itTo
tal
no
n-u
nit
u
nit
Tota
l(1
)(2
)(3
)=(1
) +
(2)
(4)
(5)
(6)=
(4)
+ (
5)(7
)(8
)(9
)= (
7) +
(8)
(10)
=(3)
+ (6
)+(9
)pr
emiu
ms
earn
ed –
net
(a)
Prem
ium
39
1,19
76,
933,
160
7,32
4,35
71,
039
62,7
4363
,782
-66
,072
66,0
727,
454,
211
(b)
Rein
sura
nce
cede
d(1
32,8
16)
-(1
32,8
16)
291
-29
1-
--
(118
,832
)In
com
e fr
om
Inve
stm
ents
(a)
Inte
rest
, Div
iden
d &
Ren
t -
Gro
ss25
,995
2,32
2,56
32,
348,
558
-38
,275
38,2
75-
99,8
8999
,889
2,48
6,72
2(b
) Pr
ofit
on s
ale/
rede
mpt
ion
of
inve
stm
ents
15,
482,
003
5,48
2,00
4-
145,
517
145,
517
-40
,018
40,0
185,
667,
539
(c)
Loss
on
sale
/red
empt
ion
of
inve
stm
ents
-(4
93,8
30)
(493
,830
)-
(9,4
16)
(9,4
16)
-(9
,974
)(9
,974
)(5
13,2
20)
(d)
Tran
sfer
/gai
n on
rev
alua
tion/
chan
ge
in f
air
valu
e-
1,85
7,20
71,
857,
207
-46
,102
46,1
02-
31,9
7431
,974
1,93
5,28
3
(e)
Oth
er M
isc
inco
me
14,2
41(4
,466
)9,
775
1,69
6(1
,538
)15
8(6
88)
690
29,
935
Oth
er in
com
e:-
(a)
Link
ed In
com
eU
L12,
086,
193
(2,0
86,1
93)
-25
,197
(25,
197)
-9,
433
(9,4
33)
--
(b)
Con
trib
utio
n fr
om t
he
Shar
ehol
ders
' a/c
--
--
--
-
TOTA
l (A
)2,
384,
811
14,0
10,4
4416
,395
,255
28,2
2325
6,48
628
4,70
98,
745
219,
236
227,
981
16,9
21,6
38C
omm
issi
on
134,
007
-13
4,00
716
5-
165
10-
1013
4,18
2O
pera
ting
Expe
nses
rel
ated
to
Insu
ranc
e Bu
sine
ss82
0,44
1-
820,
441
4,54
0-
4,54
02,
679
-2,
679
827,
660
Serv
ice
tax
on C
harg
es-
353,
378
353,
378
-2,
853
2,85
3-
1,36
91,
369
357,
600
Prov
isio
n fo
r Ta
xatio
n -
--
--
--
--
-Pr
ovis
ion
for
Adv
ance
s &
Rec
over
ies
12,0
58-
12,0
58(1
,380
)-
(1,3
80)
(165
)-
(165
)10
,513
TOTA
l (b
)96
6,50
635
3,37
81,
319,
884
3,32
52,
853
6,17
82,
524
1,36
93,
893
1,32
9,95
5Be
nefit
s Pa
id (N
et)
UL2
380,
472
12,6
43,2
5013
,023
,722
(380
)45
6,50
945
6,12
979
312
4,74
812
5,54
113
,605
,392
Inte
rim B
onus
Pai
d-
--
--
--
--
-C
hang
e in
val
uatio
n of
liab
ility
in
resp
ect
of li
fe p
olic
ies
--
--
--
--
--
Cha
nge
in V
alua
tion
Liab
ility
86,6
611,
013,
816
1,10
0,47
72,
510
(202
,876
)(2
00,3
66)
-93
,119
93,1
1999
3,23
0TO
TAl
(c)
467,
133
13,6
57,0
6614
,124
,199
2,13
025
3,63
325
5,76
379
321
7,86
721
8,66
014
,598
,622
SuR
plu
S/ (
deF
IcIT
) (d
) =
(A)-
(b)-
(c)
951,
172
-95
1,17
222
,768
-22
,768
5,42
8-
5,42
899
3,06
1A
ppR
OpR
IATI
On
STr
ansf
er t
o Sh
areh
olde
rs' a
/c-
--
--
--
--
-Fu
nds
avai
labl
e fo
r fu
ture
ap
prop
riatio
ns-
--
--
--
--
-
Tran
sfer
to
Def
icit
in R
even
ue A
ccou
nt95
1,17
2-
951,
172
22,7
68-
22,7
685,
428
-5,
428
979,
368
Tota
l (d
)95
1,17
2-
951,
172
22,7
68-
22,7
685,
428
-5,
428
979,
368

170
Nam
e of
the
Insu
rer
: PN
B M
etLi
fe In
dia
Insu
ranc
e C
ompa
ny L
imite
d
An
nex
ure
8Re
gist
ratio
n N
o : 1
17
Dat
e of
Reg
istr
atio
n w
ith IR
DA
: A
ugus
t 6,
200
1
Sch
edu
le-u
l1
lin
ked
Inco
me
(rec
ove
red
fro
m li
nke
d f
un
ds)
*(`
in '0
00)
part
icu
lars
2017
-18
life
lin
ked
un
itpe
nsi
on
lin
ked
un
itli
nke
d g
rou
p u
nit
Tota
l(1
)(2
)(3
)(4
)= (
1)+
(2)+
(3)
Fund
Adm
inis
trat
ion
char
ges
--
--
Fund
Man
agem
ent
char
ge83
8,57
919
,886
9,49
686
7,96
1Po
licy
Adm
inis
trat
ion
char
ge23
3,87
51,
358
-23
5,23
3Su
rren
der
char
ge46
,905
-43
547
,340
Switc
hing
cha
rge
--
--
Mor
talit
y ch
arge
762,
074
221
-76
2,29
5Ri
der
Prem
ium
cha
rge
--
--
Part
ial w
ithdr
awal
cha
rge
14-
-14
Dis
cont
inua
nce
char
ge19
,770
--
19,7
70M
isce
llane
ous
char
ge1,
732
3126
02,
023
TOTA
l (u
l-1)
1,90
2,94
921
,496
10,1
911,
934,
636
* (n
et o
f se
rvic
e ta
x, if
any
)
Sch
edu
le-u
l1
lin
ked
Inco
me
(rec
ove
red
fro
m li
nke
d f
un
ds)
*(`
in '0
00)
part
icu
lars
2016
-17
life
lin
ked
un
itpe
nsi
on
lin
ked
un
itli
nke
d g
rou
p u
nit
Tota
l(1
)(2
)(3
)(4
)= (
1)+
(2)+
(3)
Fund
Adm
inis
trat
ion
char
ges
--
--
Fund
Man
agem
ent
char
ge86
0,63
923
,038
9,20
089
2,87
7Po
licy
Adm
inis
trat
ion
char
ge21
2,65
01,
813
-21
4,46
3Su
rren
der
char
ge92
,875
(3)
-92
,872
Switc
hing
cha
rge
--
--
Mor
talit
y ch
arge
875,
713
305
-87
6,01
8Ri
der
Prem
ium
cha
rge
--
--
Part
ial w
ithdr
awal
cha
rge
(109
)-
(6)
(115
)D
isco
ntin
uanc
e ch
arge
42,0
00-
-42
,000
Mis
cella
neou
s ch
arge
2,42
544
239
2,70
8TO
TAl
(ul-
1)2,
086,
193
25,1
979,
433
2,12
0,82
3*
(net
of
serv
ice
tax,
if a
ny)

Financial StatementsStatutory ReportsCorporate Overview
171
Nam
e of
the
Insu
rer
: PN
B M
etLi
fe In
dia
Insu
ranc
e C
ompa
ny L
imite
d
An
nex
ure
8Re
gist
ratio
n N
o : 1
17
Dat
e of
Reg
istr
atio
n w
ith IR
DA
: A
ugus
t 6,
200
1
Sch
edu
le–u
l2
ben
eFIT
S pA
Id [
neT
] FO
R T
he
yeA
R e
nd
ed M
AR
ch
31,
201
8
(` in
'000
)
Sl.
no
.pa
rtic
ula
rs
lin
ked
lif
e l
inke
d p
ensi
on
l
inke
d g
rou
p
Tota
l un
it
lin
ked
no
n u
nit
un
itli
nke
d l
ife
no
n-u
nit
un
itli
nke
d
pen
sio
nn
on
-un
itu
nit
lin
ked
gro
up
(1)
(2)
(3)=
(1)+
(2)
(4)
(5)
(6)=
(4)+
(5)
(7)
(8)
(9)=
(7)+
(8)
(10)
=(3)
+(6)
+(9)
1In
sura
nce
Cla
ims
(a)
Cla
ims
by D
eath
36
1,07
019
7,49
055
8,56
013
73,
554
3,69
1(6
97)
-(6
97)
561,
554
(b)
Cla
ims
by M
atur
ity(1
35)
341,
212
341,
077
-70
,371
70,3
71-
--
411,
448
(c)
Ann
uitie
s / P
ensi
on p
aym
ent
--
--
--
(14)
130,
678
130,
664
130,
664
(d)
Oth
er b
enef
its-
--
--
-
- Su
rren
der
1,18
815
,300
,362
15,3
01,5
5090
299,
987
300,
077
-50
,064
50,0
6415
,651
,691
- Pe
riodi
cal B
enef
its-
--
--
--
--
-
- H
ealth
--
--
--
--
--
- O
ther
s-
--
--
--
--
-
Sub
To
tal (
A)
362,
123
15,8
39,0
6416
,201
,187
227
373,
912
374,
139
(711
)18
0,74
218
0,03
116
,755
,357
2A
mou
nt C
eded
in r
eins
uran
ce
(a)
Cla
ims
by D
eath
55
,177
-55
,177
--
--
--
55,1
77
(b)
Cla
ims
by M
atur
ity-
--
--
--
--
-
(c)
Ann
uitie
s / P
ensi
on p
aym
ent
--
--
--
(d)
Oth
er b
enef
its-
--
--
--
--
-
- Su
rren
der
--
--
--
--
--
- Pe
riodi
cal B
enef
its-
--
--
--
--
-
- H
ealth
--
--
--
--
--
Sub
To
tal (
b)
55,1
77-
55,1
77-
--
--
-55
,177
TOTA
l (A
) -
(b)
306,
946
15,8
39,0
6416
,146
,010
227
373,
912
374,
139
(711
)18
0,74
218
0,03
116
,700
,180
ben
efit
s p
aid
to
cla
iman
ts:
In In
dia
306,
946
15,8
39,0
6416
,146
,010
227
373,
912
374,
139
(711
)18
0,74
218
0,03
116
,700
,180
Out
side
Indi
a
TOTA
l (u
l2)
306,
946
15,8
39,0
6416
,146
,010
227
373,
912
374,
139
(711
)18
0,74
218
0,03
116
,700
,180
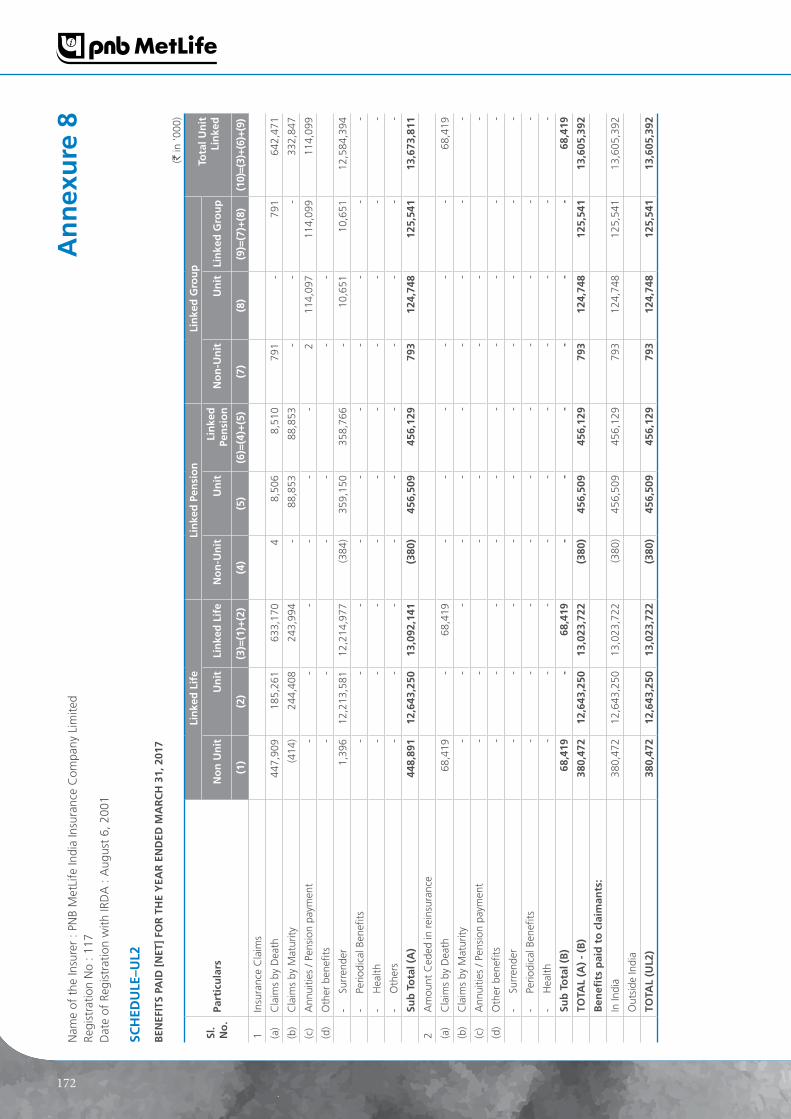
172
Nam
e of
the
Insu
rer
: PN
B M
etLi
fe In
dia
Insu
ranc
e C
ompa
ny L
imite
d
An
nex
ure
8Re
gist
ratio
n N
o : 1
17
Dat
e of
Reg
istr
atio
n w
ith IR
DA
: A
ugus
t 6,
200
1
Sch
edu
le–u
l2
ben
eFIT
S pA
Id [
neT
] FO
R T
he
yeA
R e
nd
ed M
AR
ch
31,
201
7
(` in
'000
)
Sl.
no
.pa
rtic
ula
rs
lin
ked
lif
e l
inke
d p
ensi
on
l
inke
d g
rou
p
Tota
l un
it
lin
ked
no
n u
nit
un
itli
nke
d l
ife
no
n-u
nit
un
itli
nke
d
pen
sio
nn
on
-un
itu
nit
lin
ked
gro
up
(1)
(2)
(3)=
(1)+
(2)
(4)
(5)
(6)=
(4)+
(5)
(7)
(8)
(9)=
(7)+
(8)
(10)
=(3)
+(6)
+(9)
1In
sura
nce
Cla
ims
(a)
Cla
ims
by D
eath
44
7,90
918
5,26
163
3,17
04
8,50
68,
510
791
-79
164
2,47
1
(b)
Cla
ims
by M
atur
ity(4
14)
244,
408
243,
994
-88
,853
88,8
53-
--
332,
847
(c)
Ann
uitie
s / P
ensi
on p
aym
ent
--
--
--
211
4,09
711
4,09
911
4,09
9
(d)
Oth
er b
enef
its-
--
--
-
- Su
rren
der
1,39
612
,213
,581
12,2
14,9
77(3
84)
359,
150
358,
766
-10
,651
10,6
5112
,584
,394
- Pe
riodi
cal B
enef
its-
--
--
--
--
-
- H
ealth
--
--
--
--
--
- O
ther
s-
--
--
--
--
-
Sub
To
tal (
A)
448,
891
12,6
43,2
5013
,092
,141
(380
)45
6,50
945
6,12
979
312
4,74
812
5,54
113
,673
,811
2A
mou
nt C
eded
in r
eins
uran
ce
(a)
Cla
ims
by D
eath
68
,419
-68
,419
--
--
--
68,4
19
(b)
Cla
ims
by M
atur
ity-
--
--
--
--
-
(c)
Ann
uitie
s / P
ensi
on p
aym
ent
--
--
--
-
(d)
Oth
er b
enef
its-
--
--
--
--
-
- Su
rren
der
--
--
--
--
--
- Pe
riodi
cal B
enef
its-
--
--
--
--
-
- H
ealth
--
--
--
--
--
Sub
To
tal (
b)
68,4
19-
68,4
19-
--
--
-68
,419
TOTA
l (A
) -
(b)
380,
472
12,6
43,2
5013
,023
,722
(380
)45
6,50
945
6,12
979
312
4,74
812
5,54
113
,605
,392
ben
efit
s p
aid
to
cla
iman
ts:
In In
dia
380,
472
12,6
43,2
5013
,023
,722
(380
)45
6,50
945
6,12
979
312
4,74
812
5,54
113
,605
,392
Out
side
Indi
a
TOTA
l (u
l2)
380,
472
12,6
43,2
5013
,023
,722
(380
)45
6,50
945
6,12
979
312
4,74
812
5,54
113
,605
,392

Financial StatementsStatutory ReportsCorporate Overview
173
Name of the Insurer : PNB MetLife India Insurance Company Limited Annexure 9Registration No : 117 Date of Registration with IRDA : August 6, 2001
Fund balance Sheet as at March 31, 2018
Form A-bS(ul) (` in '000)particulars Schedule March 31, 2018 March 31, 2017 Sources of Funds
policyholders' Funds:Policyholder contribution F-1 45,987,058 54,993,856 Revenue Account 16,854,880 12,733,492 Funds for future appropriation - - Total 62,841,938 67,727,348
Application of Funds
Investments F-2 61,819,923 66,459,394
Current Assets F-3 1,512,955 1,888,769 Less: Current Liabilities and Provisions F-4 490,940 620,815 Net current assets 1,022,015 1,267,954
Total 62,841,938 67,727,348
Fund Revenue Account for the year ended March 31, 2018
Form A-RA(ul) (` in '000)particulars Schedule March 31, 2018 March 31, 2017 Income from investmentsInterest income 1,907,585 1,924,206 Dividend income 512,763 536,521 Profit/loss on sale of investment 6,507,343 5,154,318 Profit/loss on inter fund transfer/ sale of investment - - Miscellaneous Income - - Unrealised Gain/loss* (2,871,673) 1,935,283 Total (A) 6,056,018 9,550,328
Fund management expenses 867,961 892,876 Fund administration expenses - - Other charges F-5 1,066,675 1,227,954Total (b) 1,934,636 2,120,830
net Income for the year (A-b) 4,121,382 7,429,498
Add: Fund revenue account at the beginning of the year 12,733,498 5,303,994
Fund revenue account at the end of the year 16,854,880 12,733,492
* Net change in mark to market value of investments

174
Schedules to Fund Revenue Account Annexure 9Name of the Insurer : PNB MetLife India Insurance Company Limited Registration No : 117 Date of Registration with IRDA : August 6, 2001
Schedule: F-1
pOlIcyhOldeRS' cOnTRIbuTIOn (` in '000)
particulars March 31, 2018 March 31, 2017
Opening balance 54,993,856 61,519,296
Add: Additions during the year* 7,772,555 7,084,357
Less: Deductions during the year* (16,779,353) (13,609,797)
Less: Funds for future appropriation - -
closing balance 45,987,058 54,993,856
* Additions represents units creation and deductions represent unit cancellations
Schedule: F-2
InVeSTMenTS (` in '000)
particulars March 31, 2018 March 31, 2017
Approved Investments
Government Bonds 11,198,755 12,320,376
Corporate Bonds 3,904,156 3,032,692
Infrastructure Bonds 7,633,492 7,203,409
Equity/Preference shares 32,803,465 38,917,732
Money Market - -
Mutual Funds - -
Commercial Papers/CBLO 2,565,630 2,473,325
Fixed Deposits - -
Total 58,105,498 63,947,534
Other Investments
Corporate Bonds - -
Infrastructure Bonds - -
Equity/Preference shares 592,656 1,435,436
Money Market - -
Mutual Funds 3,121,769 1,076,424
Commercial Papers/CBLO - -
Fixed Deposits
Total 3,714,425 2,511,860
gRAnd TOTAl 61,819,923 66,459,394
% of Approved Investments to Total 93.99% 96.22%
% of Other Investments to Total 6.01% 3.78%

Financial StatementsStatutory ReportsCorporate Overview
175
Schedules to Fund Revenue Account Annexure 9Name of the Insurer : PNB MetLife India Insurance Company Limited Registration No : 117 Date of Registration with IRDA : August 6, 2001
Schedule: F-3
cuRRenT ASSeTS (` in '000)
particulars March 31, 2018 March 31, 2017
Accrued Interest 566,757 540,544
Cash &Bank Balance 14,885 1,770
Dividend Receivable 926 6,504
Receivable for Sale of Investments 227,248 1,110,965
Unit Collection A/c# 703,139 228,986
Other Current Assets (for Investments) - -
Total 1,512,955 1,888,769
Schedule: F-4
cuRRenT lIAbIlITIeS (` in '000)
particulars March 31, 2018 March 31, 2017
Payable for Purchase of Investments 128,320 564,030
Other Current Liabilities 10,410 2,799
Unit Payable a/c# 352,210 53,986
Total 490,940 620,815
bReAK up OF OTheR expenSeS undeR ulIp
Schedule: F-5
OTheR expenSeS* (` in '000)
particulars March 31, 2018 March 31, 2017
Policy Administration charge 235,233 214,463
Surrender charge 47,340 92,872
Switching charge - 0
Mortality charge 762,295 876,018
Rider Premium charge - 0
Partial withdrawal charge 14 (115)
Discontinuance charge 19,770 42,000
Miscellaneous charge 2,023 2,708
Total 1,066,675 1,227,946
*Any expense which is 1% of the total expenses incurred should be disclosed as a separate line item.
# Represents inter fund receivables or payables, if any

176
Name of the Insurer : PNB MetLife India Insurance Company Limited Annexure 9Registration No : 117 Date of Registration with IRDA : August 6, 2001
net Asset Value (nAV) per unit as at March 31, 2018
Form A-bS(ul)
Sl no
Funds
net Assets as per balance Sheet (Total
Assets less current lai-bilities and provisions)
number of units out-standing
nAV per unit (`)
Figures `in 000 nos in thousands(a) (b) (a)/(b)
1 linked Individual lifeBalancer 3,642,770 108,247 33.6524 Multiplier 16,699,932 408,484 40.8827 Accelerator 2,031,185 51,370 39.5403 Preserver 625,650 27,896 22.4276 Protector 1,447,975 58,845 24.6066 Moderator 162,545 5,919 27.4605 Virtue 900,976 41,445 21.7392 Balancer 2 3,605,221 189,209 19.0542 Multiplier 2 6,607,340 358,078 18.4523 Preserver 2 656,951 36,339 18.0783 Protector 2 10,696,951 560,332 19.0904 Vitue 2 1,063,442 47,276 22.4942 Flexi Cap 6,202,763 295,949 20.9589 Multiplier 3 55,967 4,786 11.6942 Liquid Fund 5,346 494 10.8279 Mid Cap Fund 10,345 1,032 10.0221 Premier Multi-Cap Fund 16,316 1,629 10.0136 Crest (Thematic Fund) 24,269 2,428 9.9963 Balanced Opportunities Fund 5,997 596 10.0603 Bond Opportunities Fund 2,861 285 10.0297 NAV Guarantee - - - Discontinued Fund 5,749,233 346,512 16.5918 Total 60,214,035 2,547,151
2 linked Individual pensionBalancer 193,241 5,742 33.6524 Multiplier 598,077 14,629 40.8827 Accelerator 66,645 1,685 39.5403 Preserver 29,690 1,324 22.4276 Protector 23,237 944 24.6066 Moderator 15,092 550 27.4605 Virtue 43,578 2,005 21.7392 Balancer 2 15,813 830 19.0542 Multiplier 2 85,808 4,650 18.4523 Preserver 2 157 9 18.0783 Protector 2 4,969 260 19.0904 Vitue 2 1,473 65 22.4942 Flexi Cap 16,862 805 20.9589 Total 1,094,642 33,498
3 linked groupDebt Fund 973,847 52,888 18.4134 Balanced Fund 559,414 26,334 21.2428 Total 1,533,261 79,222 net asset as per balance Sheet 62,841,938

Financial StatementsStatutory ReportsCorporate Overview
177
Name of the Insurer : PNB MetLife India Insurance Company Limited Annexure 9Registration No : 117 Date of Registration with IRDA : August 6, 2001
net Asset Value (nAV) per unit as at March 31, 2017
Form A-bS(ul)
Sl no
Funds
net Assets as per balance Sheet (Total
Assets less current lai-bilities and provisions)
number of units out-standing
nAV per unit (`)
Figures ` in 000 nos in thousands(a) (b) (a)/(b)
1 linked Individual lifeBalancer 4,300,985 137,277 31.3306Multiplier 19,426,217 516,665 37.5994Accelerator 2,387,948 65,263 36.5896Preserver 718,034 33,082 21.7044Protector 1,689,729 71,414 23.6613Moderator 200,584 7,667 26.1621Virtue 949,301 49,242 19.2783Balancer 2 3,716,133 210,613 17.6444Multiplier 2 7,735,547 459,002 16.8530Preserver 2 694,736 39,682 17.5076Protector 2 10,596,456 577,611 18.3453Vitue 2 543,118 27,707 19.6018Flexi Cap 6,032,091 317,611 18.9921Multiplier 3 24,367 2,305 10.5720Liquid Fund 3,906 378 10.3291NAV Guarantee - - 0.0000Discontinued Fund 5,924,858 377,462 15.6966Total 64,944,010 2,892,981
2 linked Individual pensionBalancer 228,389 7,290 31.3306Multiplier 689,741 18,344 37.5994Accelerator 77,654 2,122 36.5896Preserver 42,339 1,951 21.7044Protector 51,696 2,185 23.6613Moderator 15,507 593 26.1621Virtue 47,678 2,473 19.2783Balancer 2 25,348 1,437 17.6444Multiplier 2 108,322 6,427 16.8530Preserver 2 774 44 17.5076Protector 2 6,691 365 18.3453Vitue 2 4,674 238 19.6018Flexi Cap 20,216 1,065 18.9921Total 1,319,029 44,534
3 linked groupDebt Fund 951,987 54,087 17.6009Balanced Fund 512,322 25,818 19.8435Total 1,464,309 79,905net asset as per balance Sheet 67,727,348

178
Statement showing the controlled Fund of pnb Metlife India Insurance co. ltd.
(` in crore)
2017-18 2016-17
1 computation of controlled fund as per the balance Sheet
policyholders' Fund (life Fund)
Participating
Individual Assurance 6,742 5,260
Individual Pension 77 39
Group Assurance 32 31
Non-participating
Individual Assurance 2,646 1,800
Group Assurance 285 229
Individual Annuity 21 9
Group Pension 39 47
Health 80 35
Linked
Individual Assurance 6,061 5,226
Group Assurance - -
Individual Pension 109 176
Group Superannuation - -
Group Gratuity 153 155
Funds for Future Appropriations 179 152
Total (A) 16,424 13,158
Shareholders'' Fund
Paid up Capital 2,013 2,013
Reserves & Surpluses - 221
Fair Value Change (0.01) -
Total (b) 2,013 2,234
Misc. expenses not written off -
Credit / (Debit) from P&L A/c. (938) -
Total (c) (938) -
Total shareholders' funds (b+c) 1,075 2,234
controlled Fund (Total (A+b+c)) 17,499 15,392
Annexure 9

Financial StatementsStatutory ReportsCorporate Overview
179
(` in crore)
2017-18 2016-17
2 Reconciliation of the controlled Fund from Revenue and profit & loss Account
Opening Balance of Controlled Fund 15,392 13,401
Add: Inflow
Income
Premium Income 3,954 3,236
Less: Reinsurance ceded (93) (97)
net premium 3,861 3,139
Investment Income 1,348 1,521
Other Income 22 17
Funds transferred from Shareholders' Accounts 48 -
Total Income 5,279 4,677
Less: Outgo
(i) Benefits paid (Net) 2,107 1,769
(ii) Interim Bonus Paid 3 2
(iii) Change in Valuation of Liability 1,937 1,898
(iv) Commission 215 180
(v) Operating Expenses 815 747
(vI) Service tax on ULIP 39 36
(vii) Provision for Taxation - -
(viii) Provision for Advances & Recoveries (0.5) 5
Total Outgo 5,116 4,636
Surplus of the policyholders' Fund 163 41
less: transferred to Shareholders' Account 135 15
Net Flow in Policyholders' account 28 26
Add: Net income in Shareholders' Fund 142 64
net In Flow / Outflow 170 90
Add: change in valuation Liabilities 1,937 1,901
Add: increase in Paid up Capital - -
Add: change in Fair Value - -
Closing Balance of Controlled Fund 17,499 15,392
As Per Balance Sheet 17,499 15,392
Difference, if any - -
Annexure 9

180
(` in crore)
2017-18 2016-17
3 Reconciliation with Shareholders' and policyholders' Fund
Policyholders' Funds
3.1 policyholders' Funds - Traditional-pAR and nOn-pAR
Opening Balance of the Policyholders' Fund 7,601 5,869
Add: Surplus/(Deficit) of the Revenue Account 117 (57)
Amount transferred from/ (to) Shareholders' account (90) (15)
Add: change in valuation Liabilities 2,430 1,805
Add:Transfer from Profit and Loss account (Shareholder's Account) to meet brought forward accumalated deficit in Revenue Account (Policyholder's Account) 42
Total 10,100 7,601
As per Balance Sheet 10,100 7,601
Difference, if any - -
3.2 policyholders' Funds - linked
Opening Balance of the Policyholders' Fund 5,557 5,363
Add: Surplus/(Deficit) of the Revenue Account - 98
Add: change in valuation Liabilities (491) 96
Add:Transfer from Profit and Loss account (Shareholder's Account) to meet brought forward accumalated deficit in Revenue Account (Policyholder's Account) 1,258
Total 6,324 5,557
As per Balance Sheet 6,324 5,557
Difference, if any - -
Shareholders'' Funds
Opening Balance of Shareholders' Fund 2,234 2,170
Add: net income of Shareholders' account (P&L) 142 64
Add: Infusion of Capital - -
Add:Change in Fair value change (0.3) -
Add:Transfer to Revenue Account (Policyholder's Account) to meet brought forward accumnalated deficit in Revenue Account (Policyholder's Account) (1,300)
Closing Balance of the Shareholders'' fund 1,076 2,234
As per Balance Sheet 1,076 2,234
Difference, if any - -
Annexure 9
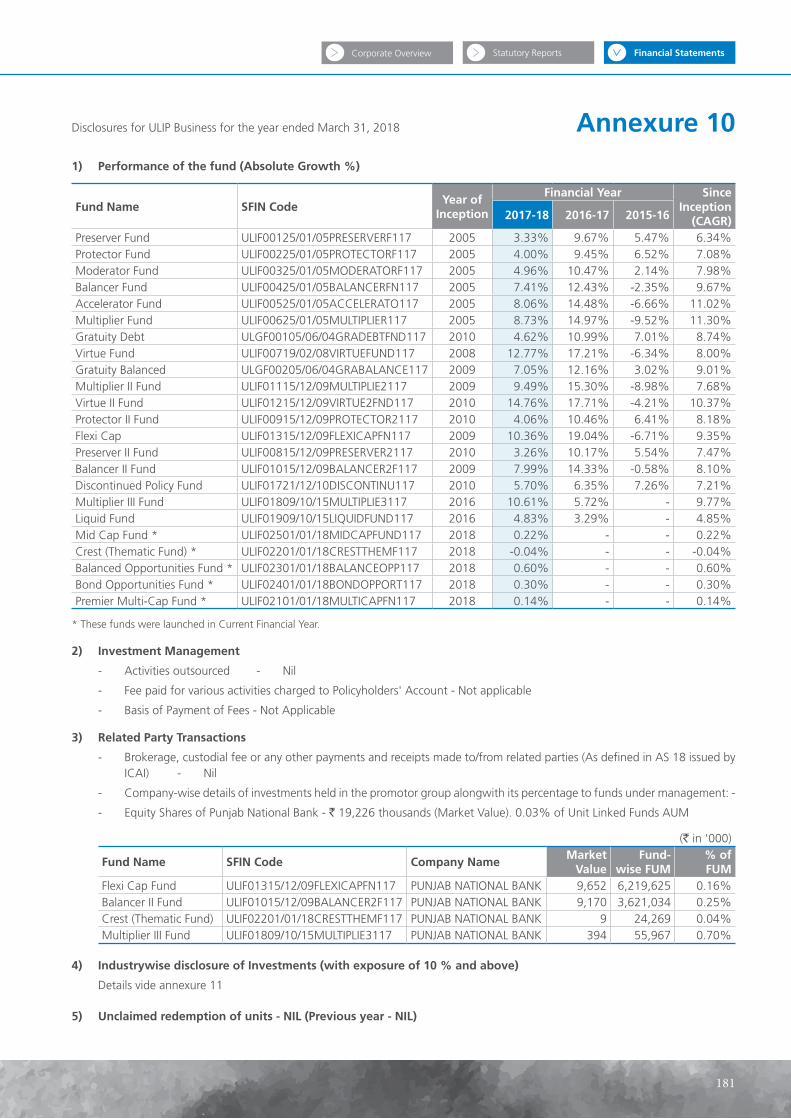
Financial StatementsStatutory ReportsCorporate Overview
181
Disclosures for ULIP Business for the year ended March 31, 2018 Annexure 101) performance of the fund (Absolute growth %)
Fund name SFIn codeyear of
Inception
Financial year Since Inception
(cAgR)2017-18 2016-17 2015-16
Preserver Fund ULIF00125/01/05PRESERVERF117 2005 3.33% 9.67% 5.47% 6.34%Protector Fund ULIF00225/01/05PROTECTORF117 2005 4.00% 9.45% 6.52% 7.08%Moderator Fund ULIF00325/01/05MODERATORF117 2005 4.96% 10.47% 2.14% 7.98%Balancer Fund ULIF00425/01/05BALANCERFN117 2005 7.41% 12.43% -2.35% 9.67%Accelerator Fund ULIF00525/01/05ACCELERATO117 2005 8.06% 14.48% -6.66% 11.02%Multiplier Fund ULIF00625/01/05MULTIPLIER117 2005 8.73% 14.97% -9.52% 11.30%Gratuity Debt ULGF00105/06/04GRADEBTFND117 2010 4.62% 10.99% 7.01% 8.74%Virtue Fund ULIF00719/02/08VIRTUEFUND117 2008 12.77% 17.21% -6.34% 8.00%Gratuity Balanced ULGF00205/06/04GRABALANCE117 2009 7.05% 12.16% 3.02% 9.01%Multiplier II Fund ULIF01115/12/09MULTIPLIE2117 2009 9.49% 15.30% -8.98% 7.68%Virtue II Fund ULIF01215/12/09VIRTUE2FND117 2010 14.76% 17.71% -4.21% 10.37%Protector II Fund ULIF00915/12/09PROTECTOR2117 2010 4.06% 10.46% 6.41% 8.18%Flexi Cap ULIF01315/12/09FLEXICAPFN117 2009 10.36% 19.04% -6.71% 9.35%Preserver II Fund ULIF00815/12/09PRESERVER2117 2010 3.26% 10.17% 5.54% 7.47%Balancer II Fund ULIF01015/12/09BALANCER2F117 2009 7.99% 14.33% -0.58% 8.10%Discontinued Policy Fund ULIF01721/12/10DISCONTINU117 2010 5.70% 6.35% 7.26% 7.21%Multiplier III Fund ULIF01809/10/15MULTIPLIE3117 2016 10.61% 5.72% - 9.77%Liquid Fund ULIF01909/10/15LIQUIDFUND117 2016 4.83% 3.29% - 4.85%Mid Cap Fund * ULIF02501/01/18MIDCAPFUND117 2018 0.22% - - 0.22%Crest (Thematic Fund) * ULIF02201/01/18CRESTTHEMF117 2018 -0.04% - - -0.04%Balanced Opportunities Fund * ULIF02301/01/18BALANCEOPP117 2018 0.60% - - 0.60%Bond Opportunities Fund * ULIF02401/01/18BONDOPPORT117 2018 0.30% - - 0.30%Premier Multi-Cap Fund * ULIF02101/01/18MULTICAPFN117 2018 0.14% - - 0.14%
* These funds were launched in Current Financial Year.
2) Investment Management
- Activities outsourced - Nil
- Fee paid for various activities charged to Policyholders' Account - Not applicable
- Basis of Payment of Fees - Not Applicable
3) Related party Transactions
- Brokerage, custodial fee or any other payments and receipts made to/from related parties (As defined in AS 18 issued by ICAI) - Nil
- Company-wise details of investments held in the promotor group alongwith its percentage to funds under management: -
- Equity Shares of Punjab National Bank - ` 19,226 thousands (Market Value). 0.03% of Unit Linked Funds AUM
(` in '000)
Fund name SFIn code company nameMarket
ValueFund-
wise FuM% of FuM
Flexi Cap Fund ULIF01315/12/09FLEXICAPFN117 PUNJAB NATIONAL BANK 9,652 6,219,625 0.16%Balancer II Fund ULIF01015/12/09BALANCER2F117 PUNJAB NATIONAL BANK 9,170 3,621,034 0.25%Crest (Thematic Fund) ULIF02201/01/18CRESTTHEMF117 PUNJAB NATIONAL BANK 9 24,269 0.04%Multiplier III Fund ULIF01809/10/15MULTIPLIE3117 PUNJAB NATIONAL BANK 394 55,967 0.70%
4) Industrywise disclosure of Investments (with exposure of 10 % and above)
Details vide annexure 11
5) unclaimed redemption of units - nIl (previous year - nIl)

182
Annexure 106) nAV: highest, lowest and closing
For the year ended March 31, 2018
Fund name SFIn code highest lowest closing
Preserver Fund ULIF00125/01/05PRESERVERF117 22.5339 21.5760 22.4276
Protector Fund ULIF00225/01/05PROTECTORF117 24.6087 23.5816 24.6066
Moderator Fund ULIF00325/01/05MODERATORF117 27.8162 26.0641 27.4605
Balancer Fund ULIF00425/01/05BALANCERFN117 35.1677 31.2274 33.6524
Accelerator Fund ULIF00525/01/05ACCELERATO117 42.5978 36.3665 39.5403
Multiplier Fund ULIF00625/01/05MULTIPLIER117 45.0166 37.2997 40.8827
Gratuity Debt ULGF00105/06/04GRADEBTFND117 18.4134 17.5435 18.4134
Virtue Fund ULIF00719/02/08VIRTUEFUND117 23.5058 19.2762 21.7392
Gratuity Balanced ULGF00205/06/04GRABALANCE117 21.6632 19.8452 21.2428
Multiplier II Fund ULIF01115/12/09MULTIPLIE2117 20.3043 16.7538 18.4523
Virtue II Fund ULIF01215/12/09VIRTUE2FND117 24.2441 19.6003 22.4942
Protector II Fund ULIF00915/12/09PROTECTOR2117 19.0904 18.2580 19.0904
Flexi Cap ULIF01315/12/09FLEXICAPFN117 22.9642 18.9906 20.9589
Preserver II Fund ULIF00815/12/09PRESERVER2117 18.1878 17.4047 18.0783
Balancer II Fund ULIF01015/12/09BALANCER2F117 19.8950 17.6452 19.0542
Discontinued Policy Fund ULIF01721/12/10DISCONTINU117 16.5918 15.6961 16.5918
Multiplier III Fund ULIF01809/10/15MULTIPLIE3117 12.7782 10.5148 11.6942
Liquid Fund ULIF01909/10/15LIQUIDFUND117 10.8279 10.3285 10.8279
Mid Cap Fund ULIF02501/01/18MIDCAPFUND117 10.0707 9.9303 10.0221
Crest (Thematic Fund) ULIF02201/01/18CRESTTHEMF117 10.0635 9.9295 9.9963
Balanced Opportunities Fund ULIF02301/01/18BALANCEOPP117 10.0879 9.9989 10.0603
Bond Opportunities Fund ULIF02401/01/18BONDOPPORT117 10.0322 9.9757 10.0297
Premier Multi-Cap Fund ULIF02101/01/18MULTICAPFN117 10.0721 9.9895 10.0136
For the year ended March 31, 2017
Fund name SFIn code highest lowest closing
Preserver Fund ULIF00125/01/05PRESERVERF117 22.5953 19.7935 21.7044
Protector Fund ULIF00225/01/05PROTECTORF117 24.1277 21.6213 23.6613
Moderator Fund ULIF00325/01/05MODERATORF117 26.1621 23.6606 26.1621
Balancer Fund ULIF00425/01/05BALANCERFN117 31.3306 27.6211 31.3306
Accelerator Fund ULIF00525/01/05ACCELERATO117 36.5896 31.4266 36.5896
Multiplier Fund ULIF00625/01/05MULTIPLIER117 37.6333 31.9889 37.5994
Gratuity Debt ULGF00105/06/04GRADEBTFND117 17.9860 15.8608 17.6009
Virtue Fund ULIF00719/02/08VIRTUEFUND117 19.2783 16.1357 19.2783
Gratuity Balanced ULGF00205/06/04GRABALANCE117 19.8436 17.6414 19.8435
Multiplier II Fund ULIF01115/12/09MULTIPLIE2117 16.8742 14.3098 16.8530
Virtue II Fund ULIF01215/12/09VIRTUE2FND117 19.6018 16.3853 19.6018
Protector II Fund ULIF00915/12/09PROTECTOR2117 18.6837 16.6110 18.3453
Flexi Cap ULIF01315/12/09FLEXICAPFN117 18.9921 15.6435 18.9921
Preserver II Fund ULIF00815/12/09PRESERVER2117 18.2486 15.8946 17.5076
Balancer II Fund ULIF01015/12/09BALANCER2F117 17.6444 15.3253 17.6444
Discontinued Policy Fund ULIF01721/12/10DISCONTINU117 15.6966 14.7622 15.6966
Multiplier III Fund ULIF01809/10/15MULTIPLIE3117 10.5765 9.2871 10.5720
Liquid Fund ULIF01909/10/15LIQUIDFUND117 10.3291 10.0000 10.3291

Financial StatementsStatutory ReportsCorporate Overview
183
Annexure 107) expenses charged to Fund (%) - Annualised expense ratio to average daily assets of the fund
Fund Management charges SFIn code 2017-18 2016-17Accelerator ULIF00525/01/05ACCELERATO117 1.75% 1.75%Balancer ULIF00425/01/05BALANCERFN117 1.50% 1.50%Balancer II ULIF01015/12/09BALANCER2F117 1.15% 1.15%Flexi Cap ULIF01315/12/09FLEXICAPFN117 1.25% 1.25%Gratuity Balanced ULGF00205/06/04GRABALANCE117 0.65% 0.65%Gratuity Debt ULGF00105/06/04GRADEBTFND117 0.65% 0.65%Moderator ULIF00325/01/05MODERATORF117 1.50% 1.50%Multiplier ULIF00625/01/05MULTIPLIER117 1.75% 1.75%Multiplier II ULIF01115/12/09MULTIPLIE2117 1.25% 1.25%Preserver ULIF00125/01/05PRESERVERF117 1.25% 1.25%Preserver II ULIF00815/12/09PRESERVER2117 1.00% 1.00%Protector ULIF00225/01/05PROTECTORF117 1.25% 1.25%Protector II ULIF00915/12/09PROTECTOR2117 1.00% 1.00%Virtue ULIF00719/02/08VIRTUEFUND117 1.75% 1.75%Virtue II ULIF01215/12/09VIRTUE2FND117 1.25% 1.25%Multiplier III ULIF01809/10/15MULTIPLIE3117 1.25% 1.25%Liquid ULIF01909/10/15LIQUIDFUND117 1.00% 1.00%Discontinued Policy fund ULIF01721/12/10DISCONTINU117 0.50% 0.50%Mid Cap * ULIF02501/01/18MIDCAPFUND117 1.25% NACrest (Thematic Fund) * ULIF02201/01/18CRESTTHEMF117 1.25% NABalanced Opportunities * ULIF02301/01/18BALANCEOPP117 1.15% NABond Opportunities * ULIF02401/01/18BONDOPPORT117 1.00% NAPremier Multi-Cap ULIF02101/01/18MULTICAPFN117 1.25% NA
* These funds were launched in Current Financial Year.
8) Ratio of gross income (including unrealised gains to average daily net assets)
particulars SFIn code 2017-18 2016-17Accelerator ULIF00525/01/05ACCELERATO117 10.30% 15.64%Balancer ULIF00425/01/05BALANCERFN117 9.28% 13.51%Balancer II ULIF01015/12/09BALANCER2F117 9.18% 14.68%Flexi Cap ULIF01315/12/09FLEXICAPFN117 11.24% 18.91%Gratuity Balanced ULGF00205/06/04GRABALANCE117 7.44% 12.09%Gratuity Debt ULGF00105/06/04GRADEBTFND117 5.36% 11.09%Moderator ULIF00325/01/05MODERATORF117 6.79% 11.94%Multiplier ULIF00625/01/05MULTIPLIER117 11.00% 16.10%Multiplier II ULIF01115/12/09MULTIPLIE2117 11.02% 16.08%Preserver ULIF00125/01/05PRESERVERF117 4.78% 10.76%Preserver II ULIF00815/12/09PRESERVER2117 4.47% 10.91%Protector ULIF00225/01/05PROTECTORF117 5.43% 10.45%Protector II ULIF00915/12/09PROTECTOR2117 5.20% 10.93%Virtue ULIF00719/02/08VIRTUEFUND117 14.24% 18.01%Virtue II ULIF01215/12/09VIRTUE2FND117 12.18% 18.77%Multiplier III ULIF01809/10/15MULTIPLIE3117 8.32% 15.37%Liquid ULIF01909/10/15LIQUIDFUND117 5.90% 4.01%Discontinued Policy fund ULIF01721/12/10DISCONTINU117 6.13% 6.71%Mid Cap * ULIF02501/01/18MIDCAPFUND117 0.26% NACrest (Thematic Fund) * ULIF02201/01/18CRESTTHEMF117 -0.06% NABalanced Opportunities * ULIF02301/01/18BALANCEOPP117 0.50% NABond Opportunities * ULIF02401/01/18BONDOPPORT117 0.47% NAPremier Multi-Cap ULIF02101/01/18MULTICAPFN117 -0.13% NA
* These funds were launched in Current Financial Year.
9) provision for doubtful debts on the assets of the respective fund - nil

184
Annexure 1010) Fund wise disclosure of appreciation and/or (depreciation) in value of investments segregated class wise
Financial year ended March 31, 2018(` in '000)
Security class balancer Multiplier Accelerator preserver protector Moderator Virtue balancer II
Debt Securities (47,831) 0 (12,076) (21,460) (40,493) (5,009) 0 (39,380)
Equity (121,040) (1,113,519) (150,988) - - (3,099) 50,457 (99,642)
Mutual fund - 79,414 5,988 - - 7 - -
Total (168,871) (1,034,105) (157,077) (21,460) (40,493) (8,100) 50,457 (139,022)
(` in '000)
Security class Multiplier
II preserver II protector II Virtue II Flexi cap
gratuity balanced
gratuity debt
Multiplier III
Debt Securities 0 (17,088) (190,494) 0 0 (7,896) (17,695) 0
Equity (654,317) - - 8,151 (566,607) 3,718 - 414
Mutual fund 48,720 - - - 40,187 - - 103
Total (605,597) (17,088) (190,494) 8,151 (526,420) (4,178) (17,695) 517
(` in '000)
Security class liquid
discontinued policy
Mid cap Fund
crest (Thematic
Fund)
balanced Opportuni-
ties Fund
bond Oppor-tunities Fund
premier Multi-cap
Fund Total
Debt Securities 0 (195) - - 1 1 - (399,614)
Equity - - 6 (8) 4 - (7) (2,646,476)
Mutual fund - - - - - - - 174,418
Total 0 (195) 6 (8) 5 1 (7) (2,871,673)
Financial year ended March 31, 2017(` in '000)
Security class balancer Multiplier Accelerator preserver protector Moderator Virtue balancer II
Debt Securities 15,983 (0) 2,534 (1,478) 9,284 3,375 (0) 25,060
Equity 106,059 761,807 55,156 - - 1,997 61,977 116,890
Mutual fund - 12,361 - - - - - -
Total 122,042 774,169 57,690 (1,478) 9,284 5,372 61,977 141,950
(` in '000)
Security class Multiplier
II preserver II protector II Virtue II Flexi cap
gratuity balanced
gratuity debt
Multiplier III
Debt Securities (0) 149 98,099 (0) 0 2,791 13,032 (0)
Equity 117,433 - - 33,784 466,314 16,151 - 1,406
Mutual fund 4,654 - - - 10,356 - - 34
Total 122,087 149 98,099 33,784 476,670 18,942 13,032
(` in '000)
Security class liquid
discontinued policy
Mid cap Fund
crest (Thematic
Fund)
balanced Opportuni-
ties Fund
bond Oppor-tunities Fund
premier Multi-cap
Fund Total
Debt Securities (0) 75 - - - - - 168,903
Equity - - - - - - - 1,738,974
Mutual fund - - - - - - - 27,406
Total 75 1,935,283

Financial StatementsStatutory ReportsCorporate Overview
185
Name of the Insurer : PNB MetLife India Insurance Company Limited Annexure 11Industry wise disclosure of Investments as at March 31, 2018 (with exposure of 10% and above)
name of Fund : AcceleRATOR (ulIF00525/01/05AcceleRATO117)
InduSTRy Security descriptionMarket Value
(` In 000)% of nAV
FInAncIAl And InSuRAnce AcTIVITIeS
HDFC BANK LTD 142,238 6.78%
HDFC 112,451 5.36%
ICICI BANK LTD FV 2 53,201 2.54%
KOTAK MAHINDRA BANK LTD 52,216 2.49%
INDUSIND BANK LTD 44,886 2.14%
8.45% SUNDARAM FINANCE LTD 21-02-2028 30,687 1.46%
YES BANK LTD.FV-2 22,735 1.08%
INDIABULLS HOUSING FINANCE LTD 21,726 1.04%
BAJAJ FINANCE LIMITED FV -2 20,039 0.96%
STATE BANK OF INDIAFV-1 12,050 0.57%
NABARD CP 31-07-2018 9,762 0.47%
FInAncIAl And InSuRAnce AcTIVITIeS Total 521,993 24.88%
InFRASTRucTuRe SecTOR
10.25% RELIANCE GAS TRANSPORTATION INFRA 150,792.32 7.19%
POWER GRID CORPORATION 29,059.78 1.39%
BHARTI AIRTEL LTD 26,478.07 1.26%
GAIL (INDIA) LTD 25,717.91 1.23%
7.83% IRFC 21-03-2027 24,713.18 1.18%
7.90% INDIA INFRADEBT LIMITED 31-10-2022 19,587.34 0.93%
NTPC 12,759.91 0.61%
BHARTI INFRATEL LTD. 8,052.47 0.38%
InFRASTRucTuRe SecTOR Total 297,161 14.17%
cOMpuTeR pROgRAMMIng, cOnSulTAncy And RelATed AcTIVITIeS
INFOSYS LTD. 114,633.23 5.46%
TATA CONSULTANCY SERVICES LTD. 39,312.57 1.87%
HCL TECHNOLOGIES LIMITED 38,117.32 1.82%
TECH MAHINDRA LIMITED FV-5 14,301.77 0.68%
WIPRO 8,252.88 0.39%
cOMpuTeR pROgRAMMIng, cOnSulTAncy And RelATed AcTIVITIeS Total 214,618 10.23%
Others 1,058,104 50.44%
current Assets and liabilities 5,954 0.28%
grand Total 2,097,830 100.00%

186
Name of the Insurer : PNB MetLife India Insurance Company Limited Annexure 11Industry wise disclosure of Investments as at March 31, 2018 (with exposure of 10% and above)
name of Fund : bAlAnceR [ulIF00425/01/05bAlAnceRFn117]
InduSTRy Security descriptionMarket Value
(` In 000)% of nAV
FInAncIAl And InSuRAnce AcTIVITIeSHDFC BANK LTD 223,273 5.82%HDFC 166,283 4.33%NABARD CP 31-07-2018 78,094 2.04%ICICI BANK LTD FV 2 75,109 1.96%8.45% SUNDARAM FINANCE LTD 21-02-2028 61,375 1.60%KOTAK MAHINDRA BANK LTD 59,077 1.54%INDUSIND BANK LTD 52,064 1.36%8.22% NABARD 25-02-2028 51,328 1.34%8.8394% HDB FINANCIAL SERVICES 12-03-2019 50,653 1.32%YES BANK LTD.FV-2 32,656 0.85%BAJAJ FINANCE LIMITED FV -2 23,268 0.61%INDIABULLS HOUSING FINANCE LTD 20,215 0.53%STATE BANK OF INDIAFV-1 16,483 0.43%
FInAncIAl And InSuRAnce AcTIVITIeS Total 909,880 23.72%
InFRASTRucTuRe SecTOR10.25% RELIANCE GAS TRANSPORTATION INFRA 323,126 8.42%7.28% POWER FINANCE CORPN. LTD. 10-06-2022
56,811 1.48%
9.34% RECL 25-08-2024 53,114 1.38%8.93% POWER GRID CORPORATION 20-10-2024 52,159 1.36%8.11% RECL 07-10-2025 50,132 1.31%8.15% L&T INFRA DEBT FUND LTD 16-01-2023 49,803 1.30%7.70% RECL 10-12-2027 48,983 1.28%GAIL (INDIA) LTD 28,748 0.75%BHARTI AIRTEL LTD 28,549 0.74%POWER GRID CORPORATION 23,530 0.61%NTPC 16,004 0.42%BHARTI INFRATEL LTD. 9,146 0.24%
InFRASTRucTuRe SecTOR Total 740,104 19.29%
gOVeRnMenT OF IndIA7.17% GOI 08-01-2028 191,919 5.00%6.68% GOI 17-09-2031 120,068 3.13%6.57% GOI 05-12-2033 45,175 1.18%GOI 8.24% 2027 41,400 1.08%9.23% GOI 23-12-2043 40,773 1.06%7.59% GOI 20-03-2029 23,856 0.62%8.83% GSEC 25-11-2023 21,288 0.55%8.17% GSEC 01-12-2044 15,863 0.41%8.40% GSEC 28-07-2024 10,435 0.27%GOI LOAN 7.95% 2032 9,897 0.26%8.40% OIL SPL BONDS 2025 881 0.02%8.13% GOI OIL Bond 2021 830 0.02%
gOVeRnMenT OF IndIA Total 522,386 13.62%
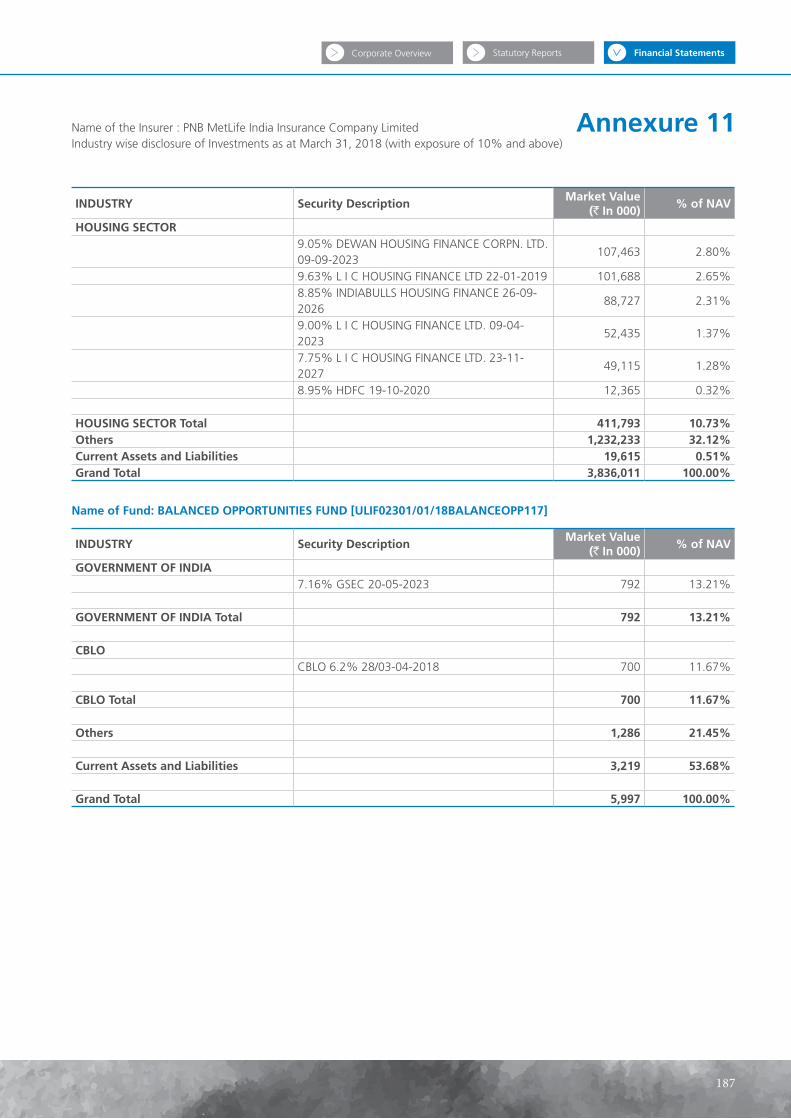
Financial StatementsStatutory ReportsCorporate Overview
187
InduSTRy Security descriptionMarket Value
(` In 000)% of nAV
hOuSIng SecTOR9.05% DEWAN HOUSING FINANCE CORPN. LTD. 09-09-2023
107,463 2.80%
9.63% L I C HOUSING FINANCE LTD 22-01-2019 101,688 2.65%8.85% INDIABULLS HOUSING FINANCE 26-09-2026
88,727 2.31%
9.00% L I C HOUSING FINANCE LTD. 09-04-2023
52,435 1.37%
7.75% L I C HOUSING FINANCE LTD. 23-11-2027
49,115 1.28%
8.95% HDFC 19-10-2020 12,365 0.32%
hOuSIng SecTOR Total 411,793 10.73%Others 1,232,233 32.12%current Assets and liabilities 19,615 0.51%grand Total 3,836,011 100.00%
name of Fund: bAlAnced OppORTunITIeS Fund [ulIF02301/01/18bAlAnceOpp117]
InduSTRy Security descriptionMarket Value
(` In 000)% of nAV
gOVeRnMenT OF IndIA7.16% GSEC 20-05-2023 792 13.21%
gOVeRnMenT OF IndIA Total 792 13.21%
cblOCBLO 6.2% 28/03-04-2018 700 11.67%
cblO Total 700 11.67%
Others 1,286 21.45%
current Assets and liabilities 3,219 53.68%
grand Total 5,997 100.00%
Name of the Insurer : PNB MetLife India Insurance Company Limited Annexure 11Industry wise disclosure of Investments as at March 31, 2018 (with exposure of 10% and above)

188
Name of the Insurer : PNB MetLife India Insurance Company Limited Annexure 11Industry wise disclosure of Investments as at March 31, 2018 (with exposure of 10% and above)
name of Fund : bAlAnceR II Fund [ulIF01015/12/09bAlAnceR2F117]
InduSTRy Security descriptionMarket Value
(` In 000)% of nAV
FInAncIAl And InSuRAnce AcTIVITIeSHDFC BANK LTD 187,488 5.18%9.00% SHRIRAM TRANSPORT FINANCE CO. LTD. 28-03-2028
152,427 4.21%
HDFC 94,139 2.60%ICICI BANK LTD FV 2 78,847 2.18%KOTAK MAHINDRA BANK LTD 54,143 1.50%8.45% SUNDARAM FINANCE LTD 21-02-2028 51,146 1.41%STATE BANK OF INDIAFV-1 34,782 0.96%YES BANK LTD.FV-2 32,241 0.89%INDUSIND BANK LTD 28,949 0.80%8.60% SUNDARAM FINANCE 09-05-2018 20,028 0.55%8.67% IDFC BANK 03-01-2025 15,468 0.43%SBI LIFE INSURANCE CO. LTD 15,093 0.42%INDIABULLS HOUSING FINANCE LTD 13,809 0.38%8.8394% HDB FINANCIAL SERVICES 12-03-2019 10,131 0.28%SHRIRAM TRANSPORT FINANCE CO. LTD. 9,694 0.27%BAJAJ FINANCE LIMITED FV -2 9,610 0.27%PUNJAB NATIONAL BANK FV 2 9,170 0.25%RBL BANK LTD. 8,970 0.25%AXIS BANK LTD. 8,511 0.24%ICICI LOMBARD GENERAL INSURANCE COMPANY LIMITED
812 0.02%
CAN FIN HOMES LIMITED FV-2 31 0.00%FInAncIAl And InSuRAnce AcTIVITIeS Total 835,489 23.07%
InFRASTRucTuRe SecTOR9.30% PGC NCD 04-09-2024 159,078 4.39%9.34% RECL 25-08-2024 106,227 2.93%7.27% IRFC 15-06-2027 95,687 2.64%10.25% RELIANCE GAS TRANSPORTATION INFRA 64,625 1.78%8.75% RECL 12-07-2025 51,851 1.43%8.65% POWER FINANCE CORPN. LTD. 28-12-2024
51,507 1.42%
8.57% RECL 21-12-2024 51,342 1.42%8.93% POWER GRID CORPORATION 20-10-2024 26,079 0.72%BHARTI AIRTEL LTD 23,138 0.64%C E S C LTD. 22,164 0.61%GAIL (INDIA) LTD 18,785 0.52%PETRONET L N G LTD 16,050 0.44%GUJARAT STATE PETRONET LTD 11,206 0.31%9.82% IL&FS 24-01-2022 10,648 0.29%POWER GRID CORPORATION 10,612 0.29%INDRAPRASTHA GAS LTD.FV-2 7,957 0.22%V A TECH WABAG LTD. 6,956 0.19%
InFRASTRucTuRe SecTOR Total 733,911 20.27%

Financial StatementsStatutory ReportsCorporate Overview
189
InduSTRy Security descriptionMarket Value
(` In 000)% of nAV
gOVeRnMenT OF IndIA9.20% GSEC 30-09-2030 111,770 3.09%7.17% GOI 08-01-2028 98,420 2.72%6.68% GOI 17-09-2031 69,270 1.91%8.38% KARNATAKA SDL 27-01-2026 51,312 1.42%8.25% PUNJAB SDL 09-09-2025 50,887 1.41%8.27% GUJARAT SDL 13-01-2026 50,818 1.40%7.16% GSEC 20-05-2023 48,065 1.33%8.25% MAHARASHTRA SDL 13-01-2026 20,388 0.56%8.40% OIL SPL BONDS 2025 1,578 0.04%
gOVeRnMenT OF IndIA Total 502,508 13.88%
hOuSIng SecTOR8.85% INDIABULLS HOUSING FINANCE 26-09-2026
211,501 5.84%
7.75% L I C HOUSING FINANCE LTD. 23-11-2027
98,230 2.71%
9.63% L I C HOUSING FINANCE LTD 22-01-2019 50,844 1.40%8.95% HDFC 19-10-2020 19,578 0.54%
hOuSIng SecTOR Total 380,152 10.50%
Others 1,043,886 28.83%
current Assets and liabilities 125,088 3.45%
grand Total 3,621,034 100.00%
name of Fund: bOnd OppORTunITIeS Fund [ulIF02401/01/18bOndOppORT117]
InduSTRy Security descriptionMarket Value
(` In 000)% of nAV
gOVeRnMenT OF IndIA7.16% GSEC 20-05-2023 644 22.49%
gOVeRnMenT OF IndIA Total 644 22.49%Others 20 0.70%current Assets and liabilities 2,197 76.81%grand Total 2,861 100.00%
name of Fund: cReST (TheMATIc Fund) [ulIF02201/01/18cReSTTheMF117]
InduSTRy Security descriptionMarket Value
(` In 000)% of nAV
cblOCBLO 6.2% 28/03-04-2018 3699 15.24%
cblO Total 3,699 15.24%Others 9,048 37.28%current Assets and liabilities 11,522 47.48%grand Total 24,269 100.00%
Name of the Insurer : PNB MetLife India Insurance Company Limited Annexure 11Industry wise disclosure of Investments as at March 31, 2018 (with exposure of 10% and above)

190
Name of the Insurer : PNB MetLife India Insurance Company Limited Annexure 11Industry wise disclosure of Investments as at March 31, 2018 (with exposure of 10% and above)
name of Fund : FlexI cAp Fund [ulIF01315/12/09FlexIcApFn117]
InduSTRy Security descriptionMarket Value
(` In 000)% of nAV
FInAncIAl And InSuRAnce AcTIVITIeS
HDFC BANK LTD 385,856 6.20%
HDFC 243,820 3.92%
ICICI BANK LTD FV 2 144,706 2.33%
KOTAK MAHINDRA BANK LTD 116,594 1.87%
YES BANK LTD.FV-2 92,135 1.48%
STATE BANK OF INDIAFV-1 83,741 1.35%
INDIABULLS HOUSING FINANCE LTD 72,464 1.17%
INDUSIND BANK LTD 59,237 0.95%
SHRIRAM TRANSPORT FINANCE CO. LTD. 49,842 0.80%
BAJAJ FINANCE LIMITED FV -2 49,255 0.79%
SBI LIFE INSURANCE CO. LTD 47,487 0.76%
CAN FIN HOMES LIMITED FV-2 26,066 0.42%
FEDERAL BANK LTD. 22,392 0.36%
MAGMA FINCORP LTD. 19,132 0.31%
BAJAJ FINSERV LIMITED 15,173 0.24%
PUNJAB NATIONAL BANK FV 2 9,652 0.16%
RBL BANK LTD. 6,094 0.10%
ICICI LOMBARD GENERAL INSURANCE COMPANY LIMITED
812 0.01%
FInAncIAl And InSuRAnce AcTIVITIeS Total 1,444,458 23.22%
cOMpuTeR pROgRAMMIng, cOnSulTAncy And RelATed AcTIVITIeS
INFOSYS LTD. 337,235 5.42%
HCL TECHNOLOGIES LIMITED 112,274 1.81%
TATA CONSULTANCY SERVICES LTD. 85,215 1.37%
TECH MAHINDRA LIMITED FV-5 60,194 0.97%
ORACLE FINANCIAL SERVICES SOFTWARE LTD 28,742 0.46%
CYIENT LTD 21,449 0.34%
PERSISTENT SYSTEMS LIMITED 18,054 0.29%
cOMpuTeR pROgRAMMIng, cOnSulTAncy And RelATed AcTIVITIeS Total 663,162 10.66%
Others 3,967,364 63.79%
current Assets and liabilities 144,640 2.33%
grand Total 6,219,625 100.00%

Financial StatementsStatutory ReportsCorporate Overview
191
Name of the Insurer : PNB MetLife India Insurance Company Limited Annexure 11Industry wise disclosure of Investments as at March 31, 2018 (with exposure of 10% and above)
name of Fund : gRATuITy bAlAnced [ulgF00205/06/04gRAbAlAnce117]
InduSTRy Security descriptionMarket Value
(` In 000)% of nAV
InFRASTRucTuRe SecTOR10.25% RELIANCE GAS TRANSPORTATION INFRA 36,621 6.55%8.15% L&T INFRA DEBT FUND LTD 16-01-2023 34,862 6.23%7.90% INDIA INFRADEBT LIMITED 31-10-2022 34,278 6.13%7.28% POWER FINANCE CORPN. LTD. 10-06-2022
29,385 5.25%
POWER GRID CORPORATION 3,884 0.69%GAIL (INDIA) LTD 2,013 0.36%BHARTI AIRTEL LTD 1,997 0.36%GUJARAT STATE PETRONET LTD 1,215 0.22%C E S C LTD. 1,115 0.20%
InFRASTRucTuRe SecTOR Total 145,369 25.99%
gOVeRnMenT OF IndIA6.68% GOI 17-09-2031 46,180 8.26%8.60% GOI 02-06-2028 39,697 7.10%8.25% MAHARASHTRA SDL 13-01-2026 30,582 5.47%7.35% GOI 22-06-2024 9,949 1.78%
gOVeRnMenT OF IndIA Total 126,408 22.60%
FInAncIAl And InSuRAnce AcTIVITIeS8.8394% HDB FINANCIAL SERVICES 12-03-2019 20,261 3.62%HDFC BANK LTD 18,944 3.39%8.45% SUNDARAM FINANCE LTD 21-02-2028 10,229 1.83%HDFC 10,185 1.82%ICICI BANK LTD FV 2 6,963 1.24%KOTAK MAHINDRA BANK LTD 5,312 0.95%INDUSIND BANK LTD 4,797 0.86%YES BANK LTD.FV-2 3,734 0.67%STATE BANK OF INDIAFV-1 2,920 0.52%INDIABULLS HOUSING FINANCE LTD 1,219 0.22%RBL BANK LTD. 1,131 0.20%BAJAJ FINANCE LIMITED FV -2 870 0.16%ICICI PRUDENTIAL LIFE INSURANCE COMPANY LTD.
718 0.13%
FInAncIAl And InSuRAnce AcTIVITIeS Total 87,284 15.60%
hOuSIng SecTOR8.85% INDIABULLS HOUSING FINANCE 26-09-2026
41,268 7.38%
9.05% DEWAN HOUSING FINANCE CORPN. LTD. 09-09-2023
30,704 5.49%
hOuSIng SecTOR Total 71,972 12.87%
Others 117,123 20.94%
current Assets and liabilities 11,258 2.01%
grand Total 559,414 100.00%

192
Name of the Insurer : PNB MetLife India Insurance Company Limited Annexure 11Industry wise disclosure of Investments as at March 31, 2018 (with exposure of 10% and above)
name of Fund : MOdeRATOR [ulIF00325/01/05MOdeRATORF117]
InduSTRy Security descriptionMarket Value
(` In 000)% of nAV
InFRASTRucTuRe SecTOR8.15% L&T INFRA DEBT FUND LTD 16-01-2023 14,941 8.41%7.90% INDIA INFRADEBT LIMITED 31-10-2022 14,691 8.27%7.28% POWER FINANCE CORPN. LTD. 10-06-2022
11,754 6.62%
7.83% IRFC 21-03-2027 9,885 5.56%BHARTI AIRTEL LTD 547 0.31%POWER GRID CORPORATION 546 0.31%GAIL (INDIA) LTD 534 0.30%NTPC 314 0.18%BHARTI INFRATEL LTD. 175 0.10%
InFRASTRucTuRe SecTOR Total 53,386 30.05%
gOVeRnMenT OF IndIA7.17% GOI 08-01-2028 24,605 13.85%7.35% GOI 22-06-2024 9,949 5.60%6.68% GOI 17-09-2031 9,236 5.20%8.13% GOI OIL Bond 2021 263 0.15%
gOVeRnMenT OF IndIA Total 44,053 24.80%
hOuSIng SecTOR9.05% DEWAN HOUSING FINANCE CORPN. LTD. 09-09-2023
15,352 8.64%
8.85% INDIABULLS HOUSING FINANCE 26-09-2026
9,285 5.23%
hOuSIng SecTOR Total 24,637 13.87%
FInAncIAl And InSuRAnce AcTIVITIeS8.8394% HDB FINANCIAL SERVICES 12-03-2019 10,131 5.70%HDFC BANK LTD 3,804 2.14%HDFC 3,229 1.82%KOTAK MAHINDRA BANK LTD 1,393 0.78%ICICI BANK LTD FV 2 1,370 0.77%INDUSIND BANK LTD 997 0.56%YES BANK LTD.FV-2 590 0.33%BAJAJ FINANCE LIMITED FV -2 440 0.25%INDIABULLS HOUSING FINANCE LTD 397 0.22%STATE BANK OF INDIAFV-1 374 0.21%
FInAncIAl And InSuRAnce AcTIVITIeS Total 22,726 12.79%
Others 28,890 16.27%
current Assets and liabilities Total 3,946 2.22%
grand Total 177,638 100.00%

Financial StatementsStatutory ReportsCorporate Overview
193
Name of the Insurer : PNB MetLife India Insurance Company Limited Annexure 11Industry wise disclosure of Investments as at March 31, 2018 (with exposure of 10% and above)
name of Fund : gRATuITy debT [ulgF00105/06/04gRAdebTFnd117]
InduSTRy Security descriptionMarket Value
(` In 000)% of nAV
InFRASTRucTuRe SecTOR
10.40% RELIANCE PORTS AND TERMINALS LTD 53,974 5.54%
9.98% IL&FS 05-12-2021 53,620 5.51%
8.72% L&T INFRA DEBT FUND LTD 27-03-2026 51,919 5.33%
8.75% RECL 12-07-2025 51,851 5.32%
8.65% POWER FINANCE CORPN. LTD. 28-12-2024
51,507 5.29%
10.25% RELIANCE GAS TRANSPORTATION INFRA 31,236 3.21%
RECL CP 04-09-2018 29,092 2.99%
8.93% POWER GRID CORPORATION 20-10-2024 26,079 2.68%
InFRASTRucTuRe SecTOR Total 349,277 35.87%
gOVeRnMenT OF IndIA
6.68% GOI 17-09-2031 103,905 10.67%
7.17% GOI 08-01-2028 68,894 7.07%
7.68% GSEC 15-12-2023 65,975 6.77%
8.40% GSEC 28-07-2024 15,653 1.61%
8.13% GOI OIL Bond 2021 736 0.08%
GOI LOAN 7.95% 2032 303 0.03%
gOVeRnMenT OF IndIA Total 255,466 26.23%
FInAncIAl And InSuRAnce AcTIVITIeS
9.78% TATA SONS LTD 13-01-2019 50,876 5.22%
7.60% AXIS BANK 20-10-2023 49,008 5.03%
NABARD CP 31-07-2018 39,047 4.01%
8.67% IDFC BANK 03-01-2025 30,936 3.18%
9.43% TATA SONS LTD 02-06-2019 20,425 2.10%
FInAncIAl And InSuRAnce AcTIVITIeS Total 190,293 19.54%
hOuSIng SecTOR
8.85% INDIABULLS HOUSING FINANCE 26-09-2026
51586 5.30%
9.05% DEWAN HOUSING FINANCE CORPN. LTD. 09-09-2023
51173 5.25%
hOuSIng SecTOR Total 102,759 10.55%
Others 11,181 1.15%
current Assets and liabilities 64,871 6.66%
grand Total 973,847 100.00%

194
Name of the Insurer : PNB MetLife India Insurance Company Limited Annexure 11Industry wise disclosure of Investments as at March 31, 2018 (with exposure of 10% and above)
name of Fund : MulTIplIeR [ulIF00625/01/05MulTIplIeR117]
InduSTRy Security descriptionMarket Value
(` In 000)% of nAV
FInAncIAl And InSuRAnce AcTIVITIeSHDFC BANK LTD 1,475,130 8.53%HDFC 886,787 5.13%INDUSIND BANK LTD 436,048 2.52%KOTAK MAHINDRA BANK LTD 404,120 2.34%INDIABULLS HOUSING FINANCE LTD 325,353 1.88%ICICI BANK LTD FV 2 311,346 1.80%YES BANK LTD.FV-2 249,628 1.44%STATE BANK OF INDIAFV-1 159,617 0.92%AXIS BANK LTD. 164 0.00%
FInAncIAl And InSuRAnce AcTIVITIeS Total 4,248,193 24.56%
cOMpuTeR pROgRAMMIng, cOnSulTAncy And RelATed AcTIVITIeSINFOSYS LTD. 1,139,104 6.59%TATA CONSULTANCY SERVICES LTD. 405,813 2.35%HCL TECHNOLOGIES LIMITED 366,836 2.12%TECH MAHINDRA LIMITED FV-5 4,790 0.03%
cOMpuTeR pROgRAMMIng, cOnSulTAncy And RelATed AcTIVITIeS Total 1,916,543 11.08%
MuTuAl FundSBI-ETF NIFTY BANK 630,154 3.64%KOTAK MAHINDRA MF-KOTAK BANKING ETF - DIV PAYOUT
595,602 3.44%
R*SHARES BANK BEES ETF 576,489 3.33%MuTuAl Fund Total 1,802,245 10.42%Others 9,413,432 54.42%current Assets and liabilities -82,403 -0.48%grand Total 17,298,009 100.00%
name of Fund : dIScOnTInued pOlIcy Fund [ulIF01721/12/10dIScOnTInu117]
InduSTRy Security descriptionMarket Value
(` In 000)% of nAV
gOVeRnMenT OF IndIA364 DAY TBILL 21-06-2018 1,085,399 18.88%364 DAY TBILL 27-12-2018 668,898 11.63%364 DAY TBILL 07-06-2018 598,416 10.41%364 DAY TBILL 19-07-2018 491,136 8.54%182 DAY TBILL 05-04-2018 447,207 7.78%364 DAY TBILL 26-04-2018 398,343 6.93%364 DAY TBILL 10-05-2018 397,407 6.91%91 DAY TBILL 17-05-2018 379,357 6.60%364 DAY TBILL 27-09-2018 341,730 5.94%182 DAY TBILL 16-08-2018 312,342 5.43%364 DAY TBILL 30-08-2018 292,714 5.09%182 DAY TBILL 17-05-2018 163,912 2.85%
gOVeRnMenT OF IndIA Total 5,576,860 97.00%Others 384,764 6.69%current Assets and liabilities -212,391 -3.69%grand Total 5,749,233 100.00%

Financial StatementsStatutory ReportsCorporate Overview
195
Name of the Insurer : PNB MetLife India Insurance Company Limited Annexure 11Industry wise disclosure of Investments as at March 31, 2018 (with exposure of 10% and above)
name of Fund : lIquId Fund [ulIF01909/10/15lIquIdFund117]
InduSTRy Security descriptionMarket Value
(` In 000)% of nAV
gOVeRnMenT OF IndIA
182 DAY TBILL 05-04-2018 2,498 46.73%
gOVeRnMenT OF IndIA Total 2,498 46.73%
cblO
CBLO 6.2% 28/03-04-2018 2,125 39.74%
cblO Total 2,125 39.74%
current Assets and liabilities 723 13.53%
grand Total 5,346 100.00%
name of Fund : MId cAp Fund [ulIF02501/01/18MIdcApFund117]
InduSTRy Security descriptionMarket Value
(` In 000)% of nAV
cblO
CBLO 6.2% 28/03-04-2018 1,699 16.43%
cblO Total 1,699 16.43%
Others 4,343 41.98%
current Assets and liabilities 4,302 41.59%
grand Total 10,345 100.00%

196
Name of the Insurer : PNB MetLife India Insurance Company Limited Annexure 11Industry wise disclosure of Investments as at March 31, 2018 (with exposure of 10% and above)
name of Fund : MulTIplIeR II Fund [ulIF01115/12/09MulTIplIe2117]
InduSTRy Security descriptionMarket Value
(` In 000)% of nAV
FInAncIAl And InSuRAnce AcTIVITIeS
HDFC BANK LTD 545,354 8.15%
HDFC 397,937 5.95%
KOTAK MAHINDRA BANK LTD 191,977 2.87%
ICICI BANK LTD FV 2 188,859 2.82%
INDUSIND BANK LTD 99,251 1.48%
YES BANK LTD.FV-2 90,100 1.35%
STATE BANK OF INDIAFV-1 69,423 1.04%
INDIABULLS HOUSING FINANCE LTD 39,581 0.59%
BAJAJ FINANCE LIMITED FV -2 18,582 0.28%
FInAncIAl And InSuRAnce AcTIVITIeS Total 1,641,064 24.52%
cOMpuTeR pROgRAMMIng, cOnSulTAncy And RelATed AcTIVITIeS
INFOSYS LTD. 477,656 7.14%
HCL TECHNOLOGIES LIMITED 146,219 2.18%
TATA CONSULTANCY SERVICES LTD. 141,059 2.11%
TECH MAHINDRA LIMITED FV-5 67,550 1.01%
WIPRO 32,256 0.48%
cOMpuTeR pROgRAMMIng, cOnSulTAncy And RelATed AcTIVITIeS Total 864,740 12.92%
MuTuAl Fund
R*SHARES BANK BEES ETF 314,907 4.70%
KOTAK MAHINDRA MF-KOTAK BANKING ETF - DIV PAYOUT
307,967 4.60%
SBI-ETF NIFTY BANK 77,628 1.16%
MuTuAl Fund Total 700,501 10.47%
Others 3,452,499 51.58%
current Assets and liabilities 34,344 0.51%
grand Total 6,693,147 100.00%

Financial StatementsStatutory ReportsCorporate Overview
197
Name of the Insurer : PNB MetLife India Insurance Company Limited Annexure 11Industry wise disclosure of Investments as at March 31, 2018 (with exposure of 10% and above)
name of Fund : MulTIplIeR III Fund [ulIF01809/10/15MulTIplIe3117]
InduSTRy Security descriptionMarket Value
(` In 000)% of nAV
FInAncIAl And InSuRAnce AcTIVITIeS
HDFC BANK LTD 2,914 5.21%
HDFC 2,304 4.12%
ICICI BANK LTD FV 2 1,076 1.92%
KOTAK MAHINDRA BANK LTD 654 1.17%
YES BANK LTD.FV-2 607 1.09%
INDUSIND BANK LTD 595 1.06%
STATE BANK OF INDIAFV-1 498 0.89%
PUNJAB NATIONAL BANK FV 2 394 0.70%
INDIABULLS HOUSING FINANCE LTD 255 0.46%
SBI LIFE INSURANCE CO. LTD 241 0.43%
BAJAJ FINANCE LIMITED FV -2 232 0.41%
SHRIRAM TRANSPORT FINANCE CO. LTD. 216 0.39%
AXIS BANK LTD. 192 0.34%
FInAncIAl And InSuRAnce AcTIVITIeS Total 10,178 18.19%
cblO
CBLO 6.2% 28/03-04-2018 6133 10.96%
cblO Total 6,133 10.96%
Others 29,626 52.94%
current Assets and liabilities 10,031 17.92%
grand Total 55,967 100.00%
name of Fund : pReMIeR MulTI-cAp Fund [ulIF02101/01/18MulTIcApFn117]
InduSTRy Security descriptionMarket Value
(` In 000)% of nAV
cblO
CBLO 6.2% 28/03-04-2018 1,899 11.64%
cblO Total 1,899 11.64%
Others 4,709 28.86%
current Assets and liabilities 9,708 59.50%
grand Total 16,316 100.00%

198
Name of the Insurer : PNB MetLife India Insurance Company Limited Annexure 11Industry wise disclosure of Investments as at March 31, 2018 (with exposure of 10% and above)
name of Fund : pReSeRVeR [ulIF00125/01/05pReSeRVeRF117]
InduSTRy Security descriptionMarket Value
(` In 000)% of nAV
gOVeRnMenT OF IndIA
7.68% GSEC 15-12-2023 126,875 19.36%
7.16% GSEC 20-05-2023 99,000 15.11%
6.84% GOI 19-12-2022 98,120 14.97%
7.35% GOI 22-06-2024 94,516 14.42%
8.39% RAJASHTAN SDL UDAY 15-03-2024 76,464 11.67%
8.27% GSEC 09-06-2020 71,974 10.98%
8.60% GOI 02-06-2028 13,232 2.02%
7.99% MAHARASHTRA SDL 28-10-2025 8,361 1.28%
8.33% GOI 09-07-2026 6,992 1.07%
8.13% GOI OIL Bond 2021 3,033 0.46%
7.59% GOI 20-03-2029 1,988 0.30%
gOVeRnMenT OF IndIA Total 600,554 91.64%
Others 42,396 6.47%
current Assets and liabilities 12,390 1.89%
grand Total 655,340 100.00%
name of Fund : pReSeRVeR II Fund [ulIF00815/12/09pReSeRVeR2117]
InduSTRy Security descriptionMarket Value
(` In 000)% of nAV
gOVeRnMenT OF IndIA
6.84% GOI 19-12-2022 147,180 22.40%
7.35% GOI 22-06-2024 114,414 17.41%
7.68% GSEC 15-12-2023 111,650 16.99%
8.39% RAJASHTAN SDL UDAY 15-03-2024 76,464 11.64%
7.16% GSEC 20-05-2023 49,500 7.53%
8.40% GSEC 28-07-2024 41,740 6.35%
8.27% GSEC 09-06-2020 30,846 4.69%
8.13% GOI OIL Bond 2021 414 0.06%
gOVeRnMenT OF IndIA Total 572,208 87.08%
Others 61,985 9.43%
current Assets and liabilities 22,914 3.49%
grand Total 657,107 100.00%

Financial StatementsStatutory ReportsCorporate Overview
199
Name of the Insurer : PNB MetLife India Insurance Company Limited Annexure 11Industry wise disclosure of Investments as at March 31, 2018 (with exposure of 10% and above)
name of Fund : pROTecTOR [ulIF00225/01/05pROTecTORF117]
InduSTRy Security descriptionMarket Value
(` In 000)% of nAV
gOVeRnMenT OF IndIA6.68% GOI 17-09-2031 177,793 12.08%7.17% GOI 08-01-2028 127,946 8.70%7.73% GOI 19-12-2034 50,150 3.41%6.79% GSEC 15-05-2027 47,515 3.23%8.33% GOI 09-07-2026 20,840 1.42%7.35% GOI 22-06-2024 19,898 1.35%8.43% SDL WB 12-03-2019 17,407 1.18%9.23% GOI 23-12-2043 4,345 0.30%
gOVeRnMenT OF IndIA Total 465,894 31.67%
InFRASTRucTuRe SecTOR10.40% RELIANCE PORTS AND TERMINALS LTD 107,948 7.34%8.75% RECL 12-07-2025 51,851 3.52%8.65% POWER FINANCE CORPN. LTD. 28-12-2024
51,507 3.50%
7.99% POWER FINANCE CORPN. LTD. 20-12-2022
50,309 3.42%
10.25% RELIANCE GAS TRANSPORTATION INFRA 48,469 3.29%9.98% IL&FS 05-12-2021 32,172 2.19%
7.90% INDIA INFRADEBT LIMITED 31-10-2022 29,381 2.00%
8.93% POWER GRID CORPORATION 20-10-2020 25,750 1.75%
RECL CP 04-09-2018 19,394 1.32%
7.83% IRFC 21-03-2027 14,828 1.01%
InFRASTRucTuRe SecTOR Total 431,609 29.34%
FInAncIAl And InSuRAnce AcTIVITIeS
9.43% TATA SONS LTD 02-06-2019 91,912 6.25%
9.78% TATA SONS LTD 13-01-2019 50,876 3.46%
7.60% AXIS BANK 20-10-2023 49,008 3.33%
NABARD CP 31-07-2018 19,524 1.33%
8.60% SUNDARAM FINANCE 09-05-2018 10,014 0.68%
8.67% IDFC BANK 03-01-2025 5,156 0.35%
FInAncIAl And InSuRAnce AcTIVITIeS Total 226,490 15.39%
hOuSIng SecTOR9.05% DEWAN HOUSING FINANCE CORPN. LTD. 09-09-2023
102,346 6.96%
8.85% INDIABULLS HOUSING FINANCE 26-09-2026
92,854 6.31%
8.95% HDFC 19-10-2020 15,456 1.05%
hOuSIng SecTOR Total 210,656 14.32%
Others 100,558 6.84%
current Assets and liabilities 36,006 2.45%
grand Total 1,471,213 100.00%

200
Name of the Insurer : PNB MetLife India Insurance Company Limited Annexure 11Industry wise disclosure of Investments as at March 31, 2018 (with exposure of 10% and above)
name of Fund : pROTecTOR II Fund [ulIF00915/12/09pROTecTOR2117]
InduSTRy Security descriptionMarket Value
(` In 000)% of nAV
InFRASTRucTuRe SecTOR7.90% RPTL 18-11-2026 544,981 5.09%7.95% RPTL 28-10-2026 446,950 4.18%RECL CP 04-09-2018 436,373 4.08%8.72% L&T INFRA DEBT FUND LTD 27-03-2026 259,596 2.43%7.10% POWER FINANCE CORPN 08-08-2022 243,674 2.28%10.25% RELIANCE GAS TRANSPORTATION INFRA 152,946 1.43%9.34% RECL 25-08-2024 106,227 0.99%8.8% POWER FINANCE CORPORATION 15-01-202 103,793 0.97%8.75% RECL 12-07-2025 103,701 0.97%8.39% POWER FINANCE CORPN 19-04-2025 101,781 0.95%8.93% POWER GRID CORPORATION 20-10-2022 52,077 0.49%8.93% POWER GRID CORPORATION 20-10-2021 52,029 0.49%8.93% POWER GRID CORPORATION 20-10-2023 51,891 0.48%8.65% POWER FINANCE CORPN. LTD. 28-12-2024
51,507 0.48%
8.13% POWER GRID CORPORATION 25-04-2023 50,680 0.47%8.13% POWER GRID CORPORATION 25-04-2022 50,564 0.47%8.13% POWER GRID CORPORATION 23-04-2027 50,241 0.47%
8.13% POWER GRID CORPORATION 24-04-2026 50,221 0.47%
8.13% POWER GRID CORPORATION 25-04-2024 50,200 0.47%
9.82% IL&FS 24-01-2022 42,592 0.40%
8.93% POWER GRID CORPORATION 20-10-2020 25,750 0.24%
InFRASTRucTuRe SecTOR Total 3,027,773 28.29%
FInAncIAl And InSuRAnce AcTIVITIeS
7.95% HDFC BANK 21-09-2026 347,639 3.25%
8.85% BAJAJ FINANCE LTD. 21-07-2026 257,836 2.41%
8.67% IDFC BANK 03-01-2025 257,804 2.41%9.00% SHRIRAM TRANSPORT FINANCE CO. LTD. 28-03-2028
254,046 2.37%
8.25% TATA SONS 23-03-2022 253,789 2.37%
8.65% KOTAK MAHINDRA PRIME 08-06-2018 250,695 2.34%8.27% CHOLAMANDALAM INV & FIN 26-09-2019
250,651 2.34%
7.60% AXIS BANK 20-10-2023 245,040 2.29%
8.70% IDFC BANK 20-05-2025 103,442 0.97%
8.45% SUNDARAM FINANCE LTD 21-02-2028 102,292 0.96%
9.43% TATA SONS LTD 02-06-2019 91,912 0.86%
8.8394% HDB FINANCIAL SERVICES 12-03-2019 60,783 0.57%
8.45% BAJAJ FINANCE LTD 29-09-2026 53,427 0.50%
8.60% SUNDARAM FINANCE 09-05-2018 20,028 0.19%
FInAncIAl And InSuRAnce AcTIVITIeS Total 2,549,382 23.82%
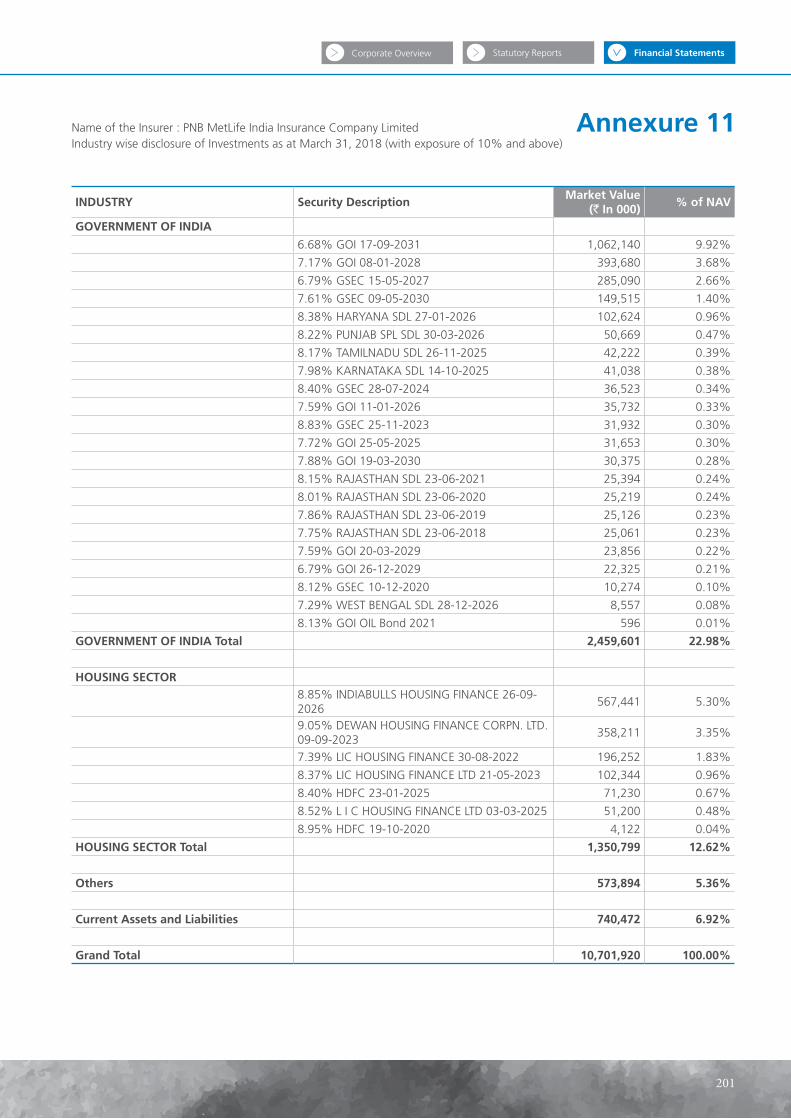
Financial StatementsStatutory ReportsCorporate Overview
201
InduSTRy Security descriptionMarket Value
(` In 000)% of nAV
gOVeRnMenT OF IndIA
6.68% GOI 17-09-2031 1,062,140 9.92%
7.17% GOI 08-01-2028 393,680 3.68%
6.79% GSEC 15-05-2027 285,090 2.66%
7.61% GSEC 09-05-2030 149,515 1.40%
8.38% HARYANA SDL 27-01-2026 102,624 0.96%
8.22% PUNJAB SPL SDL 30-03-2026 50,669 0.47%
8.17% TAMILNADU SDL 26-11-2025 42,222 0.39%
7.98% KARNATAKA SDL 14-10-2025 41,038 0.38%
8.40% GSEC 28-07-2024 36,523 0.34%
7.59% GOI 11-01-2026 35,732 0.33%
8.83% GSEC 25-11-2023 31,932 0.30%
7.72% GOI 25-05-2025 31,653 0.30%
7.88% GOI 19-03-2030 30,375 0.28%
8.15% RAJASTHAN SDL 23-06-2021 25,394 0.24%
8.01% RAJASTHAN SDL 23-06-2020 25,219 0.24%
7.86% RAJASTHAN SDL 23-06-2019 25,126 0.23%
7.75% RAJASTHAN SDL 23-06-2018 25,061 0.23%
7.59% GOI 20-03-2029 23,856 0.22%
6.79% GOI 26-12-2029 22,325 0.21%
8.12% GSEC 10-12-2020 10,274 0.10%
7.29% WEST BENGAL SDL 28-12-2026 8,557 0.08%
8.13% GOI OIL Bond 2021 596 0.01%
gOVeRnMenT OF IndIA Total 2,459,601 22.98%
hOuSIng SecTOR8.85% INDIABULLS HOUSING FINANCE 26-09-2026
567,441 5.30%
9.05% DEWAN HOUSING FINANCE CORPN. LTD. 09-09-2023
358,211 3.35%
7.39% LIC HOUSING FINANCE 30-08-2022 196,252 1.83%
8.37% LIC HOUSING FINANCE LTD 21-05-2023 102,344 0.96%
8.40% HDFC 23-01-2025 71,230 0.67%
8.52% L I C HOUSING FINANCE LTD 03-03-2025 51,200 0.48%
8.95% HDFC 19-10-2020 4,122 0.04%
hOuSIng SecTOR Total 1,350,799 12.62%
Others 573,894 5.36%
current Assets and liabilities 740,472 6.92%
grand Total 10,701,920 100.00%
Name of the Insurer : PNB MetLife India Insurance Company Limited Annexure 11Industry wise disclosure of Investments as at March 31, 2018 (with exposure of 10% and above)

202
Name of the Insurer : PNB MetLife India Insurance Company Limited Annexure 11Industry wise disclosure of Investments as at March 31, 2018 (with exposure of 10% and above)
name of Fund : VIRTue [ulIF00719/02/08VIRTueFund117]
InduSTRy Security descriptionMarket Value
(` In 000)% of nAV
cOMpuTeR pROgRAMMIng, cOnSulTAncy And RelATed AcTIVITIeSINFOSYS LTD. 54,991 5.82%HCL TECHNOLOGIES LIMITED 34,673 3.67%TATA CONSULTANCY SERVICES LTD. 13,263 1.40%ORACLE FINANCIAL SERVICES SOFTWARE LTD 11,487 1.22%TECH MAHINDRA LIMITED FV-5 10,840 1.15%CYIENT LTD 6,565 0.70%KPIT TECHNOLOGIES LIMITED 4,908 0.52%
cOMpuTeR pROgRAMMIng, cOnSulTAncy And RelATed AcTIVITIeS 136,727 14.48%
InFRASTRucTuRe SecTORGUJARAT STATE PETRONET LTD 24,742 2.62%C E S C LTD. 17,699 1.87%INDRAPRASTHA GAS LTD.FV-2 16,747 1.77%PETRONET L N G LTD 16,664 1.76%NTPC 15,051 1.59%BHARTI AIRTEL LTD 10,938 1.16%
TATA COMMUNICATIONS LTD 9,300 0.98%
GAIL (INDIA) LTD 7,431 0.79%
BHARTI INFRATEL LTD. 6,255 0.66%
InFRASTRucTuRe SecTOR Total 124,829 13.22%
MAnuFAcTuRe OF cOKe And ReFIned peTROleuM pROducTS
RELIANCE INDUSTRIES 69,633 7.37%
CASTROL INDIA LTD. 22,317 2.36%
INDIAN OIL CORPN. LTD. 12,652 1.34%
HINDUSTAN PETROLEUM CORPN. LTD 4,483 0.47%
MAnuFAcTuRe OF cOKe And ReFIned peTROleuM pROducTS 109,085 11.55%
MAnuFAcTuRe OF MOTOR VehIcleS, TRAIleRS And SeMI-TRAIleRS
MARUTI SUZUKI INDIA LIMITED 40,318 4.27%
WABCO INDIA LTD 33,325 3.53%
EICHER MOTORS LIMITED 11,775 1.25%
MOTHERSON SUMI SYSTEMS LTD. 11,455 1.21%
MAnuFAcTuRe OF MOTOR VehIcleS, TRAIleRS And SeMI-TRAIleRS Total 96,873 10.26%
Others 486,363 51.49%
current Assets and liabilities -9,323 -0.99%
grand Total 944,554 100.00%

Financial StatementsStatutory ReportsCorporate Overview
203
Name of the Insurer : PNB MetLife India Insurance Company Limited Annexure 11Industry wise disclosure of Investments as at March 31, 2018 (with exposure of 10% and above)
name of Fund : VIRTue II Fund [ulIF01215/12/09VIRTue2Fnd117]
InduSTRy Security descriptionMarket Value
(` In 000)% of nAV
cblO
CBLO 6.2% 28/03-04-2018 139,743 13.12%
cblO Total 139,743 13.12%
cOMpuTeR pROgRAMMIng, cOnSulTAncy And RelATed AcTIVITIeS
INFOSYS LTD. 53,536 5.03%
HCL TECHNOLOGIES LIMITED 21,485 2.02%
TECH MAHINDRA LIMITED FV-5 14,430 1.35%
CYIENT LTD 13,716 1.29%
ORACLE FINANCIAL SERVICES SOFTWARE LTD 9,180 0.86%
TATA CONSULTANCY SERVICES LTD. 8,160 0.77%
KPIT TECHNOLOGIES LIMITED 4,262 0.40%
PERSISTENT SYSTEMS LIMITED 4,028 0.38%
cOMpuTeR pROgRAMMIng, cOnSulTAncy And RelATed AcTIVITIeS Total 128,797 12.09%
InFRASTRucTuRe SecTOR
C E S C LTD. 18,907 1.78%
INDRAPRASTHA GAS LTD.FV-2 15,241 1.43%
BHARTI AIRTEL LTD 15,178 1.43%
GAIL (INDIA) LTD 14,145 1.33%
PETRONET L N G LTD 13,123 1.23%
GUJARAT STATE PETRONET LTD 11,969 1.12%
NTPC 9,361 0.88%
V A TECH WABAG LTD. 6,511 0.61%
TATA COMMUNICATIONS LTD 3,833 0.36%
InFRASTRucTuRe SecTOR Total 108,267 10.17%
Others Total 625,176 58.71%
current Assets and liabilities Total 62,932 5.91%
grand Total 1,064,915 100.00%

204
Management Reportfor the year ended March 31, 2018
With respect to the operations of PNB MetLife India Insurance Company Limited (‘the Company’) for the year ended March 31, 2018 and results thereof, the Management of the Company confirms and declares that:
1. The Certificate of Registration granted by the Insurance Regulatory and Development Authority of India (IRDAI) continues to be inforce as at March 31, 2018. As per the circular IRDA/F&A/CIR/GLD/062/04/2015 dated April 7, 2015 issued by IRDAI, the authority has discontinued the process of issuing a renewed physical certificate and the existing certificate is valid from the date of issuance.
2. We certify, to the best of our knowledge and belief, that all material dues payable to the statutory authorities have been duly paid.
3. The shareholding pattern is in accordance with statutory and regulatory requirement and there is no transfer of shares during the year.
4. The management has not invested directly or indirectly outside India the funds of the holders of policies issued in India.
5. The solvency margins as required by the regulations prescribed by the IRDAI have been maintained.
6. The Company has reviewed the values of all the assets as at March 31, 2018. We certify to the best of our knowledge and belief, that the value of the assets as set forth in the Balance Sheet are shown in the aggregate at amounts not exceeding their realizable or market value under the several headings – “Loans’, “Investments” (Other than Government & other Debt securities which have been valued at amortized cost in case of shareholders’ and non-linked policyholders’ investments as required under IRDAI (Assets, Liabilities and Solvency Margin of Insurers Regulations,2000), “Agents balances”, ”Outstanding Premiums”, “Interest, Dividends and Rents outstanding”, “Interest, Dividends, Rents accruing but not due”, “Amounts due from other persons or Bodies carrying on insurance business”, ”Sundry Debtors”, ”Bills Receivable”, “Cash” and the several items specified under “Other Accounts”.
7. We certify that no part of the life insurance fund has been directly or indirectly applied in contravention of the Insurance Act, 1938 (as amended in 2015), IRDA (Investment) Regulation, 2000 as amended and applicable circulars and guidelines relating to the application and investments of the life insurance funds.
8. In a process oriented industry like insurance, it is important to integrate and strengthen the role of risk management in business processes and decisions. In order to enable the same, the risk management in the Company is managed by an independent risk management function. The role of the risk management function is to establish sound risk management practices by proactively identifying, measuring, mitigating and monitoring the organization’s risk exposures. Our risk management is based upon four guiding principles viz. ‘Controlled Risk-Taking’, ‘Ownership, Accountability and Authority’, ‘Specialization’ and ‘Change Management’. The Enterprise Risk Management framework is designed to manage the Insurance, Market, Credit, Liquidity and Operational Risks. Assessment is done on a regular basis to evaluate enterprise wide risks and take appropriate steps to mitigate the same.
9. Apart from this, In order to monitor the Risk Management at Board level, as per Corporate Governance Guidelines issued by IRDAI, Asset Liability Management & Risk Management Committee (ALMR) is established as a sub-committee of the Board. ALMR committee is setting up the Company’s risk/reward objectives, formulate and implement optimal ALM strategies and also lay down Company’s Risk Management Strategy. The committee will also provide ALM and Risk management governance oversight throughout the Company.
10. The Company’s risk exposure could also be in the areas of adverse claims experience, shortfall in investment performance and high expense levels. Mitigation steps in each of these areas are stated below:
a) The Company’s underwriting policy and implementation of the same are subjected to continuous monitoring and review. Adequate and suitable reinsurance treaties are in force with internationally reputed and highly rated reinsurers.
b) The investments of the Company are in accordance with IRDAI guidelines and as per the Investment Policy approved by the Investment Committee of the Board which stipulates appropriate risk exposures. credit risk, liquidity risk and market risks are also evaluated on a continuous basis.
c) The assets of the Company are invested in accordance with the requirements prescribed by the IRDAI.
d) Expenses are continuously monitored to ensure that the expense levels are commensurate with the level of operations of the company.

Financial StatementsStatutory ReportsCorporate Overview
205
11. The Company is not operating in any other country.
12. Ageing of death claims registered and not settled (where all the documentations have been completed) as at March 31, 2018 is furnished below:
` in ‘000
Ageinglinked Traditional Total
Amount no of claims Amount no of claims Amount no of claims
Upto 30 days - - 1,998 3 1,998 3
30 days to 6 months 10,200 1 34,003 9 44,203 10
6 month to 1 year 2,515 1 2,515 1
1 year to 5 year - - - - - -
5 years and above - - - - - -
Grand Total 10,200 1 38,516 13 48,716 14
Trends in death claim settlement time for the last five financial years are given below:
Financial year 2013-14 2014-15 2015-16 2016-17 2017-18
Average claim settlement period (in days) 1.26 3.06 6.12 3.14 2.38
13. We certify that the values as shown in the Balance sheet pertaining to investments are as under:
a) Debt securities: In case of shareholders’ and non-linked policyholders’ investments, debt securities (other than Government securities) are valued at amortised cost. In case of linked policyholders, bonds & debentures securities (other than Government securities) are valued at market value using CRISIL Bond Valuer and money market instruments are being stated at amortized cost.
b) Government securities: In case of shareholders and non-linked policyholders’ investments, Government securities have been valued at amortised cost. In case of linked policyholders’ investments, Government securities are valued at market price using CRISIL Gilt Prices
c) Liquid mutual funds are valued at the previous day’s net asset values
d) Listed equity shares and equity ETF Investments are valued at fair value being the closing price on the National Stock Exchange (‘NSE’). If the security is not listed/ traded on NSE, then the closing price on the Bombay Stock Exchange (‘BSE’) is used.
14. The Company ensures that policyholders’ and shareholders’ funds are invested in high grade fixed income securities with a minimum rating of AA and equities of high quality based on fundamental research. Management has reviewed the performance of these investments and are largely aligned to the industry benchmarks.
15. Management of the Company certifies that:
a) the financial statements of the Company have been prepared in accordance with applicable accounting standards, the regulations stipulated and the circulars issued by the IRDAI in this context from time to time and the provisions of the Insurance Act, 1938 (as amended in 2015) with no material departures.
b) management has adopted accounting policies and applied them consistently and made judgments and estimates that are reasonable and prudent so as to give a true and fair view of the state of affairs of the Company as at March 31, 2018 and of the operating profit of the Company for the year ended March 31, 2018.
c) management has taken proper and sufficient care for the maintenance of adequate accounting records in accordance with the applicable provisions of the Insurance Act 1938 and the Companies Act, 2013 for safeguarding the assets of the Company and for preventing and detecting fraud and other irregularities.
d) management has prepared the financial statements on a going concern basis.
e) management has ensured that an internal audit system commensurate with the size and nature of the business exists and is operating effectively.
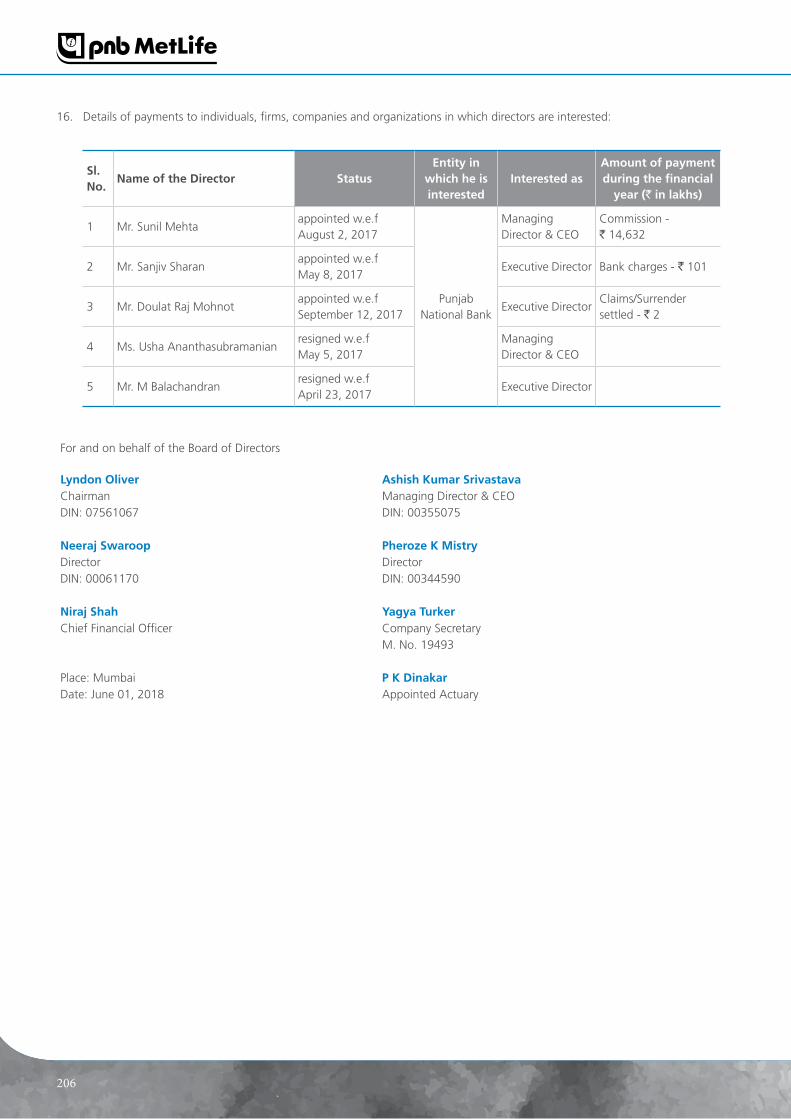
206
16. Details of payments to individuals, firms, companies and organizations in which directors are interested:
Sl. no.
name of the director Statusentity in
which he is interested
Interested as Amount of payment during the financial
year (` in lakhs)
1 Mr. Sunil Mehtaappointed w.e.f August 2, 2017
Punjab National Bank
Managing Director & CEO
Commission - ` 14,632
2 Mr. Sanjiv Sharanappointed w.e.f May 8, 2017
Executive Director Bank charges - ` 101
3 Mr. Doulat Raj Mohnotappointed w.e.f September 12, 2017
Executive Director Claims/Surrender settled - ` 2
4 Ms. Usha Ananthasubramanianresigned w.e.f May 5, 2017
Managing Director & CEO
5 Mr. M Balachandranresigned w.e.f April 23, 2017
Executive Director
For and on behalf of the Board of Directors
lyndon Oliver Ashish Kumar SrivastavaChairman Managing Director & CEODIN: 07561067 DIN: 00355075
neeraj Swaroop pheroze K MistryDirector DirectorDIN: 00061170 DIN: 00344590
niraj Shah yagya TurkerChief Financial Officer Company Secretary
M. No. 19493
Place: Mumbai p K dinakarDate: June 01, 2018 Appointed Actuary

Financial StatementsStatutory ReportsCorporate Overview
notes

notes

Navigating Life Together
PNB MetLife India Insurance Company Limited
Registered OfficeUnit No. 701, 702 & 703, 7th Floor, West Wing, Raheja Towers, 26/27 M G Road, Bangalore – 560001, Karnataka.
Corporate office1st Floor, Techniplex – 1, Techniplex Complex, Off Veer Savarkar Flyover, Goregaon (West), Mumbai – 400062. Phone: +91-22-41790000 | Fax: +91-22-41790203 | CI No.: U66010KA2001PLC028883
PNBMetLife1 | PNBMetLife | Website: www.pnbmetlife.com