Broughton et al 2011
26
I n the past several decades, models from evo- lutionary ecology have been applied with in- creasing sophistication to a wide range of ar- chaeological issues ranging from life-history evolution in early Homo, to the origins of agri- culture, to Mayan monument construction (see reviews in Bird and O’Connell 2006; Broughton and Cannon 2010). The approach has become es- PREY BODY SIZE AND RANKING IN ZOOARCHAEOLOGY: THEORY, EMPIRICAL EVIDENCE, AND APPLICATIONS FROM THE NORTHERN GREAT BASIN Jack M. Broughton, Michael D. Cannon, Frank E. Bayham, and David A. Byers The use of body size as an index of prey rank in zooarchaeology has fostered a widely applied approach to understanding variability in foraging efficiency. This approach has, however, been critiqued— most recently by the suggestion that large prey have high probabilities of failed pursuits. Here, we clarify the logic and history of using body size as a measure of prey rank and summarize empirical data on the body size–return rate relationship. With few exceptions, these data document strong positive relationships between prey size and return rate. We then illustrate, with studies from the Great Basin, the utility of body size-based abundance indices (e.g., the Artiodactyl Index) when used as one component of multidimensional analyses of prehistoric diet breadth. We use foraging theory to derive predictions about Holocene variability in diet breadth and test those predictions using the Artiodactyl Index and over a dozen other archaeological indices. The results indicate close fits between the predictions and the data and thus support the use of body size-based abundance indices as measures of foraging efficiency. These conclusions have implications for reconstructions of Holocene trends in large game hunting in western North America and for zooarchaeological applications of foraging theory in general. El uso del tamaño del cuerpo como un índice de rango presa en zooarqueológico aplicaciones de la teoría del forrajeo ha fomentado un enfoque ampliamente aplicado a la variabilidad de la comprensión en la eficiencia de forrajeo y amplitud de la dieta. Este enfoque ha sido criticado periódicamente, con una preocupación más recientes derivados de los datos etnográfi- cos que sugieren que la presa de gran tamaño puede estar asociado con altas probabilidades de actividades y por lo tanto no las tasas de retorno bajo. En este documento, clarificar la lógica y la historia de la utilización de tamaño corporal como una medida de rango de presas y resumir los datos empíricos sobre el tamaño de la relación cuerpo-la tasa de retorno, haciendo hincapié en los artiodáctilos y los lagomorfos. Estos documento de datos fuertes relaciones positivas entre el tamaño de las presas y tasa de retorno, con excepciones limitadas a los casos que no incluyen los artiodáctilos, y que se caracterizan por estrechos márgenes de tamaños de las presas. A continuación, ilustran con estudios de caso de la cuenca del norte de la Gran la utilidad del tamaño corporal basado en los índices de abundancia (por ejemplo, el Índice de Artiodáctilo: NISP Artiodác- tilos/[NISP Lagomorfos + Artiodáctilos]) cuando se utilizacomo un componente de análisis multidimensionales de ampli- tud de la dieta prehistórica. En estos estudios de caso, utilizamos modelos de la teoría de forrajeo para obtener predicciones sobre la variabilidad del Holoceno en la amplitud de la dieta de la hipótesis de clima tendencias determinadas en la densi- dad de artiodáctilos. A continuación, prueba de las predicciones utilizando el Índice de artiodáctilos y más de una docena de otros índices derivados de la fauna arqueológica, floral, y ensamblajes de la herramienta. Los resultados indican una estrecha encaja entre las predicciones y los datos empíricos y con ello proporcionar un fuerte apoyo para la utilización del tamaño corporal basado en los índices de abundancia como medidas de eficiencia de forrajeo. Estas conclusiones tienen implica- ciones de largo alcance no sólo para las reconstrucciones de las tendencias recientes del Holoceno en la caza mayor y la vari- abilidad del comportamiento relacionados en el oeste de América del Norte, pero para las aplicaciones de la teoría del forrajeo zooarqueológico en general. Jack M. Broughton Department of Anthropology, University of Utah, 270 S. 1400 E., Room 102, Salt Lake City, Utah 84112 ([email protected]) Michael D. Cannon SWCA Environmental Consultants, Salt Lake City, Utah 84112 Frank E. Bayham Department of Anthropology, California State University, Chico, California 85929-0400 David A. Byers Department of Sociology, Anthropology and Criminology, Missouri State University, Springfield, Missouri. American Antiquity 76(3), 2011, pp. 403–428 Copyright ©2011 by the Society for American Archaeology 403 AQ76(3)Broughton_Layout 1 7/5/11 2:43 PM Page 403
Transcript of Broughton et al 2011
In the past several decades, models from evo-lutionary ecology have been applied with in-creasing sophistication to a wide range of ar-
chaeological issues ranging from life-history
evolution in early Homo, to the origins of agri-culture, to Mayan monument construction (seereviews in Bird and O’Connell 2006; Broughtonand Cannon 2010). The approach has become es-
PREY BODY SIZE AND RANKING IN ZOOARCHAEOLOGY: THEORY, EMPIRICAL EVIDENCE, AND APPLICATIONS
FROM THE NORTHERN GREAT BASIN
Jack M. Broughton, Michael D. Cannon, Frank E. Bayham, and David A. Byers
The use of body size as an index of prey rank in zooarchaeology has fostered a widely applied approach to understandingvariability in foraging efficiency. This approach has, however, been critiqued— most recently by the suggestion that largeprey have high probabilities of failed pursuits. Here, we clarify the logic and history of using body size as a measure of preyrank and summarize empirical data on the body size–return rate relationship. With few exceptions, these data documentstrong positive relationships between prey size and return rate. We then illustrate, with studies from the Great Basin, theutility of body size-based abundance indices (e.g., the Artiodactyl Index) when used as one component of multidimensionalanalyses of prehistoric diet breadth. We use foraging theory to derive predictions about Holocene variability in diet breadthand test those predictions using the Artiodactyl Index and over a dozen other archaeological indices. The results indicateclose fits between the predictions and the data and thus support the use of body size-based abundance indices as measuresof foraging efficiency. These conclusions have implications for reconstructions of Holocene trends in large game huntingin western North America and for zooarchaeological applications of foraging theory in general.
El uso del tamaño del cuerpo como un índice de rango presa en zooarqueológico aplicaciones de la teoría del forrajeo hafomentado un enfoque ampliamente aplicado a la variabilidad de la comprensión en la eficiencia de forrajeo y amplitud de ladieta. Este enfoque ha sido criticado periódicamente, con una preocupación más recientes derivados de los datos etnográfi-cos que sugieren que la presa de gran tamaño puede estar asociado con altas probabilidades de actividades y por lo tanto nolas tasas de retorno bajo. En este documento, clarificar la lógica y la historia de la utilización de tamaño corporal como unamedida de rango de presas y resumir los datos empíricos sobre el tamaño de la relación cuerpo-la tasa de retorno, haciendohincapié en los artiodáctilos y los lagomorfos. Estos documento de datos fuertes relaciones positivas entre el tamaño de laspresas y tasa de retorno, con excepciones limitadas a los casos que no incluyen los artiodáctilos, y que se caracterizan porestrechos márgenes de tamaños de las presas. A continuación, ilustran con estudios de caso de la cuenca del norte de la Granla utilidad del tamaño corporal basado en los índices de abundancia (por ejemplo, el Índice de Artiodáctilo: �NISP Artiodác-tilos/�[NISP Lagomorfos + Artiodáctilos]) cuando se utilizacomo un componente de análisis multidimensionales de ampli-tud de la dieta prehistórica. En estos estudios de caso, utilizamos modelos de la teoría de forrajeo para obtener prediccionessobre la variabilidad del Holoceno en la amplitud de la dieta de la hipótesis de clima tendencias determinadas en la densi-dad de artiodáctilos. A continuación, prueba de las predicciones utilizando el Índice de artiodáctilos y más de una docena deotros índices derivados de la fauna arqueológica, floral, y ensamblajes de la herramienta. Los resultados indican una estrechaencaja entre las predicciones y los datos empíricos y con ello proporcionar un fuerte apoyo para la utilización del tamañocorporal basado en los índices de abundancia como medidas de eficiencia de forrajeo. Estas conclusiones tienen implica-ciones de largo alcance no sólo para las reconstrucciones de las tendencias recientes del Holoceno en la caza mayor y la vari-abilidad del comportamiento relacionados en el oeste de América del Norte, pero para las aplicaciones de la teoría del forrajeozooarqueológico en general.
Jack M. Broughton � Department of Anthropology, University of Utah, 270 S. 1400 E., Room 102, Salt Lake City, Utah84112 ([email protected])Michael D. Cannon � SWCA Environmental Consultants, Salt Lake City, Utah 84112Frank E. Bayham � Department of Anthropology, California State University, Chico, California 85929-0400David A. Byers � Department of Sociology, Anthropology and Criminology, Missouri State University, Springfield, Missouri.
American Antiquity 76(3), 2011, pp. 403–428Copyright ©2011 by the Society for American Archaeology
403
AQ76(3)Broughton_Layout 1 7/5/11 2:43 PM Page 403

404 american antiquity [Vol. 76, no. 3, 2011
pecially well- developed— reaching almost main-stream status— in zooarchaeology, the context ofseveral of the earliest applications of evolutionaryecology in archaeology (Bayham 1977, 1979,1982; Beaton 1973). In this context, foraging the-ory models have been effectively applied as toolsfor understanding prehistoric behavioral variabil-ity and diachronic trends in foraging efficiency anddiet breadth. Such variability and trends have, inturn, been linked to many broader developments inhuman behavior and morphology, includingchanges involving technology, the division of la-bor, the emergence of agriculture, population re-placements, violence and warfare, social inequal-ities, settlement systems, material display, andhuman health (e.g., Bird and O’Connell 2006;Broughton and O’Connell 1999; Broughton et al.2010; Cannon 2003; Fitzhugh 2003; Jones andRaab 2004; Kennett 2005; Kuhn et al. 2001; Morin2004, 2010; Ugan et al. 2003). Central to these applications has been the ef-
fective estimation of key parameters of foragingtheory models and articulation of these to the im-perfectly preserved archaeological residues of pasthuman foraging decisions. Perhaps most importantin this context is the estimation of prey ranks,which are essential to application of the fine-grained prey model, the most widely applied of allforaging models. Prey-rank estimates are typicallydefined in standard model formulations as post-en-counter return rates, measured as e/h, where e rep-resents the net energy gain provided by a resourceand h represents the handling costs associated withacquiring and processing it. Of these variables,only energy gain is more or less directly measur-able in archaeological contexts because it is directlyproportional to prey body size. Because most of thehandling costs are highly variable, context-depen-dent, and difficult to estimate from archaeofaunalmaterials, prey body size has been commonly usedas a proxy measure of prey rank in the deploymentof the prey model in archaeofaunal contexts. Thisconvention was initially advanced in early archae-ological applications of the prey model (Bayham1977, 1979, 1982) and has more recently beenbolstered by extensive ethnographic and experi-mental data sets bearing on the relationship be-tween prey size and post-encounter return rate(e.g., Alvard 1993; Hill et al. 1987; Simms 1985,1987; Smith 1991; Winterhalder 1981).
While the use of body size as a measure of preyrank has fostered a robust and successful approachto understanding variation in the archaeofaunalrecord, most often operationalized through thecalculation of body-sized-based taxonomic “abun-dance indices” (e.g., Bayham 1979, 1982;Broughton 1994a, 1994b, 2004; Broughton et al.2010; Broughton et al. 2007; Butler 2000; Butlerand Campbell 2004; Byers and Broughton 2004;Byers et al. 2005; Byers and Smith 2007; Cannon2003; Faith 2007; Grayson 2001; Grayson andDelpech 1998; Hildebrandt and Jones 2002; Joneset al. 2008; Kennett 2005; Lyman 2003a, 2003b;Morin 2004, 2011; Nagaoka 2002a, 2002b, 2005,2006; Porcasi et al. 2000; Ugan 2005a, 2005b;Ugan and Bright 2001; Wolverton 2005; Wolver-ton et al. 2008), the approach has also been cri-tiqued periodically over the past few decades. Thecritiques have involved concerns about the effectsof mass-capture techniques on prey return rates(e.g., Madsen and Schmitt 1998; Rick and Er-landson 2000; see also Lupo 2007), the high travelcosts presumed to be associated with large-gameexploitation (McGuire et al. 2007; but see Grim-stead 2010), and, most recently, the high mobilityof large game, which is presumed to result in bothhigh pursuit costs and high probabilities of failedpursuits (Bird et al. 2009). This last issue, emerg-ing from ethnographic data collected from theMartu of western Australia, has led Bird et al. tocontend that failure to incorporate pursuit costsinto the ranking of a prey item may well compro-mise “interpretations of variability in prehistoricresource use” (2009:8). Apparently reflecting theseconcerns, Bird and O’Connell (2006) refer to theuse of body size as an index of prey rank in ar-chaeofaunal applications as a “fragile” assump-tion, a conclusion that is very different from theone we reach here. In this paper, we discuss the role of prey-rank
estimates as one of many assumptions containedin prey model applications. We clarify the originallogic of using body size as a hypothetical measureof prey rank in archaeological applications of for-aging models, and we summarize available em-pirical evidence that speaks to the utility and lim-itations of prey body size when used in this way.We also explore the potential influence of mobil-ity-related costs on the return rates for the NorthAmerican mammalian prey most commonly used
AQ76(3)Broughton_Layout 1 7/5/11 2:43 PM Page 404
in body size–based abundance indices— artiodactyls and lagomorphs— and we illustratewith case studies from the northern Great Basinthe role that abundance indices can play in broader,multidimensional analyses of prehistoric forag-ing behavior. The main points that we make hereare (1) that the relationship between prey body sizeand post-encounter return rate is thoroughly sup-ported for a wide range of prey types, especiallythose most commonly employed in foraging the-ory-inspired abundance indices; and (2) that con-clusions about variability in prehistoric foragingefficiency that are based on patterns observed inabundance indices are frequently well-supportedby other, independent archaeological measures.These points have far-reaching implications notonly for recent reconstructions of trans-Holocenetrends in large game hunting in western NorthAmerica and the debate about whether those trendsare driven by foraging efficiency or by factors re-lated to costly signaling and prestige rivalry(Broughton and Bayham 2003; Broughton et al.2008; Byers and Broughton 2004; Hildebrandtand McGuire 2002; McGuire and Hildebrandt2005), but also for zooarchaeological applicationsof foraging theory in general.
Body Size and Prey Ranking in Zooarchaeology: The Original Rationale
Recognition of the importance of prey body sizeas a significant variable influencing food choicehas a long history in zooarchaeology (e.g., White1952, 1953), even prior to its use as a proxy forprey rank in early foraging theory applications inthe field. As a prey characteristic that is readily de-rived from archaeological faunas, the use of bodysize in this context grew out of the limitations ofearlier biomass-based efforts to understand the se-lective utilization of animals, which required datadifficult to derive from archaeological settings(e.g., Grayson 1974; Munson et al. 1971; Smith1974, 1979; Yesner and Aigner 1976; see Bayham1982 for further discussion). Pioneering the ar-ticulation of prey model predictions with archae-ological measures of the relative abundance of dif-ferent-sized prey species, Bayham reasoned:
It is clear that a variety of factors influencewhich animals are selected for food, such assize, density, palatability, search time and pro-
cessing time. Among those, abundance of preyin the diet and size of the prey item are the onlydirect quantifiable variables that the faunalanalyst has access to. The attempt is made hereto characterize the prehistoric diet using sizeand abundance, thereby facilitating compar-isons from one site to another...In the aridSouthwest it is easy to understand the con-ceptual utility of this scheme, when we con-sider the most dominant animals in theprehistoric diet, deer and rabbits. It is assumedthat deer are the most preferred food item, andtherefore, the representation of rabbit speciesin the diet is an indirect index of how abun-dant deer were [Bayham 1977:357].
Further work emphasized that ratios of theabundances of such taxa could be extended toprovide measures of hunting efficiency, with highproportionate abundances of large-sized taxa (e.g.,deer) indicating higher overall return rates (Bay-ham 1982, 1986; Szuter and Bayham 1989). Us-ing measures such as the Artiodactyl Index(�NISP Artiodactyls/�NISP [Artiodactyls +Lagomorphs]), Bayham (1977, 1979, 1982, 1986;Szuter and Bayham 1989) explored patterning inSouthwestern hunting efficiency related to a va-riety of factors including resource depression andchanges in settlement system organization. At the same time, analogous approaches were
being developed in early applications of the preymodel within the field of zoology. Wilson (1976),for instance, argued that the abundance of large,relative to small, insect prey found in the stomachcontents of birds could be used to measure thequality of their foraging environments and thusforaging efficiency. Since large, high-ranked preyshould always be pursued, Wilson (1976:96) ar-gued, their relative abundances measure both howfrequently they were encountered and the amountof energy “available in the environment.” We emphasize that these structurally similar
early prey model applications in zooarchaeologyand zoology both fully recognized the potentialimportance of pursuit costs, but, since they dealtonly with the residues of past foraging decisions,neither had any secure way to access them. Thus,adopting a standard modeling convention, vari-ables perceived to be intractable— albeit poten-tially significant— were held constant to allowthe analysis to proceed (see also Griffiths 1975).
Broughton et al.] Prey BODy SiZe anD ranKinG in ZOOarcHaeOLOGy 405
AQ76(3)Broughton_Layout 1 7/5/11 2:43 PM Page 405
Both approaches therefore adopted body size as aproxy for prey rank given its intrinsic link with en-ergetic gain.We also emphasize that the assumptions about
prey ranks incorporated in this tradition of prey-model applications in zooarchaeology have al-ways been viewed as hypotheses that enable thegeneration of testable predictions, rather than asabsolute or deterministic characterizations of pasthuman foraging behavior. As with all model com-ponents (currency, constraints, etc.), the assump-tions made about prey rankings are at risk when-ever a model is applied in a particular context.Predictive failures imply that one or more of theassumptions incorporated into a model, includingthose associated with prey rankings, may be in-appropriate. Predictive successes, on the otherhand, imply that model assumptions are valid.The wide range of successful tests involving mod-els that assume maximization of foraging effi-ciency as a goal and currency, and that use bodysize as a proxy for prey ranks, attest to the gener-ality of these particular assumptions.
Ethnographic and Experimental EvidenceSupport the Body Size-Return Rate
Relationship
The first wave of prey model applications inzooarchaeology reasoned that, though context-dependent, pursuit costs would typically not varyto such a degree that an ordinal scale rankingbased on size alone would become reversed, es-pecially for taxa of such disparate size as artio-dactyls and lagomorphs. This conclusion beganto be empirically supported as soon as ethno-graphic and experimental analyses of post-en-counter return rates started to emerge in the1980s (e.g., Hawkes et al. 1982; Hill et al. 1987;Simms 1985, 1987; Winterhalder 1981). By theearly 1990s, summaries of the empirical dataon the relationship between vertebrate prey bodysize and return rate showed positive correlationsin each and every case (e.g., Broughton 1994a).These data supplied estimates for other criticalmodel parameters and enabled a surge in theapplication of foraging models not only in zooar-chaeology but throughout archaeology in general(see Bird and O’Connell 2006; Cannon andBroughton 2010).
To our knowledge, there are now ten data setsin existence that include return-rate estimates forsuites of vertebrate prey types consisting of fiveor more taxa or prey types; these data sets aresummarized in Table 1. In all of these cases, thedirection of the relationship between post-en-counter return rate and body size is positive, andin eight of the ten cases the correlation is signif-icant at an alpha level of .10 (Table 1). Becausethe effects of prey mobility and failed pursuits onreturn rates have been recently highlighted (Birdet al. 2009), we point out that all of the ethno-graphic-observational data sets represented inTable 1 explicitly include the costs of failed pur-suits in their return rate estimates. Since signifi-cant correlations between prey body size and re-turn rates are indicated in almost of all of thesecases, it would appear that prey mobility may beless influential than has been suggested. Pursuing this further, the two empirical cases
that fail to produce significant correlations be-tween prey body size and return rate— those in-volving the Mayangna-Miskito and Martu— areinstructive in that they elucidate an importantgeneral factor that appears to affect the bodysize–return rate relationship. Specifically, com-pared to data sets derived from other cases that in-volve terrestrial hunting, these two incorporatevery narrow prey size ranges and very small max-imum prey sizes: the Martu data, for example, ex-hibit the lowest range of exploited prey sizes,with hill kangaroo (Macropus robustus), thelargest prey type, weighing only 22 kg and cossidlarva, the smallest type, weighing just 13 g. Incontrast, the prey-size range for the Cree is over415 kg, with moose (Alces alces) and grouse(Phasianidae), representing the largest and small-est prey sizes, respectively (Table 1). We alsonote that the Mayangna-Miskito and Martu casesare the only two involving terrestrial hunting inwhich artiodactyls are not included in the suite ofprey exploited. Thus, we can only conclude thatthe lack of truly large-bodied prey and the rela-tively narrow range of prey sizes in these twocases must accentuate the effect of variation inprey mobility on prey rankings. This, of course, isnot a new point, having previously been articu-lated most notably by Stiner and colleagues (e.g.,Stiner et al. 1999; Stiner et al. 2000; Stiner andMunro 2002; see also Morin 2011), who have
406 american antiquity [Vol. 76, no. 3, 2011
AQ76(3)Broughton_Layout 1 7/5/11 2:43 PM Page 406

Broughton et al.] Prey BODy SiZe anD ranKinG in ZOOarcHaeOLOGy 407Table 1. Correlation Coefficients for the Body Size (kg) and Post-Encounter Return Rate (Kcal/hr) Relationship for Vertebrates Derived from Experimental and Ethnographic Contexts.
Primary
Failed Pursuits
Cultural
Vertebrate Classes
Size Range
Capture
Included in
Affiliation
Location: Environment
(no. of prey species or weight classes)(max size) kg
r sP
Method
Return Rates
Reference
Creea
N. Ontario: Boreal Forest
Mammals (10); Fishes (6); Birds (3)
415 (416)
.52
.03
Single, Mass
yes
Winterhalder 1981: Table 4.4
Creeb
N. Ontario: Boreal Forest
Mammals (4); Fishes (1); Birds (2)
258 (259)
.75
.07
Single, Mass
yes
Winterhalder 1981: Table 4.4
Achec
E. Paraguay: Tropical Forest
Mammals (7); Fish (1)
29 (30)
.56
.09
Single
yes
Hawkes et al. 1982: Table 3
Reptile (1); Bird (1)
Modern Utah
Utah: Temperate Forest,
Mammals (9); Birds (1)
56 (57)
.73
.04
Single
naSimms 1985, 1987
Huntersd
Sage Steppe
Achee
E. Paraguay: Tropical Forest
Mammals (7)
27 (30)
.71
.08
Single
yes
Hill et al. 1987: Table 2
Experimentalf
W. Nevada: Wetland Marshes
Fishes (12 see note)
.042 (.058)
.67
.03
Mass
naRaymond and Sobel 1990: Table 5
Inujjuamiutg
NW. Quebec:
Mammals (11); Fishes (5);
498 (499)
.81
<.001
Single, Mass
yes
Smith 1991; Table 6.11;
Low-Arctic Coastal
Birds (9)
Jones 2004: Table 2
Inujjuamiuth
NW. Quebec:
Mammals (5); Fishes (3); Birds (3)
498 (499)
.63
.05
Single, Mass
yes
Smith 1991: Table 6.11
Low-Arctic Coastal
Piroi
S. Peru: Tropical Forest
Mammals (8); Birds (1)
261 (263)
.65
.07
Single
yes
Alvard 1993: Table 2 and p. 372;
Washoe, Historic
E. California: Riverine
Fishes (22, see note)
3.17 (3.18)
.54
.01
Single, Mass
naLindstrom 1996: Table 9a
Euro-Americanj
Washoe, Historic
E. California: Riverine
Fishes (22, see note)
3.17 (3.18)
.81
<.001
Single, Mass
naLindstrom 1996: Table 9b
Euro-Americank
Mayangna and
Nicaragua: Tropical Forest
Mammals (6); Reptiles (1)
29 (30.5)
.32
.43
Single (w/dogs)
yes
Koster 2008a: Table 2
Miskito
Martu
W. Australia: Desert
Reptiles (4); Mammals (2);
22 (~22)
.23
.53
Single
yes
Bird et al. 2009: Table 2
Birds (1); Insect (1)
Martul
W. Australia: Desert
Reptiles (4); Mammals (2);
22 (~22)
.71
.06
Single
noBird et al. 2009: Table 2
Birds (1); Insect (1)
a Return rates are separated by season. For reference to costs associated with failed pursuits see Winterhalder (1977:Table 4.3). Weights for moose and caribou are 416 kg and 102.5 kg, respectively.
b Mean return rates (seasons lumped). Moose and caribou weights are averaged and equal 259 kg.
c For reference to costs associated with failed pursuits see Hill and Hawkes 1983.
d Midpoint of return rate ranges. Pursuit costs estimated from interviews with experienced Utah hunters.
e This data set is independent from Hawkes et al. 1982. Return rate for white-lipped peccary excludes tracking time.
f Twelve wt. classes for G. bicolor. Does not include failed pursuits since every net set contained some fish (A. Raymond, pers. comm.)
g Return rates separated by season. For reference on costs associated with failed pursuits see Smith (1991:Table 6.2).
h Mean return rates (seasons lumped).
i Includes return rates for Brazilian tapir (Tapirus terrestris) and Capybara (Hydrochaeris hydrochaeris); handling times estimated.
j Fresh consumption; 22 size/capture method categories used; mean return rates reported here from ranges.
k Dried for storage; 22 size/capture method categories used; mean return rates reported here from ranges.
l Excludes tracking and pursuit time.
AQ76(3)Broughton_Layout 1 7/5/11 2:43 PM Page 407
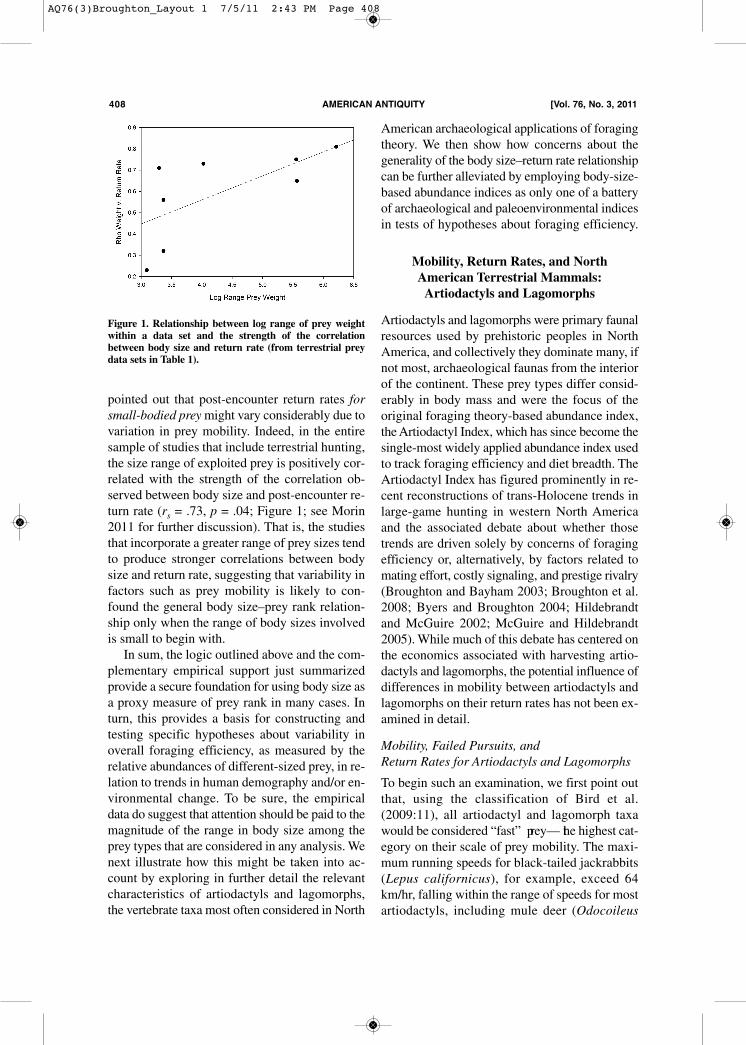
pointed out that post-encounter return rates forsmall-bodied preymight vary considerably due tovariation in prey mobility. Indeed, in the entiresample of studies that include terrestrial hunting,the size range of exploited prey is positively cor-related with the strength of the correlation ob-served between body size and post-encounter re-turn rate (rs = .73, p = .04; Figure 1; see Morin2011 for further discussion). That is, the studiesthat incorporate a greater range of prey sizes tendto produce stronger correlations between bodysize and return rate, suggesting that variability infactors such as prey mobility is likely to con-found the general body size–prey rank relation-ship only when the range of body sizes involvedis small to begin with.In sum, the logic outlined above and the com-
plementary empirical support just summarizedprovide a secure foundation for using body size asa proxy measure of prey rank in many cases. Inturn, this provides a basis for constructing andtesting specific hypotheses about variability inoverall foraging efficiency, as measured by therelative abundances of different-sized prey, in re-lation to trends in human demography and/or en-vironmental change. To be sure, the empiricaldata do suggest that attention should be paid to themagnitude of the range in body size among theprey types that are considered in any analysis. Wenext illustrate how this might be taken into ac-count by exploring in further detail the relevantcharacteristics of artiodactyls and lagomorphs,the vertebrate taxa most often considered in North
American archaeological applications of foragingtheory. We then show how concerns about thegenerality of the body size–return rate relationshipcan be further alleviated by employing body-size-based abundance indices as only one of a batteryof archaeological and paleoenvironmental indicesin tests of hypotheses about foraging efficiency.
Mobility, Return Rates, and North American Terrestrial Mammals: Artiodactyls and Lagomorphs
Artiodactyls and lagomorphs were primary faunalresources used by prehistoric peoples in NorthAmerica, and collectively they dominate many, ifnot most, archaeological faunas from the interiorof the continent. These prey types differ consid-erably in body mass and were the focus of theoriginal foraging theory-based abundance index,the Artiodactyl Index, which has since become thesingle-most widely applied abundance index usedto track foraging efficiency and diet breadth. TheArtiodactyl Index has figured prominently in re-cent reconstructions of trans-Holocene trends inlarge-game hunting in western North Americaand the associated debate about whether thosetrends are driven solely by concerns of foragingefficiency or, alternatively, by factors related tomating effort, costly signaling, and prestige rivalry(Broughton and Bayham 2003; Broughton et al.2008; Byers and Broughton 2004; Hildebrandtand McGuire 2002; McGuire and Hildebrandt2005). While much of this debate has centered onthe economics associated with harvesting artio-dactyls and lagomorphs, the potential influence ofdifferences in mobility between artiodactyls andlagomorphs on their return rates has not been ex-amined in detail.
Mobility, Failed Pursuits, and Return Rates for Artiodactyls and Lagomorphs
To begin such an examination, we first point outthat, using the classification of Bird et al.(2009:11), all artiodactyl and lagomorph taxawould be considered “fast” prey— the highest cat-egory on their scale of prey mobility. The maxi-mum running speeds for black-tailed jackrabbits(Lepus californicus), for example, exceed 64km/hr, falling within the range of speeds for mostartiodactyls, including mule deer (Odocoileus
408 american antiquity [Vol. 76, no. 3, 2011
Figure 1. Relationship between log range of prey weightwithin a data set and the strength of the correlationbetween body size and return rate (from terrestrial preydata sets in Table 1).
AQ76(3)Broughton_Layout 1 7/5/11 2:43 PM Page 408

hemionus), elk (Cervus canadensis), bison (Bisonbison), and bighorn sheep (Ovis canadensis) (Gar-land 1983; Garland and Janis 1993; Morin 2011).The great agility and elusiveness of lagomorphs,although difficult to quantify, is also legendaryand may be enhanced by their smaller size relativeto artiodactyls. These considerations suggest thatpursuit costs and the probability of failed pursuitsmight be broadly comparable for artiodactyls and lagomorphs— or even higher for lagomorphs— allelse being equal. If so, then post-encounter returnrates for artiodactyls and lagomorphs would, onaverage, be largely a function of the substantialdifferences in body size that separate the two or-ders. This is, in fact, born out by the available em-pirical data on returns for these taxa. Figure 2 shows the relationship between log
prey-body size and empirically derived post-en-counter return rates for the entire sample of NorthAmerican artiodactyls and lagomorphs. These in-clude all of the relevant data from the studies inTable 1 as well as several return-rate estimates forlagomorphs provided in Ugan (2005a). The rela-tionship is positive and highly significant (r2 = .80,p < .0001; rs = .84, p = .0004), with dramaticallysignificant differences in mean return rates be-tween the two orders (t = 6.58, df = 17, p < .0001). Further information on mobility-related pursuit
costs are available from studies involving modernlagomorph and artiodactyl hunters in easternNorth America (Holsworth 1973; Morgan 2005;Ruth and Simmons 1999; South Carolina De-partment of Natural Resources 2009). In these
studies, data on the number of animals pursuedper hunt— that is, animals either shot at or“jumped”—are presented along with the totalnumber of animals harvested, enabling the prob-ability of successful pursuits to be estimated. Thedata on lagomorphs include 11- and 3-year surveyperiods for cottontail (Sylvilagus spp.) huntersfrom South Carolina and Kentucky, respectively.The artiodactyl data are for white-tailed deer(Odocoileus virginianus) hunters from single-year surveys in Ontario and South Carolina. The average pursuit success rate for 14 years of
survey data for rabbits is .56, with yearly valuesthat range between .62 and .42. This means thatlagomorphs escape from modern shotgun huntersbetween 60 percent to 40 percent of the time. Thetwo different white-tailed deer studies producednearly identical pursuit success rates of .82 and.79, with a mean of .80. Failed pursuits thus occurin only about 20 percent of encounters. The sub-stantial differences in target size and the greatervisibility of artiodactyls within areas of dense veg-etation, we suspect, may lie at the heart of the dif-ference in pursuit success between artiodactylsand lagomorphs. In any case, these data are con-sistent with the ethnographically derived return-rate estimates in that they indicate no overlap inpursuit success rates between rabbits and deer. We are under no illusion that these actualisti-
cally derived return-rate and pursuit-success dataare necessarily representative of the actual ab-solute values associated with prehistoric foragersin any particular context. They do, however, pro-vide no challenge to using prey size, the most im-portant knowable economic quality of artiodactylsand lagomorphs, as a source to hypothesize an or-dinal-scale ranking of them in archaeofaunal stud-ies. If anything, they suggest that lagomorphs aregenerally more difficult to capture than artio-dactyls, which only reinforces the point that lago-morphs should, in general, provide lower post-en-counter return rates than artiodactyls.
Modeling the Effect of Pursuit Success on Return Rates
This analysis can be made somewhat more gen-eral by deconstructing, on a theoretical level, theeffect of prey capture success on post-encounterreturn rates. As noted above, in standard formu-lations, post-encounter return rates are calculated
Broughton et al.] Prey BODy SiZe anD ranKinG in ZOOarcHaeOLOGy 409
Figure 2. Relationship between log weight and return ratefor artiodactyls and lagomorphs. Data from references inTable 1 and Ugan (2005a).
AQ76(3)Broughton_Layout 1 7/5/11 2:43 PM Page 409
as e/h, or energetic gain per handling time. As acharacteristic of a prey type, the quantity e/h isgenerally recognized to be an expected or averagevalue (e.g., Stephens and Krebs 1986:13–17), inlight of the fact that there may be some intra-prey-type variability in return rate, due to, among otherfactors, success or failure in pursuit. The effect ofcapture success on prey ranks can be understoodmore explicitly by substituting into the calculationof the post-encounter return rate the equality e =p*g, where p is the probability of successfullycapturing a prey type and g is the average ener-getic gain provided by that prey type when pursuitis successful. Thus, for prey type i, the averagepost-encounter return rate (r) can be calculated asri = (pi*gi)/hi, with h representing handling timeaveraged across both successful and unsuccess-ful pursuits.1
To illustrate, a prey type that could be capturedwithout fail (i.e., p = 1) with an average energeticvalue upon capture (g) of 1,000 kcal and an aver-age handling time of 1 hr would provide an aver-age post-encounter return rate of 1,000 kcal/hr.The exact same average post-encounter returnrate would also be provided by a larger-bodied butmore elusive prey type with an average energeticgain of 10,000 kcal and an average handling timeof 1 hr that could only be captured in one out often pursuits (p = .1). When the effects of capturesuccess are made explicit in this manner, it can beseen that the average post-encounter return rate ofa large-bodied prey type might indeed be lowerthan that of a smaller-bodied prey type if theprobability of capture success is sufficiently lowerfor the former than for the latter. Specifically, ifprey type 1 is the large-bodied type and prey type2 is the small-bodied type, then for prey type 2 toprovide the higher average post-encounter returnrate, it must be the case that
Applying this to artiodactyls and lagomorphs,the data used to generate Figure 2 suggest averagevalues of g and h, respectively, on the order of51,000 kcal and 2.35 hours for artiodactyls and1200 kcal and 6 minutes for lagomorphs. In turn,this would suggest that the probability of suc-cessful capture would have to be at least 1.8 times
greater for lagomorphs than for artiodactyls forthe average post-encounter return rate of lago-morphs to exceed that of artiodactyls. Given themodern hunting survey data discussed above,which suggest that pursuit success is likely to belower for lagomorphs than for artiodactyls (per-haps by half), it is difficult to see how prehistoriclagomorph capture success could ever have ex-ceeded that for artiodactyls by such a margin.
Multiple Quantitative Indices of DietBreadth and Foraging Efficiency
The data just discussed strongly suggest thatanalyses of patterns in foraging efficiency thatrely on the body size–return rate relationship, atleast as applied to artiodactyls and lagomorphs,are valid. However, as in any archaeologicalanalysis, even stronger cases regarding trends inforaging efficiency can be made when multiple,independent lines of evidence are employed. Inother words, a single abundance index is only oneof many individually less-than-fool-proof toolsthat can be and have been used in these kinds ofanalyses. It is therefore worth noting that themost compelling examples of prehistoric changesin foraging efficiency do not rely solely on thebody size–return rate relationship, but insteadhave been demonstrated through the use of mul-tiple measures that collectively signal compara-ble trends. Zooarchaeological complements tobody size-based abundance indices may include,but are not limited to, measures of evenness andrichness as indicators of faunal diet breadth;skeletal part representation reflecting local de-pression and distant patch use; age, size, and sexstructure as they relate to harvest pressure, preydepression, and habitat quality (e.g., Stiner et al.2000; Wolverton et al. 2008); and bone frag-mentation and other variables that may relate toprocessing intensity (Ugan 2005b). Abundanceindices constructed to reflect the harvesting ofprey types from proximal and distant patcheshave also played a key role in documenting de-clining returns for central-place foragers in anumber of studies (Broughton 1999, 2002; Na-gaoka 2002b). Indices constructed to representthe relative frequency of high and low rankingsmall-sized prey have also been effectively de-ployed, in many cases relying on distinctive dif-
p
p
g
h
g
h2
1
1
1
2
2
⟩ ÷
.
410 american antiquity [Vol. 76, no. 3, 2011
AQ76(3)Broughton_Layout 1 7/5/11 2:43 PM Page 410
ferences in prey mobility (Stiner et al. 2000;Stutz et al. 2009; Wolverton 2005). In addition to these variables— now industry
standards in zooarchaeological applications offoraging theory— trends in frequencies of tools(tool abundance indices) associated with the har-vesting of particular resources can be establishedto further test hypothesized trends in prey abun-dances. In more exceptional cases, independentpaleontological data can also provide supportingevidence, as in the example we discuss below in-volving the trans-Holocene artiodactyl fecal pel-let record from Homestead Cave, Utah. Quanti-tative paleoclimatic indices of many kinds havealso long been employed in the context of tests in-volving trends in foraging returns. And finally,trends in human skeletal paleopathologies andstature have also been linked to trends in foragingefficiency derived from faunal indices: insofar aslower foraging efficiency implies greater foragingeffort required to meet minimum caloric require-ments and an increased risk of malnutrition,higher levels of morbidity and mortality, slowergrowth rates, and reduced adult body size shouldaccompany declines in the former (Bartelink2006; Broughton and O’Connell 1999; Broughtonet al. 2010). To these more established measures we can
add promising but still experimental use of faunalbone isotopic and ancient mtDNA analyses. Boneisotope analyses have been used to determine thegeographic origin of prey animals and identifypossible instances of distant patch utilization dri-ven by local patch depression (Grimstead 2005,2009). Ancient mtDNA analyses of faunal bonecan potentially reveal trends in genetic diversitythat may reflect changes in prey population sizes,and preliminary work with California tule elkand Northern fur seal shows promising signs forthe approach (Beck 2010).With the exception of these last measures,
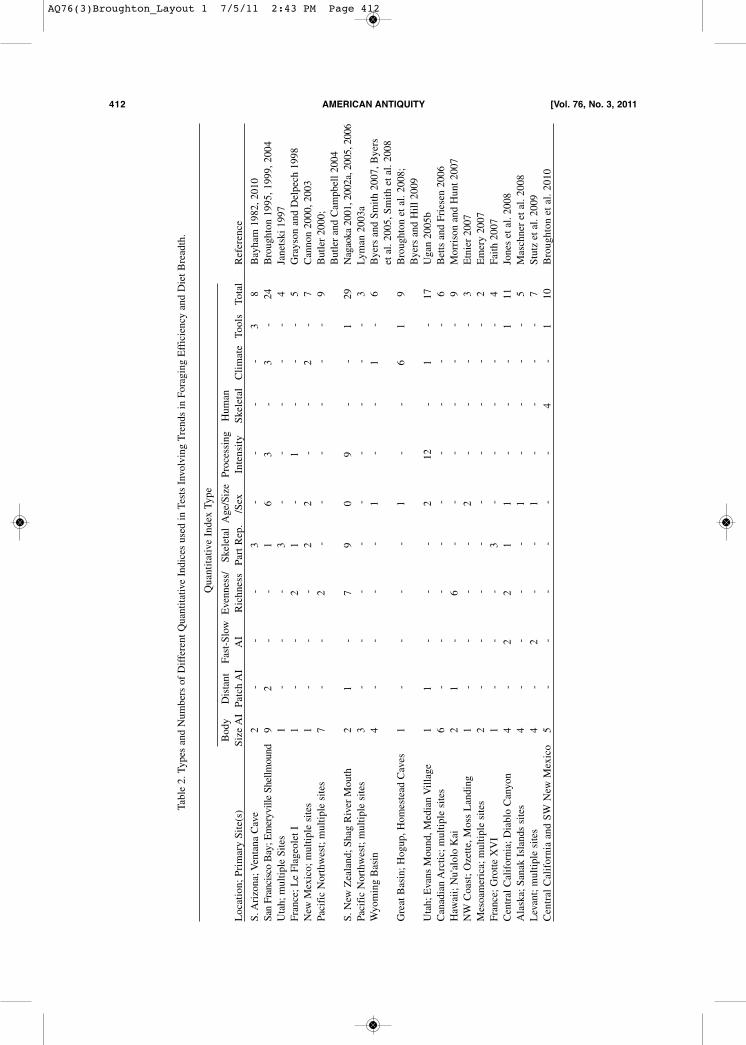
where work is still in its infancy, good use of in-dices constructed from all the other variableslisted above has been made in analyses of trendsin prehistoric foraging behavior the world over,with most also attentive to taphonomic issues thatmay cloud their meaning. Table 2 presents a non-comprehensive sampling of studies in this tradi-tion that use body-size based abundance indices,along with the numbers and types of additional in-
dices used to independently inform on foragingefficiency and prey abundances in these settings.We next further illustrate the strength of the “mul-tiple lines of evidence approach” with recent re-search and ongoing analyses involving Holoceneclimate change and trends in human hunting effi-ciency in the northern Great Basin.
Holocene Climate Change and Human DietBreadth and Foraging Efficiency in the
Northern Great Basin
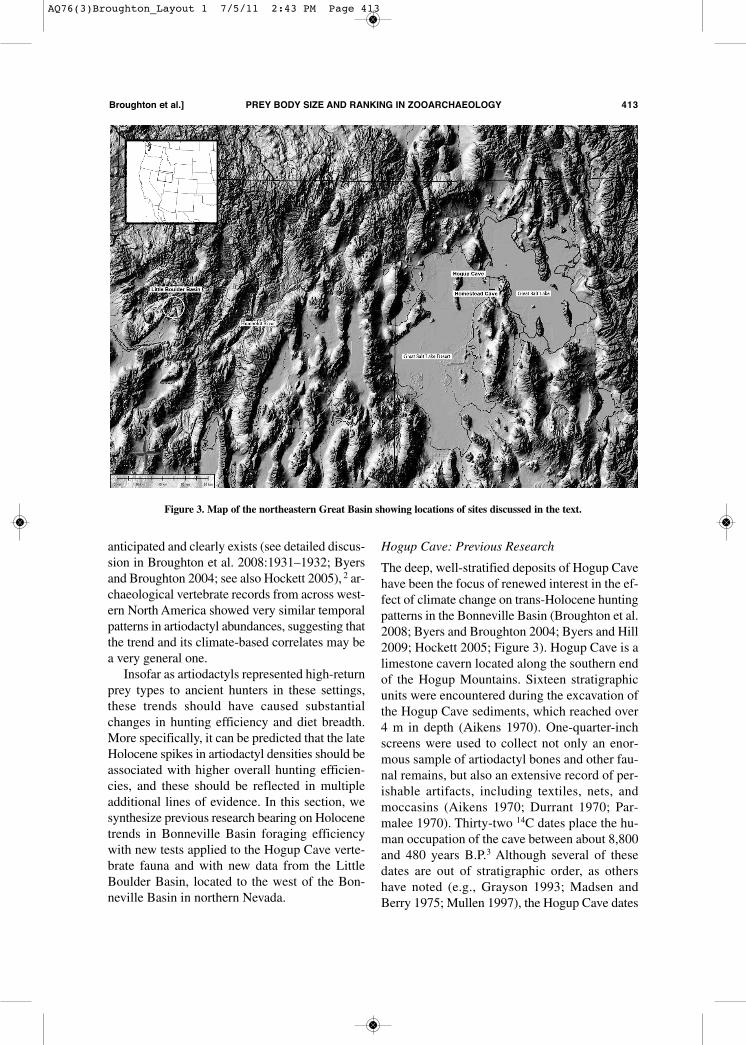
In recent work, we tested the hypothesis that theseasonality of temperature and precipitationplayed a major role in controlling the populationdensities of artiodactyls (e.g., bighorn sheep [Oviscanadensis], mule deer [Odocoileus hemionus],and pronghorn [Antilocapra americana]) acrossthe terminal Pleistocene and Holocene of westernNorth America (Broughton et al. 2008). For muchof this region, general circulation climate modelsand a range of paleoclimatic data suggest that sea-sonal extremes in temperature peaked during theterminal Pleistocene and early Holocene and thatearly and middle Holocene precipitation followeda winter-wet, summer-dry pattern— conditionsknown to depress artiodactyl densities. Thesetrends are mirrored in a macrophysical climatesimulation model (MCM) developed for the north-ern Bonneville Basin (Figure 3), northwesternUtah, from which we derived terminal Pleistoceneand Holocene climatic values and three indices ofclimatic seasonality: (1) intra-annual temperaturerange, (2) summer precipitation intensity, and (3)winter precipitation intensity. These indices werethen arrayed against detailed late Quaternary ar-tiodactyl abundance records in the BonnevilleBasin. These included a unique paleontologicalrecord of fecal pellet densities from HomesteadCave and archaeological records of artiodactylfaunal remains (i.e., an Artiodactyl Index) andlarge-game hunting tools from Hogup Cave. Eachof these artiodactyl abundance records showedsignificant correlations with the model-derivedseasonality indices and suggested that artiodactylsoccurred in low densities from the terminal Pleis-tocene through the middle Holocene, while sub-stantial increases occurred during equable, sum-mer-wet periods of the late Holocene. Althoughgeographic, site- and species-specific variability is
Broughton et al.] Prey BODy SiZe anD ranKinG in ZOOarcHaeOLOGy 411
AQ76(3)Broughton_Layout 1 7/5/11 2:43 PM Page 411
412 american antiquity [Vol. 76, no. 3, 2011
Table 2. Types and Numbers of Different Quantitative Indices used in Tests Involving Trends in Foraging Efficiency and Diet Breadth.
Quantitative Index Type
Body
Distant Fast-Slow Evenness/
SkeletalAge/SizeProcessing
Human
Location; Primary Site(s)
Size AIPatch AI
AI
RichnessPart Rep./Sex
Intensity
SkeletalClimateToolsTotal
Reference
S. Arizona; Ventana Cave
2-
--
3-
--
-3
8Bayham 1982, 2010
San Francisco Bay; Emeryville Shellmound
92
--
16
3-
3-
24Broughton 1995, 1999, 2004
Utah; multiple Sites
1-
--
3-
--
--
4Janetski 1997
France; Le Flageolet I
1-
-2
1-
1-
--
5Grayson and Delpech 1998
New Mexico; multiple sites
1-
--
22
--
2-
7Cannon 2000, 2003
Pacific Northwest; multiple sites
7-
-2
--
--
--
9Butler 2000;
Butler and Campbell 2004
S. New Zealand; Shag River Mouth
21
-7
90
9-
-1
29Nagaoka 2001, 2002a, 2005, 2006
Pacific Northwest; multiple sites
3-
--
--
--
--
3Lyman 2003a
Wyoming Basin
4-
--
-1
--
1-
6Byers and Smith 2007, Byers
et al. 2005, Smith et al. 2008
Great Basin; Hogup, Homestead Caves
1-
--
-1
--
61
9Broughton et al. 2008;
Byers and Hill 2009
Utah; Evans Mound, Median Village
11
--
-2
12-
1-
17Ugan 2005b
Canadian Arctic; multiple sites
6-
--
--
--
--
6Betts and Friesen 2006
Hawaii; Nu'alolo Kai
21
-6
--
--
--
9Morrison and Hunt 2007
NW Coast; Ozette, Moss Landing
1-
--
-2
--
--
3Etnier 2007
Mesoamerica; multiple sites
2-
--
--
--
--
2Emery 2007
France; Grotte XVI
1-
--
3-
--
--
4Faith 2007
Central California; Diablo Canyon
4-
22
11
--
-1
11Jones et al. 2008
Alaska; Sanak Islands sites
4-
--
-1
--
--
5Maschner et al. 2008
Levant; multiple sites
4-
2-
-1
--
--
7Stutz et al. 2009
Central California and SW New Mexico
5-
--
--
-4
-1
10Broughton et al. 2010
AQ76(3)Broughton_Layout 1 7/5/11 2:43 PM Page 412
anticipated and clearly exists (see detailed discus-sion in Broughton et al. 2008:1931–1932; Byersand Broughton 2004; see also Hockett 2005), 2 ar-chaeological vertebrate records from across west-ern North America showed very similar temporalpatterns in artiodactyl abundances, suggesting thatthe trend and its climate-based correlates may bea very general one. Insofar as artiodactyls represented high-return
prey types to ancient hunters in these settings,these trends should have caused substantialchanges in hunting efficiency and diet breadth.More specifically, it can be predicted that the lateHolocene spikes in artiodactyl densities should beassociated with higher overall hunting efficien-cies, and these should be reflected in multipleadditional lines of evidence. In this section, wesynthesize previous research bearing on Holocenetrends in Bonneville Basin foraging efficiencywith new tests applied to the Hogup Cave verte-brate fauna and with new data from the LittleBoulder Basin, located to the west of the Bon-neville Basin in northern Nevada.
Hogup Cave: Previous Research
The deep, well-stratified deposits of Hogup Cavehave been the focus of renewed interest in the ef-fect of climate change on trans-Holocene huntingpatterns in the Bonneville Basin (Broughton et al.2008; Byers and Broughton 2004; Byers and Hill2009; Hockett 2005; Figure 3). Hogup Cave is alimestone cavern located along the southern endof the Hogup Mountains. Sixteen stratigraphicunits were encountered during the excavation ofthe Hogup Cave sediments, which reached over4 m in depth (Aikens 1970). One-quarter-inchscreens were used to collect not only an enor-mous sample of artiodactyl bones and other fau-nal remains, but also an extensive record of per-ishable artifacts, including textiles, nets, andmoccasins (Aikens 1970; Durrant 1970; Par-malee 1970). Thirty-two 14C dates place the hu-man occupation of the cave between about 8,800and 480 years B.P.3 Although several of thesedates are out of stratigraphic order, as othershave noted (e.g., Grayson 1993; Madsen andBerry 1975; Mullen 1997), the Hogup Cave dates
Broughton et al.] Prey BODy SiZe anD ranKinG in ZOOarcHaeOLOGy 413
Figure 3. Map of the northeastern Great Basin showing locations of sites discussed in the text.
AQ76(3)Broughton_Layout 1 7/5/11 2:43 PM Page 413
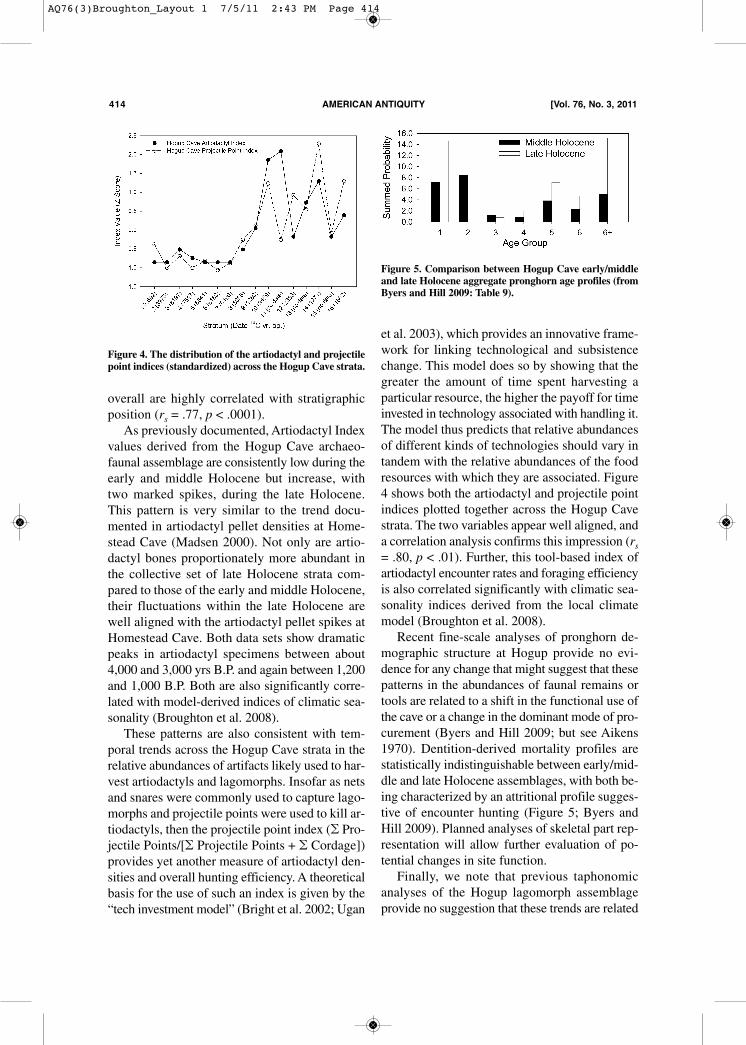
overall are highly correlated with stratigraphicposition (rs = .77, p < .0001).As previously documented, Artiodactyl Index
values derived from the Hogup Cave archaeo-faunal assemblage are consistently low during theearly and middle Holocene but increase, withtwo marked spikes, during the late Holocene.This pattern is very similar to the trend docu-mented in artiodactyl pellet densities at Home-stead Cave (Madsen 2000). Not only are artio-dactyl bones proportionately more abundant inthe collective set of late Holocene strata com-pared to those of the early and middle Holocene,their fluctuations within the late Holocene arewell aligned with the artiodactyl pellet spikes atHomestead Cave. Both data sets show dramaticpeaks in artiodactyl specimens between about4,000 and 3,000 yrs B.P. and again between 1,200and 1,000 B.P. Both are also significantly corre-lated with model-derived indices of climatic sea-sonality (Broughton et al. 2008). These patterns are also consistent with tem-
poral trends across the Hogup Cave strata in therelative abundances of artifacts likely used to har-vest artiodactyls and lagomorphs. Insofar as netsand snares were commonly used to capture lago-morphs and projectile points were used to kill ar-tiodactyls, then the projectile point index (� Pro-jectile Points/[� Projectile Points + � Cordage])provides yet another measure of artiodactyl den-sities and overall hunting efficiency. A theoreticalbasis for the use of such an index is given by the“tech investment model” (Bright et al. 2002; Ugan
et al. 2003), which provides an innovative frame-work for linking technological and subsistencechange. This model does so by showing that thegreater the amount of time spent harvesting aparticular resource, the higher the payoff for timeinvested in technology associated with handling it.The model thus predicts that relative abundancesof different kinds of technologies should vary intandem with the relative abundances of the foodresources with which they are associated. Figure4 shows both the artiodactyl and projectile pointindices plotted together across the Hogup Cavestrata. The two variables appear well aligned, anda correlation analysis confirms this impression (rs= .80, p < .01). Further, this tool-based index ofartiodactyl encounter rates and foraging efficiencyis also correlated significantly with climatic sea-sonality indices derived from the local climatemodel (Broughton et al. 2008). Recent fine-scale analyses of pronghorn de-
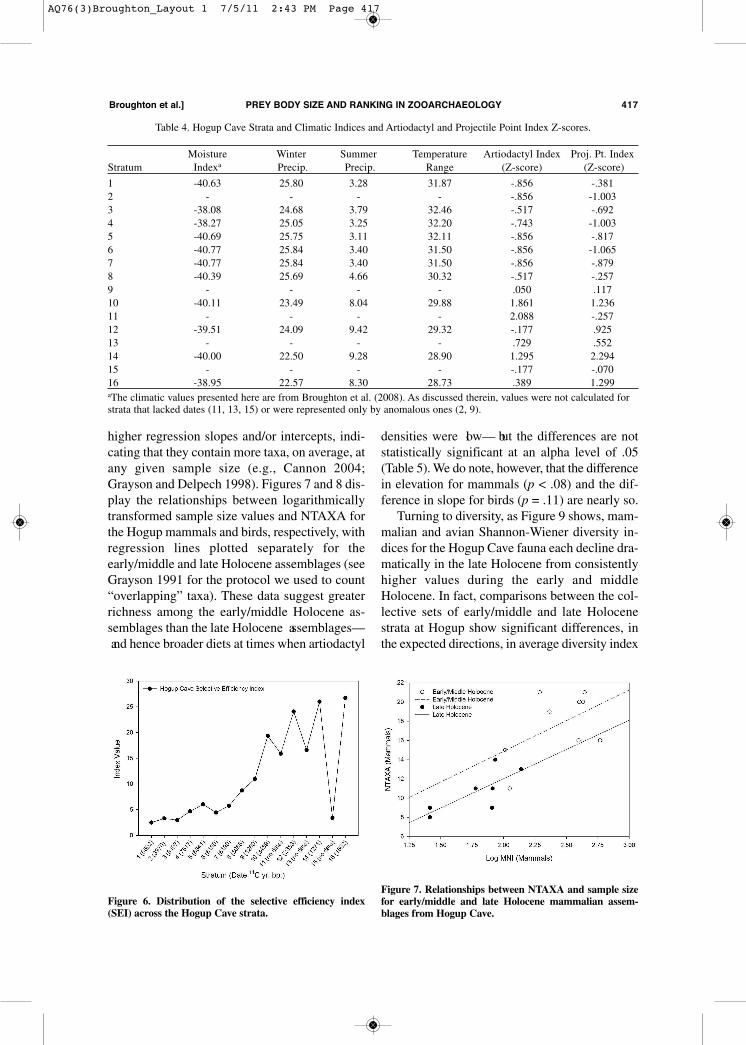
mographic structure at Hogup provide no evi-dence for any change that might suggest that thesepatterns in the abundances of faunal remains ortools are related to a shift in the functional use ofthe cave or a change in the dominant mode of pro-curement (Byers and Hill 2009; but see Aikens1970). Dentition-derived mortality profiles arestatistically indistinguishable between early/mid-dle and late Holocene assemblages, with both be-ing characterized by an attritional profile sugges-tive of encounter hunting (Figure 5; Byers andHill 2009). Planned analyses of skeletal part rep-resentation will allow further evaluation of po-tential changes in site function. Finally, we note that previous taphonomic
analyses of the Hogup lagomorph assemblageprovide no suggestion that these trends are related
414 american antiquity [Vol. 76, no. 3, 2011
Figure 4. The distribution of the artiodactyl and projectilepoint indices (standardized) across the Hogup Cave strata.
Figure 5. Comparison between Hogup Cave early/middleand late Holocene aggregate pronghorn age profiles (fromByers and Hill 2009: Table 9).
AQ76(3)Broughton_Layout 1 7/5/11 2:43 PM Page 414

to changes in the proportionate use of the cave bypeople and other agents. Most notably, no sig-nificant differences are evident in the relativefrequencies of raptor/carnivore marks comparedto human-induced damage (cut marks, burning)between the early/middle and late Holocene as-semblages (Byers and Broughton 2004; Hockett1993, 1994).
Hogup Cave: New Tests
To further test whether the trends previously doc-umented at Hogup Cave truly reflect changes inhunting efficiency and diet breadth, we apply sev-eral additional indices to the vertebrate faunafrom this site here. These include a selective ef-ficiency index that incorporates the entire assem-blage of identified mammals, rather than only ar-tiodactyls and lagomorphs, and taxonomicrichness and diversity indices applied to both themammal and avian collections from the site (Ta-bles 3 and 4). Although the trend in the Artiodactyl Index at
Hogup Cave is correlated in the expected direc-tions with indices of seasonality, a tool-basedmeasure of foraging efficiency, and the Home-stead Cave pellet record, it incorporates only theidentified artiodactyl and lagomorph specimensfrom the collection, and these taxa comprise only64 percent of the total mammalian MNI from thesite. More taxonomically comprehensive teststhus seem warranted, and one such approach is touse a version of Bayham’s (1982, 2010; Szuterand Bayham 1989) selective efficiency index(SEI). As adapted here, the SEI may be defined as:
SEI = (�MiEi )/�Mi
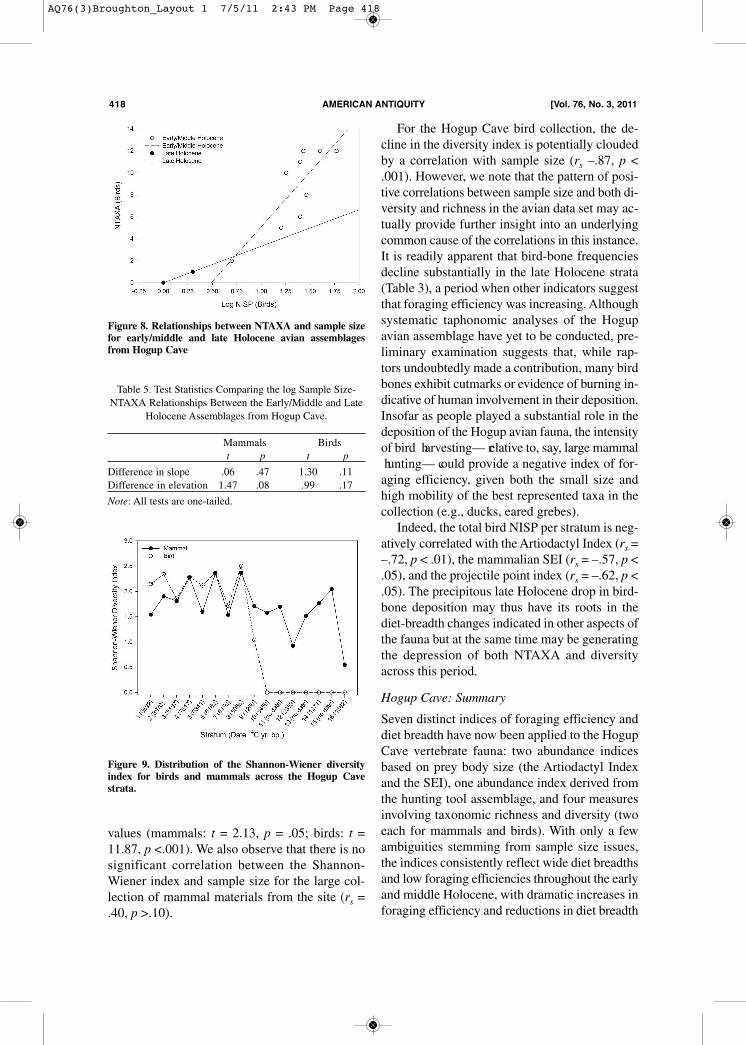
where Mi is an estimate of the relative abundanceof prey type i and Ei is an estimate of the weightin kg per individual of prey type i. In addition toartiodactyls and lagomorphs, values of this indexthus include the contributions of the variablyabundant rodents and carnivores in the sequenceand provide the aggregate mean weight of indi-vidual animals recovered from any given stra-tum. Insofar as body size is an appropriate mea-sure of prey rank in this setting, this index shouldbe low during the early and middle Holocenestrata and increase in tandem with other mea-sures during equable climatic periods of the lateHolocene. Figure 6 shows that it does just this.
Moreover, the SEI is significantly correlated withthe Artiodactyl Index (rs = .74, p < .01), the pro-jectile point index (rs = .79, p < .01), and thethree indices of climatic seasonality (winter pre-cipitation: rs = –.73, p < .05; temperature range:rs = –.86, p < .01; summer precipitation: rs = .73,p < .05), which, again, are hypothesized to be dri-ving the trends in artiodactyl densities and over-all hunting efficiency. Finally, we note that the SEIis uncorrelated with the underlying strata samplesizes in the Hogup collection (rs = –.34, p > .15),alleviating any concerns that might arise weresuch a correlation present (e.g., Grayson 1984). Taxonomic diversity and richness measures
can provide additional indices of diet breadth andforaging efficiency in archaeological faunas, es-pecially if used alongside other measures that di-rectly incorporate prey rank estimates. All else be-ing equal, faunas deposited by foragers with widediet breadths and low foraging efficiencies shouldbe represented by many prey types, with moreequal distributions of abundances across them(Grayson 1991; Grayson and Delpech 1998;Jones 2004; Nagaoka 2001; but see alsoBroughton and Grayson 1993). Conversely, incontexts characterized by high overall returns,hunters should focus disproportionately on only afew of the highest ranked prey. Thus, as has beenarticulated elsewhere, wide diet breadths shouldbe associated with high numbers of taxa(NTAXA) and high diversity values as measuredby measures such as the Shannon-Wiener index(H’ = -� pi log pi). We can therefore hypothesizethat the early/middle Holocene assemblages atHogup should be characterized by high NTAXAand Shannon-Wiener diversity values, while thosefor the late Holocene samples should be charac-terized by low values of these measures. Since NTAXA is widely known to be highly
dependent on sample size, measured either as to-tal MNI or total NISP (e.g., Grayson 1984, 1991),sample size must be taken into account when as-sessing variation in richness across the Holocenedeposits at Hogup Cave. The approach that wetake here to doing this is to compare regressionsof NTAXA on sample size for sets of assem-blages that are hypothesized to differ in richness(i.e., to test for differences in richness throughanalysis of covariance). Assemblages that aresampling broader underlying diets should exhibit
Broughton et al.] Prey BODy SiZe anD ranKinG in ZOOarcHaeOLOGy 415
AQ76(3)Broughton_Layout 1 7/5/11 2:43 PM Page 415

416 american antiquity [Vol. 76, no. 3, 2011
Table 3. Hogup Cave 14C Dates and Corresponding Faunal and Climatic Indices.
Artiodactyl
Projectile
Shannon-Wiener
NTAXA
MNI
Shannon-Wiener
NISP
NTAXA
Stratum
Datea
Indexb
Point Index
Index (Mammals)
(Mammals)
(Mammals)
Periodc
(Bird)d
(Bird)
(Bird)
SEI
16692
.04
.20
1.541
15102
emh
2.146
5812
2.48
23970
.04
.10
1.901
11111
emh
2.340
2411
3.29
38197
.07
.15
1.811
19231
emh
1.856
246
2.96
47515
.05
.10
2.274
16394
emh
2.289
3912
4.68
56841
.04
.13
1.595
20428
emh
2.115
288
6.01
66180
.04
.09
2.356
16585
emh
2.364
1710
4.44
76190
.04
.12
1.537
20399
emh
1.714
155
5.75
85086
.07
.22
2.364
21441
emh
2.505
2612
8.73
91260
.12
.28
1.710
21193
emh
1.040
42
10.97
103459
.28
.46
1.577
980
lh.000
11
19.34
11-
.30
.22
1.693
825
lh.000
00
15.88
122353
.10
.41
.924
13137
lh-
11
24.07
13-
.18
.35
1.512
1181
lh.000
11
16.62
141271
.23
.63
1.764
1485
lh.000
11
25.99
15-
.10
.25
2.043
925
lh-
00
3.39
161562
.15
.47
.548
1159
lh.000
11
26.73
a The dates for strata with multiple radiocarbon determinations are pooled mean dates calculated using Calib 5.1.0 software (Stuiver and Reimer 2005). For strata with more than three
assays, dates in excess of one standard deviation from the mean date were omitted prior to calculating the pooled mean.
b Raw data for mammalian abundance indices from Durrant (1970).
c emh = early/middle Holocene; lh = late Holocene.
d Raw data for avian abundance indices from Parmalee (1970).
AQ76(3)Broughton_Layout 1 7/5/11 2:43 PM Page 416
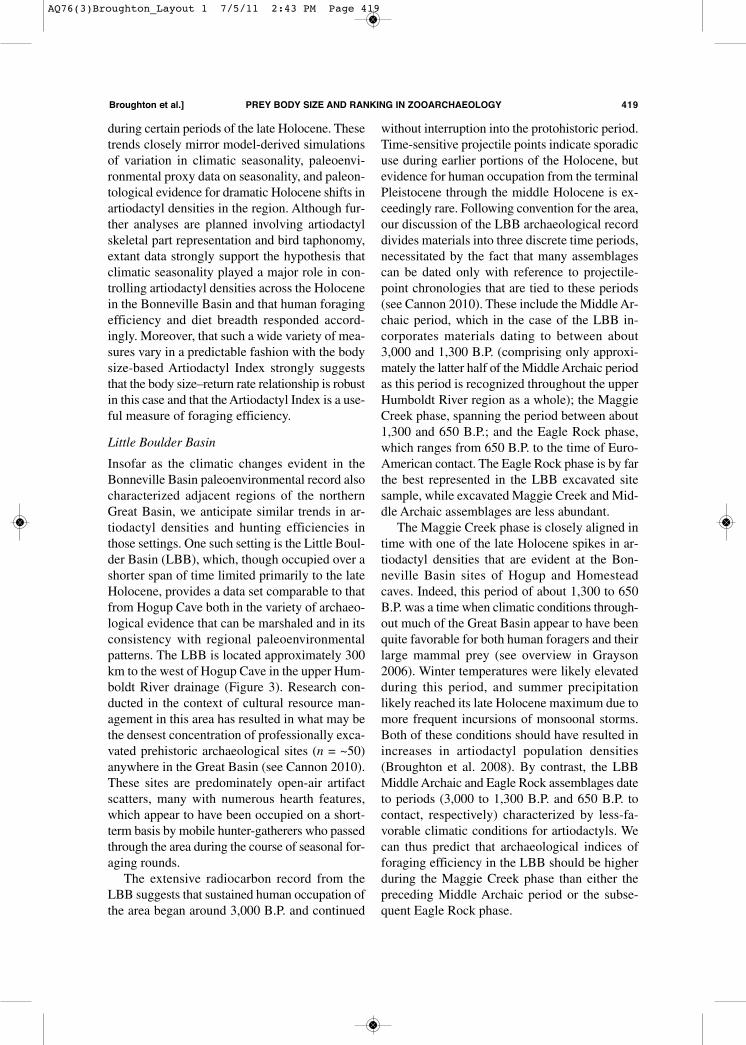
higher regression slopes and/or intercepts, indi-cating that they contain more taxa, on average, atany given sample size (e.g., Cannon 2004;Grayson and Delpech 1998). Figures 7 and 8 dis-play the relationships between logarithmicallytransformed sample size values and NTAXA forthe Hogup mammals and birds, respectively, withregression lines plotted separately for theearly/middle and late Holocene assemblages (seeGrayson 1991 for the protocol we used to count“overlapping” taxa). These data suggest greaterrichness among the early/middle Holocene as-semblages than the late Holocene assemblages— and hence broader diets at times when artiodactyl
densities were low— but the differences are notstatistically significant at an alpha level of .05(Table 5). We do note, however, that the differencein elevation for mammals (p < .08) and the dif-ference in slope for birds (p = .11) are nearly so. Turning to diversity, as Figure 9 shows, mam-
malian and avian Shannon-Wiener diversity in-dices for the Hogup Cave fauna each decline dra-matically in the late Holocene from consistentlyhigher values during the early and middleHolocene. In fact, comparisons between the col-lective sets of early/middle and late Holocenestrata at Hogup show significant differences, inthe expected directions, in average diversity index
Broughton et al.] Prey BODy SiZe anD ranKinG in ZOOarcHaeOLOGy 417
Table 4. Hogup Cave Strata and Climatic Indices and Artiodactyl and Projectile Point Index Z-scores.
Moisture Winter Summer Temperature Artiodactyl Index Proj. Pt. IndexStratum Indexa Precip. Precip. Range (Z-score) (Z-score)
1 -40.63 25.80 3.28 31.87 -.856 -.3812 - - - - -.856 -1.0033 -38.08 24.68 3.79 32.46 -.517 -.6924 -38.27 25.05 3.25 32.20 -.743 -1.0035 -40.69 25.75 3.11 32.11 -.856 -.8176 -40.77 25.84 3.40 31.50 -.856 -1.0657 -40.77 25.84 3.40 31.50 -.856 -.8798 -40.39 25.69 4.66 30.32 -.517 -.2579 - - - - .050 .11710 -40.11 23.49 8.04 29.88 1.861 1.23611 - - - - 2.088 -.25712 -39.51 24.09 9.42 29.32 -.177 .92513 - - - - .729 .55214 -40.00 22.50 9.28 28.90 1.295 2.29415 - - - - -.177 -.07016 -38.95 22.57 8.30 28.73 .389 1.299aThe climatic values presented here are from Broughton et al. (2008). As discussed therein, values were not calculated forstrata that lacked dates (11, 13, 15) or were represented only by anomalous ones (2, 9).
Figure 6. Distribution of the selective efficiency index(SEI) across the Hogup Cave strata.
Figure 7. Relationships between NTAXA and sample sizefor early/middle and late Holocene mammalian assem-blages from Hogup Cave.
AQ76(3)Broughton_Layout 1 7/5/11 2:43 PM Page 417
values (mammals: t = 2.13, p = .05; birds: t =11.87, p <.001). We also observe that there is nosignificant correlation between the Shannon-Wiener index and sample size for the large col-lection of mammal materials from the site (rs =.40, p >.10).
For the Hogup Cave bird collection, the de-cline in the diversity index is potentially cloudedby a correlation with sample size (rs –.87, p <.001). However, we note that the pattern of posi-tive correlations between sample size and both di-versity and richness in the avian data set may ac-tually provide further insight into an underlyingcommon cause of the correlations in this instance.It is readily apparent that bird-bone frequenciesdecline substantially in the late Holocene strata(Table 3), a period when other indicators suggestthat foraging efficiency was increasing. Althoughsystematic taphonomic analyses of the Hogupavian assemblage have yet to be conducted, pre-liminary examination suggests that, while rap-tors undoubtedly made a contribution, many birdbones exhibit cutmarks or evidence of burning in-dicative of human involvement in their deposition.Insofar as people played a substantial role in thedeposition of the Hogup avian fauna, the intensityof bird harvesting— relative to, say, large mammal hunting— could provide a negative index of for-aging efficiency, given both the small size andhigh mobility of the best represented taxa in thecollection (e.g., ducks, eared grebes). Indeed, the total bird NISP per stratum is neg-
atively correlated with the Artiodactyl Index (rs =–.72, p < .01), the mammalian SEI (rs = –.57, p <.05), and the projectile point index (rs = –.62, p <.05). The precipitous late Holocene drop in bird-bone deposition may thus have its roots in thediet-breadth changes indicated in other aspects ofthe fauna but at the same time may be generatingthe depression of both NTAXA and diversityacross this period.
Hogup Cave: Summary
Seven distinct indices of foraging efficiency anddiet breadth have now been applied to the HogupCave vertebrate fauna: two abundance indicesbased on prey body size (the Artiodactyl Indexand the SEI), one abundance index derived fromthe hunting tool assemblage, and four measuresinvolving taxonomic richness and diversity (twoeach for mammals and birds). With only a fewambiguities stemming from sample size issues,the indices consistently reflect wide diet breadthsand low foraging efficiencies throughout the earlyand middle Holocene, with dramatic increases inforaging efficiency and reductions in diet breadth
418 american antiquity [Vol. 76, no. 3, 2011
Figure 8. Relationships between NTAXA and sample sizefor early/middle and late Holocene avian assemblagesfrom Hogup Cave
Table 5. Test Statistics Comparing the log Sample Size-NTAXA Relationships Between the Early/Middle and Late
Holocene Assemblages from Hogup Cave.
Mammals Birdst p t p
Difference in slope .06 .47 1.30 .11Difference in elevation 1.47 .08 .99 .17
Note: All tests are one-tailed.
Figure 9. Distribution of the Shannon-Wiener diversityindex for birds and mammals across the Hogup Cavestrata.
AQ76(3)Broughton_Layout 1 7/5/11 2:43 PM Page 418
during certain periods of the late Holocene. Thesetrends closely mirror model-derived simulationsof variation in climatic seasonality, paleoenvi-ronmental proxy data on seasonality, and paleon-tological evidence for dramatic Holocene shifts inartiodactyl densities in the region. Although fur-ther analyses are planned involving artiodactylskeletal part representation and bird taphonomy,extant data strongly support the hypothesis thatclimatic seasonality played a major role in con-trolling artiodactyl densities across the Holocenein the Bonneville Basin and that human foragingefficiency and diet breadth responded accord-ingly. Moreover, that such a wide variety of mea-sures vary in a predictable fashion with the bodysize-based Artiodactyl Index strongly suggeststhat the body size–return rate relationship is robustin this case and that the Artiodactyl Index is a use-ful measure of foraging efficiency.
Little Boulder Basin
Insofar as the climatic changes evident in theBonneville Basin paleoenvironmental record alsocharacterized adjacent regions of the northernGreat Basin, we anticipate similar trends in ar-tiodactyl densities and hunting efficiencies inthose settings. One such setting is the Little Boul-der Basin (LBB), which, though occupied over ashorter span of time limited primarily to the lateHolocene, provides a data set comparable to thatfrom Hogup Cave both in the variety of archaeo-logical evidence that can be marshaled and in itsconsistency with regional paleoenvironmentalpatterns. The LBB is located approximately 300km to the west of Hogup Cave in the upper Hum-boldt River drainage (Figure 3). Research con-ducted in the context of cultural resource man-agement in this area has resulted in what may bethe densest concentration of professionally exca-vated prehistoric archaeological sites (n = ~50)anywhere in the Great Basin (see Cannon 2010).These sites are predominately open-air artifactscatters, many with numerous hearth features,which appear to have been occupied on a short-term basis by mobile hunter-gatherers who passedthrough the area during the course of seasonal for-aging rounds.The extensive radiocarbon record from the
LBB suggests that sustained human occupation ofthe area began around 3,000 B.P. and continued
without interruption into the protohistoric period.Time-sensitive projectile points indicate sporadicuse during earlier portions of the Holocene, butevidence for human occupation from the terminalPleistocene through the middle Holocene is ex-ceedingly rare. Following convention for the area,our discussion of the LBB archaeological recorddivides materials into three discrete time periods,necessitated by the fact that many assemblagescan be dated only with reference to projectile-point chronologies that are tied to these periods(see Cannon 2010). These include the Middle Ar-chaic period, which in the case of the LBB in-corporates materials dating to between about3,000 and 1,300 B.P. (comprising only approxi-mately the latter half of the Middle Archaic periodas this period is recognized throughout the upperHumboldt River region as a whole); the MaggieCreek phase, spanning the period between about1,300 and 650 B.P.; and the Eagle Rock phase,which ranges from 650 B.P. to the time of Euro-American contact. The Eagle Rock phase is by farthe best represented in the LBB excavated sitesample, while excavated Maggie Creek and Mid-dle Archaic assemblages are less abundant.The Maggie Creek phase is closely aligned in
time with one of the late Holocene spikes in ar-tiodactyl densities that are evident at the Bon-neville Basin sites of Hogup and Homesteadcaves. Indeed, this period of about 1,300 to 650B.P. was a time when climatic conditions through-out much of the Great Basin appear to have beenquite favorable for both human foragers and theirlarge mammal prey (see overview in Grayson2006). Winter temperatures were likely elevatedduring this period, and summer precipitationlikely reached its late Holocene maximum due tomore frequent incursions of monsoonal storms.Both of these conditions should have resulted inincreases in artiodactyl population densities(Broughton et al. 2008). By contrast, the LBBMiddle Archaic and Eagle Rock assemblages dateto periods (3,000 to 1,300 B.P. and 650 B.P. tocontact, respectively) characterized by less-fa-vorable climatic conditions for artiodactyls. Wecan thus predict that archaeological indices offoraging efficiency in the LBB should be higherduring the Maggie Creek phase than either thepreceding Middle Archaic period or the subse-quent Eagle Rock phase.
Broughton et al.] Prey BODy SiZe anD ranKinG in ZOOarcHaeOLOGy 419
AQ76(3)Broughton_Layout 1 7/5/11 2:43 PM Page 419
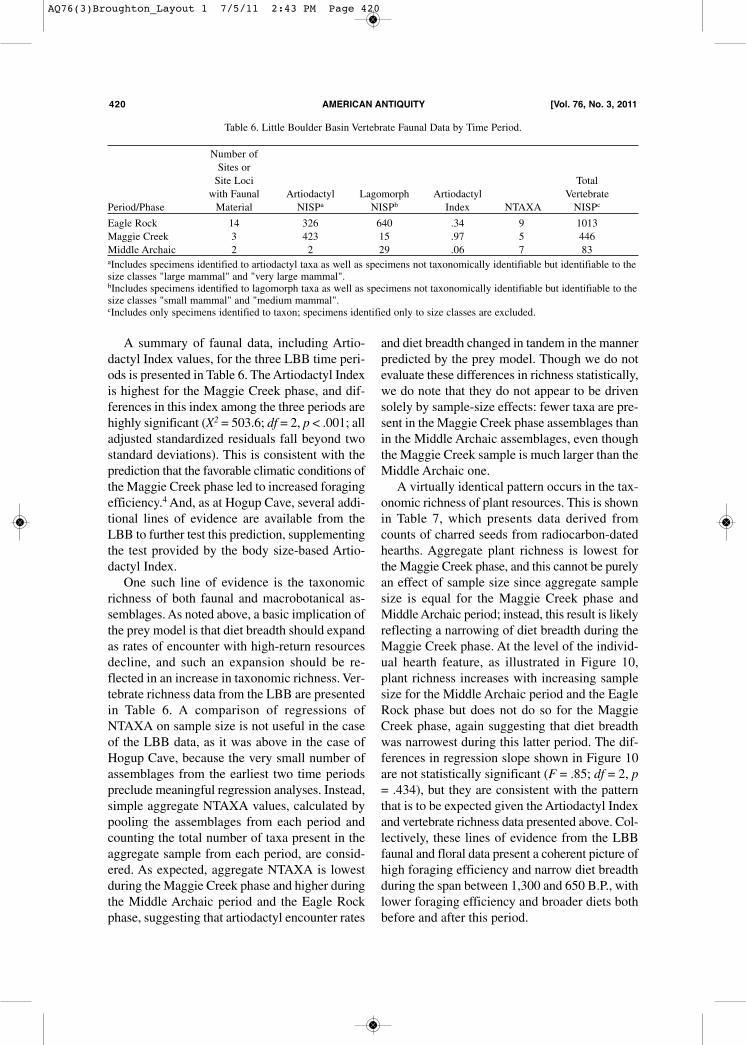
A summary of faunal data, including Artio-dactyl Index values, for the three LBB time peri-ods is presented in Table 6. The Artiodactyl Indexis highest for the Maggie Creek phase, and dif-ferences in this index among the three periods arehighly significant (X2 = 503.6; df = 2, p < .001; alladjusted standardized residuals fall beyond twostandard deviations). This is consistent with theprediction that the favorable climatic conditions ofthe Maggie Creek phase led to increased foragingefficiency.4 And, as at Hogup Cave, several addi-tional lines of evidence are available from theLBB to further test this prediction, supplementingthe test provided by the body size-based Artio-dactyl Index.One such line of evidence is the taxonomic
richness of both faunal and macrobotanical as-semblages. As noted above, a basic implication ofthe prey model is that diet breadth should expandas rates of encounter with high-return resourcesdecline, and such an expansion should be re-flected in an increase in taxonomic richness. Ver-tebrate richness data from the LBB are presentedin Table 6. A comparison of regressions ofNTAXA on sample size is not useful in the caseof the LBB data, as it was above in the case ofHogup Cave, because the very small number ofassemblages from the earliest two time periodspreclude meaningful regression analyses. Instead,simple aggregate NTAXA values, calculated bypooling the assemblages from each period andcounting the total number of taxa present in theaggregate sample from each period, are consid-ered. As expected, aggregate NTAXA is lowestduring the Maggie Creek phase and higher duringthe Middle Archaic period and the Eagle Rockphase, suggesting that artiodactyl encounter rates
and diet breadth changed in tandem in the mannerpredicted by the prey model. Though we do notevaluate these differences in richness statistically,we do note that they do not appear to be drivensolely by sample-size effects: fewer taxa are pre-sent in the Maggie Creek phase assemblages thanin the Middle Archaic assemblages, even thoughthe Maggie Creek sample is much larger than theMiddle Archaic one.A virtually identical pattern occurs in the tax-
onomic richness of plant resources. This is shownin Table 7, which presents data derived fromcounts of charred seeds from radiocarbon-datedhearths. Aggregate plant richness is lowest forthe Maggie Creek phase, and this cannot be purelyan effect of sample size since aggregate samplesize is equal for the Maggie Creek phase andMiddle Archaic period; instead, this result is likelyreflecting a narrowing of diet breadth during theMaggie Creek phase. At the level of the individ-ual hearth feature, as illustrated in Figure 10,plant richness increases with increasing samplesize for the Middle Archaic period and the EagleRock phase but does not do so for the MaggieCreek phase, again suggesting that diet breadthwas narrowest during this latter period. The dif-ferences in regression slope shown in Figure 10are not statistically significant (F = .85; df = 2, p= .434), but they are consistent with the patternthat is to be expected given the Artiodactyl Indexand vertebrate richness data presented above. Col-lectively, these lines of evidence from the LBBfaunal and floral data present a coherent picture ofhigh foraging efficiency and narrow diet breadthduring the span between 1,300 and 650 B.P., withlower foraging efficiency and broader diets bothbefore and after this period.
420 american antiquity [Vol. 76, no. 3, 2011
Table 6. Little Boulder Basin Vertebrate Faunal Data by Time Period.
Number ofSites orSite Loci Totalwith Faunal Artiodactyl Lagomorph Artiodactyl Vertebrate
Period/Phase Material NISPa NISPb Index NTAXA NISPc
Eagle Rock 14 326 640 .34 9 1013Maggie Creek 3 423 15 .97 5 446Middle Archaic 2 2 29 .06 7 83aIncludes specimens identified to artiodactyl taxa as well as specimens not taxonomically identifiable but identifiable to thesize classes "large mammal" and "very large mammal".bIncludes specimens identified to lagomorph taxa as well as specimens not taxonomically identifiable but identifiable to thesize classes "small mammal" and "medium mammal".cIncludes only specimens identified to taxon; specimens identified only to size classes are excluded.
AQ76(3)Broughton_Layout 1 7/5/11 2:43 PM Page 420

Several lines of artifactual evidence from theLBB add further detail to this picture. One comesfrom projectile points. At Hogup Cave, an indexmeasuring the abundance of projectile points rel-ative to cordage closely tracks the Artiodactyl In-dex, a pattern that is entirely predictable in lightof the “tech investment model.” A similar indexcannot be calculated for the LBB because per-ishable materials such as cordage are generallyabsent at the open sites that comprise the archae-ological record of this area. However, the relativeimportance of projectile points among time peri-ods can be measured by normalizing the numberof temporally diagnostic projectile points recov-ered from LBB excavated sites by the amount oftime spanned by the period of which they are di-agnostic (Table 8; see Cannon 2010). In normal-izing the projectile point counts, calibrated cal-endar years are used rather than uncalibratedradiocarbon years (see Cannon 2010 for cali-brated dates), and spans of 600 calendar years areused for the Maggie Creek and Eagle Rockphases, while a span of 1,900 calendar years isused for the Middle Archaic period. Both the ab-solute number of recovered projectile points andthe number of points per calendar year are far
higher for the Maggie Creek phase than for thepreceding and following periods. This pattern inthe abundance of hunting tools exactly mirrors thepattern that occurs in the LBB Artiodactyl Index(Figure 11), providing further support for theproposition that late Holocene LBB hunter-gath-erers experienced the highest artiodactyl en-counter rates and highest foraging efficiency dur-ing the Maggie Creek phase.Whereas projectile points likely comprised an
important component of large mammal huntingtechnology, grinding stones surely played a keyrole in the processing of low-return plant foods.Thus, as predicted by the “tech investment model”and as demonstrated to some extent previously inthe LBB (Bright et al. 2002), measures of the de-gree of investment in grinding stone technologyshould vary inversely with the Artiodactyl Index.
Broughton et al.] Prey BODy SiZe anD ranKinG in ZOOarcHaeOLOGy 421
Table 7. Little Boulder Basin Macrobotanical Data by Time Period.
Number ofRadiocarbon-datedFeatures with Total Number ofMacrobotanical Macrobotanical
Period/Phase Material NTAXA Specimens
Eagle Rock 38 16 352Maggie Creek 9 5 56Middle Archaic 14 8 56
Figure 10. Relationships between macrobotanical richnessand sample size for each LBB time period.
Figure 11. Comparison of LBB time-normalized projectilepoint frequencies and Artiodactyl Index values (standard-ized).
Table 8. Little Boulder Basin Projectile Point Counts by Time Period.
Number of Temporally Number ofDiagnostic Projectile ProjectilePoints Reported from Points per
Period/Phase Excavated Sites Calendar Year
Eagle Rock 207 .35Maggie Creek 618 1.03Middle Archaic 305 .16Note: Counts of Elko series points, which were likely usedduring both the Middle Archaic period and the Maggie Creekphase, are split evenly between these two time periods.
AQ76(3)Broughton_Layout 1 7/5/11 2:43 PM Page 421
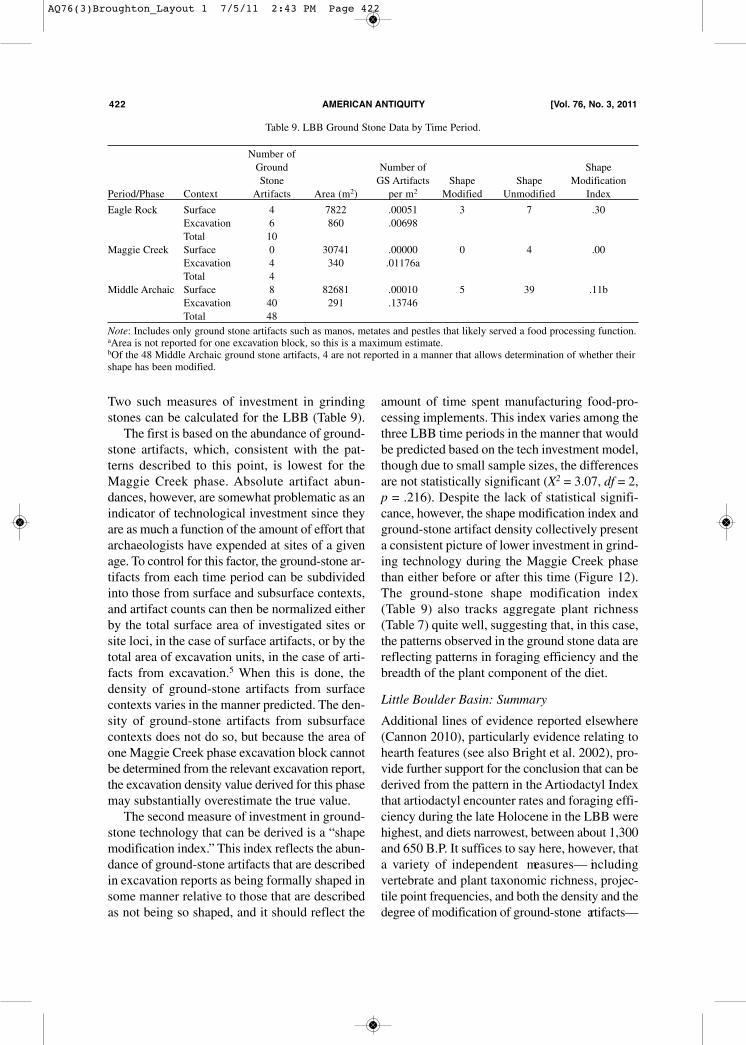
Two such measures of investment in grindingstones can be calculated for the LBB (Table 9).The first is based on the abundance of ground-
stone artifacts, which, consistent with the pat-terns described to this point, is lowest for theMaggie Creek phase. Absolute artifact abun-dances, however, are somewhat problematic as anindicator of technological investment since theyare as much a function of the amount of effort thatarchaeologists have expended at sites of a givenage. To control for this factor, the ground-stone ar-tifacts from each time period can be subdividedinto those from surface and subsurface contexts,and artifact counts can then be normalized eitherby the total surface area of investigated sites orsite loci, in the case of surface artifacts, or by thetotal area of excavation units, in the case of arti-facts from excavation.5 When this is done, thedensity of ground-stone artifacts from surfacecontexts varies in the manner predicted. The den-sity of ground-stone artifacts from subsurfacecontexts does not do so, but because the area ofone Maggie Creek phase excavation block cannotbe determined from the relevant excavation report,the excavation density value derived for this phasemay substantially overestimate the true value.The second measure of investment in ground-
stone technology that can be derived is a “shapemodification index.” This index reflects the abun-dance of ground-stone artifacts that are describedin excavation reports as being formally shaped insome manner relative to those that are describedas not being so shaped, and it should reflect the
amount of time spent manufacturing food-pro-cessing implements. This index varies among thethree LBB time periods in the manner that wouldbe predicted based on the tech investment model,though due to small sample sizes, the differencesare not statistically significant (X2 = 3.07, df = 2,p = .216). Despite the lack of statistical signifi-cance, however, the shape modification index andground-stone artifact density collectively presenta consistent picture of lower investment in grind-ing technology during the Maggie Creek phasethan either before or after this time (Figure 12).The ground-stone shape modification index(Table 9) also tracks aggregate plant richness(Table 7) quite well, suggesting that, in this case,the patterns observed in the ground stone data arereflecting patterns in foraging efficiency and thebreadth of the plant component of the diet.
Little Boulder Basin: Summary
Additional lines of evidence reported elsewhere(Cannon 2010), particularly evidence relating tohearth features (see also Bright et al. 2002), pro-vide further support for the conclusion that can bederived from the pattern in the Artiodactyl Indexthat artiodactyl encounter rates and foraging effi-ciency during the late Holocene in the LBB werehighest, and diets narrowest, between about 1,300and 650 B.P. It suffices to say here, however, thata variety of independent measures— includingvertebrate and plant taxonomic richness, projec-tile point frequencies, and both the density and thedegree of modification of ground-stone artifacts—
422 american antiquity [Vol. 76, no. 3, 2011
Table 9. LBB Ground Stone Data by Time Period.
Number ofGround Number of ShapeStone GS Artifacts Shape Shape Modification
Period/Phase Context Artifacts Area (m2) per m2 Modified Unmodified Index
Eagle Rock Surface 4 7822 .00051 3 7 .30Excavation 6 860 .00698Total 10
Maggie Creek Surface 0 30741 .00000 0 4 .00Excavation 4 340 .01176aTotal 4
Middle Archaic Surface 8 82681 .00010 5 39 .11bExcavation 40 291 .13746Total 48
Note: Includes only ground stone artifacts such as manos, metates and pestles that likely served a food processing function.aArea is not reported for one excavation block, so this is a maximum estimate.bOf the 48 Middle Archaic ground stone artifacts, 4 are not reported in a manner that allows determination of whether theirshape has been modified.
AQ76(3)Broughton_Layout 1 7/5/11 2:43 PM Page 422

are all consistent with this conclusion. Thus, aswith the Hogup Cave example, this case high-lights the usefulness of a body size-based abun-dance index like the Artiodactyl Index as part ofa comprehensive effort to track changes in forag-ing efficiency and important related behavioralvariables. The degree of consistency among all ofthe various lines of evidence considered in bothexamples also strongly suggests that the bodysize-based Artiodactyl Index is a useful indicatorof changes in prehistoric foraging efficiency,which in this case appears to be tightly linked toclimatic variability.
Conclusion
The use of foraging theory to address issues relatedto prehistoric foraging efficiency and diet breadthrepresents one of the more prolific areas of the ap-plication of evolutionary ecology in archaeology.The success of this approach has been enabled bythe derivation of proxy measures of key model pa-rameters, a requirement in archaeological appli-cations. One of the most widely applied such prox-ies has been the use of body size as a measure ofprey rank, and research drawing on the foundationprovided by this proxy has had far-reaching im-plications for our understanding of many otheraspects of human behavior and evolution. The use of the body-size proxy continues to be
supported by the available ethnographic and ex-perimentally derived return-rate data, informa-tion that we have summarized here. These data
uniformly show significant positive correlationsbetween prey size and post-encounter return rate,with just a couple of exceptions that occur incases where only a narrow range of smaller-sizedprey are considered. Yet, as with all assumptionsthat are incorporated into the application of anyforaging model, we emphasize that the bodysize–return rate rule of thumb should always betreated as a hypothesis to be tested rather than asan absolute or invariant claim about past humanforaging behavior and prey choice. And becausedeviations from the general body size–return raterelationship certainly do occur, potential devia-tions must be considered on a case-by-case basis.In this regard, we note that there are many exam-ples of archaeological applications of foragingtheory in which considerable attention has beendevoted to such potential deviations (e.g.,Broughton 2004; Stiner et al. 2000; Ugan 2005a),and we also emphasize that our understanding ofthe variables influencing them continues to beenhanced by detailed analyses of contemporaryforagers (e.g., Bird et al. 2009). For artiodactyls and lagomorphs, taxa of par-
ticular importance in North American archaeo-faunas, the available data show them to exhibitdramatically significant differences in return rates— even in data sets incorporating the costs offailed pursuits. Further, modeling presented heresuggests that it is highly unlikely that pursuitsuccess for lagomorphs could ever have beengreater than that for artiodactyls to the extentthat this might have offset the difference in returnrate associated with the difference in body sizebetween the two orders. Previous archaeologicalapplications that have used the body size–returnrate rule of thumb for these taxa are thus partic-ularly well supported.Finally, we also emphasize that most of the de-
tailed analyses of archaeofaunal variability thathave used the body size–return rate relationship— operationalized through an abundance index orsimilar measures— have not relied on this rela-tionship alone. Instead, these studies have em-ployed multiple lines of evidence, including rich-ness and diversity indices, body-part representation,age structure, and measures of technological in-vestment. Our analyses of archaeological faunal,floral, and tool assemblages from the Bonnevilleand Little Boulder basins represent examples of
Broughton et al.] Prey BODy SiZe anD ranKinG in ZOOarcHaeOLOGy 423
Figure 12. Density of LBB ground stone artifacts from sur-face contexts and ground stone shape modification index(standardized) by time period.
AQ76(3)Broughton_Layout 1 7/5/11 2:43 PM Page 423
this kind of approach. In each of these analyses wehave employed at least half a dozen diet-breadth in-dices, each of which behaves as predicted from aconsideration of paleoclimatic data from the north-eastern Great Basin. In turn, the fact that such a di-verse array of archaeological variables vary in tan-dem both with each other and with paleoclimaticvariables strongly suggests that overall patterns inthe archaeological record are reflecting climati-cally driven variability in foraging efficiency anddiet breadth. Perhaps more important for purposesof this paper, the fact that the conclusions that canbe derived from a body-size-based abundance in-dex are so consistent with conclusions derivedfrom so many other lines of evidence attests to therobustness of the body size–return rate relationship.Moreover, because the body size of a prey item isone of the few invariant referent properties of preyselection in archaeological contexts, this attributeand its relationship to prey rank can now evenmore confidently be used and employed to maxi-mize the inferential potential of any prehistoricdata set. We therefore conclude that, when used ju-diciously as one component of broader archaeo-logical analyses geared towards testing hypothesesderived from foraging theory, the body-size proxyfor prey rank must be considered more reliablethan tenuous, and more robust rather than fragile.
Acknowledgments. We thank Andrew Ugan, Lisa Nagaoka,Douglas Bird, Brian Codding and two anonymous reviewersfor helpful comments on the manuscript. We also thank BillFawcett of the U.S. Bureau of Land Management, Elko Dis-trict, Tuscarora Field Office, for his insights into and supportof the Little Boulder Basin research reported here.
References Cited
Aikens, C. Melvin1970 Hogup Cave. University of Utah Anthropological Pa-pers 93. University of Utah Press, Salt Lake City.
Alvard, Michael1993 Testing the “Ecologically Noble Savage” Hypothesis:Interspecific Prey Choice by Piro Hunters of AmazonianPeru. Human Ecology 21:355–387.
Bartelink, Eric, J.2006 Resource Intensification in Pre-Contact Central Cal-ifornia: A Bioarchaeological Perspective on Diet and HealthPatterns among Hunter-Gatherers from the Lower Sacra-mento Valley and San Francisco Bay. Ph. D. Dissertation,Department of Anthropology, Texas A & M University, Col-lege Station, Texas. University Microfilms, Ann Arbor.
Bayham, Frank. E.1977 Analysis of Faunal Remains and Animal Exploitationin Copper Basin. In Archaeology in Copper Basin, Yava-pai County, Arizona: Model Building for the Prehistory of
the Prescott Region, edited by Marvin D. Jeter, pp.339–367. Anthropological Research paper No. 11. ArizonaState University, Tempe, Arizona.
1979 Factors Influencing the Archaic Pattern of Animal Uti-lization. Kiva 44:219–235.
1982 A Diachronic Analysis of Prehistoric Animal Ex-ploitation at Ventana Cave. Ph. D. Dissertation. Departmentof Anthropology, Arizona State University, Tempe, Arizona.University Microfilms, Ann Arbor.
1986 Middle Archaic Animal Utilization in South CentralArizona. In Prehistoric Hunter Gatherers of South CentralArizona: The Picacho Reservoir Archaic Project, edited byFrank E. Bayham, D. H. Morris, and M. S. Shackley, pp.315–340. Arizona State University Anthropological FieldStudies 13. Tempe, Arizona.
2010 Effects of a Sedentary Lifestyle on the Utilization ofAnimals in the Prehistoric Southwest. In Evolutionary Ecol-ogy and Archaeology: Applications to Problems in HumanEvolution and Prehistory, edited by Jack M. Broughton andMichael D. Cannon, pp. 159–171. University of Utah Press,Salt Lake City,
Beaton, John, M. 1973 The Nature of Aboriginal Exploitation of Mollusk Pop-ulations in Southern California. Master’s thesis, Departmentof Anthropology, University of California, Los Angeles.
Beck, R. Kelly2010 The Molecular Genetics of Prey Choice: Using AncientDNA to Infer Prehistoric Population Histories. CaliforniaArchaeology 1:253–268.
Betts, Matthew W., and T. Max Friesen2006 Declining Foraging Returns from an Inexhaustible Re-source? Abundance Indices and Beluga Whaling in the West-ern Canadian Arctic. Journal of Anthropological Archae-ology 25:59–81.
Bird, Douglas W., Rebecca Bliege Bird, and Brian F. Codding2009 In Pursuit of Mobile Prey: Martu Hunting Strategiesand Archaeofaunal Interpretation. American Antiquity74:3–30.
Bird, Douglas W., and James F. O’Connell2006 Behavioral Ecology and Archaeology. Journal of Ar-chaeological Research 14:143–188.
Bright, Jason, Andrew Ugan, and Lori Hunsaker2002 The Effect of Handling Time on Subsistence Tech-nology. World Archaeology 34:164–181.
Broughton, Jack, M. 1994a Late Holocene Resource Intensification in the Sacra-mento Valley, California: The Vertebrate Evidence. Jour-nal of Archaeological Science 21:501–514.
1994b Declines in Mammalian Foraging Efficiency Duringthe Late Holocene, San Francisco Bay. Journal of An-thropological Archaeology 13:371–401.
1995 Resource Depression and Intensification During theLate Holocene, San Francisco Bay: Evidence from theEmeryville Shellmound Vertebrate Fauna. Ph. D. Disser-tation, Department of Anthropology, University of Wash-ington. University Microfilms, Ann Arbor.
1999 Resource Depression and Intensification during the LateHolocene, San Francisco Bay: Evidence from the EmeryvilleShellmound Vertebrate Fauna. University of California Pub-lications, Anthropological Records 32. Berkeley, Califor-nia.
2002 Prey Spatial Structure and Behavior Affect Archaeo-logical Tests of Optimal Foraging Models: Examplesfrom the Emeryville Shellmound Vertebrate Fauna. WorldArchaeology 34:60–83.
2004 Prehistoric Human Impacts on California Birds: Ev-idence from the Emeryville Shellmound Avifauna. Or-
424 american antiquity [Vol. 76, no. 3, 2011
AQ76(3)Broughton_Layout 1 7/5/11 2:44 PM Page 424

nithological Monographs 56. Washington, D.C.Broughton, Jack, M., and Frank E. Bayham2002 Showing Off, Foraging Models, and the Ascendanceof Large Game Hunting in the California Middle Archa-ic. American Antiquity 68:783–789.
Broughton, Jack M., David Byers, Reid Bryson, William Eck-erle, and David B. Madsen
2008 Did Climatic Seasonality Control Late Quaternary Ar-tiodactyl Densities in Western North America? QuaternaryScience Reviews 37:1916–1937.
Broughton, Jack M., and Michael D. Cannon (Editors)2010 Evolutionary Ecology and Archaeology: Applica-tions to Problems in Human Evolution and Prehistory.Uni-versity of Utah Press, Salt Lake City.
Broughton, Jack M., Michael D. Cannon, and Eric J. Bartelink2010 Evolutionary Ecology, Resource Depression, andNiche Construction Theory in Archaeology: Applicationsto Central California Hunter-Gatherers and Mimbres-Mogollon Agriculturalists. Journal of ArchaeologicalMethod and Theory 17:371–421.
Broughton, Jack M., and Donald K. Grayson1993 Diet Breadth, Adaptive Change and the White Moun-tains Faunas. Journal of Archaeological Science 20:331–336.
Broughton, Jack M., Daniel Mullins, and Tamara Ekker2006 Avian Resource Depression or Intertaxonomic Vari-ation in Bone Density? A Test with San Francisco Bay Avi-faunas. Journal of Archaeological Science 34:374–391.
Broughton, Jack M., and James F. O’Connell1999 On Evolutionary Ecology, Selectionist Archaeologyand Behavioral Archaeology. American Antiquity64:153–165.
Butler, L. Virginia 2000 Resource Depression on the Northwest Coast ofNorth America. Antiquity 74:649–661.
Butler, Virginia, L., and Sarah K. Campbell 2002 Resource Intensification and Resource Depression inthe Pacific Northwest of North America: a Zooarchaeo-logical Review. Journal of World Prehistory 18:327–405.
Byers, David A., and Jack M. Broughton2004 Holocene Environmental Change, Artiodactyl Abun-dances, and Human Hunting Strategies in the Great Basin.American Antiquity 69:235–255.
Byers, David A., and Brenda L. Hill2009 Pronghorn Dental Age Profiles and Holocene Hunt-ing Strategies at Hogup Cave, Utah. American Antiquity74:299–322.
Byers, David A., and Criag S. Smith2007 Ecosystem Controls and the Archaeofaunal Record:An Example from the Wyoming Basin, U.S.A. TheHolocene 17:1171–1184.
Byers, David A., Criag S. Smith, and Jack M. Broughton2005 Holocene Artiodactyl Population Histories and LargeGame Hunting in the Wyoming Basin, USA. Journal of Ar-chaeological Science 32: 125–142.
Cannon, Michael D.2000 Large Mammal Relative Abundance in Pithouse andPueblo Period Archaeofaunas From Southwestern NewMexico: Resource Depression among the Mimbres-Mogol-lon? Journal of Anthropological Archaeology 19:317–347.
2003 A Model of Central Place Forager Prey Choice and anApplication to Faunal Remains from the Mimbres Valley,New Mexico. Journal of Archaeological Science 22:1–25.
2004 Geographic Variability in North American MammalCommunity Richness during the Terminal Pleistocene. Qua-ternary Science Reviews 23:1099–1123.
2010 A Revised Research Context for the Prehistoric Ar-chaeology of the Little Boulder Basin Area, North-central
Nevada. SWCA Cultural Resources Report No. 2009–87SWCA Environmental Consultants, Salt Lake City. Sub-mitted to U.S. Bureau of Land Management, Elko District,Tuscarora Field Office, Elko, NV. BLM Project No. BLM1–2505. Forthcoming in BLM Nevada Cultural ResourceSeries (http://www.blm.gov/nv/st/en/prog/more–pro-grams/cultural–resources/reports.html).
Cannon, Michael D., and Jack M. Broughton2010 Evolutionary Ecology and Archaeology: An Intro-duction. In Evolutionary Ecology and Archaeology:Applications to Problems in Human Evolution and Pre-history, edited by Jack M. Broughton and Michael D. Can-non, pp. 1–12. University of Utah Press, Salt Lake City.
Carpenter, Kimberly2004 Terrestrial Faunal Remains. In Archaeological Exca-vations at Pie Creek and Tule Valley Shelters, Elko County,Nevada, edited by Kelly R. McGuire, Michael G. Delacorte,and Kimberly Carpenter, pp. 105–110. Nevada State MuseumAnthropological Papers No. 25. Carson City, Nevada.
Durrant, Stephen, D.1970 Faunal Remains as Indicators of Neothermal Climatesat Hogup Cave. In Hogup Cave edited by C. Melvin Aikens,pp. 241–245. University of Utah Anthropological Papers,Number 93. Salt Lake City, Utah.
Elston, Robert G., and Elizabeth E. Budy 1990 The Archaeology of James Creek Shelter. Universityof Utah Anthropological Papers No. 115. Salt Lake City,Utah.
Emery, Kitty F.2007 Assessing the Impact of Ancient Maya Animal Use.Journal for Nature Conservation 15:184–195.
Etnier, Michael A.2007 Defining and Identifying Sustainable Harvests ofResources: Archaeological Examples of Pinniped Harvestsin the Eastern North Pacific. Journal for Nature Conser-vation 15:196–207.
Faith, Tyler J. 2007 Changes in Reindeer Body Part Representation at GrotteXVI, Dordogne, France. Journal of Archaeological Science34:2003–2011.
Fitzhugh, Ben 2003 The Evolution of Complex Hunter-Gatherers: Ar-chaeological Evidence from the North Pacific. Plenum, NewYork.
Garland, Theodore, Jr., 1983 The Relation Between Maximal Running Speed andBody Mass in Terrestrial Mammals. Journal of Zoology199:157–170.
Garland, Theodore, Jr., and Christine M. Janis1993 Does Metatarsal/Femur Ratio Predict Maximal Run-ning Speed in Cursorial Mammals? Journal of Zoology229:133–151.
Grayson, Donald K.1974 The Riverhaven No. 1 Vertebrate Fauna: Commentson Methods in Faunal Analysis and on Aspects of the Sub-sistence Potential of Prehistoric New York. Man in theNorth-east 8:23–39.
1984 Quantitative Zooarchaeology. Academic Press, Orlando.1990 The James Creek Shelter Mammals. In The Archae-ology of James Creek Shelter, edited by Robert G. Elstonand Elizabeth E. Budy, pp. 87–98. University of Utah An-thropological Papers No. 115. Salt Lake City, Utah.
1991 Alpine Faunas from the White Mountains, California:Adaptive Change in the Late Prehistoric Great Basin? Jour-nal of Archaeological Science 18:483–506.
1993 The Desert’s Past: A Natural Prehistory of the GreatBasin. Smithsonian Institution Press, Washington, D.C.
Broughton et al.] Prey BODy SiZe anD ranKinG in ZOOarcHaeOLOGy 425
AQ76(3)Broughton_Layout 1 7/5/11 2:44 PM Page 425
2001 The Archaeological Record of Human Impacts on An-imal Populations. World Prehistory 15:1–68.
2006 The Late Quaternary Biogeographic Histories ofsome Great Basin Mammals (western USA. QuaternaryScience Reviews 25:2964–2991.
Grayson, Donald, K., and Francoise Delpech1998 Changing Diet Breadth in the Early Paleolithic of South-western France. Journal of Archaeological Science25:1119–1129.
Griffiths, David1975 Prey Availability and the Food of Predators. Ecology56:1209–1214.
Grimstead, Deanna N.2005 Tracking Artiodactyl Hunting Across Late Period North-ern California: An Assessment of Traditional and Geo-chemical Methods. Masters thesis, Department of An-thropology, California State University, Chico.
2009 Contradictions and Compliments: The Use of Geo-chemistry and Body Part Utility Analysis to Detect Non-Local Procurement Strategies during the Late Holocene inNorthern California. In Understanding California Prehis-tory: Deriving Meaning from Shells, Bones, and Other Re-mains, edited by Michael A. Glassow and Terry L. Joslin,in Press.
2009 Ethnographic and Modeled Costs of Long-distance, Big-Game Hunting. American Antiquity 75:61–80.
Hawkes, Kristen, Kim Hill, and James F. O’Connell1982 Why Hunters Gather: Optimal Foraging and theAche of Eastern Paraguay. American Ethnologist 9:379–398.
Hildebrandt, William R., and Terry L. Jones2002 Depletion of Prehistoric Pinniped Populations alongthe California and Oregon Coasts: Were Humans the Cause?In Wilderness and Political Ecology: Aboriginal Influencesand the Original State of Nature, edited by Charles E. Kay,and Randall T. Simmons, pp. 72–110.University of UtahPress, Salt Lake City.
Hildebrandt, William R., and Kelly R. McGuire2002 The Ascendance of Hunting During the California Mid-dle Archaic: An Evolutionary Perspective. American An-tiquity 67:231–256.
Hill, Kim, and Kristen Hawkes1983 Neotropical Hunting among the Ache of EasternParaguay. In Adaptive Responses of Native Amazonians, edit-ed by R. Hames and William Vickers, pp. 139–188. Aca-demic Press, New York.
Hill, Kim, Hillard Kaplan, Kristen Hawkes, and A. MagdalenaHurtado
1987 Foraging Decisions among the Ache Hunter-gather-ers: New Data and Implications for Optimal Foraging Mod-els. Ethology and Sociobiology 8:1–36.
Hockett, Brian S.1993 Taphonomy of the Leporid Bones from Hogup Cave,Utah: Implications for Cultural Continuity in the EasternGreat Basin. Ph. D. Dissertation, Department of Anthro-pology, University of Nevada, Reno. University Microfilms,Ann Arbor.
1994 A Descriptive Analysis of the Leporid Bones fromHogup Cave, Utah. Journal of California and GreatBasin Archaeology 16:106–117.
2005 Middle and Late Holocene Hunting in the Great Basin:A Critical Review of the Debate and Future Prospects. Amer-ican Antiquity 70:713–731.
Holsworth, William N.1973 Hunting Efficiency and White-tailed Deer Density. Jour-nal of Wildlife Management 37:336–342.
Janetski, Joel, C.1997 Fremont Hunting and Resource Intensification in the
Eastern Great Basin. Journal of Archaeological Science24:1075–1088.
Jones, Emily L.2004 Dietary Evenness, Prey Choice, and Human-Envi-ronment Interactions. Journal of Archaeological Science31:307–317.
Jones, Terry L., and L. Mark Raab2004 Rediscovery of California Prehistory. In Prehistoric Cal-ifornia: Archaeology and the Myth of Paradise, edited byL. Mark Raab and Terry L. Jones, pp. 1–10. University ofUtah Press, Salt Lake City.
Jones, Terry L., Judith F. Porcasi, Jereme Gaeta, and Brian F. Cod-ding
2008 The Diablo Canyon Fauna: A Coarse-Grained Recordof Trans-Holocene Foraging from the Central CaliforniaMainland Coast. American Antiquity 73:289–316.
Kennett, Douglas J.2005 The Island Chumash: Behavioral Ecology of a Mar-itime Society. University of California Press, Berkeley.
Koster, Jeremy M.2008 Hunting With Dogs in Nicaragua: An Optimal ForagingApproach. Current Anthropology 49:935–944.
Kuhn, Steven L., Mary C. Stiner, D. S. Reese, and E. Gulec 2001 Ornaments of the Earliest Upper Paleolithic: New In-sights from the Levant. Proceedings of the National Acad-emy of Sciences (USA) 98:7641–7646.
Lindstrom, Susan1996 Great Basin Fisherfolk: Optimal Diet Breadth Mod-eling the Truckee River Aboriginal Subsistence Fishery. InPrehistoric Hunter-Gatherer Fishing Strategies, edited byMark G. Plew, pp. 114–179. Department of Anthropolo-gy, Boise State University. Boise, Idaho.
Lupo, Karen D.2007 Evolutionary Foraging Models in ZooarchaeologicalAnalysis: Recent Applications and Future Challenges. Jour-nal of Archaeological Research 15:143–189.
Lyman, R. Lee2003a The Influence of Time Averaging and Space Averagingon the Application of Foraging Theory in Zooarchaeolo-gy. Journal of Archaeological Science 30:595–610.
2003b Pinniped Behavior, Foraging Theory, and the De-pression of Metapopulations and Nondepression of a Lo-cal Population on the Southern Northwest Coast of NorthAmerica. Journal of Anthropological Archaeology22:376–388.
McGuire, Kelly R., and William R. Hildebrandt2004 Re-thinking Great Basin Foragers: Prestige Huntingand Costly Signaling During the Middle Archaic Period.American Antiquity 70:695–712.
McGuire, Kelly R., William R. Hildebrandt, and Kimberly L.Carpenter
2007 Costly Signaling and the Ascendance of No-Can-DoArchaeology: A Reply to Codding and Jones. American An-tiquity 72:358–365.
Madsen, David B.2000 Late Quaternary Paleoecology in the BonnevilleBasin. Utah Geological Survey Bulletin 130:1–190.
Madsen, David B., and Michael S. Berry1975 A Reassessment of Northeastern Great Basin Prehis-tory. American Antiquity 40:391–405.
Madsen, David B., and David N. Schmitt1997 Mass Collecting and the Diet Breadth Model: A GreatBasin Example. Journal of Archaeological Science25:445–457.
Maschner, Herbert D. G., Matthew W. Betts, Katherine L. Reedy-Maschner, and Andrew W. Trites
2006 A 4500-year Time Series of Pacific Cod (Gadus macro-
426 american antiquity [Vol. 76, no. 3, 2011
AQ76(3)Broughton_Layout 1 7/5/11 2:44 PM Page 426
cephalus) Size and Abundance: Archaeology, OceanicRegime Shifts, and Sustainable Fisheries. Fishery Bulletin106:386–394.
Morgan, John2005 2003-04 Rabbit Hunter Cooperator Survey Report. Ken-tucky Department of Fish and Wildlife Resources, Frank-fort, Kentucky.
Morin, Eugene 2004 Late Pleistocene Population Interaction in Western Eu-rope and Modern Human Origins: New Insights Based onthe Faunal Remains from Saint-Césaire, SouthwesternFrance. Ph.D. Dissertation, University of Michigan, AnnArbor. University Microfilms, Ann Arbor.
2011 Paleolithic Foragers at Saint-Cesaire, France: AFaunal Perspective on the Origins of Modern Humans.Cam-bridge University Press, Cambridge, in press.
Morrison, Alex E., and Terry L. Hunt2007 Human Impacts on the Nearshore Environment: An Ar-chaeological Case Study from Kaua’I, Hawaiian Islands.Pacific Science 61:325–345.
Mullen, Christine, O.1997 Mammalian Response to Pleistocene/Holocene En-vironmental Change in the Great Basin: The Jackrabbit’sTale. Ph. D. Dissertation. Program in Ecology, Evolution,and Conservation Biology, University of Nevada, Reno. Uni-versity, Microfilms, Ann Arbor.
Munson, Patrick J., Paul W. Parmalee, and Richard A. Yarnell1971 Subsistence Ecology of Scovill, a Terminal MiddleWoodland Village. American Antiquity 36:410–431.
Nagaoka, Lisa 2001 Using Diversity Indices to Measure Changes in PreyChoice at the Shag River Mouth Site, Southern NewZealand. International Journal of Osteoarchaeology11:419–442.
2002a Explaining Subsistence Change in Southern NewZealand using Foraging Theory Models. World Archaeol-ogy 34:84–102.
2002b The Effects of Resource Depression on Foraging Ef-ficiency, Diet Breadth, and Patch Use in Southern NewZealand. Journal of Anthropological Archaeology21:419–442.
2005 Declining Foraging Efficiency and Moa Carcass Ex-ploitation in Southern New Zealand. Journal of Archaeo-logical Science 32:1328–1338.
2006 Prehistoric Seal Carcass Exploitation at the Shag Riv-er Mouth Site, New Zealand. Journal of Archaeological Sci-ence 33:1474–1481.
Parmalee, Paul W.1970 Birds from Hogup Cave. In Hogup Cave, edited by C.Melvin Aikens, pp. 263–266. University of Utah Anthro-pological Papers, Number 93. Salt Lake City, Utah.
Porcasi, Judith. F., Terry L. Jones, and L. Mark Raab2000 Trans-Holocene Marine Mammal Exploitation on SanClemente Island, California: a Tragedy of the CommonsRevisited. Journal of Anthropological Archaeology 19:200–220.
Raymond, Alan W., and Elizabeth Sobel1990 The Use of Tui Chub as Food by Indians of the West-ern Great Basin. Journal of California and Great Basin An-thropology 12:2–18.
Rick, Torben C., and Jon M. Erlandson2000 Early Holocene Fishing Strategies on the CaliforniaCoast: Evidence from CA-SBA-2057. Journal of Archae-ological Science 27:621–633.
Ruth, Charles, R., and H. L. Simmons, Jr. 1999 Answering Questions About Guns, Ammo, and Man’sBest Friend. In The Twenty Second Annual Meeting of the
Southeast Deer Study Group, pp. 28–29. Fayetteville,Arkansas. www.scilowcountry.org/cedar–knoll–deer–study.html
Simms, Steven, R.1985 Acquisition Cost and Nutritional Data on Great BasinResources. Journal of California and Great Basin An-thropology 7:117–126.
1987 Behavioral Ecology and Hunter-Gatherer Foraging:An Example from the Great Basin. BAR International Se-ries 381. Oxford, England.
Smith, Bruce D.1974 Middle Mississippi Exploitation of Animal Populations:A Predictive Model. American Antiquity 39:274–291.
1979 Measuring the Selective Utilization of Animal Speciesby Prehistoric Human Populations. American Antiquity44:155–160.
Smith, Craig., David A. Byers, and Cynthia Craven2008 Holocene Bison Procurement and Processing in theWyoming Basin: The View from the Graham Ranch Site.Plains Anthropologist, 53:313–322.
Smith, Eric Alden1991 Inujjuamiut Foraging Strategies: Evolutionary Ecol-ogy of an Arctic Hunting Economy. Aldine de Gruyter, NewYork.
South Carolina Department of Natural Resources2009 South Carolina Rabbit Hunter Survey, 2007–08.South Carolina Department of Natural Resources, Columbia,South Carolina.
Stephens, David, W., and John R. Krebs1986 Foraging Theory. Princeton University Press, Prince-ton.
Stiner, Mary, C., and Natalie D. Munro2002 Approaches to Prehistoric Diet Breadth, Demographyand Prey Ranking Systems in Time and Space. Journal ofArchaeological Method and Theory 9:181–214.
Stiner, Mary, C., Natalie D. Munro, and Todd A. Surovell2000 The Tortoise and the Hare: Small Game Use, the Broad-spectrum Revolution, and Paleolithic Demography. Cur-rent Anthropology 41:39–73.
Stiner, Mary, C., Natalie D. Munro, Todd A. Surovell, Eitan Tch-ernov, and Ofer Bar-Yosef
1999 Paleolithic Population Growth Pulses Evidenced bySmall Animal Exploitation. Science 283:190–194.
Stuiver, Minze, and Paula J. Reimer2005 Calib Radiocarbon Calibration Program Home Page.Electronic document, http://calib.qub.ac.uk/calib/.
Stutz, Aaron J., Natalie D. Munro, and Guy Bar-Oz2009 Increasing the Resolution of the Broad Spectrum Rev-olution in the Southern Levantine Epipaleolithic (19–12 ka).Journal of Human Evolution 56:294–306.
Szuter, Christine R., and Frank E. Bayham1989 Sedentism and Prehistoric Animal ProcurementAmong Desert Horticulturalists of the North AmericanSouthwest. In Farmers and Hunters: The Implications ofSedentism, edited by Susan Kent, pp. 80–95. CambridgeUniversity Press, Cambridge.
Ugan, Andrew2005a Does Size Matter? Body size, Mass Collecting, andTheir Implications for Understanding Prehistoric ForagingBehavior. American Antiquity 70:75–90.
2005b Climate, Bone Density, and Resource Depression:What is Driving Variation in Large and Small Game in Fre-mont Archaeofaunas? Journal of Anthropological Ar-chaeology 24:227–251.
Ugan, Andrew, and Jason Bright2001 Measuring Foraging Efficiency with ArchaeologicalFaunas: The Relationship Between Relative Abundance In-
Broughton et al.] Prey BODy SiZe anD ranKinG in ZOOarcHaeOLOGy 427
AQ76(3)Broughton_Layout 1 7/5/11 2:44 PM Page 427
dices and Foraging Returns. Journal of Archaeological Sci-ence 28:1309–1321.
Ugan, Andrew, Jason Bright, and Alan R. Rogers2003 When is Technology Worth the Trouble? Journal of Ar-chaeological Science 30:1315–1329.
White, Theodore E.1952 Observations on the Butchering Technique of SomeAboriginal Peoples: I. American Antiquity 17:337–338.
1953 A Method of Calculating the Dietary Percentage of Var-ious Food Animals Utilized by Aboriginal Peoples. Amer-ican Antiquity 18:396–398.
Wilson, Davis S.1976 Deducing the Energy Available in the Environment:An Application of Optimal Foraging Theory. Biotropica8:96–103.
Winterhalder, Bruce1977 Foraging Strategy Adaptations of the Boreal Forest Cree:An Evaluation of Theory and Models from Evolutionary Ecol-ogy. Ph. D. Dissertation, Department of Anthropology, Cor-nell University. University Microfilms, Ann Arbor.
1981 Foraging Strategies in the Boreal Forest: An Analysisof Cree Hunting and Gathering. In Hunter-Gatherer For-aging Strategies: Ethnographic and Archaeological Analy-ses, edited by Bruce Winterhalder and Eric Alden Smith,pp. 66–98. University of Chicago Press, Chicago.
Wolverton, Steve2005 The Effects of the Hypsithermal on Prehistoric For-aging Efficiency in Missouri. American Antiquity 70:91–106.
Wolverton, Steve, Lisa Nagaoka, Julie Densmore, and Ben Fullerton2008 White-tailed Deer Harvest Pressure and Within-boneNutrient Exploitation During the Mid-to-Late Holocene inSoutheast Texas. Before Farming 2008:1–23.
Yesner, David R., and Jean S. Aigner1976 Comparative Biomass Estimates and Prehistoric Cul-tural Ecology of the Southwest Umnak Region, AleutianIslands. Arctic Anthropology 8:91–112.
Young, D. Craig2004 Geoarchaeology. In Archaeological Excavations at PieCreek and Tule Valley Shelters, Elko County, Nevada, edit-ed by Kelly R. McGuire, Michael G. Delacorte, and Kim-berly Carpenter, pp. 39–53. Nevada State Museum An-thropological Papers No. 25. Carson City, Nevada.
Notes
1. This formulation assumes for simplicity’s sake that av-erage handling time does not differ between successful and un-successful pursuits.
2. Insofar as particular spatiotemporal contexts during theearly and middle Holocene were characterized by more equableclimate, for instance, they may also have supported higher den-sities of artiodactyls. Primary migration corridors may alsohave contained relatively high densities (seasonally) of gameduring these times. In such contexts, increases in the propor-tional representation of artiodactyls would not be anticipatedat the middle-late Holocene transition.
As we discuss elsewhere (Broughton et al. 2008:1931), sev-eral records seem to show just this pattern. We stress too thatartiodactyl abundances appear to have been highly variablethrough time within the late Holocene, as the Bonneville Basinpaleontological and archaeological records so clearly suggest.Thus, generating predictions about variation in artiodactylabundances at any particular spot on the landscape requires
careful attention to locally derived paleoclimatic data. And cli-matic conditions were, of course, not the only factors influ-encing the prehistoric abundances of artiodactyls in westernNorth America. Despite generally favorable environmentalconditions for artiodactyls across many stretches of the lateHolocene, in certain contexts, human hunting pressure ap-pears to have ultimately overtaken them, causing substantialpopulation declines. Such anthropogenic depressions havenow been documented in some detail in several areas of west-ern North America. We also emphasize that variation in ar-chaeological site function or the role that sites played in the re-gional settlement-mobility system can, of course, influence theenergetics of prey choice and transport, and affect variation inthe taxonomic composition of archaeological faunas, inde-pendent of any temporal trends in the abundances of artio-dactyls on past landscapes (Bayham 1982; Broughton 1999,2002; Cannon 2003). A shift in the regional settlement patternin which the function of a site changed from a residential baseto a hunting camp, would, for instance, have obvious implica-tions for variation in the relative abundances of large gameskeletal elements or hunting tools recovered from its sedi-ments (see Bayham 1982; Byers and Broughton 2004). And in-sofar as there is a greater likelihood that large-packaged re-sources will be field processed, we anticipate kill sites to bebiased towards the remains of large-sized prey, regardless ofwhen they were deposited.
3. To maintain consistency with the published literature(e.g., Broughton et al. 2008; Grayson 2006; Madsen 2000), un-calibrated radiocarbon years before present is the time-scaleused here.
4. Consistent trends in the Artiodactyl Index also occur atother sites with well-reported faunal assemblages in the upperHumboldt River region. At James Creek Shelter, located ap-proximately 25 km to the southeast of the LBB, the abundanceof artiodactyls relative to lagomorphs is also highest in depositsdating to the Maggie Creek phase (data in Grayson 1990). AtPie Creek Shelter, located approximately 65 km northeast of theLBB, the Artiodactyl Index is highest in deposits that date tobetween about 3,960 and 2,740 B.P. (Carpenter 2004; see dis-cussion of the dating of this site in Cannon 2010). This largelypre-dates the earliest faunal assemblages from the LBB but, no-tably, corresponds to the earlier of the two late Holocene spikesin artiodactyl abundance observed at Hogup and HomesteadCaves. The Artiodactyl Index then declines at Pie Creek Shel-ter in deposits that are roughly coeval with the LBB Middle Ar-chaic assemblages. The Pie Creek Shelter faunal data are un-fortunately not useful for exploring trends in artiodactyl relativeabundance during the Maggie Creek and Eagle Rock phasesbecause materials from these phases are stratigraphically co-mingled at the site (see Young 2004:45–46).
5. Due to very low rates of deposition during the Holocene,buried archaeological materials in the LBB generally occur withinthe first 20 cm below surface, and excavations routinely proceedno deeper than this. Therefore, excavation unit area, rather than vol-ume, is an appropriate measure of excavation effort.
Submitted January 29, 2010; Revised March 18, 2010;Accepted March 19, 2010.
428 american antiquity [Vol. 76, no. 3, 2011]
AQ76(3)Broughton_Layout 1 7/5/11 2:44 PM Page 428