Breast Implant Surface Development - Research Explorer
185
BREAST IMPLANT SURFACE DEVELOPMENT A Thesis submitted to The University of Manchester for the degree of Doctor of Philosophy in the Faculty of Engineering and Physical Sciences 2015 ANAI ALICIA VALENCIA LAZCANO SCHOOL OF MECHANICAL, AEROSPACE AND CIVIL ENGINEERING
-
Upload
khangminh22 -
Category
Documents
-
view
0 -
download
0
Transcript of Breast Implant Surface Development - Research Explorer

BREAST IMPLANT SURFACE
DEVELOPMENT
A Thesis submitted to The University of Manchester for the degree of
Doctor of Philosophy in the Faculty of Engineering and Physical
Sciences
2015
ANAI ALICIA VALENCIA LAZCANO
SCHOOL OF MECHANICAL, AEROSPACE AND CIVIL
ENGINEERING

2
Contents
Contents ...................................................................................................................... 2
List of Tables .............................................................................................................. 5
List of Figures ............................................................................................................. 6
List of abbreviations .................................................................................................. 9
Nomenclature............................................................................................................ 10
Abstract ..................................................................................................................... 11
Declaration ................................................................................................................ 12
Copyright .................................................................................................................. 13
Acknowledgements ................................................................................................... 14
The Author ................................................................................................................ 15
Chapter I Introduction ............................................................................................ 16
1.1 Overview .......................................................................................................... 16 1.2 Research background ....................................................................................... 17 1.3 Objectives and methodology ............................................................................ 18 1.4 Thesis structure ................................................................................................ 19
Chapter II Breast implants ..................................................................................... 21
2.1 Introduction ...................................................................................................... 21 2.2 Breast anatomy ................................................................................................. 21
2.2.1 Mammary gland ........................................................................................ 22
2.2.2 Function of the nipples and the surrounding pigmented tissue ................. 22
2.2.3 Internal features of the breast .................................................................... 23
2.2.4 Pectoral fascia ........................................................................................... 23 2.2.5 Breast shape .............................................................................................. 23
2.3 Breast implants ................................................................................................. 24 2.3.1 Evolution of breast implants ..................................................................... 24

3
2.3.2 Material ..................................................................................................... 28 2.3.3 Shapes ....................................................................................................... 28 2.3.4 Sizes .......................................................................................................... 29 2.3.5 Implant shell .............................................................................................. 30 2.3.6 Manufacturing process of silicone breast implants ................................... 31
2.4 Breast augmentation surgery ............................................................................ 33
Chapter III Capsular contracture and cell adhesion ............................................ 35
3.1 Introduction ...................................................................................................... 35
3.2 Complications related to breast implants ......................................................... 36
3.2.1 Capsular contracture.................................................................................. 42
3.3 Tissue response to breast implants ................................................................... 44 3.3.1 Inflammation ............................................................................................. 45 3.3.2 Granulation tissue formation ..................................................................... 47 3.3.3 Re-epithelialisation ................................................................................... 48 3.3.4 Matrix formation and remodelling ............................................................ 49
3.4 Cell-surface adhesion process .......................................................................... 49 3.4.1 Forces at the interface between cells and their environment .................... 51
3.5 Formation of the scar encapsulation around the textured surface of a silicone
breast implant ......................................................................................................... 53
Chapter IV Surface characterisation: parameters and equipment, microscopy
principles and surface coatings ............................................................................... 55
4.1 Introduction ...................................................................................................... 55
4.2 Parameters and equipment ............................................................................... 56 4.2.1 Roughness ................................................................................................. 56
4.2.2 Wettability ................................................................................................. 62 4.3 Principles of microscopy .................................................................................. 64
4.3.1 Fluorescence microscopy .......................................................................... 64
4.3.2 Confocal microscopy ................................................................................ 68 4.3.3 Deconvolution ........................................................................................... 70
4.4 Surface coatings ............................................................................................... 72 4.4.1 Surface coatings requirements .................................................................. 72 4.4.2 Surface coating selection procedure.......................................................... 73
4.4.3 Surface coating selection tables ................................................................ 74 4.4.4 The selected surface coatings .................................................................... 81
Chapter V Characterisation of breast implant shells and correlation with
fibroblast adhesion ................................................................................................... 83
5.1 Introduction ...................................................................................................... 83
5.2 Materials and Methods ..................................................................................... 84
5.2.1 Characterisation of the silicone surfaces ................................................... 85 5.2.2 Kinetics of fibroblast–surface detachment mediated by trypsin ............... 90
5.3 Results .............................................................................................................. 91 5.3.1 Surface characterisation ............................................................................ 91
4
5.3.2 Kinetics of fibroblast–silicone implant surfaces detachment mediated by
trypsin ............................................................................................................... 101 5.4 Discussion ...................................................................................................... 106
Chapter VI Physico-chemical characteristics of coated silicone textured versus
smooth breast implants differentially influence breast-derived fibroblast
morphology and behaviour ................................................................................... 109
6.1 Introduction .................................................................................................... 109
6.2 Materials and Methods ................................................................................... 110
6.2.1 Sample preparation.................................................................................. 110
6.2.2 Characterisation....................................................................................... 111 6.2.3 Cell culture .............................................................................................. 111 6.2.4 Cytotoxicity ............................................................................................. 113 6.2.5 Fibroblast adhesion to surfaces ............................................................... 113 6.2.6 Fibroblast proliferation ........................................................................... 114
6.2.7 Immunofluorescence ............................................................................... 114 6.2.8 Quantification of gene adhesion expression ........................................... 115 6.2.9 Statistical analysis ................................................................................... 117
6.3. Results ........................................................................................................... 117
6.3.1 Physico-chemical characterisation of smooth versus textured implants . 117
6.3.2 Cytotoxic effect of specific coatings on breast fibroblasts ..................... 121 6.3.3 Effect of specific coatings on breast fibroblast attachment .................... 122 6.3.4 Effect of specific coatings on cell proliferation ...................................... 123
6.3.5 Effect of coatings on cytoskeleton organization ..................................... 124 6.3.6 Effect of aggrecan, collagen I, fibronectin and hyaluronic acid coatings on
adhesion expression in breast fibroblasts ......................................................... 127 6.4 Discussion ...................................................................................................... 130
Chapter VII Conclusions ....................................................................................... 136
7.1 Conclusions .................................................................................................... 136
7.2 Limitations of the work .................................................................................. 137 7.3 Recommendations for future work ................................................................ 137
References ............................................................................................................... 139
Appendix ................................................................................................................. 154
Final words count 33,294

5
List of Tables
Chapter III
Table 3.1 Macrophage activities in wound repair ……………………………. 47
Table 3.2 Late inflammatory and early granulation tissue phases components.
…..
48
Table 3.3 Fibroblast activities in wound repair……………………………….. 49
Chapter IV
Table 4.1 Selection of the down-regulated genes from a microarray data……. 75
Table 4.2 Genes related to the extracellular matrix……………...………..….. 76
Table 4.3 Genes selected from the microarray according to the lowest p-value 77
Table 4.4 Genes that correspond to the three categories……………………… 78
Table 4.5 Molecules involved in fibrosis and breast capsule...…….…………. 80
Table 4.6 Biomolecules related to fibrosis, wound healing in the body ……... 81
Chapter V
Table 5.1 3D Surface height parameters: skewness and kurtosis…………….. 95
Table 5.2 Summary of results…………………………………………………. 105
Chapter VI
Table 6.1 Sequences of primers used to amplified adhesion related genes……
117

6
List of Figures
Chapter II
Figure 2.1 Breast anatomy…………………………………….........................
………………………...
22
Figure 2.2 Breast implants generations………….........…………………….... 25
Figure 2.3 Schematic representation of Silicone………….........…………….. 28
Figure 2.4 Breast implants shapes. ………………………………………...… 29
Figure 2.5 Breast implants projections……………………………..………… 30
Figure 2.6 Breast implants textures…………………………….....………….. 31
Figure 2.7 Types of incisions ……………………...........…………………… 33
Figure 2.8 Types of implant placement..……………..………………………. 34
Chapter III
Figure 3.1 Adverse effects associated with breast implants …………………. 38
Figure 3.2 Phases of wound repair ………………………...........…………… 45
Chapter IV
Figure 4.1 Arithmetical mean deviation ……………………………………. 57
Figure 4.2 Maximum peak height …………………………….……………. 57
Figure 4.3 Maximum valley depth ………………………….……………… 58
Figure 4.4 Skewness ……………………………...………………………… 58
Figure 4.5 Kurtosis…………………………..……………………………… 59
Figure 4.6 Material ratio curve……………………………………………… 60
Figure 4.7 Volume parameters …………………………. ………………… 61
Figure 4.8 Cut-off length …………………………. ……………………… 61
Figure 4.9 Contact angles of drops on a smooth homogeneous solid surface 63

7
Figure 4.10 Forces of liquid molecules at the surface ……. ……………….. 63
Figure 4.11 Simplified Jablonski-diagram of states...……………………….
…..
65
Figure 4.12 Visible light region of electromagnetic radiation ……………… 65
Figure 4.13 Principle of excitation and emission …………………………… 66
Figure 4.14 4´-6 diamidino -2- phenylindole (DAPI)…………. …………… 67
Figure 4.15 Absorption and emission spectra with overlap profile …………. 67
Figure 4.16 Laser scanning confocal microscope optical configuration….…. 69
Figure 4.17 Widefield versus confocal point scanning of specimens ………. 69
Figure 4.18 Acquisition of optical sections for deconvolution………………. 71
Figure 4.19 Flowchart of protein selection from microarray data…………... 74
Chapter V
Figure 5.1 TS1 surface topography………....…………....………….…........ 85
Figure 5.2 TS2 surface topography…………………....…………...……….. 86
Figure 5.3 SS1 surface topography…………………......………...………… 86
Figure 5.4 SS2 surface topography…………………....….………….…..…. 87
Figure 5.5 Contact angle values of the silicone sample surfaces. ….………. 88
Figure 5.6 Microtest 5kN tensile module and TS1 tensile test…………...… 89
Figure 5.7 3D functional parameters ………..……………………………… 96
Figure 5.8 Core and valley fluid retention indexes…………….…………… 97
Figure 5.9 Mean force-displacement curves ………………………….……. 100
Figure 5.10 Mean dynamic stretching stiffness for all samples.…………….. 100
Figure 5.11 Fibroblast attachment to surfaces after 24 hours of incubation… 102
Figure 5.12 Fibroblast attachment to surfaces after 48 hours of incubation… 103
Figure 5.13 Fibroblast attachment to surfaces after 72 hours of incubation… 103
Figure 5.14 Ln of number of cells attached at a time point over all surfaces.. 104

8
Chapter VI
Figure 6.1 Study design for physico-chemical and in-vitro characterisation. 110
Figure 6.2 Confocal laser 3-D topography of silicone breast implants…….. 112
Figure 6.3 Raman spectra of silicone breast implants……………………… 119
Figure 6.4 Confocal laser 3-D topography of silicone breast implants…….. 120
Figure 6.5 Changes in Sa of the modified coated surfaces…………………. 121
Figure 6.6 Cytotoxicity of fibroblasts seeded on surfaces………………….. 122
Figure 6.7 Effect of coatings and roughness on fibroblast attachment…….. 123
Figure 6.8 Effect of coatings and roughness on fibroblast proliferation…… 124
Figure 6.9 Effect of coatings and roughness on fibroblast morphology.…… 126
Figure 6.10 Effect of coatings and roughness on fibroblast adhesion gene
expression………………………………………………………..
.
129

9
List of abbreviations
3-D Three-dimensional
ANOVA Analysis of Variance
Calcein AM Calcein acetoxymethyl ester
cDNA Complementary DNA
D.F.D Depth from defocus
DAPI 4',6-diamidino-2-phenylindole
DMEM Dulbecco‘s Culture Medium
DNA Deoxyribonucleic Acid
ECM Extra cellular matrix
FAK Focal adhesion kinase
FBS Fetal bovine serum
FITC Fluorescein Isothiocyanate dye
LDH Lactate dehydrogenase
mRNA Messenger RNA
PBS Phosphate-Buffered Saline
PCR Polymerase chain reaction
PDMS Poly (dimethylsiloxane)
Pen/strep Penicillin/streptomycin
qRT-PCR Quantitative reverse-transcriptase polymerase chain reaction
RNA Ribonucleic acid
RPE RNA precipitating elution buffer
RPL32 60S ribosomal protein L32
rpm Revolutions per minute
TRITC Tetramethylrhodamine Isothiocyanate
WST-1 Water-soluble tetrazolium salt-1

10
Nomenclature
L Microlitre
°C Degrees Celsius
D Bending stiffness
E Young‘s modulus
h Hour
k Stretching stiffness
kN Kilonewton
min Minute
mL Microlitre
mm Millimetre
ms Millisecond
ng Nanograms
nm Nanometre
PV Maximum peak to valley height roughness
Sk Core roughness
Sku Kurtosis of roughness surface
SMr1 Load area ratio of reduced peak part to core part
SMr2 Load area ratio of reduced valley part to core part
Spk Reduced Peak Height
Ssk Skewness of roughness surface
Svk Reduced Valley Depth
t Thickness
Vmc Actual volume at a core part
Vmp Actual volume at a peak region
Vvc Void volume at a core part
Vvv Void volume at valley region
θ Water contact angle

11
Abstract
Bilateral breast augmentation is one of the most common cosmetic surgical
procedures carried out on women in the western world. Breast augmentation involves
increasing the volume of a woman‘s breasts through surgery by placing a silicone
implant in the subglandular or subpectoral cavity. Although a capsule forms
inevitably around breast implants as a natural part of healing, it can cause significant
morbidity if the capsule becomes firm and contracted, a condition known as breast
capsular contracture (BCC). The aetiology of BCC remains unknown however it is
characterised by dense fibrocollagenous connective tissue with a local inflammatory
response. Host response is influenced by several factors including implant surface
texture, chemistry and interactions between cells and the extracellular matrix.
Texturing holds the implant in place, thus preventing micromotion at the host
prosthesis interface. While in smooth surfaces, the implant moves inside the breast,
making the fibroblasts repeatedly produce collagen in response to this host-prosthesis
shearing motion. In this thesis, the effect of surface characteristics and specific
coatings on the cell-surface interaction has been examined on smooth compared to
textured surfaces using commercially available breast implants.
The properties of breast implants shells have been characterised using confocal laser
microscopy, contact angle measurements, confocal Raman spectroscopy and tensile
testing. Confocal laser microscopy was used to evaluate the topographical features
and surface roughness of the implant surfaces. Contact angle measurements were
carried out to determine the hydrophobicity of the implant surfaces. Chemical
characterisation was carried out recording Raman images and spectra of the implants
using confocal Raman spectrometer. The mechanical properties of the breast implant
shells were measured via tensile testing. Adhesive interactions of breast-derived
fibroblasts with breast implant surfaces were examined in-vitro. For this purpose, the
effect of four molecule coatings (aggrecan, collagen I, fibronectin, and hyaluronic
acid) was evaluated on fibroblast attachment, proliferation, fibroblast morphology,
spreading, cytotoxicity and gene expression.
Results from in-vitro assays demonstrated cell susceptibility to topography and
protein coatings and further showed cytoskeletal re-organisation and modification
with specific cell adhesion patterns. Combination of diverse topographies and
specific coatings induced differential regulation of the expression of adhesion related
genes, such as focal adhesion kinase, paxillin, vinculin, and α-actinin on breast
fibroblasts.
In conclusion, this thesis has demonstrated the extent and strength of cell adhesion
and subsequent cell proliferation and differentiation. This is based on the physical
interactions between cells and the extracellular environment in the form of
topography and on the chemical interactions mediated by specific coatings. Precise
characterisation of the silicone breast implant surfaces was achieved. This may play
an important role in the development of improved breast implant surfaces with
improved qualities leading the development of surfaces that may be less prone to
capsular contracture.

12
Declaration
No portion of the work referred to in the thesis has been submitted in support of an
application for another degree or qualification of this or any other university or other
institute of learning.

13
Copyright
The author of this thesis (including any appendices and/or schedules to this thesis)
owns certain copyright or related rights in it (the ―Copyright‖) and she has given The
University of Manchester certain rights to use such Copyright, including for
administrative purposes.
Copies of this thesis, either in full or in extracts and whether in hard or electronic
copy, may be made only in accordance with the Copyright, Designs and Patents Act
1988 (as amended) and regulations issued under it or, where appropriate, in
accordance with licensing agreements which the University has from time to time.
The ownership of certain Copyright, patents, designs, trade marks and other
intellectual property (the ―Intellectual Property‖) and any reproductions of copyright
works in the thesis, for example graphs and tables (―Reproductions‖), which may be
described in this thesis, may not be owned by the author and may be owned by third
parties. Such Intellectual Property and Reproductions cannot and must not be made
available for use without the prior written permission of the owner(s) of the relevant
Intellectual Property and/or Reproductions.
Further information on the conditions under which disclosure, publication and
commercialisation of this thesis, the Copyright and any Intellectual Property and/or
Reproductions described in it may take place is available in the University IP Policy
(see http://documents.manchester.ac.uk/DocuInfo.aspx?DocID=487), in any relevant
Thesis restriction declarations deposited in the University Library, The University
Library‘s regulations (see http://www.manchester.ac.uk/library/aboutus/regulations)
and in The University‘s policy on Presentation of Theses.

14
Acknowledgements
I would like to convey my gratitude to my supervisors, Prof. Teresa Alonso-Rasgado,
and Dr. Ardeshir Bayat for support, enthusiastic guidance, valuable suggestions, and
constructive criticisms. I also wish to express my sincere gratitude to Dr. Alison
Patrick, Dr. Alan Walmsley and Dr. Farhatullah Syed for their guidance, patience
and constant encouragement indispensable for improving this work.
I wish to gratefully acknowledge the PhD scholarship and associated financial
support provided by The National Council on Science and Technology of Mexico
(CONACYT).
To my family and friends.

15
The Author
Ms Anai Valencia is currently a member of both, the Bio-engineering Group at the
School of Materials and the Plastic and Reconstruction Surgery Research Group at
the University of Manchester, UK. She graduated with a bachelor‘s degree in
Robotics Engineering from the National Polytechnic Institute, Mexico, before
obtaining a Master‘s degree in Mechanical Engineering from the National
Polytechnic Institute, Mexico.
Publications resulting from this research work:
Characterisation of breast implant surfaces and correlation with fibroblast adhesion.
Valencia-Lazcano, A. A., Alonso-Rasgado, T. and Bayat, A., Journal of the
Mechanical Behavior of Biomedical Materials, 21:133-148, 2013.
DOI:10.1016/j.jmbbm.2013.02.005.
Physico-chemical characteristics of coated silicone textured versus smooth breast
implants differentially influence breast-derived fibroblast morphology and
behaviour. Valencia-Lazcano A. A., Alonso-Rasgado T. and Bayat A., Journal of
the Mechanical Behavior of Biomedical Materials, 40, 140-155, 2014. DOI:
10.1016/j.jmbbm.2014.08.018
Poster presentations
Understanding the effect of protein coatings on cell-surface interaction and
physicochemical properties of breast implants: evaluated using tensile stress testing,
confocal laser microscopy and Raman spectroscopy, Wound Healing Society Annual
Meeting, Denver, Colorado, 2013.
Surface coatings & substrata topographies induce differential regulation of the
expression of adhesion related genes in breast tissue fibroblasts,
European Tissue Repair Society, Reims, France, 2013.
16
Chapter I Introduction
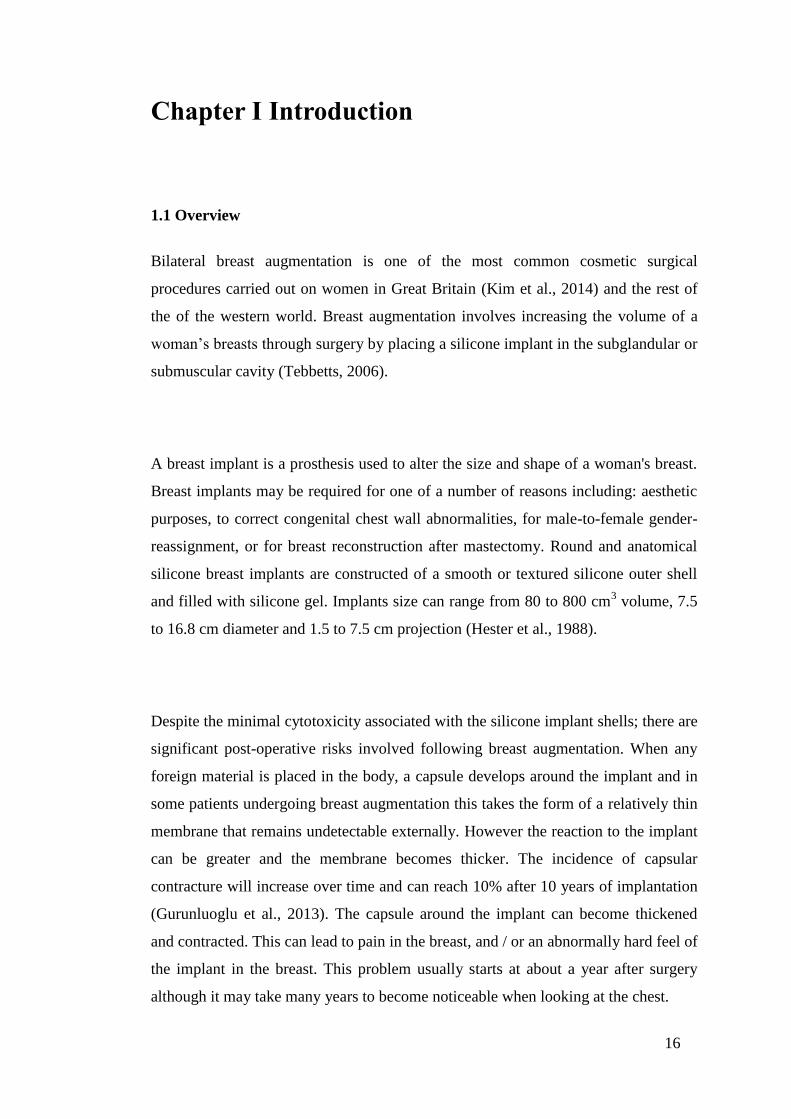
1.1 Overview
Bilateral breast augmentation is one of the most common cosmetic surgical
procedures carried out on women in Great Britain (Kim et al., 2014) and the rest of
the of the western world. Breast augmentation involves increasing the volume of a
woman‘s breasts through surgery by placing a silicone implant in the subglandular or
submuscular cavity (Tebbetts, 2006).
A breast implant is a prosthesis used to alter the size and shape of a woman's breast.
Breast implants may be required for one of a number of reasons including: aesthetic
purposes, to correct congenital chest wall abnormalities, for male-to-female gender-
reassignment, or for breast reconstruction after mastectomy. Round and anatomical
silicone breast implants are constructed of a smooth or textured silicone outer shell
and filled with silicone gel. Implants size can range from 80 to 800 cm3 volume, 7.5
to 16.8 cm diameter and 1.5 to 7.5 cm projection (Hester et al., 1988).
Despite the minimal cytotoxicity associated with the silicone implant shells; there are
significant post-operative risks involved following breast augmentation. When any
foreign material is placed in the body, a capsule develops around the implant and in
some patients undergoing breast augmentation this takes the form of a relatively thin
membrane that remains undetectable externally. However the reaction to the implant
can be greater and the membrane becomes thicker. The incidence of capsular
contracture will increase over time and can reach 10% after 10 years of implantation
(Gurunluoglu et al., 2013). The capsule around the implant can become thickened
and contracted. This can lead to pain in the breast, and / or an abnormally hard feel of
the implant in the breast. This problem usually starts at about a year after surgery
although it may take many years to become noticeable when looking at the chest.

17
Capsular contracture is more common following infection, hematoma, and seroma,
and the chances of this happening to the implanted breast may increase over time.
The exact aetiology of capular contracture remains unknown; however, a variety of
associations including the implant surface topography have been proposed to date
(Burkhardt et al., 1986, Adams et al., 1998, Handel et al., 1995) that may increase the
predisposition to capsular contracture formation (Ersek and Navarro, 1991, Hakelius
and Ohlsen, 1997).
1.2 Research background
In view of the role of implant surface topography, in order to reduce breast capsular
contracture formation, one option would therefore be to attempt to improve the
performance of breast implants by enhancing their surface topography. Publications
on implanting synthetic materials in living tissue have shown that surface texturing
affects healing favourably, with regards to capsule pliability, and seems to inhibit
tumour formation in laboratory rats (Oppenheimer et al., 1955).
By texturing the silicone surface, it is thought that the host response will be altered to
one of wound healing (Ersek et al., 1990). Tissue ingrowth may produce a host-
prosthesis interface that would be more stable, pliable, bio-compatible, thinner and
with a reduced propensity to contract (Ersek et al., 1990).
Additonally, a number of studies have proposed the use of extracellular matrix
(ECM) coatings to elicit specific cellular responses, such as cell adhesion,
proliferation and migration (Bloom et al., 1999, Arthur and Burridge, 2001).

18
Physico-chemical properties of biomaterials that have been shown to influence cell
behaviour include: wettability and surface topography (Clark et al., 1990). However,
characterisation of the physico-chemical properties of several well established and
commercially available implant surfaces, to evaluate the reaction of breast derived
fibroblast to these surfaces, has not been previously investigated thoroughly.
1.3 Objectives and methodology
The aim of this research was to evaluate in detail the biomechanical characteristics of
commercially available smooth versus textuted silicone implant surfaces and to
investigate the effect of the physical, chemical and mechanical features of breast
implant surfaces on breast-derived fibroblast morphology and behaviour. The
research findings provide valuable information about the characteristic expression of
adhesion related genes, cell morphology and proliferation in breast fibroblasts
following the application of specific coatings on smooth, compared to textured,
breast implant surfaces.
In order to investigate the effect of the physico-chemical characteristics of breast
implants that may potentially influence the cell adhesion to surfaces, three different
breast implants, with different characteristics, were evaluated in this research.
The properties of these commercially available smooth and textured silicone breast
implants were explored to find physical, mechanical and chemical characteristics that
could trigger cell-surface adhesion. Confocal laser microscopy was performed to
measure surface roughness parameters and to image the topography of the breast
implant surface. Contact angle measurement was performed to determine the surface
wettability. Raman spectroscopy was employed to study the chemical composition of
the breast implant surface. Tensile testing was employed to measure the stiffness of
the breast implant shells.
19
Finally, having determined the breast implants‘ characteristics that could trigger cell-
surface adhesion it was possible to study the effect of four unique protein and
glycosaminoglycan (GAG) coatings (aggrecan, collagen I, fibronectin and hyaluronic
acid) on breast-derived fibroblast initial cell attachment, cytotoxicity, proliferation,
and cell morphology; the gene expression of α-actinin, vinculin, paxillin, and focal
adhesion kinase (FAK) on these surfaces.
Precise characterisation of the silicone implant surfaces is likely to play a pivotal role
in the development of improved implant surfaces with enhanced cell-surface
interaction. Knowledge of how cell adhesion-related gene expression is regulated in
response to specific coatings and surface features will enable a better understanding
of silicone surface-fibroblast interaction, allowing the development of surfaces that
may be less prone to capsular contracture formation.
1.4 Thesis structure
In this thesis, Chapter I provides a brief overview of breast augmentation and
capsular contracture. This chapter also provides the research background and
describes the objectives and methodology employed in this thesis. Finally, the
structure of the thesis is presented.
Chapter II provides a brief background of breast implants. Firstly, a review of breast
anatomy, characteristics of the silicone gel breast implants such as shape, size,
material, texture and manufacture and the breast augmentation surgical procedure
will be provided. In addition, the evolution of breast implants through the years is
described with the aim of showing the measures taken to reduce the rate of
complications related to breast augmentation.

20
Chapter III reviews the relevant literature on the body-surface interaction when
breast implants are placed in the breast cavity. Firstly, the risks and complications
associated with breast implants are given. Secondly, the characteristics of capsular
contracture are presented. Thirdly, the tissue response once the breast implants are
inserted into the body is described. Finally, the cell-surface adhesion process is given
with the aim of describing the molecular interactions which determine and regulate
cell behaviour on surfaces.
Chapter IV reviews the relevant literature on surface parameters that could induce
cell adhesion onto breast implant surfaces. This chapter also describes the process
used for selecting the relevant surface coatings for improving the performance of
silicone breast implants. Finally, the principles of microscopy to identify fibroblasts
adhered to the surfaces and sharp image acquisition are explained.
Chapter V describes the findngs regarding the characteristics of breast implant
surfaces that can influence cell-surface adhesion such as surface roughness, stiffness
and surface wettability.
In Chapter VI, the effect of four unique protein and glycosaminoglycan coatings
(aggrecan, collagen I, fibronectin and hyaluronic acid) on breast-derived fibroblast
cytotoxicity, attachment, proliferation, morphology, and gene expression is
examined.
Chapter VI presents the conclusions of the thesis.

21
Chapter II Breast implants
2.1 Introduction
A breast implant is a prosthesis used to alter the size and shape of a woman's breast
for aesthetic reasons, congenital chest wall abnormalities correction, male-to-female
gender-reassignment, or breast reconstruction after mastectomy. Attempts to
augment the size and shape of breasts can be traced back to the late 1880s. Among
the materials inserted in breasts were ivory, glass balls, ground rubber, ox cartilage,
sponges and tapes made from various synthetic substances (Grigg et al., 2000). In
1963, the Dow Corning Corporation introduced the first silicone-gel-filled implant.
Since then, the characteristics of breast implants have been modified in order to
create a positive biological response with the host tissue (Berry and Davies, 2010).
Biointegration of breast implants implies an understanding of the anatomy of the
breast; breast implant characteristics and the breast augmentation procedure. This
chapter provides a review of breast anatomy, the evolution of breast implants through
the years and the actual characteristics of silicone gel breast implants such as shape,
size, material, texture and manufacture. In addition, the breast augmentation surgical
procedure is described. The risks and complications associated with breast implants
will be covered in the next chapter.
2.2 Breast anatomy
The breast is the tissue overlying the pectoralis muscles and is composed of
glandular and fatty tissues. The normal breast shape is given by the connective tissue
and ligaments that provide support to the breast parenchyma (Bethesda, 2014).

22
2.2.1 Mammary gland
The mammary gland is a milk-producing gland that is composed mainly of fat. The
endocrine system regulates mammary glands and under the influence of hormonal
changes become functional (Muschler and Streuli, 2010). There is a complex
network of branching ducts within the mammary gland (Shackleton et al., 2006).
These ducts come from the lobules which are sac-like structures. When the lobules
receive the appropriate hormonal stimulation can produce milk in females (Figure
2.1). Milk is transported by the breast ducts from the lobules out to the nipple.
Figure 2.1 Breast anatomy (modified from (Bethesda, 2014)).
2.2.2 Function of the nipples and the surrounding pigmented tissue
The nipple is innervated by the fourth intercostal nerve and becomes erect when
stimulated by a cold environment, sexual activity or breastfeeding. During lactation,
the female mammary glands produce milk which the nipple delivers to the infant.

23
The areola is the small dark pigmented circular area around the nipple. The areola
spreads in size and darkens in pregnancy. Glands in the areola secrete moisture that
serves as a lubricant during lactation (Ellis and Mahadevan, 2013).
2.2.3 Internal features of the breast
The suspensory ligaments and the surrounding fatty tissue support the lobules and
ducts in the breast. The elasticity of the matrix of connective tissue fibres in the
breast provides the characteristic bounce of the breast (Drew et al., 2007).
Inside the breast, there are blood vessels and lymphatics whose function is to carry
blood (blood vessels) and collect and carry tissue fluid (lymphatics). The lymphatic
system drains the waste products from the body; the tissue fluid flows through this
system and drains into veins. The lymphatic system runs from the centre of the chest,
by the sternum to the axilla (Pandya and Moore, 2011).
2.2.4 Pectoral fascia
The pectoral fascia is a thin layer of tissue that encloses the pectoralis major and
minor muscles. Pectoral fascia wraps the two muscles allowing them to glide
smoothly when contracting. It is adhered to the clavicle, while laterally and below
extends, to the scapular region forming the axillary fascia (Dempsey and Latham,
1968).
2.2.5 Breast shape
Skin, fat, and breast tissue (lactiferous ducts along with breast stroma) comprise the
breast structure. Breast begins to develop a functional organ in puberty on the
anterior chest along the embryonic milk line. During puberty the breasts have the

24
shape of a cone, but gravity elongate and make bigger the lower half of the breasts to
form a teardrop shape. The universally accepted concept of well-shaped breast says
that breast will almost not face downwards; the inferior pole of the breast will have
the shape of a half cone; the lateral breast will not go beyond a few centimeters
posterior to the anterior axillary fold; the nipple will be located at the anteriormost
point of the breast mound and a straight line will be formed from the clavicle to the
nipple (Westreich, 2009).
2.3 Breast implants
2.3.1 Evolution of breast implants
In 1895, autogenous fat was used to reconstruct a volume defect after benign tumour
extirpation (Goldwyn, 1978). In 1899 Gersuny performed percutaneous injections of
paraffin (Lewis, 1965). In the 1940s paraffin and petroleum jellies, among other
liquid substances, were injected into the breast.
In 1951 the Ivalon sponge, a synthetic implant made of a polyvinyl alcohol and
formaldehyde polymer, was created by Pangman (Middleton and McNamara, 2000).
The Ivalon sponge elicited ingrowth of scar tissue into the sponge creating seroma
and severe firmness.
Industrial medical-grade silicones were subsequently injected into the breast by
unlicensed practitioners, sometimes in astonishing amounts. Pain, infection, skin
discoloration, disfigurement, ulceration, breast loss, respiratory distress, pulmonary
embolism, liver problems, and even coma and death were caused by silicone breast
injections. Breast injections caused capsular contracture reaching 100% of
occurrence. In 1976, Nevada state law declared the procedure to be a felony after
12,000 - 40,000 women had received breast injections in Las Vegas (Bondurant et
al., 1999).

25
Figure 2.2 Breast implant generations (modified from (Berry and Davies, 2010))
In 1963, the first silicone-gel-filled implant was introduced by Dow Corning
Corporation (Braley, 1973). A high-molecular-weight ―gum‖ filled with amorphous
silica constituted the first Dow implants, in which the gel in the implant was
platinum cured.
88% of all Dow Corning Dacron-patched implants were sold at the beginning of the
1970s (Figure 2.2).Thick shells, with seams and a smooth surface, constituted these
early implants which in the inside contained a firm silicone gel and fluids. The tough
shell reduced the rupture rates, but gel-fluid leakage and capsular contracture were
common. Dow's shells became less thick and were seamless by the late 1960s
(Thomsen et al., 1990).
Saline-filled implants were firstly manufactured by Heyer Schulte Corporation in
1968. The strengthening process of the first saline implants caused there to be a high
First Generation Cronin TD, Gerow FJ: thick smooth shell, implant anatomic, and Dacron patch.
Second Generation Dow Corning: commercial product, thin smooth shell, less viscous gel. Legal claims in
the 80`s / 90`s.
Polyurethane: lower contracture. FDA (cancer)
Double Lumen: silicone shell, saline filling.
Third Generation Multilayered thick shell, reduced leaking, more cohesive silicone.
Fourth Generation Textured surface
Fifth Generation Cohesive silicone gel-filled, form-stable.
1
9
8
0
1
9
7
0
1
9
6
0
1
9
9
0
1
9
9
3

26
deflation rate of up to 76% due to the process involving high-temperature for
vulcanizing. They also were heavy and fragile producing audible sloshing (Crosby,
2013).
In the 1970s and early 1980s the thick-shell models were replaced by implants with
thin shells, increasing the tendency to rupture and deflate. These ―second-generation‖
implants were characterised by a smooth surface, high contracture and gel-fluid
leakage rates. From 1972 to 1975 more companies introduced flexible gels and
thinner elastomer shells (Grigg et al., 2000).
With the aim of reducing contracture a polyurethane foam coating on the implant
shell was developed in the 1970s. This popular implant was placed in approximately
110,000 women before it was discontinued in 1991. The polyurethane coating caused
an inflammatory reaction that repels the formation of fibrous tissue around the
capsule. This implant caused pain, infection and fluid accumulation. Disintegration
of the polyurethane coating ended in a capsule containing foam fragments which
made the implant difficult to remove (Barr et al., 2009).
In order to prevent collagen and other fibrous tissue forming excessive growth
around the implant capsule, a textured shell surface was produced at the beginning of
the mid-1980s. The textured surface allowed the growth of tissue into the irregular
spaces of the shell. Friction from the movement, common in all breast implants,
results in synovium. Textured implants also developed a thin membrane that secreted
synovial fluid, a sticky substance (Grigg et al., 2000).
Another attempt to control contracture, gel and fluid leakage and rupture was the
creation of a double lumen implant. These implants consisted of two cavities and two
shells containing gel in the inside cavity and saline in the outside lumen. By using

27
the saline lumen as an expander or for injections of antibiotics or steroids cosmetic
benefits were expected, but the expectations were not accomplished (Nichter and
Hamas, 2012).
The third generation of implants dating from the mid-1980s, decreased the deflation,
bleeding, contractures and rupture rates by manufacturing stronger shells with barrier
layers and texturing surfaces (Bondurant et al., 1999).
Nowadays, most implants have one cavity filled with silicone gel. The shell is
manufactured with silicone rubber and, to prevent the escape of silicone fluid, has an
inside barrier coated with fluorosilicone or a modified layer of elastomer (Bondurant
et al., 1999).
The 1992 Food and Drug Administration (FDA) moratorium on the use of silicone
gel and saline-filled implants caused the single-lumen implants to almost entirely
replace the gel-filled models. Implant reconstruction after mastectomy increased
from 3% of implants in 1983 to more than 25% in 1992 (Cohen, 1994).
Current saline implants are improved by eliminating visible wrinkles through the
skin and audible fluid waves within the implant by slightly overfilling the implant
and placing it behind the chest muscles. Some saline implants used in reconstruction
have valves that allow new tissue forms around the pockets to be created by
gradually inflating the valve after surgery (Maxwell and Gabriel, 2009).
The period from 1992 to 1994 was marked by complaints to the FDA by numerous
law suits resulting in much negative publicity, despite the fact that majority of
women were satisfied with their implants (Brody, 1997).

28
2.3.2 Material
Silicone has been used in medical devices because of its low toxicity and biological
stability and has the capacity to be easily shaped and moulded (Prasad et al., 2010).
Silicone belongs to the organic silicon polymer family mainly composed of a chain
of alternating oxygen and silicon atoms. Each silicon in the chain has two methyl
groups (CH3-) and the material is named poly (dimethylsiloxane) (PDMS) as shown
on Figure 2.3.
Figure 2.3 Schematic representation of Silicone showing one end and two central
subunits
Silicone gel is composed of a matrix of cross-linked long silicone chains soaked in a
bath of non-cross-linked long silicone chains. The matrix is generally formed by
vinyl groups placed as cross-links, between silicon atoms, on neighbouring silicone
molecules. Vinyl cross-links are often created by catalysis of platinum in an
exothermic reaction (Middleton, 1998). Silicone gel has the capacity of providing the
feel of human adipose tissue, but has enough strength to maintain its shape
(Bondurant et al., 1999).
2.3.3 Shapes
Breast implants come in round and anatomical shapes (Figure 2.4). The anatomical
shape has a tear drop shape that mimics the slope of a natural breast. The implant
stays upside down due to its textured surface that avoids the implant flipping inside
the breast. When the patient is lying down, the implants will maintain the same
shape. In the supine position round implants settle back evenly like normal breasts.

29
In the standing-up position, gravity makes the filler substance go to the bottom of the
implants and the implants assume a natural tear drop shape. Round implants have a
more natural appearance when placed under the muscle than anatomical implants
which can look elongated in some women (Berry et al., 2010).
Figure 2.4 Lateral view of breast implants: on the left, round shape; on the right,
anatomical shape
2.3.4 Sizes
Implant sizes vary from 80 to 800 cubic centimetres in volume, but there are also
1,000 cc implants (Hester et al., 1988). The diameter ranges from 7.5 to 16.8 cm and
the profile is from 1.5 to 7.5 cm as seen on Figure 2.5 (Hester et al., 1988). The
diameter of the implant should adequately cover the natural diameter of the breast
size without taking the implant too far towards the cleavage and underarm.

30
Figure 2.5 Projections of breast implants (modified from
(Allergan, 2006))
2.3.5 Implant shell
Breast implant shells are made of silicone rubber, whose composition of amorphous
silica is approximately 21-27% in the elastomer for the shell and in shell patches, and
16.5% in barrier coats according to Dow Corning corporation, but the chemical
composition of other manufacturers could vary (Bondurant et al., 1999). Shell
thickness varies from 0.13 to 0.75 mm. Depending on the manufacturer; shells have
either smooth elastomer rubber or are textured with a different surface topography of
varying coarseness:
Textured surface
Textured surface was created in the 1980s with the aim of reducing capsular
contracture. The texture was designed for fibroblasts to grow into the interstices of
the pores, disorienting collagen fibrils, and weakening their contractile forces
forming a thinner capsule and minimizing the contracture (Barone et al., 1992,
Whalen, 1988, Ulrich et al., 2009). Formation of peri-implant synovial tissue, which
is a joint lining-like tissue reaction, can appear in textured silicone implants (Raso
and Greene, 1997), which along with a more cellular capsule can cause excessive
contracture.
Implant Diameter
Implant projection

31
Depending on the manufacturer, the size and shapes of the texture of the silicone
implant surfaces vary (Figure 2.6). For instance, the SILASTIC MSI breast implant
(Micro Structured Implant) had regular pillars of 750 m high, diameter of 250 m,
and distance between pillars of 500 m. McGhan Biocell has the topography of an
open pore network at 3.1 pores per m2, and side size of 289 m, the height varies
from 500 to 800 m. Mentor Siltex has bumps of 65-150 m high and 60-275 m
wide. Bioplasty Misti is composed of pores 20-800 m wide (Jenkins et al., 1996).
Figure 2.6 Textured (left) and smooth (right) breast implants
2.3.6 Manufacturing process of silicone breast implants
The usual multiple dipping method to manufacture commercially conventional
silicone breast implants consists of using mandrels with the shape of the implant to
form the scaffolds that support the implant. The mandrel is immersed in liquid
silicone until a homogeneous layer is formed, then it is polymerized into a laminar
flow cabinet or oven. The thickness of the implant is increased by repeating this
procedure (Barr and Bayat, 2011).
The smooth surface is created by immersing the implant in solvent to flatten this
outer surface. To prevent silicone gel leakage through the shell silicone prepared

32
with a phenyl group, instead of the methyl group, is used to make a second layer on
the shell (Barr and Bayat, 2011).
The textured surface is created, after the mandrel is coated with silicone, to be then
pushed into specific molecules whose shape and size produce three-dimensional
projections of 20 - 500 microns in size. This is polymerized into a laminar flow
oven. The molecules are removed by washing after it is cured (Biocell surface) or
by brushing before curing (Cereform surface) (Ersek et al., 1990).
Dow Corning‘s Medical Grade Silastic was produced by making mould surfaces
with photolithography in a class-100 clean room. Impression casting of silicone
monomer on the wafers is used to create textured and smooth silicone surfaces.
Silicone was applied on the wafers under vacuum conditions and then cured at room
temperature for 3 days and subsequently at 55 C for 2 h. The silicone sheets are then
detached from the wafer and inspected with phase contrast microscopy for regularity
of the pattern, dimensions (deviations up to 10% for depth, groove and ridge width),
transparency and contamination of air bubbles or dust. Ultraviolet (UV) light
exposure is used to sterilize the samples, and extraction in sterile phosphate-buffered
saline (PBS) was performed to remove any hazardous substances that might have
been released during UV irradiation.
Patterning PDMS using etching is another way to create varied surface roughness by
controlled etching with potassium hydroxide (KOH) in mixed organic/aqueous
solvents. The silicone elastomer is placed in the basic etchant solution and shaken for
6 h at room temperature. At the end of the etching process, the elastomer disks were
washed extensively to remove any adhering materials, and finally flushed with
nitrogen and then let to dry overnight in a vacuum chamber at room temperature
(Prasad et al., 2010).

33
2.4 Breast augmentation surgery
The overall method of augmenting the breast will depend on factors such as
preferences made by the patient and the surgeon as well as the patient‘s anatomy.
The routine surgical procedure often involves first making an incision
(inframammary, periareolar and axillary incision) (Figure 2.7). Then the implant can
be placed subgladular or subpectoral (Figure 2.8), depending on the volume and
shape of the breast tissue. (Tebbetts, 2006).
An incision should be of an appropriate length to accommodate the style, size, and
profile of the implant in order to reduce the stress to the implant during insertion.
The most common type of incision is the inframammary. The periareolar incision
usually causes minimal scarring and is thought to be more concealed (Spear et al.,
1995). In the axillary incision bleeding may be difficult to control and the abundance
of lymphatics in the axilla can produce an untoward lymphangitis of the upper arm,
clearly a dangerous and unacceptable complication for an elective cosmetic
procedure.
Figure 2.7 Types of incisions (modified from (Berry et al., 2010))
Axillary
Periareolar
Inframammary

34
Placement of an implant in any pocket location initiates a complex series of events
(anatomic, mechanical, and biological) that vary significantly from patient to patient
over time (Tebbetts, 2006). Subglandular placement may result in more palpable
implants with greater likelihood of capsular contracture, (Henriksen et al., 2005,
Kulmala et al., 2004) and increased difficulty in imaging the breast with
mammography (Spear et al., 2004). Subpectoral placement may result in less
palpable implants, less likelihood of capsular contracture (Hidalgo, 2000), and easier
imaging of the breast for mammography.
Figure 2.8 Subglandular (left) and subpectoral (right) placement (modified from
(Berry et al., 2010))

35
Chapter III Capsular contracture and cell
adhesion
3.1 Introduction
Capsular contracture is the most common complication of breast augmentation
occurring in approximately 10% of the patient population (Zahavi et al., 2006). The
causes of capsular contraction remain unknown, but it is characterised by dense
fibrocollagenous connective tissue with local inflammatory response.
This tissue response may be affected by factors related to the implant or tissue. These
include implant design, implant localization, physico-chemical surface properties, the
host bed conditions, surgical technique and mechanical load (Hilborn and Bjursten,
2007).
Tissue response can be affected by the shear stress and strain elicited at the tissue
implant interface by the natural movements of the tissue. Any movement of the host
creates a shearing effect and stresses will be concentrated at the interface between the
implant and tissue. Cells respond to shear stress with the production of
proinflammatory signals that recruit immune cells (Bao et al., 1999) and foreign
body reaction. Thus, the effect of stress on cellular response is inherently coupled to
the rearrangement of the cells in the cytoskeleton, to the adhesion to the ECM and to
other cells, and in the remodelling of the ECM itself.

36
In this thesis, cell-surface adhesion will be studied as well as the characteristics of
breast implant surfaces as it is known that surface topography influences cell
morphology and adhesion, which in turn influence the incidence of capsular
contracture. The rationale behind the efficacy of reducing capsular contracture with
textured breast implants is based on the fact that, on these types of surfaces, cells are
able to grow in and around the interstices of the surfaces creating a connection with
the host prosthetic interface to prevent micro-motion. This results in thinner capsule
formation, whereas smooth implant surfaces elicit a fibrous reaction where collagen
fibrils align cumulatively in a connective-tissue capsule adjacent to the implant.
Therefore, any movement of the host creates a shearing effect of any microscopic
surface irregularity, resulting in a chronic inflammatory, thickly scarred pseudo-
bursa around the smooth implant (Emery et al., 1994).
In order to understand capsular contracture, this chapter first addresses the risks and
complications associated with breast implants. Therefore, it is essential to understand
how tissue responds to the breast implants once inserted into the body. This involves
the study of the foreign body reaction, the phases of wound repair, the process of
prosthesis encapsulation, and the contraction of the capsule. Finally, when
investigating cell-surface adhesion, the role of molecular interactions in the
determination and regulation of cell behaviour on surfaces is discussed in this
chapter. The tissue response may be influenced by the physico-chemical properties
of the implant surface. A detailed description of these properties will be given in the
following chapter.
3.2 Complications related to breast implants
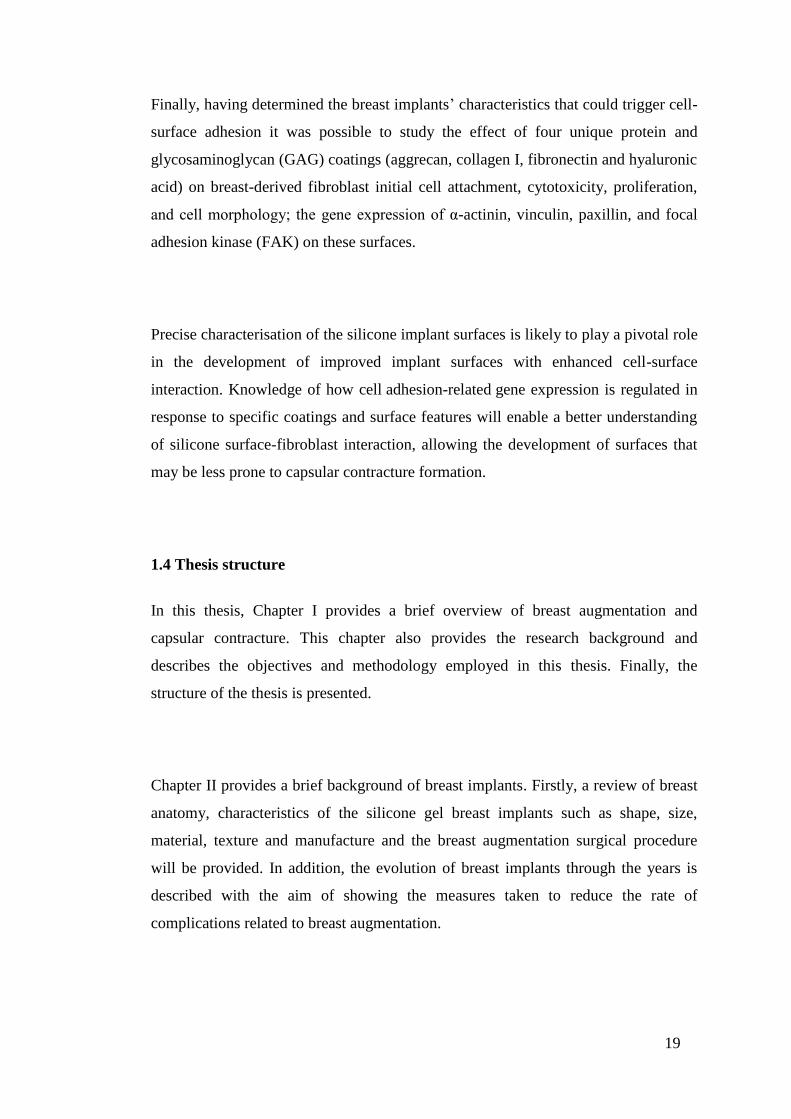
Risks and complications associated with breast implants can be categorized in
immediate, short-term, and long-term adverse effects (Pereira and Sterodimas, 2009)
as shown in Figure 3.1. In the paragraphs below, the most common complications are
briefly explained.

37
Rupture
Pain, hard lumps in the armpit or around the implant, swelling, change in size or
shape of the breast or implant, burning, tingling, hardening, or numbness of the
breast can be symptoms of gel implant rupture (Brown et al., 1997). Breast implant
rupture refers to a tear or hole in the implants‘ shell. Rupture can be caused by
damage by surgical instruments; trauma; wrinkling or folding of the implant which
may weaken the shell; severe capsular contracture; and compression during
mammographic imaging (Berry and Davies, 2010). Mechanical testing of explanted
ruptured silicone breast implants revealed that elasticity, toughness, and shell
strength declines with time, probably because of lipid infiltration (Adams et al.,
1998). The consequences of rupture can make silicone gel remain between the scar
tissue capsule and the implant (intracapsular rupture), flow outside the capsule
(extracapsular rupture), or move beyond the breast (migrated gel).
Reoperations
Reasons for reoperation includes rupture, capsular contracture, hypertrophic scarring
(irregular, raised scar), asymmetry, infection, and implant shifting (Adams and
Mallucci, 2012).
38
Figure 3.1 Adverse effects associated with breast implants
Implant removal
Reasons for implant removal include dissatisfaction, an unacceptable cosmetic result,
or a complication such as symptomatic capsular contracture. There is a chance of
future complications resulting from having the implants removed and replaced.
Women who have their implants removed have them replaced with the same
implants; the implants may be cosmetically unacceptable due to dimpling, wrinkling,
puckering, and other cosmetic changes of the breast. Moreover, implant removal may
result in loss of breast tissue, so implant replacement increases the risks of future

39
complications. Implant replacement increases the risks of capsular contracture and
reoperation in comparison to first time placement of the implant (Gabriel et al.,
1997).
Unsatisfactory results
Breast augmentation can have unsatisfactory results such as asymmetry, wrinkling,
implant displacement, implant palpability, incorrect size, scar deformity, and/or
hypertrophic scarring (Steiert et al., 2013).
Pain
Following breast implant surgery, pain of varying intensity and length of time may
occur and persist. Furthermore, pain can result from improper size, surgical
technique, placement, or capsular contracture (Zhibo and Miaobo, 2009, Young et
al., 2004).
Changes in nipple sensation
During a periareolar incision, the nerve or the nerve endings can be damaged, so
sensation in the nipple-areolar complex decreases or disappears and the suckling
reflex will be lost (Hurst, 1996). Studies show that 3 years after surgery, nipple
sensation was lost in 8–10% of women and after 5 years in 10% of women (Kostas,
2007).
Infection
Infections following breast augmentation surgery appear within a few days to a few
weeks after the operation (Pittet et al., 2005). Reasons for infection can be due to any

40
of the following: skin atrophy, corticosteroids in subglandular augmentation,
additional simultaneous surgery, massage and trauma postsurgically, vigorous
exercising, pregnancy, preceding lactation. Pain, inflammation, sudden fever,
sunburn-like rash on the operated area, discharge and swelling are symptoms and
signs indicating possibility of implant related infection. The bacteria that can cause
infection include: mycobacteria, Staphylococcus aureus and Staphylococcus
epidermidis, Pseudomonas, Klebsiella, Streptococci A and B and enterobacteria
(Brand, 1993). Removal of the implant and new implant replacement will be
necessary if an infection does not respond to antibiotics.
Hematoma / Seroma
Swelling, pain, and bruising soon after surgery can be symptoms of hematoma or
seroma. Seroma is an accumulation of fluid around the implant and hematoma is a
collection of blood within the space around the implant. Seroma and/or hematoma
could develop infection and / or capsular contracture. Surgery on hematomas and
seromas involves draining and temporarily placing a surgical drain in the wound for
proper healing. Surgical draining can damage the implant causing its rupture (Grigg
et al., 2000).
Breastfeeding
Breastfeeding difficulties have been reported proceeding a periareolar incision and
there is a chance of lactation insufficiency (Marianne et al., 1990, Tran et al., 2014).
Calcium deposits
Pain and firmness can be symptoms of calcium deposits, the occurrence of which
increases significantly with age post-implantation. Calcium deposits can form in the
tissue capsule surrounding the implant. The appearance of calcium on mammograms

41
can be similar to the appearance of cancer, resulting in additional surgery to examine
or remove calcifications. Additional surgery may also damage the implants (Lee et
al., 2011).
Extrusion
Extrusion can occur when breast tissue covering the implants weakens, or when the
wound has not closed. Extrusion is when the breast implant comes through the skin.
It has been reported that radiation therapy could increase the likelihood of extrusion.
Extrusion requires additional surgery and possible removal of the implant, resulting
in loss of breast tissue and/or additional scarring (Allergan, 2006).
Necrosis
Infection, use of steroids, smoking, chemotherapy/radiation, and excessive heat or
cold therapy can lead to necrosis. Necrosis is the death of cells, or even tissues; that
delay or prevent wound healing. Necrosis will require surgical correction, resulting
in loss of breast tissue or additional scarring (Gabriel et al., 1997).
Delayed wound healing
After augmentation mammaplasty, a prolonged wound healing time can be
experienced. This increases the risk of extrusion, infection, and necrosis. Wound
healing times may vary depending on the type of surgery or the incision (Prantl et al.,
2007).

42
Breast tissue atrophy / chest wall deformity
Thinning of breast tissue and chest wall deformity are caused by the pressure of the
breast implant following implant removal without replacement or while implants are
still in place. Implant visibility and palpability may result in additional surgeries
and/or puckering or dimpling of the breast (Tebbetts and Teitelbaum, 2010).
Lymphadenopathy
A chronic enlargement of the lymph nodes is called lymphadenopathy. Lymph nodes
are located in the lower axilla near the breast (Rivero et al., 1994). Removal of the
lymph node(s) will be necessary if they become too large or painful (Katzin et al.,
2005).
Capsular contracture
Following augmentation mammaplasty, a capsule forms around a breast implant, but
the abnormal hardening and tightening of the capsule forms what is called capsular
contracture (Yang and Muradali, 2011). Characteristics of capsular contracture will
be studied in detail below.
3.2.1 Capsular contracture
The most common complication of breast augmentation is capsular contracture that
encircles the implant. This occurs in approximately 10% of the patient population
after 10 years of implantation (Kjoller et al., 2001, Zahavi et al., 2006, Gurunluoglu
et al., 2013). A fibrous capsule usually forms around silicone breast implants. This is
a relatively hypocellular membrane of rather uniform thickness which is rich in
collagen. There may be a thin discontinuous layer of activated epithelioid
myofibroblasts next to where the implant was situated and a thin acellular protein
film between the implant and capsule. Both within and directly below this

43
membrane, there are usually foam cells and lymphocytes, often in large numbers
(Van Diest et al., 1998). The scar tissue (capsule) that normally forms around the
implant may tighten and squeeze the implant, making the breast feel firmer and
sometimes painful. This is called capsular contracture (Yang and Muradali, 2011).
Capsular contracture may be more common following infection, hematoma, and
seroma, and the chance of it happening may increase over time. Capsular contracture
is a risk factor for implant rupture and it is one of the most common reasons for
reoperation. However, whilst aeiology remains unknown, a variety of causal
associations have been proposed (Burkhardt et al., 1986, Adams et al., 1998, Handel
et al., 1995) that may predispose implants to capsular contracture formation
including the implant surface topography (Ersek and Navarro, 1991, Hakelius and
Ohlsen, 1997).
Capsular contracture is currently evaluated according to the Baker grading score.
Capsular contracture is graded into 4 levels according to its symptoms (Spear et al.,
1995). According to Baker‘s system, class I represents a soft and natural breast
appearance without any detectable capsular contracture (Young and Watson, 2000).
Class II represents an implant easily detected by the surgeon, where the surrounding
scar capsule suggests some degree of contraction. In class III there is discomfort and
the breast is firm and the implant is palpable. Class IV is characterised by severe
pain, a distorted shape of the implant, and an easily palpable implant. Severe
capsular contracture requires capsule tissue and/or implant removal. This procedure
implicates loss of breast tissue and there is a possibility that capsular contracture
occurs again (Spear et al., 2004, Marshall et al., 1989).
Closed and open capsulotomies are two ways to reduce the firmness of a contracture.
In the closed capsulotomy, the hardened implant is manually squeezed tightly from
the outside, in an attempt to tear the scar envelope. When successful the result is

44
instantaneous and the implant immediately feels soft. Due to some scars being very
hard it makes it impossible for them to be torn. A closed capsulotomy can result in
bruising, bleeding, or even rupture of the implant itself. If rupture occurs then
surgery will be needed to remove and replace it. Due to this, closed capsulotomy is
the less favorable method and not in current use in modern practice. (Kjoller et al.,
2001).
Open capsulectomy is the most successful and commonly used method for capsular
contracture, whereby the surgeon makes an incision to enter into the pocket and
makes cuts into the scar tissue. These cuts are made to release tension around the
implant caused by capsular contracture. The implant is then reinserted into the breast
pocket. Unfortunately, even after a successful capsulectomy, there is always the
possibility of recurrent hardening and capsular contracture development (Kjoller et
al., 2001).
3.3 Tissue response to breast implants
Once the breast implant is inserted into the body, the immediate tissue response is to
flood the injured area with fibrinogen and blood which will cleave to fibrin and form
a blood clot that will promote platelet adhesion and aggregation. White blood cells
are recruited by cytokines and growth factors that the blood clot released. This will
make monocytes appear and differentiate into macrophages that will clean the wound
site of dead cells, bacteria, and foreign material. Fibroblasts and endothelial cells,
recruited by macrophages, convert the fibrin clot into a highly vascularised tissue.
The extracellular matrix (ECM), deposited mainly by fibroblasts, replaces the
vascularised tissue (Hilborn and Bjursten, 2007). Following resolution of the acute
and chronic inflammatory responses, granulation tissue identified by the presence of
macrophages, infiltration of fibroblasts and neovascularization in the new healing
tissue, is identified. The cellular components of foreign body reaction: 1-2 cell layers
of monocytes, macrophages and foreign body giant cells, separate the implant from
the granulation tissue. Granulation tissue is the precursor to fibrous capsule

45
formation. The inflammatory reaction leads to capsule formation that often forms
undesirable growth of fibrotic tissue around the implant (Hilborn and Bjursten,
2007). Tissue response to breast implants follows the wound healing phases (Figure
3.2). These phases overlap, but are biologically different and are characterised by
events that promote closure of the injury. The wound healing phases are described
below.
Figure 3.2 Phases of wound repair (adapted from (Mendonca and Coutinho-Netto,
2009))
3.3.1 Inflammation
During the early inflammatory phase, the leaking of blood constituents and
concomitant platelet aggregation, blood coagulation, and generation of bradykinin
and complement-derived anaphylatoxins occurs after the blood vessel is disrupted
(Williams and Jose, 1981). Blood coagulation is triggered when the activated
platelets aggregate. This makes hemostasis in the disrupted blood vessels and
releases biologically active substances. These substances are an array of molecules
% M
axim
um
res
ponse
Inflammation
early phase late phase Wound
contraction
0.1 0.3 1 3 10 30 100
Days from time of injury
Wound
breaking
strength
Collagen
accumulation
Granulation tissue formation
Matrix formation and remodelling
100%
0%

46
that promote cell migration and growth in the injury (Ginsberg, 1981). The extent of
platelet aggregation and blood coagulation to the wounded area are limited by
intrinsic activities of the blood vessel endothelium.
Neutrophils and monocytes are attracted by the chemotactic factors to sites of tissue
injury and inflammation. Contaminating bacteria is eliminated by neutrophils in the
early inflammatory phase of tissue injury. The early inflammatory phase of wound
healing ends once the bacteria is eliminated (Hilborn and Bjursten, 2007). The set of
events necessary to clear the wounds from bacterial contaminations is listed above
(Hilborn and Bjursten, 2007).
1. Opsonisation of bacteria by complement
2. Generation of chemotactic factors
3. Adhesion of polymorphonuclear leukocytes to endothelial cells
4. Emigration of polymorphonuclear leukocytes through blood vessels
5. Attachment of opsonised bacteria to polymorphonuclear leukocytes
6. Phagocytosis of bacteria
7. Killing and digestion of bacteria
The acute inflammatory phase will continue if there is wound contamination, so the
next phases of wound healing will be interfered. Therefore, the attempt to eliminate
foreign objects and bacteria from the injured area will provoke more inflammation
and tissue destruction.
Tissue repair is initiated at the time monocytes convert to macrophages (Leibovich
and Ross, 1975). The pathogenic organisms are phagocytosed and digested by
macrophages and neutrophils. Macrophages also scavenge tissue debris and effete
neutrophils. The release a biologically active substances by the macrophages,

47
facilitate the recruitment of additional inflammatory cells. This aid the macrophage
in tissue decontamination and debridement, and releases growth factors and other
substances those are necessary for granulation tissue formation (Table 3.1).
Table 3.1 Macrophage activities in wound repair (modified from (Wynn et al.,
2011))
Activity Elements involved
Scavenging Pathogenic organisms
Tissue debris
Secretion of biologically active substances
Vasoactive mediators
Chemotactic factors
Growth factors
Proteases
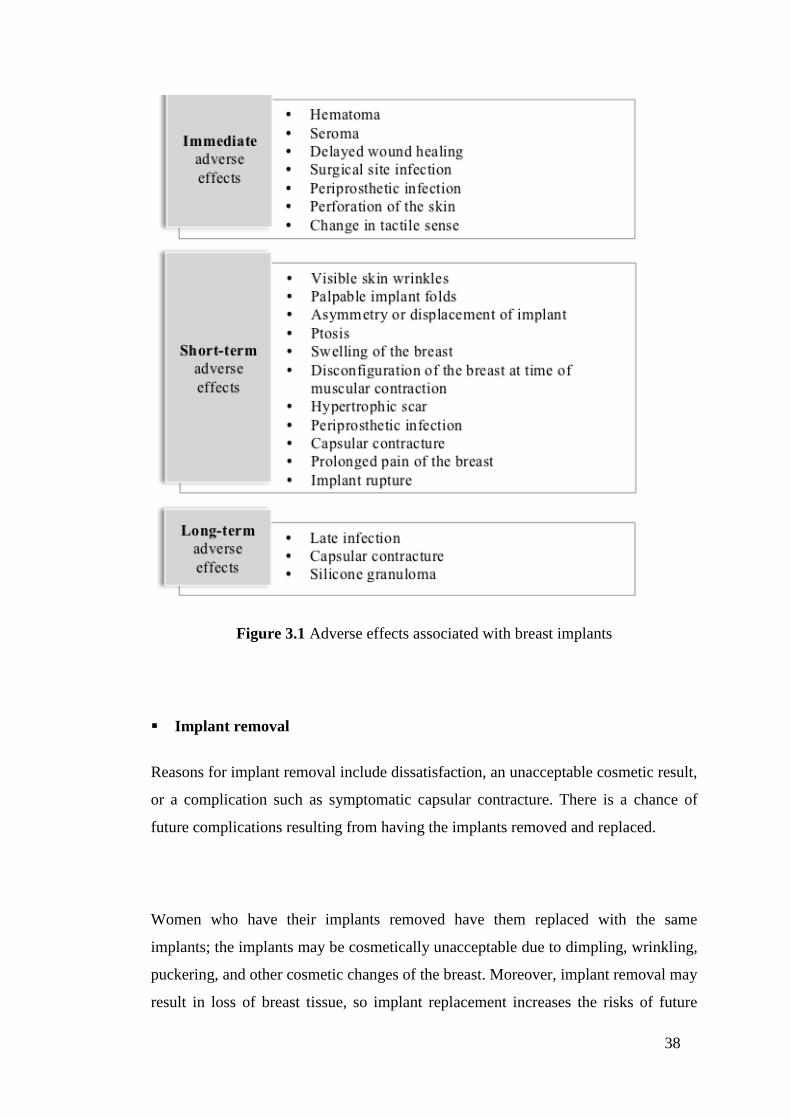
3.3.2 Granulation tissue formation
Granulation tissue is composed by a loose matrix of collagen, hyaluronic acid and
fibronectin, where macrophages, neovasculature and fibroblasts reside. The growth
and chemotactic factors released by macrophages stimulates the granulation tissue
formation (Table 3.2). These factors stimulate fibroblast to proliferate, migrate, and
deposit matrix. Fibroblasts form the connective tissue matrix which provides a
substratum for macrophages, new blood vessels, and fibroblasts themselves to
migrate (Table 3.3) (Enoch and Leaper, 2008).
In response to macrophage growth stimuli and fibroblast neomatrix, the endothelial
cells form capillary buds toward the centre of the wound. Neovasculature provides
macrophage and fibroblast with oxygen and nutrients necessary to grow. Therefore,
during granulation tissue generation, the macrophages, fibroblasts, and blood vessels
depend on each other (Hunt, 1980).
48
Table 3.2 Major components of late inflammatory and early granulation tissue
formation phases of tissue repair (modified from (Eming et al., 2007))
Composition of granulation tissue Components
Matrix componets
Fibrin
Fibronectin
Collagen I/III
Hyaluronic acid
Cellular components
Epidermal cells
Macrophages
Endothelial cells
Fibroblasts
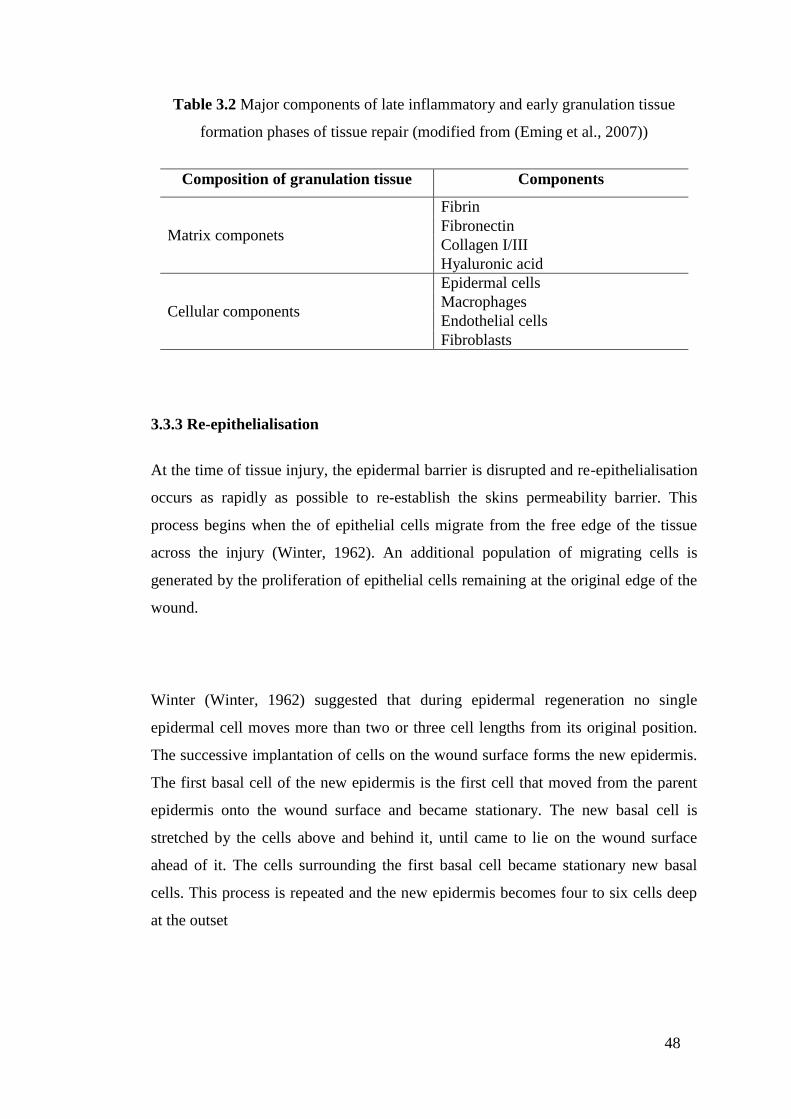
3.3.3 Re-epithelialisation
At the time of tissue injury, the epidermal barrier is disrupted and re-epithelialisation
occurs as rapidly as possible to re-establish the skins permeability barrier. This
process begins when the of epithelial cells migrate from the free edge of the tissue
across the injury (Winter, 1962). An additional population of migrating cells is
generated by the proliferation of epithelial cells remaining at the original edge of the
wound.
Winter (Winter, 1962) suggested that during epidermal regeneration no single
epidermal cell moves more than two or three cell lengths from its original position.
The successive implantation of cells on the wound surface forms the new epidermis.
The first basal cell of the new epidermis is the first cell that moved from the parent
epidermis onto the wound surface and became stationary. The new basal cell is
stretched by the cells above and behind it, until came to lie on the wound surface
ahead of it. The cells surrounding the first basal cell became stationary new basal
cells. This process is repeated and the new epidermis becomes four to six cells deep
at the outset
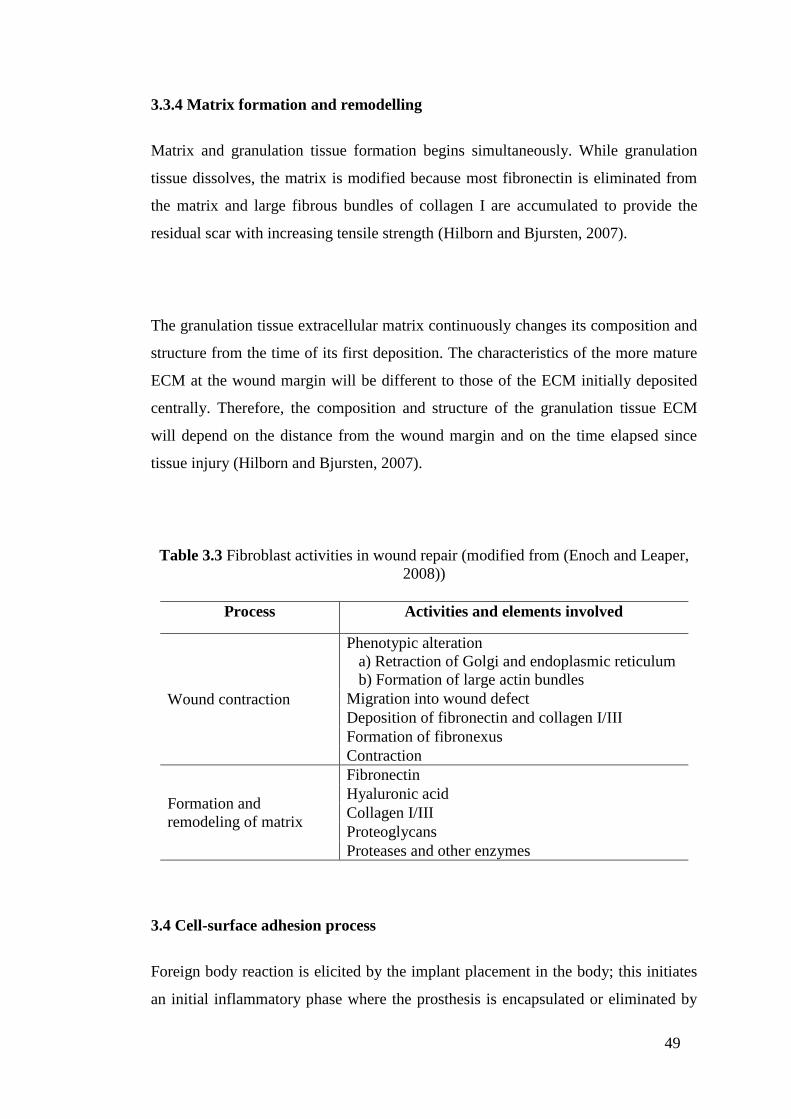
49
3.3.4 Matrix formation and remodelling
Matrix and granulation tissue formation begins simultaneously. While granulation
tissue dissolves, the matrix is modified because most fibronectin is eliminated from
the matrix and large fibrous bundles of collagen I are accumulated to provide the
residual scar with increasing tensile strength (Hilborn and Bjursten, 2007).
The granulation tissue extracellular matrix continuously changes its composition and
structure from the time of its first deposition. The characteristics of the more mature
ECM at the wound margin will be different to those of the ECM initially deposited
centrally. Therefore, the composition and structure of the granulation tissue ECM
will depend on the distance from the wound margin and on the time elapsed since
tissue injury (Hilborn and Bjursten, 2007).
Table 3.3 Fibroblast activities in wound repair (modified from (Enoch and Leaper,
2008))
Process Activities and elements involved
Wound contraction
Phenotypic alteration
a) Retraction of Golgi and endoplasmic reticulum
b) Formation of large actin bundles
Migration into wound defect
Deposition of fibronectin and collagen I/III
Formation of fibronexus
Contraction
Formation and
remodeling of matrix
Fibronectin
Hyaluronic acid
Collagen I/III
Proteoglycans
Proteases and other enzymes
3.4 Cell-surface adhesion process
Foreign body reaction is elicited by the implant placement in the body; this initiates
an initial inflammatory phase where the prosthesis is encapsulated or eliminated by

50
the host. The adhesion of animal cells to polymer surfaces occurs generally in two
steps. Firstly, the cell examines the surface for suitable protein ligands by
approaching to a surface and expanding out a temporary pseudopodial extension to
later form an initial temporary focal attachment. Secondly, the cell spreads over the
surface and creates more permanent local attachments. Thus, a combination of non-
specific and specific interactions creates the adhesion process. There are many forces
considered the sources of cell sticking (Khorasani and Mirzadeh, 2004): specific
charge-charge interactions at contact, electrostatic repulsion, hydration repulsion, and
van der Waals attraction. Specific adhesion involves receptor-ligand bonding, that is
the case of integrins that binds to ECM molecules such as fibronectin, collagen and
laminin.
Anchorage-dependent cells adhere and grow upon the provision of a suitable
substratum, which allows the establishment of a complex set of molecular
interactions. These determine and regulate morphology, motility, growth and
metabolism (Lydon et al., 1985). Therefore, the anchorage-dependant cell behaviour
will be regulated by the definition of the substratum properties.
The ECM in the breast tissue is comprised of specific proteins and proteoglycans
(Muschler and Streuli, 2010). Fibroblasts use surface receptors to interact physically
with their immediate environment (Bershadsky et al., 2003). ECM receptors, mainly
integrins, provide attachment to the surrounding stroma. The associations of the
heterodimeric receptors formed by integrins define the influence to different ECM
components.
A protrusion is sent in the direction of the movement in cell migration, integrin
clustering and formation of adhesion complexes are induced by the extracellular
substrate bound by integrin receptors (Biname et al., 2010). This leads to eliciting the
adaptor proteins to connect the adhesion points to the actin cytoskeleton. This starts

51
focalized intracellular signalling which depend on the proteins created and the type
of integrin engaged in the interaction with its specific extracellular substrate. At the
leading edge of the protrusions, small temporary adhesion complexes mature into
larger structures named focal contacts when they are under tension. Focal adhesions,
the more stable structures, are connected to actin stress fibres (Berrier and Yamada,
2007).
3.4.1 Forces at the interface between cells and their environment
The cell‘s own contractile machinery and a variety of environmental factors act at the
interface between cells and the extracellular matrix or between cells and their
neighbours, Cells sense these forces and their application triggers physiological
responses that affect the cell behaviour and structure. Local structural changes in
adhesion sites and the attached cytoskeleton, alterations in cell proliferation, motility,
and survival are responses to these mechanical perturbations. However, it is
uncertain the mechanism underlying the conversion of physical signals in adhesion
sites into chemical signals (Gillespie and Walker, 2001, Hamill and Martinac, 2001).
The forces that the cell produces are primarily generated by the different cytoskeletal
networks that span the cytoplasm. Actin polymerization generates forces that can be
applied to organelles, membranes, and other cytoskeletal systems, thus leading to
their deformation (e.g., protrusion of the lamellipodium) or translocation (e.g.,
organelle transport) (Carlier et al., 2003).
3.4.1.1 Cell adhesions
In focal adhesions, the integrin receptors are heterodimers whose alpha and beta
subunits link the ECM to the cytoskeleton. Networks of adapter or anchor proteins
that form a submembrane plaque mediate this transmembrane interaction. These
connections are stablished by the cytoplasmic domains of β-integrin subunits. Talin,

52
α-actinin, filamin and tensin can directly link integrins with the actin filaments
(Geiger et al., 2001, Liu et al., 2000, Zamir and Geiger, 2001). Appart from these
direct linkers, there are several potential connections composed of two or more links
(Zamir and Geiger, 2001, Geiger et al., 2001), and new discovered components is
increasing (Tu et al., 2003).
Focal adhesions and focal complexes are apparently associated with different sub-
domains of actin cytoskeleton (Geiger and Bershadsky, 2001, Rottner et al., 1999). A
dense, rapidly polymerizing branching network of actin filaments are contained in a
protruding lamellipodia
The actin-related protein-2/3 (ARP2/3) complex is contained in focal complexes, and
it is reported a transient molecular interaction between vinculin and Arp2/3 (DeMali
et al., 2002). Transition of the associated actin mesh into densely packed straight
bundles of filaments (stress fibres) accompain the transition of the focal complexes
into focal adhesions (Heath and Dunn, 1978).
Among the actin-associated proteins contained in the stress fibres, myosin II in an
active form apparently apply tension to the membrane-bound adhesion plaque
(Matsumura et al., 1998, Katoh et al., 2001). These tension forces are transmitted via
integrins to the extracellular matrix.
3.4.1.2 Forces the cell exerts via focal adhesions
Different cell types generally produce different traction forces and develop matrix
adhesions of different sizes. Thus, different cell types exert similar forces per unit of
the adhesion area (stress) (Balaban et al., 2001, Beningo et al., 2001). The actin
cytoskeleton generates forces that the integrin-mediated matrix adhesions transmit,
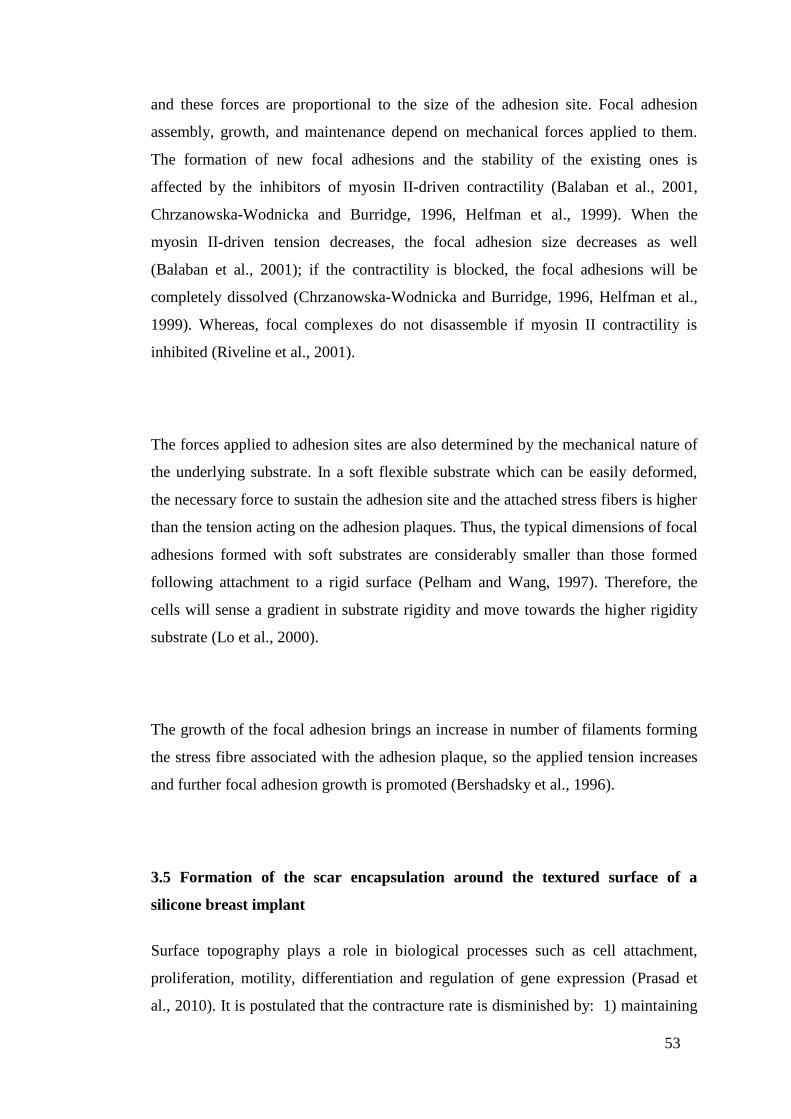
53
and these forces are proportional to the size of the adhesion site. Focal adhesion
assembly, growth, and maintenance depend on mechanical forces applied to them.
The formation of new focal adhesions and the stability of the existing ones is
affected by the inhibitors of myosin II-driven contractility (Balaban et al., 2001,
Chrzanowska-Wodnicka and Burridge, 1996, Helfman et al., 1999). When the
myosin II-driven tension decreases, the focal adhesion size decreases as well
(Balaban et al., 2001); if the contractility is blocked, the focal adhesions will be
completely dissolved (Chrzanowska-Wodnicka and Burridge, 1996, Helfman et al.,
1999). Whereas, focal complexes do not disassemble if myosin II contractility is
inhibited (Riveline et al., 2001).
The forces applied to adhesion sites are also determined by the mechanical nature of
the underlying substrate. In a soft flexible substrate which can be easily deformed,
the necessary force to sustain the adhesion site and the attached stress fibers is higher
than the tension acting on the adhesion plaques. Thus, the typical dimensions of focal
adhesions formed with soft substrates are considerably smaller than those formed
following attachment to a rigid surface (Pelham and Wang, 1997). Therefore, the
cells will sense a gradient in substrate rigidity and move towards the higher rigidity
substrate (Lo et al., 2000).
The growth of the focal adhesion brings an increase in number of filaments forming
the stress fibre associated with the adhesion plaque, so the applied tension increases
and further focal adhesion growth is promoted (Bershadsky et al., 1996).
3.5 Formation of the scar encapsulation around the textured surface of a
silicone breast implant
Surface topography plays a role in biological processes such as cell attachment,
proliferation, motility, differentiation and regulation of gene expression (Prasad et
al., 2010). It is postulated that the contracture rate is disminished by: 1) maintaining

54
the macrophages in a state of phagocytic readiness to delay fibroblast fibrogenesis,
and 2) creating a nonlongitudinal organization of the collagen fibres, formed during
the tissue reaction, to the irregular, porous structure of the envelope (Brohim et al.,
1992).
It has been found that capsules around smooth surface implants are thicker and more
contracted in comparison to the capsules surrounding textured surface implants. In
smooth surfaces, the entire portion of the cell that is in contact with the surface
prevents contact with other cells (except at their very periphery) and the orientation
of the fibroblasts leads to collagen fibres to effectively contract (Prasad et al., 2010).
Whereas in textured surfaces, contact guidance directs the fibroblast into the crevices
and indentations of the substrate surface, so the advancing edge of the fibroblast
touch each other in several planes (contact inhibition), creating a minimal
encapsulation response and a thinner capsule (Ersek et al., 1990).
Texturing has the function of holding the implant in place, thus preventing
micromotion at the host prosthesis interface. While in smooth surface implants, the
implant moves inside the breast, making the fibroblasts repeatedly produce collagen
in response to this host-prosthesis shearing motion (Ersek et al., 1990).
It was found that the fibroblasts‘ response to oriented grooves was better than to the
randomly oriented surfaces: thicker capsules formed on the oriented grooves in
comparison to the randomly oriented grooves. However, the thinner capsules on
random rough surfaces led to greater inflammatory responses (Parker et al., 2002).

55
Chapter IV Surface characterisation:
parameters and equipment, microscopy
principles and surface coatings
4.1 Introduction
In order to understand cell responses to surface properties, it is fundamental to know
how the cells interact with their natural surroundings in the ECM. The ECM is three-
dimensional, composed of functional groups, specific proteins such as collagen,
laminin and proteoglycans, and growth factor reservoirs. The ECM provides, with its
three-dimensional surface topography, the biophysical cues and the chemical
stimulus for the cells adhered to it. Cells adhere, change their morphology,
proliferate, migrate and differentiate by the ECM influence (Mwenifumbo and
Stevens, 2007).
Cells interact with the substrate on which they grow by producing ECM proteins.
These ECM proteins transduce both the chemical and physical extracellular signals
through the cytosol membrane using focal contacts. The types of cell–matrix
adhesions organized by integrins in vitro and the signals they transduce are strongly
affected by their microenvironment (Mwenifumbo and Stevens, 2007). Therefore, a
closer approximation to in vivo environments should be attained by growing cells on
three-dimensional surfaces.
This chapter identifies the parameters that can influence cell adhesion and describes
the techniques and equipment used for their quantification. Among the factors that
influence cell-surface adhesion, surface coating is studied as a factor that will modify
the original properties of wettability and surface roughness in the breast implants
analysed. Wettability was considered in this study due to the fact that cell attachment

56
is known to be more favourable on moderately wettable (hydrophilic) surfaces
compared to hydrophobic substrates. Surface roughness allows cells to grow into the
interstices and creates a bigger area for cells to spread and proliferate. The successful
adhesion of a cell depends on the presence of suitable adhesion cues on the surface.
Therefore, implants have been coated with proteins that promote cell-adhesion
(fibronectin, collagen, and hyaluronic acid).
The selection of surface coatings that will improve the properties of the actual breast
implants is based on a genome microarray study. The microarray study identified
genes whose expression would correlate with breast capsular contracture. The study
of cell morphology represented a considerable challenge in this research due to the
topography and the semitransparency of the textured surfaces. Therefore knowledge
of the principles of microscopy was essential to identifying fibroblasts adhered to the
surfaces and to obtaining sharp images. The information from this chapter will form
the basis of the forthcoming experiments to characterise the breast implants shells
and study cell morphology.
4.2 Parameters and equipment
4.2.1 Roughness
Surface roughness is a constituent of surface texture and is defined by the vertical
deviations measuring the real surface against its ideal form. The surface is considered
rough if these deviations are large, and smooth if the deviations are small (Chi et al.,
2005). Surface roughness is essential to determine the interaction of an object with
its environment, for instance rough surfaces promote adhesion. In this thesis the
roughness value was calculated on a surface and the parameters measured in the
breast implant surfaces are described below.

57
Amplitude parameters
Arithmetic mean surface roughness (Sa) is defined as the arithmetic average
deviation (Figure 4.1) of the surface peaks and valleys measured in micrometers. The
measurement is taken while the stylus of a profilometer traverses the sampling length
on the surface (Trelleborg, 2008). The total height of the profile St is the height
between the highest peak and the deepest valley on the evaluation length (Chi et al.,
2005). The maximum profile peak height Sp, as seen on Figure 4.2, is measured from
the mean line to the highest peak on the sampling length, while the maximum profile
valley depth Sv, as seen on Figure 4.3, is measured from the mean line to the highest
peak on the sampling length (Whitehouse, 2002).
Figure 4.1 Arithmetical mean deviation (modified from (Zygo, 2005))
Figure 4.2 Maximum peak height (modified from (Zygo, 2005))
Sampling length lr
Zp1 Zp2 Zpi
Sp
Sa
Sampling length lr

58
Figure 4.3 Maximum valley depth (modified from (Zygo, 2005))
Hybrid Parameters
Skewness Ssk refers to the symmetry of the profile with respect to the mean line
(Figure 4.4). This parameter is important as it gives information on the morphology
of the surface texture. A negative value of skewness indicates the predominance of
valleys; a positive value indicates the predominance of peaks (Stout, 1993).
Figure 4.4 Skewness (modified from (Zygo, 2005))
Kurtosis Sku indicates the randomness of heights and sharpness of the structures
comprising the surface. A perfectly random surface has a kurtosis value of 3; the
farther the result is from 3, the less random and more repetitive the surface is (Figure
4.5) (Stout, 1993).
Sampling length lr
Zv1 Zv2 Zvi
Sv
Ssk > 0
Ssk < 0
Amplitude distribution

59
Figure 4.5 Kurtosis (modified from (Zygo, 2005))
Functional parameters
The material ratio curve (Figure 4.6) devises the ratio of material to air from the first
contact at the highest peak showing the change with depth (Abbott and Firestone,
1993). From the material ratio curve, the core roughness depth Sk refers to the depth
of the roughness core profile. The reduced peak height Spk refers to the average
height of the prominent peaks above the roughness core profile, while reduced valley
depth Svk refers to the average height of the profile valleys below the roughness core
profile.
The material portion % Mr1 refers to the intersection line which divides the
roughness core profile from the prominent peaks, while the % Mr2 refers to the
intersection line which divides the roughness core profile from the valleys
(Trelleborg, 2008).
Sku > 3
Sku < 3
Amplitude distribution

60
Figure 4.6 Material ratio curve (modified from (Zygo, 2005))
Volume Parameters
These parameters are defined with respect to the material ratio curve (Figure 4.7).
The parameters are defined with respect to two bearing ratio thresholds, set by
default to 10% and 80%. Two material volume and two void volume parameters are
defined: the peak material volume Vmp is the volume of material contained in the
surface from the height corresponding to the 10% material ratio to the highest peak.
The core material volume Vmc is the volume of material contained in the texture
between heights corresponding to the 10% to the 80% material ratio. The core void
volume Vvc and the valley void volume Vvv provide the void volume for cells to
adhere and spread (Stout, 1993).

61
Figure 4.7 Volume parameters (modified from (Zygo, 2005))
Sampling length and Evaluation length
Sampling length is used to cover enough surface to ensure a reliable value of the
parameter measured. It is calculated on profile segments (sampling lengths) and then
averaged. The sampling length is defined as the cut-off length (λc) of the filter used
to separate waviness and roughness. For instance, using a cut-off length of 0.8 mm
and 5 sampling lengths, parameters are measured on each segment (Sa1, Sa2, ., Sa5)
and the parameter value would be the mean of these estimated values (Figure 4.8)
(Srinivasan, 1998).
Sampling length = 2.5 mm
Figure 4.8 Cutt-off length (modified from (Srinivasan, 1998))
1 2 3 4 5
0 2 4 6 8 10 12 14 mm
m
150
100
50
0
-50
-100

62
4.2.1.1 Surface roughness measurement by confocal laser microscope
In order to prevent damaging the soft surface of the breast implants, as a hard needle-
shaped stylus would do, a non-contact laser microscope was used. Measuring surface
roughness using a laser scanning microscope (LSM) does not require sample
preparation, because the sample is just placed on the stage. In comparison the
scanning electron microscope requires the sample to be altered to fit into the
observation chamber and an extensive sample preparation. The LSM measured the
surface roughness at high resolution due to its 0.2 m laser spot diameter.
The values of the surface roughness texture parameters were obtained by applying
the Olympus LEXT laser microscope software to the scanned images. The cut-off
length was chosen to be 80 m as the dimensions of the scanned area were 644 x 642
m. The principles of the confocal microscope are given below in 4.2.3.
4.2.2 Wettability
Wettability indicates the degree of wetting when a solid and liquid interact by
measuring contact angles. A contact angle can be defined as the angle formed by the
liquid-vapour interface and the intersection of the liquid-solid interface (Young,
1805). A contact angle can be acquired by drawing a tangent line from the contact
point along the liquid-vapour interface in the droplet profile as seen in Figure 4.9.
Wetting of a surface is considered favourable when the contact angle is fewer than
90° so the liquid will spread over a large area on the surface. An unfavourable
surface wetting will have a contact angle higher than 90° and the liquid will form a
compact droplet with minimal contact with the surface. Finally, a surface is
considered super hydrophobic when the contact angle is greater than 150° (Lafuma
and Quere, 2003).

63
Figure 4.9 Contact angles formed by sessile liquid drops on a smooth homogeneous
solid surface (modified from (Lafuma and Quere, 2003))
The shape of a liquid droplet and the contact angle is determined by a combination of
surface tension and external forces (usually gravity). Surface tension is defined as the
intermolecular force to contract the surface of the liquid. Surface tension can be
explained in Figure 4.10 where the liquid molecules pull equally each molecule in
the bulk in all directions, but the molecules at the surface are pulled inward by the
neighbouring molecules, creating an internal pressure. Consequently, the liquid
keeps the lowest surface free energy by contracting its surface area to form a sphere
droplet (Snoeijer and Andreotti, 2008).
Figure 4.10 Forces of liquid molecules at the surface (modified from (Lafuma and
Quere, 2003))
The mechanical equilibrium drops under the action of three interfacial tensions
which define the contact angle of a liquid drop on an ideal solid surface (Young,
1805) (Figure 4.10):
θ < 90° θ = 90° θ > 90°
lv
θ sv
sl

64
γlv cos θY = γsv − γsl (4.1)
4.3 Principles of microscopy
4.3.1 Fluorescence microscopy
Fluorescence microscopy involves three basic concepts: photoluminescence,
phosphorescence and fluorescence. Photoluminescence occurs when specimens
absorb and subsequently reradiate the light. Phosphorescence happens after the
excitation energy is discontinued and the emission of light persists for up to a few
seconds. Fluorescence refers to the light emission only during the absorption of the
excitation light, so the time interval between absorption and emission of light is
usually less than a millionth of a second (Haugland et al., 2002).
When a photon gets absorbed by a molecule, this leads to one electron raises from its
ground state (S0) to a higher vibrational level of an excited singlet state (S2). In the
next step, some energy is lost as heat (S1), returning the electon to its ground state
(S0) and the absorbed energy is released again by emission of light. This light is
called fluorescence which is illustrated in Figure 4.11. Because a part of this energy
is dissipated into heat; the energy of the emmited fluorescence light is lower than the
energy of the absorbed light, so the emission occurs at a longer wavelength than
absorption (Didenko, 2006, Kubitscheck, 2013). The visible light region of
electromagnetic radiation covers a wavelength range from approximately 400 to 700
nanometres as seen in Figure 4.12 (Nassau, 2001).
γlv = liquid-vapor interfacial tension
γsv = solid-vapor interfacial tension
γsl = solid-liquid interfacial tension
θY = contact angle

65
Figure 4.11 Simplified Jablonski-diagram of states (adapted from (Lakowicz, 2007))
Figure 4.12 Visible light region of electromagnetic radiation (adapted from
(Abramowitz, 1993))
4.3.1.1 Electron excitation and emission
The principle of a fluorescence microscope is that only the emission light from the
specimen reaches the eye or the detector by allowing only the excitation light to
irradiate the specimen and isolating the brighter excitation light from the much
weaker emitted fluorescent light as seen on Figure 4.13. Thereafter, only the brighter
fluorescing areas will shine against a dark background with sufficient contrast to be
detected (Hibbs, 2000).
Ab
sorp
tio
n
Em
issi
on
Flu
ore
scen
ce
Inte
rnal
Co
nv
ersi
on S2
S1
S0

66
Figure 4.13 Principle of excitation and emission (adapted from (Abramowitz, 1993))
Autofluorescence and secondary fluorescence have been used to study materials that
are fluoresced in their natural form or by treating them with chemicals able to
fluoresce. Secondary fluorescence uses an appropriate fluorochrome capable of
absorbing and then re-radiating light with known intensity curves of excitation
(absorption) and emission and which are highly specific in their attachment
biological targeting (Goldstein, 1999).
Illustrated in Figure 4.14 is one of the fluorochromes that stained the nucleus of the
studied fibroblasts blue, 4',6-diamidino-2-phenylindole (DAPI). DAPI binds
preferentially to adenosine and thymidine (A-T) base pair regions in DNA and is
excited by ultraviolet light with a maximum absorption wavelength of 355
nanometres (Foster, 1997). The appropriate fluorochrome for any fluorescence
application must possess a high likelihood of absorbing the exciting light, a
satisfactory yield of emitted fluorescence light, and should remain attached to the
target molecules (Eftink, 2000).
Barrier
filter
Emitted
blue light
Ultraviolet and
visible light
Exciter
filter Excitation
UV light
Fluorescent specimen

67
Figure 4.14 4´-6 diamidino -2- phenylindole (DAPI) (adapted from (Foster, 1997))
The absorption spectrum of a typical fluorochrome is illustrated in Figure 4.15 (a).
Excitation is induced (usually by means of a monochromator) at various excitation
wavelengths and the emitted fluorescence intensity is measured as a function of
wavelength to plot the emission spectrum as seen on Figure 4.15 (b) (Herman, 1998).
Excitation and emission filters prevent the much brighter excitation light
overwhelming the weaker emitted fluorescence light by eliminating the overlap of
excitation and emission intensities and wavelengths (Figure 4.15 (c) (Goldstein,
1999).
Figure 4.15 Absorption and emission spectra of a typical fluorochrome (adapted
from (Abramowitz, 1993))
4.3.1.2 Fading or photobleaching
The intensity of fluorescence is reduced by specific conditions that may affect the re-
radiation of light by an excited fluorophore. This reduction of emission intensity is
called fading and can be reduced using a neutral density filter in the light path before
Nitrogen
Carbon
Hydrogen
Absorption
spectrum
(a) Emission
spectrum
(b) Spectral
overlap
(c)
Overlap
UV Wavelength Wavelength Wavelength IR
Rel
ativ
e in
ten
sity

68
the illumination reaches the excitation filter, thus diminishing the excitation light
intensity. In our study, fading effects were reduced by using anti-bleaching agents
and rapidly changing the field of view while digital imaging the specimens (Slayter,
1970).
4.3.2 Confocal microscopy
The confocal approach eliminates out-of-focus light or glare in specimens whose
thickness exceeds the immediate plane of focus using spatial filtering techniques.
Confocal microscopy was chosen for this study because the fibroblast seeded into
rough surfaces that exhibited a high degree of fluorescence emission and most of the
fine detail was lost. Confocal microscopes have the capability to exclude secondary
fluorescence in areas, removed from the focal plane, from resulting images. Another
property is that it has control over the depth of field making it possible to collect
serial optical sections from our thick specimens (Pawley et al., 2006).
The principles of confocal microscopy can be explained using Figure 4.16 where the
excitation source beam light first passes through a pinhole aperture located in a
conjugate plane (confocal), with a scanning point on the specimen, and then passes
through a second pinhole aperture in front of the detector. The dichromatic mirror
reflects the laser that is scanned across the specimen in a defined focal plane. Atthe
same time, in the same focal plane; the specimen emits secondary fluorescence that
passes back through the dichromatic mirror and is focused as a confocal point at the
detector pinhole aperture. In the aperture plane, extended airy disks are formed with
the fluorescence emission that was not confocal with the pinhole, so a small portion
of the out-of-focus fluorescence emission is delivered through the pinhole aperture.
Therefore, the photomultiplier does not detect most of this unnecessary light and
does not contribute to the resulting image (Pawley and Inoué, 2006).

69
Figure 4.16 Laser scanning confocal microscope optical configuration (adapted from
(Claxton et al., 2006))
The above can be illustrated in Figure 4.17 when comparing the typical illumination
cones of point scanning confocal microscope and widefield at the same numerical
aperture. In the confocal microscope the specimen is scanned with a finely focused
spot of illumination that is centred in the focal plane, while in the widefield
microscope the entire depth of the specimen over a wide area is illuminated. The
result is a diminished resolution and image contrast due to the significant amount of
signal as a result of the emitted background light and autofluorescence of areas above
and below the focal plane (Claxton et al., 2006).
Figure 4.17 Widefield versus confocal point scanning of specimens (modified from
(Claxton et al., 2006))
Point scanning
(small volume)
Cover glass
Specimen
Microscope slide
Excitation beam Widefield illumination
(large volume)
Light detector
Point source of light
Objective lens
Specimen
Detector pinhole aperture
Tube lens
Dichromatic mirror
Fluorescence barrier filter
Out-of-focus light rays

70
Fluorescence emission passes through the pinhole aperture and is converted by the
photomultiplier into an analogue electrical signal. It is later converted into pixels
that will compose the confocal image of a specimen (Claxton et al., 2006).
4.3.3 Deconvolution
Deconvolution was used in this study to improve the contrast and resolution of
digital images captured in the confocal microscope. Deconvolution is based on
methods that can remove or reverse the out-of-focus blur from images generated by
the narrow aperture of the objective (McNally et al., 1999, Spector et al., 1988). Blur
is described by a non-random spreading of light that occurs by passing through the
imaging system‘s optical train. As blur is a function of any microscope optical
system, (generally the objective function), can be modelled to reverse the blurring
process mathematically by deconvolution methods (Shaw, 1998).
Principles of acquisition of serial optical sections for deconvolution analysis can be
explained using Figure 4.18 where a series of optical sections of a specimen are
recorded along the z-axis of an optical microscope. The detector records an image
plane for each focal plane of the specimen and then stores them in a data analysis
computer. Deconvolution analyses the resulting images to subtract blurred light and
the entire sequence of optical sections to create a three-dimensional montage
(McNally et al., 1999).
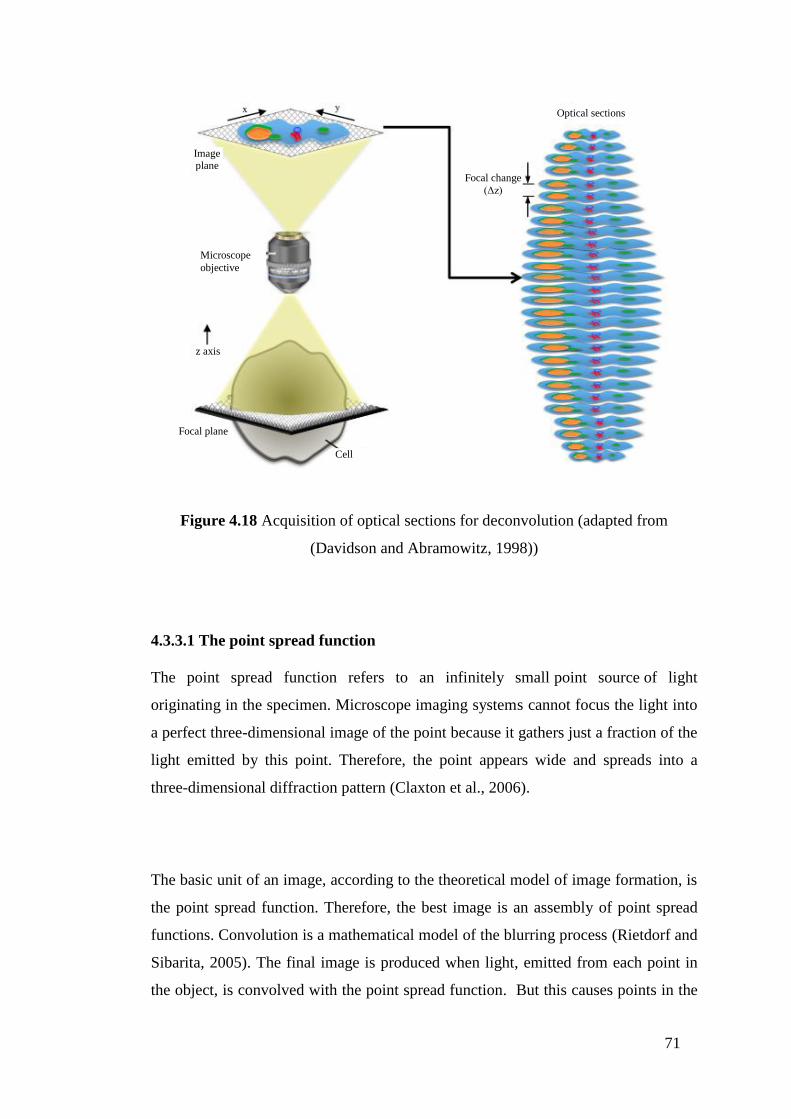
71
Figure 4.18 Acquisition of optical sections for deconvolution (adapted from
(Davidson and Abramowitz, 1998))
4.3.3.1 The point spread function
The point spread function refers to an infinitely small point source of light
originating in the specimen. Microscope imaging systems cannot focus the light into
a perfect three-dimensional image of the point because it gathers just a fraction of the
light emitted by this point. Therefore, the point appears wide and spreads into a
three-dimensional diffraction pattern (Claxton et al., 2006).
The basic unit of an image, according to the theoretical model of image formation, is
the point spread function. Therefore, the best image is an assembly of point spread
functions. Convolution is a mathematical model of the blurring process (Rietdorf and
Sibarita, 2005). The final image is produced when light, emitted from each point in
the object, is convolved with the point spread function. But this causes points in the
Cell
Optical sections
Focal change
(Δz)
Focal plane
Microscope
objective
Image plane
z axis

72
specimen to become blurred zones in the image. This process is reversed with
deconvolution in an attempt to reconstruct the specimen from a blurred image
(Rietdorf and Sibarita, 2005).
4.4 Surface coatings
To successfully elicit specific cellular responses and direct new tissue formation,
biological cues were created by the design of biomimetic scaffolds modifying
biomaterials with ECM molecules (Shin et al., 2003). When proteins of the ECM
interact with cells via cell surface integrin family receptors, the resulting focal
contacts are important for the maintenance of tissue architecture and for supporting a
variety of cellular processes. Binding of an ECM molecule and integrin may initiate
a network of signal transduction cascades that influence cell spreading, adhesion,
proliferation and migration.
4.4.1 Surface coatings requirements
The objective of coating the breast implant surfaces is to direct new tissue formation
using biological cues with ECM molecules (Steward et al., 2011, Li et al., 2012b,
Hauser et al., 2009). To achieve this, the coatings used in this research were selected
based on their properties to:
Interact with cells via cell surface integrin family receptors
Promote cell-surface adhesion, cell spreading,
Provide a scaffold for cells to proliferate and migrate
Do not relate to capsular contracture and fibrosis
Do not contribute to fibrosis
Be commercially available

73
4.4.2 Surface coating selection procedure
The surface coatings were chosen from a whole genome microarray study (Kyle et
al., 2013) performed in cDNA of 23 breast capsules from which 12 capsules
correspond to Baker grades I and II and 11 capsules correspond to Baker grades III
and IV (Baker grades I and II refer to normal capsules compared to grades III and IV
which refer to severely contracted capsules). 122 genes were found to be up-
regulated and 22 down-regulated. The candidate genes were selected from the
microarray data by grouping genes according to 5 categories (Figure 4.19).
The first category consisted of all the down-regulated genes, the second category was
comprised of the genes related to cell adhesion and extracellular matrix and the third
category was formed according to the smallest statistical p-value. A selection of
genes was chosen that matched the 3 criterions and a literature review was conducted
in order to further investigate the potential use of the selected genes as coatings.
Research into gene and protein expression of fibrosis and breast capsules was
undertaken to facilitate a comparison with the selected genes from the microarray.
Moreover, a literature review was carried out to identify bio-molecules related to
fibrosis and wound healing in the body, and the results were compared with the
genes selected from the microarray. Finally, the candidate genes were evaluated
according to their commercial availability.
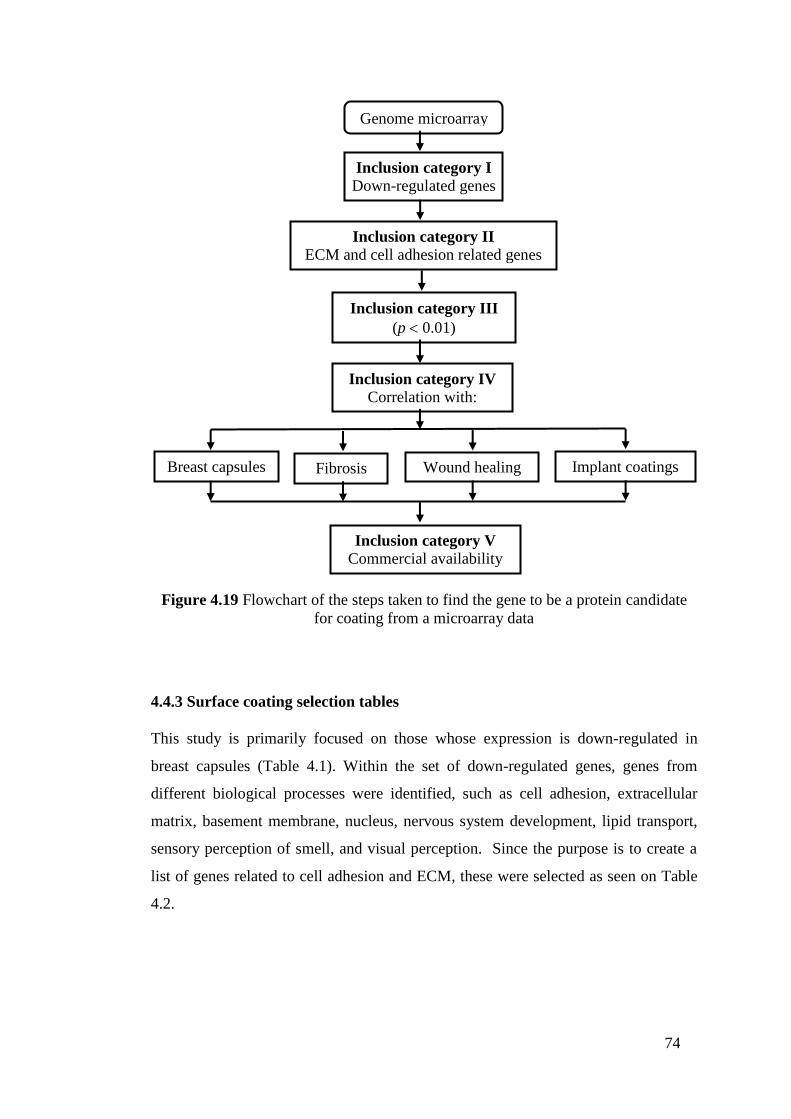
74
Figure 4.19 Flowchart of the steps taken to find the gene to be a protein candidate
for coating from a microarray data
4.4.3 Surface coating selection tables
This study is primarily focused on those whose expression is down-regulated in
breast capsules (Table 4.1). Within the set of down-regulated genes, genes from
different biological processes were identified, such as cell adhesion, extracellular
matrix, basement membrane, nucleus, nervous system development, lipid transport,
sensory perception of smell, and visual perception. Since the purpose is to create a
list of genes related to cell adhesion and ECM, these were selected as seen on Table
4.2.
Inclusion category I Down-regulated genes
Inclusion category II
ECM and cell adhesion related genes
Inclusion category III
(p 0.01)
Inclusion category IV
Correlation with:
Breast capsules Fibrosis Wound healing Implant coatings
Inclusion category V
Commercial availability
Genome microarray

75
Table 4.1 Selection of the most down-regulated genes from a microarray data.
Selected genes were highlighted.
Comparison
1 Log ratio
Comparison
P-value
Gene
Symbol Name
-1.2723 0.0097 HIST1H2BH Histone cluster 1, H2bh
-1.2955 0.0097 CRYGC Crystallin, gamma C
-1.3424 0.0085 RGS10 Regulator of G-protein signalling 10
-1.3558 0.002 C10orf132 Chromosome 10 open reading frame 132
-1.383 0.0058 VPS28 Vacuolar protein sorting 28 homolog (S.
cerevisiae)
-1.4505 0.002 SEMA3A Sema domain, immunoglobulin domain (Ig), short
basic domain, secreted, (semaphorin) 3A
-1.5191 0.0066 SLC5A5 Solute carrier family 5 (sodium iodide symporter),
member 5
-1.5888 0.0014 CRTAC1 Cartilage acidic protein 1
-1.6137 0.0028 SPNS1 Spinster homolog 1 (Drosophila)
-1.6823 0.0078 SCRG1 Scrapie responsive protein 1
-1.7233 0.0036 C1orf173 Chromosome 1 open reading frame 173
-1.8075 0.0076 TIMP4 TIMP metallopeptidase inhibitor 4
-1.8473 0.0024 TNMD Tenomodulin
-2.0432 0.0001 DLX3 Distal-less homeobox 3
-2.2717 0.0009 SMOC1 SPARC related modular calcium binding 1
-2.4866 0.0007 TNFSF11 Tumor necrosis factor (ligand) superfamily,
member 11
-2.9522 0 VWC2 Von Willebrand factor C domain containing 2
-2.9897 0 SMOC1 SPARC related modular calcium binding 1
-3.5333 0 ACAN Aggrecan

76
Table 4.2 Genes related to the extracellular matrix. Selected genes were highlighted.
Comparison 1
Log ratio
Comparison
P-value
Gene
Symbol Name Biological Process
-1.2955 0.0097 CRYGC Crystallin, gamma C Response to stimulus,
sensory perception of
smell.
-1.2723 0.0097 HIST1H2BH Histone cluster 1, H2bh Nucleosome assembly
-1.342 0.0085 RGS10 Regulator of G-protein
signaling 10
Negative regulation of
signal transduction
-1.682 0.0078 SCRG1 Scrapie responsive protein 1 Nervous system
development, ECM
-1.808 0.0076 TIMP4 TIMP metallopeptidase
inhibitor 4
ECM
-1.519 0.0066 SLC5A5 Solute carrier family 5
(sodium iodide symporter),
member 5
Iodide transport, ion
transport, sodium ion
transport
-1.383 0.0058 VPS28 Vacuolar protein sorting 28
homolog (S. cerevisiae)
Protein transport
-1.147 0.0049 MEGF10 Multiple EGF-like-domains
10
Cell adhesion,
phagocytosis
-1.176 0.0037 NELL1 NEL-like 1 (chicken) Cell adhesion, nervous
system development
-1.247 0.0029 OR7G1 Olfactory receptor, family
7, subfamily G, member 1
Response to stimulus,
sensory perception of
smell, signal transduction
-1.614 0.0028 SPNS1 Spinster homolog 1
(Drosophila)
Lipid transport
-1.847 0.0024 TNMD Tenomodulin Integral to membrane
-1.356 0.002 C10orf132 Chromosome 10 open
reading frame 132
Golgi apparatus, Golgi
membrane, membrane
-1.451 0.002 SEMA3A Sema domain,
immunoglobulin domain
(Ig), short basic domain,
secreted, (semaphorin) 3A
Cell differentiation,
multicellular organismal
development, negative
chemotaxis,
-1.589 0.0014 CRTAC1 Cartilage acidic protein 1 ECM
-2.487 0.0007 TNFSF11 Tumor necrosis factor
(ligand) superfamily,
member 11
Cell differentiation,
immune response
-2.043 0.0001 DLX3 Distal-less homeobox 3 Blood vessel
development,
multicellular organismal
development, placenta
development
-2.9897 0 SMOC1 SPARC related modular
calcium binding 1
Basement membrane,
extracellular region
-3.533 0 ACAN Aggrecan Cell adhesion, ECM
organization, proteolysis,
skeletal system
development
-2.9522 0 VWC2 Von Willebrand factor C
domain containing 2
Basement membrane,
extracellular region,
extracellular space
77
Another group was created according to the lowest statistic p-value 0.01. Genes on
Table 4.3 demonstrated a statistically significant difference for the gene expression
levels between severe and mild capsular contracture. A comparison among the above
lists was done, and the genes that matched in the three categories (Table 4.4) were
SPARC related modular calcium binding 1 (SMOC1), Von Willebrand factor C
domain-containing protein 2 (VWC-2), TIMP metallopeptidase inhibitor 4 (TIMP-4),
Tumor necrosis factor (ligand) superfamily, member 11 (TNFSF11) and Aggrecan
(ACAN). These genes were analysed as follows:
Table 4.3 Genes selected from the microarray data according to the lowest statistic
p-value. Selected genes were highlighted.
Comparison
1 Log ratio
Comparison
P-value
Gene
Symbol Name
-1.2955 0.0097 CRYGC Crystallin, gamma C
-1.2723 0.0097 HIST1H2BH Histone cluster 1, H2bh
-1.342 0.0085 RGS10 Regulator of G-protein signalling 10
-1.682 0.0078 SCRG1 Scrapie responsive protein 1
-1.808 0.0076 TIMP4 TIMP metallopeptidase inhibitor 4
-1.519 0.0066 SLC5A5 Solute carrier family 5 (sodium iodide
symporter), member 5
-1.383 0.0058 VPS28 Vacuolar protein sorting 28 homolog (S.
cerevisiae)
-1.147 0.0049 MEGF10 Multiple EGF-like-domains 10
-1.176 0.0037 NELL1 NEL-like 1 (chicken)
-1.247 0.0029 OR7G1 Olfactory receptor, family 7, subfamily G,
member 1
-1.614 0.0028 SPNS1 Spinster homolog 1 (Drosophila)
-1.847 0.0024 TNMD Tenomodulin
-1.356 0.002 C10orf132 Chromosome 10 open reading frame 132
-1.451 0.002 SEMA3A Sema domain, immunoglobulin domain (Ig),
short basic domain, secreted, (semaphorin) 3A
-1.589 0.0014 CRTAC1 Cartilage acidic protein 1
-2.487 0.0007 TNFSF11 Tumour necrosis factor (ligand) superfamily,
member 11
-2.043 0.0001 DLX3 Distal-less homeobox 3
-2.9897 0 SMOC1 SPARC related modular calcium binding 1
-3.533 0 ACAN Aggrecan
-2.9522 0 VWC2 Von Willebrand factor C domain containing 2

78
Table 4.4 Genes that correspond to the three categories. Selected genes were
highlighted.
Comparison
Gene
Relative
Expression
Gene
Symbol
Comparison
1 p-value
Gene
Symbol ECM Relation
-1.8075 TIMP4 0.002 SEMA3A TIMP-4
-1.8473 TNMD 0.0014 CRTAC1 NELL1
-2.0432 DLX3 0.0007 TNFSF11 SEMA3A
-2.4866 TNFSF11 0.0001 DLX3 SMOC1
-2.9522 VWC2 0 SMOC1 TNFSF11
-2.9897 SMOC1 0 ACAN ACAN
-3.5333 ACAN 0 VWC2 VWC2
SPARC related modular calcium binding 1 (SMOC1) is a secreted glycoprotein that
is a member of the SPARC family of matricellular molecules (Aroca-Aguilar et al.,
2011). A signalling role for SMOC1 was shown in rat mesangial cells in which
induction of nitric oxide in response to inflammatory cytokines downregulates
SMOC1 which, in turn, downregulates expression of TGF-β (Dreieicher et al., 2009).
This mechanism was proposed to limit the profibrotic effects of TGF-β in the
glomerulus, but in the microarray it was found to be already down-regulated, so
using SMOC1 as a coating would increase expression of TGF-β. Also, an elevated
expression of SMOC-1 was found in brain tumours (Bradshaw, 2012). Von
Willebrand factor C domain-containing protein 2 (VWC-2) is a secreted protein,
which is a BMP antagonist and may play a role in neural development promoting cell
adhesion. VWC-2 was dismissed from the list due to it being both predominantly
expressed in neural tissues in embryos and also in the adult brain, and potentially
playing roles in neural development and functions (Koike et al., 2007, Miwa et al.,
2009).

79
TIMP metallopeptidase inhibitor 4 (TIMP-4) belongs to the TIMP gene family. The
proteins encoded by this gene family are inhibitors of the matrix metalloproteinases,
a group of peptidases involved in degradation of the extracellular matrix. The
secreted, netrin domain-containing protein encoded by this gene is involved in
regulation of platelet aggregation and recruitment and may play a role in hormonal
regulation and endometrial tissue remodelling. TIMP-4 was removed from our list
since it was found that the decrease in MMP-to-TIMP expression during capsule
formation around smooth and textured silicone implants may contribute to increased
synthesis and deposition of collagen, leading to a severe fibrotic reaction after
cosmetic breast augmentation with alloplastic material (Ulrich et al., 2009). Also,
TIMP-4 resulted in a significant stimulation of primary mammary tumorigenes, since
TIMP-4 has a growth-stimulating and anti-apoptotic (by stimulate Bcl-2 and Bcl-XL
expression) (Jiang et al., 2001).
The tumour necrosis factor (ligand) superfamily, member 11 (TNFSF11) encodes a
member of the tumour necrosis factor (TNF) cytokine family which is a ligand for
osteoprotegerin and functions as a key factor for osteoclast differentiation and
activation. This protein was shown to be a dentritic cell survival factor and is
involved in the regulation of T cell-dependent immune response. T cell activation
was reported to induce expression of this gene and lead to an increase of
osteoclastogenesis and bone loss. This protein was shown to activate antiapoptotic
kinase AKT/PKB, through a signalling complex involving SRC kinase and tumour
necrosis factor receptor-associated factor (TRAF) 6, which indicated this protein,
may have a role in the regulation of cell apoptosis. TNFSF11 was not considered as a
coating candidate since its use as a protein coating did not show any statistically
significant reduction in fibrosis in the periprosthetic capsule after treating implants
with it (San-Martin et al., 2010).
Aggrecan (ACAN) plays an important role in mediating chondrocyte-chondrocyte
and chondrocyte-matrix interactions through its ability to bind hyaluronan (Kiani et
al., 2002). The presence of aggrecan seems to increase the amount of link protein on

80
the cell surface. Expression of hyaluronic acid in periprosthetic breast capsules was
found, so there is a positive correlation between the HA and Baker grade of capsular
contracture (Tan et al., 2011). Aggrecan was chosen to be a candidate of protein
coating due to its ability to bind HA, thus reducing levels of free hyaluronan in
contracted capsules. Aggrecan is commercially available.
A literature review of these genes was undertaken with the aim of finding any
correlation with capsular contracture (Table 4.5), wound healing and fibrosis (Table
4.6). None of these four genes were found to be related to these processes.
Table 4.5 Research on gene and protein expression in relation to fibrosis and breast
capsular contracture formation
Function Molecules involved Reference
Overproduction
Transforming Growth
Factor Beta TGF-B
High levels of fibrogenic cytokines
Induce Fibrosis
TGF-B1 (modulating cell proliferation, survival
and apoptosis, enhancing ECM production and
adhesion)
TGF-B2
(Kuhn et al., 2000)
Immunologic response is
mediated by cytokines and
growth factors:
Interleukin-1 (IL-1)
Interleukin-6 (IL-6)
Tumour Necrosis Factor-a (TNF-a)
Platelet-derived growth factor (PDGF)
TGF-B (angiogenic and inflammatory mediator)
(Diao et al., 2011)

81
Table 4.6 Literature review of biomolecules related to fibrosis, wound healing in
general
Biomolecule
Relation with
Reference
Fibrosis Wound healing
Tenascin-C Wound healing (Udalova et al., 2011)
Platelet-derived growth factor
(PDGF) Fibrosis Wound healing (Zaccone et al., 2003)
Fibroblast growth factor Wound healing (Caldas et al., 2008)
Insulin-like growth factor Wound healing (Prakobwong et al., 2009)
ET-1 Fibrosis (Wangoo et al., 2001)
OPN Fibrosis (Ajmal et al., 2003)
IGF-1 Fibrosis (Demedts et al., 2005)
EGF Fibrosis (Wilson et al., 2007)
bfgf Fibrosis (Gruber et al., 1996)
CTGF Fibrosis (Tulinska et al., 2004)
Epidermal growth factor Wound healing (Notas et al., 2009)
Transforming growth factor Wound healing (Wynn, 2008)
12-Hydroxyeicosatetranouic acid Wound healing (Fallowfield et al., 2007)
Thromboxanes Wound healing (Polo et al., 1999)
Leukotrines Wound healing (Roberts, 1995)
Prostacyclin Wound healing (Tredget et al., 1998)
4.4.4 The selected surface coatings
The coatings used in this research were selected based on their properties to promote
fibroblasts activity (collagen I, fibronectin and hyaluronic acid), and from a whole
genome microarray study (Kyle et al., 2013) performed in cDNA of 23 breast
capsules. The description of properties of the selected coatings is described below.
Aggrecan is a proteoglycan found in the ECM of cartilage, which has a molecular
mass of >2,500 kDa (Roughley et al., 2006). Another constituent element of ECM is
collagen, which enhances cell attachment and proliferation and can be found in the
form of filaments, sheets and fibrils (Li et al., 2012a), which provides tensile strength
to the tissue scaffolding. Collagen triggers cell-ECM interactions as well as cell-to-
cell interactions and fibroblasts activation (Roberts et al., 2013).

82
An essential component of ECM related to cell adhesion is fibronectin, a 450kDa
dimeric glycoprotein that can bind specifically to two widely expressed cell surface
receptors, integrins α5β3, and αvβ3 (Elter et al., 2012). Fibronectin plays an
important role in the adhesion of cells to material surfaces. It can even strengthen
the cell-surface adhesion (Elter et al., 2012). Hyaluronic acid transports the
metabolites and nutrients, provides tissue resistance to compressive forces, and
controls cell migration and cell proliferation (Cohen et al., 2003). Hyaluronic acid
provides the perfect scaffold for cells to proliferate and migrate (Collins and
Birkinshaw, 2013, Korurer et al., 2014).
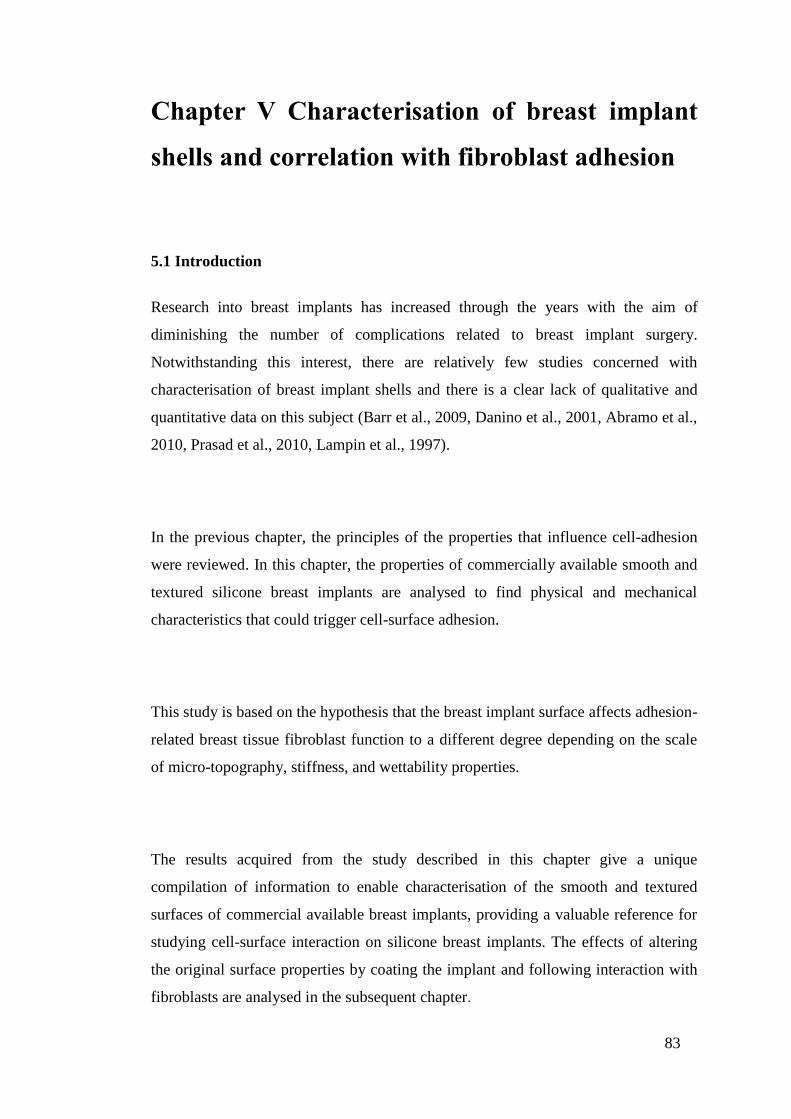
83
Chapter V Characterisation of breast implant
shells and correlation with fibroblast adhesion
5.1 Introduction
Research into breast implants has increased through the years with the aim of
diminishing the number of complications related to breast implant surgery.
Notwithstanding this interest, there are relatively few studies concerned with
characterisation of breast implant shells and there is a clear lack of qualitative and
quantitative data on this subject (Barr et al., 2009, Danino et al., 2001, Abramo et al.,
2010, Prasad et al., 2010, Lampin et al., 1997).
In the previous chapter, the principles of the properties that influence cell-adhesion
were reviewed. In this chapter, the properties of commercially available smooth and
textured silicone breast implants are analysed to find physical and mechanical
characteristics that could trigger cell-surface adhesion.
This study is based on the hypothesis that the breast implant surface affects adhesion-
related breast tissue fibroblast function to a different degree depending on the scale
of micro-topography, stiffness, and wettability properties.
The results acquired from the study described in this chapter give a unique
compilation of information to enable characterisation of the smooth and textured
surfaces of commercial available breast implants, providing a valuable reference for
studying cell-surface interaction on silicone breast implants. The effects of altering
the original surface properties by coating the implant and following interaction with
fibroblasts are analysed in the subsequent chapter.

84
5.2 Materials and Methods
Circular samples of 14 mm diameter were removed from each silicone implant shell.
These samples were then sterilised by initial sonication in detergent for 10 min,
before being rinsed in distilled water. This was followed by sonication in acetone for
10 min. Subsequently the samples were air dried and kept in petri dishes (Barr et al.,
2010). The samples were sterilised in order to eliminate any possible contamination
from particles on their surfaces.
The silicone breast implants studied were chosen from some of the commonly
available implants in clinical practice: (1) Textured Surface-1 (TS1) (Mentor Siltex
(Mentor Worldwide LLC, Skyway Circle North Irving, Texas)); (2) Textured
Surface-2 (TS2) (Allergan Biocell (Allergan, Inc, Santa Barbara, California)). (3)
Smooth Surface-1 (SS1) (Mentor Smooth (Mentor Worldwide LLC, Skyway
Circle North Irving, Texas)); and (4) Smooth Surface-2 (SS2) (Allergan (Allergan,
Inc, Santa Barbara, California)).
The characterisation of the breast implant surface shells was investigated using three
approaches:
1) 3D imaging—surface roughness texture parameter measurement.
2) Optical tensiometry (goniometry) —contact angle measurement.
3) Micro tensile testing—measurement of bending and stretching stiffness.
In addition, the kinetics of fibroblast–silicone implant surface detachment mediated
by trypsin was undertaken in order to investigate the adhesive interaction between
the fibroblasts and the breast implant surfaces. All experiments were conducted in
triplicate. The characterisation and kinetics of detachment tests were performed on
the surfaces that come into contact with the tissue of the patient. All tests were
performed on these surfaces.

85
5.2.1 Characterisation of the silicone surfaces
5.2.1.1 3-D images
Silicone surfaces were observed at 20x magnification in three different areas
(dimension of each area 644x 642 m) of each implant after being scanned using a
LEXT OLS4000 3D confocal laser scanning microscope. The LEXT OLS4000 uses
a 408 nm laser diode and has a resolution on the Z-axis of 10 nm with finely
controlled movement of the nosepiece. The microscope creates optical slices from in-
focus pixels and combines a stack of slices (z-stack) into one image forming a 2D
representation as shown in Figures 5.1—5.4a. These optical slices were then
arranged into a highly accurate 3D image (Figures 5.1–5.4b) from which the surface
roughness parameter values were obtained. The 20x objective has a depth of field of
6 m and the number of z slices to construct the 3D image was selected
automatically by the software from the objective and magnification settings. The
tests were undertaken five times in order to ensure repeatability.
a b
Figure 5.1 Confocal laser scanning microscope images (644x642 m) of uncoated
TS1 surface a) surface topography b) using colour height information.
328.2
262.6
196.9
131.3
65.6
0

86
a b
Figure 5.2 Confocal laser scanning microscope image (644x642m) of uncoated
TS2 surface a) surface topography b) using colour height information.
a b
Figure 5.3 Confocal laser scanning microscope image (644x642m) of SS1 surface
a) surface topography b) image using colour height information.
454.6
363.6
272.7
181.8
90.9
0
21.8
17.4
13.1
8.7
4.4
0

87
a b
Figure 5.4 Confocal laser scanning microscope image (644x642m) of SS2 surface
a) surface topography b) image using colour height information.
5.2.1.2 Surface roughness parameters
Surface texture measurements were carried out using the Olympus LEXT laser
microscope (Olympus Corporation, Japan). The tests were carried out on three
sample areas using a 100 m scale. Roughness, skewness and kurtosis were
measured in order to characterise the surface of the implants. Maximum values of
peak height, valley depth and surface height of the surface were also obtained.
In addition, measurements of the core roughness of the surface, reduced peak height,
reduced valley depth, load area ratio of reduced peak part to core part and load area
ratio of reduced valley part to core part, were undertaken. Void volume parameters
were ascertained for each sample of the implant surfaces, namely, the void volume at
a valley region, void volume at a core part, actual volume at a peak region and actual
volume at a core part.
11.2
8.9
6.7
4.5
2.2
0
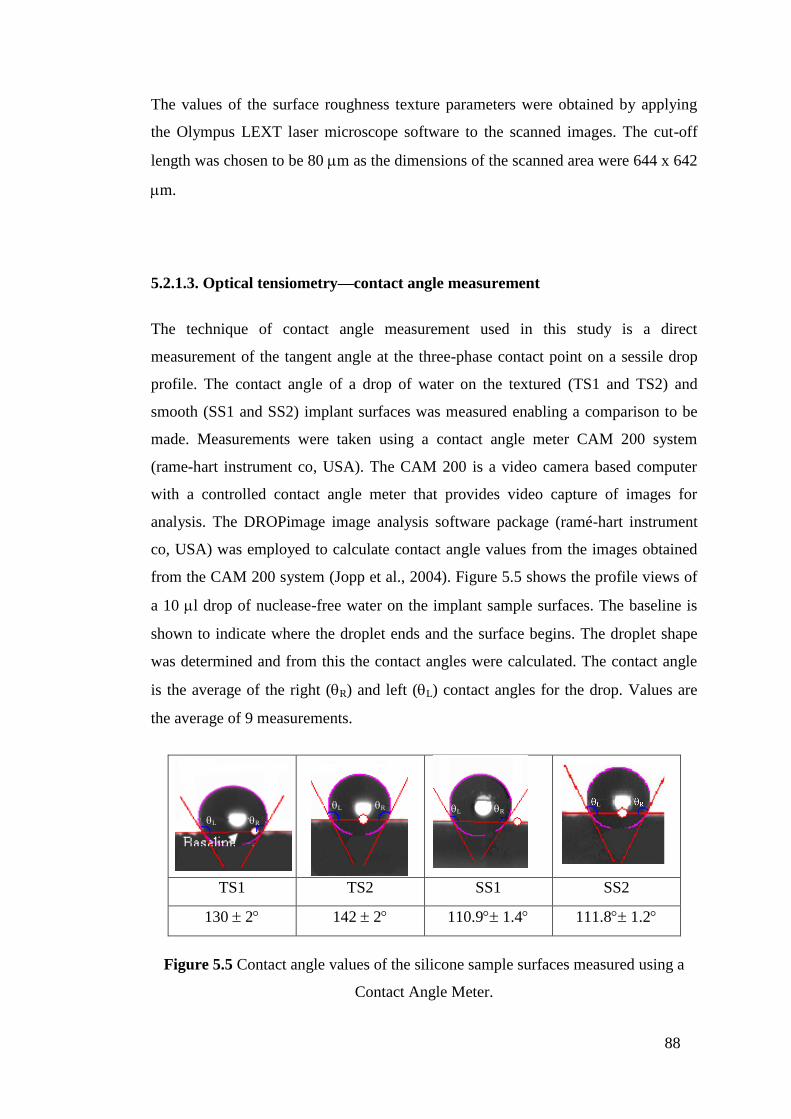
88
The values of the surface roughness texture parameters were obtained by applying
the Olympus LEXT laser microscope software to the scanned images. The cut-off
length was chosen to be 80 m as the dimensions of the scanned area were 644 x 642
m.
5.2.1.3. Optical tensiometry—contact angle measurement
The technique of contact angle measurement used in this study is a direct
measurement of the tangent angle at the three-phase contact point on a sessile drop
profile. The contact angle of a drop of water on the textured (TS1 and TS2) and
smooth (SS1 and SS2) implant surfaces was measured enabling a comparison to be
made. Measurements were taken using a contact angle meter CAM 200 system
(rame-hart instrument co, USA). The CAM 200 is a video camera based computer
with a controlled contact angle meter that provides video capture of images for
analysis. The DROPimage image analysis software package (ramé-hart instrument
co, USA) was employed to calculate contact angle values from the images obtained
from the CAM 200 system (Jopp et al., 2004). Figure 5.5 shows the profile views of
a 10 l drop of nuclease-free water on the implant sample surfaces. The baseline is
shown to indicate where the droplet ends and the surface begins. The droplet shape
was determined and from this the contact angles were calculated. The contact angle
is the average of the right (R) and left (L) contact angles for the drop. Values are
the average of 9 measurements.
TS1 TS2 SS1 SS2
130 2 142 2 110.9 1.4 111.8 1.2
Figure 5.5 Contact angle values of the silicone sample surfaces measured using a
Contact Angle Meter.
L R
L R
L R

89
5.2.1.4. Micro tensile testing—measurement of bending and stretching stiffness.
In order to determine the mechanical properties of the breast implant surfaces a
tensile test was carried out using a Microtest 5kN tensile testing device (Deben, UK).
Figure 5.6a depicts the tensile-testing instrument used for this test. Three samples
from each of TS1, TS2, SS1 and SS2 implants were tested. These samples had
dimensions of 30 mm x 10 mm and their thicknesses varied from 0.45 to 0.75 mm. In
order to carry out the test, a sample was mounted horizontally onto the machine. The
sample was clamped by a pair of jaws leaving 10 mm length in the middle as gauge
length. During the tensile test a dual screw pulled the jaws symmetrically in opposite
directions (Figure 5.6b). The samples were stretched at a constant speed of 1.5 mm
per minute up to 100% strain and force–elongation data was recorded every 200 ms.
The tensile testing stage was computer controlled and the resulting
force/displacement curves were displayed in real time. The force–displacement data
were used to estimate the stiffness of the samples at biologically relevant strains.
Figure 5.6 Tensile test of TS1 a) sample prior to testing b) sample during tensile
testing.
For the purpose of characterisation of the breast implant surfaces, stiffness is a more
suitable parameter than the Young‘s modulus (E), as stiffness includes the effect of
implant thickness (t). Hence two stiffness parameters— stretching stiffness (k) and
bending stiffness (D) (Fenner, 1989)—were estimated for the samples.
Micro Test Materials Testing
F F
F F
a b

90
5.2.2 Kinetics of fibroblast–surface detachment mediated by trypsin
Cultured human skin fibroblasts were established from skin biopsies taken from a
healthy subject. All cultures were passage three and were grown to confluence in 125
mL culture flasks in Dulbecco‘s Culture Medium (DMEM) substituted with 10%
fetal bovine serum, 1% L-glutamine (PAA), 1% non-essential amino acid solution
(Sigma) and 1% penicillin/ streptomycin (PAA) at 37°C in a 5% CO2 atmosphere.
The cells were arrested to take them to the G0/G1 phase, 16 h later dissociated cell
suspensions were seeded in triplicate on silicone surfaces placed in the tissue culture
in 24 well-plates to a concentration of 5.1 x 10⁴ cells in 1 mL of complete media per
well and incubated for 24, 48 and 72 hrs at 37°C. After setting times the incubation
media was discarded and the surfaces were washed once with PBS. 400 l of 0.25%
trypsin was added to each well. At 2-min intervals (from 5 to 17 min) a sample of
100 l of trypsin was then removed from each well and replaced with 100 l of fresh
trypsin. The well plate was moved gently before taking the sample to homogenize it.
The sample of trypsin was poured into an eppendorf tube and 200 l of complete
media was added to stop the trypsin reaction. The detached cells were then
centrifuged and resuspended in 200 l complete media and their number counted
with a C6 flow cytometer (Accuri Cytometers, Inc., Michigan, U.S.A.). Wells of
cells prepared for the zero-time point of trypsinisation were incubated in trypsin until
they were completely detached. Cell-substratum detachment at a given time point
was expressed as the percentage of detached cells relative to those detached at time
zero. Each experiment was conducted in triplicate.

91
5.3 Results
5.3.1 Surface characterisation
5.3.1.1 3-D images
The 3-D images of the surfaces obtained using the LEXT OLS4000 3D laser
measuring microscope are shown in Figures 5.1–5.4. The planar images obtained are
depicted in Figures 5.1–5.4a; the corresponding topological models obtained using
colour-height information are shown in Figures 5.1–5.4b. The images reveal the
textured surfaces to be relatively rough and nodular, consisting of high peaks and
deep crevasses, having roughness (Sa) values in the range 8.88–18.83 m. The
smooth implant surfaces are more regular and repetitive and less rough, exhibiting
roughness (Sa) values in the range 0.06–0.07 m.
TS1 implant
The TS1 shows high peaks and deep plunging crevasses (Figure 5.1). The
topography reveals a rough surface composed of textured nodules. The texture is an
outcome of the manufacturing process in which a negative-contact imprint of
polyurethane foam is formed on the surface (Barr and Bayat 2011). The nodular
outcrops are separated from one another by apparently smooth-surface crevasses.
The surface is almost geographical with peaks that are frequently covered in silicone
debris. Figure 5.1b shows the confocal laser scanning microscope image obtained
using colour height information (taken on the Olympus LEXT with 20 x
magnifications, image scale bar 100 m). The yellow coloured areas indicate the
valleys, which are from 0 to 66 m deep, while the purple areas correspond to the
core of the profile, which is between 132 and 197 m in height. The peaks of the
surface can be discerned by the blue coloured areas, which are 263 to 328 m high.
The image was captured as a 3D data set and the measurement of plane roughness on
the entire surface (644x642m) was taken. The average surface roughness
measurement of 3 different areas was evaluated and an arithmetic mean roughness
value of 8.880.5 m was obtained.

92
TS2 implant
The TS2 depicts a granular surface which is pitted with cuboid shaped wells (Figure
5.2). These wells are formed by granular salt during the manufacturing phase, which
are subsequently washed away (Barr and Bayat, 2011). The bases of these pits are
irregular with ridges. The polyhedra are approximately 235–522 m in width and the
distance between them varies from 37 to 358 m. Figure 5.2b shows the confocal
laser scanning microscope image obtained using colour height information (taken on
the Olympus LEXT with 20x magnification, image scale bar 100 m). The valleys of
the surface, shown in yellow, are from 0 to 91 m deep. The purple coloured regions,
which correspond to the core of the profile, are between 182 and 273 m high. The
peaks of the surface can be distinguished in blue, and range from 364 to 455 m in
height. The image was captured as a 3D data set and the measurement of plane
roughness on the entire surface (644x642 m) was taken. The average surface
roughness measurement of 3 areas was evaluated and an arithmetic mean roughness
value of 18.830.91 m was obtained.
SS1 and SS2 implants
The SS1 and SS2 are characterised by an inherently regular, ridged topography; both
surfaces depicted a geographical surface with rocky formations and small pits
(Figures 5.3 and 5.4). The topography observed results from silicone creeping down
the implant template during the curing process (Barr and Bayat, 2011). The
arithmetic mean roughness was 0.07±0.01 m for the SS2 and 0.06±0.02 m for the
SS1. Figure 5.3b shows the confocal laser scanning microscope image of SS1 surface
obtained using colour height information (taken on the Olympus LEXT with 20x
magnification, image scale bar 100m). The deepest areas of the sample are shown
in yellow and range from 0 to 4.4m in depth, while the purple areas correspond to
the core of the profile, which are from 8.7 to 13 m high. The surface peaks are
coloured blue and range from 17.4 to 22m in height. The average surface roughness
measurement of 3 areas was evaluated and an arithmetic mean roughness value of
0.060.02m was obtained.
93
Figure 5.4b shows the confocal laser scanning microscope image of SS2 obtained
using colour height information (taken on the Olympus LEXT with 20 x
magnifications, image scale bar 100m). The deepest areas of the sample are shown
in yellow and range from 0 to 2.2m in depth, while the purple areas correspond to
the core of the profile, which are from 4.5 to 6.7 m high. The surface peaks are
coloured blue and range from 9 to 11m in height. The average surface roughness
measurement of 3 areas was evaluated and Sa of 0.070.01m was obtained.
5.3.1.2 Surface roughness parameters
The roughness parameters of the textured and smooth samples were obtained using
the LEXT OLS4000 3D laser measuring microscope. The maximum Sa was obtained
for TS2 textured sample, which had a value of 18.83 m and the lowest, 0.06 m,
was obtained for the SS1 surface. The values obtained for the additional roughness
parameters are given in Figures 5.7 and 5.8.
The negative skewness value measured for the TS1 sample (Ssk=-0.22) indicates the
predominance of valleys on this surface; the positive skewness values exhibited by
the TS2 (Ssk=0.38), SS2 (Ssk=12.27) and the SS1 (Ssk=14.11) samples reveal that
peaks are the prevailing characteristic on the surfaces of these samples.
The SS1 samples exhibited a relatively high kurtosis value (Sku=333.57) indicating a
repetitive surface with spikes. The lower kurtosis values obtained for the TS1
(Sku=8.38), and TS2 (Sku=10.23) implants indicate that these surfaces are more
random and bumpy.
The relatively large reduced peak height value obtained for the TS2 (Spk=62.75 m),
implies a surface composed of high peaks providing small initial contact area and

94
thus high areas of contact stress (force/area) when the surface is contacted. Thus
reduced peak height may represent the nominal height of the material that may be
removed during a ‗running-in‘ operation. Consistent with reduced peak height, the
load area ratio of reduced peak part to core part (SMr1) represents the percentage of
the surface that may be removed during ‗running-in‘. The TS2 has the highest SMr1
value indicating that for this sample, a larger percentage of area would be removed
once the implant was in place in the body. The core roughness measure indicates the
roughness of the surface over which a load may be distributed after the surface has
been ‘run-in‘. The TS1 has the highest core roughness value, Sk=17.52 m, which is
relatively high in comparison with the value obtained for the SS1, Sk=0.11 m.
The reduced valley depth is a measure of the valley depth below the core roughness
and may be related to fluid retention and debris entrapment. The implant surface
which would potentially retain the greatest amount of fluid and debris is the TS2
sample, with Svk=58.67 m and load area ratio of reduced valley part to core part,
SMr2=74.19%. The implant that is likely to retain the least fluid is the SS2 surface,
with Svk=0.17 m and SMr2=86.94%.
The void volume parameters ascertained for the samples indicate that the TS2
surface can contain the largest volume of fluid, with Vvc + Vvv = 36.92 m3/m
2
while the SS1 implant can only contain Vvc + Vvv = 0.07 m3/m
2, the lowest value
of all the samples considered. Of the four implant surfaces tested, the TS2 sample
exhibited the highest value for the volume that may be worn away in the run-in
period, having a Vmp value of 3.32 m3/m
2. The TS2 textured sample has the
greatest volume of material available to support load, with Vmc=14.04 m3/m
2.

95
Table 5.1 3D Surface height parameters: skewness and kurtosis of breast implant
surfaces.
Breast
implant Skewness Kurtosis
TS1 -0.220.27 Predominance of
valleys 8.381.57 Random and
bumpy surfaces TS2 0.380.35
Predominance of
peaks
10.230.26
SS1 14.113.6 333.5711 More repetitive
surface with
spikes SS2 12.271.03 281.5348

96
Breast
implant Profile
Functional
Parameters
TS1
Sk(µm) 17.521.4
Spk(µm) 20.052.1
Svk(µm) 21.091.6
SMr1(%) 16.580.3
SMr2(%) 81.681.1
TS2
Sk (µm) 9.632.8
Spk (µm) 62.753.9
Svk (µm) 58.672.1
SMr1 (%) 25.500.7
SMr2 (%) 74.191.3
SS1
Sk (µm) 0.110.01
Spk (µm) 0.340.2
Svk (µm) 0.200.1
SMr1(%) 9.150.1
SMr2(%) 87.971
SS2
Sk (µm) 0.140.006
Spk (µm) 0.240.04
Svk (µm) 0.170.01
SMr1(%) 10.950.6
SMr2(%) 86.940.1
Figure 5.7 3D functional parameters: Spk (reduced peak height), Sk (core roughness
depth), Svk (reduced valley depth), SMr1 (load area ratio to separate between a
reduced peak part and a core part) and SMr2 (load area ratio to separate between a
reduced valley part and a core part).
Mentor Siltex Textured
0
10
20
30
40
50
60
70
0 20 40 60 80 100 120
Bearing ratio (%)
Dep
th f
orm
hig
hest
peak
(um
)
Sk=17.5
Spk=20
Svk=21
SMr1 [16.5] SMr2 [81.6]Allergan Biocell Textured
0
20
40
60
80
100
120
140
0 20 40 60 80 100 120
Bearing ratio (%)
Dep
th f
orm
hig
hest
peak
(um
)
Sk=9.6
Spk=62.7
Svk=58.6
SMr1 [25.5] SMr2 [74.1]Mentor Smooth
0
0.1
0.2
0.3
0.4
0.5
0.6
0.7
0 20 40 60 80 100 120
Bearing ratio (%)
Dep
th f
orm
hig
hest
peak
(um
)
Sk=0.11
Spk=0.34
Svk=0.2
SMr1 [9.15] SMr2 [87.97]Allergan Smooth
0
0.1
0.2
0.3
0.4
0.5
0.6
0 20 40 60 80 100 120
Bearing ratio (%)
Dep
th f
orm
hig
hest
peak
(um
)
Sk=0.1
4
Spk=0.24
Svk=0.17
SMr1 [10.95] SMr2 [86.94]

97
Breast
implant Profile
Material volume
parameters
(m3/m
2)
TS1
Vvv 2.10.16
Vvc 12.830.8
Vmp 1.050.13
Vmc 8.560.31
Vvc+Vvv 14.93 0.8
TS2
Vvv 6.340.39
Vvc 30.580.9
Vmp 3.320.36
Vmc 14.040.4
Vvc+Vvv 36.921.07
SS1
Vvv 0.020.01
Vvc 0.050
Vmp 0.020.01
Vmc 0.040
Vvc+Vvv 0.070.01
SS2
Vvv 0.010
Vvc 0.070
Vmp 0.010
Vmc 0.050
Vvc+Vvv 0.080
Figure 5.8 Bearing curves illustrating the core and valley fluid retention indexes of
uncoated breast implants: Vvv (void volume at valley region), Vvc (void volume at a
core part), Vmp (peak material volume) and Vmc (core material volume).

98
5.3.1.3 Wettability
The contact angle values obtained from the CAM 200 system using the DROPimage
software package are given in Table 5.2, and Figure 5.5 shows profile views of a 10
L drop of nuclease-free water on the implant sample surfaces. The baseline is
shown to indicate where the droplet ends and the surface begins. The droplet shape
was determined and from this the contact angles were calculated. From the
measurements it was determined that the TS2 sample was the most hydrophobic
surface, exhibiting a contact angle of 142 ± 2°. The SS1 sample was the least
hydrophobic surface, having an average contact angle of 110.9°± 1.4°. The values
indicate that the TS2 surface is less wettable than TS1.
5.3.1.4 Stiffness: Tensile test
The biologically relevant strain region is expected to be between 0 and 10% strain,
and so the stretching stiffness (k), which is proportional to Young‘s modulus times
the thickness (E x t), is approximated by the slope of the force–displacement curve.
The uniaxial stress-strain relation is given by Hooke‘s law as
(5.1)
by substituting = F/A and = /l into Eq. (1)
(5.2)
The equation of a spring is given as F=k
(5.3)
Substituting Eq. (2) in Eq. (3)
(5.4)
Substituting A=b·t in Eq. (4)

99
For the experiments, b and l were fixed parameters; therefore, the stretching stiffness
depends only from E and t as follows,
(5.5)
All samples exhibited strongly non-linear force displacement behaviour. The mean
force–displacement curves for each sample are shown in Figure 5.9. The stretching
stiffness of the sample is the slope of the force–displacement curve. The mean
stretching stiffness curves were obtained by differentiation of the polynomial fit
equations and these are shown in Figure 5.10.
Poisson‘s ratio was considered as 0.5 (Johnston et al., 2014). The (19) bending
stiffness (D) is given as
(5.6)
The estimated stretching stiffness and bending stiffness for the samples are shown in
Table 5.2. The variation in stretching stiffness can be attributed to the difference in
thickness of the implant shells and in the manufacturing procedures for the different
implants, whereas the variation in bending stiffness is primarily due to variation in
thickness. The textured surfaces showed higher bending stiffness. Among all the
surfaces, SS1 had the lowest thickness that resulted in the lowest bending stiffness.
Besides the effect of surface roughness on fibroblast adhesion, the variation in
thickness affects mechanical stiffness, which in turn may change the performance of
breast implants.

100
Figure 5.9 Mean force-displacement curves for all samples with fourth order
polynomial fit lines and equations.
Figure 5.10 Mean stretching stiffness for all samples.
y =-0.0003x4+0.006x3-0.056x2+0.518x-0.009 R² = 0.999
y = -0.0001x4+0.003x3-0.042x2+0.333x+0.001 R² = 0.999
y=-0.0004x4+0.01x3-0.096x2+0.542x+0.012 R² = 0.999
y=-0.0002x4+0.005x3-0.059x2+0.426x+0.010 R² = 0.999
0
0.5
1
1.5
2
2.5
3
3.5
0 1 2 3 4 5 6 7 8 9 10
Forc
e (
N)
Displacement (mm)
TS1 Mean TS2 Mean SS1 Mean SS2 Mean
TS1 Mean TS2 Mean SS1 Mean SS2 Mean
- Poly. (TS1)
- Poly. (TS2) - Poly. (SS1) - Poly. (SS2)

101
5.3.2 Kinetics of fibroblast–silicone implant surfaces detachment mediated by
trypsin
This assay directly measures the number of cells that detach from the silicone
surfaces following trypsinisation using the Accuri C6 flow cytometer (Accuri
Cytometers, Inc., Michigan, U.S.A.). In three series of experiments at 24, 48 and 72
hrs incubation using cultures derived from healthy human skin, trypsin-induced
detachment of normal cultured skin fibroblasts was scored at 2-min intervals. The
resulting attachment values calculated are given in Figures 5.11-5.13 and in Table
5.2. Cell-substratum attachment at a given point in time is expressed as the
percentage of attached cells relative to those attached at time zero. The results
displayed are the mean percentage cell attachment derived from three experiments.
Data was analyzed for significance using ANOVA. The difference between the
means for all conditions was considered statistically significant at P<0.05 employing
Prims-4 GraphPad software (San Diego, CA, USA). As expected, there was a
decrease in the number of cells attached over time in all surface and a significant
difference was detected in the trypsin-induced detachment rates between the smooth
(SS1 and SS2) and textured (TS1 and TS2) silicone surfaces.
Upon inspection of Figure 5.11 it can be seen that after 24 hrs of incubation, there
was a decrease in the number of cells attached over time as expected on all surfaces.
Adhesion on the TS1, TS2 and SS2 samples did not differ significantly (P>0.05).
Adhesion was significantly decreased on SS1 (P<0.01) surfaces compared with the
textured surfaces.
Figures 5.12 and 5.13 indicate that after incubations times of 48 and 72 hrs,
respectively, adhesion on the TS1, and TS2 textured samples did not differ
significantly (P>0.05). In addition, there was no significant difference between the
adhesion on the SS1 and SS2 samples (P>0.05). Adhesion on the smooth surfaces
was significantly less than on the textured surfaces (P<0.001).

102
Overall, the figures indicate that the smooth surface samples (SS1 and SS2) generally
exhibited lower initial adhesion than the textured surface samples (TS1 and TS2).
Repeated measures two-way ANOVA on the cell attachment data with incubation
time and surface texture as factors indicated that there was no significant main effect
for incubation time but there was a highly significant main effect for surface texture
P<0.0001).
Figure 5.14 shows that when the number of cells attached is averaged across both
textured and smooth samples there is a clear difference in the rate at which cells are
detached from the substrate. The linear nature of the relationship between the natural
logarithm of the data and decay time indicates that cells detach in an exponential
fashion. The decay constant for textured surfaces is approximately an order of
magnitude smaller than for smooth surfaces (0.029 for textured compared with 0.29
for smooth).
Figure 5.11 Comparison of normal skin fibroblast attachment to four implant
surfaces after 24 hours of incubation.
TS1 TS2 SS2 SS1
Time (mins)

103
Figure 5.12 Comparison of normal skin fibroblast attachment to four implant
surfaces after 48 hours of incubation.
Figure 5.13 Comparison of normal skin fibroblast attachment to four implant
surfaces after 72 hours of incubation.
TS1 TS2 SS2 SS1
Time (mins)
TS1 TS2 SS2 SS1
Time (mins)
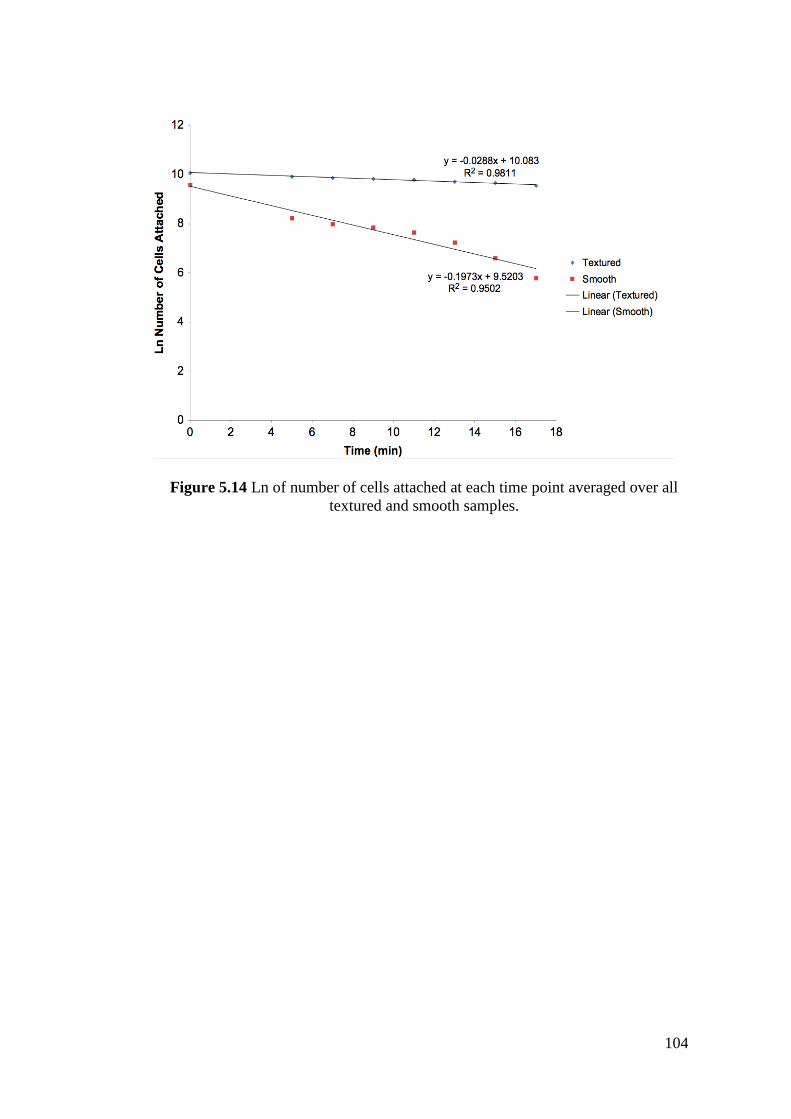
104
Figure 5.14 Ln of number of cells attached at each time point averaged over all
textured and smooth samples.
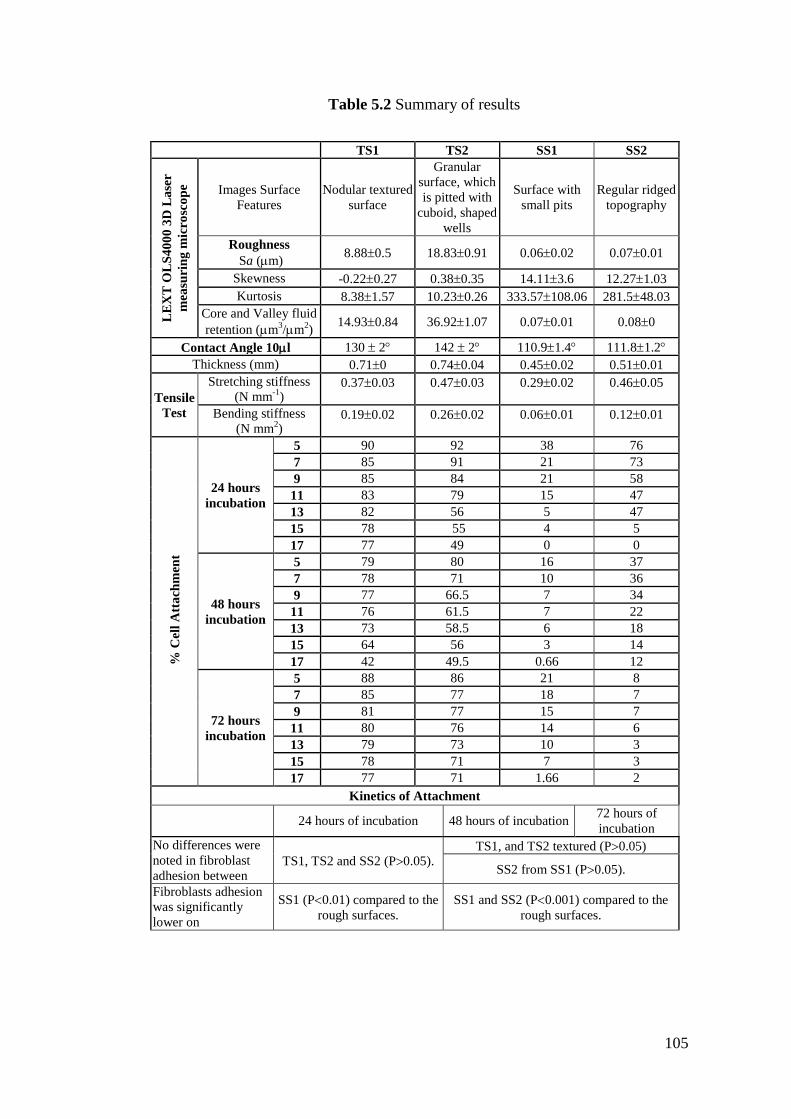
105
Table 5.2 Summary of results
TS1 TS2 SS1 SS2
LE
XT
OL
S4
00
0 3
D L
ase
r
mea
suri
ng
mic
rosc
op
e
Images Surface
Features
Nodular textured
surface
Granular
surface, which
is pitted with
cuboid, shaped
wells
Surface with
small pits
Regular ridged
topography
Roughness
Sa (m) 8.880.5 18.830.91 0.060.02 0.070.01
Skewness -0.220.27 0.380.35 14.113.6 12.271.03
Kurtosis 8.381.57 10.230.26 333.57108.06 281.548.03
Core and Valley fluid
retention (m3/m
2)
14.930.84 36.921.07 0.070.01 0.080
Contact Angle 10l 130 2 142 2 110.91.4 111.81.2
Thickness (mm) 0.710 0.740.04 0.450.02 0.510.01
Tensile
Test
Stretching stiffness
(N mm-1
) 0.370.03 0.470.03 0.290.02 0.460.05
Bending stiffness
(N mm2)
0.190.02 0.260.02 0.060.01 0.120.01
% C
ell
Att
ach
men
t
24 hours
incubation
5 90 92 38 76
7 85 91 21 73
9 85 84 21 58
11 83 79 15 47
13 82 56 5 47
15 78 55 4 5
17 77 49 0 0
48 hours
incubation
5 79 80 16 37
7 78 71 10 36
9 77 66.5 7 34
11 76 61.5 7 22
13 73 58.5 6 18
15 64 56 3 14
17 42 49.5 0.66 12
72 hours
incubation
5 88 86 21 8
7 85 77 18 7
9 81 77 15 7
11 80 76 14 6
13 79 73 10 3
15 78 71 7 3
17 77 71 1.66 2
Kinetics of Attachment
24 hours of incubation 48 hours of incubation 72 hours of
incubation
No differences were
noted in fibroblast
adhesion between TS1, TS2 and SS2 (P0.05).
TS1, and TS2 textured (P0.05)
SS2 from SS1 (P0.05).
Fibroblasts adhesion
was significantly
lower on
SS1 (P0.01) compared to the
rough surfaces.
SS1 and SS2 (P0.001) compared to the
rough surfaces.

106
5.4 Discussion
This study has accomplished an investigation into the characterisation of
microstructure surface of commercially available breast implants. A variety of
experimental techniques were employed including 3-D imaging, surface roughness
and hydrophobicity measurement and micro tensile testing. In addition, experimental
tests were undertaken in order to examine the kinetics of fibroblast-silicone surface
detachment of the implants. The correlation between surface characteristics and
fibroblast adhesion was analysed.
The 3-D imaging and surface roughness parameter measurement of the implant
samples revealed the textured surfaces to be rough, nodular surfaces containing high
peaks and deep crevasses. The magnitude of the skewness values obtained for the
textured surfaces was relatively small indicating that the predominance of either
valleys or peaks was weak in both of the samples. The SS1 and SS2 samples
displayed surfaces with features that were less rough and more regular and repetitive
than those of the textured surfaces. Peaks were the predominant feature on these
smooth surfaces; however both the magnitudes of both peak height above and valley
depth below the core roughness were relatively small compared to those of the
textured surfaces.
The textured surfaces were significantly rougher than smooth surfaces exhibiting Sa
measurements which were 130 - 320 times greater than the SS2and SS1 samples and
a core roughness measure, Sk, that was between 69 and 160 times higher. In
addition, the maximum surface heights of the textured surfaces were between 21 - 57
times greater than the smooth samples. Both maximum peak height and valley depth
of the textured surfaces were significantly higher than the smooth samples, between
12 and 46 times for peak height and 56 - 98 times for valley depth.
107
The fluid retention indexes determined for the breast implant samples indicated that
the smooth implant surfaces would require significantly less fluid than the textured
samples to fill the surface voids. The contact angle measurements for water droplets
placed on the sample surfaces revealed that the rougher the surface, the larger the
contact angle and consequently the greater the hydophobicity (Figure 5.5). The
textured surfaces exhibited higher roughness values, contact angles and
hydrophobicity than the smooth sample surfaces.
The adhesiveness of human skin fibroblasts on the breast implant surfaces was
analyzed in terms of the resistance to detachment with trypsin. In this study, the
effect of surface roughness on normal skin cell adhesion was investigated on implant
samples with Sa in the range 0.06 0.02 to 18.83 0 .91 m. The results show that
fibroblasts adhere significantly better on the textured, rougher surfaces than on the
smoother surfaces (Table 5.2). Lower levels of cell adhesion were observed on
surfaces with roughness of 0.07 0.01 m and lower, while higher levels of cell
adhesion were observed for the samples with Sa above 8 m. At the end of the tests
following 24 and 72 hours incubation the highest number of cells remained attached
to the TS1 sample whereas following 48 hours incubation, the TS2 textured surface
demonstrated the highest cell attachment. The TS1 sample exhibited higher average
cell attachments than the TS2 sample over the test periods following incubations of
24, 48 and 72 hours. The skewness value obtained for the TS1 sample indicated a
slight predominance of valleys in the surface topology, which is in contrast to the
TS2 sample, where peaks predominate.
Comparing the kinetics of attachment after 24, 48 and 72 hours of incubation and the
sample contact angle measurement measurements it was found that surfaces
exhibiting contact angles of 130 and greater and Sa above 8 m (TS1, TS2)
provided greater rates of attachment compared to surfaces with contact angles less
than 112 and Sa of 0.07m and below (SS2, SS1). The rationale of this behaviour
suggests that rough surfaces provide a greater area of attachment in comparison to
the smooth ones because the cells are able to infiltrate the interstices of the textured

108
surfaces. Take into consideration that a typical fibroblast has the following
dimensions 50 – 100 x 30 x 3 m. The grooves of, for example, the TS2 textured
implant surface are 52.02 - 358 m width, so it is possible that many cells spread
along these interstices. Additional studies are needed to evaluate cell attachment in
the groove and ridge transitions in terms of the area of the adhesive contact and to
study cell spreading in the micropatterns of these breast implants.
The results of the stiffness investigation revealed that although there was no clear
hierarchy of stiffness among the implant types overall, the textured surfaces did tend
to exhibit higher bending stiffness. Bending stiffness is related to change in implant
shape whereas stretching stiffness is associated with change in implant volume under
stress.

109
Chapter VI Physico-chemical characteristics of
coated silicone textured versus smooth breast
implants differentially influence breast-derived
fibroblast morphology and behaviour
6.1 Introduction
In the previous chapter physical and mechanical characteristics of the breast implants
that could influence cell-surface adhesion were studied. This is important because the
breast implant surface is thought to interact directly with the breast tissue once
inserted (Harvey et al., 2013). To successfully elicit specific cellular responses and
direct new tissue formation, biological cues are created through the design of
biomimetic scaffolds that modify biomaterials with ECM molecules (Shin et al.,
2003).
The interaction of ECM proteins with cells via cell-surface integrin family receptors
results in focal contacts; they provide support to cellular processes and maintain the
tissue architecture. Cell spreading, adhesion, proliferation and migration are
influenced by the signal transduction cascades initiated by the binding of an ECM
molecule and integrin (Franz et al., 2011).
This chapter addresses the efficacy of different types of coatings on commercially
available smooth and textured silicone breast implant surface topographies. To this
end, the effect of four specific coatings on initial cell attachment, viability,
proliferation and gene expression on these surfaces was investigated.

110
6.2 Materials and Methods
The study was conducted following two stages: the first stage consist of
characterising the surface of silicone breast implants by measuring the arithmetic
surface roughness and analysing the chemical composition, the second stage
consisted of studying the in-vitro adhesive interactions of breast fibroblasts with
implants surfaces in order to determine how implant surface textures and surface
coatings affect specific functions of the cell directly involved in cell-surface
adhesion. These stages are described in diagrammatic form in Figure 6.1.
Figure 6.1 Study design to determine the implant surfaces physico-chemical
characteristics and cell-surface behaviour in-vitro.
6.2.1 Sample preparation
The silicone breast implants studied were chosen from some of the commonly
available implants (Figure 6.2) in clinical practice: (1) Textured Surface-1 (TS1)
(TS1 (Mentor Worldwide LLC, Skyway Circle North Irving, Texas)); (2) Smooth

111
Surface (SS1) (Mentor Smooth (Mentor Worldwide LLC, Skyway Circle North
Irving, Texas)); (3) Textured Surface-2 (TS2) (Allergan Biocell (Allergan, Inc,
Santa Barbara, California)). Sample preparation was performed following the
methodology of Valencia (Valencia-Lazcano et al., 2013). Surfaces were coated with
either 5 μg/ml aggrecan (Sigma-Aldrich, USA), 5 μg/ml collagen type I (BD
Biosciences, USA), 5 μg/ml fibronectin (Sigma-Aldrich, USA) or 10 μg/ml
hyaluronic acid (Sigma-Aldrich, USA) solution and incubated for 1 h at 37 C and
washed twice with PBS (PAA laboratories, Austria).
6.2.2 Characterisation
Physical properties of smooth and textured breast implants were evaluated by
looking at their topographical features using confocal laser microscopy following the
procedure described previously by Valencia (Valencia-Lazcano et al., 2013). The
procedure enables highly accurate 3D images of implant surfaces to be produced
from which surface roughness parameter values can be obtained. Chemical
characterisation was carried out recording Raman images and spectra of the implants
using α300R equipped with a CCD camera, UHTS spectrometer, frequency-doubled
Nd:YAG laser used for 532 nm excitation, and a Zeiss 50x air objective (N.A.=0.7)
(Horiba, USA).
6.2.3 Cell culture
Cultured human breast tissue fibroblasts were established from tissue biopsies taken
from healthy female patients (n=3) undergoing routine elective surgery. All patients
had given full written and verbal consent for the use of discarded tissue for the
experimental purposes of this ethically approved study. All cultures were passage 2
and were grown to confluence in 125 ml culture flasks in Dulbecco‘s Culture
Medium (DMEM) (Sigma-Aldrich, UK) substituted with 10% fetal bovine serum
(Sigma-Aldrich, USA), 1% L-glutamine (PAA laboratories, Austria), 1 % non-
essential amino acid solution (Sigma-Aldrich, USA) and 1% penicillin/streptomycin
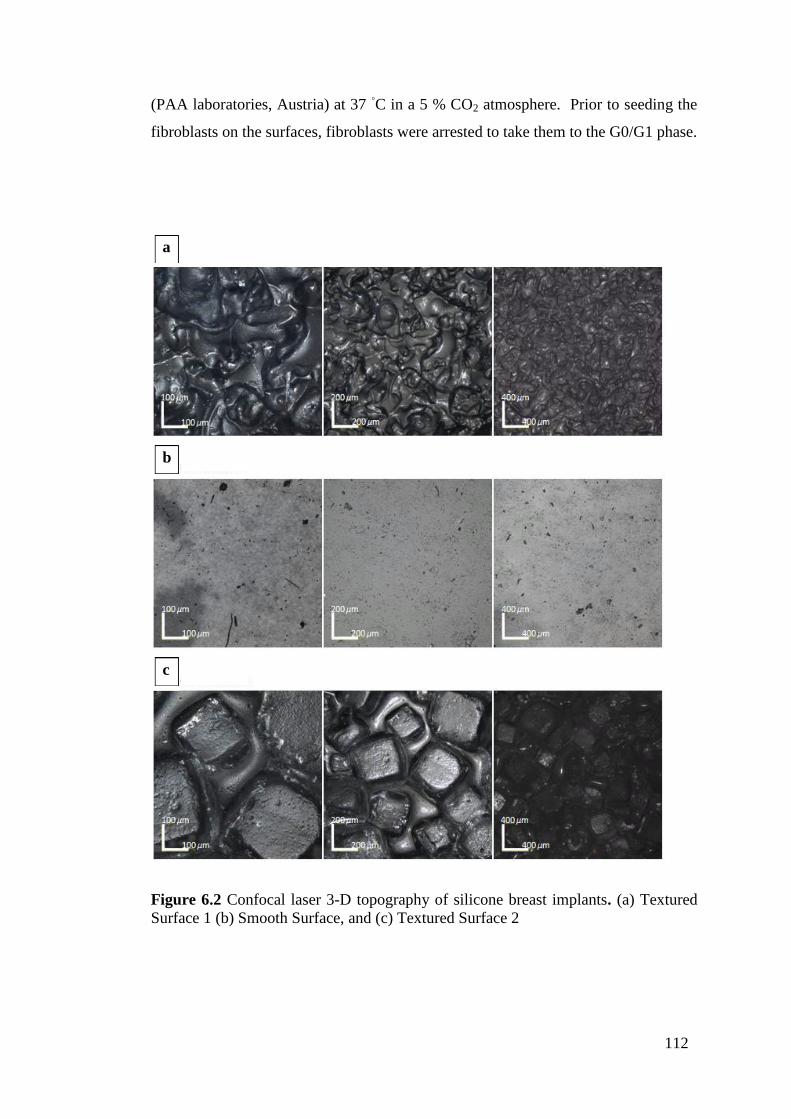
112
(PAA laboratories, Austria) at 37 ◦C in a 5 % CO2 atmosphere. Prior to seeding the
fibroblasts on the surfaces, fibroblasts were arrested to take them to the G0/G1 phase.
Figure 6.2 Confocal laser 3-D topography of silicone breast implants. (a) Textured
Surface 1 (b) Smooth Surface, and (c) Textured Surface 2
b
c
a

113
6.2.4 Cytotoxicity
Cytotoxicity was tested after 24 hrs incubation; media from each well was aspired
and centrifuged at 1600 rpm for 4 min. The media was transferred to a 96 well-plate
at a volume of 100 L per well by triplicate, and 100 L of LDH (Roche, USA) was
added to each well. The plate was protected from light and incubated at room
temperature for 30 min. Absorbance was measured spectrophotometrically
(Molecular Devices, USA) at a wavelength of 485 nm. The background absorbance
of the multi-well plates was measured at 690 nm and this value was subtracted from
the primary wavelength measurement. The number of replicates was 3 per surface;
the control group corresponds to the uncoated surfaces.
6.2.5 Fibroblast adhesion to surfaces
Adhesion assay was tested after 2 hrs of seeding the fibroblasts onto the surfaces.
Dissociated cell suspensions were washed twice with PBS (PAA laboratories,
Austria) to be later re-suspended in media without serum. 5 L of calcein AM
solution (Molecular probes, USA) was added to a cell suspension of 5x10⁶ cells/ml
and incubated at 37 °C for 30 min. The cells were washed twice with media and re-
suspended in fresh media. The cells were seeded on breast implant surfaces in a 96
well plate in a final volume of 100 L/well of the calcein-labelled cell suspension
(5x10⁴ cells) culture medium (Sigma-Aldrich, UK) and incubated for 2 h in a
humidified atmosphere of 37 °C, 5 % CO2. Non-adherent calcein-labelled cells were
removed by washing four times with warm media (Sigma-Aldrich, UK); finally 200
L of PBS (PAA laboratories, Austria) was added. Fluorescence was measured using
a micro-plate reader (Molecular Devices, USA) at 485/538 nm. The percentage of
cell adhesion was determined by dividing the corrected (background subtracted)
fluorescence of adherent cells by the total of corrected fluorescence of cells added to
each micro-plate well and multiplying by 100 %. The number of replicates was 3 per
surface; the control group corresponds to the uncoated surfaces.

114
6.2.6 Fibroblast proliferation
Proliferation was tested after 24 hrs incubation in standard conditions, media from
each well was aspired and 300 L of fresh complete media (Sigma-Aldrich, UK) and
30 L of water-soluble tetrazolium salt-1 (WST-1) cell proliferation reagent (Roche,
USA) were added to each well. The well plate was wrapped in aluminium foil and
placed in a shaker for 2 min at 55 rpm. After 4 h incubation in a humidified
atmosphere of 37 °C, 5 % CO2, media was removed and poured at 100 L per well
into a 96 well-plate. Absorbance was measured using a micro-plate reader
(Molecular Devices, USA) at 450 - 690 nm. Cell proliferation was determined by
subtracting the absorbance background control and the absorbance of 630 – 690 nm
from the 450 – 500 nm measurement. Specific Absorbance = A475nm (Test) –
A475nm (Blank) – A660nm (Test). The number of replicates was 3 per surface; the
control group corresponds to the uncoated surfaces.
6.2.7 Immunofluorescence
Fluorescence staining of the actin (TRITC) (cytoskeleton), vinculin (FITC) (focal
adhesion protein), and cell nucleus (DAPI) was performed using triple staining.
Throughout the staining procedure, after 24 hrs of culture, media was removed from
the well plate and the surfaces washed with PBS (PAA laboratories, Austria).
Surfaces were covered with 10% formalin (Sigma-Aldrich, USA) overnight and
washed with PBS (PAA laboratories, Austria). Surfaces were covered with 0.1 %
Triton X-100 (Sigma-Aldrich, USA) for 10 min. Each sample was washed twice with
PBS (PAA laboratories, Austria) (5min each), then covered with blocking buffer (LI-
COR Biosciences, USA) for 30 min, and washed twice with PBS (PAA laboratories,
Austria) (5 min each). The surfaces were labelled with 1st antibody ab2264 rabbit
polyclonal to paxillin (abcam, UK) at a concentration of 1:100 overnight at 4 C.
Surfaces were washed 3 times with 0.1 % Tween 20/PBS (5 min each). Surfaces
were labelled with Secondary antibody Alexa Fluor® 488 dye (abcam, UK) 1:500
dilution for 100 min at room temperature. Surfaces were washed 3 times with 0.1 %
Tween 20/PBS (Fisher Scientific, USA) (5min each). The surfaces were labelled

115
with 4',6-diamidino-2-phenylindole (DAPI) (Molecular probes, USA) for 15 min
then washed with 0.1 % Tween 20/PBS (Fisher Scientific, USA) for 5 min.
The surfaces were labelled with rhodamine-phalloidin 1:1000 (Sigma-Aldrich, USA)
for 40 min at room temperature then washed once with PBS (PAA laboratories,
Austria), and washed twice with 0.1% Tween 20/PBS (Fisher Scientific, USA) (5
min each), then finally being washed twice with PBS (PAA laboratories, Austria).
Surfaces were mounted with ProLong® Gold antifade reagent (Invitrogen, USA),
and covered with aluminium paper and stored at -4 C. Immunofluorescence
microscopy was carried out using a DeltaVision deconvolution system softWoRx
v3.4.5 (Applied precision, USA) which consists of an Olympus IX-70 inverted
microscope with an epi-fluorescence attachment. The images were obtained at 512 x
512 pixels with a magnification of 100x. Images were analyzed using softWoRx
v3.4.5 and Image-J software (NIH, USA).
6.2.8 Quantification of gene adhesion expression
6.2.8.1 RNA extraction
After 24 hrs of culture, total RNA was extracted from each specimen by adding 500
L of Trizol reagent (Invitrogen Ltd, UK) for 2 min. Trizol was aspired and
transferred to an eppendorf tube and 350 L of chloroform (Fisher Scientific, USA)
was added; the tube was shaken and centrifuged at 14500 rpm for 15 min. Three
layers were formed and the upper layer was aspired and transferred into an eppendorf
tube; an equal amount of ethanol 80 % (Fisher Scientific, USA) was added and
mixed by pipetting it and poured into an RNeasy mini spin column. After 15 s of
centrifugation, supernatant was poured away and 600 L of RWT buffer (Qiagen,
Netherlands) was added. Centrifugation was performed for a further 15 s then the
column was placed into a collection tube and 500 L of RPE buffer (Qiagen,
Netherlands) was added; this was then centrifuged for 15 s. Supernatant was poured
away and the column was centrifuged for 1 min at 15000 rpm. The column was

116
placed into an eppendorf tube and 25 L of RNease-free water (Qiagen, Netherlands)
was added to the top layer and left for 1 min at room temperature before
centrifugation at 15000 rpm for 1min. RNA concentration and purity was determined
using a UV-Vis spectrophotometer (NanoDrop, USA) by absorbance measurements.
6.2.8.2 cDNA Synthesis
The quantity of nuclease free water was calculated based on RNAs (100ng)
concentration to make a 20 L solution, 4 L of cDNA super mix (Quanta
Biosciences, USA) was poured into an eppendorf tube, RNease-free water (Qiagen,
Netherlands) was added and finally mRNA was added. The tube was centrifuged for
30 s and incubated at 25 C for 5 min. Synthesis conditions comprised an initial
cycle at 42 C for 1 h and one cycle at 85 C for 5 min to inactivate the enzyme and
finally the solution was diluted in 180 L of nuclease free water (Ambion, USA).
6.2.8.3 Quantitative real-time polymerase chain reaction
The primers used to amplify the selected genes using real time qPCR were designed
using Universal ProbeLibrary (Roche, USA). Reactions were set up in a total volume
of 10 L using 4 L of cDNA, 5 L probes master (Roche, Germany), 0.7 L
RNease-free water (Qiagen, Netherlands) and 0.1 L each of gene-specific primer
(Table 1) and performed in a LightCycler® 480 Real-Time PCR System (Roche,
Germany). The cycling conditions were: 95 °C for 10 min; 45 cycles of 95 °C for 10
s, 60 °C for 30 s and 72 °C for 1 s with a single fluorescence measurement; cooling
was set at 40 °C for 30 s. Specificity of the PCR products was confirmed by analysis
of the dissociation curve.

117
6.2.9 Statistical analysis
Statistical analysis was performed using the Prism v.5.0 software package for
Windows (GraphPad Software, Inc., USA), applying the two-way ANOVA test.
When the p-value was less than 0.05; the difference was regarded as statistically
significant.
Table 1 Sequences of primers used for adhesion related genes using quantitative
real-time polymerase chain reaction
6.3. Results
6.3.1 Physico-chemical characterisation of smooth versus textured implants
Raman spectra showed all implants have the typical Raman spectrum of pure PDMS
at the 490 cm-1
the Si-O stretch and 713 cm-1
the Si-C stretch modes. TS1 and SS1
possess a similar profile (Figure 6.3), while confocal laser microscopy showed
different arithmetic mean surface roughness (Sa) between these two implants: TS1 is
8.88 m rough while SS1 is 0.06 m. TS1-SS1 and TS2 implants showed different
profiles and intensity levels (Figure 6.3).
Gene/Primer Gene ID Sequence 5' to 3' Primer
Position
Amplicon
Size (bp)
(ACTN1) Alpha-actinin L nm_001102.3 ctgttccagccatccttcat 834-853 70
(ACTN1) Alpha-actinin R nm_001102.3 tcatgatgctgttgtaggtggt 882-903 70
(VCL) Vinculin (VCL) L nm _014000.2 ggaggtgattaaccagccaat 2767 - 2787 88
(VCL) Vinculin (VCL) R nm _014000.2 aatgatgtcattgcccttgc 2835 - 2854 88
(PXN) Paxillin L nm _002859.3 cccagtgtggagagtctcttg 785 - 805 81
(PXN) Paxillin R nm _002859.3 ctcgccctggttcacagt 848 - 865 81
(ptk2) Protein tyrosine kinase L nm_153831.2 gtctgccttcgcttcacg 73 - 90 77
(ptk2) Protein tyrosine kinase R nm_153831.2 gaatttgtaactggaagatgcaag 126 - 149 77

118
Sa was modified by coating the surfaces with specific protein, PG, and GAG
coatings. In this case, the same coating procedure was performed on all surfaces, thus
the changes in roughness were likely due to the interactions between implant
topography and the coating structure. The surface features of the different breast
implants after coating with aggrecan, collagen I, fibronectin, and hyaluronic acid
were assessed using confocal laser scanning microscopy. 3D topological models
were obtained using colour-height information from planar images of the implant
sample surfaces (Valencia-Lazcano et al., 2013). Figures 6.4 (a) - (c) show the 3-D
topography of the uncoated silicone breast implants (a) TS1, (b) SS1, and (c) TS2,
were used as the control. The Sa measurements for both the coated and uncoated
implant surfaces are shown in Figure 6.5 (a), where upon inspection it can be seen
that significant differences (p < 0.001) exist among the TS1, SS1 and TS2. Coated
surfaces of TS1 were found to be significantly rougher (p < 0.001) than the uncoated
ones Figure 6.5 (b). SS coated with collagen I, fibronectin and hyaluronic acid were
significantly rougher (p < 0.01) compared to the uncoated surfaces; however, no
significant difference in Sa was observed between the aggrecan coated and uncoated
SS1 (Figure 6.5 (c). TS2 coated with fibronectin and hyaluronic acid were found to
be significantly rougher (p < 0.05) in comparison to the uncoated surfaces. No
significant differences were found in the roughness values of uncoated, aggrecan and
collagen I coated TS2 (Figure 6.5 (d).

119
Figure 6.3 Raman spectra of silicone breast implants
b
c
a

120
Figure 6.4 Confocal laser 3-D topography of silicone breast implants. Confocal laser
3-D topography of silicone breast implants using colour height information (644 x
642 m). (a) Textured Surface 1, (b) Smooth Surface, and (c) Textured Surface 2.
b
c
21.8
0 0
160
640 480
320
x
328.2
262.6
196.9
131.3
65.6
0 0
160
640 480
320
x
454.6 363.6 272.7 181.8 90.9
0
x
0 160
640 480
320
a

121
Figure 6.5 Changes in Sa of the modified coated surfaces examined by confocal
laser microscopy. (a) Comparison of measured Sa among the three implants showed
statistical significant differences between them (p < 0.001). Comparison of measured
Sa among uncoated and coated (b) Textured Surface 1, (c) Smooth Surface, and (d)
Textured Surface 2. Statistical analysis was performed applying the two-way
ANOVA test. When the p-value was less than 0.05, the difference was regarded as
statistically significant (*p<0.05, **p<0.01, ***p<0.001).
6.3.2 Cytotoxic effect of specific coatings on breast fibroblasts
After 24 hrs of seeding breast fibroblasts onto uncoated TS1, SS1 and TS2 and
surfaces coated with aggrecan, collagen I, fibronectin, and hyaluronic acid, lactate
dehydrogenase (LDH) activity in the culture media was used as an indicator of cell
membrane integrity and thus a measurement of cytotoxicity (Figure 6.6). The results
presented in Figure 6.6 reveal that SS1, TS1 and TS2 coated with aggrecan showed a
significantly higher (p<0.001) cytotoxicity compared with the corresponding
uncoated surfaces. A decrease in cytotoxicity was found on TS1 coated with collagen
I (p<0.01), fibronectin (p<0.01) and hyaluronic acid (p<0.001) when compared with
Hyaluronic Acid Uncoated Aggrecan Fibronectin Collagen I
Textured Surface 1 Smooth Surface Textured Surface 2
a
b c d
***
*** ***
***
** **
**
* *
***
***
***

122
uncoated TS1. No significant difference was found between the cytotoxicity values
of SS1 and TS2 coated with collagen I and fibronectin compared with the uncoated
SS1 and TS2, however, the cytotoxicity of the hyaluronic acid coated surfaces were
significantly lower (p<0.001) than the uncoated surfaces.
Figure 6.6 Cytotoxicity was evaluated by the quantification of plasma membrane
damage by measuring the LDH activity in the 24 hrs cultured supernatant of breast-
derived fibroblasts. Data shows mean standard deviation. Statistical analysis was
performed applying the two-way ANOVA test; when the p-value was less than 0.05,
the difference was regarded as statistically significant (*p<0.05, **p<0.01,
***p<0.001).
6.3.3 Effect of specific coatings on breast fibroblast attachment
A Calcein AM cell adhesion assay was used to measure the adhesion of calcein-
labeled breast fibroblasts to uncoated TS1, SS1 and TS2 and surfaces coated with
aggrecan, collagen I, fibronectin, and hyaluronic acid (Figure 6.7). Cell adhesion was
found to be lower for fibroblasts on the smooth surfaces compared to the textured
ones (p<0.001). Cell adhesion was significantly higher on collagen I, fibronectin and
hyaluronic acid coated implants compared to the corresponding uncoated surfaces
(p<0.001). Cell adhesion was highest (89%) for collagen I coated TS1 and TS2 and
Hyaluronic Acid Uncoated Aggrecan Fibronectin Collagen I
Textured Surface 1 Smooth Surface Textured Surface 2

123
fibronectin coated TS2 (87%). No significant difference was found between
fibroblast adhesion to aggrecan coated implants compared to the corresponding
uncoated surfaces (p>0.05).
Figure 6.7 Effect of specific coatings on fibroblast attachment. Textured Surface 1,
Smooth Surface, and Textured Surface 2 were coated with aggrecan, collagen I,
fibronectin, and hyaluronic acid. Calcein AM cell adhesion assay was used to
compare breast fibroblasts attachment after 2 hrs compared to control cultures grown
onto uncoated Textured Surface 1, Smooth Surface, and Textured Surface 2.
Statistical analysis was performed applying the two-way ANOVA test; when the p-
value was less than 0.05, the difference was regarded as statistically significant
(*p<0.05, **p<0.01, ***p<0.001).
6.3.4 Effect of specific coatings on cell proliferation
Proliferation of breast fibroblasts seeded for 24 hrs on TS1, SS1 and TS2 coated with
aggrecan, collagen I, fibronectin, and hyaluronic acid was quantified using a water-
soluble tetrazolium salt-1 (WST-1) cell proliferation assay and compared with
control cultures grown on uncoated TS1, uncoated SS1 and uncoated TS2 (Figure
6.8). On smooth surfaces, fibroblasts proliferation rates were lower compared to the
Hyaluronic Acid Uncoated Aggrecan Fibronectin Collagen I
Textured Surface 1 Smooth Surface Textured Surface 2

124
textured surfaces for both the coated and uncoated surfaces (p<0.001). Cell
proliferation was significantly higher for fibroblasts seeded on collagen I, fibronectin
and hyaluronic acid coated implants compared to the corresponding uncoated
surfaces (p<0.001). The highest cell proliferation rate (0.8) was found in collagen
coated TS1, followed by 0.71 for fibronectin coated TS1. Lower proliferation rates
were measured on uncoated and aggrecan coated surfaces (p<0.001).
Figure 6.8 Effect of specific coatings on fibroblast proliferation after 24 hrs cell
culture. Statistical analysis was performed applying the two-way ANOVA test; when
the p-value was less than 0.05, the difference was regarded as statistically significant
(*p<0.05, **p<0.01, ***p<0.001).
6.3.5 Effect of coatings on cytoskeleton organization
Rhodamine-phalloidin staining of breast fibroblasts cultured on uncoated and
aggrecan coated TS1 and SS1, and uncoated TS2 revealed cells that exhibited fine
stress fibres all around the cell periphery (Figure 6.9). Fibroblasts seeded on
aggrecan coated SS1 and TS1, and uncoated TS2 were not able to form detectable
cell-material adhesion complexes as well as actin cytoskeleton, and thus remained
rounded, non-spread. Fibroblasts seeded on uncoated SS1 were poorly spread and
showed a more random actin network than on uncoated TS1. Well spread cells in
Hyaluronic Acid Uncoated Aggrecan Fibronectin Collagen I
Textured Surface 1 Smooth Surface Textured Surface 2

125
collagen I, fibronectin and hyaluronic acid coated TS1, SS1 and TS2 exhibited thick
fibres throughout the entire cell. In fibronectin coated TS2, collagen I coated SS1 and
hyaluronic acid coated TS1 cells showed a well organized actin cytoskeleton.
Fibroblasts seeded on fibronectin coated TS1 and on Hyaluronic Acid coated TS2
exhibited an elongated cellular phenotype. However, actin fibres were dense in all
the cells in hyaluronic acid coated TS2 in comparison to fibroblasts in fibronectin
coated TS1 which showed an abundance of fine fibres throughout the entire cell.

126
Textured Surface 1 Smooth Surface Textured Surface 2
Un
coa
ted
A
B
C
Ag
gre
can
D
E
F
Co
lla
gen
I
G
H
I
Fib
ron
ecti
n
J
K
L
Hy
alu
ron
ic A
cid
M
N
O
Figure 6.9 Morphology of breast fibroblasts seeded onto coated and uncoated
breast implant surfaces. Immunofluorescence staining of the actin (red)
(cytoskeleton), vinculin (green) (focal adhesion protein), and cell nucleus (blue)
(DAPI) was performed on breast-derived fibroblasts on day 1 after seeding onto (D-
F) aggrecan, (G-I) collagen I, (J-L) fibronectin, and (M-O) hyaluronic acid. Coated
and uncoated (A, D, G, J, M) Surface Texture 1, (B, E, H, K, N) Smooth Surface,
and (C, F, I, L, O) Surface Texture 2.
15
15m 15m 15m
15m 15m 15m
15m 15m 15m
15m 15m 15m
15m 15m 15m

127
6.3.6 Effect of aggrecan, collagen I, fibronectin and hyaluronic acid coatings on
adhesion expression in breast fibroblasts
After 24 hrs of incubation, total RNA was extracted from breast fibroblasts (n=3)
(passage 2). The expression of alpha-actinin, FAK, paxillin, and vinculin, mRNA
was determined by quantitative reverse-transcriptase polymerase chain reaction to
compare the effect of the coatings with the uncoated implants in breast fibroblasts
(Figure 6.10).
When the expression of the cytoskeleton components was examined, the level of α-
actinin was found to be reduced in uncoated and aggrecan coated surfaces, but the α-
actinin expression was higher in collagen I and fibronectin coated TS1 (p<0.01) and
hyaluronic acid coated TS1 (p<0.001), and in collagen I, fibronectin and hyaluronic
acid coated TS2 (p<0.001). The FAK level expression by breast fibroblasts was up-
regulated in collagen I, fibronectin and hyaluronic acid coated surfaces (p<0.001)
while the FAK expression was lower in both uncoated and aggrecan coated TS1, SS1
and TS2. The gene expression of paxillin was up-regulated in fibroblasts seeded on
collagen I and fibronectin coated implants (p<0.001) and in the hyaluronic acid
coated TS1 (p<0.01), SS1 (p<0.05) and TS2 (p<0.001). Regarding vinculin
expression, a higher level was detected in the surfaces coated with collagen I and
fibronectin (p<0.001) compared to the uncoated ones. Conclusions of the findings
will be shown in the next chapter.

128
Hyaluronic Acid Uncoated Aggrecan Fibronectin Collagen I
Textured Surface 1 Smooth Surface Textured Surface 2
Textured Surface 1 Smooth Surface Textured Surface 2
Hyaluronic Acid Uncoated Aggrecan Fibronectin Collagen I
Gene expression of alpha-actinin
Gene expression of focal adhesion kinase
a
b

129
Figure 6.10 Effect of aggrecan, collagen I, fibronectin and hyaluronic acid coatings
on gene adhesion expression in breast-derived fibroblasts after 24 hrs of cell culture.
Results are expressed as mean standard deviation of triplicates. *p<0.05,
**p<0.01, ***p<0.001 indicates significant difference between mRNA expression in
fibroblasts seeded onto uncoated implants versus mRNA expression in fibroblasts
seeded onto coated surfaces.
Hyaluronic Acid Uncoated Aggrecan Fibronectin Collagen I
Textured Surface 1 Smooth Surface Textured Surface 2
Textured Surface 1 Smooth Surface Textured Surface 2
Hyaluronic Acid Uncoated Aggrecan Fibronectin Collagen I
Gene expression of paxillin
Gene expression of vinculin
c
d

130
6.4 Discussion
In this study, for the first time, the physico-chemical characteristics of coated
silicone breast implants on breast-derived fibroblast morphology and behaviour were
evaluated. Chemical properties were examined by Raman spectroscopy;
topographical features were studied by confocal laser microscopy, and the effect of
four unique protein and glycosaminoglycan (GAG) coatings (aggrecan, collagen I,
fibronectin and hyaluronic acid) on breast-derived fibroblast cytotoxicity,
attachment, proliferation, morphology, and gene expression were examined.
The choice of the specific coatings evaluated in this study was based on an in-house
whole genome microarray study undertaken in order to determine genes whose
expression would correlate with breast capsular contracture formation and on
previously published gene and protein research of relevance to breast capsular
fibrosis (Kyle et al., 2013). Results showed that specific coatings can modify the
physico-chemical properties of implant surfaces eliciting specific cellular reactions.
Moreover, it was showed that the coated surfaces excluding aggregan, promoted cell-
surface adhesion, proliferation, morphology and the up-regulation of adhesion related
genes without any cytotoxic effect. These findings provide valuable information of
characteristic expression of adhesion related genes; cell morphology and
proliferation in breast fibroblasts following the application of specific coatings on
smooth compared to textured breast implant surfaces.
Foreign body reaction is elicited by the implant placement in the body; this initiates
an initial inflammatory phase where the prosthesis is encapsulated or eliminated by
the host. Surface characteristics such as roughness, texture, surface free energy,
surface charge and chemical composition all play key roles in cell adhesion and
growth, and the nature of a biomaterial surface governs the phenotypic response of
interacting cells (Prasad et al., 2010). Previous studies (Bacakova et al., 2011) have
demonstrated that fibroblast activity can be modulated by specific coatings. Coating
the surface of implants with these specific coatings may thus provide enhanced
131
support and anchorage for cells and favourably regulate cell morphology, adhesion,
and proliferation (Yamamoto et al., 2006, Franz et al., 2011). In this study, specific
coatings were employed on the surfaces of smooth versus textured breast implant
surfaces in order to study fibroblast behaviour on these different topographies. It has
been suggested that ECM proteins can be used to optimize fibroblast reaction to
implants (Li et al., 2012b, Li et al., 2012a, Ungaro et al., 2006). Surface roughness
and chemistry of the substrate have been shown to modulate cell-surface interaction.
Furthermore, cell attachment and proliferation can be improved by utilizing coatings
and altering the micro-topography of these surfaces.
The study demonstrated that cell adhesion and spreading were sensitive to both the
physical and chemical properties of the substrate. Cell proliferation and cytotoxicity
were also studied. It was found that surfaces coated with collagen I, fibronectin and
hyaluronic acid did not elicit a cytotoxic effect on breast tissue derived fibroblasts in
comparison to the uncoated surfaces. Lower proliferation rates were measured on
uncoated and aggrecan coated surfaces. Fibroblast proliferation rate differed
significantly among the surfaces investigated. An investigation into cell morphology
showed that surface coatings promoted cell morphological modifications and the
organization of actin fibres in all surfaces. Gene expression of adhesion related
proteins shown to be modified by specific coatings and topography amongst the
variety of surfaces tested.
Silicone breast implants investigated in this study are made with
polydimethylsiloxane (PDMS); however, Raman spectra revealed a nearly matching
profile for implants from the same company, however, implants from different
company showed a dissimilar profile. These results are consistent with FTIR/ATR
spectroscopy studies comparing breast implants from 2 different companies
(Persichetti et al., 2009). Breast implants differed in chemical composition, and this
could be related to the manufacturing process. In smooth implants, the silicone
rubber shell is made with a shiny polished mandrel and to flatten this outer surface it
is steeped in a solvent, while in textured implants, the silicone rubber shell is made

132
with a negative-contact imprint from a polyurethane foam or by pushing the silicone-
coated mandrel into granular salt (Barr and Bayat, 2011).
Scanning electron microscopy and light microscopy have been used to analyze the
topographic features (Barr et al., 2009). Changes in surface roughness after coating
the surfaces were consistent with the adsorption of coatings on the valleys of the
surfaces. Fibronectin coated surfaces showed the highest increment of surface
roughness up to 277% in SS, 100% in TS1 and 16% in TS2 which correlates well
with the highest rates of adsorption (per surface) of fibronectin on SS (0.014
mg/cm2), TS1 (1.118 mg/cm
2) and TS2 (0.986 mg/cm
2). It was also found that cell
adhesion was improved by surface roughness. Cell adhesion on rougher surfaces was
higher. This means that the greater area due to texturing available for cell spreading
allows increased anchoring ability by fibroblasts. In contrast, the same level of cell
adhesion was not achieved on smooth surfaces, where low percentages of cell
adhesion were recorded in comparison to the textured surfaces. After evaluating
surface roughness, it was determined that, for the surfaces investigated in this study,
fibroblast adhesion required a substrate with a surface roughness of at least 14 m, at
which point the degree of adhesion increased with surface roughness until a
maximum adhesion was achieved at 21.94 m. Furthermore, cell spreading
demonstrated an incremental response to increases in surface roughness between
17.46 m and 21.94 m. The organization of the actin cytoskeleton was induced by
the micro-topography in fibroblasts seeded on textured surfaces alone compared to
smooth surfaces.
Increased cell adhesion was found on all implant surfaces coated with fibronectin
and collagen I in comparison to the uncoated surfaces, which increased cell
spreading. By contrast, implants coated with aggrecan demonstrated reduced cell-
surface adhesion which therefore reduced cellular proliferation. These results
suggest that collagen I and fibronectin act as potent regulators of cytoskeletal
organization and cell spreading. This interaction is important for cell migration in
wound healing (Franz et al., 2007). Cells that are forced to spread over large surface

133
areas, as in the case with textured surfaces, survive better and proliferate faster than
cells that do not spread out (Lowery et al., 2010). The stimulatory effect of cell
spreading potentially encourages tissues to regenerate after injury. If cells are lost
from an epithelial layer, for example, the spreading of the remaining cells into the
vacated space will stimulate them to proliferate until they fill the gap (Alberts et al.,
2002). It is still uncertain, however, how a cell senses the extent of its own spreading
and how it adjusts its behaviour accordingly. Cell behaviour is likely to be affected
by the chemical and physical structure of the coating. Fluorescent staining images
revealed that surfaces coated with collagen I and fibronectin induced organization of
actin stress fibres and that collagen I affected the cytoskeletal arrangement and cell
spreading, factors commonly regarded to be of significance with cell migration and
wound healing.
In cell migration, a protrusion is sent in the direction of the movement, the
extracellular substrate bound by integrin receptors induces integrin clustering and
formation of adhesion complexes (Biname et al., 2010). This leads to the eliciting of
adaptor proteins, which connect the adhesion points to the actin cytoskeleton and
triggers intracellular signalling. This signal is defined by the proteins created and the
type of integrin engaged in the interaction with the specific extracellular substrate.
Small temporary adhesion complexes located in the leading edge of protrusions
(focal complexes) mature under tension into larger structures known as focal
contacts. Focal adhesions are more stable structures connected to actin stress fibres
(Berrier and Yamada, 2007). Focal adhesion complexes are well established as a
major adhesive and signal transducing component between the internal actin
cytoskeleton and the external ECM (Petit and Thiery, 2000). Focal adhesion plays a
key role in sensing surface topography in the extracellular environment. Focal
adhesion kinase and the adaptor protein paxillin are focal adhesion proteins that can
bind to and activate integrin B1 subunit cytoplasmic domains (Sequeira et al., 2012),
along with vinculin, which connects integrins to actin filaments.

134
The adapter proteins that link stress fibres to integrins include alpha-actinin. An
increase of alpha-actinin content was observed in the cells that had spread most with
netlike actin filaments seeded on hyaluronic acid coated TS1, collagen I coated SS
and fibronectin coated TS2. When SS and TS2 were coated with collagen I, TS1 and
TS2 were coated with fibronectin, and TS1 and TS2 were coated with hyaluronic
acid, the alpha-actinin expression was up-regulated (p < 0.001), which resulted in
firmly attached fibroblasts to the substrate (p < 0.001). FAK has a role in modulation
of the assembly of focal adhesions in response to tension exerted by the cytoskeleton
on attachments to the extracellular substrate via integrins (Parsons, 2003). It was
observed that the expression of FAK was reduced in fibroblasts seeded onto the
uncoated and aggrecan coated implant surfaces. In contrast, the FAK expression was
up-regulated in the surfaces coated with fibronectin and collagen I which resulted in
increased cell-substrate adhesion p < 0.001. Paxillin, a focal adhesion-associated
adaptor protein is involved in modulating cell adhesion and spreading (Wang et al.,
2009). It was observed that the expression of paxillin was reduced in fibroblasts
cultured on the uncoated and aggrecan coated implant surfaces. However, paxillin
expression was up-regulated (p < 0.001), which resulted in well-spread fibroblasts, in
the surfaces coated with fibronectin and collagen I. Vinculin, a membrane-
cytoskeletal protein in focal adhesions that is involved in linkage of integrin adhesion
molecules to the actin cytoskeleton (Maheshwari et al., 2000), was found in all
surfaces. A low content of vinculin was observed in fibroblasts seeded onto uncoated
and aggrecan coated surfaces (p < 0.001). This resulted in weakening of adhesion (p
< 0.001), conversely a higher content of vinculin resulted in bigger focal adhesions
and greater abundance of focal adhesion points in fibroblasts seeded onto collagen I
and fibronectin surfaces. There is a consistent pattern in enhanced cell-surface
adhesion when the surfaces were coated with collagen I. Cell proliferation highlights
a significant benefit on the presence of collagen I to the surface of TS1, while
hyaluronic acid did to SS, and fibronectin to TS2. TS1 represented the optimal
substrate to promote spreading when coated with hyaluronic acid, while SS and TS2
did with collagen I. Surprisingly, no significant difference was identified between
fibroblast adhesion and proliferation to aggrecan coated implants compared to the
corresponding uncoated surfaces (p>0.05).

135
The study demonstrated that cell adhesion and spreading were sensitive to smooth
and textured surfaces. Cell proliferation and cytotoxicity were also studied. It was
found that surfaces coated with collagen I, fibronectin and hyaluronic acid did not
elicit a cytotoxic effect on breast tissue derived fibroblasts in comparison to the
uncoated surfaces. Fibroblast proliferation rate differed significantly among the
surfaces investigated. An investigation into cell morphology showed that surface
coatings promoted cell morphology modifications and the organization of actin fibres
in all surfaces. Gene expression of adhesion related proteins shown to be modified by
specific coatings and topography amongst the variety of surfaces tested.
136
Chapter VII Conclusions
7.1 Conclusions
In conclusion, data acquired from the 3-D images, roughness experimentations,
hydrophobicity assay and tensile testing have given a unique compilation of
information to enable characterisation of the smooth and textured surfaces of
commercial available breast implants. Through the investigation of the physico-
chemical properties of implants influencing cell adhesion behaviour, collagen I and
fibronectin coated implants made the substrate less hydrophobic allowing fibroblasts
to adhere and spread better. Arithmetic surface roughness increases with the use of
coatings. This increases the total area of cell-substrate contact leading to an increase
in fibroblast spreading. Tensile tests demonstrated that the textured surfaces tended
to exhibit higher bending stiffness, a property that allows fibroblasts to increase their
link between the integrins and the cytoskeleton in order to exert more force on the
substrate.
This study has demonstrated the extent and strength of cell adhesion, and subsequent
cell proliferation and differentiation based on the physical interactions between cells
and the extracellular environment in the form of topography and on the chemical
interactions mediated by specific coatings. This study has also shown that the surface
coating of the silicone breast implants induced over-expression of specific adhesion
related genes in breast-derived fibroblasts. It was identified that collagen I,
fibronectin, and hyaluronic acid coatings did not elicit a cytotoxic effect on breast
tissue derived fibroblasts in comparison to the uncoated surfaces. Fibroblast-
substrate adhesion was enhanced on collagen I and fibronectin coated samples in
comparison to the uncoated surfaces, which increased cell spreading. Breast-derived
fibroblasts proliferate actively in response to collagen I, fibronectin and hyaluronic
acid coatings. Breast-derived fibroblasts cultured on collagen I, fibronectin and
hyaluronic acid coated implants exhibit morphology, in which the cells were better
spread. There was a higher expression of a number of matrix genes in relation to

137
fibroblast attachement, which showed a greater extent on fibroblasts cultured on
collagen I and fibronectin coated implants.
The research findings demonstrate that the most promising candidate in the
regulation of adhesion and proliferation in the coated textured implant are fibronectin
and collagen I. A good adhesion ensures that the implant holds in place, thus
preventing micromotion at the host prosthesis interface, the fibroblasts will not over
produce collagen in response to this host-prosthesis shearing motion. Consequently,
capsules around these coated surfaces may be thinner and less contracted in
comparison to the capsules surrounding the uncoated textured surface implants. The
addition of appropriate coating to the surface of silicone breast implants may reduce
the risk of capsular contracture formation in the near future. Further studies are
required to provide a better understanding of cell-surface interaction in breast
fibroblasts and silicone implants.
7.2 Limitations of the work
Breast capsular contracture aetiology remains uncertain, but it is characterised by
dense fibrocollagenous connective tissue with local inflammatory response.
Furthermore, breast capsule consists of myofibroblasts, which are implicated in
contracting the breast implants (Hwang et al., 2010). Thus it was decided to limit the
samples to breast-derived fibroblasts. However, future investigation, involving
different types of cells found in breast capsules, will be of value. Another potential
limitation of our study was the total number of samples used for breast tissue (n=3), a
larger number of samples that includes different ethnicities would be beneficial.
7.3 Recommendations for future work
This study has aided in clarifying the relationship between surface roughness and cell
adhesion. As regards the other parameters (wettability, bending and stretching

138
stiffness), because commercial breast implants were considered then the key
parameters investigated may have had values that varied over only a relatively small
range, thus making it difficult to modulate some of the key factors, which is one
limitation of the study. Therefore, future work should investigate implant surfaces,
not necessarily commercial ones that exhibit a wider range of surface parameters so
that the cause effect relationships of some of the key surface parameters may be
more clearly established.
This research represents a study focused on enhancing, by surface coating, cell-
surface adhesion, spreading, and proliferation on fibroblasts seeded on breast
implants. By optimising surface coating it allows the coating to be better attached to
the breast implant surface. From this point, future work conducted can focus on the
use of chemically grafting coatings to improve coating adhesion to the substrate
resulting in a thin and more stable layer that can improve cell behaviour on breast
implants.

139
References
Abbott, E. and Firestone, F. (1993) Specifying surface quantity - a method based on
accurate measurements and comparison. Mech. Eng, 55, 569-572.
Abramo, A. C., De Oliveira, V. R., Ledo-Silva, M. C. and De Oliveira, E. L. (2010)
How texture-inducing contraction vectors affect the fibrous capsule shrinkage around
breasts implants? Aesthetic Plast Surg, 34, 555-560.
Abramowitz, M. (1993) Fluorescence microscopy: The essentials. Olympus America
Inc., 4, 1-4.
Adams, W. P., Jr. and Mallucci, P. (2012) Breast Augmentation. Plast Reconstr
Surg, 130, 597e-611e
Adams, W. P., Robinson, J. B. and Rohrich, R. J. (1998) Lipid infiltration as a
possible biologic cause of silicone gel breast implant aging. Plast Reconstr Surg.,
101, 64-68.
Ajmal, N., Riordan, C. L., Cardwell, N., Nanney, L. B. and Shack, R. B. (2003) The
effectiveness of sodium 2-mercaptoethane sulfonate (mesna) in reducing capsular
formation around implants in a rabbit model. Plast Reconstr Surg, 112, 1455-61.
Alberts, B., Johnson, A. and Lewis, J. (2002) Molecular biology of the cell. Garland
Science, 907-933.
Allergan, M. (2006) Natrelle highly cohesive silicone-filled breast implants.
Allergan, 53, 1-75.
Aroca-Aguilar, J. D., Sanchez-Sanchez, F., Ghosh, S., Fernandez-Navarro, A., Coca-
Prados, M. and Escribano, J. (2011) Interaction of recombinant myocilin with the
matricellular protein SPARC: functional implications. Invest Ophthalmol Vis Sci. ,
52, 179-189.
Arthur, W. T. and Burridge, K. (2001) RhoA inactivation by p190RhoGAP regulates
cell spreading and migration by promoting membrane protrusion and polarity. Mol
Biol Cell 12, 2711-2720.
Bacakova, L., Filova, E., Parizek, M., Ruml, T. and Svorcik, V. (2011) Modulation
of cell adhesion, proliferation and differentiation on materials designed for body
implants. Biotechnol Adv, 29, 739-67.
Balaban, N. Q., Schwarz, U. S., Riveline, D., Goichberg, P., Tzur, G., Sabanay, I.,
Mahalu, D., Safran, S., Bershadsky, A., Addadi, L. and Geiger, B. (2001) Force and
focal adhesion assembly: a close relationship studied using elastic micropatterned
substrates. Nat Cell Biol, 3, 466-72.

140
Bao, X., Lu, C. and Frangos, J. A. (1999) Temporal gradient in shear but not steady
shear stress induces PDGF-A and MCP-1 expression in endothelial cells: role of NO,
NF kappa B, and egr-1. Arterioscler Thromb Vasc Biol, 19, 996-1003.
Barone, F. E., Perry, L., Keller, T. and Maxwell, G. P. (1992) The biomechanical and
histopathologic effects of surface texturing with silicone and polyurethane in tissue
implantation and expansion. Plast Reconstr Surg, 90, 77-86.
Barr, S. and Bayat, A. (2011) Breast implant surface development: perspectives on
development and manufacture. Aesthet Surg J, 31, 56-67.
Barr, S., Hill, E. and Bayat, A. (2009) Current implant surface technology: an
examination of their nanostructure and their influence on fibroblast alignment and
biocompatibility. Eplasty 9, 198-217.
Beningo, K. A., Dembo, M., Kaverina, I., Small, J. V. and Wang, Y. L. (2001)
Nascent focal adhesions are responsible for the generation of strong propulsive
forces in migrating fibroblasts. J Cell Biol, 153, 881-8.
Berrier, A. L. and Yamada, K. M. (2007) Cell-matrix adhesion. Cellular Physiology,
213, 565-573.
Berry, M. G., Cucchiara, V. and Davies, D. M. (2010) Breast augmentation: Part II-
Adverse capsular contracture. J Plast Reconstr Aesthet Surg, 63, 2098-107.
Berry, M. G. and Davies, D. M. (2010) Breast augmentation: Part I - a review of the
silicone prosthesis. J Plast Reconstr Aesthet Surg, 63, 1761-1768.
Bershadsky, A., Chausovsky, A., Becker, E., Lyubimova, A. and Geiger, B. (1996)
Involvement of microtubules in the control of adhesion-dependent signal
transduction. Curr Biol, 6, 1279-89.
Bershadsky, A. D., Balaban, N. Q. and Geiger, B. (2003) Adhesion-dependent cell
mechanosensitivity. Annu Rev Cell Dev Biol, 19, 677-95.
Bethesda, M. D. (2014) Breast cancer screening (PDQ): health professional version.
National Cancer Institute (US), 1-30.
Biname, F., Pawlak, G., Roux, P. and Hibner, U. (2010) What makes cells move:
requirements and obstacles for spontaneous cell motility. Mol Biosyst, 6, 648-661.
Bloom, L., Ingham, K. C. and Hynes, R. O. (1999) Fibronectin regulates assembly of
actin filaments and focal contacts in cultured cells via the heparin-binding site in
repeat III13. Mol Biol Cell., 5, 1521-36.
Bondurant, S., Ernster, V. and Herdman, R. (1999) Safety of silicone breast implants.
NAP, 50-100.
Bradshaw, A. D. (2012) Diverse biological functions of the SPARC family of
proteins. Int J Biochem Cell Biol., 44, 480-488.

141
Braley, S. A. (1973) The use of silicones in plastic surgery: A Retrospective View.
Plast Reconstr Surg., 51, 280-288.
Brand, K. G. (1993) Infection of mammary prostheses: A survey and the question of
prevention. Ann Plast Surg, 30, 289-295.
Brody, G. S. (1997) On the safety of breast implants. Plast Reconstr Surg, 100,
1314-1321.
Brohim, R. M., Foresman, P. A., Hildebrandt, P. K. and Rodeheaver, G. T. (1992)
Early tissue reaction to textured breast implant surfaces. Ann Plast Surg, 28, 354-
362.
Brown, S. L., Silverman, B. G. and Berg, W. A. (1997) Rupture of silicone-gel breast
implants: causes, sequelae, and diagnosis. The Lancet, 350, 1531-1537.
Burkhardt, B. R., Dempsey, P. D., Schnur, P. L. and Tofield, J. J. (1986) Capsular
contracture: A prospective study of the effect of local antibacterial agents. Plast
Reconstr Surg., 77, 919-930.
Caldas, I. R., Campi-Azevedo, A. C., Oliveira, L. F., Silveira, A. M., Oliveira, R. C.
and Gazzinelli, G. (2008) Human schistosomiasis mansoni: immune responses
during acute and chronic phases of the infection. Acta Trop, 108, 109-17.
Carlier, M. F., Le Clainche, C., Wiesner, S. and Pantaloni, D. (2003) Actin-based
motility: from molecules to movement. Bioessays, 25, 336-45.
Chi, T., Ballinger, T., Olds, R. and Zecchino, M. (2005) Surface texture analysis
using dektak stylus profilers. Veeco Instruments Application Notes, 15.
Chrzanowska-Wodnicka, M. and Burridge, K. (1996) Rho-stimulated contractility
drives the formation of stress fibers and focal adhesions. J Cell Biol, 133, 1403-15.
Clark, P., Connolly, P., Curtis, A. S., Dow, J. A. and Wilkinson, C. D. (1990)
Topographical control of cell behaviour: II. multiple grooved substrata.
Development, 108, 635-644.
Claxton, N. S., Fellers, T. J. and Davidson, M. W. (2006) Laser scanning confocal
microscopy. Department of Optical Microscopy and Digital Imaging, 3-20.
Cohen, I. K. (1994) Impact of the FDA ban on silicone breast implants. J Surg
Oncol., 56, 1.
Cohen, M., Klein, E., Geiger, B. and Addadi, L. (2003) Organization and adhesive
properties of the hyaluronan pericellular coat of chondrocytes and epithelial cells.
Biophys J., 85, 1996-2005.
Collins, M. N. and Birkinshaw, C. (2013) Hyaluronic acid based scaffolds for tissue
engineering-A review. Carbohydr Polym, 92, 1262-1279.
Crosby, M. A. (2013) Plastic Surgery. Plast Reconstr Surg., 5, 13-15.

142
Danino, A., Rocher, F., Blanchet-Bardon, C., Revol, M. and Servant, J. M. (2001) A
scanning electron microscopic study of the surface of textured mammary implants
and their capsules. Description of the adhesive "velcro" effect of porous-textured
breast prostheses. Ann Chir Plast Esthet, 46, 23-30.
Davidson, M. W. and Abramowitz, M. (1998) Deconvolution in Optical Microscopy.
Olympus America Inc., 40-47.
DeMali, K. A., Barlow, C. A. and Burridge, K. (2002) Recruitment of the Arp2/3
complex to vinculin: coupling membrane protrusion to matrix adhesion. J Cell Biol,
159, 881-91.
Demedts, M., Behr, J., Buhl, R., Costabel, U., Dekhuijzen, R., Jansen, H. M.,
MacNee, W., Thomeer, M., Wallaert, B., Laurent, F., Nicholson, A. G., Verbeken, E.
K., Verschakelen, J., Flower, C. D., Capron, F., Petruzzelli, S., De Vuyst, P., van den
Bosch, J. M., Rodriguez-Becerra, E., Corvasce, G., Lankhorst, I., Sardina, M. and
Montanari, M. (2005) High-dose acetylcysteine in idiopathic pulmonary fibrosis. N
Engl J Med, 353, 2229-42.
Dempsey, W. C. and Latham, W. D. (1968) Subpectoral implants in augmentation
mammaplasty. Preliminary report. Plast Reconstr Surg., 42, 515-521.
Diao, Z. Y., Fu, H. L., Nie, C. L., Hao, L. J., Yang, D. P. and Chen, W. H. (2011)
Controlled release of transforming growth factor-beta receptor kinase inhibitor from
thermosensitive Chitosan-based hydrogel: application for prevention of capsular
contracture. Chin Med J, 124, 284-90.
Didenko, V. V. (2006) Fluorescent energy transfer nucleic acid probes: designs and
protocols. Springer, 3-4.
Dreieicher, E., Beck, K. F., Lazaroski, S., Boosen, M., Tsalastra-Greul, W., Beck,
M., Fleming, I., Schaefer, L. and Pfeilschifter, J. (2009) Nitric oxide inhibits
glomerular TGF-beta signaling via SMOC-1. J Am Soc Nephrol, 20, 1963-1974.
Drew, P., Cawthorn, S. and Michell, M. (2007) Interventional ultrasound of the
breast. CRC Press, 11-14.
Eftink, M. R. (2000) Use of fluorescence spectroscopy as thermodynamics tool. Meth
Enzymol, 323, 459-73.
Ellis, H. and Mahadevan, V. (2013) Anatomy and physiology of the breast. Surgery
31, 11-14.
Elter, P., Weihe, T., Buhler, S., Gimsa, J. and Beck, U. (2012) Low fibronectin
concentration overcompensates for reduced initial fibroblasts adhesion to a nanoscale
topography: single-cell force spectroscopy. Colloids Surf B Biointerfaces, 95, 82-89.
Eming, S. A., Krieg, T. and Davidson, J. M. (2007) Inflammation in wound repair:
molecular and cellular mechanisms. J Invest Dermatol, 127, 514-525.
Enoch, S. and Leaper, D. J. (2008) Basic science of wound healing. Surgery 26, 31-
37.

143
Ersek, R. A., Beisang, A. A., Minn, R. and Iowa, D. M. (1990) Textured silicone
implant prosthesis. United States Patent, 1-7.
Ersek, R. A. and Navarro, J. A. (1991) Transaxillary subpectoral placement of
textured breast prostheses. Ann Plast Surg, 27, 93-96.
Fallowfield, J. A., Mizuno, M., Kendall, T. J., Constandinou, C. M., Benyon, R. C.,
Duffield, J. S. and Iredale, J. P. (2007) Scar-associated macrophages are a major
source of hepatic matrix metalloproteinase-13 and facilitate the resolution of murine
hepatic fibrosis. J Immunol, 178, 5288-95.
Fenner, R. T. (1989) Mechanics of solids. Blackwell Sci Publ, 98-100.
Foster, B. (1997) Optimizing light microscopy for biological and clinical
laboratories. Kendall Hunt Pub Co, 72-78.
Franz, M. G., Steed, D. L. and Robson, M. C. (2007) Optimizing healing of the acute
wound by minimizing complications. Curr Probl Surg, 44, 691-763.
Franz, S., Rammelt, S., Scharnweber, D. and Simon, J. C. (2011) Immune responses
to implants - A review of the implications for the design of immunomodulatory
biomaterials. Biomaterials, 32, 6692-6709.
Gabriel, S. E., Woods, J. E., O'Fallon, W. M., Beard, C. M., Kurland, L. T. and
Melton, L. J. (1997) Complications leading to surgery after breast implantation. N
Engl J Med, 336, 677-682.
Geiger, B. and Bershadsky, A. (2001) Assembly and mechanosensory function of
focal contacts. Curr Opin Cell Biol, 13, 584-92.
Geiger, B., Bershadsky, A., Pankov, R. and Yamada, K. M. (2001) Transmembrane
crosstalk between the extracellular matrix-cytoskeleton crosstalk. Nat Rev Mol Cell
Biol, 2, 793-805.
Gillespie, P. G. and Walker, R. G. (2001) Molecular basis of mechanosensory
transduction. Nature, 413, 194-202.
Ginsberg, M. (1981) Role of platelets in inflammation and rheumatic disease. Adv
Inflam 2, 53-71.
Goldstein, D. J. (1999) Understanding the light microscope: a computer-aided
introduction. Academic Press, 90-97.
Goldwyn, R. M. (1978) Vincenz Czerny and beginnings of breast reconstruction.
Plast Reconstr Surg., 61, 673-681.
Grigg, M., Bondurant, S., Ernster, V. L. and Herdman, R. (2000) Information for
women about the safety of silicone breast implant. National Academies Press, 1-30.
Gruber, R., Pforte, A., Beer, B. and Riethmuller, G. (1996) Determination of
gamma/delta and other T-lymphocyte subsets in bronchoalveolar lavage fluid and

144
peripheral blood from patients with sarcoidosis and idiopathic fibrosis of the lung.
APMIS, 104, 199-205.
Gurunluoglu, R., Kubek, E. and Arton, J. (2013) Dual pedicle mastopexy technique
for reorientation of volume and shape after subglandular and submuscular breast
implant removal. Eplasty, 13, 397-412.
Hakelius, L. and Ohlsen, L. (1997) Tendency to capsular contracture around smooth
and textured gel-filled silicone mammary implants: a five-year follow-up. Plast
Reconstr Surg, 100, 1566-9.
Hamill, O. P. and Martinac, B. (2001) Molecular basis of mechanotransduction in
living cells. Physiol Rev, 81, 685-740.
Handel, N., Jensen, J. A., Black, Q., Waisman, J. R. and Silverstein, M. J. (1995) The
fate of breast implants: a critical analysis of complications and outcomes. Plast
Reconstr Surg, 96, 1521-33.
Harvey, A. G., Hill, E. W. and Bayat, A. (2013) Designing implant surface
topography for improved biocompatibility. Expert Rev Med Devices, 10, 257-67.
Haugland, R. P., Gregory, J., Spence, M. T. Z., Johnson, I. and Miller, E. (2002)
Introduction to fluorescence techniques, Molecular Probes, Inc.
Hauser, J., Zietlow, J., Koller, M., Esenwein, S. A., Halfmann, H., Awakowicz, P.
and Steinau, H. U. (2009) Enhanced cell adhesion to silicone implant material
through plasma surface modification. J Mater Sci Mater Med, 20, 2541-2548.
Heath, J. P. and Dunn, G. A. (1978) Cell to substratum contacts of chick fibroblasts
and their relation to the microfilament system. A correlated interference-reflexion
and high-voltage electron-microscope study. J Cell Sci, 29, 197-212.
Helfman, D. M., Levy, E. T., Berthier, C., Shtutman, M., Riveline, D., Grosheva, I.,
Lachish-Zalait, A., Elbaum, M. and Bershadsky, A. D. (1999) Caldesmon inhibits
nonmuscle cell contractility and interferes with the formation of focal adhesions. Mol
Biol Cell, 10, 3097-112.
Henriksen, T. F., Fryzek, J. P., Holmich, L. R., McLaughlin, J. K., Kjoller, K.,
Hoyer, A. P., Olsen, J. H. and Friis, S. (2005) Surgical intervention and capsular
contracture after breast augmentation: a prospective study of risk factors. Ann Plast
Surg, 54, 343-51.
Herman, B. (1998) Fundamentals of fluorescence. Bios Scient 40, 1-14.
Hester, T. R., Nahai, F., Bostwick, J. and Cukic, J. (1988) A 5-year experience with
polyurethane-covered mammary prostheses for treatment of capsular contracture,
primary augmentation mammoplasty, and breast reconstruction. Clin Plast Surg, 15,
569-585.
Hibbs, A. R. (2000) Confocal microscopy for biologists: an intensive introductory
course. BIOCON, 81-88.

145
Hidalgo, D. A. (2000) Breast augmentation: choosing the optimal incision, implant,
and pocket plane. Plast Reconstr Surg., 105, 2202-2216.
Hilborn, J. and Bjursten, L. M. (2007) A new and evolving paradigm for
biocompatibility. J Tissue Eng Regen Med, 1, 110-9.
Hunt, T. K. (1980) Disorders of wound healing. World J Surg, 4, 271-7.
Hurst, N. M. (1996) Lactation after augmentation mammoplasty - Reply. Obstet
Gynecol., 87, 1063-1063.
Hwang, K., Sim, H. B., Huan, F. and Kim, D. J. (2010) Myofibroblasts and capsular
tissue tension in breast capsular contracture. Aesthetic Plast Surg, 34, 716-21.
Jenkins, M. E., Friedman, H. I. and Von Recum, A. F. (1996) Breast implants: facts,
controversy, and speculations for future research. J Invest Surg., 9, 1 - 12.
Jiang, Y., Wang, M., Celiker, M. Y., Liu, Y. E., Sang, Q. X., Goldberg, I. D. and Shi,
Y. E. (2001) Stimulation of mammary tumorigenesis by systemic tissue inhibitor of
matrix metalloproteinase 4 gene delivery. Cancer Res. , 61, 2365-2370.
Johnston, I. D., McCluskey, D. K., Tan, C. K. L. and Tracey, M. C. (2014)
Mechanical characterization of bulk Sylgard 184 for microfluidics and
microengineering. J Micromech Microeng, 24, 1-7.
Jopp, J., Grüll, H. and Yerushalmi-Rozen, R. (2004) Wetting behavior of water
droplets on hydrophobic microtextures of comparable size. Langmuir, 20, 10015-
10019.
Katoh, K., Kano, Y., Amano, M., Onishi, H., Kaibuchi, K. and Fujiwara, K. (2001)
Rho-kinase-mediated contraction of isolated stress fibers. J Cell Biol, 153, 569-84.
Katzin, W. E., Centeno, J. A., Feng, L. J., Kiley, M. and Mullick, F. G. (2005)
Pathology of lymph nodes from patients with breast implants: A histologic and
spectroscopic evaluation. Am J Surg Pathol, 29, 506-511.
Khorasani, M. T. and Mirzadeh, H. (2004) BHK cells behaviour on laser treated
polydimethylsiloxane surface. Colloids Surf B Biointerfaces, 35, 67-71.
Kiani, C., Chen, L., Wu, Y. J., Yee, A. J. and Yang, B. B. (2002) Structure and
function of aggrecan. Cell Res, 12, 19-32.
Kim, Y. J., Kim, Y. W. and Cheon, Y. W. (2014) Prevention of implant malposition
in inframammary augmentation mammaplasty. Arch Plast Surg, 41, 407-13.
Kjoller, K., Holmich, L. R., Jacobsen, P. H., Friis, S., Fryzek, J., McLaughlin, J. K.,
Lipworth, L., Henriksen, T. F., Jorgensen, S., Bittmann, S. and Olsen, J. H. (2001)
Capsular contracture after cosmetic breast implant surgery in Denmark. Ann Plast
Surg., 47, 359-366.

146
Koike, N., Kassai, Y., Kouta, Y., Miwa, H., Konishi, M. and Itoh, N. (2007) Brorin,
a novel secreted bone morphogenetic protein antagonist, promotes neurogenesis in
mouse neural precursor cells. J Biol Chem. , 282, 15843-15850.
Korurer, E., Kenar, H., Doger, E. and Karaoz, E. (2014) Production of a composite
hyaluronic acid/gelatin blood plasma gel for hydrogel-based adipose tissue
engineering applications. J Biomed Mater Res Part A, 102A, 2220-2229.
Kostas, M. (2007) The effects of breast augmentation surgery on future ability to
lactate. Breast J., 13, 62-67.
Kubitscheck, U. (2013) Fluorescence microscopy: from principles to biological
applications. Wiley, 24-25.
Kuhn, A., Singh, S., Smith, P. D., Ko, F., Falcone, R., Lyle, W. G., Maggi, S. P.,
Wells, K. E. and Robson, M. C. (2000) Periprosthetic breast capsules contain the
fibrogenic cytokines TGF-beta1 and TGF-beta2, suggesting possible new treatment
approaches. Ann Plast Surg, 44, 387-91.
Kulmala, I., McLaughlin, J. K., Pakkanen, M., Lassila, K., Holmich, L. R., Lipworth,
L., Boice, J. D., Jr., Raitanen, J. and Luoto, R. (2004) Local complications after
cosmetic breast implant surgery in Finland. Ann Plast Surg, 53, 413-9.
Kyle, D. J., Harvey, A. G., Shih, B., Tan, K. T., Chaudhry, I. H. and Bayat, A. (2013)
Identification of molecular phenotypic descriptors of breast capsular contracture
formation using informatics analysis of the whole genome transcriptome. Wound
Repair Regen, 21, 762-9.
Lafuma, A. and Quere, D. (2003) Superhydrophobic states. Nat Mater, 2, 457-60.
Lakowicz, J. R. (2007) Principles of fluorescence spectroscopy. Springer, 1-5.
Lampin, M., Warocquier-Clérout, R., Legris, C., Degrange, M. and Sigot-Luizard,
M. F. (1997) Correlation between substratum roughness and wettability, cell
adhesion, and cell migration. J Biomed Mater Res, 36, 99-108.
Lee, H. K., Jin, U. S. and Lee, Y. H. (2011) Subpectoral and precapsular implant
repositioning technique: correction of capsular contracture and implant malposition.
Aesthetic Plast Surg, 35, 1126-32.
Leibovich, S. J. and Ross, R. (1975) The role of the macrophage in wound repair. A
study with hydrocortisone and antimacrophage serum. Am J Pathol, 78, 71-100.
Lewis, J. R. (1965) The augmentation mammaplasty. Plast Reconstr Surg., 35, 51-
59.
Li, Y., Zhang, S., Guo, L., Dong, M., Liu, B. and Mamdouh, W. (2012a) Collagen
coated tantalum substrate for cell proliferation. Colloids Surf B Biointerfaces, 95, 10-
15.

147
Li, Y. C., Lin, Y. C. and Young, T. H. (2012b) Combination of media, biomaterials
and extracellular matrix proteins to enhance the differentiation of neural
stem/precursor cells into neurons. Acta Biomater, 8, 3035-3048.
Liu, S., Calderwood, D. A. and Ginsberg, M. H. (2000) Integrin cytoplasmic domain-
binding proteins. J Cell Sci, 113, 3563-71.
Lo, C. M., Wang, H. B., Dembo, M. and Wang, Y. L. (2000) Cell movement is
guided by the rigidity of the substrate. Biophys J, 79, 144-52.
Lowery, J. L., Datta, N. and Rutledge, G. C. (2010) Effect of fiber diameter, pore
size and seeding method on growth of human dermal fibroblasts in electrospun
poly(epsilon-caprolactone) fibrous mats. Biomaterials, 31, 491-504.
Lydon, M. J., Minett, T. W. and Tighe, B. J. (1985) Cellular interactions with
synthetic polymer surfaces in culture. Biomaterials, 6, 396-402.
Maheshwari, G., Brown, G., Lauffenburger, D. A., Wells, A. and Griffith, L. G.
(2000) Cell adhesion and motility depend on nanoscale RGD clustering. Cell
Science, 113, 1677-1686.
Marianne, N., Sandra, D., Joy, S., David, Y., Marilyn, L. and Miriam, O. (1990) The
influence of breast surgery, breast appearance, and pregnancy-induced breast
changes on lactation sufficiency as measured by infant weight gain. Birth, 17, 31-38.
Marshall, W. R., Godfrey, M., Hollister, D. W., Balkovich, M. E. and Lindgren, V.
V. (1989) Types of collagen in breast capsules. Ann Plast Surg, 23, 401-5.
Matsumura, F., Ono, S., Yamakita, Y., Totsukawa, G. and Yamashiro, S. (1998)
Specific localization of serine 19 phosphorylated myosin II during cell locomotion
and mitosis of cultured cells. J Cell Biol, 140, 119-29.
Maxwell, G. P. and Gabriel, A. (2009) The evolution of breast implants. Plast
Reconstr Surg, 36, 1-13.
McNally, J., Karpova, T., Cooper, J. and Conchello, J. (1999) Three-dimensional
imaging by deconvolution microscopy. Methods, 19, 373-385
Mendonca, R. J. and Coutinho-Netto, J. (2009) Cellular aspects of wound healing.
An Bras Dermatol, 84, 257-62.
Middleton, M. S. (1998) Magnetic resonance evaluation of breast implants and soft-
tissue silicone. Top Magn Reson Imaging, 9, 92-137.
Middleton, M. S. and McNamara, M. P. (2000) Breast implant classification with
MR imaging correlation. Radiographics, 20, 1-72.
Miwa, H., Miyake, A., Kouta, Y., Shimada, A., Yamashita, Y., Nakayama, Y.,
Yamauchi, H., Konishi, M. and Itoh, N. (2009) A novel neural-specific BMP
antagonist, Brorin-like, of the Chordin family. FEBS Letters, 583, 3643-3648.

148
Muschler, J. and Streuli, C. H. (2010) Cell-matrix interactions in mammary gland
development and breast cancer. Cold Spring Harb Perspect Biol, 2, 1-17.
Mwenifumbo, S. and Stevens, M. M. (2007) Biomedical Nanostructures. ECM
interactions with cells from the macro to nanoscale. John Wiley & Sons, Inc., 223-
260.
Nassau, K. (2001) Color produced by vibrations and rotations. Wiley-Interscience,
69-80.
Nichter, L. S. and Hamas, R. S. (2012) Two-year outcomes with a novel, double-
lumen, saline-filled breast implant. Aesthet Surg J, 32, 861-867.
Notas, G., Kisseleva, T. and Brenner, D. (2009) NK and NKT cells in liver injury
and fibrosis. Clin Immunol, 130, 16-26.
Oppenheimer, B. S., Oppenheimer, E. T., Danishefsky, I., Stout, A. P. and Eirich, F.
R. (1955) Further studies of polymers as carcinogenic agents in animals. Cancer
research, 15, 333-340.
Pandya, S. and Moore, R. G. (2011) Breast development and anatomy. Clin Obstet
Gynecol, 54, 91-95
Parker, J. A., Walboomers, X. F., Von den Hoff, J., Maltha, J. C. and Jansen, J. A.
(2002) Soft tissue response to microtextured silicone and polylactic acid implants:
fibronectin pre-coating vs. radio-frequency glow discharge treatment. Biomaterials,
23, 3545-3553.
Parsons, J. T. (2003) Focal adhesion kinase: the first ten years. Cell Science 116,
1409-1416.
Pawley, J. B., Dailey, M., Manders, E., Soll, D. and Terasaki, M. (2006) Handbook
of biological confocal microscopy. Confocal microscopy of living cells. Springer US,
381-403.
Pawley, J. B. and Inoué, S. (2006) Handbook of biological confocal microscopy.
Foundations of confocal scanned imaging in light microscopy. 1-19.
Pelham, R. J. and Wang, Y. (1997) Cell locomotion and focal adhesions are
regulated by substrate flexibility. Proc. Natl. Acad. Sci. USA, 94, 13661-5.
Pereira, L. and Sterodimas, A. (2009) Transaxillary breast augmentation: a
prospective comparison of subglandular, subfascial, and submuscular implant
insertion. Aesthetic Plast Surg, 33, 752-759.
Persichetti, P., Tenna, S., Delfino, S., Abbruzzese, F., Trombetta, M. and Scuderi, N.
(2009) Textured and Smooth Breast Implants: Is There a Difference in the Chemical
Structure of Silicone?: An Analysis With Fourier Transformation Infrared and
Attenuated Total Reflectance Spectroscopy. Annals of Plastic Surgery, 63, 373-377.
Petit, V. and Thiery, J. P. (2000) Focal adhesions: structure and dynamics. Biol Cell,
92, 477-494.

149
Pittet, B., Montandon, D. and Pittet, D. (2005) Infection in breast implants. Lancet
Infect Dis, 5, 94-106.
Polo, M., Smith, P. D., Kim, Y. J., Wang, X., Ko, F. and Robson, M. C. (1999)
Effect of TGF-B2 on proliferative scar fibroblast cell kinetics. Ann Plast Surg, 43,
185-90.
Prakobwong, S., Pinlaor, S., Yongvanit, P., Sithithaworn, P., Pairojkul, C. and
Hiraku, Y. (2009) Time profiles of the expression of metalloproteinases, tissue
inhibitors of metalloproteases, cytokines and collagens in hamsters infected with
Opisthorchis viverrini with special reference to peribiliary fibrosis and liver injury.
Int J Parasitol, 39, 825-35.
Prantl, L., Schreml, S., Fichtner-Feigl, S., Poppl, N., Eisenmann-Klein, M.,
Schwarze, H. and Fuchtmeier, B. (2007) Clinical and morphological conditions in
capsular contracture formed around silicone breast implants. Plast Reconstr Surg,
120, 275-84.
Prasad, B. R., Brook, M. A., Smith, T., Zhao, S., Chen, Y., Sheardown, H., D'Souza,
R. and Rochev, Y. (2010) Controlling cellular activity by manipulating silicone
surface roughness. Colloids Surf B Biointerfaces, 78, 237-242.
Raso, D. S. and Greene, W. B. (1997) Silicone breast implants: pathology.
Ultrastruct Pathol, 21, 263-271.
Rietdorf, J. and Sibarita, J. B. (2005) Microscopy techniques. Deconvolution
microscopy. Springer, 95, 201-243.
Riveline, D., Zamir, E., Balaban, N. Q., Schwarz, U. S., Ishizaki, T., Narumiya, S.,
Kam, Z., Geiger, B. and Bershadsky, A. D. (2001) Focal contacts as
mechanosensors: externally applied local mechanical force induces growth of focal
contacts by an mDia1-dependent and ROCK-independent mechanism. J Cell Biol,
153, 1175-86.
Rivero, M. A., Schwartz, D. S. and Mies, C. (1994) Silicone lymphadenopathy
involving intramammary lymph nodes: a new complication of silicone
mammaplasty. AJR Am J Roentgenol, 162, 1089-1090.
Roberts, A. B. (1995) Transforming growth factor-beta: activity and efficacy in
animal models of wound healing. Wound Repair Regen, 3, 408-18.
Roberts, M. J., Bhatt, N., Voge, C. M., Meshot, E. R., Stegemann, J. P. and Hart, A.
J. (2013) Self-assembly of suspended collagen films and their viability as cell culture
substrates. J. Mater. Chem. B, 1, 4711-4718.
Rottner, K., Hall, A. and Small, J. V. (1999) Interplay between Rac and Rho in the
control of substrate contact dynamics. Curr Biol, 9, 640-8.
Roughley, P., Martens, D., Rantakokko, J., Alini, M., Mwale, F. and Antoniou, J.
(2006) The involvement of aggrecan polymorphism in degeneration of human
intervertebral disc and articular cartilage. Eur Cell Mater, 11, 1-7.

150
San-Martin, A., Dotor, J., Martinez, F. and Hontanilla, B. (2010) Effect of the
inhibitor peptide of the transforming growth factor beta (p144) in a new silicone
pericapsular fibrotic model in pigs. Aesthetic Plast Surg, 34, 430-437.
Sequeira, S. J., Soscia, D. A., Oztan, B., Mosier, A. P., Jean-Gilles, R., Gadre, A.,
Cady, N. C., Yener, B., Castracane, J. and Larsen, M. (2012) The regulation of focal
adhesion complex formation and salivary gland epithelial cell organization by
nanofibrous PLGA scaffolds. Biomaterials, 33, 3175-3186.
Shackleton, M., Vaillant, F., Simpson, K. J., Stingl, J., Smyth, G. K., Asselin-Labat,
M. L., Wu, L., Lindeman, G. J. and Visvader, J. E. (2006) Generation of a functional
mammary gland from a single stem cell. Nature, 439, 84-88.
Shaw, P. (1998) Cell biology: a laboratory handbook. Computational deblurring of
fluorescence microscope images. Academic Press, 2, 206-217
Shin, H., Jo, S. and Mikos, A. G. (2003) Biomimetic materials for tissue engineering.
Biomaterials, 24, 4353-4364.
Slayter, E. (1970) Optical methods in biology. Interactions of light and matter.
Wiley-Interscience, 119-152
Snoeijer, J. H. and Andreotti, B. (2008) A microscopic view on contact angle
selection. Phys Fluids, 20, 57101-11.
Spear, S. L., Baker Jr, J. L. and Caffee, H. H. (1995) Classification of capsular
contracture after prosthetic breast reconstruction. Plast Reconstr Surg, 96, 1119-
1124.
Spear, S. L., Bulan, E. J. and Venturi, M. L. (2004) Breast augmentation. Plast
Reconstr Surg, 114, 73E-81E.
Spector, D., Goldman, R. and Leinwand, L. (1988) Cells: a laboratory manual, light
microscopy and cell structure. Confocal microscopy and deconvolution techniques.
Cold Spring Harbor Laboratory Press, 2, 96.1-96.23
Srinivasan, V. (1998) Discrete morphological filters for metrology. 6th. Symp. on
Quality Control in Production, 623-628.
Steiert, A. E., Boyce, M. and Sorg, H. (2013) Capsular contracture by silicone breast
implants: Possible causes, biocompatibility, and prophylactic strategies. Medical
Devices: Evidence and Research, 6, 211-218.
Steward, R. L., Jr., Cheng, C. M., Ye, J. D., Bellin, R. M. and LeDuc, P. R. (2011)
Mechanical stretch and shear flow induced reorganization and recruitment of
fibronectin in fibroblasts. Sci Rep, 1, 1-12.
Stout, K. J. (1993) Development of methods for the characterisation of roughness in
three dimensions. Penton Press, 200-241.
Tan, K. T., Baildam, A. D., Juma, A., Milner, C. M., Day, A. J. and Bayat, A. (2011)
Hyaluronan, TSG-6, and inter-alpha-inhibitor in periprosthetic breast capsules:

151
reduced levels of free hyaluronan and TSG-6 expression in contracted capsules.
Aesthet Surg J, 31, 47-55.
Tebbetts, J. B. and Teitelbaum, S. (2010) High- and extra-high-projection breast
implants: potential consequences for patients. Plast Reconstr Surg, 126, 2150-9.
Tebbetts, J. B. M. D. (2006) Dual plane breast augmentation: optimizing implant-
soft-tissue relationships in a wide range of breast types. Plast Reconstr Surg., 118,
81S-98S.
Thomsen, J. L., Christensen, L., Nielsen, M., Brandt, B., Breiting, V. B., Felby, S.
and Nielsen, E. (1990) Histologic changes and silicone concentrations in human
breast tissue surrounding silicone breast prostheses. Plast Reconstr Surg, 85, 38-41.
Tran, P. L., Houdjati, H., Barau, G. and Boukerrou, M. (2014) Breastfeeding after
breast surgery: information for patients. Gynecol Obstet Fertil, 42, 205-209.
Tredget, E. E., Shankowsky, H. A., Pannu, R., Nedelec, B., Iwashina, T., Ghahary,
A., Taerum, T. V. and Scott, P. G. (1998) Transforming growth factor-beta in
thermally injured patients with hypertrophic scars: effects of interferon alpha-2b.
Plast Reconstr Surg, 102, 1317-28.
Trelleborg, S. S. (2008) Aerospace engineering guide. Alphaomega, 21-22.
Tu, Y., Wu, S., Shi, X., Chen, K. and Wu, C. (2003) Migfilin and Mig-2 link focal
adhesions to filamin and the actin cytoskeleton and function in cell shape
modulation. Cell, 113, 37-47.
Tulinska, J., Jahnova, E., Dusinska, M., Kuricova, M., Liskova, A., Ilavska, S.,
Horvathova, M., Wsolova, L., Kyrtopoulos, S. A., Collins, A., Harrington, V. and
Fuortes, L. (2004) Immunomodulatory effects of mineral fibres in occupationally
exposed workers. Mutat Res, 553, 111-24.
Udalova, I. A., Ruhmann, M., Thomson, S. J. and Midwood, K. S. (2011) Expression
and immune function of tenascin-C. Crit Rev Immunol, 31, 115-45.
Ulrich, D., Ulrich, F., Pallua, N. and Eisenmann-Klein, M. (2009) Effect of tissue
inhibitors of metalloproteinases and matrix metalloproteinases on capsular formation
around smooth and textured silicone gel implants. Aesthetic Plast Surg., 33, 555-562.
Ungaro, F., Biondi, M., Indolfi, L., De Rosa, G., La Rotonda, M. I., Quaglia, F. and
Netti, P. (2006) Bioactivated polymer scaffolds for tissue engineering. In Topics in
Tissue Engineering N. Ashammakhi & R.L. Reis, 2, 1-38.
Valencia-Lazcano, A. A., Alonso-Rasgado, T. and Bayat, A. (2013) Characterisation
of breast implant surfaces and correlation with fibroblast adhesion. J Mech Behav
Biomed Mater, 21, 133-148.
Van Diest, P. J., Beekman, W. H. and Hage, J. J. (1998) Pathology of silicone
leakage from breast implants. J Clin Pathol, 493-7.

152
Wang, Y. H., Yan, Z. Q., Shen, B. R., Zhang, L., Zhang, P. and Jiang, Z. L. (2009)
Vascular smooth muscle cells promote endothelial cell adhesion via microtubule
dynamics and activation of paxillin and the extracellular signal-regulated kinase
(ERK) pathway in a co-culture system. Eur J Cell Biol, 88, 701-709.
Wangoo, A., Sparer, T., Brown, I. N., Snewin, V. A., Janssen, R., Thole, J., Cook, H.
T., Shaw, R. J. and Young, D. B. (2001) Contribution of Th1 and Th2 cells to
protection and pathology in experimental models of granulomatous lung disease. J
Immunol, 166, 3432-9.
Westreich, M. (2009) Breast Augmentation. Anthropomorphic measurement of the
breast. Springer, 3, 27-44.
Whalen, R. L. (1988) Improved textured surfaces for implantable prostheses. ASAIO
Trans, 34, 887-892.
Whitehouse, D. (2002) Profile and areal (3D) parameter characterisation. In:
Surfaces and their measurement 2002. Kogan Page Science, 5-6.
Williams, T. J. and Jose, P. J. (1981) Mediation of increased vascular permeability
after complement activation. Histamine-independent action of rabbit C5a. J Exp
Med, 153, 136-53.
Wilson, N. J., Boniface, K., Chan, J. R., McKenzie, B. S., Blumenschein, W. M.,
Mattson, J. D., Basham, B., Smith, K., Chen, T., Morel, F., Lecron, J. C., Kastelein,
R. A., Cua, D. J., McClanahan, T. K., Bowman, E. P. and de Waal Malefyt, R.
(2007) Development, cytokine profile and function of human interleukin 17-
producing helper T cells. Nat Immunol, 8, 950-7.
Winter, G. D. (1962) Formation of the scab and the rate of epithelization of
superficial wounds in the skin of the young domestic pig. Nature, 193, 293-4.
Wynn, T. A. (2008) Cellular and molecular mechanisms of fibrosis. J Pathol, 214,
199-210.
Wynn, T. A., Barron, L., Thompson, R. W., Madala, S. K., Wilson, M. S., Cheever,
A. W. and Ramalingam, T. (2011) Quantitative assessment of macrophage functions
in repair and fibrosis. Curr Protoc Immunol, 1-15.
Yamamoto, S., Tanaka, M., Sunami, H., Arai, K., Takayama, A., Yamashita, S.,
Morita, Y. and Shimomura, M. (2006) Relationship between adsorbed fibronectin
and cell adhesion on a honeycomb-patterned film. Surface Science, 600, 3785-3791.
Yang, N. and Muradali, D. (2011) The augmented breast: a pictorial review of the
abnormal and unusual. ARRS, 196, W451-W460.
Young, T. (1805) An essay on the cohesion of fluids. Phil Trans R Soc Lond, 95, 65-
87.
Young, V. L. and Watson, M. E. (2000) Treatment of subglandular capsular
contracture. Phil Trans R Soc Lond, 7, 137-143.

153
Young, V. L., Watson, M. E., Boswell, C. B. and Centeno, R. F. (2004) Initial results
from an online breast augmentation survey. Aesthetic Surgery Journal, 24, 117-135.
Zaccone, P., Fehervari, Z., Jones, F. M., Sidobre, S., Kronenberg, M., Dunne, D. W.
and Cooke, A. (2003) Schistosoma mansoni antigens modulate the activity of the
innate immune response and prevent onset of type 1 diabetes. Eur J Immunol, 33,
1439-49.
Zahavi, A., Sklair, M. L. and Ad-El, D. (2006) Capsular contracture of the breast:
working towards a better classification using clinical and radiologic assessment. Ann
Plast Surg, 57, 248-251.
Zamir, E. and Geiger, B. (2001) Molecular complexity and dynamics of cell-matrix
adhesions. J Cell Sci, 114, 3583-90.
Zhibo, X. and Miaobo, Z. (2009) Effect of sustained-release lidocaine on reduction
of pain after subpectoral breast augmentation. Aesthetic Surgery Journal, 29, 32-34.
Zygo, C. (2005) Surface Texture Parameters. Metrol Meas Syst, 1-20.

154
Appendix

155

156

157

158

159

160

161

162

163

164

165

166

167

168

169
170

171
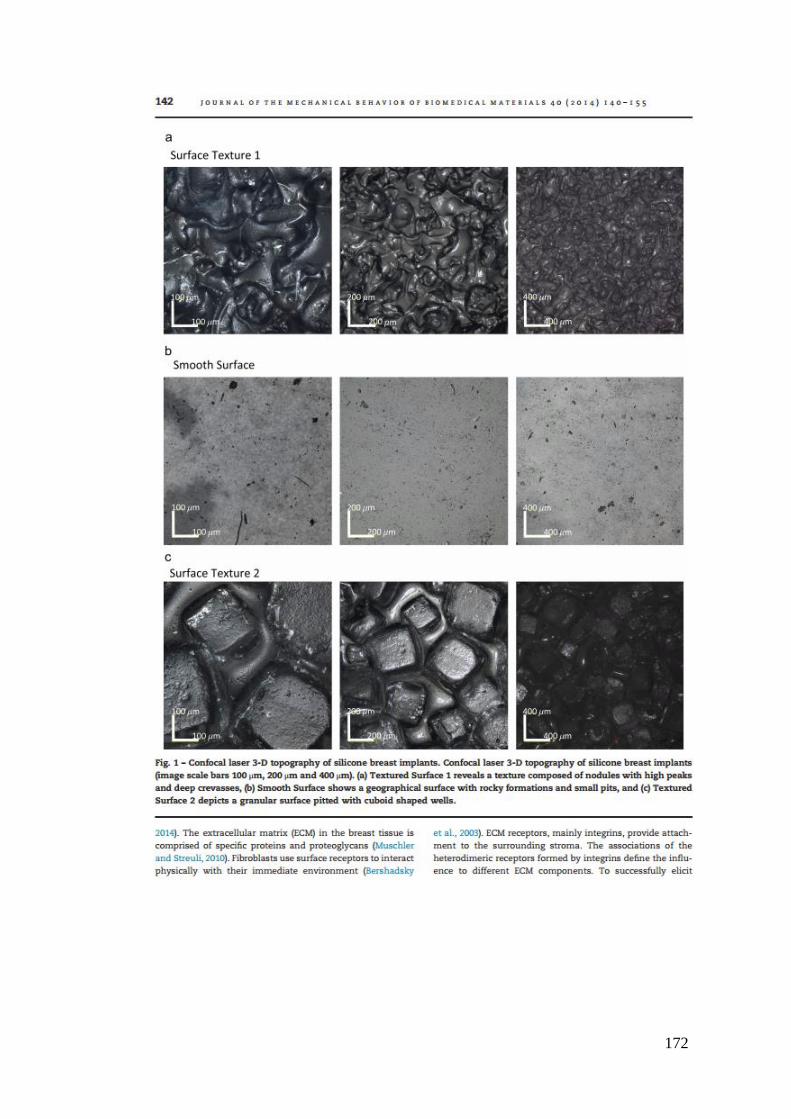
172

173

174

175
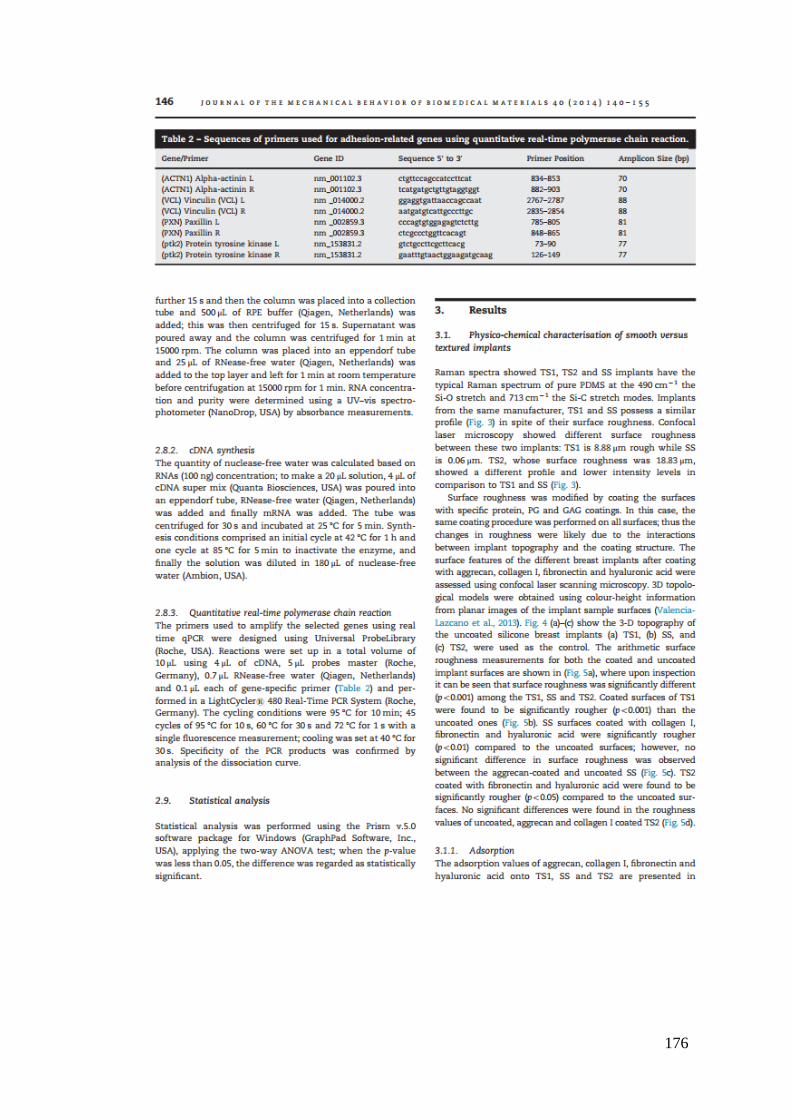
176

177

178

179

180

181

182

183

184
185