Braving the Storms - Public Documents | The World Bank
24
Braving the Storms EAP Economic Update, April 2022 World Bank
-
Upload
khangminh22 -
Category
Documents
-
view
5 -
download
0
Transcript of Braving the Storms - Public Documents | The World Bank

Braving the Storms
EAP Economic Update, April 2022
World Bank

Agenda
• Recent developments
• Opportunities
• Policy
East Asia and Pacific Economic Update, April 2022

GDP relative to pre-pandemic
Recovery resumed in 2021 Q4 …
Source: Haver Analytics, World Bank.
Note: The figures show seasonally adjusted real
GDP indexed to 2019Q4
85
90
95
100
105
110
Q4 Q1 Q2 Q3 Q4 Q1 Q2 Q3 Q4
2019 2020 2021
INDEX: 2019Q4 =100
China
EAP excl. China
Delta
East Asia and Pacific Economic Update, April 2022

Change in GDP relative to pre-pandemic
Source: Haver Analytics, World Bank.
Note: Latest value is 2021 compared to 2019.
…but was uneven across countries
-25
-20
-15
-10
-5
0
5
10
15
Ch
ina
Vie
tna
mT
uva
luL
ao
PD
RN
au
ruIn
do
ne
sia
To
ng
aM
ala
ysia
Ca
mb
odia
Kirib
ati
Ph
ilip
pin
es
PN
GT
ha
ilan
dM
on
go
liaS
olo
mo
n I
sla
nd
sM
ars
ha
ll Is
lan
ds
FS
MV
an
ua
tuT
imo
r-L
este
Sa
mo
aM
ya
nm
ar
Fiji
Pa
lau
Percent
East Asia and Pacific Economic Update, April 2022
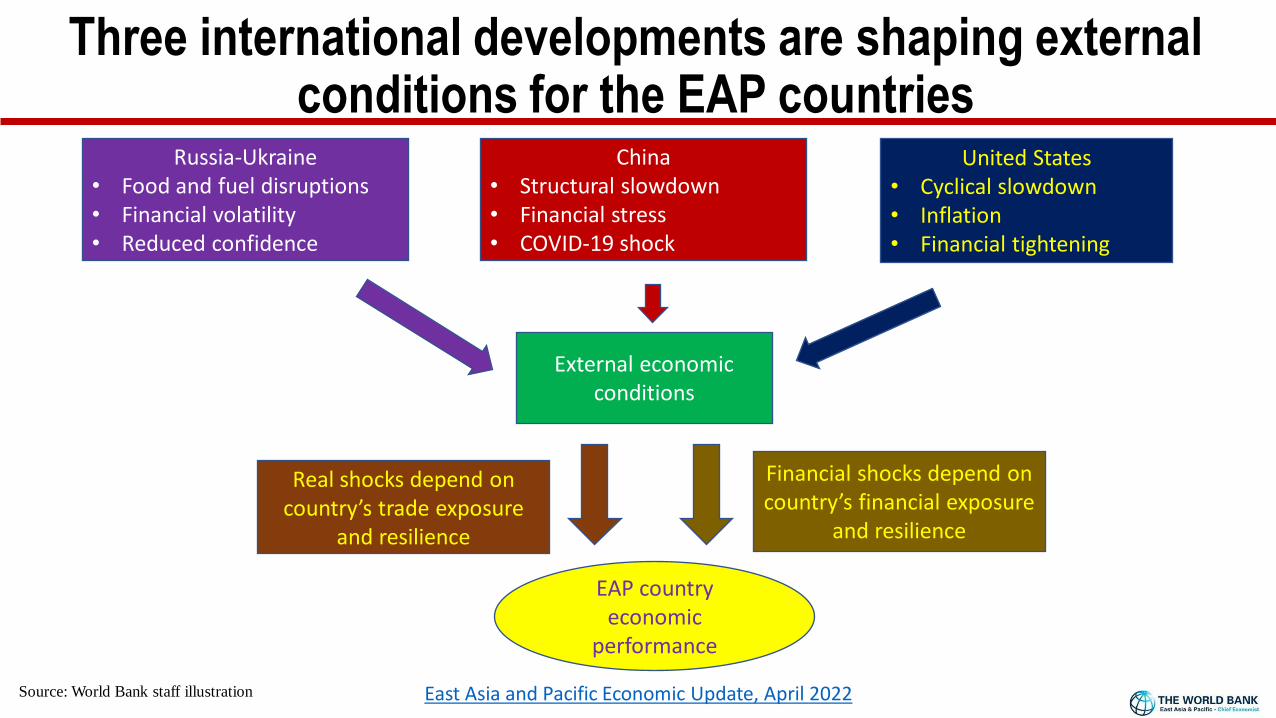
Three international developments are shaping external conditions for the EAP countries
China• Structural slowdown• Financial stress• COVID-19 shock
External economic conditions
United States• Cyclical slowdown• Inflation • Financial tightening
Financial shocks depend on country’s financial exposure
and resilience
EAP country economic
performance
Real shocks depend on country’s trade exposure
and resilience
Russia-Ukraine• Food and fuel disruptions• Financial volatility• Reduced confidence
Source: World Bank staff illustration East Asia and Pacific Economic Update, April 2022

Channel 1: The fuel and food price spikes will hurt those dependent on commodity imports
Net exports of mineral fuels Net exports of rice, corn & wheat, and fertilizers
Sources: UN Comtrade, World Bank.
Notes: Net export of selected commodities
as a share of GDP, average 2015-19.
-30
-20
-10
0
10
20
PN
G
Mo
ng
olia
Ma
laysia
Mya
nm
ar
Tim
or-
Le
ste
Ind
on
esia
Ch
ina
Vie
tna
mP
hili
ppin
es
Tha
ilan
dL
ao
PD
RC
am
bo
dia
So
lom
on
Isl.
Va
nu
atu
Sa
mo
a
Pa
lau
Fiji
To
ng
a
Kirib
ati
FS
M
Tu
va
lu
Na
uru
East Asia Island economies
Oil
Petroleum gases
Coal
Percent of GDP
-3
-2
-1
0
1
2
Th
aila
nd
Ca
mb
odia
La
o P
DR
Mya
nm
ar
Ch
ina
Vie
tna
mIn
do
ne
sia
Ma
laysia
Mo
ngo
liaP
hili
pp
ine
s
PN
GT
imo
r-L
este
Na
uru
To
ng
a
Pa
lau
Sa
mo
a
Va
nu
atu
Tu
va
lu
FS
M Fiji
So
lom
on
Isl.
Kirib
ati
East Asia Island economies
Rice
Corn and wheat
Fertilizers
Percent of GDP
East Asia and Pacific Economic Update, April 2022
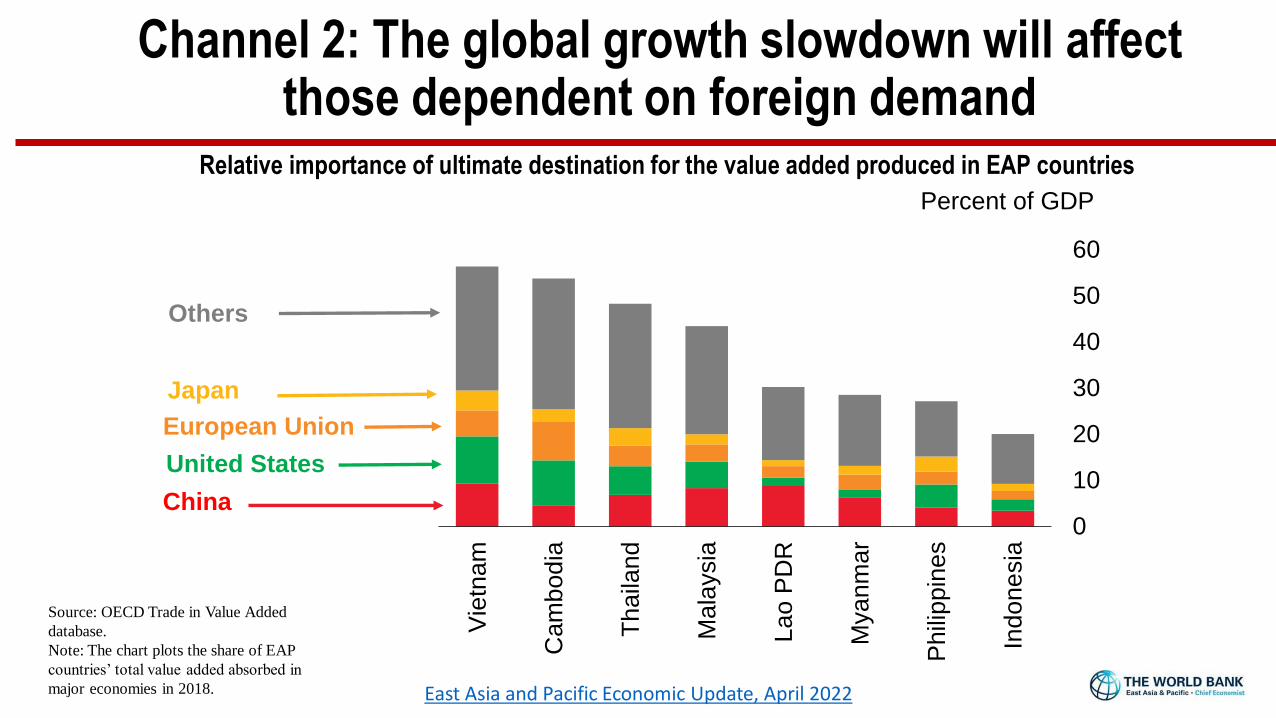
Channel 2: The global growth slowdown will affect those dependent on foreign demand
Relative importance of ultimate destination for the value added produced in EAP countries
Source: OECD Trade in Value Added
database.
Note: The chart plots the share of EAP
countries’ total value added absorbed in
major economies in 2018.
China
United States
European Union
Japan
Others
0
10
20
30
40
50
60
Vie
tnam
Cam
bod
ia
Thaila
nd
Mala
ysia
La
o P
DR
Mya
nm
ar
Phili
ppin
es
Indone
sia
Percent of GDP
East Asia and Pacific Economic Update, April 2022

Channel 3: Financial tightening will affect those with large current account deficits and external debt
-10
0
10
20
30
40
50
Mo
ng
olia
Ca
mb
od
ia
Ma
laysia
So
lom
on
Isl.
La
o P
DR
Fiji
Th
aila
nd
Ind
on
esia
Ph
ilip
pin
es
Ch
ina
Vie
tna
m
Mya
nm
ar
EM
DE
Percent of GDP
Short-term debt
Debt service
Current account deficit
External financing needs
Source. International Monetary Fund. World
Development Indicators. World Bank. Fitch Solutions
Note: The figure shows decomposition of external
financing needs in 2022 estimates. EMDE shows the
unweighted average of EMDEs.East Asia and Pacific Economic Update, April 2022

-0.8
-0.6
-0.4
-0.2
0.0
0.2
0.4
Mo
ne
tary
Re
al e
sta
te
CO
VID
-19
sh
ock
En
erg
y (
imp
ort
ers
)
En
erg
y (
exp
ort
ers
)
Cro
ps(im
po
rte
rs)
Cro
ps(e
xp
ort
ers
)
Fin
an
cia
l
UnitedStates
China War in Ukraine G7
Percentage points
The potential impact on EAP countries’ real income of selected international scenarios
Source: World Bank Staff estimates East Asia and Pacific Economic Update, April 2022

Hence, downgrades in growth projections for 2022
Source: World Bank staff projections.
Notes: Percent growth of GDP at market prices.
0
1
2
3
4
5
6
7
Vie
tna
m
Mala
ysia
Phili
ppin
es
Chin
a
Indon
esia
Mon
golia
Lao P
DR
Cam
bod
ia
PN
G
Thaila
nd
Isla
nd
coun
trie
s
Previous forecast
Baseline
Low case
Percent
0
1
2
3
4
5
6
7
Vie
tna
m
Mala
ysia
Phili
ppin
es
Chin
a
Indon
esia
Mon
golia
Lao P
DR
Cam
bod
ia
PN
G
Thaila
nd
Isla
nd
coun
trie
s
Previous forecast
Baseline
Low case
Percent
0
1
2
3
4
5
6
7
Vie
tna
m
Mala
ysia
Phili
ppin
es
Chin
a
Indon
esia
Mon
golia
Lao P
DR
Cam
bod
ia
PN
G
Thaila
nd
Isla
nd
coun
trie
s
Previous forecast
Baseline
Low case
Percent
East Asia and Pacific Economic Update, April 2022

Opportunities
East Asia and Pacific Economic Update, April 2022

Some evidence already of value chain shifts from China to EAP countries
China’s share in EAP
intermediate imports
China’s share in US final
goods imports
12Source: Author’s calculations based on customs trade data from China, European Union, Japan and the U.S.
33.1
24.2
52.5
68.2
10.0
15.3
0
2
4
6
8
10
12
14
16
18
20
10
20
30
40
50
60
702018m
1
201
8m
3
201
8m
5
201
8m
7
201
8m
9
201
8m
11
201
9m
1
201
9m
3
201
9m
5
201
9m
7
201
9m
9
201
9m
11
202
0m
1
202
0m
3
202
0m
5
202
0m
7
202
0m
9
202
0m
11
202
1m
1
202
1m
3
202
1m
5
202
1m
7
per
cen
t
perc
ent
Trade tensions
33.1
24.2
52.5
68.2
10.0
15.3
0
2
4
6
8
10
12
14
16
18
20
10
20
30
40
50
60
702018m
1
2018m
3
2018m
5
2018m
7
2018m
9
2018m
11
2019m
1
2019m
3
2019m
5
2019m
7
2019m
9
2019m
11
2020m
1
2020m
3
2020m
5
2020m
7
2020m
9
2020m
11
2021m
1
2021m
3
2021m
5
2021m
7
perc
ent
perc
ent
Trade tensions COVID-19
China’s share in US final
goods imports
EAP’s share in US final
goods imports (RHS)
China’s share in EAP
intermediate imports
East Asia and Pacific Economic Update, April 2022

Gains in trade share were unevenly spread across EAP countries
Share in US final goods imports
0
2
4
6
8
10
12
14
16
Jan Apr Jul Oct Jan Apr Jul Oct Jan Apr Jul Oct Jan Apr Jul Oct Jan Apr Jul Oct
2017 2018 2019 2020 2021
US-ChinaTrade tensions
COVID-19 AlphaCOVID-19 Delta
Percent
Vietnam
MalaysiaCambodiaThailandPhilippines
Indonesia
Source: China, EU, Japan and US customs trade data
and World Bank staff estimations.
Note: A. The figure shows the share in US final goods
imports.East Asia and Pacific Economic Update, April 2022

COVID has accelerated technology adoption
Notes: Event study plot where the x axis shows event time in weeks – relative to the first COVID cases. COVID cases taken from Oxford Covid-19 Government Response Tracker. Unweighted averages Includes country fixed effects and standard errors are clustered at country-level. Bars reflect 95% confidence intervals. Coefficients are normalized relative to the omitted category at week t-1, the week before the first COVID cases.
E-commerce Data analytics
-1
0
1
2
3
-8 -4 0 4 8 12 16 20 24
Event weeks
Percent of firms
-1
0
1
2
3
-8 -4 0 4 8 12 16 20 24
Event weeks
Percent of firms
Weeks since first COVID cases Weeks since first COVID cases
East Asia and Pacific Economic Update, April 2022
Policy
East Asia and Pacific Economic Update, April 2022

Firms: Shrinking sales
Sales Employment
-25
-20
-15
-10
-5
0
Micro Small Medium Large
Perc
ent
-60
-50
-40
-30
-20
-10
0
Micro Small Medium Large
Perc
ent
and employment
Source: World Banks Business Pulse Surveys,
2020-21 East Asia and Pacific Economic Update, April 2022
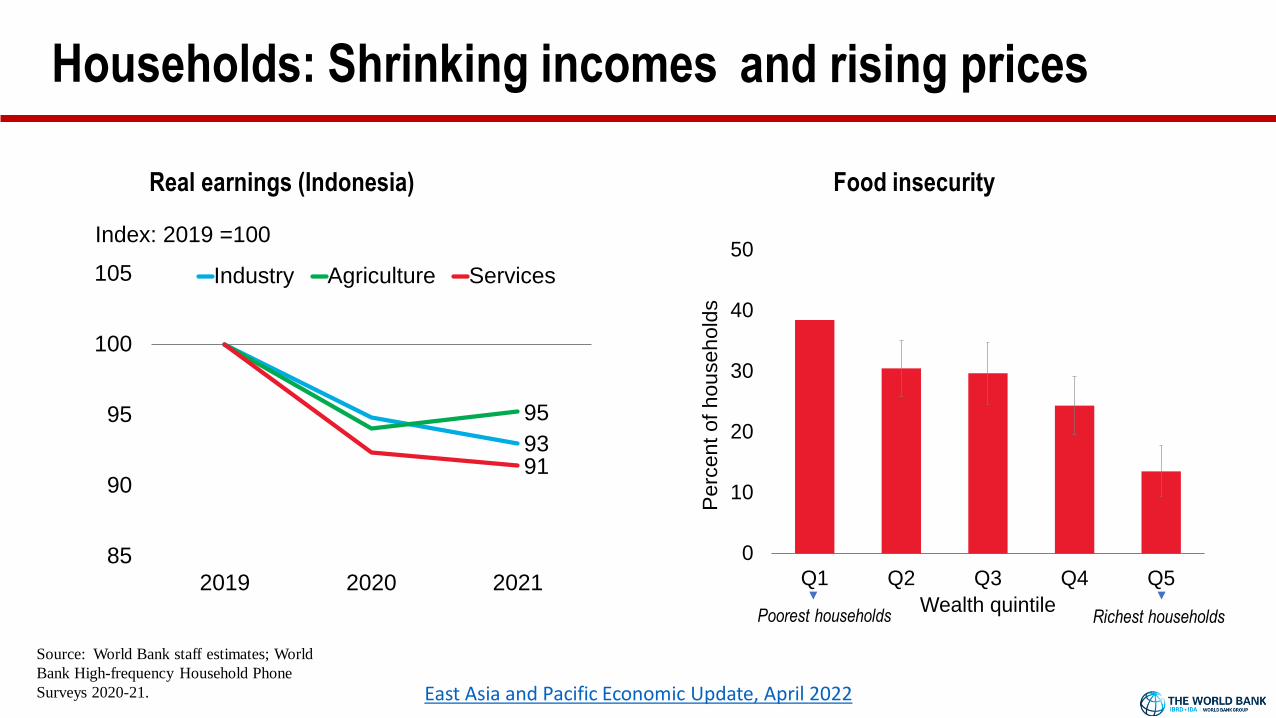
Households: Shrinking incomes
Food insecurity
93
95
91
85
90
95
100
105
2019 2020 2021
Industry Agriculture Services
Index: 2019 =100
Real earnings (Indonesia)
Source: World Bank staff estimates; World
Bank High-frequency Household Phone
Surveys 2020-21.
and rising prices
0
10
20
30
40
50
Q1 Q2 Q3 Q4 Q5
Perc
en
t of hou
se
ho
lds
Wealth quintilePoorest households Richest households
East Asia and Pacific Economic Update, April 2022

1.Fiscal policy space is shrinking because of increasing debt,
Public and private investment
contribution to investment growth
General government debt
Source: Fitch Solutions, IMF Investment and Capital Stock Database 2021, Government
Financial Statistics, International Monetary Fund, Haver Analytics.World Bank
Notes: B. Shows decomposition of real investment growth. 2015-19 and 2020-21 refers to
average during each respective period. Decomposition of investment growth for 2020-21
represents team’s assessment for Cambodia, China, Indonesia, Philippines, and Vietnam.
impeding the revival of public investment
-12-9-6-30369
1215
20
15-1
9
20
20-2
1
20
15-1
9
20
20-2
1
20
15-1
9
20
20-2
1
20
15-1
9
20
20-2
1
20
15-1
9
20
20-2
1
20
15-1
9
20
20-2
1
20
15-1
9
20
20-2
1
Philippines Vietnam China Cambodia Indonesia MalaysiaThailand
Public PrivatePercent
East Asia and Pacific Economic Update, April 2022

-4
-3
-2
-1
0
Universal BasicIncome
TargetingHouseholds w/
Children Under 6Geographical
Targeting Proxy Means Test
Poverty Gap Poverty Rate
Percent
Government assistance has not been selective;
Simulated poverty impacts of cash transfers using different
targeting approaches, given a fixed budget
Source: World Bank EAP Economic Update April 2022, International Monetary Fund,
Haver Analytics, Fitch Solutions, World Bank, national sources.
Note: A. Simulations illustrate the poverty impacts of better targeting social assistance
resources in a large middle-income country. B. shows latest quarterly data in 2021
Share of households receiving government
assistance during the pandemic
targeted fiscal assistance could have a bigger impact
East Asia and Pacific Economic Update, April 2022
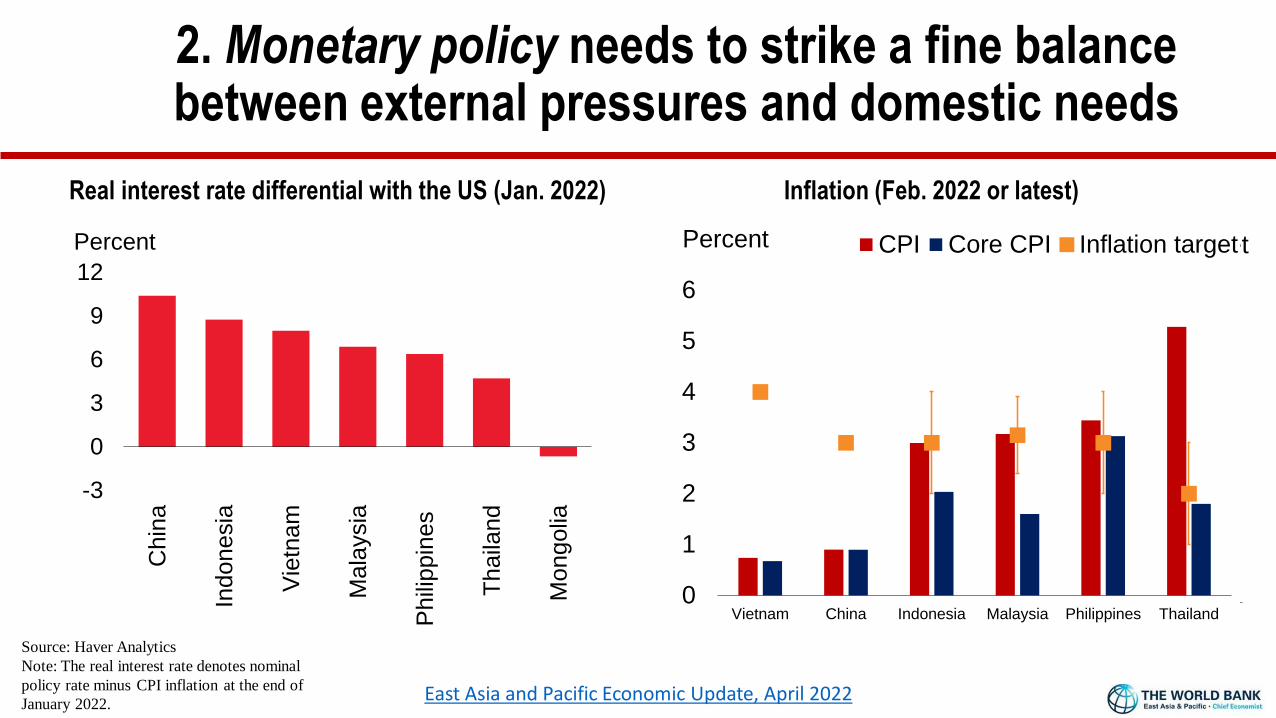
2. Monetary policy needs to strike a fine balance between external pressures and domestic needs
Real interest rate differential with the US (Jan. 2022) Inflation (Feb. 2022 or latest)
-3
0
3
6
9
12
Ch
ina
Ind
on
esia
Vie
tna
m
Mala
ysia
Ph
ilip
pin
es
Th
aila
nd
Mon
go
lia
Percent
Source: Haver Analytics
Note: The real interest rate denotes nominal
policy rate minus CPI inflation at the end of
January 2022.
0
1
2
3
4
5
6
Vietnam China Indonesia Malaysia Philippines Thailand
CPI Core CPI Inflation targetPercent
0
1
2
3
4
5
6
Vietnam China Indonesia Malaysia Philippines Thailand
CPI Core CPI Inflation targetPercent
East Asia and Pacific Economic Update, April 2022

Financial sector risks need to be identified and addressed
Solvency (Deposit to loan ratio) Liquidity (Liquid assets to short term liabilities)
0
20
40
60
80
100
120
140
160
EMDE medianPercent
0
20
40
60
80
100
120
140
160
EMDE medianPercent
Source: International Monetary Fund, Fitch
Solutions, World Bank, national sources.
Notes: Refers to 2021 data. East Asia and Pacific Economic Update, April 2022

3. Eliminating non-tariff barriers to trade could open new trade opportunities
22
Digital services trade restrictiveness index (2021)
0
0.1
0.2
0.3
0.4
0.5
0.6
Ch
ina
Lao
PD
R
Ca
mb
odia
Indo
ne
sia
Th
aila
nd
Kore
a,
Re
p.
Mala
ysia
Van
ua
tu
Jap
an
OE
CD
ave
rag
e
Index
0
10
20
30
40
50
60
70
80
2009 2010 2011 2012 2013 2014 2015 2016 2017 2018
Cambodia Indonesia Malaysia
Singapore Thailand Vietnam
Percent
Share of import value subject to new import restrictions
Source: Global Trade Alert; World Integrated Trade
Solution (WITS) database, OECD. East Asia and Pacific Economic Update, April 2022

Difficulty hiring adequately skilled workers –
across a range of skills (Malaysia)
Inadequate workforce skills
4. Strengthening human capital and infrastructure would boost technology diffusion
0 20 40 60 80 100
Work ethic and commitment
Interpersonal andcommunication skills
Computer orgeneral IT skills
Technical (other than IT),vocational, or job-specific skills
Writing skills
Managerial and leadership skills
Foreign language skills
Percent
Access to broadband
Source: World Bank Enterprise Survey, 2015; Ookla fixed broadband speed test data for Q4 2020.
Note: Left panel shows the share of firms cited difficulty by skill, based on. IT = Information
technologies. Right: Colors reflect the average reported speeds within each 25 kilometers cell, subject
to a minimum number of 100 tests per cell. Gray areas reflect either lack of broadband availability or
an insufficient number of reported tests. East Asia and Pacific Economic Update, April 2022