brand image thdp kepuasan pelanggan
19
1 KUESIONER A. Data Responden 1. Profesi anda sekarang : a. Mahasiswa b. Pegawai swasta c. Pegawai negeri d. Wiraswata e. Lain-lain 2. Usia anda sekarang : a. 17-21 tahun b. 21-30 tahun c. 30-40 tahun d. 41-50 tahun e. >51 tahun 3. Jenis kelamin anda : a. Laki-laki b. Perempuan 4. Pendidikan terakhir anda : a. SMU / sederajat b. S1 (Sarjana) / sederajat c. S2 (Magister) d. S3 (Doktor) e. Lain-lain B. About Sriwijaya Air Keterangan : STS : Sangat Tidak Setuju TS : Tidak Setuju S : Setuju SS : Sangat Setuju
-
Upload
independent -
Category
Documents
-
view
1 -
download
0
Transcript of brand image thdp kepuasan pelanggan

1
KUESIONER
A. Data Responden
1. Profesi anda sekarang : a. Mahasiswa b. Pegawai swasta c. Pegawai negeri d. Wiraswata e. Lain-lain
2. Usia anda sekarang : a. 17-21 tahun
b. 21-30 tahun c. 30-40 tahun d. 41-50 tahun e. >51 tahun
3. Jenis kelamin anda :
a. Laki-laki b. Perempuan
4. Pendidikan terakhir anda :
a. SMU / sederajat b. S1 (Sarjana) / sederajat c. S2 (Magister) d. S3 (Doktor) e. Lain-lain
B. About Sriwijaya Air
Keterangan :
STS : Sangat Tidak Setuju
TS : Tidak Setuju
S : Setuju
SS : Sangat Setuju

2
Variabel (7p) Indikator STS TS S SS
Product
Rute Sriwijaya Air sesuai dengan kebutuhan saya Rute Sriwijaya Air sesuai memberi kemudahan bagi saya untuk bepergian Jadwal penerbangan Sriwijaya Air sesuai dengan kebutuhan saya Jadwal penerbangan Sriwijaya Air memberikan kemudahan bagi saya untuk bepergian
Price
Harga tiket yang ditawarkan Sriwijaya Air sesuai dengan kebutuhan saya Harga tiket yang ditawarkan Sriwijaya Air sesuai dengan kantong saya Harga tiket Sriwijaya Air sebanding dengan jasa yang saya peroleh Harga tiket Sriwijaya Air tergolong murah jika dibandingkan dengan operator lain
Place
Kantor cabang Sriwijaya Air berada di lokasi yang mudah dijangkau Kantor cabang Sriwijaya Air berada di lokasi yang strategis Tiket Sriwijaya Air bisa dibeli melalui website Sriwijaya Air
Tiket Sriwijaya Air mudah untuk didapat
Promotion
Promosi yang diberikan oleh Sriwijaya Air sangat menarik Promosi yang diberikan oleh Sriwijaya Air sangat menguntungkan saya Promosi yang diberikan oleh Sriwijaya Air memberikan manfaat lain bagi saya Saya bersedia memberitahukan promosi yang diadakan oleh Sriwijaya Air kepada teman dan kerabat
People
Staff dan awak kabin Sriwijaya Air sangatlah ramah Staff dan awak kabin Sriwijaya Air sangat membantu saya Staff dan awak kabin Sriwijaya Air berpenampilan bersih Staff dan awak kabin Sriwijaya Air berpenampilan rapi
Process
Proses pembelian tiket Sriwijaya Air sederhana
Sriwijaya Air tepat waktu sesuai dengan jadwalnya Pelayanan yang diberikan Sriwijaya Air selama penerbangan sangat berkesan bagi saya Pelayanan yang diberikan oleh Sriwijaya Air selama saya berada di bandara sangat baik

3
Variabel Indikator STS TS S SS
Physical Evidence
Kabin pesawat Sriwijaya Air bersih dan nyaman Kursi penumpang dalam pesawat Sriwijaya Air cukup lega Ruang tunggu di bandara bersih dan nyaman Makanan yang disajikan dalam penerbangan masih baru dan segar
Kepuasan Pelanggan
Saya puas dengan produk jasa yang diberikan oleh Sriwijaya Air Saya puas dengan harga yang ditawarkan oleh Sriwijaya Air Saya puas dengan pelayanan yang diberikan oleh staff dan awak kabin Sriwijaya Air Saya puas dengan promosi yang ditawarkan oleh Sriwijaya Air Secara keseluruhan saya puas atas kinerja Sriwijaya Air
Ikatan emosional
Sriwijaya Air menjadi pilihan saya dalam merencanakan suatu perjalanan Sejak dulu saya paling suka dengan Sriwijaya Air
Sejak dulu saya percaya dengan Sriwijaya Air
Loyalitas Merk
Saya akan selalu menggunakan Sriwijaya Air Ketika saya akan bepergian, Sriwijaya Air selalu menjadi pilihan utama saya Saya akan selalu merekomendasikan Sriwijaya Air kepada rekan dan kerabat saya
Saya tidak membandingkan Sriwijaya Air dengan airline lainnya

ATTACHMENT B : VALIDITY PRE-TEST RESULT
1. Variable PRODUCT
Item-Total Statistics
Scale Mean if
Item Deleted
Scale Variance
if Item Deleted
Corrected Item-
Total Correlation
Squared
Multiple
Correlation
Cronbach's
Alpha if Item
Deleted
V1 8.83 1.623 .474 .241 .884
V2 8.79 .868 .822 .718 .727
V3 8.96 1.172 .721 .523 .779
V4 8.79 .868 .822 .718 .727
2. Variable PRICE
Item-Total Statistics
Scale Mean if
Item Deleted
Scale Variance
if Item Deleted
Corrected Item-
Total Correlation
Squared
Multiple
Correlation
Cronbach's
Alpha if Item
Deleted
V5 8.79 1.998 .771 .640 .832
V6 8.88 2.027 .775 .633 .831
V7 8.75 2.109 .609 .376 .899
V8 8.83 2.058 .822 .702 .816
3. Variable PLACE
Item-Total Statistics
Scale Mean if
Item Deleted
Scale Variance
if Item Deleted
Corrected Item-
Total Correlation
Squared
Multiple
Correlation
Cronbach's
Alpha if Item
Deleted
V9 9.13 1.245 .518 .770 .620
V10 9.13 1.245 .688 .803 .515
V11 8.92 1.471 .470 .454 .650
V12 8.71 1.520 .315 .265 .744
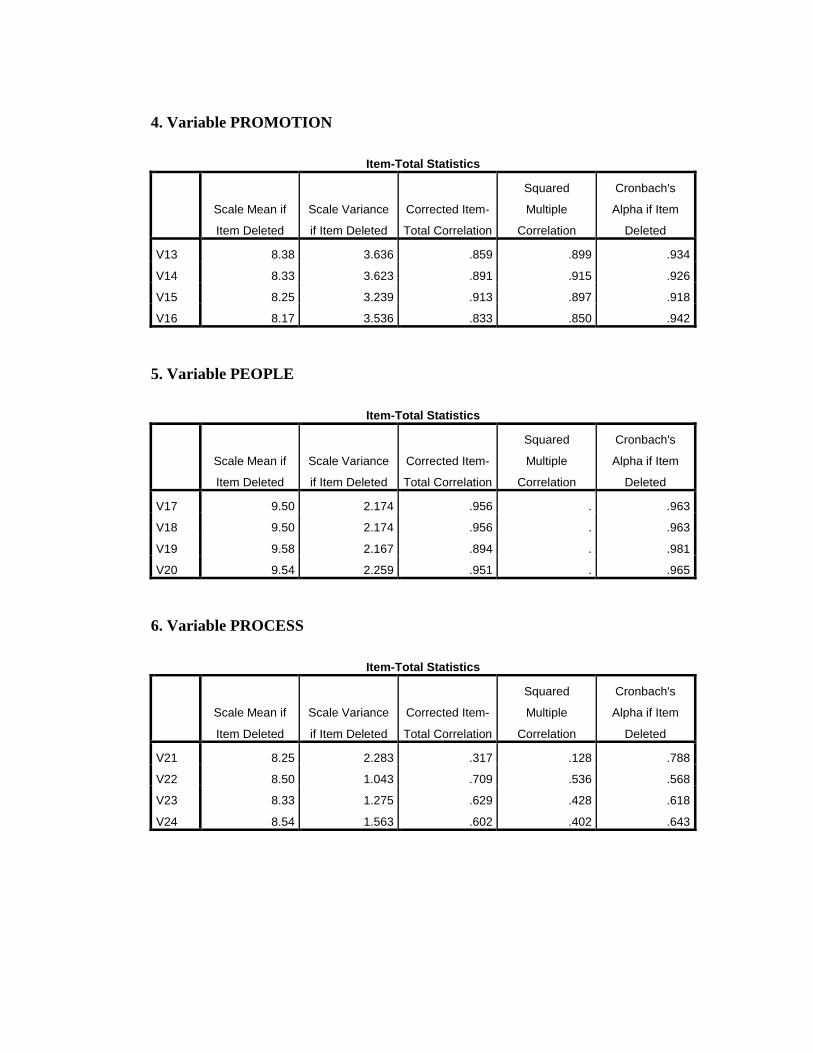
4. Variable PROMOTION
Item-Total Statistics
Scale Mean if
Item Deleted
Scale Variance
if Item Deleted
Corrected Item-
Total Correlation
Squared
Multiple
Correlation
Cronbach's
Alpha if Item
Deleted
V13 8.38 3.636 .859 .899 .934
V14 8.33 3.623 .891 .915 .926
V15 8.25 3.239 .913 .897 .918
V16 8.17 3.536 .833 .850 .942
5. Variable PEOPLE
Item-Total Statistics
Scale Mean if
Item Deleted
Scale Variance
if Item Deleted
Corrected Item-
Total Correlation
Squared
Multiple
Correlation
Cronbach's
Alpha if Item
Deleted
V17 9.50 2.174 .956 . .963
V18 9.50 2.174 .956 . .963
V19 9.58 2.167 .894 . .981
V20 9.54 2.259 .951 . .965
6. Variable PROCESS
Item-Total Statistics
Scale Mean if
Item Deleted
Scale Variance
if Item Deleted
Corrected Item-
Total Correlation
Squared
Multiple
Correlation
Cronbach's
Alpha if Item
Deleted
V21 8.25 2.283 .317 .128 .788
V22 8.50 1.043 .709 .536 .568
V23 8.33 1.275 .629 .428 .618
V24 8.54 1.563 .602 .402 .643

7. Variable PHYSICAL EVIDENCE
Item-Total Statistics
Scale Mean if
Item Deleted
Scale Variance
if Item Deleted
Corrected Item-
Total Correlation
Squared
Multiple
Correlation
Cronbach's
Alpha if Item
Deleted
V25 8.29 4.042 .524 .472 .855
V26 8.38 2.853 .745 .682 .754
V27 8.67 2.406 .661 .526 .834
V28 8.17 3.014 .892 .824 .709
8. Variable CUSTOMER SATISFACTION
Item-Total Statistics
Scale Mean if
Item Deleted
Scale Variance
if Item Deleted
Corrected Item-
Total Correlation
Squared
Multiple
Correlation
Cronbach's
Alpha if Item
Deleted
V29 11.67 1.536 .414 .533 .783
V30 11.54 1.042 .684 .483 .696
V31 11.63 1.375 .478 .501 .766
V32 11.75 1.239 .616 .448 .721
V33 11.75 1.239 .616 .570 .721
9. Variable EMOTIONAL BONDING
Item-Total Statistics
Scale Mean if
Item Deleted
Scale Variance
if Item Deleted
Corrected Item-
Total Correlation
Squared
Multiple
Correlation
Cronbach's
Alpha if Item
Deleted
V34 3.04 .476 .920 .846 .
V35 3.04 .563 .920 .846 .
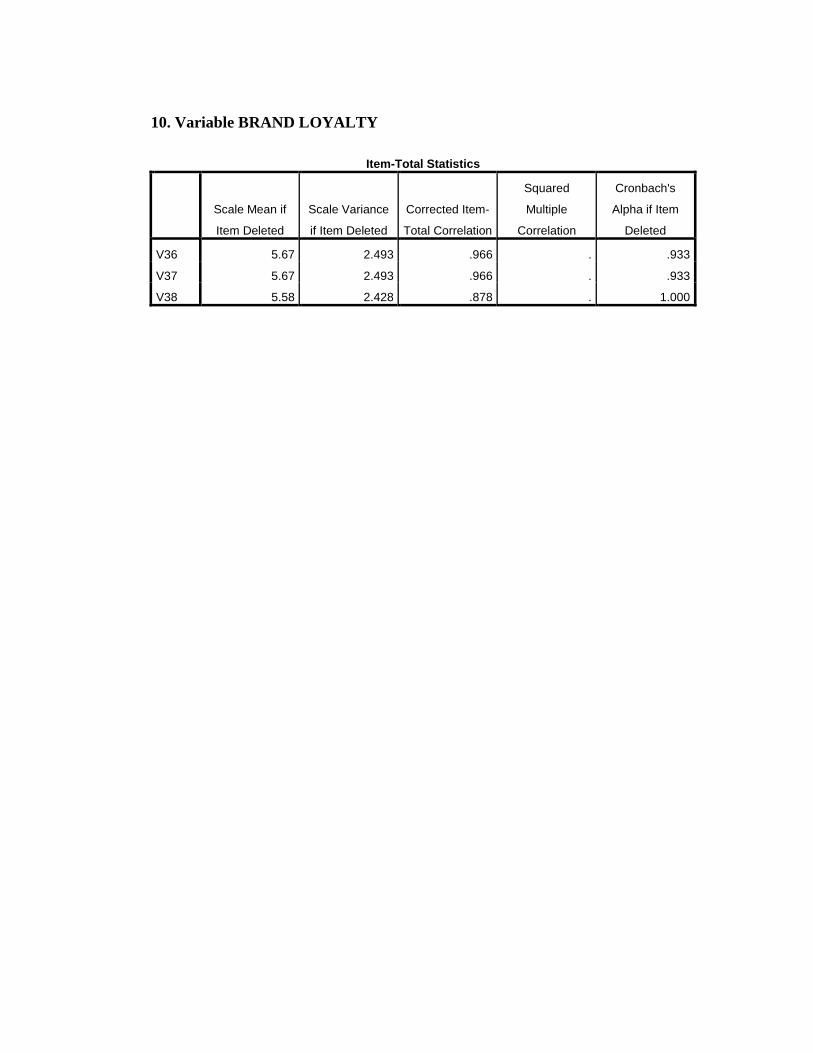
10. Variable BRAND LOYALTY
Item-Total Statistics
Scale Mean if
Item Deleted
Scale Variance
if Item Deleted
Corrected Item-
Total Correlation
Squared
Multiple
Correlation
Cronbach's
Alpha if Item
Deleted
V36 5.67 2.493 .966 . .933
V37 5.67 2.493 .966 . .933
V38 5.58 2.428 .878 . 1.000

ATTACHMENT C : REABILITY PRE-TEST RESULT
1. Variable PRODUCT
Reliability Statistics
Cronbach's
Alpha
Cronbach's
Alpha Based on
Standardized
Items N of Items
.839 .846 4
2. Variable PRICE
Reliability Statistics
Cronbach's
Alpha
Cronbach's
Alpha Based on
Standardized
Items N of Items
.879 .883 4
3. Variable PLACE
Reliability Statistics
Cronbach's
Alpha
Cronbach's
Alpha Based on
Standardized
Items N of Items
.702 .708 4

4. Variable PROMOTION
Reliability Statistics
Cronbach's
Alpha
Cronbach's
Alpha Based on
Standardized
Items N of Items
.947 .948 4
5. Variable PEOPLE
Reliability Statistics
Cronbach's
Alpha
Cronbach's
Alpha Based on
Standardized
Items N of Items
.975 .976 4
6. Variable PROCESS
Reliability Statistics
Cronbach's
Alpha
Cronbach's
Alpha Based on
Standardized
Items N of Items
.738 .741 4
7. Variable PHYSICAL EVIDENCE
Reliability Statistics
Cronbach's
Alpha
Cronbach's
Alpha Based on
Standardized
Items N of Items
.835 .859 4

8. Variable CUSTOMER SATISFACTION
Reliability Statistics
Cronbach's
Alpha
Cronbach's
Alpha Based on
Standardized
Items N of Items
.782 .778 5
9. Variable EMOTIONAL BONDING
Reliability Statistics
Cronbach's
Alpha
Cronbach's
Alpha Based on
Standardized
Items N of Items
.956 .958 2
10. Variable BRAND LOYALTY
Reliability Statistics
Cronbach's
Alpha
Cronbach's
Alpha Based on
Standardized
Items N of Items
.970 .971 3

ATTACHMENT D : VALIDITY TEST USING FACTOR ANALYSIS 1. Variable MARKETING MIX
KMO and Bartlett's Test
Kaiser-Meyer-Olkin Measure of Sampling Adequacy. .500 Bartlett's Test of Sphericity Approx. Chi-Square 656.017
df 1 Sig. .000
Anti-image Matrices
PPL PRC
Anti-image Covariance PPL .012 -.012
PRC -.012 .012 Anti-image Correlation PPL .500a -.994
PRC -.994 .500a a. Measures of Sampling Adequacy(MSA)
Communalities
Initial Extraction
PPL 1.000 .997 PRC 1.000 .997 Extraction Method: Principal Component Analysis.
Total Variance Explained
Component
Initial Eigenvalues Extraction Sums of Squared Loadings
Total % of Variance Cumulative % Total % of Variance Cumulative %
1 1.994 99.706 99.706 1.994 99.706 99.706 2 .006 .294 100.000 Extraction Method: Principal Component Analysis.
Component Matrixa
Component
1
PPL .999 PRC .999 Extraction Method: Principal Component Analysis.
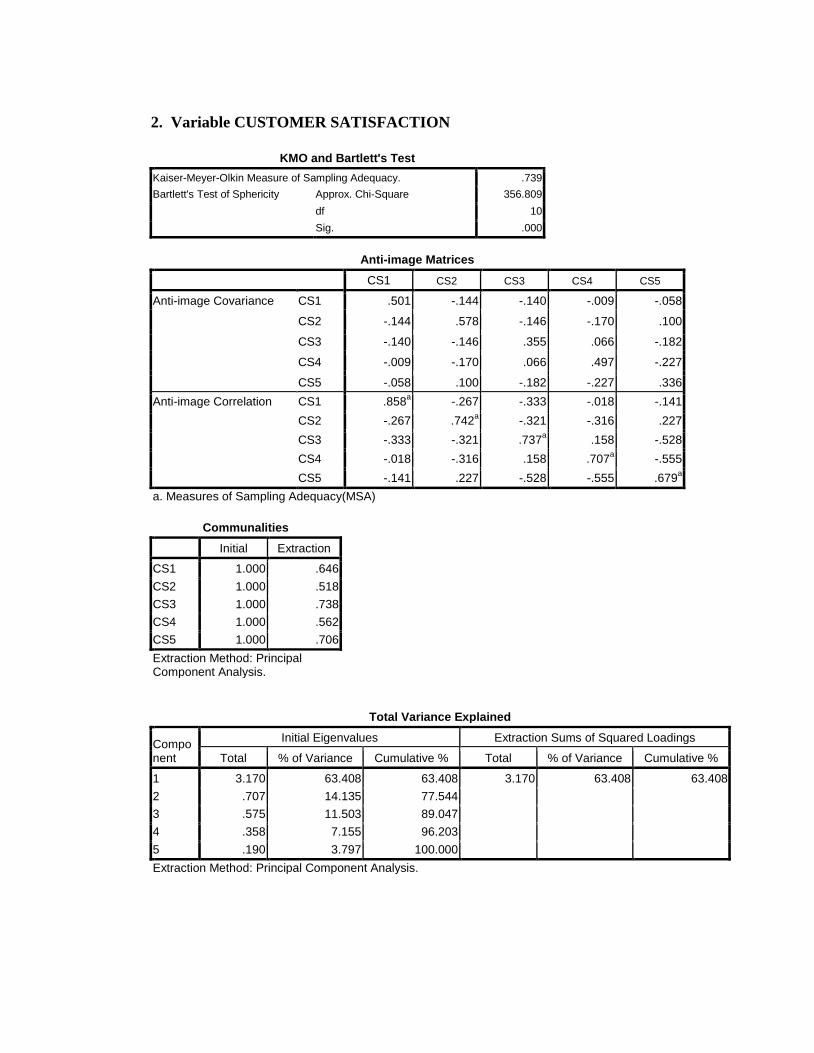
2. Variable CUSTOMER SATISFACTION
KMO and Bartlett's Test Kaiser-Meyer-Olkin Measure of Sampling Adequacy. .739 Bartlett's Test of Sphericity Approx. Chi-Square 356.809
df 10 Sig. .000
Anti-image Matrices
CS1 CS2 CS3 CS4 CS5
Anti-image Covariance CS1 .501 -.144 -.140 -.009 -.058
CS2 -.144 .578 -.146 -.170 .100
CS3 -.140 -.146 .355 .066 -.182
CS4 -.009 -.170 .066 .497 -.227
CS5 -.058 .100 -.182 -.227 .336 Anti-image Correlation CS1 .858a -.267 -.333 -.018 -.141
CS2 -.267 .742a -.321 -.316 .227 CS3 -.333 -.321 .737a .158 -.528 CS4 -.018 -.316 .158 .707a -.555 CS5 -.141 .227 -.528 -.555 .679a
a. Measures of Sampling Adequacy(MSA)
Communalities
Initial Extraction
CS1 1.000 .646 CS2 1.000 .518 CS3 1.000 .738 CS4 1.000 .562 CS5 1.000 .706 Extraction Method: Principal Component Analysis.
Total Variance Explained
Component
Initial Eigenvalues Extraction Sums of Squared Loadings
Total % of Variance Cumulative % Total % of Variance Cumulative %
1 3.170 63.408 63.408 3.170 63.408 63.408 2 .707 14.135 77.544 3 .575 11.503 89.047 4 .358 7.155 96.203 5 .190 3.797 100.000 Extraction Method: Principal Component Analysis.

Component Matrixa
Component
1
CS1 .804 CS2 .720 CS3 .859 CS4 .750 CS5 .840 Extraction Method: Principal Component Analysis. a. 1 components extracted. 3. Variable EMOTIONAL BONDING
KMO and Bartlett's Test Kaiser-Meyer-Olkin Measure of Sampling Adequacy. .500 Bartlett's Test of Sphericity Approx. Chi-Square 30.506
df 1 Sig. .000
Anti-image Matrices
EB1 EB3
Anti-image Covariance EB1 .813 -.351
EB3 -.351 .813 Anti-image Correlation EB1 .500a -.432
EB3 -.432 .500a a. Measures of Sampling Adequacy(MSA)
Communalities
Initial Extraction
EB1 1.000 .716 EB3 1.000 .716 Extraction Method: Principal Component Analysis.

Total Variance Explained
Component
Initial Eigenvalues Extraction Sums of Squared Loadings
Total % of Variance Cumulative % Total % of Variance Cumulative %
1 1.432 71.612 71.612 1.432 71.612 71.612 2 .568 28.388 100.000 Extraction Method: Principal Component Analysis.
Component Matrixa
Component
1
EB1 .846 EB3 .846 Extraction Method: Principal Component Analysis. a. 1 components extracted.
4. Variable BRAND LOYALTY
KMO and Bartlett's Test
Kaiser-Meyer-Olkin Measure of Sampling Adequacy. .500 Bartlett's Test of Sphericity Approx. Chi-Square 175.205
df 1 Sig. .000
Anti-image Matrices
BL1 BL2
Anti-image Covariance BL1 .305 -.254
BL2 -.254 .305 Anti-image Correlation BL1 .500a -.834
BL2 -.834 .500a a. Measures of Sampling Adequacy(MSA)

Communalities
Initial Extraction
BL1 1.000 .917 BL2 1.000 .917 Extraction Method: Principal Component Analysis.
Total Variance Explained
Component
Initial Eigenvalues Extraction Sums of Squared Loadings
Total % of Variance Cumulative % Total % of Variance Cumulative %
1 1.834 91.687 91.687 1.834 91.687 91.687 2 .166 8.313 100.000 Extraction Method: Principal Component Analysis.
Component Matrixa
Component
1
BL1 .958 BL2 .958 Extraction Method: Principal Component Analysis. a. 1 components extracted.

ATTACHMENT E : REABILITY TEST ACTUAL QUESTIONAIRE
1. Variable MARKETING MIX
Reliability Statistics
Cronbach's
Alpha
Cronbach's
Alpha Based on
Standardized
Items N of Items
.752 .762 7
2. Variable CUSTOMER SATISFACTION
Reliability Statistics
Cronbach's
Alpha
Cronbach's
Alpha Based on
Standardized
Items N of Items
.851 .854 5
3. Variable EMOTIONAL BONDING
Reliability Statistics
Cronbach's
Alpha
Cronbach's
Alpha Based on
Standardized
Items N of Items
.613 .613 3

4. Variable BRAND LOYALTY
Reliability Statistics
Cronbach's
Alpha
Cronbach's
Alpha Based on
Standardized
Items N of Items
.755 .772 4

ATTACHMENT F : INTERVIEW QUESTION
1. Question to support hypothesis 1.
H1 : 7P of marketing mix variables has positive influence on customer
satisfaction.
- The results of this study shows that good marketing mix process are able
to raise the level of customer satisfaction on Sriwijata Air. What is your
opinion?
2. Question to support hypothesis 2
H2 : 7P of marketing mix variables has positive influence on brand
loyalty.
- The result of this study shows that good marketing mix process has no
effect on brand loyalty among Sriwijaya Air customer. What is your
opinion?
3. Question to support hypothesis 3
H3 : 7P of marketing mix variables has positive influence on emotional
bonding.
- The result of this study shows that good marketing mix process can also
increase emotional bonding between the passanger of Sriwijaya Air. What
is your opinion?
4. Question to support hypothesis 4
H4 : Customer satisfaction has positive influence on emotional bonding.
- The result of this study shows that customer satisfaction not able to deliver
into emotional bonding among Sriwijaya Air customer. What is your
opinion?

5. Question to support hypothesis 5
H5 : Customer satisfaction has positive influence on brand loyalty.
- The result of this study show that high customer satisfaction are not able
to deliver into brand loyalty. What is your opinion?
6. Question to support hypothesis 6
H6 : Emotional bonding has positive influence on brand loyalty.
- The result of this study show that high emotional bonding can also
increase brand loyalty if Sriwijaya Air. What is your opinion?