Boston Properties - AnnualReports.com
170
Boston Properties 2006 Annual Report BOSTON NEW YORK WASHINGTON SAN FRANCISCO PRINCETON
-
Upload
khangminh22 -
Category
Documents
-
view
3 -
download
0
Transcript of Boston Properties - AnnualReports.com

Boston Properties2006 Annual Report
BOSTON
NEW YORK
WASHINGTON
SAN FRANCISCO
PRINCETON

This Annual Report contains “forward-looking statements” within the meaning of the federal securities laws.
See the discussion under “Forward-Looking Statements” in this report for matters to be considered in this regard.
Boston Properties, Inc., a self-administered and self-managed real estate invest-
ment trust (REIT), is one of the largest owners, managers, and developers of
first-class office properties in the United States, with a significant presence
in four core markets: Boston, Washington, D.C., Midtown Manhattan, and San
Francisco. The Company was founded in 1970 by Mortimer B. Zuckerman and
Edward H. Linde in Boston, where it maintains its headquarters. Boston Properties
became a public company in June 1997 and is traded on the New York Stock
Exchange under the symbol BXP.
The Company acquires, develops, and manages its properties through full-service
regional offices in Boston, New York City, Washington, D.C., San Francisco, and
Princeton, New Jersey. Its property portfolio is comprised primarily of first-class
office space and also includes two hotels. Boston Properties is well-known for
its in-house building management expertise and has a superior track record in
developing Class A, Central Business District (CBD) office buildings, suburban office
centers and build-to-suit projects for the U.S. government and a diverse array of
high-credit tenants.
On the Cover
Times Square Tower,
New York, NY
5 Times Square,
New York, NY
(background)
Contents
IFC Company Description
1 Letter to Shareholders
5 Creating Value Through Excellence
12 Property Portfolio
14 Directors and Officers
15 Form 10-K
IBC Corporate Information

1
Once again, we are proud to report a superb year of performance that has enabled Boston Properties to provide a total return of 63% to its shareholders in 2006, including an annualized regular quarterly dividend of $2.72 as well as a special cash dividend of$5.40 per share announced on December 18, 2006.Looking back over the last five years, BostonProperties’ total return to its shareholders was 249%and, if measured from the time of our IPO in 1997,represents a compound annual return of 21%. We alsofinished the year with an increase in our Funds fromOperations (FFO) of $4.47 per share on a fully dilutedbasis, up more than 5% from the previous year.
While Boston Properties’ performance as measured within its industry stands out, it alsoreflects the premium value now attributed to high quality real estate. Individual assetsand portfolios of properties command ever higher prices in the private market which, inturn, are reflected in the prices of REITs’ stock. Capitalization rates continue to compressespecially for assets which differentiate themselves through their quality, location, andleasing profile.
The risk premium assigned to real estate assets has fallen dramatically with the realizationthat these assets offer stability in the short term due to the highly reliable income streamassociated with contractual leases and the expectation in the long term of dramatic valueincreases arising from the scarcity of comparable locations, ever rising replacementcosts, and even more complicated entitlement processes. In a world with ample capitalexceeding available investment opportunities, high quality real estate has become particularly attractive. During 2006, this situation was further enhanced by a relatively low and stable interest rate environment and tight credit spreads so that the acquirers of real estate could leverage investments on very favorable terms enhancing ultimateinternal rates of return on equity.
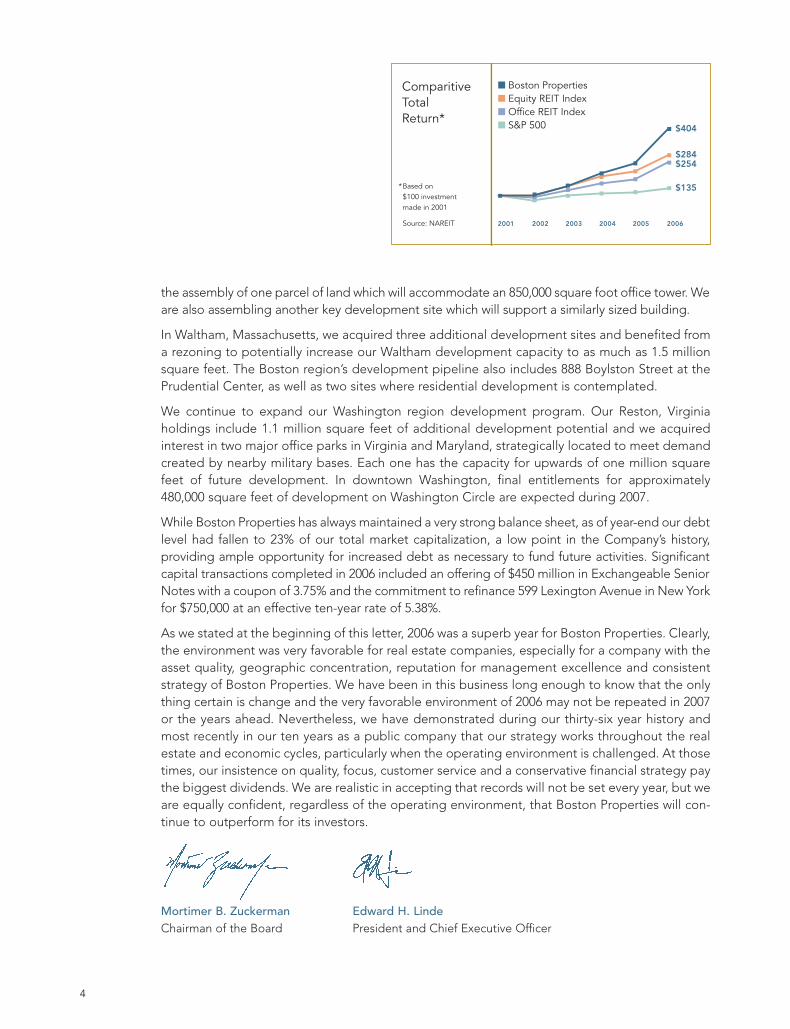
It is particularly satisfying that Boston Properties was not only able to take advantage of this environment but also achieved a significant premium over other indices. Our totalreturn outstripped the Office REIT Index by 40% and we outpaced the Standard & Poor’s500 Index by 294%. We achieved these performance levels by continuing to follow theconsistent business strategy that we have employed throughout our history.
The preeminence of Boston Properties’ operating portfolio is universally recognized. It is characterized by the high quality of our assets which appeal to premier tenants willing to pay a premium to house their employees in the best possible work environ-ment. Approximately 75% of our assets are located in the Central Business Districts of America’s most important business centers–Midtown Manhattan, San Francisco,Washington, D.C., and Boston–with the balance situated in unique and highly valuedsuburban locations.
To Our Shareholders
Mortimer B. Zuckerman
Chairman of the Board
(left)
Edward H. Linde
President and
Chief Executive Officer
2
We believe that leasing space to strong, creditworthy companies under long-term contractsserves us best in both up and down cycles. Furthermore, the quality of our tenants is matched bythe care with which Boston Properties serves them every day.
Boston Properties’ attractiveness to investors also derives from its highly regarded developmentexpertise. We can achieve a significant premium in return on equity by building quality officebuildings in prized locations that far exceed the returns available through acquisitions in today’sheated investment environment.
These factors have led to public recognition of our success. During 2006, Boston Properties wasadded to the Standard & Poor’s 500 Index and, in addition to many other awards, for the thirdyear in a row we were selected as one of America’s Most Admired Companies in the real estateindustry by FORTUNE® magazine.
As reviewed in more detail in the paragraphs below, our achievements in 2006, and theCompany’s long-held strategy, reflect accomplishments in several areas–improving the perform-ance of our operating portfolio; disposing of select assets at record prices; completing strategicacquisitions; building our development pipeline, which sets the stage for growth in the yearsahead; and initiating several new and highly profitable ground-up developments.
Operations of the Existing PortfolioOur markets continued to improve during 2006. Vacancy rates declined by an average of 1% inthe regions in which we operate while rental rates climbed by as much as 31% in those same markets. Perhaps the clearest way to measure the result of this strengthening is to compare, asof December 31, 2006, the estimated average market rent for our entire office portfolio with theactual contractual rent on that same date last year. The result is a positive difference of more than$6.20 per square foot, or over $170 million when applied to the Company’s total portfolio, ascompared to $0.39 per square foot at the end of 2005.
Acquisitions and DispositionsTaking advantage of historically high private market valuations, Boston Properties disposed of$1.3 billion in assets during the year and limited its $372 million in acquisitions to special situations available on a sole source basis or where strategic factors enhanced acquisition values.
The dispositions captured the arbitrage between private market pricing on certain assets and thevalues attributed to those same buildings as reflected in our stock price. While additional assetsales might offer similar opportunities, moderation is required because one of Boston Properties’most important advantages is our operating platform which will only be maintained if the size ofour portfolio remains large enough to provide management, operating, marketing, and capitalgathering synergies.
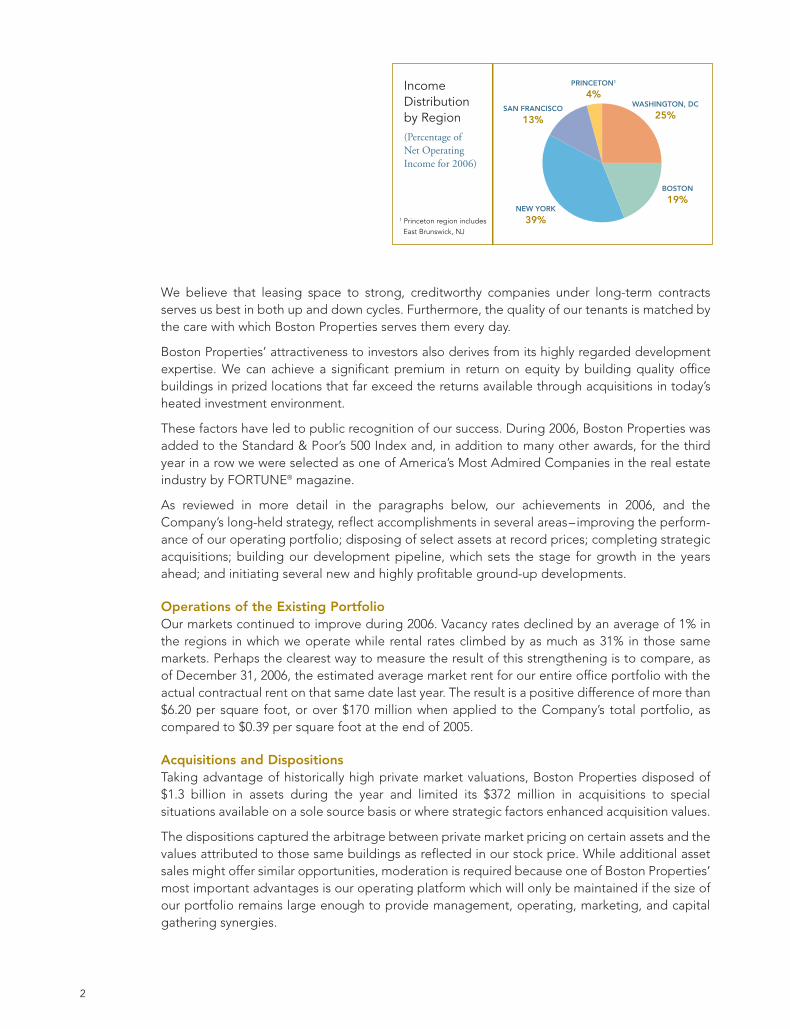
1 Princeton region includes East Brunswick, NJ
BOSTON
19%
WASHINGTON, DC
25%
NEW YORK
39%
SAN FRANCISCO
13%
PRINCETON1
4%Income Distributionby Region(Percentage ofNet Operating Income for 2006)

Two of the more noteworthy transactions during 2006 were in Midtown Manhattan–the sale of 280 Park Avenue commanded a record setting price of $1,018 per square foot and we retainedmanagement under an annually renewing agreement. In November, we agreed to sell the long-term leasehold interest and related credits in 5 Times Square for approximately $1.28 billion.The sale of 5 Times Square, which closed in February of 2007, allowed the Company to monetizethe future value of a building under lease through 2022 at a rent significantly under market.
Despite the competitive acquisition market, Boston Properties was able to complete severalattractive acquisitions. In northern California, we purchased three properties including 3200Zanker Road, a 544,000 square foot complex that is under lease through 2010 and provides anopportunity for considerably higher rents at that time while offering near term developmentpotential for up to an additional 450,000 square feet. We also closed on the purchase of 303Almaden, strategically adjacent to our 850,000 square foot development site in San Jose. Finally,on behalf of our joint-venture Value-Added Fund, we acquired One and Two Circle Star Way inSan Carlos, a 208,000 square foot office complex offering immediate repositioning opportunities.
On the East Coast we purchased, at an extremely attractive price, the remaining minority interestin Citigroup Center, a Midtown Manhattan icon. And, we acquired Four and Five CambridgeCenter, which were originally developed by Boston Properties, increasing our control of that market at an investment well below today’s replacement costs.
DevelopmentBoston Properties completed three development projects with a total investment of $209 millionat an average return on total capital invested much greater than acquisitions of comparablebuildings. These projects included the Broad Institute in Cambridge, Massachusetts, a collabo-rative genomic research institute that is leased in its entirety to the Massachusetts Institute ofTechnology; a 180,000 square feet building in Reston, Virginia that is 100% leased to theLockheed Martin Corporation; and, in the District of Columbia, the successful expansion of ourCapital Gallery property with 319,000 square feet of additional office space.
As we completed these buildings in 2006, we began $350 million of new projects. The most sig-nificant development start during the year was a 650,000 square foot mixed-use office and retailproject in Reston Town Center, known as South of Market. Now over 50% committed, and withtwelve months still remaining before opening, it will bring our total holdings in this key market tomore than 3.2 million square feet. In October 2007, we expect to complete 323,000 square feetof development at 505 9th Street in Washington, D.C., which is now virtually 100% leased.
Building our development pipeline to create the fuel for future growth was a major and very successful focus in 2006. In the particularly challenging Midtown Manhattan market, we closed on
3
0
1
2
3
4
5
FFO Per Share(Diluted)and Dividends Per Share
FFO nDividends nSpecial Dividends n
2002 2003 2004 2005 2006
$4.09 $4.09 $4.16 $4.25 $4.48 $2.41 $2.50 $2.58 $2.69 $2.72
$2.50 $5.40
0.0001.1252.2503.3754.5005.6256.7507.8759.000
4
the assembly of one parcel of land which will accommodate an 850,000 square foot office tower. Weare also assembling another key development site which will support a similarly sized building.
In Waltham, Massachusetts, we acquired three additional development sites and benefited froma rezoning to potentially increase our Waltham development capacity to as much as 1.5 millionsquare feet. The Boston region’s development pipeline also includes 888 Boylston Street at thePrudential Center, as well as two sites where residential development is contemplated.
We continue to expand our Washington region development program. Our Reston, Virginiaholdings include 1.1 million square feet of additional development potential and we acquiredinterest in two major office parks in Virginia and Maryland, strategically located to meet demandcreated by nearby military bases. Each one has the capacity for upwards of one million squarefeet of future development. In downtown Washington, final entitlements for approximately480,000 square feet of development on Washington Circle are expected during 2007.
While Boston Properties has always maintained a very strong balance sheet, as of year-end our debtlevel had fallen to 23% of our total market capitalization, a low point in the Company’s history, providing ample opportunity for increased debt as necessary to fund future activities. Significantcapital transactions completed in 2006 included an offering of $450 million in Exchangeable SeniorNotes with a coupon of 3.75% and the commitment to refinance 599 Lexington Avenue in New Yorkfor $750,000 at an effective ten-year rate of 5.38%.
As we stated at the beginning of this letter, 2006 was a superb year for Boston Properties. Clearly,the environment was very favorable for real estate companies, especially for a company with theasset quality, geographic concentration, reputation for management excellence and consistentstrategy of Boston Properties. We have been in this business long enough to know that the onlything certain is change and the very favorable environment of 2006 may not be repeated in 2007or the years ahead. Nevertheless, we have demonstrated during our thirty-six year history andmost recently in our ten years as a public company that our strategy works throughout the realestate and economic cycles, particularly when the operating environment is challenged. At thosetimes, our insistence on quality, focus, customer service and a conservative financial strategy paythe biggest dividends. We are realistic in accepting that records will not be set every year, but weare equally confident, regardless of the operating environment, that Boston Properties will con-tinue to outperform for its investors.
Mortimer B. Zuckerman Edward H. LindeChairman of the Board President and Chief Executive Officer
Comparitive Total Return*
2002
$404
$135
$284$254
2003 2004 2005 20062001
0
100
200
300
400
500
*Based on $100 investment made in 2001
Source: NAREIT
n Boston Properties n Equity REIT Index n Office REIT Index n S&P 500

Creating ValueThrough Excellence
The entire history of Boston Properties reflects Management’s unwavering
commitment to a core strategy of building appreciation through property
development, acquisition, ownership, and hands-on management in select,
supply-constrained markets. This in turn has resulted in higher asset values
for our properties over time. We continue to focus on opportunities for
expansion in our select geographical markets in order to build long-term
value for our shareholders and to support growth in the communities
where we do business.

6
Management
Boston Properties’ well-respected management team consists of thirty-three senior
officers, led by co-founders Mort Zuckerman and Ed Linde, with an average of
twenty-five years in real estate industry experience and
an average of fourteen years with the Company. Boston
Properties believes the relationships and expertise of its
senior management team provide the Company with a
competitive advantage to realize continued growth in
the coming years.
PICTURED ABOVE: The Prudential Center, Boston, MA.
FACING PAGE: 399 Park Avenue, New York, NY;
Citigroup Center, New York, NY (background).


9
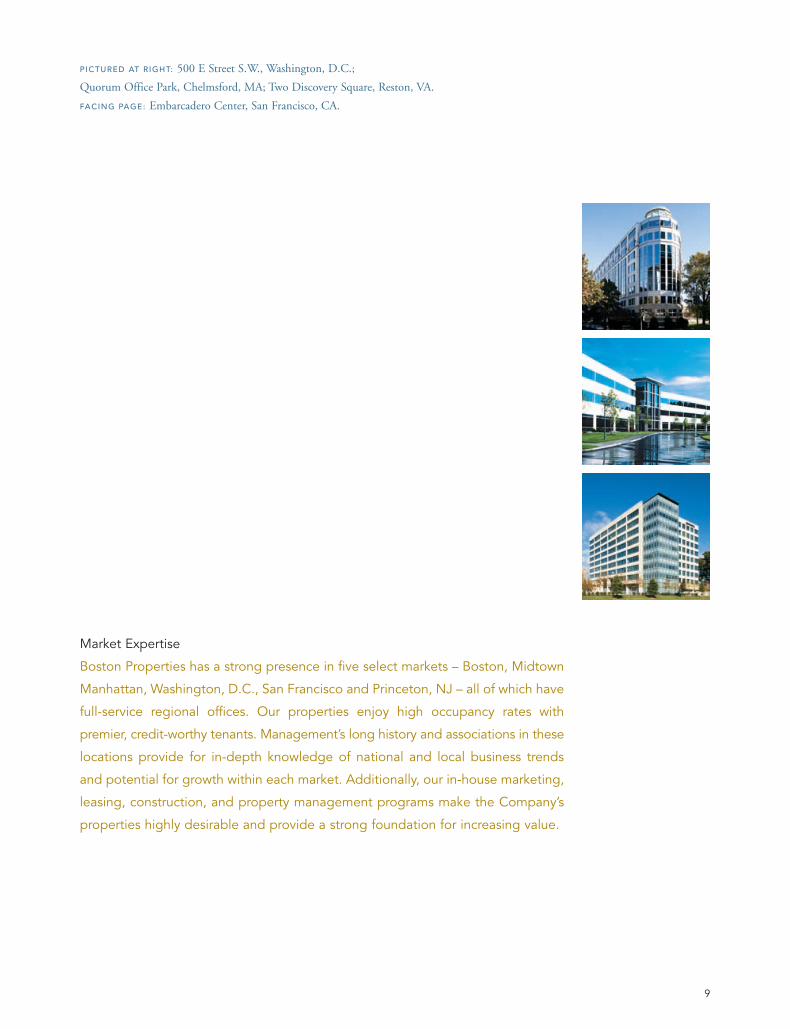
Market Expertise
Boston Properties has a strong presence in five select markets – Boston, Midtown
Manhattan, Washington, D.C., San Francisco and Princeton, NJ – all of which have
full-service regional offices. Our properties enjoy high occupancy rates with
premier, credit-worthy tenants. Management’s long history and associations in these
locations provide for in-depth knowledge of national and local business trends
and potential for growth within each market. Additionally, our in-house marketing,
leasing, construction, and property management programs make the Company’s
properties highly desirable and provide a strong foundation for increasing value.
PICTURED AT RIGHT: 500 E Street S.W., Washington, D.C.;
Quorum Office Park, Chelmsford, MA; Two Discovery Square, Reston, VA.
FACING PAGE: Embarcadero Center, San Francisco, CA.

10
Development
Boston Properties’ long-standing reputation and relationships both nationwide and in our
primary markets with brokers, tenants, financial institutions, and contractors provides us with
superior access to potential development and acquisition opportunities. Our development of
almost twelve million square feet over our thirty-six year history exemplifies our Company’s
successful track record and focus in markets where we have attained leadership positions and,
therefore, can achieve superior returns.
PICTURED BELOW: 599 Lexington Avenue, New York, NY;
Seven Cambridge Center, Cambridge, MA.
FACING PAGE: 111 Huntington Avenue
at The Prudential Center, Boston, MA.


12
Property Portfolio
As of December 31, 2006, the Company’s portfolio consisted of 131 properties comprising approximately
43.4 million square feet, including six properties under construction totaling 1.4 million square feet, and
two hotels. The overall percentage of leased space for the 123 properties in service as of year-end was 94.2%.
CLOCKWISE FROM UPPER LEFT: Waltham Weston Corporate Center, Waltham, MA;
Citigroup Center, New York, NY; 303 Almaden, San Jose, CA; Market Square North,
Washington, D.C.; Capital Gallery, Washington, D.C.

13
CLOCKWISE FROM UPPER LEFT: One and Two Freedom Square, Reston, VA;
Eight Cambridge Center, Cambridge, MA; Embarcadero Center, San Francisco, CA;
One and Two Reston Overlook, Reston, VA; 201 Spring Street, Lexington, MA;
Carnegie Center, Princeton, NJ (center).

14
Directors and Officers
Directors
MORTIMER B. ZUCKERMANCHAIRMAN OF THE BOARD
EDWARD H. LINDEPRESIDENT AND CHIEF
EXECUTIVE OFFICER
LAWRENCE S. BACOWPRESIDENT OF
TUFTS UNIVERSITY
ZOË BAIRDPRESIDENT OF THE
MARKLE FOUNDATION
WILLIAM M. DALEYCHAIRMAN OF
THE MIDWEST REGION
JPMORGAN CHASE & CO.
CAROL B. EINIGERPRESIDENT OF POST
ROCK ADVISORS, LLC
ALAN J. PATRICOFMANAGING DIRECTOR
GREYCROFT, LLC
RICHARD E. SALOMONPRESIDENT OF MECOX
VENTURES, INC.
MARTIN TURCHINVICE CHAIRMAN OF
CB RICHARD ELLIS
DAVID A. TWARDOCKPRESIDENT AND
CHIEF EXECUTIVE OFFICER OF
PRUDENTIAL MORTGAGE
CAPITAL COMPANY, LLC
Executive Officers
DOUGLAS T. LINDEEXECUTIVE VICE PRESIDENT
AND CHIEF FINANCIAL OFFICER
E. MITCHELL NORVILLEEXECUTIVE VICE PRESIDENT
FOR OPERATIONS
RAYMOND A. RITCHEYEXECUTIVE VICE PRESIDENT
AND NATIONAL DIRECTOR
OF ACQUISITIONS
AND DEVELOPMENT
PETER D. JOHNSTONSENIOR VICE PRESIDENT
AND REGIONAL MANAGER OF
WASHINGTON, D.C., OFFICE
BRYAN J. KOOPSENIOR VICE PRESIDENT
AND REGIONAL MANAGER
OF BOSTON OFFICE
MITCHELL S. LANDISSENIOR VICE PRESIDENT
AND REGIONAL MANAGER
OF PRINCETON OFFICE
ROBERT E. PESTERSENIOR VICE PRESIDENT
AND REGIONAL MANAGER
OF SAN FRANCISCO OFFICE
ROBERT E. SELSAMSENIOR VICE PRESIDENT
AND REGIONAL MANAGER
OF NEW YORK OFFICE
Senior Officers
JOHN K. BRANDBERGHSENIOR VICE PRESIDENT
LEASING–PRINCETON
FRANK D. BURTSENIOR VICE PRESIDENT
AND GENERAL COUNSEL
MICHAEL A. CANTALUPASENIOR VICE PRESIDENT
DEVELOPMENT–BOSTON
STEVEN R. COLVINSENIOR VICE PRESIDENT
PROPERTY MANAGEMENT–
SAN FRANCISCO
FREDERICK J. DEANGELISSENIOR VICE PRESIDENT
AND SENIOR COUNSEL
RODNEY C. DIEHLSENIOR VICE PRESIDENT
LEASING–SAN FRANCISCO
AMY C. GINDEL SENIOR VICE PRESIDENT
FINANCE AND PLANNING
THOMAS L. HILLSENIOR VICE PRESIDENT
PROPERTY MANAGEMENT–
NEW YORK
JONATHAN L. KAYLORSENIOR VICE PRESIDENT
LEASING–WASHINGTON
JONATHAN B. KURTISSENIOR VICE PRESIDENT
CONSTRUCTION–WASHINGTON
MICHAEL E. LABELLE SENIOR VICE PRESIDENT
FINANCE
ANDREW LEVINSENIOR VICE PRESIDENT
LEASING–NEW YORK
MATTHEW W. MAYERSENIOR VICE PRESIDENT
AND REGIONAL GENERAL
COUNSEL–NEW YORK
WILLIAM C. NUSSBAUMSENIOR VICE PRESIDENT
AND REGIONAL GENERAL
COUNSEL–WASHINGTON
DAVID C. PROVOSTSENIOR VICE PRESIDENT
LEASING–BOSTON
JONATHAN S. RANDALLSENIOR VICE PRESIDENT
CONSTRUCTION–BOSTON
JAMES C. ROSENFELDSENIOR VICE PRESIDENT
DEVELOPMENT–BOSTON
ROBERT A. SCHUBERTSENIOR VICE PRESIDENT
CONSTRUCTION–NEW YORK
PETER V. SEESENIOR VICE PRESIDENT
PROPERTY MANAGEMENT–
BOSTON
ROBERT A. SILPESENIOR VICE PRESIDENT
DEVELOPMENT–NEW YORK
KENNETH F. SIMMONSSENIOR VICE PRESIDENT
DEVELOPMENT–WASHINGTON
MICHAEL R. WALSHSENIOR VICE PRESIDENT
FINANCE
JAMES J. WHALEN, JR.SENIOR VICE PRESIDENT AND
CHIEF INFORMATION OFFICER
Board of Directors
From left back: Zoë Baird, Lawrence Bacow, Edward Linde,
William Daley, David Twardock and Martin Turchin.
From left front: Alan Patricof, Mortimer Zuckerman,
Carol Einiger and Richard Salomon.
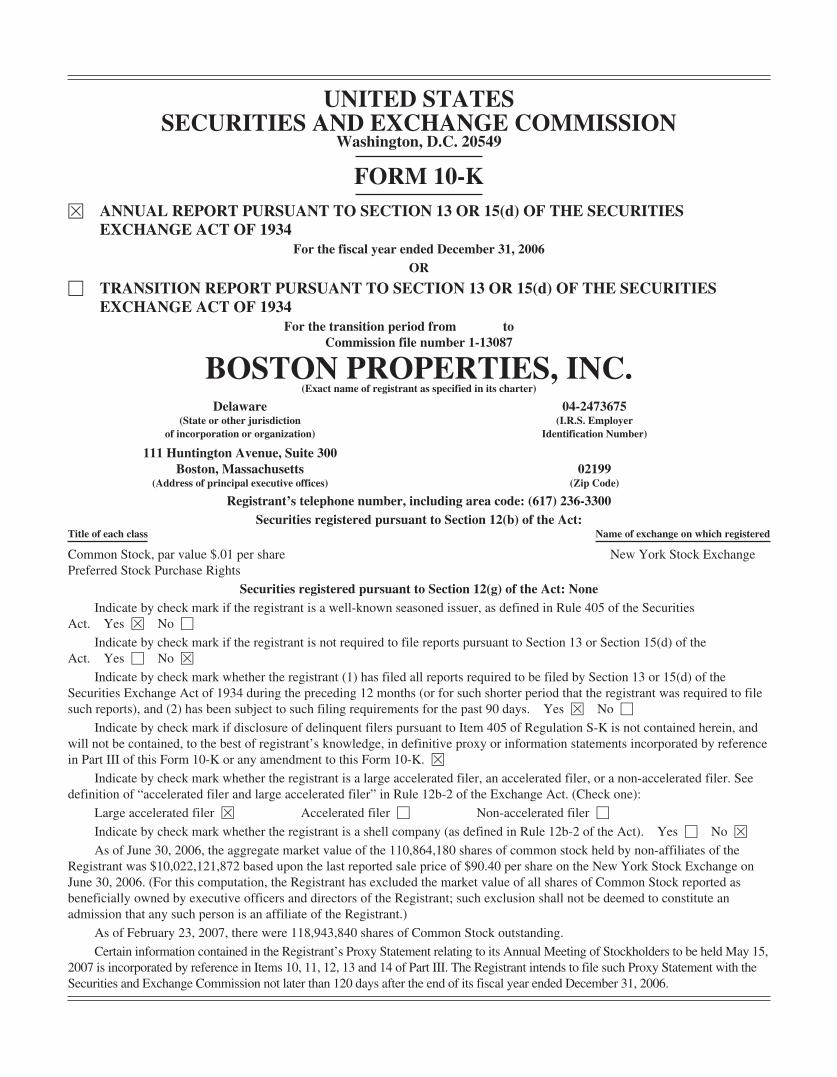
UNITED STATESSECURITIES AND EXCHANGE COMMISSION
Washington, D.C. 20549
FORM 10-KÈ ANNUAL REPORT PURSUANT TO SECTION 13 OR 15(d) OF THE SECURITIES
EXCHANGE ACT OF 1934For the fiscal year ended December 31, 2006
OR
‘ TRANSITION REPORT PURSUANT TO SECTION 13 OR 15(d) OF THE SECURITIESEXCHANGE ACT OF 1934
For the transition period from toCommission file number 1-13087
BOSTON PROPERTIES, INC.(Exact name of registrant as specified in its charter)
Delaware 04-2473675(State or other jurisdiction
of incorporation or organization)(I.R.S. Employer
Identification Number)
111 Huntington Avenue, Suite 300Boston, Massachusetts 02199
(Address of principal executive offices) (Zip Code)
Registrant’s telephone number, including area code: (617) 236-3300Securities registered pursuant to Section 12(b) of the Act:
Title of each class Name of exchange on which registered
Common Stock, par value $.01 per sharePreferred Stock Purchase Rights
New York Stock Exchange
Securities registered pursuant to Section 12(g) of the Act: NoneIndicate by check mark if the registrant is a well-known seasoned issuer, as defined in Rule 405 of the Securities
Act. Yes È No ‘
Indicate by check mark if the registrant is not required to file reports pursuant to Section 13 or Section 15(d) of theAct. Yes ‘ No È
Indicate by check mark whether the registrant (1) has filed all reports required to be filed by Section 13 or 15(d) of theSecurities Exchange Act of 1934 during the preceding 12 months (or for such shorter period that the registrant was required to filesuch reports), and (2) has been subject to such filing requirements for the past 90 days. Yes È No ‘
Indicate by check mark if disclosure of delinquent filers pursuant to Item 405 of Regulation S-K is not contained herein, andwill not be contained, to the best of registrant’s knowledge, in definitive proxy or information statements incorporated by referencein Part III of this Form 10-K or any amendment to this Form 10-K. È
Indicate by check mark whether the registrant is a large accelerated filer, an accelerated filer, or a non-accelerated filer. Seedefinition of “accelerated filer and large accelerated filer” in Rule 12b-2 of the Exchange Act. (Check one):
Large accelerated filer È Accelerated filer ‘ Non-accelerated filer ‘
Indicate by check mark whether the registrant is a shell company (as defined in Rule 12b-2 of the Act). Yes ‘ No È
As of June 30, 2006, the aggregate market value of the 110,864,180 shares of common stock held by non-affiliates of theRegistrant was $10,022,121,872 based upon the last reported sale price of $90.40 per share on the New York Stock Exchange onJune 30, 2006. (For this computation, the Registrant has excluded the market value of all shares of Common Stock reported asbeneficially owned by executive officers and directors of the Registrant; such exclusion shall not be deemed to constitute anadmission that any such person is an affiliate of the Registrant.)
As of February 23, 2007, there were 118,943,840 shares of Common Stock outstanding.
Certain information contained in the Registrant’s Proxy Statement relating to its Annual Meeting of Stockholders to be held May 15,2007 is incorporated by reference in Items 10, 11, 12, 13 and 14 of Part III. The Registrant intends to file such Proxy Statement with theSecurities and Exchange Commission not later than 120 days after the end of its fiscal year ended December 31, 2006.

TABLE OF CONTENTS
ITEM NO. DESCRIPTION PAGE NO.
PART I
1. BUSINESS . . . . . . . . . . . . . . . . . . . . . . . . . . . . . . . . . . . . . . . . . . . . . . . . . . . . . . . . . . . . . . 1
1A. RISK FACTORS . . . . . . . . . . . . . . . . . . . . . . . . . . . . . . . . . . . . . . . . . . . . . . . . . . . . . . . . . 14
1B. UNRESOLVED STAFF COMMENTS . . . . . . . . . . . . . . . . . . . . . . . . . . . . . . . . . . . . . . . . 28
2. PROPERTIES . . . . . . . . . . . . . . . . . . . . . . . . . . . . . . . . . . . . . . . . . . . . . . . . . . . . . . . . . . . . 28
3. LEGAL PROCEEDINGS . . . . . . . . . . . . . . . . . . . . . . . . . . . . . . . . . . . . . . . . . . . . . . . . . . . 33
4. SUBMISSION OF MATTERS TO A VOTE OF SECURITY HOLDERS . . . . . . . . . . . . . 33
PART II
5. MARKET FOR REGISTRANT’S COMMON EQUITY, RELATED STOCKHOLDERMATTERS AND ISSUER PURCHASES OF EQUITY SECURITIES . . . . . . . . . . . . . 33
6. SELECTED FINANCIAL DATA . . . . . . . . . . . . . . . . . . . . . . . . . . . . . . . . . . . . . . . . . . . . 36
7. MANAGEMENT’S DISCUSSION AND ANALYSIS OF FINANCIAL CONDITIONAND RESULTS OF OPERATION . . . . . . . . . . . . . . . . . . . . . . . . . . . . . . . . . . . . . . . . . 38
7A. QUANTITATIVE AND QUALITATIVE DISCLOSURES ABOUT MARKET RISK . . . 81
8. FINANCIAL STATEMENTS AND SUPPLEMENTARY DATA . . . . . . . . . . . . . . . . . . . 82
9. CHANGES IN AND DISAGREEMENTS WITH ACCOUNTANTS ONACCOUNTING AND FINANCIAL DISCLOSURE . . . . . . . . . . . . . . . . . . . . . . . . . . . 133
9A. CONTROLS AND PROCEDURES . . . . . . . . . . . . . . . . . . . . . . . . . . . . . . . . . . . . . . . . . . . 133
9B. OTHER INFORMATION . . . . . . . . . . . . . . . . . . . . . . . . . . . . . . . . . . . . . . . . . . . . . . . . . . 133
PART III
10. DIRECTORS, EXECUTIVE OFFICERS AND CORPORATE GOVERNANCE . . . . . . . 134
11. EXECUTIVE COMPENSATION . . . . . . . . . . . . . . . . . . . . . . . . . . . . . . . . . . . . . . . . . . . . 134
12. SECURITY OWNERSHIP OF CERTAIN BENEFICIAL OWNERS ANDMANAGEMENT AND RELATED STOCKHOLDER MATTERS . . . . . . . . . . . . . . . . 134
13. CERTAIN RELATIONSHIPS AND RELATED TRANSACTIONS, AND DIRECTORINDEPENDENCE . . . . . . . . . . . . . . . . . . . . . . . . . . . . . . . . . . . . . . . . . . . . . . . . . . . . . . 135
14. PRINCIPAL ACCOUNTING FEES AND SERVICES . . . . . . . . . . . . . . . . . . . . . . . . . . . . 135
PART IV
15. EXHIBITS, FINANCIAL STATEMENT SCHEDULES . . . . . . . . . . . . . . . . . . . . . . . . . . 136
PART I
Item 1. Business
General
As used herein, the terms “we,” “us,” “our” and the “Company” refer to Boston Properties, Inc., a Delawarecorporation organized in 1997, individually or together with its subsidiaries, including Boston Properties LimitedPartnership, a Delaware limited partnership, and our predecessors. We are a fully integrated self-administeredand self-managed real estate investment trust, or “REIT,” and one of the largest owners and developers of officeproperties in the United States. Our properties are concentrated in five markets—Boston, Washington, D.C.,midtown Manhattan, San Francisco and Princeton, NJ. We conduct substantially all of our business through oursubsidiary, Boston Properties Limited Partnership. At December 31, 2006, we owned or had interests in 131properties, totaling approximately 33.4 million net rentable square feet and structured parking for vehiclescontaining approximately 10.0 million square feet. Our properties consisted of:
• 127 office properties comprised of 109 Class A office properties (including six properties underconstruction) and 18 Office/Technical properties;
• two hotels; and
• two retail properties.
We own or control undeveloped land totaling approximately 524.3 acres, which will support approximately9.3 million square feet of development. In addition, we have a 25% interest in the Boston Properties OfficeValue-Added Fund, L.P., which we refer to as the “Value-Added Fund,” which is a strategic partnership with twoinstitutional investors through which we have pursued the acquisition of assets within our existing markets thathave deficiencies in property characteristics which provide an opportunity to create value through repositioning,refurbishment or renovation. Our investments through the Value-Added Fund are not included in our portfolioinformation tables or any other portfolio level statistics. At December 31, 2006, the Value-Added Fund hadinvestments in an office complex in Herndon, Virginia, an office property in Chelmsford, Massachusetts and anoffice complex in San Carlos, California.
We consider Class A office properties to be centrally-located buildings that are professionally managed andmaintained, attract high-quality tenants and command upper-tier rental rates, and that are modern structures orhave been modernized to compete with newer buildings. We consider Office/Technical properties to beproperties that support office, research and development, laboratory and other technical uses. Our definitions ofClass A office and Office/Technical properties may be different than those used by other companies.
We are a full-service real estate company, with substantial in-house expertise and resources in acquisitions,development, financing, capital markets, construction management, property management, marketing, leasing,accounting, tax and legal services. As of December 31, 2006, we had approximately 650 employees. Our thirty-three senior officers have an average of twenty-five years experience in the real estate industry and an average offourteen years of experience with us. Our principal executive office and Boston regional office is located at 111Huntington Avenue, Boston, Massachusetts 02199 and our telephone number is (617) 236-3300. In addition, wehave regional offices at 901 New York Avenue, NW, Washington, D.C. 20001; 599 Lexington Avenue, New York,New York 10022; Four Embarcadero Center, San Francisco, California 94111; and 302 Carnegie Center, Princeton,New Jersey 08540.
Our Web site is located at http://www.bostonproperties.com. On our Web site, you can obtain a copy of ourannual report on Form 10-K, quarterly reports on Form 10-Q, current reports on Form 8-K, and amendments tothose reports filed or furnished pursuant to Section 13(a) or 15(d) of the Securities Exchange Act of 1934, asamended, as soon as reasonably practicable after we electronically file such material with, or furnish it to, theSecurities and Exchange Commission, or the SEC. The name “Boston Properties” and our logo (consisting of astylized “b”) are registered service marks of Boston Properties Limited Partnership.
1

Boston Properties Limited Partnership
Boston Properties Limited Partnership, or BPLP, is a Delaware limited partnership, and the entity throughwhich we conduct substantially all of our business and own, either directly or through subsidiaries, substantiallyall of our assets. We are the sole general partner and, as of February 23, 2007, the owner of approximately 84.0%of the economic interests in BPLP. Economic interest was calculated as the number of common partnership unitsof BPLP owned by the Company as a percentage of the sum of (1) the actual aggregate number of outstandingcommon partnership units of BPLP, (2) the number of common partnership units issuable upon conversion ofoutstanding preferred partnership units of BPLP and (3) the number of common units issuable upon conversionof all outstanding long term incentive plan units of BPLP, or LTIP units, assuming all conditions have been metfor the conversion of the LTIP units. An LTIP Unit is generally the economic equivalent of a share of ourrestricted common stock. Our general and limited partnership interests in BPLP entitle us to share in cashdistributions from, and in the profits and losses of, BPLP in proportion to our percentage interest and entitle us tovote on all matters requiring a vote of the limited partners. The other limited partners of BPLP are persons whocontributed their direct or indirect interests in properties to BPLP in exchange for common units or preferredunits of limited partnership interest in BPLP or recipients of LTIP units pursuant to our 1997 Stock Option andIncentive Plan, as amended. Under the limited partnership agreement of BPLP, unitholders may present theircommon units of BPLP for redemption at any time (subject to restrictions agreed upon at the time of issuance ofthe units that may restrict such right for a period of time, generally one year from issuance). Upon presentation ofa unit for redemption, BPLP must redeem the unit for cash equal to the then value of a share of our commonstock. In lieu of cash redemption by BPLP, however, we may elect to acquire any common units so tendered byissuing shares of our common stock in exchange for the common units. If we so elect, our common stock will beexchanged for common units on a one-for-one basis. This one-for-one exchange ratio is subject to specifiedadjustments to prevent dilution. We generally expect that we will elect to issue our common stock in connectionwith each such presentation for redemption rather than having BPLP pay cash. With each such exchange orredemption, our percentage ownership in BPLP will increase. In addition, whenever we issue shares of ourcommon stock other than to acquire common units of Boston Properties Limited Partnership, we must contributeany net proceeds we receive to BPLP and BPLP must issue to us an equivalent number of common units ofBPLP. This structure is commonly referred to as an umbrella partnership REIT, or “UPREIT.”
Preferred units of BPLP have the rights, preferences and other privileges, including the right to convert intocommon units of BPLP, as are set forth in an amendment to the limited partnership agreement of BPLP. As ofDecember 31, 2006 and February 23, 2007, BPLP had one series of its preferred units outstanding. The SeriesTwo preferred units have a liquidation preference of $50.00 per unit (or an aggregate of approximately $86.0million at December 31, 2006 and approximately $64.0 million at February 23, 2007). The Series Two preferredunits are convertible, at the holder’s election, into common units at a conversion price of $38.10 per commonunit (equivalent to a ratio of 1.312336 common units per Series Two preferred unit). Distributions on the SeriesTwo preferred units are payable quarterly and, unless the greater rate described in the next sentence applies,accrue at 7.0% until May 12, 2009 and 6.0% thereafter. If distributions on the number of common units intowhich the Series Two preferred units are convertible are greater than distributions calculated using the ratesdescribed in the preceding sentence for the applicable quarterly period, then the greater distributions are payableinstead. Since May 2005, distributions have been made at the greater rate determined on the basis of distributionspaid on the common units into which the Series Two preferred units are convertible. The terms of the Series Twopreferred units provide that they may be redeemed for cash in six annual tranches, beginning on May 12, 2009, atour election or at the election of the holders. We also have the right to convert into common units of BPLP anySeries Two preferred units that are not redeemed when they are eligible for redemption.
Transactions During 2006
Real Estate Acquisitions/Dispositions
On December 22, 2006, we executed a contract to acquire Kingstowne Towne Center, a mixed-use propertylocated in Alexandria, Virginia, at a purchase price of approximately $134.0 million. This property is comprised of
2

two Class A office properties totaling approximately 307,000 net rentable square feet and a retail/movie theatercomplex totaling approximately 88,000 net rentable square feet. The acquisition is subject to the satisfaction ofcustomary closing conditions and, although there can be no assurance that the acquisition will be consummated onthe terms currently contemplated or at all, it is expected to close by the end of the first quarter of 2007.
On November 30, 2006, we acquired Four and Five Cambridge Center and the Cambridge Center EastGarage located in Cambridge, Massachusetts, at a purchase price of approximately $186.0 million. This propertyconsists of two Class A office properties totaling approximately 436,000 net rentable square feet and structuredparking for approximately 840 vehicles totaling approximately 300,000 square feet. The acquisition was financedwith available cash.
On November 17, 2006, we executed a binding agreement for the sale of the long-term leasehold interest in5 Times Square in New York City and related credits, for approximately $1.28 billion in cash. 5 Times Square isa fully-leased Class A office tower that contains approximately 1,101,779 net rentable square feet. OnFebruary 15, 2007, we completed the sale of the long-term leasehold interest in 5 Times Square in New YorkCity and related credits, for approximately $1.28 billion in cash.
On October 27, 2006, we acquired a parcel of land located in Waltham, Massachusetts for a purchase priceof approximately $5.6 million. On April 13, 2006, we acquired an adjacent parcel of land located in Waltham,Massachusetts for a purchase price of $16.0 million.
On September 15, 2006, a joint venture in which we have a 35% interest sold 265 Franklin Street, a Class Aoffice property with approximately 347,000 net rentable square feet located in Boston, Massachusetts, at a saleprice of approximately $170.0 million. Net cash proceeds totaled approximately $108.3 million, of which ourshare was approximately $37.9 million, after the repayment of mortgage indebtedness of approximately $60.8million and unfunded tenant obligations and other closing costs of approximately $0.9 million.
On August 31, 2006, our Value-Added Fund acquired One and Two Circle Star Way, a 208,000 net rentablesquare foot office complex located in San Carlos, California, at a purchase price of approximately $63.5 million.The acquisition was financed with new mortgage indebtedness totaling $42.0 million and approximately $21.5million in cash, of which our share was approximately $5.4 million. The mortgage financing requires interest-only payments at a fixed interest rate of 6.57% per annum and matures in September 2013. Our Value-AddedFund had total equity commitments of $140 million, of which $47.4 million was funded. Our share of the equitycontributed was approximately $11.8 million. The Value-Added Fund’s investment period expired onOctober 25, 2006.
On August 10, 2006, we acquired 3200 Zanker Road, a Class A Office property with approximately 544,000net rentable square feet located in San Jose, California, at a purchase price of approximately $126.0 million. Theacquisition was financed with available cash.
On June 30, 2006, we acquired 303 Almaden Boulevard, a Class A office property with approximately157,000 net rentable square feet located in San Jose, California, at a purchase price of approximately $45.2million. The acquisition was financed with available cash.
On June 6, 2006, we completed the sale of 280 Park Avenue, a Class A office property with approximately1,179,000 net rentable square feet located in midtown Manhattan, for approximately $1.2 billion in cash. Netcash proceeds were approximately $875 million, after legal defeasance of indebtedness secured by the property(consisting of approximately $254.4 million of principal indebtedness and approximately $28.2 million of relateddefeasance costs) and the payment of transfer taxes, brokers’ fees and other customary closing costs.
On May 31, 2006, we redeemed the outside members’ equity interests in the limited liability company thatowns Citigroup Center for an aggregate redemption price of $100 million, with $50 million paid at closing and$25 million to be paid on each of the first and second anniversaries of the closing or, if earlier, in connection witha sale of Citigroup Center.
3

On May 8, 2006, a joint venture in which we have a 50% interest acquired additional land parcels located inNew York City for an aggregate purchase price of approximately $15.3 million. On March 13, 2006, the jointventure acquired an adjacent land parcel located in New York City for a purchase price of approximately $6.0million. The joint venture obtained mortgage financing collateralized by the land parcels totaling approximately$23.6 million. The mortgage financing bears interest at a variable rate equal to LIBOR plus 2.25% per annumand matures in May 2008.
On January 3, 2006, we completed the previously disclosed sale of a parcel of land at the Prudential Centerlocated in Boston, Massachusetts, which is being developed as the Mandarin Oriental, a hotel and condominiummixed-use complex.
Developments
On December 6, 2006, we commenced construction of One Preserve Parkway, a Class A office propertytotaling approximately 183,000 net rentable square feet located in Rockville, Maryland. We have not pre-leasedany of the space and expect that the project will be completed in the second quarter of 2008.
On September 18, 2006, we commenced construction of 77 Fourth Avenue, a Class A office project withapproximately 210,000 net rentable square feet, located in Waltham, Massachusetts. We have not pre-leased anyof the space and expect that the project will be completed in the first quarter of 2008.
On July 22, 2006, we placed in-service our Capital Gallery expansion project, consisting of a ten-storyaddition totaling approximately 319,000 net rentable square feet of Class A office space located in Washington,D.C. The property is currently 97% leased.
On April 1, 2006, we placed-in-service 12290 Sunrise Valley, a 182,000 net rentable square foot Class Aoffice property located in Reston, Virginia. The property is currently 100% leased.
On March 31, 2006, we commenced construction of South of Market, a Class A office project consisting ofthree buildings aggregating approximately 652,000 net rentable square feet located in Reston, Virginia. Theproject is currently 24% pre-leased. We expect that the project will be completed in the first quarter of 2008. OnNovember 21, 2006, we obtained construction financing totaling $200.0 million collateralized by the project. Theconstruction financing bears interest at a variable rate equal to LIBOR plus 1.25% per annum and matures inNovember 2009 with two one-year extension options.
On January 17, 2006, we placed-in-service our Seven Cambridge Center development project located inCambridge, Massachusetts. Seven Cambridge Center is a fully-leased, build-to-suit project with approximately231,000 net rentable square feet of office, research laboratory and retail space. We have leased 100% of the spaceto the Massachusetts Institute of Technology for occupancy by its affiliate, the Eli and Edythe L. Broad Institute.On October 1, 2005, we had placed-in-service the West Garage phase of the project consisting of parking forapproximately 800 cars.
4

As of December 31, 2006, we had five active construction projects underway, which aggregate an estimatedtotal investment of $452.4 million. The estimated total investment for our properties under construction as ofDecember 31, 2006 is detailed below (in thousands):
Properties Under ConstructionEstimated
Stabilization Date LocationEstimated Total
Investment
Wisconsin Place- Infrastructure (23.89%ownership) . . . . . . . . . . . . . . . . . . . . . . . . . . . . . . . N/A Chevy Chase, MD $ 34,569(1)
505 9th Street (50% ownership) . . . . . . . . . . . . . . . . . First Quarter, 2008 Washington, D.C. 65,000(1)South of Market . . . . . . . . . . . . . . . . . . . . . . . . . . . . . Third Quarter, 2009 Reston, VA 213,80077 Fourth Avenue . . . . . . . . . . . . . . . . . . . . . . . . . . . Fourth Quarter, 2008 Waltham, MA 79,707One Preserve Parkway . . . . . . . . . . . . . . . . . . . . . . . . Fourth Quarter, 2009 Rockville, MD 59,330
Total Properties Under Construction . . . . . . . . . . $452,406
(1) Represents our share of the estimated total investment.
Equity Transactions
During the year ended December 31, 2006, holders of Series Two preferred units of BPLP converted1,982,105 Series Two preferred units into 2,601,132 common units of limited partnership interest. The commonunits of limited partnership interest were subsequently presented by the holders for redemption and wereacquired by us in exchange for an equal number of shares of common stock. In addition, during the year endedDecember 31, 2006, we acquired an aggregate of 560,133 common units of limited partnership interest, presentedby the holders for redemption, in exchange for an equal number of shares of common stock. During the yearended December 31, 2006, we issued 1,793,418 shares of common stock as a result of stock options beingexercised.
Exchangeable Notes Offering
On April 6, 2006, BPLP closed an offering of $400 million in aggregate principal amount of its 3.75%exchangeable senior notes due 2036. On May 2, 2006, BPLP closed an additional $50 million aggregate principalamount of the notes as a result of the underwriter’s exercise of its over-allotment option. When issued, the noteswere exchangeable into our common stock at an initial exchange rate, subject to adjustment, of 8.9461 shares per$1,000 principal amount of notes (or an initial exchange price of approximately $111.78 per share of commonstock). As a result of our declaration of a $5.40 per common share special cash dividend in December 2006, theexchange rate of the notes was adjusted effective December 29, 2006 to 9.3900 per $1,000 principal amount ofnotes (or an exchange price of approximately $106.50 per share of common stock). Noteholders may require theOperating Partnership to purchase the notes at par initially on May 18, 2013 and, after that date, the notes will beredeemable at par at the option of the Operating Partnership. See Note 8 to the Consolidated Financial Statementsfor a description of the terms of the notes.
Special Dividend
On December 15, 2006, our Board of Directors declared a special cash dividend of $5.40 per common sharewhich was paid on January 30, 2007 to shareholders of record as of the close of business on December 29, 2006.The decision to declare a special dividend was the result of the sales of assets in 2006, including 280 ParkAvenue and 265 Franklin Street. The Board of Directors did not make any change in the Company’s policy withrespect to regular quarterly dividends. The special cash dividend was in addition to the regular quarterly dividendof $0.68 per share resulting in a total payment of $6.08 per share paid on January 30, 2007.
5

Business and Growth Strategies
Business Strategy
Our primary business objective is to maximize return on investment so as to provide our investors with thegreatest possible total return. Our strategy to achieve this objective is:
• to concentrate on a few carefully selected geographic markets, including Boston, Washington D.C.,midtown Manhattan, San Francisco and Princeton, NJ., and to be one of the leading, if not the leading,owners and developers in each of those markets. We select markets and submarkets where tenants havedemonstrated a preference for high-quality office buildings and other facilities;
• to emphasize markets and submarkets within those markets where the lack of available sites and thedifficulty of receiving the necessary approvals for development and the necessary financing constitutehigh barriers to the creation of new supply, and where skill, financial strength and diligence are requiredto successfully develop, finance and manage high-quality office, research and development space aswell as selected retail space;
• to take on complex, technically challenging projects, leveraging the skills of our management team tosuccessfully develop, acquire or reposition properties which other organizations may not have thecapacity or resources to pursue;
• to concentrate on high-quality real estate designed to meet the demands of today’s tenants who requiresophisticated telecommunications and related infrastructure and support services, and to manage thosefacilities so as to become the landlord of choice for both existing and prospective clients;
• to opportunistically acquire assets which increase our penetration in the markets in which we havechosen to concentrate and which exhibit an opportunity to improve or preserve returns throughrepositioning (through a combination of capital improvements and shift in marketing strategy), changesin management focus and re-leasing as existing leases terminate;
• to explore joint venture opportunities primarily with existing owners of land parcels located in desirablelocations, who seek to benefit from the depth of development and management expertise we are able toprovide and our access to capital, and/or to explore joint venture opportunities with strategicinstitutional partners, leveraging our skills as owners, operators and developers of Class A office spaceas well as partners with expertise in mixed-use opportunities;
• to pursue on a selective basis the sale of properties, including core properties, to take advantage of ourvalue creation and the demand for our premier properties (see “Part II, Item 7 Management’s Discussionand Analysis of Financial Condition and Results of Operations- Overview” beginning on page 40);
• to seek third-party development contracts, which can be a significant source of revenue and enable us toretain and utilize our existing development and construction management staff, especially when ourinternal development is less active or when new development is less-warranted due to marketconditions; and
• to enhance our capital structure through our access to a variety of sources of capital.
Growth Strategies
External Growth
We believe that our development experience and our organizational depth position us to continue toselectively develop a range of property types, including low-rise suburban office properties, high-rise urbandevelopments, mixed-use developments and research and laboratory space, within budget and on schedule. Otherfactors that contribute to our competitive position include:
• our control of sites (including sites under contract or option to acquire) in our markets that will supportapproximately 9.3 million square feet of new office, hotel and residential development;
6

• our reputation gained through 37 years of successful operations and the stability and strength of ourexisting portfolio of properties;
• our relationships with leading national corporations and public institutions seeking new facilities anddevelopment services;
• our relationships with nationally recognized financial institutions that provide capital to the real estateindustry;
• our track record and reputation for executing acquisitions efficiently provides comfort to domestic andforeign institutions, private investors and corporations who seek to sell commercial real estate in ourmarket areas;
• our ability to act quickly on due diligence and financing; and
• our relationships with institutional buyers and sellers of high-quality real estate assets.
Opportunities to execute our external growth strategy fall into three categories:
• Development in selected submarkets. We believe the continued development of well-positioned officebuildings will be justified in many of our submarkets. We believe in acquiring land after taking intoconsideration timing factors relating to economic cycles and in response to market conditions that allowfor its development at the appropriate time. While we purposely concentrate in markets with highbarriers-to-entry, we have demonstrated throughout our 37-year history, an ability to make carefullytimed land acquisitions in submarkets where we can become one of the market leaders in establishingrent and other business terms. We believe that there are opportunities at key locations in our existingand other markets for a well-capitalized developer to acquire land with development potential.
In the past, we have been particularly successful at acquiring sites or options to purchase sites that needgovernmental approvals for development. Because of our development expertise, knowledge of thegovernmental approval process and reputation for quality development with local governmentregulatory bodies, we generally have been able to secure the permits necessary to allow developmentand to profit from the resulting increase in land value. We seek complex projects where we can addvalue through the efforts of our experienced and skilled management team leading to attractive returnson investment.
Our strong regional relationships and recognized development expertise have enabled us to capitalize onunique build-to-suit opportunities. We intend to seek and expect to continue to be presented with suchopportunities in the near term allowing us to earn relatively significant returns on these developmentopportunities through multiple business cycles.
• Acquisition of assets and portfolios of assets from institutions or individuals. We believe that due to oursize, management strength and reputation, we are well positioned to acquire portfolios of assets orindividual properties from institutions or individuals if valuations meet our criteria. We may acquireproperties for cash, but we are also particularly well-positioned to appeal to sellers wishing to contributeon a tax-deferred basis their ownership of property for equity in a diversified real estate operatingcompany that offers liquidity through access to the public equity markets in addition to a quarterlydistribution. Our ability to offer common and preferred units of limited partnership in BPLP to sellerswho would otherwise recognize a taxable gain upon a sale of assets for cash or our common stock mayfacilitate this type of transaction on a tax-efficient basis. In addition, we may consider mergers with andacquisitions of compatible real estate firms.
• Acquisition of underperforming assets and portfolios of assets. We believe that because of our in-depthmarket knowledge and development experience in each of our markets, our national reputation withbrokers, financial institutions and others involved in the real estate market and our access tocompetitively-priced capital, we are well-positioned to identify and acquire existing, underperformingproperties for competitive prices and to add significant additional value to such properties through our
7

effective marketing strategies and a responsive property management program. We have developed thisstrategy and program for our existing portfolio, where we provide high-quality property managementservices using our own employees in order to encourage tenants to renew, expand and relocate in ourproperties. We are able to achieve speed and transaction cost efficiency in replacing departing tenantsthrough the use of in-house and third-party vendors’ services for marketing, including calls andpresentations to prospective tenants, print advertisements, lease negotiation and construction of tenantimprovements. Our tenants benefit from cost efficiencies produced by our experienced work force,which is attentive to preventive maintenance and energy management.
• The continued inflow of capital into well located well leased Class A office properties like ours makesthe acquisition environment increasingly competitive. We continue to explore opportunities and willmaintain our core underwriting and discipline.
Internal Growth
We believe that significant opportunities will exist to increase cash flow from our existing properties becausethey are of high quality and in desirable locations. In addition, our properties are in markets where, in general, thecreation of new supply is limited by the lack of available sites, the difficulty of receiving the necessary approvals fordevelopment on vacant land and the difficulty of obtaining financing. Our strategy for maximizing the benefits fromthese opportunities is three-fold: (1) to provide high-quality property management services using our employees inorder to encourage tenants to renew, expand and relocate in our properties, and (2) to achieve speed and transactioncost efficiency in replacing departing tenants through the use of in-house services for marketing, lease negotiationand construction of tenant improvements and (3) work with new or existing tenants with space expansion andcontraction maximizing the cash flow from our assets. We believe that with the continued improvement of theeconomy, our office properties will add to our internal growth because of their desirable locations. In addition, webelieve that with the continued improvement in the business and leisure travel sector, our two hotel properties willcontinue to add to our internal growth because of their desirable locations in the downtown Boston and EastCambridge submarkets. We expect to continue our internal growth as a result of our ability to:
• Cultivate existing submarkets and long-term relationships with credit tenants. In choosing locations forour properties, we have paid particular attention to transportation and commuting patterns, physicalenvironment, adjacency to established business centers, proximity to sources of business growth andother local factors.
We had an average lease term of 7.8 years at December 31, 2006 and continue to cultivate long-termleasing relationships with a diverse base of high quality, financially stable tenants. Based on leases inplace at December 31, 2006, leases with respect to 5.3% of the total square feet from our Class A officeproperties will expire in calendar year 2007.
• Directly manage properties to maximize the potential for tenant retention. We provide propertymanagement services ourselves, rather than contracting for this service, to maintain awareness of andresponsiveness to tenant needs. We and our properties also benefit from cost efficiencies produced by anexperienced work force attentive to preventive maintenance and energy management and from ourcontinuing programs to assure that our property management personnel at all levels remain aware oftheir important role in tenant relations.
• Replace tenants quickly at best available market terms and lowest possible transaction costs. Webelieve that we are well-positioned to attract new tenants and achieve relatively high rental rates as aresult of our well-located, well-designed and well-maintained properties, our reputation for high-qualitybuilding services and responsiveness to tenants, and our ability to offer expansion and relocationalternatives within our submarkets.
• Extend terms of existing leases to existing tenants prior to expiration. We have also successfullystructured early tenant renewals, which have reduced the cost associated with lease downtime whilesecuring the tenancy of our highest quality credit-worthy tenants on a long-term basis and enhancingrelationships.
8

Policies with Respect to Certain Activities
The discussion below sets forth certain additional information regarding our investment, financing and otherpolicies. These policies have been determined by our Board of Directors and, in general, may be amended orrevised from time to time by our Board of Directors.
Investment Policies
Investments in Real Estate or Interests in Real Estate
Our investment objectives are to provide quarterly cash dividends to our securityholders and to achievelong-term capital appreciation through increases in the value of Boston Properties, Inc. We have not established aspecific policy regarding the relative priority of these investment objectives.
We expect to continue to pursue our investment objectives primarily through the ownership of our currentproperties, development projects and other acquired properties. We currently intend to continue to investprimarily in developments of properties and acquisitions of existing improved properties or properties in need ofredevelopment, and acquisitions of land that we believe have development potential, primarily in our markets—Boston, Washington, D.C., midtown Manhattan, San Francisco and Princeton, NJ. Future investment ordevelopment activities will not be limited to a specified percentage of our assets. We intend to engage in suchfuture investment or development activities in a manner that is consistent with the maintenance of our status as aREIT for federal income tax purposes. In addition, we may purchase or lease income-producing commercial andother types of properties for long-term investment, expand and improve the real estate presently owned or otherproperties purchased, or sell such real estate properties, in whole or in part, when circumstances warrant. We donot have a policy that restricts the amount or percentage of assets that will be invested in any specific property,however, our investments may be restricted by our debt covenants.
We may also continue to participate with third parties in property ownership, through joint ventures or othertypes of co-ownership, including third parties with expertise in mixed-used opportunities. These investments maypermit us to own interests in larger assets without unduly restricting diversification and, therefore, add flexibilityin structuring our portfolio.
Equity investments may be subject to existing mortgage financing and other indebtedness or such financingor indebtedness as may be incurred in connection with acquiring or refinancing these investments. Debt serviceon such financing or indebtedness will have a priority over any distributions with respect to our common stock.Investments are also subject to our policy not to be treated as an investment company under the InvestmentCompany Act of 1940, as amended (the “1940 Act”).
Investments in Real Estate Mortgages
While our current portfolio consists of, and our business objectives emphasize, equity investments incommercial real estate, we may, at the discretion of the Board of Directors, invest in mortgages and other typesof real estate interests consistent with our qualification as a REIT. Investments in real estate mortgages run therisk that one or more borrowers may default under such mortgages and that the collateral securing suchmortgages may not be sufficient to enable us to recoup its full investment. We do not presently intend to invest inmortgages or deeds of trust, but may invest in participating or convertible mortgages if we conclude that we maybenefit from the cash flow or any appreciation in value of the property.
Securities of or Interests in Persons Primarily Engaged in Real Estate Activities
Subject to the percentage of ownership limitations and gross income tests necessary for our REITqualification, we also may invest in securities of other REITs, other entities engaged in real estate activities orsecurities of other issuers, including for the purpose of exercising control over such entities.
9

Dispositions
Our disposition of properties is based upon the periodic review of our portfolio and the determination by theBoard of Directors that such action would be in our best interests. Any decision to dispose of a property will beauthorized by the Board of Directors or a committee thereof. Some holders of limited partnership interests inBPLP, including Messrs. Mortimer B. Zuckerman, Edward H. Linde and other executive officers, would incuradverse tax consequences upon the sale of certain of our properties that differ from the tax consequences to us.Consequently, holders of limited partnership interests in BPLP may have different objectives regarding theappropriate pricing and timing of any such sale. Such different tax treatment derives in most cases from the factthat we acquired these properties in exchange for partnership interests in contribution transactions structured toallow the prior owners to defer taxable gain. Generally this deferral continues so long as we do not dispose of theproperties in a taxable transaction. Unless a sale by us of these properties is structured as a like-kind exchange orin a manner that otherwise allows deferral to continue, recognition of the deferred tax gain allocable to theseprior owners is generally triggered by the sale. Some of our assets are subject to tax protection agreements, whichmay limit our ability to dispose of the assets or require us to pay damages to the prior owners in the event of ataxable sale.
Financing Policies
The agreement of limited partnership of BPLP and our certificate of incorporation and bylaws do not limitthe amount or percentage of indebtedness that we may incur. We do not have a policy limiting the amount ofindebtedness that we may incur. However, our mortgages, credit facilities and unsecured debt securities containcustomary restrictions, requirements and other limitations on our ability to incur indebtedness. We have notestablished any limit on the number or amount of mortgages that may be placed on any single property or on ourportfolio as a whole.
Our Board of Directors will consider a number of factors when evaluating our level of indebtedness andwhen making decisions regarding the incurrence of indebtedness, including the purchase price of properties to beacquired with debt financing, the estimated market value of our properties upon refinancing, the entering intoagreements such as interest rate swaps, caps, floors and other interest rate hedging contracts and the ability ofparticular properties and BPLP as a whole to generate cash flow to cover expected debt service.
Policies with Respect to Other Activities
As the sole general partner of BPLP, we have the authority to issue additional common and preferred unitsof limited partnership interest of BPLP. We have in the past, and may in the future, issue common or preferredunits of limited partnership interest of BPLP to persons who contribute their direct or indirect interests inproperties to us in exchange for such common or preferred units of limited partnership interest in BPLP. We havenot engaged in trading, underwriting or agency distribution or sale of securities of issuers other than BPLP andwe do not intend to do so. At all times, we intend to make investments in such a manner as to maintain ourqualification as a REIT, unless because of circumstances or changes in the Internal Revenue Code of 1986, asamended (or the Treasury Regulations), our Board of Directors determines that it is no longer in our best interestto qualify as a REIT. We may make loans to third parties, including, without limitation, to joint ventures inwhich we participate. We intend to make investments in such a way that we will not be treated as an investmentcompany under the 1940 Act. Our policies with respect to these and other activities may be reviewed andmodified or amended from time to time by the Board of Directors.
10
Energy Conservation
As one of the largest owners and developers of office properties in the United States, we strive to controlour energy consumption through active management at our properties. On an annual basis, our property managersidentify capital improvement projects and building systems enhancements that have the potential to reduce theuse of energy at each property. The identified projects and enhancements are then reviewed with seniormanagement, and the projects and enhancements that offer material energy savings and meet our investmentcriteria are then implemented.
Over the past several years, we have implemented numerous improvement projects and systemenhancements, including, without limitation, the following:
• installation of higher efficiency lighting in public spaces, garages, stairways and elevators;
• installation of new, high-efficiency motors, air compressors, chillers and other heating, ventilation andair conditioning system components;
• replacing energy management systems;
• installation of solar reflective window film to reduce solar heat gain, glare and ultraviolet radiation;
• modernizing cooling towers with high-efficiency fill and distribution pans; and
• adding wall and ceiling insulation to reduce thermal losses.
In addition to the physical improvements and systems enhancements described above, our propertymanagers also benchmark building energy consumption with the goal of optimizing equipment use and operation,provide training for our property management staff and strive to make our tenants more aware of energy codesand energy saving opportunities. These management initiatives are intended to not only help reduce energyconsumption in the short term, but also heighten awareness of the issue to help ensure energy efficiency over thelong term.
We believe our efforts described above have led to a meaningful reduction in the number of kilowatt-hours(“kWh”) used in the operation of our properties and a reduction in our operating expenses. We estimate that theefforts we have undertaken since 2001 have reduced the amount of electrical usage throughout our portfolio bymore than 30 million kWh per year. These efforts have also been recognized by third parties as we have achievedthe Environmental Protection Agency’s Energy Star® designation at several of our buildings and have earnedenergy conservation awards and recognition at properties located throughout our portfolio.
In addition to the efforts described above, we participate in utility rebate programs when making significantcapital improvements and, when economically practicable, we subscribe to long-term, fixed utility contracts on aregional basis.
On an annual basis, we intend to continue to explore ways of reducing our energy consumption, and relatedexpenses, across our portfolio.
Environmentally Sound Development
“Green” buildings are designed, constructed, and operated to provide greater environmental, economic,health and productivity performance than conventional buildings. As a developer, we participate in the U.S.Green Building Council’s Leadership in Energy and Environmental Design (LEED) program. The LEED GreenBuilding Rating System® is a voluntary, consensus-based national standard of design guidelines for high-performance, sustainable “Green” buildings. The USGBC’s LEED certification follows a rigorous registrationprocess which evaluates and gives Certified, Silver, Gold, and Platinum ratings to green buildings. We currentlyhave LEED registered projects under development in both our Boston and Washington, D.C. markets.
11

Many of the local jurisdictions in which we operate and develop buildings are also making efforts topromote environmentally sound developments by adopting aspects of the LEED program. As a result, we intendto continue to be proactive in evaluating each new development to determine whether it is physically practicaland economically feasible to produce a LEED certified building.
Competition
We compete in the leasing of office space with a considerable number of other real estate companies, someof which may have greater marketing and financial resources than are available to us. In addition, our hotelproperties compete for guests with other hotels, some of which may have greater marketing and financialresources than are available to us and to the manager of our hotels, Marriott International, Inc.
Principal factors of competition in our primary business of owning, acquiring and developing officeproperties are the quality of properties, leasing terms (including rent and other charges and allowances for tenantimprovements), attractiveness and convenience of location, the quality and breadth of tenant services provided,and reputation as an owner and operator of quality office properties in the relevant market. Additionally, ourability to compete depends upon, among other factors, trends of the national and local economies, investmentalternatives, financial condition and operating results of current and prospective tenants, availability and cost ofcapital, construction and renovation costs, taxes, utilities, governmental regulations, legislation and populationtrends.
The Hotel Properties
We operate our two hotel properties through a taxable REIT subsidiary (“TRS”). The TRS, a wholly-ownedsubsidiary of BPLP, is the lessee pursuant to leases for each of the hotel properties. As lessor, BPLP is entitled toa percentage of gross receipts from the hotel properties. The hotel leases allow all the economic benefits ofownership to flow to us. Marriott International, Inc. continues to manage the hotel properties under the Marriottname and under terms of the existing management agreements. Marriott has been engaged under separate long-term incentive management agreements to operate and manage each of the hotels on behalf of the TRS. Inconnection with these arrangements, Marriott has agreed to operate and maintain the hotels in accordance with itssystem-wide standard for comparable hotels and to provide the hotels with the benefits of its central reservationsystem and other chain-wide programs and services. Under a separate management agreement for each hotel,Marriott acts as the TRS’ agent to supervise, direct and control the management and operation of the hotel andreceives as compensation base management fees that are calculated as a percentage of the hotel’s gross revenues,and supplemental incentive fees if the hotel exceeds negotiated profitability breakpoints. In addition, the TRScompensates Marriott, on the basis of a formula applied to the hotel’s gross revenues, for certain system-wideservices provided by Marriott, including central reservations, marketing and training. During 2006, 2005 and2004, Marriott received an aggregate of approximately $4.7 million, $4.2 million and $4.0 million, respectively,under the management agreements.
Seasonality
Our hotel properties traditionally have experienced significant seasonality in their operating income, withthe percentage of net operating income by quarter over the year ended December 31, 2006 shown below.
First Quarter Second Quarter Third Quarter Fourth Quarter
4% 32% 28% 36%
Corporate Governance
Boston Properties is currently managed by a ten member Board of Directors, which is divided into threeclasses (Class I, Class II and Class III). Our Board of Directors is currently composed of three Class I directors
12
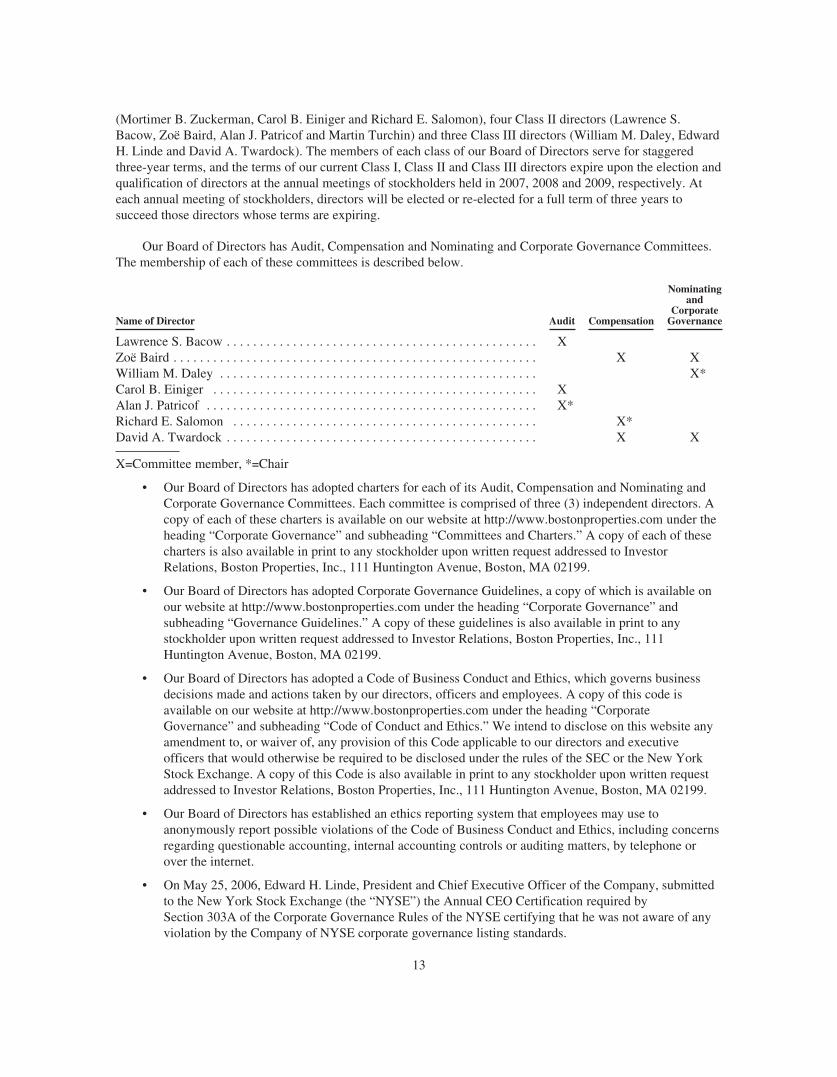
(Mortimer B. Zuckerman, Carol B. Einiger and Richard E. Salomon), four Class II directors (Lawrence S.Bacow, Zoë Baird, Alan J. Patricof and Martin Turchin) and three Class III directors (William M. Daley, EdwardH. Linde and David A. Twardock). The members of each class of our Board of Directors serve for staggeredthree-year terms, and the terms of our current Class I, Class II and Class III directors expire upon the election andqualification of directors at the annual meetings of stockholders held in 2007, 2008 and 2009, respectively. Ateach annual meeting of stockholders, directors will be elected or re-elected for a full term of three years tosucceed those directors whose terms are expiring.
Our Board of Directors has Audit, Compensation and Nominating and Corporate Governance Committees.The membership of each of these committees is described below.
Name of Director Audit Compensation
Nominatingand
CorporateGovernance
Lawrence S. Bacow . . . . . . . . . . . . . . . . . . . . . . . . . . . . . . . . . . . . . . . . . . . . . . . XZoë Baird . . . . . . . . . . . . . . . . . . . . . . . . . . . . . . . . . . . . . . . . . . . . . . . . . . . . . . . X XWilliam M. Daley . . . . . . . . . . . . . . . . . . . . . . . . . . . . . . . . . . . . . . . . . . . . . . . . X*Carol B. Einiger . . . . . . . . . . . . . . . . . . . . . . . . . . . . . . . . . . . . . . . . . . . . . . . . . XAlan J. Patricof . . . . . . . . . . . . . . . . . . . . . . . . . . . . . . . . . . . . . . . . . . . . . . . . . . X*Richard E. Salomon . . . . . . . . . . . . . . . . . . . . . . . . . . . . . . . . . . . . . . . . . . . . . . X*David A. Twardock . . . . . . . . . . . . . . . . . . . . . . . . . . . . . . . . . . . . . . . . . . . . . . . X X
X=Committee member, *=Chair
• Our Board of Directors has adopted charters for each of its Audit, Compensation and Nominating andCorporate Governance Committees. Each committee is comprised of three (3) independent directors. Acopy of each of these charters is available on our website at http://www.bostonproperties.com under theheading “Corporate Governance” and subheading “Committees and Charters.” A copy of each of thesecharters is also available in print to any stockholder upon written request addressed to InvestorRelations, Boston Properties, Inc., 111 Huntington Avenue, Boston, MA 02199.
• Our Board of Directors has adopted Corporate Governance Guidelines, a copy of which is available onour website at http://www.bostonproperties.com under the heading “Corporate Governance” andsubheading “Governance Guidelines.” A copy of these guidelines is also available in print to anystockholder upon written request addressed to Investor Relations, Boston Properties, Inc., 111Huntington Avenue, Boston, MA 02199.
• Our Board of Directors has adopted a Code of Business Conduct and Ethics, which governs businessdecisions made and actions taken by our directors, officers and employees. A copy of this code isavailable on our website at http://www.bostonproperties.com under the heading “CorporateGovernance” and subheading “Code of Conduct and Ethics.” We intend to disclose on this website anyamendment to, or waiver of, any provision of this Code applicable to our directors and executiveofficers that would otherwise be required to be disclosed under the rules of the SEC or the New YorkStock Exchange. A copy of this Code is also available in print to any stockholder upon written requestaddressed to Investor Relations, Boston Properties, Inc., 111 Huntington Avenue, Boston, MA 02199.
• Our Board of Directors has established an ethics reporting system that employees may use toanonymously report possible violations of the Code of Business Conduct and Ethics, including concernsregarding questionable accounting, internal accounting controls or auditing matters, by telephone orover the internet.
• On May 25, 2006, Edward H. Linde, President and Chief Executive Officer of the Company, submittedto the New York Stock Exchange (the “NYSE”) the Annual CEO Certification required bySection 303A of the Corporate Governance Rules of the NYSE certifying that he was not aware of anyviolation by the Company of NYSE corporate governance listing standards.
13

Item 1A. Risk Factors.
Set forth below are the risks that we believe are material to our investors. We refer to the shares of ourcommon stock and the units of limited partnership interest in BPLP together as our “securities,” and theinvestors who own shares or units, or both, as our “securityholders.” This section contains forward-lookingstatements. You should refer to the explanation of the qualifications and limitations on forward-lookingstatements beginning on page 38.
Our performance and value are subject to risks associated with our real estate assets and with the real estateindustry.
Our economic performance and the value of our real estate assets, and consequently the value of oursecurities, are subject to the risk that if our office and hotel properties do not generate revenues sufficient to meetour operating expenses, including debt service and capital expenditures, our cash flow and ability to paydistributions to our securityholders will be adversely affected. The following factors, among others, mayadversely affect the income generated by our office and hotel properties:
• downturns in the national, regional and local economic conditions (particularly increases inunemployment);
• competition from other office, hotel and commercial buildings;
• local real estate market conditions, such as oversupply or reduction in demand for office, hotel or othercommercial space;
• changes in interest rates and availability of attractive financing;
• vacancies, changes in market rental rates and the need to periodically repair, renovate and re-let space;
• increased operating costs, including insurance expense, utilities, real estate taxes, state and local taxesand heightened security costs;
• civil disturbances, earthquakes and other natural disasters, or terrorist acts or acts of war which mayresult in uninsured or underinsured losses;
• significant expenditures associated with each investment, such as debt service payments, real estatetaxes, insurance and maintenance costs which are generally not reduced when circumstances cause areduction in revenues from a property;
• declines in the financial condition of our tenants and our ability to collect rents from our tenants; and
• decreases in the underlying value of our real estate.
We are dependent upon the economic climates of our markets—Boston, Washington, D.C., midtownManhattan, San Francisco and Princeton, NJ
Substantially all of our revenue is derived from properties located in five markets: Boston, Washington,D.C., midtown Manhattan, San Francisco and Princeton, NJ. A downturn in the economies of these markets, orthe impact that a downturn in the overall national economy may have upon these economies, could result inreduced demand for office space. Because our portfolio consists primarily of office buildings (as compared to amore diversified real estate portfolio), a decrease in demand for office space in turn could adversely affect ourresults of operations. Additionally, there are submarkets within our markets that are dependent upon a limitednumber of industries. For example, in our Washington, D.C. market we focus on leasing office properties togovernmental agencies and contractors, as well as legal firms. In our midtown Manhattan market we havehistorically leased properties to financial, legal and other professional firms. A significant downturn in one ormore of these sectors could adversely affect our results of operations.
14
Our investment in property development may be more costly than anticipated.
We intend to continue to develop and substantially renovate office properties. Our current and futuredevelopment and construction activities may be exposed to the following risks:
• we may be unable to proceed with the development of properties because we cannot obtain financing onfavorable terms or at all;
• we may incur construction costs for a development project which exceed our original estimates due toincreases in interest rates and increased materials, labor, leasing or other costs, which could makecompletion of the project less profitable because market rents may not increase sufficiently tocompensate for the increase in construction costs;
• we may be unable to obtain, or face delays in obtaining, required zoning, land-use, building, occupancy,and other governmental permits and authorizations, which could result in increased costs and couldrequire us to abandon our activities entirely with respect to a project;
• we may abandon development opportunities after we begin to explore them and as a result we may losedeposits or fail to recover expenses already incurred;
• we may expend funds on and devote management’s time to projects which we do not complete; and
• we may be unable to complete construction and/or leasing of a property on schedule.
Investment returns from our developed properties may be lower than anticipated.
Our developed properties may be exposed to the following risks:
• we may lease developed properties at rental rates that are less than the rates projected at the time wedecide to undertake the development; and
• occupancy rates and rents at newly developed properties may fluctuate depending on a number offactors, including market and economic conditions, and may result in our investments being lessprofitable than we expected or not profitable at all.
Our use of joint ventures may limit our flexibility with jointly owned investments.
In appropriate circumstances, we intend to develop and acquire properties in joint ventures with otherpersons or entities when circumstances warrant the use of these structures. We currently have eight joint venturesthat are not consolidated with our financial statements. Our share of the aggregate revenue of these joint venturesrepresented approximately 2.7% of our total revenue (the sum of our total consolidated revenue and our share ofsuch joint venture revenue) for the year ended December 31, 2006. Our participation in joint ventures is subjectto the risks that:
• we could become engaged in a dispute with any of our joint venture partners that might affect our abilityto develop or operate a property;
• our joint venture partners may have different objectives than we have regarding the appropriate timingand terms of any sale or refinancing of properties; and
• our joint venture partners may have competing interests in our markets that could create conflict ofinterest issues.
We face risks associated with property acquisitions.
We have acquired in the past and intend to continue to pursue the acquisition of properties and portfolios ofproperties, including large portfolios that could increase our size and result in alterations to our capital structure.Our acquisition activities and their success are subject to the following risks:
• even if we enter into an acquisition agreement for a property, we may be unable to complete thatacquisition after making a non-refundable deposit and incurring certain other acquisition-related costs;
15
• we may be unable to obtain financing for acquisitions on favorable terms or at all;
• acquired properties may fail to perform as expected;
• the actual costs of repositioning or redeveloping acquired properties may be greater than our estimates;
• the acquisition agreement will likely contain conditions to closing, including completion of duediligence investigations to our satisfaction or other conditions that are not within our control, which maynot be satisfied;
• acquired properties may be located in new markets where we may face risks associated with a lack ofmarket knowledge or understanding of the local economy, lack of business relationships in the area andunfamiliarity with local governmental and permitting procedures; and
• we may be unable to quickly and efficiently integrate new acquisitions, particularly acquisitions ofportfolios of properties, into our existing operations, and this could have an adverse effect on our resultsof operations and financial condition.
We have acquired in the past and in the future may acquire properties or portfolios of properties through taxdeferred contribution transactions in exchange for partnership interests in BPLP. This acquisition structure hasthe effect, among others, of reducing the amount of tax depreciation we can deduct over the tax life of theacquired properties, and typically requires that we agree to protect the contributors’ ability to defer recognition oftaxable gain through restrictions on our ability to dispose of the acquired properties and/or the allocation ofpartnership debt to the contributors to maintain their tax bases. These restrictions on dispositions could limit ourability to sell an asset at a time, or on terms, that would be favorable absent such restrictions.
Acquired properties may expose us to unknown liability.
We may acquire properties subject to liabilities and without any recourse, or with only limited recourseagainst the prior owners or other third parties, with respect to unknown liabilities. As a result, if a liability wereasserted against us based upon ownership of those properties, we might have to pay substantial sums to settle orcontest it, which could adversely affect our results of operations and cash flow. Unknown liabilities with respectto acquired properties might include:
• liabilities for clean-up of undisclosed environmental contamination;
• claims by tenants, vendors or other persons against the former owners of the properties;
• liabilities incurred in the ordinary course of business; and
• claims for indemnification by general partners, directors, officers and others indemnified by the formerowners of the properties.
Competition for acquisitions may result in increased prices for properties.
We plan to continue to acquire properties as we are presented with attractive opportunities. We may facecompetition for acquisition opportunities with other investors, particularly private investors who can incur moreleverage, and this competition may adversely affect us by subjecting us to the following risks:
• we may be unable to acquire a desired property because of competition from other well-capitalized realestate investors, including publicly traded and private REITs, institutional investment funds and otherreal estate investors; and
• even if we are able to acquire a desired property, competition from other real estate investors maysignificantly increase the purchase price.
We face potential difficulties or delays renewing leases or re-leasing space.
We derive most of our income from rent received from our tenants. If a tenant experiences a downturn in itsbusiness or other types of financial distress, it may be unable to make timely rental payments. Also, when our
16
tenants decide not to renew their leases or terminate early, we may not be able to re-let the space. Even if tenantsdecide to renew or lease new space, the terms of renewals or new leases, including the cost of requiredrenovations or concessions to tenants, may be less favorable to us than current lease terms. As a result, our cashflow could decrease and our ability to make distributions to our securityholders could be adversely affected.
We face potential adverse effects from major tenants’ bankruptcies or insolvencies.
The bankruptcy or insolvency of a major tenant may adversely affect the income produced by ourproperties. Our tenants could file for bankruptcy protection or become insolvent in the future. We cannot evict atenant solely because of its bankruptcy. On the other hand, a bankrupt tenant may reject and terminate its leasewith us. In such case, our claim against the bankrupt tenant for unpaid and future rent would be subject to astatutory cap that might be substantially less than the remaining rent actually owed under the lease, and, even so,our claim for unpaid rent would likely not be paid in full. This shortfall could adversely affect our cash flow andresults of operations.
We face risks associated with our Tenants being designated “Prohibited Persons” by the Office of ForeignAssets Control.
Pursuant to Executive Order 13224 and other laws, the Office of Foreign Assets Control of the United StatesDepartment of the Treasury (“OFAC”) maintains a list of persons designated as terrorists or who are otherwiseblocked or banned (“Prohibited Persons”). OFAC regulations and other laws prohibit conducting business orengaging in transactions with Prohibited Persons (the “OFAC Requirements”). Certain of our loan and otheragreements require us to comply with OFAC Requirements. We have established a compliance program wherebytenants and others with whom we conduct business are checked against the OFAC list of Prohibited Persons prior toentering into any agreement and on a periodic basis thereafter. Our leases and other agreements require the otherparty to comply with OFAC Requirements. If a tenant or other party with whom we contract is placed on the OFAClist we may be required by the OFAC Requirements to terminate the lease or other agreement. Any such terminationcould result in a loss of revenue or a damage claim by the other party that the termination was wrongful.
We may have difficulty selling our properties, which may limit our flexibility.
Large and high-quality office and hotel properties like the ones that we own could be difficult to sell. Thismay limit our ability to change our portfolio promptly in response to changes in economic or other conditions. Inaddition, federal tax laws limit our ability to sell properties and this may affect our ability to sell propertieswithout adversely affecting returns to our securityholders. These restrictions reduce our ability to respond tochanges in the performance of our investments and could adversely affect our financial condition and results ofoperations.
Our ability to dispose of some of our properties is constrained by their tax attributes. Properties which wedeveloped and have owned for a significant period of time or which we acquired through tax deferredcontribution transactions in exchange for partnership interests in BPLP often have low tax bases. If we dispose ofthese properties outright in taxable transactions, we may be required to distribute a significant amount of thetaxable gain to our securityholders under the requirements of the Internal Revenue Code for REITs, which in turnwould impact our cash flow and increase our leverage. In some cases, without incurring additional costs we maybe restricted from disposing of properties contributed in exchange for our partnership interests under taxprotection agreements with contributors. To dispose of low basis or tax-protected properties efficiently we fromtime to time use like-kind exchanges, which qualify for non-recognition of taxable gain, but can be difficult toconsummate and result in the property for which the disposed assets are exchanged inheriting their low tax basesand other tax attributes (including tax protection covenants).
Our properties face significant competition.
We face significant competition from developers, owners and operators of office properties and othercommercial real estate, including sublease space available from our tenants. Substantially all of our properties
17
face competition from similar properties in the same market. This competition may affect our ability to attractand retain tenants and may reduce the rents we are able to charge. These competing properties may have vacancyrates higher than our properties, which may result in their owners being willing to lease available space at lowerrates than the space in our properties.
Because we own two hotel properties, we face the risks associated with the hospitality industry.
Because the lease payments we receive under the hotel leases are based on a participation in the grossreceipts of the hotels, if the hotels do not generate sufficient receipts, our cash flow would be decreased, whichcould reduce the amount of cash available for distribution to our securityholders. The following factors, amongothers, are common to the hotel industry, and may reduce the receipts generated by our hotel properties:
• our hotel properties compete for guests with other hotels, a number of which have greater marketing andfinancial resources than our hotel-operating business partners;
• if there is an increase in operating costs resulting from inflation and other factors, our hotel-operatingbusiness partners may not be able to offset such increase by increasing room rates;
• our hotel properties are subject to the fluctuating and seasonal demands of business travelers andtourism; and
• our hotel properties are subject to general and local economic and social conditions that may affectdemand for travel in general, including war and terrorism.
In addition, because our hotel properties are located within two miles of each other in downtown Boston andCambridge, they are subject to the Boston market’s fluctuations in demand, increases in operating costs andincreased competition from additions in supply.
Because of the ownership structure of our two hotel properties, we face potential adverse effects from changesto the applicable tax laws.
We own two hotel properties. However, under the Internal Revenue Code, REITs like us are not allowed tooperate hotels directly or indirectly. Accordingly, we lease our hotel properties to one of our taxable REITsubsidiaries, or TRS. As lessor, we are entitled to a percentage of the gross receipts from the operation of thehotel properties. Marriott International, Inc. manages the hotels under the Marriott name pursuant to amanagement contract with the TRS as lessee. While the TRS structure allows the economic benefits of ownershipto flow to us, the TRS is subject to tax on its income from the operations of the hotels at the federal and statelevel. In addition, the TRS is subject to detailed tax regulations that affect how it may be capitalized andoperated. If the tax laws applicable to TRSs are modified, we may be forced to modify the structure for owningour hotel properties, and such changes may adversely affect the cash flows from our hotels. In addition, theInternal Revenue Service, the United States Treasury Department and Congress frequently review federal incometax legislation, and we cannot predict whether, when or to what extent new federal tax laws, regulations,interpretations or rulings will be adopted. Any of such actions may prospectively or retroactively modify the taxtreatment of the TRS and, therefore, may adversely affect our after-tax returns from our hotel properties.
Compliance or failure to comply with the Americans with Disabilities Act or other safety regulations andrequirements could result in substantial costs.
The Americans with Disabilities Act generally requires that public buildings, including office buildings andhotels, be made accessible to disabled persons. Noncompliance could result in the imposition of fines by thefederal government or the award of damages to private litigants. If, under the Americans with Disabilities Act,we are required to make substantial alterations and capital expenditures in one or more of our properties,including the removal of access barriers, it could adversely affect our financial condition and results ofoperations, as well as the amount of cash available for distribution to our securityholders.
18
Our properties are subject to various federal, state and local regulatory requirements, such as state and localfire and life safety requirements. If we fail to comply with these requirements, we could incur fines or privatedamage awards. We do not know whether existing requirements will change or whether compliance with futurerequirements will require significant unanticipated expenditures that will affect our cash flow and results ofoperations.
Some potential losses are not covered by insurance.
We carry insurance coverage on our properties of types and in amounts and with deductibles that we believeare in line with coverage customarily obtained by owners of similar properties. In response to the uncertainty inthe insurance market following the terrorist attacks of September 11, 2001, the Federal Terrorism Risk InsuranceAct, or TRIA, was enacted in November 2002 to require regulated insurers to make available coverage forcertified acts of terrorism (as defined by the statute) through December 31, 2004, which date was extended toDecember 31, 2005 by the United States Department of Treasury on June 18, 2004 and which date was furtherextended to December 31, 2007 by the Terrorism Risk Insurance Extension Act of 2005 (the “TRIA ExtensionAct”). TRIA expires on December 31, 2007, and we cannot currently anticipate whether it will be extended.Effective as of March 1, 2007, our property insurance program per occurrence limits were increased from $800million to $900 million, including coverage for “certified” acts of terrorism by TRIA and coverage for “non-certified” acts of terrorism by TRIA up to $500 million per occurrence, and an additional $400 million ofcoverage for “non-certified” acts of terrorism by TRIA on a per occurrence and annual aggregate basis. We alsocarry nuclear, biological, chemical and radiological terrorism insurance coverage (“NBCR Coverage”) for“certified” acts of terrorism as defined by TRIA, which is provided by IXP, LLC as a direct insurer. Effective asof March 1, 2007, we extended the NBCR Coverage to March 1, 2008, excluding our Value-Added Fundproperties. Effective as of March 1, 2007, the per occurrence limit for NBCR Coverage was increased from $800million to $900 million. Under TRIA, after the payment of the required deductible and coinsurance the NBCRCoverage is backstopped by the Federal Government if the aggregate industry insured losses resulting from acertified act of terrorism exceed a “program trigger.” Under the TRIA Extension Act (a) the program trigger is $5million through March 31, 2006, $50 million from April 1, 2006 through December 31, 2006 and $100 millionfrom January 1, 2007 through December 31, 2007 and (b) the coinsurance is 10% through December 31, 2006and 15% through December 31, 2007. We may elect to terminate the NBCR Coverage if there is a change in ourportfolio or for any other reason. In the event TRIA is not extended beyond December 31, 2007 (i) the NBCRcoverage provided by IXP will terminate and (ii) we will have some gaps in our coverage for acts of terrorismthat would have constituted both “certified” and “non-certified” acts of terrorism had TRIA not expired and wemay obtain the right to replace a portion of such coverage. We intend to continue to monitor the scope, natureand cost of available terrorism insurance and maintain insurance in amounts and on terms that are commerciallyreasonable.
We also currently carry earthquake insurance on our properties located in areas known to be subject toearthquakes in an amount and subject to self-insurance that we believe are commercially reasonable. In addition,this insurance is subject to a deductible in the amount of 5% of the value of the affected property. Specifically,we currently carry earthquake insurance which covers our San Francisco region with a $120 million peroccurrence limit and a $120 million annual aggregate limit, $20 million of which is provided by IXP, LLC, as adirect insurer. The amount of our earthquake insurance coverage may not be sufficient to cover losses fromearthquakes. We may discontinue earthquake insurance on some or all of our properties in the future if thepremiums exceed our estimation of the value of the coverage.
In January 2002, we formed a wholly-owned taxable REIT subsidiary, IXP, Inc., to act as a captiveinsurance company and be one of the elements of our overall insurance program. On September 27, 2006, IXP,Inc. was merged into IXP, LLC, a wholly owned subsidiary, and all insurance policies issued by IXP, Inc. werecancelled and reissued by IXP, LLC. The term “IXP” refers to IXP, Inc. for the period prior to September 27,2006 and to IXP, LLC for the period on and subsequent to September 27, 2006. IXP acts as a direct insurer withrespect to a portion of our earthquake insurance coverage for our Greater San Francisco properties and our
19

NBCR Coverage for “certified acts of terrorism” under TRIA. Insofar as we own IXP, we are responsible for itsliquidity and capital resources, and the accounts of IXP are part of our consolidated financial statements. Inparticular, if a loss occurs which is covered by our NBCR Coverage but is less than the applicable programtrigger under TRIA, IXP would be responsible for the full amount of the loss without any backstop by theFederal Government. If we experience a loss and IXP is required to pay under our insurance policy, we wouldultimately record the loss to the extent of IXP’s required payment. Therefore, insurance coverage provided byIXP should not be considered as the equivalent of third-party insurance, but rather as a modified form of self-insurance.
We continue to monitor the state of the insurance market in general, and the scope and costs of coverage foracts of terrorism in particular, but we cannot anticipate what coverage will be available on commerciallyreasonable terms in future policy years. There are other types of losses, such as from wars or the presence ofmold at our properties, for which we cannot obtain insurance at all or at a reasonable cost. With respect to suchlosses and losses from acts of terrorism, earthquakes or other catastrophic events, if we experience a loss that isuninsured or that exceeds policy limits, we could lose the capital invested in the damaged properties, as well asthe anticipated future revenues from those properties. Depending on the specific circumstances of each affectedproperty, it is possible that we could be liable for mortgage indebtedness or other obligations related to theproperty. Any such loss could materially and adversely affect our business and financial condition and results ofoperations.
Actual or threatened terrorist attacks may adversely affect our ability to generate revenues and the value ofour properties.
We have significant investments in large metropolitan markets that have been or may be in the future thetargets of actual or threatened terrorism attacks, including midtown Manhattan, Washington, D.C., Boston andSan Francisco. As a result, some tenants in these markets may choose to relocate their businesses to othermarkets or to lower-profile office buildings within these markets that may be perceived to be less likely targets offuture terrorist activity. This could result in an overall decrease in the demand for office space in these marketsgenerally or in our properties in particular, which could increase vacancies in our properties or necessitate thatwe lease our properties on less favorable terms or both. In addition, future terrorist attacks in these markets coulddirectly or indirectly damage our properties, both physically and financially, or cause losses that materiallyexceed our insurance coverage. As a result of the foregoing, our ability to generate revenues and the value of ourproperties could decline materially. See also “—Some potential losses are not covered by insurance.”
Potential liability for environmental contamination could result in substantial costs.
Under federal, state and local environmental laws, ordinances and regulations, we may be required toinvestigate and clean up the effects of releases of hazardous or toxic substances or petroleum products at ourproperties simply because of our current or past ownership or operation of the real estate. If unidentifiedenvironmental problems arise, we may have to make substantial payments, which could adversely affect our cashflow and our ability to make distributions to our securityholders, because:
• as owner or operator we may have to pay for property damage and for investigation and clean-up costsincurred in connection with the contamination;
• the law typically imposes clean-up responsibility and liability regardless of whether the owner oroperator knew of or caused the contamination;
• even if more than one person may be responsible for the contamination, each person who shares legalliability under the environmental laws may be held responsible for all of the clean-up costs; and
• governmental entities and third parties may sue the owner or operator of a contaminated site fordamages and costs.
These costs could be substantial and in extreme cases could exceed the amount of our insurance or the valueof the contaminated property. We currently carry environmental insurance in an amount and subject to
20
deductibles that we believe are commercially reasonable. Specifically, we carry a pollution legal liability policywith a $10 million limit per incident and a policy aggregate limit of $25 million. The presence of hazardous ortoxic substances or petroleum products or the failure to properly remediate contamination may materially andadversely affect our ability to borrow against, sell or rent an affected property. In addition, applicableenvironmental laws create liens on contaminated sites in favor of the government for damages and costs it incursin connection with a contamination. Changes in laws increasing the potential liability for environmentalconditions existing at our properties, or increasing the restrictions on the handling, storage or discharge ofhazardous or toxic substances or petroleum products or other actions may result in significant unanticipatedexpenditures.
Environmental laws also govern the presence, maintenance and removal of asbestos. Such laws require thatowners or operators of buildings containing asbestos:
• properly manage and maintain the asbestos;
• notify and train those who may come into contact with asbestos; and
• undertake special precautions, including removal or other abatement, if asbestos would be disturbedduring renovation or demolition of a building.
Such laws may impose fines and penalties on building owners or operators who fail to comply with theserequirements and may allow third parties to seek recovery from owners or operators for personal injuryassociated with exposure to asbestos fibers.
Some of our properties are located in urban and previously developed areas where fill or current or historicindustrial uses of the areas have caused site contamination. It is our policy to retain independent environmentalconsultants to conduct Phase I environmental site assessments and asbestos surveys with respect to ouracquisition of properties. These assessments generally include a visual inspection of the properties and thesurrounding areas, an examination of current and historical uses of the properties and the surrounding areas and areview of relevant state, federal and historical documents, but do not involve invasive techniques such as soil andground water sampling. Where appropriate, on a property-by-property basis, our practice is to have theseconsultants conduct additional testing, including sampling for asbestos, for lead in drinking water, for soilcontamination where underground storage tanks are or were located or where other past site usage creates apotential environmental problem, and for contamination in groundwater. Even though these environmentalassessments are conducted, there is still the risk that:
• the environmental assessments and updates did not identify all potential environmental liabilities;
• a prior owner created a material environmental condition that is not known to us or the independentconsultants preparing the assessments;
• new environmental liabilities have developed since the environmental assessments were conducted; and
• future uses or conditions such as changes in applicable environmental laws and regulations could resultin environmental liability for us.
Inquiries about indoor air quality may necessitate special investigation and, depending on the results,remediation beyond our regular indoor air quality testing and maintenance programs. Indoor air quality issuescan stem from inadequate ventilation, chemical contaminants from indoor or outdoor sources, and biologicalcontaminants such as molds, pollen, viruses and bacteria. Indoor exposure to chemical or biological contaminantsabove certain levels can be alleged to be connected to allergic reactions or other health effects and symptoms insusceptible individuals. If these conditions were to occur at one of our properties, we may need to undertake atargeted remediation program, including without limitation, steps to increase indoor ventilation rates andeliminate sources of contaminants. Such remediation programs could be costly, necessitate the temporaryrelocation of some or all of the property’s tenants or require rehabilitation of the affected property.
21
We face risks associated with the use of debt to fund acquisitions and developments, including refinancingrisk.
We are subject to the risks normally associated with debt financing, including the risk that our cash flowwill be insufficient to meet required payments of principal and interest. We anticipate that only a small portion ofthe principal of our debt will be repaid prior to maturity. Therefore, we are likely to need to refinance at least aportion of our outstanding debt as it matures. There is a risk that we may not be able to refinance existing debt orthat the terms of any refinancing will not be as favorable as the terms of our existing debt. If principal paymentsdue at maturity cannot be refinanced, extended or repaid with proceeds from other sources, such as new equitycapital, our cash flow may not be sufficient to repay all maturing debt in years when significant “balloon”payments come due.
We have agreements with a number of limited partners of BPLP who contributed properties in exchange forpartnership interests that require BPLP to maintain for specified periods of time secured debt on certain of ourassets and/or allocate partnership debt to such limited partners to enable them to continue to defer recognition oftheir taxable gain with respect to the contributed property. These tax protection and debt allocation agreementsmay restrict our ability to repay or refinance debt.
An increase in interest rates would increase our interest costs on variable rate debt and could adversely impactour ability to refinance existing debt or sell assets.
As of December 31, 2006, we had approximately $711 million of indebtedness that bears interest at variablerates, and we may incur more of such indebtedness in the future. Accordingly, if interest rates increase, so willour interest costs, which could adversely affect our cash flow and our ability to pay principal and interest on ourdebt and our ability to make distributions to our securityholders. Further, rising interest rates could limit ourability to refinance existing debt when it matures. In the past, we have entered into interest rate swap agreementsand other interest rate hedging contracts, including interest rate caps and we may in the future enter into similaragreements, including swaps, caps, floors and other interest rate hedging contracts. While these agreements areintended to lessen the impact of rising interest rates on us, they also expose us to the risk that the other parties tothe agreements will not perform, the agreements will be unenforceable and the underlying transactions will failto qualify as highly-effective cash flow hedges under SFAS No. 133, “Accounting for Derivative Instruments andHedging Activities, as amended” (See Note 6 to the Consolidated Financial Statements). In addition, an increasein interest rates could decrease the amount third-parties are willing to pay for our assets, thereby limiting ourability to change our portfolio promptly in response to changes in economic or other conditions.
Covenants in our debt agreements could adversely affect our financial condition.
The mortgages on our properties contain customary covenants such as those that limit our ability, withoutthe prior consent of the lender, to further mortgage the applicable property or to discontinue insurance coverage.Our unsecured credit facility, unsecured debt securities and secured loans contain customary restrictions,requirements and other limitations on our ability to incur indebtedness, including total debt to asset ratios,secured debt to total asset ratios, debt service coverage ratios and minimum ratios of unencumbered assets tounsecured debt, which we must maintain. Our continued ability to borrow under our credit facilities is subject tocompliance with our financial and other covenants. In addition, our failure to comply with such covenants couldcause a default under the applicable debt agreement, and we may then be required to repay such debt with capitalfrom other sources. Under those circumstances, other sources of capital may not be available to us, or beavailable only on unattractive terms. Additionally, in the future our ability to satisfy current or prospectivelenders’ insurance requirements may be adversely affected if lenders generally insist upon greater insurancecoverage against acts of terrorism or losses resulting from earthquakes than is available to us in the marketplaceor on commercially reasonable terms, particularly with regard to terrorism if TRIA is not extended beyondDecember 31, 2007.
We rely on debt financing, including borrowings under our unsecured credit facility, issuances of unsecureddebt securities and debt secured by individual properties, to finance our acquisition and development activities
22
and for working capital. If we are unable to obtain debt financing from these or other sources, or to refinanceexisting indebtedness upon maturity, our financial condition and results of operations would likely be adverselyaffected. If we breach covenants in our debt agreements, the lenders can declare a default and, if the debt issecured, can take possession of the property securing the defaulted loan. In addition, our unsecured debtagreements contain specific cross-default provisions with respect to specified other indebtedness, giving theunsecured lenders the right to declare a default if we are in default under other loans in some circumstances.Defaults under our debt agreements could materially and adversely affect our financial condition and results ofoperations.
Our degree of leverage could limit our ability to obtain additional financing or affect the market price of ourcommon stock or debt securities.
On February 23, 2007, we had approximately $5.5 billion in total indebtedness outstanding on aconsolidated basis (i.e., excluding unconsolidated joint venture debt). Debt to market capitalization ratio, whichmeasures total debt as a percentage of the aggregate of total debt plus the market value of outstanding equitysecurities, is often used by analysts to gauge leverage for equity REITs such as us. Our market value is calculatedusing the price per share of our common stock. Using the closing stock price of $122.65 per share of ourcommon stock of Boston Properties, Inc. on February 23, 2007, multiplied by the sum of (1) the actual aggregatenumber of outstanding common partnership units of BPLP (including common partnership units held by us),(2) the number of common partnership units available upon conversion of all outstanding preferred partnershipunits of BPLP and (3) the number of common units issuable upon conversion of all outstanding LTIP unitsassuming all conditions have been met for conversion of the LTIP units, our debt to total market capitalizationratio was approximately 24.06% as of February 23, 2007.
Our degree of leverage could affect our ability to obtain additional financing for working capital, capitalexpenditures, acquisitions, development or other general corporate purposes. Our senior unsecured debt iscurrently rated investment grade by the three major rating agencies. However, there can be no assurance that wewill be able to maintain this rating, and in the event our senior debt is downgraded from its current rating, wewould likely incur higher borrowing costs and/or difficulty in obtaining additional financing. Our degree ofleverage could also make us more vulnerable to a downturn in business or the economy generally. There is a riskthat changes in our debt to market capitalization ratio, which is in part a function of our stock price, or our ratioof indebtedness to other measures of asset value used by financial analysts may have an adverse effect on themarket price of our equity or debt securities.
Further issuances of equity securities may be dilutive to current securityholders.
The interests of our existing securityholders could be diluted if additional equity securities are issued tofinance future developments, acquisitions, or repay indebtedness. Our ability to execute our business strategydepends on our access to an appropriate blend of debt financing, including unsecured lines of credit and otherforms of secured and unsecured debt, and equity financing, including common and preferred equity.
Failure to qualify as a real estate investment trust would cause us to be taxed as a corporation, which wouldsubstantially reduce funds available for payment of dividends.
If we fail to qualify as a real estate investment trust, or REIT, for federal income tax purposes, we will betaxed as a corporation. We believe that we are organized and qualified as a REIT and intend to operate in amanner that will allow us to continue to qualify as a REIT. However, we cannot assure you that we are qualifiedas such, or that we will remain qualified as such in the future. This is because qualification as a REIT involvesthe application of highly technical and complex provisions of the Internal Revenue Code as to which there areonly limited judicial and administrative interpretations and involves the determination of facts and circumstancesnot entirely within our control. Future legislation, new regulations, administrative interpretations or courtdecisions may significantly change the tax laws or the application of the tax laws with respect to qualification asa REIT for federal income tax purposes or the federal income tax consequences of such qualification.
23

In addition, we currently hold certain of our properties, and the Value-Added Fund holds its properties,through a subsidiary that has elected to be taxed as a REIT and we may in the future determine that it is in ourbest interests to hold one or more of our other properties through one or more subsidiaries that elect to be taxedas REITs. If any of these subsidiaries fails to qualify as a REIT for federal income tax purposes, then we mayalso fail to qualify as a REIT for federal income tax purposes.
If we fail to qualify as a REIT we will face serious tax consequences that will substantially reduce the fundsavailable for payment of dividends for each of the years involved because:
• we would not be allowed a deduction for dividends paid to stockholders in computing our taxableincome and would be subject to federal income tax at regular corporate rates;
• we also could be subject to the federal alternative minimum tax and possibly increased state and localtaxes;
• unless we are entitled to relief under statutory provisions, we could not elect to be subject to tax as aREIT for four taxable years following the year during which we were disqualified; and
• all dividends will be subject to tax as ordinary income to the extent of our current and accumulatedearnings and profits.
In addition, if we fail to qualify as a REIT, we will no longer be required to pay dividends. As a result of allthese factors, our failure to qualify as a REIT could impair our ability to expand our business and raise capital,and it would adversely affect the value of our common stock.
In order to maintain our REIT status, we may be forced to borrow funds during unfavorable marketconditions.
In order to maintain our REIT status, we may need to borrow funds on a short-term basis to meet the REITdistribution requirements, even if the then-prevailing market conditions are not favorable for these borrowings.To qualify as REIT, we generally must distribute to our stockholders at least 90% of our net taxable income eachyear, excluding capital gains. In addition, we will be subject to a 4% nondeductible excise tax on the amount, ifany, by which dividends paid by us in any calendar year are less than the sum of 85% of our ordinary income,95% of our capital gain net income and 100% of our undistributed income from prior years. We may need short-term debt or long-term debt or proceeds from asset sales, creation of joint ventures or sales of common stock tofund required distributions as a result of differences in timing between the actual receipt of income and therecognition of income for federal income tax purposes, or the effect of non-deductible capital expenditures, thecreation of reserves or required debt or amortization payments. The inability of our cash flows to cover ourdistribution requirements could have an adverse impact on our ability to raise short—and long-term debt or sellequity securities in order to fund distributions required to maintain our REIT status.
Limits on changes in control may discourage takeover attempts beneficial to stockholders.
Provisions in our certificate of incorporation and bylaws, our shareholder rights agreement and the limitedpartnership agreement of BPLP, as well as provisions of the Internal Revenue Code and Delaware corporate law,may:
• delay or prevent a change of control over us or a tender offer, even if such action might be beneficial toour stockholders; and
• limit our stockholders’ opportunity to receive a potential premium for their shares of common stockover then-prevailing market prices.
Stock Ownership Limit
To facilitate maintenance of our qualification as a REIT and to otherwise address concerns relating toconcentration of capital stock ownership, our certificate of incorporation generally prohibits ownership, directly,
24

indirectly or beneficially, by any single stockholder of more than 6.6% of the number of outstanding shares of anyclass or series of our common stock. We refer to this limitation as the “ownership limit.” Our board of directors maywaive, in its sole discretion, or modify the ownership limit with respect to one or more persons if it is satisfied thatownership in excess of this limit will not jeopardize our status as a REIT for federal income tax purposes. Inaddition, under our certificate of incorporation each of Mortimer B. Zuckerman and Edward H. Linde, along withtheir respective families and affiliates, as well as, in general, pension plans and mutual funds, may actually andbeneficially own up to 15% of the number of outstanding shares of any class or series of our equity common stock.Shares owned in violation of the ownership limit will be subject to the loss of rights to distributions and voting andother penalties. The ownership limit may have the effect of inhibiting or impeding a change in control.
BPLP’s Partnership Agreement
We have agreed in the limited partnership agreement of BPLP not to engage in specified extraordinarytransactions, including, among others, business combinations, unless limited partners of BPLP other than BostonProperties, Inc. receive, or have the opportunity to receive, either (1) the same consideration for their partnershipinterests as holders of our common stock in the transaction or (2) limited partnership units that, among otherthings, would entitle the holders, upon redemption of these units, to receive shares of common equity of apublicly traded company or the same consideration as holders of our common stock received in the transaction. Ifthese limited partners would not receive such consideration, we cannot engage in the transaction unless limitedpartners holding at least 75% of the common units of limited partnership interest, other than those held by BostonProperties, Inc. or its affiliates, consent to the transaction. In addition, we have agreed in the limited partnershipagreement of BPLP that we will not complete specified extraordinary transactions, including among others,business combinations, in which we receive the approval of our common stockholders unless (1) limited partnersholding at least 75% of the common units of limited partnership interest, other than those held by BostonProperties, Inc. or its affiliates, consent to the transaction or (2) the limited partners of BPLP are also allowed tovote and the transaction would have been approved had these limited partners been able to vote as commonstockholders on the transaction. Therefore, if our common stockholders approve a specified extraordinarytransaction, the partnership agreement requires the following before we can complete the transaction:
• holders of partnership interests in BPLP, including Boston Properties, Inc., must vote on the matter;
• Boston Properties, Inc. must vote its partnership interests in the same proportion as our stockholdersvoted on the transaction; and
• the result of the vote of holders of partnership interests in BPLP must be such that had such vote been avote of stockholders, the business combination would have been approved.
As a result of these provisions, a potential acquirer may be deterred from making an acquisition proposal,and we may be prohibited by contract from engaging in a proposed extraordinary transaction, including aproposed business combination, even though our stockholders approve of the transaction.
Shareholder Rights Plan
We have a shareholder rights plan. Under the terms of this plan, we can in effect prevent a person or groupfrom acquiring more than 15% of the outstanding shares of our common stock because, unless we approve of theacquisition, after the person acquires more than 15% of our outstanding common stock, all other stockholderswill have the right to purchase securities from us at a price that is less than their then fair market value. Thiswould substantially reduce the value and influence of the stock owned by the acquiring person. Our board ofdirectors can prevent the plan from operating by approving the transaction in advance, which gives us significantpower to approve or disapprove of the efforts of a person or group to acquire a large interest in our company.
We may change our policies without obtaining the approval of our stockholders.
Our operating and financial policies, including our policies with respect to acquisitions of real estate,growth, operations, indebtedness, capitalization and dividends, are exclusively determined by our Board ofDirectors. Accordingly, our securityholders do not control these policies.
25

Our success depends on key personnel whose continued service is not guaranteed.
We depend on the efforts of key personnel, particularly Mortimer B. Zuckerman, Chairman of our Board ofDirectors, and Edward H. Linde, our President and Chief Executive Officer. Among the reasons that Messrs.Zuckerman and Linde are important to our success is that each has a national reputation, which attracts businessand investment opportunities and assists us in negotiations with lenders. If we lost their services, ourrelationships with lenders, potential tenants and industry personnel could diminish. Mr. Zuckerman hassubstantial outside business interests that could interfere with his ability to devote his full time to our businessand affairs.
Our three Executive Vice Presidents and five Regional Managers also have strong reputations. Theirreputations aid us in identifying opportunities, having opportunities brought to us, and negotiating with tenantsand build-to-suit prospects. While we believe that we could find replacements for these key personnel, the loss oftheir services could materially and adversely affect our operations because of diminished relationships withlenders, prospective tenants and industry personnel.
Conflicts of interest exist with holders of interests in BPLP.
Sales of properties and repayment of related indebtedness will have different effects on holders of interests inBPLP than on our stockholders.
Some holders of interests in BPLP, including Messrs. Zuckerman and Linde, would incur adverse taxconsequences upon the sale of certain of our properties and on the repayment of related debt which differ fromthe tax consequences to us and our stockholders. Consequently, these holders of partnership interests in BPLPmay have different objectives regarding the appropriate pricing and timing of any such sale or repayment of debt.While we have exclusive authority under the limited partnership agreement of BPLP to determine when torefinance or repay debt or whether, when, and on what terms to sell a property, subject, in the case of certainproperties, to the contractual commitments described below, any such decision would require the approval of ourBoard of Directors. While the Board of Directors has a policy with respect to these matters, as directors andexecutive officers, Messrs. Zuckerman and Linde could exercise their influence in a manner inconsistent with theinterests of some, or a majority, of our stockholders, including in a manner which could prevent completion of asale of a property or the repayment of indebtedness.
Agreement not to sell some properties.
Under the terms of the limited partnership agreement of BPLP, we have agreed not to sell or otherwisetransfer some of our properties, prior to specified dates, in any transaction that would trigger taxable income,without first obtaining the consent of Messrs. Zuckerman and Linde. However, we are not required to obtain theirconsent if, during the applicable period, each of them does not hold at least 30% of his original interests in BPLP,or if those properties are transferred in a nontaxable transaction. In addition, we have entered into similaragreements with respect to other properties that we have acquired in exchange for partnership interests in BPLP.Pursuant to those agreements, we are responsible for the reimbursement of certain tax-related costs to the priorowners if the subject properties are sold in a taxable sale. In general, our obligations to the prior owners arelimited in time and only apply to actual damages suffered. As of December 31, 2006, there were a total of 25wholly-owned properties subject to these restrictions, and those properties are estimated to have accounted forapproximately 32% of our total revenue for the year ended December 31, 2006.
BPLP has also entered into agreements providing prior owners of properties with the right to guaranteespecific amounts of indebtedness and, in the event that the specific indebtedness they guarantee is repaid orreduced, additional and/or substitute indebtedness. These agreements may hinder actions that we may otherwisedesire to take to repay or refinance guaranteed indebtedness because we would be required to make payments tothe beneficiaries of such agreements if we violate these agreements.
26

Messrs. Zuckerman and Linde will continue to engage in other activities.
Messrs. Zuckerman and Linde have a broad and varied range of investment interests. Either one couldacquire an interest in a company which is not currently involved in real estate investment activities but whichmay acquire real property in the future. However, pursuant to each of their employment agreements, Messrs.Zuckerman and Linde will not, in general, have management control over such companies and, therefore, theymay not be able to prevent one or more of such companies from engaging in activities that are in competitionwith our activities.
Changes in market conditions could adversely affect the market price of our common stock.
As with other publicly traded equity securities, the value of our common stock depends on various marketconditions that may change from time to time. Among the market conditions that may affect the value of ourcommon stock are the following:
• the extent of investor interest in our securities;• the general reputation of REITs and the attractiveness of our equity securities in comparison to other
equity securities, including securities issued by other real estate-based companies;
• our underlying asset value;
• investor confidence in the stock and bond markets, generally;
• national economic conditions;
• changes in tax laws;
• our financial performance;
• change in our credit rating; and
• general stock and bond market conditions.
The market value of our common stock is based primarily upon the market’s perception of our growthpotential and our current and potential future earnings and cash dividends. Consequently, our common stock maytrade at prices that are greater or less than our net asset value per share of common stock. If our future earningsor cash dividends are less than expected, it is likely that the market price of our common stock will diminish.
The number of shares available for future sale could adversely affect the market price of our stock.
In connection with and subsequent to our initial public offering, we have completed many private placementtransactions in which shares of capital stock of Boston Properties, Inc. or partnership interests in BPLP wereissued to owners of properties we acquired or to institutional investors. This common stock, or common stockissuable in exchange for such partnership interests in BPLP, may be sold in the public securities markets overtime under registration rights we granted to these investors. Additional common stock issuable under ouremployee benefit and other incentive plans, including as a result of the grant of stock options and restrictedequity securities, may also be sold in the market at some time in the future. Future sales of our common stock inthe market could adversely affect the price of our common stock. We cannot predict the effect the perception inthe market that such sales may occur will have on the market price of our common stock.
We did not obtain new owner’s title insurance policies in connection with properties acquired during ourinitial public offering.
We acquired many of our properties from our predecessors at the completion of our initial public offering inJune 1997. Before we acquired these properties, each of them was insured by a title insurance policy. We did notobtain new owner’s title insurance policies in connection with the acquisition of these properties. However, to theextent we have financed properties after acquiring them in connection with the IPO, we have obtained new title
27

insurance policies. Nevertheless, because in many instances we acquired these properties indirectly by acquiringownership of the entity that owned the property and those owners remain in existence as our subsidiaries, someof these title insurance policies may continue to benefit us. Many of these title insurance policies may be foramounts less than the current or future values of the applicable properties. If there was a title defect related to anyof these properties, or to any of the properties acquired at the time of our initial public offering, that is no longercovered by a title insurance policy, we could lose both our capital invested in and our anticipated profits fromsuch property. We have obtained title insurance policies for all properties that we have acquired after our initialpublic offering, however, these policies may be for amounts less than the current or future values of theapplicable properties.
We face possible adverse changes in tax laws.
From time to time changes in state and local tax laws or regulations are enacted, which may result in anincrease in our tax liability. A shortfall in tax revenues for states and municipalities in which we operate maylead to an increase in the frequency and size of such changes. If such changes occur, we may be required to payadditional taxes on our assets or income. These increased tax costs could adversely affect our financial conditionand results of operations and the amount of cash available for the payment of dividends.
We face possible state and local tax audits.
Because we are organized and qualify as a REIT, we are generally not subject to federal income taxes, butare subject to certain state and local taxes. In the normal course of business, certain entities through which weown real estate either have undergone, or are currently undergoing, tax audits. Although we believe that we havesubstantial arguments in favor of our positions in the ongoing audits, in some instances there is no controllingprecedent or interpretive guidance on the specific point at issue. Collectively, tax deficiency notices received todate from the jurisdictions conducting the ongoing audits have not been material. However, there can be noassurance that future audits will not occur with increased frequency or that the ultimate result of such audits willnot have a material adverse effect on our results of operations.
Item 1B. Unresolved Staff Comments.
None.
Item 2. Properties
At December 31, 2006, our portfolio consisted of 131 properties totaling 43.4 million net rentable squarefeet. Our properties consisted of (1) 127 office properties, comprised of 109 Class A office buildings, includingsix properties under construction, and 18 properties that support both office and technical uses, (2) two retailproperties and (3) two hotels. In addition, we own or control 524.3 acres of land for future development. Thetable set forth below shows information relating to the properties we owned, or in which we had an ownershipinterest, at December 31, 2006. Information relating to properties owned by the Value-Added Fund is notincluded in our portfolio information tables or any other portfolio level statistics because the Value-Added Fundinvests in assets within our existing markets that have deficiencies in property characteristics which provide anopportunity to create value through repositioning, refurbishment or renovation. We therefore believe includingsuch information in our portfolio tables and statistics would render the portfolio information less useful toinvestors. Information relating to the Value-Added Fund is set forth below separately.
Properties Location%
Leased
Numberof
Buildings
NetRentableSquare
Feet
Class A Office399 Park Avenue . . . . . . . . . . . . . . . . . . . . . . . . . . New York, NY 99.8% 1 1,697,564Citigroup Center . . . . . . . . . . . . . . . . . . . . . . . . . . New York, NY 99.9% 1 1,565,895Times Square Tower . . . . . . . . . . . . . . . . . . . . . . . New York, NY 100.0% 1 1,238,787
28
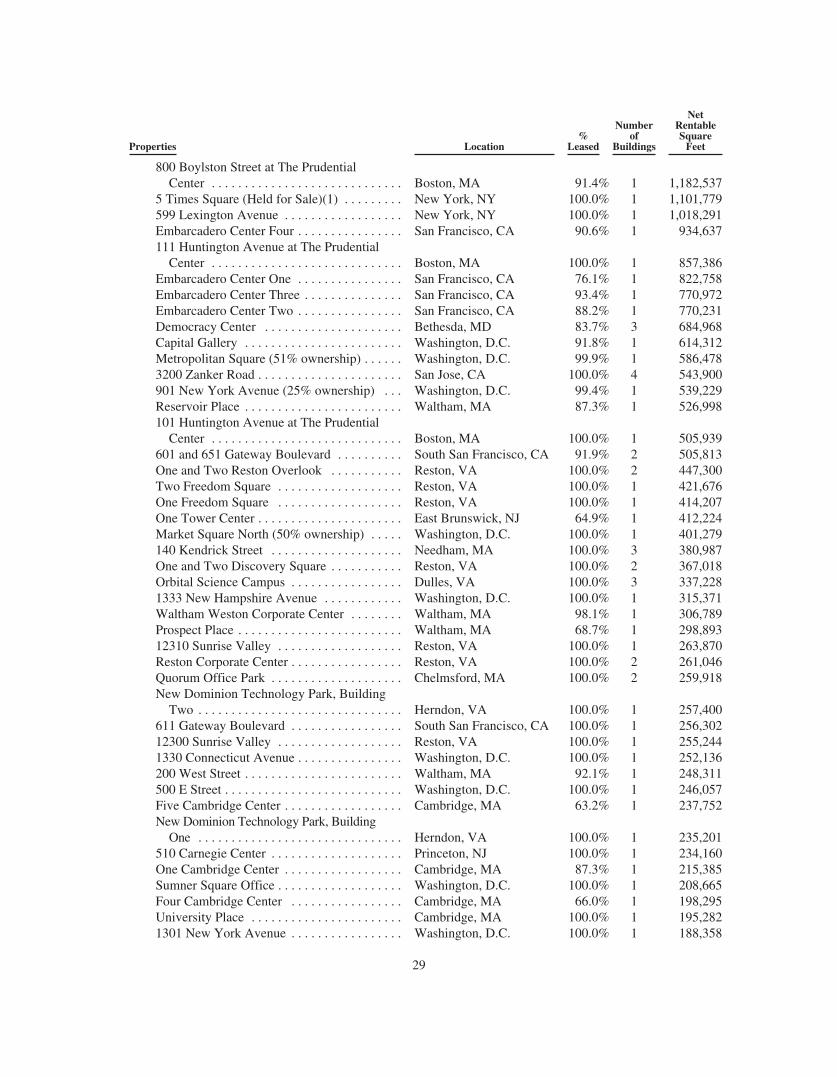
Properties Location%
Leased
Numberof
Buildings
NetRentableSquare
Feet
800 Boylston Street at The PrudentialCenter . . . . . . . . . . . . . . . . . . . . . . . . . . . . . Boston, MA 91.4% 1 1,182,537
5 Times Square (Held for Sale)(1) . . . . . . . . . New York, NY 100.0% 1 1,101,779599 Lexington Avenue . . . . . . . . . . . . . . . . . . New York, NY 100.0% 1 1,018,291Embarcadero Center Four . . . . . . . . . . . . . . . . San Francisco, CA 90.6% 1 934,637111 Huntington Avenue at The Prudential
Center . . . . . . . . . . . . . . . . . . . . . . . . . . . . . Boston, MA 100.0% 1 857,386Embarcadero Center One . . . . . . . . . . . . . . . . San Francisco, CA 76.1% 1 822,758Embarcadero Center Three . . . . . . . . . . . . . . . San Francisco, CA 93.4% 1 770,972Embarcadero Center Two . . . . . . . . . . . . . . . . San Francisco, CA 88.2% 1 770,231Democracy Center . . . . . . . . . . . . . . . . . . . . . Bethesda, MD 83.7% 3 684,968Capital Gallery . . . . . . . . . . . . . . . . . . . . . . . . Washington, D.C. 91.8% 1 614,312Metropolitan Square (51% ownership) . . . . . . Washington, D.C. 99.9% 1 586,4783200 Zanker Road . . . . . . . . . . . . . . . . . . . . . . San Jose, CA 100.0% 4 543,900901 New York Avenue (25% ownership) . . . Washington, D.C. 99.4% 1 539,229Reservoir Place . . . . . . . . . . . . . . . . . . . . . . . . Waltham, MA 87.3% 1 526,998101 Huntington Avenue at The Prudential
Center . . . . . . . . . . . . . . . . . . . . . . . . . . . . . Boston, MA 100.0% 1 505,939601 and 651 Gateway Boulevard . . . . . . . . . . South San Francisco, CA 91.9% 2 505,813One and Two Reston Overlook . . . . . . . . . . . Reston, VA 100.0% 2 447,300Two Freedom Square . . . . . . . . . . . . . . . . . . . Reston, VA 100.0% 1 421,676One Freedom Square . . . . . . . . . . . . . . . . . . . Reston, VA 100.0% 1 414,207One Tower Center . . . . . . . . . . . . . . . . . . . . . . East Brunswick, NJ 64.9% 1 412,224Market Square North (50% ownership) . . . . . Washington, D.C. 100.0% 1 401,279140 Kendrick Street . . . . . . . . . . . . . . . . . . . . Needham, MA 100.0% 3 380,987One and Two Discovery Square . . . . . . . . . . . Reston, VA 100.0% 2 367,018Orbital Science Campus . . . . . . . . . . . . . . . . . Dulles, VA 100.0% 3 337,2281333 New Hampshire Avenue . . . . . . . . . . . . Washington, D.C. 100.0% 1 315,371Waltham Weston Corporate Center . . . . . . . . Waltham, MA 98.1% 1 306,789Prospect Place . . . . . . . . . . . . . . . . . . . . . . . . . Waltham, MA 68.7% 1 298,89312310 Sunrise Valley . . . . . . . . . . . . . . . . . . . Reston, VA 100.0% 1 263,870Reston Corporate Center . . . . . . . . . . . . . . . . . Reston, VA 100.0% 2 261,046Quorum Office Park . . . . . . . . . . . . . . . . . . . . Chelmsford, MA 100.0% 2 259,918New Dominion Technology Park, Building
Two . . . . . . . . . . . . . . . . . . . . . . . . . . . . . . . Herndon, VA 100.0% 1 257,400611 Gateway Boulevard . . . . . . . . . . . . . . . . . South San Francisco, CA 100.0% 1 256,30212300 Sunrise Valley . . . . . . . . . . . . . . . . . . . Reston, VA 100.0% 1 255,2441330 Connecticut Avenue . . . . . . . . . . . . . . . . Washington, D.C. 100.0% 1 252,136200 West Street . . . . . . . . . . . . . . . . . . . . . . . . Waltham, MA 92.1% 1 248,311500 E Street . . . . . . . . . . . . . . . . . . . . . . . . . . . Washington, D.C. 100.0% 1 246,057Five Cambridge Center . . . . . . . . . . . . . . . . . . Cambridge, MA 63.2% 1 237,752New Dominion Technology Park, Building
One . . . . . . . . . . . . . . . . . . . . . . . . . . . . . . . Herndon, VA 100.0% 1 235,201510 Carnegie Center . . . . . . . . . . . . . . . . . . . . Princeton, NJ 100.0% 1 234,160One Cambridge Center . . . . . . . . . . . . . . . . . . Cambridge, MA 87.3% 1 215,385Sumner Square Office . . . . . . . . . . . . . . . . . . . Washington, D.C. 100.0% 1 208,665Four Cambridge Center . . . . . . . . . . . . . . . . . Cambridge, MA 66.0% 1 198,295University Place . . . . . . . . . . . . . . . . . . . . . . . Cambridge, MA 100.0% 1 195,2821301 New York Avenue . . . . . . . . . . . . . . . . . Washington, D.C. 100.0% 1 188,358
29

Properties Location%
Leased
Numberof
Buildings
NetRentableSquare
Feet
12290 Sunrise Valley . . . . . . . . . . . . . . . . . . . . . Reston, VA 100.0% 1 182,4242600 Tower Oaks Boulevard . . . . . . . . . . . . . . . Rockville, MD 100.0% 1 178,887Eight Cambridge Center . . . . . . . . . . . . . . . . . . . Cambridge, MA 100.0% 1 177,226Newport Office Park . . . . . . . . . . . . . . . . . . . . . . Quincy, MA 97.4% 1 171,957Lexington Office Park . . . . . . . . . . . . . . . . . . . . Lexington, MA 96.4% 2 166,689210 Carnegie Center . . . . . . . . . . . . . . . . . . . . . . Princeton, NJ 74.5% 1 161,776206 Carnegie Center . . . . . . . . . . . . . . . . . . . . . . Princeton, NJ 100.0% 1 161,763191 Spring Street . . . . . . . . . . . . . . . . . . . . . . . . Lexington, MA 100.0% 1 158,900303 Almaden . . . . . . . . . . . . . . . . . . . . . . . . . . . . San Jose, CA 100.0% 1 157,53710 & 20 Burlington Mall Road . . . . . . . . . . . . . . Burlington, MA 91.3% 2 153,048Ten Cambridge Center . . . . . . . . . . . . . . . . . . . . Cambridge, MA 100.0% 1 152,664214 Carnegie Center . . . . . . . . . . . . . . . . . . . . . . Princeton, NJ 76.8% 1 150,774212 Carnegie Center . . . . . . . . . . . . . . . . . . . . . . Princeton, NJ 97.3% 1 149,398506 Carnegie Center . . . . . . . . . . . . . . . . . . . . . . Princeton, NJ 100.0% 1 136,213508 Carnegie Center . . . . . . . . . . . . . . . . . . . . . . Princeton, NJ 100.0% 1 131,085Waltham Office Center . . . . . . . . . . . . . . . . . . . . Waltham, MA 79.1% 3 129,041202 Carnegie Center . . . . . . . . . . . . . . . . . . . . . . Princeton, NJ 74.5% 1 128,705101 Carnegie Center . . . . . . . . . . . . . . . . . . . . . . Princeton, NJ 100.0% 1 123,659Montvale Center (75% ownership) . . . . . . . . . . . Gaithersburg, MD 90.8% 1 122,737504 Carnegie Center . . . . . . . . . . . . . . . . . . . . . . Princeton, NJ 100.0% 1 121,99091 Hartwell Avenue . . . . . . . . . . . . . . . . . . . . . . Lexington, MA 88.3% 1 121,42540 Shattuck Road . . . . . . . . . . . . . . . . . . . . . . . . Andover, MA 95.6% 1 120,000502 Carnegie Center . . . . . . . . . . . . . . . . . . . . . . Princeton, NJ 100.0% 1 116,855Three Cambridge Center . . . . . . . . . . . . . . . . . . . Cambridge, MA 100.0% 1 108,152104 Carnegie Center . . . . . . . . . . . . . . . . . . . . . . Princeton, NJ 89.5% 1 102,830201 Spring Street . . . . . . . . . . . . . . . . . . . . . . . . Lexington, MA 100.0% 1 102,500Bedford Office Park . . . . . . . . . . . . . . . . . . . . . . Bedford, MA 16.3% 1 89,96133 Hayden Avenue . . . . . . . . . . . . . . . . . . . . . . . Lexington, MA 100.0% 1 80,128Eleven Cambridge Center . . . . . . . . . . . . . . . . . . Cambridge, MA 100.0% 1 79,616Reservoir Place North . . . . . . . . . . . . . . . . . . . . . Waltham, MA 97.5% 1 73,258105 Carnegie Center . . . . . . . . . . . . . . . . . . . . . . Princeton, NJ 81.1% 1 70,02932 Hartwell Avenue . . . . . . . . . . . . . . . . . . . . . . Lexington, MA 100.0% 1 69,154302 Carnegie Center . . . . . . . . . . . . . . . . . . . . . . Princeton, NJ 100.0% 1 64,726195 West Street . . . . . . . . . . . . . . . . . . . . . . . . . . Waltham, MA 100.0% 1 63,500100 Hayden Avenue . . . . . . . . . . . . . . . . . . . . . . Lexington, MA 100.0% 1 55,924181 Spring Street . . . . . . . . . . . . . . . . . . . . . . . . Lexington, MA 89.8% 1 55,793211 Carnegie Center . . . . . . . . . . . . . . . . . . . . . . Princeton, NJ 100.0% 1 47,02592 Hayden Avenue . . . . . . . . . . . . . . . . . . . . . . . Lexington, MA 100.0% 1 31,100201 Carnegie Center . . . . . . . . . . . . . . . . . . . . . . Princeton, NJ 100.0% — 6,500
Subtotal for Class A Office Properties . . . . 94.7% 103 29,059,777
RetailShops at The Prudential Center . . . . . . . . . . . . . Boston, MA 95.9% 1 500,135Shaws Supermarket at The Prudential Center . . Boston, MA 100.0% 1 57,235
Subtotal for Retail Properties . . . . . . . . . . . 96.3% 2 557,370
Office/Technical PropertiesBedford Office Park . . . . . . . . . . . . . . . . . . . . . . Bedford, MA 33.9% 2 383,704Seven Cambridge Center . . . . . . . . . . . . . . . . . . Cambridge, MA 100.0% 1 231,028Broad Run Business Park, Building E . . . . . . . . Dulles, VA 100.0% 1 127,0707601 Boston Boulevard . . . . . . . . . . . . . . . . . . . Springfield, VA 100.0% 1 103,750
30
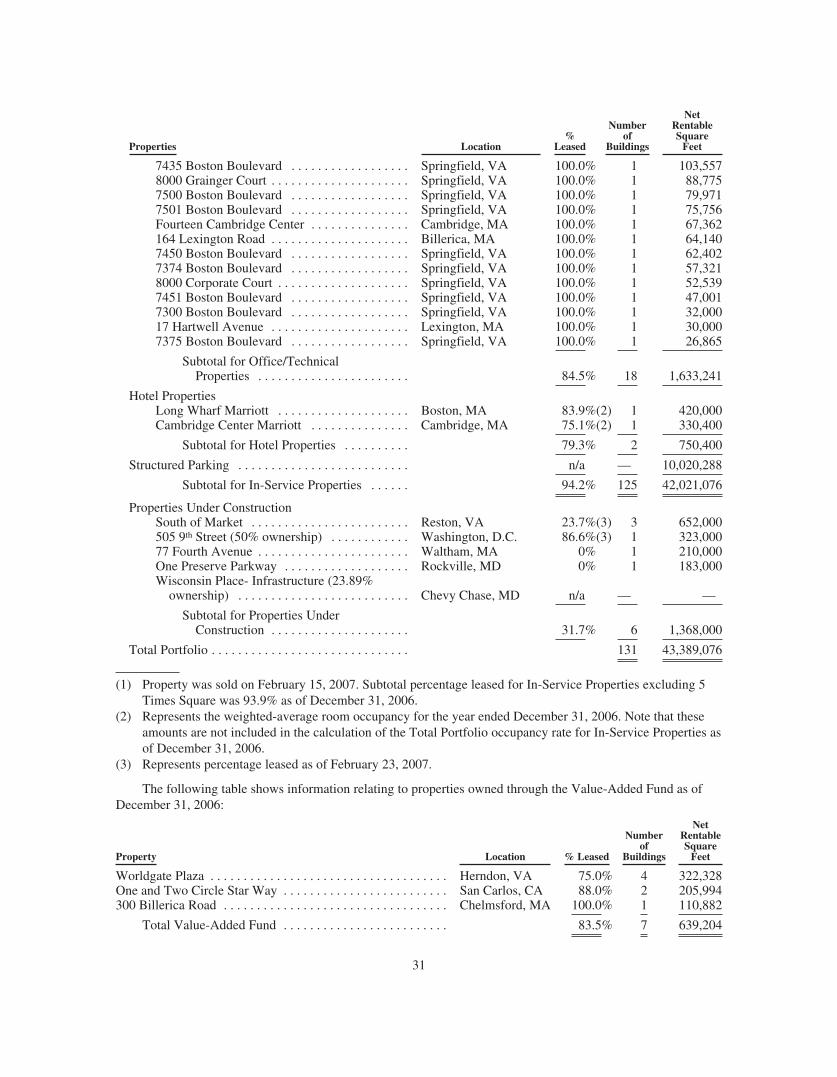
Properties Location%
Leased
Numberof
Buildings
NetRentableSquare
Feet
7435 Boston Boulevard . . . . . . . . . . . . . . . . . . Springfield, VA 100.0% 1 103,5578000 Grainger Court . . . . . . . . . . . . . . . . . . . . . Springfield, VA 100.0% 1 88,7757500 Boston Boulevard . . . . . . . . . . . . . . . . . . Springfield, VA 100.0% 1 79,9717501 Boston Boulevard . . . . . . . . . . . . . . . . . . Springfield, VA 100.0% 1 75,756Fourteen Cambridge Center . . . . . . . . . . . . . . . Cambridge, MA 100.0% 1 67,362164 Lexington Road . . . . . . . . . . . . . . . . . . . . . Billerica, MA 100.0% 1 64,1407450 Boston Boulevard . . . . . . . . . . . . . . . . . . Springfield, VA 100.0% 1 62,4027374 Boston Boulevard . . . . . . . . . . . . . . . . . . Springfield, VA 100.0% 1 57,3218000 Corporate Court . . . . . . . . . . . . . . . . . . . . Springfield, VA 100.0% 1 52,5397451 Boston Boulevard . . . . . . . . . . . . . . . . . . Springfield, VA 100.0% 1 47,0017300 Boston Boulevard . . . . . . . . . . . . . . . . . . Springfield, VA 100.0% 1 32,00017 Hartwell Avenue . . . . . . . . . . . . . . . . . . . . . Lexington, MA 100.0% 1 30,0007375 Boston Boulevard . . . . . . . . . . . . . . . . . . Springfield, VA 100.0% 1 26,865
Subtotal for Office/TechnicalProperties . . . . . . . . . . . . . . . . . . . . . . . 84.5% 18 1,633,241
Hotel PropertiesLong Wharf Marriott . . . . . . . . . . . . . . . . . . . . Boston, MA 83.9%(2) 1 420,000Cambridge Center Marriott . . . . . . . . . . . . . . . Cambridge, MA 75.1%(2) 1 330,400
Subtotal for Hotel Properties . . . . . . . . . . 79.3% 2 750,400
Structured Parking . . . . . . . . . . . . . . . . . . . . . . . . . . n/a — 10,020,288
Subtotal for In-Service Properties . . . . . . 94.2% 125 42,021,076
Properties Under ConstructionSouth of Market . . . . . . . . . . . . . . . . . . . . . . . . Reston, VA 23.7%(3) 3 652,000505 9th Street (50% ownership) . . . . . . . . . . . . Washington, D.C. 86.6%(3) 1 323,00077 Fourth Avenue . . . . . . . . . . . . . . . . . . . . . . . Waltham, MA 0% 1 210,000One Preserve Parkway . . . . . . . . . . . . . . . . . . . Rockville, MD 0% 1 183,000Wisconsin Place- Infrastructure (23.89%
ownership) . . . . . . . . . . . . . . . . . . . . . . . . . . Chevy Chase, MD n/a — —
Subtotal for Properties UnderConstruction . . . . . . . . . . . . . . . . . . . . . 31.7% 6 1,368,000
Total Portfolio . . . . . . . . . . . . . . . . . . . . . . . . . . . . . . 131 43,389,076
(1) Property was sold on February 15, 2007. Subtotal percentage leased for In-Service Properties excluding 5Times Square was 93.9% as of December 31, 2006.
(2) Represents the weighted-average room occupancy for the year ended December 31, 2006. Note that theseamounts are not included in the calculation of the Total Portfolio occupancy rate for In-Service Properties asof December 31, 2006.
(3) Represents percentage leased as of February 23, 2007.
The following table shows information relating to properties owned through the Value-Added Fund as ofDecember 31, 2006:
Property Location % Leased
Numberof
Buildings
NetRentableSquare
Feet
Worldgate Plaza . . . . . . . . . . . . . . . . . . . . . . . . . . . . . . . . . . . . Herndon, VA 75.0% 4 322,328One and Two Circle Star Way . . . . . . . . . . . . . . . . . . . . . . . . . San Carlos, CA 88.0% 2 205,994300 Billerica Road . . . . . . . . . . . . . . . . . . . . . . . . . . . . . . . . . . Chelmsford, MA 100.0% 1 110,882
Total Value-Added Fund . . . . . . . . . . . . . . . . . . . . . . . . . 83.5% 7 639,204
31
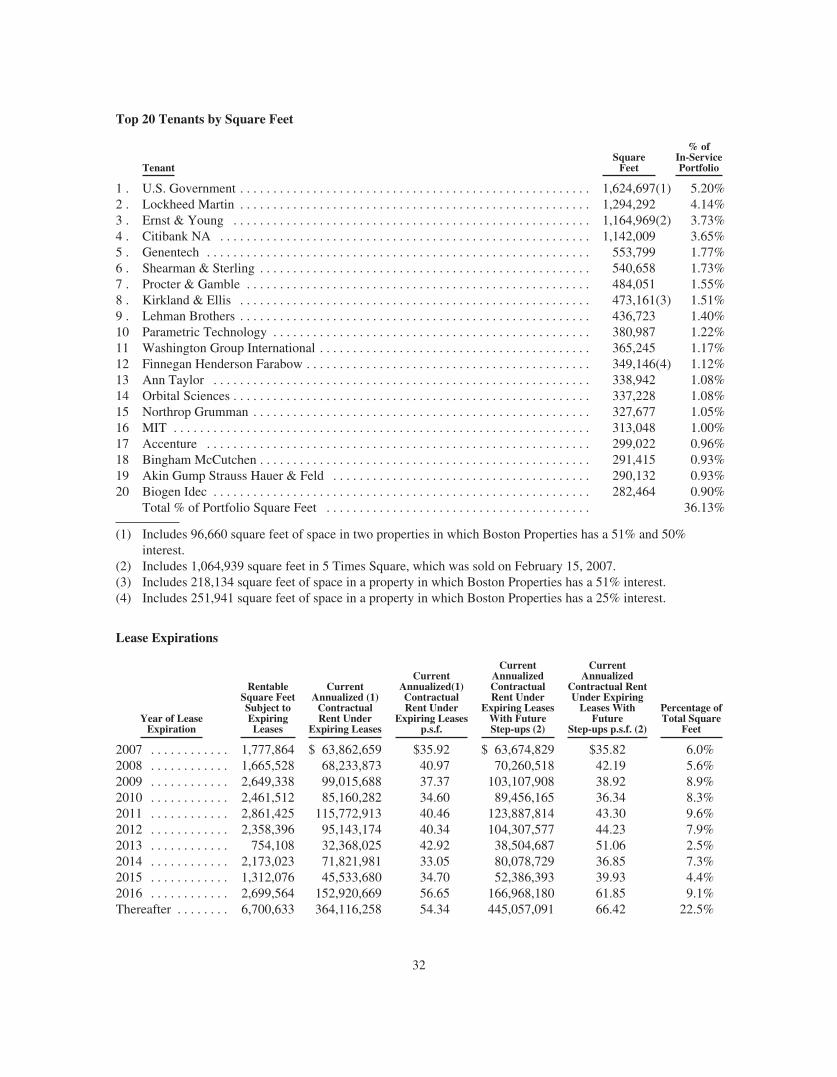
Top 20 Tenants by Square Feet
TenantSquare
Feet
% ofIn-ServicePortfolio
1 . U.S. Government . . . . . . . . . . . . . . . . . . . . . . . . . . . . . . . . . . . . . . . . . . . . . . . . . . . . . 1,624,697(1) 5.20%2 . Lockheed Martin . . . . . . . . . . . . . . . . . . . . . . . . . . . . . . . . . . . . . . . . . . . . . . . . . . . . . 1,294,292 4.14%3 . Ernst & Young . . . . . . . . . . . . . . . . . . . . . . . . . . . . . . . . . . . . . . . . . . . . . . . . . . . . . . 1,164,969(2) 3.73%4 . Citibank NA . . . . . . . . . . . . . . . . . . . . . . . . . . . . . . . . . . . . . . . . . . . . . . . . . . . . . . . . 1,142,009 3.65%5 . Genentech . . . . . . . . . . . . . . . . . . . . . . . . . . . . . . . . . . . . . . . . . . . . . . . . . . . . . . . . . . 553,799 1.77%6 . Shearman & Sterling . . . . . . . . . . . . . . . . . . . . . . . . . . . . . . . . . . . . . . . . . . . . . . . . . . 540,658 1.73%7 . Procter & Gamble . . . . . . . . . . . . . . . . . . . . . . . . . . . . . . . . . . . . . . . . . . . . . . . . . . . . 484,051 1.55%8 . Kirkland & Ellis . . . . . . . . . . . . . . . . . . . . . . . . . . . . . . . . . . . . . . . . . . . . . . . . . . . . . 473,161(3) 1.51%9 . Lehman Brothers . . . . . . . . . . . . . . . . . . . . . . . . . . . . . . . . . . . . . . . . . . . . . . . . . . . . . 436,723 1.40%10 Parametric Technology . . . . . . . . . . . . . . . . . . . . . . . . . . . . . . . . . . . . . . . . . . . . . . . . 380,987 1.22%11 Washington Group International . . . . . . . . . . . . . . . . . . . . . . . . . . . . . . . . . . . . . . . . . 365,245 1.17%12 Finnegan Henderson Farabow . . . . . . . . . . . . . . . . . . . . . . . . . . . . . . . . . . . . . . . . . . . 349,146(4) 1.12%13 Ann Taylor . . . . . . . . . . . . . . . . . . . . . . . . . . . . . . . . . . . . . . . . . . . . . . . . . . . . . . . . . 338,942 1.08%14 Orbital Sciences . . . . . . . . . . . . . . . . . . . . . . . . . . . . . . . . . . . . . . . . . . . . . . . . . . . . . . 337,228 1.08%15 Northrop Grumman . . . . . . . . . . . . . . . . . . . . . . . . . . . . . . . . . . . . . . . . . . . . . . . . . . . 327,677 1.05%16 MIT . . . . . . . . . . . . . . . . . . . . . . . . . . . . . . . . . . . . . . . . . . . . . . . . . . . . . . . . . . . . . . . 313,048 1.00%17 Accenture . . . . . . . . . . . . . . . . . . . . . . . . . . . . . . . . . . . . . . . . . . . . . . . . . . . . . . . . . . 299,022 0.96%18 Bingham McCutchen . . . . . . . . . . . . . . . . . . . . . . . . . . . . . . . . . . . . . . . . . . . . . . . . . . 291,415 0.93%19 Akin Gump Strauss Hauer & Feld . . . . . . . . . . . . . . . . . . . . . . . . . . . . . . . . . . . . . . . 290,132 0.93%20 Biogen Idec . . . . . . . . . . . . . . . . . . . . . . . . . . . . . . . . . . . . . . . . . . . . . . . . . . . . . . . . . 282,464 0.90%
Total % of Portfolio Square Feet . . . . . . . . . . . . . . . . . . . . . . . . . . . . . . . . . . . . . . . . 36.13%
(1) Includes 96,660 square feet of space in two properties in which Boston Properties has a 51% and 50%interest.
(2) Includes 1,064,939 square feet in 5 Times Square, which was sold on February 15, 2007.(3) Includes 218,134 square feet of space in a property in which Boston Properties has a 51% interest.(4) Includes 251,941 square feet of space in a property in which Boston Properties has a 25% interest.
Lease Expirations
Year of LeaseExpiration
RentableSquare FeetSubject toExpiringLeases
CurrentAnnualized (1)
ContractualRent Under
Expiring Leases
CurrentAnnualized(1)ContractualRent Under
Expiring Leasesp.s.f.
CurrentAnnualizedContractualRent Under
Expiring LeasesWith FutureStep-ups (2)
CurrentAnnualized
Contractual RentUnder Expiring
Leases WithFuture
Step-ups p.s.f. (2)
Percentage ofTotal Square
Feet
2007 . . . . . . . . . . . . 1,777,864 $ 63,862,659 $35.92 $ 63,674,829 $35.82 6.0%2008 . . . . . . . . . . . . 1,665,528 68,233,873 40.97 70,260,518 42.19 5.6%2009 . . . . . . . . . . . . 2,649,338 99,015,688 37.37 103,107,908 38.92 8.9%2010 . . . . . . . . . . . . 2,461,512 85,160,282 34.60 89,456,165 36.34 8.3%2011 . . . . . . . . . . . . 2,861,425 115,772,913 40.46 123,887,814 43.30 9.6%2012 . . . . . . . . . . . . 2,358,396 95,143,174 40.34 104,307,577 44.23 7.9%2013 . . . . . . . . . . . . 754,108 32,368,025 42.92 38,504,687 51.06 2.5%2014 . . . . . . . . . . . . 2,173,023 71,821,981 33.05 80,078,729 36.85 7.3%2015 . . . . . . . . . . . . 1,312,076 45,533,680 34.70 52,386,393 39.93 4.4%2016 . . . . . . . . . . . . 2,699,564 152,920,669 56.65 166,968,180 61.85 9.1%Thereafter . . . . . . . . 6,700,633 364,116,258 54.34 445,057,091 66.42 22.5%
32
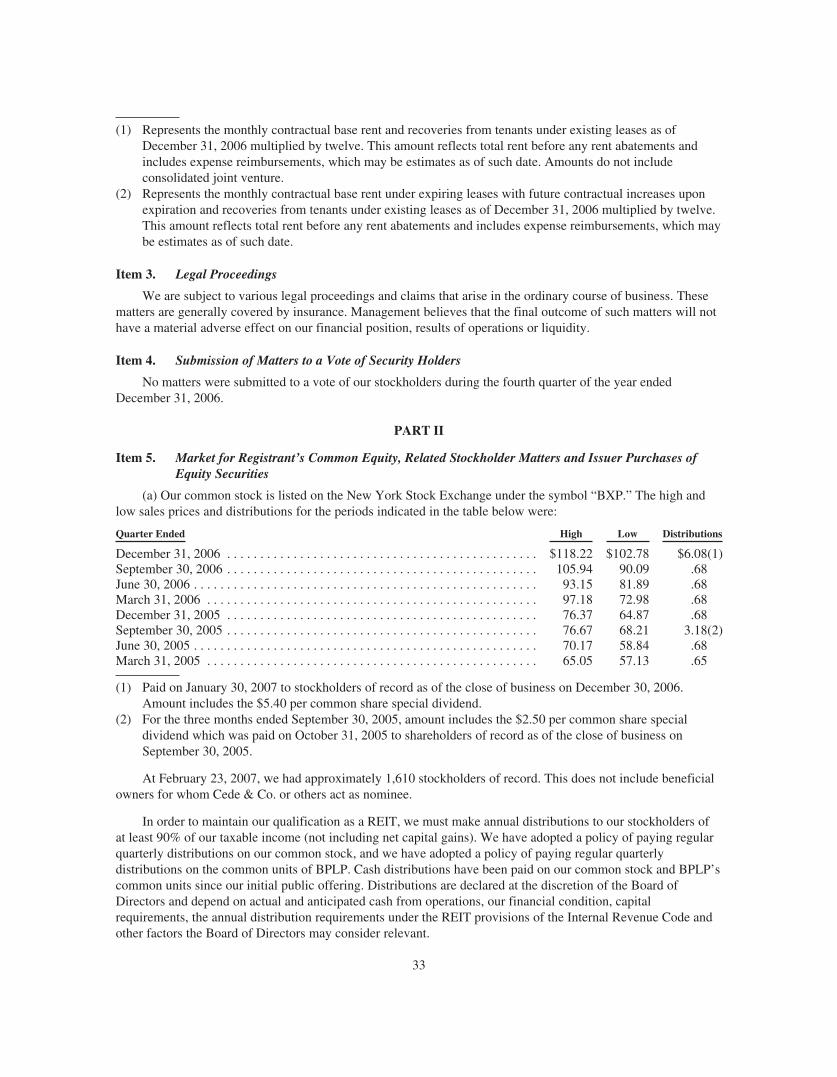
(1) Represents the monthly contractual base rent and recoveries from tenants under existing leases as ofDecember 31, 2006 multiplied by twelve. This amount reflects total rent before any rent abatements andincludes expense reimbursements, which may be estimates as of such date. Amounts do not includeconsolidated joint venture.
(2) Represents the monthly contractual base rent under expiring leases with future contractual increases uponexpiration and recoveries from tenants under existing leases as of December 31, 2006 multiplied by twelve.This amount reflects total rent before any rent abatements and includes expense reimbursements, which maybe estimates as of such date.
Item 3. Legal Proceedings
We are subject to various legal proceedings and claims that arise in the ordinary course of business. Thesematters are generally covered by insurance. Management believes that the final outcome of such matters will nothave a material adverse effect on our financial position, results of operations or liquidity.
Item 4. Submission of Matters to a Vote of Security Holders
No matters were submitted to a vote of our stockholders during the fourth quarter of the year endedDecember 31, 2006.
PART II
Item 5. Market for Registrant’s Common Equity, Related Stockholder Matters and Issuer Purchases ofEquity Securities
(a) Our common stock is listed on the New York Stock Exchange under the symbol “BXP.” The high andlow sales prices and distributions for the periods indicated in the table below were:
Quarter Ended High Low Distributions
December 31, 2006 . . . . . . . . . . . . . . . . . . . . . . . . . . . . . . . . . . . . . . . . . . . . . . . $118.22 $102.78 $6.08(1)September 30, 2006 . . . . . . . . . . . . . . . . . . . . . . . . . . . . . . . . . . . . . . . . . . . . . . . 105.94 90.09 .68June 30, 2006 . . . . . . . . . . . . . . . . . . . . . . . . . . . . . . . . . . . . . . . . . . . . . . . . . . . . 93.15 81.89 .68March 31, 2006 . . . . . . . . . . . . . . . . . . . . . . . . . . . . . . . . . . . . . . . . . . . . . . . . . . 97.18 72.98 .68December 31, 2005 . . . . . . . . . . . . . . . . . . . . . . . . . . . . . . . . . . . . . . . . . . . . . . . 76.37 64.87 .68September 30, 2005 . . . . . . . . . . . . . . . . . . . . . . . . . . . . . . . . . . . . . . . . . . . . . . . 76.67 68.21 3.18(2)June 30, 2005 . . . . . . . . . . . . . . . . . . . . . . . . . . . . . . . . . . . . . . . . . . . . . . . . . . . . 70.17 58.84 .68March 31, 2005 . . . . . . . . . . . . . . . . . . . . . . . . . . . . . . . . . . . . . . . . . . . . . . . . . . 65.05 57.13 .65
(1) Paid on January 30, 2007 to stockholders of record as of the close of business on December 30, 2006.Amount includes the $5.40 per common share special dividend.
(2) For the three months ended September 30, 2005, amount includes the $2.50 per common share specialdividend which was paid on October 31, 2005 to shareholders of record as of the close of business onSeptember 30, 2005.
At February 23, 2007, we had approximately 1,610 stockholders of record. This does not include beneficialowners for whom Cede & Co. or others act as nominee.
In order to maintain our qualification as a REIT, we must make annual distributions to our stockholders ofat least 90% of our taxable income (not including net capital gains). We have adopted a policy of paying regularquarterly distributions on our common stock, and we have adopted a policy of paying regular quarterlydistributions on the common units of BPLP. Cash distributions have been paid on our common stock and BPLP’scommon units since our initial public offering. Distributions are declared at the discretion of the Board ofDirectors and depend on actual and anticipated cash from operations, our financial condition, capitalrequirements, the annual distribution requirements under the REIT provisions of the Internal Revenue Code andother factors the Board of Directors may consider relevant.
33
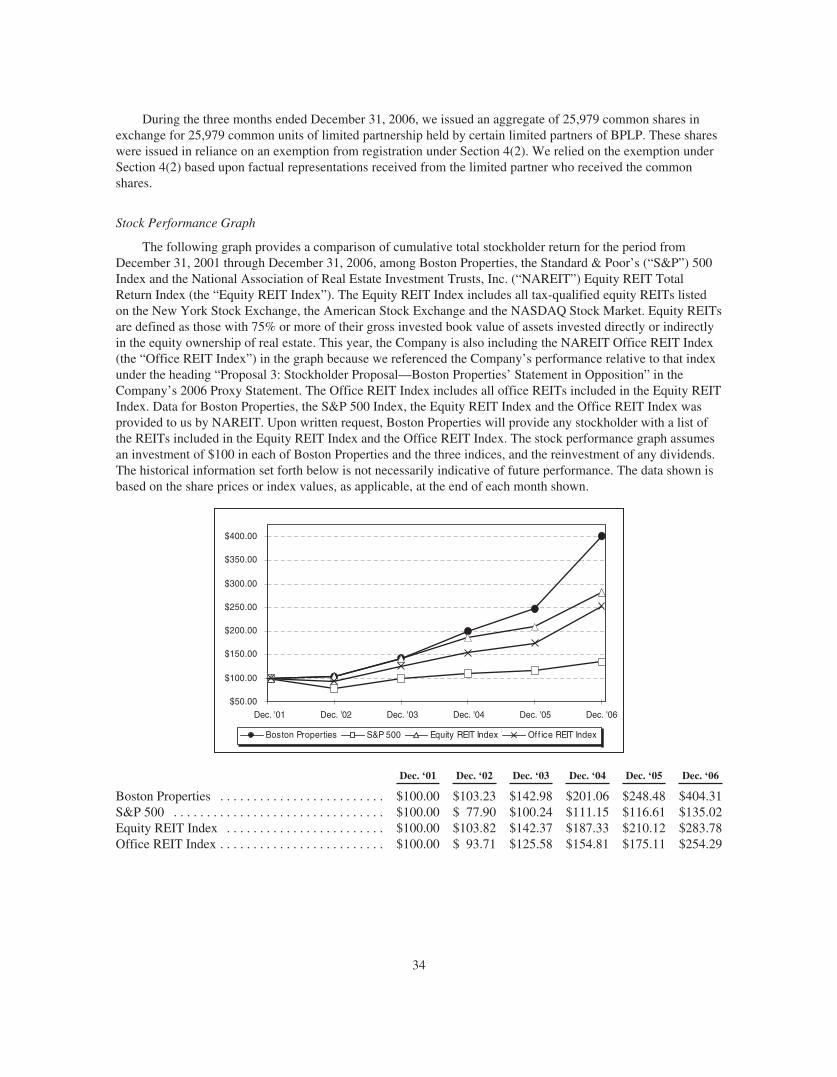
During the three months ended December 31, 2006, we issued an aggregate of 25,979 common shares inexchange for 25,979 common units of limited partnership held by certain limited partners of BPLP. These shareswere issued in reliance on an exemption from registration under Section 4(2). We relied on the exemption underSection 4(2) based upon factual representations received from the limited partner who received the commonshares.
Stock Performance Graph
The following graph provides a comparison of cumulative total stockholder return for the period fromDecember 31, 2001 through December 31, 2006, among Boston Properties, the Standard & Poor’s (“S&P”) 500Index and the National Association of Real Estate Investment Trusts, Inc. (“NAREIT”) Equity REIT TotalReturn Index (the “Equity REIT Index”). The Equity REIT Index includes all tax-qualified equity REITs listedon the New York Stock Exchange, the American Stock Exchange and the NASDAQ Stock Market. Equity REITsare defined as those with 75% or more of their gross invested book value of assets invested directly or indirectlyin the equity ownership of real estate. This year, the Company is also including the NAREIT Office REIT Index(the “Office REIT Index”) in the graph because we referenced the Company’s performance relative to that indexunder the heading “Proposal 3: Stockholder Proposal—Boston Properties’ Statement in Opposition” in theCompany’s 2006 Proxy Statement. The Office REIT Index includes all office REITs included in the Equity REITIndex. Data for Boston Properties, the S&P 500 Index, the Equity REIT Index and the Office REIT Index wasprovided to us by NAREIT. Upon written request, Boston Properties will provide any stockholder with a list ofthe REITs included in the Equity REIT Index and the Office REIT Index. The stock performance graph assumesan investment of $100 in each of Boston Properties and the three indices, and the reinvestment of any dividends.The historical information set forth below is not necessarily indicative of future performance. The data shown isbased on the share prices or index values, as applicable, at the end of each month shown.
$50.00
$100.00
$150.00
$200.00
$250.00
$300.00
$350.00
$400.00
Dec. '01
Boston Properties S&P 500 Equity REIT Index Off ice REIT Index
Dec. '02 Dec. '03 Dec. '04 Dec. '05 Dec. '06
Dec. ‘01 Dec. ‘02 Dec. ‘03 Dec. ‘04 Dec. ‘05 Dec. ‘06
Boston Properties . . . . . . . . . . . . . . . . . . . . . . . . . $100.00 $103.23 $142.98 $201.06 $248.48 $404.31S&P 500 . . . . . . . . . . . . . . . . . . . . . . . . . . . . . . . . $100.00 $ 77.90 $100.24 $111.15 $116.61 $135.02Equity REIT Index . . . . . . . . . . . . . . . . . . . . . . . . $100.00 $103.82 $142.37 $187.33 $210.12 $283.78Office REIT Index . . . . . . . . . . . . . . . . . . . . . . . . . $100.00 $ 93.71 $125.58 $154.81 $175.11 $254.29
34

(b) None.
(c)
Period
(a) TotalNumber ofShares of
Common StockPurchased (1)
(b) AveragePrice Paid per
CommonShare
(c) Total Number ofShares Purchased as
Part of PubliclyAnnounced Plans or
Programs
(d) MaximumNumber (or
Approximate DollarValue) of Shares that
May Yet be Purchased
October 1, 2006—October 31, 2006 . . . . — — N/A N/ANovember 1, 2006—November 30,
2006 . . . . . . . . . . . . . . . . . . . . . . . . . . . 1,743(1) $117.95 N/A N/ADecember 1, 2006—December 31,
2006 . . . . . . . . . . . . . . . . . . . . . . . . . . . — — N/A N/A
Total . . . . . . . . . . . . . . . . . . . . . . . . . . . . . 1,743 $117.95 N/A N/A
(1) Represents shares of restricted Common Stock surrendered by an employee to satisfy such employee’s taxwithholding obligation in connection with the vesting of restricted Common Stock. Such shares wererepurchased by the Company for their fair market value on the vesting date.
35
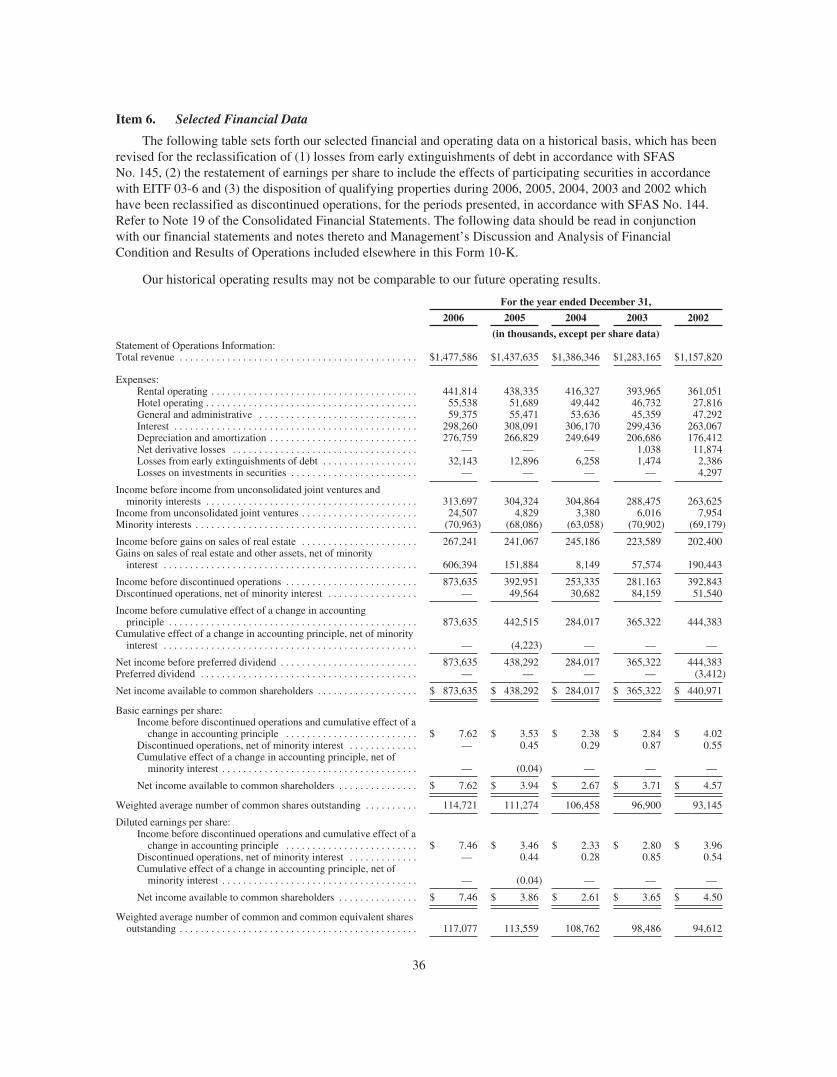
Item 6. Selected Financial Data
The following table sets forth our selected financial and operating data on a historical basis, which has beenrevised for the reclassification of (1) losses from early extinguishments of debt in accordance with SFASNo. 145, (2) the restatement of earnings per share to include the effects of participating securities in accordancewith EITF 03-6 and (3) the disposition of qualifying properties during 2006, 2005, 2004, 2003 and 2002 whichhave been reclassified as discontinued operations, for the periods presented, in accordance with SFAS No. 144.Refer to Note 19 of the Consolidated Financial Statements. The following data should be read in conjunctionwith our financial statements and notes thereto and Management’s Discussion and Analysis of FinancialCondition and Results of Operations included elsewhere in this Form 10-K.
Our historical operating results may not be comparable to our future operating results.
For the year ended December 31,
2006 2005 2004 2003 2002
(in thousands, except per share data)Statement of Operations Information:Total revenue . . . . . . . . . . . . . . . . . . . . . . . . . . . . . . . . . . . . . . . . . . . . . $1,477,586 $1,437,635 $1,386,346 $1,283,165 $1,157,820
Expenses:Rental operating . . . . . . . . . . . . . . . . . . . . . . . . . . . . . . . . . . . . . . . 441,814 438,335 416,327 393,965 361,051Hotel operating . . . . . . . . . . . . . . . . . . . . . . . . . . . . . . . . . . . . . . . . 55,538 51,689 49,442 46,732 27,816General and administrative . . . . . . . . . . . . . . . . . . . . . . . . . . . . . . 59,375 55,471 53,636 45,359 47,292Interest . . . . . . . . . . . . . . . . . . . . . . . . . . . . . . . . . . . . . . . . . . . . . . 298,260 308,091 306,170 299,436 263,067Depreciation and amortization . . . . . . . . . . . . . . . . . . . . . . . . . . . . 276,759 266,829 249,649 206,686 176,412Net derivative losses . . . . . . . . . . . . . . . . . . . . . . . . . . . . . . . . . . . — — — 1,038 11,874Losses from early extinguishments of debt . . . . . . . . . . . . . . . . . . 32,143 12,896 6,258 1,474 2,386Losses on investments in securities . . . . . . . . . . . . . . . . . . . . . . . . — — — — 4,297
Income before income from unconsolidated joint ventures andminority interests . . . . . . . . . . . . . . . . . . . . . . . . . . . . . . . . . . . . . . . . 313,697 304,324 304,864 288,475 263,625
Income from unconsolidated joint ventures . . . . . . . . . . . . . . . . . . . . . . 24,507 4,829 3,380 6,016 7,954Minority interests . . . . . . . . . . . . . . . . . . . . . . . . . . . . . . . . . . . . . . . . . . (70,963) (68,086) (63,058) (70,902) (69,179)
Income before gains on sales of real estate . . . . . . . . . . . . . . . . . . . . . . 267,241 241,067 245,186 223,589 202,400Gains on sales of real estate and other assets, net of minority
interest . . . . . . . . . . . . . . . . . . . . . . . . . . . . . . . . . . . . . . . . . . . . . . . . 606,394 151,884 8,149 57,574 190,443
Income before discontinued operations . . . . . . . . . . . . . . . . . . . . . . . . . 873,635 392,951 253,335 281,163 392,843Discontinued operations, net of minority interest . . . . . . . . . . . . . . . . . — 49,564 30,682 84,159 51,540
Income before cumulative effect of a change in accountingprinciple . . . . . . . . . . . . . . . . . . . . . . . . . . . . . . . . . . . . . . . . . . . . . . . 873,635 442,515 284,017 365,322 444,383
Cumulative effect of a change in accounting principle, net of minorityinterest . . . . . . . . . . . . . . . . . . . . . . . . . . . . . . . . . . . . . . . . . . . . . . . . — (4,223) — — —
Net income before preferred dividend . . . . . . . . . . . . . . . . . . . . . . . . . . 873,635 438,292 284,017 365,322 444,383Preferred dividend . . . . . . . . . . . . . . . . . . . . . . . . . . . . . . . . . . . . . . . . . — — — — (3,412)
Net income available to common shareholders . . . . . . . . . . . . . . . . . . . $ 873,635 $ 438,292 $ 284,017 $ 365,322 $ 440,971
Basic earnings per share:Income before discontinued operations and cumulative effect of a
change in accounting principle . . . . . . . . . . . . . . . . . . . . . . . . . $ 7.62 $ 3.53 $ 2.38 $ 2.84 $ 4.02Discontinued operations, net of minority interest . . . . . . . . . . . . . — 0.45 0.29 0.87 0.55Cumulative effect of a change in accounting principle, net of
minority interest . . . . . . . . . . . . . . . . . . . . . . . . . . . . . . . . . . . . . — (0.04) — — —
Net income available to common shareholders . . . . . . . . . . . . . . . $ 7.62 $ 3.94 $ 2.67 $ 3.71 $ 4.57
Weighted average number of common shares outstanding . . . . . . . . . . 114,721 111,274 106,458 96,900 93,145
Diluted earnings per share:Income before discontinued operations and cumulative effect of a
change in accounting principle . . . . . . . . . . . . . . . . . . . . . . . . . $ 7.46 $ 3.46 $ 2.33 $ 2.80 $ 3.96Discontinued operations, net of minority interest . . . . . . . . . . . . . — 0.44 0.28 0.85 0.54Cumulative effect of a change in accounting principle, net of
minority interest . . . . . . . . . . . . . . . . . . . . . . . . . . . . . . . . . . . . . — (0.04) — — —
Net income available to common shareholders . . . . . . . . . . . . . . . $ 7.46 $ 3.86 $ 2.61 $ 3.65 $ 4.50
Weighted average number of common and common equivalent sharesoutstanding . . . . . . . . . . . . . . . . . . . . . . . . . . . . . . . . . . . . . . . . . . . . . 117,077 113,559 108,762 98,486 94,612
36

December 31,
2006 2005 2004 2003 2002
(in thousands)Balance Sheet information:
Real estate, gross . . . . . . . . . . . . . . . . . . . . . . . . . . . . . . . . . . . . . $9,552,458 $9,151,175 $9,291,227 $8,983,260 $ 8,670,711Real estate, net . . . . . . . . . . . . . . . . . . . . . . . . . . . . . . . . . . . . . . . 8,160,403 7,886,102 8,147,858 7,981,825 7,847,778Cash and cash equivalents . . . . . . . . . . . . . . . . . . . . . . . . . . . . . . 725,788 261,496 239,344 22,686 55,275Total assets . . . . . . . . . . . . . . . . . . . . . . . . . . . . . . . . . . . . . . . . . . 9,695,022 8,902,368 9,063,228 8,551,100 8,427,203Total indebtedness . . . . . . . . . . . . . . . . . . . . . . . . . . . . . . . . . . . . 4,600,937 4,826,254 5,011,814 5,004,720 5,147,220Minority interests . . . . . . . . . . . . . . . . . . . . . . . . . . . . . . . . . . . . . 623,508 739,268 786,328 830,133 844,581Stockholders’ equity . . . . . . . . . . . . . . . . . . . . . . . . . . . . . . . . . . . 3,223,226 2,917,346 2,936,073 2,400,163 2,159,590
For the year ended December 31,
2006 2005 2004 2003 2002
(in thousands, except per share data)Other Information:
Funds from Operations available to common shareholders (1) . . $ 501,125 $ 479,726 $ 459,497 $ 410,012 $ 380,814Funds from Operations available to common shareholders, as
adjusted (1) . . . . . . . . . . . . . . . . . . . . . . . . . . . . . . . . . . . . . . . . 527,665 488,972 459,497 412,073 399,489Dividends declared per share . . . . . . . . . . . . . . . . . . . . . . . . . . . . 8.12 5.19 2.58 2.50 2.41Cash flow provided by operating activities . . . . . . . . . . . . . . . . . 527,979 472,249 429,506 488,275 437,380Cash flow provided by (used in) investing activities . . . . . . . . . . 229,756 356,605 (171,014) 97,496 (1,017,283)Cash flow provided by (used in) financing activities . . . . . . . . . . (293,443) (806,702) (41,834) (618,360) 537,111Total square feet at end of year . . . . . . . . . . . . . . . . . . . . . . . . . . . 43,389 42,013 44,117 43,894 42,411Percentage leased at end of year . . . . . . . . . . . . . . . . . . . . . . . . . . 94.2% 93.8% 92.1% 92.1% 93.9%
(1) Pursuant to the revised definition of Funds from Operations adopted by the Board of Governors of theNational Association of Real Estate Investment Trusts (“NAREIT”), we calculate Funds from Operations, or“FFO,” by adjusting net income (loss) (computed in accordance with GAAP, including non-recurring items)for gains (or losses) from sales of properties, real estate related depreciation and amortization, and afteradjustment for unconsolidated partnerships, joint ventures and preferred distributions. FFO is a non-GAAPfinancial measure. The use of FFO, combined with the required primary GAAP presentations, has beenfundamentally beneficial in improving the understanding of operating results of REITs among the investingpublic and making comparisons of REIT operating results more meaningful. Management generallyconsiders FFO to be a useful measure for reviewing our comparative operating and financial performancebecause, by excluding gains and losses related to sales of previously depreciated operating real estate assetsand excluding real estate asset depreciation and amortization (which can vary among owners of identicalassets in similar condition based on historical cost accounting and useful life estimates), FFO can help onecompare the operating performance of a company’s real estate between periods or as compared to differentcompanies. Our computation of FFO may not be comparable to FFO reported by other REITs or real estatecompanies that do not define the term in accordance with the current NAREIT definition or that interpret thecurrent NAREIT definition differently. Amount represents our share, which was 84.40%, 83.74%, 82.97%,82.06% and 81.98% for the years ended December 31, 2006, 2005, 2004, 2003 and 2002, respectively, afterallocation to the minority interest in the Operating Partnership.
In addition to presenting FFO in accordance with the NAREIT definition, we also disclose FFO, as adjusted,for year ended December 31, 2006 and 2005 which excludes the effects of the losses from earlyextinguishments of debt associated with the sales of real estate. The adjustment to exclude losses from earlyextinguishments of debt results when the sale of real estate encumbered by debt requires us to pay theextinguishment costs prior to the debt’s stated maturity and to write-off unamortized loan costs at the date ofthe extinguishment. Such costs are excluded from the gains on sales of real estate reported in accordancewith GAAP. However, we view the losses from early extinguishments of debt associated with the sales ofreal estate as an incremental cost of the sale transactions because we extinguished the debt in connectionwith the consummation of the sale transactions and we had no intent to extinguish the debt absent suchtransactions. We believe that this supplemental adjustment more appropriately reflects the results of ouroperations exclusive of the impact of our sale transactions.
37

The adjustments for net derivative losses related to non-qualifying derivative contracts for the years endedDecember 31, 2003 and 2002 resulted from interest rate contracts we entered into prior to the effective dateof SFAS No. 133 to limit our exposure to fluctuations in interest rates with respect to variable rate debtassociated with real estate projects under development. Upon transition to SFAS No. 133 on January 1,2001, the impacts of these contracts were recorded in current earnings, while prior to that time they werecapitalized. Although these adjustments were attributable to a single hedging program, the underlyingcontracts extended over multiple reporting periods and therefore resulted in adjustments from 2002 throughthe third quarter of 2003. Management presents FFO before the impact of non-qualifying derivativecontracts because economically this interest rate hedging program was consistent with our risk managementobjective of limiting our exposure to interest rate volatility and the change in accounting under GAAP didnot correspond to a substantive difference. Management does not currently anticipate structuring futurehedging programs in a manner that would give rise to this kind of adjustment.
The adjustments for early lease surrender for the year ended December 31, 2002 resulted from a uniquelease transaction related to the surrender of space by a tenant that was accounted for as a termination forGAAP purposes and recorded in income at the time the space was surrendered. However, we continued tocollect payments monthly after the surrender of space through the month of July 2002, the date on which theterminated lease would otherwise have expired under its original terms. Management presents FFO after theearly surrender lease adjustment because economically this transaction impacted periods subsequent to thetime the space was surrendered by the tenant and, therefore, recording the entire amount of the leasetermination payment in a single period made FFO less useful as an indicator of operating performance.Although these adjustments are attributable to a single lease, the transaction impacted multiple reportingperiods and resulted in an adjustment for the year ended December 31, 2002.
Although our FFO, as adjusted, clearly differs from NAREIT’s definition of FFO, and may not becomparable to that of other REITs and real estate companies, we believe it provides a meaningfulsupplemental measure of our operating performance because we believe that, by excluding the effects of thelosses from early extinguishments of debt associated with the sales of real estate, adjustments fornon-qualifying derivative contracts and early lease surrender payments, management and investors arepresented with an indicator of our operating performance that more closely achieves the objectives of thereal estate industry in presenting FFO.
Neither FFO, nor FFO as adjusted, should be considered as an alternative to net income (determined inaccordance with GAAP) as an indication of our performance. Neither FFO nor FFO, as adjusted, representcash generated from operating activities determined in accordance with GAAP and is not a measure ofliquidity or an indicator of our ability to make cash distributions. We believe that to further understand ourperformance, FFO and FFO, as adjusted should be compared with our reported net income and consideredin addition to cash flows in accordance with GAAP, as presented in our Consolidated Financial Statements.
A reconciliation of FFO, and FFO, as adjusted, to net income available to common shareholders computedin accordance with GAAP is provided under the heading of “Management’s Discussion and Analysis ofFinancial Condition and Results of Operations—Funds from Operations.”
Item 7. Management’s Discussion and Analysis of Financial Condition and Results of Operations
The following discussion should be read in conjunction with the financial statements and notes theretoappearing elsewhere in this report.
Forward-Looking Statements
This Annual Report on Form 10-K contains forward-looking statements within the meaning of the federalsecurities laws, principally, but not only, under the captions “Business-Business and Growth Strategies,” “RiskFactors” and “Management’s Discussion and Analysis of Financial Condition and Results of Operations.” Wecaution investors that any forward-looking statements in this report, or which management may make orally or in
38
writing from time to time, are based on management’s beliefs and on assumptions made by, and informationcurrently available to, management. When used, the words “anticipate,” “believe,” “estimate,” “expect,”“intend,” “may,” “might,” “plan,” “project,” “result” “should,” “will,” and similar expressions which do notrelate solely to historical matters are intended to identify forward-looking statements. These statements aresubject to risks, uncertainties and assumptions and are not guarantees of future performance, which may beaffected by known and unknown risks, trends, uncertainties and factors that are beyond our control. Should oneor more of these risks or uncertainties materialize, or should underlying assumptions prove incorrect, actualresults may differ materially from those anticipated, estimated or projected by the forward-looking statements.We caution you that, while forward-looking statements reflect our good faith beliefs when we make them, theyare not guarantees of future performance and are impacted by actual events when they occur after we make suchstatements. We expressly disclaim any responsibility to update our forward-looking statements, whether as aresult of new information, future events or otherwise. Accordingly, investors should use caution in relying onpast forward-looking statements, which are based on results and trends at the time they are made, to anticipatefuture results or trends.
Some of the risks and uncertainties that may cause our actual results, performance or achievements to differmaterially from those expressed or implied by forward-looking statements include, among others, the following:
• general risks affecting the real estate industry (including, without limitation, the inability to enter into orrenew leases, dependence on tenants’ financial condition, and competition from other developers,owners and operators of real estate);
• failure to manage effectively our growth and expansion into new markets and sub-markets or tointegrate acquisitions and developments successfully;
• risks and uncertainties affecting property development and construction (including, without limitation,construction delays, cost overruns, inability to obtain necessary permits and public opposition to suchactivities);
• risks associated with the availability and terms of financing and the use of debt to fund acquisitions anddevelopments, including the risk associated with interest rates impacting the cost and/or availability offinancing;
• risks associated with forward interest rate contracts and the effectiveness of such arrangements;
• risks associated with downturns in the national and local economies, increases in interest rates, andvolatility in the securities markets;
• risks associated with actual or threatened terrorist attacks;
• risks associated with the impact on our insurance program if TRIA, which expires on December 31,2007, is not extended or is extended on different terms;
• costs of compliance with the Americans with Disabilities Act and other similar laws;
• potential liability for uninsured losses and environmental contamination;
• risks associated with our potential failure to qualify as a REIT under the Internal Revenue Code of 1986,as amended;
• possible adverse changes in tax and environmental laws;
• risks associated with possible state and local tax audits; and
• risks associated with our dependence on key personnel whose continued service is not guaranteed.
The risks included here are not exhaustive. Other sections of this report, including “Part I, Item 1A- RiskFactors,” include additional factors that could adversely affect our business and financial performance.Moreover, we operate in a very competitive and rapidly changing environment. New risk factors emerge fromtime to time and it is not possible for management to predict all such risk factors, nor can we assess the impact of
39
all such risk factors on our business or the extent to which any factor, or combination of factors, may cause actualresults to differ materially from those contained in any forward-looking statements. Given these risks anduncertainties, investors should not place undue reliance on forward-looking statements as a prediction of actualresults. Investors should also refer to our quarterly reports on Form 10-Q for future periods and current reports onForm 8-K as we file them with the SEC, and to other materials we may furnish to the public from time to timethrough current reports on Form 8-K or otherwise.
Overview
We are a fully integrated self-administered and self-managed REIT and one of the largest owners anddevelopers of Class A office properties in the United States. Our properties are concentrated in five markets—Boston, midtown Manhattan, Washington, D.C., San Francisco and Princeton, NJ. We generate revenue and cashprimarily by leasing our Class A office space to our tenants. Factors we consider when we lease space include thecreditworthiness of the tenant, the length of the lease, the rental rate to be paid, the costs of tenant improvements,current and anticipated operating costs and real estate taxes, our current and anticipated vacancy, current andanticipated future demand for office space generally and general economic factors. We also generate cashthrough the sale of assets, which may be either non-core assets that have limited growth potential or core assetsthat command premiums from real estate investors.
The office markets in which we operate continued to show dramatic improvement over the past twelvemonths, with the pace of rental rate growth and the demand for high-quality space continuing to accelerate. Wecontinue to experience strong market rental rate growth in midtown Manhattan, San Francisco, Washington, D.C.and Boston. We expect this trend to continue, but its impact on our rental revenues will be felt gradually giventhe modest amount of 2007 lease expirations. Some of the leases that expire in 2007 reflect the high rentsachieved in the late 1990s and early 2000s, and therefore we could experience some roll down in near-term rentsat certain properties in our portfolio despite the positive overall trends in our markets.
Our core strategy has always been to operate in supply constrained markets, so combining strong demand,increasing replacement costs and scarcity of supply, we expect our assets to continue to appreciate over time.Many individuals and institutions have recognized these same conditions which have translated into a supply ofcapital that continues to compete to own commercial real estate assets. We remain concerned that makingsignificant acquisitions at today’s pricing levels could reduce our ability to enhance our long-term earningsgrowth rate, so we have chosen the path of selectively selling assets, reducing the overall size of the portfolio andfocusing our more substantial investments on new development opportunities. During 2006, we sold $1.26 billionof assets, compared with $838 million during 2005.
We believe the sale of 280 Park Avenue in June 2006 and the sale of 5 Times Square on February 15, 2007are evidence of a trend that sees allocators of capital continuing to place premiums on high-quality, well-locatedoffice buildings resulting in lower capitalization rates and higher prices per square foot. As an owner of thesetypes of assets, we are pleased with higher valuations, and, given current market conditions, we intend tocontinue to explore the selective sale of some of our assets (including core assets) to realize some of this value.Unfortunately, the same market conditions that are leading to record valuations for Class A office buildings andthat make significant asset sales attractive to us are also continuing to make it more difficult for us to acquireassets at what we believe to be attractive rates of return. However, we have acquired and intend to pursue theacquisition of assets at attractive initial rates of return or where the potential exists for long-term valueappreciation.
As we look forward into 2007 and 2008, we will be operating with a smaller portfolio than in prior yearsand we will be concentrating on a growing development pipeline. Given current market conditions, we generallybelieve that the returns we can generate from developments will be significantly greater than those we can expectto realize from acquisitions. As a result, we will continue to focus significant energy and capital on our currentand future development pipeline. We are also considering alternative uses (i.e., non-office) for some of our landholdings and may participate in or undertake alternative development projects. During 2006, we started morethan $300 million of developments and in 2007 we anticipate starting in excess of $1 billion of developments.
40
Critical Accounting Policies
The preparation of financial statements in conformity with accounting principles generally accepted in theUnited States of America, or GAAP, requires management to use judgment in the application of accountingpolicies, including making estimates and assumptions. We base our estimates on historical experience and onvarious other assumptions believed to be reasonable under the circumstances. These judgments affect thereported amounts of assets and liabilities and disclosure of contingent assets and liabilities at the dates of thefinancial statements and the reported amounts of revenue and expenses during the reporting periods. If ourjudgment or interpretation of the facts and circumstances relating to various transactions had been different, it ispossible that different accounting policies would have been applied resulting in a different presentation of ourfinancial statements. From time to time, we evaluate our estimates and assumptions. In the event estimates orassumptions prove to be different from actual results, adjustments are made in subsequent periods to reflect morecurrent information. Below is a discussion of accounting policies that we consider critical in that they mayrequire complex judgment in their application or require estimates about matters that are inherently uncertain.
Real Estate
Upon acquisitions of real estate, we assess the fair value of acquired tangible and intangible assets,including land, buildings, tenant improvements, “above-” and “below-market” leases, origination costs, acquiredin-place leases, other identified intangible assets and assumed liabilities in accordance with Statement ofFinancial Accounting Standards (“SFAS”) No. 141, “Business Combinations” and allocate the purchase price tothe acquired assets and assumed liabilities, including land at appraised value and buildings at replacement cost.We assess and consider fair value based on estimated cash flow projections that utilize discount and/orcapitalization rates that we deem appropriate, as well as available market information. Estimates of future cashflows are based on a number of factors including the historical operating results, known and anticipated trends,and market and economic conditions. The fair value of the tangible assets of an acquired property considers thevalue of the property as if it were vacant. We also consider an allocation of purchase price of other acquiredintangibles, including acquired in-place leases that may have a customer relationship intangible value, including(but not limited to) the nature and extent of the existing relationship with the tenants, the tenants’ credit qualityand expectations of lease renewals. Based on our acquisitions to date, our allocation to customer relationshipintangible assets has been immaterial.
We record acquired “above-” and “below-market” leases at their fair values (using a discount rate whichreflects the risks associated with the leases acquired) equal to the difference between (1) the contractual amountsto be paid pursuant to each in-place lease and (2) management’s estimate of fair market lease rates for eachcorresponding in-place lease, measured over a period equal to the remaining term of the lease for above-marketleases and the initial term plus the term of any below-market fixed rate renewal options for below-market leases.Other intangible assets acquired include amounts for in-place lease values that are based on our evaluation of thespecific characteristics of each tenant’s lease. Factors to be considered include estimates of carrying costs duringhypothetical expected lease-up periods considering current market conditions, and costs to execute similar leases.In estimating carrying costs, we include real estate taxes, insurance and other operating expenses and estimates oflost rentals at market rates during the expected lease-up periods, depending on local market conditions. Inestimating costs to execute similar leases, we consider leasing commissions, legal and other related expenses.
Real estate is stated at depreciated cost. The cost of buildings and improvements includes the purchase priceof property, legal fees and other acquisition costs. Costs directly related to the development of properties arecapitalized. Capitalized development costs include interest, internal wages, property taxes, insurance, and otherproject costs incurred during the period of development.
Management reviews its long-lived assets used in operations for impairment when there is an event orchange in circumstances that indicates an impairment in value. An impairment loss is recognized if the carryingamount of its assets is not recoverable and exceeds its fair value. If such impairment is present, an impairment
41

loss is recognized based on the excess of the carrying amount of the asset over its fair value. The evaluation ofanticipated cash flows is highly subjective and is based in part on assumptions regarding future occupancy, rentalrates and capital requirements that could differ materially from actual results in future periods. Since cash flowson properties considered to be “long-lived assets to be held and used” as defined by SFAS No. 144 “Accountingfor the Impairment or Disposal of Long-Lived Assets,” (“SFAS No. 144”) are considered on an undiscountedbasis to determine whether an asset has been impaired, our established strategy of holding properties over thelong term directly decreases the likelihood of recording an impairment loss. If our strategy changes or marketconditions otherwise dictate an earlier sale date, an impairment loss may be recognized and such loss could bematerial. If we determine that impairment has occurred, the affected assets must be reduced to their fair value.No such impairment losses have been recognized to date.
SFAS No. 144 requires that qualifying assets and liabilities and the results of operations that have been sold,or otherwise qualify as “held for sale,” be presented as discontinued operations in all periods presented if theproperty operations are expected to be eliminated and we will not have significant continuing involvementfollowing the sale. The components of the property’s net income that is reflected as discontinued operationsinclude the net gain (or loss) upon the disposition of the property held for sale, operating results, depreciation andinterest expense (if the property is subject to a secured loan). We generally consider assets to be “held for sale”when the transaction has been approved by our Board of Directors, or a committee thereof, and there are noknown significant contingencies relating to the sale, such that the property sale within one year is consideredprobable. Following the classification of a property as “held for sale,” no further depreciation is recorded on theassets.
A variety of costs are incurred in the acquisition, development and leasing of properties. After thedetermination is made to capitalize a cost, it is allocated to the specific component of a project that is benefited.Determination of when a development project is substantially complete and capitalization must cease involves adegree of judgment. Our capitalization policy on development properties is guided by SFAS No. 34“Capitalization of Interest Cost” and SFAS No. 67 “Accounting for Costs and the Initial Rental Operations ofReal Estate Projects.” The costs of land and buildings under development include specifically identifiable costs.The capitalized costs include pre-construction costs essential to the development of the property, developmentcosts, construction costs, interest costs, real estate taxes, salaries and related costs and other costs incurred duringthe period of development. We consider a construction project as substantially completed and held available foroccupancy upon the completion of tenant improvements, but no later than one year from cessation of majorconstruction activity. We cease capitalization on the portion (1) substantially completed and (2) occupied or heldavailable for occupancy, and we capitalize only those costs associated with the portion under construction.
Investments in Unconsolidated Joint Ventures
Except for ownership interests in variable interest entities, we account for our investments in joint venturesunder the equity method of accounting because we exercise significant influence over, but do not control, theseentities. These investments are recorded initially at cost, as Investments in Unconsolidated Joint Ventures, andsubsequently adjusted for equity in earnings and cash contributions and distributions. Any difference between thecarrying amount of these investments on our balance sheet and the underlying equity in net assets is amortized asan adjustment to equity in earnings of unconsolidated joint ventures over the life of the related asset. Under theequity method of accounting, our net equity is reflected within the Consolidated Balance Sheets, and our share ofnet income or loss from the joint ventures is included within the Consolidated Statements of Operations. Thejoint venture agreements may designate different percentage allocations among investors for profits and losses,however, our recognition of joint venture income or loss generally follows the joint venture’s distributionpriorities, which may change upon the achievement of certain investment return thresholds. For ownershipinterests in variable interest entities, we consolidate those in which we are the primary beneficiary.
Revenue Recognition
Base rental revenue is reported on a straight-line basis over the terms of our respective leases. In accordancewith SFAS No. 141, we recognize rental revenue of acquired in-place “above-” and “below-market” leases at
42

their fair values over the terms of the respective leases. Accrued rental income as reported on the ConsolidatedBalance Sheets represents rental income recognized in excess of rent payments actually received pursuant to theterms of the individual lease agreements.
Our leasing strategy is generally to secure creditworthy tenants that meet our underwriting guidelines.Furthermore, following the initiation of a lease, we continue to actively monitor the tenant’s creditworthiness toensure that all tenant related assets are recorded at their realizable value. When assessing tenant credit quality,we:
• review relevant financial information, including:
• financial ratios;
• net worth;
• debt to market capitalization; and
• liquidity;
• evaluate the depth and experience of the tenant’s management team; and
• assess the strength/growth of the tenant’s industry.
As a result of the underwriting process, tenants are then categorized into one of three categories:
(1) low risk tenants;
(2) the tenant’s credit is such that we require collateral, in which case we:
• require a security deposit; and/or
• reduce upfront tenant improvement investments; or
(3) the tenant’s credit is below our acceptable parameters.
We maintain a rigorous process of monitoring the credit quality of our tenant base. We provide anallowance for doubtful accounts arising from estimated losses that could result from the tenant’s inability tomake required current rent payments and an allowance against accrued rental income for future potential lossesthat we deem to be unrecoverable over the term of the lease.
Tenant receivables are assigned a credit rating of 1-4 with a rating of 1 representing the highest possiblerating with no allowance recorded and a rating of 4 representing the lowest credit rating, recording a full reserveagainst the receivable balance. Among the factors considered in determining the credit rating include:
• payment history;
• credit status and change in status (credit ratings for public companies are used as a primary metric);
• change in tenant space needs (i.e., expansion/downsize);
• tenant financial performance;
• economic conditions in a specific geographic region; and
• industry specific credit considerations.
If our estimates of collectibility differ from the cash received, the timing and amount of our reportedrevenue could be impacted. The average remaining term of our in-place tenant leases was approximately7.8 years as of December 31, 2006. The credit risk is mitigated by the high quality of our existing tenant base,reviews of prospective tenants’ risk profiles prior to lease execution and frequent monitoring of our portfolio toidentify potential problem tenants.
43

Recoveries from tenants, consisting of amounts due from tenants for common area maintenance, real estatetaxes and other recoverable costs, are recognized as revenue in the period the expenses are incurred. Tenantreimbursements are recognized and presented in accordance with Emerging Issues Task Force, or EITF, Issue99-19 “Reporting Revenue Gross as a Principal versus Net as an Agent,” or Issue 99-19. Issue 99-19 requires thatthese reimbursements be recorded on a gross basis, as we are generally the primary obligor with respect topurchasing goods and services from third-party suppliers, have discretion in selecting the supplier and have creditrisk. We also receive reimbursement of payroll and payroll related costs from third parties which we reflect on anet basis in accordance with Issue 99-19.
Our hotel revenues are derived from room rentals and other sources such as charges to guests for long-distance telephone service, fax machine use, movie and vending commissions, meeting and banquet roomrevenue and laundry services. Hotel revenues are recognized as earned.
We receive management and development fees from third parties. Management fees are recorded and earnedbased on a percentage of collected rents at the properties under management, and not on a straight-line basis,because such fees are contingent upon the collection of rents. We review each development agreement and recorddevelopment fees on a straight-line basis or percentage of completion depending on the risk associated with eachproject. Profit on development fees earned from joint venture projects is recognized as revenue to the extent ofthe third party partners’ ownership interest.
Gains on sales of real estate are recognized pursuant to the provisions of SFAS No. 66, “Accounting forSales of Real Estate.” The specific timing of the sale is measured against various criteria in SFAS No. 66 relatedto the terms of the transactions and any continuing involvement in the form of management or financialassistance associated with the properties. If the sales criteria are not met, we defer gain recognition and accountfor the continued operations of the property by applying the finance, installment or cost recovery methods, asappropriate, until the sales criteria are met.
Depreciation and Amortization
We compute depreciation and amortization on our properties using the straight-line method based onestimated useful asset lives. In accordance with SFAS No. 141, we allocate the acquisition cost of real estate toland, building, tenant improvements, acquired “above-” and “below-market” leases, origination costs andacquired in-place leases based on an assessment of their fair value and depreciate or amortize these assets overtheir useful lives. The amortization of acquired “above-” and “below-market” leases and acquired in-place leasesis recorded as an adjustment to revenue and depreciation and amortization, respectively, in the ConsolidatedStatements of Operations.
Fair Value of Financial Instruments
For purposes of disclosure, we calculate the fair value of our mortgage notes payable and unsecured seniornotes. We discount the spread between the future contractual interest payments and future interest payments onour mortgage debt and unsecured notes based on a current market rate. In determining the current market rate, weadd our estimate of a market spread to the quoted yields on federal government treasury securities with similarmaturity dates to our own debt. Because our valuations of our financial instruments are based on these types ofestimates, the fair value of our financial instruments may change if our estimates do not prove to be accurate.
Results of Operations
The following discussion is based on our Consolidated Financial Statements for the years endedDecember 31, 2006, 2005 and 2004.
At December 31, 2006, 2005 and 2004, we owned or had interests in a portfolio of 131, 121 and 125properties, respectively (the “Total Property Portfolio”). As a result of changes within our Total Property
44

Portfolio, the financial data presented below shows significant changes in revenue and expenses fromperiod-to-period. Accordingly, we do not believe that our period-to-period financial data with respect to the TotalProperty Portfolio are necessarily meaningful. Therefore, the comparisons of operating results for the yearsended 2006, 2005 and 2004 show separately the changes attributable to the properties that were owned by usthroughout each period compared (the “Same Property Portfolio”) and the changes attributable to the TotalProperty Portfolio.
In our analysis of operating results, particularly to make comparisons of net operating income betweenperiods meaningful, it is important to provide information for properties that were in-service and owned by usthroughout each period presented. We refer to properties acquired or placed in-service prior to the beginning ofthe earliest period presented and owned by us through the end of the latest period presented as our Same PropertyPortfolio. The Same Property Portfolio therefore excludes properties placed in-service, acquired or repositionedafter the beginning of the earliest period presented or disposed of prior to the end of the latest period presented.
Net operating income, or “NOI,” is a non-GAAP financial measure equal to net income available tocommon shareholders, the most directly comparable GAAP financial measure, plus cumulative effect of a changein accounting principle (net of minority interest), minority interest in Operating Partnership, losses from earlyextinguishments of debt, depreciation and amortization, interest expense, general and administrative expense,less gains on sales of real estate from discontinued operations (net of minority interest), income fromdiscontinued operations (net of minority interest), gains on sales of real estate and other assets (net of minorityinterest), income from unconsolidated joint ventures, minority interest in property partnerships, interest and otherincome and development and management services revenue. We use NOI internally as a performance measureand believe NOI provides useful information to investors regarding our financial condition and results ofoperations because it reflects only those income and expense items that are incurred at the property level.Therefore, we believe NOI is a useful measure for evaluating the operating performance of our real estate assets.
Our management also uses NOI to evaluate regional property level performance and to make decisions aboutresource allocations. Further, we believe NOI is useful to investors as a performance measure because, whencompared across periods, NOI reflects the impact on operations from trends in occupancy rates, rental rates,operating costs and acquisition and development activity on an unleveraged basis, providing perspective notimmediately apparent from net income. NOI excludes certain components from net income in order to provideresults that are more closely related to a property’s results of operations. For example, interest expense is notnecessarily linked to the operating performance of a real estate asset and is often incurred at the corporate level asopposed to the property level. In addition, depreciation and amortization, because of historical cost accounting anduseful life estimates, may distort operating performance at the property level. NOI presented by us may not becomparable to NOI reported by other REITs that define NOI differently. We believe that in order to facilitate a clearunderstanding of our operating results, NOI should be examined in conjunction with net income as presented in ourconsolidated financial statements. NOI should not be considered as an alternative to net income as an indication ofour performance or to cash flows as a measure of liquidity or ability to make distributions.
Comparison of the year ended December 31, 2006 to the year ended December 31, 2005
The table below shows selected operating information for the Same Property Portfolio and the TotalProperty Portfolio. The Same Property Portfolio consists of 113 properties, including two hotel properties,properties acquired or placed in-service on or prior to January 1, 2005 and owned through December 31, 2006,totaling approximately 29.0 million net rentable square feet of space (excluding square feet of structuredparking). The Total Property Portfolio includes the effects of the other properties either placed in-service,acquired or repositioned after January 1, 2005 or disposed of on or prior to December 31, 2006. This tableincludes a reconciliation from the Same Property Portfolio to the Total Property Portfolio by also providinginformation for the year ended December 31, 2006 and 2005 with respect to the properties which were acquired,placed in-service, repositioned or sold.
45

Sam
eP
rope
rty
Por
tfol
ioP
rope
rtie
sSo
ldP
rope
rtie
sA
cqui
red
Pro
pert
ies
Pla
ced
In-S
ervi
ceP
rope
rtie
sR
epos
itio
ned
Tot
alP
rope
rty
Por
tfol
io
(dol
lars
inth
ousa
nds)
2006
2005
Incr
ease
/(D
ecre
ase)
%C
hang
e20
0620
0520
0620
0520
0620
0520
0620
0520
0620
05In
crea
se/
(Dec
reas
e)%
Cha
nge
Ren
talR
even
ue:
Ren
talR
even
ue..
....
....
....
....
....
.$1
,243
,672
$1,2
09,5
89$3
4,08
32.
82%
$32,
208
$104
,430
$15,
498
$28
$24,
117
$412
$20,
402
$13,
094
$1,3
35,8
97$1
,327
,553
$8,
344
0.63
%T
erm
inat
ion
Inco
me
....
....
....
....
...
8,13
75,
416
2,72
150
.24%
—6,
064
——
——
——
8,13
711
,480
(3,3
43)
(29.
12)%
Tot
alR
enta
lRev
enue
....
....
....
....
....
..1,
251,
809
1,21
5,00
536
,804
3.03
%32
,208
110,
494
15,4
9828
24,1
1741
220
,402
13,0
941,
344,
034
1,33
9,03
35,
001
0.37
%
Rea
lEst
ate
Ope
ratin
gE
xpen
ses
....
....
....
..41
1,48
638
9,95
421
,532
5.52
%14
,307
44,8
185,
866
184,
731
122
5,42
43,
423
441,
814
438,
335
3,47
90.
79%
Net
Ope
ratin
gIn
com
e,ex
clud
ing
hote
ls..
....
..84
0,32
382
5,05
115
,272
1.85
%17
,901
65,6
769,
632
1019
,386
290
14,9
789,
671
902,
220
900,
698
1,52
20.
17%
Hot
elN
etO
pera
ting
Inco
me
(1)
....
....
....
..21
,452
17,5
883,
864
21.9
7%—
——
——
——
—21
,452
17,5
883,
864
21.9
7%
Con
solid
ated
Net
Ope
ratin
gIn
com
e(1
)..
....
..86
1,77
584
2,63
919
,136
2.27
%17
,901
65,6
769,
632
1019
,386
290
14,9
789,
671
923,
672
918,
286
5,38
60.
59%
Oth
erR
even
ue:
Dev
elop
men
tand
Man
agem
ents
ervi
ces
....
....
——
——
——
——
——
——
19,8
2517
,310
2,51
514
.53%
Inte
rest
and
Oth
er..
....
....
....
....
....
...
——
——
——
——
——
——
36,7
3712
,015
24,7
2220
5.76
%
Tot
alO
ther
Rev
enue
....
....
....
....
....
...
——
——
——
——
——
——
56,5
6229
,325
27,2
3792
.88%
Oth
erE
xpen
ses:
Gen
eral
and
adm
inis
trat
ive
....
....
....
..—
——
——
——
——
——
—59
,375
55,4
713,
904
7.04
%In
tere
st..
....
....
....
....
....
....
....
——
——
——
——
——
——
298,
260
308,
091
(9,8
31)
(3.1
9)%
Dep
reci
atio
nan
dam
ortiz
atio
n..
....
....
..25
6,10
224
7,38
58,
717
3.52
%3,
502
17,6
956,
758
—7,
365
943,
032
1,65
527
6,75
926
6,82
99,
930
3.72
%L
osse
sfr
omea
rly
extin
guis
hmen
tsof
debt
....
....
....
....
....
....
....
..—
——
——
——
——
——
—32
,143
12,8
9619
,247
149.
25%
Tot
alO
ther
Exp
ense
s..
....
....
....
....
....
.25
6,10
224
7,38
58,
717
3.52
%3,
502
17,6
956,
758
—7,
365
943,
032
1,65
566
6,53
764
3,28
723
,250
3.61
%In
com
ebe
fore
min
ority
inte
rest
s..
....
....
....
$60
5,67
3$
595,
254
$10,
419
1.75
%$1
4,39
9$
47,9
81$
2,87
4$
10$1
2,02
1$1
96$1
1,94
6$
8,01
6$
313,
697
$30
4,32
4$
9,37
33.
08%
Inco
me
from
unco
nsol
idat
edjo
intv
entu
res
....
.$
$$
%$
$$
$$
$$
—$
—24
,507
4,82
919
,678
407.
50%
Inco
me
from
disc
ontin
ued
oper
atio
ns,n
etof
min
ority
inte
rest
....
....
....
....
....
....
.$
—$
—$
——
$$
1,90
8$
—$—
$—
$—$
—$
——
1,90
8(1
,908
)(1
00.0
)%M
inor
ityin
tere
sts
inpr
oper
typa
rtne
rshi
ps..
....
2,01
36,
017
(4,0
04)
(66.
54)%
Min
ority
inte
rest
inO
pera
ting
Part
ners
hip
....
..(7
2,97
6)(7
4,10
3)1,
127
1.52
%G
ains
onsa
les
ofre
ales
tate
,net
ofm
inor
ityin
tere
st..
....
....
....
....
....
....
....
..60
6,39
415
1,88
445
4,51
029
9.25
%G
ains
onsa
les
ofre
ales
tate
from
disc
ontin
ued
oper
atio
ns,n
etof
min
ority
inte
rest
....
....
..—
47,6
56(4
7,65
6)(1
00.0
)%C
umul
ativ
eef
fect
ofa
chan
gein
acco
untin
gpr
inci
ple,
neto
fm
inor
ityin
tere
st..
....
....
.—
(4,2
23)
4,22
310
0.0%
Net
Inco
me
avai
labl
eto
com
mon
shar
ehol
ders
...
$87
3,63
5$
438,
292
$435
,343
99.3
3%
(1)
For
ade
taile
ddi
scus
sion
ofN
OI,
incl
udin
gth
ere
ason
sm
anag
emen
tbel
ieve
sN
OI
isus
eful
toin
vest
ors,
see
page
45.H
otel
Net
Ope
ratin
gIn
com
efo
rth
eye
ars
ende
dD
ecem
ber
31,2
006
and
2005
are
com
pris
edof
Hot
elR
even
ueof
$76,
990
and
$69,
277
less
Hot
elE
xpen
ses
of$5
5,53
8an
d$5
1,68
9,re
spec
tivel
ype
rth
eC
onso
lidat
edIn
com
eSt
atem
ent.
46
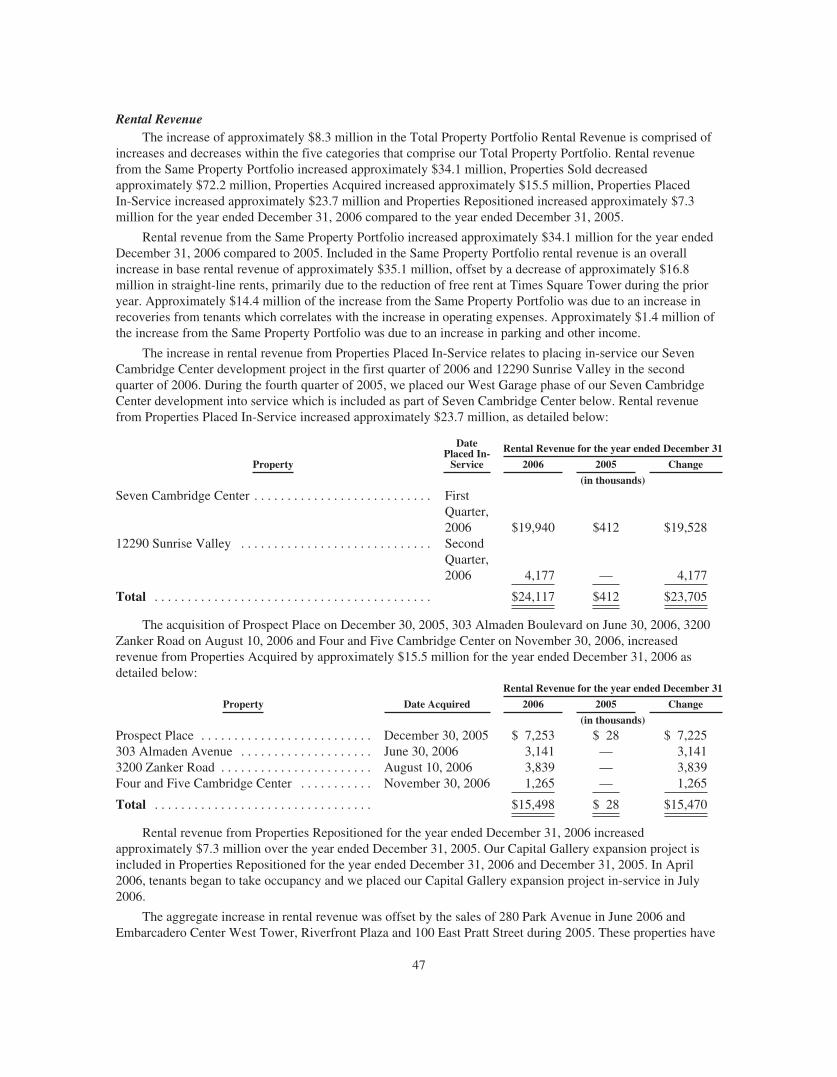
Rental RevenueThe increase of approximately $8.3 million in the Total Property Portfolio Rental Revenue is comprised of
increases and decreases within the five categories that comprise our Total Property Portfolio. Rental revenuefrom the Same Property Portfolio increased approximately $34.1 million, Properties Sold decreasedapproximately $72.2 million, Properties Acquired increased approximately $15.5 million, Properties PlacedIn-Service increased approximately $23.7 million and Properties Repositioned increased approximately $7.3million for the year ended December 31, 2006 compared to the year ended December 31, 2005.
Rental revenue from the Same Property Portfolio increased approximately $34.1 million for the year endedDecember 31, 2006 compared to 2005. Included in the Same Property Portfolio rental revenue is an overallincrease in base rental revenue of approximately $35.1 million, offset by a decrease of approximately $16.8million in straight-line rents, primarily due to the reduction of free rent at Times Square Tower during the prioryear. Approximately $14.4 million of the increase from the Same Property Portfolio was due to an increase inrecoveries from tenants which correlates with the increase in operating expenses. Approximately $1.4 million ofthe increase from the Same Property Portfolio was due to an increase in parking and other income.
The increase in rental revenue from Properties Placed In-Service relates to placing in-service our SevenCambridge Center development project in the first quarter of 2006 and 12290 Sunrise Valley in the secondquarter of 2006. During the fourth quarter of 2005, we placed our West Garage phase of our Seven CambridgeCenter development into service which is included as part of Seven Cambridge Center below. Rental revenuefrom Properties Placed In-Service increased approximately $23.7 million, as detailed below:
Property
DatePlaced In-
Service
Rental Revenue for the year ended December 31
2006 2005 Change
(in thousands)
Seven Cambridge Center . . . . . . . . . . . . . . . . . . . . . . . . . . . FirstQuarter,2006 $19,940 $412 $19,528
12290 Sunrise Valley . . . . . . . . . . . . . . . . . . . . . . . . . . . . . SecondQuarter,2006 4,177 — 4,177
Total . . . . . . . . . . . . . . . . . . . . . . . . . . . . . . . . . . . . . . . . . . $24,117 $412 $23,705
The acquisition of Prospect Place on December 30, 2005, 303 Almaden Boulevard on June 30, 2006, 3200Zanker Road on August 10, 2006 and Four and Five Cambridge Center on November 30, 2006, increasedrevenue from Properties Acquired by approximately $15.5 million for the year ended December 31, 2006 asdetailed below:
Property Date Acquired
Rental Revenue for the year ended December 31
2006 2005 Change
(in thousands)
Prospect Place . . . . . . . . . . . . . . . . . . . . . . . . . . December 30, 2005 $ 7,253 $ 28 $ 7,225303 Almaden Avenue . . . . . . . . . . . . . . . . . . . . June 30, 2006 3,141 — 3,1413200 Zanker Road . . . . . . . . . . . . . . . . . . . . . . . August 10, 2006 3,839 — 3,839Four and Five Cambridge Center . . . . . . . . . . . November 30, 2006 1,265 — 1,265
Total . . . . . . . . . . . . . . . . . . . . . . . . . . . . . . . . . $15,498 $ 28 $15,470
Rental revenue from Properties Repositioned for the year ended December 31, 2006 increasedapproximately $7.3 million over the year ended December 31, 2005. Our Capital Gallery expansion project isincluded in Properties Repositioned for the year ended December 31, 2006 and December 31, 2005. In April2006, tenants began to take occupancy and we placed our Capital Gallery expansion project in-service in July2006.
The aggregate increase in rental revenue was offset by the sales of 280 Park Avenue in June 2006 andEmbarcadero Center West Tower, Riverfront Plaza and 100 East Pratt Street during 2005. These properties have
47
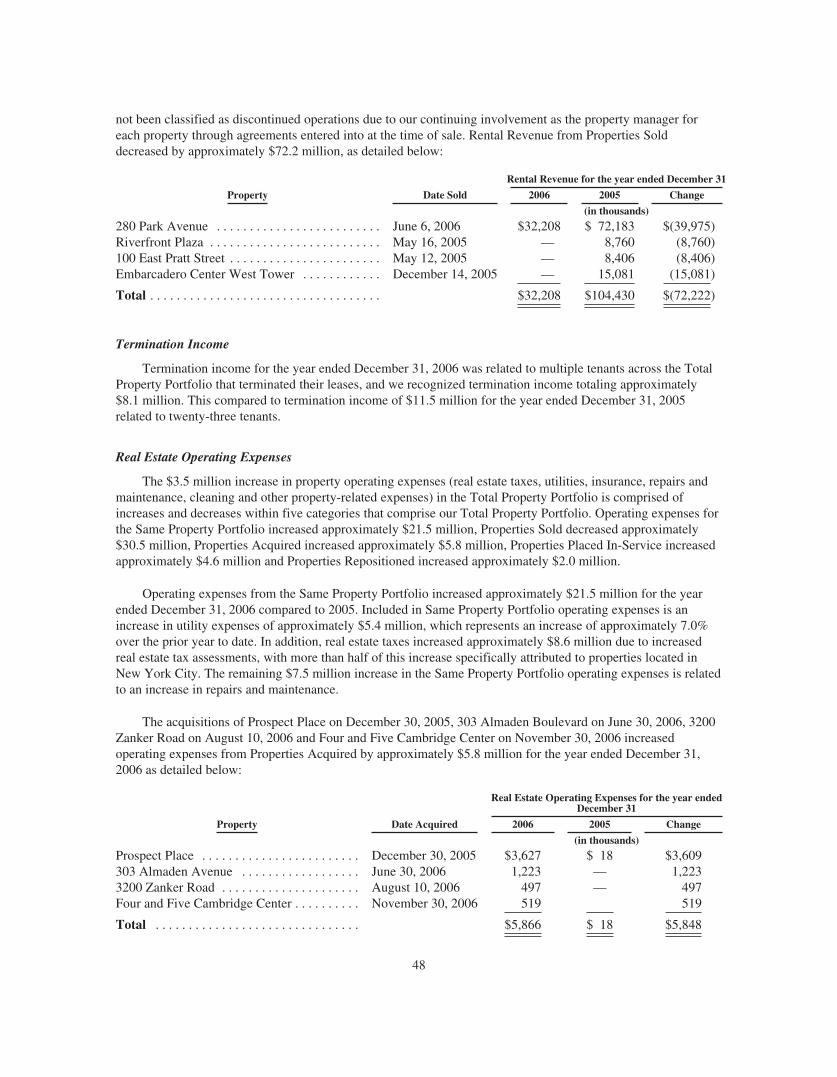
not been classified as discontinued operations due to our continuing involvement as the property manager foreach property through agreements entered into at the time of sale. Rental Revenue from Properties Solddecreased by approximately $72.2 million, as detailed below:
Property Date Sold
Rental Revenue for the year ended December 31
2006 2005 Change
(in thousands)
280 Park Avenue . . . . . . . . . . . . . . . . . . . . . . . . . June 6, 2006 $32,208 $ 72,183 $(39,975)Riverfront Plaza . . . . . . . . . . . . . . . . . . . . . . . . . . May 16, 2005 — 8,760 (8,760)100 East Pratt Street . . . . . . . . . . . . . . . . . . . . . . . May 12, 2005 — 8,406 (8,406)Embarcadero Center West Tower . . . . . . . . . . . . December 14, 2005 — 15,081 (15,081)
Total . . . . . . . . . . . . . . . . . . . . . . . . . . . . . . . . . . . $32,208 $104,430 $(72,222)
Termination Income
Termination income for the year ended December 31, 2006 was related to multiple tenants across the TotalProperty Portfolio that terminated their leases, and we recognized termination income totaling approximately$8.1 million. This compared to termination income of $11.5 million for the year ended December 31, 2005related to twenty-three tenants.
Real Estate Operating Expenses
The $3.5 million increase in property operating expenses (real estate taxes, utilities, insurance, repairs andmaintenance, cleaning and other property-related expenses) in the Total Property Portfolio is comprised ofincreases and decreases within five categories that comprise our Total Property Portfolio. Operating expenses forthe Same Property Portfolio increased approximately $21.5 million, Properties Sold decreased approximately$30.5 million, Properties Acquired increased approximately $5.8 million, Properties Placed In-Service increasedapproximately $4.6 million and Properties Repositioned increased approximately $2.0 million.
Operating expenses from the Same Property Portfolio increased approximately $21.5 million for the yearended December 31, 2006 compared to 2005. Included in Same Property Portfolio operating expenses is anincrease in utility expenses of approximately $5.4 million, which represents an increase of approximately 7.0%over the prior year to date. In addition, real estate taxes increased approximately $8.6 million due to increasedreal estate tax assessments, with more than half of this increase specifically attributed to properties located inNew York City. The remaining $7.5 million increase in the Same Property Portfolio operating expenses is relatedto an increase in repairs and maintenance.
The acquisitions of Prospect Place on December 30, 2005, 303 Almaden Boulevard on June 30, 2006, 3200Zanker Road on August 10, 2006 and Four and Five Cambridge Center on November 30, 2006 increasedoperating expenses from Properties Acquired by approximately $5.8 million for the year ended December 31,2006 as detailed below:
Property Date Acquired
Real Estate Operating Expenses for the year endedDecember 31
2006 2005 Change
(in thousands)
Prospect Place . . . . . . . . . . . . . . . . . . . . . . . . December 30, 2005 $3,627 $ 18 $3,609303 Almaden Avenue . . . . . . . . . . . . . . . . . . June 30, 2006 1,223 — 1,2233200 Zanker Road . . . . . . . . . . . . . . . . . . . . . August 10, 2006 497 — 497Four and Five Cambridge Center . . . . . . . . . . November 30, 2006 519 519
Total . . . . . . . . . . . . . . . . . . . . . . . . . . . . . . . $5,866 $ 18 $5,848
48

The increase in operating expenses from Properties Placed In-Service relates to placing in-service our SevenCambridge Center development project in the first quarter of 2006 and 12290 Sunrise Valley in the secondquarter of 2006. During the fourth quarter of 2005, we placed our West Garage phase of our Seven CambridgeCenter development into service and it is included as part of Seven Cambridge Center below. Operating expensesfrom Properties Placed In-Service increased approximately $4.6 million, as detailed below:
PropertyDate Placed In-
Service
Real Estate Operating Expenses for the year endedDecember 31
2006 2005 Change
(in thousands)
Seven Cambridge Center . . . . . . . . . . . . . . First Quarter, 2006 $4,277 $122 $4,15512290 Sunrise Valley . . . . . . . . . . . . . . . . . Second Quarter, 2006 454 — 454
Total . . . . . . . . . . . . . . . . . . . . . . . . . . . . . . $4,731 $122 $4,609
Operating expenses from Properties Repositioned for the year ended December 31, 2006 increasedapproximately $2.0 million over the year ended December 31, 2005. Our Capital Gallery expansion project isincluded in Properties Repositioned for the year ended December 31, 2006 and December 31, 2005. In April2006, tenants began to take occupancy and during July 2006, we placed our Capital Gallery expansion projectin-service.
A decrease of approximately $30.5 million in the Total Property Portfolio operating expenses was due to thesales of 280 Park Avenue in June 2006 and Embarcadero Center West Tower, 100 East Pratt Street andRiverfront Plaza in 2005, as detailed below:
Property Date Sold
Real Estate Operating Expenses for the year endedDecember 31
2006 2005 Change
(in thousands)
280 Park Avenue . . . . . . . . . . . . . . . . . . . . . . . June 6, 2006 $14,307 $32,418 $(18,111)100 East Pratt Street . . . . . . . . . . . . . . . . . . . . May 12, 2005 — 3,019 (3,019)Riverfront Plaza . . . . . . . . . . . . . . . . . . . . . . . May 16, 2005 — 2,864 (2,864)Embarcadero Center West Tower . . . . . . . . . . December 14, 2005 — 6,517 (6,517)
Total . . . . . . . . . . . . . . . . . . . . . . . . . . . . . . . . $14,307 $44,818 $(30,511)
We continue to review and monitor the impact of rising insurance and energy costs, as well as other factors,on our operating budgets for fiscal year 2007. Because some operating expenses are not recoverable fromtenants, an increase in operating expenses due to one or more of the foregoing factors could have an adverseeffect on our results of operations.
Hotel Net Operating Income
Net operating income for the hotel properties increased approximately $3.9 million, a 22.0% increase for theyear ended December 31, 2006 as compared to 2005. For the year ended December 31, 2005 the operations of theResidence Inn by Marriott has been included as part of discontinued operations due to its sale on November 4,2005. We expect the hotels to contribute in the aggregate between approximately $24 million and $25 million ofnet operating income in 2007.
The following reflects our occupancy and rate information for our hotel properties for the year endedDecember 31, 2006 and 2005:
2006 2005Percentage
Change
Occupancy . . . . . . . . . . . . . . . . . . . . . . . . . . . . . . . . . . . . . . . . . . . . . . . . . . . . . . . 79.3% 77.4% 2.5%Average daily rate . . . . . . . . . . . . . . . . . . . . . . . . . . . . . . . . . . . . . . . . . . . . . . . . . $217.18 $197.82 9.8%Revenue per available room, REVPAR . . . . . . . . . . . . . . . . . . . . . . . . . . . . . . . . . $173.35 $153.95 12.6%
49

Development and Management Services
Development and Management Services income increased approximately $2.5 million for the year endedDecember 31, 2006 compared to 2005. Management Service income has increased approximately $1.6 milliondue to management contracts following the sales of 100 East Pratt Street, Riverfront Plaza and EmbarcaderoCenter West Tower in 2005, as well as the sale of 280 Park Avenue on June 6, 2006. Approximately $0.5 millionof the increase related to tenant improvement construction management fees earned, the majority of which was inSan Francisco. An increase in development income of approximately $0.4 million was due to the increasingdevelopment activity at our 505 9th Street joint venture project.
Interest and Other Income
Interest and other income increased by approximately $24.7 million for the year ended December 31, 2006compared to 2005 as a result of higher overall interest rates and increased cash balances. During the secondquarter of 2006, we issued $450 million of 3.75% exchangeable senior notes due 2036. On June 6, 2006, wecompleted the sale of 280 Park Avenue for net cash proceeds of approximately $875 million. The decision todeclare a special dividend was the result of the sales of assets in 2006, including 280 Park Avenue and 265Franklin Street.
Other Expenses
General and Administrative
General and administrative expenses increased approximately $3.9 million for the year ended December 31,2006 compared to 2005. An overall increase of approximately $4.7 million was attributed to bonuses and salariesfor the year ended December 31, 2006 compared to 2005 and approximately $1.5 million related to tax savingsduring 2005. These increases were offset by approximately $2.1 million of decreased accounting- and legal-relatedexpenses, and other overall decreases aggregating approximately $0.2 million. We anticipate our general andadministrative expenses to be between $66 million and $67 million for the year 2007. A significant portion of theexpected increase results from the final ramp-up on our long-term equity compensation program described below.
Commencing in 2003, we issued restricted stock and/or LTIP Units, as opposed to granting stock optionsand restricted stock, under the 1997 Stock Option and Incentive Plan as our primary vehicle for employee equitycompensation. An LTIP Unit is generally the economic equivalent of a share of our restricted stock. Employeesgenerally vest in restricted stock and LTIP Units over a five-year term (for awards granted prior to 2003, vestingis in equal annual installments; for those granted in 2003 through 2006, vesting occurs over a five-year term withannual vesting of 0%, 0%, 25%, 35% and 40%; and for awards granted in 2007, vesting will occur in equalannual installments over a four-year term). Restricted stock and LTIP Units are valued based on observablemarket prices for similar instruments. Such value is recognized as an expense ratably over the correspondingemployee service period. LTIP Units that were issued in January 2005 and all subsequent LTIP Unit awards willbe valued using an option pricing model in accordance with the provisions of SFAS No. 123R. To the extentrestricted stock or LTIP Units are forfeited prior to vesting, the corresponding previously recognized expense isreversed as an offset to “stock-based compensation.” Stock-based compensation associated with approximately$11.4 million of restricted stock and LTIP Units granted in January 2005 and approximately $11.3 million ofrestricted stock and LTIP Units granted in April 2006 will be incurred ratably as such restricted stock and LTIPUnits vest.
Interest Expense
Interest expense for the Total Property Portfolio decreased approximately $9.8 million for the year endedDecember 31, 2006 compared to 2005. The majority of the decreases are due to (1) the repayment of outstandingmortgage debt in connection with the sales of 280 Park Avenue in June 2006, Riverfront Plaza and 100 East PrattStreet in the second quarter of 2005, and Embarcadero Center West Tower in October 2005, which collectively
50

decreased interest expense by $20.4 million and (2) the repayment of our mortgage loans collateralized byCapital Gallery, Montvale Center, 101 Carnegie Center, 191 Spring Street and 601 and 651 Gateway Boulevard,which decreased interest expense approximately $8.2 million. These decreases were offset by (1) increases ofapproximately $8.6 million at Times Square Tower due to increasing interest rates (5.85% on December 31, 2006and 4.87% on December 31, 2005) and the increased principal balance due to the refinancing of the mortgageloan in June 2005, (2) an increase of approximately $12.3 million related to interest paid on the $450 million of3.75% exchangeable senior notes due 2036 issued in the second quarter of 2006 by our Operating Partnershipand (3) a net increase of approximately $1.2 million due to the interest imputed on the unpaid redemption pricerelated to the redemption of the outside members’ equity interest at Citigroup Center to reflect the fair value ofdebt as well as the impact of placing Seven Cambridge Center into service prior to the repayment of debt. Theremaining decrease is attributed to scheduled loan amortization on our outstanding debt.
We expect interest expense to decrease in 2007, taking into account approximately (1) $361 million of debtrepayments during 2006, (2) debt defeasance of approximately $254.4 million in connection with the sale of 280Park Avenue, an increase in capitalized interest due to development projects, offset by interest on our unsecuredexchangeable senior notes and the refinancing of our 599 Lexington Avenue mortgage loan.
At December 31, 2006, our variable rate debt consisted of our construction loan at Times Square Tower andour secured borrowings under our unsecured line of credit. The following summarizes our outstanding debt as ofDecember 31, 2006 compared with December 31, 2005:
December 31,
2006 2005
(dollars in thousands)
Debt Summary:Balance
Fixed rate . . . . . . . . . . . . . . . . . . . . . . . . . . . . . . . . . . . . . . . . . . . . . . . . . . . . . . . . . $3,889,447 $3,952,151Variable rate . . . . . . . . . . . . . . . . . . . . . . . . . . . . . . . . . . . . . . . . . . . . . . . . . . . . . . 711,490 874,103
Total . . . . . . . . . . . . . . . . . . . . . . . . . . . . . . . . . . . . . . . . . . . . . . . . . . . . . . . . $4,600,937 $4,826,254
Percent of total debt:Fixed rate . . . . . . . . . . . . . . . . . . . . . . . . . . . . . . . . . . . . . . . . . . . . . . . . . . . . . . . . . 84.54% 81.89%Variable rate . . . . . . . . . . . . . . . . . . . . . . . . . . . . . . . . . . . . . . . . . . . . . . . . . . . . . . 15.46% 18.11%
Total . . . . . . . . . . . . . . . . . . . . . . . . . . . . . . . . . . . . . . . . . . . . . . . . . . . . . . . . 100.00% 100.00%
Weighted average interest rate at end of period:Fixed rate . . . . . . . . . . . . . . . . . . . . . . . . . . . . . . . . . . . . . . . . . . . . . . . . . . . . . . . . . 6.27% 6.70%Variable rate . . . . . . . . . . . . . . . . . . . . . . . . . . . . . . . . . . . . . . . . . . . . . . . . . . . . . . 5.80% 4.96%
Total . . . . . . . . . . . . . . . . . . . . . . . . . . . . . . . . . . . . . . . . . . . . . . . . . . . . . . . . 6.20% 6.39%
Depreciation and Amortization
Depreciation and amortization expense for the Total Property Portfolio increased approximately $9.9 millionfor the year ended December 31, 2006 compared to 2005. The increase in depreciation and amortization consistedof approximately $7.3 million due to the placing in-service of our Seven Cambridge Center development project inthe first quarter of 2006 and 12290 Sunrise Valley in the second quarter of 2006, approximately $6.8 million relatedto the acquisition of Prospect Place on December 30, 2005, 303 Almaden Boulevard on June 30, 2006, 3200 ZankerRoad on August 10, 2006 and Four and Five Cambridge Center in November 2006, and approximately $1.4 millionrelated to placing Capital Gallery into service during the third quarter. The increase was offset by reductions indepreciation and amortization resulting from the sales of 280 Park Avenue in June 2006 and Embarcadero Center
51

West Tower, 100 East Pratt Street and Riverfront Plaza in 2005, which resulted in an aggregate decrease ofapproximately $14.2 million. Depreciation and amortization in the Same Property Portfolio increased approximately$8.7 million for the year ended December 31, 2006 compared to 2005.
Capitalized Costs
Costs directly related to the development of rental properties are not included in our operating results. Thesecosts are capitalized and included in real estate assets on our Consolidated Balance Sheets and amortized overtheir useful lives. Capitalized development costs include interest, wages, property taxes, insurance and otherproject costs incurred during the period of development. Capitalized wages for the year ended December 31,2006 and 2005 were $7.0 million and $5.9 million, respectively. These costs are not included in the general andadministrative expenses discussed above. We expect capitalized wages to increase proportionately with ourincreased development activity and increased wages into 2007 and 2008. Interest capitalized for the year endedDecember 31, 2006 and 2005 was $5.9 million and $5.7 million, respectively. These costs are not included in theinterest expense referenced above.
Losses from early extinguishments of debt
For the year ended December 31, 2006, in connection with the sale of 280 Park Avenue, we legally defeasedthe mortgage indebtedness collateralized by the property, totaling approximately $254.4 million. In connectionwith the legal defeasance of the mortgage indebtedness at 280 Park Avenue, we recognized a loss from earlyextinguishment of debt totaling approximately $31.4 million consisting of the difference between the value of theU.S. Treasuries and the principal balance of the mortgage loan totaling approximately $28.2 million and thewrite-off of unamortized deferred financing costs totaling approximately $3.2 million. In addition, we repaidconstruction financing collateralized by our Seven Cambridge Center property. The construction financing atSeven Cambridge Center totaling approximately $112.5 million was repaid using approximately $7.5 million ofavailable cash and $105.0 million drawn under our Unsecured Line of Credit. There was no prepayment penaltyassociated with the repayment for Seven Cambridge Center. We recognized losses from early extinguishments ofdebt totaling approximately $0.5 million consisting of the write-off of unamortized deferred financing costs. Werepaid the construction and permanent financing at Capital Gallery totaling approximately $34.0 million and$49.7 million using available cash. We recognized a loss from early extinguishment of debt totalingapproximately $0.2 million comprised of a prepayment penalty and the write-off of unamortized deferred financecosts. During 2006, we also repaid the mortgage loan collateralized by our Embarcadero Center Three propertylocated in San Francisco, California totaling approximately $133.4 million, the mortgage loan collateralized byour 191 Spring Street property located in Lexington, Massachusetts totaling approximately $17.9 million, themortgage loan collateralized by our Montvale Center property located in Gaithersburg, Maryland totalingapproximately $6.6 million and the mortgage loan collateralized by our 101 Carnegie Center property located inPrinceton, New Jersey totaling approximately $6.6 million. There were no significant prepayment penalties orwrite-offs of unamortized deferred financing costs related to these repayments.
In connection with the sales of 100 East Pratt Street and Riverfront Plaza in May 2005, we repaid themortgage loans collateralized by the properties totaling approximately $188 million. For the year endedDecember 31, 2005, we recognized a loss from early extinguishment of debt totaling approximately $11.0million, consisting of prepayment fees of approximately $10.8 million and the write-off of unamortized deferredfinancing costs of approximately $0.2 million. We also recognized a $1.9 million loss from early extinguishmentof debt, which relates to the refinancing of our Times Square Tower mortgage loan and the modification on ourUnsecured Line of Credit.
Income from Unconsolidated Joint Ventures
On September 15, 2006, a joint venture in which we have a 35% interest sold 265 Franklin Street located inBoston, Massachusetts, at a sale price of approximately $170.0 million. Net cash proceeds totaled approximately
52

$108.3 million, of which our share was approximately $37.9 million, after the repayment of mortgageindebtedness of approximately $60.8 million and unfunded tenant obligations and other closing costs ofapproximately $0.9 million. The venture recognized a gain on sale of real estate of approximately $51.4 million,of which our share was approximately $18.0 million, and a loss from early extinguishment of debt ofapproximately $0.2 million, of which our share was $0.1 million.
Income from discontinued operations, net of minority interest
For the year ended December 31, 2006 there were no properties included in discontinued operations.Properties included in discontinued operations for the year ended December 31, 2005 consisted of 40-46 HarvardStreet, the Residence Inn by Marriott and Old Federal Reserve.
Minority interest in property partnership
Minority interest in property partnership consists of the outside equity interests in the venture that ownsCitigroup Center. This venture was consolidated with our financial results because we exercised control over theentity. Due to the redemption of the minority interest holder’s interest at Citigroup Center on May 31, 2006,minority interest in property partnership will no longer reflect an allocation to the minority interest holder.
Minority interest in Operating Partnership
Minority interest in Operating Partnership decreased $1.1 million for the year ended December 31, 2006compared to 2005. In connection with the special dividend declared on December 15, 2006 payable onJanuary 30, 2007, holders of Series Two Preferred Units will participate on an as-converted basis in connectionwith their regular May 2007 distribution payment as provided for in the Operating Partnership’s partnershipagreement. As a result, we accrued approximately $12.2 million for the year ended December 31, 2006 related tothe special cash distribution payable to holders of the Series Two Preferred Units and have allocated earnings tothe Series Two Preferred Units of approximately $12.2 million, which amount has been reflected in minorityinterest in Operating Partnership for the year ended December 31, 2006.
In connection with the special cash distribution declared in July 2005, holders of Series Two Preferred Unitsparticipated on an as-converted basis in connection with their regular February 2006 distribution payment asprovided for in the Operating Partnership’s partnership agreement. As a result, we accrued approximately $12.1million for the year ended December 31, 2005 related to the special cash distribution payable to holders of theSeries Two Preferred Units and allocated earnings to the Series Two Preferred Units of approximately $12.1million, which amount is reflected in minority interest in Operating Partnership for the year ended December 31,2005. This decrease was offset by an increase related to the minority interest in our Operating Partnership’sincome allocation related to an underlying increase in allocable income.
Gains on sales of real estate, net of minority interest
On June 6, 2006, we sold 280 Park Avenue, a 1,179,000 net rentable square foot Class A office propertylocated in midtown Manhattan, New York, for approximately $1.2 billion. Net proceeds totaled approximately$875 million after legal defeasance of indebtedness secured by the property (consisting of approximately $254.4million of principal indebtedness and approximately $28.2 million of related defeasance costs) and the paymentof transfer taxes, brokers’ fees and other customary closing costs. We recognized at closing a gain on sale ofapproximately $583.3 million (net of minority interest share of approximately $109.2 million).
Under the purchase and sale agreement, we have also agreed to provide to the buyer fixed monthly revenuesupport from the closing date until December 31, 2008. The aggregate amount of the revenue support paymentswill be approximately $22.5 million and has been recorded as a purchase price adjustment and included in OtherLiabilities within our Consolidated Balance Sheet. Pursuant to the purchase and sale agreement we also enteredinto a master lease agreement with the buyer at closing. Under the master lease agreement, we have guaranteedthat the buyer will receive at least a minimum amount of base rent from approximately 74,340 square feet of
53
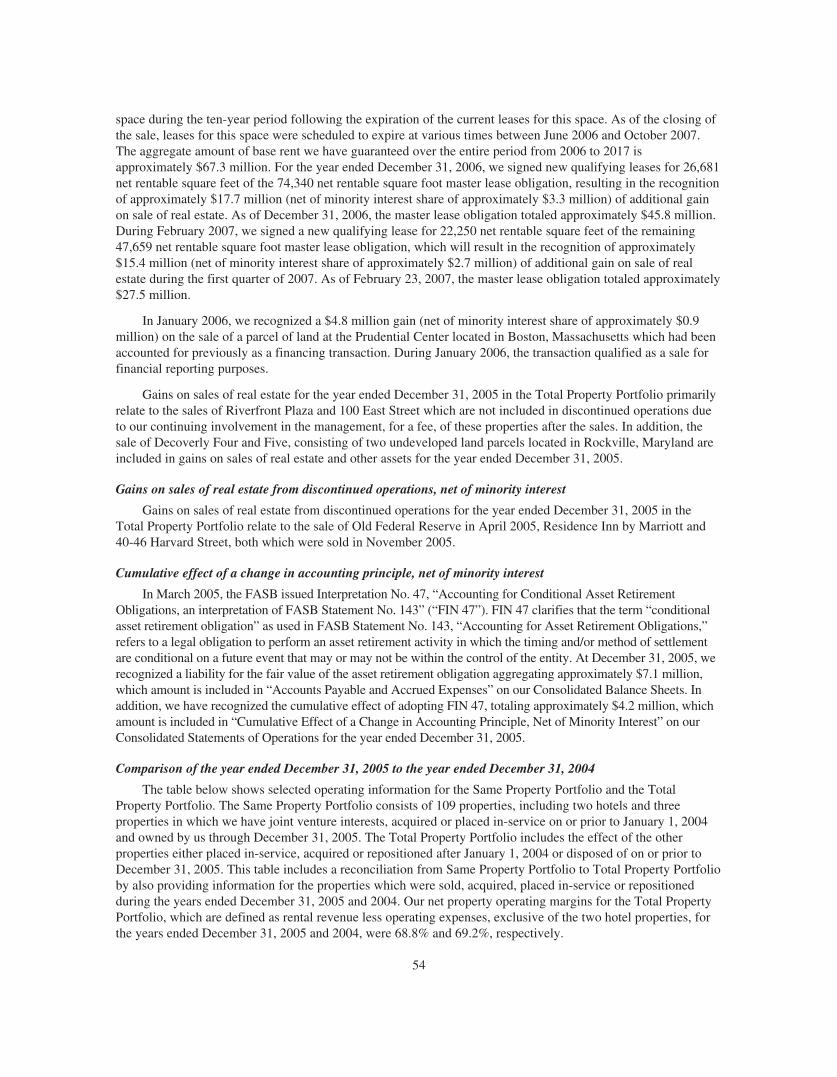
space during the ten-year period following the expiration of the current leases for this space. As of the closing ofthe sale, leases for this space were scheduled to expire at various times between June 2006 and October 2007.The aggregate amount of base rent we have guaranteed over the entire period from 2006 to 2017 isapproximately $67.3 million. For the year ended December 31, 2006, we signed new qualifying leases for 26,681net rentable square feet of the 74,340 net rentable square foot master lease obligation, resulting in the recognitionof approximately $17.7 million (net of minority interest share of approximately $3.3 million) of additional gainon sale of real estate. As of December 31, 2006, the master lease obligation totaled approximately $45.8 million.During February 2007, we signed a new qualifying lease for 22,250 net rentable square feet of the remaining47,659 net rentable square foot master lease obligation, which will result in the recognition of approximately$15.4 million (net of minority interest share of approximately $2.7 million) of additional gain on sale of realestate during the first quarter of 2007. As of February 23, 2007, the master lease obligation totaled approximately$27.5 million.
In January 2006, we recognized a $4.8 million gain (net of minority interest share of approximately $0.9million) on the sale of a parcel of land at the Prudential Center located in Boston, Massachusetts which had beenaccounted for previously as a financing transaction. During January 2006, the transaction qualified as a sale forfinancial reporting purposes.
Gains on sales of real estate for the year ended December 31, 2005 in the Total Property Portfolio primarilyrelate to the sales of Riverfront Plaza and 100 East Street which are not included in discontinued operations dueto our continuing involvement in the management, for a fee, of these properties after the sales. In addition, thesale of Decoverly Four and Five, consisting of two undeveloped land parcels located in Rockville, Maryland areincluded in gains on sales of real estate and other assets for the year ended December 31, 2005.
Gains on sales of real estate from discontinued operations, net of minority interest
Gains on sales of real estate from discontinued operations for the year ended December 31, 2005 in theTotal Property Portfolio relate to the sale of Old Federal Reserve in April 2005, Residence Inn by Marriott and40-46 Harvard Street, both which were sold in November 2005.
Cumulative effect of a change in accounting principle, net of minority interest
In March 2005, the FASB issued Interpretation No. 47, “Accounting for Conditional Asset RetirementObligations, an interpretation of FASB Statement No. 143” (“FIN 47”). FIN 47 clarifies that the term “conditionalasset retirement obligation” as used in FASB Statement No. 143, “Accounting for Asset Retirement Obligations,”refers to a legal obligation to perform an asset retirement activity in which the timing and/or method of settlementare conditional on a future event that may or may not be within the control of the entity. At December 31, 2005, werecognized a liability for the fair value of the asset retirement obligation aggregating approximately $7.1 million,which amount is included in “Accounts Payable and Accrued Expenses” on our Consolidated Balance Sheets. Inaddition, we have recognized the cumulative effect of adopting FIN 47, totaling approximately $4.2 million, whichamount is included in “Cumulative Effect of a Change in Accounting Principle, Net of Minority Interest” on ourConsolidated Statements of Operations for the year ended December 31, 2005.
Comparison of the year ended December 31, 2005 to the year ended December 31, 2004
The table below shows selected operating information for the Same Property Portfolio and the TotalProperty Portfolio. The Same Property Portfolio consists of 109 properties, including two hotels and threeproperties in which we have joint venture interests, acquired or placed in-service on or prior to January 1, 2004and owned by us through December 31, 2005. The Total Property Portfolio includes the effect of the otherproperties either placed in-service, acquired or repositioned after January 1, 2004 or disposed of on or prior toDecember 31, 2005. This table includes a reconciliation from Same Property Portfolio to Total Property Portfolioby also providing information for the properties which were sold, acquired, placed in-service or repositionedduring the years ended December 31, 2005 and 2004. Our net property operating margins for the Total PropertyPortfolio, which are defined as rental revenue less operating expenses, exclusive of the two hotel properties, forthe years ended December 31, 2005 and 2004, were 68.8% and 69.2%, respectively.
54

Sam
eP
rope
rty
Por
tfol
ioP
rope
rtie
sSo
ldP
rope
rtie
sA
cqui
red
Pro
pert
ies
Pla
ced
In-S
ervi
ceP
rope
rtie
sR
epos
itio
ned
Tot
alP
rope
rty
Por
tfol
io
(dol
lars
inth
ousa
nds)
2005
2004
Incr
ease
/(D
ecre
ase)
%C
hang
e20
0520
0420
0520
0420
0520
0420
0520
0420
0520
04In
crea
se/
(Dec
reas
e)%
Cha
nge
Ren
talR
even
ue:
Ren
talR
even
ue..
....
....
....
...
$1,1
76,0
06$1
,147
,496
$28,
510
2.48
%$3
2,24
7$6
3,06
7$2
6,50
3$1
9,34
4$7
9,70
3$4
0,87
3$1
3,09
4$1
4,36
9$1
,327
,553
$1,2
85,1
49$
42,4
043.
30%
Ter
min
atio
nIn
com
e..
....
....
....
11,3
113,
982
7,32
918
4.05
%—
9—
—16
9—
——
11,4
803,
991
7,48
918
7.65
%
Tot
alR
enta
lRev
enue
....
....
....
....
.1,
187,
317
1,15
1,47
835
,839
3.11
%32
,247
63,0
7626
,503
19,3
4479
,872
40,8
7313
,094
14,3
691,
339,
033
1,28
9,14
049
,893
3.87
%
Ope
ratin
gE
xpen
ses
....
....
....
....
..40
3,96
438
0,67
823
,286
6.12
%12
,399
22,7
065,
665
4,19
812
,884
4,47
43,
423
4,27
143
8,33
541
6,32
722
,008
5.29
%
Net
Ope
ratin
gIn
com
e,ex
clud
ing
hote
ls..
....
....
....
....
....
....
.78
3,35
377
0,80
012
,553
1.63
%19
,848
40,3
7020
,838
15,1
4666
,988
36,3
999,
671
10,0
9890
0,69
887
2,81
327
,885
3.19
%
Hot
elN
etO
pera
ting
Inco
me
(1)
....
....
17,5
8816
,985
603
3.55
%—
——
——
——
—17
,588
16,9
8560
33.
55%
Con
solid
ated
Net
Ope
ratin
gIn
com
e(1
)..
800,
941
787,
785
13,1
561.
67%
19,8
4840
,370
20,8
3815
,146
66,9
8836
,399
9,67
110
,098
918,
286
889,
798
28,4
883.
20%
Oth
erR
even
ue:
Dev
elop
men
tand
Man
agem
ent
serv
ices
....
....
....
....
....
....
..—
——
——
——
——
——
—17
,310
20,4
40(3
,130
)(1
5.31
)%In
tere
stan
dO
ther
....
....
....
....
....
——
——
——
——
——
——
12,0
1510
,339
1,67
616
.21%
Tot
alO
ther
Rev
enue
....
....
....
....
.—
——
——
——
——
——
—29
,325
30,7
79(1
,454
)(4
.72)
%O
ther
Exp
ense
s:G
ener
alan
dad
min
istr
ativ
e..
....
..—
——
——
——
——
——
—55
,471
53,6
361,
835
3.42
%In
tere
st..
....
....
....
....
....
..—
——
——
——
——
——
—30
8,09
130
6,17
01,
921
0.63
%D
epre
ciat
ion
and
amor
tizat
ion
....
..23
4,93
722
0,17
114
,766
6.71
%5,
983
12,7
915,
497
3,85
018
,757
7,90
91,
655
4,92
826
6,82
924
9,64
917
,180
6.88
%L
osse
sfr
omea
rly
extin
guis
hmen
tsof
debt
....
....
....
....
....
....
.—
——
——
——
——
——
—12
,896
6,25
86,
638
106.
07%
Tot
alO
ther
Exp
ense
s..
....
....
....
...
234,
937
220,
171
14,7
666.
71%
5,98
312
,791
5,49
73,
850
18,7
577,
909
1,65
54,
928
643,
287
615,
713
27,5
744.
48%
Inco
me
befo
rem
inor
ityin
tere
sts
....
....
$56
6,00
4$
567,
614
$(1
,610
)(0
.28)
%$1
3,86
5$2
7,57
9$1
5,34
1$1
1,29
6$4
8,23
1$2
8,49
0$
8,01
6$
5,17
0$
304,
324
$30
4,86
4$
(540
)(0
.18)
%In
com
efr
omun
cons
olid
ated
join
tve
ntur
es..
....
....
....
....
....
...
$2,
602
$3,
054
$(4
52)
(14.
80)%
$—
$30
4$
103
$(3
2)$
2,12
4$
54—
—4,
829
3,38
01,
449
42.8
7%
Inco
me
from
disc
ontin
ued
oper
atio
ns,n
etof
min
ority
inte
rest
....
....
....
....
.$
—$
——
—$
1,90
8$
3,34
4—
——
——
—1,
908
3,34
4(1
,436
)(4
2.94
)%M
inor
ityin
tere
sts
inpr
oper
typa
rtne
rshi
ps..
....
....
....
....
....
6,01
74,
685
1,33
228
.43%
Min
ority
inte
rest
inO
pera
ting
Part
ners
hip
....
....
....
....
....
...
(74,
103)
(67,
743)
(6,3
60)
9.39
%G
ains
onsa
les
ofre
ales
tate
,net
ofm
inor
ityin
tere
st..
....
....
....
....
.15
1,88
48,
149
143,
735
1,76
3.84
%G
ains
onsa
les
ofre
ales
tate
from
disc
ontin
ued
oper
atio
ns,n
etof
min
ority
inte
rest
....
....
....
....
....
....
..47
,656
27,3
3820
,318
74.3
2%C
umul
ativ
eef
fect
ofa
chan
gein
acco
untin
gpr
inci
ple,
neto
fm
inor
ityin
tere
st..
....
....
....
....
....
....
(4,2
23)
—(4
,223
)(1
00.0
)%
Net
Inco
me
avai
labl
eto
com
mon
shar
ehol
ders
....
....
....
....
....
..$
438,
292
$28
4,01
7$1
54,2
7554
.32%
(2)
For
ade
taile
ddi
scus
sion
ofN
OI,
incl
udin
gth
ere
ason
sm
anag
emen
tbel
ieve
sN
OI
isus
eful
toin
vest
ors,
see
page
45.H
otel
Net
Ope
ratin
gIn
com
efo
rth
eye
ars
ende
dD
ecem
ber
31,2
005
and
2004
are
com
pris
edof
Hot
elR
even
ueof
$69,
277
and
$66,
427
less
Hot
elE
xpen
ses
of$5
1,68
9an
d$4
9,44
2,re
spec
tivel
ype
rth
eC
onso
lidat
edIn
com
eSt
atem
ent.
55

Rental Revenue
The increase of $42.4 million in the Total Property Portfolio is comprised of increases and decreases withinthe five categories that represent our Total Property Portfolio. Rental revenue from Properties Placed In-Serviceincreased approximately $38.8 million, Same Property Portfolio increased approximately $28.5 million,Properties Acquired increased approximately $7.2 million, Properties Sold decreased approximately $30.8million and Properties Repositioned decreased approximately $1.3 million.
The increase in rental revenue from Properties Placed In-Service relates to placing in-service Times SquareTower and New Dominion Technology Park, Building Two during the third quarter of 2004, and the WestGarage phase of our Seven Cambridge Center development in the fourth quarter of 2005 as detailed below:
Date Placed-in-service
Rental Revenue for the year ended
Property 2005 2004 Change
(in thousands)
Times Square Tower . . . . . . . . . . . . . . . . . . . . . . . . . . . . . . . 3rd Quarter 2004 $69,608 $36,470 $33,138New Dominion Technology Park, Building Two . . . . . . . . . 3rd Quarter 2004 9,683 4,403 5,280Cambridge Center West Garage . . . . . . . . . . . . . . . . . . . . . . 4th Quarter 2005 412 — 412
Total . . . . . . . . . . . . . . . . . . . . . . . . . . . . . . . . . . . . . . . . . . . $79,703 $40,873 $38,830
Rental revenue from the Same Property Portfolio increased approximately $28.5 million from 2004.Included in rental revenue is an overall increase in base rental revenue of approximately $8.9 million due toincreases in our occupancy from 92.1% on December 31, 2004 to 93.8% on December 31, 2005 which was offsetby a roll-down in market rents. Straight-line rent increased approximately $6.5 million for the year endedDecember 31, 2005 compared to December 31, 2004. Approximately $13.6 million of the increase from theSame Property Portfolio was due to an increase in recoveries from tenants attributed to higher operatingexpenses.
The acquisition of Prospect Place on December 30, 2005, 1330 Connecticut Avenue on April 1, 2004 andthe purchase of the remaining interest in 140 Kendrick Street on March 24, 2004 increased revenue fromProperties Acquired by approximately $7.2 million, as detailed below:
Date Acquired
Rental Revenue for the year ended
Property 2005 2004 Change
(in thousands)
1330 Connecticut Avenue . . . . . . . . . . . . . . . . . . . . . . . . . April 1, 2004 $14,860 $10,870 $3,990140 Kendrick Street . . . . . . . . . . . . . . . . . . . . . . . . . . . . . March 24, 2004 11,614 8,474 3,140Prospect Place . . . . . . . . . . . . . . . . . . . . . . . . . . . . . . . . . . December 30, 2005 29 — 29
Total . . . . . . . . . . . . . . . . . . . . . . . . . . . . . . . . . . . . . . . . . $26,503 $19,344 $7,159
56

The aggregate increase in rental revenue was offset by the sales of Embarcadero Center West Tower,Riverfront Plaza and 100 East Pratt Street during 2005, and Hilltop Office Center during 2004. These propertieshave not been classified as discontinued operations due to our continuing involvement as the property managerfor each property. Revenue from Properties Sold decreased by approximately $30.8 million, as detailed below:
Date Sold
Rental Revenue for the year ended
Property 2005 2004 Change
(in thousands)
Embarcadero Center West Tower . . . . . . . . . . . . . . . . . . . . December 14, 2005 $15,081 $17,837 $ (2,756)Riverfront Plaza . . . . . . . . . . . . . . . . . . . . . . . . . . . . . . . . . . May 16, 2005 8,760 23,488 (14,728)100 East Pratt Street . . . . . . . . . . . . . . . . . . . . . . . . . . . . . . May 12, 2005 8,406 21,602 (13,196)Hilltop Office Center . . . . . . . . . . . . . . . . . . . . . . . . . . . . . . February 4, 2004 — 140 (140)
Total . . . . . . . . . . . . . . . . . . . . . . . . . . . . . . . . . . . . . . . . . . $32,247 $63,067 $(30,820)
In September 2004, we commenced the redevelopment of our Capital Gallery property in Washington, D.C.Capital Gallery is a Class A office property totaling approximately 397,000 square feet. The project entailsremoving a three-story low-rise section of the property comprised of 100,000 square feet from in-service statusand developing it into a 10-story office building resulting in a total complex size of approximately 610,000square feet upon completion. This property is included in Properties Repositioned for the year endedDecember 31, 2005 and 2004. Rental revenue has decreased for the year ended December 31, 2005 due to takingthe three-story low-rise section out of service in September 2004.
Termination Income
Termination income for year ended December 31, 2005 was related to twenty-three tenants across the TotalProperty Portfolio that terminated their leases, and we recognized termination income totaling approximately$11.5 million. This compared to termination income earned for the year ended December 31, 2004 related tonineteen tenants totaling $4.0 million. During 2005 we completed several leasing transactions which involvedtaking space back from tenants with resulting termination income and releasing the space at higher rents.
Operating Expenses
The $22.0 million increase in property operating expenses in the Total Property Portfolio (real estate taxes,utilities, insurance, repairs and maintenance, cleaning and other property-related expenses) is comprised ofincreases and decreases within the five categories that represent our Total Property Portfolio. Operating expensesfor the Same Property Portfolio increased approximately $23.3 million, Properties Placed In-Service increasedapproximately $8.4 million, Properties Acquired increased approximately $1.4 million, Properties Sold decreasedapproximately $10.3 million and Properties Repositioned decreased approximately $0.8 million.
Operating expenses from the Same Property Portfolio increased approximately $23.3 million for the yearended December 31, 2005 compared to 2004. Included in Same Property Portfolio operating expenses is anincrease in utility expenses of approximately $10.2 million, an increase of approximately 14% over the prior yearutility expense. In addition, real estate taxes increased approximately $7.9 million due to increased real estate taxassessments, with approximately half of this increase specifically attributed to properties located in New YorkCity. The remaining $5.2 million increase in the Same Property Portfolio operating expenses are related to anincrease to repairs and maintenance.
57

We placed in-service Times Square Tower and New Dominion Technology Park, Building Two during thethird quarter of 2004 and the West Garage phase of our Seven Cambridge Center development in the fourthquarter of 2005 increasing operating expenses by approximately $8.4 million as detailed below:
Date Placed-in-service
Operating Expenses for theyear ended
Property 2005 2004 Change
(in thousands)
Times Square Tower . . . . . . . . . . . . . . . . . . . . . . . . . . . . . . . . . . . 3rd Quarter 2004 $11,168 $4,053 $7,115New Dominion Technology Park Building Two . . . . . . . . . . . . . . 3rd Quarter 2004 1,595 421 1,174West Garage . . . . . . . . . . . . . . . . . . . . . . . . . . . . . . . . . . . . . . . . . . 4th Quarter 2005 121 — 121
Total . . . . . . . . . . . . . . . . . . . . . . . . . . . . . . . . . . . . . . . . . . . . . . . $12,884 $4,474 $8,410
In addition, approximately $1.4 million of the increase in Total Property Portfolio operating expensesprimarily relates to the acquisitions of Prospect Place at the end of 2005 as well as our acquisitions in 2004 of1330 Connecticut Avenue and the remaining interest in 140 Kendrick Street, as detailed below:
Date Acquired
Operating Expenses for theyear ended
Property 2005 2004 Change
(in thousands)
1330 Connecticut Avenue . . . . . . . . . . . . . . . . . . . . . . . . . . . . . . April 1, 2004 $4,220 $2,986 $1,234140 Kendrick Street . . . . . . . . . . . . . . . . . . . . . . . . . . . . . . . . . . March 24, 2004 1,427 1,212 215Prospect Place . . . . . . . . . . . . . . . . . . . . . . . . . . . . . . . . . . . . . . . December 30, 2005 18 — 18
Total . . . . . . . . . . . . . . . . . . . . . . . . . . . . . . . . . . . . . . . . . . . . . . $5,665 $4,198 $1,467
A decrease of approximately $10.3 million in Total Property Portfolio operating expenses relates to the salesof Embarcadero Center West Tower, 100 East Pratt Street and Riverfront Plaza in 2005, and Hilltop OfficeCenter in 2004, as detailed below:
Date Sold
Operating Expenses for theyear ended
Property 2005 2004 Change
(in thousands)
Embarcadero Center West Tower . . . . . . . . . . . . . . . . . . . . December 14, 2005 $ 6,516 $ 6,866 $ (350)100 East Pratt Street . . . . . . . . . . . . . . . . . . . . . . . . . . . . . . May 12, 2005 3,019 8,039 (5,020)Riverfront Plaza . . . . . . . . . . . . . . . . . . . . . . . . . . . . . . . . . . May 16, 2005 2,864 7,764 (4,900)Hilltop Office Center . . . . . . . . . . . . . . . . . . . . . . . . . . . . . . February 4, 2004 — 37 (37)
Total . . . . . . . . . . . . . . . . . . . . . . . . . . . . . . . . . . . . . . . . . . $12,399 $22,706 $(10,307)
Hotel Net Operating Income
Net operating income for the hotel properties increased by approximately $0.6 million for the year endedDecember 31, 2005 compared to 2004. For the years ended December 31, 2005 and 2004 the Residence Inn byMarriott was included as part of discontinued operations due to its sale on November 4, 2005.
58
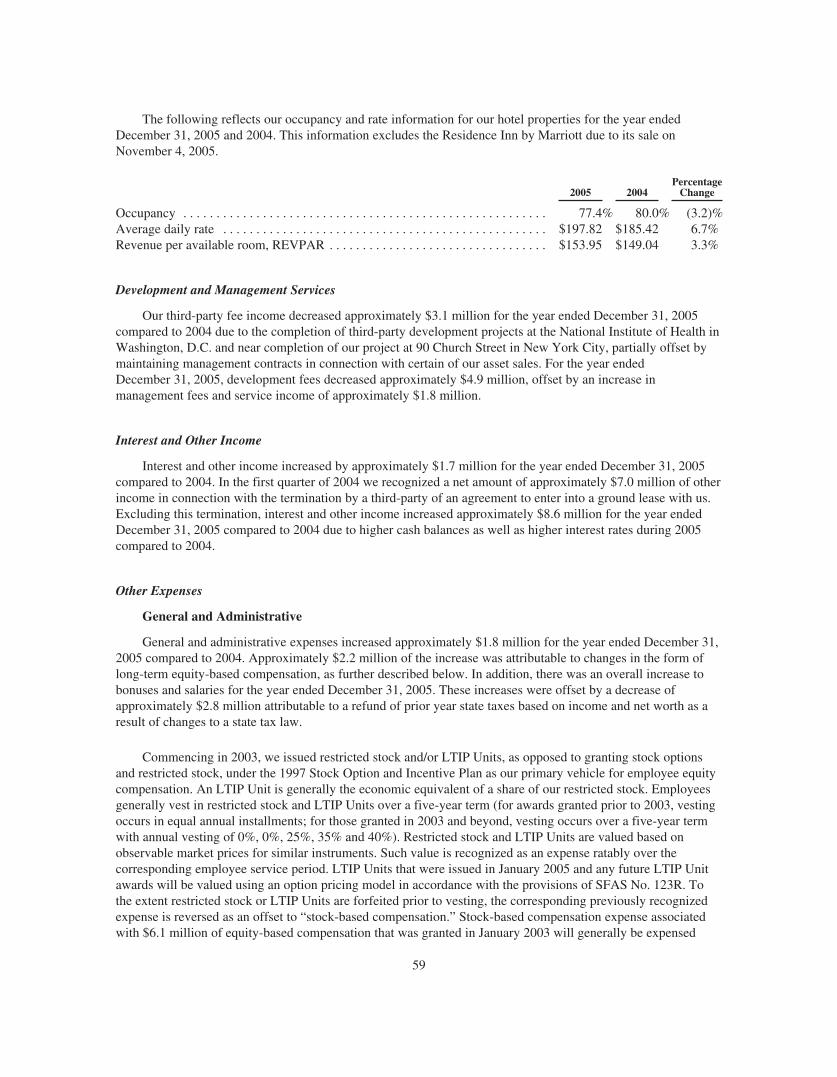
The following reflects our occupancy and rate information for our hotel properties for the year endedDecember 31, 2005 and 2004. This information excludes the Residence Inn by Marriott due to its sale onNovember 4, 2005.
2005 2004Percentage
Change
Occupancy . . . . . . . . . . . . . . . . . . . . . . . . . . . . . . . . . . . . . . . . . . . . . . . . . . . . . . . 77.4% 80.0% (3.2)%Average daily rate . . . . . . . . . . . . . . . . . . . . . . . . . . . . . . . . . . . . . . . . . . . . . . . . . $197.82 $185.42 6.7%Revenue per available room, REVPAR . . . . . . . . . . . . . . . . . . . . . . . . . . . . . . . . . $153.95 $149.04 3.3%
Development and Management Services
Our third-party fee income decreased approximately $3.1 million for the year ended December 31, 2005compared to 2004 due to the completion of third-party development projects at the National Institute of Health inWashington, D.C. and near completion of our project at 90 Church Street in New York City, partially offset bymaintaining management contracts in connection with certain of our asset sales. For the year endedDecember 31, 2005, development fees decreased approximately $4.9 million, offset by an increase inmanagement fees and service income of approximately $1.8 million.
Interest and Other Income
Interest and other income increased by approximately $1.7 million for the year ended December 31, 2005compared to 2004. In the first quarter of 2004 we recognized a net amount of approximately $7.0 million of otherincome in connection with the termination by a third-party of an agreement to enter into a ground lease with us.Excluding this termination, interest and other income increased approximately $8.6 million for the year endedDecember 31, 2005 compared to 2004 due to higher cash balances as well as higher interest rates during 2005compared to 2004.
Other Expenses
General and Administrative
General and administrative expenses increased approximately $1.8 million for the year ended December 31,2005 compared to 2004. Approximately $2.2 million of the increase was attributable to changes in the form oflong-term equity-based compensation, as further described below. In addition, there was an overall increase tobonuses and salaries for the year ended December 31, 2005. These increases were offset by a decrease ofapproximately $2.8 million attributable to a refund of prior year state taxes based on income and net worth as aresult of changes to a state tax law.
Commencing in 2003, we issued restricted stock and/or LTIP Units, as opposed to granting stock optionsand restricted stock, under the 1997 Stock Option and Incentive Plan as our primary vehicle for employee equitycompensation. An LTIP Unit is generally the economic equivalent of a share of our restricted stock. Employeesgenerally vest in restricted stock and LTIP Units over a five-year term (for awards granted prior to 2003, vestingoccurs in equal annual installments; for those granted in 2003 and beyond, vesting occurs over a five-year termwith annual vesting of 0%, 0%, 25%, 35% and 40%). Restricted stock and LTIP Units are valued based onobservable market prices for similar instruments. Such value is recognized as an expense ratably over thecorresponding employee service period. LTIP Units that were issued in January 2005 and any future LTIP Unitawards will be valued using an option pricing model in accordance with the provisions of SFAS No. 123R. Tothe extent restricted stock or LTIP Units are forfeited prior to vesting, the corresponding previously recognizedexpense is reversed as an offset to “stock-based compensation.” Stock-based compensation expense associatedwith $6.1 million of equity-based compensation that was granted in January 2003 will generally be expensed
59

ratably as such restricted stock and LTIP Units vests over a five-year vesting period. Stock-based compensationassociated with approximately $9.7 million of restricted stock and LTIP Units granted in January 2004 andapproximately $11.4 million of restricted stock and LTIP Units granted in January 2005 will also be incurredratably as such restricted stock and LTIP Units vest.
Interest Expense
Interest expense for the Total Property Portfolio increased approximately $1.9 million for the year endedDecember 31, 2005 compared to 2004. The majority of the increases are due to (1) the cessation of interestcapitalization at Times Square Tower and New Dominion Technology Park, Building Two, which increasedinterest expense by $14.9 million, and (2) the assumption of debt in connection with the acquisition of theremaining interest in 140 Kendrick Street and 1330 Connecticut Avenue in the second quarter of 2004, whichincreased interest expense by $1.3 million. These increases were offset by (1) the repayment of outstandingmortgage debt in connection with the sales of Riverfront Plaza and 100 East Pratt Street in the second quarter of2005, as well as Embarcadero Center West Tower in October 2005, which decreased interest expense by $9.7million, and (2) the repayment of mortgage debt at One and Two Reston Overlook and the 12300 and 12310Sunrise Valley Drive buildings in the beginning of 2004 which decreased interest expense by $1.4 million. Inaddition, the impact of refinancing our fixed rate debt collateralized by 599 Lexington Avenue using borrowingsunder our unsecured line at a lower interest rate decreased interest expense approximately $3.0 million.
At December 31, 2005, our variable rate debt consisted of our construction loans on our Times SquareTower, Capital Gallery Expansion and Seven Cambridge Center construction projects, as well as our borrowingsunder our unsecured line of credit. The following summarizes our outstanding debt as of December 31, 2005compared with December 31, 2004:
December 31,
2005 2004
(dollars in thousands)
Debt Summary:Balance
Fixed rate . . . . . . . . . . . . . . . . . . . . . . . . . . . . . . . . . . . . . . . . . . . . . . . . . . . . . . . . . $3,952,151 $4,588,024Variable rate . . . . . . . . . . . . . . . . . . . . . . . . . . . . . . . . . . . . . . . . . . . . . . . . . . . . . . 874,103 423,790
Total . . . . . . . . . . . . . . . . . . . . . . . . . . . . . . . . . . . . . . . . . . . . . . . . . . . . . . . . $4,826,254 $5,011,814
Percent of total debt:Fixed rate . . . . . . . . . . . . . . . . . . . . . . . . . . . . . . . . . . . . . . . . . . . . . . . . . . . . . . . . . 81.89% 91.54%Variable rate . . . . . . . . . . . . . . . . . . . . . . . . . . . . . . . . . . . . . . . . . . . . . . . . . . . . . . 18.11% 8.46%
Total . . . . . . . . . . . . . . . . . . . . . . . . . . . . . . . . . . . . . . . . . . . . . . . . . . . . . . . . 100.00% 100.00%
Weighted average interest rate at end of period:Fixed rate . . . . . . . . . . . . . . . . . . . . . . . . . . . . . . . . . . . . . . . . . . . . . . . . . . . . . . . . . 6.70% 6.66%Variable rate . . . . . . . . . . . . . . . . . . . . . . . . . . . . . . . . . . . . . . . . . . . . . . . . . . . . . . 4.96% 3.36%
Total . . . . . . . . . . . . . . . . . . . . . . . . . . . . . . . . . . . . . . . . . . . . . . . . . . . . . . . . 6.39% 6.38%
Depreciation and Amortization
Depreciation and amortization expense for the Total Property Portfolio increased approximately $17.2million for the year ended December 31, 2005 compared to 2004. Depreciation and amortization from PropertiesPlaced In-Service increased approximately $10.8 million, Properties Acquired increased approximately $1.6million, the Same Property Portfolio increased approximately $13.1 million, Properties Sold decreasedapproximately $5.2 million and Properties Repositioned decreased approximately $3.3 million. In connection
60
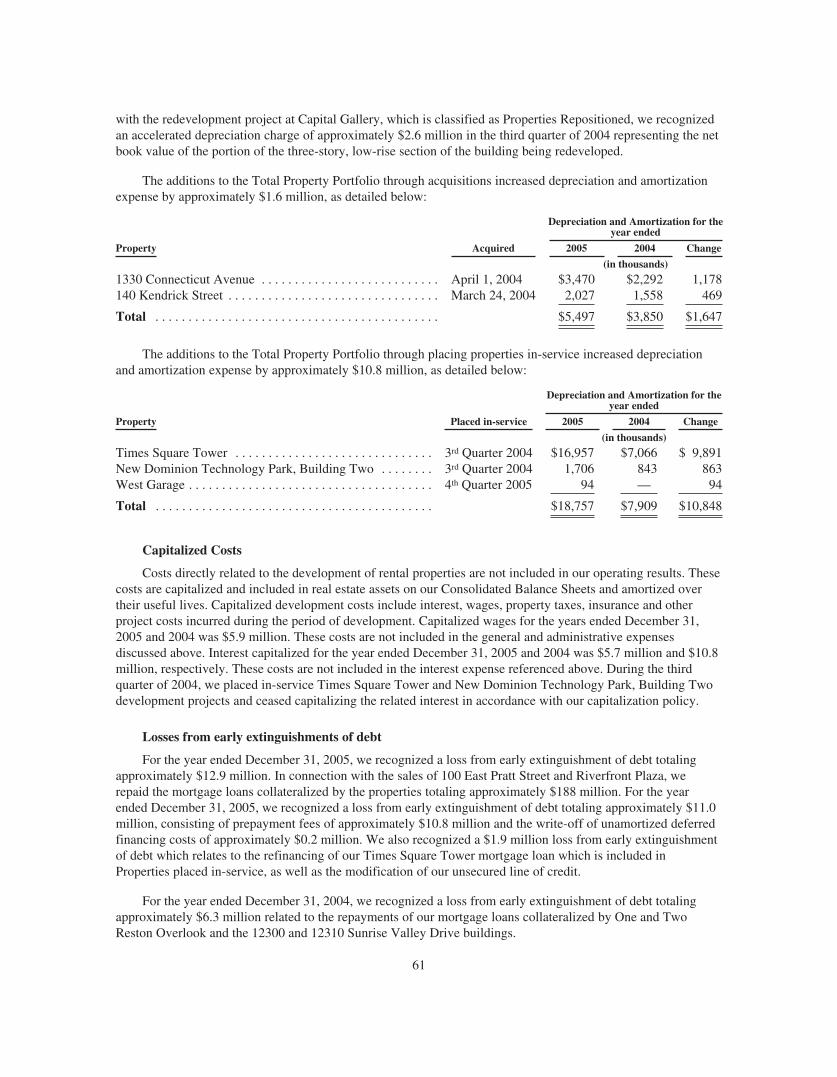
with the redevelopment project at Capital Gallery, which is classified as Properties Repositioned, we recognizedan accelerated depreciation charge of approximately $2.6 million in the third quarter of 2004 representing the netbook value of the portion of the three-story, low-rise section of the building being redeveloped.
The additions to the Total Property Portfolio through acquisitions increased depreciation and amortizationexpense by approximately $1.6 million, as detailed below:
Property Acquired
Depreciation and Amortization for theyear ended
2005 2004 Change
(in thousands)
1330 Connecticut Avenue . . . . . . . . . . . . . . . . . . . . . . . . . . . April 1, 2004 $3,470 $2,292 1,178140 Kendrick Street . . . . . . . . . . . . . . . . . . . . . . . . . . . . . . . . March 24, 2004 2,027 1,558 469
Total . . . . . . . . . . . . . . . . . . . . . . . . . . . . . . . . . . . . . . . . . . . $5,497 $3,850 $1,647
The additions to the Total Property Portfolio through placing properties in-service increased depreciationand amortization expense by approximately $10.8 million, as detailed below:
Property Placed in-service
Depreciation and Amortization for theyear ended
2005 2004 Change
(in thousands)
Times Square Tower . . . . . . . . . . . . . . . . . . . . . . . . . . . . . . 3rd Quarter 2004 $16,957 $7,066 $ 9,891New Dominion Technology Park, Building Two . . . . . . . . 3rd Quarter 2004 1,706 843 863West Garage . . . . . . . . . . . . . . . . . . . . . . . . . . . . . . . . . . . . . 4th Quarter 2005 94 — 94
Total . . . . . . . . . . . . . . . . . . . . . . . . . . . . . . . . . . . . . . . . . . $18,757 $7,909 $10,848
Capitalized Costs
Costs directly related to the development of rental properties are not included in our operating results. Thesecosts are capitalized and included in real estate assets on our Consolidated Balance Sheets and amortized overtheir useful lives. Capitalized development costs include interest, wages, property taxes, insurance and otherproject costs incurred during the period of development. Capitalized wages for the years ended December 31,2005 and 2004 was $5.9 million. These costs are not included in the general and administrative expensesdiscussed above. Interest capitalized for the year ended December 31, 2005 and 2004 was $5.7 million and $10.8million, respectively. These costs are not included in the interest expense referenced above. During the thirdquarter of 2004, we placed in-service Times Square Tower and New Dominion Technology Park, Building Twodevelopment projects and ceased capitalizing the related interest in accordance with our capitalization policy.
Losses from early extinguishments of debt
For the year ended December 31, 2005, we recognized a loss from early extinguishment of debt totalingapproximately $12.9 million. In connection with the sales of 100 East Pratt Street and Riverfront Plaza, werepaid the mortgage loans collateralized by the properties totaling approximately $188 million. For the yearended December 31, 2005, we recognized a loss from early extinguishment of debt totaling approximately $11.0million, consisting of prepayment fees of approximately $10.8 million and the write-off of unamortized deferredfinancing costs of approximately $0.2 million. We also recognized a $1.9 million loss from early extinguishmentof debt which relates to the refinancing of our Times Square Tower mortgage loan which is included inProperties placed in-service, as well as the modification of our unsecured line of credit.
For the year ended December 31, 2004, we recognized a loss from early extinguishment of debt totalingapproximately $6.3 million related to the repayments of our mortgage loans collateralized by One and TwoReston Overlook and the 12300 and 12310 Sunrise Valley Drive buildings.
61

Joint Ventures
During the first quarter of 2005, we placed in-service 901 New York Avenue, a 539,000 net rentable squarefoot Class A office property located in Washington, D.C., in which we have a 25% ownership interest. Theaddition of this property contributed approximately $2.1 million to joint venture income for the year endedDecember 31, 2005.
Income from discontinued operations, net of minority interest
The decrease in income from discontinued operations in the Total Property Portfolio for the year endedDecember 31, 2005 was a result of properties sold or designated as held for sale during 2005 and 2004 which areno longer included in our operations as of December 31, 2005. Below is a list of properties included indiscontinued operations for the years ended December 31, 2005 and 2004:
Year ended December 31, 2005 Year ended December 31, 2004
Old Federal Reserve Old Federal Reserve40-46 Harvard Street 40-46 Harvard StreetResidence Inn by Marriott Residence Inn by Marriott
Sugarland Business Park- Building One204 Second Avenue560 Forbes BoulevardDecoverly Two, Three, Six and Seven38 Cabot BoulevardThe Arboretum430 Rozzi PlaceSugarland Business Park-Building Two
Gains on sales of real estate and other assets, net of minority interest
Gains on sales of real estate for the year ended December 31, 2005 in the Total Property Portfolio relate tothe sales of Riverfront Plaza, 100 East Pratt Street and Embarcadero Center West Tower which are not includedin discontinued operations due to our continuing involvement in the management, for a fee, of these propertiesafter the sales. Also included in gains on sale of real estate for the year ended December 31, 2005 is the sale ofDecoverly Four and Five, consisting of two undeveloped land parcels located in Rockville, Maryland.
Gains on sales of real estate for the year ended December 31, 2004 in the Total Property Portfolio relate tothe sale of Hilltop Office Center and a land parcel in Burlington, MA. Hilltop Office Center is not included indiscontinued operations due to our continuing involvement in the management, for a fee, of this property afterthe sale.
Gains on sales of real estate from discontinued operations, net of minority interest
Properties included in our gains on sales of real estate from discontinued operations for the year endedDecember 31, 2005 and 2004 in the Total Property Portfolio are shown below:
Year ended December 31, 2005 Date Disposed Year ended December 31, 2004 Date Disposed
Old Federal Reserve April 2005 430 Rozzi Place January 2004Residence Inn by Marriott November 2005 Sugarland Business Park-Building Two February 200440-46 Harvard Street November 2005 Decoverly Two, Three, Six and Seven April 2004
The Arboretum April 200438 Cabot Boulevard May 2004Sugarland Business Park-Building One August 2004204 Second Avenue September 2004560 Forbes Boulevard December 2004
62

Minority interest in Operating Partnership
Minority interest in Operating Partnership increased $6.4 million for the year ended December 31, 2005compared to 2004. In connection with the special cash dividend paid to holders of common stock on October 31,2005, holders of Series Two Preferred Units participated in the distribution on an as-converted basis with theirregular February 2006 distribution payment as provided for in the Operating Partnership’s partnership agreement.As a result, we accrued approximately $12.1 million related to the special cash distribution payable to holders ofthe Series Two Preferred Units and allocated earnings to the Series Two Preferred Units of approximately $12.1million, which amount is reflected in minority interest in Operating Partnership for the year ended December 31,2005. This increase was partially offset by a reduction in the minority interest in our Operating Partnership’sincome allocation related to changes in the partnership’s ownership interests and an underlying change inallocable income.
Cumulative effect of a change in accounting principle, net of minority interest
In March 2005, the FASB issued Interpretation No. 47, “Accounting for Conditional Asset RetirementObligations, an interpretation of FASB Statement No. 143” (“FIN 47”). FIN 47 clarifies that the term“conditional asset retirement obligation” as used in FASB Statement No. 143, “Accounting for Asset RetirementObligations,” refers to a legal obligation to perform an asset retirement activity in which the timing and/ormethod of settlement are conditional on a future event that may or may not be within the control of the entity. AtDecember 31, 2005, we recognized a liability for the fair value of the asset retirement obligation aggregatingapproximately $7.1 million, which amount is included in “Accounts Payable and Accrued Expenses” on ourConsolidated Balance Sheets. In addition, we have recognized the cumulative effect of adopting FIN 47, totalingapproximately $4.2 million, which amount is included in “Cumulative Effect of a Change in AccountingPrinciple, Net of Minority Interest” on our Consolidated Statements of Operations for the year endedDecember 31, 2005.
Liquidity and Capital Resources
General
Our principal liquidity needs for the next twelve months are to:
• fund normal recurring expenses;
• meet debt service requirements;
• fund capital expenditures, including tenant improvements and leasing costs;
• fund current development costs not covered under construction loans;
• fund new property acquisitions; and
• make the minimum distribution required to maintain our REIT qualification under the Internal RevenueCode of 1986, as amended.
On December 15, 2006, our Board of Directors declared a special cash dividend of $5.40 per common sharepayable on January 30, 2007 to shareholders of record as of the close of business on December 29, 2006. Thedecision to declare a special dividend was the result of the sales of assets in 2006, including 280 Park Avenueand 265 Franklin Street. The Board of Directors did not make any change in our policy with respect to regularquarterly dividends. The payment of the regular quarterly dividend of $0.68 per share and the special dividend of$5.40 per share resulted in a total payment of $6.08 per share on January 30, 2007.
We believe that our liquidity needs will be satisfied using cash on hand, cash flows generated by operationsand provided by financing activities, as well as cash generated from asset sales. Base rental revenue, recovery
63
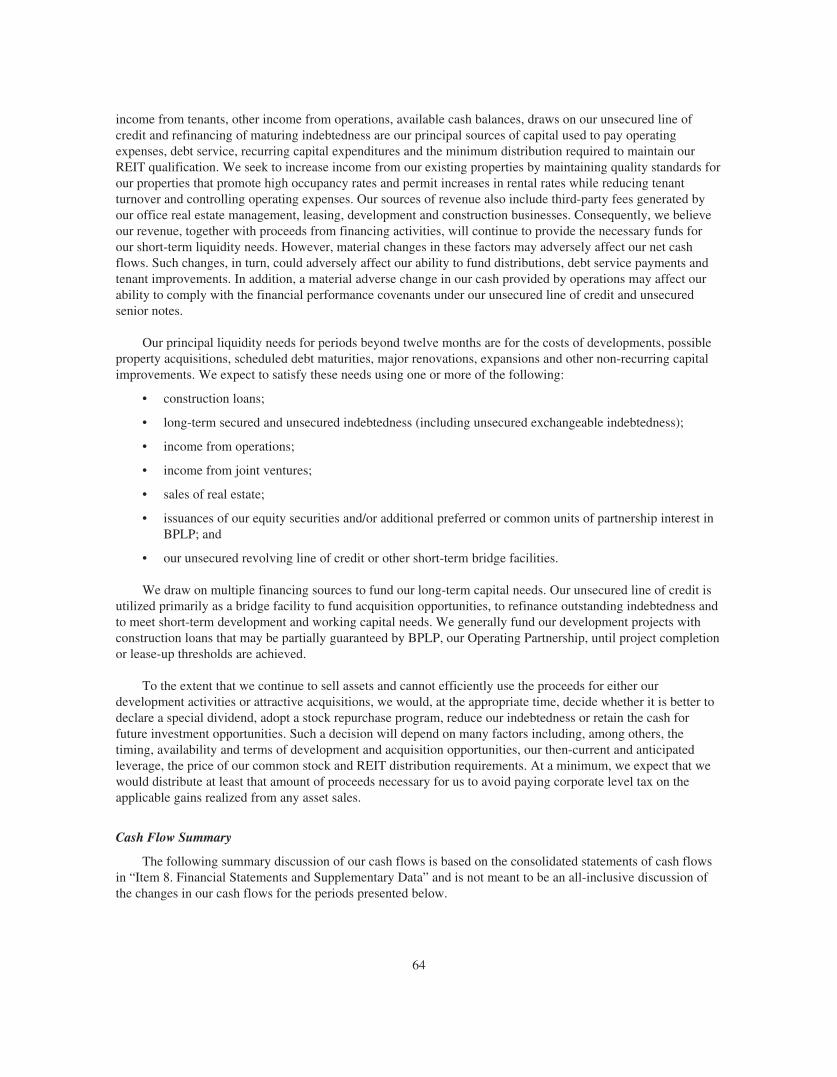
income from tenants, other income from operations, available cash balances, draws on our unsecured line ofcredit and refinancing of maturing indebtedness are our principal sources of capital used to pay operatingexpenses, debt service, recurring capital expenditures and the minimum distribution required to maintain ourREIT qualification. We seek to increase income from our existing properties by maintaining quality standards forour properties that promote high occupancy rates and permit increases in rental rates while reducing tenantturnover and controlling operating expenses. Our sources of revenue also include third-party fees generated byour office real estate management, leasing, development and construction businesses. Consequently, we believeour revenue, together with proceeds from financing activities, will continue to provide the necessary funds forour short-term liquidity needs. However, material changes in these factors may adversely affect our net cashflows. Such changes, in turn, could adversely affect our ability to fund distributions, debt service payments andtenant improvements. In addition, a material adverse change in our cash provided by operations may affect ourability to comply with the financial performance covenants under our unsecured line of credit and unsecuredsenior notes.
Our principal liquidity needs for periods beyond twelve months are for the costs of developments, possibleproperty acquisitions, scheduled debt maturities, major renovations, expansions and other non-recurring capitalimprovements. We expect to satisfy these needs using one or more of the following:
• construction loans;
• long-term secured and unsecured indebtedness (including unsecured exchangeable indebtedness);
• income from operations;
• income from joint ventures;
• sales of real estate;
• issuances of our equity securities and/or additional preferred or common units of partnership interest inBPLP; and
• our unsecured revolving line of credit or other short-term bridge facilities.
We draw on multiple financing sources to fund our long-term capital needs. Our unsecured line of credit isutilized primarily as a bridge facility to fund acquisition opportunities, to refinance outstanding indebtedness andto meet short-term development and working capital needs. We generally fund our development projects withconstruction loans that may be partially guaranteed by BPLP, our Operating Partnership, until project completionor lease-up thresholds are achieved.
To the extent that we continue to sell assets and cannot efficiently use the proceeds for either ourdevelopment activities or attractive acquisitions, we would, at the appropriate time, decide whether it is better todeclare a special dividend, adopt a stock repurchase program, reduce our indebtedness or retain the cash forfuture investment opportunities. Such a decision will depend on many factors including, among others, thetiming, availability and terms of development and acquisition opportunities, our then-current and anticipatedleverage, the price of our common stock and REIT distribution requirements. At a minimum, we expect that wewould distribute at least that amount of proceeds necessary for us to avoid paying corporate level tax on theapplicable gains realized from any asset sales.
Cash Flow Summary
The following summary discussion of our cash flows is based on the consolidated statements of cash flowsin “Item 8. Financial Statements and Supplementary Data” and is not meant to be an all-inclusive discussion ofthe changes in our cash flows for the periods presented below.
64

Cash and cash equivalents were $725.8 million and $261.5 million at December 31, 2006 and December 31,2005, respectively, representing an increase of $464.3 million. The increase was a result of the followingincreases and decreases in cash flows:
Years ended December 31,
2006 2005Increase
(Decrease)
(in thousands)
Net cash provided by operating activities . . . . . . . . . . . . . . . . . . . . . . . . . . . $ 527,979 $ 472,249 $ 55,730Net cash provided by investing activities . . . . . . . . . . . . . . . . . . . . . . . . . . . . $ 229,756 $ 356,605 $(126,849)Net cash used in financing activities . . . . . . . . . . . . . . . . . . . . . . . . . . . . . . . $(293,443) $(806,702) $ 513,259
Our principal source of cash flow is related to the operation of our office properties. The average term of ourtenant leases is approximately 7.8 years with occupancy rates historically in the range of 92% to 98%. Ourproperties provide a relatively consistent stream of cash flow that provides us with resources to pay operatingexpenses, debt service and fund quarterly dividend and distribution payment requirements. In addition, over thepast year, we have raised capital through the sale of some of our properties and raised proceeds from secured andunsecured borrowings.
For the year ended December 31, 2006 our cash flows from operating activities exceeded our dividends.During the year ended December 31, 2005, we paid a special cash dividend of approximately $335.7 million,which cash flows had been generated from sales of real estate assets and which proceeds are not included in cashflows from operating activities. As a result, our total dividends exceeded our total cash flows from operatingactivities for the year ended December 31, 2005. In 2007, we expect our total dividends to exceed our cash flowfrom operating activities due to the special dividend which was declared in December 2006 and paid to commonstockholders and common unitholders of BPLP on January 30, 2007. The cash flows distributed were generatedfrom sales of real estate assets and which proceeds are included as part of cash flows from investment activities.Dividends will generally exceed cash flows from operating activities during periods in which we sell significantreal estate assets and distribute gains on sale that would otherwise be taxable.
Cash is used in investing activities to fund acquisitions, development and recurring and nonrecurring capitalexpenditures. We selectively invest in new projects that enable us to take advantage of our development, leasing,financing and property management skills and invest in existing buildings that meet our investment criteria. Cashprovided by investing activities for the twelve months ended December 31, 2006 consisted of the following:
(in thousands)
Net proceeds from the sales of real estate . . . . . . . . . . . . . . . . . . . . . . . . . . . . . $1,130,978Net investments in unconsolidated joint ventures . . . . . . . . . . . . . . . . . . . . . . . 23,566The cash provided by these investing activities is offset by:Investments in marketable securities . . . . . . . . . . . . . . . . . . . . . . . . . . . . . . . . . (282,764)Recurring capital expenditures . . . . . . . . . . . . . . . . . . . . . . . . . . . . . . . . . . . . . (14,417)Planned non-recurring capital expenditures associated with acquisition
properties . . . . . . . . . . . . . . . . . . . . . . . . . . . . . . . . . . . . . . . . . . . . . . . . . . . . (2,237)Hotel improvements, equipment upgrades and replacements . . . . . . . . . . . . . . (6,756)Acquisitions/additions to real estate . . . . . . . . . . . . . . . . . . . . . . . . . . . . . . . . . (618,614)
Net cash provided by investing activities . . . . . . . . . . . . . . . . . . . . . . . . . . . . . $ 229,756
Cash used in financing activities for the year ended December 31, 2006 totaled approximately $293.4million. This consisted primarily of net repayments of our secured and unsecured indebtedness totalingapproximately $424.3 million and payments of dividends and distributions to our shareholders and to theunitholders of our Operating Partnership totaling approximately $391.6 million. The decreases were partiallyoffset by the proceeds of $450 million from our April/May 2006 offering of 3.75% exchangeable senior notes
65

due 2036, net proceeds from equity transactions of approximately $63.4 million and net proceeds from a realestate financing transaction totaling approximately $15.2 million. Future debt payments are discussed belowunder the heading “Debt Financing.”
Capitalization
At December 31, 2006, our total consolidated debt was approximately $4.6 billion. The weighted-averageannual interest rate on our consolidated indebtedness was 6.20% and the weighted-average maturity wasapproximately 4.7 years.
Debt to total market capitalization ratio, defined as total consolidated debt as a percentage of the marketvalue of our outstanding equity securities plus our total consolidated debt, is a measure of leverage commonlyused by analysts in the REIT sector. Our total market capitalization was approximately $20.4 billion atDecember 31, 2006. Total market capitalization was calculated using the December 29, 2006 closing stock priceof $111.88 per common share and the following: (1) 117,503,542 shares of our common stock, (2) 20,817,587outstanding common units of limited partnership of BPLP (excluding common units held by Boston Properties,Inc.), (3) an aggregate of 2,256,208 common units issuable upon conversion of all outstanding preferred units ofpartnership interest in BPLP, (4) an aggregate of 521,119 common units issuable upon conversion of alloutstanding LTIP units, assuming all conditions have been met for the conversion of the LTIP units, and (5) ourconsolidated debt totaling approximately $4.6 billion. Our total consolidated debt at December 31, 2006represented approximately 22.57% of our total market capitalization. This percentage will fluctuate with changesin the market price of our common stock and does not necessarily reflect our capacity to incur additional debt tofinance our activities or our ability to manage our existing debt obligations. However, for a company like ours,whose assets are primarily income-producing real estate, the debt to total market capitalization ratio may provideinvestors with an alternate indication of leverage, so long as it is evaluated along with other financial ratios andthe various components of our outstanding indebtedness.
66

Debt Financing
As of December 31, 2006, we had approximately $4.6 billion of outstanding indebtedness, representing22.57% of our total market capitalization as calculated above under the heading “Capitalization,” consisting of(1) $1.5 billion in publicly traded unsecured debt having a weighted average interest rate of 5.95% and maturitiesin 2013 and 2015; (2) $450 million of publicly traded exchangeable senior notes having a weighted averageinterest rate of 3.75%, an initial redemption date at the option of either the holder or us in 2013 and maturity in2036 and (3) $2.7 billion of property-specific mortgage debt having a weighted average interest rate of 6.74% perannum and weighted average term of 3.3 years (which includes the $225.0 million drawn on our Unsecured Lineof Credit secured by 599 Lexington Avenue). As of December 31, 2006, we had approximately $225.0 milliondrawn on our Unsecured Line of Credit which was secured by our 599 Lexington Avenue property in New Yorkand which balance is included under our variable rate mortgages in the table below. The table below summarizesour outstanding debt at December 31, 2006 and 2005:
December 31,
2006 2005
(dollars in thousands)
DEBT SUMMARY:Balance
Fixed rate . . . . . . . . . . . . . . . . . . . . . . . . . . . . . . . . . . . . . . . . . . . . . . . . . . . . . . . . . $3,889,447 $3,952,151Variable rate . . . . . . . . . . . . . . . . . . . . . . . . . . . . . . . . . . . . . . . . . . . . . . . . . . . . . . 711,490 874,103
Total . . . . . . . . . . . . . . . . . . . . . . . . . . . . . . . . . . . . . . . . . . . . . . . . . . . . . . . . $4,600,937 $4,826,254
Percent of total debt:Fixed rate . . . . . . . . . . . . . . . . . . . . . . . . . . . . . . . . . . . . . . . . . . . . . . . . . . . . . . . . . 84.54% 81.89%Variable rate . . . . . . . . . . . . . . . . . . . . . . . . . . . . . . . . . . . . . . . . . . . . . . . . . . . . . . 15.46% 18.11%
Total . . . . . . . . . . . . . . . . . . . . . . . . . . . . . . . . . . . . . . . . . . . . . . . . . . . . . . . . 100.00% 100.00%
Weighted average interest rate at end of period:Fixed rate . . . . . . . . . . . . . . . . . . . . . . . . . . . . . . . . . . . . . . . . . . . . . . . . . . . . . . . . . 6.27% 6.70%Variable rate . . . . . . . . . . . . . . . . . . . . . . . . . . . . . . . . . . . . . . . . . . . . . . . . . . . . . . 5.80% 4.96%
Total . . . . . . . . . . . . . . . . . . . . . . . . . . . . . . . . . . . . . . . . . . . . . . . . . . . . . . . . 6.20% 6.39%
The variable rate debt shown above bears interest based on various spreads over the London InterbankOffered Rate or Eurodollar rates. As of December 31, 2006, the weighted average interest rate on our variablerate debt was LIBOR/Eurodollar plus .45% per annum. On February 12, 2007, we repaid $700 million of thevariable rate indebtedness above consisting of (1) the $225.0 million draw on our Unsecured Line of Credit,which draw was collateralized by 599 Lexington Avenue, and (2) the mortgage loan collateralized by TimesSquare Tower totaling $475.0 million. The variable rate indebtedness was repaid with proceeds from a newmortgage financing secured by 599 Lexington Avenue totaling $750.0 million, which bears interest at a fixedinterest rate of 5.57% per annum and matures on March 1, 2017 (See Note 22 to the Consolidated FinancialStatements). On December 19, 2006, we had terminated our forward-starting interest rate swap contracts andreceived approximately $10.9 million, which amount will reduce our interest expense over the ten-year term ofthe financing, resulting in an effective interest rate of 5.38% per annum.
Unsecured Line of Credit
On August 3, 2006, we modified our $605.0 million unsecured revolving credit facility (the “UnsecuredLine of Credit”) by extending the maturity date from October 30, 2007 to August 3, 2010, with a provision for aone-year extension at our option, subject to certain conditions, and by reducing the per annum variable interestrate on outstanding balances from Eurodollar plus 0.65% to Eurodollar plus 0.55% per annum. Under theUnsecured Line of Credit, a facility fee equal to 15 basis points per annum is payable in quarterly installments.The interest rate and facility fee are subject to adjustment in the event of a change in our Operating Partnership’sunsecured debt ratings. The Unsecured Line of Credit involves a syndicate of lenders. The Unsecured Line of
67

Credit contains a competitive bid option that allows banks that are part of the lender consortium to bid to makeloan advances to the Company at a negotiated LIBOR-based rate. The Unsecured Line of Credit is available tofund working capital and general corporate purposes, including, without limitation, to fund development ofproperties, land and property acquisitions and to repay or reduce indebtedness. The Unsecured Line of Credit is arecourse obligation of Boston Properties Limited Partnership.
Our ability to borrow under our Unsecured Line of Credit is subject to our compliance with a number ofcustomary financial and other covenants on an ongoing basis, including:
• a leverage ratio not to exceed 60%, however the leverage ratio may increase to no greater than 65%provided that it is reduced back to 60% within 180 days;
• a secured debt leverage ratio not to exceed 55%;
• a fixed charge coverage ratio of at least 1.40;
• an unsecured leverage ratio not to exceed 60%, however the leverage ratio may increase to no greaterthan 65% provided that it is reduced back to 60% within 180 days;
• a minimum net worth requirement;
• an unsecured debt interest coverage ratio of at least 1.75; and
• limitations on permitted investments.
We believe we are in compliance with the financial and other covenants listed above.
We had an outstanding balance on our Unsecured Line of Credit of $225.0 million at December 31, 2006,which was collateralized by our 599 Lexington Avenue property and therefore is included in Mortgage NotesPayable in our Consolidated Balance Sheets. We also had $18.1 million in outstanding letters of credit under ourUnsecured Line of Credit. As of December 31, 2006, we had the ability to borrow an additional $361.9 millionunder our Unsecured Line of Credit. On February 12, 2007, we repaid the $225.0 million which wascollateralized by our 599 Lexington Avenue property. As of February 23, 2007, we have no borrowingsoutstanding under our Unsecured Line of Credit.
Unsecured Senior Notes
The following summarizes the unsecured senior notes outstanding as of December 31, 2006 (dollars inthousands):
Coupon/Stated Rate
EffectiveRate (1)
PrincipalAmount Maturity Date (2)
10 Year Unsecured Senior Notes . . . . . . . . . . . . . . . . . . . . 6.250% 6.296% $ 750,000 January 15, 201310 Year Unsecured Senior Notes . . . . . . . . . . . . . . . . . . . . 6.250% 6.280% 175,000 January 15, 201312 Year Unsecured Senior Notes . . . . . . . . . . . . . . . . . . . . 5.625% 5.636% 300,000 April 15, 201512 Year Unsecured Senior Notes . . . . . . . . . . . . . . . . . . . . 5.000% 5.075% 250,000 June 1, 2015
Total principal . . . . . . . . . . . . . . . . . . . . . . . . . . . . . . . . . . 1,475,000Net discount . . . . . . . . . . . . . . . . . . . . . . . . . . . . . . . . . . . . (3,525)
Total . . . . . . . . . . . . . . . . . . . . . . . . . . . . . . . . . . . . . . . . . . $1,471,475
(1) Yield on issuance date including the effects of discounts on the notes.(2) No principal amounts are due prior to maturity.
Our unsecured senior notes are redeemable at our option, in whole or in part, at a redemption price equal tothe greater of (1) 100% of their principal amount or (2) the sum of the present value of the remaining scheduledpayments of principal and interest discounted at a rate equal to the yield on U.S. Treasury securities with a
68

comparable maturity plus 35 basis points (or 25 basis point in the case of the $250 million 12 Year UnsecuredSenior Notes that mature on June 1, 2015), in each case plus accrued and unpaid interest to the redemption date.The indenture under which our senior unsecured notes were issued contains restrictions on incurring debt andusing our assets as security in other financing transactions and other customary financial and other covenants,including (1) a leverage ratio not to exceed 60%, (2) a secured debt leverage ratio not to exceed 50%, (3) aninterest coverage ratio of 1.5, and (4) unencumbered asset value to be no less than 150% of our unsecured debt.As of December 31, 2006 we were in compliance with each of these financial restrictions and requirements.
BPLP’s investment grade ratings on its senior unsecured notes are as follows:
Rating Organization Rating
Moody’s Baa2 (stable)Standard & Poor’s BBB (stable)FitchRatings BBB (stable)
The security rating is not a recommendation to buy, sell or hold securities, as it may be subject to revision orwithdrawal at any time by the rating organization. Each rating should be evaluated independently of any otherrating.
Unsecured exchangeable senior notes
On April 6, 2006, our Operating Partnership completed a public offering of $400 million in aggregateprincipal amount of its 3.75% exchangeable senior notes due 2036. On May 2, 2006, our Operating Partnershipissued an additional $50 million aggregate principal amount of the notes as a result of the exercise by theunderwriter of its over-allotment option. The notes will be exchangeable into our common stock under certaincircumstances. When issued, the initial exchange rate, subject to adjustment, was 8.9461 shares per $1,000principal amount of notes (or an exchange price of approximately $111.78 per share of common stock).Noteholders may require the Operating Partnership to purchase the notes at par initially on May 18, 2013 and,after that date, the notes will be redeemable at par at the option of the Operating Partnership. In connection withthe special dividend declared on December 15, 2006, the exchange rate was adjusted effective December 29,2006 to 9.3900 shares per $1,000 principal amount of notes (or an exchange price of approximately $106.50 pershare of common stock). See Note 8 to the Consolidated Financial Statements for a description of the terms ofthe notes.
On February 6, 2007, our Operating Partnership completed an offering of $862.5 million in aggregateprincipal amount (including $112.5 million as a result of the exercise by the initial purchasers of their over-allotment option) of its 2.875% exchangeable senior notes due 2037. The notes were priced at 97.433333% oftheir face amount, resulting in an effective interest rate of approximately 3.438% per annum and net proceeds tous of approximately $840.0 million. The notes were offered and sold to the initial purchasers in reliance on theexemption from registration provided by Section 4(2) of the Securities Act of 1933. The initial purchasers thensold the notes to qualified institutional buyers pursuant to the exemption provided by Rule 144A under theSecurities Act. The notes will be exchangeable into our common stock under certain circumstances at an initialexchange rate, subject to adjustment, of 6.6090 shares per $1,000 principal amount of notes (or an initialexchange price of approximately $151.31 per share of common stock). Noteholders may require the OperatingPartnership to purchase the notes at par initially on February 15, 2012 and, commencing on February 20, 2012and any time thereafter, the notes will be redeemable at par at the option of the Operating Partnership. See Note22 to the Consolidated Financial Statements for a description of the terms of the notes.
69

Mortgage Debt
The following represents the outstanding principal balances due under the mortgages notes payable atDecember 31, 2006:
PropertiesInterest
RatePrincipalAmount Maturity Date
(in thousands)
Citigroup Center . . . . . . . . . . . . . . . . . . . . . . . . . . . . . . . . . . . . . 7.19% $ 493,526(1) May 11, 2011Times Square Tower . . . . . . . . . . . . . . . . . . . . . . . . . . . . . . . . . . 5.85% 475,000(2) July 9, 2008Embarcadero Center One and Two . . . . . . . . . . . . . . . . . . . . . . . 6.70% 284,789 December 10, 2008Prudential Center . . . . . . . . . . . . . . . . . . . . . . . . . . . . . . . . . . . . . 6.72% 265,325 July 1, 2008599 Lexington Avenue . . . . . . . . . . . . . . . . . . . . . . . . . . . . . . . . 5.65% 225,000(3) August 3, 2010Embarcadero Center Four . . . . . . . . . . . . . . . . . . . . . . . . . . . . . . 6.79% 134,058 February 1, 2008Democracy Center . . . . . . . . . . . . . . . . . . . . . . . . . . . . . . . . . . . . 7.05% 96,150 April 1, 2009One Freedom Square . . . . . . . . . . . . . . . . . . . . . . . . . . . . . . . . . . 5.33% 78,007(4) June 30, 2012New Dominion Tech Park, Bldg. Two . . . . . . . . . . . . . . . . . . . . 5.55% 63,000(5) October 1, 2014202, 206 & 214 Carnegie Center . . . . . . . . . . . . . . . . . . . . . . . . . 8.13% 59,061 October 1, 2010140 Kendrick Street . . . . . . . . . . . . . . . . . . . . . . . . . . . . . . . . . . . 5.21% 58,501(6) July 1, 2013New Dominion Tech. Park, Bldg. One . . . . . . . . . . . . . . . . . . . . 7.69% 55,420 January 15, 20211330 Connecticut Avenue . . . . . . . . . . . . . . . . . . . . . . . . . . . . . . 4.65% 55,097(7) February 26, 2011Reservoir Place . . . . . . . . . . . . . . . . . . . . . . . . . . . . . . . . . . . . . . 5.82% 51,916(8) July 1, 2009504, 506 & 508 Carnegie Center . . . . . . . . . . . . . . . . . . . . . . . . . 7.39% 42,229 January 1, 200810 and 20 Burlington Mall Road . . . . . . . . . . . . . . . . . . . . . . . . . 7.25% 36,375(9) October 1, 2011Ten Cambridge Center . . . . . . . . . . . . . . . . . . . . . . . . . . . . . . . . 8.27% 32,213 May 1, 2010Sumner Square . . . . . . . . . . . . . . . . . . . . . . . . . . . . . . . . . . . . . . 7.35% 27,581 September 1, 2013Eight Cambridge Center . . . . . . . . . . . . . . . . . . . . . . . . . . . . . . . 7.73% 25,188 July 15, 20101301 New York Avenue . . . . . . . . . . . . . . . . . . . . . . . . . . . . . . . 7.14% 25,061(10) August 15, 2009510 Carnegie Center . . . . . . . . . . . . . . . . . . . . . . . . . . . . . . . . . . 7.39% 24,255 January 1, 2008Reston Corporate Center . . . . . . . . . . . . . . . . . . . . . . . . . . . . . . . 6.56% 21,268 May 1, 2008University Place . . . . . . . . . . . . . . . . . . . . . . . . . . . . . . . . . . . . . 6.94% 21,203 August 1, 2021Bedford Business Park . . . . . . . . . . . . . . . . . . . . . . . . . . . . . . . . 8.50% 17,749 December 10, 2008South of Market . . . . . . . . . . . . . . . . . . . . . . . . . . . . . . . . . . . . . . 6.63% 11,490(11) November 21, 2009
Total . . . . . . . . . . . . . . . . . . . . . . . . . . . . . . . . . . . . . . . . . . . . . . $2,679,462
(1) In accordance with EITF 98-1, the principal amount and interest rates shown were adjusted uponredemption of the outside members’ equity interest in the limited liability company that owns the propertyto reflect the fair value of the note. The stated principal balance at December 31, 2006 was $490.9 millionand the stated interest rate was 7.19% per annum. The interest rate used to adjust the portion of debtassociated with the redemption to fair value was 6.25% per annum.
(2) The mortgage financing bears interest at a variable rate equal to LIBOR plus 0.50% per annum. This loanwas repaid on February 12, 2007.
(3) On July 19, 2005, we repaid the mortgage loan through a secured draw on our unsecured line of credit. Asof December 31, 2006, the interest rate on this draw under our unsecured line of credit was 5.65% using aweighted average LIBOR plus 0.30% per annum. On December 19, 2006, we entered into an interest ratelock agreement with a lender for a fixed interest rate of 5.57% per annum on a ten-year mortgage financingtotaling $750.0 million to be collateralized by 599 Lexington Avenue. We closed on the mortgage financingon February 12, 2007.
(4) In accordance with EITF 98-1, the principal amount and interest rates shown were adjusted upon acquisitionof the property to reflect the fair value of the note. The stated principal balance at December 31, 2006 was$72.1 million and the stated interest rate was 7.75%.
(5) The mortgage loan requires interest only payments with a balloon payment due at maturity.
70
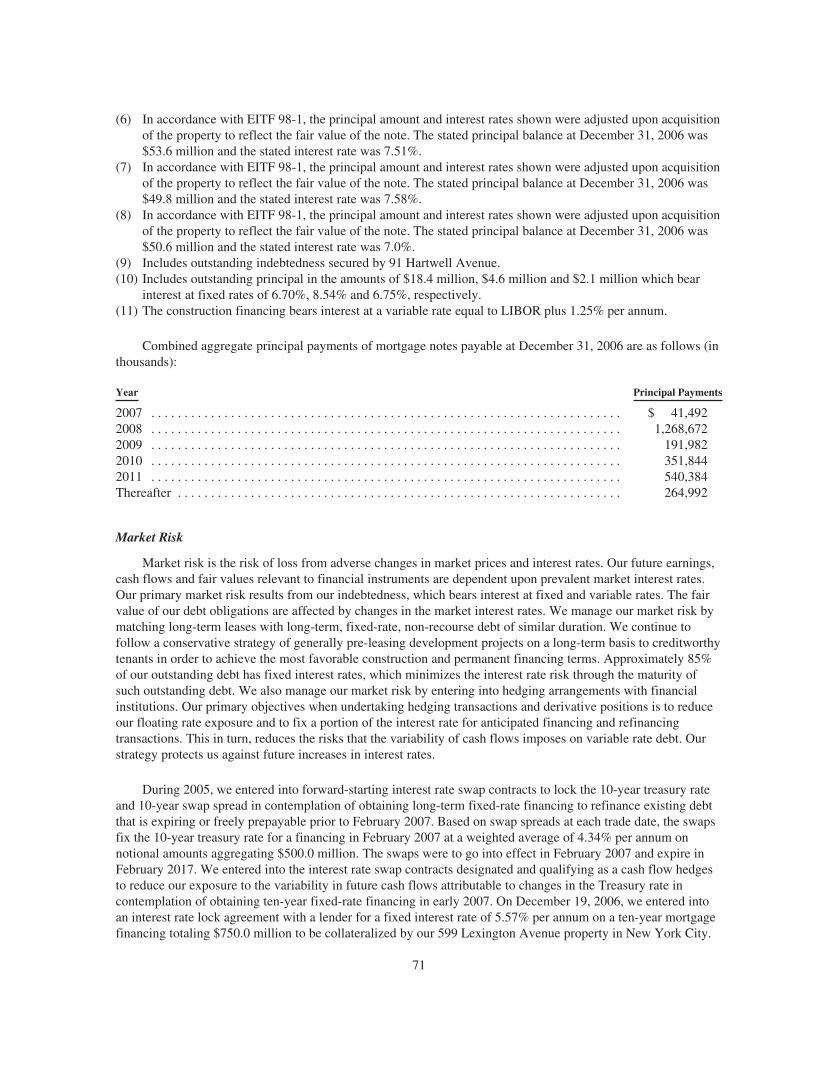
(6) In accordance with EITF 98-1, the principal amount and interest rates shown were adjusted upon acquisitionof the property to reflect the fair value of the note. The stated principal balance at December 31, 2006 was$53.6 million and the stated interest rate was 7.51%.
(7) In accordance with EITF 98-1, the principal amount and interest rates shown were adjusted upon acquisitionof the property to reflect the fair value of the note. The stated principal balance at December 31, 2006 was$49.8 million and the stated interest rate was 7.58%.
(8) In accordance with EITF 98-1, the principal amount and interest rates shown were adjusted upon acquisitionof the property to reflect the fair value of the note. The stated principal balance at December 31, 2006 was$50.6 million and the stated interest rate was 7.0%.
(9) Includes outstanding indebtedness secured by 91 Hartwell Avenue.(10) Includes outstanding principal in the amounts of $18.4 million, $4.6 million and $2.1 million which bear
interest at fixed rates of 6.70%, 8.54% and 6.75%, respectively.(11) The construction financing bears interest at a variable rate equal to LIBOR plus 1.25% per annum.
Combined aggregate principal payments of mortgage notes payable at December 31, 2006 are as follows (inthousands):
Year Principal Payments
2007 . . . . . . . . . . . . . . . . . . . . . . . . . . . . . . . . . . . . . . . . . . . . . . . . . . . . . . . . . . . . . . . . . . . . . . . $ 41,4922008 . . . . . . . . . . . . . . . . . . . . . . . . . . . . . . . . . . . . . . . . . . . . . . . . . . . . . . . . . . . . . . . . . . . . . . . 1,268,6722009 . . . . . . . . . . . . . . . . . . . . . . . . . . . . . . . . . . . . . . . . . . . . . . . . . . . . . . . . . . . . . . . . . . . . . . . 191,9822010 . . . . . . . . . . . . . . . . . . . . . . . . . . . . . . . . . . . . . . . . . . . . . . . . . . . . . . . . . . . . . . . . . . . . . . . 351,8442011 . . . . . . . . . . . . . . . . . . . . . . . . . . . . . . . . . . . . . . . . . . . . . . . . . . . . . . . . . . . . . . . . . . . . . . . 540,384Thereafter . . . . . . . . . . . . . . . . . . . . . . . . . . . . . . . . . . . . . . . . . . . . . . . . . . . . . . . . . . . . . . . . . . . 264,992
Market Risk
Market risk is the risk of loss from adverse changes in market prices and interest rates. Our future earnings,cash flows and fair values relevant to financial instruments are dependent upon prevalent market interest rates.Our primary market risk results from our indebtedness, which bears interest at fixed and variable rates. The fairvalue of our debt obligations are affected by changes in the market interest rates. We manage our market risk bymatching long-term leases with long-term, fixed-rate, non-recourse debt of similar duration. We continue tofollow a conservative strategy of generally pre-leasing development projects on a long-term basis to creditworthytenants in order to achieve the most favorable construction and permanent financing terms. Approximately 85%of our outstanding debt has fixed interest rates, which minimizes the interest rate risk through the maturity ofsuch outstanding debt. We also manage our market risk by entering into hedging arrangements with financialinstitutions. Our primary objectives when undertaking hedging transactions and derivative positions is to reduceour floating rate exposure and to fix a portion of the interest rate for anticipated financing and refinancingtransactions. This in turn, reduces the risks that the variability of cash flows imposes on variable rate debt. Ourstrategy protects us against future increases in interest rates.
During 2005, we entered into forward-starting interest rate swap contracts to lock the 10-year treasury rateand 10-year swap spread in contemplation of obtaining long-term fixed-rate financing to refinance existing debtthat is expiring or freely prepayable prior to February 2007. Based on swap spreads at each trade date, the swapsfix the 10-year treasury rate for a financing in February 2007 at a weighted average of 4.34% per annum onnotional amounts aggregating $500.0 million. The swaps were to go into effect in February 2007 and expire inFebruary 2017. We entered into the interest rate swap contracts designated and qualifying as a cash flow hedgesto reduce our exposure to the variability in future cash flows attributable to changes in the Treasury rate incontemplation of obtaining ten-year fixed-rate financing in early 2007. On December 19, 2006, we entered intoan interest rate lock agreement with a lender for a fixed interest rate of 5.57% per annum on a ten-year mortgagefinancing totaling $750.0 million to be collateralized by our 599 Lexington Avenue property in New York City.
71

On February 12, 2007, we closed on the mortgage financing. In conjunction with the interest rate lock agreement,we terminated our forward-starting interest rate swap contracts and received approximately $10.9 million, whichamount will reduce our interest expense over the ten-year term of the financing, resulting in an effective interestrate of 5.38% per annum. We recorded the changes in fair value of the swap contracts related to the effectiveportion of the interest rate contracts totaling approximately $10.9 million in Accumulated Other ComprehensiveIncome (Loss) within the our Consolidated Balance Sheets. We expect that within the next twelve months wewill reclassify into earnings approximately $1.0 million of the amounts recorded within Accumulated OtherComprehensive Income (Loss) relating to the forward-starting interest rate swap contracts.
At December 31, 2005, derivatives with a fair value of $6.2 million were included in Prepaid Expenses andOther Assets and derivatives with a fair value of $0.2 million were included in Other Liabilities within ourConsolidated Balance Sheets. We have recorded the changes in fair value of the swap contracts related to theeffective portion of the interest rate contracts totaling approximately $6.0 million in Accumulated OtherComprehensive Income (Loss) within our Consolidated Balance Sheets. The amount of hedge ineffectiveness in2005 was not material. As of December 31, 2006, no derivatives were designated as cash flow hedges, fair valuehedges or hedges of net investments in foreign operations. We do not use derivatives for trading or speculativepurposes. Derivatives not designated as hedges, which consist entirely of two immaterial interest rate caps, arenot speculative and are used to manage our exposure to interest rate movements and other identified risks.
At December 31, 2006, our outstanding variable rate debt based off LIBOR totaled approximately $711million. At December 31, 2006, the average interest rate on variable rate debt was approximately 5.80%. Ifmarket interest rates on our variable rate debt had been 100 basis points greater, total interest would haveincreased approximately $7.1 million for the year ended December 31, 2006.
At December 31, 2005, our outstanding variable rate debt based off LIBOR totaled approximately $874.1million. At December 31, 2005, the average interest rate on variable rate debt was approximately 4.96%. Ifmarket interest rates on our variable rate debt had been 100 basis points greater, total interest would haveincreased approximately $8.7 million for the year ended December 31, 2005.
These amounts were determined solely by considering the impact of hypothetical interest rates on ourfinancial instruments. Due to the uncertainty of specific actions we may undertake to minimize possible effectsof market interest rate increases, this analysis assumes no changes in our financial structure.
Funds from Operations
Pursuant to the revised definition of Funds from Operations adopted by the Board of Governors of theNational Association of Real Estate Investment Trusts (“NAREIT”), we calculate Funds from Operations, or“FFO,” by adjusting net income (loss) (computed in accordance with GAAP, including non-recurring items) forgains (or losses) from sales of properties, real estate related depreciation and amortization, and after adjustmentfor unconsolidated partnerships, joint ventures and preferred distributions. FFO is a non-GAAP financialmeasure. The use of FFO, combined with the required primary GAAP presentations, has been fundamentallybeneficial in improving the understanding of operating results of REITs among the investing public and makingcomparisons of REIT operating results more meaningful. Management generally considers FFO to be a usefulmeasure for reviewing our comparative operating and financial performance because, by excluding gains andlosses related to sales of previously depreciated operating real estate assets and excluding real estate assetdepreciation and amortization (which can vary among owners of identical assets in similar condition based onhistorical cost accounting and useful life estimates), FFO can help one compare the operating performance of acompany’s real estate between periods or as compared to different companies. Our computation of FFO may notbe comparable to FFO reported by other REITs or real estate companies that do not define the term in accordancewith the current NAREIT definition or that interpret the current NAREIT definition differently. Amountrepresents our share, which was 84.40%, 83.74%, 82.97%, 82.06% and 81.98% for the years endedDecember 31, 2006, 2005, 2004, 2003 and 2002, respectively, after allocation to the minority interest in theOperating Partnership.
72
In addition to presenting FFO in accordance with the NAREIT definition, we also disclose FFO, as adjusted,for the year ended December 31, 2006, 2005, 2003 and 2002 which excludes the effects of the losses from earlyextinguishments of debt associated with the sales of real estate. The adjustment to exclude losses from earlyextinguishments of debt results when the sale of real estate encumbered by debt requires us to pay theextinguishment costs prior to the debt’s stated maturity and to write-off unamortized loan costs at the date of theextinguishment. Such costs are excluded from the gains on sales of real estate reported in accordance withGAAP. However, we view the losses from early extinguishments of debt associated with the sales of real estateas an incremental cost of the sale transactions because we extinguished the debt in connection with theconsummation of the sale transactions and we had no intent to extinguish the debt absent such transactions. Webelieve that this supplemental adjustment more appropriately reflects the results of our operations exclusive ofthe impact of our sale transactions.
The adjustments for net derivative losses related to non-qualifying derivative contracts for the years endedDecember 31, 2003 and 2002 resulted from interest rate contracts we entered into prior to the effective date ofSFAS No. 133 to limit our exposure to fluctuations in interest rates with respect to variable rate debt associatedwith real estate projects under development. Upon transition to SFAS No. 133 on January 1, 2001, the impacts ofthese contracts were recorded in current earnings, while prior to that time they were capitalized. Although theseadjustments were attributable to a single hedging program, the underlying contracts extended over multiplereporting periods and therefore resulted in adjustments from the first quarter of 2001 through the third quarter of2003. Management presents FFO before the impact of non-qualifying derivative contracts because economicallythis interest rate hedging program was consistent with our risk management objective of limiting our exposure tointerest rate volatility and the change in accounting under GAAP did not correspond to a substantive difference.Management does not currently anticipate structuring future hedging programs in a manner that would give riseto this kind of adjustment.
The adjustments for early lease surrender for the year ended December 31, 2002 resulted from a uniquelease transaction related to the surrender of space by a tenant that was accounted for as a termination for GAAPpurposes and recorded in income at the time the space was surrendered. However, we continued to collectpayments monthly after the surrender of space through the month of July 2002, the date on which the terminatedlease would otherwise have expired under its original terms. Management presents FFO after the early surrenderlease adjustment because economically this transaction impacted periods subsequent to the time the space wassurrendered by the tenant and, therefore, recording the entire amount of the lease termination payment in a singleperiod made FFO less useful as an indicator of operating performance. Although these adjustments areattributable to a single lease, the transaction impacted multiple reporting periods and resulted in an adjustmentfor the year ended December 31, 2002.
Although our FFO, as adjusted, clearly differs from NAREIT’s definition of FFO, and may not becomparable to that of other REITs and real estate companies, we believe it provides a meaningful supplementalmeasure of our operating performance because we believe that, by excluding the effects of the losses from earlyextinguishments of debt associated with the sales of real estate, adjustments for non-qualifying derivativecontracts and early lease surrender payments, management and investors are presented with an indicator of ouroperating performance that more closely achieves the objectives of the real estate industry in presenting FFO.
Neither FFO, nor FFO as adjusted, should be considered as an alternative to net income (determined inaccordance with GAAP) as an indication of our performance. Neither FFO nor FFO, as adjusted, represent cashgenerated from operating activities determined in accordance with GAAP and is not a measure of liquidity or anindicator of our ability to make cash distributions. We believe that to further understand our performance, FFOand FFO, as adjusted should be compared with our reported net income and considered in addition to cash flowsin accordance with GAAP, as presented in our Consolidated Financial Statements.
73

The following table presents a reconciliation of net income available to common shareholders to FFO andFFO, as adjusted, for the years ended December 31, 2006, 2005, 2004, 2003 and 2002:
Year ended December 31,
2006 2005 2004 2003 2002
(in thousands)Net income available to common shareholders . . . . . . . . . . . . . . . . . . . . . . . . . . $873,635 $438,292 $284,017 $365,322 $440,971Add:
Preferred dividend . . . . . . . . . . . . . . . . . . . . . . . . . . . . . . . . . . . . . . . . . . . . . — — — — 3,412Cumulative effect of a change in accounting principle, net of minority
interest . . . . . . . . . . . . . . . . . . . . . . . . . . . . . . . . . . . . . . . . . . . . . . . . . . . . — 4,223 — — —Minority interest in Operating Partnership . . . . . . . . . . . . . . . . . . . . . . . . . . 72,976 74,103 67,743 72,729 71,587
Less:Gains on sales of real estate from discontinued operations, net of minority
interest . . . . . . . . . . . . . . . . . . . . . . . . . . . . . . . . . . . . . . . . . . . . . . . . . . . . — 47,656 27,338 73,234 25,345Income from discontinued operations, net of minority interest . . . . . . . . . . — 1,908 3,344 10,925 26,195Gains on sales of real estate and other assets, net of minority interest . . . . . 606,394 151,884 8,149 57,574 190,443Income from unconsolidated joint ventures . . . . . . . . . . . . . . . . . . . . . . . . . 24,507 4,829 3,380 6,016 7,954Minority interests in property partnerships . . . . . . . . . . . . . . . . . . . . . . . . . . 2,013 6,017 4,685 1,827 2,408
Income before minority interests in property partnerships, income fromunconsolidated joint ventures, minority interest in Operating Partnership,gains on sales of real estate and other assets, discontinued operations,cumulative effect of a change in accounting principle and preferreddividend . . . . . . . . . . . . . . . . . . . . . . . . . . . . . . . . . . . . . . . . . . . . . . . . . . . . . . . 313,697 304,324 304,864 288,475 263,625
Add:Real estate depreciation and amortization (1) . . . . . . . . . . . . . . . . . . . . . . . . 283,350 274,476 257,319 216,235 192,574Income from discontinued operations . . . . . . . . . . . . . . . . . . . . . . . . . . . . . . — 2,279 4,238 13,644 32,294Income from unconsolidated joint ventures . . . . . . . . . . . . . . . . . . . . . . . . . 6,590 (2) 4,829 3,380 6,016 7,954
Less:Minority interests in property partnerships’ share of Funds from
Operations . . . . . . . . . . . . . . . . . . . . . . . . . . . . . . . . . . . . . . . . . . . . . . . . . 479 113 922 3,458 3,223Preferred dividends and distributions . . . . . . . . . . . . . . . . . . . . . . . . . . . . . . 9,418(3) 12,918(3) 15,050 21,249 28,711
Funds from Operations . . . . . . . . . . . . . . . . . . . . . . . . . . . . . . . . . . . . . . . . . . . . . 593,740 572,877 553,829 499,663 464,513Add(subtract):
Losses from early extinguishments of debt associated with the sales of realestate . . . . . . . . . . . . . . . . . . . . . . . . . . . . . . . . . . . . . . . . . . . . . . . . . . . . . 31,444 11,041 — 1,474 2,386
Net derivative losses (SFAS No. 133) . . . . . . . . . . . . . . . . . . . . . . . . . . . . . — — — 1,038 11,874Early surrender lease adjustment . . . . . . . . . . . . . . . . . . . . . . . . . . . . . . . . . — — — — 8,520
Funds from Operations after supplemental adjustments to exclude losses fromearly extinguishments of debt associated with the sales of real estate, netderivative losses (SFAS No. 133) and early surrender lease adjustment . . . . . 625,184 583,918 553,829 502,175 487,293
Less:Minority interest in Operating Partnership’s share of Funds from
Operations after supplemental adjustments to exclude losses from earlyextinguishments of debt associated with the sales of real estate, netderivative losses (SFAS No. 133) and early surrender leaseadjustment . . . . . . . . . . . . . . . . . . . . . . . . . . . . . . . . . . . . . . . . . . . . . . . . . 97,519 94,946 94,332 90,102 87,804
Funds from Operations available to common shareholders after supplementaladjustments to exclude losses from early extinguishments of debt associatedwith the sales of real estate, net derivative losses (SFAS No. 133) and earlysurrender lease adjustment . . . . . . . . . . . . . . . . . . . . . . . . . . . . . . . . . . . . . . . . $527,665 $488,972 $459,497 $412,073 $399,489
Our percentage share of Funds from Operations—basic . . . . . . . . . . . . . . . . . . . 84.40% 83.74% 82.97% 82.06% 81.98%Weighted average shares outstanding—basic . . . . . . . . . . . . . . . . . . . . . . . . . . . . 114,721 111,274 106,458 96,900 93,145
(1) Real estate depreciation and amortization consists of depreciation and amortization from the Consolidated Statements ofOperations of $276,759, $266,829, $249,649, $206,686 and $176,412, our share of unconsolidated joint venture realestate depreciation and amortization of $9,087, $8,554, $6,814, $8,475 and $8,955, and depreciation and amortizationfrom discontinued operations of $0, $812, $3,292, $3,791 and $10,016, less corporate related depreciation andamortization of $1,584, $1,719, $2,436, $2,717 and $2,809 and adjustment of asset retirement obligations of $912, $0,$0, $0 and $0 for the years ended December 31, 2006, 2005, 2004, 2003 and 2002, respectively.
(2) Excludes approximately $17.9 million related to our share of the gain on sale and related loss from early extinguishmentof debt associated with the sale of 265 Franklin Street.
(3) Excludes approximately $12.2 million and approximately $12.1 million for the year ended December 31, 2006 and 2005,respectively, of income allocated to the holders of Series Two Preferred Units to account for their right to participate onan as-converted basis in the special dividends that followed previously completed sales of real estate.
74

Rec
onci
liatio
nto
Dilu
ted
Fund
sfr
omO
pera
tions
:
For
the
year
sen
ded
Dec
embe
r31
,
2006
2005
2004
2003
2002
Inco
me
(Num
erat
or)
Shar
es/U
nits
(Den
omin
ator
)In
com
e(N
umer
ator
)Sh
ares
/Uni
ts(D
enom
inat
or)
Inco
me
(Num
erat
or)
Shar
es/U
nits
(Den
omin
ator
)In
com
e(N
umer
ator
)Sh
ares
/Uni
ts(D
enom
inat
or)
Inco
me
(Num
erat
or)
Shar
es/U
nits
(Den
omin
ator
)B
asic
Fund
sfr
omO
pera
tions
afte
rsu
pple
men
tala
djus
tmen
tsto
excl
ude
loss
esfr
omea
rly
extin
guis
hmen
tsof
debt
asso
ciat
edw
ithth
esa
les
ofre
ales
tate
,net
deri
vativ
elo
sses
(SFA
SN
o.13
3)an
dea
rly
surr
ende
rle
ase
adju
stm
ent.
....
....
....
....
....
$625
,184
135,
923
$583
,918
132,
881
$553
,829
128,
313
$502
,175
118,
087
$487
,293
113,
617
Eff
ecto
fD
ilutiv
eSe
curi
ties:
Con
vert
ible
Pref
erre
dU
nits
....
.9,
418(
1)3,
629
12,9
18(1
)5,
163
15,0
506,
054
21,2
498,
375
25,1
149,
821
Con
vert
ible
Pref
erre
dSt
ock
....
.—
——
——
——
—3,
412
1,36
6St
ock
Opt
ions
and
othe
r..
....
..—
2,35
6—
2,28
5—
2,30
3—
1,58
618
51,
468
Dilu
ted
Fund
sfr
omO
pera
tions
afte
rsu
pple
men
tala
djus
tmen
tsto
excl
ude
loss
esfr
omea
rly
extin
guis
hmen
tsof
debt
asso
ciat
edw
ithth
esa
les
ofre
ales
tate
,net
deri
vativ
elo
sses
(SFA
SN
o.13
3)an
dea
rly
surr
ende
rle
ase
adju
stm
ent.
....
....
....
....
....
$634
,602
141,
908
$596
,836
140,
329
$568
,879
136,
670
$523
,424
128,
048
$516
,004
126,
272
Les
s:M
inor
ityin
tere
stin
Ope
ratin
gPa
rtne
rshi
p’s
shar
eof
dilu
ted
Fund
sfr
omO
pera
tions
....
....
....
....
94,8
1321
,202
91,8
9621
,607
90,9
7021
,854
86,6
0821
,187
83,6
5920
,473
Dilu
ted
Fund
sfr
omO
pera
tions
avai
labl
eto
com
mon
shar
ehol
ders
afte
rsu
pple
men
tala
djus
tmen
tsto
excl
ude
loss
esfr
omea
rly
extin
guis
hmen
tsof
debt
asso
ciat
edw
ithth
esa
les
ofre
ales
tate
,net
deri
vativ
elo
sses
(SFA
SN
o.13
3)an
dea
rly
surr
ende
rle
ase
adju
stm
ent(
2)..
....
....
....
....
$539
,789
120,
706
$504
,940
118,
722
$477
,909
114,
816
$436
,816
106,
861
$432
,345
105,
799
(1)
Exc
lude
sap
prox
imat
ely
$12.
2m
illio
nan
dap
prox
imat
ely
$12.
1m
illio
nfo
rth
eye
ars
ende
dD
ecem
ber
31,2
006
and
2005
,res
pect
ivel
y,of
inco
me
allo
cate
dto
the
hold
ers
ofSe
ries
Tw
oPr
efer
red
Uni
tsto
acco
untf
orth
eir
righ
tto
part
icip
ate
onan
as-c
onve
rted
basi
sin
the
spec
iald
ivid
ends
that
follo
wed
prev
ious
lyco
mpl
eted
sale
sof
real
esta
te.
(2)
Our
shar
eof
dilu
ted
Fund
sfr
omO
pera
tions
was
85.0
6%,8
4.60
%,8
4.01
%,8
3.45
%an
d83
.79%
for
the
year
sen
ded
Dec
embe
r31
,200
6,20
05,2
004,
2003
and
2002
,res
pect
ivel
y.
75

Net Operating Income
Net operating income, or “NOI,” is a non-GAAP financial measure equal to net income available tocommon shareholders, the most directly comparable GAAP financial measure, plus minority interest inOperating Partnership, net derivative losses, losses from early extinguishments of debt, losses on investments insecurities, cumulative effect of a change in accounting principle (net of minority interest), preferred dividends,depreciation and amortization, interest expense and general and administrative expense, less gains on sales ofreal estate from discontinued operations (net of minority interest), income from discontinued operations (net ofminority interest), gains on sales of real estate (net of minority interest), income from unconsolidated jointventures, minority interests in property partnerships, interest and other income and development andmanagement services revenue. We use NOI internally as a performance measure and believe NOI provides usefulinformation to investors regarding our financial condition and results of operations because it reflects only thoseincome and expense items that are incurred at the property level. Therefore, we believe NOI is a useful measurefor evaluating the operating performance of our real estate assets.
Our management also uses NOI to evaluate regional property level performance and to make decisionsabout resource allocations. Further, we believe NOI is useful to investors as a performance measure because,when compared across periods, NOI reflects the impact on operations from trends in occupancy rates, rentalrates, operating costs and acquisition and development activity on an unleveraged basis, providing perspectivenot immediately apparent from net income. NOI excludes certain components from net income in order toprovide results that are more closely related to a property’s results of operations. For example, interest expense isnot necessarily linked to the operating performance of a real estate asset and is often incurred at the corporatelevel as opposed to the property level. In addition, depreciation and amortization, because of historical costaccounting and useful life estimates, may distort operating performance at the property level. NOI presented byus may not be comparable to NOI reported by other REITs and real estate companies that define NOI differently.We believe that in order to facilitate a clear understanding of our operating results, NOI should be examined inconjunction with net income as presented in our Consolidated Financial Statements. NOI should not beconsidered as an alternative to net income as an indication of our performance or to cash flows as a measure ofliquidity or ability to make distributions.
The following sets forth a reconciliation of NOI to net income available to common shareholders for thefiscal years 2002 through 2006.
Years ended December 31,
2006 2005 2004 2003 2002
Net operating income . . . . . . . . . . . . . . . . . . . . . . . . . . . . . . . . . . . . . . . . . . . . . . $923,672 $918,286 $889,798 $822,122 $752,743Add:
Development and management services . . . . . . . . . . . . . . . . . . . . . . . . . . . . 19,825 17,310 20,440 17,332 10,731Interest and other . . . . . . . . . . . . . . . . . . . . . . . . . . . . . . . . . . . . . . . . . . . . . . 36,737 12,015 10,339 3,014 5,479Minority interests in property partnerships . . . . . . . . . . . . . . . . . . . . . . . . . . 2,013 6,017 4,685 1,827 2,408Income from unconsolidated joint ventures . . . . . . . . . . . . . . . . . . . . . . . . . 24,507 4,829 3,380 6,016 7,954Gains on sales of real estate and other assets, net of minority interest . . . . . 606,394 151,884 8,149 57,574 190,443Income from discontinued operations, net of minority interest . . . . . . . . . . — 1,908 3,344 10,925 26,195Gains on sales of real estate from discontinued operations, net of minority
interest . . . . . . . . . . . . . . . . . . . . . . . . . . . . . . . . . . . . . . . . . . . . . . . . . . . . — 47,656 27,338 73,234 25,345Less:
General and administrative . . . . . . . . . . . . . . . . . . . . . . . . . . . . . . . . . . . . . . 59,375 55,471 53,636 45,359 47,292Interest expense . . . . . . . . . . . . . . . . . . . . . . . . . . . . . . . . . . . . . . . . . . . . . . . 298,260 308,091 306,170 299,436 263,067Depreciation and amortization . . . . . . . . . . . . . . . . . . . . . . . . . . . . . . . . . . . 276,759 266,829 249,649 206,686 176,412Net derivative losses . . . . . . . . . . . . . . . . . . . . . . . . . . . . . . . . . . . . . . . . . . . — — — 1,038 11,874Losses from early extinguishments of debt . . . . . . . . . . . . . . . . . . . . . . . . . . 32,143 12,896 6,258 1,474 2,386Losses on investments in securities . . . . . . . . . . . . . . . . . . . . . . . . . . . . . . . — — — — 4,297Minority interest in Operating Partnership . . . . . . . . . . . . . . . . . . . . . . . . . . 72,976 74,103 67,743 72,729 71,587Cumulative effect of a change in accounting principle, net of minority
interest . . . . . . . . . . . . . . . . . . . . . . . . . . . . . . . . . . . . . . . . . . . . . . . . . . . . — 4,223 — — —Preferred dividend . . . . . . . . . . . . . . . . . . . . . . . . . . . . . . . . . . . . . . . . . . . . . — — — — 3,412
Net income available to common shareholders . . . . . . . . . . . . . . . . . . . . . . . . . . $873,635 $438,292 $284,017 $365,322 $440,971
76

Contractual Obligations
As of December 31, 2006, we were subject to contractual payment obligations as described in the tablebelow.
Payments Due by Period
Total 2007 2008 2009 2010 2011 Thereafter
(Dollars in thousands)Contractual Obligations:Long-term debt
Mortgage debt (1) . . . . . . . . . . . . . . . . . . . . $3,278,301 $219,307 $1,417,139 $350,485 $425,879 $546,349 $ 319,142Unsecured senior notes (1) . . . . . . . . . . . . . 2,100,472 87,188 87,188 87,188 87,188 87,188 1,664,532
Unsecured senior exchangeable notes (1) . . . . . . 557,630 16,875 16,875 16,875 16,875 16,875 473,255Unsecured line of credit . . . . . . . . . . . . . . . . . . . . — — — — — — —Ground leases . . . . . . . . . . . . . . . . . . . . . . . . . . . 46,448 2,349 2,252 2,275 2,300 2,324 34,948Tenant obligations (2) . . . . . . . . . . . . . . . . . . . . . 93,266 82,965 5,475 4,458 368 — —Construction contracts on development
projects . . . . . . . . . . . . . . . . . . . . . . . . . . . . . . 298,431 194,076 78,067 23,324 2,964 — —
Total Contractual Obligations . . . . . . . . . . . . . . . $6,374,548 $602,760 $1,606,996 $484,605 $535,574 $652,736 $2,491,877
(1) Amounts include principal and interest payments.(2) Committed tenant-related obligations based on executed leases as of December 31, 2006 (tenant improvements and lease commissions).
We have various standing or renewable service contracts with vendors related to our property management.In addition, we have certain other utility contracts we enter into in the ordinary course of business that mayextend beyond one year and that vary based on usage. These contracts include terms that provide for cancellationwith insignificant or no cancellation penalties. Contract terms are generally one year or less.
Off-Balance Sheet Arrangements
Joint Ventures
We have investments in eight unconsolidated joint ventures (including our investment in the Value-AddedFund) with our effective ownership interests ranging from 23.89% to 51%, all of which have mortgageindebtedness. We exercise significant influence over, but do not control, these entities and therefore they arepresently accounted for using the equity method of accounting. See also Note 5 to the Consolidated FinancialStatements. At December 31, 2006, the debt related to these ventures was equal to approximately $630.3 million.The table below summarizes the outstanding debt of these joint venture properties at December 31, 2006:
PropertiesCompany %Ownership
InterestRate
PrincipalAmount
MaturityDate
(in thousands)
901 New York Avenue . . . . . . . . . . . . . . . . . . . . . . . . . 25.00% 5.19% $170,000 January 1,2015Metropolitan Square . . . . . . . . . . . . . . . . . . . . . . . . . . . 51.00% 8.23% 130,643 May 1, 2010Market Square North . . . . . . . . . . . . . . . . . . . . . . . . . . 50.00% 7.70% 90,112 December 19, 2010Worldgate Plaza . . . . . . . . . . . . . . . . . . . . . . . . . . . . . . 25.00% 6.24% 57,000(1) December 1, 2007Wisconsin Place . . . . . . . . . . . . . . . . . . . . . . . . . . . . . . 23.89% 6.88% 50,770(2) March 11, 2009Circle Star . . . . . . . . . . . . . . . . . . . . . . . . . . . . . . . . . . . 25.00% 6.57% 42,000(3) September 1, 2013505 9th Avenue . . . . . . . . . . . . . . . . . . . . . . . . . . . . . . . 50.00% 6.05% 43,505(4) See note 4New York Land Venture . . . . . . . . . . . . . . . . . . . . . . . . 50.00% 7.60% 23,600(5) May 8, 2008Wisconsin Place . . . . . . . . . . . . . . . . . . . . . . . . . . . . . . 23.89% 4.38% 15,124(6) January 1, 2008300 Billerica Road . . . . . . . . . . . . . . . . . . . . . . . . . . . . 25.00% 5.69% 7,500(3) January 1, 2016
Total . . . . . . . . . . . . . . . . . . . . . . . . . . . . . . . . . . . . . . . $630,254
77

(1) This property is owned by the Value-Added Fund. The mortgage financing bears interest at a variable rateequal to LIBOR plus 0.89% per annum and requires interest only payments with a balloon payment due atmaturity. This mortgage matures in December 2007, with two one-year extension options. In addition, theValue-Added Fund entered into an agreement to cap the interest rate at 9.5% for a nominal fee.
(2) Amount represents outstanding construction financing under a $96.5 million loan commitment (of whichour share is $23.1 million) at a variable rate equal to LIBOR plus 1.50% per annum with a maturity inMarch 2009. The mortgage debt requires interest only payments with a balloon payment due at maturity.
(3) This property is owned by the Value-Added Fund. The mortgage financing bears interest at a fixed rate andrequires interest only payments with a balloon payment due at maturity.
(4) Amount represents outstanding construction financing under a $60.0 million loan commitment (of whichour share is $30.0 million) which bears interest at a fixed rate of 5.73% per annum and a $35.0 million loancommitment (of which our share is $17.5 million) which bears interest at a variable rate of LIBOR plus1.25% per annum. The financing converts to a ten-year fixed rate loan in October 2007 at an interest rate of5.73% per annum with a provision for an increase in the borrowing capacity by $35.0 million (of which ourshare would be $17.5 million). The conversion is subject to conditions which we expect to satisfy. As ofDecember 31, 2006, the interest rate on the variable rate portion of the debt was 6.60% per annum. Theweighted-average rate as of December 31, 2006 is reflected in the table.
(5) We have agreed to guarantee approximately $11.8 million of this loan. The financing bears interest at avariable rate equal to LIBOR plus 2.25% per annum.
(6) In accordance with EITF 98-1, the principal amount and interest rates shown were adjusted to reflect the fairvalue of the note using an effective interest rate of 4.38% per annum. This note is non-interest bearing witha stated principal balance of $15.5 million (of which our share is approximately $2.9 million) and matures inJanuary 2008. The weighted average rates exclude the impact of this loan. We have agreed, together withour third-party joint venture partners, to guarantee this seller financing on behalf of the land andinfrastructure entity.
Environmental Matters
It is our policy to retain independent environmental consultants to conduct or update Phase I environmentalassessments (which generally do not involve invasive techniques such as soil or ground water sampling) andasbestos surveys in connection with our acquisition of properties. These pre-purchase environmental assessmentshave not revealed environmental conditions that we believe will have a material adverse effect on our business,assets, financial condition, results of operations or liquidity, and we are not otherwise aware of environmentalconditions with respect to our properties that we believe would have such a material adverse effect. However,from time to time environmental conditions at our properties have required and may in the future requireenvironmental testing and/or regulatory filings, as well as remedial action.
In February 1999, we (through a joint venture) acquired from Exxon Corporation a property inMassachusetts that was formerly used as a petroleum bulk storage and distribution facility and was known by thestate regulatory authority to contain soil and groundwater contamination. We developed an office park on theproperty. We engaged a specially licensed environmental consultant to oversee the management of contaminatedsoil and groundwater that was disturbed in the course of construction. Under the property acquisition agreement,Exxon agreed to (1) bear the liability arising from releases or discharges of oil and hazardous substances whichoccurred at the site prior to our ownership, (2) continue monitoring and/or remediating such releases anddischarges as necessary and appropriate to comply with applicable requirements, and (3) indemnify us for certainlosses arising from preexisting site conditions. Any indemnity claim may be subject to various defenses, andthere can be no assurance that the amounts paid under the indemnity, if any, would be sufficient to cover theliabilities arising from any such releases and discharges.
Environmental investigations at two of our properties in Massachusetts have identified groundwatercontamination migrating from off-site source properties. In both cases we engaged a specially licensed
78

environmental consultant to perform the necessary investigations and assessments and to prepare submittals tothe state regulatory authority, including Downgradient Property Status Opinions. The environmental consultantconcluded that the properties qualify for Downgradient Property Status under the state regulatory program, whicheliminates certain deadlines for conducting response actions at a site. We also believe that these propertiesqualify for liability relief under certain statutory amendments regarding upgradient releases. Although we believethat the current or former owners of the upgradient source properties may bear responsibility for some or all ofthe costs of addressing the identified groundwater contamination, we will take necessary further response actions(if any are required). Other than periodic testing, no such additional response actions are anticipated at this time.
We own a property in Massachusetts where historic groundwater contamination was identified prior toacquisition. We engaged a specially licensed environmental consultant to perform investigations and to preparenecessary submittals to the state regulatory authority. The environmental consultant has concluded that(1) certain identified groundwater contaminants are migrating to the subject property from an off-site sourceproperty and (2) certain other detected contaminants are likely related to a historic release on the subjectproperty. We have filed a Downgradient Property Status Opinion (described above) with respect tocontamination migrating from off-site and a Response Action Outcome (“RAO”) with respect to the identifiedhistoric release. The RAO indicates that regulatory closure has been achieved and that no further action isrequired at this time.
Some of our properties and certain properties owned by our affiliates are located in urban, industrial andother previously developed areas where fill or current or historical uses of the areas have caused sitecontamination. Accordingly, it is sometimes necessary to institute special soil and/or groundwater handlingprocedures and/or include particular building design features in connection with development, construction andother property operations in order to achieve regulatory closure and/or ensure that contaminated materials areaddressed in an appropriate manner. In these situations it is our practice to investigate the nature and extent ofdetected contamination and estimate the costs of required response actions and special handling procedures. Wethen use this information as part of our decision-making process with respect to the acquisition and/ordevelopment of the property. We own a parcel in Massachusetts, formerly used as a quarry/asphalt batchingfacility, which we may develop in the future. Pre-purchase testing indicated that the site contains relatively lowlevels of certain contaminants. We have engaged a specially licensed environmental consultant to monitorenvironmental conditions at the site and prepare necessary regulatory submittals based on the results of anenvironmental risk characterization. We anticipate that additional response actions necessary to achieveregulatory closure (if any) will be performed prior to or in connection with future development activities. Whenappropriate, closure documentation will be submitted for public review and comment pursuant to the stateregulatory authority’s public information process.
We expect that resolution of the environmental matters relating to the above will not have a material impacton our business, assets, financial condition, results of operations or liquidity. However, we cannot assure you thatwe have identified all environmental liabilities at our properties, that all necessary remediation actions have beenor will be undertaken at our properties or that we will be indemnified, in full or at all, in the event that suchenvironmental liabilities arise.
Newly Issued Accounting Standards
In February 2006, the FASB issued SFAS No. 155, “Accounting for Certain Hybrid Financial Instruments—an Amendment of FASB Statements No. 133 and 140” (“SFAS No. 155”). The purpose of SFAS No. 155 is tosimplify the accounting for certain hybrid financial instruments by permitting fair value re-measurement for anyhybrid financial instrument that contains an embedded derivative that otherwise would require bifurcation. SFASNo. 155 is effective for all financial instruments acquired or issued after the beginning of an entity’s first fiscalyear that begins after September 15, 2006. We do not expect the adoption of SFAS No. 155 to have a materialimpact on our cash flows, results of operations, financial position, or liquidity.
79
In March 2006, the FASB issued SFAS No. 156, “Accounting for Servicing of Financial Assets—anAmendment of FASB Statement No. 140” (“SFAS No. 156”). SFAS No. 156 requires recognition of a servicingasset or a servicing liability each time an entity undertakes an obligation to service a financial asset by enteringinto a servicing contract. SFAS No. 156 also requires that all separately recognized servicing assets and servicingliabilities be initially measured at fair value and subsequently measured at fair value at each reporting date. SFASNo. 156 is effective as of the beginning of an entity’s first fiscal year that begins after September 15, 2006. Wedo not expect the adoption of SFAS No. 156 to have a material impact on our cash flows, results of operations,financial position, or liquidity.
In June 2006, the FASB issued Interpretation No. 48, “Accounting for Uncertainty in Income Taxes, anInterpretation of FASB Statement No. 109” (“FIN No. 48”). FIN No. 48 clarifies the accounting for uncertaintyin income taxes recognized in a company’s financial statements and prescribes a recognition threshold andmeasurement attribute for the financial statement recognition and measurement of a tax position taken orexpected to be taken in a tax return. FIN No. 48 also provides guidance on description, classification, interest andpenalties, accounting in interim periods, disclosure and transition. FIN No. 48 is effective for fiscal yearsbeginning after December 15, 2006. We do not expect the adoption of FIN No. 48 to have a material impact onour cash flows, results of operations, financial position, or liquidity.
In September 2006, the Securities and Exchange Commission issued Staff Accounting Bulletin No. 108(“SAB No. 108”), “Considering the Effects of Prior Year Misstatements When Quantifying Misstatements inCurrent Year Financial Statements.” SAB 108 provides guidance on the consideration of the effects of priorperiod misstatements in quantifying current year misstatements for the purpose of a materiality assessment. SAB108 requires the quantification of financial statement misstatements based on the effects of the misstatements oneach of the company’s financial statements and the related financial statement disclosures. This model iscommonly referred to as the “dual approach” because it requires quantification of errors under both the ironcurtain and the roll-over methods. The roll-over method focuses primarily on the impact of a misstatement on theincome statement—including the reversing effect of prior year misstatements—but its use can lead to theaccumulation of misstatements in the balance sheet. The iron-curtain method focuses primarily on the effect ofcorrecting the period-end balance sheet with less emphasis on the reversing effects of prior year errors on theincome statement. SAB 108 was effective for financial statements for fiscal years ending after November 15,2006. The adoption of SAB 108 did not have a material impact on our cash flows, results of operations, financialposition or liquidity.
Inflation
Substantially all of our leases provide for separate real estate tax and operating expense escalations over abase amount. In addition, many of our leases provide for fixed base rent increases or indexed increases. Webelieve that inflationary increases in costs may be at least partially offset by the contractual rent increases andoperating expense escalations.
80

Item 7A. Quantitative and Qualitative Disclosures about Market Risk
Approximately $3.9 billion of our borrowings, as of December 31, 2006, bear interest at fixed rates, andtherefore the fair value of these instruments is affected by changes in the market interest rates. The followingtable presents our aggregate fixed rate debt obligations as of December 31, 2006 with corresponding weighted-average interest rates sorted by maturity date and our aggregate variable rate debt obligations sorted by maturitydate. The weighted average interest rate on the variable rate debt as of December 31, 2006 was 5.80% per annum.
2007 2008 2009 2010 2011 2012+ Total Fair Value
(dollars in thousands)Secured debtFixed Rate . . . . . . . . . $45,489 $ 797,794 $184,450 $130,625 $542,781 $ 266,833 $1,967,972 $2,058,000Average Interest
Rate . . . . . . . . . . . . 7.15% 6.83% 7.10% 7.96% 7.23% 7.09% 7.08%Variable Rate . . . . . . . — $ 475,000 $ 11,490 $225,000 — — $ 711,490 $ 711,490Unsecured debtFixed Rate . . . . . . . . . — — — — — $1,471,475 $1,471,475 $1,496,497Average Interest
Rate . . . . . . . . . . . . — — — — — 5.95% 5.95%Variable Rate . . . . . . . — — — — — — — —Unsecured
exchangeable debtFixed Rate . . . . . . . . . — — — — — $ 450,000 $ 450,000 $ 517,685Average Interest
Rate . . . . . . . . . . . . — — — — — 3.75% 3.75%Variable Rate . . . . . . . — — — — — — — —
Total Debt . . . . . . . . . $45,489 $1,272,794 $195,940 $355,625 $542,781 $2,188,308 $4,600,937 $4,783,672
During 2005, we entered into twelve forward-starting interest rate swap contracts to lock in the 10-yeartreasury rate and 10-year swap spread in contemplation of obtaining long-term fixed-rate financing to refinanceexisting debt that is expiring or freely prepayable prior to February 2007. Based on swap spreads at each tradedate, the swaps fix the 10-year treasury rate for a financing in February 2007 at a weighted average rate of4.34% per annum on notional amounts aggregating $500.0 million. The swaps were to go into effect in February2007 and expire in February 2017. We believe that these swaps qualify as highly-effective cash flow hedgesunder SFAS No. 133, “Accounting for Derivative Instruments and Hedging Activities,” as amended. OnDecember 19, 2006, we entered into an interest rate lock agreement with a lender for a fixed interest rate of5.57% per annum on a ten-year mortgage financing totaling $750.0 million to be collateralized by our 599Lexington Avenue property in New York City. We closed on the mortgage financing on February 12, 2007. Inconjunction with the interest rate lock agreement, we terminated the forward-starting interest rate swap contractsand received approximately $10.9 million, which amount will reduce our interest expense over the ten-year termof the financing, resulting in an effective interest rate of 5.38% per annum. We intend to consider entering intoadditional hedging arrangements to minimize our interest rate risk. We expect that within the next twelve monthswe will reclassify into earnings approximately $1.0 million of the amounts recorded within Accumulated OtherComprehensive Loss relating to the forward-starting interest rate swap contracts. See Note 6 to the ConsolidatedFinancial Statements.
Additional disclosure about market risk is incorporated herein by reference from “Management’s Discussionand Analysis of Financial Condition and Results of Operations—Liquidity and Capital Resources—MarketRisk.”
81

Item 8. Financial Statements and Supplementary Data
BOSTON PROPERTIES, INC.INDEX TO CONSOLIDATED FINANCIAL STATEMENTS
Page
Management’s Report on Internal Control over Financial Reporting . . . . . . . . . . . . . . . . . . . . . . . . . . . . . . . 83
Report of Independent Registered Public Accounting Firm . . . . . . . . . . . . . . . . . . . . . . . . . . . . . . . . . . . . . . 84
Consolidated Balance Sheets as of December 31, 2006 and 2005 . . . . . . . . . . . . . . . . . . . . . . . . . . . . . . . . . . 86
Consolidated Statements of Operations for the years ended December 31, 2006, 2005 and 2004 . . . . . . . . . 87
Consolidated Statements of Stockholders’ Equity for the years ended December 31, 2006, 2005 and2004 . . . . . . . . . . . . . . . . . . . . . . . . . . . . . . . . . . . . . . . . . . . . . . . . . . . . . . . . . . . . . . . . . . . . . . . . . . . . . . . 88
Consolidated Statements of Comprehensive Income for the years ended December 31, 2006, 2005 and2004 . . . . . . . . . . . . . . . . . . . . . . . . . . . . . . . . . . . . . . . . . . . . . . . . . . . . . . . . . . . . . . . . . . . . . . . . . . . . . . . 89
Consolidated Statements of Cash Flows for the years ended December 31, 2006, 2005 and 2004 . . . . . . . . . 90
Notes to Consolidated Financial Statements . . . . . . . . . . . . . . . . . . . . . . . . . . . . . . . . . . . . . . . . . . . . . . . . . . 92
Financial Statement Schedule—Schedule III . . . . . . . . . . . . . . . . . . . . . . . . . . . . . . . . . . . . . . . . . . . . . . . . . 137
All other schedules for which a provision is made in the applicable accounting regulations of the Securitiesand Exchange Commission are not required under the related instructions or are inapplicable, and therefore havebeen omitted.
82

Management’s Report on Internal Control overFinancial Reporting
Management of Boston Properties, Inc. (“the Company”), is responsible for establishing and maintainingadequate internal control over financial reporting for the Company. The Company’s internal control overfinancial reporting is a process designed under the supervision of the Company’s principal executive andprincipal financial officers to provide reasonable assurance regarding the reliability of financial reporting and thepreparation of the Company’s financial statements for external reporting purposes in accordance withU.S. generally accepted accounting principles.
As of the end of the Company’s 2006 fiscal year, management conducted assessments of the effectivenessof the Company’s internal control over financial reporting based on the framework established in InternalControl—Integrated Framework issued by the Committee of Sponsoring Organizations of the TreadwayCommission (COSO). Based on these assessments, management has determined that the Company’s internalcontrol over financial reporting as of December 31, 2006 was effective.
Our internal control over financial reporting includes policies and procedures that (1) pertain to themaintenance of records that, in reasonable detail, accurately and fairly reflect transactions and dispositions of ourassets; (2) provide reasonable assurance that transactions are recorded as necessary to permit preparation offinancial statements in accordance with U.S. generally accepted accounting principles, and that receipts andexpenditures are being made only in accordance with authorizations of management and the directors of theCompany; and (3) provide reasonable assurance regarding prevention or timely detection of unauthorizedacquisition, use or disposition of the Company’s assets that could have a material effect on our financialstatements.
Management’s assessment of the effectiveness of the Company’s internal control over financial reporting asof December 31, 2006 has been audited by PricewaterhouseCoopers LLP, an independent registered publicaccounting firm, as stated in its report appearing on pages 84 and 85, which expresses unqualified opinions onmanagement’s assessment and on the effectiveness of the Company’s internal control over financial reporting asof December 31, 2006.
83
Report of Independent Registered Public Accounting Firm
To the Board of Directors and Shareholdersof Boston Properties, Inc.:
We have completed integrated audits of Boston Properties, Inc.’s consolidated financial statements and ofits internal control over financial reporting as of December 31, 2006 in accordance with the standards of thePublic Company Accounting Oversight Board (United States). Our opinions, based on our audits, are presentedbelow.
Consolidated Financial statements and financial statement schedule
In our opinion, the consolidated financial statements listed in the accompanying index present fairly, in allmaterial respects, the financial position of Boston Properties, Inc. and its subsidiaries at December 31, 2006 and2005, and the results of their operations and their cash flows for each of the three years in the period endedDecember 31, 2006 in conformity with accounting principles generally accepted in the United States of America.In addition, in our opinion, the financial statement schedule listed in the accompanying index presents fairly, inall material respects, the information set forth therein when read in conjunction with the related consolidatedfinancial statements. These financial statements and financial statement schedule are the responsibility of theCompany’s management. Our responsibility is to express an opinion on these financial statements and financialstatement schedule based on our audits. We conducted our audits of these statements in accordance with thestandards of the Public Company Accounting Oversight Board (United States). Those standards require that weplan and perform the audit to obtain reasonable assurance about whether the financial statements are free ofmaterial misstatement. An audit of financial statements includes examining, on a test basis, evidence supportingthe amounts and disclosures in the financial statements, assessing the accounting principles used and significantestimates made by management, and evaluating the overall financial statement presentation. We believe that ouraudits provide a reasonable basis for our opinion.
As discussed in Note 2 to the consolidated financial statements, in the fourth quarter of 2005, the Companyadopted Financial Accounting Standards Board Interpretation No. 47, “Accounting for Conditional AssetRetirement Obligations, an interpretation of FASB Statement No. 143.”
Internal control over financial reporting
Also, in our opinion, management’s assessment, included in Management’s Report on Internal Control overFinancial Reporting appearing on page 83, that the Company maintained effective internal control over financialreporting as of December 31, 2006 based on criteria established in Internal Control—Integrated Frameworkissued by the Committee of Sponsoring Organizations of the Treadway Commission (COSO), is fairly stated, inall material respects, based on those criteria. Furthermore, in our opinion, the Company maintained, in allmaterial respects, effective internal control over financial reporting as of December 31, 2006, based on criteriaestablished in Internal Control—Integrated Framework issued by the COSO. The Company’s management isresponsible for maintaining effective internal control over financial reporting and for its assessment of theeffectiveness of internal control over financial reporting. Our responsibility is to express opinions onmanagement’s assessment and on the effectiveness of the Company’s internal control over financial reportingbased on our audit. We conducted our audit of internal control over financial reporting in accordance with thestandards of the Public Company Accounting Oversight Board (United States). Those standards require that weplan and perform the audit to obtain reasonable assurance about whether effective internal control over financialreporting was maintained in all material respects. An audit of internal control over financial reporting includesobtaining an understanding of internal control over financial reporting, evaluating management’s assessment,testing and evaluating the design and operating effectiveness of internal control, and performing such otherprocedures as we consider necessary in the circumstances. We believe that our audit provides a reasonable basisfor our opinions.
84
A company’s internal control over financial reporting is a process designed to provide reasonable assuranceregarding the reliability of financial reporting and the preparation of financial statements for external purposes inaccordance with generally accepted accounting principles. A company’s internal control over financial reportingincludes those policies and procedures that (i) pertain to the maintenance of records that, in reasonable detail,accurately and fairly reflect the transactions and dispositions of the assets of the company; (ii) provide reasonableassurance that transactions are recorded as necessary to permit preparation of financial statements in accordancewith generally accepted accounting principles, and that receipts and expenditures of the company are being madeonly in accordance with authorizations of management and directors of the company; and (iii) provide reasonableassurance regarding prevention or timely detection of unauthorized acquisition, use, or disposition of thecompany’s assets that could have a material effect on the financial statements.
Because of its inherent limitations, internal control over financial reporting may not prevent or detectmisstatements. Also, projections of any evaluation of effectiveness to future periods are subject to the risk thatcontrols may become inadequate because of changes in conditions, or that the degree of compliance with thepolicies or procedures may deteriorate.
/s/ PricewaterhouseCoopers LLPPricewaterhouseCoopers LLPBoston, MassachusettsMarch 1, 2007
85

BOSTON PROPERTIES, INC.CONSOLIDATED BALANCE SHEETS
(in thousands, except for share and par value amounts)
December 31,2006
December 31,2005
ASSETSReal estate, at cost: . . . . . . . . . . . . . . . . . . . . . . . . . . . . . . . . . . . . . . . . . . . . . . . . . . . . $ 9,552,458 $ 9,151,175
Less: accumulated depreciation . . . . . . . . . . . . . . . . . . . . . . . . . . . . . . . . . . . . . . (1,392,055) (1,265,073)
Total real estate . . . . . . . . . . . . . . . . . . . . . . . . . . . . . . . . . . . . . . . . . . . . . . . 8,160,403 7,886,102Cash and cash equivalents . . . . . . . . . . . . . . . . . . . . . . . . . . . . . . . . . . . . . . . . . . . . . . 725,788 261,496Cash held in escrows . . . . . . . . . . . . . . . . . . . . . . . . . . . . . . . . . . . . . . . . . . . . . . . . . . 25,784 25,618Tenant and other receivables (net of allowance for doubtful accounts of $2,682 and
$2,519, respectively) . . . . . . . . . . . . . . . . . . . . . . . . . . . . . . . . . . . . . . . . . . . . . . . . . 57,052 52,668Accrued rental income (net of allowance of $783 and $2,638, respectively) . . . . . . . 327,337 302,356Deferred charges, net . . . . . . . . . . . . . . . . . . . . . . . . . . . . . . . . . . . . . . . . . . . . . . . . . . 274,079 242,660Prepaid expenses and other assets . . . . . . . . . . . . . . . . . . . . . . . . . . . . . . . . . . . . . . . . 40,868 41,261Investments in unconsolidated joint ventures . . . . . . . . . . . . . . . . . . . . . . . . . . . . . . . . 83,711 90,207
Total assets . . . . . . . . . . . . . . . . . . . . . . . . . . . . . . . . . . . . . . . . . . . . . . . . . . $ 9,695,022 $ 8,902,368
LIABILITIES AND STOCKHOLDERS' EQUITYLiabilities:
Mortgage notes payable . . . . . . . . . . . . . . . . . . . . . . . . . . . . . . . . . . . . . . . . . . . . $ 2,679,462 $ 3,297,192Unsecured senior notes (net of discount of $3,525 and $3,938, respectively) . . . 1,471,475 1,471,062Unsecured exchangeable senior notes . . . . . . . . . . . . . . . . . . . . . . . . . . . . . . . . . 450,000 —Unsecured line of credit . . . . . . . . . . . . . . . . . . . . . . . . . . . . . . . . . . . . . . . . . . . . — 58,000Accounts payable and accrued expenses . . . . . . . . . . . . . . . . . . . . . . . . . . . . . . . 102,934 109,823Dividends and distributions payable . . . . . . . . . . . . . . . . . . . . . . . . . . . . . . . . . . 857,892 107,643Accrued interest payable . . . . . . . . . . . . . . . . . . . . . . . . . . . . . . . . . . . . . . . . . . . 47,441 47,911Other liabilities . . . . . . . . . . . . . . . . . . . . . . . . . . . . . . . . . . . . . . . . . . . . . . . . . . . 239,084 154,123
Total liabilities . . . . . . . . . . . . . . . . . . . . . . . . . . . . . . . . . . . . . . . . . . . . . . . 5,848,288 5,245,754
Commitments and contingencies . . . . . . . . . . . . . . . . . . . . . . . . . . . . . . . . . . . . . . . . . — —
Minority interests . . . . . . . . . . . . . . . . . . . . . . . . . . . . . . . . . . . . . . . . . . . . . . . . . . . . . 623,508 739,268
Stockholders’ equity:Excess stock, $.01 par value, 150,000,000 shares authorized, none issued or
outstanding . . . . . . . . . . . . . . . . . . . . . . . . . . . . . . . . . . . . . . . . . . . . . . . . . . . . — —Preferred stock, $.01 par value, 50,000,000 shares authorized, none issued or
outstanding . . . . . . . . . . . . . . . . . . . . . . . . . . . . . . . . . . . . . . . . . . . . . . . . . . . . — —Common stock, $.01 par value, 250,000,000 shares authorized, 117,582,442
and 112,621,162 issued and 117,503,542 and 112,542,262 outstanding in2006 and 2005, respectively . . . . . . . . . . . . . . . . . . . . . . . . . . . . . . . . . . . . . . . 1,175 1,125
Additional paid-in capital . . . . . . . . . . . . . . . . . . . . . . . . . . . . . . . . . . . . . . . . . . . 3,119,941 2,745,719Earnings in excess of dividends . . . . . . . . . . . . . . . . . . . . . . . . . . . . . . . . . . . . . . 108,155 182,105Treasury common stock at cost, 78,900 shares in 2006 and 2005 . . . . . . . . . . . . (2,722) (2,722)Accumulated other comprehensive loss . . . . . . . . . . . . . . . . . . . . . . . . . . . . . . . . (3,323) (8,881)
Total stockholders’ equity . . . . . . . . . . . . . . . . . . . . . . . . . . . . . . . . . . . . . . 3,223,226 2,917,346
Total liabilities and stockholders’ equity . . . . . . . . . . . . . . . . . . . . . . . $ 9,695,022 $ 8,902,368
The accompanying notes are an integral part of these financial statements.
86
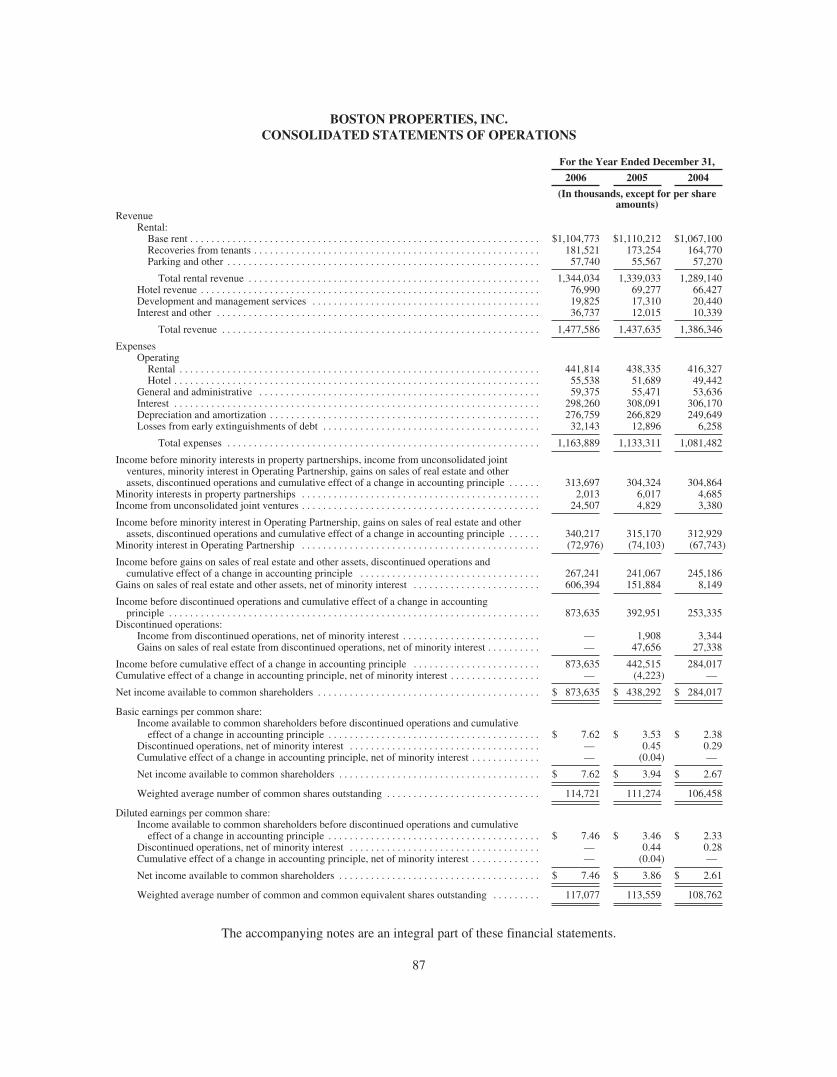
BOSTON PROPERTIES, INC.CONSOLIDATED STATEMENTS OF OPERATIONS
For the Year Ended December 31,
2006 2005 2004
(In thousands, except for per shareamounts)
RevenueRental:
Base rent . . . . . . . . . . . . . . . . . . . . . . . . . . . . . . . . . . . . . . . . . . . . . . . . . . . . . . . . . . . . . . . . . . $1,104,773 $1,110,212 $1,067,100Recoveries from tenants . . . . . . . . . . . . . . . . . . . . . . . . . . . . . . . . . . . . . . . . . . . . . . . . . . . . . . 181,521 173,254 164,770Parking and other . . . . . . . . . . . . . . . . . . . . . . . . . . . . . . . . . . . . . . . . . . . . . . . . . . . . . . . . . . . 57,740 55,567 57,270
Total rental revenue . . . . . . . . . . . . . . . . . . . . . . . . . . . . . . . . . . . . . . . . . . . . . . . . . . . . . . . 1,344,034 1,339,033 1,289,140Hotel revenue . . . . . . . . . . . . . . . . . . . . . . . . . . . . . . . . . . . . . . . . . . . . . . . . . . . . . . . . . . . . . . . . 76,990 69,277 66,427Development and management services . . . . . . . . . . . . . . . . . . . . . . . . . . . . . . . . . . . . . . . . . . . 19,825 17,310 20,440Interest and other . . . . . . . . . . . . . . . . . . . . . . . . . . . . . . . . . . . . . . . . . . . . . . . . . . . . . . . . . . . . . 36,737 12,015 10,339
Total revenue . . . . . . . . . . . . . . . . . . . . . . . . . . . . . . . . . . . . . . . . . . . . . . . . . . . . . . . . . . . . 1,477,586 1,437,635 1,386,346
ExpensesOperating
Rental . . . . . . . . . . . . . . . . . . . . . . . . . . . . . . . . . . . . . . . . . . . . . . . . . . . . . . . . . . . . . . . . . . . . 441,814 438,335 416,327Hotel . . . . . . . . . . . . . . . . . . . . . . . . . . . . . . . . . . . . . . . . . . . . . . . . . . . . . . . . . . . . . . . . . . . . . 55,538 51,689 49,442
General and administrative . . . . . . . . . . . . . . . . . . . . . . . . . . . . . . . . . . . . . . . . . . . . . . . . . . . . . 59,375 55,471 53,636Interest . . . . . . . . . . . . . . . . . . . . . . . . . . . . . . . . . . . . . . . . . . . . . . . . . . . . . . . . . . . . . . . . . . . . . 298,260 308,091 306,170Depreciation and amortization . . . . . . . . . . . . . . . . . . . . . . . . . . . . . . . . . . . . . . . . . . . . . . . . . . . 276,759 266,829 249,649Losses from early extinguishments of debt . . . . . . . . . . . . . . . . . . . . . . . . . . . . . . . . . . . . . . . . . 32,143 12,896 6,258
Total expenses . . . . . . . . . . . . . . . . . . . . . . . . . . . . . . . . . . . . . . . . . . . . . . . . . . . . . . . . . . . 1,163,889 1,133,311 1,081,482
Income before minority interests in property partnerships, income from unconsolidated jointventures, minority interest in Operating Partnership, gains on sales of real estate and otherassets, discontinued operations and cumulative effect of a change in accounting principle . . . . . . 313,697 304,324 304,864
Minority interests in property partnerships . . . . . . . . . . . . . . . . . . . . . . . . . . . . . . . . . . . . . . . . . . . . . 2,013 6,017 4,685Income from unconsolidated joint ventures . . . . . . . . . . . . . . . . . . . . . . . . . . . . . . . . . . . . . . . . . . . . . 24,507 4,829 3,380
Income before minority interest in Operating Partnership, gains on sales of real estate and otherassets, discontinued operations and cumulative effect of a change in accounting principle . . . . . . 340,217 315,170 312,929
Minority interest in Operating Partnership . . . . . . . . . . . . . . . . . . . . . . . . . . . . . . . . . . . . . . . . . . . . . (72,976) (74,103) (67,743)
Income before gains on sales of real estate and other assets, discontinued operations andcumulative effect of a change in accounting principle . . . . . . . . . . . . . . . . . . . . . . . . . . . . . . . . . . 267,241 241,067 245,186
Gains on sales of real estate and other assets, net of minority interest . . . . . . . . . . . . . . . . . . . . . . . . 606,394 151,884 8,149
Income before discontinued operations and cumulative effect of a change in accountingprinciple . . . . . . . . . . . . . . . . . . . . . . . . . . . . . . . . . . . . . . . . . . . . . . . . . . . . . . . . . . . . . . . . . . . . . . 873,635 392,951 253,335
Discontinued operations:Income from discontinued operations, net of minority interest . . . . . . . . . . . . . . . . . . . . . . . . . . — 1,908 3,344Gains on sales of real estate from discontinued operations, net of minority interest . . . . . . . . . . — 47,656 27,338
Income before cumulative effect of a change in accounting principle . . . . . . . . . . . . . . . . . . . . . . . . 873,635 442,515 284,017Cumulative effect of a change in accounting principle, net of minority interest . . . . . . . . . . . . . . . . . — (4,223) —
Net income available to common shareholders . . . . . . . . . . . . . . . . . . . . . . . . . . . . . . . . . . . . . . . . . . $ 873,635 $ 438,292 $ 284,017
Basic earnings per common share:Income available to common shareholders before discontinued operations and cumulative
effect of a change in accounting principle . . . . . . . . . . . . . . . . . . . . . . . . . . . . . . . . . . . . . . . . $ 7.62 $ 3.53 $ 2.38Discontinued operations, net of minority interest . . . . . . . . . . . . . . . . . . . . . . . . . . . . . . . . . . . . — 0.45 0.29Cumulative effect of a change in accounting principle, net of minority interest . . . . . . . . . . . . . — (0.04) —
Net income available to common shareholders . . . . . . . . . . . . . . . . . . . . . . . . . . . . . . . . . . . . . . $ 7.62 $ 3.94 $ 2.67
Weighted average number of common shares outstanding . . . . . . . . . . . . . . . . . . . . . . . . . . . . . 114,721 111,274 106,458
Diluted earnings per common share:Income available to common shareholders before discontinued operations and cumulative
effect of a change in accounting principle . . . . . . . . . . . . . . . . . . . . . . . . . . . . . . . . . . . . . . . . $ 7.46 $ 3.46 $ 2.33Discontinued operations, net of minority interest . . . . . . . . . . . . . . . . . . . . . . . . . . . . . . . . . . . . — 0.44 0.28Cumulative effect of a change in accounting principle, net of minority interest . . . . . . . . . . . . . — (0.04) —
Net income available to common shareholders . . . . . . . . . . . . . . . . . . . . . . . . . . . . . . . . . . . . . . $ 7.46 $ 3.86 $ 2.61
Weighted average number of common and common equivalent shares outstanding . . . . . . . . . 117,077 113,559 108,762
The accompanying notes are an integral part of these financial statements.
87
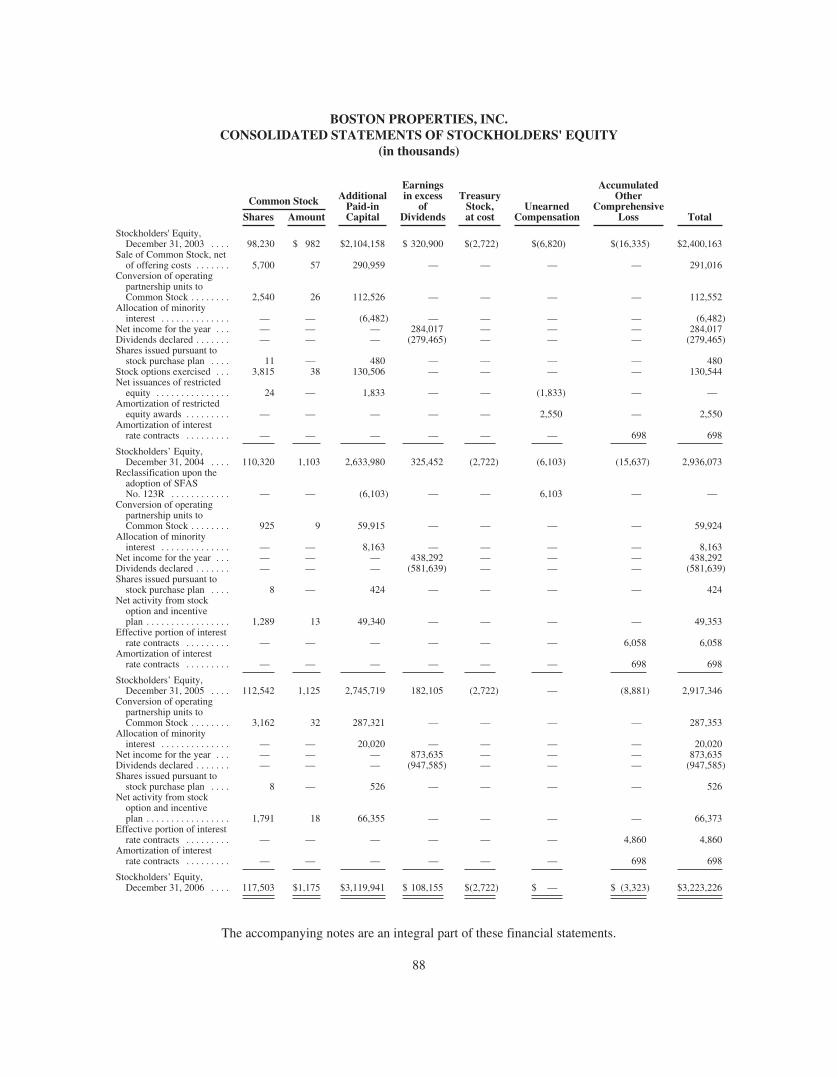
BOSTON PROPERTIES, INC.CONSOLIDATED STATEMENTS OF STOCKHOLDERS' EQUITY
(in thousands)
Common Stock AdditionalPaid-inCapital
Earningsin excess
ofDividends
TreasuryStock,at cost
UnearnedCompensation
AccumulatedOther
ComprehensiveLoss TotalShares Amount
Stockholders' Equity,December 31, 2003 . . . . 98,230 $ 982 $2,104,158 $ 320,900 $(2,722) $(6,820) $(16,335) $2,400,163
Sale of Common Stock, netof offering costs . . . . . . . 5,700 57 290,959 — — — — 291,016
Conversion of operatingpartnership units toCommon Stock . . . . . . . . 2,540 26 112,526 — — — — 112,552
Allocation of minorityinterest . . . . . . . . . . . . . . — — (6,482) — — — — (6,482)
Net income for the year . . . — — — 284,017 — — — 284,017Dividends declared . . . . . . . — — — (279,465) — — — (279,465)Shares issued pursuant to
stock purchase plan . . . . 11 — 480 — — — — 480Stock options exercised . . . 3,815 38 130,506 — — — — 130,544Net issuances of restricted
equity . . . . . . . . . . . . . . . 24 — 1,833 — — (1,833) — —Amortization of restricted
equity awards . . . . . . . . . — — — — — 2,550 — 2,550Amortization of interest
rate contracts . . . . . . . . . — — — — — — 698 698
Stockholders’ Equity,December 31, 2004 . . . . 110,320 1,103 2,633,980 325,452 (2,722) (6,103) (15,637) 2,936,073
Reclassification upon theadoption of SFASNo. 123R . . . . . . . . . . . . — — (6,103) — — 6,103 — —
Conversion of operatingpartnership units toCommon Stock . . . . . . . . 925 9 59,915 — — — — 59,924
Allocation of minorityinterest . . . . . . . . . . . . . . — — 8,163 — — — — 8,163
Net income for the year . . . — — — 438,292 — — — 438,292Dividends declared . . . . . . . — — — (581,639) — — — (581,639)Shares issued pursuant to
stock purchase plan . . . . 8 — 424 — — — — 424Net activity from stock
option and incentiveplan . . . . . . . . . . . . . . . . . 1,289 13 49,340 — — — — 49,353
Effective portion of interestrate contracts . . . . . . . . . — — — — — — 6,058 6,058
Amortization of interestrate contracts . . . . . . . . . — — — — — — 698 698
Stockholders’ Equity,December 31, 2005 . . . . 112,542 1,125 2,745,719 182,105 (2,722) — (8,881) 2,917,346
Conversion of operatingpartnership units toCommon Stock . . . . . . . . 3,162 32 287,321 — — — — 287,353
Allocation of minorityinterest . . . . . . . . . . . . . . — — 20,020 — — — — 20,020
Net income for the year . . . — — — 873,635 — — — 873,635Dividends declared . . . . . . . — — — (947,585) — — — (947,585)Shares issued pursuant to
stock purchase plan . . . . 8 — 526 — — — — 526Net activity from stock
option and incentiveplan . . . . . . . . . . . . . . . . . 1,791 18 66,355 — — — — 66,373
Effective portion of interestrate contracts . . . . . . . . . — — — — — — 4,860 4,860
Amortization of interestrate contracts . . . . . . . . . — — — — — — 698 698
Stockholders’ Equity,December 31, 2006 . . . . 117,503 $1,175 $3,119,941 $ 108,155 $(2,722) $ — $ (3,323) $3,223,226
The accompanying notes are an integral part of these financial statements.
88

BOSTON PROPERTIES, INC.CONSOLIDATED STATEMENTS OF
COMPREHENSIVE INCOME
For the year ended December 31,
2006 2005 2004
(in thousands)
Net income available to common shareholders . . . . . . . . . . . . . . . . . . . . . . . . . $873,635 $438,292 $284,017Other comprehensive income:
Effective portion of interest rate contracts . . . . . . . . . . . . . . . . . . . . . . . . . 4,860 6,058 —Amortization of interest rate contracts . . . . . . . . . . . . . . . . . . . . . . . . . . . . 698 698 698
Other comprehensive income . . . . . . . . . . . . . . . . . . . . . . . . . . . . . . . . . . . . . . . 5,558 6,756 698
Comprehensive income . . . . . . . . . . . . . . . . . . . . . . . . . . . . . . . . . . . . . . . . . . . $879,193 $445,048 $284,715
The accompanying notes are an integral part of these financial statements.
89
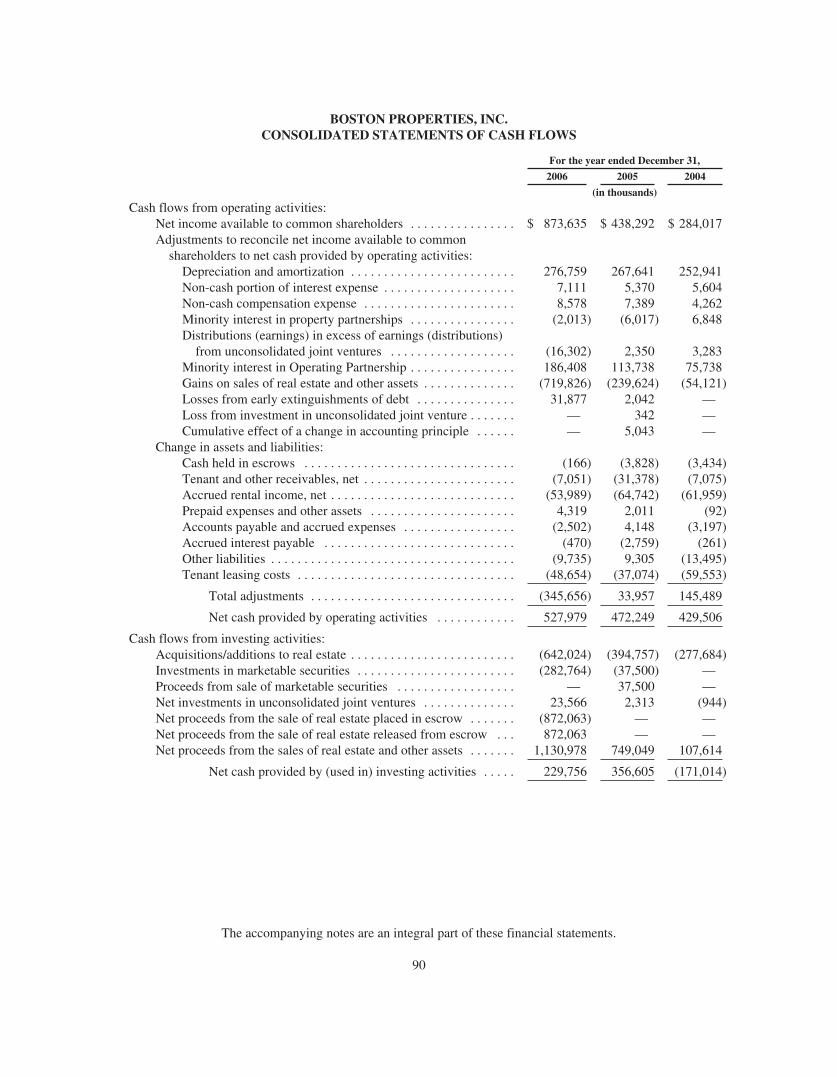
BOSTON PROPERTIES, INC.CONSOLIDATED STATEMENTS OF CASH FLOWS
For the year ended December 31,
2006 2005 2004
(in thousands)
Cash flows from operating activities:Net income available to common shareholders . . . . . . . . . . . . . . . . $ 873,635 $ 438,292 $ 284,017Adjustments to reconcile net income available to common
shareholders to net cash provided by operating activities:Depreciation and amortization . . . . . . . . . . . . . . . . . . . . . . . . . 276,759 267,641 252,941Non-cash portion of interest expense . . . . . . . . . . . . . . . . . . . . 7,111 5,370 5,604Non-cash compensation expense . . . . . . . . . . . . . . . . . . . . . . . 8,578 7,389 4,262Minority interest in property partnerships . . . . . . . . . . . . . . . . (2,013) (6,017) 6,848Distributions (earnings) in excess of earnings (distributions)
from unconsolidated joint ventures . . . . . . . . . . . . . . . . . . . (16,302) 2,350 3,283Minority interest in Operating Partnership . . . . . . . . . . . . . . . . 186,408 113,738 75,738Gains on sales of real estate and other assets . . . . . . . . . . . . . . (719,826) (239,624) (54,121)Losses from early extinguishments of debt . . . . . . . . . . . . . . . 31,877 2,042 —Loss from investment in unconsolidated joint venture . . . . . . . — 342 —Cumulative effect of a change in accounting principle . . . . . . — 5,043 —
Change in assets and liabilities:Cash held in escrows . . . . . . . . . . . . . . . . . . . . . . . . . . . . . . . . (166) (3,828) (3,434)Tenant and other receivables, net . . . . . . . . . . . . . . . . . . . . . . . (7,051) (31,378) (7,075)Accrued rental income, net . . . . . . . . . . . . . . . . . . . . . . . . . . . . (53,989) (64,742) (61,959)Prepaid expenses and other assets . . . . . . . . . . . . . . . . . . . . . . 4,319 2,011 (92)Accounts payable and accrued expenses . . . . . . . . . . . . . . . . . (2,502) 4,148 (3,197)Accrued interest payable . . . . . . . . . . . . . . . . . . . . . . . . . . . . . (470) (2,759) (261)Other liabilities . . . . . . . . . . . . . . . . . . . . . . . . . . . . . . . . . . . . . (9,735) 9,305 (13,495)Tenant leasing costs . . . . . . . . . . . . . . . . . . . . . . . . . . . . . . . . . (48,654) (37,074) (59,553)
Total adjustments . . . . . . . . . . . . . . . . . . . . . . . . . . . . . . . (345,656) 33,957 145,489
Net cash provided by operating activities . . . . . . . . . . . . 527,979 472,249 429,506
Cash flows from investing activities:Acquisitions/additions to real estate . . . . . . . . . . . . . . . . . . . . . . . . . (642,024) (394,757) (277,684)Investments in marketable securities . . . . . . . . . . . . . . . . . . . . . . . . (282,764) (37,500) —Proceeds from sale of marketable securities . . . . . . . . . . . . . . . . . . — 37,500 —Net investments in unconsolidated joint ventures . . . . . . . . . . . . . . 23,566 2,313 (944)Net proceeds from the sale of real estate placed in escrow . . . . . . . (872,063) — —Net proceeds from the sale of real estate released from escrow . . . 872,063 — —Net proceeds from the sales of real estate and other assets . . . . . . . 1,130,978 749,049 107,614
Net cash provided by (used in) investing activities . . . . . 229,756 356,605 (171,014)
The accompanying notes are an integral part of these financial statements.
90
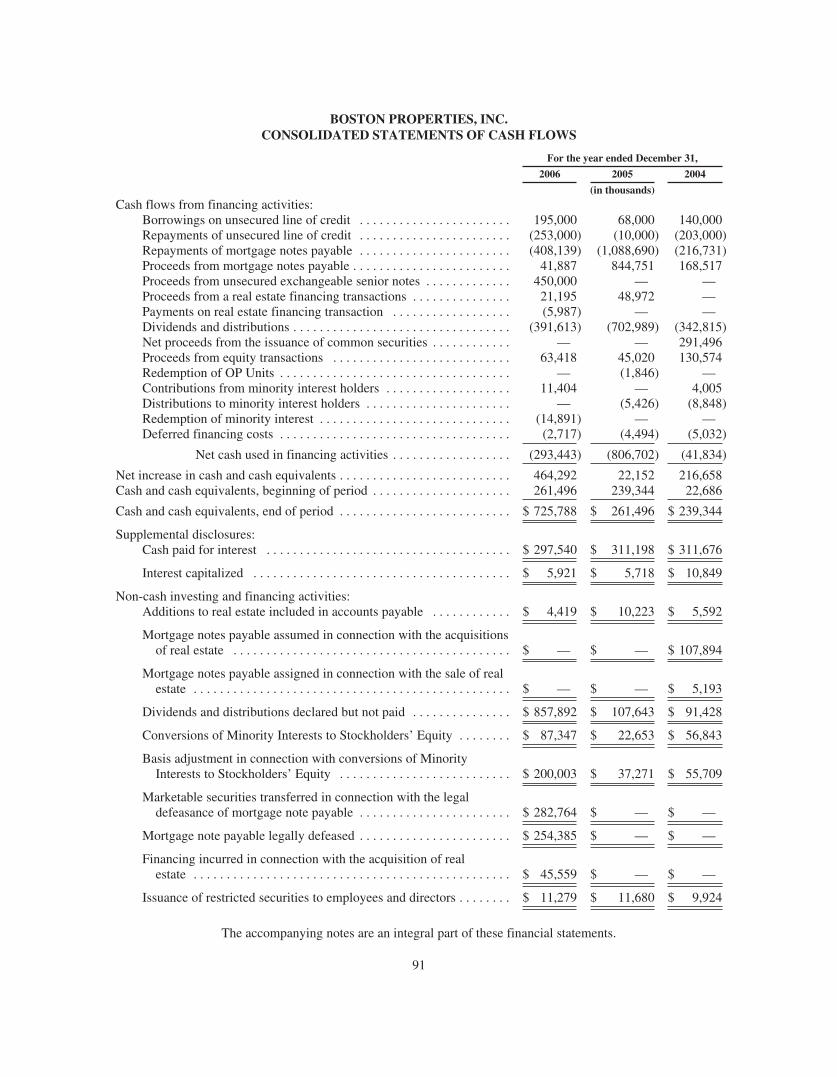
BOSTON PROPERTIES, INC.CONSOLIDATED STATEMENTS OF CASH FLOWS
For the year ended December 31,
2006 2005 2004
(in thousands)Cash flows from financing activities:
Borrowings on unsecured line of credit . . . . . . . . . . . . . . . . . . . . . . . 195,000 68,000 140,000Repayments of unsecured line of credit . . . . . . . . . . . . . . . . . . . . . . . (253,000) (10,000) (203,000)Repayments of mortgage notes payable . . . . . . . . . . . . . . . . . . . . . . . (408,139) (1,088,690) (216,731)Proceeds from mortgage notes payable . . . . . . . . . . . . . . . . . . . . . . . . 41,887 844,751 168,517Proceeds from unsecured exchangeable senior notes . . . . . . . . . . . . . 450,000 — —Proceeds from a real estate financing transactions . . . . . . . . . . . . . . . 21,195 48,972 —Payments on real estate financing transaction . . . . . . . . . . . . . . . . . . (5,987) — —Dividends and distributions . . . . . . . . . . . . . . . . . . . . . . . . . . . . . . . . . (391,613) (702,989) (342,815)Net proceeds from the issuance of common securities . . . . . . . . . . . . — — 291,496Proceeds from equity transactions . . . . . . . . . . . . . . . . . . . . . . . . . . . 63,418 45,020 130,574Redemption of OP Units . . . . . . . . . . . . . . . . . . . . . . . . . . . . . . . . . . . — (1,846) —Contributions from minority interest holders . . . . . . . . . . . . . . . . . . . 11,404 — 4,005Distributions to minority interest holders . . . . . . . . . . . . . . . . . . . . . . — (5,426) (8,848)Redemption of minority interest . . . . . . . . . . . . . . . . . . . . . . . . . . . . . (14,891) — —Deferred financing costs . . . . . . . . . . . . . . . . . . . . . . . . . . . . . . . . . . . (2,717) (4,494) (5,032)
Net cash used in financing activities . . . . . . . . . . . . . . . . . . (293,443) (806,702) (41,834)
Net increase in cash and cash equivalents . . . . . . . . . . . . . . . . . . . . . . . . . . 464,292 22,152 216,658Cash and cash equivalents, beginning of period . . . . . . . . . . . . . . . . . . . . . 261,496 239,344 22,686
Cash and cash equivalents, end of period . . . . . . . . . . . . . . . . . . . . . . . . . . $ 725,788 $ 261,496 $ 239,344
Supplemental disclosures:Cash paid for interest . . . . . . . . . . . . . . . . . . . . . . . . . . . . . . . . . . . . . $ 297,540 $ 311,198 $ 311,676
Interest capitalized . . . . . . . . . . . . . . . . . . . . . . . . . . . . . . . . . . . . . . . $ 5,921 $ 5,718 $ 10,849
Non-cash investing and financing activities:Additions to real estate included in accounts payable . . . . . . . . . . . . $ 4,419 $ 10,223 $ 5,592
Mortgage notes payable assumed in connection with the acquisitionsof real estate . . . . . . . . . . . . . . . . . . . . . . . . . . . . . . . . . . . . . . . . . . $ — $ — $ 107,894
Mortgage notes payable assigned in connection with the sale of realestate . . . . . . . . . . . . . . . . . . . . . . . . . . . . . . . . . . . . . . . . . . . . . . . . $ — $ — $ 5,193
Dividends and distributions declared but not paid . . . . . . . . . . . . . . . $ 857,892 $ 107,643 $ 91,428
Conversions of Minority Interests to Stockholders’ Equity . . . . . . . . $ 87,347 $ 22,653 $ 56,843
Basis adjustment in connection with conversions of MinorityInterests to Stockholders’ Equity . . . . . . . . . . . . . . . . . . . . . . . . . . $ 200,003 $ 37,271 $ 55,709
Marketable securities transferred in connection with the legaldefeasance of mortgage note payable . . . . . . . . . . . . . . . . . . . . . . . $ 282,764 $ — $ —
Mortgage note payable legally defeased . . . . . . . . . . . . . . . . . . . . . . . $ 254,385 $ — $ —
Financing incurred in connection with the acquisition of realestate . . . . . . . . . . . . . . . . . . . . . . . . . . . . . . . . . . . . . . . . . . . . . . . . $ 45,559 $ — $ —
Issuance of restricted securities to employees and directors . . . . . . . . $ 11,279 $ 11,680 $ 9,924
The accompanying notes are an integral part of these financial statements.
91
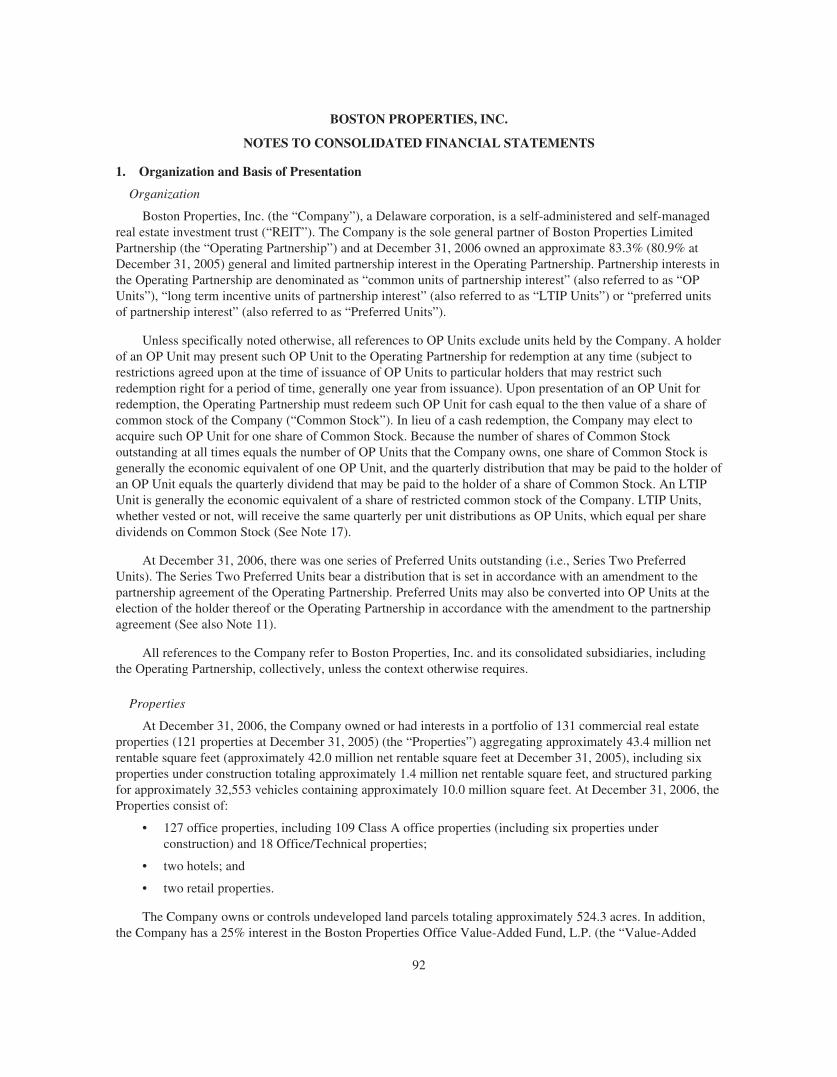
BOSTON PROPERTIES, INC.
NOTES TO CONSOLIDATED FINANCIAL STATEMENTS
1. Organization and Basis of Presentation
Organization
Boston Properties, Inc. (the “Company”), a Delaware corporation, is a self-administered and self-managedreal estate investment trust (“REIT”). The Company is the sole general partner of Boston Properties LimitedPartnership (the “Operating Partnership”) and at December 31, 2006 owned an approximate 83.3% (80.9% atDecember 31, 2005) general and limited partnership interest in the Operating Partnership. Partnership interests inthe Operating Partnership are denominated as “common units of partnership interest” (also referred to as “OPUnits”), “long term incentive units of partnership interest” (also referred to as “LTIP Units”) or “preferred unitsof partnership interest” (also referred to as “Preferred Units”).
Unless specifically noted otherwise, all references to OP Units exclude units held by the Company. A holderof an OP Unit may present such OP Unit to the Operating Partnership for redemption at any time (subject torestrictions agreed upon at the time of issuance of OP Units to particular holders that may restrict suchredemption right for a period of time, generally one year from issuance). Upon presentation of an OP Unit forredemption, the Operating Partnership must redeem such OP Unit for cash equal to the then value of a share ofcommon stock of the Company (“Common Stock”). In lieu of a cash redemption, the Company may elect toacquire such OP Unit for one share of Common Stock. Because the number of shares of Common Stockoutstanding at all times equals the number of OP Units that the Company owns, one share of Common Stock isgenerally the economic equivalent of one OP Unit, and the quarterly distribution that may be paid to the holder ofan OP Unit equals the quarterly dividend that may be paid to the holder of a share of Common Stock. An LTIPUnit is generally the economic equivalent of a share of restricted common stock of the Company. LTIP Units,whether vested or not, will receive the same quarterly per unit distributions as OP Units, which equal per sharedividends on Common Stock (See Note 17).
At December 31, 2006, there was one series of Preferred Units outstanding (i.e., Series Two PreferredUnits). The Series Two Preferred Units bear a distribution that is set in accordance with an amendment to thepartnership agreement of the Operating Partnership. Preferred Units may also be converted into OP Units at theelection of the holder thereof or the Operating Partnership in accordance with the amendment to the partnershipagreement (See also Note 11).
All references to the Company refer to Boston Properties, Inc. and its consolidated subsidiaries, includingthe Operating Partnership, collectively, unless the context otherwise requires.
Properties
At December 31, 2006, the Company owned or had interests in a portfolio of 131 commercial real estateproperties (121 properties at December 31, 2005) (the “Properties”) aggregating approximately 43.4 million netrentable square feet (approximately 42.0 million net rentable square feet at December 31, 2005), including sixproperties under construction totaling approximately 1.4 million net rentable square feet, and structured parkingfor approximately 32,553 vehicles containing approximately 10.0 million square feet. At December 31, 2006, theProperties consist of:
• 127 office properties, including 109 Class A office properties (including six properties underconstruction) and 18 Office/Technical properties;
• two hotels; and
• two retail properties.
The Company owns or controls undeveloped land parcels totaling approximately 524.3 acres. In addition,the Company has a 25% interest in the Boston Properties Office Value-Added Fund, L.P. (the “Value-Added
92
BOSTON PROPERTIES, INC.
NOTES TO CONSOLIDATED FINANCIAL STATEMENTS—(Continued)
Fund”), which is a strategic partnership with two institutional investors through which the Company has pursuedthe acquisition of value-added investments in assets within its existing markets. The Company’s investmentsthrough the Value-Added Fund are not included in its portfolio information or any other portfolio level statistics.At December 31, 2006, the Value-Added Fund had investments in an office complex in Herndon, Virginia, anoffice property in Chelmsford, Massachusetts and an office complex in San Carlos, California. The Value-AddedFund’s investment period expired on October 25, 2006.
The Company considers Class A office properties to be centrally located buildings that are professionallymanaged and maintained, that attract high-quality tenants and command upper-tier rental rates, and that aremodern structures or have been modernized to compete with newer buildings. The Company considers Office/Technical properties to be properties that support office, research and development, laboratory and othertechnical uses. Net rentable square feet amounts are unaudited.
Basis of Presentation
Boston Properties, Inc. does not have any other significant assets, liabilities or operations, other than itsinvestment in the Operating Partnership, nor does it have employees of its own. The Operating Partnership, notBoston Properties, Inc., executes all significant business relationships. All majority-owned subsidiaries andaffiliates over which the Company has financial and operating control and variable interest entities (“VIE”s) inwhich the Company has determined it is the primary beneficiary are included in the consolidated financialstatements. All significant intercompany balances and transactions have been eliminated in consolidation. TheCompany accounts for all other unconsolidated joint ventures using the equity method of accounting.Accordingly, the Company’s share of the earnings of these joint ventures and companies is included inconsolidated net income.
In January 2003, the Financial Accounting Standards Board (“FASB”) issued FASB Interpretation No. 46,“Consolidation of Variable Interest Entities” (“FIN 46”). In December 2003, the FASB issued FIN 46R,“Consolidation of Variable Interest Entities,” which amended FIN 46. FIN 46R was effective immediately forarrangements entered into after January 31, 2003, and became effective during the first quarter of 2004 for allarrangements entered into before February 1, 2003. FIN 46R requires existing unconsolidated VIEs to beconsolidated by their primary beneficiaries. The primary beneficiary of a VIE is the party that absorbs a majorityof the entity’s expected losses or receives a majority of its expected residual returns, or both, as a result ofholding variable interests, which are the ownership interests, contractual interests, or other pecuniary interests inan entity that change with changes in the fair value of the entity’s net assets excluding variable interests. Prior toFIN 46R, the Company included an entity in its consolidated financial statements only if it controlled the entitythrough voting interests. The adoption and application of FIN 46 and FIN 46R has not had a material impact onthe Company’s consolidated financial statements.
2. Summary of Significant Accounting Policies
Real Estate
Upon acquisitions of real estate, the Company assesses the fair value of acquired tangible and intangibleassets (including land, buildings, tenant improvements, “above-” and “below-market” leases, origination costs,acquired in-place leases, other identified intangible assets and assumed liabilities in accordance with Statementof Financial Accounting Standards (“SFAS”) No. 141, “Business Combinations”), and allocates the purchaseprice to the acquired assets and assumed liabilities, including land at appraised value and buildings atreplacement cost. The Company assesses and considers fair value based on estimated cash flow projections thatutilize discount and/or capitalization rates that we deem appropriate, as well as available market information.Estimates of future cash flows are based on a number of factors including the historical operating results, known
93

BOSTON PROPERTIES, INC.
NOTES TO CONSOLIDATED FINANCIAL STATEMENTS—(Continued)
and anticipated trends, and market and economic conditions. The fair value of the tangible assets of an acquiredproperty considers the value of the property as if it were vacant. The Company also considers an allocation ofpurchase price of other acquired intangibles, including acquired in-place leases that may have a customerrelationship intangible value, including (but not limited to) the nature and extent of the existing relationship withthe tenants, the tenant’s credit quality and expectations of lease renewals. Based on its acquisitions to date, theCompany’s allocation to customer relationship intangible assets has been immaterial.
The Company records acquired “above-” and “below-market” leases at their fair value (using a discount ratewhich reflects the risks associated with the leases acquired) equal to the difference between (1) the contractualamounts to be paid pursuant to each in-place lease and (2) management’s estimate of fair market lease rates foreach corresponding in-place lease, measured over a period equal to the remaining term of the lease for above-market leases and the initial term plus the term of any below-market fixed rate renewal options for below-marketleases. Other intangible assets acquired include amounts for in-place lease values that are based on theCompany’s evaluation of the specific characteristics of each tenant’s lease. Factors to be considered includeestimates of carrying costs during hypothetical expected lease-up periods considering current market conditions,and costs to execute similar leases. In estimating carrying costs, the Company includes real estate taxes,insurance and other operating expenses and estimates of lost rentals at market rates during the expected lease-upperiods, depending on local market conditions. In estimating costs to execute similar leases, the Companyconsiders leasing commissions, legal and other related expenses.
Real estate is stated at depreciated cost. The cost of buildings and improvements includes the purchase priceof property, legal fees and other acquisition costs. Costs directly related to the development of properties arecapitalized. Capitalized development costs include interest, internal wages, property taxes, insurance, and otherproject costs incurred during the period of development.
The Company reviews its long-lived assets used in operations for impairment when there is an event orchange in circumstances that indicates an impairment in value. An impairment loss is recognized if the carryingamount of its assets is not recoverable and exceeds its fair value. If such impairment is present, an impairmentloss is recognized based on the excess of the carrying amount of the asset over its fair value. The evaluation ofanticipated cash flows is highly subjective and is based in part on assumptions regarding future occupancy, rentalrates and capital requirements that could differ materially from actual results in future periods. Since cash flowson properties considered to be “long-lived assets to be held and used,” as defined by SFAS No. 144, “Accountingfor the Impairment or Disposal of Long-Lived Assets,” (“SFAS No. 144”) are considered on an undiscountedbasis to determine whether an asset has been impaired, the Company’s established strategy of holding propertiesover the long term directly decreases the likelihood of recording an impairment loss. If the Company’s strategychanges or market conditions otherwise dictate an earlier sale date, an impairment loss may be recognized andsuch loss could be material. If the Company determines that impairment has occurred, the affected assets must bereduced to their fair value. No such impairment losses have been recognized to date.
SFAS No. 144, requires that qualifying assets and liabilities and the results of operations that have beensold, or otherwise qualify as “held for sale,” be presented as discontinued operations in all periods presented ifthe property operations are expected to be eliminated and the Company will not have significant continuinginvolvement following the sale. The components of the property’s net income that is reflected as discontinuedoperations include the net gain (or loss) upon the disposition of the property held for sale, operating results,depreciation and interest expense (if the property is subject to a secured loan). The Company generally considersassets to be “held for sale” when the transaction has been approved by the Board of Directors, or a committeethereof, and there are no known significant contingencies relating to the sale, such that the property sale withinone year is considered probable. Following the classification of a property as “held for sale,” no furtherdepreciation is recorded on the assets.
94

BOSTON PROPERTIES, INC.
NOTES TO CONSOLIDATED FINANCIAL STATEMENTS—(Continued)
A variety of costs are incurred in the acquisition, development and leasing of properties. After determinationis made to capitalize a cost, it is allocated to the specific component of a project that is benefited. Determinationof when a development project is substantially complete and capitalization must cease involves a degree ofjudgment. The Company’s capitalization policy on development properties is guided by SFAS No. 34“Capitalization of Interest Cost” and SFAS No. 67 “Accounting for Costs and the Initial Rental Operations ofReal Estate Projects.” The costs of land and buildings under development include specifically identifiable costs.The capitalized costs include pre-construction costs essential to the development of the property, developmentcosts, construction costs, interest costs, real estate taxes, salaries and related costs and other costs incurred duringthe period of development. The Company considers a construction project as substantially completed and heldavailable for occupancy upon the completion of tenant improvements, but no later than one year from cessationof major construction activity. The Company ceases capitalization on the portion (1) substantially completed and(2) occupied or held available for occupancy, and capitalizes only those costs associated with the portion underconstruction. Interest costs capitalized for the years ended December 31, 2006, 2005 and 2004 were $5.9 million,$5.7 million and $10.8 million, respectively. Salaries and related costs capitalized for the years endedDecember 31, 2006, 2005 and 2004 were $4.2 million, $3.9 million and $4.4 million, respectively.
The acquisitions of minority interests (i.e., OP Units) for shares of the Company’s common stock arerecorded under the purchase method with assets acquired reflected at the fair market value of the Company’scommon stock on the date of acquisition. The acquisition amounts are allocated to the underlying assets based ontheir estimated fair values.
Expenditures for repairs and maintenance are charged to operations as incurred. Significant betterments arecapitalized. When assets are sold or retired, their costs and related accumulated depreciation are removed fromthe accounts with the resulting gains or losses reflected in net income or loss for the period.
Certain of the Company’s real estate assets contain asbestos. Although the asbestos is appropriatelyencapsulated, in accordance with current environmental regulations, the Company’s practice is to remediate theasbestos upon the renovation or redevelopment of its properties. In March 2005, the FASB issued InterpretationNo. 47, “Accounting for Conditional Asset Retirement Obligations, an interpretation of FASB Statement No.143” (“FIN 47”). FIN 47 clarifies that the term “conditional asset retirement obligation” as used in FASBStatement No. 143, “Accounting for Asset Retirement Obligations,” refers to a legal obligation to perform anasset retirement activity in which the timing and/or method of settlement are conditional on a future event thatmay or may not be within the control of the entity. The legal obligation to perform the asset retirement activity isunconditional even though uncertainty exists about the timing and/or method of settlement. FIN 47 requires anentity to recognize a liability for the fair value of a conditional asset retirement obligation if the fair value of theliability can be reasonably estimated. The fair value of a liability for the conditional asset retirement obligationshould be recognized when incurred - generally upon the acquisition, construction, or development and/orthrough the normal operation of an asset. FIN 47 also clarifies when an entity would have sufficient informationto reasonably estimate the fair value of an asset retirement obligation. FIN 47 became effective and was adoptedby the Company on December 31, 2005.
The Company computes depreciation and amortization on properties using the straight-line method based onestimated useful asset lives. In accordance with SFAS No. 141, the Company allocates the acquisition cost of realestate to land, building, tenant improvements, acquired “above-” and “below-market” leases, origination costsand acquired in-place leases based on an assessment of their fair value and depreciates or amortizes these assets(or liabilities) over their useful lives. The amortization of acquired “above-” and “below-market” leases andacquired in-place leases is recorded as an adjustment to revenue and depreciation and amortization, respectively,in the Consolidated Statements of Operations.
95

BOSTON PROPERTIES, INC.
NOTES TO CONSOLIDATED FINANCIAL STATEMENTS—(Continued)
Depreciation is computed on a straight-line basis over the estimated useful lives of the assets as follows:
Land improvements . . . . . . . . . . . . . . . . . . . . . . . . . . . 25 to 40 yearsBuildings and improvements . . . . . . . . . . . . . . . . . . . . 10 to 40 yearsTenant improvements . . . . . . . . . . . . . . . . . . . . . . . . . . Shorter of useful life or terms of related leaseFurniture, fixtures, and equipment . . . . . . . . . . . . . . . . 3 to 7 years
Cash and Cash Equivalents
Cash and cash equivalents consist of cash on hand and investments with maturities of three months or lessfrom the date of purchase. The majority of the Company’s cash and cash equivalents are held at majorcommercial banks which may at times exceed the Federal Deposit Insurance Corporation limit of $100,000. TheCompany has not experienced any losses to date on its invested cash.
Cash Held in Escrows
Escrows include amounts established pursuant to various agreements for security deposits, property taxes,insurance and other costs.
Investments in Securities
The Company accounts for investments in securities of publicly traded companies in accordance with SFASNo. 115 “Accounting for Certain Investments in Debt and Equity Investments.” Investments in securities ofnon-publicly traded companies are recorded at cost, as they are not considered marketable under SFAS No. 115.At December 31, 2006 and 2005, the Company had insignificant investments in securities.
Tenant and other receivables
Tenant and other accounts receivable, other than accrued rents receivable, are expected to be collectedwithin one year.
Deferred Charges
Deferred charges include leasing costs and financing fees. Leasing costs include an allocation for acquiredintangible in-place lease values and direct and incremental fees and costs incurred in the successful negotiation ofleases, including brokerage, legal, internal leasing employee salaries and other costs which have been deferredand are being amortized on a straight-line basis over the terms of the respective leases. Internal leasing salariesand related costs capitalized for the years ended December 31, 2006, 2005 and 2004 were $2.8 million, $2.0million and $1.5 million, respectively. External fees and costs incurred to obtain long-term financing have beendeferred and are being amortized over the terms of the respective loans on a basis that approximates the effectiveinterest method and are included with interest expense. Unamortized financing and leasing costs are charged toexpense upon the early repayment or significant modification of the financing or upon the early termination ofthe lease, respectively. Fully amortized deferred charges are removed from the books upon the expiration of thelease or maturity of the debt.
Investments in Unconsolidated Joint Ventures
Except for ownership interests in a variable interest entity, the Company accounts for its investments in jointventures under the equity method of accounting because it exercises significant influence over, but does notcontrol, these entities. These investments are recorded initially at cost, as Investments in Unconsolidated JointVentures, and subsequently adjusted for equity in earnings and cash contributions and distributions. Any
96
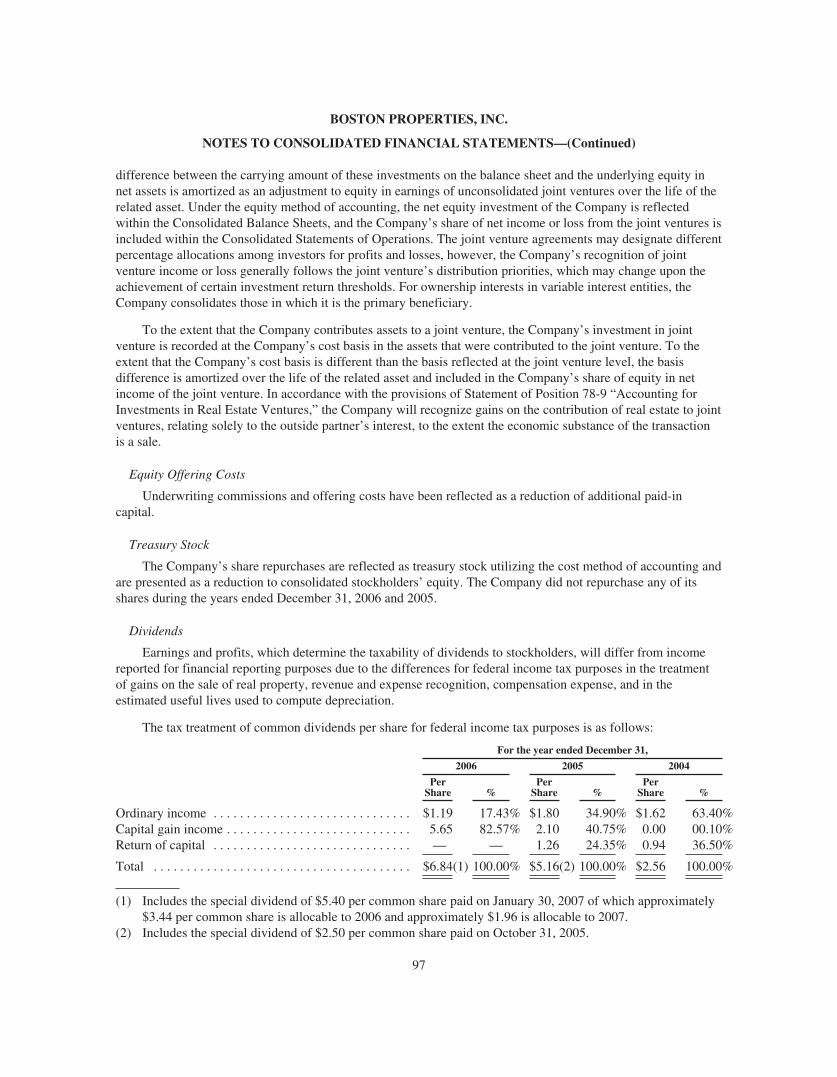
BOSTON PROPERTIES, INC.
NOTES TO CONSOLIDATED FINANCIAL STATEMENTS—(Continued)
difference between the carrying amount of these investments on the balance sheet and the underlying equity innet assets is amortized as an adjustment to equity in earnings of unconsolidated joint ventures over the life of therelated asset. Under the equity method of accounting, the net equity investment of the Company is reflectedwithin the Consolidated Balance Sheets, and the Company’s share of net income or loss from the joint ventures isincluded within the Consolidated Statements of Operations. The joint venture agreements may designate differentpercentage allocations among investors for profits and losses, however, the Company’s recognition of jointventure income or loss generally follows the joint venture’s distribution priorities, which may change upon theachievement of certain investment return thresholds. For ownership interests in variable interest entities, theCompany consolidates those in which it is the primary beneficiary.
To the extent that the Company contributes assets to a joint venture, the Company’s investment in jointventure is recorded at the Company’s cost basis in the assets that were contributed to the joint venture. To theextent that the Company’s cost basis is different than the basis reflected at the joint venture level, the basisdifference is amortized over the life of the related asset and included in the Company’s share of equity in netincome of the joint venture. In accordance with the provisions of Statement of Position 78-9 “Accounting forInvestments in Real Estate Ventures,” the Company will recognize gains on the contribution of real estate to jointventures, relating solely to the outside partner’s interest, to the extent the economic substance of the transactionis a sale.
Equity Offering Costs
Underwriting commissions and offering costs have been reflected as a reduction of additional paid-incapital.
Treasury Stock
The Company’s share repurchases are reflected as treasury stock utilizing the cost method of accounting andare presented as a reduction to consolidated stockholders’ equity. The Company did not repurchase any of itsshares during the years ended December 31, 2006 and 2005.
Dividends
Earnings and profits, which determine the taxability of dividends to stockholders, will differ from incomereported for financial reporting purposes due to the differences for federal income tax purposes in the treatmentof gains on the sale of real property, revenue and expense recognition, compensation expense, and in theestimated useful lives used to compute depreciation.
The tax treatment of common dividends per share for federal income tax purposes is as follows:
For the year ended December 31,
2006 2005 2004
PerShare %
PerShare %
PerShare %
Ordinary income . . . . . . . . . . . . . . . . . . . . . . . . . . . . . . $1.19 17.43% $1.80 34.90% $1.62 63.40%Capital gain income . . . . . . . . . . . . . . . . . . . . . . . . . . . . 5.65 82.57% 2.10 40.75% 0.00 00.10%Return of capital . . . . . . . . . . . . . . . . . . . . . . . . . . . . . . — — 1.26 24.35% 0.94 36.50%
Total . . . . . . . . . . . . . . . . . . . . . . . . . . . . . . . . . . . . . . . $6.84(1) 100.00% $5.16(2) 100.00% $2.56 100.00%
(1) Includes the special dividend of $5.40 per common share paid on January 30, 2007 of which approximately$3.44 per common share is allocable to 2006 and approximately $1.96 is allocable to 2007.
(2) Includes the special dividend of $2.50 per common share paid on October 31, 2005.
97
BOSTON PROPERTIES, INC.
NOTES TO CONSOLIDATED FINANCIAL STATEMENTS—(Continued)
Revenue Recognition
Base rental revenue is reported on a straight-line basis over the terms of the respective leases. The impact ofthe straight-line rent adjustment increased revenue by approximately $53.7 million, $66.0 million and $61.3million for the years ended December 31, 2006, 2005 and 2004, respectively, as the revenue recorded exceededamounts billed. In accordance with SFAS No. 141, the Company recognizes rental revenue of acquired in-place“above-” and “below-market” leases at their fair values over the terms of the respective leases. Accrued rentalincome, as reported on the Consolidated Balance Sheets, represents rental income earned in excess of rentpayments received pursuant to the terms of the individual lease agreements. The Company maintains anallowance against accrued rental income for future potential tenant credit losses. The credit assessment is basedon the estimated accrued rental income that is recoverable over the term of the lease. The Company alsomaintains an allowance for doubtful accounts for estimated losses resulting from the inability of tenants to makerequired rent payments. The computation of this allowance is based on the tenants’ payment history and currentcredit status, as well as certain industry or geographic specific credit considerations. If the Company’s estimatesof collectibility differ from the cash received, then the timing and amount of the Company’s reported revenuecould be impacted. The credit risk is mitigated by the high quality of the Company’s existing tenant base,reviews of prospective tenant’s risk profiles prior to lease execution and continual monitoring of the Company’sportfolio to identify potential problem tenants.
Recoveries from tenants, consisting of amounts due from tenants for common area maintenance, real estatetaxes and other recoverable costs are recognized as revenue in the period the expenses are incurred. Tenantreimbursements are recognized and presented in accordance with EITF Issue 99-19 “Reporting Revenue Gross asa Principal versus Net as an Agent” (“Issue 99-19”). Issue 99-19 requires that these reimbursements be recordedon a gross basis, as the Company is generally the primary obligor with respect to purchasing goods and servicesfrom third- party suppliers, has discretion in selecting the supplier and has credit risk. The Company alsoreceives reimbursement of payroll and payroll related cost from third parties which we reflect on a net basis inaccordance with Issue 99-19.
The Company’s hotel revenues are derived from room rentals and other sources such as charges to guestsfor long-distance telephone service, fax machine use, movie and vending commissions, meeting and banquetroom revenue and laundry services. Hotel revenues are recognized as earned.
The Company receives management and development fees from third parties. Management fees arerecorded and earned based on a percentage of collected rents at the properties under management, and not on astraight-line basis, because such fees are contingent upon the collection of rents. The Company reviews eachdevelopment agreement and records development fees on a straight-line basis or percentage of completiondepending on the risk associated with each project. Profit on development fees earned from joint venture projectsis recognized as revenue to the extent of the third party partners’ ownership interest.
Gains on sales of real estate are recognized pursuant to the provisions of SFAS No. 66 “Accounting forSales of Real Estate.” The specific timing of a sale is measured against various criteria in SFAS No. 66 related tothe terms of the transaction and any continuing involvement in the form of management or financial assistanceassociated with the properties. If the sales criteria are not met, the Company defers gain recognition and accountsfor the continued operations of the property by applying the finance, installment or cost recovery methods, asappropriate, until the sales criteria are met.
Interest Expense and Interest Rate Protection Agreements
From time to time, the Company enters into interest rate protection agreements to reduce the impact ofchanges in interest rates on its variable rate debt or in anticipation of issuing fixed rate debt. The fair value of
98
BOSTON PROPERTIES, INC.
NOTES TO CONSOLIDATED FINANCIAL STATEMENTS—(Continued)
these agreements is reflected on the Consolidated Balance Sheets. Changes in the fair value of these agreementswould be recorded in the Consolidated Statements of Operations if the agreements were not effective foraccounting purposes.
Earnings Per Share
Basic earnings per share (“EPS”) is computed by dividing net income available to common shareholders, asadjusted for unallocated earnings (if any) of certain securities issued by the Operating Partnership, by theweighted average number of shares of Common Stock outstanding during the year. Diluted EPS reflects thepotential dilution that could occur from shares issuable under stock-based compensation plans, including uponthe exercise of stock options, and conversion of the minority interests in the Operating Partnership.
Fair Value of Financial Instruments
The carrying values of cash and cash equivalents, escrows, receivables, accounts payable, accrued expensesand other assets and liabilities are reasonable estimates of their fair values because of the short maturities of theseinstruments.
For purposes of disclosure, the Company calculates the fair value of mortgage notes payable and unsecuredsenior notes. The Company discounts the spread between the future contractual interest payments and futureinterest payments on mortgage debt and unsecured notes based on a current market rate. In determining thecurrent market rate, the Company adds its estimation of a market spread to the quoted yields on federalgovernment treasury securities with similar maturity dates to its debt. Because the Company’s valuations of itsfinancial instruments are based on these types of estimates, the fair value of its financial instruments may changeif the Company’s estimates do not prove to be accurate. The fair value of the Company’s long-term indebtednessexceeds the aggregate carrying value by approximately $182.7 million at December 31, 2006.
Income Taxes
The Company has elected to be treated as a REIT under Sections 856 through 860 of the Internal RevenueCode of 1986, as amended (the “Code”), commencing with its taxable year ended December 31, 1997. As aresult, the Company generally will not be subject to federal corporate income tax on its taxable income that isdistributed to its stockholders. A REIT is subject to a number of organizational and operational requirements,including a requirement that it currently distribute at least 90% of its annual taxable income. The Company’spolicy is to distribute at least 100% of its taxable income. Accordingly, the only provision for federal incometaxes in the accompanying consolidated financial statements relates to the Company’s consolidated taxable REITsubsidiaries. The Company’s taxable REIT subsidiaries did not have significant tax provisions or deferredincome tax items.
In January 2002, the Company formed a taxable REIT subsidiary (“TRS”), IXP, Inc. (IXP) which acts as acaptive insurance company and is one of the elements of its overall insurance program. On September 27, 2006,IXP, Inc. was merged into IXP, LLC, a wholly owned subsidiary, and all insurance policies issued by IXP, Inc.were cancelled and reissued by IXP, LLC. The accounts of IXP are consolidated within the Company. IXP, Inc.was a captive TRS that was subject to tax at the federal and state level. Accordingly, the Company has recorded atax provision in the Company’s Consolidated Statements of Operations for the years ended December 31, 2006,2005 and 2004.
Effective July 1, 2002, the Company restructured the leases with respect to its ownership of the hotelproperties by forming a TRS. The hotel TRS, a wholly owned subsidiary of the Operating Partnership, is the
99

BOSTON PROPERTIES, INC.
NOTES TO CONSOLIDATED FINANCIAL STATEMENTS—(Continued)
lessee pursuant to leases for each of the hotel properties. As lessor, the Operating Partnership is entitled to apercentage of gross receipts from the hotel properties. Marriott International, Inc. continues to manage the hotelproperties under the Marriott name and under terms of the existing management agreements. In connection withthe restructuring, the revenue and expenses of the hotel properties are being reflected in the Company’sConsolidated Statements of Operations. The hotel TRS is subject to tax at the federal and state level and,accordingly, the Company has recorded a tax provision in the Company’s Consolidated Statements of Operationsfor the years ended December 31, 2006, 2005 and 2004.
The net difference between the tax basis and the reported amounts of the Company’s assets and liabilities isapproximately $674 million and $1.5 billion as of December 31, 2006 and 2005, respectively.
Certain entities included in the Company’s consolidated financial statements are subject to certain state andlocal taxes. These taxes are recorded as operating expenses in the accompanying consolidated financialstatements.
The following reconciles GAAP net income to taxable income:
For the year ended December 31,
2006 2005 2004
(in thousands)
Net income available to common shareholders . . . . . . . . . . . . . . . . . . . . . . . . $ 873,635 $438,292 $284,017Straight-line rent adjustments . . . . . . . . . . . . . . . . . . . . . . . . . . . . . . . . . . . . . . (48,563) (54,902) (51,692)Book/Tax differences from depreciation and amortization . . . . . . . . . . . . . . . 65,213 60,488 56,041Book/Tax differences on gains/losses from capital transactions . . . . . . . . . . . 67,316 36,319 (35,129)Book/Tax differences from stock-based compensation . . . . . . . . . . . . . . . . . . (100,292) (35,611) (67,027)Other book/tax differences, net . . . . . . . . . . . . . . . . . . . . . . . . . . . . . . . . . . . . . (60,209) 1,813 (11,540)
Taxable income . . . . . . . . . . . . . . . . . . . . . . . . . . . . . . . . . . . . . . . . . . . . . . . . . $ 797,100 $446,399 $174,670
Stock-based employee compensation plans
At December 31, 2006, the Company has stock-based employee compensation plan. Effective January 1,2005, the Company adopted the fair value recognition provisions of Financial Accounting Standards Board(“FASB”) Statement of Financial Accounting Standards (“SFAS”) No. 123, “Accounting for Stock-BasedCompensation,” as amended by SFAS No. 148, “Accounting for Stock-Based Compensation—Transition andDisclosure, an amendment of FASB Statement No. 123,” using the modified prospective application method forstock compensation awards. In addition, effective January 1, 2005, the Company adopted early SFAS No. 123(revised) (“SFAS No. 123R”), “Share-Based Payment,” which revised the fair value based method of accountingfor share-based payment liabilities, forfeitures and modifications of stock-based awards and clarified SFASNo. 123’s guidance in several areas, including measuring fair value, classifying an award as equity or as aliability and attributing compensation cost to reporting periods. In 2003, the Company transitioned to grantingrestricted stock and/or LTIP Units, as opposed to granting stock options, as its primary vehicle for employeeequity compensation under its stock-based employee compensation plan. The Company had previouslyaccounted for its stock-based employee compensation plans under the recognition and measurement principles ofthe Accounting Principles Board (“APB”) Opinion No. 25, “Accounting for Stock Issued to Employees,” andrelated interpretations. All outstanding options had an exercise price equal to the market value of the underlyingcommon stock on the date of grant, and all outstanding options are currently exercisable. As a result, thefollowing table only illustrates the effect on net income available to common shareholders and earnings percommon share if the Company had applied the fair value recognition provisions to stock-based employeecompensation for the year ended December 31, 2004 (in thousands, except for per share amounts).
100
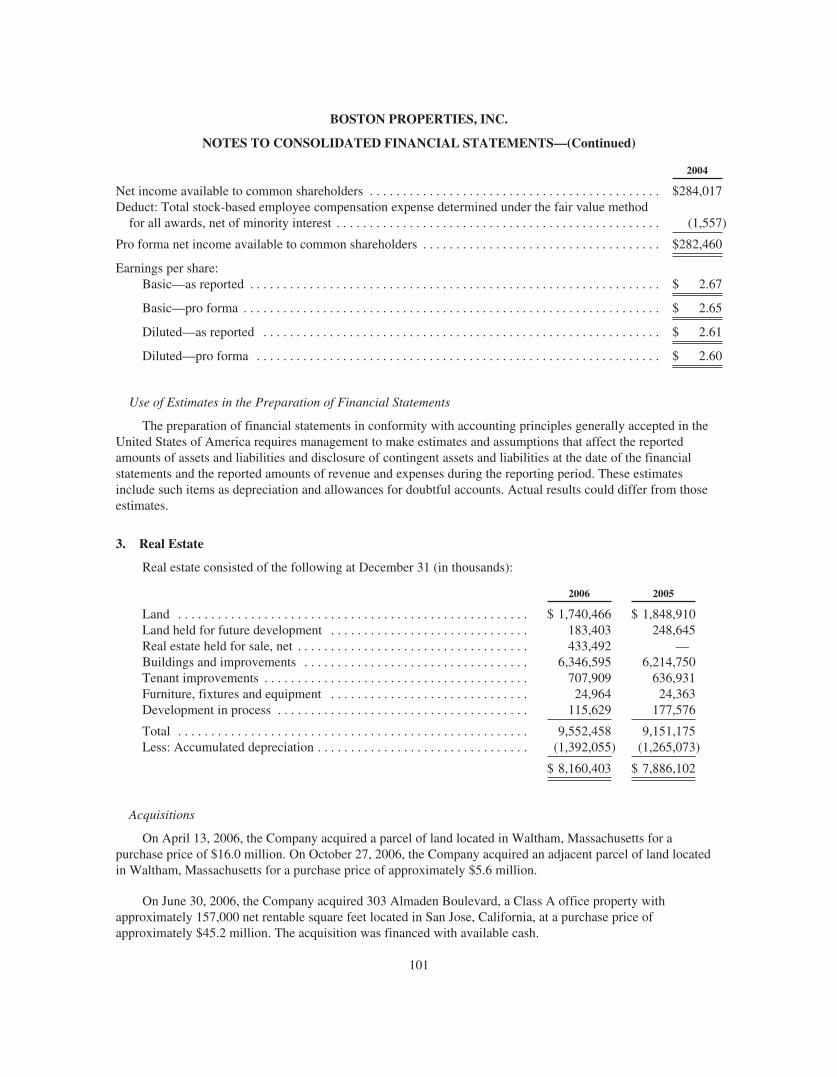
BOSTON PROPERTIES, INC.
NOTES TO CONSOLIDATED FINANCIAL STATEMENTS—(Continued)
2004
Net income available to common shareholders . . . . . . . . . . . . . . . . . . . . . . . . . . . . . . . . . . . . . . . . . . . . $284,017Deduct: Total stock-based employee compensation expense determined under the fair value method
for all awards, net of minority interest . . . . . . . . . . . . . . . . . . . . . . . . . . . . . . . . . . . . . . . . . . . . . . . . . (1,557)
Pro forma net income available to common shareholders . . . . . . . . . . . . . . . . . . . . . . . . . . . . . . . . . . . . $282,460
Earnings per share:Basic—as reported . . . . . . . . . . . . . . . . . . . . . . . . . . . . . . . . . . . . . . . . . . . . . . . . . . . . . . . . . . . . . . $ 2.67
Basic—pro forma . . . . . . . . . . . . . . . . . . . . . . . . . . . . . . . . . . . . . . . . . . . . . . . . . . . . . . . . . . . . . . . $ 2.65
Diluted—as reported . . . . . . . . . . . . . . . . . . . . . . . . . . . . . . . . . . . . . . . . . . . . . . . . . . . . . . . . . . . . $ 2.61
Diluted—pro forma . . . . . . . . . . . . . . . . . . . . . . . . . . . . . . . . . . . . . . . . . . . . . . . . . . . . . . . . . . . . . $ 2.60
Use of Estimates in the Preparation of Financial Statements
The preparation of financial statements in conformity with accounting principles generally accepted in theUnited States of America requires management to make estimates and assumptions that affect the reportedamounts of assets and liabilities and disclosure of contingent assets and liabilities at the date of the financialstatements and the reported amounts of revenue and expenses during the reporting period. These estimatesinclude such items as depreciation and allowances for doubtful accounts. Actual results could differ from thoseestimates.
3. Real Estate
Real estate consisted of the following at December 31 (in thousands):
2006 2005
Land . . . . . . . . . . . . . . . . . . . . . . . . . . . . . . . . . . . . . . . . . . . . . . . . . . . . . $ 1,740,466 $ 1,848,910Land held for future development . . . . . . . . . . . . . . . . . . . . . . . . . . . . . . 183,403 248,645Real estate held for sale, net . . . . . . . . . . . . . . . . . . . . . . . . . . . . . . . . . . . 433,492 —Buildings and improvements . . . . . . . . . . . . . . . . . . . . . . . . . . . . . . . . . . 6,346,595 6,214,750Tenant improvements . . . . . . . . . . . . . . . . . . . . . . . . . . . . . . . . . . . . . . . . 707,909 636,931Furniture, fixtures and equipment . . . . . . . . . . . . . . . . . . . . . . . . . . . . . . 24,964 24,363Development in process . . . . . . . . . . . . . . . . . . . . . . . . . . . . . . . . . . . . . . 115,629 177,576
Total . . . . . . . . . . . . . . . . . . . . . . . . . . . . . . . . . . . . . . . . . . . . . . . . . . . . . 9,552,458 9,151,175Less: Accumulated depreciation . . . . . . . . . . . . . . . . . . . . . . . . . . . . . . . . (1,392,055) (1,265,073)
$ 8,160,403 $ 7,886,102
Acquisitions
On April 13, 2006, the Company acquired a parcel of land located in Waltham, Massachusetts for apurchase price of $16.0 million. On October 27, 2006, the Company acquired an adjacent parcel of land locatedin Waltham, Massachusetts for a purchase price of approximately $5.6 million.
On June 30, 2006, the Company acquired 303 Almaden Boulevard, a Class A office property withapproximately 157,000 net rentable square feet located in San Jose, California, at a purchase price ofapproximately $45.2 million. The acquisition was financed with available cash.
101

BOSTON PROPERTIES, INC.
NOTES TO CONSOLIDATED FINANCIAL STATEMENTS—(Continued)
On August 10, 2006, the Company acquired 3200 Zanker Road, a Class A office complex withapproximately 544,000 net rentable square feet located in San Jose, California, at a purchase price ofapproximately $126.0 million. The acquisition was financed with available cash.
On November 30, 2006, the Company acquired Four and Five Cambridge Center and the Cambridge CenterEast Garage located in Cambridge, Massachusetts, at a purchase price of approximately $186.0 million. Thisproperty consists of two Class A office properties totaling approximately 436,000 net rentable square feet andstructured parking for approximately 840 vehicles totaling approximately 300,000 square feet. The acquisitionwas financed with available cash.
On December 22, 2006, the Company executed a contract to acquire Kingstowne Towne Center, amixed-use property located in Alexandria, Virginia, at a purchase price of approximately $134.0 million. Thisproperty is comprised of two Class A office properties totaling approximately 307,000 net rentable square feetand a retail/movie theater complex totaling approximately 88,000 net rentable square feet. The acquisition issubject to the satisfaction of customary closing conditions and there can be no assurance that the acquisition willbe consummated on the terms currently contemplated or at all.
Development
On January 17, 2006, the Company placed-in-service its Seven Cambridge Center development projectlocated in Cambridge, Massachusetts. Seven Cambridge Center is a fully-leased, build-to-suit project withapproximately 231,000 net rentable square feet of office, research laboratory and retail space.
On March 31, 2006, the Company commenced construction of South of Market, a Class A office projectconsisting of three buildings aggregating approximately 652,000 net rentable square feet located in Reston,Virginia.
On April 1, 2006, the Company placed-in-service 12290 Sunrise Valley, a 182,000 net rentable square footClass A office property located in Reston, Virginia.
On July 22, 2006, the Company placed-in-service its Capital Gallery expansion project, consisting of aten-story addition totaling approximately 319,000 net rentable square feet of Class A office space located inWashington, D.C.
On September 18, 2006, the Company commenced construction of 77 Fourth Avenue, a Class A officeproject with approximately 210,000 net rentable square feet, located in Waltham, Massachusetts.
On December 6, 2006, the Company commenced construction of One Preserve Parkway, a Class A officeproperty totaling approximately 183,000 net rentable square feet located in Rockville, Maryland.
Dispositions
On February 23, 2005, the Company sold a parcel of land at the Prudential Center located in Boston,Massachusetts for a net sale price of approximately $31.5 million and an additional obligation of the buyer tofund approximately $19.6 million of development-related costs at the Prudential Center for aggregate proceeds of$51.1 million. Due to the structure of the transaction and certain continuing involvement provisions related to thedevelopment of the property, this transaction did not initially qualify as a sale for financial reporting purposesand had been accounted for as a financing transaction. On January 3, 2006, the continuing involvementprovisions expired and the Company recognized a gain on sale of approximately $4.8 million (net of minorityinterest share of approximately $0.9 million).
102

BOSTON PROPERTIES, INC.
NOTES TO CONSOLIDATED FINANCIAL STATEMENTS—(Continued)
On June 6, 2006, the Company sold 280 Park Avenue, a 1,179,000 net rentable square foot Class A officeproperty located in midtown Manhattan, New York, for approximately $1.2 billion. Net proceeds totaledapproximately $875 million after legal defeasance of indebtedness secured by the property (consisting ofapproximately $254.4 million of principal indebtedness and approximately $28.2 million of related defeasancecosts) and the payment of transfer taxes, brokers’ fees and other customary closing costs. At closing, the Companyrecognized a gain on sale of approximately $583.3 million (net of minority interest share of approximately $109.2million). The net proceeds from the sale were recorded in Cash Held in Escrows in the Company’s ConsolidatedBalance Sheets because the cash was held in escrow by a qualifying intermediary for the purpose of potentiallyaccomplishing a like-kind exchange under Section 1031 of the Internal Revenue Code. The Company did notidentify any qualifying replacement assets to accomplish the like-kind exchange by the statutory expiration date ofJuly 21, 2006 and, as a result, the cash was released from escrow and returned to the Company with no restrictionsas to its use. Pursuant to the purchase and sale agreement, the Company entered into a master lease agreement withthe buyer at closing. Under the master lease agreement, the Company has guaranteed that the buyer will receive atleast a minimum amount of base rent from approximately 74,340 square feet of space during the ten-year periodfollowing the expiration of the current leases for this space. The current leases for this space are scheduled to expireat various times between June 2006 and October 2007. The aggregate amount of base rent guaranteed by theCompany over the entire period from 2006 to 2017 is approximately $67.3 million. The Company’s guaranteeobligations, which are in the form of base rent payments to the buyer, will be reduced by the amount of base rentpayable, whether or not actually paid, under qualifying leases for this space that are obtained by the Company fromprospective tenants. The Company will remain responsible for any free rent periods. The buyer will bear allcustomary leasing costs for this space, including tenant improvements and leasing commissions. The recognizedgain on sale of the property had been reduced by approximately $67.3 million, representing the Company’smaximum obligation under the master lease. Such amount has been deferred and recorded in Other Liabilities in theCompany’s Consolidated Balance Sheets and will be reduced as (1) payments are made under the master lease or(2) as qualifying leases are signed by the Company, at which time the Company will recognize additional gain onsale. Subsequent to the sale, the Company signed new qualifying leases for 26,681 net rentable square feet of the74,340 net rentable square foot master lease obligation, resulting in the recognition of approximately $17.7 million(net of minority interest share of approximately $3.3 million) of additional gain on sale of real estate. As ofDecember 31, 2006, the master lease obligation totaled approximately $45.8 million. As part of the transaction, thebuyer has engaged the Company as the property manager and leasing agent for 280 Park Avenue for a one-yearterm that renews automatically. Either party has the right to terminate this relationship at any time after thetermination or expiration of the master lease agreement described above. The Company will recognize managementfees on a fair value basis over the term of the agreement. As a result, the recognized gain on sale of the property hasbeen reduced by approximately $16.6 million, representing the difference between the management fees to bereceived by the Company and the fair value of the management fees. Such amount has been deferred and recordedin Other Liabilities in the Company’s Consolidated Balance Sheets and will be recognized as management servicesrevenue over the term of the management agreement. Under the purchase and sale agreement, the Company has alsoagreed to provide to the buyer fixed monthly revenue support from the closing date until December 31, 2008. Theaggregate amount of the revenue support payments will be approximately $22.5 million and has been recorded as apurchase price adjustment and included in Other Liabilities within the Company’s Consolidated Balance Sheets. Asof December 31, 2006, the revenue support obligation totaled approximately $15.2 million. Due to the Company’scontinuing involvement through an agreement with the buyer to manage and lease the property for a fee after thesale and the financial obligations discussed above, this property has not been categorized as discontinued operationsin the accompanying Consolidated Statements of Operations (See Note 19).
On November 17, 2006, the Company executed a binding agreement for the sale of the long-term leaseholdinterest in 5 Times Square in New York City and related credits, for approximately $1.28 billion in cash. 5 TimesSquare is a fully-leased Class A office tower that contains approximately 1,101,779 net rentable square feet. Inconjunction with the sale, the Company has agreed to provide to the buyer monthly revenue support from the
103
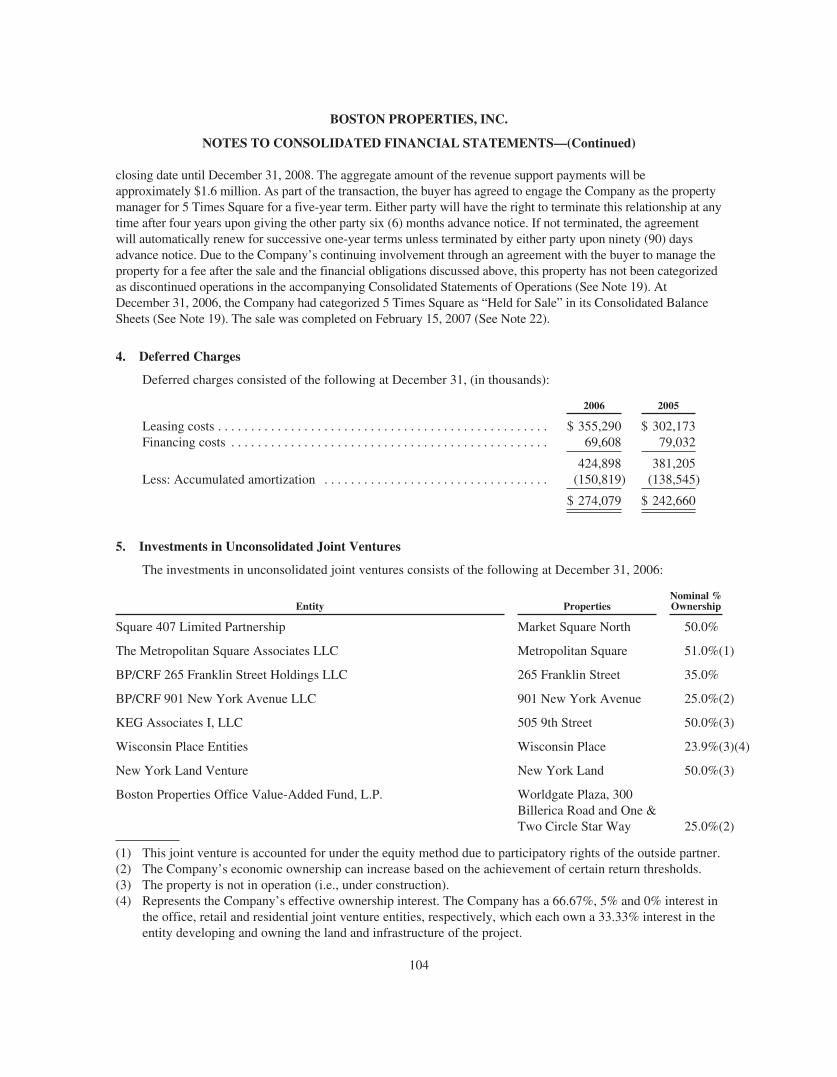
BOSTON PROPERTIES, INC.
NOTES TO CONSOLIDATED FINANCIAL STATEMENTS—(Continued)
closing date until December 31, 2008. The aggregate amount of the revenue support payments will beapproximately $1.6 million. As part of the transaction, the buyer has agreed to engage the Company as the propertymanager for 5 Times Square for a five-year term. Either party will have the right to terminate this relationship at anytime after four years upon giving the other party six (6) months advance notice. If not terminated, the agreementwill automatically renew for successive one-year terms unless terminated by either party upon ninety (90) daysadvance notice. Due to the Company’s continuing involvement through an agreement with the buyer to manage theproperty for a fee after the sale and the financial obligations discussed above, this property has not been categorizedas discontinued operations in the accompanying Consolidated Statements of Operations (See Note 19). AtDecember 31, 2006, the Company had categorized 5 Times Square as “Held for Sale” in its Consolidated BalanceSheets (See Note 19). The sale was completed on February 15, 2007 (See Note 22).
4. Deferred Charges
Deferred charges consisted of the following at December 31, (in thousands):
2006 2005
Leasing costs . . . . . . . . . . . . . . . . . . . . . . . . . . . . . . . . . . . . . . . . . . . . . . . . . . $ 355,290 $ 302,173Financing costs . . . . . . . . . . . . . . . . . . . . . . . . . . . . . . . . . . . . . . . . . . . . . . . . 69,608 79,032
424,898 381,205Less: Accumulated amortization . . . . . . . . . . . . . . . . . . . . . . . . . . . . . . . . . . (150,819) (138,545)
$ 274,079 $ 242,660
5. Investments in Unconsolidated Joint Ventures
The investments in unconsolidated joint ventures consists of the following at December 31, 2006:
Entity PropertiesNominal %Ownership
Square 407 Limited Partnership Market Square North 50.0%
The Metropolitan Square Associates LLC Metropolitan Square 51.0%(1)
BP/CRF 265 Franklin Street Holdings LLC 265 Franklin Street 35.0%
BP/CRF 901 New York Avenue LLC 901 New York Avenue 25.0%(2)
KEG Associates I, LLC 505 9th Street 50.0%(3)
Wisconsin Place Entities Wisconsin Place 23.9%(3)(4)
New York Land Venture New York Land 50.0%(3)
Boston Properties Office Value-Added Fund, L.P. Worldgate Plaza, 300Billerica Road and One &Two Circle Star Way 25.0%(2)
(1) This joint venture is accounted for under the equity method due to participatory rights of the outside partner.(2) The Company’s economic ownership can increase based on the achievement of certain return thresholds.(3) The property is not in operation (i.e., under construction).(4) Represents the Company’s effective ownership interest. The Company has a 66.67%, 5% and 0% interest in
the office, retail and residential joint venture entities, respectively, which each own a 33.33% interest in theentity developing and owning the land and infrastructure of the project.
104

BOSTON PROPERTIES, INC.
NOTES TO CONSOLIDATED FINANCIAL STATEMENTS—(Continued)
Certain of the Company’s joint venture agreements include provisions whereby, at certain specified times,each partner has the right to initiate a purchase or sale of its interest in the joint ventures at an agreed upon fairvalue. Under these provisions, the Company is not compelled to purchase the interest of its outside joint venturepartners.
On March 13, 2006, a joint venture in which the Company has a 50% interest acquired a land parcel locatedin New York City for a purchase price of approximately $6.0 million. In addition, on May 8, 2006, the jointventure acquired additional land parcels located in New York City for an aggregate purchase price ofapproximately $15.3 million. On May 8, 2006, the joint venture obtained mortgage financing collateralized bythe land parcels totaling approximately $23.6 million. The mortgage financing bears interest at a variable rateequal to LIBOR plus 2.25% per annum and matures in May 2008. The Company and its third-party joint venturepartner have each agreed to guarantee approximately $11.8 million of the mortgage loan.
On August 31, 2006, the Company’s Value-Added Fund acquired One and Two Circle Star Way, a 208,000net rentable square foot office complex located in San Carlos, California, at a purchase price of approximately$63.5 million. The acquisition was financed with new mortgage indebtedness totaling $42.0 million andapproximately $21.5 million in cash, of which the Company’s share was approximately $5.4 million. Themortgage financing requires interest-only payments at a fixed interest rate of 6.57% per annum and matures inSeptember 2013.
On September 15, 2006, a joint venture in which the Company has a 35% interest sold 265 Franklin Street, aClass A office property with approximately 347,000 net rentable square feet located in Boston, Massachusetts,for approximately $170.0 million. Net cash proceeds totaled approximately $108.3 million, of which theCompany’s share was approximately $37.9 million, after the repayment of the mortgage indebtedness ofapproximately $60.8 million and unfunded tenant obligations and other closing costs of approximately $0.9million, resulting in a gain on sale of approximately $51.4 million. The Company’s share of the gain on sale wasapproximately $18.0 million, which has been included in Income from Unconsolidated Joint Ventures in theaccompanying Consolidated Statements of Operations. In connection with the repayment of the mortgageindebtedness on the property, the joint venture recognized a loss from early extinguishment of debt totalingapproximately $0.2 million, consisting of the write-off of unamortized deferred financing costs. The mortgageloan bore interest at a variable rate equal to LIBOR plus 1.10% per annum and was scheduled to mature inSeptember 2007.
105

BOSTON PROPERTIES, INC.
NOTES TO CONSOLIDATED FINANCIAL STATEMENTS—(Continued)
The combined summarized financial information of the unconsolidated joint ventures is as follows (inthousands):
December 31,
Balance Sheets 2006 2005
Real estate and development in process, net . . . . . . . . . . . . . . . . . . . . . . . . . . . $760,139 $733,908Other assets . . . . . . . . . . . . . . . . . . . . . . . . . . . . . . . . . . . . . . . . . . . . . . . . . . . . 87,759 67,654
Total assets . . . . . . . . . . . . . . . . . . . . . . . . . . . . . . . . . . . . . . . . . . . . . . . . $847,898 $801,562
Mortgage and Notes payable (1) . . . . . . . . . . . . . . . . . . . . . . . . . . . . . . . . . . . . $630,254 $587,727Other liabilities . . . . . . . . . . . . . . . . . . . . . . . . . . . . . . . . . . . . . . . . . . . . . . . . . 36,991 18,717Members’/Partners’ equity . . . . . . . . . . . . . . . . . . . . . . . . . . . . . . . . . . . . . . . . 180,653 195,118
Total liabilities and members’/partners’ equity . . . . . . . . . . . . . . . . . . . . $847,898 $801,562
Company’s share of equity . . . . . . . . . . . . . . . . . . . . . . . . . . . . . . . . . . . . . . . . $ 81,053 $ 87,489Basis differential (2) . . . . . . . . . . . . . . . . . . . . . . . . . . . . . . . . . . . . . . . . . . . . . 2,658 2,718
Carrying value of the Company’s investments in unconsolidated jointventures . . . . . . . . . . . . . . . . . . . . . . . . . . . . . . . . . . . . . . . . . . . . . . . . . . . . . $ 83,711 $ 90,207
(1) The Company and its third-party joint venture partners in the Wisconsin Place Entities have guaranteed theseller financing totaling $15.5 million related to the acquisition of the land by the Land and InfrastructureEntity. The Company and its third-party joint venture partners in the New York Land Venture have eachagreed to guarantee approximately $11.8 million of the mortgage loan. The fair value of the Company’sstand-ready obligations related to the issuance of these guarantees is immaterial.
(2) This amount represents the aggregate difference between the Company’s historical cost basis and the basisreflected at the joint venture level, which is typically amortized over the life of the related asset. Basisdifferentials occur primarily upon the transfer of assets that were previously owned by the Company into ajoint venture. In addition, certain acquisition, transaction and other costs may not be reflected in the netassets at the joint venture level.
Statements of Operations Year Ended December 31,
2006 2005 2004
(in thousands)
Total revenue . . . . . . . . . . . . . . . . . . . . . . . . . . . . . . . . . . . . . . . . . . $103,050 $96,189 $66,755Expenses
Operating . . . . . . . . . . . . . . . . . . . . . . . . . . . . . . . . . . . . . . . . . 33,595 31,354 21,241Interest . . . . . . . . . . . . . . . . . . . . . . . . . . . . . . . . . . . . . . . . . . . 34,899 32,469 21,821Depreciation and amortization . . . . . . . . . . . . . . . . . . . . . . . . . 23,959 22,354 14,928Loss from early extinguishment of debt . . . . . . . . . . . . . . . . . . 205 — —
Total expenses . . . . . . . . . . . . . . . . . . . . . . . . . . . . . . . . . . . . . . . . . 92,658 86,177 57,990
Income before gain on sale of real estate . . . . . . . . . . . . . . . . . . . . . 10,392 10,012 8,765Gain on sale of real estate . . . . . . . . . . . . . . . . . . . . . . . . . . . . . . . . 51,384 — —
Net income . . . . . . . . . . . . . . . . . . . . . . . . . . . . . . . . . . . . . . . . . . . . $ 61,776 $10,012 $ 8,765
Company’s share of net income . . . . . . . . . . . . . . . . . . . . . . . . . . . . $ 24,507 $ 4,829 $ 3,380
106
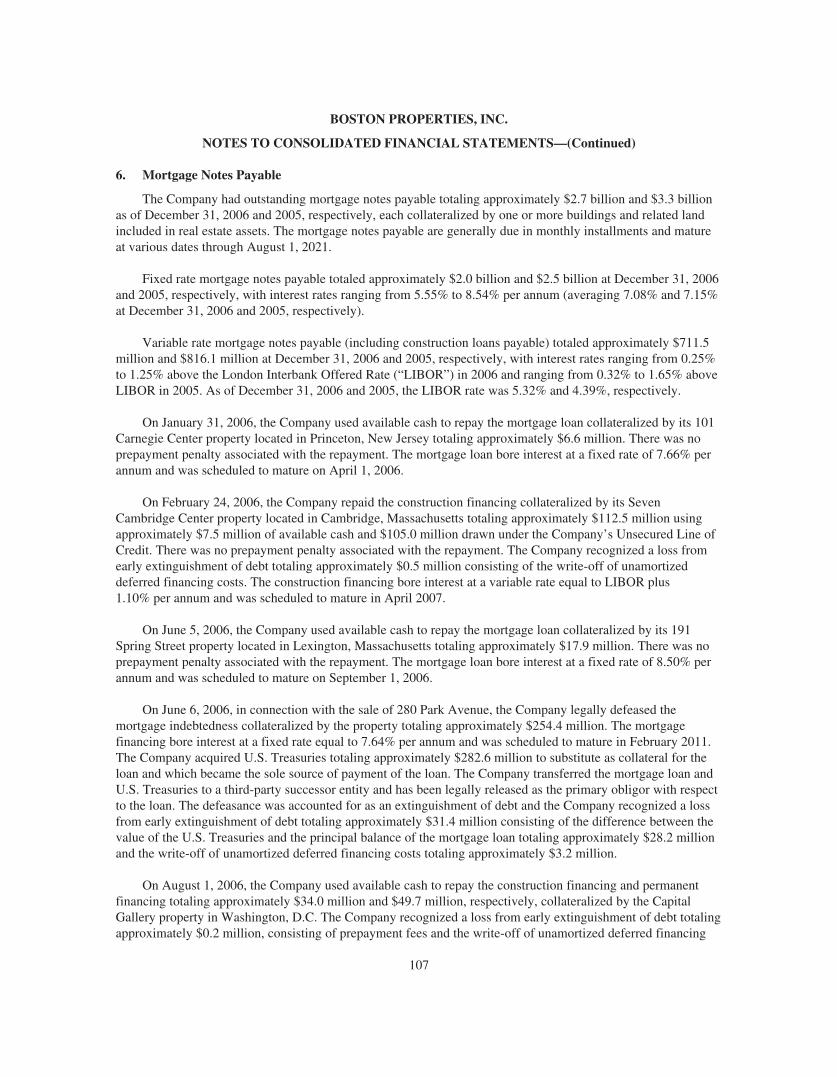
BOSTON PROPERTIES, INC.
NOTES TO CONSOLIDATED FINANCIAL STATEMENTS—(Continued)
6. Mortgage Notes Payable
The Company had outstanding mortgage notes payable totaling approximately $2.7 billion and $3.3 billionas of December 31, 2006 and 2005, respectively, each collateralized by one or more buildings and related landincluded in real estate assets. The mortgage notes payable are generally due in monthly installments and matureat various dates through August 1, 2021.
Fixed rate mortgage notes payable totaled approximately $2.0 billion and $2.5 billion at December 31, 2006and 2005, respectively, with interest rates ranging from 5.55% to 8.54% per annum (averaging 7.08% and 7.15%at December 31, 2006 and 2005, respectively).
Variable rate mortgage notes payable (including construction loans payable) totaled approximately $711.5million and $816.1 million at December 31, 2006 and 2005, respectively, with interest rates ranging from 0.25%to 1.25% above the London Interbank Offered Rate (“LIBOR”) in 2006 and ranging from 0.32% to 1.65% aboveLIBOR in 2005. As of December 31, 2006 and 2005, the LIBOR rate was 5.32% and 4.39%, respectively.
On January 31, 2006, the Company used available cash to repay the mortgage loan collateralized by its 101Carnegie Center property located in Princeton, New Jersey totaling approximately $6.6 million. There was noprepayment penalty associated with the repayment. The mortgage loan bore interest at a fixed rate of 7.66% perannum and was scheduled to mature on April 1, 2006.
On February 24, 2006, the Company repaid the construction financing collateralized by its SevenCambridge Center property located in Cambridge, Massachusetts totaling approximately $112.5 million usingapproximately $7.5 million of available cash and $105.0 million drawn under the Company’s Unsecured Line ofCredit. There was no prepayment penalty associated with the repayment. The Company recognized a loss fromearly extinguishment of debt totaling approximately $0.5 million consisting of the write-off of unamortizeddeferred financing costs. The construction financing bore interest at a variable rate equal to LIBOR plus1.10% per annum and was scheduled to mature in April 2007.
On June 5, 2006, the Company used available cash to repay the mortgage loan collateralized by its 191Spring Street property located in Lexington, Massachusetts totaling approximately $17.9 million. There was noprepayment penalty associated with the repayment. The mortgage loan bore interest at a fixed rate of 8.50% perannum and was scheduled to mature on September 1, 2006.
On June 6, 2006, in connection with the sale of 280 Park Avenue, the Company legally defeased themortgage indebtedness collateralized by the property totaling approximately $254.4 million. The mortgagefinancing bore interest at a fixed rate equal to 7.64% per annum and was scheduled to mature in February 2011.The Company acquired U.S. Treasuries totaling approximately $282.6 million to substitute as collateral for theloan and which became the sole source of payment of the loan. The Company transferred the mortgage loan andU.S. Treasuries to a third-party successor entity and has been legally released as the primary obligor with respectto the loan. The defeasance was accounted for as an extinguishment of debt and the Company recognized a lossfrom early extinguishment of debt totaling approximately $31.4 million consisting of the difference between thevalue of the U.S. Treasuries and the principal balance of the mortgage loan totaling approximately $28.2 millionand the write-off of unamortized deferred financing costs totaling approximately $3.2 million.
On August 1, 2006, the Company used available cash to repay the construction financing and permanentfinancing totaling approximately $34.0 million and $49.7 million, respectively, collateralized by the CapitalGallery property in Washington, D.C. The Company recognized a loss from early extinguishment of debt totalingapproximately $0.2 million, consisting of prepayment fees and the write-off of unamortized deferred financing
107
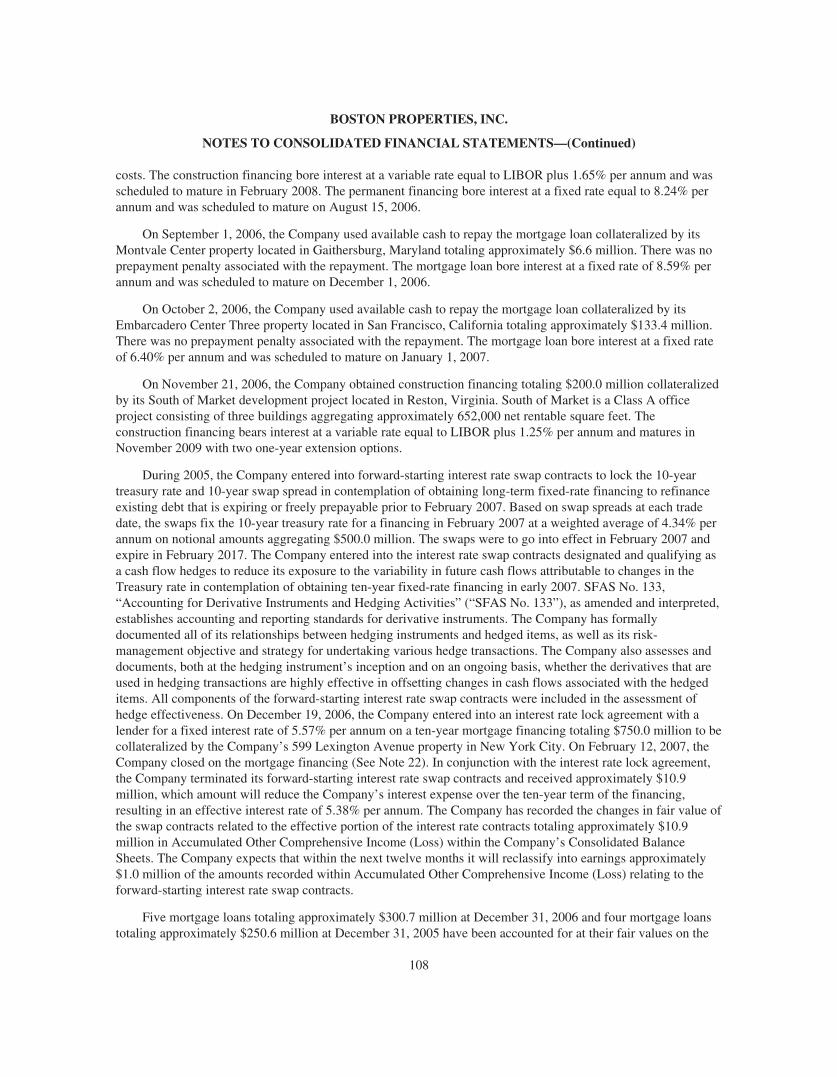
BOSTON PROPERTIES, INC.
NOTES TO CONSOLIDATED FINANCIAL STATEMENTS—(Continued)
costs. The construction financing bore interest at a variable rate equal to LIBOR plus 1.65% per annum and wasscheduled to mature in February 2008. The permanent financing bore interest at a fixed rate equal to 8.24% perannum and was scheduled to mature on August 15, 2006.
On September 1, 2006, the Company used available cash to repay the mortgage loan collateralized by itsMontvale Center property located in Gaithersburg, Maryland totaling approximately $6.6 million. There was noprepayment penalty associated with the repayment. The mortgage loan bore interest at a fixed rate of 8.59% perannum and was scheduled to mature on December 1, 2006.
On October 2, 2006, the Company used available cash to repay the mortgage loan collateralized by itsEmbarcadero Center Three property located in San Francisco, California totaling approximately $133.4 million.There was no prepayment penalty associated with the repayment. The mortgage loan bore interest at a fixed rateof 6.40% per annum and was scheduled to mature on January 1, 2007.
On November 21, 2006, the Company obtained construction financing totaling $200.0 million collateralizedby its South of Market development project located in Reston, Virginia. South of Market is a Class A officeproject consisting of three buildings aggregating approximately 652,000 net rentable square feet. Theconstruction financing bears interest at a variable rate equal to LIBOR plus 1.25% per annum and matures inNovember 2009 with two one-year extension options.
During 2005, the Company entered into forward-starting interest rate swap contracts to lock the 10-yeartreasury rate and 10-year swap spread in contemplation of obtaining long-term fixed-rate financing to refinanceexisting debt that is expiring or freely prepayable prior to February 2007. Based on swap spreads at each tradedate, the swaps fix the 10-year treasury rate for a financing in February 2007 at a weighted average of 4.34% perannum on notional amounts aggregating $500.0 million. The swaps were to go into effect in February 2007 andexpire in February 2017. The Company entered into the interest rate swap contracts designated and qualifying asa cash flow hedges to reduce its exposure to the variability in future cash flows attributable to changes in theTreasury rate in contemplation of obtaining ten-year fixed-rate financing in early 2007. SFAS No. 133,“Accounting for Derivative Instruments and Hedging Activities” (“SFAS No. 133”), as amended and interpreted,establishes accounting and reporting standards for derivative instruments. The Company has formallydocumented all of its relationships between hedging instruments and hedged items, as well as its risk-management objective and strategy for undertaking various hedge transactions. The Company also assesses anddocuments, both at the hedging instrument’s inception and on an ongoing basis, whether the derivatives that areused in hedging transactions are highly effective in offsetting changes in cash flows associated with the hedgeditems. All components of the forward-starting interest rate swap contracts were included in the assessment ofhedge effectiveness. On December 19, 2006, the Company entered into an interest rate lock agreement with alender for a fixed interest rate of 5.57% per annum on a ten-year mortgage financing totaling $750.0 million to becollateralized by the Company’s 599 Lexington Avenue property in New York City. On February 12, 2007, theCompany closed on the mortgage financing (See Note 22). In conjunction with the interest rate lock agreement,the Company terminated its forward-starting interest rate swap contracts and received approximately $10.9million, which amount will reduce the Company’s interest expense over the ten-year term of the financing,resulting in an effective interest rate of 5.38% per annum. The Company has recorded the changes in fair value ofthe swap contracts related to the effective portion of the interest rate contracts totaling approximately $10.9million in Accumulated Other Comprehensive Income (Loss) within the Company’s Consolidated BalanceSheets. The Company expects that within the next twelve months it will reclassify into earnings approximately$1.0 million of the amounts recorded within Accumulated Other Comprehensive Income (Loss) relating to theforward-starting interest rate swap contracts.
Five mortgage loans totaling approximately $300.7 million at December 31, 2006 and four mortgage loanstotaling approximately $250.6 million at December 31, 2005 have been accounted for at their fair values on the
108
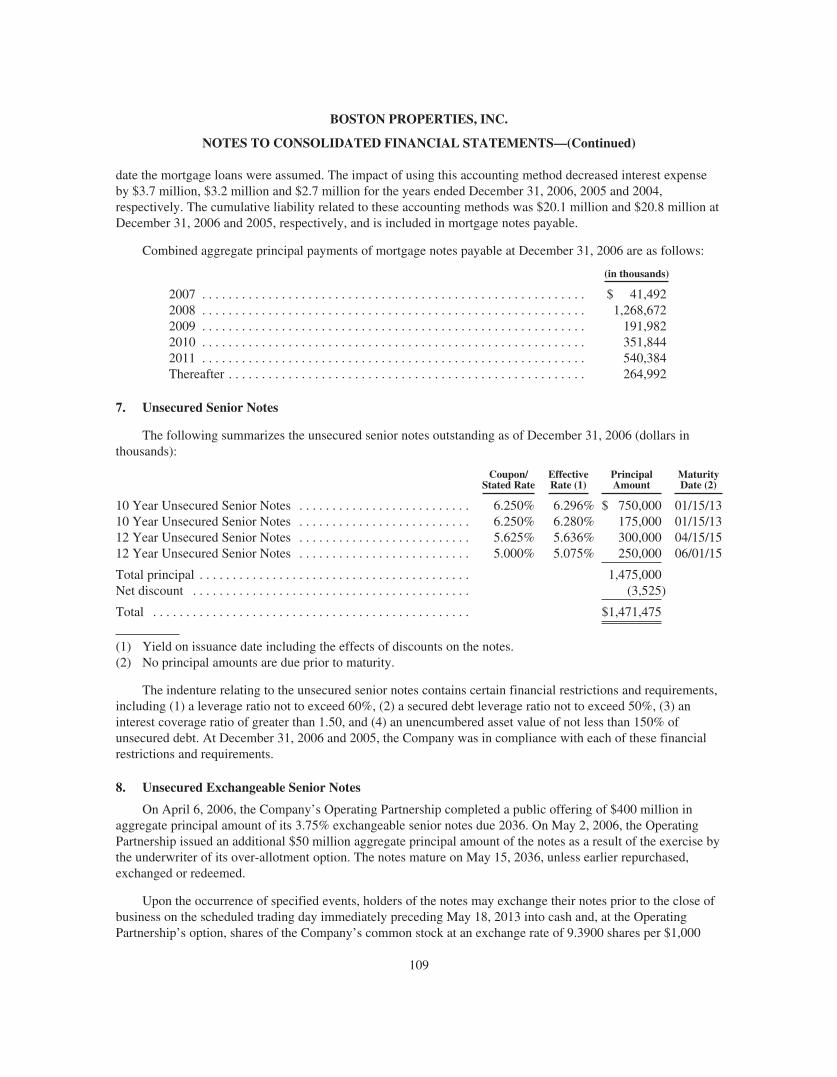
BOSTON PROPERTIES, INC.
NOTES TO CONSOLIDATED FINANCIAL STATEMENTS—(Continued)
date the mortgage loans were assumed. The impact of using this accounting method decreased interest expenseby $3.7 million, $3.2 million and $2.7 million for the years ended December 31, 2006, 2005 and 2004,respectively. The cumulative liability related to these accounting methods was $20.1 million and $20.8 million atDecember 31, 2006 and 2005, respectively, and is included in mortgage notes payable.
Combined aggregate principal payments of mortgage notes payable at December 31, 2006 are as follows:
(in thousands)
2007 . . . . . . . . . . . . . . . . . . . . . . . . . . . . . . . . . . . . . . . . . . . . . . . . . . . . . . . . . . $ 41,4922008 . . . . . . . . . . . . . . . . . . . . . . . . . . . . . . . . . . . . . . . . . . . . . . . . . . . . . . . . . . 1,268,6722009 . . . . . . . . . . . . . . . . . . . . . . . . . . . . . . . . . . . . . . . . . . . . . . . . . . . . . . . . . . 191,9822010 . . . . . . . . . . . . . . . . . . . . . . . . . . . . . . . . . . . . . . . . . . . . . . . . . . . . . . . . . . 351,8442011 . . . . . . . . . . . . . . . . . . . . . . . . . . . . . . . . . . . . . . . . . . . . . . . . . . . . . . . . . . 540,384Thereafter . . . . . . . . . . . . . . . . . . . . . . . . . . . . . . . . . . . . . . . . . . . . . . . . . . . . . . 264,992
7. Unsecured Senior Notes
The following summarizes the unsecured senior notes outstanding as of December 31, 2006 (dollars inthousands):
Coupon/Stated Rate
EffectiveRate (1)
PrincipalAmount
MaturityDate (2)
10 Year Unsecured Senior Notes . . . . . . . . . . . . . . . . . . . . . . . . . . 6.250% 6.296% $ 750,000 01/15/1310 Year Unsecured Senior Notes . . . . . . . . . . . . . . . . . . . . . . . . . . 6.250% 6.280% 175,000 01/15/1312 Year Unsecured Senior Notes . . . . . . . . . . . . . . . . . . . . . . . . . . 5.625% 5.636% 300,000 04/15/1512 Year Unsecured Senior Notes . . . . . . . . . . . . . . . . . . . . . . . . . . 5.000% 5.075% 250,000 06/01/15
Total principal . . . . . . . . . . . . . . . . . . . . . . . . . . . . . . . . . . . . . . . . . 1,475,000Net discount . . . . . . . . . . . . . . . . . . . . . . . . . . . . . . . . . . . . . . . . . . (3,525)
Total . . . . . . . . . . . . . . . . . . . . . . . . . . . . . . . . . . . . . . . . . . . . . . . . $1,471,475
(1) Yield on issuance date including the effects of discounts on the notes.(2) No principal amounts are due prior to maturity.
The indenture relating to the unsecured senior notes contains certain financial restrictions and requirements,including (1) a leverage ratio not to exceed 60%, (2) a secured debt leverage ratio not to exceed 50%, (3) aninterest coverage ratio of greater than 1.50, and (4) an unencumbered asset value of not less than 150% ofunsecured debt. At December 31, 2006 and 2005, the Company was in compliance with each of these financialrestrictions and requirements.
8. Unsecured Exchangeable Senior Notes
On April 6, 2006, the Company’s Operating Partnership completed a public offering of $400 million inaggregate principal amount of its 3.75% exchangeable senior notes due 2036. On May 2, 2006, the OperatingPartnership issued an additional $50 million aggregate principal amount of the notes as a result of the exercise bythe underwriter of its over-allotment option. The notes mature on May 15, 2036, unless earlier repurchased,exchanged or redeemed.
Upon the occurrence of specified events, holders of the notes may exchange their notes prior to the close ofbusiness on the scheduled trading day immediately preceding May 18, 2013 into cash and, at the OperatingPartnership’s option, shares of the Company’s common stock at an exchange rate of 9.3900 shares per $1,000
109
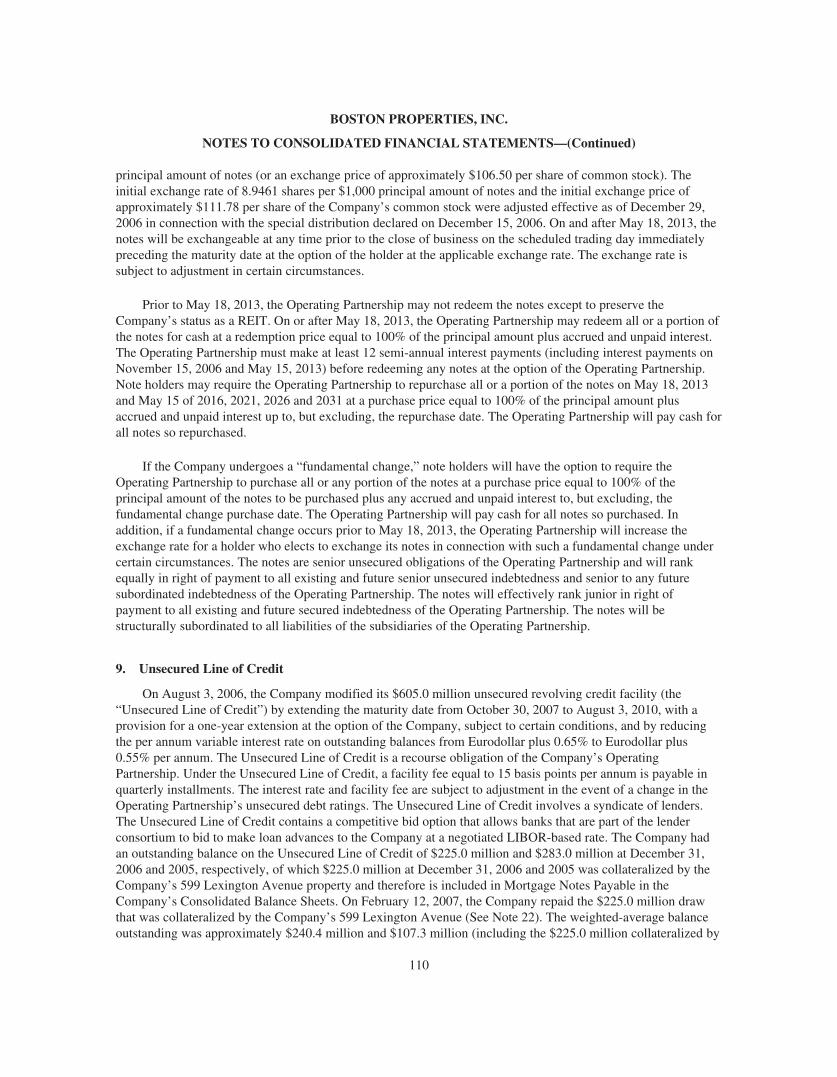
BOSTON PROPERTIES, INC.
NOTES TO CONSOLIDATED FINANCIAL STATEMENTS—(Continued)
principal amount of notes (or an exchange price of approximately $106.50 per share of common stock). Theinitial exchange rate of 8.9461 shares per $1,000 principal amount of notes and the initial exchange price ofapproximately $111.78 per share of the Company’s common stock were adjusted effective as of December 29,2006 in connection with the special distribution declared on December 15, 2006. On and after May 18, 2013, thenotes will be exchangeable at any time prior to the close of business on the scheduled trading day immediatelypreceding the maturity date at the option of the holder at the applicable exchange rate. The exchange rate issubject to adjustment in certain circumstances.
Prior to May 18, 2013, the Operating Partnership may not redeem the notes except to preserve theCompany’s status as a REIT. On or after May 18, 2013, the Operating Partnership may redeem all or a portion ofthe notes for cash at a redemption price equal to 100% of the principal amount plus accrued and unpaid interest.The Operating Partnership must make at least 12 semi-annual interest payments (including interest payments onNovember 15, 2006 and May 15, 2013) before redeeming any notes at the option of the Operating Partnership.Note holders may require the Operating Partnership to repurchase all or a portion of the notes on May 18, 2013and May 15 of 2016, 2021, 2026 and 2031 at a purchase price equal to 100% of the principal amount plusaccrued and unpaid interest up to, but excluding, the repurchase date. The Operating Partnership will pay cash forall notes so repurchased.
If the Company undergoes a “fundamental change,” note holders will have the option to require theOperating Partnership to purchase all or any portion of the notes at a purchase price equal to 100% of theprincipal amount of the notes to be purchased plus any accrued and unpaid interest to, but excluding, thefundamental change purchase date. The Operating Partnership will pay cash for all notes so purchased. Inaddition, if a fundamental change occurs prior to May 18, 2013, the Operating Partnership will increase theexchange rate for a holder who elects to exchange its notes in connection with such a fundamental change undercertain circumstances. The notes are senior unsecured obligations of the Operating Partnership and will rankequally in right of payment to all existing and future senior unsecured indebtedness and senior to any futuresubordinated indebtedness of the Operating Partnership. The notes will effectively rank junior in right ofpayment to all existing and future secured indebtedness of the Operating Partnership. The notes will bestructurally subordinated to all liabilities of the subsidiaries of the Operating Partnership.
9. Unsecured Line of Credit
On August 3, 2006, the Company modified its $605.0 million unsecured revolving credit facility (the“Unsecured Line of Credit”) by extending the maturity date from October 30, 2007 to August 3, 2010, with aprovision for a one-year extension at the option of the Company, subject to certain conditions, and by reducingthe per annum variable interest rate on outstanding balances from Eurodollar plus 0.65% to Eurodollar plus0.55% per annum. The Unsecured Line of Credit is a recourse obligation of the Company’s OperatingPartnership. Under the Unsecured Line of Credit, a facility fee equal to 15 basis points per annum is payable inquarterly installments. The interest rate and facility fee are subject to adjustment in the event of a change in theOperating Partnership’s unsecured debt ratings. The Unsecured Line of Credit involves a syndicate of lenders.The Unsecured Line of Credit contains a competitive bid option that allows banks that are part of the lenderconsortium to bid to make loan advances to the Company at a negotiated LIBOR-based rate. The Company hadan outstanding balance on the Unsecured Line of Credit of $225.0 million and $283.0 million at December 31,2006 and 2005, respectively, of which $225.0 million at December 31, 2006 and 2005 was collateralized by theCompany’s 599 Lexington Avenue property and therefore is included in Mortgage Notes Payable in theCompany’s Consolidated Balance Sheets. On February 12, 2007, the Company repaid the $225.0 million drawthat was collateralized by the Company’s 599 Lexington Avenue (See Note 22). The weighted-average balanceoutstanding was approximately $240.4 million and $107.3 million (including the $225.0 million collateralized by
110

BOSTON PROPERTIES, INC.
NOTES TO CONSOLIDATED FINANCIAL STATEMENTS—(Continued)
599 Lexington Avenue) during the year ended December 31, 2006 and 2005, respectively. The weighted-averageinterest rate on amounts outstanding was approximately 5.38% and 4.32% during the year ended December 31,2006 and 2005, respectively.
The terms of the Unsecured Line of Credit require that the Company maintain a number of customaryfinancial and other covenants on an ongoing basis, including: (1) a leverage ratio not to exceed 60%, however,the leverage ratio may increase to no greater than 65% provided that it is reduced back to 60% within 180 days,(2) a secured debt leverage ratio not to exceed 55%, (3) a fixed charge coverage ratio of at least 1.40, (4) anunsecured debt leverage ratio not to exceed 60%, however, the unsecured debt leverage ratio may increase to nogreater than 65% provided that it is reduced back to 60% within 180 days, (5) a minimum net worth requirement,(6) an unsecured debt interest coverage ratio of at least 1.75 and (7) limitations on permitted investments,development, partially owned entities, business outside of commercial real estate and commercial non-officeproperties. At December 31, 2006 and 2005, the Company was in compliance with each of these financial andother covenant requirements.
10. Commitments and Contingencies
General
In the normal course of business, the Company guarantees its performance of services or indemnifies thirdparties against its negligence.
The Company has letter of credit and performance obligations of approximately $25.8 million related tolender and development requirements.
The Company and its third-party joint venture partners have guaranteed the seller financing totaling $15.5million related to the acquisition of land by WP Project Developer LLC, the Land and Infrastructure Entity of theWisconsin Place joint venture entities. The Company and its third-party joint venture partners in the New YorkLand Venture have each agreed to guarantee approximately $11.8 million of the related mortgage loan.
Certain of the Company’s joint venture agreements include provisions whereby, at certain specified times,each partner has the right to initiate a purchase or sale of its interest in the joint ventures. Under these provisions,the Company is not compelled to purchase the interest of its outside joint venture partners.
Concentrations of Credit Risk
Management of the Company performs ongoing credit evaluations of tenants and may require tenants toprovide some form of credit support such as corporate guarantees and/or other financial guarantees. Although theCompany’s properties are geographically diverse and the tenants operate in a variety of industries, to the extentthe Company has a significant concentration of rental revenue from any single tenant, the inability of that tenantto make its lease payments could have an adverse effect on the Company.
Some potential losses are not covered by insurance.
The Company carries insurance coverage on its properties of types and in amounts and with deductibles thatit believes are in line with coverage customarily obtained by owners of similar properties. In response to theuncertainty in the insurance market following the terrorist attacks of September 11, 2001, the Federal TerrorismRisk Insurance Act, or TRIA, was enacted in November 2002 to require regulated insurers to make availablecoverage for certified acts of terrorism (as defined by the statute) through December 31, 2004, which date wasextended to December 31, 2005 by the United States Department of Treasury on June 18, 2004 and which datewas further extended to December 31, 2007 by the Terrorism Risk Insurance Extension Act of 2005 (the “TRIAExtension Act”). TRIA expires on December 31, 2007, and the Company cannot currently anticipate whether it
111

BOSTON PROPERTIES, INC.
NOTES TO CONSOLIDATED FINANCIAL STATEMENTS—(Continued)
will be extended. Effective as of March 1, 2007, the Company’s property insurance program per occurrencelimits were increased from $800 million to $900 million, including coverage for “certified” acts of terrorism byTRIA and coverage for “non-certified” acts of terrorism by TRIA up to $500 million per occurrence, and anadditional $400 million of coverage for “non-certified” acts of terrorism by TRIA on a per occurrence and annualaggregate basis. The Company also carries nuclear, biological, chemical and radiological terrorism insurancecoverage (“NBCR Coverage”) for “certified” acts of terrorism as defined by TRIA, which is provided by IXP,LLC as a direct insurer. Effective as of March 1, 2007, the Company extended the NBCR Coverage to March 1,2008, excluding the Company’s Value-Added Fund properties. Effective as of March 1, 2007, the per occurrencelimit for NBCR Coverage was increased from $800 million to $900 million. Under TRIA, after the payment ofthe required deductible and coinsurance the NBCR Coverage is backstopped by the Federal Government if theaggregate industry insured losses resulting from a certified act of terrorism exceed a “program trigger.” Underthe TRIA Extension Act (a) the program trigger is $5 million through March 31, 2006, $50 million from April 1,2006 through December 31, 2006 and $100 million from January 1, 2007 through December 31, 2007 and (b) thecoinsurance is 10% through December 31, 2006 and 15% through December 31, 2007. The Company may electto terminate the NBCR Coverage if there is a change in its portfolio or for any other reason. In the event TRIA isnot extended beyond December 31, 2007 (i) the NBCR coverage provided by IXP will terminate and (ii) theCompany will have some gaps in its coverage for acts of terrorism that would have constituted both “certified”and “non-certified” acts of terrorism had TRIA not expired and the Company may obtain the right to replace aportion of such coverage. The Company intends to continue to monitor the scope, nature and cost of availableterrorism insurance and maintain insurance in amounts and on terms that are commercially reasonable.
The Company also currently carries earthquake insurance on its properties located in areas known to besubject to earthquakes in an amount and subject to self-insurance that the Company believes are commerciallyreasonable. In addition, this insurance is subject to a deductible in the amount of 5% of the value of the affectedproperty. Specifically, the Company currently carries earthquake insurance which covers its San Francisco regionwith a $120 million per occurrence limit and a $120 million annual aggregate limit, $20 million of which isprovided by IXP, LLC, as a direct insurer. The amount of the Company’s earthquake insurance coverage may notbe sufficient to cover losses from earthquakes. The Company may discontinue earthquake insurance on some orall of its properties in the future if the premiums exceed the Company’s estimation of the value of the coverage.
In January 2002, the Company formed a wholly-owned taxable REIT subsidiary, IXP, Inc., to act as acaptive insurance company and be one of the elements of the Company’s overall insurance program. OnSeptember 27, 2006, IXP, Inc. was merged into IXP, LLC, a wholly owned subsidiary, and all insurance policiesissued by IXP, Inc. were cancelled and reissued by IXP, LLC. The term “IXP” refers to IXP, Inc. for the periodprior to September 27, 2006 and to IXP, LLC for the period on and subsequent to September 27, 2006. IXP actsas a direct insurer with respect to a portion of the Company’s earthquake insurance coverage for its Greater SanFrancisco properties and the Company’s NBCR Coverage for “certified acts of terrorism” under TRIA. Insofar asthe Company owns IXP, it is responsible for its liquidity and capital resources, and the accounts of IXP are partof the Company’s consolidated financial statements. In particular, if a loss occurs which is covered by theCompany’s NBCR Coverage but is less than the applicable program trigger under TRIA, IXP would beresponsible for the full amount of the loss without any backstop by the Federal Government. If the Companyexperiences a loss and IXP is required to pay under its insurance policy, the Company would ultimately recordthe loss to the extent of IXP’s required payment. Therefore, insurance coverage provided by IXP should not beconsidered as the equivalent of third-party insurance, but rather as a modified form of self-insurance.
The Company continues to monitor the state of the insurance market in general, and the scope and costs ofcoverage for acts of terrorism in particular, but the Company cannot anticipate what coverage will be availableon commercially reasonable terms in future policy years. There are other types of losses, such as from wars orthe presence of mold at the Company’s properties, for which the Company cannot obtain insurance at all or at areasonable cost. With respect to such losses and losses from acts of terrorism, earthquakes or other catastrophic
112
BOSTON PROPERTIES, INC.
NOTES TO CONSOLIDATED FINANCIAL STATEMENTS—(Continued)
events, if the Company experiences a loss that is uninsured or that exceeds policy limits, the Company could losethe capital invested in the damaged properties, as well as the anticipated future revenues from those properties.Depending on the specific circumstances of each affected property, it is possible that the Company could beliable for mortgage indebtedness or other obligations related to the property. Any such loss could materially andadversely affect the Company’s business and financial condition and results of operations.
Legal Matters
The Company is subject to various legal proceedings and claims that arise in the ordinary course ofbusiness. These matters are generally covered by insurance. Management believes that the final outcome of suchmatters will not have a material adverse effect on the financial position, results of operations or liquidity of theCompany.
State and Local Tax Matters
Because the Company is organized and qualifies as a REIT, it is generally not subject to federal incometaxes, but is subject to certain state and local taxes. In the normal course of business, certain entities throughwhich the Company owns real estate either have undergone, or are currently undergoing, tax audits. Although theCompany believes that it has substantial arguments in favor of its positions in the ongoing audits, in someinstances there is no controlling precedent or interpretive guidance on the specific point at issue. Collectively, taxdeficiency notices received to date from the jurisdictions conducting the ongoing audits have not been material.However, there can be no assurance that future audits will not occur with increased frequency or that the ultimateresult of such audits will not have a material adverse effect on the Company’s results of operations.
Environmental Matters
It is the Company’s policy to retain independent environmental consultants to conduct or update Phase Ienvironmental assessments (which generally do not involve invasive techniques such as soil or ground watersampling) and asbestos surveys in connection with the Company’s acquisition of properties. These pre-purchaseenvironmental assessments have not revealed environmental conditions that the Company believes will have amaterial adverse effect on its business, assets, financial condition, results of operations or liquidity, and theCompany is not otherwise aware of environmental conditions with respect to its properties that the Companybelieves would have such a material adverse effect. However, from time to time environmental conditions at theCompany’s properties have required and may in the future require environmental testing and/or regulatoryfilings, as well as remedial action.
In February 1999, the Company (through a joint venture) acquired from Exxon Corporation a property inMassachusetts that was formerly used as a petroleum bulk storage and distribution facility and was known by thestate regulatory authority to contain soil and groundwater contamination. The Company developed an office parkon the property. The Company engaged a specially licensed environmental consultant to oversee the managementof contaminated soil and groundwater that was disturbed in the course of construction. Under the propertyacquisition agreement, Exxon agreed to (1) bear the liability arising from releases or discharges of oil andhazardous substances which occurred at the site prior to the Company’s ownership, (2) continue monitoring and/or remediating such releases and discharges as necessary and appropriate to comply with applicablerequirements, and (3) indemnify the Company for certain losses arising from preexisting site conditions. Anyindemnity claim may be subject to various defenses, and there can be no assurance that the amounts paid underthe indemnity, if any, would be sufficient to cover the liabilities arising from any such releases and discharges.
Environmental investigations at two of the Company’s properties in Massachusetts have identifiedgroundwater contamination migrating from off-site source properties. In both cases the Company engaged aspecially licensed environmental consultant to perform the necessary investigations and assessments and toprepare submittals to the state regulatory authority, including Downgradient Property Status Opinions. The
113

BOSTON PROPERTIES, INC.
NOTES TO CONSOLIDATED FINANCIAL STATEMENTS—(Continued)
environmental consultant concluded that the properties qualify for Downgradient Property Status under the stateregulatory program, which eliminates certain deadlines for conducting response actions at a site. The Companyalso believes that these properties qualify for liability relief under certain statutory amendments regardingupgradient releases. Although the Company believes that the current or former owners of the upgradient sourceproperties may bear responsibility for some or all of the costs of addressing the identified groundwatercontamination, the Company will take necessary further response actions (if any are required). Other thanperiodic testing, no such additional response actions are anticipated at this time.
The Company owns a property in Massachusetts where historic groundwater contamination was identifiedprior to acquisition. The Company engaged a specially licensed environmental consultant to performinvestigations and to prepare necessary submittals to the state regulatory authority. The environmental consultanthas concluded that (1) certain identified groundwater contaminants are migrating to the subject property from anoff-site source property and (2) certain other detected contaminants are likely related to a historic release on thesubject property. The Company has filed a Downgradient Property Status Opinion (described above) with respectto contamination migrating from off-site and a Response Action Outcome (“RAO”) with respect to the identifiedhistoric release. The RAO indicates that regulatory closure has been achieved and that no further action isrequired at this time.
Some of the Company’s properties and certain properties owned by the Company’s affiliates are located inurban, industrial and other previously developed areas where fill or current or historical uses of the areas havecaused site contamination. Accordingly, it is sometimes necessary to institute special soil and/or groundwaterhandling procedures and/or include particular building design features in connection with development,construction and other property operations in order to achieve regulatory closure and/or ensure that contaminatedmaterials are addressed in an appropriate manner. In these situations it is the Company’s practice to investigatethe nature and extent of detected contamination and estimate the costs of required response actions and specialhandling procedures. The Company then uses this information as part of its decision-making process with respectto the acquisition and/or development of the property. The Company owns a parcel in Massachusetts, formerlyused as a quarry/asphalt batching facility, which the Company may develop in the future. Pre-purchase testingindicated that the site contains relatively low levels of certain contaminants. The Company has engaged aspecially licensed environmental consultant to monitor environmental conditions at the site and preparenecessary regulatory submittals based on the results of an environmental risk characterization. The Companyanticipates that additional response actions necessary to achieve regulatory closure (if any) will be performedprior to or in connection with future development activities. When appropriate, closure documentation will besubmitted for public review and comment pursuant to the state regulatory authority’s public information process.
The Company expects that resolution of the environmental matters relating to the above will not have amaterial impact on its business, assets, financial condition, results of operations or liquidity. However, theCompany cannot assure you that it has identified all environmental liabilities at its properties, that all necessaryremediation actions have been or will be undertaken at the Company’s properties or that the Company will beindemnified, in full or at all, in the event that such environmental liabilities arise.
Tax Protection Obligations
The Operating Partnership Agreement provides that, until June 23, 2007, the Operating Partnership may notsell or otherwise transfer three designated properties (or a property acquired pursuant to the disposition of adesignated property in a non-taxable transaction) in a taxable transaction without the prior written consent ofMr. Mortimer B. Zuckerman, Chairman of the Board of Directors, and Mr. Edward H. Linde, President and ChiefExecutive Officer. The Operating Partnership is not required to obtain their consent if each of them does not holdat least 30% of their original interests in the Operating Partnership, or if those properties are transferred in anon-taxable transaction.
114

BOSTON PROPERTIES, INC.
NOTES TO CONSOLIDATED FINANCIAL STATEMENTS—(Continued)
In connection with the acquisition or contribution of 24 properties, the Company entered into similaragreements for the benefit of the selling or contributing parties which specifically state that until specified datesranging from November 2007 to April 2016, or such time as the contributors do not hold at least a specifiedpercentage of the OP Units owned by such person following the contribution of the properties, the OperatingPartnership will not sell or otherwise transfer the properties in a taxable transaction. If the Company does sell ortransfer the properties in a taxable transaction, it would be liable to the contributors for contractual damages.
11. Minority Interests
Minority interests relate to the interest in the Operating Partnership not owned by the Company and interestsin property partnerships not wholly-owned by the Company. As of December 31, 2006, the minority interest inthe Operating Partnership consisted of 20,817,587 OP Units, 521,119 LTIP Units and 1,719,230 Series TwoPreferred Units (or 2,256,208 OP Units on an as converted basis) held by parties other than the Company.
The minority interests in property partnerships consist of the outside equity interests in ventures that areconsolidated with the financial results of the Company because the Company exercises control over the entitiesthat own the properties. The equity interests in these ventures that are not owned by the Company, totalingapproximately $12.5 million and $18.0 million at December 31, 2006 and December 31, 2005, respectively, areincluded in Minority Interests on the accompanying Consolidated Balance Sheets.
On May 31, 2006, the Company redeemed the outside members’ equity interests in the limited liabilitycompany that owns Citigroup Center for an aggregate redemption price of $100 million, with $50 million paid atclosing and $25 million to be paid on each of the first and second anniversaries of the closing or, if earlier, inconnection with a sale of Citigroup Center. In addition, the parties terminated the existing tax protectionagreement. The redemption was accounted for using the purchase method in accordance with FinancialAccounting Standards Board’s (“FASB”) Statements of Financial Accounting Standards (“SFAS”) No. 141“Business Combinations” (“SFAS No. 141”). The difference between the aggregate book value of the outsidemembers’ equity interests totaling approximately $14.9 million and the purchase price increased the recordedvalue of the property’s net assets. The unpaid redemption price was recorded at its fair value in Other Liabilitiesin the Company’s Consolidated Balance Sheets and totaled $47.3 million at December 31, 2006.
During the years ended December 31, 2006 and 2005, 1,982,105 and 381,000 Series Two Preferred Units ofthe Operating Partnership, respectively, were converted by the holders into 2,601,132 and 500,000 OP Units,respectively. In addition, the Company paid the accrued preferred distributions due to the holders of PreferredUnits that were converted.
During the years ended December 31, 2006 and 2005, 3,161,265 and 924,976 OP Units, respectively, werepresented by the holders for redemption and were redeemed by the Company in exchange for an equal number ofshares of Common Stock. The aggregate book value of the OP Units that were redeemed, as measured for eachOP Unit on the date of its redemption, was approximately $87.3 million and $22.7 million during the years endedDecember 31, 2006 and 2005, respectively. The difference between the aggregate book value and the purchaseprice of these OP Units was approximately $200.0 million and $37.3 million during the years endedDecember 31, 2006 and 2005, respectively, which increased the recorded value of the Company’s net assets.
The Preferred Units at December 31, 2006 consist solely of 1,719,230 Series Two Preferred Units, whichbear a preferred distribution equal to the greater of (1) the distribution which would have been paid in respect ofthe Series Two Preferred Unit had such Series Two Preferred Unit been converted into an OP Unit (includingboth regular and special distributions) or (2) an increasing rate, ranging from 5.00% to 7.00% per annum (7.00%for the years ended December 31, 2006, 2005 and 2004) on a liquidation preference of $50.00 per unit, and areconvertible into OP Units at a rate of $38.10 per Preferred Unit (1.312336 OP Units for each Preferred Unit).Distributions to holders of Preferred Units are recognized on a straight-line basis that approximates the effectiveinterest method.
115

BOSTON PROPERTIES, INC.
NOTES TO CONSOLIDATED FINANCIAL STATEMENTS—(Continued)
On December 15, 2006, Boston Properties, Inc., as general partner of the Operating Partnership, declared aspecial cash distribution on the OP Units and LTIP Units in the amount of $5.40 per unit which was paid onJanuary 30, 2007 to unitholders of record as of the close of business on December 30, 2006. The special cashdistribution was in addition to the regular quarterly distributions of $0.68, $0.68, $0.68 and $0.68 per unit whichwere declared by Boston Properties, Inc., as general partner of the Operating Partnership, during the year endedDecember 31, 2006. Holders of Series Two Preferred Units will participate in the $5.40 per unit special cashdistribution on an as-converted basis in connection with their regular May 2007 distribution payment as providedfor in the Operating Partnership’s partnership agreement. At December 31, 2006, the Company accruedapproximately $12.2 million related to the $5.40 per unit special cash distribution payable to holders of the SeriesTwo Preferred Units and allocated earnings to the Series Two Preferred Units of approximately $12.2 million,which amount has been reflected in Minority Interest in Operating Partnership within the ConsolidatedStatements of Operations for the year ended December 31, 2006.
On July 21, 2005, Boston Properties, Inc., as general partner of the Operating Partnership, declared a specialcash distribution on the OP Units and LTIP Units in the amount of $2.50 per unit which was paid on October 31,2005 to unitholders of record as of the close of business on September 30, 2005. The special cash distributionwas in addition to the regular quarterly distributions of $0.65, $0.68, $0.68 and $0.68 per unit which weredeclared by Boston Properties, Inc., as general partner of the Operating Partnership, during the year endedDecember 31, 2005. Holders of Series Two Preferred Units participated in the $2.50 per unit special cashdistribution on an as-converted basis in connection with their regular February 2006 distribution payment asprovided for in the Operating Partnership’s partnership agreement. At December 31, 2005, the Company accruedapproximately $12.1 million related to the $2.50 per unit special cash distribution payable to holders of the SeriesTwo Preferred Units and allocated earnings to the Series Two Preferred Units of approximately $12.1 million,which amount has been reflected in Minority Interest in Operating Partnership within the ConsolidatedStatements of Operations for the year ended December 31, 2005.
The Series Two Preferred Units may be converted into OP Units at the election of the holder thereof at anytime. A holder of an OP Unit may present such OP Unit to the Operating Partnership for redemption at any time(subject to restrictions agreed upon at the time of issuance of OP Units to particular holders that may restrict suchredemption right for a period of time, generally one year from issuance). Upon presentation of an OP Unit forredemption, the Operating Partnership must redeem such OP Unit for cash equal to the then value of a share ofcommon stock of the Company. In lieu of a cash redemption, the Company may elect to acquire such OP Unit forone share of Common Stock. The value of the OP Units (not owned by the Company and including LTIP Unitsassuming that all conditions have been met for the conversion thereof) and Series Two Preferred Units had suchunits been redeemed at December 31, 2006 was approximately $2.4 billion and $252.4 million, respectively,based on the closing price of the Company’s common stock of $111.88 per share.
12. Stockholders’ Equity
As of December 31, 2006, the Company had 117,503,542 shares of Common Stock outstanding.
On December 15, 2006, the Board of Directors of the Company declared a special cash dividend of $5.40per share of Common Stock which was paid on January 30, 2007 to shareholders of record as of the close ofbusiness on December 30, 2006. The special cash dividend was in addition to the regular quarterly dividends of$0.68, $0.68, $0.68 and $0.68 per share of Common Stock which were declared by the Company’s Board ofDirectors during the year ended December 31, 2006.
On July 21, 2005, the Board of Directors of the Company declared a special cash dividend of $2.50 pershare of Common Stock which was paid on October 31, 2005 to shareholders of record as of the close of businesson September 30, 2005. The special cash dividend is in addition to the regular quarterly dividends of $0.65,$0.68, $0.68 and $0.68 per share of Common Stock which were declared by the Company’s Board of Directorsduring the year ended December 31, 2005.
116

BOSTON PROPERTIES, INC.
NOTES TO CONSOLIDATED FINANCIAL STATEMENTS—(Continued)
During the years ended December 31, 2006 and 2005, the Company issued 3,161,265 and 924,976 shares ofits Common Stock, respectively, in connection with the redemption of an equal number of OP Units.
During the years ended December 31, 2006 and 2005, the Company issued 1,793,418 and 1,270,436 sharesof its Common Stock, respectively, upon the exercise of options to purchase Common Stock by certainemployees.
13. Future Minimum Rents
The Properties are leased to tenants under net operating leases with initial term expiration dates rangingfrom 2007 to 2029. The future minimum lease payments to be received (excluding operating expensereimbursements) by the Company as of December 31, 2006, under non-cancelable operating leases (includingleases for properties under development and excluding leases at 5 Times Square, which was categorized as “Heldfor Sale” at December 31, 2006 and was sold on February 15, 2007), which expire on various dates through2029, are as follows:
Years Ending December 31, (in thousands)
2007 . . . . . . . . . . . . . . . . . . . . . . . . . . . . . . . . . . . . . . . . . . . . . . . . . . . . . . . . . . . . . . . . . . $1,007,3552008 . . . . . . . . . . . . . . . . . . . . . . . . . . . . . . . . . . . . . . . . . . . . . . . . . . . . . . . . . . . . . . . . . . 985,1942009 . . . . . . . . . . . . . . . . . . . . . . . . . . . . . . . . . . . . . . . . . . . . . . . . . . . . . . . . . . . . . . . . . . 923,4582010 . . . . . . . . . . . . . . . . . . . . . . . . . . . . . . . . . . . . . . . . . . . . . . . . . . . . . . . . . . . . . . . . . . 849,3362011 . . . . . . . . . . . . . . . . . . . . . . . . . . . . . . . . . . . . . . . . . . . . . . . . . . . . . . . . . . . . . . . . . . 774,799Thereafter . . . . . . . . . . . . . . . . . . . . . . . . . . . . . . . . . . . . . . . . . . . . . . . . . . . . . . . . . . . . . . 3,869,223
No single tenant represented more than 10.0% of the Company’s total rental revenue for the years endedDecember 31, 2006, 2005 and 2004.
14. Segment Reporting
The Company’s segments are based on the Company’s method of internal reporting which classifies itsoperations by both geographic area and property type. The Company’s segments by geographic area are GreaterBoston, Greater Washington, D.C., Midtown Manhattan, Greater San Francisco and New Jersey. Segments byproperty type include: Class A Office, Office/Technical and Hotels.
Asset information by segment is not reported because the Company does not use this measure to assessperformance. Therefore, depreciation and amortization expense is not allocated among segments. Interest andother income, development and management services, general and administrative expenses, interest expense,depreciation and amortization expense, minority interests in property partnerships, income from unconsolidatedjoint ventures, minority interest in Operating Partnership, gains on sales of real estate and other assets (net ofminority interest), income from discontinued operations (net of minority interest), gains on sales of real estatefrom discontinued operations (net of minority interest) and cumulative effect of a change in accounting principle(net of minority interest) and losses from early extinguishments of debt are not included in Net Operating Incomeas the internal reporting addresses these items on a corporate level.
Net Operating Income is not a measure of operating results or cash flows from operating activities asmeasured by accounting principles generally accepted in the United States of America, and it is not indicative ofcash available to fund cash needs and should not be considered an alternative to cash flows as a measure of
117

BOSTON PROPERTIES, INC.
NOTES TO CONSOLIDATED FINANCIAL STATEMENTS—(Continued)
liquidity. All companies may not calculate Net Operating Income in the same manner. The Company considersNet Operating Income to be an appropriate supplemental measure to net income because it helps both investorsand management to understand the core operations of the Company’s properties.
Information by geographic area and property type (dollars in thousands):
For the year ended December 31, 2006:
GreaterBoston
GreaterWashington,
D.C.Midtown
Manhattan
GreaterSan
FranciscoNew
Jersey Total
Rental Revenue:Class A Office . . . . $309,760 $223,154 $515,713 $188,194 $64,781 $1,301,602Office/Technical . . 26,973 15,459 — — — 42,432Hotels . . . . . . . . . . . 76,990 — — — — 76,990
Total . . . . . . . . . . 413,723 238,613 515,713 188,194 64,781 1,421,024% of Grand Totals . . . 29.12% 16.79% 36.29% 13.24% 4.56% 100.0%Rental Expenses:
Class A Office . . . . 118,938 59,556 155,015 71,830 28,228 433,567Office/Technical . . 6,446 1,801 — — — 8,247Hotels . . . . . . . . . . . 55,538 — — — — 55,538
Total . . . . . . . . . . 180,922 61,357 155,015 71,830 28,228 497,352% of Grand Totals . . . 36.37% 12.34% 31.17% 14.44% 5.68% 100.0%
Net operatingincome . . . . . . . . $232,801 $177,256 $360,698 $116,364 $36,553 $ 923,672
% of Grand Totals . . . 25.20% 19.19% 39.05% 12.60% 3.96% 100.0%
For the year ended December 31, 2005:
GreaterBoston
GreaterWashington,
D.C.Midtown
Manhattan
GreaterSan
FranciscoNew
Jersey Total
Rental Revenue:Class A Office . . . . $296,003 $223,085 $531,481 $198,404 $66,502 $1,315,475Office/Technical . . 8,527 15,031 — — — 23,558Hotels . . . . . . . . . . . 69,277 — — — — 69,277
Total . . . . . . . . . . 373,807 238,116 531,481 198,404 66,502 1,408,310% of Grand Totals . . . 26.54% 16.91% 37.74% 14.09% 4.72% 100.00%Rental Expenses:
Class A Office . . . . 108,173 59,100 165,500 73,105 27,448 433,326Office/Technical . . 1,938 3,071 — — — 5,009Hotels . . . . . . . . . . . 51,689 — — — — 51,689
Total . . . . . . . . . . 161,800 62,171 165,500 73,105 27,448 490,024% of Grand Totals . . . 33.02% 12.69% 33.77% 14.92% 5.60% 100.00%
Net operatingincome . . . . . . . . $212,007 $175,945 $365,981 $125,299 $39,054 $ 918,286
% of Grand Totals . . . 23.09% 19.16% 39.85% 13.65% 4.25% 100.00%
118

BOSTON PROPERTIES, INC.
NOTES TO CONSOLIDATED FINANCIAL STATEMENTS—(Continued)
For the year ended December 31, 2004:
GreaterBoston
GreaterWashington,
D.C.Midtown
Manhattan
GreaterSan
FranciscoNew
Jersey Total
Rental Revenue:Class A Office . . . . $286,568 $240,644 $478,652 $191,422 $69,051 $1,266,337Office/Technical . . 8,525 14,144 — 134 — 22,803Hotels . . . . . . . . . . . 66,427 — — — — 66,427
Total . . . . . . . . . . 361,520 254,788 478,652 191,556 69,051 1,355,567% of Grand Totals . . . 26.67% 18.80% 35.31% 14.13% 5.09% 100.00%Rental Expenses:
Class A Office . . . . 98,480 66,505 147,127 71,616 27,587 411,315Office/Technical . . 1,997 2,979 — 36 — 5,012Hotels . . . . . . . . . . . 49,442 — — — — 49,442
Total . . . . . . . . . . 149,919 69,484 147,127 71,652 27,587 465,769% of Grand Totals . . . 32.19% 14.92% 31.59% 15.38% 5.92% 100.00%
Net operatingincome . . . . . . . . $211,601 $185,304 $331,525 $119,904 $41,464 $ 889,798
% of Grand Totals . . . 23.78% 20.83% 37.25% 13.48% 4.66% 100.00%
The following is a reconciliation of net operating income to net income available to common shareholders(in thousands):
Years ended December 31,
2006 2005 2004
Net operating income . . . . . . . . . . . . . . . . . . . . . . . . . . . . . . . . . . . . . . . . . . . . . $923,672 $918,286 $889,798Add:
Development and management services . . . . . . . . . . . . . . . . . . . . . . . . . . . . 19,825 17,310 20,440Interest and other . . . . . . . . . . . . . . . . . . . . . . . . . . . . . . . . . . . . . . . . . . . . . . 36,737 12,015 10,339Minority interests in property partnerships . . . . . . . . . . . . . . . . . . . . . . . . . . 2,013 6,017 4,685Income from unconsolidated joint ventures . . . . . . . . . . . . . . . . . . . . . . . . . . 24,507 4,829 3,380Gains on sales of real estate and other assets, net of minority interest . . . . . 606,394 151,884 8,149Gains on sales of real estate from discontinued operations, net of minority
interest . . . . . . . . . . . . . . . . . . . . . . . . . . . . . . . . . . . . . . . . . . . . . . . . . . . . — 47,656 27,338Income from discontinued operations, net of minority interest . . . . . . . . . . . — 1,908 3,344
Less:General and administrative . . . . . . . . . . . . . . . . . . . . . . . . . . . . . . . . . . . . . . 59,375 55,471 53,636Interest expense . . . . . . . . . . . . . . . . . . . . . . . . . . . . . . . . . . . . . . . . . . . . . . . 298,260 308,091 306,170Depreciation and amortization . . . . . . . . . . . . . . . . . . . . . . . . . . . . . . . . . . . . 276,759 266,829 249,649Losses from early extinguishments of debt . . . . . . . . . . . . . . . . . . . . . . . . . . 32,143 12,896 6,258Minority interest in Operating Partnership . . . . . . . . . . . . . . . . . . . . . . . . . . 72,976 74,103 67,743Cumulative effect of a change in accounting principle, net of minority
interest . . . . . . . . . . . . . . . . . . . . . . . . . . . . . . . . . . . . . . . . . . . . . . . . . . . . — 4,223 —
Net income available to common shareholders . . . . . . . . . . . . . . . . . . . . . . . . . $873,635 $438,292 $284,017
119
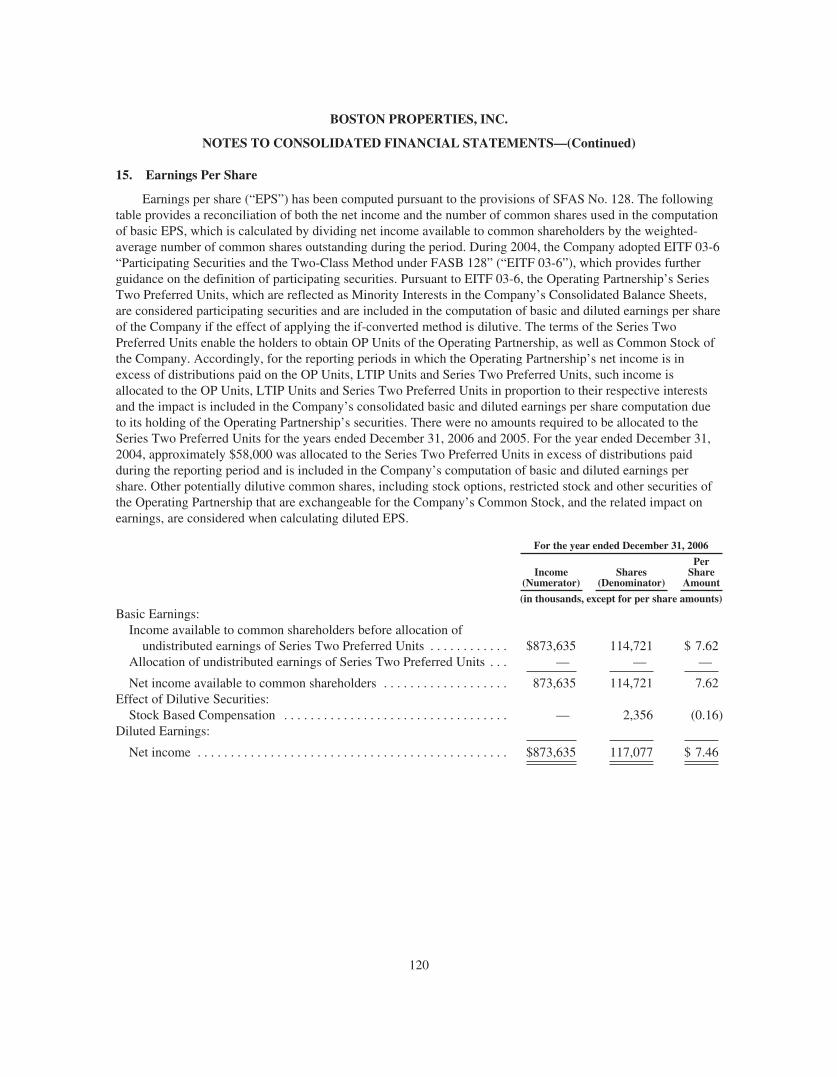
BOSTON PROPERTIES, INC.
NOTES TO CONSOLIDATED FINANCIAL STATEMENTS—(Continued)
15. Earnings Per Share
Earnings per share (“EPS”) has been computed pursuant to the provisions of SFAS No. 128. The followingtable provides a reconciliation of both the net income and the number of common shares used in the computationof basic EPS, which is calculated by dividing net income available to common shareholders by the weighted-average number of common shares outstanding during the period. During 2004, the Company adopted EITF 03-6“Participating Securities and the Two-Class Method under FASB 128” (“EITF 03-6”), which provides furtherguidance on the definition of participating securities. Pursuant to EITF 03-6, the Operating Partnership’s SeriesTwo Preferred Units, which are reflected as Minority Interests in the Company’s Consolidated Balance Sheets,are considered participating securities and are included in the computation of basic and diluted earnings per shareof the Company if the effect of applying the if-converted method is dilutive. The terms of the Series TwoPreferred Units enable the holders to obtain OP Units of the Operating Partnership, as well as Common Stock ofthe Company. Accordingly, for the reporting periods in which the Operating Partnership’s net income is inexcess of distributions paid on the OP Units, LTIP Units and Series Two Preferred Units, such income isallocated to the OP Units, LTIP Units and Series Two Preferred Units in proportion to their respective interestsand the impact is included in the Company’s consolidated basic and diluted earnings per share computation dueto its holding of the Operating Partnership’s securities. There were no amounts required to be allocated to theSeries Two Preferred Units for the years ended December 31, 2006 and 2005. For the year ended December 31,2004, approximately $58,000 was allocated to the Series Two Preferred Units in excess of distributions paidduring the reporting period and is included in the Company’s computation of basic and diluted earnings pershare. Other potentially dilutive common shares, including stock options, restricted stock and other securities ofthe Operating Partnership that are exchangeable for the Company’s Common Stock, and the related impact onearnings, are considered when calculating diluted EPS.
For the year ended December 31, 2006
Income(Numerator)
Shares(Denominator)
PerShare
Amount
(in thousands, except for per share amounts)
Basic Earnings:Income available to common shareholders before allocation of
undistributed earnings of Series Two Preferred Units . . . . . . . . . . . . $873,635 114,721 $ 7.62Allocation of undistributed earnings of Series Two Preferred Units . . . — — —
Net income available to common shareholders . . . . . . . . . . . . . . . . . . . 873,635 114,721 7.62Effect of Dilutive Securities:
Stock Based Compensation . . . . . . . . . . . . . . . . . . . . . . . . . . . . . . . . . . — 2,356 (0.16)Diluted Earnings:
Net income . . . . . . . . . . . . . . . . . . . . . . . . . . . . . . . . . . . . . . . . . . . . . . . $873,635 117,077 $ 7.46
120

BOSTON PROPERTIES, INC.
NOTES TO CONSOLIDATED FINANCIAL STATEMENTS—(Continued)
For the year ended December 31, 2005
Income(Numerator)
Shares(Denominator)
Per ShareAmount
(in thousands, except for per share amounts)
Basic Earnings:Income available to common shareholders before discontinued
operations, cumulative effect of a change in accounting principleand allocation of undistributed earnings of Series Two PreferredUnits . . . . . . . . . . . . . . . . . . . . . . . . . . . . . . . . . . . . . . . . . . . . . . . . $392,951 111,274 $ 3.53
Discontinued operations, net of minority interest . . . . . . . . . . . . . . . 49,564 — 0.45Cumulative effect of a change in accounting principle, net of
minority interest . . . . . . . . . . . . . . . . . . . . . . . . . . . . . . . . . . . . . . . (4,223) — (0.04)Allocation of undistributed earnings of Series Two Preferred
Units . . . . . . . . . . . . . . . . . . . . . . . . . . . . . . . . . . . . . . . . . . . . . . . . — — —
Net income available to common shareholders . . . . . . . . . . . . . . . . . 438,292 111,274 3.94Effect of Dilutive Securities:
Stock Based Compensation . . . . . . . . . . . . . . . . . . . . . . . . . . . . . . . . — 2,285 (0.08)Diluted Earnings:
Net income . . . . . . . . . . . . . . . . . . . . . . . . . . . . . . . . . . . . . . . . . . . . . $438,292 113,559 $ 3.86
For the year ended December 31, 2004
Income(Numerator)
Shares(Denominator)
Per ShareAmount
(in thousands, except for per share amounts)
Basic Earnings:Income available to common shareholders before discontinued
operations and allocation of undistributed earnings of Series TwoPreferred Units . . . . . . . . . . . . . . . . . . . . . . . . . . . . . . . . . . . . . . . . $253,335 106,458 $ 2.38
Discontinued operations, net of minority interest . . . . . . . . . . . . . . . 30,682 — 0.29Allocation of undistributed earnings of Series Two Preferred
Units . . . . . . . . . . . . . . . . . . . . . . . . . . . . . . . . . . . . . . . . . . . . . . . . (58) — —
Net income available to common shareholders . . . . . . . . . . . . . . . . . 283,959 106,458 2.67Effect of Dilutive Securities:
Stock Based Compensation . . . . . . . . . . . . . . . . . . . . . . . . . . . . . . . . — 2,304 (0.06)Diluted Earnings:
Net income . . . . . . . . . . . . . . . . . . . . . . . . . . . . . . . . . . . . . . . . . . . . . $283,959 108,762 $ 2.61
16. Employee Benefit PlanEffective January 1, 1985, the predecessor of the Company adopted a 401(k) Savings Plan (the “Plan”) for
its employees. Under the Plan, as amended, employees, as defined, are eligible to participate in the Plan afterthey have completed three months of service. Upon formation, the Company adopted the Plan and the terms ofthe Plan.
Effective January 1, 2000, the Company amended the Plan by increasing the Company’s matchingcontribution to 200% of the first 3% from 200% of the first 2% of participant’s eligible earnings contributed(utilizing earnings that are not in excess of an amount established by the IRS ($220,000 in 2006 and $225,000 in2007), indexed for inflation) and by eliminating the vesting requirement. The Company’s aggregate matchingcontribution for the years ended December 31, 2006, 2005 and 2004 was $2.2 million, $2.1 million and $2.2million, respectively.
121

BOSTON PROPERTIES, INC.
NOTES TO CONSOLIDATED FINANCIAL STATEMENTS—(Continued)
Effective January 1, 2001, the Company amended the Plan to provide a supplemental retirement contributionto employees who have at least ten years of service on January 1, 2001, and who are 40 years of age or older as ofJanuary 1, 2001. The maximum supplemental retirement contribution will not exceed the annual limit oncontributions established by the Internal Revenue Service. The Company will record an annual supplementalretirement credit for the benefit of each participant. The Company’s supplemental retirement contribution and creditfor the years ended December 31, 2006, 2005 and 2004 was $191,000, $189,000 and $167,000, respectively.
The Company also maintains a deferred compensation plan that is designed to allow officers of theCompany to defer a portion of their current income on a pre-tax basis and receive a tax-deferred return on thesedeferrals. The Company’s obligation under the plan is that of an unsecured promise to pay the deferredcompensation to the plan participants in the future. At December 31, 2006 and 2005, the Company has fundedapproximately $6.9 million and $4.8 million, respectively, into a separate account, which is not restricted as to itsuse. The Company’s liability under the plan is equal to the total amount of compensation deferred by the planparticipants and earnings on the deferred compensation pursuant to investments elected by the plan participants.The Company’s liability as of December 31, 2006 and 2005 was $6.6 million and $4.8 million, respectively,which are included in the accompanying Consolidated Balance Sheets.
17. Stock Option and Incentive Plan and Stock Purchase Plan
The Company has established a stock option and incentive plan for the purpose of attracting and retainingqualified employees and rewarding them for superior performance in achieving the Company’s business goalsand enhancing stockholder value.
Under the plan, the number of shares of Common Stock available for issuance is 14,699,162 shares plus asof the first day of each calendar quarter after January 1, 2000, 9.5% of any net increase since the first day of thepreceding calendar quarter in the total number of shares of Common Stock outstanding, on a fully convertedbasis (excluding Preferred Stock). At December 31, 2006, the number of shares available for issuance under theplan was 4,081,261, of which a maximum of 1,073,541 shares may be granted as awards other than stockoptions.
Options granted under the plan became exercisable over a two-, three- or five-year period and have terms often years, as determined at the time of the grant. All options were granted at the fair market value of theCompany’s Common Stock at the dates of grant. As of January 17, 2005, all outstanding options had becomefully vested and exercisable.
The Company issued 9,182, 12,317 and 32,585 shares of restricted stock and 147,845, 211,408 and 166,430LTIP Units under the plan during the years ended December 31, 2006, 2005 and 2004, respectively. The sharesof restricted stock were valued at approximately $0.8 million ($89.03 per share weighted-average), $0.7 million($57.99 per share weighted-average) and $1.6 million ($49.88 per share weighted-average) for the years endedDecember 31, 2006, 2005 and 2004, respectively. LTIP Units issued during 2006 and 2005 were valued using anoption pricing model in accordance with the provisions of SFAS No. 123R. LTIP Units issued during the yearsended December 31, 2006 and 2005 were valued at approximately $11.2 million and $10.5 million, respectively.The weighted-average per unit fair value of LTIP Unit grants in 2006 and 2005 was $75.64 and $49.59,respectively. The per unit fair value of each LTIP Unit granted in 2006 and 2005 was estimated on the date ofgrant using the following assumptions; an expected life of 6.5 and 8 years, a risk-free interest rate of 4.97% and3.96% and an expected price volatility of 17.84% and 20.00%, respectively. For the year ended December 31,2004 LTIP Units were valued at approximately $8.3 million ($49.82 per share weighted-average). An LTIP Unitis generally the economic equivalent of a share of restricted stock in the Company. The aggregate value of theLTIP Units is included in Minority Interests in the Consolidated Balance Sheets. The restricted stock and LTIPUnits granted to employees between January 1, 2004 and November 21, 2006 vest over a five-year term. Grantsof restricted stock and LTIP Units made on and after November 22, 2006 vest in four equal annual installments.Restricted stock and LTIP Units are measured at fair value on the date of grant based on the number of shares or
122

BOSTON PROPERTIES, INC.
NOTES TO CONSOLIDATED FINANCIAL STATEMENTS—(Continued)
units granted, as adjusted for forfeitures and the price of the Company’s Common Stock on the date of grant asquoted on the New York Stock Exchange. Such value is recognized as an expense ratably over the correspondingemployee service period. Dividends paid on both vested and unvested shares of restricted stock are chargeddirectly to Earnings in Excess of Dividends in the Consolidated Balance Sheets. Stock-based compensationexpense associated with restricted stock and LTIP Units was approximately $7.7 million, $6.4 million and $4.0million for the years ended December 31, 2006, 2005 and 2004, respectively. In addition, in accordance with themodified prospective application transition provisions of SFAS No. 123R, the Company has recognizedcompensation expense of approximately $50,000 relating to its unvested stock options for the year endedDecember 31, 2005. At December 31, 2006, there was $19.3 million of unrecognized compensation cost relatedto unvested restricted stock and LTIP Units that is expected to be recognized over a weighted-average period ofapproximately 3.2 years.
In connection with the declaration of the special cash dividends of $5.40 per share of Common Stock paidon January 30, 2007 to shareholders of record on December 29, 2006 and $2.50 per share of Common Stock paidon October 31, 2005 to shareholders of record on September 30, 2005, the Company’s Board of Directorsapproved adjustments to all its outstanding stock option awards that were intended to ensure that its employees,directors and other persons who held such stock options were not disadvantaged by the special cash dividend.The exercise prices and number of all outstanding options were adjusted as of the close of business on the lasttrading day prior to the related “ex-dividend” date such that each option had the same fair value to the holderbefore and after giving effect to the payment of the special cash dividend. Accordingly, pursuant to theprovisions of SFAS No. 123R, no compensation cost has been recognized in the Consolidated Statements ofOperations in connection with such adjustments. As a result, effective as of the close of business onDecember 26, 2006, 2,655,275 outstanding stock options with a weighted-average exercise price of $39.37 wereadjusted to 2,788,634 outstanding options with a weighted-average exercise price of $37.49, and effective as ofthe close of business on September 27, 2005, 4,325,656 outstanding stock options with a weighted-averageexercise price of $38.96 were adjusted to 4,481,864 outstanding options with a weighted-average exercise priceof $37.61. There were no other adjustments to the terms of the outstanding stock option awards.
A summary of the status of the Company’s stock options as of December 31, 2006, 2005 and 2004 andchanges during the years ended December 31, 2006, 2005 and 2004 are presented below:
Shares
WeightedAverageExercise
Price
Outstanding at December 31, 2003 . . . . . . . . . . . . . . . . . . . . . . . . . . . . . . . . . 9,439,680 $36.08Granted . . . . . . . . . . . . . . . . . . . . . . . . . . . . . . . . . . . . . . . . . . . . . . . . . . . . . . . — —Exercised . . . . . . . . . . . . . . . . . . . . . . . . . . . . . . . . . . . . . . . . . . . . . . . . . . . . . . (3,814,274) $33.14Canceled . . . . . . . . . . . . . . . . . . . . . . . . . . . . . . . . . . . . . . . . . . . . . . . . . . . . . . (25,532) $37.26
Outstanding at December 31, 2004 . . . . . . . . . . . . . . . . . . . . . . . . . . . . . . . . . 5,599,874 $38.08Granted . . . . . . . . . . . . . . . . . . . . . . . . . . . . . . . . . . . . . . . . . . . . . . . . . . . . . . . — —Exercised . . . . . . . . . . . . . . . . . . . . . . . . . . . . . . . . . . . . . . . . . . . . . . . . . . . . . . (1,270,436) $35.06Canceled . . . . . . . . . . . . . . . . . . . . . . . . . . . . . . . . . . . . . . . . . . . . . . . . . . . . . . (34,158) $35.78Special Dividend Adjustment . . . . . . . . . . . . . . . . . . . . . . . . . . . . . . . . . . . . . . 156,208 $37.61
Outstanding at December 31, 2005 . . . . . . . . . . . . . . . . . . . . . . . . . . . . . . . . . 4,451,488 $37.63Granted . . . . . . . . . . . . . . . . . . . . . . . . . . . . . . . . . . . . . . . . . . . . . . . . . . . . . . . — —Exercised . . . . . . . . . . . . . . . . . . . . . . . . . . . . . . . . . . . . . . . . . . . . . . . . . . . . . . (1,793,418) $35.05Canceled . . . . . . . . . . . . . . . . . . . . . . . . . . . . . . . . . . . . . . . . . . . . . . . . . . . . . . (2,795) $28.31Special Dividend Adjustment . . . . . . . . . . . . . . . . . . . . . . . . . . . . . . . . . . . . . . 133,359 $37.49
Outstanding at December 31, 2006 . . . . . . . . . . . . . . . . . . . . . . . . . . . . . . . . . 2,788,634 $37.49
123

BOSTON PROPERTIES, INC.
NOTES TO CONSOLIDATED FINANCIAL STATEMENTS—(Continued)
The following table summarizes information about stock options outstanding at December 31, 2006:
Options Outstanding Options Exercisable
Range of ExercisePrices
NumberOutstanding at
12/31/06
Weighted-AverageRemaining
Contractual LifeWeighted-Average
Exercise PriceNumber Exercisable
at 12/31/06Weighted-Average
Exercise Price
$22.98-$34.65 663,936 4.8 Years $34.24 663,936 $34.24$35.91-$38.72 2,124,698 4.1 Years $38.50 2,124,698 $38.50
The total intrinsic value of the outstanding and exercisable stock options as of December 31, 2006 wasapproximately $207.4 million. In addition, the Company had 4,451,488 and 5,196,166 options exercisable atweighted-average exercise prices of $37.63 and $38.11 at December 31, 2005 and 2004, respectively.
The Company adopted the 1999 Non-Qualified Employee Stock Purchase Plan (the “Stock Purchase Plan”)to encourage the ownership of Common Stock by eligible employees. The Stock Purchase Plan became effectiveon January 1, 1999 with an aggregate maximum of 250,000 shares of Common Stock available for issuance. TheStock Purchase Plan provides for eligible employees to purchase on the business day immediately following theend of the biannual purchase periods (i.e., January 1-June 30 and July 1-December 31) shares of Common Stockat a purchase price equal to 85% of the average closing prices of the Common Stock during the last ten businessdays of the purchase period. The Company issued 7,633, 7,492 and 11,125 shares with the weighted averagepurchase price equal to $69.02 per share, $56.56 per share and $41.54 per share under the Stock Purchase Planduring the years ended December 31, 2006, 2005 and 2004, respectively.
Effective January 1, 2005, the Company adopted the fair value recognition provisions of SFAS No. 123, asamended by SFAS No. 148. The Company’s share of compensation cost under SFAS No. 123, as amended bySFAS No. 148, for the stock performance-based plan would have been $1.6 million for the year endedDecember 31, 2004. Had compensation cost for the Company’s grants for stock-based compensation plans beendetermined consistent with SFAS No. 123, as amended by SFAS No. 148, the Company’s net income, and netincome per common share for the year ended December 31, 2004 would approximate the pro forma amountsbelow:
2004
Net income (in thousands) . . . . . . . . . . . . . . . . . . . . . . . . . . . . . . . . . . . . . . . . . . . . . . . . . . . . . . . . . . . . $282,460Net income per common share—basic . . . . . . . . . . . . . . . . . . . . . . . . . . . . . . . . . . . . . . . . . . . . . . . . . . $ 2.65Net income per common share— diluted . . . . . . . . . . . . . . . . . . . . . . . . . . . . . . . . . . . . . . . . . . . . . . . . . $ 2.60
18. Selected Interim Financial Information (unaudited)
The tables below reflect the Company’s selected quarterly information for the years ended December 31,2006 and 2005. Certain 2005 amounts have been reclassified to conform to the current presentation ofdiscontinued operations.
2006 Quarter Ended
March 31, June 30, September 30, December 31,
(in thousands, except for per share amounts)Total revenue . . . . . . . . . . . . . . . . . . . . . . . . . . . . . . . . . . . . . . . . . . . . $356,104 $370,349 $372,460 $378,673Income before minority interest in Operating Partnership . . . . . . . . . . $ 77,766 $ 56,187 $109,101 $ 97,163Net income available to common shareholders . . . . . . . . . . . . . . . . . . $ 67,737 $625,731 $107,962 $ 71,655Income available to common shareholders per share—basic . . . . . . . . $ 0.60 $ 5.33 $ 0.93 $ 0.61Income available to common shareholders per share—diluted . . . . . . $ 0.59 $ 5.23 $ 0.91 $ 0.60
124

BOSTON PROPERTIES, INC.
NOTES TO CONSOLIDATED FINANCIAL STATEMENTS—(Continued)
2005 Quarter Ended
March 31, June 30, September 30, December 31,
(in thousands, except for per share amounts)Total revenue . . . . . . . . . . . . . . . . . . . . . . . . . . . . . . . . . . . . . . . . . . . . $354,273 $357,935 $359,094 $366,333Income before minority interest in Operating Partnership . . . . . . . . . . $ 76,004 $ 68,897 $ 83,679 $ 86,590Net income available to common shareholders . . . . . . . . . . . . . . . . . . $ 61,242 $165,490 $ 57,551 $154,063Income available to common shareholders per share—basic . . . . . . . . $ 0.56 $ 1.46 $ 0.51 $ 1.35Income available to common shareholders per share—diluted . . . . . . $ 0.55 $ 1.43 $ 0.50 $ 1.32
19. Held for Sale/Discontinued Operations
Effective January 1, 2002, the Company adopted the provisions of SFAS No. 144, “Accounting for theImpairment or Disposal of Long-Lived Assets.” SFAS No. 144 requires that long-lived assets that are to bedisposed of by sale be measured at the lesser of (1) book value or (2) fair value less cost to sell. In addition, itrequires that one accounting model be used for long-lived assets to be disposed of by sale and broadens thepresentation of discontinued operations to include more disposal transactions.
During the year ended December 31, 2006, the Company sold 280 Park Avenue, a Class A office propertytotaling approximately 1,179,000 net rentable square feet located in midtown Manhattan, as discussed in Note 3.On November 17, 2006, the Company executed a binding agreement for the sale of the long-term leaseholdinterest in 5 Times Square in New York City and related credits, for approximately $1.28 billion in cash. 5 TimesSquare is a fully-leased Class A office tower that contains approximately 1,101,779 net rentable square feet. OnFebruary 15, 2007, the Company completed the sale of 5 Times Square (See Note 22). At December 31, 2006,the Company had categorized 5 Times Square as “held for sale” in its Consolidated Balance Sheets. Thefollowing table reflects the assets and liabilities of 5 Times Square at December 31, 2006:
5 Times Square Balance Sheet December 31, 2006
Total real estate, net . . . . . . . . . . . . . . . . . . . . . . . . . . . . . . . . . . . . . . . . . . . $433,492Accrued rental income . . . . . . . . . . . . . . . . . . . . . . . . . . . . . . . . . . . . . . . . . 50,527Deferred charges, net . . . . . . . . . . . . . . . . . . . . . . . . . . . . . . . . . . . . . . . . . . 29,947Other assets . . . . . . . . . . . . . . . . . . . . . . . . . . . . . . . . . . . . . . . . . . . . . . . . . 4,393
Total assets . . . . . . . . . . . . . . . . . . . . . . . . . . . . . . . . . . . . . . . . . . . . . $518,359
Other liabilities . . . . . . . . . . . . . . . . . . . . . . . . . . . . . . . . . . . . . . . . . . . . . . $ 3,007Equity . . . . . . . . . . . . . . . . . . . . . . . . . . . . . . . . . . . . . . . . . . . . . . . . . . . . . 515,352
Total liabilities and equity . . . . . . . . . . . . . . . . . . . . . . . . . . . . . . . . . . $518,359
During the year ended December 31, 2005, the Company sold the following operating properties:
• Old Federal Reserve, a Class A office property totaling approximately 150,000 net rentable square feetlocated in San Francisco, California;
• 100 East Pratt Street, a Class A office property totaling approximately 639,000 net rentable square feetlocated in Baltimore, Maryland;
• Riverfront Plaza, a Class A office property totaling approximately 910,000 net rentable square feetlocated in Richmond, Virginia;
• Residence Inn by Marriott, a 221-room extended-stay hotel property located in Cambridge,Massachusetts;
125
BOSTON PROPERTIES, INC.
NOTES TO CONSOLIDATED FINANCIAL STATEMENTS—(Continued)
• 40-46 Harvard Street, an industrial property totaling approximately 152,000 net rentable square feetlocated in Westwood, Massachusetts; and
• Embarcadero Center West Tower, a Class A office property totaling approximately 475,000 net rentablesquare feet located in San Francisco, California.
During the year ended December 31, 2004, the Company sold the following operating properties:
• 430 Rozzi Place, an industrial property totaling 20,000 net rentable square feet located in South SanFrancisco, California;
• Hilltop Office Center, a complex of nine office/technical properties totaling approximately 143,000 netrentable square feet located in South San Francisco, California;
• Sugarland Business Park—Building Two, an office/technical property totaling approximately 59,000 netrentable square feet located in Herndon, Virginia;
• Decoverly Two, Three, Six and Seven, consisting of Two Class A office properties totalingapproximately 155,000 net rentable square feet and two land parcels, one of which is subject to a groundlease, located in Rockville, Maryland;
• The Arboretum, a Class A office property totaling approximately 96,000 net rentable square feet locatedin Reston, Virginia;
• 38 Cabot Boulevard, an industrial property totaling approximately 161,000 net rentable square feetlocated in Langhorne, Pennsylvania;
• Sugarland Business Park—Building One, an office/technical property totaling approximately 52,000 netrentable square feet located in Herndon, Virginia;
• 204 Second Avenue, a Class A office property totaling approximately 41,000 net rentable square feetlocated in Waltham, Massachusetts; and
• 560 Forbes Boulevard, an industrial property totaling approximately 40,000 net rentable square feetlocated in South San Francisco, California.
Due to the Company’s continuing involvement in the management, for a fee, of 280 Park Avenue and 5Times Square through agreements with the buyers and other financial obligations to the buyers as discussed inNote 3, 280 Park Avenue and 5 Times Square have not been categorized as discontinued operations in theaccompanying Consolidated Statements of Operations. Due to the Company’s continuing involvement in themanagement, for a fee, of the 100 East Pratt Street, Riverfront Plaza, Embarcadero Center West Tower andHilltop Office Center properties through agreements with the buyers which were entered into at closing, theseproperties are not categorized as discontinued operations in the accompanying Consolidated Statements ofOperations. As a result, the gains on sales related to these properties have been reflected under the caption “Gainson sales of real estate and other assets, net of minority interest,” in the Consolidated Statements of Operations.The Company has presented the other properties listed above as discontinued operations in its ConsolidatedStatements of Operations for the years ended December 31, 2005 and 2004, as applicable.
126

BOSTON PROPERTIES, INC.
NOTES TO CONSOLIDATED FINANCIAL STATEMENTS—(Continued)
There were no properties categorized as discontinued operations for the year ended December 31, 2006. Thefollowing table summarizes income from discontinued operations (net of minority interests) and the relatedrealized gains on sales of real estate from discontinued operations (net of minority interests) for the years endedDecember 31, 2006, 2005 and 2004:
For the Year Ended December 31,
2006 2005 2004
(in thousands)
Total revenue . . . . . . . . . . . . . . . . . . . . . . . . . . . . . . . . . . . . . . . . . . . . . . . . . . . $— $ 9,400 $17,379Operating expenses . . . . . . . . . . . . . . . . . . . . . . . . . . . . . . . . . . . . . . . . . . . . . . . — (6,309) (9,849)Interest Expense . . . . . . . . . . . . . . . . . . . . . . . . . . . . . . . . . . . . . . . . . . . . . . . . . — — —Depreciation and Amortization . . . . . . . . . . . . . . . . . . . . . . . . . . . . . . . . . . . . . — (812) (3,292)Minority interest in property partnership . . . . . . . . . . . . . . . . . . . . . . . . . . . . . . — — (208)Minority interest in Operating Partnership . . . . . . . . . . . . . . . . . . . . . . . . . . . . . — (371) (686)
Income from discontinued operations (net of minority interests) . . . . . . . . . . . $— $ 1,908 $ 3,344
Realized gain on sale of real estate . . . . . . . . . . . . . . . . . . . . . . . . . . . . . . . . . . $— $57,082 $36,970Minority interest in property partnership . . . . . . . . . . . . . . . . . . . . . . . . . . . . . . — — (3,996)Minority interest in Operating Partnership . . . . . . . . . . . . . . . . . . . . . . . . . . . . . — (9,426) (5,636)
Realized gains on sales of real estate (net of minority interests) . . . . . . . . . . . . $— $47,656 $27,338
The Company’s application of SFAS No. 144 results in the presentation of the net operating results of thesequalifying properties sold during 2005 and 2004, as income from discontinued operations for all periodspresented. In addition, SFAS No. 144 results in the gains on sale of these qualifying properties totalingapproximately $47.7 million (net of minority interests share of $9.4 million) and $27.3 million (net of minorityinterests share of $9.6 million) to be reflected as gains on sales of real estate from discontinued operations in theaccompanying Consolidated Statements of Operations for the years ended December 31, 2005 and 2004,respectively. The application of SFAS No. 144 does not have an impact on net income available to commonshareholders. SFAS No. 144 only impacts the presentation of these properties within the Consolidated Statementsof Operations.
20. Newly Issued Accounting Standards
In February 2006, the FASB issued SFAS No. 155, “Accounting for Certain Hybrid Financial Instruments—an Amendment of FASB Statements No. 133 and 140” (“SFAS No. 155”). The purpose of SFAS No. 155 is tosimplify the accounting for certain hybrid financial instruments by permitting fair value re-measurement for anyhybrid financial instrument that contains an embedded derivative that otherwise would require bifurcation. SFASNo. 155 is effective for all financial instruments acquired or issued after the beginning of an entity’s first fiscalyear that begins after September 15, 2006. The Company does not expect the adoption of SFAS No. 155 to havea material impact on the Company’s cash flows, results of operations, financial position or liquidity.
In March 2006, the FASB issued SFAS No. 156, “Accounting for Servicing of Financial Assets—anAmendment of FASB Statement No. 140” (“SFAS No. 156”). SFAS No. 156 requires recognition of a servicingasset or a servicing liability each time an entity undertakes an obligation to service a financial asset by enteringinto a servicing contract. SFAS No. 156 also requires that all separately recognized servicing assets and servicingliabilities be initially measured at fair value and subsequently measured at fair value at each reporting date. SFASNo. 156 is effective as of the beginning of an entity’s first fiscal year that begins after September 15, 2006. TheCompany does not expect the adoption of SFAS No. 156 to have a material impact on the Company’s cash flows,results of operations, financial position or liquidity.
127

BOSTON PROPERTIES, INC.
NOTES TO CONSOLIDATED FINANCIAL STATEMENTS—(Continued)
In June 2006, the FASB issued Interpretation No. 48, “Accounting for Uncertainty in Income Taxes, anInterpretation of FASB Statement No. 109” (“FIN No. 48”). FIN No. 48 clarifies the accounting for uncertaintyin income taxes recognized in a company’s financial statements and prescribes a recognition threshold andmeasurement attribute for the financial statement recognition and measurement of a tax position taken orexpected to be taken in a tax return. FIN No. 48 also provides guidance on description, classification, interest andpenalties, accounting in interim periods, disclosure and transition. FIN No. 48 is effective for fiscal yearsbeginning after December 15, 2006. The Company does not expect the adoption of FIN No. 48 to have a materialimpact on the Company’s cash flows, results of operations, financial position or liquidity.
In September 2006, the Securities and Exchange Commission issued Staff Accounting Bulletin No. 108(“SAB No. 108”), “Considering the Effects of Prior Year Misstatements When Quantifying Misstatements inCurrent Year Financial Statements.” SAB 108 provides guidance on the consideration of the effects of priorperiod misstatements in quantifying current year misstatements for the purpose of a materiality assessment. SAB108 requires the quantification of financial statement misstatements based on the effects of the misstatements oneach of the company’s financial statements and the related financial statement disclosures. This model iscommonly referred to as the “dual approach” because it requires quantification of errors under both the ironcurtain and the roll-over methods. The roll-over method focuses primarily on the impact of a misstatement on theincome statement—including the reversing effect of prior year misstatements—but its use can lead to theaccumulation of misstatements in the balance sheet. The iron-curtain method focuses primarily on the effect ofcorrecting the period-end balance sheet with less emphasis on the reversing effects of prior year errors on theincome statement. SAB 108 was effective for financial statements for fiscal years ending after November 15,2006. The adoption of SAB 108 did not have a material impact on the Company’s cash flows, results ofoperations, financial position or liquidity.
21. Related Party Transactions
The Company paid Applied Printing Technologies, a printing company affiliated with Mr. Mortimer B.Zuckerman, approximately $0, $67,000 and $53,000 during the years ended December 31, 2006, 2005 and 2004,respectively, for printing services principally relating to the printing of the Company’s annual report toshareholders.
An entity controlled by Mr. Mortimer B. Zuckerman, Chairman of the Company’s Board of Directors,owned an office building located at 2400 N Street, N.W. in Washington, D.C., in which a company affiliatedwith Mr. Zuckerman leased 100% of the building. The Company had entered into an agreement with an entitycontrolled by Mr. Zuckerman to manage this property on terms comparable with other third-party propertymanagement agreements that the Company currently has in place. The disinterested members of the Company’sBoard of Directors had approved the management agreement between the Company and Mr. Zuckerman’saffiliate. Under the management agreement, the Company had also agreed to provide consulting services andassistance in connection with a possible sale of this property in exchange for a fee of $100,000 payable upon theclosing of the sale of the property. During the years ended December 31, 2005 and 2004, the Company receivedapproximately $329,000 and $777,000, respectively, for reimbursements of building operating costs and earned$66,000 and $135,000, respectively, in management fees under the management agreement. During the yearended December 31, 2005, the entity controlled by Mr. Zuckerman closed on the sale of the property andpursuant to the management agreement the Company received and recognized $100,000 for consulting servicesand assistance in connection with the sale.
On October 26, 2005, the Company entered into an agreement with an entity owned by Mr. Zuckerman.Under the agreement, which was approved by the disinterested members of the Company’s Board of Directors,the Company renders project management services to such entity in exchange for a fee. The Company extended
128

BOSTON PROPERTIES, INC.
NOTES TO CONSOLIDATED FINANCIAL STATEMENTS—(Continued)
its services under a letter dated October 10, 2006. Under the agreement, as extended, the Company earned$79,800 and $34,200 during the years ended December 31, 2006 and 2005, respectively.
A firm controlled by Mr. Raymond A. Ritchey’s brother was paid aggregate leasing commissions, ofapproximately $559,000, $0 and $626,000 for the years ended December 31, 2006, 2005 and 2004, respectively,related to certain exclusive leasing arrangements for certain Northern Virginia properties. Mr. Ritchey is anExecutive Vice President of Boston Properties, Inc.
Mr. Martin Turchin, a member of the Company’s Board of Directors, is a non-executive/non-director ViceChairman of CB Richard Ellis (“CBRE”). Through an arrangement with CBRE and its predecessor, Insignia/ESG, Inc. that has been in place since 1985, Mr. Turchin and Turchin & Associates, an entity owned byMr. Turchin (95%) and his son (5%), participate in brokerage activities for which CBRE is retained as leasingagent, some of which involve leases for space within buildings owned by the Company. Additionally,Mr. Turchin’s son is employed by CBRE and works on transactions for which CBRE earns commission incomefrom the Company. Mr. Turchin’s son’s compensation from CBRE is in the form of salary and bonus, neither ofwhich is directly tied to CBRE’s transactions with the Company. For the years ended December 31, 2006, 2005and 2004, Mr. Turchin, directly and through Turchin & Associates, received commission income of $19,000,$194,000 and $220,000, respectively, from commissions earned by CBRE and its predecessor, Insignia/ESG,Inc., from the Company. Pursuant to its arrangement with CBRE, Turchin & Associates has confirmed to theCompany that it is paid on the same basis with respect to properties owned by the Company as it is with respectto properties owned by other clients of CBRE. Mr. Turchin does not participate in any discussions or otheractivities relating to the Company’s contractual arrangements with CBRE either in his capacity as a member ofthe Company’s Board of Directors or as a Vice Chairman of CBRE.
On June 30, 1998, the Company acquired from entities controlled by Mr. Alan B. Landis a portfolio ofproperties known as the Carnegie Center Portfolio and Tower Center One and related operations anddevelopment rights (collectively, the “Carnegie Center Portfolio”). In connection with the acquisition of theCarnegie Center Portfolio, the Operating Partnership entered into a development agreement (the “DevelopmentAgreement”) with affiliates of Mr. Landis providing for up to approximately 2,000,000 square feet ofdevelopment in or adjacent to the Carnegie Center office complex. An affiliate of Mr. Landis was entitled to apurchase price for each parcel developed under the Development Agreement calculated on the basis of $20 perrentable square foot of property developed. Another affiliate of Mr. Landis was eligible to earn a contingentpayment for each developed property that achieves a stabilized return in excess of a target annual return rangingbetween 10.5% and 11%. The Development Agreement also provided that upon negotiated terms and conditions,the Company and Mr. Landis would form a development company to provide development services for thesedevelopment projects and would share the expenses and profits, if any, of this new company. In addition, inconnection with the acquisition of the Carnegie Center Portfolio, Mr. Landis became a director of the Companypursuant to an Agreement Regarding Directorship, dated as of June 30, 1998, with the Company (the“Directorship Agreement”). Under the Directorship Agreement, the Company agreed to nominate Mr. Landis forre-election as a director at each annual meeting of stockholders of the Company in a year in which his termexpires, provided that specified conditions are met.
On October 21, 2004, the Company entered into an agreement (the “2004 Agreement”) to modify severalprovisions of the Development Agreement. Under the terms of the 2004 Agreement, the Operating Partnershipand affiliates of Mr. Landis amended the Development Agreement to limit the rights of Mr. Landis and hisaffiliates to participate in the development of properties under the Development Agreement. Among other things,Mr. Landis agreed that (1) Mr. Landis and his affiliates will have no right to participate in any entity formed toacquire land parcels or the development company formed by the Operating Partnership to provide developmentservices under the Development Agreement, (2) Mr. Landis will have no right or obligation to play a role in
129

BOSTON PROPERTIES, INC.
NOTES TO CONSOLIDATED FINANCIAL STATEMENTS—(Continued)
development activities engaged in by the development company formed by the Operating Partnership under theDevelopment Agreement or receive compensation from the development company and (3) the affiliate ofMr. Landis will have no right to receive a contingent payment for developed properties based on stabilizedreturns. In exchange, the Company (together with the Operating Partnership) agreed to:
• effective as of June 30, 1998, pay Mr. Landis $125,000 on January 1 of each year until the earlier of(A) January 1, 2018, (B) the termination of the Development Agreement or (C) the date on which alldevelopment properties under the Development Agreement have been conveyed pursuant to theDevelopment Agreement, with $750,000, representing payments of this annual amount from 1998 to2004, being paid upon execution of the 2004 Agreement; and
• pay an affiliate of Mr. Landis, in connection with the development of land parcels acquired under theDevelopment Agreement, an aggregate fixed amount of $10.50 per rentable square foot of propertydeveloped (with a portion of this amount (i.e., $5.50) being subject to adjustment, in specifiedcircumstances, based on future increases in the Consumer Price Index) in lieu of a contingent paymentbased on stabilized returns, which payment could have been greater or less than $10.50 per rentablesquare foot of property developed.
The Operating Partnership also continues to be obligated to pay an affiliate of Mr. Landis the purchase priceof $20 per rentable square foot of property developed for each land parcel acquired as provided in the originalDevelopment Agreement. During the 20-year term of the Development Agreement, until such time, if any, as theOperating Partnership elects to acquire a land parcel, an affiliate of Mr. Landis will remain responsible for allcarrying costs associated with such land parcel.
In addition, in connection with entering into the 2004 Agreement, Mr. Landis resigned as a director of theCompany effective as of May 11, 2005 and agreed that the Company will have no future obligation to nominateMr. Landis as a director of the Company under the Directorship Agreement or otherwise. Mr. Landis did notresign because of a disagreement with the Company on any matter relating to its operations, policies or practices.
During the year ended December 31, 2004, a joint venture in which the Company has a 35.7% interest sold430 Rozzi Place, an industrial property totaling 20,000 net rentable square feet, Hilltop Office Center, comprisedof nine office/technical properties totaling approximately 143,000 net rentable square feet and 560 ForbesBoulevard, an industrial property totaling 40,000 net rentable square feet located in South San Francisco,California. The properties were sold in three separate transactions for aggregate net cash proceeds ofapproximately $17.8 million and the assumption by the buyer of the mortgage debt on the Hilltop Office Centerproperties totaling $5.2 million, resulting in aggregate gains on sale to the Company of approximately $8.4million (net of minority interest in the property partnership’s share of approximately $11.3 million and net ofminority interest in the Operating Partnership’s share of approximately $1.7 million). The joint venture wasconsolidated in the Company’s financial statements due to the Company’s unilateral control. The outside partnersin the joint venture, owning a 64.3% interest, are related parties of Mr. Zuckerman. The related parties wereallocated their pro-rata share of the net proceeds from the sale totaling approximately $11.3 million.
In accordance with the Company’s 1997 Stock Option and Incentive Plan, as amended, and as approved bythe Board of Directors, each non-employee director has made an election to receive deferred stock units in lieu ofcash fees. The deferred stock units will be settled in shares of common stock upon the cessation of suchdirector’s service on the Board of Directors. As a result of these elections, the aggregate cash fees otherwisepayable to a non-employee director during a fiscal quarter are converted into a number of deferred stock unitsequal to the aggregate cash fees divided by the last reported sales price of a share of the Company’s commonstock on the last trading of the applicable fiscal quarter. The deferred stock units are also credited with dividendequivalents. At December 31, 2006 and 2005, the Company had outstanding 54,157, 46,800 and 43,552 deferred
130
BOSTON PROPERTIES, INC.
NOTES TO CONSOLIDATED FINANCIAL STATEMENTS—(Continued)
stock units, respectively, with an aggregate value of approximately $3.0 million, $2.4 million and $2.1 million,respectively, which amounts are included in the accompanying Consolidated Balance Sheets.
22. Subsequent Events
On January 5, 2007 and January 18, 2007, the Company acquired adjacent parcels of land located inSpringfield, Virginia for a purchase price of approximately $12.0 million and $4.5 million, respectively. TheCompany also has an agreement to acquire an additional adjacent parcel of land for a purchase price ofapproximately $25.6 million. The assembled land parcels will support a commercial development ofapproximately 800,000 net rentable square feet.
On January 9, 2007, the Company acquired a parcel of land located in New York City, through a majority-owned venture, for a purchase price of approximately $38.8 million. On January 24, 2007, the Company acquiredan adjacent parcel of land, through a majority-owned venture, for a purchase price of approximately $160.0million. On February 1, 2007, the Company acquired an additional adjacent parcel of land, through a majority-owned venture, for a purchase price of approximately $30.0 million. The Company also has agreements toacquire other real estate interests, through the majority-owned venture, for approximately $30.0 million. Theacquisitions were financed with members’ capital contributions and a $160.0 million mortgage loan bearinginterest at a variable rate equal to LIBOR plus 0.40% per annum and maturing in January 2009. The assembledland parcels will support the development of an approximately 885,000 net rentable square foot Class A officetower. On February 26, 2007, the Company entered into an agreement to acquire the outside member’s equityinterest in the venture for approximately $21.0 million.
On January 29, 2007, the Company acquired a parcel of land located in Waltham, Massachusetts for apurchase price of approximately $13.9 million.
On February 2, 2007, the Company issued 5,951 shares of restricted stock and the Company’s OperatingPartnership issued 152,651 LTIP Units to employees under the stock option and incentive plan.
On February 6, 2007, the Company’s Operating Partnership completed an offering of $862.5 million inaggregate principal amount (including $112.5 million as a result of the exercise by the initial purchasers of theirover-allotment option) of its 2.875% exchangeable senior notes due 2037. The notes were priced at 97.433333%of their face amount, resulting in an effective interest rate of approximately 3.438% per annum and net proceedsto the Company of approximately $840.0 million. The notes mature on February 15, 2037, unless earlierrepurchased, exchanged or redeemed.
Upon the occurrence of specified events, holders of the notes may exchange their notes prior to the close ofbusiness on the scheduled trading day immediately preceding February 20, 2012 into cash and, at the OperatingPartnership’s option, shares of the Company’s common stock at an initial exchange rate of 6.6090 shares per$1,000 principal amount of notes (or an initial exchange price of approximately $151.31 per share of theCompany’s common stock). On and after February 20, 2012, the notes will be exchangeable at any time prior tothe close of business on the scheduled trading day immediately preceding the maturity date at the option of theholder at the applicable exchange rate. The initial exchange rate is subject to adjustment in certain circumstances.
Prior to February 20, 2012, the Operating Partnership may not redeem the notes except to preserve theCompany’s status as a REIT. On or after February 20, 2012, the Operating Partnership may redeem all or aportion of the notes for cash at a redemption price equal to 100% of the principal amount plus accrued andunpaid interest. Note holders may require the Operating Partnership to repurchase all or a portion of the notes onFebruary 15 of 2012, 2017, 2022, 2027 and 2032 at a purchase price equal to 100% of the principal amount plus
131

BOSTON PROPERTIES, INC.
NOTES TO CONSOLIDATED FINANCIAL STATEMENTS—(Continued)
accrued and unpaid interest up to, but excluding, the repurchase date. The Operating Partnership will pay cash forall notes so repurchased.
If the Company undergoes a “fundamental change,” note holders will have the option to require theOperating Partnership to purchase all or any portion of the notes at a purchase price equal to 100% of theprincipal amount of the notes to be purchased plus any accrued and unpaid interest to, but excluding, thefundamental change purchase date. The Operating Partnership will pay cash for all notes so purchased. Inaddition, if a fundamental change occurs prior to February 20, 2012, the Operating Partnership will increase theexchange rate for a holder who elects to exchange its notes in connection with such a fundamental change undercertain circumstances. The notes are senior unsecured obligations of the Operating Partnership and will rankequally in right of payment to all existing and future senior unsecured indebtedness and senior to any futuresubordinated indebtedness of the Operating Partnership. The notes will effectively rank junior in right ofpayment to all existing and future secured indebtedness of the Operating Partnership. The notes will bestructurally subordinated to all liabilities of the subsidiaries of the Operating Partnership.
The Operating Partnership offered and sold the notes to the initial purchasers in reliance on the exemptionfrom registration provided by Section 4(2) of the Securities Act of 1933. The initial purchasers then sold thenotes to qualified institutional buyers pursuant to the exemption from registration provided by Rule 144A underthe Securities Act.
In connection with the closing, The Company and the Operating Partnership entered into a RegistrationRights Agreement (the “Registration Rights Agreement”) with the initial purchasers. Under the RegistrationRights Agreement, the Company and the Operating Partnership have agreed, for the benefit of the holders of thenotes, to file with the Securities and Exchange Commission, or have on file, a shelf registration statementproviding for the sale by the holders of the notes and the Company’s common stock, if any, issuable uponexchange of the notes (the “Registrable Securities”), within 90 days after the original issuance of the notes and touse reasonable best efforts to cause such shelf registration statement to be declared effective within 210 daysafter the original issuance of the notes or otherwise make available for use by selling security holders an effectiveshelf registration statement no later than such date. The Company and the Operating Partnership will be requiredto pay liquidated damages in the form of specified additional interest to the holders of the notes if they fail tocomply with their respective obligations to register the notes and the Company common stock issuable uponexchange of the notes within specified time periods, or if the registration statement ceases to be effective or theuse of the prospectus is suspended for specified time periods. Neither Company nor the Operating Partnershipwill be required to pay liquidated damages with respect to any note after it has been exchanged for any of theCompany’s common stock.
On February 8, 2007, 439,674 Series Two Preferred Units of the Company’s Operating Partnership wereconverted by the holder thereof into 577,000 OP Units. The OP Units were subsequently presented by the holderfor redemption and were redeemed by the Company in exchange for an equal number of shares of CommonStock.
On February 12, 2007, the Company refinanced its mortgage loan collateralized by 599 Lexington Avenuelocated in New York City. The new mortgage financing totaling $750.0 million bears interest at a fixed interestrate of 5.57% per annum and matures on March 1, 2017. On December 19, 2006, the Company had terminated itsforward-starting interest rate swap contracts and received approximately $10.9 million, which amount willreduce the Company’s interest expense over the ten-year term of the financing, resulting in an effective interestrate of 5.38% per annum for the financing. The Company repaid the $225.0 million draw on its Unsecured Lineof Credit, which draw was collateralized by 599 Lexington Avenue. In addition, the Company used the netproceeds from the refinancing to repay the mortgage loan collateralized by Times Square Tower located in New
132

York City totaling $475.0 million. The Times Square Tower mortgage loan bore interest at a variable rate equalto LIBOR plus 0.50% per annum and was scheduled to mature on July 9, 2008. There was no prepayment penaltyassociated with the repayment.
On February 15, 2007, the Company completed the sale of its long-term leasehold interest in 5 TimesSquare in New York City and related credits, for approximately $1.28 billion in cash. 5 Times Square is a fully-leased Class A office tower that contains approximately 1,101,779 net rentable square feet.
Item 9. Changes in and Disagreements with Accountants on Accounting and Financial Disclosure
None.
Item 9A. Controls and Procedures
As of the end of the period covered by this report, an evaluation was carried out by our management, withthe participation of our Chief Executive Officer and Chief Financial Officer, of the effectiveness of ourdisclosure controls and procedures (as defined in Rule 13a-15(e) under the Securities Exchange Act of 1934).Based upon that evaluation, our Chief Executive Officer and Chief Financial Officer concluded that thesedisclosure controls and procedures were effective as of the end of the period covered by this report. In addition,no change in our internal control over financial reporting (as defined in Rule 13a-15(f) under the SecuritiesExchange Act of 1934) occurred during the fourth quarter of our fiscal year ended December 31, 2006 that hasmaterially affected, or is reasonably likely to materially affect, our internal control over financial reporting.
Management’s Report on Internal Control over Financial Reporting and the Report of IndependentRegistered Public Accounting Firm thereon are set forth on pages 83 and 84 of this Annual Report on Form 10-Kand are incorporated herein by reference.
Item 9B. Other Information
None.
133
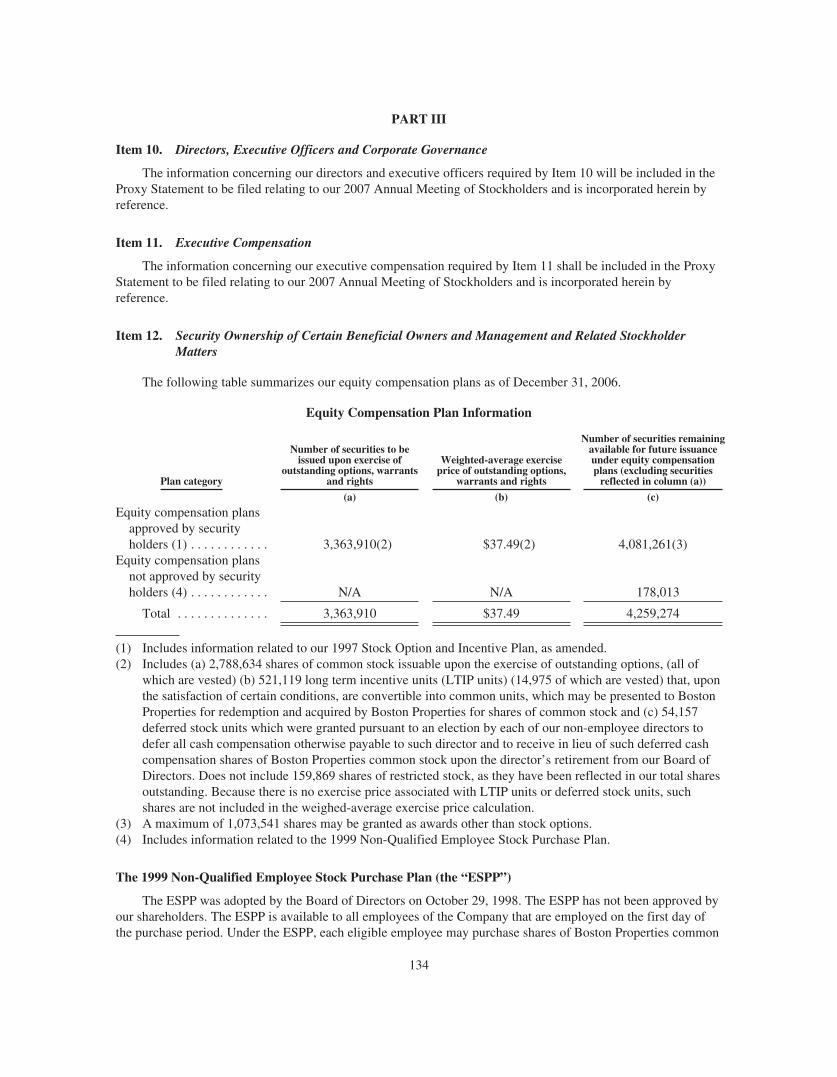
PART III
Item 10. Directors, Executive Officers and Corporate Governance
The information concerning our directors and executive officers required by Item 10 will be included in theProxy Statement to be filed relating to our 2007 Annual Meeting of Stockholders and is incorporated herein byreference.
Item 11. Executive Compensation
The information concerning our executive compensation required by Item 11 shall be included in the ProxyStatement to be filed relating to our 2007 Annual Meeting of Stockholders and is incorporated herein byreference.
Item 12. Security Ownership of Certain Beneficial Owners and Management and Related StockholderMatters
The following table summarizes our equity compensation plans as of December 31, 2006.
Equity Compensation Plan Information
Plan category
Number of securities to beissued upon exercise of
outstanding options, warrantsand rights
Weighted-average exerciseprice of outstanding options,
warrants and rights
Number of securities remainingavailable for future issuanceunder equity compensationplans (excluding securities
reflected in column (a))
(a) (b) (c)
Equity compensation plansapproved by securityholders (1) . . . . . . . . . . . . 3,363,910(2) $37.49(2) 4,081,261(3)
Equity compensation plansnot approved by securityholders (4) . . . . . . . . . . . . N/A N/A 178,013
Total . . . . . . . . . . . . . . 3,363,910 $37.49 4,259,274
(1) Includes information related to our 1997 Stock Option and Incentive Plan, as amended.(2) Includes (a) 2,788,634 shares of common stock issuable upon the exercise of outstanding options, (all of
which are vested) (b) 521,119 long term incentive units (LTIP units) (14,975 of which are vested) that, uponthe satisfaction of certain conditions, are convertible into common units, which may be presented to BostonProperties for redemption and acquired by Boston Properties for shares of common stock and (c) 54,157deferred stock units which were granted pursuant to an election by each of our non-employee directors todefer all cash compensation otherwise payable to such director and to receive in lieu of such deferred cashcompensation shares of Boston Properties common stock upon the director’s retirement from our Board ofDirectors. Does not include 159,869 shares of restricted stock, as they have been reflected in our total sharesoutstanding. Because there is no exercise price associated with LTIP units or deferred stock units, suchshares are not included in the weighed-average exercise price calculation.
(3) A maximum of 1,073,541 shares may be granted as awards other than stock options.(4) Includes information related to the 1999 Non-Qualified Employee Stock Purchase Plan.
The 1999 Non-Qualified Employee Stock Purchase Plan (the “ESPP”)
The ESPP was adopted by the Board of Directors on October 29, 1998. The ESPP has not been approved byour shareholders. The ESPP is available to all employees of the Company that are employed on the first day ofthe purchase period. Under the ESPP, each eligible employee may purchase shares of Boston Properties common
134

stock at semi-annual intervals each year at a purchase price equal to 85% of the average closing prices of BostonProperties common stock on the New York Stock Exchange during the last ten business days of the purchaseperiod. Each eligible employee may contribute no more than $10,000 per year to purchase Boston Properties, Inc.common stock under the ESPP.
Additional information concerning security ownership of certain beneficial owners and managementrequired by Item 12 shall be included in the Proxy Statement to be filed relating to our 2007 Annual Meeting ofStockholders and is incorporated herein by reference.
Item 13. Certain Relationships and Related Transactions, and Director Independence
The information concerning certain relationships and related transactions required by Item 13 shall beincluded in the Proxy Statement to be filed relating to our 2007 Annual Meeting of Stockholders and isincorporated herein by reference.
Item 14. Principal Accountant Fees and Services
The information concerning our principal accounting fees and services required by Item 14 shall be includedin the Proxy Statement to be filed relating to our 2007 Annual Meeting of Stockholders and is incorporatedherein by reference.
135

PART IV
Item 15. Exhibits, Financial Statement Schedules
(a) Financial Statement Schedule
136

Bos
ton
Pro
pert
ies,
Inc.
Sche
dule
3—R
ealE
stat
ean
dA
ccum
ulat
edD
epre
ciat
ion
Dec
embe
r31
,200
6(d
olla
rsin
thou
sand
s)
Pro
pert
yN
ame
Typ
eL
ocat
ion
Enc
umbr
ance
s
Ori
gina
l
Cos
tsC
apit
aliz
edSu
bseq
uent
toA
cqui
siti
onL
and
and
Impr
ovem
ents
Bui
ldin
gan
dIm
prov
emen
ts
Lan
dH
eld
for
Dev
elop
men
t
Dev
elop
men
tan
dC
onst
ruct
ion
inP
rogr
ess
Tot
alA
ccum
ulat
edD
epre
ciat
ion
Yea
r(s)
Bui
lt/
Ren
ovat
ed
Dep
reci
able
Liv
es(Y
ears
)L
and
Bui
ldin
g
Em
barc
ader
oC
ente
r..
....
Off
ice
San
Fran
cisc
o,C
A$4
18,8
47$1
79,6
97$8
47,4
10$1
93,0
73$1
91,3
05$1
,028
,875
$—
$—
$1,2
20,1
80$2
15,8
4019
70/1
989
(1)
399
Park
Ave
nue
....
....
Off
ice
New
Yor
k,N
Y—
339,
200
700,
358
50,7
2234
9,73
074
0,55
0—
—1,
090,
280
76,6
1819
61(1
)Pr
uden
tialC
ente
r..
....
..O
ffic
eB
osto
n,M
A26
5,32
592
,077
734,
594
208,
538
102,
794
915,
249
13,0
084,
158
1,03
5,20
918
1,34
019
65/1
993/
2002
(1)
Citi
grou
pC
ente
r..
....
...
Off
ice
New
Yor
k,N
Y49
3,52
624
1,60
049
4,78
213
8,97
128
6,39
658
8,95
7—
—87
5,35
375
,358
1977
/199
7(1
)T
imes
Squa
reT
ower
....
.O
ffic
eN
ewY
ork,
NY
475,
000
165,
413
380,
438
71,1
2017
0,82
044
6,15
1—
—61
6,97
135
,514
2004
(1)
Car
negi
eC
ente
r..
....
...
Off
ice
Prin
ceto
n,N
J12
5,54
610
1,77
234
9,08
942
,996
98,4
8739
5,35
218
—49
3,85
784
,676
1983
-199
9(1
)59
9L
exin
gton
Ave
nue
....
Off
ice
New
Yor
k,N
Y22
5,00
081
,040
100,
507
100,
623
85,7
7719
6,39
3—
—28
2,17
010
9,88
419
86(1
)G
atew
ayC
ente
r..
....
...
Off
ice
San
Fran
cisc
o,C
A—
28,2
5513
9,24
542
,542
30,1
6717
9,87
5—
—21
0,04
229
,577
1984
/198
6/20
02(1
)R
eser
voir
Plac
e..
....
....
Off
ice
Wal
tham
,MA
51,9
1618
,605
92,6
1922
,960
19,3
8811
4,79
6—
—13
4,18
427
,460
1955
/198
7(1
)13
33N
ewH
amps
hire
Ave
nue
....
....
....
..O
ffic
eW
ashi
ngto
n,D
C—
34,0
3285
,660
4,37
934
,998
89,0
73—
—12
4,07
110
,834
1996
(1)
3200
Zan
ker
Roa
d..
....
.O
ffic
eSa
nJo
se,C
A—
36,7
0582
,863
639
36,8
6583
,342
——
120,
207
884
1988
(1)
Seve
nC
ambr
idge
Cen
ter
..O
ffic
eC
ambr
idge
,MA
—3,
457
97,1
361,
528
3,83
998
,282
——
102,
121
5,69
520
06(1
)13
30C
onne
ctic
utA
venu
e..
....
....
....
Off
ice
Was
hing
ton,
DC
55,0
9625
,982
82,3
1112
,299
26,8
0793
,785
——
120,
592
7,49
619
84(1
)C
apita
lGal
lery
....
....
..O
ffic
eW
ashi
ngto
n,D
C—
4,72
529
,560
78,8
717,
913
105,
243
——
113,
156
27,4
1119
81/2
006
(1)
Dem
ocra
cyC
ente
r..
....
.O
ffic
eB
ethe
sda,
MD
96,1
5012
,550
50,0
1545
,693
14,6
2093
,638
——
108,
258
42,3
3419
85-8
8/94
-96
(1)
One
Free
dom
Squa
re..
...
Off
ice
Res
ton,
VA
78,0
079,
929
84,5
0410
,817
10,8
8694
,364
——
105,
250
20,8
6520
00(1
)T
wo
Free
dom
Squa
re..
...
Off
ice
Res
ton,
VA
—13
,930
77,7
3910
,279
14,9
6486
,984
——
101,
948
13,0
9820
01(1
)O
nean
dT
wo
Res
ton
Ove
rloo
k..
....
....
...
Off
ice
Res
ton,
VA
—16
,456
66,1
926,
023
17,2
4871
,423
——
88,6
7114
,640
1999
(1)
140
Ken
dric
kSt
reet
....
..O
ffic
eN
eedh
am,M
A58
,501
18,0
9566
,905
3,03
118
,790
69,2
41—
—88
,031
4,73
520
00(1
)D
isco
very
Squa
re..
....
..O
ffic
eR
esto
n,V
A—
11,1
9871
,782
4,75
512
,136
75,5
99—
—87
,735
12,3
5020
01(1
)12
310
Sunr
ise
Val
ley
Dri
ve..
....
....
....
..O
ffic
eR
esto
n,V
A—
9,36
767
,431
7,65
911
,107
73,3
50—
—84
,457
15,3
4619
87/1
988
(1)
Wal
tham
Wes
ton
Cor
pora
teC
ente
r..
....
....
....
.O
ffic
eW
alth
am,M
A—
10,3
8560
,694
7,11
710
,878
67,3
18—
—78
,196
11,2
7320
03(1
)12
300
Sunr
ise
Val
ley
Dri
ve..
....
....
....
..O
ffic
eR
esto
n,V
A—
9,06
258
,884
7,58
110
,781
64,7
46—
—75
,527
13,4
3819
87/1
988
(1)
Five
Cam
brid
geC
ente
r..
..O
ffic
eC
ambr
idge
,MA
—18
,863
53,3
4691
18,8
8653
,414
——
72,3
0016
919
81/1
996
(1)
Four
Cam
brid
geC
ente
r..
.O
ffic
eC
ambr
idge
,MA
—19
,104
52,0
7849
19,1
1652
,115
——
71,2
3116
919
83/1
998
(1)
Pros
pect
Plac
e..
....
....
.O
ffic
eW
alth
am,M
A—
13,1
8949
,823
4,97
913
,421
54,5
70—
—67
,991
1,98
619
92(1
)R
esto
nC
orpo
rate
Cen
ter
..O
ffic
eR
esto
n,V
A21
,268
9,13
550
,857
3,47
19,
955
53,5
08—
—63
,463
10,6
0119
84(1
)N
ewD
omin
ion
Tec
hnol
ogy
Park
,Bld
g.T
wo
....
...
Off
ice
Her
ndon
,VA
63,0
005,
584
51,8
682,
584
6,23
853
,798
——
60,0
364,
245
2004
(1)
Orb
italS
cien
ces
....
....
.O
ffic
eD
ulle
s,V
A—
5,69
951
,082
2,39
86,
171
53,0
08—
—59
,179
10,8
7020
00/2
001
(1)
191
Spri
ngSt
reet
....
....
Off
ice
Lex
ingt
on,M
A—
2,85
027
,166
21,9
103,
066
48,8
60—
—51
,926
24,7
5219
71/1
995
(1)
New
Dom
inio
nT
echn
olog
yPa
rk,B
ldg.
One
....
...
Off
ice
Her
ndon
,VA
55,4
203,
880
43,2
272,
910
4,38
045
,637
——
50,0
178,
447
2001
(1)
303
Alm
aden
Bou
leva
rd..
.O
ffic
eSa
nJo
se,C
A—
10,8
3635
,606
232
10,8
9435
,780
——
46,6
7455
219
95(1
)13
01N
ewY
ork
Ave
nue
...
Off
ice
Was
hing
ton,
DC
25,0
619,
250
18,7
5019
,727
9,67
838
,049
——
47,7
279,
234
1983
/199
8(1
)20
0W
estS
tree
t...
....
...
Off
ice
Wal
tham
,MA
—16
,148
24,9
831,
879
16,6
2626
,384
——
43,0
107,
184
1999
(1)
137

Bos
ton
Pro
pert
ies,
Inc.
Sche
dule
3—R
ealE
stat
ean
dA
ccum
ulat
edD
epre
ciat
ion
Dec
embe
r31
,200
6(d
olla
rsin
thou
sand
s)
Pro
pert
yN
ame
Typ
eL
ocat
ion
Enc
umbr
ance
s
Ori
gina
l
Cos
tsC
apit
aliz
edSu
bseq
uent
toA
cqui
siti
onL
and
and
Impr
ovem
ents
Bui
ldin
gan
dIm
prov
emen
ts
Lan
dH
eld
for
Dev
elop
men
t
Dev
elop
men
tan
dC
onst
ruct
ion
inP
rogr
ess
Tot
alA
ccum
ulat
edD
epre
ciat
ion
Yea
r(s)
Bui
lt/
Ren
ovat
ed
Dep
reci
able
Liv
es(Y
ears
)L
and
Bui
ldin
g
Sum
ner
Squa
re..
....
....
....
.O
ffic
eW
ashi
ngto
n,D
C27
,581
624
28,7
4513
,156
1,33
141
,194
——
42,5
2510
,923
1985
(1)
Uni
vers
ityPl
ace
....
....
....
..O
ffic
eC
ambr
idge
,MA
21,2
03—
37,0
914,
669
282
41,4
78—
—41
,760
10,8
3419
85(1
)Q
uoru
mO
ffic
ePa
rk..
....
....
.O
ffic
eC
helm
sfor
d,M
A—
3,75
032
,454
4,67
55,
062
35,8
17—
—40
,879
5,32
920
01(1
)26
00T
ower
Oak
sB
oule
vard
....
.O
ffic
eR
ockv
ille,
MD
—4,
243
31,1
253,
686
4,62
634
,428
——
39,0
547,
850
2001
(1)
1229
0Su
nris
eV
alle
yD
rive
....
.O
ffic
eR
esto
n,V
A—
3,59
432
,977
972
3,83
733
,706
——
37,5
4394
920
06(1
)O
neC
ambr
idge
Cen
ter
....
....
.O
ffic
eC
ambr
idge
,MA
—13
425
,110
7,94
942
732
,766
——
33,1
9315
,620
1987
(1)
500
ESt
reet
....
....
....
....
..O
ffic
eW
ashi
ngto
n,D
C—
109
22,4
208,
793
2,14
229
,180
——
31,3
2214
,149
1987
(1)
Bed
ford
Bus
ines
sPa
rk..
....
...
Off
ice
Bed
ford
,MA
17,7
4953
43,
403
23,4
2292
126
,438
——
27,3
5916
,099
1980
(1)
Eig
htC
ambr
idge
Cen
ter
....
....
Off
ice
Cam
brid
ge,M
A25
,188
850
25,0
421,
545
1,18
126
,256
——
27,4
374,
824
1999
(1)
New
port
Off
ice
Park
....
....
...
Off
ice
Qui
ncy,
MA
—3,
500
18,2
081,
263
3,86
219
,109
——
22,9
714,
685
1988
(1)
10an
d20
Bur
lingt
onM
all
Roa
d..
....
....
....
....
....
Off
ice
Bur
lingt
on,M
A20
,006
930
6,92
811
,730
756
18,8
32—
—19
,588
9,43
119
84-1
989/
95-9
6(1
)20
1Sp
ring
Stre
et..
....
....
....
Off
ice
Lex
ingt
on,M
A—
2,84
915
,303
1,15
73,
042
16,2
67—
—19
,309
5,49
319
97(1
)T
enC
ambr
idge
Cen
ter
....
....
.O
ffic
eC
ambr
idge
,MA
32,2
131,
299
12,9
435,
486
2,23
917
,489
——
19,7
287,
081
1990
(1)
Bro
adR
unB
usin
ess
Park
,B
uild
ing
E..
....
....
....
...
Off
ice
Lou
don
Cou
nty,
VA
—49
715
,131
2,24
179
917
,070
——
17,8
692,
649
2002
(1)
Mon
tval
eC
ente
r..
....
....
....
Off
ice
Gai
ther
sbur
g,M
D—
1,57
49,
786
5,80
62,
509
14,6
57—
—17
,166
7,33
719
87(1
)40
Shat
tuck
Roa
d..
....
....
....
Off
ice
And
over
,MA
—70
914
,740
1,63
284
216
,239
——
17,0
812,
895
2001
(1)
Thr
eeC
ambr
idge
Cen
ter
....
....
Off
ice
Cam
brid
ge,M
A—
174
12,2
003,
819
307
15,8
86—
—16
,193
7,21
319
87(1
)L
exin
gton
Off
ice
Park
....
....
..O
ffic
eL
exin
gton
,MA
—99
81,
426
12,4
341,
209
13,6
49—
—14
,858
7,14
319
82(1
)18
1Sp
ring
Stre
et..
....
....
....
Off
ice
Lex
ingt
on,M
A—
1,06
69,
520
2,82
31,
132
12,2
77—
—13
,409
2,43
419
99(1
)75
01B
osto
nB
oule
vard
,Bui
ldin
gSe
ven
....
....
....
....
....
.O
ffic
eSp
ring
fiel
d,V
A—
665
9,27
339
475
49,
578
——
10,3
322,
183
1997
(1)
92-1
00H
ayde
nA
venu
e..
....
...
Off
ice
Lex
ingt
on,M
A—
594
6,74
82,
959
719
9,58
2—
—10
,301
5,44
619
85(1
)91
Har
twel
lAve
nue
....
....
....
Off
ice
Lex
ingt
on,M
A16
,369
784
6,46
42,
882
894
9,23
6—
—10
,130
4,58
619
85(1
)19
5W
estS
tree
t..
....
....
....
.O
ffic
eW
alth
am,M
A—
1,61
16,
652
1,65
11,
785
8,12
9—
—9,
914
3,59
319
90(1
)33
Hay
den
Ave
nue
....
....
....
Off
ice
Lex
ingt
on,M
A—
266
3,23
45,
742
379
8,86
3—
—9,
242
3,50
219
79(1
)W
alth
amO
ffic
eC
ente
r..
....
...
Off
ice
Wal
tham
,MA
—42
22,
719
5,74
453
88,
347
——
8,88
54,
961
1968
-197
0/87
-88
(1)
Ele
ven
Cam
brid
geC
ente
r..
....
.O
ffic
eC
ambr
idge
,MA
—12
15,
535
2,78
625
88,
184
——
8,44
24,
543
1984
(1)
8000
Gra
inge
rC
ourt
,Bui
ldin
gFi
ve..
....
....
....
....
....
Off
ice
Spri
ngfi
eld,
VA
—36
64,
282
2,70
955
76,
800
——
7,35
73,
331
1984
(1)
7450
Bos
ton
Bou
leva
rd,B
uild
ing
Thr
ee..
....
....
....
....
...
Off
ice
Spri
ngfi
eld,
VA
—1,
165
4,68
11,
087
1,39
95,
534
——
6,93
31,
566
1987
(1)
7435
Bos
ton
Bou
leva
rd,B
uild
ing
One
....
....
....
....
....
..O
ffic
eSp
ring
fiel
d,V
A—
392
3,82
22,
702
608
6,30
8—
—6,
916
3,49
919
82(1
)73
00B
osto
nB
oule
vard
,Bui
ldin
gT
hirt
een
....
....
....
....
...
Off
ice
Spri
ngfi
eld,
VA
—60
84,
773
149
645
4,88
5—
—5,
530
1,47
120
02(1
)32
Har
twel
lAve
nue
....
....
....
Off
ice
Lex
ingt
on,M
A—
168
1,94
33,
610
273
5,44
8—
—5,
721
4,88
819
68-1
979/
1987
(1)
7601
Bos
ton
Bou
leva
rd,B
uild
ing
Eig
ht..
....
....
....
....
...
Off
ice
Spri
ngfi
eld,
VA
—20
087
84,
656
500
5,23
4—
—5,
734
2,46
119
86(1
)Fo
urte
enC
ambr
idge
Cen
ter
....
.O
ffic
eC
ambr
idge
,MA
—11
04,
483
1,03
222
65,
399
——
5,62
52,
838
1983
(1)
7500
Bos
ton
Bou
leva
rd,B
uild
ing
Six
....
....
....
....
....
...
Off
ice
Spri
ngfi
eld,
VA
—13
83,
749
1,57
936
75,
099
——
5,46
62,
629
1985
(1)
8000
Cor
pora
teC
ourt
,Bui
ldin
gE
leve
n..
....
....
....
....
..O
ffic
eSp
ring
fiel
d,V
A—
136
3,07
183
974
93,
297
——
4,04
61,
504
1989
(1)
138

Bos
ton
Pro
pert
ies,
Inc.
Sche
dule
3—R
ealE
stat
ean
dA
ccum
ulat
edD
epre
ciat
ion
Dec
embe
r31
,200
6(d
olla
rsin
thou
sand
s)
Pro
pert
yN
ame
Typ
eL
ocat
ion
Enc
umbr
ance
s
Ori
gina
l
Cos
tsC
apit
aliz
edSu
bseq
uent
toA
cqui
siti
onL
and
and
Impr
ovem
ents
Bui
ldin
gan
dIm
prov
emen
ts
Lan
dH
eld
for
Dev
elop
men
t
Dev
elop
men
tan
dC
onst
ruct
ion
inP
rogr
ess
Tot
alA
ccum
ulat
edD
epre
ciat
ion
Yea
r(s)
Bui
lt/
Ren
ovat
ed
Dep
reci
able
Liv
es(Y
ears
)L
and
Bui
ldin
g
7375
Bos
ton
Bou
leva
rd,
Bui
ldin
gT
en..
....
....
Off
ice
Spri
ngfi
eld,
VA
—23
2,68
588
279
3,51
1—
—3,
590
1,65
419
88(1
)74
51B
osto
nB
oule
vard
,B
uild
ing
Tw
o..
....
...
Off
ice
Spri
ngfi
eld,
VA
—24
91,
542
1,22
159
02,
422
——
3,01
21,
497
1982
(1)
7374
Bos
ton
Bou
leva
rd,
Bui
ldin
gFo
ur..
....
...
Off
ice
Spri
ngfi
eld,
VA
—24
11,
605
1,21
137
02,
687
——
3,05
71,
267
1984
(1)
164
Lex
ingt
onR
oad
....
..O
ffic
eB
iller
ica,
MA
—59
21,
370
356
628
1,69
0—
—2,
318
482
1982
(1)
17H
artw
ellA
venu
e..
....
Off
ice
Lex
ingt
on,M
A—
2615
076
354
885
——
939
782
1968
(1)
Lon
gW
harf
Mar
riot
t..
....
Hot
elB
osto
n,M
A—
1,70
831
,904
28,2
402,
604
59,2
48—
—61
,852
27,9
3519
82(1
)C
ambr
idge
Cen
ter
Mar
riot
t..
....
....
....
Hot
elC
ambr
idge
,MA
—47
837
,918
21,7
8898
659
,198
——
60,1
8424
,912
1986
(1)
Cam
brid
geC
ente
rE
ast
Gar
age
....
....
....
...G
arag
eC
ambr
idge
,MA
——
35,0
3521
554
35,1
96—
—35
,250
7719
84(1
)C
ambr
idge
Cen
ter
Wes
tG
arag
e..
....
....
....
.Gar
age
Cam
brid
ge,M
A—
1,25
615
,697
408
1,35
816
,003
——
17,3
6149
120
06(1
)C
ambr
idge
Cen
ter
Nor
thG
arag
e..
....
....
....
.Gar
age
Cam
brid
ge,M
A—
1,16
311
,633
1,95
71,
459
13,2
94—
—14
,753
5,30
719
90(1
)Fi
veT
imes
Squa
re..
....
..H
eld
for
Sale
New
Yor
k,N
Y—
158,
530
288,
589
27,3
7416
2,19
231
2,30
1—
—47
4,49
341
,001
2002
(1)
Sout
hof
Mar
ket.
....
....
.D
evel
opm
ent
Res
ton,
VA
11,4
90—
—54
,568
——
—54
,568
54,5
68—
Var
ious
N/A
774t
hA
venu
e..
....
....
.D
evel
opm
ent
Wal
tham
,MA
——
—22
,472
——
—22
,472
22,4
72—
Var
ious
N/A
One
Pres
erve
Park
way
....
Dev
elop
men
tR
ockv
ille,
MD
——
—8,
355
——
—8,
355
8,35
5—
Var
ious
N/A
Wis
cons
inPl
ace
....
....
.D
evel
opm
ent
Che
vyC
hase
,MD
——
—2,
366
——
—2,
366
2,36
6—
Var
ious
N/A
Plaz
aat
Alm
aden
....
....
.L
and
San
Jose
,CA
——
—36
,306
——
36,3
06—
36,3
06—
Var
ious
N/A
Tow
erO
aks
Mas
ter
Plan
...
Lan
dR
ockv
ille,
MD
——
—28
,635
——
28,6
35—
28,6
35—
Var
ious
N/A
Wes
ton
Cor
pora
teC
ente
r..
Lan
dW
esto
n,M
A—
——
23,4
88—
—23
,488
—23
,488
—V
ario
usN
/APr
ospe
ctH
ill..
....
....
..L
and
Wal
tham
,MA
——
—22
,693
——
22,6
93—
22,6
93—
Var
ious
N/A
New
Yor
kC
ityL
and
....
..L
and
New
Yor
k,N
Y—
——
21,5
05—
——
21,5
0521
,505
—V
ario
usN
/AW
ashi
ngto
nian
Nor
th..
...
Lan
dG
aith
ersb
urg,
MD
——
—17
,580
——
17,5
80—
17,5
80—
Var
ious
N/A
Res
ton
Gat
eway
....
....
.L
and
Res
ton,
VA
——
—9,
166
——
9,16
6—
9,16
6—
Var
ious
N/A
Res
ton
Eas
tgat
e..
....
....
Lan
dR
esto
n,V
A—
——
9,11
5—
—9,
115
—9,
115
—V
ario
usN
/AC
rane
Mea
dow
....
....
..L
and
Mar
lbor
ough
,MA
——
—8,
695
——
8,69
5—
8,69
5—
Var
ious
N/A
Bro
adR
unB
usin
ess
Park
..L
and
Lou
don
Cou
nty,
VA
——
—7,
287
——
7,28
7—
7,28
7—
Var
ious
N/A
20F
Stre
et..
....
....
....
Lan
dW
ashi
ngto
n,D
C—
——
4,83
3—
—4,
833
—4,
833
—V
ario
usN
/AC
ambr
idge
Mas
ter
Plan
....
Lan
dC
ambr
idge
,MA
——
—3,
649
——
1,44
42,
205
3,64
9—
Var
ious
N/A
30Sh
attu
ckR
oad
....
....
Lan
dA
ndov
er,M
A—
——
1,13
5—
—1,
135
—1,
135
—V
ario
usN
/A
$2,6
79,4
62$1
,777
,516
$6,1
34,4
91$1
,656
,488
$1,9
02,6
58$7
,366
,805
$183
,403
$115
,629
$9,5
68,4
95$1
,416
,219
(1)
Dep
reci
atio
nof
the
build
ings
and
impr
ovem
ents
are
calc
ulat
edov
erliv
esra
ngin
gfr
omth
elif
eof
the
leas
eto
40ye
ars.
The
aggr
egat
eco
stan
dac
cum
ulat
edde
prec
iatio
nfo
rta
xpu
rpos
esw
asap
prox
imat
ely
$8.6
billi
onan
d$1
.5bi
llion
,res
pect
ivel
y.
139

Boston Properties, Inc.Real Estate and Accumulated Depreciation
December 31, 2006(dollars in thousands)
A summary of activity for real estate and accumulated depreciation is as follows:
2006 2005 2004
Real Estate:Balance at the beginning of the year . . . . . . . . . . . . . . . . . . . . . . . . . $9,126,812 $9,256,637 $8,917,786
Additions to/improvements of real estate . . . . . . . . . . . . . . . . . 878,670 450,641 454,806Assets sold/written-off . . . . . . . . . . . . . . . . . . . . . . . . . . . . . . . (436,987) (580,466) (115,955)
Balance at the end of the year . . . . . . . . . . . . . . . . . . . . . . . . . . . . . . $9,568,495 $9,126,812 $9,256,637
Accumulated Depreciation:Balance at the beginning of the year . . . . . . . . . . . . . . . . . . . . . . . . . $1,250,005 $1,122,806 $ 958,531
Depreciation expense . . . . . . . . . . . . . . . . . . . . . . . . . . . . . . . . 236,883 231,790 222,142Assets sold/written-off . . . . . . . . . . . . . . . . . . . . . . . . . . . . . . . (70,669) (104,591) (57,867)
Balance at the end of the year . . . . . . . . . . . . . . . . . . . . . . . . . . . . . . $1,416,219 $1,250,005 $1,122,806
Note: Real Estate and Accumulated Depreciation amounts do not include Furniture, Fixtures and Equipment.(b) Exhibits
3.1 Form of Amended and Restated Certificate of Incorporation of Boston Properties, Inc. (Incorporatedby reference to Exhibit 3.1 to Boston Properties, Inc.’s Registration Statement on Form S-11, FileNo. 333-25279.)
3.2 Form of Amended and Restated Bylaws of Boston Properties, Inc. (Incorporated by reference toExhibit 3.2 to Boston Properties, Inc.’s Registration Statement on Form S-11, File No. 333-25279.)
3.3 Amendment No. 1 to Amended and Restated Bylaws of Boston Properties, Inc. (Incorporated byreference to Exhibit 3.3 to Boston Properties, Inc.’s Annual Report on Form 10-K filed onMarch 24, 2000.)
3.4 Amendment No. 2 to Amended and Restated Bylaws of Boston Properties, Inc. (Incorporated byreference to Exhibit 3.4 to Boston Properties, Inc.’s Annual Report on Form 10-K filed onFebruary 26, 2004.)
4.1 Form of Shareholder Rights Agreement, dated as of June 16, 1997, between Boston Properties, Inc.and Bank of America (f.k.a. Fleet National Bank, f.k.a. BankBoston, N.A.), as Rights Agent.(Incorporated by reference to Exhibit 4.1 to Boston Properties, Inc.’s Registration Statement onForm S-11, File No. 333-25279.)
4.2 Form of Certificate of Designations for Series E Junior Participating Cumulative Preferred Stock, parvalue $.01 per share. (Incorporated by reference to Exhibit 4.2 to Boston Properties, Inc.’sRegistration Statement on Form S-11, File No. 333-25279.)
4.3 Form of Certificate of Designations for Series A Preferred Stock. (Incorporated by reference toExhibit 99.26 to Boston Properties, Inc.’s Current Report on Form 8-K filed on November 25,1998.)
4.4 Form of Common Stock Certificate. (Incorporated by reference to Exhibit 4.3 to Boston Properties,Inc.’s Registration Statement on Form S-11., File No. 333-25279.)
4.5 Indenture, dated as of December 13, 2002, by and between Boston Properties Limited Partnershipand The Bank of New York, as Trustee. (Incorporated by reference to Exhibit 4.1 to BostonProperties, Inc.’s Current Report on Form 8-K/A filed on December 13, 2002.)
140

4.6 Supplemental Indenture No. 1, dated as of December 13, 2002, by and between Boston PropertiesLimited Partnership and The Bank of New York, as Trustee, including a form of the 6.25% SeniorNote due 2013. (Incorporated by reference to Exhibit 4.2 to Boston Properties, Inc.’s CurrentReport on Form 8-K/A filed on December 13, 2002.)
4.7 Supplemental Indenture No. 2, dated as of January 17, 2003, by and between Boston PropertiesLimited Partnership and The Bank of New York, as Trustee, including a form of the 6.25% SeniorNote due 2013. (Incorporated by reference to Exhibit 4.1 to Boston Properties, Inc.’s CurrentReport on Form 8-K filed on January 23, 2003.)
4.8 Supplemental Indenture No. 3, dated as of March 18, 2003, by and between Boston PropertiesLimited Partnership and The Bank of New York, as Trustee, including a form of the 5.625%Senior Note due 2015. (Incorporated by reference to Exhibit 4.6 to Boston Properties LimitedPartnership’s Amendment No. 3 to Form 10 filed on May 13, 2003.)
4.9 Supplemental Indenture No. 4, dated as of May 22, 2003, by and between Boston Properties LimitedPartnership and The Bank of New York, as Trustee, including a form of the 5.00% Senior Notedue 2015. (Incorporated by reference to Exhibit 4.2 to Boston Properties Limited Partnership’sForm S-4 filed on June 13, 2003, File No. 333-106127.)
4.10 Supplemental Indenture No. 5, dated as of April 6, 2006, by and between Boston Properties LimitedPartnership and The Bank of New York Trust Company, N.A., as Trustee, including a form of the3.75% Exchangeable Senior Note due 2036. (Incorporated by reference to Exhibit 4.1 to BostonProperties, Inc.’s Quarterly Report on Form 10-Q filed on May 10, 2006.)
4.11 Supplemental Indenture No. 6, dated February 6, 2007, by and between Boston Properties LimitedPartnership and The Bank of New York Trust Company, N.A., as Trustee, including a form of the2.875% Exchangeable Senior Note due 2037. (Incorporated by reference to Exhibit 4.1 to CurrentReport on Form 8-K of Boston Properties Limited Partnership filed on February 6, 2007.)
4.12 Registration Rights Agreement, dated as of February 6, 2007, among Boston Properties LimitedPartnership, Boston Properties, Inc., JP Morgan Securities Inc. and Morgan Stanley & Co.Incorporated. (Incorporated by reference to Exhibit 4.3 to the Current Report on Form 8-K ofBoston Properties Limited Partnership filed on February 6, 2007.)
10.1 Second Amended and Restated Agreement of Limited Partnership of Boston Properties LimitedPartnership, dated as of June 29, 1998. (Incorporated by reference to Exhibit 99.1 to BostonProperties, Inc.’s Current Report on Form 8-K filed on July 15, 1998.)
10.2 Certificate of Designations for the Series Two Preferred Units, dated November 12, 1998,constituting an amendment to the Second Amended and Restated Agreement of LimitedPartnership of Boston Properties Limited Partnership. (Incorporated by reference to Exhibit 99.24to Boston Properties, Inc.’s Current Report on Form 8-K filed on November 25, 1998.)
10.3* Forty-Seventh Amendment to the Second Amended and Restated Agreement of Limited Partnershipof Boston Properties Limited Partnership, dated as of April 11, 2003, by Boston Properties, Inc., asgeneral partner. (Incorporated by reference to Exhibit 10.1 to Boston Properties, Inc.’s QuarterlyReport on Form 10-Q filed on August 14, 2003.)
10.4* Amended and Restated 1997 Stock Option and Incentive Plan, dated May 3, 2000, and forms ofoption agreements. (Incorporated by reference to Exhibit 10.6 to Boston Properties, Inc.’s AnnualReport on Form 10-K filed on March 30, 2001.)
10.5* Amendment No. 1 to Amended and Restated 1997 Stock Option and Incentive Plan as amended andrestated dated November 14, 2000. (Incorporated by reference to Exhibit 10.7 to BostonProperties, Inc.’s Annual Report on Form 10-K filed on March 30, 2001.)
10.6* Amendment No. 2 to Amended and Restated 1997 Stock Option and Incentive Plan as amended andrestated, dated March 4, 2003. (Incorporated by reference to Exhibit 10.1 to Boston Properties,Inc.’s Quarterly Report on Form 10-Q filed on May 14, 2003.)
141
10.7* Amendment No. 3 to Amended and Restated 1997 Stock Option and Incentive Plan as amended andrestated dated October 16, 2003. (Incorporated by reference to Exhibit 10.67 to Boston Properties,Inc.’s Annual Report on Form 10-K filed on February 26, 2004.)
10.8* Amendment No. 4 to Amended and Restated 1997 Stock Option and Incentive Plan as amended andrestated dated March 30, 2005. (Incorporated by reference to Exhibit 10.1 to Boston Properties,Inc.’s Quarterly Report of Form 10-Q filed on May 10, 2005.)
10.9* Amendment No. 5 to the Boston Properties, Inc. 1997 Stock Option and Incentive Plan, as amendedand restated dated on July 20, 2006. (Incorporated by reference to Exhibit 10.1 to BostonProperties, Inc.’s Quarterly Report on Form 10-Q filed on August 9, 2006.)
10.10* Boston Properties, Inc. 1999 Non-Qualified Employee Stock Purchase Plan. (Incorporated byreference to Exhibit 10.59 to Boston Properties, Inc.’s Annual Report of Form 10-K filed on March15, 2005.)
10.11* First Amendment to the Boston Properties, Inc. 1999 Non-Qualified Employee Stock Purchase Plan.(Incorporated by reference to Exhibit 10.60 to Boston Properties, Inc.’s Annual Report of Form10-K filed on March 15, 2005.)
10.12* Second Amendment to the Boston Properties, Inc. 1999 Non-Qualified Employee Stock PurchasePlan. (Incorporated by reference to Exhibit 10.61 to Boston Properties, Inc.’s Annual Report ofForm 10-K filed on March 15, 2005.)
10.13* Form of Employee Long Term Incentive Unit Vesting Agreement under the Boston Properties, Inc.Amended and Restated 1997 Stock Option and Incentive Plan. (Incorporated by reference to Exhibit10.68 to Boston Properties, Inc.’s Annual Report on Form 10-K filed on February 26, 2004.)
10.14* Form of Long Term Incentive Plan Unit Vesting Agreement between each of Messrs. Mortimer B.Zuckerman and Edward H. Linde and Boston Properties, Inc. and Boston Properties LimitedPartnership. (Incorporated by reference to Exhibit 10.69 to Boston Properties, Inc.’s Annual Reporton Form 10-K filed on February 26, 2004.)
10.15* Form of Director Long Term Incentive Plan Unit Vesting Agreement under the Boston Properties, Inc.Amended and Restated 1997 Stock Option and Incentive Plan. (Incorporated by reference to Exhibit10.2 to Boston Properties, Inc.’s Quarterly Report on Form 10-Q filed on August 14, 2003.)
10.16* Form of Employee Restricted Stock Award Agreement under the Boston Properties, Inc. 1997 StockOption and Incentive Plan. (Incorporated by reference to Exhibit 10.1 to Boston Properties, Inc.’sQuarterly Report on Form 10-Q filed on November 9, 2004.)
10.17* Form of Director Restricted Stock Award Agreement under the Boston Properties, Inc. Amended andRestated 1997 Stock Option and Incentive Plan. (Incorporated by reference to Exhibit 10.2 toBoston Properties, Inc.’s Quarterly Report on Form 10-Q filed on November 9, 2004.)
10.18* Boston Properties Deferred Compensation Plan effective, March 1, 2002. (Incorporated by referenceto Exhibit 10.1 to Boston Properties, Inc.’s Quarterly Report on Form 10-Q filed on May 15,2002.)
10.19* Employment Agreement by and between Mortimer B. Zuckerman and Boston Properties, Inc. datedas of January 17, 2003. (Incorporated by reference to Exhibit 10.7 to Boston Properties, Inc.’sAnnual Report on Form 10-K filed on February 27, 2003.)
10.20* Amended and Restated Employment Agreement by and between Edward H. Linde and BostonProperties, Inc. dated as of November 29, 2002. (Incorporated by reference to Exhibit 10.8 toBoston Properties, Inc.’s Annual Report on Form 10-K filed on February 27, 2003.)
10.21* Employment Agreement by and between Peter D. Johnston and Boston Properties, Inc. dated as ofAugust 25, 2005. (Incorporated by reference to Exhibit 10.2 to Boston Properties, Inc.’s QuarterlyReport of Form 10-Q filed on November 9, 2005.)
142

10.22* Employment Agreement by and between Bryan J. Koop and Boston Properties, Inc. dated as ofNovember 29, 2002. (Incorporated by reference to Exhibit 10.10 to Boston Properties, Inc.’sAnnual Report on Form 10-K filed on February 27, 2003.)
10.23* Employment Agreement by and between Mitchell S. Landis and Boston Properties, Inc. dated as ofNovember 26, 2002. (Incorporated by reference to Exhibit 10.11 to Boston Properties, Inc.’sAnnual Report on Form 10-K filed on February 27, 2003.)
10.24* Employment Agreement by and between Douglas T. Linde and Boston Properties, Inc. dated as ofNovember 29, 2002. (Incorporated by reference to Exhibit 10.12 to Boston Properties, Inc.’sAnnual Report on Form 10-K filed on February 27, 2003.)
10.25* Amended and Restated Employment Agreement by and between E. Mitchell Norville and BostonProperties, Inc. dated as of August 25, 2005. (Incorporated by reference to Exhibit 10.1 to BostonProperties, Inc.’s Quarterly Report of Form 10-Q filed on November 9, 2005.)
10.26* Employment Agreement by and between Robert E. Pester and Boston Properties, Inc. dated as ofDecember 16, 2002. (Incorporated by reference to Exhibit 10.14 to Boston Properties, Inc.’sAnnual Report on Form 10-K filed on February 27, 2003.)
10.27* Amended and Restated Employment Agreement by and between Raymond A. Ritchey and BostonProperties, Inc. dated as of November 29, 2002. (Incorporated by reference to Exhibit 10.15 toBoston Properties, Inc.’s Annual Report on Form 10-K filed on February 27, 2003.)
10.28* Amended and Restated Employment Agreement by and between Robert E. Selsam and BostonProperties, Inc. dated as of November 29, 2002. (Incorporated by reference to Exhibit 10.16 toBoston Properties, Inc.’s Annual Report on Form 10-K filed on February 27, 2003.)
10.29* Compensation Agreement between Boston Properties, Inc. and Robert E. Selsam, dated as of August10, 1995 relating to 90 Church Street. (Incorporated by reference to Exhibit 10.26 to BostonProperties, Inc.’s Registration Statement on Form S-11, File No. 333-25279.)
10.30* Senior Executive Severance Agreement by and among Boston Properties, Inc., Boston PropertiesLimited Partnership and Mortimer B. Zuckerman. (Incorporated by reference to Exhibit 10.17 toBoston Properties, Inc.’s Annual Report on Form 10-K filed on February 27, 2003.)
10.31* Senior Executive Severance Agreement by and among Boston Properties, Inc., Boston PropertiesLimited Partnership and Edward H. Linde. (Incorporated by reference to Exhibit 10.18 to BostonProperties, Inc.’s Annual Report on Form 10-K filed on February 27, 2003.)
10.32* Boston Properties, Inc. Senior Executive Severance Plan. (Incorporated by reference to Exhibit 10.19to Boston Properties, Inc.’s Annual Report on Form 10-K filed on February 27, 2003.)
10.33* Boston Properties, Inc. Executive Severance Plan. (Incorporated by reference to Exhibit 10.20 toBoston Properties, Inc.’s Annual Report on Form 10-K filed on February 27, 2003.)
10.34* Form of Indemnification Agreement by and among Boston Properties, Inc., Boston Properties LimitedPartnership and certain officers and directors of Boston Properties, Inc. (Incorporated by reference toExhibit 10.1 to Boston Properties, Inc.’s Quarterly Report on Form 10-Q filed on August 9, 2004.)
10.35* Omnibus Option Agreement by and among Boston Properties Limited Partnership and the Grantorsnamed therein, dated as of April 9, 1997. (Incorporated by reference to Exhibit 10.6 to BostonProperties, Inc.’s Registration Statement on Form S-11, File No. 333-25279.)
10.36 Fourth Amended and Restated Revolving Credit Agreement, dated as of May 19, 2005, amongBoston Properties Limited Partnership and the banks identified therein and Bank of America, N.A.as administrative agent, swingline lender and fronting bank, JPMorgan Chase Bank, N.A. assyndication agent, and Commerzbank AG, Keybank National Association and Wells Fargo BankNational Association as documentation agents, with Banc of America Securities LLC and J.P.Morgan Securities, Inc. acting as joint lead arrangers and joint bookrunners. (Incorporated byreference to Exhibit 10.1 to Boston Properties, Inc.’s Current Report on Form 8-K filed on May 23,2005.)
143

10.37 Fifth Amended and Restated Revolving Credit Agreement, dated as of August 3, 2006, among BostonProperties Limited Partnership and the banks identified therein and Bank of America, N.A. asadministrative agent, swingline lender and fronting bank, JPMorgan Chase Bank, N.A. assyndication agent, and Eurohypo AG-New York Branch, Keybank National Association, WellsFargo Bank National Association as documentation agents, with The Bank of New York, CiticorpNorth America, Inc., Citizens Bank of Massachusetts, Deutsche Bank Trust Company, PNC Bank-National Association as co-managing agents and J.P. Morgan Securities Inc. and Banc of AmericaSecurities LLC acting as joint lead arrangers and joint bookrunners. (Incorporated by reference toExhibit 10.2 to Boston Properties, Inc.’s Quarterly Report on Form 10-Q filed on August 9, 2006.)
10.38 Contribution and Conveyance Agreement concerning the Carnegie Portfolio, dated June 30, 1998, byand among Boston Properties, Inc., Boston Properties Limited Partnership, and the parties namedtherein as Landis Parties. (Incorporated by reference to Exhibit 99.3 to Boston Properties, Inc.’sCurrent Report on Form 8-K filed on July 15, 1998.)
10.39 Contribution Agreement, dated June 30, 1998, by and among Boston Properties, Inc., BostonProperties Limited Partnership, and the parties named therein as Landis Parties. (Incorporated byreference to Exhibit 99.4 to Boston Properties, Inc.’s Current Report on Form 8-K filed on July 15,1998.)
10.40 Agreement, dated as of October 21, 2004, by and among Boston Properties Limited Partnership,Boston Properties, Inc., Alan B. Landis, The Landis Group, ABL Capital Corp. and Princeton LandPartners, L.L.C. (Incorporated by reference to Exhibit 99.1 to Boston Properties, Inc.’s CurrentReport on Form 8-K filed on October 25, 2004.)
10.41 Development Agreement, dated as of June 30, 1998, by and among Boston Properties LimitedPartnership, ABL Capital Corp. and Princeton Land Partners, L.L.C. (Incorporated by reference toExhibit 99.2 to Boston Properties, Inc.’s Current Report on Form 8-K filed on October 25, 2004.)
10.42 First Amendment to Development Agreement, dated as of October 21, 2004, by and among BostonProperties Limited Partnership, ABL Capital Corp. and Princeton Land Partners, L.L.C.(Incorporated by reference to Exhibit 99.3 to Boston Properties, Inc.’s Current Report on Form 8-Kfiled on October 25, 2004.)
10.43 Contribution Agreement, dated as of November 12, 1998, by and among Boston Properties, Inc.,Boston Properties Limited Partnership, Embarcadero Center Investors Partnership and the partnersin Embarcadero Center Investors Partnership listed on Exhibit A thereto. (Incorporated by referenceto Exhibit 99.2 to Boston Properties, Inc.’s Current Report on Form 8-K filed on November 25,1998.)
10.44 Master Agreement by and between New York State Common Retirement Fund and Boston PropertiesLimited Partnership, dated as of May 12, 2000. (Incorporated by reference to Exhibit 10.54 toBoston Properties, Inc.’s Annual Report on Form 10-K filed on March 30, 2001.)
10.45 Purchase and Sale Agreement between BP 280 Park Avenue LLC and Istithmar Building FZE datedApril 26, 2006. (Incorporated by reference to Exhibit 10.1 to Boston Properties, Inc.’s QuarterlyReport on Form 10-Q filed on May 10, 2006.)
10.46 Purchase and Sale Agreement, dated as of November 17, 2006, between No. 5 Times SquareDevelopment LLC and AVR Crossroads LLC. (Incorporated by reference to Exhibit 2.1 to BostonProperties, Inc.’s Current Report on Form 8-K filed on February 16, 2007.)
10.47 Amendment to Purchase and Sale Agreement, dated as of February 15, 2007, between No. 5 TimesSquare Development LLC and AVR Crossroads LLC. (Incorporated by reference to Exhibit 2.2 toBoston Properties, Inc.’s Current Report on Form 8-K filed on February 16, 2007.)
144
10.48 ESAC Receivable Sale Agreement, dated as of November 17, 2006, between No. 5 Times SquareDevelopment LLC and AVR Crossroads LLC. (Incorporated by reference to Exhibit 2.3 to BostonProperties, Inc.’s Current Report on Form 8-K filed on February 16, 2007.)
10.49 Amendment to ESAC Receivable Sale Agreement, dated as of February 15, 2007, between No. 5Times Square Development LLC and AVR Crossroads LLC. (Incorporated by reference to Exhibit2.4 to Boston Properties, Inc.’s Current Report on Form 8-K filed on February 16, 2007.)
10.50 Purchase Agreement, dated as of January 31, 2007, among Boston Properties Limited Partnership,Boston Properties, Inc. (solely for purposes of Sections 4(k), 4(p) and 5(k) therein), JP MorganSecurities Inc. and Morgan Stanley & Co. Incorporated. (Incorporated by reference to Exhibit 10.1to Current Report on Form 8-K of Boston Properties Limited Partnership filed on February 6, 2007.)
12.1 Statement re Computation of Ratios. (Filed herewith.)
21.1 Subsidiaries of Boston Properties, Inc. (Filed herewith.)
23.1 Consent of PricewaterhouseCoopers LLP, Independent Registered Public Accounting firm. (Filedherewith.)
31.1 Rule 13a-14(a)/15d-14(a) Certification of Chief Executive Officer pursuant to Section 302 of theSarbanes-Oxley Act of 2002. (Filed herewith.)
31.2 Rule 13a-14(a)/15d-14(a) Certification of Chief Financial Officer pursuant to Section 302 of theSarbanes-Oxley Act of 2002. (Filed herewith.)
32.1 Section 1350 Certification of Chief Executive Officer pursuant to Section 906 of the Sarbanes-OxleyAct of 2002. (Furnished herewith.)
32.2 Section 1350 Certification of Chief Financial Officer pursuant to Section 906 of the Sarbanes-OxleyAct of 2002. (Furnished herewith.)
* Indicates management contract or compensatory plan or arrangement required to be filed or incorporated byreference as an exhibit to this Form 10-K pursuant to Item 15(b) of Form 10-K.
145

SIGNATURES
Pursuant to the requirements of Section 13 or 15(d) of the Securities Exchange Act of 1934, the Registrant,Boston Properties, Inc., has duly caused this report to be signed on its behalf by the undersigned, thereunto dulyauthorized.
Boston Properties, Inc.
Date By: /s/ Douglas T. Linde
March 1, 2007 Douglas T. LindeExecutive Vice President, Chief Financial Officer
Pursuant to the requirements of the Securities Exchange Act of 1934, this report has been signed below bythe following persons on behalf of the Registrant, and in the capacities and on the dates indicated.
March 1, 2007 By: /s/ Mortimer B. Zuckerman
Mortimer B. ZuckermanChairman of the Board of Directors
By: /s/ Edward H. Linde
Edward H. LindeDirector, President and Chief Executive Officer
By: /s/ Lawrence S. Bacow
Lawrence S. BacowDirector
By: /s/ Zoë Baird
Zoë BairdDirector
By: /s/ William M. Daley
William M. DaleyDirector
By: /s/ Carol B. Einiger
Carol B. EinigerDirector
By: /s/ Alan J. Patricof
Alan J. PatricofDirector
By: /s/ Richard E. Salomon
Richard E. SalomonDirector
By: /s/ Martin Turchin
Martin TurchinDirector
146
By: /s/ David A. Twardock
David A. TwardockDirector
By: /s/ Douglas T. Linde
Douglas T. LindeExecutive Vice President, Chief Financial Officerand Principal Financial Officer
By: /s/ Arthur S. Flashman
Arthur S. FlashmanVice President, Controller and Principal AccountingOfficer
147

Exhibit 31.1
CERTIFICATION
I, Edward H. Linde, certify that:
1. I have reviewed this annual report on Form 10-K of Boston Properties, Inc.;
2. Based on my knowledge, this report does not contain any untrue statement of a material fact or omit tostate a material fact necessary to make the statements made, in light of the circumstances under whichsuch statements were made, not misleading with respect to the period covered by this report;
3. Based on my knowledge, the financial statements, and other financial information included in thisreport, fairly present in all material respects the financial condition, results of operations and cashflows of the registrant as of, and for, the periods presented in this report;
4. The registrant’s other certifying officer(s) and I are responsible for establishing and maintainingdisclosure controls and procedures (as defined in Exchange Act Rules 13a-15(e) and 15d-15(e)) andinternal control over financial reporting (as defined in Exchange Act Rules 13a-15(f) and 15d-15(f)) forthe registrant and have:
(a) Designed such disclosure controls and procedures, or caused such disclosure controls andprocedures to be designed under our supervision, to ensure that material information relating tothe registrant, including its consolidated subsidiaries, is made known to us by others within thoseentities, particularly during the period in which this report is being prepared;
(b) Designed such internal control over financial reporting, or caused such internal control overfinancial reporting to be designed under our supervision, to provide reasonable assuranceregarding the reliability of financial reporting and the preparation of financial statements forexternal purposes in accordance with generally accepted accounting principles;
(c) Evaluated the effectiveness of the registrant’s disclosure controls and procedures and presented inthis report our conclusions about the effectiveness of the disclosure controls and procedures, as ofthe end of the period covered by this report based on such evaluation; and
(d) Disclosed in this report any change in the registrant’s internal control over financial reporting thatoccurred during the registrant’s most recent fiscal quarter (the registrant’s fourth fiscal quarter inthe case of an annual report) that has materially affected, or is reasonably likely to materiallyaffect, the registrant’s internal control over financial reporting; and
5. The registrant’s other certifying officer(s) and I have disclosed, based on our most recent evaluation ofinternal control over financial reporting, to the registrant’s auditors and the audit committee of theregistrant’s board of directors (or persons performing the equivalent functions):
(a) All significant deficiencies and material weaknesses in the design or operation of internal controlover financial reporting which are reasonably likely to adversely affect the registrant’s ability torecord, process, summarize and report financial information; and
(b) Any fraud, whether or not material, that involves management or other employees who have asignificant role in the registrant’s internal control over financial reporting.
Date: March 1, 2007
/s/ EDWARD H. LINDE
Edward H. LindeChief Executive Officer

Exhibit 31.2
CERTIFICATION
I, Douglas T. Linde, certify that:
1. I have reviewed this annual report on Form 10-K of Boston Properties, Inc.;
2. Based on my knowledge, this report does not contain any untrue statement of a material fact or omit tostate a material fact necessary to make the statements made, in light of the circumstances under whichsuch statements were made, not misleading with respect to the period covered by this report;
3. Based on my knowledge, the financial statements, and other financial information included in thisreport, fairly present in all material respects the financial condition, results of operations and cashflows of the registrant as of, and for, the periods presented in this report;
4. The registrant’s other certifying officer(s) and I are responsible for establishing and maintainingdisclosure controls and procedures (as defined in Exchange Act Rules 13a-15(e) and 15d-15(e)) andinternal control over financial reporting (as defined in Exchange Act Rules 13a-15(f) and 15d-15(f)) forthe registrant and have:
(a) Designed such disclosure controls and procedures, or caused such disclosure controls andprocedures to be designed under our supervision, to ensure that material information relating tothe registrant, including its consolidated subsidiaries, is made known to us by others within thoseentities, particularly during the period in which this report is being prepared;
(b) Designed such internal control over financial reporting, or caused such internal control overfinancial reporting to be designed under our supervision, to provide reasonable assuranceregarding the reliability of financial reporting and the preparation of financial statements forexternal purposes in accordance with generally accepted accounting principles;
(c) Evaluated the effectiveness of the registrant’s disclosure controls and procedures and presented inthis report our conclusions about the effectiveness of the disclosure controls and procedures, as ofthe end of the period covered by this report based on such evaluation; and
(d) Disclosed in this report any change in the registrant’s internal control over financial reporting thatoccurred during the registrant’s most recent fiscal quarter (the registrant’s fourth fiscal quarter inthe case of an annual report) that has materially affected, or is reasonably likely to materiallyaffect, the registrant’s internal control over financial reporting; and
5. The registrant’s other certifying officer(s) and I have disclosed, based on our most recent evaluation ofinternal control over financial reporting, to the registrant’s auditors and the audit committee of theregistrant’s board of directors (or persons performing the equivalent functions):
(a) All significant deficiencies and material weaknesses in the design or operation of internal controlover financial reporting which are reasonably likely to adversely affect the registrant’s ability torecord, process, summarize and report financial information; and
(b) Any fraud, whether or not material, that involves management or other employees who have asignificant role in the registrant’s internal control over financial reporting.
Date: March 1, 2007
/s/ DOUGLAS T. LINDE
Douglas T. LindeChief Financial Officer

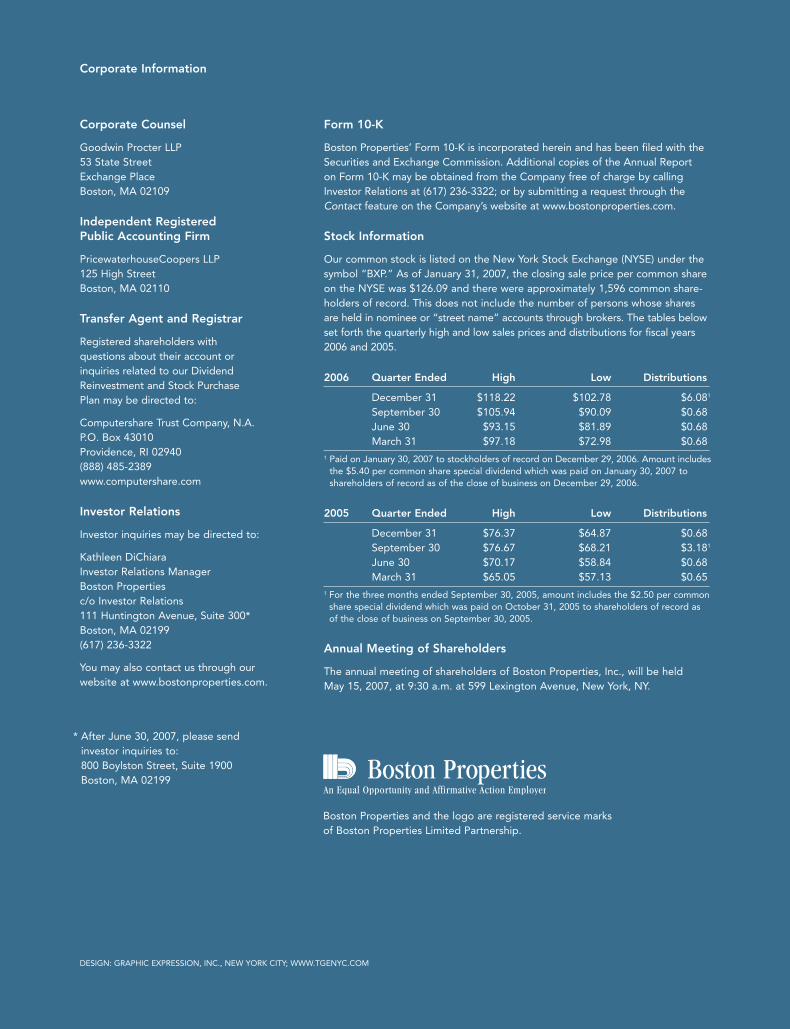
Corporate Counsel
Goodwin Procter LLP53 State StreetExchange PlaceBoston, MA 02109
Independent Registered Public Accounting Firm
PricewaterhouseCoopers LLP125 High StreetBoston, MA 02110
Transfer Agent and Registrar
Registered shareholders with questions about their account orinquiries related to our DividendReinvestment and Stock PurchasePlan may be directed to:
Computershare Trust Company, N.A.P.O. Box 43010Providence, RI 02940(888) 485-2389www.computershare.com
Investor Relations
Investor inquiries may be directed to:
Kathleen DiChiaraInvestor Relations ManagerBoston Properties c/o Investor Relations111 Huntington Avenue, Suite 300*Boston, MA 02199(617) 236-3322
You may also contact us through ourwebsite at www.bostonproperties.com.
Corporate Information
Form 10-K
Boston Properties’ Form 10-K is incorporated herein and has been filed with theSecurities and Exchange Commission. Additional copies of the Annual Report on Form 10-K may be obtained from the Company free of charge by callingInvestor Relations at (617) 236-3322; or by submitting a request through theContact feature on the Company’s website at www.bostonproperties.com.
Stock Information
Our common stock is listed on the New York Stock Exchange (NYSE) under thesymbol “BXP.” As of January 31, 2007, the closing sale price per common shareon the NYSE was $126.09 and there were approximately 1,596 common share-holders of record. This does not include the number of persons whose sharesare held in nominee or “street name” accounts through brokers. The tables belowset forth the quarterly high and low sales prices and distributions for fiscal years2006 and 2005.
2006 Quarter Ended High Low Distributions
December 31 $118.22 $102.78 $6.081
September 30 $105.94 $90.09 $0.68June 30 $93.15 $81.89 $0.68March 31 $97.18 $72.98 $0.68
1 Paid on January 30, 2007 to stockholders of record on December 29, 2006. Amount includesthe $5.40 per common share special dividend which was paid on January 30, 2007 toshareholders of record as of the close of business on December 29, 2006.
2005 Quarter Ended High Low Distributions
December 31 $76.37 $64.87 $0.68September 30 $76.67 $68.21 $3.181
June 30 $70.17 $58.84 $0.68March 31 $65.05 $57.13 $0.65
1 For the three months ended September 30, 2005, amount includes the $2.50 per commonshare special dividend which was paid on October 31, 2005 to shareholders of record as of the close of business on September 30, 2005.
Annual Meeting of Shareholders
The annual meeting of shareholders of Boston Properties, Inc., will be held May 15, 2007, at 9:30 a.m. at 599 Lexington Avenue, New York, NY.
DESIGN: GRAPHIC EXPRESSION, INC., NEW YORK CITY; WWW.TGENYC.COM
Boston Properties and the logo are registered service marks of Boston Properties Limited Partnership.
* After June 30, 2007, please send investor inquiries to:800 Boylston Street, Suite 1900Boston, MA 02199

Boston Properties, Inc.
Corporate Headquarters
111 Huntington Avenue*
at The Prudential Center
Boston, MA 02199
(617) 236-3300
www.bostonproperties.com
Regional Offices
111 Huntington Avenue*
at The Prudential Center
Boston, MA 02199
(617) 236-3300
599 Lexington Avenue
New York, NY 10022
(212) 326-4000
901 New York Avenue, N.W.
Washington, DC 20001
(202) 585-0800
Four Embarcadero Center
San Francisco, CA 94111
(415) 772-0700
302 Carnegie Center
Princeton, NJ 08540
(609) 452-1444
1653-AR-06
* As of June 2007, our Headquarters and
Boston Regional office will be located at:
800 Boylston Street
at The Prudential Center
Boston, MA 02199