Borders NHS Board
15
Appendix-2017-39 1 Borders NHS Board NHS BORDERS 2016/17 WINTER PERIOD REPORT Aim To update the Board on key activity relating to the 2016/17 winter period. Background NHS Borders, like all Scottish Health Boards, is required on an annual basis to produce a Winter Plan which outlines potential risks and contingency planning relevant to the winter season, with a particular focus on the festive period. The 2016/17 Winter Plan was developed as the first Scottish Borders Joint Winter Plan between NHS Borders and Scottish Borders Council and was approved at the October 2016 NHS Borders Board and subsequently noted by the Integrated Joint Board in November 2016. The Winter Plan is an overarching plan which signposts other relevant plans, which may be required over the winter period, for example severe weather plans, pandemic influenza plans and infection control policies and protocols. The overall aim of the planning process is to ensure that the partnership prepares effectively for winter pressures so as to continue to deliver high quality care, as well as national and local targets. After each winter period the Winter Planning Group assesses what worked well and what did not, over the previous period and key recommendations are made, which are taken forward in preparation for the next winter period. The key recommendations from 2015/16 can be found at the end of this report and a review meeting for understanding the lessons learned from 2016/17 is scheduled for April 2017. Assessment As in previous years the key elements of the 2016/17 winter plan were staffing resilience, unscheduled and elective capacity planning, including appropriate escalation and contingency or surge, infection control planning and procedures, and our communication strategy. Prevention of admissions In 2016/17 there was a programme of vaccinating NHS staff against influenza. As of end December 2016 (when monitoring ceased), 41% of staff had been vaccinated against a target set by the Scottish Government of 50%. 39% of nursing staff and 36% of medical staff were vaccinated. This is a decrease in performance compared to 2015/16 when the overall uptake was 44%. Planning for 2017/18 has already commenced with a focus on improving uptake amongst clinical staff and it is hoped that the results reported in 2016/17 can be further built upon next year.
-
Upload
khangminh22 -
Category
Documents
-
view
1 -
download
0
Transcript of Borders NHS Board
Appendix-2017-39
1
Borders NHS Board
NHS BORDERS 2016/17 WINTER PERIOD REPORT Aim To update the Board on key activity relating to the 2016/17 winter period. Background NHS Borders, like all Scottish Health Boards, is required on an annual basis to produce a Winter Plan which outlines potential risks and contingency planning relevant to the winter season, with a particular focus on the festive period. The 2016/17 Winter Plan was developed as the first Scottish Borders Joint Winter Plan between NHS Borders and Scottish Borders Council and was approved at the October 2016 NHS Borders Board and subsequently noted by the Integrated Joint Board in November 2016. The Winter Plan is an overarching plan which signposts other relevant plans, which may be required over the winter period, for example severe weather plans, pandemic influenza plans and infection control policies and protocols. The overall aim of the planning process is to ensure that the partnership prepares effectively for winter pressures so as to continue to deliver high quality care, as well as national and local targets. After each winter period the Winter Planning Group assesses what worked well and what did not, over the previous period and key recommendations are made, which are taken forward in preparation for the next winter period. The key recommendations from 2015/16 can be found at the end of this report and a review meeting for understanding the lessons learned from 2016/17 is scheduled for April 2017. Assessment As in previous years the key elements of the 2016/17 winter plan were staffing resilience, unscheduled and elective capacity planning, including appropriate escalation and contingency or surge, infection control planning and procedures, and our communication strategy. Prevention of admissions In 2016/17 there was a programme of vaccinating NHS staff against influenza. As of end December 2016 (when monitoring ceased), 41% of staff had been vaccinated against a target set by the Scottish Government of 50%. 39% of nursing staff and 36% of medical staff were vaccinated. This is a decrease in performance compared to 2015/16 when the overall uptake was 44%. Planning for 2017/18 has already commenced with a focus on improving uptake amongst clinical staff and it is hoped that the results reported in 2016/17 can be further built upon next year.
Appendix-2017-39
2
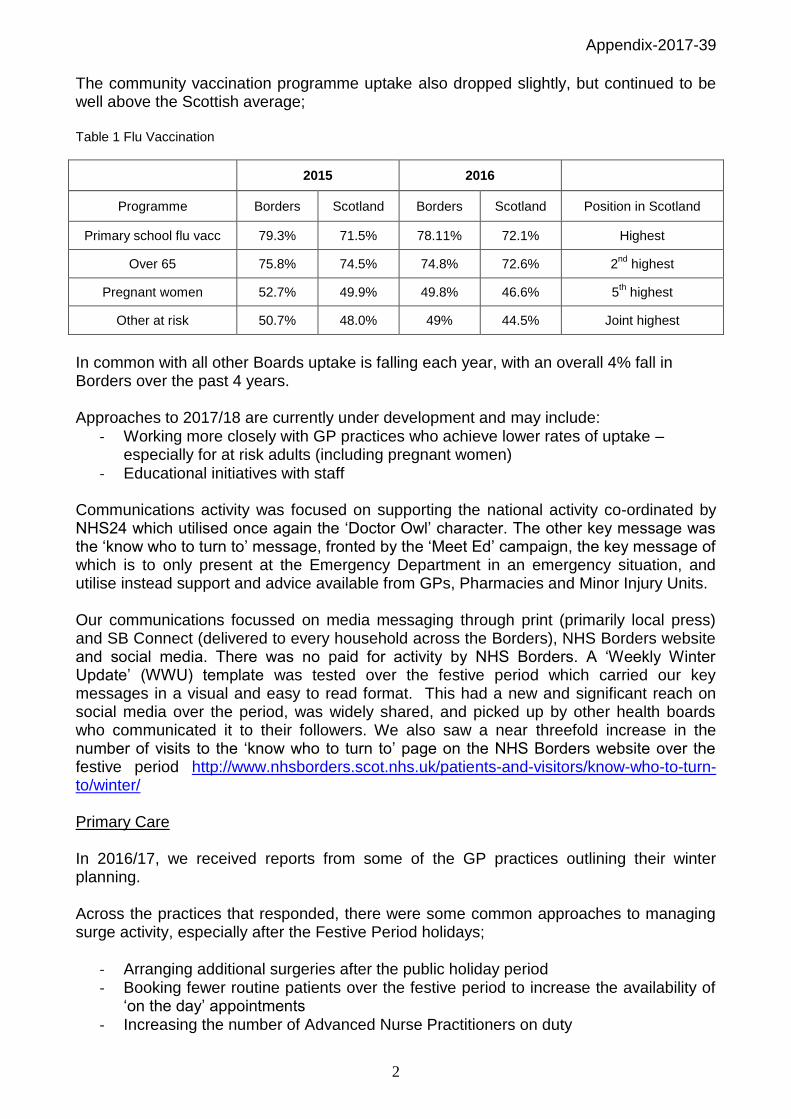
The community vaccination programme uptake also dropped slightly, but continued to be well above the Scottish average; Table 1 Flu Vaccination
2015 2016
Programme Borders Scotland Borders Scotland Position in Scotland
Primary school flu vacc 79.3% 71.5% 78.11% 72.1% Highest
Over 65 75.8% 74.5% 74.8% 72.6% 2nd
highest
Pregnant women 52.7% 49.9% 49.8% 46.6% 5th highest
Other at risk 50.7% 48.0% 49% 44.5% Joint highest
In common with all other Boards uptake is falling each year, with an overall 4% fall in Borders over the past 4 years. Approaches to 2017/18 are currently under development and may include:
- Working more closely with GP practices who achieve lower rates of uptake – especially for at risk adults (including pregnant women)
- Educational initiatives with staff Communications activity was focused on supporting the national activity co-ordinated by NHS24 which utilised once again the ‘Doctor Owl’ character. The other key message was the ‘know who to turn to’ message, fronted by the ‘Meet Ed’ campaign, the key message of which is to only present at the Emergency Department in an emergency situation, and utilise instead support and advice available from GPs, Pharmacies and Minor Injury Units. Our communications focussed on media messaging through print (primarily local press) and SB Connect (delivered to every household across the Borders), NHS Borders website and social media. There was no paid for activity by NHS Borders. A ‘Weekly Winter Update’ (WWU) template was tested over the festive period which carried our key messages in a visual and easy to read format. This had a new and significant reach on social media over the period, was widely shared, and picked up by other health boards who communicated it to their followers. We also saw a near threefold increase in the number of visits to the ‘know who to turn to’ page on the NHS Borders website over the festive period http://www.nhsborders.scot.nhs.uk/patients-and-visitors/know-who-to-turn-to/winter/ Primary Care In 2016/17, we received reports from some of the GP practices outlining their winter planning. Across the practices that responded, there were some common approaches to managing surge activity, especially after the Festive Period holidays;
- Arranging additional surgeries after the public holiday period - Booking fewer routine patients over the festive period to increase the availability of
‘on the day’ appointments - Increasing the number of Advanced Nurse Practitioners on duty
Appendix-2017-39
3
- Increasing the number of ‘on the day’ appointments on the Fridays immediately before the public holidays
- Having extra dispensing staff on duty immediately prior to Christmas - Increasing the number of GPs available for emergency appointments and home
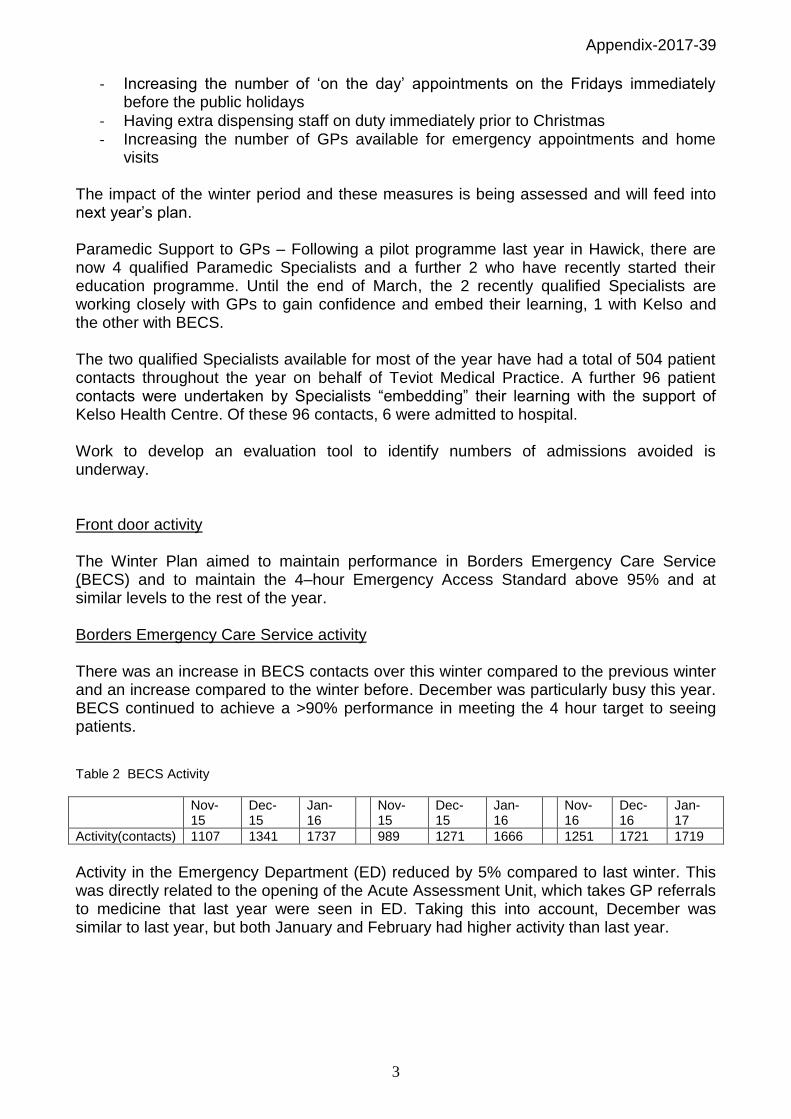
visits The impact of the winter period and these measures is being assessed and will feed into next year’s plan. Paramedic Support to GPs – Following a pilot programme last year in Hawick, there are now 4 qualified Paramedic Specialists and a further 2 who have recently started their education programme. Until the end of March, the 2 recently qualified Specialists are working closely with GPs to gain confidence and embed their learning, 1 with Kelso and the other with BECS. The two qualified Specialists available for most of the year have had a total of 504 patient contacts throughout the year on behalf of Teviot Medical Practice. A further 96 patient contacts were undertaken by Specialists “embedding” their learning with the support of Kelso Health Centre. Of these 96 contacts, 6 were admitted to hospital. Work to develop an evaluation tool to identify numbers of admissions avoided is underway. Front door activity The Winter Plan aimed to maintain performance in Borders Emergency Care Service (BECS) and to maintain the 4–hour Emergency Access Standard above 95% and at similar levels to the rest of the year. Borders Emergency Care Service activity There was an increase in BECS contacts over this winter compared to the previous winter and an increase compared to the winter before. December was particularly busy this year. BECS continued to achieve a >90% performance in meeting the 4 hour target to seeing patients. Table 2 BECS Activity
Nov- 15
Dec- 15
Jan- 16
Nov- 15
Dec- 15
Jan- 16
Nov-16
Dec-16
Jan- 17
Activity(contacts) 1107 1341 1737 989 1271 1666 1251 1721 1719
Activity in the Emergency Department (ED) reduced by 5% compared to last winter. This was directly related to the opening of the Acute Assessment Unit, which takes GP referrals to medicine that last year were seen in ED. Taking this into account, December was similar to last year, but both January and February had higher activity than last year.

Appendix-2017-39
4
Table 3 Combined ED/AAU Activity
Patient Flow Description
Nov-15
Dec-15
Jan-16
Feb-16
Nov-16
Dec-16
Jan-17
Feb-17
Flow 1: Minor injury and illness 1229 1125 1190 1123 1285 1300 1220 1106
Flow 2: Acute assessment – includes major injuries
195 246 261 230 199 211 286 234
Flow 3: Medical admissions 561 354 408 408 390 469 467 399
Flow 4: Surgical admissions 174 207 190 196 206 197 234 183
Total 2159 1932 2049 1957 2080 2177 2207 1922
Table 4 EAS performance
Apr May Jun July Aug Sept Oct Nov Dec Jan Feb
EAS performance 15/16
94.8 96.5 96.3 97.1 96.4 96.6 96.0 97.2 96.8 96.8 96.3
EAS performance 16/17
94.9 93.2 97.2 96.7 94.3 95.1 95.7 95.6 96.7 91.7 95.7
The Emergency Access Standard (EAS) of 95% was achieved each month except January over the winter period. The highest cause of breaches was wait for beds (61% of all breaches in January and 35% in February). The proportion of breaches related to delays to assessment by ED remained low at 10% in January and 18% in February. The Acute Assessment Unit, established in December 2015, continued to manage acutely ill medical patients. There was a 38% decrease in the numbers seen in AAU compared to last year. This may partially be related to the fact that AAU closes at 8pm this year instead of operating 24 hours last year. AAU was also converted to an inpatient unit for 4 days in January and therefore was not operational for this period. However, the proportion of patients seen who were discharged home from AAU increased from 31% last year to 41% this year. There was also a 45% increase (150 more attendances) in ambulatory care this year compared to last year. Assuming one-third of Ambulatory Care attendances are patients where an admission is avoided, this would mean that the number of patients who were not admitted due to being managed through AAU and ACU fell from 353 to 302 between last winter and this winter. Graph 1: AAU performance

Appendix-2017-39
5
Table 5: AAU Performance
Dec- 15 Jan- 16 Feb- 16 Dec- 16 Jan- 17 Feb- 17
Attendances 278 276 314 187 172 185
Breaches 42 47 30 16 52 18
Table 6 Ambulatory Care
Nov-16 Dec-16 Jan-17 Feb-17
Attendees 146 62 186 154
Graph 2: Ambulatory Care (ACU) attendances by month
The Rapid Assessment and Discharge (RAD) team was extended to operate on 6 days/week during the winter period providing rapid AHP assessment for patients whose condition might enable immediate discharge. The numbers of patients seen increased by 56% compared to the previous year, and by almost 96% for the month of January. On average, 42% of patients seen by RAD were discharged within 24 hours. Table 7 Rapid Assessment and Discharge Team activity
Month Jan-15 Jan-16 Nov-16 Dec-16 Jan-17 Feb-17
Referrals in total 47 109 146 171 210 155
Referrals from A & E 12 24 34 19 24 26
Referrals from MAU/ AAU 35 85 112 152 186 129
% of patients leaving Hospital within 24 hours / next day
55% 38% 44% 36% 41% 47%
0 50
100 150 200 250
Dec
-15
Jan
-16
Feb
-16
Mar
-16
Ap
r-1
6
May
-16
Jun
-16
Jul-
16
Au
g-1
6
Sep
-16
Oct
-16
No
v-1
6
Dec
-16
Jan
-17
Feb
-17
Mar
-17
ACU attendances - monthly
ACU attendances Mean UCL LCL

Appendix-2017-39
6
Admissions Admissions to the BGH over the winter period rose by approximately 2% between Dec-Feb this winter compared to last winter*. There was a 6% fall in medical admissions and a 12% increase in other admissions. General Medical admissions reduced from an average 56% of all admissions to 50% compared to the previous year. The most significant change was a fall in admissions overall in February not accounted for by the extra Leap Year day in February last year. *November 15 data not comparable due to establishment of Acute Assessment Unit on 2
nd Dec 2015
Table 8: Monthly admissions to Borders General Hospital
Nov-15
Dec-15
Jan-16
Feb-16
Nov-16
Dec-16
Jan-17
Feb-17
General Medicine 688 620 631 634 570 630 601 540
BGH (Excluding General Medicine)
617 584 443 697 634 626 483 554
Total BGH 1305 1204 1074 1331 1204 1256 1084 1094
Bed capacity Following the remodelling of the medical and surgical units, the winter plan this year aimed to open 10 surge beds only – 8 annexe beds in the Medical Assessment Unit and 2 beds in Borders Stroke Unit. In practice, surge bed numbers were as follows: Table 9 Surge Beds
2015/16 2016/17
Nov- 15
Dec-15
Jan- 16 Feb- 16 Nov- 16 Dec- 16 Jan- 17
Feb- 17
Beddays 319 294 476 495 196 243 564 308
Average beds open 10.6 9.5 15.4 22.5 6.5 7.8 18.2 22.6
The following surge capacity was opened;
MAU annexe was open for the full duration of the winter period, with only 5 days when the capacity was reduced below 8 beds
Borders Stroke Unit extra beds were open for 76 days
The 5 Knoll beds were opened with no additional staffing requirement to re-establish full bed complement of 23 beds
In addition, due to significant bed pressures, PSAU was converted to Ward 8 for 17 days. This is a reduction of 56 days of opening compared to 2015/16, when Ward 8 was open for 73 days. There were also 7 occasions when patients were managed overnight within AAU.

Appendix-2017-39
7
It should be noted that in 2015/16, NHS Borders used approximately 13 flex beds in nursing homes to assist with discharge of patients from hospital. These beds were not available this winter resulting in a reduction in bed days and reduced costs. Bed occupancy Bed occupancy rose significantly compared to last winter at both midday and midnight; Table 10 Percentage Occupancy
2015/16 2016/17
Nov-15 Dec- 15 Jan- 16 Feb-16 Nov- 16 Dec- 16 Jan -17 Feb-17
Midday 92.6% 88.8% 92.9% 91.1% 92.1% 89.6% 95.4% 93.0%
Midnight 89.5% 85.2% 89.2% 87.2% 89.0% 86.1% 91.9% 88.6%
Boarding There was a decrease in numbers of boarding patients during November and December 2016 compared to the previous year. However, there was a large increase during January and February 2017. Overall, boarding slightly increased this winter compared to last winter (by the equivalent of 1 bed per day). Table 11 Boarding
Nov-15 Dec-15 Jan-16 Feb-16 Nov-16 Dec-16 Jan-17 Feb-17
Total boarding beddays 444 272 477 324 308 296 706 419
Average boarding patients 15 9 15 11 10 10 23 15
Graph 3 Patient Boarding
Appendix-2017-39
8
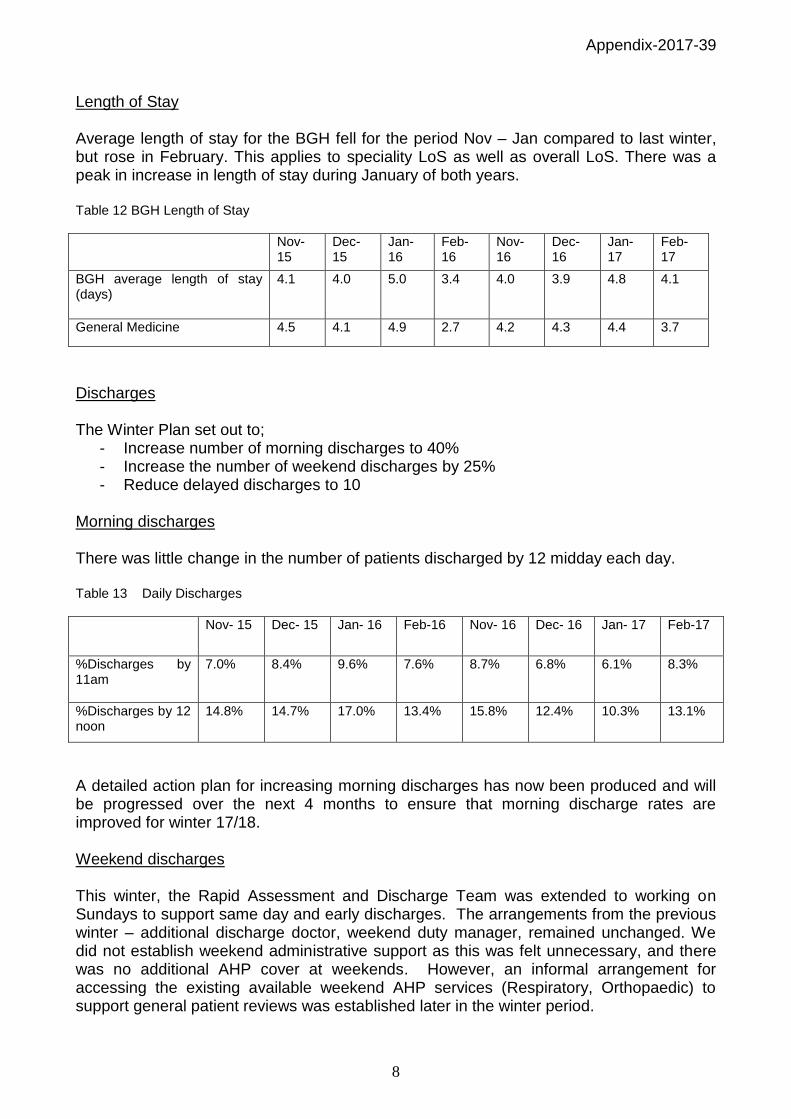
Length of Stay Average length of stay for the BGH fell for the period Nov – Jan compared to last winter, but rose in February. This applies to speciality LoS as well as overall LoS. There was a peak in increase in length of stay during January of both years. Table 12 BGH Length of Stay
Nov-15
Dec-15
Jan-16
Feb-16
Nov-16
Dec-16
Jan-17
Feb-17
BGH average length of stay (days)
4.1 4.0 5.0 3.4 4.0 3.9 4.8 4.1
General Medicine 4.5 4.1 4.9 2.7 4.2 4.3 4.4 3.7
Discharges The Winter Plan set out to;
- Increase number of morning discharges to 40% - Increase the number of weekend discharges by 25% - Reduce delayed discharges to 10
Morning discharges There was little change in the number of patients discharged by 12 midday each day. Table 13 Daily Discharges
Nov- 15 Dec- 15 Jan- 16 Feb-16 Nov- 16 Dec- 16 Jan- 17 Feb-17
%Discharges by 11am
7.0% 8.4% 9.6% 7.6% 8.7% 6.8% 6.1% 8.3%
%Discharges by 12 noon
14.8% 14.7% 17.0% 13.4% 15.8% 12.4% 10.3% 13.1%
A detailed action plan for increasing morning discharges has now been produced and will be progressed over the next 4 months to ensure that morning discharge rates are improved for winter 17/18. Weekend discharges This winter, the Rapid Assessment and Discharge Team was extended to working on Sundays to support same day and early discharges. The arrangements from the previous winter – additional discharge doctor, weekend duty manager, remained unchanged. We did not establish weekend administrative support as this was felt unnecessary, and there was no additional AHP cover at weekends. However, an informal arrangement for accessing the existing available weekend AHP services (Respiratory, Orthopaedic) to support general patient reviews was established later in the winter period.
Appendix-2017-39
9
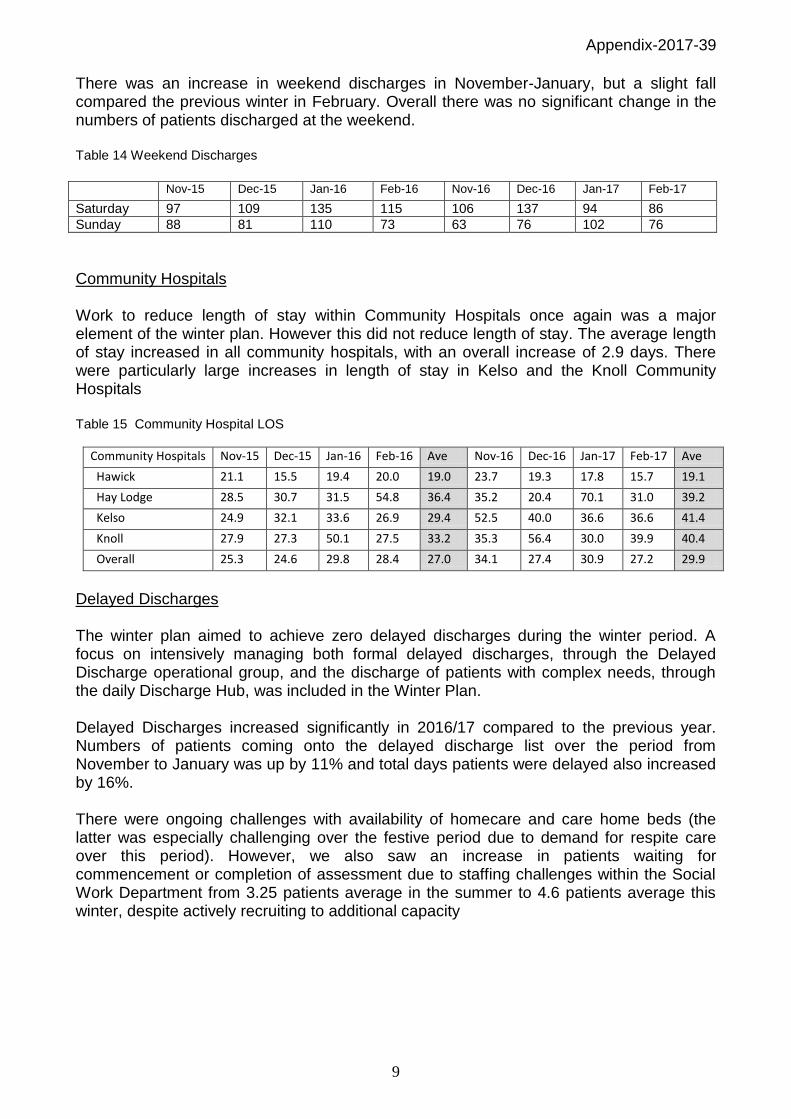
There was an increase in weekend discharges in November-January, but a slight fall compared the previous winter in February. Overall there was no significant change in the numbers of patients discharged at the weekend. Table 14 Weekend Discharges
Nov-15 Dec-15 Jan-16 Feb-16 Nov-16 Dec-16 Jan-17 Feb-17
Saturday 97 109 135 115 106 137 94 86
Sunday 88 81 110 73 63 76 102 76
Community Hospitals Work to reduce length of stay within Community Hospitals once again was a major element of the winter plan. However this did not reduce length of stay. The average length of stay increased in all community hospitals, with an overall increase of 2.9 days. There were particularly large increases in length of stay in Kelso and the Knoll Community Hospitals Table 15 Community Hospital LOS
Community Hospitals Nov-15 Dec-15 Jan-16 Feb-16 Ave Nov-16 Dec-16 Jan-17 Feb-17 Ave
Hawick 21.1 15.5 19.4 20.0 19.0 23.7 19.3 17.8 15.7 19.1
Hay Lodge 28.5 30.7 31.5 54.8 36.4 35.2 20.4 70.1 31.0 39.2
Kelso 24.9 32.1 33.6 26.9 29.4 52.5 40.0 36.6 36.6 41.4
Knoll 27.9 27.3 50.1 27.5 33.2 35.3 56.4 30.0 39.9 40.4
Overall 25.3 24.6 29.8 28.4 27.0 34.1 27.4 30.9 27.2 29.9
Delayed Discharges The winter plan aimed to achieve zero delayed discharges during the winter period. A focus on intensively managing both formal delayed discharges, through the Delayed Discharge operational group, and the discharge of patients with complex needs, through the daily Discharge Hub, was included in the Winter Plan. Delayed Discharges increased significantly in 2016/17 compared to the previous year. Numbers of patients coming onto the delayed discharge list over the period from November to January was up by 11% and total days patients were delayed also increased by 16%. There were ongoing challenges with availability of homecare and care home beds (the latter was especially challenging over the festive period due to demand for respite care over this period). However, we also saw an increase in patients waiting for commencement or completion of assessment due to staffing challenges within the Social Work Department from 3.25 patients average in the summer to 4.6 patients average this winter, despite actively recruiting to additional capacity
Appendix-2017-39
10
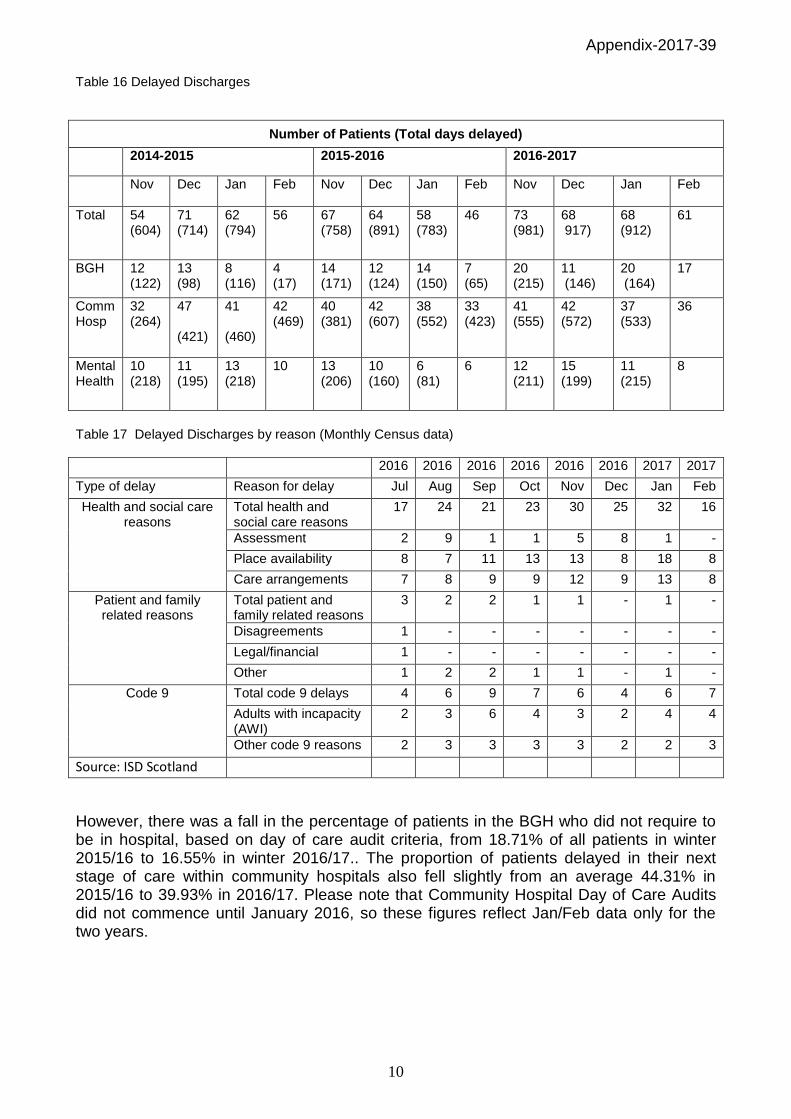
Table 16 Delayed Discharges
Number of Patients (Total days delayed)
2014-2015 2015-2016 2016-2017
Nov Dec Jan Feb Nov Dec Jan Feb Nov Dec Jan Feb
Total 54 (604)
71 (714)
62 (794)
56 67 (758)
64 (891)
58 (783)
46 73 (981)
68 917)
68 (912)
61
BGH 12 (122)
13 (98)
8 (116)
4 (17)
14 (171)
12 (124)
14 (150)
7 (65)
20 (215)
11 (146)
20 (164)
17
Comm Hosp
32 (264)
47 (421)
41 (460)
42 (469)
40 (381)
42 (607)
38 (552)
33 (423)
41 (555)
42 (572)
37 (533)
36
Mental Health
10 (218)
11 (195)
13 (218)
10 13 (206)
10 (160)
6 (81)
6 12 (211)
15 (199)
11 (215)
8
Table 17 Delayed Discharges by reason (Monthly Census data)
2016 2016 2016 2016 2016 2016 2017 2017
Type of delay Reason for delay Jul Aug Sep Oct Nov Dec Jan Feb
Health and social care reasons
Total health and social care reasons
17 24 21 23 30 25 32 16
Assessment 2 9 1 1 5 8 1 -
Place availability 8 7 11 13 13 8 18 8
Care arrangements 7 8 9 9 12 9 13 8
Patient and family related reasons
Total patient and family related reasons
3 2 2 1 1 - 1 -
Disagreements 1 - - - - - - -
Legal/financial 1 - - - - - - -
Other 1 2 2 1 1 - 1 -
Code 9 Total code 9 delays 4 6 9 7 6 4 6 7
Adults with incapacity (AWI)
2 3 6 4 3 2 4 4
Other code 9 reasons 2 3 3 3 3 2 2 3
Source: ISD Scotland
However, there was a fall in the percentage of patients in the BGH who did not require to be in hospital, based on day of care audit criteria, from 18.71% of all patients in winter 2015/16 to 16.55% in winter 2016/17.. The proportion of patients delayed in their next stage of care within community hospitals also fell slightly from an average 44.31% in 2015/16 to 39.93% in 2016/17. Please note that Community Hospital Day of Care Audits did not commence until January 2016, so these figures reflect Jan/Feb data only for the two years.

Appendix-2017-39
11
Graph 4 Day of Care Audit
Graph 5 Day of Care Audit
Elective operating A key feature of the Winter Plan was to maintain elective operating without disruption due to unscheduled pressures. This year, the Winter Plan was based on an expectation that the changes to elective inpatient footprint as a result of the Planned Care IHO remodelling and the measures taken to reduce bed requirements would allow us to maintain elective operating uninterrupted during the winter period. In fact, the pressures on the acute hospital during January meant that we were unable to maintain elective inpatient operating for a period of 17 days during January as the elective beds were required to accommodate unscheduled patients. The Planned Surgical Admissions Unit was also converted at short notice into an inpatient area for a period of 17 days during January, requiring all daycase surgery to operate through the Day Procedure Unit.
0%
10%
20%
30%
40%
50%
60%
70%
80%
90%
100%
06
-Jan
-1
6
08
-Feb
-1
6
23
-Mar
-1
6
18
-Ap
r-1
6
18
-May
-1
6
22
-Ju
n-
16
27
-Ju
n-
16
24
-Au
g-1
6
30
-Sep
-1
6
27
-Oct
-1
6
30
-No
v-1
6
22
-Dec
-1
6
26
-Jan
-1
7
24
-Feb
-1
7
24
-Mar
-1
7
Pe
rce
nta
ge
Day of Care Audit - Community Hospitals (P Chart)
% not meeting criteria C LCL UCL Sigma Violation Shift trend
Appendix-2017-39
12
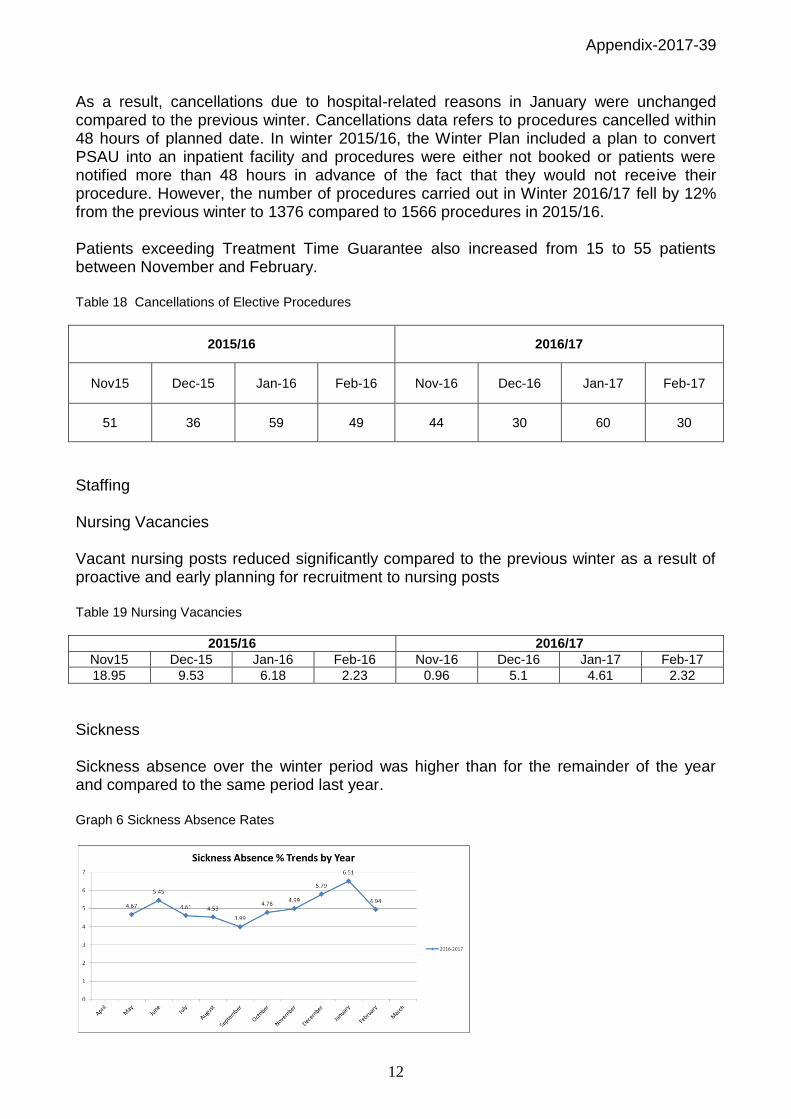
As a result, cancellations due to hospital-related reasons in January were unchanged compared to the previous winter. Cancellations data refers to procedures cancelled within 48 hours of planned date. In winter 2015/16, the Winter Plan included a plan to convert PSAU into an inpatient facility and procedures were either not booked or patients were notified more than 48 hours in advance of the fact that they would not receive their procedure. However, the number of procedures carried out in Winter 2016/17 fell by 12% from the previous winter to 1376 compared to 1566 procedures in 2015/16. Patients exceeding Treatment Time Guarantee also increased from 15 to 55 patients between November and February. Table 18 Cancellations of Elective Procedures
2015/16 2016/17
Nov15 Dec-15 Jan-16 Feb-16 Nov-16 Dec-16 Jan-17 Feb-17
51 36 59 49 44 30 60 30
Staffing Nursing Vacancies Vacant nursing posts reduced significantly compared to the previous winter as a result of proactive and early planning for recruitment to nursing posts Table 19 Nursing Vacancies
2015/16 2016/17
Nov15 Dec-15 Jan-16 Feb-16 Nov-16 Dec-16 Jan-17 Feb-17
18.95 9.53 6.18 2.23 0.96 5.1 4.61 2.32
Sickness Sickness absence over the winter period was higher than for the remainder of the year and compared to the same period last year. Graph 6 Sickness Absence Rates

Appendix-2017-39
13
Outbreaks There were no significant outbreaks of infectious diseases over the winter period. There was minimal impact from Diarrhoea and Vomiting (D&V) related symptoms and, although the number of beddays blocked due to patients with flu increased from the previous year, the number of empty beds lost was barely changed. Table 20 Blocked Bed Days
Nov-13 – Feb 14
Nov 14 – Feb 15
Nov 15 – Feb 16
Nov 16 – Feb 17
Flu Blocked Beds Not collected 135 30 70
Blocked Empty Beds Not collected 39 2 3
D&V Blocked Beds 1492 60 342 66
Blocked Empty Beds 246 12 67 6
Total Blocked Beds NA 195 372 136
Blocked Empty Beds NA 51 69 9
Overall Assessment The Scottish Borders Partnership’s performance in delivering services during the winter period 2016/17 deteriorated compared to the previous year, although was significantly better than winter 2014/15. Our performance during January 2017 was particularly low, as evidenced by the failure to achieve the 95% Emergency Access Standard in this month. The percentage of breaches between December to February related to waits for first assessment in ED fell by 1% compared to last year, indicating that arrangements to manage flow within ED were effective. The percentage of breaches related to waits for beds increased by 9%. Although, the number of admissions and the length of stay of patients decreased slightly compared to the previous year, there were an average 4.5 additional beds lost due to delayed discharges in January this year compared to last year. As we did not use flex beds this year, there were also 13 additional beds not available to the system. The impact of this was that the additional demand for beds was absorbed through an increase in occupancy, with a knock-on effect in terms of numbers of boarders and delays in movement of patients out of ED, and through the temporary opening of PSAU as a bedded area. There are therefore three areas in which the Partnership could improve performance for next year in order to avoid the pressures on the inpatient system experienced this year;
1. Work to reduce the number of people requiring admission. This year, the attendances through Acute Assessment Unit and therefore the number of patients who were treated without admission fell. Other measures to avoid admission were not fully progressed. Self-management and other plans to target areas of highest admissions should be undertaken this year. This should in particular focus on high volume admissions and those that increase in the winter, especially respiratory.
Appendix-2017-39
14
2. To manage the daily patient flow through the system more effectively. This includes actions to accommodate admissions. A renewed and more intense focus on morning discharges is underway and needs to deliver and be sustained before next winter. Weekend working arrangements should be reviewed and an enhancement of services available should be considered to facilitate increased numbers of discharges at the weekend. Support services such as AHPs and social care services (including access to care home beds and homecare) should be available at weekends. Review of elective operating in early January should once again be considered. The past two years have seen a disruption in elective operating as a result of bed pressures in the first two weeks of January. It is unlikely that the planned measures to reduce overall demand over the winter will have sufficient effect to avoid this pressure in early January and elective operating should therefore be planned to avoid this period. A decision on whether it will be necessary to open surge beds should be made by the end of June, once the potential impact of other redesign work is clear.
3. To reduce delays in transfer and discharge of patients across health and social care systems. This would have a significant impact in releasing beds to accommodate inpatient demand. The delayed discharges across most of this winter have occupied the equivalent of one hospital ward (30 beds), and the difference in length of stay between current community hospital length of stay and the target 18 days length of stay is equivalent to 32 beds. Robust project plans with timelines for completion before winter will be necessary in order to impact next year’s winter plan.
In addition, the work to ensure that all nursing vacancies are filled should be repeated this year and should be rolled out to other clinical staff within health (e.g. doctors, AHPs) and also to social care staff. Infection control measures to manage potential outbreaks were tested on a number of occasions and worked well, but we did not experience any significant challenges due to outbreaks of infectious diseases, which also helped the winter performance. Recommendations for Future Winter Planning:
1. Identify and undertake community-based prevention strategies to reduce admissions related to high volume admissions affected by winter period (e.g. respiratory)
2. Expand ambulatory care services to reduce numbers of patients requiring admission
3. Achieve and sustain increased morning discharges with a target of 30% by 11am 4. Review and expand health and social care services accessible at weekends to
ensure maximum effective discharges 5. Restrict elective operating to daycases for first two weeks of January 6. Present plans for surge beds, if required, for decision by end June 2017 7. Establish and deliver project to reduce length of stay in Community Hospitals and
reduce delayed discharges across the pathway. 8. Resolve the issues preventing patients being discharged in the morning 9. Build on and extend proactive recruitment strategies to minimise staffing vacancies
going into winter 10. Earlier preparation and implementation of Winter Plan for 2017/18
Appendix-2017-39
15
Recommendation The Board is asked to note the learning and improvement opportunities for next year which will now be taken forward by the Winter Planning Board.
Policy/Strategy Implications
Request from the Scottish Government that all Health Boards produce a Winter Plan signed off by their Board. This report will inform the Winter Planning Process 2017/18.
Consultation
Performance against the Winter Plan has been presented at numerous committees and groups within NHS Borders and Scottish Borders Council. Feedback from these presentations has influenced this evaluation. A number of evaluation sessions for staff were also held.
Consultation with Professional Committees
The original Winter Plan was approved by the NHS Borders Board and noted by the Integrated Joint Board.
Risk Assessment
The Winter Plan is designed to mitigate the risks associated with the winter and festive periods.
Compliance with Board Policy requirements on Equality and Diversity
Planning for all activity for all Groups across the Winter Period.
Resource/Staffing Implications
Resource and staffing implications were addressed within the Winter Plan.
Approved by
Name Designation Name Designation
Elaine Torrance Interim Chief Officer
Author(s)
Name Designation Name Designation
Phillip Lunts General Manager, Unscheduled Care