
A System of Relational Syllogistic Incorporating Full Boolean Reasoning
Upload
independentCategory
view
2download
0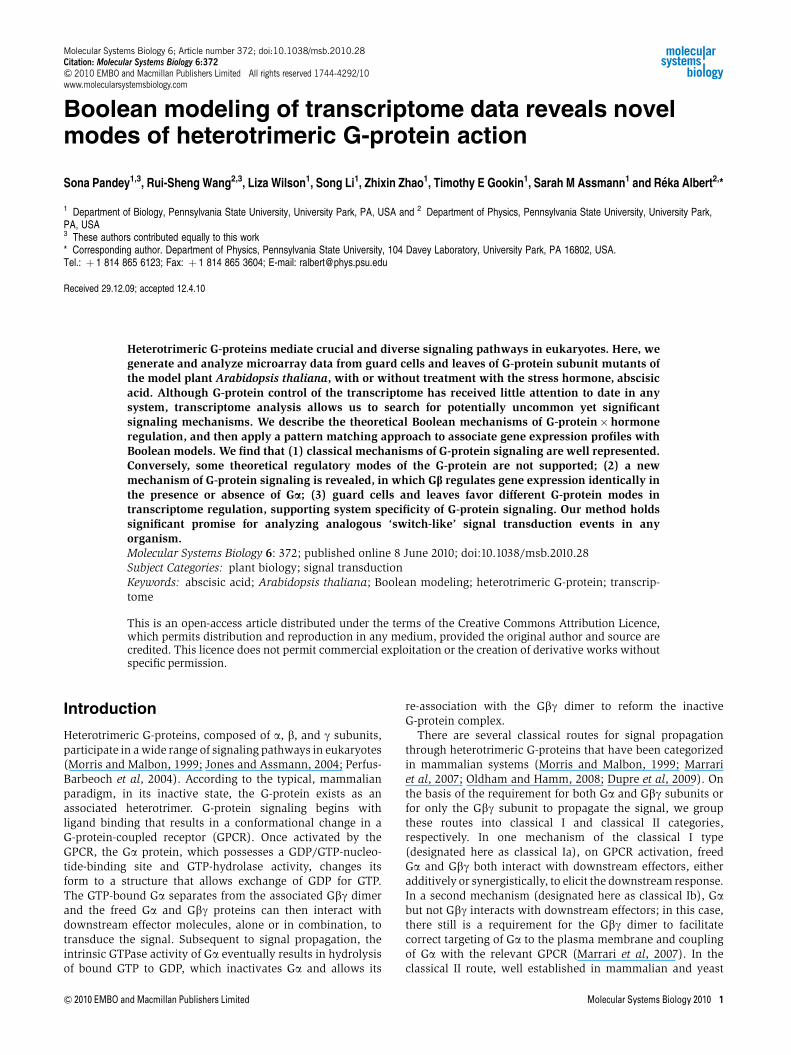
Boolean modeling of transcriptome data reveals novelmodes of heterotrimeric G-protein action
Sona Pandey1,3, Rui-Sheng Wang2,3, Liza Wilson1, Song Li1, Zhixin Zhao1, Timothy E Gookin1, Sarah M Assmann1 and Reka Albert2,*
1 Department of Biology, Pennsylvania State University, University Park, PA, USA and 2 Department of Physics, Pennsylvania State University, University Park,PA, USA3 These authors contributed equally to this work* Corresponding author. Department of Physics, Pennsylvania State University, 104 Davey Laboratory, University Park, PA 16802, USA.Tel.: þ 1 814 865 6123; Fax: þ 1 814 865 3604; E-mail: [email protected]
Received 29.12.09; accepted 12.4.10
Heterotrimeric G-proteins mediate crucial and diverse signaling pathways in eukaryotes. Here, wegenerate and analyze microarray data from guard cells and leaves of G-protein subunit mutants ofthe model plant Arabidopsis thaliana, with or without treatment with the stress hormone, abscisicacid. Although G-protein control of the transcriptome has received little attention to date in anysystem, transcriptome analysis allows us to search for potentially uncommon yet significantsignaling mechanisms. We describe the theoretical Boolean mechanisms of G-protein�hormoneregulation, and then apply a pattern matching approach to associate gene expression profiles withBoolean models. We find that (1) classical mechanisms of G-protein signaling are well represented.Conversely, some theoretical regulatory modes of the G-protein are not supported; (2) a newmechanism of G-protein signaling is revealed, in which Gb regulates gene expression identically inthe presence or absence of Ga; (3) guard cells and leaves favor different G-protein modes intranscriptome regulation, supporting system specificity of G-protein signaling. Our method holdssignificant promise for analyzing analogous ‘switch-like’ signal transduction events in anyorganism.Molecular Systems Biology 6: 372; published online 8 June 2010; doi:10.1038/msb.2010.28Subject Categories: plant biology; signal transductionKeywords: abscisic acid; Arabidopsis thaliana; Boolean modeling; heterotrimeric G-protein; transcrip-tome
This is an open-access article distributed under the terms of the Creative Commons Attribution Licence,which permits distribution and reproduction in any medium, provided the original author and source arecredited. This licence does not permit commercial exploitation or the creation of derivative works withoutspecific permission.
Introduction
Heterotrimeric G-proteins, composed of a, b, and g subunits,participate in a wide range of signaling pathways in eukaryotes(Morris and Malbon, 1999; Jones and Assmann, 2004; Perfus-Barbeoch et al, 2004). According to the typical, mammalianparadigm, in its inactive state, the G-protein exists as anassociated heterotrimer. G-protein signaling begins withligand binding that results in a conformational change in aG-protein-coupled receptor (GPCR). Once activated by theGPCR, the Ga protein, which possesses a GDP/GTP-nucleo-tide-binding site and GTP-hydrolase activity, changes itsform to a structure that allows exchange of GDP for GTP.The GTP-bound Ga separates from the associated Gbg dimerand the freed Ga and Gbg proteins can then interact withdownstream effector molecules, alone or in combination, totransduce the signal. Subsequent to signal propagation, theintrinsic GTPase activity of Ga eventually results in hydrolysisof bound GTP to GDP, which inactivates Ga and allows its
re-association with the Gbg dimer to reform the inactiveG-protein complex.
There are several classical routes for signal propagationthrough heterotrimeric G-proteins that have been categorizedin mammalian systems (Morris and Malbon, 1999; Marrariet al, 2007; Oldham and Hamm, 2008; Dupre et al, 2009). Onthe basis of the requirement for both Ga and Gbg subunits orfor only the Gbg subunit to propagate the signal, we groupthese routes into classical I and classical II categories,respectively. In one mechanism of the classical I type(designated here as classical Ia), on GPCR activation, freedGa and Gbg both interact with downstream effectors, eitheradditively or synergistically, to elicit the downstream response.In a second mechanism (designated here as classical Ib), Gabut not Gbg interacts with downstream effectors; in this case,there still is a requirement for the Gbg dimer to facilitatecorrect targeting of Ga to the plasma membrane and couplingof Ga with the relevant GPCR (Marrari et al, 2007). In theclassical II route, well established in mammalian and yeast
Molecular Systems Biology 6; Article number 372; doi:10.1038/msb.2010.28Citation: Molecular Systems Biology 6:372& 2010 EMBO and Macmillan Publishers Limited All rights reserved 1744-4292/10www.molecularsystemsbiology.com
& 2010 EMBO and Macmillan Publishers Limited Molecular Systems Biology 2010 1
cells, it is solely the Gbg dimer that interacts with downstreameffectors; in this case, sequestration of Gbg within theheterotrimer prevents signal propagation.
Each one of these classical mechanisms leads to explicitpredictions of how genetic knockout of either Ga or Gb wouldaffect production of the downstream phenotype. In classical Ia,knockout of either Ga or Gb would lead to an impairedresponse. Either there could be a stronger impairment in thecase of a double knockout of Ga and Gb, or a single knockoutcould suffice to eliminate the response, if the single knockoutreduced the signal to below a requisite activation threshold. Inclassical Ib, knockout of Gb would prevent correct Galocalization and Ga-GPCR coupling, whereas knockout of Gawould eliminate Ga-effector coupling. Thus, each singleknockout as well as a double knockout of Ga and Gb wouldeliminate the response. In the classical II mechanism, knock-out of Ga would free Gb(g) from sequestration, therebyeliciting the phenotype even in the absence of agonistactivation of the GPCR; conversely, knockout of Gb woulddefacto eliminate the possibility of eliciting the phenotype,even in the presence of the appropriate ligand.
Direct genetic tests of the above predictions are complicatedin mammalian systems, due to the abundance of G-proteinsubunits (e.g. 23 Ga subunits (including splice variants), 5 Gbsubunits, and 12 Gg subunits encoded in the human genome(McCudden et al, 2005)) and their potential for combinatorialassociations and partially redundant function. However, thepresence of only one canonical Ga protein (GPA1), one Gbprotein (AGB1), and two identified Gg proteins (AGG1 andAGG2) in the model plant Arabidopsis thaliana (Jones andAssmann, 2004; Assmann, 2005), and the availability of viablegenetic knockout mutants lacking Ga (gpa1), Gb (agb1), orboth (agb1 gpa1 double) (Lease et al, 2001; Jones et al, 2003;Ullah et al, 2003; Chen et al, 2004), offers an excellentopportunity to experimentally test these predictions. Althoughbiochemical analyses of plant G-protein receptor and subunit-effector coupling are just beginning, plant G-proteins, likethose of animals, have been shown to participate in multiplesignaling and developmental processes, and phenotypicanalysis of G-protein mutants suggests that the above classicalmechanisms also exist in plants. For example, some pheno-types, such as rounded rosette leaves, are exhibited similarlyby both gpa1 and agb1 knockout mutants (Assmann, 2005),consistent with the classical Ia and Ib mechanisms. Otherphenotypes are opposite in gpa1 and agb1 mutants, supportinga classical II mechanism. For example, agb1 mutants exhibitincreased numbers of lateral roots compared with wild type,whereas gpa1 mutants show decreased lateral root production(Chen et al, 2006), and agb1 mutants exhibit impairedresistance to some plant pathogens, whereas gpa1 mutantsexhibit enhanced resistance (Trusov et al, 2006).
In addition to the two classical mechanisms discussedabove, a few non-classical G-protein regulatory modes havealso been implicated in some systems, for example signalingby the intact heterotrimer in yeast, the possibility of varyingextents of heterotrimer dissociation in mammalian cells (Kleinet al, 2000; Frank et al, 2005; Digby et al, 2008), and asuggestion that Ga in Arabidopsis exists primarily in a GTP-bound, dissociated state (Johnston et al, 2007; Temple andJones, 2007). Observations such as these lead to a fundamental
question, namely, which of all the theoretical regulatorymodes in G-protein signaling are biologically possible,exemplifying a more general question of how we can bestmodel the effects of switch-like signaling mechanisms thathave multiple active states. It is these two questions that areaddressed here.
To facilitate the discovery of non-classical mechanisms,which arguably occur more rarely than well-establishedclassical mechanisms, here we generate microarray data fromwild-type, gpa1, agb1, and agb1 gpa1 mutant plants and usetranscriptome analysis, in which thousands of outputs (i.e.levels of individual transcripts) can be monitored simulta-neously. To assess cell/tissue specificity of G-protein signalingmechanisms, we perform transcriptome analysis in two typesof samples, stomatal guard cells and rosette leaves.
We also assay these transcriptomes in the presence orabsence of the phytohormone abscisic acid (ABA), a majorplant hormone that both inhibits growth and promotestolerance of abiotic stresses such as drought, salinity, andcold (Leung and Giraudat, 1998; Finkelstein et al, 2002;Acharya and Assmann, 2009). Although a few dozencandidate plant GPCRs with predicted 7TM structure havebeen computationally identified (Moriyama et al, 2006;Gookin et al, 2008), and several of these have been shownexperimentally to interact with GPA1 (Gookin et al, 2008), todate none of these proteins has an identified ligand. We choseABA as a variable because ABA signaling is known to interactwith heterotrimeric G-protein signaling in both developmentaland stress responses in a complex manner (Wang et al, 2001;Pandey et al, 2006, 2009; Fan et al, 2008). For example, ABAinhibition of stomatal opening, which promotes waterconservation under stress conditions by reducing water vaporefflux through microscopic stomatal pores at the leaf surface,is impaired in gpa1 and agb1 single mutants as well as agb1gpa1 double mutants, exemplifying ABA hyposensitivity ofguard cell processes (Wang et al, 2001; Coursol et al, 2003; Fanet al, 2008). By contrast, seed germination and post-germina-tion seedling development are hypersensitive to inhibition byABA in G-protein complex mutants (Pandey et al, 2006). Theseexperimental observations suggest G-proteins as one of thecomponents of ABA signaling, but to date no systematic studyhas been conducted to define the regulatory modes of aG-protein or the co-regulatory modes of a G-protein and ahormone. Further, regulation of gene expression in G-proteincomplex mutants has rarely received genome-wide analysis ineither plant or mammalian systems (Ullah et al, 2003;Okamoto et al, 2009), and there is only one replicated studyof the guard cell transcriptome (Leonhardt et al, 2004).
As there is no evidence for ABA or heterotrimeric G-proteinsdirectly interacting with chromatin or DNA to influence geneexpression, in this study we posit one or more mediators actingdownstream of these inputs to control transcript levels. Forsimplicity, we use the minimum number of mediatorsnecessary to explain the regulatory modes. In reality, thenumber of components involved may be more. In the twosimplest cases, transcript levels would be (1) controlled byABA independently of the G-protein, or, conversely (2)controlled by the G-protein independently of ABA, that is onactivation by a signal other than ABA (Figure 1A and B). Thesimplest case of a combined G-protein–ABA effect on a gene’s
Boolean modeling of transcriptome dataS Pandey et al
2 Molecular Systems Biology 2010 & 2010 EMBO and Macmillan Publishers Limited
expression would be that in addition to the G-proteinregulation, ABA has an additive G-protein-independentregulatory effect on the gene through another signalingmediator, as shown in Figure 1C. It is also possible that afterthe G-protein is activated by a signal other than ABA, theG-protein subunit(s) and ABA combinatorially co-regulate amediator, which then directly or indirectly regulates the gene,as shown in Figure 1D. There is also the possibility that ABAserves as a signal that activates the G-protein. Combined withthe regulatory modes illustrated in Figure 1, a total of ninepossible G-protein and/or ABA signaling pathways can bedistinguished (Supplementary Figure S1). On the basis of nineG-protein/ABA signaling pathways and the combinatorialrelationships between G-protein subunits, we use a Booleanmodeling approach to systematically enumerate all possibletheoretical regulatory modes of the G-protein and co-regula-tory modes of the G-protein and ABA (a total of 142 regulatorymodes). In this study, we determine which signaling pathwaysand regulatory modes are experimentally supported bytranscriptome data.
The Boolean modeling approach is used to formulate thetheoretical regulatory modes of the G-protein and ABA. Wethen apply a pattern matching approach to associate geneexpression profiles with Boolean models. Our method allowsus to address the following questions: (1) Are all of theclassical modes of G-protein signaling observed and are anynon-classical modes of G-protein signaling revealed? (2)Does the heterotrimeric G-protein have ABA-independentregulatory activity? (3) Is it possible that ABA and theG-protein co-regulate some processes, but ABA is not thesignal activating the G-protein? (4) Is there system specificityof G-protein regulation of the transcriptome? (5) Doesregulation at the level of the transcriptome recapitulatepreviously observed hypersensitivity or hyposensitivity of
developmental and dynamic transient responses to ABA inG-protein mutants?
Results
According to the characteristics of the conditions under whichwe sample the transcriptome (G-protein subunit mutantswith or without ABA), we use Boolean variables to denote thestates of GPA1, AGB1, and ABA. Specifically, GPA1¼0 andAGB1¼0 represents the agb1 gpa1 double mutant, GPA1¼0and AGB1¼1 represents the gpa1 mutant, GPA1¼1 andAGB1¼0 represents the agb1 mutant, and GPA1¼1 andAGB1¼1 means wild type. ABA¼1 indicates the presence ofABA (i.e. ABA treatment) and ABA¼0 represents the absenceof ABA (i.e. solvent control). The expression profile of a targetgene in different genotypes or treatments is the result of the(indirect) regulatory activity of the G-protein and/or ABA,which can be seen as a truth vector of a Boolean functiondetermined by the states of GPA1, AGB1, and/or ABA.Statistical analysis of gene expression data verifies the validityof this Boolean framework (Supplementary information 3).The regulatory modes of the G-protein are modeled by Booleanfunctions A(GPA1, AGB1), reflecting the effect of the G-proteinon the expression level of a target gene (see Materials andmethods). For example, the classical I mechanism of theG-protein can be represented by A2(GPA1, AGB1)¼GPA1 andAGB1. A target gene regulated by this G-protein mode isstrongly expressed when both GPA1 and AGB1 are present (i.e.in the wild type) and weakly or not expressed in the mutantgenotypes. The classical II mode of the G-protein corresponds toA5(GPA1, AGB1)¼not GPA1 and AGB1. A target gene regulatedby this mode is strongly expressed in the gpa1 mutant andshows weak or absent expression in other genotypes.
Figure 1 Illustration of possible regulatory modes of the heterotrimeric G-protein and ABA. The activation of the G-protein and its dissociation into its subunits isillustrated as an arrow activated by a signal. The effector M1 can be regulated by either GPA1, AGB1, or both G-protein subunits; for simplicity, these possibilities are notbroken out into separate diagrams. The effector M2 is co-regulated by the G-protein and ABA. The effector M3 is regulated by ABA, independent of the G-protein. Theregulatory effect on mediators and genes can be activation or inhibition. The illustrations depict the minimum number of mediators necessary to explain the regulatorymodes. In reality, the number of components involved may be more. (A) Transcript levels are controlled by ABA independently of the G-protein. (B) Transcript levels arecontrolled by the G-protein independently of ABA. (C) Transcript levels are additively controlled by the G-protein and ABA. (D) Transcript levels are combinatoriallycontrolled by the G-protein and ABA.
Boolean modeling of transcriptome dataS Pandey et al
& 2010 EMBO and Macmillan Publishers Limited Molecular Systems Biology 2010 3
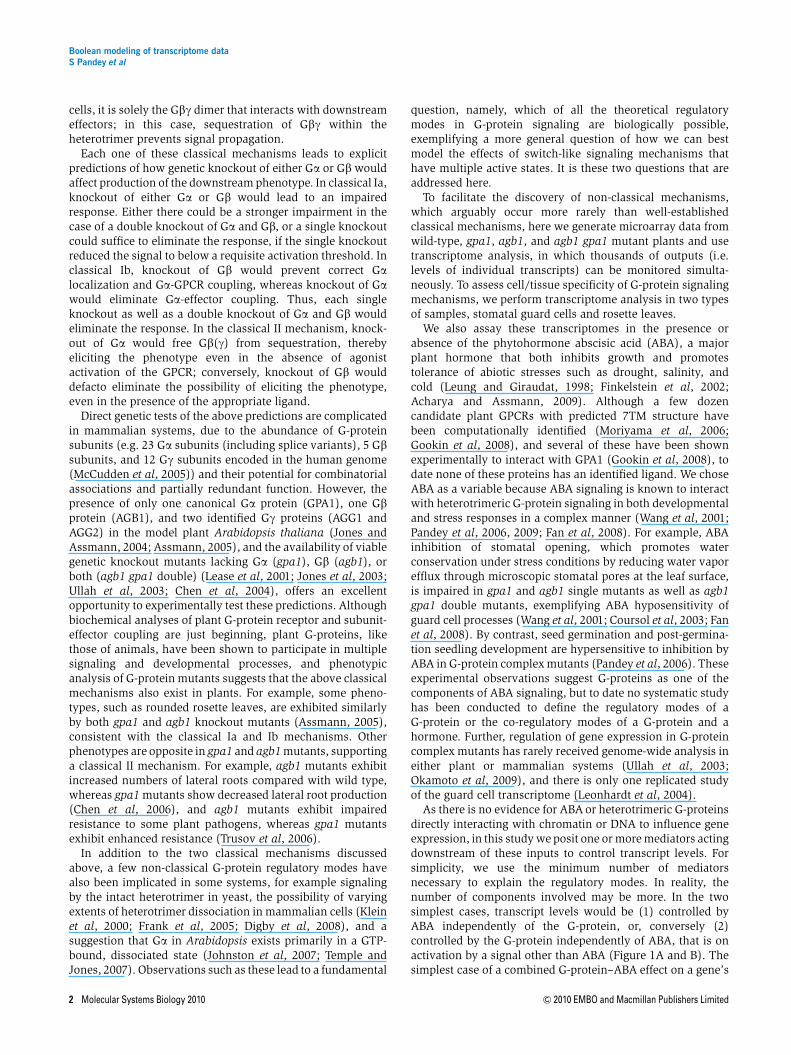
The co-regulation of a gene by the G-protein and ABA can bedescribed as F(ABA, GPA1, AGB1)¼CABAþB(ABA, A(GPA1,AGB1)). CABA is a constant that is non-zero if there is aG-protein-independent regulatory effect of ABA on a gene.B(ABA, A(GPA1, AGB1)), shown in Table I, is a nested Booleanfunction representing the possible combinatorial regulation ofABA and the G-protein. The complement of B(ABA, A(GPA1,AGB1)) functions determines a total of 72 non-trivialregulatory modes of the G-protein and/or ABA (see Materialsand methods). Together with CABA, F(ABA, GPA1, AGB1) isable to identify 142 regulatory modes of the G-protein andABA, which can be classified into five main regulatorycategories (see Materials and methods): ABA-only regulationof transcript levels, G-protein-only regulation, G-protein–ABAadditive regulation, ABA–G-protein combinatorial regula-tion, and ABA–G-protein mixed regulation. For example,B2(ABA, A2(GPA1, AGB1))¼ABA and (GPA1 and AGB1) isone example of combinatorial regulation by the G-protein andABA in which both G-protein subunits and ABA are requiredfor high gene expression. B4(ABA, A(GPA1, AGB1))¼ABAexemplifies regulation by ABA independent of the status of theG-protein. CABAþB6(ABA, A6(GPA1, AGB1))¼CABAþAGB1is one example of G-protein–ABA additive regulation, namelyregulation by the G-protein b subunit with a separate additiveinput from ABA.
Each regulatory mode represented by A(GPA1, AGB1) orB(ABA, A(GPA1, AGB1)) corresponds to an idealized Booleanexpression pattern. To avoid potential biases in binarizingexpression levels, instead of correlating absolute expressionprofiles, our method is based on the differential expressionpatterns of genes. Figure 2 illustrates four examplesof idealized expression patterns and idealized differentialexpression patterns of genes governed by Boolean functions.To associate genes with regulatory modes of the G-proteinand/or ABA, we construct the real differential expressionpattern of each gene and adopt a correlation-based patternmatching approach to examine whether the real differential
expression pattern of the gene is consistent with one of theidealized differential expression patterns given by the Booleanregulatory modes of the G-protein and/or ABA (see Materialsand methods). By looking at the number of genes belongingto each regulatory mode, we are able to gauge the plausibilityof each mode.
Biologically plausible modes of G-protein regulation
Our first aim is to determine which of the theoretically possibleG-protein regulatory modes, as reflected by the 14 Booleanfunctions A2(GPA1, AGB1) to A15(GPA1, AGB1), are experi-mentally supported by the transcriptome data. We separatelyconsider four combinations of tissues and treatment, that isguard cells or leaves with or without ABA treatment. Usingstringent thresholds for differential expression and correlationwith idealized patterns (see Materials and methods), a totalof 107 G-protein-regulated genes are identified in guardcells without ABA treatment, and 51 G-protein-regulated genesare identified in guard cells with ABA treatment. There are103 G-protein-regulated genes in leaves without ABA treatment,and 143 G-protein-regulated genes in leaves with ABA treatment.These genes are listed in the Supplementary file Sup1.xls.
We observe a number of G-protein-regulated genes inthe absence of ABA in both guard cells and leaves, indicatingthat the G-protein has regulatory activity independent ofABA treatment. Only the two knocked-out genes, GPA1 andAGB1, are common to the G-protein-regulated gene sets inguard cells and leaves in either of the two ABA conditions,suggesting system specificity of G-protein action. The dis-tribution of genes in each G-protein regulatory mode inguard cells and leaves, with and without ABA treatment, isgiven in Figure 3. Note that it is possible that the genes in Ai
and A17-i are regulated by the G-protein through the samesignaling pathway, for example for A2 and A15, GPA1 andAGB1 could synergistically regulate a mediator (e.g. atranscription factor or other regulator of gene expression
Table I Boolean regulatory modes of the G-protein and ABA and their corresponding gene expression patterns
Co-regulatory modes of the G-protein and ABA
States of B(ABA, A(GPA1, AGB1)) Target gene expression
B (ABA, A) = 0 0]0,0,0,0,0,0,[0,
B (ABA, A) = ABA and A 1)] A(1,0), A(1,1), A(0,0), A(0,0,0,0,[0,
B (ABA, A) = ABA and not A 1)](1,A0),(1,A1),(0,A0),(0,A0,0,0,0,[
B (ABA, A) = ABA 1]1,1,1,0,0,0,[0,
B (ABA, A) = not ABA and A ]00,0,0,1), A(1,0), A(1,1), A(0,0), A(0,[
B (ABA, A) = A ]1) A(1,0), A(1,1), A(0,0), A(0,1), A(1,0), A(1,1), A(0,0), A(0,[
B (ABA, A) = (ABA or A) and not (ABA and A) ]1)(1,A0),(1,A1),(0,A0),(0,A1), A(1,0), A(1,1), A(0,0), A(0,[
B (ABA, A) = ABA or A 1]1,1,1,1), A(1,0), A(1,1), A(0,0), A(0,[
B (ABA, A) =1 1]1,1,1,1,1,1,[1,
db-Gα-Gβ-wt-db-Gα-Gβ-wt db-Gα-Gβ-wt-db-Gα-Gβ-wt
B17-i¼not Bi, i¼2, y, 8 are not shown because they are the logical negations of shown modes. The target gene expression in B2, B3, B5, B6, B7, B8 depends on theA(GPA1, AGB1) functions describing the G-protein regulation. For these functions, we show one example (different from case to case) of 14 possible target geneexpression patterns. db-Ga-Gb-wt denotes the order of genotypes, that is agb1 gpa1 double mutant, gpa1 mutant, agb1 mutant and wild type, without ABA treatment.db-Ga-Gb-wt denotes the corresponding order of genotypes with ABA treatment. �A(GPA1, AGB1) denotes the logical negation of A(GPA1, AGB1).
Boolean modeling of transcriptome dataS Pandey et al
4 Molecular Systems Biology 2010 & 2010 EMBO and Macmillan Publishers Limited
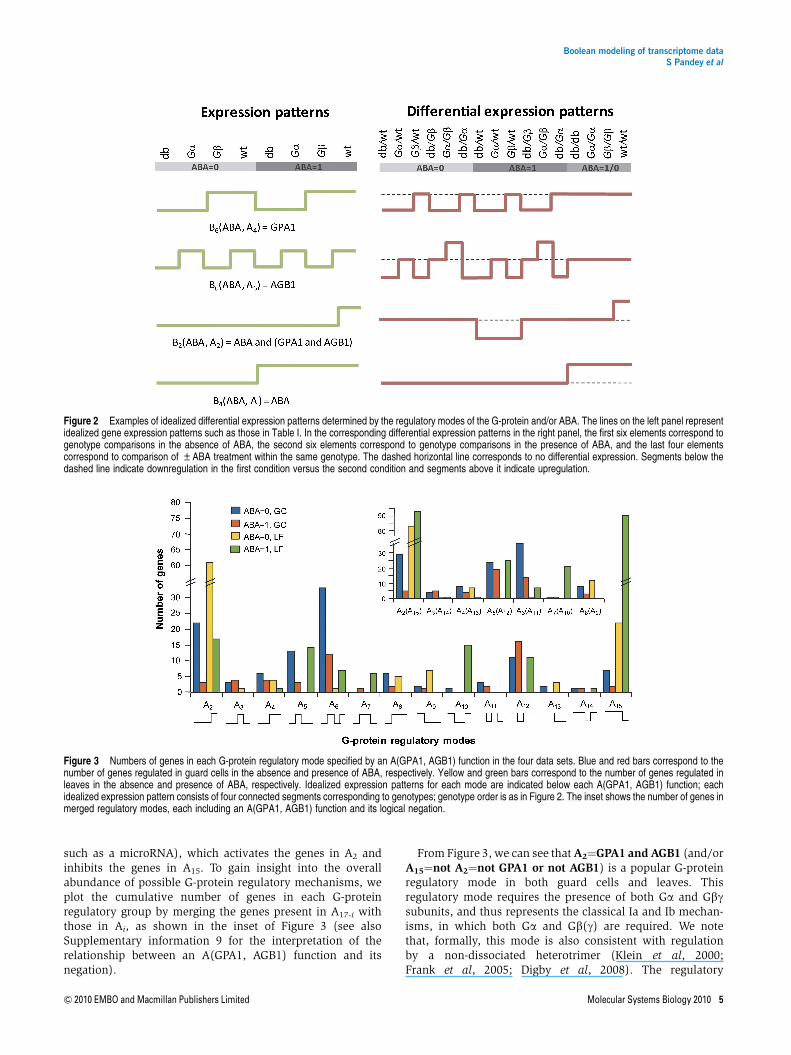
such as a microRNA), which activates the genes in A2 andinhibits the genes in A15. To gain insight into the overallabundance of possible G-protein regulatory mechanisms, weplot the cumulative number of genes in each G-proteinregulatory group by merging the genes present in A17-i withthose in Ai, as shown in the inset of Figure 3 (see alsoSupplementary information 9 for the interpretation of therelationship between an A(GPA1, AGB1) function and itsnegation).
From Figure 3, we can see that A2¼GPA1 and AGB1 (and/orA15¼not A2¼not GPA1 or not AGB1) is a popular G-proteinregulatory mode in both guard cells and leaves. Thisregulatory mode requires the presence of both Ga and Gbgsubunits, and thus represents the classical Ia and Ib mechan-isms, in which both Ga and Gb(g) are required. We notethat, formally, this mode is also consistent with regulationby a non-dissociated heterotrimer (Klein et al, 2000;Frank et al, 2005; Digby et al, 2008). The regulatory
Figure 2 Examples of idealized differential expression patterns determined by the regulatory modes of the G-protein and/or ABA. The lines on the left panel representidealized gene expression patterns such as those in Table I. In the corresponding differential expression patterns in the right panel, the first six elements correspond togenotype comparisons in the absence of ABA, the second six elements correspond to genotype comparisons in the presence of ABA, and the last four elementscorrespond to comparison of ±ABA treatment within the same genotype. The dashed horizontal line corresponds to no differential expression. Segments below thedashed line indicate downregulation in the first condition versus the second condition and segments above it indicate upregulation.
Figure 3 Numbers of genes in each G-protein regulatory mode specified by an A(GPA1, AGB1) function in the four data sets. Blue and red bars correspond to thenumber of genes regulated in guard cells in the absence and presence of ABA, respectively. Yellow and green bars correspond to the number of genes regulated inleaves in the absence and presence of ABA, respectively. Idealized expression patterns for each mode are indicated below each A(GPA1, AGB1) function; eachidealized expression pattern consists of four connected segments corresponding to genotypes; genotype order is as in Figure 2. The inset shows the number of genes inmerged regulatory modes, each including an A(GPA1, AGB1) function and its logical negation.
Boolean modeling of transcriptome dataS Pandey et al
& 2010 EMBO and Macmillan Publishers Limited Molecular Systems Biology 2010 5
mechanism A5¼not GPA1 and AGB1 (and/or A12¼notA5¼GPA1 or not AGB1) is also strongly supported in allconditions except in leaves without ABA treatment. This modeis consistent with the classical II G-protein regulatorymechanism, based on signaling by the freed Gbg subunit, asit incorporates the fact that in the gpa1 mutant, Gbg will beavailable to regulate downstream genes. The G-proteinregulatory mode A6¼AGB1 (and/or A11¼not AGB1) isprevalent in guard cells but less so in leaves. This Booleanfunction represents a non-classical regulatory mechanism inwhich signaling by Gb(g) occurs, and this signaling is notregulated in any way by Ga; in other words, at no point duringthis signaling mechanism does Gb(g) assemble with Ga into aheterotrimer. The functions A3¼GPA1 and not AGB1,A14¼not A3¼not GPA1 or AGB1 are not supported, suggestingthat Ga does not regulate downstream effectors in the absenceof Gbg. The functions A4¼GPA1, A13¼not GPA1 are also veryweakly supported, suggesting that Ga signaling unaffected bythe presence or absence of Gbg is rare. The function A8¼GPA1or AGB1 (and/or A9¼not A8¼not GPA1 and not AGB1) isweakly supported in the absence of ABA, but its lowabundance suggests that regulation of a target equally wellby either free Ga or free Gbg is relatively rare. Interestingly, thefunction A7¼(GPA1 or AGB1) and not (GPA1 and AGB1)(and/or A10¼not A7¼(GPA1 and AGB1) or not (GPA1 orAGB1)) is well represented in leaves with ABA treatment. Thecomplex combinatorial relationship between Ga and Gbgunderlying this function suggests the involvement of morethan one G-protein effector.
Co-regulatory modes of the G-protein and ABA
We next combine the data with and without ABA treatment anddetermine which of the theoretically possible (co)regulatorymodes of G-protein and ABA are experimentally supported by the
transcriptome data. By using stringent thresholds for associationof genes with regulatory modes (see Materials and methods), 71ABA–G-protein combinatorially regulated genes, 29 ABA–G-protein mixed regulated genes, 28 G-protein-only regulatedgenes, and 3 G-protein–ABA additively regulated genes areidentified in guard cells. In contrast, in leaves 471 ABA–G-proteincombinatorially regulated genes, 78 ABA–G-protein mixedregulated genes, and only 3 G-protein-only regulated genes areidentified. We also obtain 467 ABA-only induced genes and 246ABA-only repressed genes in guard cells, and 309 ABA-onlyinduced genes and 94 ABA-only repressed genes in leaves. All ofthese genes are listed in the Supplementary files Sup2.xls forguard cells and Sup3.xls for leaves.
To focus on the combinatorial G-protein–ABA regulatorymodes encapsulated in the B(ABA, A(GPA1, AGB1)) function,we cumulate ABA–G-protein combinatorially regulated genesand ABA–G-protein mixed regulated genes that are governedby the same Boolean function. Similarly, the genes governedby the same Boolean function in G-protein-only regulation andG-protein–ABA additive regulation are also merged. We findthat 33 out of the 72 theoretically possible regulatory modesare unsupported (have 0 genes) in guard cells and 34regulatory modes are unsupported in leaves. The distributionof genes in each supported regulatory mode of the G-proteinand ABA in guard cells and leaves is illustrated in Supplemen-tary Figures S10–S12. In Table II, we summarize the regulatorymodes that govern 410% of the genes in the relevantcategory (ABA–G-protein combinatorial/mixed regulation, orG-protein-only/G-protein–ABA additive regulation).
We observe that in guard cells, A5 (and/or A12)-relatedregulatory modes are the most representative: B12(ABA,A5)¼ABA or not (not GPA1 and AGB1)¼ABA or not A5,B15(ABA, A5)¼not ABA or not A5, and B5(ABA, A5)¼not ABAand A5. These co-regulatory modes of the G-protein and ABAare consistent with Figure 1D where the mediator M1 is
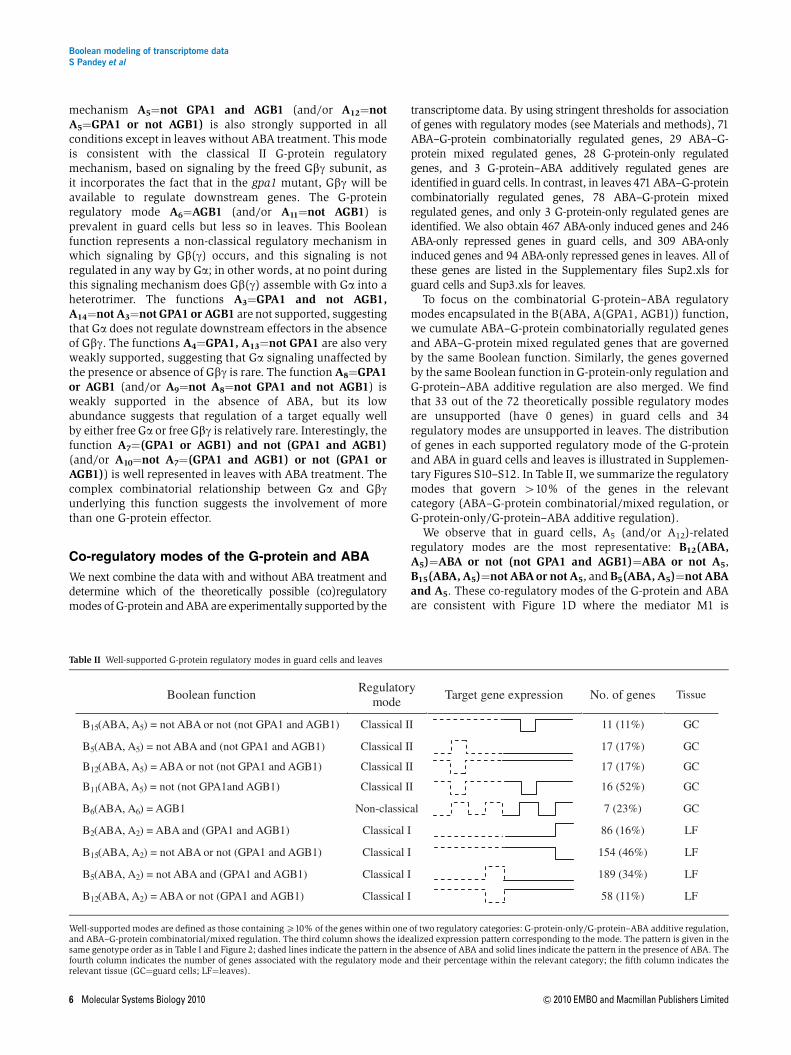
Table II Well-supported G-protein regulatory modes in guard cells and leaves
Boolean functionRegulatory
modeTarget gene expression No. of genes Tissue
B15(ABA, A5) = not ABA or not (not GPA1 and AGB1) Classical II 11 (11%) GC
B5(ABA, A5) = not ABA and (not GPA1 and AGB1) Classical II 17 (17%) GC
B12(ABA, A5) = ABA or not (not GPA1 and AGB1) Classical II 17 (17%) GC
B11(ABA, A5) = not (not GPA1and AGB1) Classical II 16 (52%) GC
B6(ABA, A6) = AGB1 Non-classical 7 (23%) GC
B2(ABA, A2) = ABA and (GPA1 and AGB1) Classical I 86 (16%) LF
B15(ABA, A2) = not ABA or not (GPA1 and AGB1) Classical I 154 (46%) LF
B5(ABA, A2) = not ABA and (GPA1 and AGB1) Classical I 189 (34%) LF
B12(ABA, A2) = ABA or not (GPA1 and AGB1) Classical I 58 (11%) LF
Well-supported modes are defined as those containing X10% of the genes within one of two regulatory categories: G-protein-only/G-protein–ABA additive regulation,and ABA–G-protein combinatorial/mixed regulation. The third column shows the idealized expression pattern corresponding to the mode. The pattern is given in thesame genotype order as in Table I and Figure 2; dashed lines indicate the pattern in the absence of ABA and solid lines indicate the pattern in the presence of ABA. Thefourth column indicates the number of genes associated with the regulatory mode and their percentage within the relevant category; the fifth column indicates therelevant tissue (GC¼guard cells; LF¼leaves).
Boolean modeling of transcriptome dataS Pandey et al
6 Molecular Systems Biology 2010 & 2010 EMBO and Macmillan Publishers Limited
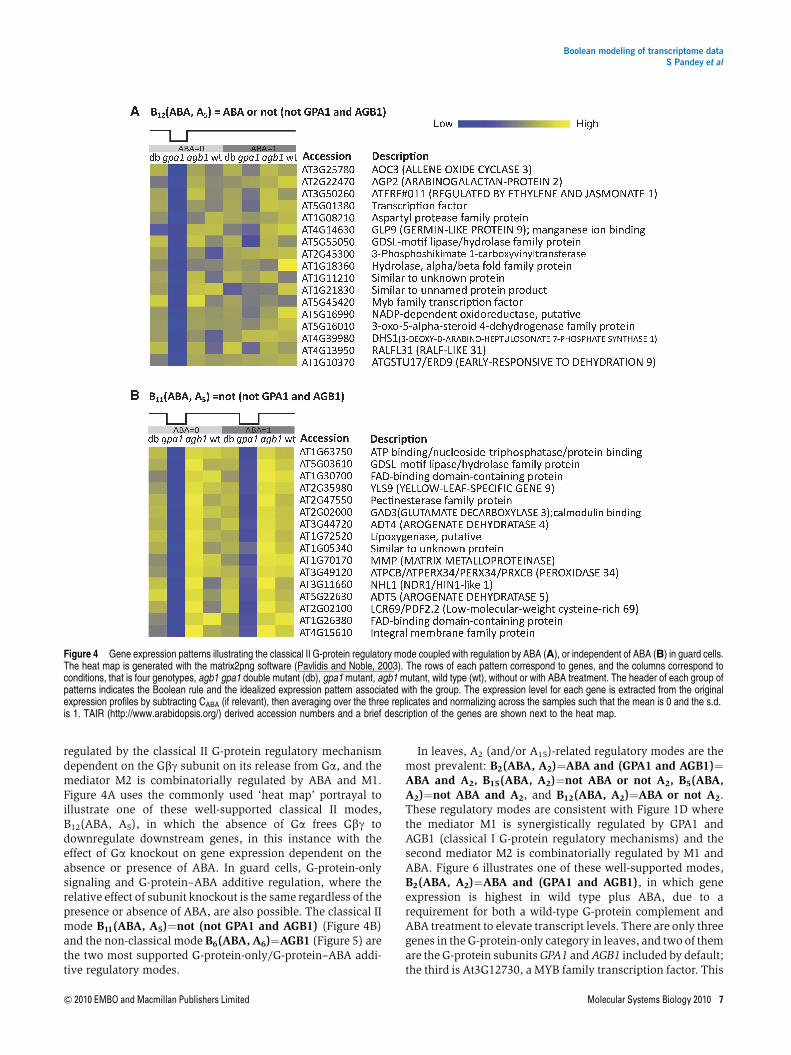
regulated by the classical II G-protein regulatory mechanismdependent on the Gbg subunit on its release from Ga, and themediator M2 is combinatorially regulated by ABA and M1.Figure 4A uses the commonly used ‘heat map’ portrayal toillustrate one of these well-supported classical II modes,B12(ABA, A5), in which the absence of Ga frees Gbg todownregulate downstream genes, in this instance with theeffect of Ga knockout on gene expression dependent on theabsence or presence of ABA. In guard cells, G-protein-onlysignaling and G-protein–ABA additive regulation, where therelative effect of subunit knockout is the same regardless of thepresence or absence of ABA, are also possible. The classical IImode B11(ABA, A5)¼not (not GPA1 and AGB1) (Figure 4B)and the non-classical mode B6(ABA, A6)¼AGB1 (Figure 5) arethe two most supported G-protein-only/G-protein–ABA addi-tive regulatory modes.
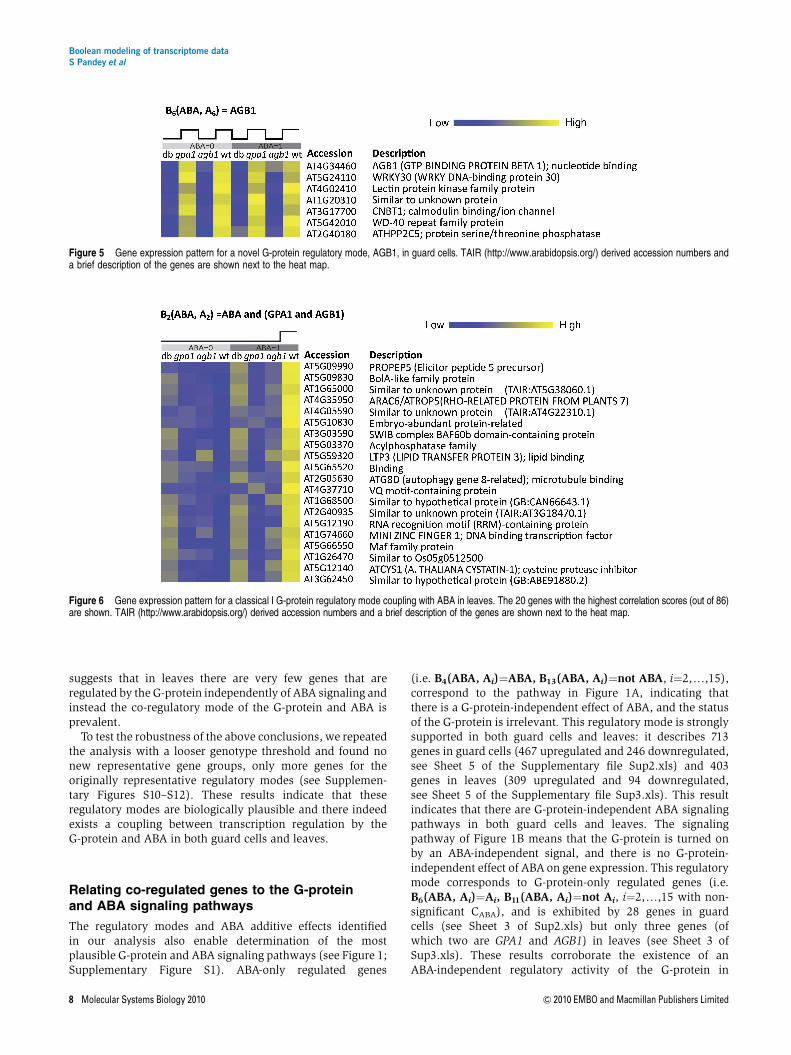
In leaves, A2 (and/or A15)-related regulatory modes are themost prevalent: B2(ABA, A2)¼ABA and (GPA1 and AGB1)¼ABA and A2, B15(ABA, A2)¼not ABA or not A2, B5(ABA,A2)¼not ABA and A2, and B12(ABA, A2)¼ABA or not A2.These regulatory modes are consistent with Figure 1D wherethe mediator M1 is synergistically regulated by GPA1 andAGB1 (classical I G-protein regulatory mechanisms) and thesecond mediator M2 is combinatorially regulated by M1 andABA. Figure 6 illustrates one of these well-supported modes,B2(ABA, A2)¼ABA and (GPA1 and AGB1), in which geneexpression is highest in wild type plus ABA, due to arequirement for both a wild-type G-protein complement andABA treatment to elevate transcript levels. There are only threegenes in the G-protein-only category in leaves, and two of themare the G-protein subunits GPA1 and AGB1 included by default;the third is At3G12730, a MYB family transcription factor. This
Figure 4 Gene expression patterns illustrating the classical II G-protein regulatory mode coupled with regulation by ABA (A), or independent of ABA (B) in guard cells.The heat map is generated with the matrix2png software (Pavlidis and Noble, 2003). The rows of each pattern correspond to genes, and the columns correspond toconditions, that is four genotypes, agb1 gpa1 double mutant (db), gpa1 mutant, agb1 mutant, wild type (wt), without or with ABA treatment. The header of each group ofpatterns indicates the Boolean rule and the idealized expression pattern associated with the group. The expression level for each gene is extracted from the originalexpression profiles by subtracting CABA (if relevant), then averaging over the three replicates and normalizing across the samples such that the mean is 0 and the s.d.is 1. TAIR (http://www.arabidopsis.org/) derived accession numbers and a brief description of the genes are shown next to the heat map.
Boolean modeling of transcriptome dataS Pandey et al
& 2010 EMBO and Macmillan Publishers Limited Molecular Systems Biology 2010 7
suggests that in leaves there are very few genes that areregulated by the G-protein independently of ABA signaling andinstead the co-regulatory mode of the G-protein and ABA isprevalent.
To test the robustness of the above conclusions, we repeatedthe analysis with a looser genotype threshold and found nonew representative gene groups, only more genes for theoriginally representative regulatory modes (see Supplemen-tary Figures S10–S12). These results indicate that theseregulatory modes are biologically plausible and there indeedexists a coupling between transcription regulation by theG-protein and ABA in both guard cells and leaves.
Relating co-regulated genes to the G-proteinand ABA signaling pathways
The regulatory modes and ABA additive effects identifiedin our analysis also enable determination of the mostplausible G-protein and ABA signaling pathways (see Figure 1;Supplementary Figure S1). ABA-only regulated genes
(i.e. B4(ABA, Ai)¼ABA, B13(ABA, Ai)¼not ABA, i¼2,y,15),correspond to the pathway in Figure 1A, indicating thatthere is a G-protein-independent effect of ABA, and the statusof the G-protein is irrelevant. This regulatory mode is stronglysupported in both guard cells and leaves: it describes 713genes in guard cells (467 upregulated and 246 downregulated,see Sheet 5 of the Supplementary file Sup2.xls) and 403genes in leaves (309 upregulated and 94 downregulated,see Sheet 5 of the Supplementary file Sup3.xls). This resultindicates that there are G-protein-independent ABA signalingpathways in both guard cells and leaves. The signalingpathway of Figure 1B means that the G-protein is turned onby an ABA-independent signal, and there is no G-protein-independent effect of ABA on gene expression. This regulatorymode corresponds to G-protein-only regulated genes (i.e.B6(ABA, Ai)¼Ai, B11(ABA, Ai)¼not Ai, i¼2,y,15 with non-significant CABA), and is exhibited by 28 genes in guardcells (see Sheet 3 of Sup2.xls) but only three genes (ofwhich two are GPA1 and AGB1) in leaves (see Sheet 3 ofSup3.xls). These results corroborate the existence of anABA-independent regulatory activity of the G-protein in
Figure 6 Gene expression pattern for a classical I G-protein regulatory mode coupling with ABA in leaves. The 20 genes with the highest correlation scores (out of 86)are shown. TAIR (http://www.arabidopsis.org/) derived accession numbers and a brief description of the genes are shown next to the heat map.
Figure 5 Gene expression pattern for a novel G-protein regulatory mode, AGB1, in guard cells. TAIR (http://www.arabidopsis.org/) derived accession numbers anda brief description of the genes are shown next to the heat map.
Boolean modeling of transcriptome dataS Pandey et al
8 Molecular Systems Biology 2010 & 2010 EMBO and Macmillan Publishers Limited
guard cells, through both classical (B11(ABA, A5)) and non-classical (B6(ABA, A6)) regulatory modes. Interestingly,these ABA-independent G-protein regulatory modes are notsupported in leaves.
The signaling pathway of Figure 1C means that in additionto ABA-independent G-protein regulation, there is also aG-protein-independent effect of ABA. This regulatory modecorresponds to G-protein–ABA additive regulated genes (i.e.B6(ABA, Ai)þCABA¼AiþCABA, B11(ABA, Ai)þCABA¼notAiþCABA) and represents an additive cross-talk, convergingon the target gene, between ABA and the signal that activatesthe G-protein. This regulatory mode has three genes in guardcells (see Sheet 4 of Sup2.xls) and no genes in leaves,indicating that additive regulation by G-protein signaling plusG-protein-independent ABA signaling is rare.
The signaling pathway shown in Figure 1D represents thecase where the G-protein is turned on by an ABA-independentsignal, and there is a combinatorial G-protein–ABA effect. Thispathway corresponds to ABA–G-protein combinatoriallyregulated genes with non-significant CABA (i.e. B2(ABA,Ai)¼Ai and ABA, B8(ABA, Ai)¼Ai or ABA, B5(ABA, Ai)¼Ai
and not ABA, and B14(ABA, Ai)¼Ai or not ABA, i¼2,y,15)and represents a combinatorial cross-talk that converges onthe mediator M2 (see Figure 1D). This regulatory mode isobserved for 71 genes in guard cells (see Sheet 1 of Sup2.xls)and 471 genes in leaves (see Sheet 1 of Sup3.xls). A similarpathway (Supplementary Figure S1E) is that in additionto the combinatorial G-protein–ABA regulatory effect, thereis also a G-protein-independent effect of ABA (i.e. (Ai andABA)þCABA, (Ai or ABA)þCABA, (Ai and not ABA)þCABA,and (Ai or not ABA)þCABA, i¼2,y,15). This regulatory modecorresponds to ABA–G-protein mixed regulated genes and issupported by 29 genes in guard cells (see Sheet 2 of Sup2.xls)and 78 genes in leaves (see Sheet 1 of Sup3.xls), indicating thatcross-talk between ABA–G-protein signaling and G-protein-independent ABA signaling occurs.
In mammalian systems, it is well established that a givenGa can interact with more than one specific GPCR and thuscan be regulated by more than one ligand (Leaney andTinker, 2000). In Arabidopsis, if the signal that catalyzesthe dissociation of Ga and Gbg and activates the G-proteinwere ABA (see Supplementary Figure S1F–I), then withoutABA treatment, the G-protein would be off and would haveno regulatory activity (described by B2(ABA, Ai)¼Ai andABA, B14(ABA, Ai)¼Ai or not ABA, i¼2,y,15). In additionto such regulation of the G-protein by ABA, there could bea G-protein-independent effect of ABA, or/and a G-protein–ABA combinatorial regulatory effect. The genes regulated bythese modes would form an unknown subset of ABA–G-protein combinatorially or mixed regulated genes, that is allor a fraction of the genes that have no differential expressionwith respect to genotypes in the absence of ABA (seeSupplementary information 11 for a detailed description).The maximum possible number of genes regulated bya mode in which ABA is the signal activating the G-proteinis 38 in guard cells and 287 in leaves. In other words, thesegenes are consistent with the possibility of ABA serving as aligand for a GPCR. On the other hand, for the specific casewhere the G-protein functions according to the classicalmechanism II, we can conclude that our analysis does not
validate the scenario in which ABA is the signal that activatesthe G-protein (see Supplementary information 11 for thereasoning behind this statement). Finally, the 62 genesin guard cells and 262 genes in leaves consistent with ABA–G-protein combinatorial or mixed regulation but notconsistent with ABA activation of the G-protein are a clearindication that the G-protein can be activated by a signal otherthan ABA.
ABA hypo-/hypersensitivity of gene regulationin G-protein mutants
For guard cell responses published in the literature to date,namely for ABA inhibition of stomatal opening and inward Kþ
channel regulation, gpa1 and agb1 mutants are equallyhyposensitive to ABA (i.e. less sensitive than wild type) (Wanget al, 2001; Coursol et al, 2003; Fan et al, 2008). By contrast,in seed germination and post-germination seedling growth,G-protein subunit mutants are un-equally hypersensitive toABA (i.e. more sensitive than wild type): the agb1 single andthe agb1 gpa1 double mutants are more hypersensitivethan the gpa1 single mutant (Pandey et al, 2006). Thereare no extant studies regarding mature leaf sensitivityto ABA in the G-protein mutants versus wild type, nor anytranscriptome-wide studies on the sensitivities of generegulation to ABA in the G-protein mutants in any cell ortissue type. Here, we use our transcriptome data to assess andcompare gene regulation by ABA in guard cells and leaves ofthe G-protein mutants.
ABA-only regulated genes by definition have equal re-sponses to ABA in all mutant genotypes. G-protein-onlyregulated genes and G-protein–ABA additively regulated genesby definition have no or equal response to ABA in all mutantgenotypes; thus, these genes are not useful for revealing ABAhyposensitivity or hypersensitivity. Therefore, we investigatethose genes that exhibit ABA–G-protein co-regulation, com-paring each ABA–G-protein-regulated gene’s expressionchange in response to ABA in the wild-type genotype versuseach mutant genotype. We define hyposensitivity to ABA asthe case when the gene has lesser up/downregulation inresponse to ABA in a mutant as compared with wild type.Similarly, we define hypersensitivity to ABA as the case whenthe gene has greater up/downregulation in response to ABA inthe mutant as compared with wild type. We also determine thenumbers of genes that have similar responses in combinationsof two mutant genotypes, or all three of them.
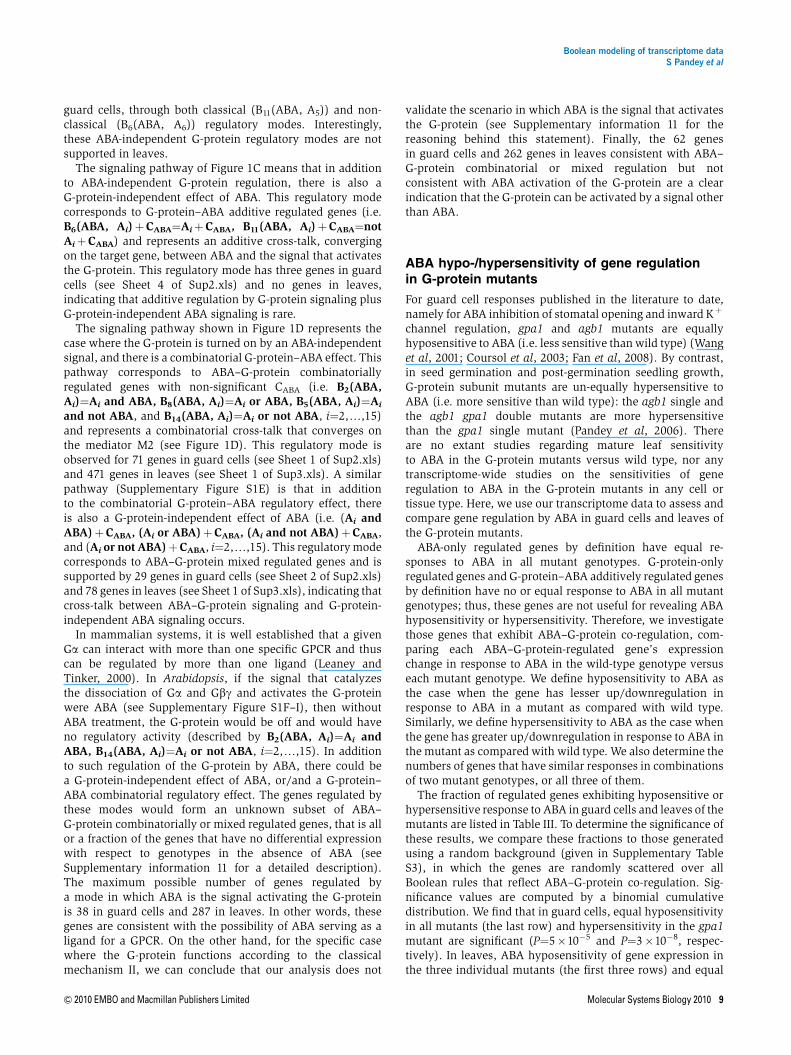
The fraction of regulated genes exhibiting hyposensitive orhypersensitive response to ABA in guard cells and leaves of themutants are listed in Table III. To determine the significance ofthese results, we compare these fractions to those generatedusing a random background (given in Supplementary TableS3), in which the genes are randomly scattered over allBoolean rules that reflect ABA–G-protein co-regulation. Sig-nificance values are computed by a binomial cumulativedistribution. We find that in guard cells, equal hyposensitivityin all mutants (the last row) and hypersensitivity in the gpa1mutant are significant (P¼5�10�5 and P¼3�10�8, respec-tively). In leaves, ABA hyposensitivity of gene expression inthe three individual mutants (the first three rows) and equal
Boolean modeling of transcriptome dataS Pandey et al
& 2010 EMBO and Macmillan Publishers Limited Molecular Systems Biology 2010 9
hyposensitivity in all mutants (the last row) are highlysignificant (Po10�50 for all these cases). Using a less stringentdifferential expression threshold (Pgenoo0.05) leads to verysimilar results (data not shown).
Functional preferences in G-protein regulatorymodes
To examine whether specific G-protein regulatory modes tendto be involved in specific aspects of plant physiology, weperform functional analysis on the co-regulated genes in eachG-protein regulatory mode using the FunCat functionalcatalogue of the MIPS database (Mewes et al, 2006). TheP-values are calculated by the hypergeometric cumulativedistribution and Bonferroni correction was applied for multi-
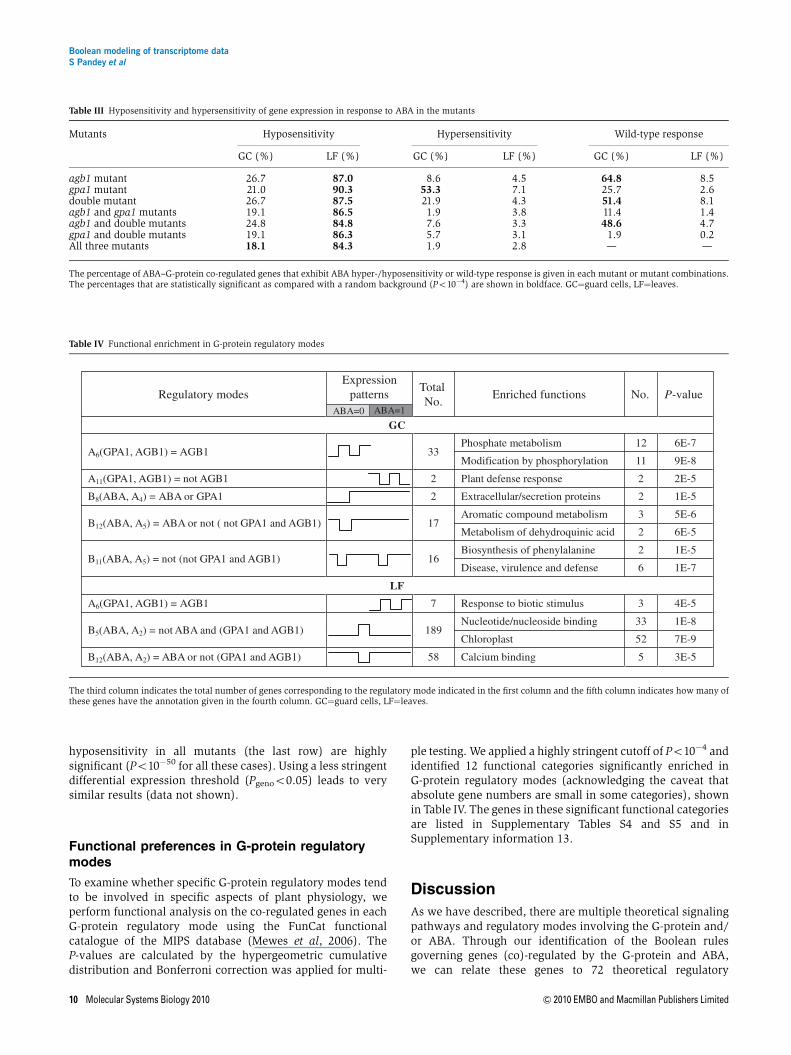
ple testing. We applied a highly stringent cutoff of Po10�4 andidentified 12 functional categories significantly enriched inG-protein regulatory modes (acknowledging the caveat thatabsolute gene numbers are small in some categories), shownin Table IV. The genes in these significant functional categoriesare listed in Supplementary Tables S4 and S5 and inSupplementary information 13.
Discussion
As we have described, there are multiple theoretical signalingpathways and regulatory modes involving the G-protein and/or ABA. Through our identification of the Boolean rulesgoverning genes (co)-regulated by the G-protein and ABA,we can relate these genes to 72 theoretical regulatory
Table IV Functional enrichment in G-protein regulatory modes
Regulatory modesExpression
patternsTotalNo.
Enriched functions No. P-value
GC
A6(GPA1, AGB1) = AGB1 33Phosphate metabolism 12 6E-7
Modification by phosphorylation 11 9E-8
A11(GPA1, AGB1) = not AGB1 2 Plant defense response 2 2E-5
B8(ABA, A4) = ABA or GPA1 2 Extracellular/secretion proteins 2 1E-5
B12(ABA, A5) = ABA or not ( not GPA1 and AGB1) 17Aromatic compound metabolism 3 5E-6
Metabolism of dehydroquinic acid 2 6E-5
B11(ABA, A5) = not (not GPA1 and AGB1) 16Biosynthesis of phenylalanine 2 1E-5
Disease, virulence and defense 6 1E-7
LF
A6(GPA1, AGB1) = AGB1 7 Response to biotic stimulus 3 4E-5
B5(ABA, A2) = not ABA and (GPA1 and AGB1) 189Nucleotide/nucleoside binding 33 1E-8
Chloroplast 52 7E-9
B12(ABA, A2) = ABA or not (GPA1 and AGB1) 58 Calcium binding 5 3E-5
ABA=0 ABA=1
The third column indicates the total number of genes corresponding to the regulatory mode indicated in the first column and the fifth column indicates how many ofthese genes have the annotation given in the fourth column. GC¼guard cells, LF¼leaves.
Table III Hyposensitivity and hypersensitivity of gene expression in response to ABA in the mutants
Mutants Hyposensitivity Hypersensitivity Wild-type response
GC (%) LF (%) GC (%) LF (%) GC (%) LF (%)
agb1 mutant 26.7 87.0 8.6 4.5 64.8 8.5gpa1 mutant 21.0 90.3 53.3 7.1 25.7 2.6double mutant 26.7 87.5 21.9 4.3 51.4 8.1agb1 and gpa1 mutants 19.1 86.5 1.9 3.8 11.4 1.4agb1 and double mutants 24.8 84.8 7.6 3.3 48.6 4.7gpa1 and double mutants 19.1 86.3 5.7 3.1 1.9 0.2All three mutants 18.1 84.3 1.9 2.8 — —
The percentage of ABA–G-protein co-regulated genes that exhibit ABA hyper-/hyposensitivity or wild-type response is given in each mutant or mutant combinations.The percentages that are statistically significant as compared with a random background (Po10�4) are shown in boldface. GC¼guard cells, LF¼leaves.
Boolean modeling of transcriptome dataS Pandey et al
10 Molecular Systems Biology 2010 & 2010 EMBO and Macmillan Publishers Limited
modes (Table I) and the proposed nine signaling pathways(Supplementary Figure S1), providing insights into thebiological plausibility of G-protein and ABA regulation andallowing us to address the questions posed in the Introduction.
Are all of the classical modes of G-proteinsignaling supported and are any non-classicalmodes of G-protein signaling revealed?
Phenotypic analysis of Arabidopsis G-protein mutants hasindicated that classic mammalian G-protein regulatory para-digms are also used during plant G-protein signaling. Ouranalysis strongly supports the conclusion that such classicalparadigms also function in the regulation of the planttranscriptome. Our analysis indicates that most of the 70theoretical regulatory mechanisms involving the G-protein(i.e. excluding two ABA-only regulatory modes) are unsup-ported and thus may be biologically untenable, at least in thebiological systems investigated here. For example, 33 out ofthese 70 theoretical regulatory modes are unsupported (have 0genes) and only five are strongly supported in guard cells; thecorresponding numbers for leaves are 34 and 4 (Supplemen-tary Figure S10–S12; Table II). These results lend credence toour analysis method, as it would be unexpected if G-proteinregulation of the transcriptome were to proceed throughentirely different mechanisms than the well-establishedmechanisms revealed by physiological analyses.
Notably, our analysis also reveals a novel G-proteinregulatory mechanism: positive regulation by the Gb(g)subunit independent of the presence or absence of the Gasubunit is well supported in the guard cell transcriptome.According to this rule, AGB1, agb1 plants exhibit a mutantphenotype, whereas gpa1 plants are wild type for the samephenotype. Interestingly, among the numerous physiologicaland developmental responses that are G-protein regulated inArabidopsis as judged by mutant analysis (Perfus-Barbeochet al, 2004), there are a few phenotypes consistent with thispattern: agb1 mutants are resistant to the protein glycosylationinhibitor, tunicamycin, whereas gpa1 plants exhibit wild-typesensitivities (Wang et al, 2007). This response has beenassociated with AGB1 resident in the endoplasmic reticulum(Wang et al, 2007), suggesting that subcellular localizationmay be one mechanism through which Gb(g) subunits arepartitioned into heterotrimer-dependent versus heterotrimer-independent functions. Another plausible AGB1 phenotype isaltered root waving and skewing, which is observed in agb1mutants and not in gpa1 mutants (Pandey et al, 2008).
To our knowledge, Gb(g) function completely independentof any input from Ga (i.e. Gb(g) never assembles into aheterotrimer, even in the absence of agonist) has not beenpreviously implicated in mammalian systems, except possiblyfor non-Gg-related signaling modes of the unusual Gb5 subunit(Dupre et al, 2009). This may be because the mechanism isunique to plants or it may be because the mechanism onlyoccurs in specialized mammalian cell types or systems andthus has escaped detection. Alternatively, it may be that thecomplexity and redundancy of the G-protein complement inmammals has simply precluded discovery of this mechanismto date, whereas our use of a simpler model system
coupled with the ability to monitor thousands of phenotypessimultaneously enabled detection. Thus, future investigationof this mechanism in both plants and metazoans is warranted.
Conversely, our analysis indicates that the regulation by Gaindependent of the presence or absence of the Gbg subunit isnot supported by the microarray data. It has been proposedthat GPA1, owing to fast kinetics of GDP/GTP exchange and aslow rate of GTP hydrolysis, would persist constitutively in theGTP-bound form, and thus could function independently fromGb(g) (Johnston et al, 2007). In our own biochemical analyses(Pandey et al, 2009), we also observed slow rates of GTPhydrolysis by GPA1 but rates of GTPgS binding werecomparable to those for bovine Ga assayed by the samemethod. Our analysis here does not indicate independent Gafunction, at least with regard to transcriptome regulation inguard cells and leaves.
Does the heterotrimeric G-protein haveABA-independent regulatory activity? Is itpossible that ABA and the G-protein co-regulatesome processes, but ABA is not the signalactivating the G-protein?
Previous physiological analyses of guard cell function havefocused almost exclusively on the roles of heterotrimericG-proteins in ABA signaling (Wang et al, 2001; Fan et al, 2008).Our transcriptome analysis now reveals that in this cell type,the heterotrimeric G-protein also has clear ABA-independentactivity. Thus, when ABA–G-protein co-regulatory modes areevaluated, two G-protein-only functions are seen in guardcells: GPA1 or not AGB1 (classical II) and AGB1. Guard cellsactually sense a wide variety of signals, including light, CO2,humidity, several hormones, and pathogens (Roelfsema andHedrich, 2005; Israelsson et al, 2006; Shimazaki et al, 2007;Melotto et al, 2008; Acharya and Assmann, 2009). Our resultsnow suggest that potential roles of G-proteins in these othersignaling processes should also be evaluated. Indeed, there isalready some evidence for heterotrimeric G-protein involve-ment in guard cell response to pathogens (Zhang et al, 2008b),as well as in guard cell development (Zhang et al, 2008a).
In guard cells, there is also evidence that ABA and theG-protein co-regulate sets of genes, consistent with knownco-regulation by ABA and the G-protein at the physiologicallevel. For the 62 genes corresponding to the functions B8(ABA,Ai)¼Ai or ABA, B5(ABA, Ai)¼Ai and not ABAwith or withouta significant CABA, ABA can be excluded as the activating signalfor the G-protein. An additional 38 guard cell genes exhibitregulation consistent with ABA being the signal that activatesthe G-protein; however, in the absence of additional biologicalinformation, these patterns are also consistent with ABAregulating signal transduction downstream of the G-protein:our current data do not allow us to distinguish between thesetwo possibilities.
Our analysis does not support G-protein functions indepen-dent of ABA (G-protein-only regulatory modes) in matureleaves. There are no genes in the leaf transcriptome thatexhibit an identical pattern of expression relative to genotypein both the presence and the absence of ABA. There is strongsupport, however, for both mixed and combinatorial regula-
Boolean modeling of transcriptome dataS Pandey et al
& 2010 EMBO and Macmillan Publishers Limited Molecular Systems Biology 2010 11
tion by ABA and the G-protein. To date, ABA responses ofrosette leaves have not been studied in the G-protein mutants,and our results strongly suggest that such studies wouldbe useful for deciphering novel G-protein/ABA signalingpathways.
Is there system specificity of G-protein regulatorymechanisms?
To account for the diversity of physiological and develop-mental phenotypes observed in knockout mutants of plantG-proteins, despite the small numbers of G-protein subunitsencoded in plant genomes, it has been proposed that there isspecificity in how G-protein signaling components are used indifferent cells and tissues. Our analyses corroborate thishypothesis, through several lines of reasoning. First, theregulatory modes that are strongly supported by our analysisdiffer in guard cells versus leaves. This is true both when weevaluate G-protein regulatory modes without considering ABAeffects (Figure 3) and when we combine all the data together toanalyze G-protein/ABA co-regulation (Table II). For example,in both the former and the latter analyses, AGB1 is an observedregulatory mode in guard cells but not in leaves and, in fact, forleaves there is no G-protein-only regulatory mode that issupported when G-protein/ABA co-regulation is considered.These results suggest that heterotrimeric G-proteins areactually more involved in ABA signaling in leaves than inguard cells, an interpretation that is consistent with thestronger ABA hyposensitivity exhibited by the leaf transcrip-tome than the guard cell transcriptome of the G-proteinmutants (see next section). This new finding was unexpected,given that ABA has been integrally linked to guard cellphysiology for decades, but has received little attention as aregulator of mesophyll cell biology. It is also important to notethat this conclusion could not have arisen from extantphysiological data, since to date no leaf responses to ABAhave been evaluated at the physiological level in the G-proteinmutant lines.
Although both guard cells and leaves do exhibit ABA–G-protein co-regulation of gene expression, the two systems
favor different co-regulatory modes. For example, it is strikingthat at the transcriptome level, the classical II mechanism (notGPA1 and AGB1) is significantly more common in guard cellsthan in leaves, whereas the classical Ia and Ib mechanisms(GPA1 and AGB1) are possible in both tissue types, but morestrongly so in leaves (Table V; see Supplementary information14 for statistical analysis). In addition, the specific genes thatare co-regulated by ABA and the G-protein differ betweenguard cells and leaves. Thus, among the 100 genes in guardcells and 549 genes in leaves that are ABA–G-protein co-regulated in some manner, only five genes (At1g30290,At4g29750, At1g31150, At1g74720, and At1g11210) appear inboth guard cell and leaf data sets, in contrast to 106 ABA-onlyregulated genes common to both systems.
Does regulation at the level of the transcriptomerecapitulate previously observed hypersensitivityor hyposensitivity of developmental and dynamictransient responses to ABA in G-protein mutants?
Transcriptome level responses to ABA show some interestingdifferences compared with the existing physiological literatureon ABA sensitivity of G-protein mutants (Wang et al, 2001;Pandey et al, 2006). For example, whereas ABA inhibition ofstomatal opening and ion channel regulation in guard cells areABA hyposensitive in gpa1, agb1, and agb1 gpa1 doublemutants (Wang et al, 2001; Fan et al, 2008), our analysis showsthat ABA hyposensitivity of the mutant guard cell transcrip-tome, at least at the time point sampled here, is not as strong asthe hyposensitivity evidenced by these rapid responses toABA, possibly indicating differences between protein level andtranscriptionally mediated responses. Further, a set of guardcells transcripts that shows ABA hypersensitivity in theG-protein mutants is observed. There is precedence for thesame guard cell signaling element functioning in both ABAhyposensitivity and ABA hypersensitivity; for example, over-expression in guard cells of an inositol polyphosphate5-phosphatase, which terminates inositol phosphate signaling,results in hyposensitivity to ABA inhibition of stomatalopening and hypersensitivity to ABA promotion of stomatalclosure (Perera et al, 2008). Nevertheless, transcriptomeresults do not necessarily mean that ABA hypersensitivityof a portion of the transcriptome results in physiologicaloutcomes that are ABA hypersensitive as, for example, theABA-hypersensitive genes could encode elements that func-tion in repression of ABA response. In either case, these resultsdo indicate that a diversity of signaling pathways existsbetween the G-protein and gene regulation in guard cells.Interestingly, the majority of genes that show ABA hypersen-sitivity in the gpa1 mutant (50/56) are governed by theclassical II mechanism and the majority of genes that showequal hyposensitivity in all mutants (19/22) are governed bythe classical I mechanisms.
Another novel observation is the strong ABA hyposensiti-vity of the G-protein-regulated mature leaf transcriptome, withall mutants showing equal ABA hyposensitivity. Previously,seed germination, seedling growth and gene expression wereshown to be hypersensitive to ABA in these G-protein mutants(Pandey et al, 2006), leading to the hypothesis that ABA
Table V Representation of the classical I and classical II G-protein mechanismsin ABA–G-protein co-regulatory modes
GC LF
Classical I 21/100 503/549B2(ABA, A2), B2(ABA, A15), B14(ABA, A2),B14(ABA, A15), B5(ABA, A2), B5(ABA, A15),B8(ABA, A2), B8(ABA, A15)
Classical II 51/100 27/549B2(ABA, A5), B2(ABA, A12), B14(ABA, A5),B14(ABA, A12), B5(ABA, A5), B5(ABA, A12),B8(ABA, A5), B8(ABA, A12)
The first column indicates the B(ABA, A) functions related to the two classicalG-protein mechanisms. In the second and third columns, the denominator ofeach ratio indicates the total number of genes assigned to the G-protein–ABAco-regulatory modes in the given tissue type and the numerator indicates thenumber of genes supporting the given classical mechanism. GC¼guard cells,LF¼leaves.
Boolean modeling of transcriptome dataS Pandey et al
12 Molecular Systems Biology 2010 & 2010 EMBO and Macmillan Publishers Limited
hyposensitivity might be a distinctive characteristic foundexclusively in the highly specialized guard cells, where ABAsignaling has an integral function in cellular function. Thishypothesis is not supported by our microarray data, whichinstead suggest the alternative hypothesis that G-proteininvolvement in ABA signaling is defined at the cell ororgan level.
Functional categories in G-protein regulatorymodes
If the biological interpretations indicated by our model arevalid, then we would expect to find at least some level ofcorrelation between these interpretations of our transcriptomedata and results from previous physiological analyses ofG-protein mutants. Indeed, several of the functional categoriesidentified by our analysis have been implicated in previousphysiological analyses of G-protein mutants, providing valida-tion to the biological interpretation of our results. Threefunctional categories related to plant pathogen responseappear in guard cell regulatory modes, consistent with knownroles of the G-protein in plant pathogen response (Trusov et al,2006). For example, the functional category ‘disease, viru-lence, and defense’ is enriched in the regulatory modeB11(ABA, A5)¼not (not GPA1 and AGB1)¼GPA1 or notAGB1 in guard cells. Specifically, At1G63750, At1G72520,LCR69, NHL10, NHL1, and AtPCB are all genes implicated indefense against pathogens. This regulatory mode is consistentwith a regulatory mechanism in which the Gbg subunit, freedfrom its association with Ga, downregulates transcript levelsof these defense genes, and is also consistent with our earlierphysiological observations that gpa1 guard cells are hypo-sensitive to the bacterial elicitor molecule, flg22 (Zhang et al,2008b). Given this information, we might speculate that,in guard cells, ligands coupling to GPCRs upstream ofthe heterotrimer may be, or include, pathogen-derived or-dependent molecules, that is elicitors. Associated with therule A6¼AGB1 in guard cells are the significant functionalcategories ‘de/phosphorylation’ and ‘phosphate metabolism’.The latter category contains nine kinases and two genesencoding PP2C-type protein phosphatases. A number ofkinases and PP2C phosphatases already have been shown tobe integral to guard cell signaling pathways (Gosti et al, 1999;Li et al, 2000; Merlot et al, 2001; Mustilli et al, 2002; Yoshidaet al, 2002; Ma et al, 2009; Park et al, 2009; Rubio et al, 2009);our results implicate new candidate proteins of this type. Inguard cells, we also find that genes associated with meta-bolism of aromatic compounds are components of the ABA–G-protein co-regulated transcriptome. Although not yetstudied in guard cells, there are several reports at the wholeseedling level that implicate G-proteins in the regulation ofaromatic amino-acid synthesis (Warpeha et al, 2006, 2008).
In leaves, we find that the functional category ‘chloroplast’is highly significant, consistent with earlier observationslinking GPA1 to chloroplast development (Zhang et al,2009). Interestingly, the chloroplast protein THF1 (Zhanget al, 2009), which has been shown to physically interact withGPA1 (Huang et al, 2006), appears as one of the regulatedtranscripts in this category. Representation of functionalcategories related to signaling (‘calcium binding,’ ‘cellular
signaling’) is also consistent with the known signaling roles ofG-proteins. The category ‘nucleotide/nucleoside binding’ istypified by kinases, ATPases, and ATP-binding G-proteins,linking G-proteins to well-established secondary messengersand transport functions. Thus, our transcriptome analyses areconsistent with previously identified biological roles ofG-proteins in Arabidopsis while also providing specific newgene targets for investigation.
One point to note is that, considering the data as a whole, thenumbers of genes regulated by the ABA-only mode (713 inguard cells and 403 in leaves) is much greater than thenumbers of genes regulated by G-protein-only modes (28genes in guard cells and only At3G12730 in leaves, excludingGPA1 and AGB1 themselves). These results, along with theobservation that transcription factors are not found to beoverrepresented among G-protein-only or G-protein–ABA co-regulated genes (data not shown), suggests that the pheno-types of G-protein mutants do not arise due to a ‘resetting’ ofthe entire cellular profile but rather are likely to stem fromdisruption of specific G-protein-coupled signaling events.
In this study, we generate transcriptome data from stomatalguard cells and rosette leaves and investigate G-proteinsignaling in these two systems. There may be a cellularcomplexity difference between guard cell and leaf samples, asguard cells are a single cell type, whereas leaves are composedof several types of cells. However, the majority of the cell typescontributing to the leaf microarray are mesophyll cells; guardcells and other non-mesophyll cell types comprise a very smallpercentage of the leaf. Our transcriptome measurementsconfirm that minor cell types such as guard cells do notsignificantly influence the leaf microarray. For example, in ourwild-type transcriptome data sets, 361 transcripts weredetectable in all three guard cell chip hybridizations but werenot present in any of the three leaf chip hybridizations. Inparticular, some genes that are very highly expressed in Colguard cells, for example ATHSP23.6-MITO (AT4G25200),ATATH4 (AT3G47760), DDF1 (AT1G12610), EPF1 (AT2G20875),SP1L2 (AT1G69230), and AtSIP1 (AT1G55740) are not present inany of the Col leaf microarrays.
In addition, in this study, we obtain leaves and guard cells atone developmental time point and measure gene expression atone time point after ABA treatment. Although we acknowledgethese caveats, the former is not an issue as germination andleaf development throughout the vegetative stage is quitesynchronous among all four genotypes under our conditions(Nilson and Assmann, 2010). For the latter, by our 3-h timepoint, the first (rapid) phase of guard cell response will havereached steady state, based on earlier studies of stomatalaperture response to ABA (Israelsson et al, 2006). Our studyidentifies key genes for which kinetics of gene expression canbe assessed in more detail in subsequent studies.
Relevance of our Boolean framework
Although Boolean networks have been used previously toextract gene relationships from time course expression profiles(Akutsu et al, 1999; Martin et al, 2007), this is, to ourknowledge, the first study using systematic Boolean rules todeduce regulatory mechanisms based on analysis of mutanttranscriptomes. The microarray studies in this work offer an
Boolean modeling of transcriptome dataS Pandey et al
& 2010 EMBO and Macmillan Publishers Limited Molecular Systems Biology 2010 13
unprecedented complexity by studying four genotypes andtwo signaling conditions, in two different tissue types. Withsuch complex data sets, pairwise differential expression analysisusually leads to results that are difficult to interpret because ofthe combinatorial complexity of regulation. The novelty of ourmethod is that we provide an intuitive and reasonable way toanalyze mutant expression data, which not only determinesgene groups/modules, but also indicates the regulatorymechanisms connecting the genes in each group to theG-protein and/or to ABA. This makes our method veryhelpful for analyzing signal transduction pathways givenindividual signaling components with known properties,for example a transcription factor known to vary in phosphory-lation status.
When associating genes with regulatory modes, we avoidbiases and binarization of the expression values by correlatingdifferential expression patterns instead of correlating absoluteexpression profiles. We use a systematic pairwise comparisonprocedure (Figure 2) to construct the differential expressionvectors of genes. Not all of these pairwise comparisons areindependent or orthogonal, but these comparisons determinea vector uniquely corresponding to a Boolean function from acomprehensive perspective and give a reliable result. We alsotested the use of orthogonal contrasts to construct thedifferential expression patterns of genes, and obtained similarresults (Supplementary information 15).
Clustering methods comprise another approach commonlyused to predict co-regulated genes in microarray data sets(Thalamuthu et al, 2006; Liu et al, 2008). These methods aremost useful when only rough knowledge such as upregulationor downregulation is expected as a result. The clusters do notoffer information on the biological regulatory modes, whereasour method provides a putative mechanism for each group ofco-regulated genes. In addition, clustering methods cannotdistinguish the extent of a regulatory effect on a gene. In ourmethod, each gene has correlation scores indicating thestrength of the gene’s association with each regulatory mode.We have tested the popular k-means clustering method toanalyze our mutant expression data (Supplementary informa-tion 16) and find that most of the clusters do not have coherentexpression patterns like ours (Supplementary Table S8).Moreover, these clusters lack biological interpretations suchas those provided by our models.
In conclusion, our application of a Boolean framework forthe analysis of microarray data sets has discovered newmechanisms of G-protein and hormonal control. We posit thatapplication of this approach to transcriptomic data sets fromother systems will similarly provide new perspectives regard-ing other switch-like signal transduction mechanisms, such asregulation by reversible post-translational events or bycombinatorial association of transcription factors.
Materials and methods
Plant materials, ABA treatment, and microarrayexperiments
All mutants are in the Arabidopsis Col background and have beendescribed earlier (Jones et al, 2003; Ullah et al, 2003; Chen et al, 2004).These are T-DNA insertional mutants that fail to produce full-lengthGPA1 or AGB1 transcripts; gpa1-4 is also confirmed as a null mutation
at the protein level (Fan et al, 2008). Microarray data were generatedfrom four genotypes (wild type, gpa1-4 mutant, agb1-2 mutant, andagb1-2 gpa1-4 double mutant) with or without ABA treatment.Arabidopsis plants were grown in growth chambers with an 8 hlight/16 h dark, 201C/181C cycle, with light intensity of120 mmol m�2 s�1. Three hundred Arabidopsis leaves excised from 60to 70 five-week-old plants were used as the starting material for eachguard cell microarray (see Supplementary information 2 for plantgrowth details and guard cell isolation protocol). Ten mature leavestaken from three to four plants grown side-by-side with the plants forguard cell isolation were used for each leaf sample. Excised leaf andisolated guard cell samples were treated with ABA (50mM) or EtOH(solvent control) for 3 h. RNA was isolated from each sample usingTrizol reagent (Invitrogen). Trizol-isolated RNA was further purifiedusing the Plant RNeasy kit (Qiagen, Valencia, CA). RNA samplesexhibiting a 25S/18S ratio 41.4 and no significant degradation inBioanalyzer profiles (Agilent Technology, Palo Alto, CA) were used forcDNA and then cRNA synthesis, followed by hybridization toAffymetrix ATH1 ‘whole genome’ chips, all according to standardAffymetrix protocols. For each type of sample (guard cells or leaves),three independent biological replicates were performed, resulting in atotal of 48 microarray hybridizations (2 sample types� 4 genoty-pes� two treatments� 3 replicates).
Microarray data processing and validation
The transcriptome data reported in this paper have been deposited inthe Gene Expression Omnibus database (http://www.ncbi.nlm.nih.gov/geo) with accession no. GSE19520. We applied several differentapproaches to assess quality control and the overall quality of thehybridizations is very high (Supplementary information 17). Theaverage pairwise correlation among all biological replicates is 0.982,indicating that the variation arising from biological replicates is verysmall. The widely used RMA method implemented in the affy packagein the bioconductor project was used to normalize the data for allprobe sets using default parameters (Gautier et al, 2004; Gentlemanet al, 2004). The RMA does not provide a way to calculate present callsand absent calls, so GeneChip suite 5.0 algorithm implemented in theaffy package was used to obtain presence/absence calls for each probeset in each independent sample with default parameters. In total, thereare 22 810 probe sets on the Affymetrix ATH1 Arabidopsis chips. Weeliminated only those genes that were absent in all 24 samples of agiven tissue type (a very loose filtering); this left 17 581 probes fromguard cell samples and 17 827 probes from leaf samples for furtheranalysis. The subsequent analysis of variance (ANOVA) step discardsthose genes that show no differential expression in any of ourmicroarray comparisons.
Data obtained from the microarray hybridizations were confirmedby real-time quantitative reverse transcriptase PCR (QPCR) of selectedgenes (Supplementary information 18). For each gene, the differentialexpression pattern of all genotype� treatment combinations wascompared between microarray data and QPCR data (8 comparisons pergene, for a total of 64 comparisons). Microarray and QPCR patterns ofgene differential expression exhibit an 86% (¼55/64) match (seeSupplementary Figure S16).
Boolean model of G-protein regulatory modes
We represent GPA1 and AGB1 by Boolean variables that can have twostates: 1 denoting ‘on’ (not knocked out) and 0 denoting ‘off’ (knockedout). Each of the four genotypes considered in our study correspondsto one of the 22¼4 possible combinations of the states of GPA1 andAGB1, from GPA1¼0 and AGB1¼0 for the agb1 gpa1 double mutant toGPA1¼1 and AGB1¼1 for wild type. The regulatory modes of theG-protein are modeled by a Boolean function A(GPA1, AGB1). There isa total of 24¼16 possible Boolean functions fitting A(GPA1, AGB1),which we denote as Ai(GPA1, AGB1), i¼1,2,y,16. Except A1 and A16,each of these corresponds to one regulatory mode of the G-protein andreflects the activity of a G-protein-regulated mediator that furtherregulates the expression level of a target gene. All possible regulatorymodes of the G-protein and the associated expression patterns of theirpotential target genes can be found in Supplementary Table S1.
Boolean modeling of transcriptome dataS Pandey et al
14 Molecular Systems Biology 2010 & 2010 EMBO and Macmillan Publishers Limited
Boolean model of G-protein–ABA co-regulatorymodes
We also represent ABA by a Boolean variable with 1 indicating thepresence of ABA (i.e. ABA treatment) and 0 representing the absence ofABA (i.e. solvent control). We assume that co-regulation by theG-protein and ABA can be described as F(ABA, GPA1, AGB1)¼CABAþB(ABA, GPA1, AGB1), where CABA is a constant representing aG-protein-independent regulatory effect of ABA on a given gene, andB(ABA, GPA1, AGB1) is a Boolean function representing the possiblecombinatorial regulation of ABA and the G-protein. A value for CABA
that is not vanishingly small indicates that there is a G-protein-independent signaling pathway by which ABA regulates the gene.Although a general B(ABA, GPA1, AGB1) function allows a variety ofcombinatorial regulatory schemes by individual G-protein subunitstogether with ABA, we have not found evidence of ABA participating incontrasting combinatorial regulation with individual G-protein sub-units (see Supplementary information 5 for a detailed analysis). Thus,in the following analysis, we use the simplified form B(ABA, A(GPA1,AGB1)) that excludes these cases.
In total, there are 24¼16 Boolean functions fitting the B(ABA,A(GPA1, AGB1)) form, denoted as B1, B2,y, B16. Each of theserepresents a set of Boolean rules due to the fact that A(GPA1, AGB1) isalready a Boolean function. Because of logical equivalence, in total,there are 72 non-trivial unique Boolean functions that we can use todistinguish between (co)regulatory modes of the G-protein and ABA(see Supplementary information 6 for the derivation of these Booleanfunctions). Together with CABA, F(ABA, GPA1, AGB1) is able to identify142 (i.e. (72�2)� 2þ 2) regulatory modes, which can categorize theregulation by the G-protein and ABA into five types: ABA-onlyregulation (B4, B13), G-protein-only regulation (B6 (ABA, Ai)¼B11
(ABA, A17-i), i¼2,y,15, combined with a non-significant CABA), G-protein–ABA additive regulation (B6 (ABA, Ai)¼B11 (ABA, A17-i),i¼2,y,15, combined with a significant CABA), ABA–G-proteincombinatorial regulation (B2(ABA, Ai)¼B3(ABA, A17-i), B5(ABA,Ai)¼B9(ABA, A17-i), B8(ABA, Ai)¼B12(ABA, A17-i), B14(ABA,Ai)¼B15(ABA, A17-i), i¼2,y,15, combined with a non-significantCABA) and ABA–G-protein mixed regulation (B2(ABA, Ai)¼B3(ABA,A17-i), B5(ABA, Ai)¼B9(ABA, A17-i), B8(ABA, Ai)¼B12(ABA, A17-i),B14(ABA, Ai)¼B15(ABA, A17-i), i¼2,y,15, combined with a significantCABA), which further allow us to examine the representation of the nineproposed G-protein and ABA signaling pathways (SupplementaryFigure S1).
Association of genes with regulatory modes
As a first step, we use ANOVA (Sahai and Agell, 2000) to identify thegenes that are differentially expressed with respect to genotypes orABA. Within the control or ABA treatment categories, the expression ofeach gene is affected merely by genotypes, so we perform one-wayANOVA and denote the corresponding P-value as Pgeno. The expressionof each gene in all samples is affected by both genotypes and ABA.To extract the ABA effect, we use two-way ANOVA and denote theABA-associated P-value as PABA.
For association of genes with G-protein regulatory modes, we usePgenoo0.01 for each individual treatment� tissue combination. Forassociation of genes with G-protein–ABA co-regulatory modes, wedesignate P40.05 as no differential expression and Po0.02 asdifferential expression. Specifically, there are 6975 genes in guardcells and 6299 genes in leaves that have PABA40.05 and Pgeno40.05(no differential expression with respect to genotypes and also nodifferential expression with respect to ABA) and these genes are notconsidered further. Those genes that have no differential expressionwith respect to genotypes but are differentially expressed with respectto ABA (PABAo0.02 and Pgeno40.05 for both ABA¼0 and ABA¼1) arecandidates for ABA-only regulation (Figure 1A). For those genes withdifferential expression in at least one condition of ABA¼0 and ABA¼1,we determine and subtract CABA from the expression values of thegenes in the condition (presence or absence of ABA) corresponding tothe higher level. We choose CABA¼0.6 as the lower threshold ofsignificance (Supplementary information 7). Those genes that havegenotype-dependent differential expression in both ABA¼0 and
ABA¼1 (Pgenoo0.02 for both ABA¼0 and ABA¼1) are candidates forG-protein-only regulation (if their CABA is not significant) (Figure 1B)or G-protein–ABA additive regulation (if their CABA is significant)(Figure 1C). Those genes that exhibit differential expression withrespect to genotypes for ABA¼0 or ABA¼1, but not both (Pgenoo0.02in one case and Pgeno40.05 in the other case) are candidates for ABA–G-protein combinatorial regulation (if their CABA is not significant)(Figure 1D) or ABA–G-protein mixed regulation (if their CABA issignificant) (Supplementary Figure S1E).
Each regulatory mode of the G-protein and ABA corresponds to aunique three-valued vector, which we call an idealized differentialexpression pattern, through comparison of the gene expression valuesbetween pairs of genotypes or within the same genotype in the absenceor presence of ABA (Figure 2; Supplementary information 8). The realdifferential expression pattern of a gene is constructed using a signal-to-noise ratio metric (Golub et al, 1999). We introduce a measure toquantify the correlation between the real differential expressionpattern of a gene with a Boolean function’s three-valued vector (seeSupplementary information 8). Each gene is associated with thatBoolean function for which it has the maximum correlation score. Weclassify a gene as regulated by a particular mode if its correlation scoreis higher than a threshold.
False discovery rates and statistical significanceevaluation
Permutation tests are used to determine the statistical significance ofeach gene’s association with a given function, and to estimate the falsediscovery rate (FDR) in putative gene groups of particular type (seeSupplementary information 8). The correlation threshold is chosen insuch a way to control the FDR at an acceptable level (seeSupplementary information 9 and 10). Specifically, for association ofgenes with G-protein regulatory modes, in all four data sets,differentially expressed genes are associated with Boolean functionsA(GPA1, AGB1) if the correlation between their differential expressionpatterns and the idealized pattern exceeds the threshold R0¼1.1, whichcontrols the FDR within 0.02 (see Supplementary Figure S6). Forassociation of genes with G-protein–ABA co-regulatory modes thecorrelation threshold R0¼0.9 is used, which controls the FDR of ABA–G-protein combinatorially or mixed regulated genes within 0.05 andthe FDR of G-protein-only or G-protein–ABA additively regulatedgenes within 0.005 (Supplementary Figures S7 and S8). As the numberof ABA-only regulated genes is large, we set 2.0 as the threshold ofABA-only regulated genes, which controls the FDR within 0.0005(Supplementary Figure S9). These thresholds and FDRs apply to bothguard cell data and leaf data.
Supplementary information
Supplementary information is available at the Molecular SystemsBiology website (http://www.nature.com/msb).
AcknowledgementsThis research was supported by NSF grants MCB-0209694, MCB-0618402, CCF-0643529, and USDA grant 2006-35100-17254. We thankDr Craig Praul for outstanding technical advice and assistance onsample preparation and microarray hybridization.
Conflict of interestThe authors declare that they have no conflict of interest.
References
Acharya BR, Assmann SM (2009) Hormone interactions in stomatalfunction. Plant Mol Biol 69: 451–462
Boolean modeling of transcriptome dataS Pandey et al
& 2010 EMBO and Macmillan Publishers Limited Molecular Systems Biology 2010 15
Akutsu T, Miyano S, Kuhara S (1999) Identification of genetic networksfrom a small number of gene expression patterns under the Booleannetwork model. Pac Symp Biocomput 4: 17–28
Assmann SM (2005) G proteins Go green: a plant G protein signalingFAQ sheet. Science 310: 71–73
Chen JG, Gao Y, Jones AM (2006) Differential roles of Arabidopsisheterotrimeric G-protein subunits in modulating cell division inroots. Plant Physiol 141: 887–897
Chen JG, Pandey S, Huang J, Alonso JM, Ecker JR, Assmann SM, JonesAM (2004) GCR1 can act independently of heterotrimeric G-proteinin response to brassinosteroids and gibberellins in Arabidopsis seedgermination. Plant Physiol 135: 907–915
Coursol S, Fan LM, Le Stunff H, Spiegel S, Gilroy S, Assmann SM (2003)Sphingolipid signalling in Arabidopsis guard cells involvesheterotrimeric G proteins. Nature 423: 651–654
Digby GJ, Sethi PR, Lambert NA (2008) Differential dissociation of Gprotein heterotrimers. J Physiol 586: 3325–3335
Dupre DJ, Robitaille M, Rebois RV, Hebert TE (2009) The role of Gbgsubunits in the organization, assembly, and function of GPCRsignaling complexes. Annu Rev Pharmacol Toxicol 49: 31–56
Fan LM, Zhang W, Chen JG, Taylor JP, Jones AM, Assmann SM (2008)Abscisic acid regulation of guard-cell K+ and anion channels in Gb-and RGS-deficient Arabidopsis lines. Proc Natl Acad Sci USA 105:8476–8481
Frank M, Thumer L, Lohse MJ, Bunemann M (2005) G Proteinactivation without subunit dissociation depends on a Ga(i)-specificregion. J Biol Chem 280: 24584–24590
Finkelstein RR, Gampala SS, Rock CD (2002) Abscisic acid signaling inseeds and seedlings. Plant Cell 14 (Suppl): S15–S45
Gautier L, Cope L, Bolstad BM, Irizarry RA (2004) affy—Analysis ofAffymetrix GeneChip data at the probe level. Bioinformatics 20:307–315
Gentleman RC, Carey VJ, Bates DM, Bolstad B, Dettling M, Dudoit S,Ellis B, Gautier L, Ge Y, Gentry J, Hornik K, Hothorn T, Huber W,Iacus S, Irizarry R, Leisch F, Li C, Maechler M, Rossini AJ,Sawitzki G et al (2004) Bioconductor: open software developmentfor computational biology and bioinformatics. Genome Biol 5:R80
Golub TR, Slonim DK, Tamayo P, Huard C, Gaasenbeek M, Mesirov JP,Coller H, Loh ML, Downing JR, Caligiuri MA, Bloomfield CD,Lander ES (1999) Molecular classification of cancer: class discoveryand class prediction by gene expression monitoring. Science 286:531–537
Gookin TE, Kim J, Assmann SM (2008) Whole proteome identificationof plant candidate G-protein coupled receptors in Arabidopsis, rice,and poplar: computational prediction and in-vivo protein coupling.Genome Biol 9: R120
Gosti F, Beaudoin N, Serizet C, Webb AA, Vartanian N, Giraudat J(1999) ABI1 protein phosphatase 2C is a negative regulator ofabscisic acid signaling. Plant Cell 11: 1897–1910
Huang J, Taylor JP, Chen JG, Uhrig JF, Schnell DJ, Nakagawa T, Korth KL,Jones AM (2006) The plastid protein THYLAKOID FORMATION1 andthe plasma membrane G-protein GPA1 interact in a novel sugar-signaling mechanism in Arabidopsis. Plant Cell 18: 1226–1238
Israelsson M, Siegel RS, Young J, Hashimoto M, Iba K, Schroeder JI(2006) Guard cell ABA and CO2 signaling network updates andCa2+ sensor priming hypothesis. Curr Opin Plant Biol 9: 654–663
Johnston CA, Taylor JP, Gao Y, Kimple AJ, Grigston JC, Chen JG,Siderovski DP, Jones AM, Willard FS (2007) GTPase acceleration asthe rate-limiting step in Arabidopsis G protein-coupled sugarsignaling. Proc Natl Acad Sci USA 104: 17317–17322
Jones AM, Assmann SM (2004) Plants: the latest model system forG-protein research. EMBO Rep 5: 572–578
Jones AM, Ecker JR, Chen JG (2003) A reevaluation of the role of theheterotrimeric G protein in coupling light responses in Arabidopsis.Plant Physiol 131: 1623–1627
Klein S, Reuveni H, Levitzki A (2000) Signal transduction by anondissociable heterotrimeric yeast G protein. Proc Natl Acad SciUSA 97: 3219–3223
Leaney JL, Tinker A (2000) The role of members of the pertussis toxin-sensitive family of G proteins in coupling receptors to the activationof the G protein-gated inwardly rectifying potassium channel. ProcNatl Acad Sci USA 97: 5651–5656
Lease KA, Wen J, Li J, Doke JT, Liscum E, Walker JC (2001) A mutantArabidopsis heterotrimeric G-protein b subunit affects leaf, flower,and fruit development. Plant Cell 13: 2631–2641
Leonhardt N, Kwak JM, Robert N, Waner D, Leonhardt G, Schroeder JI(2004) Microarray expression analyses of Arabidopsis guard cellsand isolation of a recessive abscisic acid hypersensitive proteinphosphatase 2C mutant. Plant Cell 16: 596–615
Leung J, Giraudat J (1998) Abscisic acid signal transduction. Annu RevPlant Physiol Plant Mol Biol 49: 199–222
Li J, Wang XQ, Watson MB, Assmann SM (2000) Regulation of abscisicacid-induced stomatal closure and anion channels by guard cellAAPK kinase. Science 287: 300–303
Liu X, Lee S-C, Casella G, Peter GF (2008) Assessing agreement ofclustering methods with gene expression microarray data. ComputStat Data Anal 52: 5356–5366
Ma Y, Szostkiewicz I, Korte A, Moes D, Yang Y, Christmann A, Grill E(2009) Regulators of PP2C phosphatase activity function as abscisicacid sensors. Science 324: 1064–1068
Marrari Y, Crouthamel M, Irannejad R, Wedegaertner PB (2007)Assembly and trafficking of heterotrimeric G proteins. Biochemistry46: 7665–7677
Martin S, Zhang Z, Martino A, Faulon JL (2007) Boolean dynamics ofgenetic regulatory networks inferred from microarray time seriesdata. Bioinformatics 23: 866–874
McCudden CR, Hains MD, Kimple RJ, Siderovski DP, Willard FS(2005) G-protein signaling: back to the future. Cell Mol Life Sci 62:551–577
Melotto M, Underwood W, He SY (2008) Role of stomata in plant innateimmunity and foliar bacterial diseases. Annu Rev Phytopathol 46:101–122
Merlot S, Gosti F, Guerrier D, Vavasseur A, Giraudat J (2001) The ABI1and ABI2 protein phosphatases 2C act in a negative feedbackregulatory loop of the abscisic acid signalling pathway. Plant J 25:295–303
Mewes HW, Frishman D, Mayer KF, Munsterkotter M, Noubibou O,Pagel P, Rattei T, Oesterheld M, Ruepp A, Stumpflen V (2006) MIPS:analysis and annotation of proteins from whole genomes in 2005.Nucleic Acids Res 34: D169–D172
Moriyama EN, Strope PK, Opiyo SO, Chen Z, Jones AM (2006) Miningthe Arabidopsis thaliana genome for highly-divergent seventransmembrane receptors. Genome Biol 7: R96
Morris AJ, Malbon CC (1999) Physiological regulation of G protein-linked signaling. Physiol Rev 79: 1373–1430
Mustilli AC, Merlot S, Vavasseur A, Fenzi F, Giraudat J (2002)Arabidopsis OST1 protein kinase mediates the regulation ofstomatal aperture by abscisic acid and acts upstream of reactiveoxygen species production. Plant Cell 14: 3089–3099
Nilson SE, Assmann SM (2010) Heterotrimeric G proteins regulatereproductive trait plasticity in response to water availability. NewPhytol 185: 734–746
Okamoto H, Gobel C, Capper RG, Saunders N, Feussner I, Knight MR(2009) The a-subunit of the heterotrimeric G-protein affects jasmonateresponses in Arabidopsis thaliana. J Exp Bot 60: 1991–2003
Oldham WM, Hamm HE (2008) Heterotrimeric G protein activation byG-protein-coupled receptors. Nat Rev Mol Cell Biol 9: 60–71
Pandey S, Chen JG, Jones AM, Assmann SM (2006) G-protein complexmutants are hypersensitive to abscisic acid regulation ofgermination and postgermination development. Plant Physiol141: 243–256
Pandey S, Monshausen GB, Ding L, Assmann SM (2008) Regulation ofroot-wave response by extra large and conventional G proteins inArabidopsis thaliana. Plant J 55: 311–322
Pandey S, Nelson DC, Assmann SM (2009) Two novel GPCR-type Gproteins are abscisic acid receptors in Arabidopsis. Cell 136:136–148
Boolean modeling of transcriptome dataS Pandey et al
16 Molecular Systems Biology 2010 & 2010 EMBO and Macmillan Publishers Limited
Park SY, Fung P, Nishimura N, Jensen DR, Fujii H, Zhao Y, Lumba S,Santiago J, Rodrigues A, Chow TF, Alfred SE, Bonetta D, FinkelsteinR, Provart NJ, Desveaux D, Rodriguez PL, McCourt P, Zhu JK,Schroeder JI, Volkman BFet al (2009) Abscisic acid inhibits type 2Cprotein phosphatases via the PYR/PYL family of START proteins.Science 324: 1068–1071
Pavlidis P, Noble WS (2003) Matrix2png: a utility for visualizing matrixdata. Bioinformatics 19: 295–296
Perera IY, Hung CY, Moore CD, Stevenson-Paulik J, Boss WF (2008)Transgenic Arabidopsis plants expressing the type 1 inositol 5-phosphatase exhibit increased drought tolerance and alteredabscisic acid signaling. Plant Cell 20: 2876–2893
Perfus-Barbeoch L, Jones AM, Assmann SM (2004) Plantheterotrimeric G protein function: insights from Arabidopsis andrice mutants. Curr Opin Plant Biol 7: 719–731
Roelfsema MR, Hedrich R (2005) In the light of stomatal opening: newinsights into ‘the Watergate’. New Phytol 167: 665–691
Rubio S, Rodrigues A, Saez A, Dizon MB, Galle A, Kim TH,Santiago J, Flexas J, Schroeder JI, Rodriguez PL (2009) Triple loss offunction of protein phosphatases type 2C leads to partial constitutiveresponse to endogenous abscisic acid. Plant Physiol 150: 1345–1355
Sahai H, Agell MI (2000) The Analysis of Variance. Boston: BirkhauserShimazaki K, Doi M, Assmann SM, Kinoshita T (2007) Light regulation
of stomatal movement. Annu Rev Plant Biol 58: 219–247Temple BR, Jones AM (2007) The plant heterotrimeric G-protein
complex. Annu Rev Plant Biol 58: 249–266Thalamuthu A, Mukhopadhyay I, Zheng X, Tseng GC (2006)
Evaluation and comparison of gene clustering methods inmicroarray analysis. Bioinformatics 22: 2405–2412
Trusov Y, Rookes JE, Chakravorty D, Armour D, Schenk PM, Botella JR(2006) Heterotrimeric G proteins facilitate Arabidopsis resistance tonecrotrophic pathogens and are involved in jasmonate signaling.Plant Physiol 140: 210–220
Ullah H, Chen JG, Temple B, Boyes DC, Alonso JM, Davis KR, Ecker JR,Jones AM (2003) The b-subunit of the Arabidopsis G proteinnegatively regulates auxin-induced cell division and affectsmultiple developmental processes. Plant Cell 15: 393–409
Wang S, Narendra S, Fedoroff N (2007) Heterotrimeric G proteinsignaling in the Arabidopsis unfolded protein response. Proc NatlAcad Sci USA 104: 3817–3822
Wang XQ, Ullah H, Jones AM, Assmann SM (2001) G proteinregulation of ion channels and abscisic acid signaling inArabidopsis guard cells. Science 292: 2070–2072
Warpeha KM, Gibbons J, Carol A, Slusser J, Tree R, Durham W,Kaufman LS (2008) Adequate phenylalanine synthesis mediated byG protein is critical for protection from UV radiation damage inyoung etiolated Arabidopsis thaliana seedlings. Plant Cell Environ31: 1756–1770
Warpeha KM, Lateef SS, Lapik Y, Anderson M, Lee BS, Kaufman LS(2006) G-protein-coupled receptor 1, G-protein Ga-subunit 1, andprephenate dehydratase 1 are required for blue light-inducedproduction of phenylalanine in etiolated Arabidopsis. Plant Physiol140: 844–855
Yoshida R, Hobo T, Ichimura K, Mizoguchi T, Takahashi F, Aronso J,Ecker JR, Shinozaki K (2002) ABA-activated SnRK2 protein kinaseis required for dehydration stress signaling in Arabidopsis. PlantCell Physiol 43: 1473–1483
Zhang L, Hu G, Cheng Y, Huang J (2008a) Heterotrimeric G protein aand b subunits antagonistically modulate stomatal density inArabidopsis thaliana. Dev Biol 324: 68–75
Zhang L, Wei Q, Wu W, Cheng Y, Hu G, Hu F, Sun Y, Zhu Y, SakamotoW, Huang J (2009) Activation of the heterotrimeric G protein a-subunit GPA1 suppresses the ftsh-mediated inhibition ofchloroplast development in Arabidopsis. Plant J 58: 1041–1053
Zhang W, He SY, Assmann SM (2008b) The plant innate immunityresponse in stomatal guard cells invokes G-protein-dependent ionchannel regulation. Plant J 56: 984–996
Molecular Systems Biology is an open-access journalpublished by European Molecular Biology Organiza-
tion and Nature Publishing Group.This article is licensed under a Creative Commons Attribution-Noncommercial-No Derivative Works 3.0 Licence.
Boolean modeling of transcriptome dataS Pandey et al
& 2010 EMBO and Macmillan Publishers Limited Molecular Systems Biology 2010 17
Copyright © 2022 FDOKUMEN