Bone is functionally impaired in dystrophic mice but less so than skeletal muscle
20
Bone is functionally impaired in dystrophic mice but less so than skeletal muscle Susan A. Novotny 1 , Gordon L. Warren 2 , Angela S. Lin 3 , Robert E. Gulderg 3 , Kristen A. Baltgalvis 4 , and Dawn A. Lowe 5 1 Department of Kinesiology, University of Minnesota, Minneapolis, Minnesota 2 Division of Physical Therapy, Georgia State University, Atlanta, Georgia 3 Institute for Bioengineering and Bioscience, Georgia Institute of Technology, Atlanta Georgia 4 Department of Biochemistry, Molecular Biology, and Biophysics, University of Minnesota, Minneapolis, Minnesota 5 Program in Physical Therapy and Rehabilitation Sciences, University of Minnesota, 420 Delaware Street SE, Minneapolis, Minnesota 55455, USA Abstract The primary purpose of this study was to determine if tibial bone strength is compromised in dystrophic mice and if so, what geometric and material properties contribute. Results of three- point ending tests showed that tibia of mdx and dko (dystrophin- and utrophin-deficient) mice had up to 50% lower strength and stiffness compared to wild-type mice. Micro-computed tomography indicated that dystrophic tibia had reductions of 6–57% in cortical cross-sectional moment of inertia and cross-sectional area. Metaphyseal trabecular bone morphometry was also altered up to 78% in dystrophic mice. Bone-to-muscle functional ratios (i.e., three-point bending measures:muscle strength) indicated that bone strength was relatively high in 7-week-old dystrophic mice compared to muscle strength, but ratios were similar to wild-type mice by 24- months of age. Thus, as in boys with Duchenne muscular dystrophy, young dystrophic mice have compromised bone strength; these models may be useful for designing therapeutic regimens aimed at improving the skeleton. Keywords Duchenne Muscular Dystrophy; bone geometry; μCT; bone strength; mdx mouse Introduction Bone fractures are on the rise in the nearly 8,000 boys in the United States affected by Duchenne muscular dystrophy (DMD), with little progress being made toward remediation [1–4]. DMD is characterized by progressive muscular weakness attributed to contraction- induced muscle injury followed by inefficient repair [5]. Thus as the disease progresses, Correspondence: Susan A. Novotny, Cooke Hall 110,1900 University Ave. SE, University of Minnesota, Minneapolis, Minnesota 55455, USA, Phone:612-625-5022, Fax: 612-625-4274 [email protected]. Publisher's Disclaimer: This is a PDF file of an unedited manuscript that has been accepted for publication. As a service to our customers we are providing this early version of the manuscript. The manuscript will undergo copyediting, typesetting, and review of the resulting proof before it is published in its final citable form. Please note that during the production process errors may be discovered which could affect the content, and all legal disclaimers that apply to the journal pertain. NIH Public Access Author Manuscript Neuromuscul Disord. Author manuscript; available in PMC 2012 March 1. Published in final edited form as: Neuromuscul Disord. 2011 March ; 21(3): 183–193. doi:10.1016/j.nmd.2010.12.002. NIH-PA Author Manuscript NIH-PA Author Manuscript NIH-PA Author Manuscript
Transcript of Bone is functionally impaired in dystrophic mice but less so than skeletal muscle
Bone is functionally impaired in dystrophic mice but less sothan skeletal muscle
Susan A. Novotny1, Gordon L. Warren2, Angela S. Lin3, Robert E. Gulderg3, Kristen A.Baltgalvis4, and Dawn A. Lowe51 Department of Kinesiology, University of Minnesota, Minneapolis, Minnesota2 Division of Physical Therapy, Georgia State University, Atlanta, Georgia3 Institute for Bioengineering and Bioscience, Georgia Institute of Technology, Atlanta Georgia4 Department of Biochemistry, Molecular Biology, and Biophysics, University of Minnesota,Minneapolis, Minnesota5 Program in Physical Therapy and Rehabilitation Sciences, University of Minnesota, 420Delaware Street SE, Minneapolis, Minnesota 55455, USA
AbstractThe primary purpose of this study was to determine if tibial bone strength is compromised indystrophic mice and if so, what geometric and material properties contribute. Results of three-point ending tests showed that tibia of mdx and dko (dystrophin- and utrophin-deficient) mice hadup to 50% lower strength and stiffness compared to wild-type mice. Micro-computed tomographyindicated that dystrophic tibia had reductions of 6–57% in cortical cross-sectional moment ofinertia and cross-sectional area. Metaphyseal trabecular bone morphometry was also altered up to78% in dystrophic mice. Bone-to-muscle functional ratios (i.e., three-point bendingmeasures:muscle strength) indicated that bone strength was relatively high in 7-week-olddystrophic mice compared to muscle strength, but ratios were similar to wild-type mice by 24-months of age. Thus, as in boys with Duchenne muscular dystrophy, young dystrophic mice havecompromised bone strength; these models may be useful for designing therapeutic regimens aimedat improving the skeleton.
KeywordsDuchenne Muscular Dystrophy; bone geometry; μCT; bone strength; mdx mouse
IntroductionBone fractures are on the rise in the nearly 8,000 boys in the United States affected byDuchenne muscular dystrophy (DMD), with little progress being made toward remediation[1–4]. DMD is characterized by progressive muscular weakness attributed to contraction-induced muscle injury followed by inefficient repair [5]. Thus as the disease progresses,
Correspondence: Susan A. Novotny, Cooke Hall 110,1900 University Ave. SE, University of Minnesota, Minneapolis, Minnesota55455, USA, Phone:612-625-5022, Fax: 612-625-4274 [email protected]'s Disclaimer: This is a PDF file of an unedited manuscript that has been accepted for publication. As a service to ourcustomers we are providing this early version of the manuscript. The manuscript will undergo copyediting, typesetting, and review ofthe resulting proof before it is published in its final citable form. Please note that during the production process errors may bediscovered which could affect the content, and all legal disclaimers that apply to the journal pertain.
NIH Public AccessAuthor ManuscriptNeuromuscul Disord. Author manuscript; available in PMC 2012 March 1.
Published in final edited form as:Neuromuscul Disord. 2011 March ; 21(3): 183–193. doi:10.1016/j.nmd.2010.12.002.
NIH
-PA Author Manuscript
NIH
-PA Author Manuscript
NIH
-PA Author Manuscript
boys become less physically active and unable to perform activities of daily living [6–8],both of which reduce the frequency and magnitude of mechanical loads placed on bone. Asa result, bones should enter a stage of disuse, resulting in bone loss and structurallyweakened bones that are more prone to fracture. Indeed, fracture incidence in boys withDMD is reported to be between 18–44%, where higher incidence rates parallel increases inage, physical limitation and disease state [1–3]. Fractures typically occur in the lowerextremities after falling from standing or sitting height [3,9], indicating that bone strength iscompromised. This loss of bone strength may be due to altered bone geometry and/or otherextrinsic or intrinsic material properties (e.g., density or composition of the bone). Dualenergy X-ray absorptiometry (DXA) has been utilized to monitor the loss of areal bonedensity in various skeletal regions with age in DMD [1,10], but the relative contribution ofbone loss and that of compromised bone geometry and material properties to bone strengthhave not been evaluated in DMD. Delineating the roles of these factors will provide a betterindication of whole bone function and fracture risk in the context of muscular dystrophy.
Mouse models of DMD are available and these could aid in the assessment of the disease’seffect on bone strength and its underlying mechanical determinants including geometric andintrinsic material properties. There have only been two studies on bone in a DMD mousemodel and both utilized the mdx mouse [11,12], the most commonly used animal model ofDMD. Similar to boys with DMD, mdx mice have dysfunctional dystrophin protein, and as aresult develop characteristic muscle weakness early in life, i.e., between 15–20 days of age[13]. Anderson et al. reported that the tibia is weaker in 4- and 18-week-old mdx mice,compared to that of age-matched, wild-type mice [11]. The bone weakness was indicated bylower ultimate load, smaller cross-sectional area, and thinner cortices. In contrast,Montgomery et al. found that 16-week old mdx mice had stronger, wider and denser femurscompared to those from wild-type mice [12]. In this latter study, after adjusting for thegreater body weight of mdx mice, no differences in bone characteristics were detectedbetween mdx and wild-type mice. Thus, it remains to be determined whether or not mdxbones are functionally compromised as a secondary consequence of the muscle disease.
DXA, X-ray, and histomorphometry are traditional methods used to analyze bone and wereused in the two aforementioned studies. A newer and more sensitive technique is micro-computed tomography (μCT), which simultaneously quantifies bone volumetric density andgeometry at a higher resolution providing more sensitive assessment of bone. Furthermore,μCT is a non-destructive imaging technique that allows for subsequent evaluations of thebone’s composition and functional properties to be performed on the same specimen.Collectively, these approaches can be utilized to investigate bone strength and elucidate themechanisms underlying a loss in bone strength that occur as a result of muscular dystrophy.This information may provide insight for designing strategies that could be used to offset thedeleterious effects of the disease on bone.
Therefore, the primary objective of our study was to determine if mdx mice indeed havecompromised bone compared to wild-type mice, and if so, what geometric and materialproperties contribute. Specifically, three-point bending tests, μCT imaging andmeasurements of bone composition were utilized to assess bone strength, geometry andintrinsic material properties of the tibia, respectively. We also used these strategies to assessbone in a second model of DMD, dko mice. Dko mice lack functional dystrophin andutrophin proteins resulting in a more severe phenotype of the disease relative to mdx mice[14]; this phenotype is more similar to that seen in boys with DMD.
Another objective of the study was to directly evaluate the functional relationships betweenmuscle and bone in this mouse model of muscle disease. Previous studies have suggestedthat skeletal muscle not only provides an anabolic stimulus to bone but is also required to
Novotny et al. Page 2
Neuromuscul Disord. Author manuscript; available in PMC 2012 March 1.
NIH
-PA Author Manuscript
NIH
-PA Author Manuscript
NIH
-PA Author Manuscript
maintain the structural competence of bone [15]. Thus, according to the mechanostat theory[16], the loss of muscle function with DMD disease progression should translate toproportional declines in tibial bone size and strength. To address this theory, we calculatedbone-to-muscle ratios of functional capacity using our measurements of ultimate load andstiffness for the tibial bone and force generating capacities for the extensor digitorum longus(EDL) muscle. We hypothesized that dystrophic mice would exhibit similar bone-to-muscleratios as those of wild-type mice, indicating that their tibial bone function is diminished to asimilar extent as the contractile function of the adjacent EDL muscle.
MethodsAnimals and Experimental Design
Four wk-old wild-type (C57BL/10) and mdx mice (n=8 and 7, respectively) in addition to 8-mo-old wild-type and mdx retired breeders (n=9 each) were obtained from JacksonLaboratories (Bar Harbor, ME). Four wk-old dko mice (n=7) were obtained from our colony[17]. All wild-type and mdx mice were male; dko mice were male and female (n=4 and 3,respectively). Female dko mice were included due to the limited availability of male dkomice. Mice were housed in groups of four on a 12:12-h light-dark cycle at 20–23°C underpathogen-free conditions. All mice were provided food and water ad libitum. All procedureswere approved by the Institutional Animal Care and Use Committee at the University ofMinnesota.
At the age of 7 wk or 24 mo, mice were weighed, anesthetized with sodium pentobarbital(100 mg/kg i.p.), and EDL muscles were dissected for contractile analyses. Mice were thensacrificed with an overdose of sodium pentobarbital (200 mg/kg) and tibial bones wereexcised. These bones were stored in phosphate-buffered saline at −20 °C until the time ofanalysis. The 7 wk age was chosen because it was thought to best reflect a time point withfunctional declines in both muscle and bone. Additional rationale for selecting the 7 wk timepoint was that it approximates the average lifespan of dko mice in our colony. Despite areport that the average lifespan of male mdx mice is 21.5 mo [5], all of our mdx retiredbreeders lived to 24 mo and remained apparently healthy. Therefore the 24-mo-old mdxmice in this study were mice that had lived with a chronic muscle disease.
Contractility of EDL MuscleEDL muscle contractile function was measured as previously described [18,19]. Briefly, themuscle was placed in a 0.38-ml bath assembly filled with Krebs–Ringer bicarbonate bufferthat was maintained at 25 °C; the proximal tendon was connected with 6-0 suture to the armof a dual-mode muscle lever system (300B-LR; Aurora Scientific Inc., Aurora, ON,Canada). Optimal muscle length (Lo) was set and then maximal isometric tetanic force wasdetermined by stimulating muscles with 0.5-ms pulses at 180 Hz and 150 V for 400 ms(Grass S48 stimulator connected to a SIU5D stimulus isolation unit; Grass Telefactor,Warwick, RI). The maximal isometric tetanic force was then normalized to the EDLmuscle’s physiological cross-sectional area (i.e. muscle mass divided by the product ofmuscle density (1.06 g/ml) and fiber length (0.44·Lo)) [20]. Peak eccentric force wasdetermined by passively shortening the muscle from Lo to 0.95 Lo, and then simultaneouslystimulating the muscle for 133 ms as the muscle lengthened to 1.05 Lo at 0.75 Lo/s.
μCT of Tibial Mid-Diaphysis and MetaphysisA μCT system (Scanco Medical μCT 40, Brüttisellen, Switzerland) was used to quantifycortical bone geometry and volumetric bone mineral density (vBMD) of the tibia at the mid-diaphysis; trabecular morphometry in the tibial metaphysis was also assessed. The scannerwas set to a voltage of 55 kVp and a current of 145 μA, and bones were scanned using an
Novotny et al. Page 3
Neuromuscul Disord. Author manuscript; available in PMC 2012 March 1.
NIH
-PA Author Manuscript
NIH
-PA Author Manuscript
NIH
-PA Author Manuscript
isotropic 12 μm voxel size with a 250 ms integration time. At the mid-diaphysis, 66sequential two-dimensional grayscale slices (12 μm thickness) were obtained, as previouslydescried [21]. After image segmentation for bone using a global threshold, an algorithm wasused to compute the following morphometric outcome measures: cortical cross-sectionalarea, cortical thickness, periosteal diameter, cross-sectional moment of inertia (CSMI) andvBMD. These measures were assessed for each of the 66 slices, and then the average of the66 slices was reported. The minimum principal CSMI (CSMImin) was utilized in the presentstudy as it best corresponds to the CSMI about the bone bending axis during the three-pointbending test (described below).
Trabecular bone in the proximal tibia metaphyseal region was imaged in ~50 sequentialslices, beginning 5 slices distal to the last image containing the growth plate. The mean bonevolume fraction (BV/TV), trabecular number, trabecular thickness, and trabecular spacingwere quantified to characterize bone morphometry. Upon completion of imaging, boneswere refrozen in PBS and stored at −80°C until the time they underwent mechanical testing.
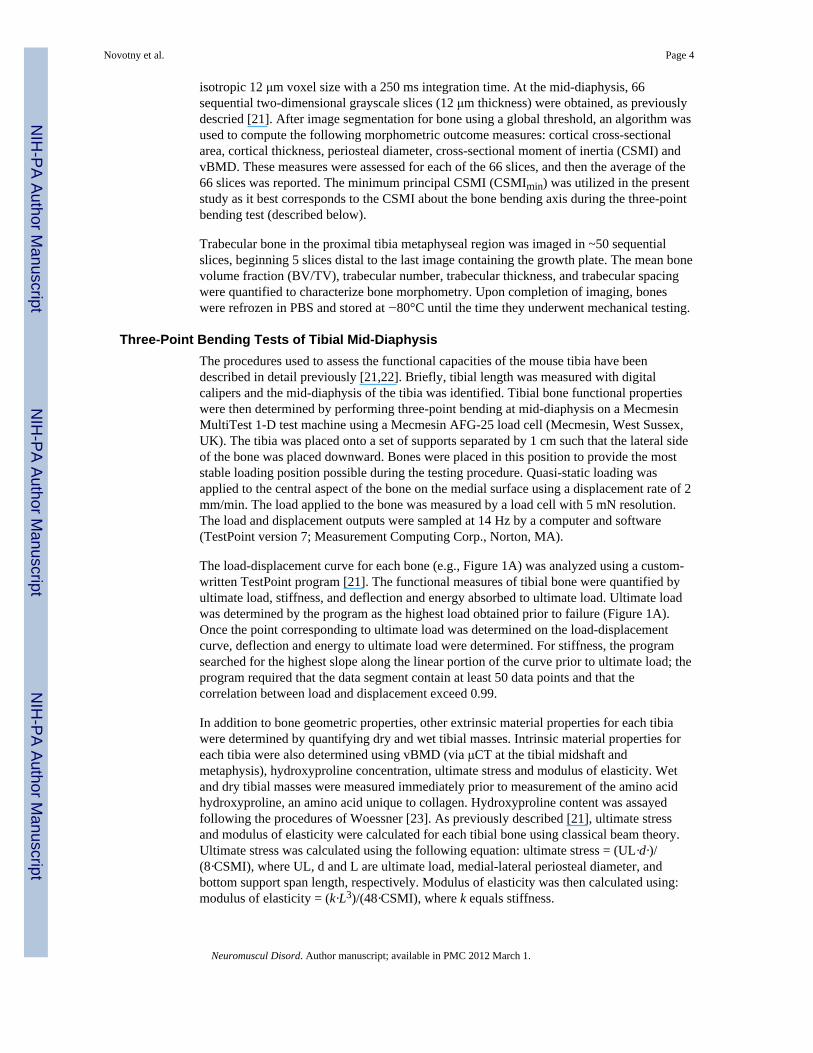
Three-Point Bending Tests of Tibial Mid-DiaphysisThe procedures used to assess the functional capacities of the mouse tibia have beendescribed in detail previously [21,22]. Briefly, tibial length was measured with digitalcalipers and the mid-diaphysis of the tibia was identified. Tibial bone functional propertieswere then determined by performing three-point bending at mid-diaphysis on a MecmesinMultiTest 1-D test machine using a Mecmesin AFG-25 load cell (Mecmesin, West Sussex,UK). The tibia was placed onto a set of supports separated by 1 cm such that the lateral sideof the bone was placed downward. Bones were placed in this position to provide the moststable loading position possible during the testing procedure. Quasi-static loading wasapplied to the central aspect of the bone on the medial surface using a displacement rate of 2mm/min. The load applied to the bone was measured by a load cell with 5 mN resolution.The load and displacement outputs were sampled at 14 Hz by a computer and software(TestPoint version 7; Measurement Computing Corp., Norton, MA).
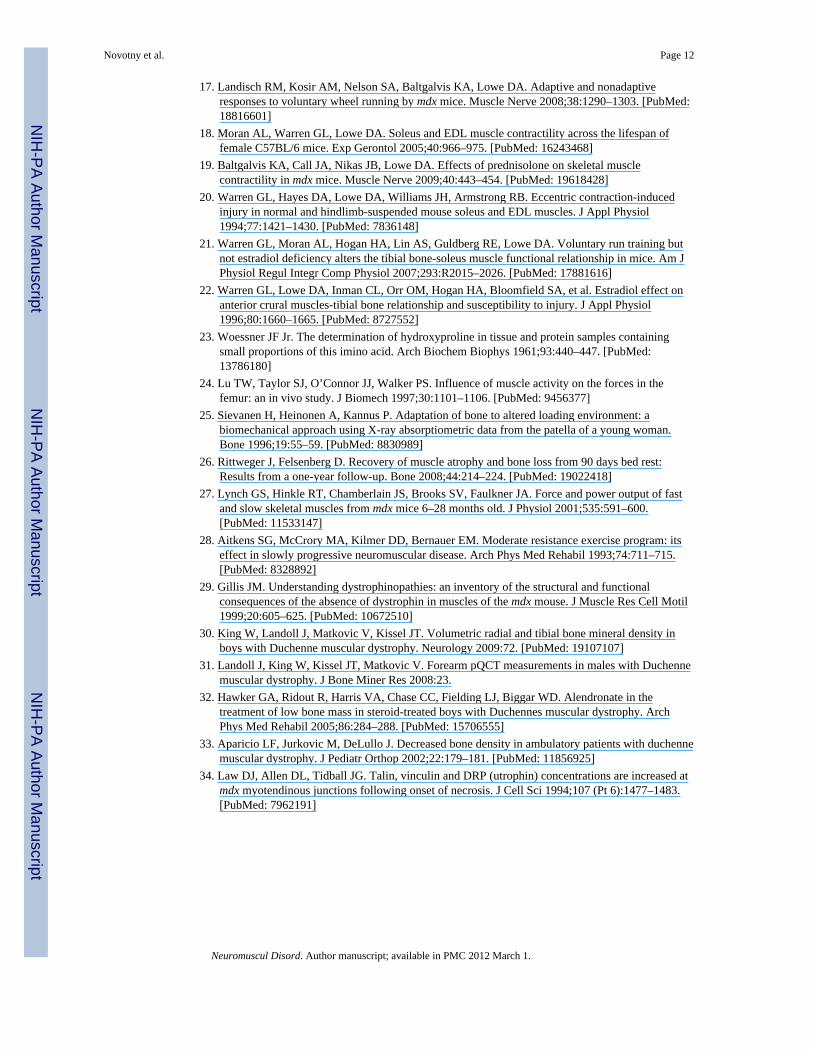
The load-displacement curve for each bone (e.g., Figure 1A) was analyzed using a custom-written TestPoint program [21]. The functional measures of tibial bone were quantified byultimate load, stiffness, and deflection and energy absorbed to ultimate load. Ultimate loadwas determined by the program as the highest load obtained prior to failure (Figure 1A).Once the point corresponding to ultimate load was determined on the load-displacementcurve, deflection and energy to ultimate load were determined. For stiffness, the programsearched for the highest slope along the linear portion of the curve prior to ultimate load; theprogram required that the data segment contain at least 50 data points and that thecorrelation between load and displacement exceed 0.99.
In addition to bone geometric properties, other extrinsic material properties for each tibiawere determined by quantifying dry and wet tibial masses. Intrinsic material properties foreach tibia were also determined using vBMD (via μCT at the tibial midshaft andmetaphysis), hydroxyproline concentration, ultimate stress and modulus of elasticity. Wetand dry tibial masses were measured immediately prior to measurement of the amino acidhydroxyproline, an amino acid unique to collagen. Hydroxyproline content was assayedfollowing the procedures of Woessner [23]. As previously described [21], ultimate stressand modulus of elasticity were calculated for each tibial bone using classical beam theory.Ultimate stress was calculated using the following equation: ultimate stress = (UL·d·)/(8·CSMI), where UL, d and L are ultimate load, medial-lateral periosteal diameter, andbottom support span length, respectively. Modulus of elasticity was then calculated using:modulus of elasticity = (k·L3)/(48·CSMI), where k equals stiffness.
Novotny et al. Page 4
Neuromuscul Disord. Author manuscript; available in PMC 2012 March 1.
NIH
-PA Author Manuscript
NIH
-PA Author Manuscript
NIH
-PA Author Manuscript
Bone and Muscle RelationshipsTo determine whether the tibia was more or less affected by the dystrophic conditionrelative to the EDL muscle’s contractile strength, bone-muscle functional relationships wereexamined. Tibial bone’s measures of functional capacity (ultimate load and stiffness) weredivided by the EDL muscle’s contractile capacity (maximum isometric and eccentriccontraction forces) as previously descried [21]. These bone-to-muscle ratios were done on amouse-by-mouse basis, meaning that if a mouse did not have measurements for both itstibial bone and EDL muscle, the ratio was not calculated. Ratios that are higher than thosefor the corresponding age-matched control mice indicate that functional properties ofdystrophic bone are relatively greater than those of muscle, while ratios that are lower thanthose for the control mice indicate the reverse.
Statistical AnalysesTo analyze the effects of genotype (wild-type vs. mdx) and age (7 wk vs. 24 mo), two-wayANOVAs were utilized. When interactions were significant (p<0.05), Holm-Sidak post hoctests were performed to determine which combinations of conditions were different fromeach other. To assess possible effects of body mass on tibial geometric parameters at themidshaft (i.e., cortical cross sectional area, cortical wall thickness, and periosteal diameter)as well as tibial bone wet and dry mass, two-way ANCOVAs were run using body mass asthe covariate.
To examine the effect of disease severity (i.e., the more severe dystrophin and utrophindeficient dko mouse model relative to both dystrophin deficient mdx mice and wild-typemice), 7 week-old dko mice were compared to wild-type and mdx mice of the same age.Before this analysis was done, independent t-tests were performed and percent differenceswere calculated to confirm that gender differences were not present between male andfemale dko mice. A one-way ANOVA was then done with genotype as the fixed factor. If aneffect of genotype was present, Holm-Sidak post-hoc measures were used to determinedifferences among the genotypes. When assumptions of normality or equal variance wereviolated, Kruskal-Wallis One Way Analysis of Variance on Ranks was performed alongwith Dunn’s post-hoc tests. All statistical analyses were carried out using SigmaStat version3.5 (Systat Software Inc; Point Richmond, CA) with the exception of the two-wayANCOVAs which were conducted using SPSS version 12 (SPSS Inc., Chicago, IL).
ResultsEffect of genotype on EDL muscle function
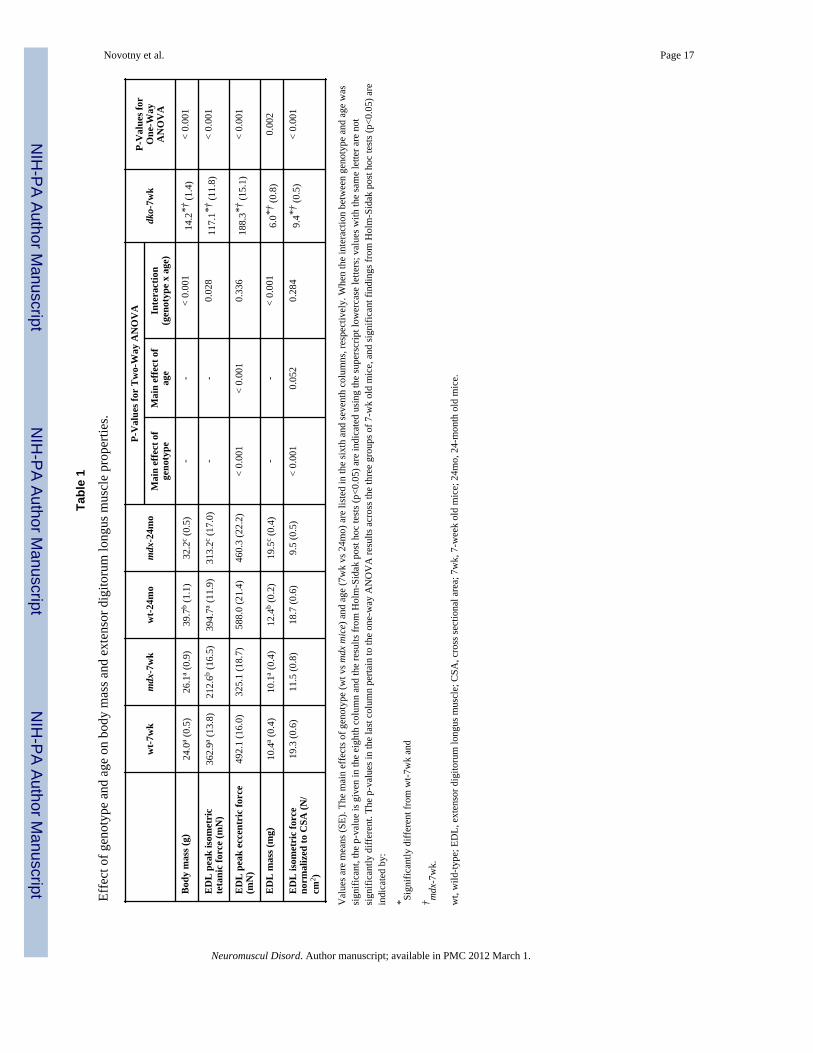
To demonstrate the severity of muscle functional impairments in the mouse models ofDMD, in vitro measures of EDL muscle contractile forces of dystrophic mice werecompared to those of wild-type mice. Mdx mice generated less maximal isometric tetanicforces at both 7 weeks and 24 months of age (41 % and 21 %, respectively) compared totheir wild-type counterparts (Table 1). Peak eccentric force was also reduced in mdx mice(Table 1). In an effort to determine the source of these decrements in EDL muscle functionin mdx mice, both the size of the EDL muscle (i.e., mass) as well as a surrogate for musclequality (i.e., peak isometric force normalized to muscle cross-sectional area) were analyzed.Mdx and wild-type EDL muscle masses were equivalent at 7 weeks of age while mdxmuscles were >50% larger at 24 months (Table 1). Peak isometric tetanic force normalizedto muscle cross-sectional area was 20–40% less in mdx than wild-type mice (Table 1). Thus,despite mdx mice having equal or greater muscle masses, contractile function wascompromised.
Novotny et al. Page 5
Neuromuscul Disord. Author manuscript; available in PMC 2012 March 1.
NIH
-PA Author Manuscript
NIH
-PA Author Manuscript
NIH
-PA Author Manuscript
Data were not statistically different between male and female dko mice for any of the muscleor bone parameters measured (i.e., independent t-tests P ≥ 0.221) with the greatestdifference between genders being 21%. Therefore all muscle and bone results for the twogenders were collapsed into a single dko group. Comparisons of EDL muscle from 7-week-old dko mice to those of age-matched, wild-type and mdx mice show that dko mice havefunctional deficits that are even greater than those of mdx. Dko mice had 42–67% lowerpeak isometric and eccentric forces relative to mdx and wild-type mice (Table 1). Unlikemdx mice, dko mice had decrements in both muscle size and muscle quality (Table 1),confirming that dko mice have a more severe phenotype than mdx mice in terms of musclefunction.
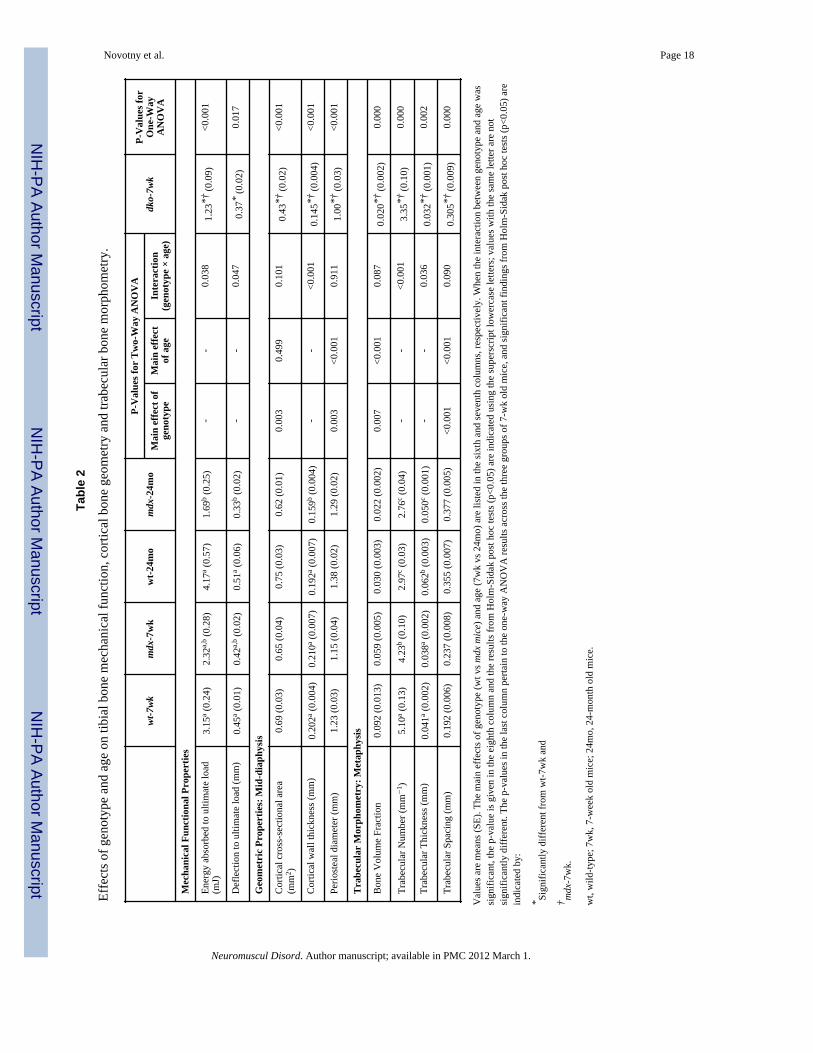
Effect of genotype on tibial bone functional capacityIn general, the functional capacity of tibial bone was affected by both genotype and age.Figure 1B shows exemplar load-displacement curves from wild-type, mdx and dko tibiaduring the three-point bending test. Ultimate loads for tibia of mdx mice were 19 and 36%lower than those for wild-type mice at 7 weeks and 24 months, respectively (Figure 2A).The larger difference in ultimate load between mdx and wild-type mice at 24 months wasattributed to an improvement with age in wild-type mice that did not occur in mdx mice. Forbone stiffness, there were both significant genotype and age effects (Figure 2B). Tibialstiffness in mdx mice was 15–20% lower than wild-type mice, indicating that mdx bone wasless resistant to bending. Additional functional properties, including energy absorbed toultimate load and deflection to ultimate load, also reveal that mdx tibia are compromised.Both of these properties were 36–60% lower in 24 month-old mdx mice compared to thosein 24 month-old wild-type mice (Table 2). Collectively, these results indicate that functionaldeficits are apparent in the tibial bones of mdx mice, confirming that bone strength iscompromised.
The tibia of dko mice had even lower functional capacity. For example, bone from thesemice had 34–50% lower values for ultimate load and stiffness compared to those of mdx andwild-type mice (Figure 2A and B). Energy absorbed to ultimate load and deflection toultimate load were also smaller in dko mice than wild-type mice (61 and 17% respectively,Table 2), indicating that dko are less ale to withstand loading.
Effect of genotype on tibial bone geometryμCT was utilized to determine if properties reflecting bone geometry at the mid-shaft of thetibia were affected by genotype and thus potentially could account for the differences inbone mechanical properties observed among genotypes. For CSMI at the tibial mid-shaft,which reflects the moment of inertia during three-point bending, independent age andgenotype effects were detected. Mdx bones had CSMI values that were approximately 25%lower than wild-type bones (Figure 3). Because cortical cross-sectional area usually parallelsCSMI, it was not surprising to find that cortical cross-sectional area was correspondingly 6–17% smaller in mdx mice (Table 2). Specifically for the 24 month-old mdx mice, the smallercross-sectional area can be largely attributed to reduced cortical wall thickness (Table 2).Body mass can influence bone geometry, therefore two-way ANCOVAs with body mass asthe covariate were conducted. Results from those analyses were similar to those presented inTable 2, with the exception of periosteal diameter in which significant interactions betweengenotype and age were found (p=0.002). Specifically, with body mass as a covariate,periosteal diameters were smaller in 7-week old mdx mice (i.e., estimated marginal meansfor a body mass of 30.97 g was 1.25 mm vs 1.38 mm) and larger in 24 month-old mdx mice(1.26 mm vs 1.19 mm) compared to wild-type mice.
Novotny et al. Page 6
Neuromuscul Disord. Author manuscript; available in PMC 2012 March 1.
NIH
-PA Author Manuscript
NIH
-PA Author Manuscript
NIH
-PA Author Manuscript
Tibial bones from 7 week old dko mice were smaller than wild-type and mdx bones for allgeometric properties at the tibial midshaft (Table 2 and Figure 2). For example dko mice had38–57% smaller CSMI and cross-sectional area values compared to mdx mice, furtherhighlighting the impact of disease severity on tibial bone. These collective results indicatethat alterations in bone geometry contribute to the compromised tibial bone strength indystrophic mice.
μCT was also used to determine if trabecular bone morphometry in the tibial metaphysis wasaffected by genotype. For trabecular bone volume fraction (i.e., trabecular bone volume pertotal volume of interest), independent genotype and age effects were present (Table 2). Mdxmice had at least 27% less trabecular bone than wild-type mice. In 7 week-old mdx mice, thereduction in bone volume fraction was largely attributed to having 17% fewer trabeculae ofequivalent thickness, whereas in 24 month-old mdx mice, the number of trabeculae was notdifferent from wild-type mice, yet the trabeculae were 19% thinner (Table 2). Consequent tothese alterations in trabecular bone, the trabecular spacing was consistently 6–23% higher inmdx mice (Table 2).
Trabecular bone morphometry in the proximal tibial bone of 7 week-old dko mice wasdifferent from those of wild-type and mdx mice (Table 2). Dko mice had 78% lower bonevolume fractions compared to wild-type mice, which was primarily due to having 34%fewer and 22% thinner trabeculae. These data for trabecular bone morphometry combinedwith the alterations seen in cortical bone geometry confirm that bone geometry iscompromised in dystrophic mice.
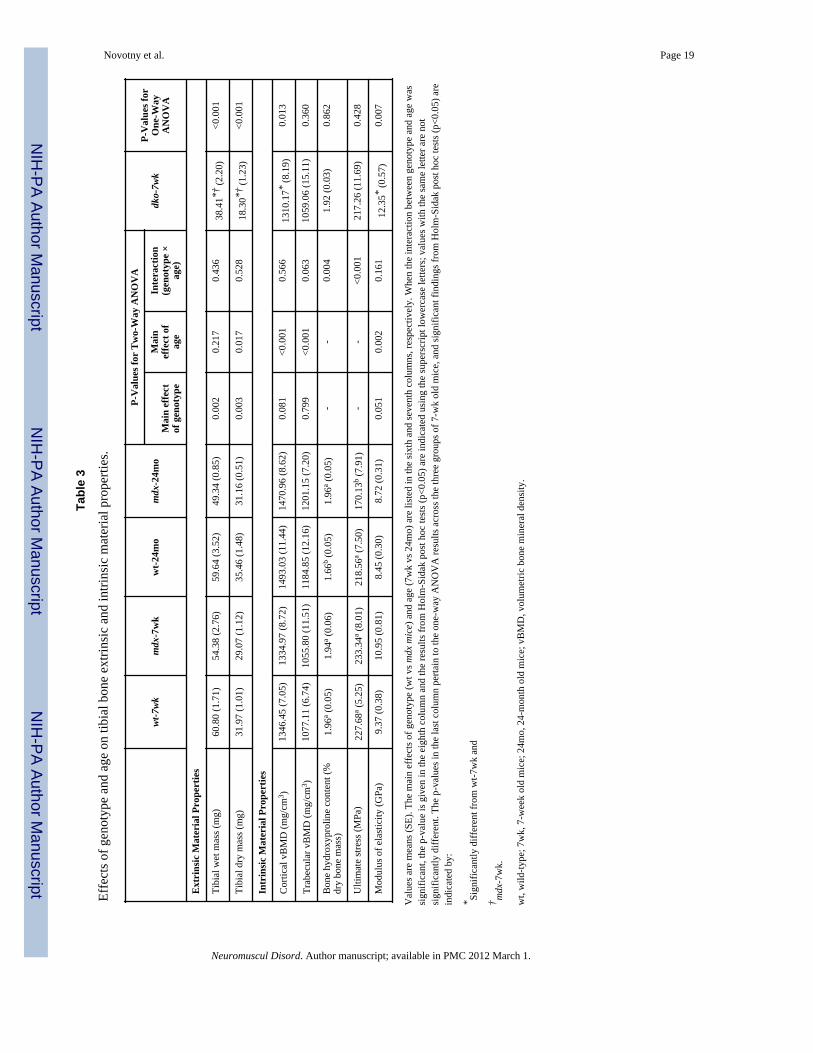
Effect of genotype on tibial bone extrinsic and intrinsic material propertiesExtrinsic material properties of the tibia, beyond geometry, were quantified by wet and drytibial masses, and intrinsic material properties were quantified by vBMD, ultimate stress,modulus of elasticity and bone hydroxyproline concentration. Tibial bone wet and drymasses were lower in mdx mice relative to wild-type mice (Table 3); however afteraccounting for body mass as a covariate, tibial dry mass was similar between groups(p=0.053). Similarly, vBMD at both the tibial mid-shaft and tibial metaphysis was notdifferent between the two genotypes (Table 3). Bone hydroxyproline concentration (i.e.,hydroxyproline content relative to dry tibial mass) revealed that the concentration ofcollagen was higher in 24 month-old mdx mice compared to 24 month-old wild-type mice(Table 3). While ultimate stress values were similar between mdx and wild-type mice at 7weeks of age, aged mdx mice had ultimate stress values that were 22% lower than wild-typemice at 24 months of age (Table 3). The modulus of elasticity within the tibial bone tendedto be higher in mdx mice compared to wild-type mice (i.e., main effect of genotype wasp=0.051) (Table 3). Combined, these data confirm that compared to wild-type mice, mdxmice have smaller sized bones of similar density. With age however, mdx mice developedhigher hydroxyproline concentrations with a trend towards higher modulus of elasticityvalues while ultimate stress values were diminished.
Extrinsic tibial bone material properties (i.e., wet and try tibial mass) of dko mice weremuch lower compared to both mdx and wild-type mice (Table 3). Despite the small bonesize in dko mice, they had similar values for two of the intrinsic material properties, i.e.,trabecular vBMD, hydroxyproline concentration and ultimate stress, compared to wild-typeand mdx mice. Unlike mdx mice, dko mice had lower cortical vBMD values and highermodulus of elasticity compared to wild-type mice. In summary dko mice, the more severemodel of DMD, have significant deficits in bone size and cortical vBMD but their modulusof elasticity was higher than that of wild-type mice.
Novotny et al. Page 7
Neuromuscul Disord. Author manuscript; available in PMC 2012 March 1.
NIH
-PA Author Manuscript
NIH
-PA Author Manuscript
NIH
-PA Author Manuscript
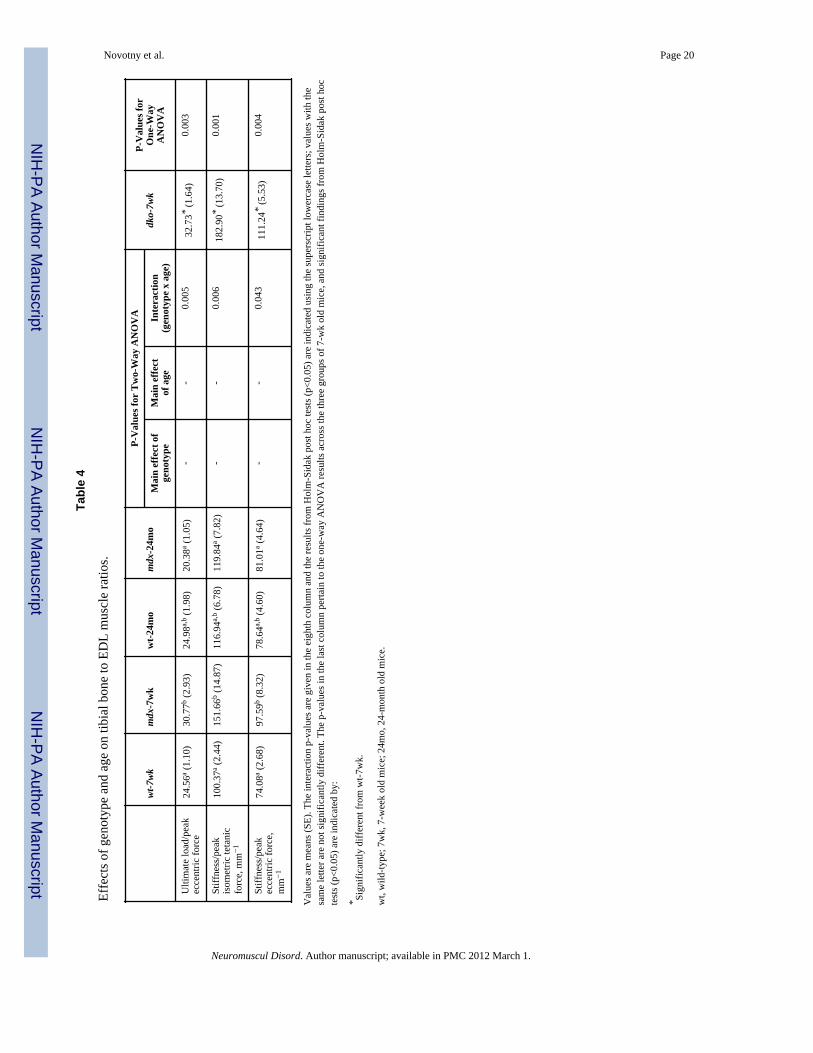
Bone and muscle relationshipsRatios that were calculated between the functional properties of the tibia and the EDLmuscle of 7-week old mdx mice were up to 1.44 fold of those for 7-week old wild-type mice(Figure 4 and Table 4). These data indicate that at this younger age in mdx mice, thefunctional capacity of the tibial bone is relatively high compared to that of the adjacent,diseased EDL muscle. As the mice aged to 24 months the functional relationships betweenbone and muscle in mdx mice became undistinguishale from those of wild-type mice. Thisobservation can be attributed to two factors. First, there were greater EDL strength gains bymdx than wild-type mice with age (i.e., EDL muscles from 24-month mdx mice generated47% more peak isometric force than those from 7-week mdx mice while wild-type muscleonly improved by 9% with age; Table 1). Second, tibia ultimate load improved with ageamong wild-type (i.e., by 20%) but not mdx mice (Figure 2). The bone-to-muscle ratios in 7-week old dko mice were at least 1.33 fold of those for wild-type mice of the same age, againindicating that the functional capacity of dko tibial bone was relatively high compared tothat of the neighboring muscle (Figure 4 and Table 4).
DiscussionWe had three primary results from our study. First, mechanical testing of the tibia directlyshowed that tibial bones from dystrophic mice possess only 50–80% of the strength of thatfrom wild-type mice, illustrating that the muscle disease has downstream functional effectson an associated tissue. Second, this low bone strength in dystrophic mice was mostlyattributed to altered extrinsic material properties (i.e., bone geometry and bone mass) moreso than alterations in bone mineral density or other intrinsic material properties. Third, thefunctional capacity of the tibial bone of young mdx and dko mice is greater than that of theadjacent EDL muscle as indicated by high bone-to-muscle functional capacity ratios relativeto wild-type mice, but following improvements in muscle function in mdx mice with age thebone-to-muscle relationships in mdx mice become equivalent to those in wild-type mice.Combined, these data highlight that there are clear decrements in both bone and muscletissues of dystrophic mice, as well as a distinct relationship between muscle disease andoverall bone health.
In the past decade, the necessity of muscle force application for overall bone health hasreceived increasing attention. Evidence from a hip prosthetic study suggested that 70% ofthe bending moments placed on bone originated from force produced via musclecontractions rather than from external reaction forces [24]. As a result, it has beenhypothesized that muscular contractions produce the majority of mechanical load-inducedstimuli sensed by bone’s mechanosensory cells, which elicit adaptations in bone stiffnessand strength if warranted. Several prospective studies have provided indirect evidence infavor of this hypothesis, by showing that bone loss followed muscle atrophy and conversely,that bone was regained after muscle mass recovered [25,26].
In muscular degenerative diseases that are progressive such as DMD, declines in bonestrength and stiffness should theoretically follow decrements in muscle function (i.e., themagnitude and frequency of force production). This reduction in muscle load placed on bonein DMD is the combined effects of loss of contractile strength [27,28] and the progressiveinability to perform activities of daily living [6–8]. In line with this, recent clinical evidencehas shown that boys with DMD lose the greatest amount of bone following the loss ofambulation [1,10]. While this loss of bone mass is expected to be appropriate for the loss ofmuscle function, it likely increases the bone’s propensity to fracture. This highlights thenecessity of muscle-induced loading for proper maintenance of the skeleton in effort toprevent fractures. The present study, consistent with previous work in mdx and dko mice[14,27], confirmed that dystrophic muscle generated 20–60% lower levels of force
Novotny et al. Page 8
Neuromuscul Disord. Author manuscript; available in PMC 2012 March 1.
NIH
-PA Author Manuscript
NIH
-PA Author Manuscript
NIH
-PA Author Manuscript
compared to that from wild-type mice. This reduction in force generating capacity in 24month-old mdx mice may appear surprising due to their larger sized EDL muscles; howeverwe are not the first to report this. Between the ages of 6 to 28 months, Lynch et al. [27] hasshown that mdx mice have larger sized EDL and soleus muscles compared to wild-typemice, which is likely attributed to a lifelong accumulation of fibrosis within the muscle. Thegreatest deficits in muscle function we found were found in dko mice, which have beenshown to have a more severe phenotype (i.e., lacking both dystrophin and its homologutrophin) suggesting to better mimic muscle deterioration in boys with DMD. Likewise, wepredicted and our data support that tibia from mdx mice were functionally compromised andthose from dko mice were worse yet.
Our findings confirm and extend the work of Anderson et al. [11], showing that tibial bonesfrom dystrophic mice are indeed functionally weakened. Specifically, we found that thetibial bone from mdx and dko mice were up to 50% lower for ultimate loads and 44% lowerfor stiffness than those of wild-type mice. These results are in parallel with the mechanostattheory, that is, one would have predicted that the progressive reductions in the magnitudeand frequency of mechanical loading of dystrophic mice (i.e. weakened muscle contractionsand reduced physical activity levels [17]) would translate to lower bone strength andstiffness compared to non-diseased mice. Contrary to the mechanostat theory, our bone-to-muscle ratios were not equivalent across genotypes in young mice, suggesting that thefunctional capacities of bone and muscle were not appropriately matched. Specifically,young dystrophic mice had up to 50% higher ratios compared to wild-type mice, implyingthat the tibial bone of these young mice was over-adapted relative to the function of thediseased muscle. Adaptations in bone are known to lag those of muscle, and because weselected the 7-week time point, mdx muscle had reached its peak rate of muscle deterioration(i.e., 3–4 weeks after weaning [29]); however, appropriate alterations to bone function hadlikely only been initiated. Alternatively, it is plausible that the lack of dystrophin caused asubtle prenatal bone effect that was apparent in the young, 7-week old mdx mice, but hadresolved in the older mdx mice. This is speculation because how bone develops during thefirst three weeks of life in dystrophic mice has not been investigated. By 24 months of age,mdx mice muscle strength had increased by ~45% while their bone strength had remainedunchanged, thereby resulting in bone-to-muscle ratios that were equivalent to those of wild-type mice. This improvement in muscle function likely reversed deleterious adaptations tobone which thereby preserved, but did not improve, its function between 7-weeks and 24-months of age. In summary, tibial bones from mdx and dko mice were found to befunctionally impaired compared to wild-type mice, which was partially attributed to alteredmuscle contractile function; however, beyond the role of muscle-induced loading, it remainsnecessary to investigate other contributing factors of bone strength and function.
The skeletal factors that contribute to reductions in bone mechanical strength, namely bonegeometry and material properties of the bone, have been minimally assessed in mdx micepreviously [11,12]. Our data show that dystrophic tibial bones had smaller cortical cross-sectional area as well as reduced cortical wall thickness, both of which presumablycontribute to their compromised bone strength. More importantly however, we found thatdystrophic tibia have smaller CSMI compared to tibia from wild-type mice. Of theaforementioned parameters, CSMI is the most important determinant of a bone’s mechanicalproperties when subjected to 3-point bending. We found CSMI to be reduced by 24–43% indystrophic mice compared to wild-type mice. Montgomery et al. reported that mdx mice hadhigher femur bone strength presumably due to larger periosteal diameters, and equivalentcortical thickness and CSMI relative to wild-type mice mdx [12]. However after accountingfor the larger body mass in mdx mice (i.e., performing ANCOVA with body mass as thecovariate), differences between genotypes for periosteal diameter were eliminated in thatstudy. Because body mass also varied among groups of mice in our study, we performed
Novotny et al. Page 9
Neuromuscul Disord. Author manuscript; available in PMC 2012 March 1.
NIH
-PA Author Manuscript
NIH
-PA Author Manuscript
NIH
-PA Author Manuscript
similar two-way ANCOVAs with body mass held as the covariate. Our results on bonegeometry indicate that muscular dystrophy independent of body mass was a detriment tobone geometry in mdx mice. The exception was periosteal diameter in the 24 month-oldmice. The results of the two-way ANCOVA indicated that older mdx mice actually hadhigher periosteal diameters after adjusting for body mass compared to wild-type mice, whichwas dissimilar to the aforementioned findings of Montgomery et al.
These somewhat contrary findings for the mdx tibia and femur may be the result of eithersite-specific differences in bone geometry or due to the sensitivity of the techniques utilizedto quantify geometry. μCT was used in the present study, and this technique computationallyassesses bone geometry by accounting for the contribution of each voxel and its position inbone, whereas Montgomery et al. utilized a caliper to quantify geometry. Thus, μCTmeasurements provide greater sensitivity and precision when measuring bone geometry.Further studies utilizing μCT are warranted to discern whether regional differences ingeometry exist between mdx tibia and femur. Even less is known about geometric ormaterial properties of bone from DMD patients. Consistent with our work on dystrophicmice, preliminary results on bone geometry in boys with DMD suggest that total cross-sectional areas are smaller than controls at various locations along the radial and tibiallength [30,31].
In addition to altered bone geometry contributing to functionally weakened bone, it wasimportant to determine if the muscle disease impacted other extrinsic as well as intrinsicmaterial properties of bone. We found that dystrophic mice had reduced extrinsic materialproperties (i.e., tibial dry and wet mass). 24-month old mdx mice had alterations in twointrinsic material properties, i.e., hydroxyproline content and ultimate stress, which indicatedthat these mice have more collagen content (i.e., less mineralized bone tissue compared towild-type mice) along with reduced whole bone strength. These data are in agreement withour results of tibial bone stiffness which, suggest that the stiffness of the tibia from 24-month old wild-type mice increases with their declining collagen content. Based onoverwhelming evidence that boys with DMD undergo loss of areal bone mineral density[1,2,10,32,33], it may seem surprising that tibial cortical and trabecular vBMD was notdifferent between mdx and wild-type mice, but this result is in agreement with findings fromMontgomery et al [12]. They reported no differences in bone mineral density at the femur orspine between mdx and wild-type mice [12]. In addition, preliminary data from a DMDclinical trial showed that cortical vBMD, measured near the mid-diaphysis of the forearmand tibia, was actually higher in boys with DMD than age-matched controls, whilesignificant deficits in vBMD were only apparent in distal regions of these bones [30,31]. Insummary, the notion that overall vBMD is low as a result of dystrophin deficiency should betaken cautiously since four different bone sites of mdx mice and two bone sties of DMDpatients do not show this. Despite the alterations in bone strength and geometry of mdx anddko tibia, a limitation in using these animals models is that dystrophic mice do notexperience fractures like boys with DMD. A known shortcoming of the mdx mouse model isthat they have a mild phenotype relative to boys with DMD both in terms of diseaseprogression and muscle weakness, so it is not surprising that mdx mice do not experiencefractures. The lack of clinical similarities between boys with DMD and mdx mice isattributed in part to elevated expression of utrophin by mdx mice [34]. Dko mice on the otherhand, do not have this recovery due to the lack of utrophin, which translates to a progressivedisease including truncated growth, limited physical abilities and muscle function,development of cardiomyopathies, and ultimately the mice suffer premature death betterparalleling boys with DMD. Dko mice also have skeletal problems, the most notable beingkyphosis of the spine [14]. Thus, utilization of the dko mouse for further bone investigationsin relation to muscular dystrophy is reasonable and will likely prove very informative.
Novotny et al. Page 10
Neuromuscul Disord. Author manuscript; available in PMC 2012 March 1.
NIH
-PA Author Manuscript
NIH
-PA Author Manuscript
NIH
-PA Author Manuscript
In summary, the present study has established that dystrophic mice, mdx and dko, do in facthave lower tibial bone strength along with deficits in muscle contractile functional capacity.Our findings indicate that bone weakness was predominately the result of adversely affectedextrinsic material properties of bone (i.e., bone geometry and mass) rather than alterations tothe bone’s density or other intrinsic material properties. These mouse models of DMDprovide a feasible approach for future research to test therapeutic regimens that ideally aimto simultaneously improve both skeletal and muscle tissues without causing further injury toeither tissue.
AcknowledgmentsOur research has been supported by grants from the Muscular Dystrophy Association (Research Grant 114071) andthe National Institutes of Health (P30-AR057220).
References1. Larson CM, Henderson RC. Bone mineral density and fractures in boys with Duchenne muscular
dystrophy. J Pediatr Orthop 2000;20:71–74. [PubMed: 10641693]2. Bianchi ML, Mazzanti A, Galbiati E, Saraifoger S, Dubini A, Cornelio F, et al. Bone mineral
density and bone metabolism in Duchenne muscular dystrophy. Osteoporos Int 2003;14:761–767.[PubMed: 12897980]
3. McDonald DG, Kinali M, Gallagher AC, Mercuri E, Muntoni F, Roper H, et al. Fracture prevalencein Duchenne muscular dystrophy. Dev Med Child Neurol 2002;44:695–698. [PubMed: 12418795]
4. Soderpalm AC, Magnusson P, Ahlander AC, Karlsson J, Kroksmark AK, Tulinius M, et al. Bonemarkers and bone mineral density in Duchenne muscular dystrophy. J Musculoskelet NeuronalInteract 2008;8:24. [PubMed: 18398258]
5. Chamerlain JS, Metzger J, Reyes M, Townsend D, Faulkner JA. Dystrophin-deficient mdx micedisplay a reduced life span and are susceptible to spontaneous rhabdomyosarcoma. Faseb J2007;21:2195–2204. [PubMed: 17360850]
6. Gaudreault N, Gravel D, Nadeau S. Evaluation of plantar flexion contracture contribution during thegait of children with Duchenne muscular dystrophy. J Electromyogr Kinesiol. 2007
7. Allen DG. Skeletal muscle function: role of ionic changes in fatigue, damage and disease. Clin ExpPharmacol Physiol 2004;31:485–493. [PubMed: 15298539]
8. Emery, AE.; Muntoni, F. Duchenne Muscular Dystrophy. Oxford: Oxford Univ. Press; 2003.9. Straathof CS, Overweg-Plandsoen WC, van den Burg GJ, van der Kooi AJ, Verschuuren JJ, de
Groot IJ. Prednisone 10 days on/10 days off in patients with Duchenne muscular dystrophy. JNeurol 2009;256:768–773. [PubMed: 19306039]
10. Soderpalm AC, Magnusson P, Ahlander AC, Karlsson J, Kroksmark AK, Tulinius M, et al. Lowbone mineral density and decreased bone turnover in Duchenne muscular dystrophy. NeuromusculDisord 2007;17:919–928. [PubMed: 17627820]
11. Anderson JE, Lentz DL, Johnson RB. Recovery from disuse osteopenia coincident to restoration ofmuscle strength in mdx mice. Bone 1993;14:625–634. [PubMed: 8274305]
12. Montgomery E, Pennington C, Isales CM, Hamrick MW. Muscle-bone interactions in dystrophin-deficient and myostatin-deficient mice. Anat Rec A Discov Mol Cell Evol Biol 2005;286:814–822. [PubMed: 16078270]
13. Bulfield G, Siller WG, Wight PA, Moore KJ. X chromosome-linked muscular dystrophy (mdx) inthe mouse. Proc Natl Acad Sci U S A 1984;81:1189–1192. [PubMed: 6583703]
14. Grady RM, Teng H, Nichol MC, Cunningham JC, Wilkinson RS, Sanes JR. Skeletal and cardiacmyopathies in mice lacking utrophin and dystrophin: a model for Duchenne muscular dystrophy.Cell 1997;90:729–738. [PubMed: 9288752]
15. Gross TS, Poliachik SL, Prasad J, Bain SD. The effect of muscle dysfunction on bone mass andmorphology. J Musculoskelet Neuronal Interact 2010;10:25–34. [PubMed: 20190377]
16. Frost HM. Bone’s mechanostat: a 2003 update. Anat Rec A Discov Mol Cell Evol Biol2003;275:1081–1101. [PubMed: 14613308]
Novotny et al. Page 11
Neuromuscul Disord. Author manuscript; available in PMC 2012 March 1.
NIH
-PA Author Manuscript
NIH
-PA Author Manuscript
NIH
-PA Author Manuscript
17. Landisch RM, Kosir AM, Nelson SA, Baltgalvis KA, Lowe DA. Adaptive and nonadaptiveresponses to voluntary wheel running by mdx mice. Muscle Nerve 2008;38:1290–1303. [PubMed:18816601]
18. Moran AL, Warren GL, Lowe DA. Soleus and EDL muscle contractility across the lifespan offemale C57BL/6 mice. Exp Gerontol 2005;40:966–975. [PubMed: 16243468]
19. Baltgalvis KA, Call JA, Nikas JB, Lowe DA. Effects of prednisolone on skeletal musclecontractility in mdx mice. Muscle Nerve 2009;40:443–454. [PubMed: 19618428]
20. Warren GL, Hayes DA, Lowe DA, Williams JH, Armstrong RB. Eccentric contraction-inducedinjury in normal and hindlimb-suspended mouse soleus and EDL muscles. J Appl Physiol1994;77:1421–1430. [PubMed: 7836148]
21. Warren GL, Moran AL, Hogan HA, Lin AS, Guldberg RE, Lowe DA. Voluntary run training butnot estradiol deficiency alters the tibial bone-soleus muscle functional relationship in mice. Am JPhysiol Regul Integr Comp Physiol 2007;293:R2015–2026. [PubMed: 17881616]
22. Warren GL, Lowe DA, Inman CL, Orr OM, Hogan HA, Bloomfield SA, et al. Estradiol effect onanterior crural muscles-tibial bone relationship and susceptibility to injury. J Appl Physiol1996;80:1660–1665. [PubMed: 8727552]
23. Woessner JF Jr. The determination of hydroxyproline in tissue and protein samples containingsmall proportions of this imino acid. Arch Biochem Biophys 1961;93:440–447. [PubMed:13786180]
24. Lu TW, Taylor SJ, O’Connor JJ, Walker PS. Influence of muscle activity on the forces in thefemur: an in vivo study. J Biomech 1997;30:1101–1106. [PubMed: 9456377]
25. Sievanen H, Heinonen A, Kannus P. Adaptation of bone to altered loading environment: abiomechanical approach using X-ray absorptiometric data from the patella of a young woman.Bone 1996;19:55–59. [PubMed: 8830989]
26. Rittweger J, Felsenberg D. Recovery of muscle atrophy and bone loss from 90 days bed rest:Results from a one-year follow-up. Bone 2008;44:214–224. [PubMed: 19022418]
27. Lynch GS, Hinkle RT, Chamberlain JS, Brooks SV, Faulkner JA. Force and power output of fastand slow skeletal muscles from mdx mice 6–28 months old. J Physiol 2001;535:591–600.[PubMed: 11533147]
28. Aitkens SG, McCrory MA, Kilmer DD, Bernauer EM. Moderate resistance exercise program: itseffect in slowly progressive neuromuscular disease. Arch Phys Med Rehabil 1993;74:711–715.[PubMed: 8328892]
29. Gillis JM. Understanding dystrophinopathies: an inventory of the structural and functionalconsequences of the absence of dystrophin in muscles of the mdx mouse. J Muscle Res Cell Motil1999;20:605–625. [PubMed: 10672510]
30. King W, Landoll J, Matkovic V, Kissel JT. Volumetric radial and tibial bone mineral density inboys with Duchenne muscular dystrophy. Neurology 2009:72. [PubMed: 19107107]
31. Landoll J, King W, Kissel JT, Matkovic V. Forearm pQCT measurements in males with Duchennemuscular dystrophy. J Bone Miner Res 2008:23.
32. Hawker GA, Ridout R, Harris VA, Chase CC, Fielding LJ, Biggar WD. Alendronate in thetreatment of low bone mass in steroid-treated boys with Duchennes muscular dystrophy. ArchPhys Med Rehabil 2005;86:284–288. [PubMed: 15706555]
33. Aparicio LF, Jurkovic M, DeLullo J. Decreased bone density in ambulatory patients with duchennemuscular dystrophy. J Pediatr Orthop 2002;22:179–181. [PubMed: 11856925]
34. Law DJ, Allen DL, Tidball JG. Talin, vinculin and DRP (utrophin) concentrations are increased atmdx myotendinous junctions following onset of necrosis. J Cell Sci 1994;107 (Pt 6):1477–1483.[PubMed: 7962191]
Novotny et al. Page 12
Neuromuscul Disord. Author manuscript; available in PMC 2012 March 1.
NIH
-PA Author Manuscript
NIH
-PA Author Manuscript
NIH
-PA Author Manuscript
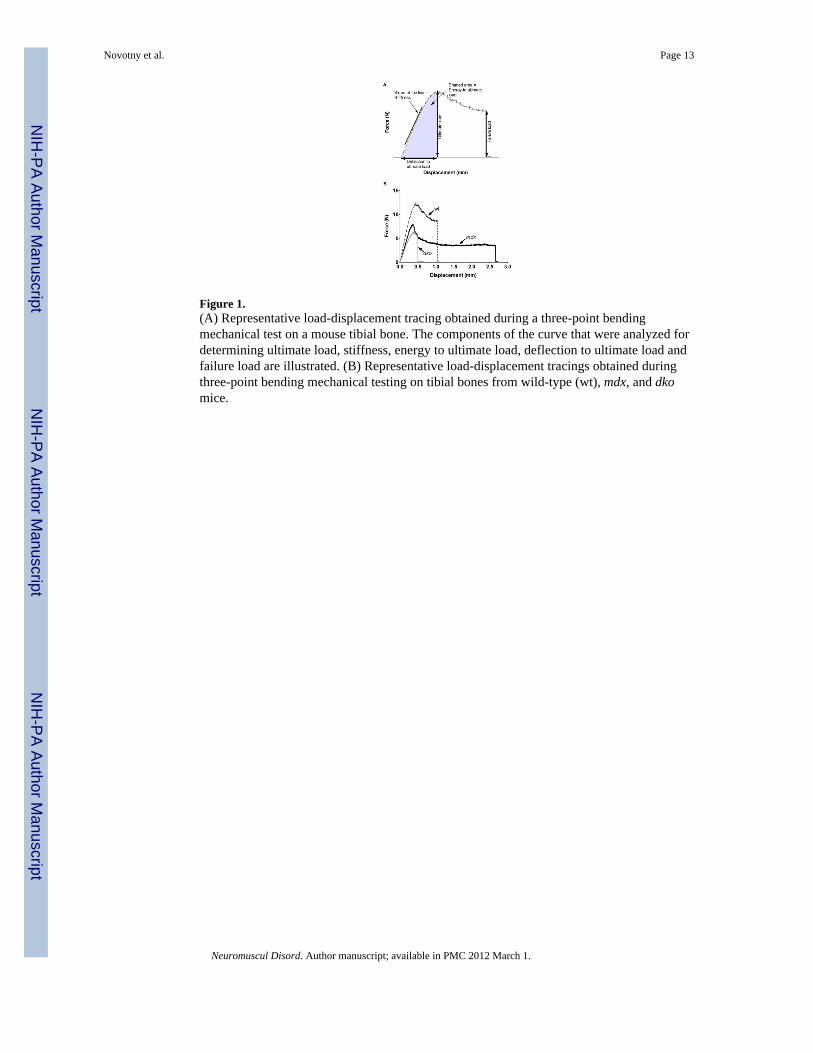
Figure 1.(A) Representative load-displacement tracing obtained during a three-point bendingmechanical test on a mouse tibial bone. The components of the curve that were analyzed fordetermining ultimate load, stiffness, energy to ultimate load, deflection to ultimate load andfailure load are illustrated. (B) Representative load-displacement tracings obtained duringthree-point bending mechanical testing on tibial bones from wild-type (wt), mdx, and dkomice.
Novotny et al. Page 13
Neuromuscul Disord. Author manuscript; available in PMC 2012 March 1.
NIH
-PA Author Manuscript
NIH
-PA Author Manuscript
NIH
-PA Author Manuscript
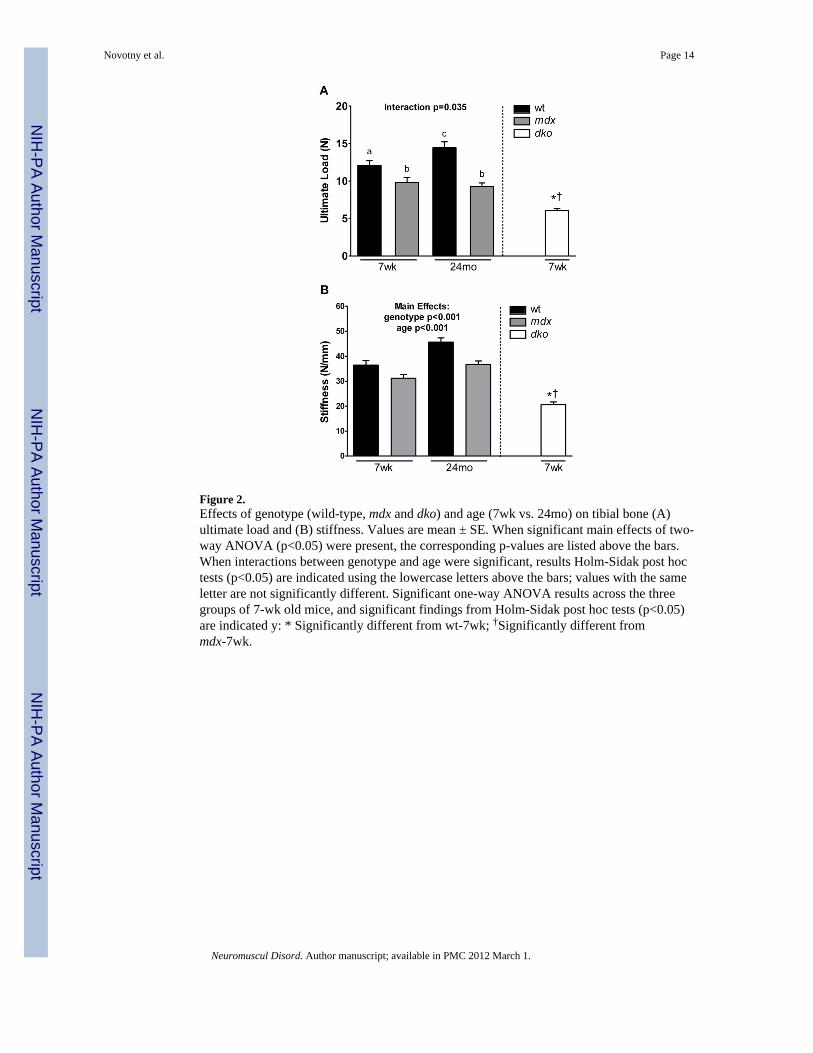
Figure 2.Effects of genotype (wild-type, mdx and dko) and age (7wk vs. 24mo) on tibial bone (A)ultimate load and (B) stiffness. Values are mean ± SE. When significant main effects of two-way ANOVA (p<0.05) were present, the corresponding p-values are listed above the bars.When interactions between genotype and age were significant, results Holm-Sidak post hoctests (p<0.05) are indicated using the lowercase letters above the bars; values with the sameletter are not significantly different. Significant one-way ANOVA results across the threegroups of 7-wk old mice, and significant findings from Holm-Sidak post hoc tests (p<0.05)are indicated y: * Significantly different from wt-7wk; †Significantly different frommdx-7wk.
Novotny et al. Page 14
Neuromuscul Disord. Author manuscript; available in PMC 2012 March 1.
NIH
-PA Author Manuscript
NIH
-PA Author Manuscript
NIH
-PA Author Manuscript
Figure 3.A) Effects of genotype (wild-type, mdx and dko) and age (7wk vs. 24mo) on tibial bonecross sectional moment of inertia (CSMI). Values are mean ± SE. Significant main effects oftwo-way ANOVA (p<0.05) and the corresponding p-values are listed above the bars.Significant one-way ANOVA results across the three groups of 7-wk old mice, andsignificant findings from Holm-Sidak post hoc tests (p<0.05) are indicated y: * Significantlydifferent from wt-7wk; †Significantly different from mdx-7wk. (B) Exemplar μCT imagesfrom 7-wk old wild-type, mdx and dko mice.
Novotny et al. Page 15
Neuromuscul Disord. Author manuscript; available in PMC 2012 March 1.
NIH
-PA Author Manuscript
NIH
-PA Author Manuscript
NIH
-PA Author Manuscript

Figure 4.Effects of genotype (wild-type, mdx and dko) and age (7wk vs. 24mo) on tibial bone to EDLmuscle ratios. Values are mean ± SE. Statistically significant effects are indicated above thebars. Significant interactions between genotype and age detected by Holm-Sidak post hoctests (p<0.05) are indicated by the lowercase letters above the bars; values with the sameletter are not significantly different. Significant one-way ANOVA results across the threegroups of 7-wk old mice, and significant findings from Holm-Sidak post hoc tests (p<0.05)are indicated y: * Significantly different from wt-7wk.
Novotny et al. Page 16
Neuromuscul Disord. Author manuscript; available in PMC 2012 March 1.
NIH
-PA Author Manuscript
NIH
-PA Author Manuscript
NIH
-PA Author Manuscript
NIH
-PA Author Manuscript
NIH
-PA Author Manuscript
NIH
-PA Author Manuscript
Novotny et al. Page 17
Tabl
e 1
Effe
ct o
f gen
otyp
e an
d ag
e on
bod
y m
ass a
nd e
xten
sor d
igito
rum
long
us m
uscl
e pr
oper
ties.
wt-7
wk
mdx
-7w
kw
t-24m
om
dx-2
4mo
P-V
alue
s for
Tw
o-W
ay A
NO
VA
dko-
7wk
P-V
alue
s for
One
-Way
AN
OV
AM
ain
effe
ct o
fge
noty
peM
ain
effe
ct o
fag
eIn
tera
ctio
n(g
enot
ype
x ag
e)
Bod
y m
ass (
g)24
.0a (
0.5)
26.1
a (0.
9)39
.7b (
1.1)
32.2
c (0.
5)-
-<
0.00
114
.2*†
(1.4
)<
0.00
1
ED
L p
eak
isom
etri
cte
tani
c fo
rce
(mN
)36
2.9a (
13.8
)21
2.6b (
16.5
)39
4.7a (
11.9
)31
3.2c (
17.0
)-
-0.
028
117.
1*†
(11.
8)<
0.00
1
ED
L p
eak
ecce
ntri
c fo
rce
(mN
)49
2.1
(16.
0)32
5.1
(18.
7)58
8.0
(21.
4)46
0.3
(22.
2)<
0.00
1<
0.00
10.
336
188.
3*†
(15.
1)<
0.00
1
ED
L m
ass (
mg)
10.4
a (0.
4)10
.1a (
0.4)
12.4
b (0.
2)19
.5c (
0.4)
--
< 0.
001
6.0*
† (0
.8)
0.00
2
ED
L is
omet
ric
forc
eno
rmal
ized
to C
SA (N
/cm
2 )
19.3
(0.6
)11
.5 (0
.8)
18.7
(0.6
)9.
5 (0
.5)
< 0.
001
0.05
20.
284
9.4*
† (0
.5)
< 0.
001
Val
ues a
re m
eans
(SE)
. The
mai
n ef
fect
s of g
enot
ype
(wt v
s mdx
mic
e) a
nd a
ge (7
wk
vs 2
4mo)
are
list
ed in
the
sixt
h an
d se
vent
h co
lum
ns, r
espe
ctiv
ely.
Whe
n th
e in
tera
ctio
n be
twee
n ge
noty
pe a
nd a
ge w
assi
gnifi
cant
, the
p-v
alue
is g
iven
in th
e ei
ghth
col
umn
and
the
resu
lts fr
om H
olm
-Sid
ak p
ost h
oc te
sts (
p<0.
05) a
re in
dica
ted
usin
g th
e su
pers
crip
t low
erca
se le
tters
; val
ues w
ith th
e sa
me
lette
r are
not
sign
ifica
ntly
diff
eren
t. Th
e p-
valu
es in
the
last
col
umn
perta
in to
the
one-
way
AN
OV
A re
sults
acr
oss t
he th
ree
grou
ps o
f 7-w
k ol
d m
ice,
and
sign
ifica
nt fi
ndin
gs fr
om H
olm
-Sid
ak p
ost h
oc te
sts (
p<0.
05) a
rein
dica
ted
by:
* Sign
ifica
ntly
diff
eren
t fro
m w
t-7w
k an
d
† mdx
-7w
k.
wt,
wild
-type
; ED
L, e
xten
sor d
igito
rum
long
us m
uscl
e; C
SA, c
ross
sect
iona
l are
a; 7
wk,
7-w
eek
old
mic
e; 2
4mo,
24-
mon
th o
ld m
ice.
Neuromuscul Disord. Author manuscript; available in PMC 2012 March 1.
NIH
-PA Author Manuscript
NIH
-PA Author Manuscript
NIH
-PA Author Manuscript
Novotny et al. Page 18
Tabl
e 2
Effe
cts o
f gen
otyp
e an
d ag
e on
tibi
al b
one
mec
hani
cal f
unct
ion,
cor
tical
bon
e ge
omet
ry a
nd tr
abec
ular
bon
e m
orph
omet
ry.
wt-7
wkm
dx-7
wk
wt-2
4mo
mdx
-24m
oP-
Val
ues f
or T
wo-
Way
AN
OV
Adk
o-7w
kP-
Val
ues f
orO
ne-W
ayA
NO
VA
Mai
n ef
fect
of
geno
type
Mai
n ef
fect
of a
geIn
tera
ctio
n(g
enot
ype
× ag
e)
Mec
hani
cal F
unct
iona
l Pro
pert
ies
Ener
gy a
bsor
bed
to u
ltim
ate
load
(mJ)
3.15
a (0.
24)
2.32
a,b (
0.28
)4.
17a (
0.57
)1.
69b (
0.25
)-
-0.
038
1.23
*† (0
.09)
<0.0
01
Def
lect
ion
to u
ltim
ate
load
(mm
)0.
45a (
0.01
)0.
42a,
b (0.
02)
0.51
a (0.
06)
0.33
b (0.
02)
--
0.04
70.
37*
(0.0
2)0.
017
Geo
met
ric
Prop
ertie
s: M
id-d
iaph
ysis
Cor
tical
cro
ss-s
ectio
nal a
rea
(mm
2 )0.
69 (0
.03)
0.65
(0.0
4)0.
75 (0
.03)
0.62
(0.0
1)0.
003
0.49
90.
101
0.43
*† (0
.02)
<0.0
01
Cor
tical
wal
l thi
ckne
ss (m
m)
0.20
2a (0.
004)
0.21
0a (0.
007)
0.19
2a (0.
007)
0.15
9b (0.
004)
--
<0.0
010.
145*
† (0
.004
)<0
.001
Perio
stea
l dia
met
er (m
m)
1.23
(0.0
3)1.
15 (0
.04)
1.38
(0.0
2)1.
29 (0
.02)
0.00
3<0
.001
0.91
11.
00*†
(0.0
3)<0
.001
Tra
becu
lar
Mor
phom
etry
: Met
aphy
sis
Bon
e V
olum
e Fr
actio
n0.
092
(0.0
13)
0.05
9 (0
.005
)0.
030
(0.0
03)
0.02
2 (0
.002
)0.
007
<0.0
010.
087
0.02
0*†
(0.0
02)
0.00
0
Trab
ecul
ar N
umbe
r (m
m−
1 )5.
10a (
0.13
)4.
23b (
0.10
)2.
97c (
0.03
)2.
76c (
0.04
)-
-<0
.001
3.35
*† (0
.10)
0.00
0
Trab
ecul
ar T
hick
ness
(mm
)0.
041a (
0.00
2)0.
038a (
0.00
2)0.
062b (
0.00
3)0.
050c (
0.00
1)-
-0.
036
0.03
2*†
(0.0
01)
0.00
2
Trab
ecul
ar S
paci
ng (m
m)
0.19
2 (0
.006
)0.
237
(0.0
08)
0.35
5 (0
.007
)0.
377
(0.0
05)
<0.0
01<0
.001
0.09
00.
305*
† (0
.009
)0.
000
Val
ues a
re m
eans
(SE)
. The
mai
n ef
fect
s of g
enot
ype
(wt v
s mdx
mic
e) a
nd a
ge (7
wk
vs 2
4mo)
are
list
ed in
the
sixt
h an
d se
vent
h co
lum
ns, r
espe
ctiv
ely.
Whe
n th
e in
tera
ctio
n be
twee
n ge
noty
pe a
nd a
ge w
assi
gnifi
cant
, the
p-v
alue
is g
iven
in th
e ei
ghth
col
umn
and
the
resu
lts fr
om H
olm
-Sid
ak p
ost h
oc te
sts (
p<0.
05) a
re in
dica
ted
usin
g th
e su
pers
crip
t low
erca
se le
tters
; val
ues w
ith th
e sa
me
lette
r are
not
sign
ifica
ntly
diff
eren
t. Th
e p-
valu
es in
the
last
col
umn
perta
in to
the
one-
way
AN
OV
A re
sults
acr
oss t
he th
ree
grou
ps o
f 7-w
k ol
d m
ice,
and
sign
ifica
nt fi
ndin
gs fr
om H
olm
-Sid
ak p
ost h
oc te
sts (
p<0.
05) a
rein
dica
ted
by:
* Sign
ifica
ntly
diff
eren
t fro
m w
t-7w
k an
d
† mdx
-7w
k.
wt,
wild
-type
; 7w
k, 7
-wee
k ol
d m
ice;
24m
o, 2
4-m
onth
old
mic
e.
Neuromuscul Disord. Author manuscript; available in PMC 2012 March 1.
NIH
-PA Author Manuscript
NIH
-PA Author Manuscript
NIH
-PA Author Manuscript
Novotny et al. Page 19
Tabl
e 3
Effe
cts o
f gen
otyp
e an
d ag
e on
tibi
al b
one
extri
nsic
and
intri
nsic
mat
eria
l pro
perti
es.
wt-7
wkm
dx-7
wk
wt-2
4mo
mdx
-24m
o
P-V
alue
s for
Tw
o-W
ay A
NO
VA
dko-
7wk
P-V
alue
s for
One
-Way
AN
OV
AM
ain
effe
ctof
gen
otyp
e
Mai
nef
fect
of
age
Inte
ract
ion
(gen
otyp
e ×
age)
Ext
rins
ic M
ater
ial P
rope
rtie
s
Tibi
al w
et m
ass (
mg)
60.8
0 (1
.71)
54.3
8 (2
.76)
59.6
4 (3
.52)
49.3
4 (0
.85)
0.00
20.
217
0.43
638
.41*
† (2
.20)
<0.0
01
Tibi
al d
ry m
ass (
mg)
31.9
7 (1
.01)
29.0
7 (1
.12)
35.4
6 (1
.48)
31.1
6 (0
.51)
0.00
30.
017
0.52
818
.30*
† (1
.23)
<0.0
01
Intr
insi
c M
ater
ial P
rope
rtie
s
Cor
tical
vB
MD
(mg/
cm3 )
1346
.45
(7.0
5)13
34.9
7 (8
.72)
1493
.03
(11.
44)
1470
.96
(8.6
2)0.
081
<0.0
010.
566
1310
.17*
(8.1
9)0.
013
Trab
ecul
ar v
BM
D (m
g/cm
3 )10
77.1
1 (6
.74)
1055
.80
(11.
51)
1184
.85
(12.
16)
1201
.15
(7.2
0)0.
799
<0.0
010.
063
1059
.06
(15.
11)
0.36
0
Bon
e hy
drox
ypro
line
cont
ent (
%dr
y bo
ne m
ass)
1.96
a (0.
05)
1.94
a (0.
06)
1.66
b (0.
05)
1.96
a (0.
05)
--
0.00
41.
92 (0
.03)
0.86
2
Ulti
mat
e st
ress
(MPa
)22
7.68
a (5.
25)
233.
34a (
8.01
)21
8.56
a (7.
50)
170.
13b (
7.91
)-
-<0
.001
217.
26 (1
1.69
)0.
428
Mod
ulus
of e
last
icity
(GPa
)9.
37 (0
.38)
10.9
5 (0
.81)
8.45
(0.3
0)8.
72 (0
.31)
0.05
10.
002
0.16
112
.35*
(0.5
7)0.
007
Val
ues a
re m
eans
(SE)
. The
mai
n ef
fect
s of g
enot
ype
(wt v
s mdx
mic
e) a
nd a
ge (7
wk
vs 2
4mo)
are
list
ed in
the
sixt
h an
d se
vent
h co
lum
ns, r
espe
ctiv
ely.
Whe
n th
e in
tera
ctio
n be
twee
n ge
noty
pe a
nd a
ge w
assi
gnifi
cant
, the
p-v
alue
is g
iven
in th
e ei
ghth
col
umn
and
the
resu
lts fr
om H
olm
-Sid
ak p
ost h
oc te
sts (
p<0.
05) a
re in
dica
ted
usin
g th
e su
pers
crip
t low
erca
se le
tters
; val
ues w
ith th
e sa
me
lette
r are
not
sign
ifica
ntly
diff
eren
t. Th
e p-
valu
es in
the
last
col
umn
perta
in to
the
one-
way
AN
OV
A re
sults
acr
oss t
he th
ree
grou
ps o
f 7-w
k ol
d m
ice,
and
sign
ifica
nt fi
ndin
gs fr
om H
olm
-Sid
ak p
ost h
oc te
sts (
p<0.
05) a
rein
dica
ted
by:
* Sign
ifica
ntly
diff
eren
t fro
m w
t-7w
k an
d
† mdx
-7w
k.
wt,
wild
-type
; 7w
k, 7
-wee
k ol
d m
ice;
24m
o, 2
4-m
onth
old
mic
e; v
BM
D, v
olum
etric
bon
e m
iner
al d
ensi
ty.
Neuromuscul Disord. Author manuscript; available in PMC 2012 March 1.
NIH
-PA Author Manuscript
NIH
-PA Author Manuscript
NIH
-PA Author Manuscript
Novotny et al. Page 20
Tabl
e 4
Effe
cts o
f gen
otyp
e an
d ag
e on
tibi
al b
one
to E
DL
mus
cle
ratio
s.
wt-7
wkm
dx-7
wk
wt-2
4mo
mdx
-24m
oP-
Val
ues f
or T
wo-
Way
AN
OV
Adk
o-7w
kP-
Val
ues f
orO
ne-W
ayA
NO
VA
Mai
n ef
fect
of
geno
type
Mai
n ef
fect
of a
geIn
tera
ctio
n(g
enot
ype
x ag
e)
Ulti
mat
e lo
ad/p
eak
ecce
ntric
forc
e24
.56a (
1.10
)30
.77b (
2.93
)24
.98a,
b (1.
98)
20.3
8a (1.
05)
--
0.00
532
.73*
(1.6
4)0.
003
Stiff
ness
/pea
kis
omet
ric te
tani
cfo
rce,
mm−
1
100.
37a (
2.44
)15
1.66
b (14
.87)
116.
94a,
b (6.
78)
119.
84a (
7.82
)-
-0.
006
182.
90*
(13.
70)
0.00
1
Stiff
ness
/pea
kec
cent
ric fo
rce,
mm−
1
74.0
8a (2.
68)
97.5
9b (8.
32)
78.6
4a,b (
4.60
)81
.01a (
4.64
)-
-0.
043
111.
24*
(5.5
3)0.
004
Val
ues a
re m
eans
(SE)
. The
inte
ract
ion
p-va
lues
are
giv
en in
the
eigh
th c
olum
n an
d th
e re
sults
from
Hol
m-S
idak
pos
t hoc
test
s (p<
0.05
) are
indi
cate
d us
ing
the
supe
rscr
ipt l
ower
case
lette
rs; v
alue
s with
the
sam
e le
tter a
re n
ot si
gnifi
cant
ly d
iffer
ent.
The
p-va
lues
in th
e la
st c
olum
n pe
rtain
to th
e on
e-w
ay A
NO
VA
resu
lts a
cros
s the
thre
e gr
oups
of 7
-wk
old
mic
e, a
nd si
gnifi
cant
find
ings
from
Hol
m-S
idak
pos
t hoc
test
s (p<
0.05
) are
indi
cate
d by
:
* Sign
ifica
ntly
diff
eren
t fro
m w
t-7w
k.
wt,
wild
-type
; 7w
k, 7
-wee
k ol
d m
ice;
24m
o, 2
4-m
onth
old
mic
e.
Neuromuscul Disord. Author manuscript; available in PMC 2012 March 1.