BOC_AR2019.pdf - Bank of Ceylon
432
BANK OF CEYLON ANNUAL REPORT 2019 A League our own of
-
Upload
khangminh22 -
Category
Documents
-
view
1 -
download
0
Transcript of BOC_AR2019.pdf - Bank of Ceylon

Bank of Ceylon,No. 01, “BOC Square”,Bank of Ceylon Mawatha,Colombo 01Sri Lanka
BANK OF CEYLONANNUAL REPORT 2019
ALeagueourown
of
AN
NU
AL R
EP
OR
T 2019


Marking eight decades of timeless and legendary presence, the Bank of Ceylon is a powerhouse that has fuelled a Nation’s hopes and aspirations with banking solutions. Rising tall as the Nation’s premier banking institution, the Bank represents the vanguard of excellence in many frontiers. Recognised in local and international platforms, the Bank reigns supreme as the only state institution amongst the most admired entities in Sri Lanka.
As Sri Lanka’s most profitable and largest financial institution these achievements pave the way for Bank of Ceylon to rise above as a league of its own.
BA
NK
OF
CE
YL
ON
AN
NU
AL
RE
PO
RT
20
19
Contents
Our Vision \ 4Our Mission \ 4Corporate Value Statement \ 4
About this ReportBank of Ceylon Annual Report 2019 \ 5
Performance Highlights 2019Financial Highlights \ 8Non-Financial Highlights \ 980th Anniversary Celebrations \ 11
Chairman’s MessageChairman’s Message \ 12
General Manager’s ReviewOutgoing General Manager’s Review \ 14Acting General Manager’s Review \ 18
Organisational OverviewWho we are \ 21Our Reach \ 22Group Structure \ 23
Board of Directors \ 24Corporate Management \ 26Executive Management \ 32
Value Creation Model \ 34Value Added Statement \ 37Our Team \ 38Operating Landscape and Risk Return Dynamics \ 39Our Material Topics \ 42Risk Management \ 44
Strategic ReportStrategy and Resource AllocationWhere we are now \ 64Where we want to be \ 64How we plan to get there \ 65
1 Service Care and Customer Tangibility \ 682 Credit Culture and Quality \ 713 Technology and Cyber Security \ 744 Sustainable Business \ 785 Brand Building \ 876 Human Capacity Building \ 907 Our Presence \ 958 Process Streamlining and Innovation \ 979 Good Governance, Ethics and Risk Management \ 99
Board Subcommittee Reports
Audit Committee Report \ 109Integrated Risk Management Committee Report \ 111Human Resources and Remuneration Committee Report \ 113 Nomination and Corporate Governance
Committee Report \ 114Information and Communication Technology
Committee Report \ 115
Performance and OutlookEconomic and Industry Environment \ 117Financial Review \ 121Business Line Reviews\ 124Way Forward \ 127
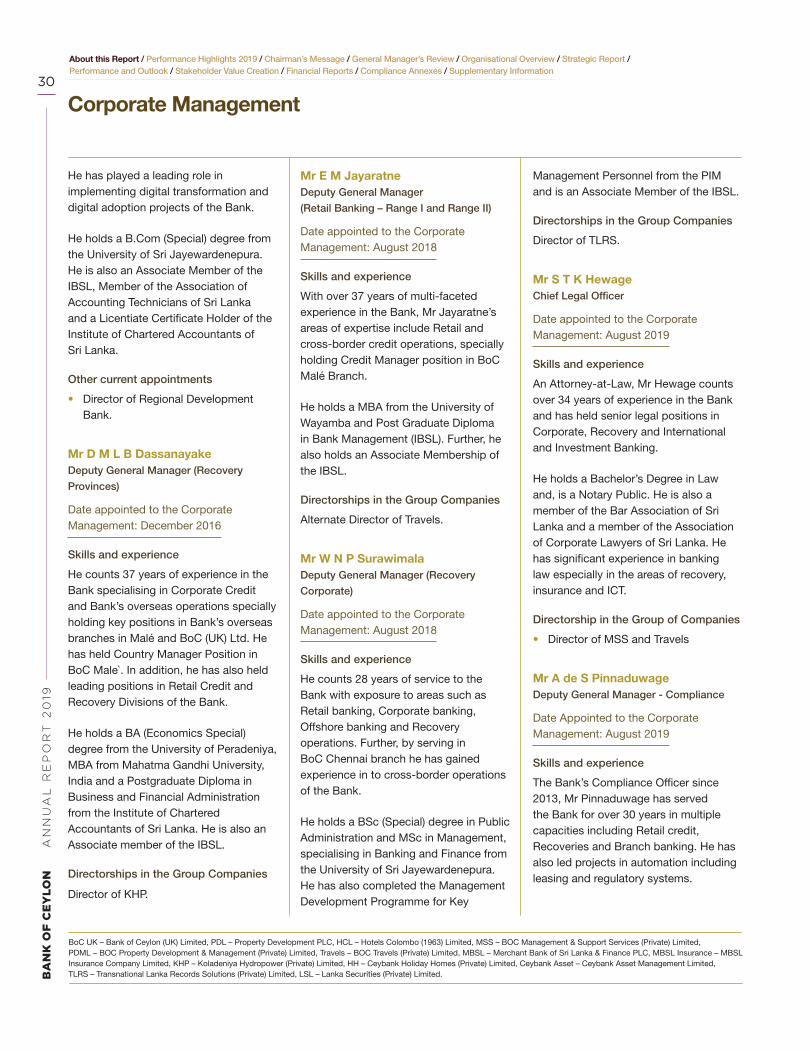
As Sri Lanka’s most economically and socially impactful organisation, BoC has over the past eight decades played the pivotal role in the country’s development journey.
Chairman’s Message \ 12

Stakeholder Value CreationStakeholder Engagement \ 128Stakeholder Value \ 130
Financial ReportsAnnual Report of the Directors
on the State of Affairs of Bank of Ceylon \ 133Directors’ Interest in Contracts \ 139Directors’ Statement on Internal Control
over Financial Reporting \ 142Independent Assurance Report \ 144Directors’ Responsibility for Financial Reporting \ 145Report of the Auditor General \ 146Statement of Profit or Loss \ 150Statement of Comprehensive Income \ 151Statement of Financial Position \ 152Statement of Changes in Equity \ 154Statement of Cash Flows \ 158Notes to the Financial Statements \ 160
Compliance AnnexesCompliance with Code of Best Practice on
Corporate Governance 2017 Issued by CA Sri Lanka \ 340Compliance Requirements as per Banking Act
Direction No. 11 of 2007 \ 347Compliance Requirements Enforced by
Colombo Stock Exchange \ 372Compliance Requirements Enforced by
the Central Bank of Sri Lanka \ 374Capital Adequacy \ 378
Supplementary InformationGRI Index \ 392Independent Assurance Report - Sustainability \ 395Statement of Profit or Loss in USD \ 397Statement of Comprehensive Income in USD \ 398Statement of Financial Position in USD \ 399Quarterly Performance \ 400Share and Debenture Information \ 403Ten Year Statistical Summary - Bank \ 405Subsidiaries and Associates \ 407Correspondent Banks by Country \ 410Exchange Companies by Country \ 416Glossary of Financial/ Banking Terms \ 418Corporate Offices and Overseas Branches \ 423Corporate Information \ 425
The first local bank to cross LKR 50 billion in brand value and retaining its position as Sri Lanka’s No.1 Banking brand..
Outgoing General Manager’s
Review \ 14
Acting General Manager’s
Review \ 18
The Bank’s customer penetration is unmatched at over 63%, enabling it to directly contribute to the development of individuals, entrepreneurs, SMEs, mid corporates and corporates.

BA
NK
OF
CE
YL
ON
AN
NU
AL
RE
PO
RT
20
19
4
Bankersto theNationOur Vision
To be the Nation’s preferred bank with a strong global presence providing customer centric innovative financial solutions.
Our Mission
To provide highly efficient, customer focused, technologically sophisticated, resilient and innovative financial services to the Nation with global access, empowering employees and enhancing value to the stakeholders.
Our
mar
ket p
ositi
on The No.
Bank
19%
20%
IndustryAssets
IndustryLoans andAdvances
IndustryProfit-After-Tax
21%
22%IndustryDeposits
Corporate Value Statement
In achieving our vision to be the Nation’s preferred bank, with a strong global presence, providing customer centric innovative financial solutions, we are committed to upholding our core five values as follows:
• Being customer centric
• Respecting all forms of diversity
• Committing towards high level of ethics, governance and professionalism
• Focusing towards agility and innovation
• Being accountable for all our actions

5
About this Report / Performance Highlights 2019 / Chairman’s Message / General Manager’s Review / Organisational Overview / Strategic Report / Performance and Outlook / Stakeholder Value Creation / Financial Reports / Compliance Annexes / Supplementary Information
Annual Report 2019Bank of Ceylon
About this Report
Bank of Ceylon (herein referred to as “BoC” or the “Bank”) 2019 Annual Report, ‘A League of our Own’ is designed to best present readers with a clear and meaningful account of how the Bank performed and created value in 2019. The Report covers the domestic and overseas operations of BoC and its subsidiaries (collectively referred to as the “Group”) for the period from 1 January 2019 to 31 December 2019. The previous Annual Report for the financial year ending 31 December 2018 is available for download at https://web.boc.lk/assets/annual_report/2018/index.html. This is the Bank’s Seventh Integrated Annual Report prepared in line with the Integrated Reporting Framework published by the International Integrated Reporting Council. This Report is also prepared in accordance with the GRI Standards; core option while targeted primarily towards the Bank’s capital providers, the Report also includes information which is relevant to other stakeholders.
Reporting Boundary
The financial information presented on pages 133 to 338 of this Report reflects
What’s newin this year’s Report
• Structured to demonstrate our strategic priorities and drivers
• Increased connectivity through navigation icons
• Enhanced conciseness (62 pages reduced)
• Adoption of Gender Parity Reporting introduced by CA Sri Lanka
consolidated financial information while the non-financial information and its narrative is limited to that of the parent entity, given its dominance within the Group. The Scope of the Integrated Report extends beyond the Bank’s operations to include its broader value chain and impacts, including external stakeholders and the operating landscape. We adopt an annual reporting cycle and this Report builds on the Bank’s previous annual report for the financial year ending 31 December 2018, for which comparative information has been provided. There have been no material restatements of non-financial information provided in the previous report. There were also no significant changes to the Bank’s structure, ownership or supply chain during the year under review.
Materiality
The content included in this Integrated Report has been determined following a materiality analysis, which takes into consideration trends in the operating landscape, legitimate interests of our stakeholders and the Bank’s strategic aspirations. The process for determining material content and a full list of material topics is given on page 42 of this Report.
Integrated Reporting
Financial Reporting
Non-Financial Reporting
Subsidiaries Associates
Bank/ Parent Entity
Internal and external stakeholders,Operating landscape, Risks and Opportunities Scan the QR Code
with your smart device to view this report online.

BA
NK
OF
CE
YL
ON
AN
NU
AL
RE
PO
RT
20
19
6
About this Report / Performance Highlights 2019 / Chairman’s Message / General Manager’s Review / Organisational Overview / Strategic Report / Performance and Outlook / Stakeholder Value Creation / Financial Reports / Compliance Annexes / Supplementary Information
Basis for Preparation
Integrated Report Sustainability Reporting Corporate Governance Financial Statements
Frameworks:
IR Framewok published by
the IIRC
Frameworks:
GRI Standards-In Accordance: ‘Core’
criteria
ESG Reporting Framework of the Colombo Stock
Exchange
Gender Parity Reporting Framework of CA Sri Lanka
Frameworks:
Bank of Ceylon Ordinance No.53 of 1938 and ammendments
Banking Act No.30 of 1988 and subsequent ammendments
Code of Best Practice on Corporate Governance 2017
issued by CA Sri Lanka
Listing Rules of Colombo Stock Exchange
Frameworks:
Sri Lanka Accounting Standards issued by
CA Sri Lanka
Guidelines issued by CBSL and CSE listing
requirements on Financial Statements and other
disclosures for Licensed Commercial Banks
Assurance:
Certain information extracted from the Group’s audited
financial statements
Assurance:
GRI Reporting disclosures audited by Messrs Ernst & Young Chartered Accountants
Assurance:
Auditor General
Assurance:
Auditor General
How this Report is StructuredThis year’s Annual Report features a key change in how material content has been structured and presented. In line with international best practice, we have aligned our narrative with the Bank’s strategic agenda, clearly demonstrating what we want to achieve and how we intend to get there. Navigation icons have been used across the Report to demonstrate connectivity between themes and eliminate duplication.
Leadership Reviews and the Bank’s performance in 2019
Performance Highlights Page 8
Chairman’s Message Page 12 General Manager’s Review Page 14/ 18
Organisational overview Who we are Page 21 Leadership Team Page 24 Value Creation Model Page 34
Our operating environment Page 39 Materiality and Risk Management Page 42
Strategic Report Where we are now Page 64
Where we want to be Page 64The Bank’s medium to long-term strategic objectives
How we plan to get there Page 65Strategic drivers and how we made the progress during the year
Performance and Outlook Economic and Industry Environment Page 117
Financial Review Page 121
Business Line Reviews Page 124
Outlook for 2020 Page 127
Financial Information and Statutory Reports
Financial Reports Page 132 Compliance Annexes Page 339
Supplementary Information Page 391
FinancialCapital
ManufacturedCapital
HumanCapital
IntellectualCapital
NaturalCapital
Social andRelationshipCapital
IconGuide Information
availableonline
Information available in other parts of this Report
FeedbackWe are committed to consistently enhancing the readability and relevance of our reporting and we welcome your suggestions and comments on our Annual Report. Please direct your feedback to,

EmpoweringNation
18.1 135.9 577.0LKR LKR LKR
Value added to Government coffers during 2019
Financing to large scale infrastructures projectsduring 2019
Funding to Direct Government and SOEs
63%Penetration
Ratio
20%Market share of loans and
advances
42%Share of inward
remittance handled
19%Controlling state of assets of the
Financial Industry
billionbillion billion
The Bank supports national socio-economic development through its role as a leading financial intermediary, thereby stimulating economic activity and its direct and indirect contribution to Government revenue.

BA
NK
OF
CE
YL
ON
AN
NU
AL
RE
PO
RT
20
19
8
About this Report / Performance Highlights 2019 / Chairman’s Message / General Manager’s Review / Organisational Overview / Strategic Report / Performance and Outlook / Stakeholder Value Creation / Financial Reports / Compliance Annexes / Supplementary Information
Performance Highlights 2019
Bank Group
2019 2018 Change % 2019 2018 Change %
Results of Operations (LKR million)
Total income 239,116 221,021 8.2 248,692 229,351 8.4
Net interest income 75,146 65,558 14.6 78,295 68,689 14.0
Profit before taxes on financial services 40,206 43,004 (6.5) 41,478 43,770 (5.2)
Profit before tax 29,685 33,416 (11.2) 30,676 33,961 (9.7)
Profit after tax 23,098 21,003 10.0 23,747 21,039 12.9
Value to the Government 18,144 24,158 (24.9) 19,626 24,852 (21.0)
Financial Position (LKR million)
Total assets 2,415,117 2,284,831 5.7 2,462,484 2,329,600 5.7
Gross loans and advances 1,648,761 1,510,534 9.2 1,682,589 1,544,355 9.0
Loans and advances net of provisioning for impairment 1,549,805 1,429,107 8.4 1,580,949 1,460,619 8.2
Due to Depositors 2,005,212 1,770,975 13.2 2,025,204 1,789,924 13.1
Total liabilities 2,272,834 2,152,661 5.6 2,307,488 2,186,731 5.5
Total equity 142,283 132,170 7.7 154,996 142,868 8.5
Per Share Data (LKR)
Basic earnings per share 972 1,127 (13.7) 987 1,129 (12.6)
Net assets value per share 5,691 6,608 (13.9) 6,128 7,109 (13.8)
Performance Ratios (%)
Return on average assets 1.3 1.6 (0.3) 1.3 1.6 (0.3)
Return on average equity 16.8 17.3 (0.5) 16.0 15.9 0.1
Interest margin 3.2 3.1 0.1 3.3 3.2 0.2
Cost to income 37.3 36.3 1.0 39.6 38.7 0.9
Loans to deposits 82.2 85.3 (3.1) 83.1 86.3 (3.2)
Debt to equity 34.7 41.0 (6.3) - - -
Impairment provision as a percentage of gross loans and advances 6.0 5.4 0.6 6.0 5.4 0.6
Statutory Ratio (%)
Liquid assets ratio (Domestic) (minimum requirement 20%) 24.6 24.5 0.1 - - -
Liquidity coverage ratio (LKR) (minimum requirement 2019 - 100%, 2018 - 90%) 188.2 143.5 44.7 - - -
Liquidity coverage ratio (All currency) (minimum requirement 2019 - 100%, 2018 - 90%) 125.6 115.0 10.6 - - -
Capital Adequacy Ratios (%)
Common Equity Tier I Capital (Minimum requirement 2019 - 8.50%, 2018 - 7.375%)
11.2 10.3 0.9 11.4 10.4 1.0
Tier I capital(Minimum requirement 2019 - 10.00%, 2018 - 8.875%)
11.2 10.3 0.9 11.4 10.4 1.0
Total Capital(Minimum requirement 2019 - 14.00%, 2018 - 12.875%)
15.6 14.6 1.0 15.7 14.6 1.1
Financial Highlights

About this Report / Performance Highlights 2019 / Chairman’s Message / General Manager’s Review / Organisational Overview / Strategic Report / Performance and Outlook / Stakeholder Value Creation / Financial Reports / Compliance Annexes / Supplementary Information
9
Economic Performance
2019 2018 2017
Value creation to Government LKR million 18,144 24,158 28,524
Direct new employment creation No. 12 1,622 534
Penetration ratio % 63 62 60
Branches outside the Western Province No. 445 442 443
Road developments financed LKR million 28,294 31,696 1,464
Renewable power projects financed LKR million 1,508 3,600 640
Inward remittances facilitated LKR million 524,749 580,133 449,170
Social Performance
2019 2018 2017
Human Capital
Total employees No. 8,503 8,724 7,587
New recruits No. 12 1,622 534
Female representation rate % 60 60 57
Attrition rate % 0.8 0.9 0.3
Total payments to employees LKR million 18,365 17,351 16,996
No. of promotions No. 821 174 1,831
Investment in training and development LKR million 233 354 289
Total training hours Hours 398,189 523,378 279,274
Revenue per employee LKR million 28.1 25.3 24.9
Net profit per employee LKR million 2.7 2.4 2.8
Employees holding membership in professional bodies No. 323 371 292
2019 2018 2017
Social and Relationship Capital
Total customers No. in million 13.7 13.4 12.8
Interest paid to customers LKR million 126,713 112,056 92,229
Customer contact points No. 1,880 1,721 1,589
Payments to suppliers LKR million 10,775 9,704 9,266
Spending on local suppliers % 97 97 92
Investment in CSR LKR million 68 108 127
No. of University trainees and School leavers trained No. 2,879 2,752 1,870
No. of correspondent relationships No. 675 859 859
Non-Financial Highlights

BA
NK
OF
CE
YL
ON
AN
NU
AL
RE
PO
RT
20
19
10
About this Report / Performance Highlights 2019 / Chairman’s Message / General Manager’s Review / Organisational Overview / Strategic Report / Performance and Outlook / Stakeholder Value Creation / Financial Reports / Compliance Annexes / Supplementary Information
2019 2018 2017
Intellectual Capital
Brand value LKR million 51,827 42,874 40,600
Employee experience (tacit knowledge) Years 78,132 81,627 81,841
Corporate Management experience Years 496 519 566
2019 2018 2017
Manufactured Capital
Investment in digital infrastructure LKR million 1,698 1,963 1,693
Capital expenditure in Branch transformation and upgrade LKR million 2,007 1,170 1,187
Environmental Performance
2019 2018 2017
Natural Capital
GHG emission Scope 1 Tons in (CO2eqv.) 2,974* 2,902 Not Available
GHG emission Scope 2 Tons in (CO2eqv.) 14,220* 10,354 Not Available
Solar power generation kWh 2,369,762 885,238 492,230
Fuel usage Litres 696,559 732,101 440,180
Electricity consumption MWh 24,328 21,135 22,325
Water usage m3 501,779 501,229 489,560
Investment in solar power LKR million 71 146 71
No. of loans screened under ESMS No. 115 508 Not Available
* Based on estimated and extrapolated data from the previous year assessment.
Non-Financial Highlights

About this Report / Performance Highlights 2019 / Chairman’s Message / General Manager’s Review / Organisational Overview / Strategic Report / Performance and Outlook / Stakeholder Value Creation / Financial Reports / Compliance Annexes / Supplementary Information
11
Anniversary
Social Sustainability“BoC Yalu Para: Fostering a Culture of Responsible Driving”
This unique project is designed to nurture a culture of responsible driving and raise awareness on road rules with the objective of reducing road accidents, which claim over 2,800 lives every year in Sri Lanka.
BoC celebrated 80 years of service to the Nation in 2019. In commemorating this momentous achievement in a meaningful way, the Bank conducted a 80th Anniversary mega celebration event with the participation of highest political representation, many loyal customers, employees and other business partners of its journey so far. Throughout the event, it highlighted the economic contribution the Bank has made to the Nation as the Nations partner in growth and it also sought to launch two strategic CSR projects aimed at supporting Environmental and Social sustainability. When formulating CSR projects, the Bank has focused on areas of national interest which are aligned to the achievement of the Sustainable Development Goals for which the Government seeks corporate sector partnership.
Celebrations
Economic Sustainability80th Anniversary Mega Celebration event was carried out at BMICH with the participation of
the President, Prime - Minister and some cabinet Ministers. Bank’s Chairperson, Directors,
Leadership Team, distinguished customers, employees, retired members of the BoC family,
and strategic partners in growth as well as well-wishers. Throughout, the ceremony the Bank
highlighted how it has contributed the Nations growth trajectory by effectively merging its
business model with the Nation’s growth priorities across many eras ranging from manual to
knowledge based economic era.
Products Launched� Bank’s QR-code enabled mobile payment app - BoC Smart Pay
� PFC Smart Saver investment plan
� BoC 'Sansada' account
� BoC Smart Lady investment plan
Environmental Sustainability“Haritha Arana: Preserving the Country’s Biodiversity and Natural Habitats”
Designed with the objective of contributing to the Government’s target of increasing Sri Lanka’s forest cover to 32% and aligned to the SDGs of Climate Action and Life on Land, this initiative involves planting 80,000 trees in a degraded forest strip in Habarana. Conducted in partnership with the Ministry of Environment and Mahaweli Development and Department of Forest Conservation, the Bank planted 40,000 new saplings in
Conducted with the support of the Sri Lanka Police, the project was launched at the Bank’s 80th Anniversary Celebrations which was held on 1 August 2019.
The project is implemented in phases, with Phase 1 targeted towards the Bank’s employees. Accordingly, seven awareness programmes were conducted for the Head Office and Provincial level staff in partnership with the Road Safety Division of Sri Lanka Police. Separate programmes were also conducted at provincial level. The Bank also
a total area of 100 Ha and cleared weeds which allowed for the healthy growth of another growth-retarded plants of around 40,000. The area and trees to be planted were based on the recommendations of the Department of Forest Conservation. The Bank, as well as its employees contributed both financial resources and time for this initiative.
developed and launched seven videos designed to raise awareness on road safety and road rules to be shared among employees as well as external stakeholders. These videos will be circulated through official WhatsApp groups and social media platforms of the Bank. Following the launch of the videos, employees were given the opportunity to pledge to be a responsible driver. In the next phase, the project will be extended to families of employees, corporate clients, customers and ultimately the general public.

BA
NK
OF
CE
YL
ON
AN
NU
AL
RE
PO
RT
20
19
12
About this Report / Performance Highlights 2019 / Chairman’s Message / General Manager’s Review / Organisational Overview / Strategic Report / Performance and Outlook / Stakeholder Value Creation / Financial Reports / Compliance Annexes / Supplementary Information
Kanchana Ratwatte, Chairman - Bank of Ceylon
Dear Stakeholder,
As the premier financial institution of this Island Nation enters its 81st year, we remain evermore resilient in order to face the trying times inflicted by a worldwide pandemic. We have weathered many a storm during our existence and have kept the wheels of finance moving by giving leadership to the entire financial sector of Sri Lanka. It is under these circumstances that I take pride and pleasure in presenting to you the Annual Report and Audited Financial Statements of Bank of Ceylon for 2019.
As Sri Lanka’s most economically and socially impactful organisation, BoC has over the past eight decades played the pivotal role in the country’s development journey. Its market leadership position as the country’s largest financial institution operating the industry’s most extensive branch network and the long-term relationships it has nurtured with diverse stakeholders places the Bank in a unique position to contribute directly towards the country’s socio-economic empowerment. This was clearly evident following the cessation of the civil conflict in 2009, where BoC played a significant role in fostering equitable wealth distribution across the country, as one third of the economy re-entered the formal structure driving economic growth of over 6%. As a fully-state owned entity, the Bank’s long-term objectives include both economic and social objectives as it continues to play a vital role in partnering the growth of individuals, entrepreneurs, businesses and the Government.
The Sri Lankan economy faced considerable challenges in 2019 with GDP growth slowing up to 2.3% during the year. Spillover effects of global dynamics coupled with prolonged impacts of the debilitating terror attacks in April had broad-based impacts on key sectors of the economy, resulting in a sharp deceleration in credit demand and weakening of investor sentiments. These dynamics directly impacted the country’s banking sector which saw a slowdown in credit growth, an escalation in impairments and narrowing interest rate margins. Economic activity was further affected during the period leading up to the Presidential elections in November 2019, which saw investors adopting a wait-and-see approach. Despite these conditions, BoC delivered a resilient performance in 2019 recording a 10% growth in profit-after-tax to LKR 23.1 billion.
While 2020 commenced on a positive note, given anticipated policy stability and a conflict-free environment between the executive and legislature, the outlook is now considerably tempered by the global and domestic implications of the COVID-19 pandemic. The economic and human toll to Sri Lanka is yet to be fully determined, although stringent measures adopted by the Government to ensure social distancing and prevent a further spread of the virus will undoubtedly impact economic activity over the short-to-medium term, over the longer-term however, the fiscal and monetary policy stimulus provided by the Government is expected to strengthen
As Sri Lanka’s most economically and socially impactful organisation, BoC has over the past eight decades played the pivotal role in the country’s development journey.
Chairman’sMessage

13
About this Report / Performance Highlights 2019 / Chairman’s Message / General Manager’s Review / Organisational Overview / Strategic Report / Performance and Outlook / Stakeholder Value Creation / Financial Reports / Compliance Annexes / Supplementary Information
the country’s SME sector, resulting in improved economic activity across key industries. Furthermore, possible debt moratoriums which are currently under negotiation between the Treasury and Sri Lanka’s key bilateral lenders would provide immediate relief to the country’s fiscal pressures, affording the necessary impetus to kick start the economy.
The Bank will continue to support the Government’s development agenda, directing lending towards much needed areas of the economy while contributing towards national infrastructure development projects. Our long-term strategy will also focus on further enhancing the Bank’s digital proposition, transforming the customer experience through offering seamless banking services and further strengthening our brand.
As a responsible corporate citizen and Sri Lanka’s leading Bank, we are cognisant of the role we can play in propagating sustainable business practices in addressing critical social and environmental issues. BoC adopts a strategic approach to sustainability, focusing on the three key dimensions of economic, social and environmental sustainability. We made significant progress in all three fronts during 2019, including continued investments in green buildings and solar power generation, implementation of a
comprehensive Environmental and Social Screening system as well as meaningful and impactful CSR activities; these initiatives are discussed in further detail in subsequent sections of this Report. We also offer a unique value proposition centred on skill development, engagement and opportunities for progression to our team of 8,503 employees.
AcknowledgementsAs the Bank gears up for 2020, I wish to thank my colleagues on the Board for their valuable counsel and continued support. I also take this opportunity to praise the Management Team and all employees for delivering the results set out before you in a challenging year. I wish to extend my gratitude to the Hon. Minister of Finance and the Officials for the confidence placed in me and their continued support. My appreciation also goes out to the Governor and Officials of the Central Bank of Sri Lanka and the Auditor General and his team for their proactive actions in creating a conducive operating landscape for the financial sector. Finally, I wish to extend my gratitude to our valuable customers, suppliers, trade unions, business partners and communities for partnering us in our journey and I look forward to your support in the coming years.
Kanchana RatwatteChairman
24 March 2020Colombo
As a responsible corporate citizen and Sri Lanka’s leading Bank, we are cognisant of the role we can play...

BA
NK
OF
CE
YL
ON
AN
NU
AL
RE
PO
RT
20
19
14
Dear Stakeholder,
The Bank of Ceylon continued to leverage on its unique value proposition to deliver sustainable stakeholder value, in a year characterised by numerous global and domestic challenges. The Bank maintained its market position as Sri Lanka’s leading financial intermediary, emerging as the first local bank to cross LKR 50 billion in brand value and retaining its position as Sri Lanka’s No.1 Banking brand, a position it has maintained consecutively for over a decade. It also received twenty two local and international awards and accolades for various aspects of its operations, attesting to the effectiveness of recent management interventions to reposition and re-energise the Bank. Most valuable banking brand in Sri Lanka 2019 - Brand Finance, Top 1000 Banks in the World - The Banker Magazine (UK), Most admired companies of Sri Lanka - 2019 by International Chamber of Commerce and the Top 10 Best Corporate Citizens in the Best Corporate Citizens Sustainability Awards - 2019 by Ceylon Chamber of Commerce are some prime awards we received during the year, out of those mentioned above. BoC also commemorated 80 years of service to the Nation in 2019, while its UK operations marked its 70th anniversary. Against this backdrop, it gives me great pleasure to present to you an overview of our strategy and performance in 2019.
Context to our PerformanceThe operating environment in 2019 presented numerous challenges for the economy as a whole and many key industries. The terror attacks in April led to a sharp downturn in the tourism sector, which in turn affected the entire hospitality value chain. Heightened security concerns and subdued sentiments in subsequent months adversely impacted overall economic activity, with consumer spending decelerating sharply. Investors also adopted a wait-and-see approach hoping for new policies in the months leading up to the elections, further impacting economic sentiments. These dynamics contributed towards liquidity stresses in many key sectors and value chains, leading to a broad-based influx of non-performing-loans across the banking sector. The banking sector was also impacted by the tightening regulatory and compliance environment, as the regulator imposed interest rate caps with a view to stimulating economic activity.
Changes in the country’s political landscape towards the latter part of 2019 and the relatively accommodative monetary and fiscal policy stance adopted by the Government has led to an overall improvement in sentiments. Credit demand has shown gradually signs of recovery in the first few months of 2020 and relief granted to the SME sector in the form of moratoriums and
The first local bank to cross LKR 50 billion in brand value and retaining its position as Sri Lanka’s No.1 Banking brand..
General Manager’sSenarath Bandara, Outgoing General Manager - Bank of Ceylon
About this Report / Performance Highlights 2019 / Chairman’s Message / General Manager’s Review / Organisational Overview / Strategic Report / Performance and Outlook / Stakeholder Value Creation / Financial Reports / Compliance Annexes / Supplementary Information
Review
Outgoing

15
In view of escalating competition, unprecedented changes in technology and increasing customer sophistication, the Bank has identified four areas of focus which will form the foundation of its strategic actions over the next few years.
tax concessions is expected to stimulate activity over the longer-term. The short-to-medium outlook, however, is tempered by the yet uncertain impacts of the COVID-19 pandemic.
A Resilient PerformanceBoC’s performance in 2019 was understandably impacted by dynamics in the operating environment, although I am pleased to report that BoC performed relatively well in comparison to its peers. The Bank’s total income increased by 8% in 2019, supported by loan growth of 9% as we continued to support the country’s SME sector despite the prevalent conditions. Net interest income growth was relatively strong at 15%, while the Net-Interest-Margin improved to 3.2% reflecting smart margin management. Other Operating Income recorded a decline of 90% compared to the previous year, reflecting a normalisation of significant exchange gains recorded in 2018.
Impairment charges on loans and advances increased by 27% reflecting the industry-wide deterioration in portfolio quality. Meanwhile, proactive efforts undertaken to strengthen monitoring and recovery mechanisms enabled the Bank to limit its gross NPA ratio to 4.8% as at end-December 2019, more over in line with the industry average. Meanwhile, the growth in operating expenses was contained at 5% reflecting the Bank’s strategic efforts towards driving automation and process efficiencies.
Overall, the Bank’s operating profit before tax on financial services recorded a decline of 7% and also post-tax level, operating profit showed a sharper decline of 11% mainly due to the implementation of the Debt Repayment Levy during the year. However, a reversal of income tax stemming from SLDB investments during the year led to the Bank’s total income tax declining 47%, which in turn resulted in the Bank’s post-tax profit recording an increase of 10% to LKR 23.1 billion during the year.
The Bank recorded consistent balance sheet expansion, with total assets increasing by 6% to reach LKR 2,415.1 billion as at end-December 2019. Deposit growth was strong at 13% while total equity increased by 8% in view of stronger profit retention during the year. As a state-bank BoC faces limitations in approaching the market for capital raising activities; given enhanced capital requirements, we have been compelled to strengthen our capital base by relying solely on internal capital generation and managing the dividend pay-out.
Transforming the BankIn view of escalating competition, unprecedented changes in technology and increasing customer sophistication, the Bank has identified four areas of focus which will form the foundation of its strategic actions over the next few years. These aspirations provide a clear blueprint on where we want to be over the long-term and the specific actions that would be required to maintain the Bank’s market leadership and sustain its
competitive edge over the long-term. The progress we made in the achievement of these objectives in 2019 is briefly discussed below; further information is available in subsequent sections of this Annual Report.
n Excellence in Customer Service
We are committed towards driving a customer-centric proposition by transforming the customer experience and providing a consistent service across our touch points. This is aligned to our digital strategy, through which we are striving to increase digital adoption among our customers, by offering self-service channels and virtual platforms. During the year, we opened three DIGI centres, 143 CRMs and 67 Smart Zones across the island, and introduced a QR code-based mobile payment app - BoC Smart Pay. Our long-term strategy is to drive customer migration to digital channels for routine transactions, thereby freeing up employee time to pursue increased value addition. Given the demographic profile of our customer base, driving digital adoption continues to be a challenge although during the year BoC made considerable progress in this front with the digitally active customer base increasing by 16%. During the year, we also sought to optimise our brick and mortar model with the addition of four new branches and relocation of 22 branches to offer improved customer access and convenience.
About this Report / Performance Highlights 2019 / Chairman’s Message / General Manager’s Review / Organisational Overview / Strategic Report / Performance and Outlook / Stakeholder Value Creation / Financial Reports / Compliance Annexes / Supplementary Information

BA
NK
OF
CE
YL
ON
AN
NU
AL
RE
PO
RT
20
19
16
n Leading the Digital Adoption
As Sri Lanka’s leading bank and a state-owned entity, we are cognisant of the role we can play in supporting the achievement of the National Digital Policy and the Central Bank’s Digital Road Map. Key elements of our digital transformation strategy include process automation, analytics and data enrichment, paperless banking and digital channels/ engagement. In 2019, we introduced six workflow solutions, made further investments in Document Management System (DMS), piloted paperless banking in four branches and introduced digital pads to 47 branches. These initiatives have resulted in a considerable reduction in paper consumption while reducing transaction turnaround times and driving increased efficiencies.
n Retaining Market Leadership
While the Bank maintained its position as the undisputed market leader in financial services, we are cognisant of intensifying competitive pressures stemming from both traditional and non-traditional banks as well as fintech companies. In order to effectively retain our market leadership status and leverage on the unmatched strength of our brand, we engaged in concerted efforts to build brand visibility across all market segments while investing in digital engagement platforms to strengthen the appeal of the brand to the younger demographics.
n Best in Sustainable Banking
As one of Sri Lanka’s most economically and socially impactful organisations,
we are aware of the role we can play in providing meaningful and effective solutions to emerging social and environmental issues. Given the increasing prevalence of climate related risks, natural disasters and widening income inequalities, the Bank has adopted a strategic and holistic approach towards sustainability, focusing on the three main dimensions of economic, environmental and social sustainability. By end-December 2019, we had converted 41 branches to solar, thereby contributing 1,855 Kwh of renewable energy to the national grid. The Bank also currently has three branches which have been constructed in compliance with guidelines for the Green Buildings issued by Green Building council Sri Lanka with 12 more branches in the pipeline. Social sustainability comprises ongoing CSR engagements in supporting education, health and wellbeing including You are a Leader programme, Nanajaya and Hapana scholarships as well as several reforestation programmes launched reiterate our commitment to Environmental Sustainability.
Stakeholder Value CreationIn 2019, we enhanced the mechanisms in place to ensure that we are responsive to our stakeholders and responsible in our value creation process. Employee training and development was a key priority during the year, and we focused on upskilling employees to thrive in a digital world, while driving attitudinal changes to better serve internal and external customers. Proactive engagement with employees was facilitated through multiple platforms aiming to drive team spirit and a sense of camaraderie among our multi-generational workforce.
We sought to further strengthen our customer value proposition by widening our product portfolio and added the Smart Saver-personal foreign currency saving account, Smart Lady (Women’s investment plan) and Sansada account
for Associations and Clubs during the year. In addition to investing in self-banking channels we also sought to enhance financial literacy through and education. As a Bank with an extensive rural presence and customer penetration rate of 63%, we play a significant role in driving financial inclusion across the country; for instance, we added five more Branch on Wheels to penetrate the country’s unbanked segment and continued to channel funds to the country’s most deserving segments through development credit schemes and our micro-financing programme 'BoC Mithuru'.
The Bank continues to be a key partner in the Government’s economic development agenda, funding national infrastructure projects such as Road Development, Power Generation and Water distribution and Irrigation among others. We also play a vital role in supporting the country’s SME sector and promoting entrepreneurship through various credit schemes. Total tax contribution during the year amounted to LKR 17.8 billion.
Risk Return DynamicsFrom a risk management perspective, key areas of focus during the year included strengthening our credit risk management framework and enhancing the IT and cyber security infrastructure. Given rising impairments across the industry, the Bank sought to proactively engage customers through awareness programmes and recovery workshops. We also invested in strengthening employees’ credit management skills, with nearly 5,000 employees undergoing training on credit appraisal and management. We are aware that the Bank’s increasing thrust towards digitisation is likely to lead to increased exposure to IT vulnerabilities and continued to invest in upgrading the IT and Cyber security infrastructure in line with international standards. In 2019,
The Bank has adopted a strategic and holistic approach towards sustainability..
Outgoing General Manager’s Review
About this Report / Performance Highlights 2019 / Chairman’s Message / General Manager’s Review / Organisational Overview / Strategic Report / Performance and Outlook / Stakeholder Value Creation / Financial Reports / Compliance Annexes / Supplementary Information

17
we completed the establishment of a dedicated Security Operations Centre and invested in Data Loss Prevention Solutions and Advanced threat protection for servers.
AcknowledgementsI would like to take this opportunity to extend my gratitude to the Chairman and Boards of Directors for their vision and valuable counsel. I also wish to thank the Corporate and Executive Management team, trade unions and all BoC employees who inspired me and offered their unstinted support over the years. I also wish to thank the Minister of Finance and Officials of the Ministry for their invaluable support. The Central Bank of Sri Lanka has provided sterling support in ensuring the creation of a stable and resilient financial sector and I wish to express my appreciation for their efforts. My gratitude also goes out to the Auditor General and his staff for the execution of the audit of the Financial Statements enabling the timely publication of this Report.
Further, I extend my gratitude to our valuable customers, who always kept their trust towards BoC.
Senarath BandaraOutgoing General Manager
28 February 2020Colombo
About this Report / Performance Highlights 2019 / Chairman’s Message / General Manager’s Review / Organisational Overview / Strategic Report / Performance and Outlook / Stakeholder Value Creation / Financial Reports / Compliance Annexes / Supplementary Information

BA
NK
OF
CE
YL
ON
AN
NU
AL
RE
PO
RT
20
19
18
About this Report / Performance Highlights 2019 / Chairman’s Message / General Manager’s Review / Organisational Overview / Strategic Report / Performance and Outlook / Stakeholder Value Creation / Financial Reports / Compliance Annexes / Supplementary Information
Acting
D P K Gunasekera, Acting General Manager - Bank of Ceylon
Dear Stakeholder,
It is my pleasure to pen this message to you as we present the Annual Report and Audited Financial Statements of the Bank of Ceylon for the financial year ending 31 December 2019.
BoC maintains its position as the undisputed market leader in Sri Lanka’s financial services sector, accounting for more than 19% of assets and 22% of deposits of the Banking sector as at end-December 2019. The Bank’s customer penetration is unmatched at over 63%, enabling it to directly contribute to the development of individuals, entrepreneurs, SMEs, mid corporates and corporates. As a state-owned entity, the Bank has and will continue to play a vital role in the Government’s development agenda, through lending to projects of national importance, contribution to national coffers via dividend and tax employment generation and facilitating financial inclusion across the country. The role we play in ensuring the soundness of the financial sector of the country also significant as the largest Banking establishment of the country.
Despite the numerous challenges that prevailed in 2019, BoC continued to deliver on its stakeholder commitments supported by a holistic strategy, a committed team and effective governance and risk management structures. The Bank recorded profit
growth of 10% during the year, while the balance sheet expanded by 6%. Key priorities during the year included strengthening the digital infrastructure, upskilling employees, preserving portfolio quality and building our brand. Further information on our strategic progress is discussed in detail in subsequent sections of this Report.
The outbreak of the Coronavirus (COVID-19) has brought the global economy to a crippling halt; the World Health Organisation declared COVID-19 as a pandemic on 11 March 2020, opining that the virus would inevitably spread to all parts of the world. With most countries implementing extraordinary measures to limit the spread, including lockdowns, curfews and large-scale quarantines, economies and businesses are expected to suffer significant distress over the next few months while recovery timelines become increasingly unpredictable. From BoC’s perspective, our first priority is to ensure the safety of our team and customers. Necessary measures have been taken to enable staff of non-critical areas to work from home while stringent checks are in place for front-line staff who are inevitably exposed to outside parties. Many measures are also taken to ensure the safety of the customers who visits the Bank branches and ATMs. We are also cognisant of the role we have to play in ensuring the continued functioning of the country’s payment and settlement
The Bank’s customer penetration is unmatched at over 63%, enabling it to directly contribute to the development of individuals, entrepreneurs, SMEs, mid corporates and corporates.
General Manager’sReview

19
About this Report / Performance Highlights 2019 / Chairman’s Message / General Manager’s Review / Organisational Overview / Strategic Report / Performance and Outlook / Stakeholder Value Creation / Financial Reports / Compliance Annexes / Supplementary Information
systems and facilitate cash circulation among masses; accordingly, in line with Government guidelines, all efforts have been made to continuously offer our essential services, albeit in a limited manner across all districts in the country.
At this point in time, it is premature to ascertain the exact economic impact of the pandemic on Sri Lanka’s economy. However I am confident that the resilience and spirit of the Sri Lankan people will enable the country to overcome these challenges over the short-to-medium term. The recent relief measures and tax concessions announced by the Government is anticipated to support a turnaround in consumer spending while political and policy stability is likely to augur well for overall economic activity over the medium to long term. We are keen to support the Government’s socio-economic development plans and will comply with the announced debt moratoriums while directing lending towards sectors and communities that have been earmarked to drive economic growth. We also remain optimistic with regards to the recovery of the local economy, particularly sectors such as agriculture, dairy and e-commerce which continue to demonstrate resilience and growth amidst this crisis. We hope to capitalise on the opportunities offered by these sectors while thereby supporting our customers and the country to overcome the economic challenges arising from COVID-19. Other areas of priority will include further strengthening our digital proposition, enhancing our brand, developing people and driving improvements in customer service.
AcknowledgementsI would like to extend my gratitude to the Chairman and Board of Directors for the confidence placed in me and look forward to their valuable counsel. I wish to thank, the BoC leadership team, all employees and the trade unions continue to be a source of inspiration and I am certain that their spirit and commitment will enable us to overcome these challenging times. I also wish to thank the Minister of Finance, Officials of the Ministry, Auditor General and his staff and the Central Bank of Sri Lanka for their continued support. Finally, my warmest appreciation goes out to all our stakeholders including our valuable customers, business partners and suppliers for their continued patronage and support.
D P K GunasekeraActing General Manager
24 March 2020Colombo

Empowering Communities
SME Loan disbursed during the year via scheme loans
Micro finance loan disbursed duringthe year via scheme loans
No. of beneficiaries of financial literacy programmes
76%Percentage of
customers outside Western Province
78%Percentage of scheme
loans distributed outside Western
Province
69%ATMs/CRMs
out of Western Province
9%Branches in marginalised
areas
68.4 9.4 17,740LKR LKR
billion billion
Our unparalleled customer reach, extensive geographical footprint and inclusive approach to lending enable us to contribute towards the economic empowerment of the country’s most deserving segments.

About this Report / Performance Highlights 2019 / Chairman’s Message / General Manager’s Review / Organisational Overview / Strategic Report / Performance and Outlook / Stakeholder Value Creation / Financial Reports / Compliance Annexes / Supplementary Information
21
Sri Lanka’s No.1Banking Brand for11 consecutiveyearsBrand value: LKR 51.8 billion
Who we are
Bank of Ceylon is Sri Lanka’s leading financial institution with an unparalleled track record of eight decades in driving the country’s socio-economic development through partnering the growth of individuals, businesses and the Government by providing access to finance and safeguarding public interest. A financial powerhouse with a customer penetration rate of over 63%, BoC accounts for a respective 19% and 22% of the banking industry’s assets and deposits is by far the largest bank in the country. As a fully-state owned, Domestic systemically Important Bank, BoC’s role extends beyond that of mere financial intermediation and its impact on the economic and social fabric of Sri Lanka is unmatched.
Sri Lanka’s largest financial institution mainly in terms of assets, advances, deposits and profit. BoC also has the largest customer penetration ratio in the financial services industry, catering to over 13.7 million customers across the island through the widest reach.
LKR 2.4 trillion assetsLKR 2.0 trillion deposits1,880 customer touch points (direct)
Social Impact
Direct employment generation: 12Value created to employees:LKR 18,365 millionInvestment in CSR: LKR 67.9 millionSpending on local suppliers:LKR 10,416 million (97%)
Environmental Impact
Lending to renewable energy:LKR 1,508 million
Solar powered branches: 41Solar power generated :
2,369,762 KwhNo. of loans screened under
ESMS: 115
LKR 18.1 billionValue creation to Government
LKR 571.3 billionInvestment in Government Securities
LKR 135.9billionLending to infrastructure projects
LKR 77.8billionDisbursements to the SME and Micro-finance sectors via scheme loans
LKR 524.7billionInward remittances facilitated
Performance
3.2% (2018: 3.1%)NIM
1.3% (2018: 1.6%)Return on average assets
16.8% (2018: 17.3%)Return on average equity
LKR 29.7 billion (2018: LKR 33.4 billion)Profit before tax
Portfolio Quality
4.8% (2018: 3.6%)Gross NPL ratio
1.8% (2018: 1.0%)Net NPL ratio
LKR 18.6 billion (2018: LKR 15.0 billion) Impairment charge
Capital and liquidity
11.16% (2018: 10.31%)CETI ratio
11.16% (2018: 10.31%)Tier 1 capital ratio
15.58% (2018: 14.58%)Total capital ratio
4.9%Leverage ratio
125.6% (2018: 115.0%)Liquidity coverageratio (all currency)
BoC is often the pioneering bank to establish a presence in rural regions, thereby playing a pivotal role in driving financial inclusion across the country.
581 branches (445 outside the Western Province)
15 SME Centres
2,477 Mobile School Savings units and School “Sansada”
0 10 20 30
2019
2018
LKR billion
24.2
18.1
Market Position
Financial Stability
Economic Impact
SocialImpact
Organisational Overview
NO. Profit after tax
Assets
Deposits
Gross loans and advances
Inward Remittance

BA
NK
OF
CE
YL
ON
AN
NU
AL
RE
PO
RT
20
19
22
About this Report / Performance Highlights 2019 / Chairman’s Message / General Manager’s Review / Organisational Overview / Strategic Report / Performance and Outlook / Stakeholder Value Creation / Financial Reports / Compliance Annexes / Supplementary Information
Our Reach
In addition to its extensive presence in Sri Lanka, the Bank has also established an international presence by operating three overseas branches in India, Maldives and Seychelles and a subsidiary in London, the UK. It also maintains relationships with 94 exchange companies in 19 counties further fortifying its international reach. During the last three years, in addition to increasing our reach via physical and digital touch points, we have also invested heavily in expanding our reach via virtual platforms.
North CentralProvince
57 03 01 106 19 02 02
126 18 02 294 50 03 01
49 02 01 79 13 01 02
41 02 01 68 11 01 02
65 03 01 113 19 02 03
EasternProvince
NorthernProvince
North WesternProvince
WesternProvince
SabaragamuwaProvince
CentralProvince
UvaProvince
SouthernProvince
65 07 01 120 15 01 02
55 03 01 71 7 01 01
63 06 01 66 12 01 01
50 03 01 91 15 02 01
Branches 581
Limited Service Branches 62
Mobile Branches 11
ATMs/ CRMs 1,033
CDMs 164
Regional Loan Centres 14
SME Centres 15
Total Customer Touch Points
Virtual Touch Points
BoC Smart online Banking BoC Smart Mobile Banking BoC Smart Pay
Corporate and Overseas Customer Touch Points
Corporate Branches 05 14 18 03 -
Premier Banking 01 - 01 - -
Overseas Branches 03 01 06 - -
FCBU 01 - - - -
Mobile Unit - - - - 01

About this Report / Performance Highlights 2019 / Chairman’s Message / General Manager’s Review / Organisational Overview / Strategic Report / Performance and Outlook / Stakeholder Value Creation / Financial Reports / Compliance Annexes / Supplementary Information
23
* Not in Operation
Group Structure
BANK OF CEYLON
Associates Subsidiaries
100%
Bank of Ceylon (UK) Limited
95.55%
Property Development PLC
99.99%
Hotels Colombo (1963) Limited
100%
BOC Travels (Private) Limited
100%
BOC Management & Support Services (Private) Limited *
100%
BOC Property Development & Management (Private) Limited
74.49%
Merchant Bank of Sri Lanka & Finance PLC
Ceybank Asset Management Limited
Southern Development Financial Company Limited *
Transnational Lanka Records Solutions (Private) Limited
Lanka Securities (Private) Limited
43.36%
41.67%
24.69%
41.60%
40.08%
MBSL Insurance Company Limited
100%
95.55%
99.99%
100%
42.86%
42.86%
14.28%
100%
100%
74.49%
53.81%
20%
29%
24.69%
41.67%
43.36%Koladeniya Hydropower (Private) Limited
Ceybank Holiday Homes (Private) Limited
95.55%
100%
100%

24
About this Report / Performance Highlights 2019 / Chairman’s Message / General Manager’s Review / Organisational Overview / Strategic Report / Performance and Outlook / Stakeholder Value Creation / Financial Reports / Compliance Annexes / Supplementary Information
BA
NK
OF
CE
YL
ON
AN
NU
AL
RE
PO
RT
20
19
Board of Directors
Mr Lalith P Withana
IndependentNon-Executive Director
Ms Janaki Senanayake Siriwardane
Secretary, Bank of Ceylon/ Secretary to the Board
Mr Kanchana Ratwatte
ChairmanIndependent Non-Executive Director
Mr G Harsha Wijayawardhana
Independent Non-Executive Director
Ms Visakha Amarasekere
Ex officio Director/ Non-Independent Non-Executive Director
Mr Hasitha Premaratne
Independent Non-Executive Director
Seated (Left to Right)
Standing (Left to Right)

About this Report / Performance Highlights 2019 / Chairman’s Message / General Manager’s Review / Organisational Overview / Strategic Report / Performance and Outlook / Stakeholder Value Creation / Financial Reports / Compliance Annexes / Supplementary Information
25
Mr Kanchana RatwatteChairman Independent Non-Executive DirectorDate of appointment: 2 January 2020
Skills and experience:
A lawyer by profession, Mr Ratwatte has extensive experience in both civil and criminal law. He has also held several leadership positions in the public sector, particularly in the fields of commerce and administration. Additionally, he has held Board positions in several private sector enterprises in the fields of IT, security data printing, software development, BPO, insurance broking and securities. He holds a LL.B Degree from the University of Colombo.
Previous appointments:
Director General of the Telecommunications Regulatory Commission of Sri Lanka, Chairman of Sri Lanka Standards Institution and Ceylon Shipping Corporation Limited among others.
Ms Visakha AmarasekereEx officio Director/ Non-Independent, Non-Executive Director
Date of appointment: 11 January 2020
Skills and experience:
Ms. Amarasekere counts over 15 years’ of experience at the Government Treasury, she holds a Bachelor of Science (Hons) Degree in Economics and Management from the University of London, UK and a Master of Arts in Development Economics from the Vanderbilt University, USA. She is a Member of the Chartered Institute of Management Accountants (CIMA) UK and is also a Chartered Public Finance Accountant.
Other appointments:
Director of the Department of External Resources of the General Treasury of the Ministry of Finance, Economy and Policy Development
Previous appointments:
She has represented the Government Treasury on the Boards of several key state-owned enterprises including the Ceylon Electricity Board, Ceylon Petroleum Corporation and People’s Bank.
Mr Lalith P WithanaIndependent Non-Executive DirectorDate of appointment: 14 January 2020
Skills and experience:
Mr Withana counts over 25 years of experience in the corporate sector in the fields of Banking, Manufacturing and Trade with more than 18 years at Senior Management capacity. He holds a Master of Business Administration (MBA) from the University of Sri Jayawardenapura and a Bachelor of Arts (Hons.) Degree from the University of Manchester Metropolitan, UK. He is also a Fellow Member of the Chartered Institute of Management Accountants (CIMA), UK and the Institute of Chartered Accountants of Sri Lanka. He is also a Project Management Professional at the Project Management Institute, USA.
Other appointments:
Chief Executive Officer of Sri Lanka Catering Limited.
Previous appointments:
Independent Non-Executive Director on the Boards of Bank of Ceylon, Dankotuwa Porcelain PLC, Merchant Bank of Sri Lanka PLC, Ceylease Limited and Seylan Bank PLC. He has also been a Commissioner of the Telecommunication Regulatory Commission of Sri Lanka.
Mr G Harsha WijayawardhanaIndependent Non-Executive DirectorDate of appointment: 14 January 2020
Skills and experience:
Mr Wijayawardhana is an IT professional with over 20 years of wide-ranging experience in the ICT industry. He was also recognised as one of the Internet pioneers of Sri Lanka and one of the seven founding members of LEARN. He has been involved in several Government ICT projects and has designed and implemented Government networks for the Ministry of Foreign Affairs and Information Department of Sri Lanka, etc. He was also responsible for establishing the Software Development Unit of the University of Colombo, as well as key national - level software projects such as Birth, Marriage and Death Certificate Issuance System and Householder lists at Divisional Secretariats. He holds a Bachelor of Science Degree from the University of Miami and is a Professional Fellow of the British Computer Society.
Other appointments:
Board member of nic.lk and Co-Chair of the Sinhala Generation Panel of ICANN. COO/CTO of Theekshana R&D which is one of the three, not - for - profit companies that had been set up in association with public universities in Sri Lanka.
Previous appointments:
Served on the Board of Directors of Lanka Government Information Infrastructure and has served as an ICT Consultant to the Telecommunication Regulatory Commission of Sri Lanka. Was also the founding President of Sri Lankan Chapter of the Internet Society (ISOC).
Mr Hasitha PremaratneIndependent Non-Executive DirectorDate of appointment: 14 January 2020
Skills and experience:
A finance professional, Mr Premaratne has wide ranging experience in the fields of capital markets, economics, strategic finance, management and research. He also has over 11 years of experience as a lecturer for Chartered Institute of Management Accountants (CIMA), UK and Association of Chartered Certified Accountants, ACCA (UK) examinations in Sri Lanka, India, Singapore and Philippines and was awarded the prestigious “Tutor of the year award” at CIMA Global Financial Management Awards 2009 in London. He holds an MBA in International Finance and a BSc in Computer Science. He is a Fellow Member of the Chartered Institute of Management Accountants (CIMA), UK, Association of Chartered Certified Accountants, (ACCA), UK and the Institute of Certified Management Accountants (CMA), Sri Lanka.
Other appointments:
Group Finance Director of the Brandix Group, Managing Director of Brandix India Apparel City, Director of several subsidiaries of the Brandix Group including Teejay Lanka PLC, Committee Member of the Ceylon Chamber of Commerce and Board Member of the Sri Lanka Accounting and Auditing Standards Board.
Previous appointments:
Head of Research at HNB Stockbrokers (Private) Limited, Board Member of CIMA Sri Lanka.
Ms Janaki Senanayake Siriwardane Secretary, Bank of Ceylon/ Secretary to the Board
Profile given on page 29.

BA
NK
OF
CE
YL
ON
AN
NU
AL
RE
PO
RT
20
19
26
About this Report / Performance Highlights 2019 / Chairman’s Message / General Manager’s Review / Organisational Overview / Strategic Report / Performance and Outlook / Stakeholder Value Creation / Financial Reports / Compliance Annexes / Supplementary Information
Corporate Management
Mr K E D Sumanasiri, Mr Senarath Bandara
Mr D M L B Dassanayake, Dr. Indunil Liyanage, Mr C Amarasinghe Mr P M Liyanage, Mr S T K Hewage
Seated (Left to Right)
Standing (Left to Right)

About this Report / Performance Highlights 2019 / Chairman’s Message / General Manager’s Review / Organisational Overview / Strategic Report / Performance and Outlook / Stakeholder Value Creation / Financial Reports / Compliance Annexes / Supplementary Information
27
Mr D P K Gunasekera, Mr W P Russel Fonseka Ms Janaki Senanayake Siriwardane
Mr A De S Pinnaduwage, Mr M M Luxaman Perera, Mr D N L Fernando Mr M J P Salgado, Mr W N P Surawimala, Mr E M Jayaratne
Seated (Left to Right)
Standing (Left to Right)

BA
NK
OF
CE
YL
ON
AN
NU
AL
RE
PO
RT
20
19
28
About this Report / Performance Highlights 2019 / Chairman’s Message / General Manager’s Review / Organisational Overview / Strategic Report / Performance and Outlook / Stakeholder Value Creation / Financial Reports / Compliance Annexes / Supplementary Information
Mr Senarath BandaraGeneral Manager
(from 22 February 2018 to 2 March 2020)
Date appointed to the Corporate Management: March 2012
Skills and experience
A veteran banker, Mr Bandara holds over 30 years of multi-faceted experience in the Bank in its local as well as cross border operations. He has held leadership positions in various functions including Product Development, Sales and Channel Management, Treasury, Corporate banking, overseas operations and also the major technology transformation projects of the Bank. His overseas Banking experience includes holding the CEO position in BoC (UK) Ltd.
He holds a BSc degree in Physical Science (University of Kelaniya), MBA (Merit) from the Postgraduate Institute of Management (PIM), University of Sri Jayewardenepura (USJ) and Postgraduate Executive Diploma in Bank Management from Institute of Bankers Sri Lanka (IBSL). He is also a fellow member of the same. Further, he has also completed the Advanced Management Programme of the Harvard Business School, USA.
Other appointments
• Chairman of the Asia Pacific Rural and Agricultural Credit Association (APRACA)
• Member of the Governing Board of IBSL
Directorships in the Group Companies
Director of MBSL, HCL, HH, MSS, PDML, Travels, BoC UK and Ceybank Asset.
Corporate Management
Mr D P K GunasekeraSenior Deputy General Manager
(International, Treasury and Investment)
Appointed as the Acting General Manager
Since 02 March 2020
Date appointed to the Corporate Management: February 2013
Skills and experience
With over 40 years of diverse experience in the Bank, Mr Gunasekera has deep insights in the areas of Retail and Corporate Banking, Treasury and Money Market Operations and overseas branch operations. Having held DGM positions in Corporate Divisions and International, Treasury, Investment and Overseas Divisions, Head of Treasury position in Chennai Branch and also experience in BoC (UK) Ltd has further widened his experience.
He holds a BSc degree in Business Administration (University of Sri Jayewardenepura) and MBA (University of Southern Queensland, Australia). He has also obtained a Postgraduate Diploma in Business and Financial Administration from Institute of Chartered Accountants of Sri Lanka and has obtained training through the Management Development Programme of PIM (University of Sri Jayewardenepura). He also hold an Associate Membership of the IBSL.
Other current appointments
• Member of the Board of Lanka Securities (Private) Limited
• Member of the Special Standing Cabinet appointed Procurement Committee of the Ceylon Petroleum Corporation
Directorships in the Group Companies
Director of MSS, Ceybank Asset and LSL.
Mr W P Russel FonsekaChief Financial Officer/ Senior Deputy
General Manager (Corporate and Offshore
Banking)
Date appointed to the Corporate Management: March 2012
Skills and experience
He has served the Bank for 30 years across its local and overseas operations in various capacities including DGM-Retail Banking, International, Treasury and Investment and Corporate and Offshore Banking while specialises in financial management, budgets and strategic planning.
Mr Fonseka holds a BSc (Special) degree in Business Administration and Post Graduate Diploma in Management (PIM) from University of Sri Jayewardenepura, MBA (University of Southern Queensland, Australia) and has completed the Advanced Management Programme at the Harvard Business School, USA. He is also a fellow member of the Institute of Chartered Accountants of Sri Lanka and a Senior Fellow Member of the IBSL.
Other current appointments
• Chairman of Audit Committee at MBSL
• Chairman of Audit Committee of PDL
• Alternate Director on the Board of LankaClear (Private) Limited, as the Chairman of the Audit Committee
Directorships in the Group Companies
Director of MBSL, PDL and TLRS.
BoC UK – Bank of Ceylon (UK) Limited, PDL – Property Development PLC, HCL – Hotels Colombo (1963) Limited, MSS – BOC Management & Support Services (Private) Limited,PDML – BOC Property Development & Management (Private) Limited, Travels – BOC Travels (Private) Limited, MBSL – Merchant Bank of Sri Lanka & Finance PLC, MBSL Insurance – MBSL Insurance Company Limited, KHP – Koladeniya Hydropower (Private) Limited, HH – Ceybank Holiday Homes (Private) Limited, Ceybank Asset – Ceybank Asset Management Limited,TLRS – Transnational Lanka Records Solutions (Private) Limited, LSL – Lanka Securities (Private) Limited.

29
About this Report / Performance Highlights 2019 / Chairman’s Message / General Manager’s Review / Organisational Overview / Strategic Report / Performance and Outlook / Stakeholder Value Creation / Financial Reports / Compliance Annexes / Supplementary Information
Mr K E D SumanasiriSenior Deputy General Manager
(Human Resource)
Date appointed to the Corporate Management: April 2013
Skills and experience
He counts over 30 years’ of experience at the Bank, having held senior leadership positions in Recoveries and Human Resource management. He also has wide exposure in areas such as Retail Banking, Micro Finance, Corporate Finance and Learning and Development.
He holds a BSc (Hons.) degree in Business Administration and has completed special management course of Higher Management and Public Policy for Business Leadership and Management Development Programme for Key Management Personal offered by PIM (University of Sri Jayewardenepura). Also he has undergone a leadership training programme offered by the Harvard Business School of USA. He is also an Associate Member of the IBSL and a fellow member of the Institute of Certified Professional Managers.
Other current appointments
• An Alternate Director of the Governing Board of IBSL
Directorships in the Group Companies
Director of KHP, HH and HCL.
Ms Janaki Senanayake SiriwardaneSecretary, Bank of Ceylon/ Secretary to
the Board
Date appointed to the Corporate Management: October 2010
Skills and experience
An Attorney – at Law by profession, Ms Siriwardane has served the Bank for 24 years, with extensive experience in the Company Secretarial work and Corporate Governance.
She holds a Bachelor’s Degree in Law and MBA (Merit) from the University of Colombo. She is also a finalist in the Charted Secretaries.
Mr D N L FernandoChief Risk Officer
Date appointed to the Corporate Management: December 2015
Skills and experience
He has served the Bank for 34 years with multi-faceted experience in Retail Banking, Recoveries, Product and Development Banking and Risk Management. Among others, he also has gained extensive experience in serving overseas branches of the Bank, including being CEO in BoC (UK) Ltd.
He holds a BSc degree in Mathematics from the University of Colombo and is an Associate member of the IBSL.
Directorships in the Group Companies
Director of MBSL, Alternate Director of PDL.
Mr M M Luxaman PereraHead of Information Technology
Date appointed to the Corporate Management: August 2013
Skills and experience
An IT professional, Mr Perera holds over 34 years of experience within the Bank having led multiple digitisation and ICT projects including core-banking applications.
He holds a BSc (Hons) degree in Science, MSc in Computer Science and MBA from the University of Colombo. He also holds Fellow Membership of the Computer Society of Sri Lanka and Membership of the British Computer Society.
Other current appointments
• The Former Chairman of Bank’s CIO Forum
• Member of the FINCSIRT Steering Committee
Mr C AmarasingheDeputy General Manager (Sales and
Channel Management)
Date appointed to the Corporate Management: July 2016
Skills and experience
He counts over 30 years of experience in the Bank and has held leadership positions in Retail Banking, Sales and Channel Management and Corporate and Offshore Banking operations.
He holds a BSc (Special) degree in Public Administration and MSc in Management from the University of Sri Jayewardenepura and also holds an Associate Membership of the IBSL.
Other current appointments
• Member of the Governing Board of the IBSL
• Alternate director of CRIB
• President of the Association of Professional Bankers of Sri Lanka
Directorships in the Group Companies
Director of MBSL, Alternate Director in PDML.
Mr M J P SalgadoDeputy General Manager (Product and
Banking Development)
Date appointed to the Corporate Management: July 2016
Skills and experience
Having served the Bank for over 30 years, Mr Salgado has held senior leadership positions in Province Sales, Credit Card operations and Product and Banking Development.
BA
NK
OF
CE
YL
ON
AN
NU
AL
RE
PO
RT
20
19
30
About this Report / Performance Highlights 2019 / Chairman’s Message / General Manager’s Review / Organisational Overview / Strategic Report / Performance and Outlook / Stakeholder Value Creation / Financial Reports / Compliance Annexes / Supplementary Information
He has played a leading role in implementing digital transformation and digital adoption projects of the Bank.
He holds a B.Com (Special) degree from the University of Sri Jayewardenepura. He is also an Associate Member of the IBSL, Member of the Association of Accounting Technicians of Sri Lanka and a Licentiate Certificate Holder of the Institute of Chartered Accountants of Sri Lanka.
Other current appointments
• Director of Regional Development Bank.
Mr D M L B DassanayakeDeputy General Manager (Recovery
Provinces)
Date appointed to the Corporate Management: December 2016
Skills and experience
He counts 37 years of experience in the Bank specialising in Corporate Credit and Bank’s overseas operations specially holding key positions in Bank’s overseas branches in Malé and BoC (UK) Ltd. He has held Country Manager Position in BoC Male`. In addition, he has also held leading positions in Retail Credit and Recovery Divisions of the Bank.
He holds a BA (Economics Special) degree from the University of Peradeniya, MBA from Mahatma Gandhi University, India and a Postgraduate Diploma in Business and Financial Administration from the Institute of Chartered Accountants of Sri Lanka. He is also an Associate member of the IBSL.
Directorships in the Group Companies
Director of KHP.
Mr E M JayaratneDeputy General Manager
(Retail Banking – Range I and Range II)
Date appointed to the Corporate Management: August 2018
Skills and experience
With over 37 years of multi-faceted experience in the Bank, Mr Jayaratne’s areas of expertise include Retail and cross-border credit operations, specially holding Credit Manager position in BoC Malé Branch.
He holds a MBA from the University of Wayamba and Post Graduate Diploma in Bank Management (IBSL). Further, he also holds an Associate Membership of the IBSL.
Directorships in the Group Companies
Alternate Director of Travels.
Mr W N P SurawimalaDeputy General Manager (Recovery
Corporate)
Date appointed to the Corporate Management: August 2018
Skills and experience
He counts 28 years of service to the Bank with exposure to areas such as Retail banking, Corporate banking, Offshore banking and Recovery operations. Further, by serving in BoC Chennai branch he has gained experience in to cross-border operations of the Bank.
He holds a BSc (Special) degree in Public Administration and MSc in Management, specialising in Banking and Finance from the University of Sri Jayewardenepura. He has also completed the Management Development Programme for Key
Management Personnel from the PIM and is an Associate Member of the IBSL.
Directorships in the Group Companies
Director of TLRS.
Mr S T K HewageChief Legal Officer
Date appointed to the Corporate Management: August 2019
Skills and experience
An Attorney-at-Law, Mr Hewage counts over 34 years of experience in the Bank and has held senior legal positions in Corporate, Recovery and International and Investment Banking.
He holds a Bachelor’s Degree in Law and, is a Notary Public. He is also a member of the Bar Association of Sri Lanka and a member of the Association of Corporate Lawyers of Sri Lanka. He has significant experience in banking law especially in the areas of recovery, insurance and ICT.
Directorship in the Group of Companies
• Director of MSS and Travels
Mr A de S PinnaduwageDeputy General Manager - Compliance
Date Appointed to the Corporate Management: August 2019
Skills and experience
The Bank’s Compliance Officer since 2013, Mr Pinnaduwage has served the Bank for over 30 years in multiple capacities including Retail credit, Recoveries and Branch banking. He has also led projects in automation including leasing and regulatory systems.
Corporate Management
BoC UK – Bank of Ceylon (UK) Limited, PDL – Property Development PLC, HCL – Hotels Colombo (1963) Limited, MSS – BOC Management & Support Services (Private) Limited,PDML – BOC Property Development & Management (Private) Limited, Travels – BOC Travels (Private) Limited, MBSL – Merchant Bank of Sri Lanka & Finance PLC, MBSL Insurance – MBSL Insurance Company Limited, KHP – Koladeniya Hydropower (Private) Limited, HH – Ceybank Holiday Homes (Private) Limited, Ceybank Asset – Ceybank Asset Management Limited,TLRS – Transnational Lanka Records Solutions (Private) Limited, LSL – Lanka Securities (Private) Limited.

31
About this Report / Performance Highlights 2019 / Chairman’s Message / General Manager’s Review / Organisational Overview / Strategic Report / Performance and Outlook / Stakeholder Value Creation / Financial Reports / Compliance Annexes / Supplementary Information
He is a Graduate from the University of Ruhuna, Sri Lanka with a Bachelor of Science (Special) degree in Agriculture Science. He had been representing Corporate Management Committee as a permanent observer for last four years.
He is also a Fellow Member of the Institute of Bankers of Sri Lanka and has obtained the Postgraduate Executive Diploma in Bank Management from the same institute.
Currently he holds Head of Compliance position of the Bank and also oversees compliance framework of all its subsidiaries and permanent invitee of the Board Integrated Risk Management Committee for last five years.
Dr. Indunil LiyanageChief Marketing Officer
Date appointed to the Corporate Management: September 2012
Skills and experience
A marketing professional, Chartered Marketer, Dr. Liyanage holds over 30 years of marketing experience and he is professionally and academically qualified in three different disciplines namely Marketing, Management and Finance. He has experience in the field of Marketing in Financial Services, Fast Moving Consumer Goods (FMCG), electronic and agriculture industries.
He holds a PhD from the University of Colombo, MSc in Management from the University of Sri Jayawardenepura and PG. Dip. In Marketing from the Chartered Institute of Marketing (UK). He is also a Chartered Marketer CIM (UK). He holds Fellow Memberships in Chartered Institute of Marketing (UK) (FCIM) and Sri Lanka Institute of Marketing (FSLIM).
Dr. Liyanage was awarded with the prestigious National APEX Award 2016 (Pinnacle Award 2016) for Marketing by the Organisation of Professional Associations of Sri Lanka (OPA).
He was also honoured in the “Most Influential Marketing Leaders Listing” at the World Marketing Congress 2015 in Mumbai, India and also honoured with the “50 Most Talented CMOs Award” at the Golden Globe Tiger Awards 2013, World Marketing Summit held in Malaysia.
Mr P M LiyanageChief Internal Auditor
Date appointed to the Corporate Management: December 2014
Skills and experience
A finance professional with over 20 years of post-qualified experience, prior to join the Bank he has served in several other Banks and Financial institutes in similar capacities.
He holds a BSc (Special) degree in Accountancy and Finance from the University of Sri Jayewardenepura and is also a Fellow member of the Institute of Chartered Accountants of Sri Lanka and a Member of Certified Information Systems Auditors (CISA) of ISACA – USA.
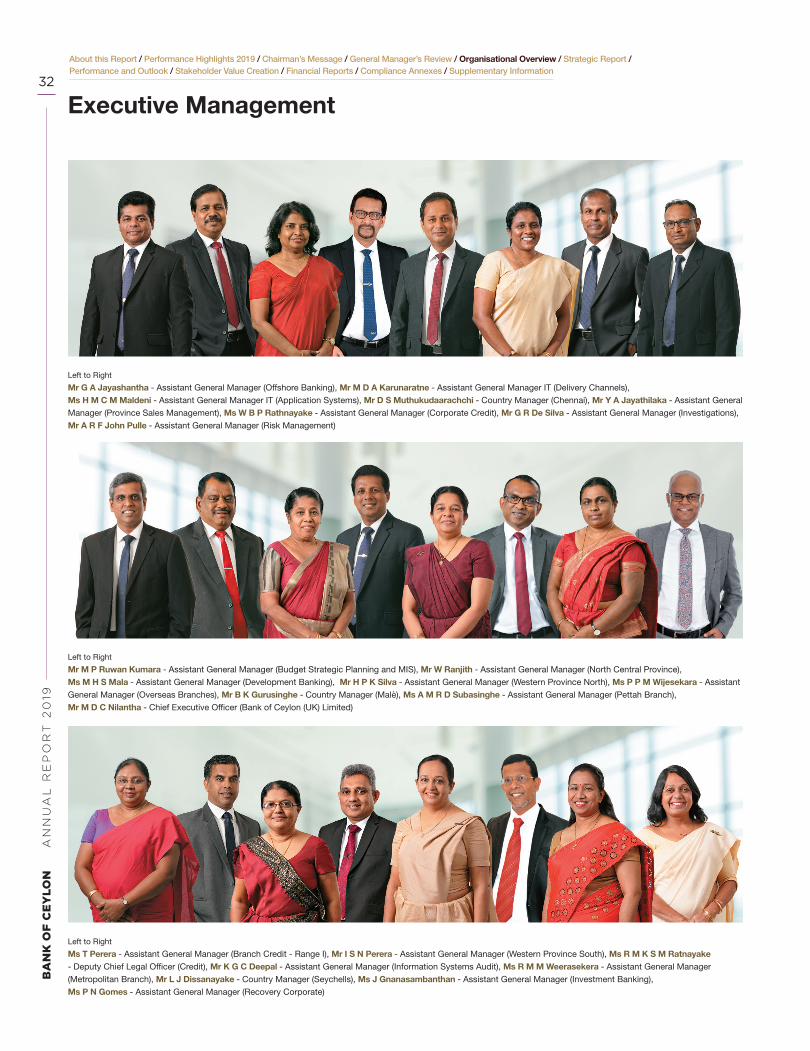
BA
NK
OF
CE
YL
ON
AN
NU
AL
RE
PO
RT
20
19
32
About this Report / Performance Highlights 2019 / Chairman’s Message / General Manager’s Review / Organisational Overview / Strategic Report / Performance and Outlook / Stakeholder Value Creation / Financial Reports / Compliance Annexes / Supplementary Information
Executive Management
Left to Right
Mr G A Jayashantha - Assistant General Manager (Offshore Banking), Mr M D A Karunaratne - Assistant General Manager IT (Delivery Channels),
Ms H M C M Maldeni - Assistant General Manager IT (Application Systems), Mr D S Muthukudaarachchi - Country Manager (Chennai), Mr Y A Jayathilaka - Assistant General
Manager (Province Sales Management), Ms W B P Rathnayake - Assistant General Manager (Corporate Credit), Mr G R De Silva - Assistant General Manager (Investigations),
Mr A R F John Pulle - Assistant General Manager (Risk Management)
Left to Right
Mr M P Ruwan Kumara - Assistant General Manager (Budget Strategic Planning and MIS), Mr W Ranjith - Assistant General Manager (North Central Province),
Ms M H S Mala - Assistant General Manager (Development Banking), Mr H P K Silva - Assistant General Manager (Western Province North), Ms P P M Wijesekara - Assistant
General Manager (Overseas Branches), Mr B K Gurusinghe - Country Manager (Malè), Ms A M R D Subasinghe - Assistant General Manager (Pettah Branch),
Mr M D C Nilantha - Chief Executive Officer (Bank of Ceylon (UK) Limited)
Left to Right
Ms T Perera - Assistant General Manager (Branch Credit - Range I), Mr I S N Perera - Assistant General Manager (Western Province South), Ms R M K S M Ratnayake - Deputy Chief Legal Officer (Credit), Mr K G C Deepal - Assistant General Manager (Information Systems Audit), Ms R M M Weerasekera - Assistant General Manager
(Metropolitan Branch), Mr L J Dissanayake - Country Manager (Seychells), Ms J Gnanasambanthan - Assistant General Manager (Investment Banking),
Ms P N Gomes - Assistant General Manager (Recovery Corporate)
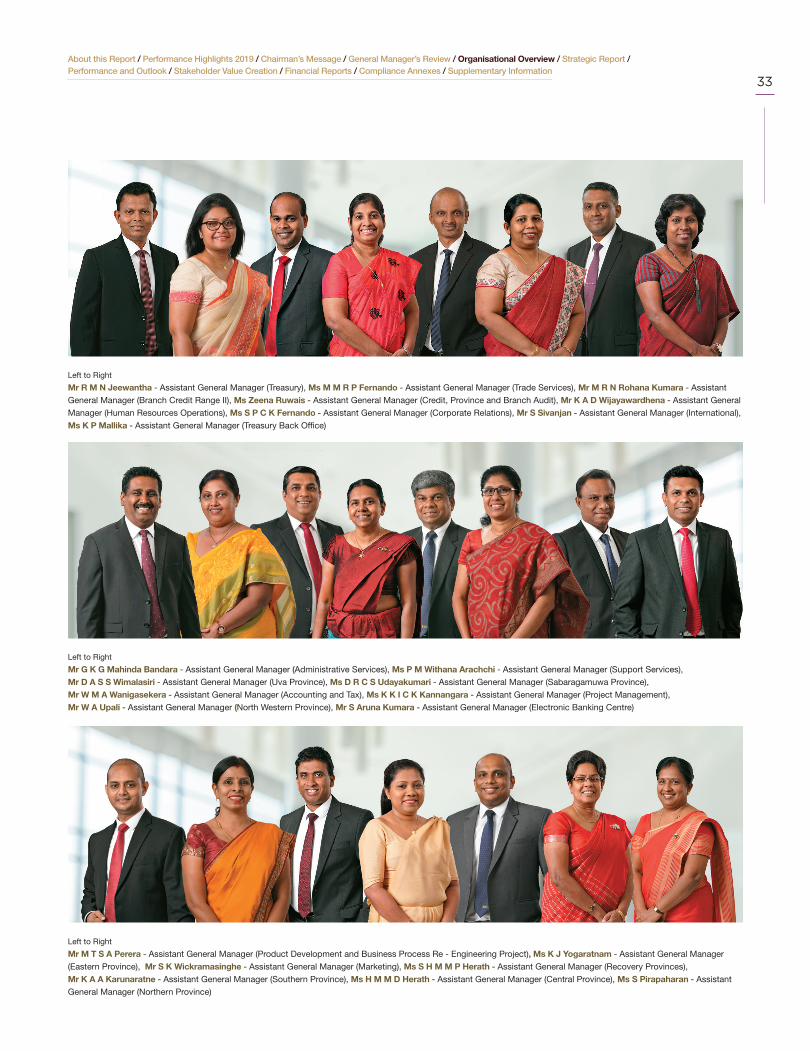
About this Report / Performance Highlights 2019 / Chairman’s Message / General Manager’s Review / Organisational Overview / Strategic Report / Performance and Outlook / Stakeholder Value Creation / Financial Reports / Compliance Annexes / Supplementary Information
33
Left to Right
Mr R M N Jeewantha - Assistant General Manager (Treasury), Ms M M R P Fernando - Assistant General Manager (Trade Services), Mr M R N Rohana Kumara - Assistant
General Manager (Branch Credit Range II), Ms Zeena Ruwais - Assistant General Manager (Credit, Province and Branch Audit), Mr K A D Wijayawardhena - Assistant General
Manager (Human Resources Operations), Ms S P C K Fernando - Assistant General Manager (Corporate Relations), Mr S Sivanjan - Assistant General Manager (International),
Ms K P Mallika - Assistant General Manager (Treasury Back Office)
Left to Right
Mr G K G Mahinda Bandara - Assistant General Manager (Administrative Services), Ms P M Withana Arachchi - Assistant General Manager (Support Services),
Mr D A S S Wimalasiri - Assistant General Manager (Uva Province), Ms D R C S Udayakumari - Assistant General Manager (Sabaragamuwa Province), Mr W M A Wanigasekera - Assistant General Manager (Accounting and Tax), Ms K K I C K Kannangara - Assistant General Manager (Project Management),
Mr W A Upali - Assistant General Manager (North Western Province), Mr S Aruna Kumara - Assistant General Manager (Electronic Banking Centre)
Left to Right
Mr M T S A Perera - Assistant General Manager (Product Development and Business Process Re - Engineering Project), Ms K J Yogaratnam - Assistant General Manager
(Eastern Province), Mr S K Wickramasinghe - Assistant General Manager (Marketing), Ms S H M M P Herath - Assistant General Manager (Recovery Provinces),
Mr K A A Karunaratne - Assistant General Manager (Southern Province), Ms H M M D Herath - Assistant General Manager (Central Province), Ms S Pirapaharan - Assistant
General Manager (Northern Province)

BA
NK
OF
CE
YL
ON
AN
NU
AL
RE
PO
RT
20
19
34
About this Report / Performance Highlights 2019 / Chairman’s Message / General Manager’s Review / Organisational Overview / Strategic Report / Performance and Outlook / Stakeholder Value Creation / Financial Reports / Compliance Annexes / Supplementary Information
Value Creation Model
BoC’s ValueCreation ProcessThe Bank’s key role is financial intermediation through which it bridges the funding requirements of individuals and businesses with depositors/ funding providers who have excess funds for investment. The Bank creates value on both sides of the balance sheet, through offering attractive investment returns to fund providers while disbursing funding to borrowers at affordable interest rates. This value creation process is powered by a team of 8,503 employees who serve across the Bank’s extensive network of 581 Branches. Customer relationships are facilitated through both brick and mortar contact points and digital and virtual platforms. The Bank is also reliant on the relationships it has nurtured with its business partners, its organisational tacit knowledge, brand strength and natural resources to drive its value creation in a commercially, economically socially and environmentally sustainable manner.
Our
Res
our
ces
Operating Environment (page 39)
FinancialCapital
ManufacturedCapital
HumanCapital
NaturalCapital
Social andRelationshipCapital
IntellectualCapital
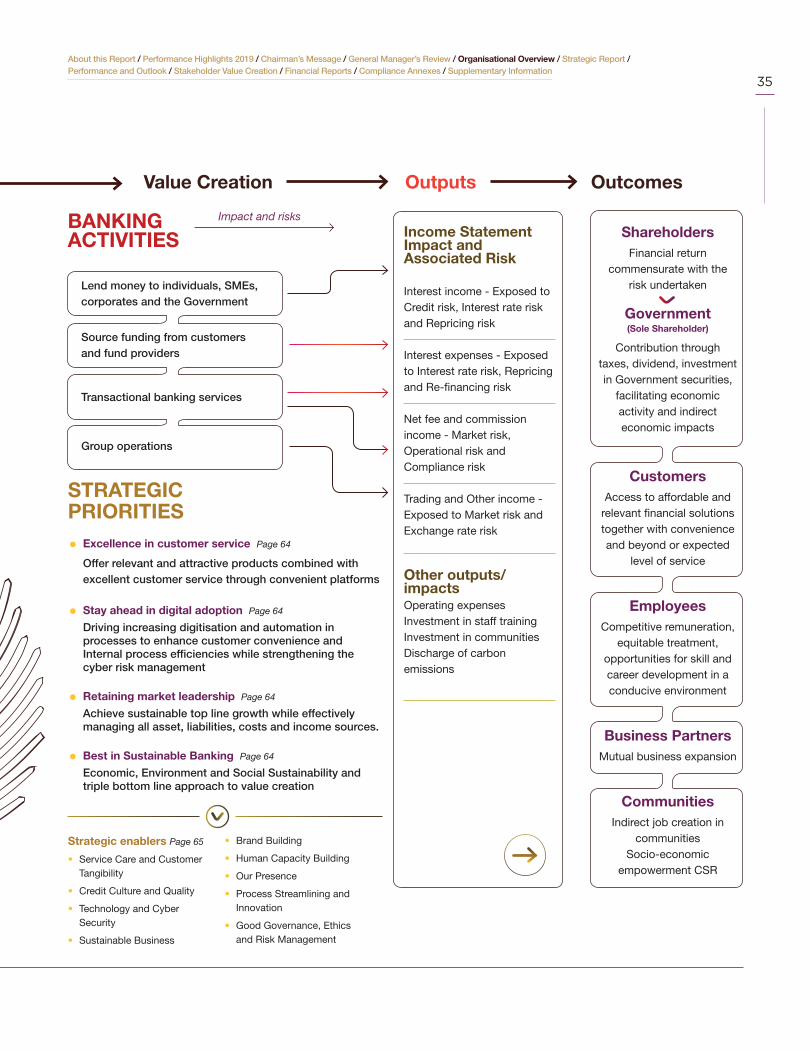
About this Report / Performance Highlights 2019 / Chairman’s Message / General Manager’s Review / Organisational Overview / Strategic Report / Performance and Outlook / Stakeholder Value Creation / Financial Reports / Compliance Annexes / Supplementary Information
35
Value Creation
BANKINGACTIVITIES
Impact and risks
Lend money to individuals, SMEs, corporates and the Government
Source funding from customers and fund providers
Transactional banking services
Group operations
STRATEGIC PRIORITIES Excellence in customer service Page 64
Offer relevant and attractive products combined with excellent customer service through convenient platforms
Stay ahead in digital adoption Page 64
Driving increasing digitisation and automation in processes to enhance customer convenience and Internal process efficiencies while strengthening the cyber risk management
Retaining market leadership Page 64
Achieve sustainable top line growth while effectively managing all asset, liabilities, costs and income sources.
Best in Sustainable Banking Page 64
Economic, Environment and Social Sustainability and triple bottom line approach to value creation
Outputs Outcomes
Income Statement Impact and Associated Risk
Interest income - Exposed to Credit risk, Interest rate risk and Repricing risk
Interest expenses - Exposed to Interest rate risk, Repricing and Re-financing risk
Net fee and commission income - Market risk, Operational risk and Compliance risk
Trading and Other income - Exposed to Market risk and Exchange rate risk
Other outputs/impactsOperating expensesInvestment in staff trainingInvestment in communitiesDischarge of carbon emissions
ShareholdersFinancial return
commensurate with the risk undertaken
Government(Sole Shareholder)
Contribution through taxes, dividend, investment in Government securities,
facilitating economic activity and indirect economic impacts
CustomersAccess to affordable and
relevant financial solutions together with convenience and beyond or expected
level of service
EmployeesCompetitive remuneration,
equitable treatment, opportunities for skill and career development in a conducive environment
Business PartnersMutual business expansion
CommunitiesIndirect job creation in
communities Socio-economic
empowerment CSR
Strategic enablers Page 65
• Service Care and Customer Tangibility
• Credit Culture and Quality
• Technology and Cyber Security
• Sustainable Business
• Brand Building
• Human Capacity Building
• Our Presence
• Process Streamlining and Innovation
• Good Governance, Ethics and Risk Management

BA
NK
OF
CE
YL
ON
AN
NU
AL
RE
PO
RT
20
19
36
About this Report / Performance Highlights 2019 / Chairman’s Message / General Manager’s Review / Organisational Overview / Strategic Report / Performance and Outlook / Stakeholder Value Creation / Financial Reports / Compliance Annexes / Supplementary Information
Capitals ScorecardThe Bank utilises resources (defined as ‘capitals’ in the IR Framework) which are enhanced and nurtured to generate stakeholder value. The following Capitals Scorecard provides a high-level overview of how the Bank utilised and enhanced its capital during the year.
Resource/ Capitals Indicator 2019 2018 Initiatives drive value creation in 2019
Financial Capital
A strong funding base and diverse funding profile which allows the Bank to drive its strategic aspirations
Interest income as a percentage of total income
92% 88% New bilateral relationships
Special deposit campaigns
Strengthened recovery mechanisms to preserve portfolio quality
(Page 121)
Customer deposits LKR 2,005.2 billion LKR 1,771.0 billion
Borrowings LKR 226.2 billion LKR 350.0 billion
Manufactured Capital
Physical infrastructure which facilitate our island-wide customer reach and digital and virtual infrastructure which drives customer convenience, agility and process efficiency in addition to wider reach
Property, plant and equipment
LKR 25.6 billion LKR 24.2 billion Review of Dividend policy
Process automation and digital initiatives aligned to CBSL’s Digital Road Map
Standardising customer experience across branch network
Expansion of CRM network
(Page 95)
Investment on Digital infrastructure
LKR 1,697.9 million LKR 1,963.5 million
Branches and Limited Service Branches
643 629
ATM/ CRMs 1,033 894
CDMs 164 163
Smart Zones 351 284
Branch on wheels 11 6
Human Capital
Our diverse and engaged workforce facilitate our customer experience and allow us to respond rapidly to industry dynamics
No. of employees 8,503 8,724 Ongoing investment in training and development with focus on driving attitudinal change
Promote better work-life balance across the organisation
(Page 90)
Retention rate 99% 98%
Investment on training per employee
LKR 27,437.4 LKR 39,591.9
Promotions during the year 821 174
Value distributed to employees
LKR 18,365.0 million LKR 17.351.5 million
Intellectual Capital
In addition to our brand and tacit knowledge, this includes our drive for digital transformation and capacity for innovation
Brand value LKR 51.8 billion LKR 42.9 billion Concerted efforts to strengthen brand across all segments and ensuring brand consistency across all platforms
Process automation and digital onboarding of customers
Piloted paperless banking in four branches
(Page 87 and 97)
Cumulative service experience
78,132 81,2678
Digitally active customers 6.8 million 4.5 million
Social and Relationship Capital
The relationships we have nurtured with our customers, business partners and communities we operate in
Customers 13.7 million 13.4 million Increased engagement with customers across segments
Developments of new products catering to women and tech savvy youth
Pursued increased penetration across the younger demographics
Launch of InnovBank an international symposium to drive stakeholder collaboration on driving digital revolution in the banking industry
CSR initiates on improving health and wellbeing of customers and promoting education among children
(Page 68 and 78)
Business partners 7,177 9,722
Financial literacy programmes conducted for customers
196 113
Payments to suppliers LKR 10,774.7 million LKR 9,704.2 million
Investment in CSR LKR 67.9 million LKR 108.0 million
No. of Correspondent relationships
675 857
Natural Capital
We impact the environment through the natural resources we consume and the outputs we generate such as waste and emissions
Renewable energy generated
2,369,762 Kwh 885,238 Kwh Community engagement initiatives focusing on environmental conservation
Ongoing efforts to enhance energy efficiency and drive reductions in carbon footprint
(Page 78)
Carbon emissions 17,194 Tons CO2eqv. 13,256 Tons CO2eqv.
No. of solar powered branches
41 27

About this Report / Performance Highlights 2019 / Chairman’s Message / General Manager’s Review / Organisational Overview / Strategic Report / Performance and Outlook / Stakeholder Value Creation / Financial Reports / Compliance Annexes / Supplementary Information
37
Value Added StatementAn analysis of the Bank's value creation and allocation among the key stakeholders is depicted below.
2019 2018 Change
LKR millon LKR millon %
Value Added
Income earned by providing banking services 235,632 217,805 8
Cost of services (139,721) (125,649) 11
Value added by banking services 95,911 92,156 4
Non - Banking Income 3,485 3,216 8
Impairment charges for loans and other losses (18,598) (15,041) 24
Value Addition 80,798 80,331 1
Value Allocation
To Employees
Salaries, wages and other benefits 18,365 17,352 6
To Government
Dividends paid to Government of Sri Lanka 346 4,846 (93)
Income tax 7,277 9,724 (25)
Taxes on financial services 10,521 9,588 10
18,144 24,158 (25)
To Community
Social responsibility projects 68 108 (37)
To Providers of External Funds
Interest on other borrowings 12,341 12,512 (1)
Interest on debt issued 6,114 5,154 19
18,455 17,666 4
To Expansion and Growth
Retained profit 22,752 16,157 41
Depreciation and amortisation 3,704 2,200 68
Deferred taxation (690) 2,690 (126)
25,766 21,047 22
80,798 80,331 1
Economic Value Added (EVA)Economic Value Added (EVA) indicates the true economic profit of a company. EVA is an estimate of the amount by which earnings exceed or fall short of required minimum return for shareholders at comparable risks. EVA of the Bank stood at 19,873 million as of 31 December 2019
against 17,510 million in 2018.
2019 2018 Change
LKR millon LKR millon %
Invested Capital
Average Shareholders' funds 137,226 121,662 13
Add: Cumulative provision for loan losses 98,956 81,427 22
236,182 203,089 16
Return on Invested Capital
Profit after taxation as reported 23,098 21,003 10
Add: Provision for loan losses 18,598 15,041 24
Less: Loans written off (94) (32) 194
Total return on invested capital 41,602 36,012 16
Opportunity cost of invested Capital* (21,729) (18,501) 17
Economic Value Added 19,873 17,510 13
* Weighted average 12 months Treasury bill rate 9.20% 9.11%
*Calculated based on weighted average 12 months Treasury bill rate 2019 - 9.20% (2018 - 9.11%)

BA
NK
OF
CE
YL
ON
AN
NU
AL
RE
PO
RT
20
19
38
About this Report / Performance Highlights 2019 / Chairman’s Message / General Manager’s Review / Organisational Overview / Strategic Report / Performance and Outlook / Stakeholder Value Creation / Financial Reports / Compliance Annexes / Supplementary Information
Our TeamThe BoC team of 8,503 engaged employees remains key to our success as they play a vital role in facilitating the customer experience, are ambassadors of our brand and drive our strategic aspirations. We
Gender Diversity
We are focused on enhancing gender diversity through creating a workplace and culture that understands, supports and empowers women
Multi-Generational Workforce
The Bank employs a multi-generational workforce demonstrating its attractiveness as an employer across generations.
Employee Reach
Our employees are spread across all nine provinces of Sri Lanka and in 13 overseas countries.
Employees by Age
Less than 35 35 - 55 Above 55
30%
65%
2019
5%
26%
6%
68%
2018
Location Permanent ContractWestern 3,732 73Southern 738 19Sabaragamuwa 558 11Uva 464 4North Western 700 8Central 724 18North Central 586 9Eastern 467 7Northern 534 7
100% Senior management hired from local communities
41 Deployed in overseas locations
17 No. of differently abled employees
Skill Base
78,132Collective experience of employees (in years)
Employees by Tenure
13%
61%2019
26%
26%14%
60%
2018
Less than 5 years 5 to 15 More than 15
Permanent2019 2018 2019 2018 2019 2018
Outsourced Contracted
0
2,000
4,000
6,000
8,000
10,000
Employment by Contract and Gender
MaleFemale
5,14
2
5,25
7
3,36
1
3,46
7 1,34
456
1,35
642
154
2
152
152
aspire to create an inclusive and conducive environment in which employees can thrive, attested by relatively low attrition rates and high satisfaction levels. Given the diversity of our extensive customer base,
we understand the importance of building a similarly diverse team which is able to understand and effectively respond to varied customer needs. The Bank does not engage employees on a part-time basis.
Employees by Type and Gender
Cor
por
ate
Man
agem
ent
Exe
cutiv
e M
anag
emen
t
Chi
ef M
anag
er
Sen
ior
Man
ager
Br.
Man
ager
and
A
sst.
Man
ager
s
Man
agem
ent
trai
nees
and
oth
er
Offi
cer
grad
es
Sta
ff as
sist
ants
an
d A
llied
gra
des
Offi
ce A
ssis
tant
s an
d A
llied
Gra
des
2019
2018
2019
2018
2019
2018
2019
2018
2019
2018
2019
2018
2019
2018
2019
2018
Male 13 12 26 29 40 56 94 90 455 409 847 929 1,471 1,520 415 422
Female 1 3 21 17 38 43 119 86 658 658 1,790 1,853 2,499 2,581 16 16
Employees by Type and Age
Cor
por
ate
Man
agem
ent
Exe
cutiv
e M
anag
emen
t
Chi
ef M
anag
er
Sen
ior
Man
ager
Br.
Man
ager
and
A
sst.
Man
ager
s
Man
agem
ent
trai
nees
and
oth
er
Offi
cer
grad
es
Sta
ff as
sist
ants
an
d A
llied
gra
des
Offi
ce A
ssis
tant
s an
d A
llied
Gra
des
2019
2018
2019
2018
2019
2018
2019
2018
2019
2018
2019
2018
2019
2018
2019
2018
Less than 35 0 0 0 0 0 0 0 0 124 175 1,691 1,940 3,584 3,697 126 133
35-55 1 2 35 26 56 69 183 140 901 746 843 705 299 309 271 273
Above 55 13 13 12 20 22 30 30 36 88 146 103 132 87 100 34 32

About this Report / Performance Highlights 2019 / Chairman’s Message / General Manager’s Review / Organisational Overview / Strategic Report / Performance and Outlook / Stakeholder Value Creation / Financial Reports / Compliance Annexes / Supplementary Information
39
Operating Landscape andRisk Return Dynamics Operating Landscape Opportunities and RisksThe material topics listed on page 42 present both opportunities and risks for the Bank’s value creation. Key exposures and what the Bank is doing to effectively address these risks and/ or capitalise on the presented opportunities are summarised in the table below;
Material topics related - recent developments
Opportunitiespresented
Potentialrisks
How we areresponding
Macro-economic and policy trends
Sri Lanka’s economic growth moderated in 2019 following the Easter Attacks and a relatively tight monetary and fiscal stance adopted by the Government. Sweeping tax concessions and relaxation of the monetary policy by the new Government is likely to result in a revival of the economy in 2020. Key policy developments which could directly impact the banking sector include,
• Moratorium and relief package granted to SMEs
• Concessions to chosen industry sectors
• Tax concessions offered to the businesses and individuals
Refer page 117for further information
Expected revival of credit demand, particularly in the SME sector
More connectivity with international investors for foreign inflows
Potential short-term impact on cash flows arising from moratorium
Fiscal slippage due to upcoming general elections
As a state-owned, Systemically Important Bank we are committed to supporting the National development agenda and will continue to fulfil the funding requirements of the country’s SME sector, while taking advantage of the retained cash of the businesses to drive them more towards new investments and to boost the economy and the business
Strategic enabler, Sustainable Business and Credit Culture and Quality have specific actions to grab the opportunities arising and to mitigate the associate risks from these developments
Refer pages 71 and 78for further information
Talent management and labour relations
Attracting and retaining the right talent is increasingly challenging given different expectations and career ambitions of the younger workforce. Increasing thrust towards digitisation has also led to a change in the skill composition required, with intense demand for talent in IT and data analytics among others
Attracting younger talent to drive the Bank’s growth and digital aspirations
Building an agile and highly skilled workforce
Increased labour costs due to the need for specialised skills
Labour turnover, particularly among the younger demographic
Concerted efforts to enhance technical skills, drive attitudinal changes and driving congruence among our multi-generational employee categories. Human Capacity Building is the key Strategic enabler supporting the Bank towards these efforts
Refer page 90for further information
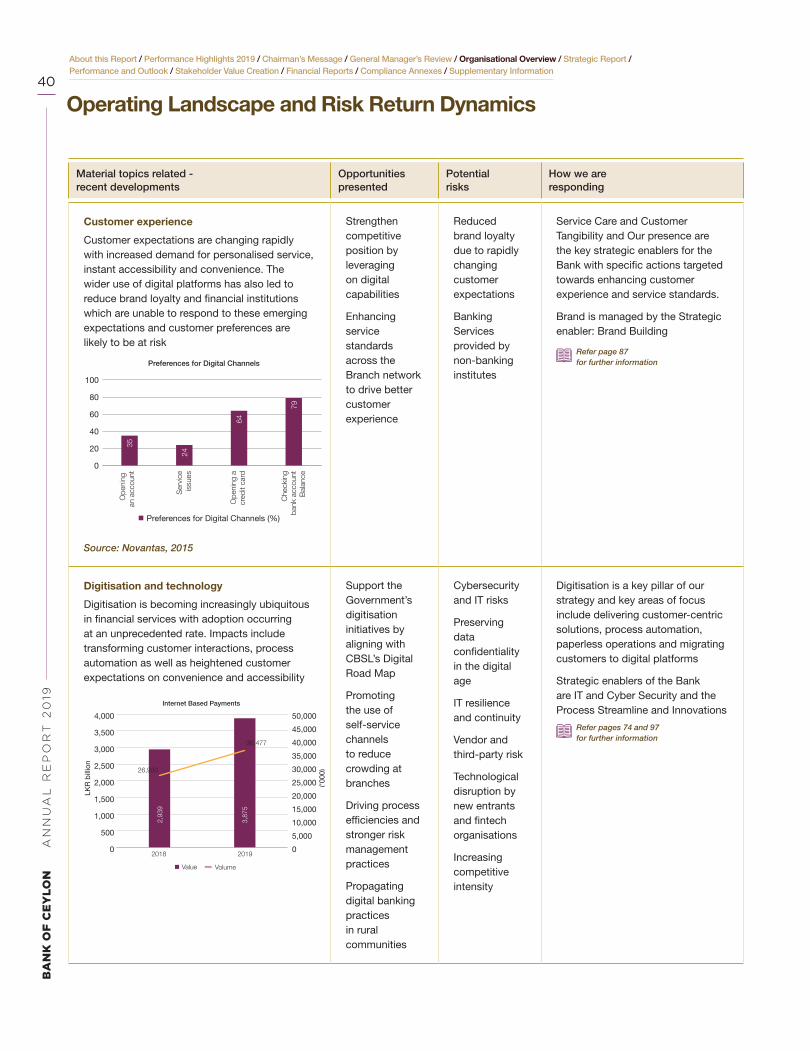
BA
NK
OF
CE
YL
ON
AN
NU
AL
RE
PO
RT
20
19
40
About this Report / Performance Highlights 2019 / Chairman’s Message / General Manager’s Review / Organisational Overview / Strategic Report / Performance and Outlook / Stakeholder Value Creation / Financial Reports / Compliance Annexes / Supplementary Information
Material topics related - recent developments
Opportunitiespresented
Potentialrisks
How we areresponding
Customer experience
Customer expectations are changing rapidly with increased demand for personalised service, instant accessibility and convenience. The wider use of digital platforms has also led to reduce brand loyalty and financial institutions which are unable to respond to these emerging expectations and customer preferences are likely to be at risk
Ope
ning
an
acc
ount
Ser
vice
issu
es
Ope
ning
acr
edit
card
Che
ckin
gba
nk a
ccou
ntB
alan
ce
0
20
40
60
80
100
Preferences for Digital Channels
35
64
79
24
Preferences for Digital Channels (%)
Source: Novantas, 2015
Strengthen competitive position by leveraging on digital capabilities
Enhancing service standards across the Branch network to drive better customer experience
Reduced brand loyalty due to rapidly changing customer expectations
Banking Services provided by non-banking institutes
Service Care and Customer Tangibility and Our presence are the key strategic enablers for the Bank with specific actions targeted towards enhancing customer experience and service standards.
Brand is managed by the Strategic enabler: Brand Building
Refer page 87for further information
Digitisation and technology
Digitisation is becoming increasingly ubiquitous in financial services with adoption occurring at an unprecedented rate. Impacts include transforming customer interactions, process automation as well as heightened customer expectations on convenience and accessibility
0
500
1,000
1,500
2,000
2,500
3,000
3,500
4,000
0
5,000
10,000
15,000
20,000
25,000
30,000
35,000
40,000
45,000
50,000
Internet Based Payments
2018 2019
Value Volume
3,87
5
2,93
9
26,930
36,477
LKR
bill
ion
(‘000
)
Support the Government’s digitisation initiatives by aligning with CBSL’s Digital Road Map
Promoting the use of self-service channels to reduce crowding at branches
Driving process efficiencies and stronger risk management practices
Propagating digital banking practices in rural communities
Cybersecurity and IT risks
Preserving data confidentiality in the digital age
IT resilience and continuity
Vendor and third-party risk
Technological disruption by new entrants and fintech organisations
Increasing competitive intensity
Digitisation is a key pillar of our strategy and key areas of focus include delivering customer-centric solutions, process automation, paperless operations and migrating customers to digital platforms
Strategic enablers of the Bank are IT and Cyber Security and the Process Streamline and Innovations
Refer pages 74 and 97for further information
Operating Landscape and Risk Return Dynamics
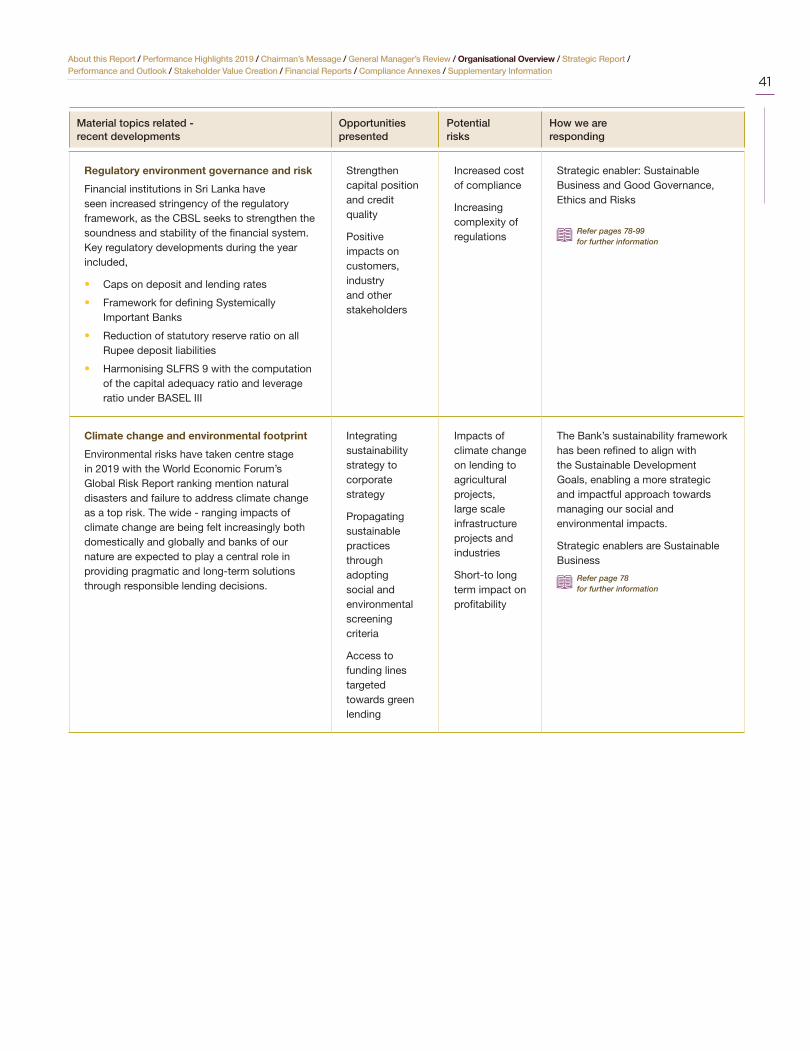
About this Report / Performance Highlights 2019 / Chairman’s Message / General Manager’s Review / Organisational Overview / Strategic Report / Performance and Outlook / Stakeholder Value Creation / Financial Reports / Compliance Annexes / Supplementary Information
41
Material topics related - recent developments
Opportunitiespresented
Potentialrisks
How we areresponding
Regulatory environment governance and risk
Financial institutions in Sri Lanka have seen increased stringency of the regulatory framework, as the CBSL seeks to strengthen the soundness and stability of the financial system. Key regulatory developments during the year included,
• Caps on deposit and lending rates
• Framework for defining Systemically Important Banks
• Reduction of statutory reserve ratio on all Rupee deposit liabilities
• Harmonising SLFRS 9 with the computation of the capital adequacy ratio and leverage ratio under BASEL III
Strengthen capital position and credit quality
Positive impacts on customers, industry and other stakeholders
Increased cost of compliance
Increasing complexity of regulations
Strategic enabler: Sustainable Business and Good Governance, Ethics and Risks
Refer pages 78-99for further information
Climate change and environmental footprint
Environmental risks have taken centre stage in 2019 with the World Economic Forum’s Global Risk Report ranking mention natural disasters and failure to address climate change as a top risk. The wide - ranging impacts of climate change are being felt increasingly both domestically and globally and banks of our nature are expected to play a central role in providing pragmatic and long-term solutions through responsible lending decisions.
Integrating sustainability strategy to corporate strategy
Propagating sustainable practices through adopting social and environmental screening criteria
Access to funding lines targeted towards green lending
Impacts of climate change on lending to agricultural projects, large scale infrastructure projects and industries
Short-to long term impact on profitability
The Bank’s sustainability framework has been refined to align with the Sustainable Development Goals, enabling a more strategic and impactful approach towards managing our social and environmental impacts.
Strategic enablers are Sustainable Business
Refer page 78for further information
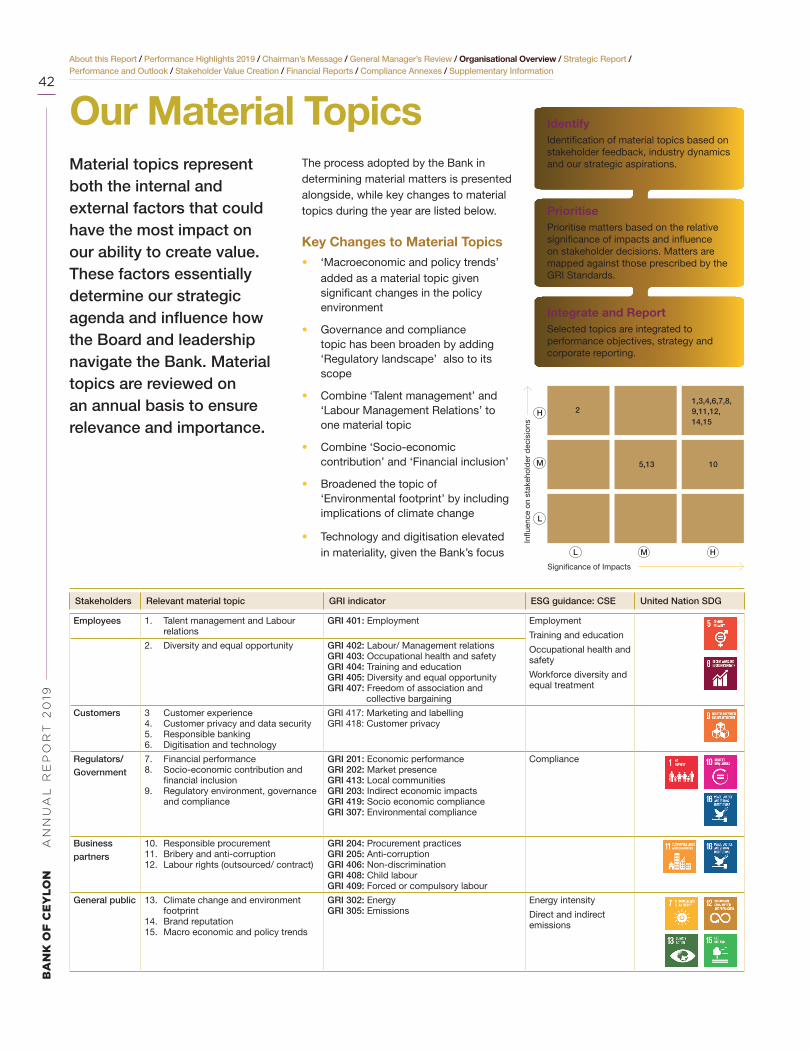
BA
NK
OF
CE
YL
ON
AN
NU
AL
RE
PO
RT
20
19
42
About this Report / Performance Highlights 2019 / Chairman’s Message / General Manager’s Review / Organisational Overview / Strategic Report / Performance and Outlook / Stakeholder Value Creation / Financial Reports / Compliance Annexes / Supplementary Information
Material topics represent both the internal and external factors that could have the most impact on our ability to create value. These factors essentially determine our strategic agenda and influence how the Board and leadership navigate the Bank. Material topics are reviewed on an annual basis to ensure relevance and importance.
Our Material Topics IdentifyIdentification of material topics based on stakeholder feedback, industry dynamics and our strategic aspirations.
PrioritisePrioritise matters based on the relative significance of impacts and influence on stakeholder decisions. Matters are mapped against those prescribed by the GRI Standards.
Integrate and ReportSelected topics are integrated to performance objectives, strategy and corporate reporting.
Influ
ence
on
stak
ehol
der
dec
isio
ns
Significance of Impacts
21,3,4,6,7,8,9,11,12,14,15
105,13
L
L
M
M
H
H
The process adopted by the Bank in determining material matters is presented alongside, while key changes to material topics during the year are listed below.
Key Changes to Material Topics• ‘Macroeconomic and policy trends’
added as a material topic given significant changes in the policy environment
• Governance and compliance topic has been broaden by adding ‘Regulatory landscape’ also to its scope
• Combine ‘Talent management’ and ‘Labour Management Relations’ to one material topic
• Combine ‘Socio-economic contribution’ and ‘Financial inclusion’
• Broadened the topic of ‘Environmental footprint’ by including implications of climate change
• Technology and digitisation elevated in materiality, given the Bank’s focus
Stakeholders Relevant material topic GRI indicator ESG guidance: CSE United Nation SDG
Employees 1. Talent management and Labour relations
GRI 401: Employment Employment
Training and education
Occupational health and safety
Workforce diversity and equal treatment
2. Diversity and equal opportunity GRI 402: Labour/ Management relationsGRI 403: Occupational health and safetyGRI 404: Training and educationGRI 405: Diversity and equal opportunityGRI 407: Freedom of association and collective bargaining
Customers 3 Customer experience4. Customer privacy and data security5. Responsible banking 6. Digitisation and technology
GRI 417: Marketing and labellingGRI 418: Customer privacy
Regulators/ Government
7. Financial performance8. Socio-economic contribution and
financial inclusion9. Regulatory environment, governance
and compliance
GRI 201: Economic performanceGRI 202: Market presenceGRI 413: Local communitiesGRI 203: Indirect economic impactsGRI 419: Socio economic complianceGRI 307: Environmental compliance
Compliance
Business partners
10. Responsible procurement11. Bribery and anti-corruption12. Labour rights (outsourced/ contract)
GRI 204: Procurement practicesGRI 205: Anti-corruptionGRI 406: Non-discriminationGRI 408: Child labourGRI 409: Forced or compulsory labour
General public 13. Climate change and environment footprint
14. Brand reputation15. Macro economic and policy trends
GRI 302: EnergyGRI 305: Emissions
Energy intensity
Direct and indirect emissions

About this Report / Performance Highlights 2019 / Chairman’s Message / General Manager’s Review / Organisational Overview / Strategic Report / Performance and Outlook / Stakeholder Value Creation / Financial Reports / Compliance Annexes / Supplementary Information
43
Material Topics and Topic Boundaries
Material topic and why it is material to BoC
Changes in materiality compared to 2018
Topic boundary and any changes in boundary
1. Talent management and labour relations
As an organisation operating in a service industry, employees are critical to all aspects of our operations. With 99% of our employees represented by one of the seven unions, maintaining cordial labour management relations is critical to the smooth continuity of our operations. With the ever evolving technological disruptions, re-skilling and up-skilling have formed a vital role in talent management
No change Relates to the Bank’s permanent employees in Sri Lanka and overseas
2. Diversity and equal opportunity
We understand the importance of nurturing a diverse workforce in which each employee has an equal opportunity for fair remuneration and career progression.
No change Relates to the Bank’s permanent employees in Sri Lanka and overseas
3. Customer experience
Given intensifying competition and increasingly sophisticated needs of customers, offering a unique customer experience is a source of competitive edge.
No change Relates to the Bank’s customers
4. Customer privacy and data security
As a financial institution we have access to confidential customer information and are committed to protecting the privacy of such information.
No change Relates to the Bank’s customers and other critical data and confidential information relates to the Bank
5. Responsible banking
As a state-owned entity and Sri Lanka’s largest bank we are committed to promoting responsible banking practices and preserving public interest.
No change Relates to the Bank’s lending practices and marketing communications.
6. Digtisation and technology
Advancements in digital technology have presented numerous opportunities for enhancing the customer experience, improving process efficiencies and strengthening risk management.
Elevated in materiality Relates to the use of technology within the Bank
7. Financial performance
Healthy financial performance is a prerequisite to generating sustainable shareholder returns and creating shared value among our stakeholders.
No change Relates to the Group’s consolidated performance
8. Socio-economic contribution and financial inclusion
BoC’s role extends beyond that of financial intermediation and profit generation and we are committed to partnering national economic development agenda and driving financial inclusion across the country.
No change Relates to the Bank’s value creation to external stakeholders including communities and customers.
9. Regulatory environment, governance and compliance
A strong governance and compliance culture underpin the sustainable creation of value, protecting against potential financial and reputational losses.
Broadened to include regulatory environment
The Bank’s regulatory environment, governance and compliance practices.
10. Responsible procurement
The Bank seeks to nurture mutually rewarding supplier relationships through responsible procurement practices.
No change Topic boundary extends to the Bank’s supply chain and other business partners.
11. Bribery and anti-corruption
As a state-owned entity, nurturing a culture of anti-bribery and anti-corruption is vital in the responsible creation of shared value.
No change Relates to the Bank’s dealings with third-parties.
12. Labour rights (outsourced/ contract)
BoC currently utilises the services of over 1,500 outsourced and contract employees and we are committed to preserving the dignity of their labour and proving a conducive work environment.
No change Relates to the Bank’s outsourced and contract employees
13. Climate change and environmental footprint
As a responsible corporate citizen, we are cognisant of the environmental impacts of our operations and are committed to reducing our environmental footprint.
Broadened in scope to include implications of climate change
Relates to the consumption of energy and water and the output of waste-paper and carbon emissions.
14.Brand reputation
Consistently ranked as Sri Lanka’s No.1 Banking brand, the BoC brand is a key source of competitive edge, underpinning our strong market position.
No change Relates to the internal and external stakeholder perception of the Bank.
15.Macro-economic and policy trends
Significant changes in the macro-economic and policy environment are likely to have a considerable impact on the Bank’s operations over the short-to-medium term.
New material topic Relates to the external macro-economic and policy environment.
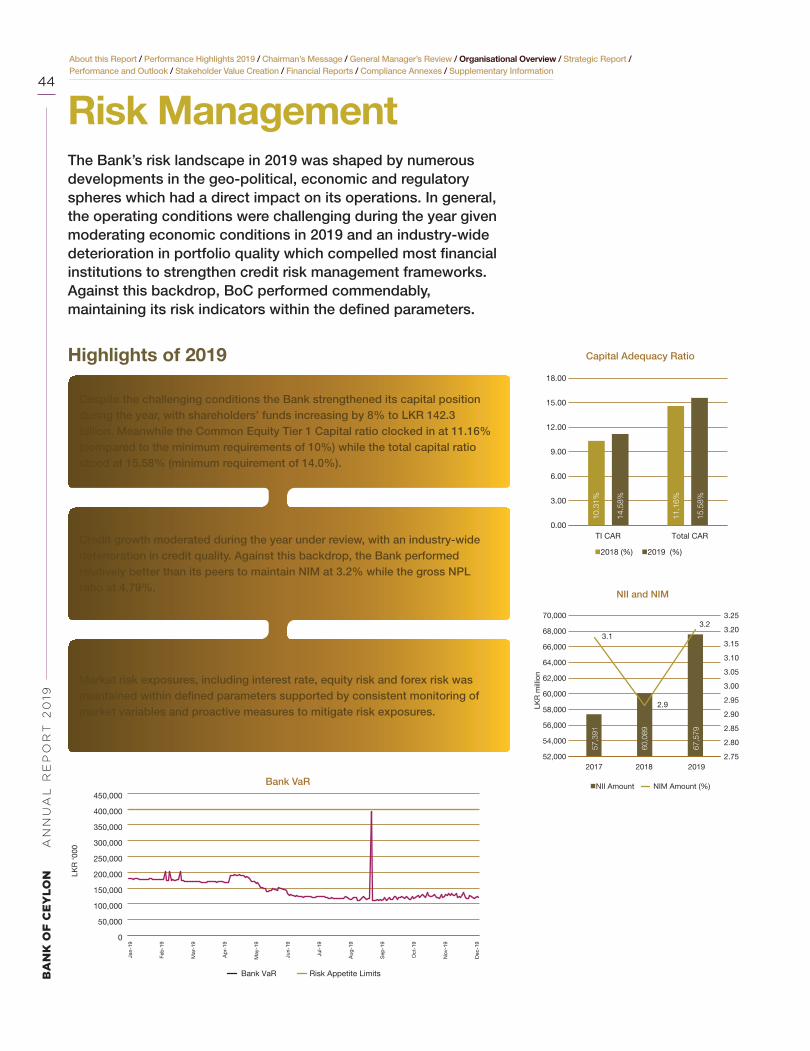
BA
NK
OF
CE
YL
ON
AN
NU
AL
RE
PO
RT
20
19
44
About this Report / Performance Highlights 2019 / Chairman’s Message / General Manager’s Review / Organisational Overview / Strategic Report / Performance and Outlook / Stakeholder Value Creation / Financial Reports / Compliance Annexes / Supplementary Information
Risk ManagementThe Bank’s risk landscape in 2019 was shaped by numerous developments in the geo-political, economic and regulatory spheres which had a direct impact on its operations. In general, the operating conditions were challenging during the year given moderating economic conditions in 2019 and an industry-wide deterioration in portfolio quality which compelled most financial institutions to strengthen credit risk management frameworks. Against this backdrop, BoC performed commendably, maintaining its risk indicators within the defined parameters.
Despite the challenging conditions the Bank strengthened its capital position during the year, with shareholders’ funds increasing by 8% to LKR 142.3 billion. Meanwhile the Common Equity Tier 1 Capital ratio clocked in at 11.16% (compared to the minimum requirements of 10%) while the total capital ratio stood at 15.58% (minimum requirement of 14.0%).
Credit growth moderated during the year under review, with an industry-wide deterioration in credit quality. Against this backdrop, the Bank performed relatively better than its peers to maintain NIM at 3.2% while the gross NPL ratio at 4.79%.
Market risk exposures, including interest rate, equity risk and forex risk was maintained within defined parameters supported by consistent monitoring of market variables and proactive measures to mitigate risk exposures.
Highlights of 2019
0.00
3.00
6.00
9.00
12.00
15.00
18.00
TI CAR Total CAR
Capital Adequacy Ratio
10.3
1%
14.5
8%
11.1
6%
15.5
8%
10 5
n2018 (%) n2019 (%)
52,000
54,000
56,000
58,000
60,000
62,000
64,000
66,000
68,000
70,000
2.75
2.80
2.85
2.90
2.95
3.00
3.05
3.10
3.15
3.20
3.25
2017 2018 2019
NII and NIM 5
7,39
1
67,
579
60,
089
nNII Amount ) NIM Amount (%)
3.1
2.9
3.2
LKR
mill
ion
0
50,000
100,000
150,000
200,000
250,000
300,000
350,000
400,000
450,000
Bank VaR Risk Appetite Limits
Bank VaR
Jan-
19
Feb
-19
Mar
-19
Ap
r-19
May
-19
Jun-
19
Jul-
19
Aug
-19
Sep
-19
Oct
-19
Nov
-19
Dec
-19
LKR
‘000

About this Report / Performance Highlights 2019 / Chairman’s Message / General Manager’s Review / Organisational Overview / Strategic Report / Performance and Outlook / Stakeholder Value Creation / Financial Reports / Compliance Annexes / Supplementary Information
45
Risk Landscape in 2019A high-level overview of the key trends which shaped the Bank’s risk landscape during the year is provided below;
Economic Trends
Sri Lanka’s GDP growth moderated to 2.7% during the first 9 months of the year, reflecting cascading effects of global dynamics as well as domestic challenges. Subdued investor and consumer sentiments led to a sharp downturn in credit growth, with private sector credit expansion moderating to 6% in third quarter 2019. Despite reductions in policy interest rates to stimulate the economy, market interest rates remained high for most part of the year, before gradually declining towards the latter part of the year.
Threat of Terrorism
The April terror attacks had wide ranging impacts across industries, with particular stress on the tourism, consumer and retail sectors. Subdued investor sentiments following heightened security concerns had a sharp impact on economic activity with investors adopting a wait-and-see approach.
Global Dynamics
Escalating trade tensions between US and its key trading partners as well as frictions between US and Iran, uncertainties surrounding the BREXIT deal and stress in key emerging market economies resulted in global growth also moderating to 2.9% While growth is expected to recover marginally in 2020, key downside risks remain; these include rising geopolitical tensions, intensifying social unrest, cyclical and structural slowdowns stemming from USA’s trade stance, as well as weather-related disasters and possible global implications of the Coronavirus.
Regulatory Developments
• Deposit and lending rate caps imposed by the regulator
• Reduction of policy rates twice by a total of 100 bps in May and August
• Reduction in SRR of all rupee deposit liabilities by 2.5%
• Debt moratorium granted to the tourism sector post-Easter attacks
• Full implementation of Basel III (CAR 14%, NSFR 100%)
• New criteria for determining Domestically Systemically Important Banks
Key Numbers
2.9%Global growth
2.3% Sri Lankan
GDP growth
6% Private sector credit growth
6%Industry loan growth
4.7%Industry
Gross NPL ratio
3.6%Industry NIM
Implications of Climate Change
The World Economic Forum’s Global Risks Report for 2019 classifies environmental risks such as extreme weather, natural disasters and failure of climate change mitigation as the top risks both in terms of likelihood and impact. On the domestic front, continued droughts followed by flooding in certain regions have led to considerable vagaries in the plantations and agriculture sectors resulting in repayment pressure.
Third quarter 2019

BA
NK
OF
CE
YL
ON
AN
NU
AL
RE
PO
RT
20
19
46
About this Report / Performance Highlights 2019 / Chairman’s Message / General Manager’s Review / Organisational Overview / Strategic Report / Performance and Outlook / Stakeholder Value Creation / Financial Reports / Compliance Annexes / Supplementary Information
Risk Management FrameworkThe Board approved risk management framework consists of clearly defined governance structures, policy frameworks and a culture of risk awareness which ensures judicious empowerment and the consistent management of risks across the Bank. The framework provides consistent guidelines to identify, measure, mitigate and report risks in a consistent manner and is regularly reviewed and revised to ensure that it remains relevant given the increasingly dynamic operating environment. The risk framework is graphically illustrated.
Board of Directors
Integrated Risk Management Committee, Audit Committee, ICT committee
Independent Integrated Risk Management Division
Risk policies Procedures, Tools, Standards and Internal controls
Three lines of defense model
Our Approach to Risk ManagementBoC’s approach towards managing risk has evolved over the years to a holistic and systematic framework which aims to develop resilience through economic cycles and internal/ external challenges. Given the Bank’s size, depth of operations and socio-economic impact, robust risk management practices are critical in ensuring the continued creation of value across the organisation.
Risk GovernanceThe clearly defined risk governance structure articulates responsibilities for the identification, measurement, management, monitoring and reporting of risks. The mandates of risk-related governance committees at both Board and Executive level ensure accountability for all types of risk across the organisation, facilitating a holistic and systematic approach to risk management which is graphically illustrated below.During the year, the Board reviewed and approved the risk governance structure;.
Board of Directors
Integrated Risk Management Committee
General Manager andManagement Level Committees
Independent Integrated Risk Management Division headed by
Chief Risk Officer
AGM Risk Management
Chief Manager Risk Management
Credit Risk Management
Market Risk Management
OperationalRisk Management
Chief Information Security Officer
Risk Management
1st lineBusiness Units
2nd lineIIRMD
3rd lineAudit/ Assurance

About this Report / Performance Highlights 2019 / Chairman’s Message / General Manager’s Review / Organisational Overview / Strategic Report / Performance and Outlook / Stakeholder Value Creation / Financial Reports / Compliance Annexes / Supplementary Information
47
Board of Directors
The Board of Directors hold apex responsibility in ensuring that the Bank’s risk profile is managed within acceptable limits while managing risk and return dynamics. The Board’s risk related duties include defining the risk appetite in line with strategic aspirations, developing the risk management framework, ensuring the consistent treatment of risks through formulating policies and procedures and regularly monitoring the risk profile against the defined risk appetite. The Board has delegated specific risk-related responsibilities to three sub-committees; namely, the IRMC, Audit Committee and the recently formed Board Information and Communication Technology Committee (ICTC).
Integrated Risk Management
Committee (IRMC)
The IRMC assists the Board in fulfilling its oversight responsibilities for all aspects of risk management including the following;
• Reviewing risk-related policy frameworks, procedures and committee charters
• Define indicators and exposure limits for all key risk exposures
• Ensure the effective functioning of risk-related management committees
• Review the adequacy and effectiveness of risk identification, measurement, monitoring and mitigation tools
• Review the Bank’s capital position and future requirements in line with the Internal Capital Adequacy Assessment Process (ICAAP)
• Evaluate results of periodic stress testing to identify potential pain points and propose risk mitigants
• Review the Bank’s Business Continuity Plan (BCP)
Independent Integrated Risk
Management Division (IIRMD)
The IIRMD is the second line of defense and operates independently of the revenue generating strategic business units. It is headed by the Chief Risk Officer (CRO) and carries out independent risk assessments thereby assisting the IRMC in fulfilling its mandate. Key responsibilities of the IIRMD include,
• Determining the Bank’s risk appetite, including defining specific key risk indicators, range and limits for approval by the Board of Directors
• Regular stress testing to assess potential vulnerabilities arising from a range of stressed scenarios to assess the impact on performance and capital
• Preparation of a comprehensive ICAAP
• Support the first line of defense in risk identification, monitoring and reporting
• Introduce and implement measures to effectively mitigate risks
• Ensuring the effective implementation of the BCP
Board contribution to Risk Management in 2019
Reviewed of the Risk Governance Framework
Approval of the Risk Appetite and Limit Management
Framework for 2019, in line with the Corporate Plan for
2019-2021
ICT Committee’s contribution in strengthening the Bank’s Cyber
and IT security frameworks
• Assess potential risks that could arise from the launch of new products and processes
• Develop a risk conscious culture among employees through ongoing training programmes and communications
Policy Framework
The Bank’s risk management policies are underpinned on risk management framework which ensures consistent treatment in the identification, measurement, mitigation and reporting of risks. All policies are reviewed and updated regularly to ensure applicability to changing internal and external operating landscapes and industry best practices. Key policy related developments and revisions carried out during the year are listed alongside;
Policy developments
• Developed and updated Information Security related Policies, Guidelines, standards and procedures.
• Information Security Policy for Seychelles Branch
• Development of the Cyber Security Policy for the Chennai Branch
Policy revisions
• Group Risk Management Policy
• Integrated Risk Management Policy
• ICAAP Policy
• Stress Testing Policy
• Credit Risk Management Policy
• Credit Risk Rating Policy
• Credit Portfolio Management Policy
• Loan Review Mechanism Policy
• Market Risk Management Policy
• Liquidity Risk Management Policy
• Foreign Exchange Risk Management Policy
• Information Security Policy • IT Risk Management Policy

BA
NK
OF
CE
YL
ON
AN
NU
AL
RE
PO
RT
20
19
48
About this Report / Performance Highlights 2019 / Chairman’s Message / General Manager’s Review / Organisational Overview / Strategic Report / Performance and Outlook / Stakeholder Value Creation / Financial Reports / Compliance Annexes / Supplementary Information
Charter for Integrated Risk Management CommitteeCommitteeCharters
Major policies which covers overall risk
Policies for specific risk categories
Integrated Risk Management PolicyGroup Risk Management Policy
Stress Testing PolicyICAAP Policy
Credit Risk Policies
Market Risk Policies
Liquidity Risk Policies
Operational Risk Policies
IT/ Information Security Policies
The Three Lines of Defense
(TLOD) Model
The Bank’s risk management framework is based on the TLOD Model, which ensures clear allocation of responsibilities in the identification and management of risks. The globally accepted model facilitates transparency and accountability while contributing towards the development of specialised risk-based skills through segregation of duties.
1st line of defense
Risk ownership by
business units
2nd line of defense
Risk management by
IIRMD
3rd line of defense
Assurance by the
audit function
• Risk taking and risk ownership
• Day to day management of risk
• Act in accordance with risk policies
• Application of internal controls and risk responses
• Develop risk management framework
• Provide guidance
• Monitoring, reporting and risk control
• Ensuring 1st line (business units) takes risk ownership
• Independent and objective assurance to the Board on the effectiveness of the 1st and 2nd lines of defense
Risk CultureRisk management at BoC has evolved from that of a single department’s responsibility to an organisation-wide culture in which all employees are responsible for risk identification and management. This has been facilitated by adoption of the TLOD model which has propagated a risk culture as well as regular training programmes and risk-related communications. Refreshers on the Bank’s whistle-blowing procedures, internal controls and Code of Ethics serves to reinforce the Bank’s values, emphasising transparency and integrity in all aspects of its operations.
Stress TestingStress testing is an effective tool in assessing the vulnerabilities of the Bank’s risk profile to changes in the operating landscapes. BoC conducts regular
stress testing and the feedback from this exercise forms a key input in corporate planning, capital management, risk appetite determination and formulating risk mitigating actions among others. A comprehensive, Board-approved stress testing policy is in place, and ensures that regular stress testing is carried out in a systematic way facilitating the
potential impacts on capital, liquidity and profitability. The results of the stress testing exercise conducted during the year are disclosed in the respective sections of this report. Key variables for which stress testing was conducted during the year included the following;
Risk Stress scenario Impact on
Credit Risk Rise in the gross NPA ratio Profitability, Liquidity and Capital Adequacy
Default Risk Default in specific sector/ region
Losing Government Exposure Reduction of Government exposure
Collateral Quality Collateral depletion
Concentration Risk Idiosyncratic Concentration – Top ten borrowers
Top ten depositors
Risk Management

About this Report / Performance Highlights 2019 / Chairman’s Message / General Manager’s Review / Organisational Overview / Strategic Report / Performance and Outlook / Stakeholder Value Creation / Financial Reports / Compliance Annexes / Supplementary Information
49
Risk ReportingAccurate and timely risk reporting is critical to effective risk management and clear reporting lines and defined responsibilities ensure that material financial and non-financial risks are clearly communicated and escalated wherever necessary. The Bank’s risk profile and exposure against risk appetite limits for key business lines, products and geographical regions are reported to the Board on a regular basis. A comprehensive risk report, comprising risk indicator dashboards and performance against risk appetite indicators is provided to the IRMC on a monthly basis and as and when required.
During the year the following improvements were made to the Bank’s risk reporting framework;
• Introduced a stress testing dashboard to the corporate and Executive Management teams
• Extended reporting line to the IRMC on the results of loan review mechanism
• Enhanced the scope and depth of risk reporting to reflect the magnitude of risks assumed by the Bank
Risk AppetiteThe Bank’s risk appetite is expressed in the form of a Risk Appetite Statement (RAS) and articulates the level of risk the Bank is willing to undertake in the achievement of its corporate objectives. When formulating the RAS, the Board gives due consideration to the Bank’s strategic aspirations, its national role and the optimum balance between risk return dynamics. The RAS includes tolerance limits and risk appetite triggers and defines specific corrective action to be taken in the event that such limits are exceeded/ triggered.
The RAS is reviewed and revised by the Board on an annual basis or as and when required. Material changes in the Bank’s risk appetite for 2019 included,
• Introduction of concentration limits
for rating grades
• Allocation of Limits on maturity profile
of rupee loans and advances
0
200
400
600
800
1000
1200
1400
1600
Name ConcentrationGeographical Concentration
Credit Concentration
HH
I Ind
ex
1st Quarter 2nd Quarter 3rd Quarter 4th Quarter
NPA Customer’ ConcentrationSector Concentration
Product wise ConcentrationLimit
• Allocation of Limits on maturity profile
of USD Loans and Advances
• Capital charge for credit risk appetite
was increased by 20% compared to
previous year
• Capital charge for market risk
appetite reduced by 48% mainly due
to reduced capital charge for foreign exchange risk by 97% (due to less volatility of exchange rate).
Risk Appetite vs Actuals
Risk Appetite Actuals as at 31 December
Leverage Ratio Minimum 4.01% 4.37%
Purchased funds to total assets Maximum 25% 9.31%
Forex Var Maximum LKR 75,000,000 LKR 25,674,299
Equity Var Maximum LKR 250,000,000 LKR119,435,071

BA
NK
OF
CE
YL
ON
AN
NU
AL
RE
PO
RT
20
19
50
About this Report / Performance Highlights 2019 / Chairman’s Message / General Manager’s Review / Organisational Overview / Strategic Report / Performance and Outlook / Stakeholder Value Creation / Financial Reports / Compliance Annexes / Supplementary Information
Credit Risk
Operational Risk
Compliance Risk
Strategic Risk
Funding and
Liquidity Risk
Market Risk
Credit Risk (page 50)
Stems from the Bank’s lending portfolio and
is the most significant risk exposure. Exposure: 92% of riskweighted assets
Market Risk (page 53)
Arises from the Bank’s trading activities.
Exposures: Below 1% of risk weighted
Compliance Risk (page 59)
Stems from the stringent regulatory framework governing the banking industry
Funding and Liquidity Risk(page 56)
Stems primarily from the Bank’s funding portfolio and funding
strategy
Strategic Risk (page 60)
Arises from our presence in competitive and dynamic industry
Operational Risk (page 58)
Arises from the Bank’s daily operations and processes
External Risks
Political changes, Geopolitical risks, Macro-economic risks, Technology risk, Implications of climate change
The subsequent sections of this Risk Management Report provide an overview of the Bank’s approach to managing the key internal risks listed above.
Risk Profile in 2019
Credit RiskCredit Risk is defined as potential losses arising due to a counterparty to a credit transaction failing to meet their obligations in accordance with agreed terms. Credit Risk can take the form of default risk, concentration of counterparties, geographical regions or industry sectors.
Credit Risk Governance
A comprehensive, Board-approved Credit Risk Management Policy clearly sets out the principles under which credit risk is to be assumed, ensuring the consistent identification, management and reporting of credit risk across the Bank.
The Credit Committee (headed by the GM) is responsible for the implementation of the credit risk management framework while oversight responsibility lies with the IRMC and Board level. Responsibilities of the Credit Committee include formulating, reviewing and implementing credit risk appetite limits, approving credit up to authorised limits and recommending the credit proposals to the Board, which are beyond it’s authorised limit, ensuring regulatory compliance in the Bank’s risk policies and guidelines and monitoring risk concentrations. The first line of defense and the primary responsibility for credit risk management lies with the business units, supported by independent review by the Credit Risk Unit of the IRMD.
Credit Risk Exposure
Credit risk arises through over 90% of the Bank’s risk-weighted-assets and arises from the direct lending as well as indirect lending
such as financial guarantees, letters of credit and acceptances
issued.
Objective in 2019
Preserving asset quality above the industry level while managing
credit risk in a challenging and turbulent environment.
Risk Management
The Risk UniverseThe Bank’s key risk exposures stem directly from its operations as well as from the external environment. While the former is managed systematically on a proactive basis, external risks are monitored on an ongoing basis by the Bank to assess the potential impact on our operations.
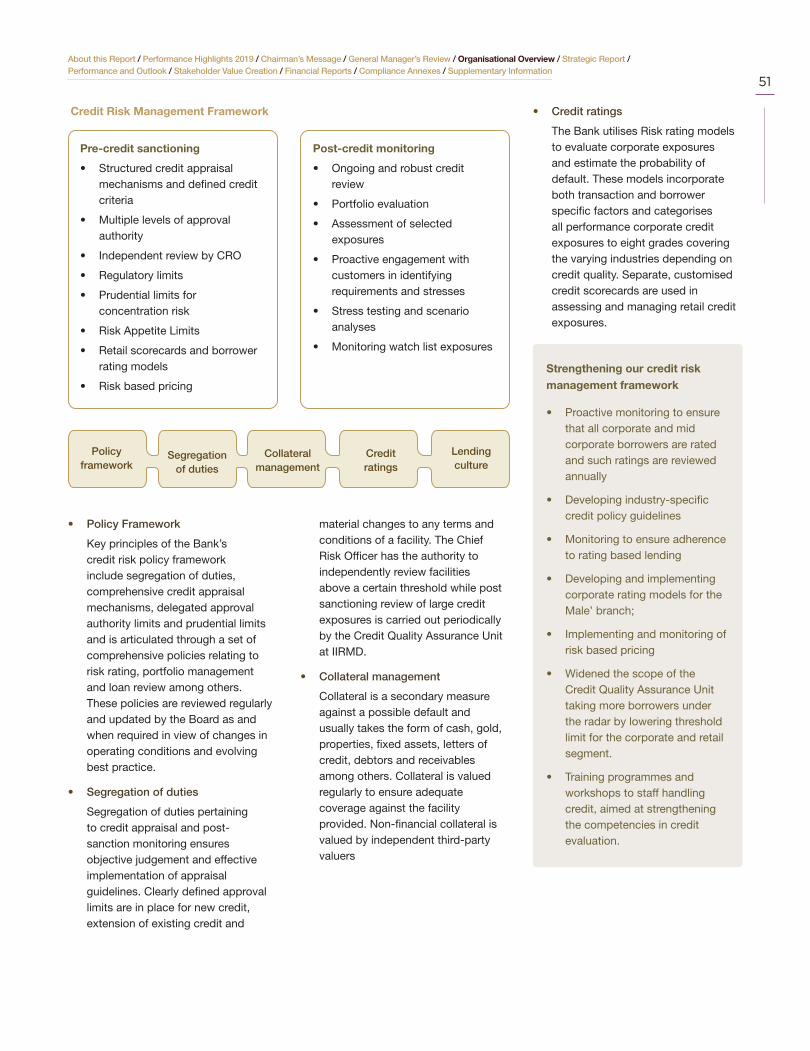
About this Report / Performance Highlights 2019 / Chairman’s Message / General Manager’s Review / Organisational Overview / Strategic Report / Performance and Outlook / Stakeholder Value Creation / Financial Reports / Compliance Annexes / Supplementary Information
51
Pre-credit sanctioning
• Structured credit appraisal mechanisms and defined credit criteria
• Multiple levels of approval authority
• Independent review by CRO
• Regulatory limits
• Prudential limits for concentration risk
• Risk Appetite Limits
• Retail scorecards and borrower rating models
• Risk based pricing
Post-credit monitoring
• Ongoing and robust credit review
• Portfolio evaluation
• Assessment of selected exposures
• Proactive engagement with customers in identifying requirements and stresses
• Stress testing and scenario analyses
• Monitoring watch list exposures
Credit Risk Management Framework
Segregationof duties
Collateral management
Lendingculture
Creditratings
• Policy Framework
Key principles of the Bank’s credit risk policy framework include segregation of duties, comprehensive credit appraisal mechanisms, delegated approval authority limits and prudential limits and is articulated through a set of comprehensive policies relating to risk rating, portfolio management and loan review among others. These policies are reviewed regularly and updated by the Board as and when required in view of changes in operating conditions and evolving best practice.
• Segregation of duties
Segregation of duties pertaining to credit appraisal and post-sanction monitoring ensures objective judgement and effective implementation of appraisal guidelines. Clearly defined approval limits are in place for new credit, extension of existing credit and
material changes to any terms and conditions of a facility. The Chief Risk Officer has the authority to independently review facilities above a certain threshold while post sanctioning review of large credit exposures is carried out periodically by the Credit Quality Assurance Unit at IIRMD.
• Collateral management
Collateral is a secondary measure against a possible default and usually takes the form of cash, gold, properties, fixed assets, letters of credit, debtors and receivables among others. Collateral is valued regularly to ensure adequate coverage against the facility provided. Non-financial collateral is valued by independent third-party valuers
• Credit ratings
The Bank utilises Risk rating models to evaluate corporate exposures and estimate the probability of default. These models incorporate both transaction and borrower specific factors and categorises all performance corporate credit exposures to eight grades covering the varying industries depending on credit quality. Separate, customised credit scorecards are used in assessing and managing retail credit exposures.
Strengthening our credit risk management framework
• Proactive monitoring to ensure that all corporate and mid corporate borrowers are rated and such ratings are reviewed annually
• Developing industry-specific credit policy guidelines
• Monitoring to ensure adherence to rating based lending
• Developing and implementing corporate rating models for the Male’ branch;
• Implementing and monitoring of risk based pricing
• Widened the scope of the Credit Quality Assurance Unit taking more borrowers under the radar by lowering threshold limit for the corporate and retail segment.
• Training programmes and workshops to staff handling credit, aimed at strengthening the competencies in credit evaluation.
Policyframework

BA
NK
OF
CE
YL
ON
AN
NU
AL
RE
PO
RT
20
19
52
About this Report / Performance Highlights 2019 / Chairman’s Message / General Manager’s Review / Organisational Overview / Strategic Report / Performance and Outlook / Stakeholder Value Creation / Financial Reports / Compliance Annexes / Supplementary Information
Credit risk models are developed and independently validated through a robust governance mechanism. When rating a counterparty, we apply in-house assessment methodologies and an eight grade rating scale for evaluating the credit worthiness of counterparties. Qualitative and quantitative techniques are also used in the independent validation of models.
• Culture of responsible lending
Emphasis is placed on nurturing a responsible, risk conscious lending culture through continuous employee engagement, workshops, training on credit appraisal, web-based learning modules as well as mentoring and knowledge sharing across the organisation. In 2019, specific focus was placed on enhancing the credit management skills of our employees through numerous training programmes that were conducted across the branch network.
Credit Risk Performance in 2019
Overview: Subdued consumer and investor sentiments following the Easter attacks and the sharp downturn in the tourism and retail sectors, led to an industry-wide deterioration in portfolio quality during the year, with borrowers across value chains experiencing repayment pressure. Meanwhile, concessions granted to the tourism industry and interest rate caps imposed by the regulator to drive a reduction in market interest rates directly impacted the Sector’s portfolio quality as well as risk-return dynamics.
Reject
Redevelop
Refine
Model Initiation and
Planning
Model Development and Testing
Model Implementation
Model Monitoring and
Use
Model Approval
Pre-approval validation
Annual/ Adhoc validation
Post-implementation
review
Against this backdrop, the Bank’s credit growth moderated to 9%, from 23% the year before. Despite rising impairments, we continued to support the country’s SME sector while parallel importance was placed on strengthening and monitoring mechanisms. The Bank also adopted a cautious approach in lending to certain industries and customer segments.
Default Risk
The Bank’s gross NPL ratio for the year increased to 4.8% from 3.6% of year 2018. However the ratio was par with the industry average of 4.7% by end December 2019. Understandably impairment charges on loans and advances also increased by 24% to LKR 18.6 Billion with pressure being seen primarily from the country’s tourism, agriculture, consumer and construction related industries. Meanwhile, 64% of the Bank’s portfolio comprised of borrowers in the rating categories of BBB and above as demonstrated alongside;
0
10
20
30
40
AAA AA A BBB BB B C D
Rating Grade wise Distribution - 2019
Rating Grades
n Borrowers (%)
2
13
33
16 17
10
6
4
Concentration Risk
Concentration risk arises from high lending exposure to a counterparty/group, sector, product or region. This risk is measured through the Herfindahl-Hirshman Index (HHI) while concentration is assessed against limits defined in the Risk Appetite Statement, specially for products, sectors, geographies and relatively significant customers. The exposure limits are reviewed and modified regularly to ensure continued applicability to changing industry dynamics.
Name Concentration: Large exposures to specific individual borrowers give rise to ‘name concentration’ risk and is monitored through the single borrower limit and the HHI. The Bank’s portfolio is relatively granular in nature with no significant name concentration in private sector lending activities. However, as a state bank and a partner in national development, BoC understandably has considerable exposure to the Government and State-Owned-Enterprises (SOEs). These facilities typically carry an explicit guarantee from the Government Treasury and do not entail credit risk.
Product Concentration
The Bank’s portfolio is well diversified in terms of its product exposure, with the largest exposure of term loans accounting for 24% of total advances, followed overdrafts and personal loans.
Risk Management

About this Report / Performance Highlights 2019 / Chairman’s Message / General Manager’s Review / Organisational Overview / Strategic Report / Performance and Outlook / Stakeholder Value Creation / Financial Reports / Compliance Annexes / Supplementary Information
53
10%
16%
5%
24%
14%
12%6%
1%1%
4%2%
2%3%
Product wise Concentration
n Trade Finance
n Ran Surakum
n Leasing
n Staff Loans
n Loans under Schemes
n Overdrafts
n Housing Loans
n Foreign Currency Loans
n Term Loans
n BoC Personal Loans
n Pledge Loans
n Money Market Loans
n Loans Others
Sector Concentration
Sovereign and Direct Government exposure amounted to 34% of the Bank’s loan book, reflecting its tilt towards government lending. Excluding this sector, the Bank’s portfolio continues to be diversified with the highest exposure stemming from Housing, Construction and Infrastructure (15%), Consumption (12%) and Commercial Trade (11%) in 2019. All exposures were maintained within the risk appetite limits during the year.
10.8%
3.6%
33.5%
6.4%
12%4.5%
4.9%
4.6%4.6%
15.2%
Sector Concentration
n Agriculture and Fisheries
n Banks, Financial, Insurance and Business Services
n Hotels Travels and Services
n Housing, Construction and Infrastructure
n Manufacturing
n Commercial Trade
n Sovereign and Direct Government
n Transportation and Logistics Services
n Other Commercial Services
n Consumption and other
Collateral Exposure
In 2019, 66% of the Bank’s lending was secured by collateral - mainly by Government securities/ guarantees and properties.
20%
8%
23%
5%
34%
5%5%
n Cash
n Gold
n GoSL Securities/Guarantees
n Movables
n Property
n Others
n Unsecured
Collateral Exposure
Cross Border Exposure
The Bank’s cross border exposure is relatively small, accounting for 5% of the balance sheet as at end-December 2019. This risk stems from BoC international operations in India, Maldives, Seychelles and the United Kingdom, which all operate with stringent risk management frameworks and policies; risk profiles are consistently monitored by the Board.
Market RiskMarket risk is defined as the potential losses arising from changes in earnings, market or future cash flows of a portfolio of financial instruments resultant from adverse movements in market variables such as interest rates, foreign exchange rates and share prices and commodity prices.
The Bank is exposed to 3 different types of market risks;
• Interest rate risk arising from the Bank’s trading and non-trading books
• Foreign exchange risk stemming from foreign currency denoted transactions
• Equity risk - losses from volatilities in equity prices
Market Risk Exposure
Market risk arises through below 1% of the Bank’s risk-weighted-
assets including the trading and non-trading books, foreign currency denoted transactions and equity investment portfolio.
Objective in 2019
Effective management of key market risk exposures given
industry volatilities, particularly on the interest rate front.
Cross Border Exposure of the Bank
Other Assets95.03%
Cross borderAssets4.97%
Maldives2.02%
UK1.93%
India0.44%
USA0.33%
Other Countries0.17%
Seychelles0.08%

BA
NK
OF
CE
YL
ON
AN
NU
AL
RE
PO
RT
20
19
54
About this Report / Performance Highlights 2019 / Chairman’s Message / General Manager’s Review / Organisational Overview / Strategic Report / Performance and Outlook / Stakeholder Value Creation / Financial Reports / Compliance Annexes / Supplementary Information
Market Risk Governance
At Board level, the IRMC provides oversight for the management of market risk, while at an executive level, the Asset and Liability Management Committee (ALCO) holds responsibility for implementation of the Bank’s market risk management framework. ALCO responsibilities including monitoring maturity mismatches, liquidity requirements as well as price and volumes of advances and deposits to ensure that market risk exposures are maintained within the defined risk appetite.
Treasury operations are critical in market risk management and the Bank has established a middle office which monitors treasury transactions which may give rise to market risks; the middle office operates independent from the Treasury Unit and is governed by the Middle Office Manual of Operations approved by the Board of Directors.
Market Risk Management Framework
Policyframework
Risk Limits
Risk monitoring
• Comprehensive framework of
policies
Market risk management is founded upon several policies including the Asset and Liability Management Policy, Limit Management Framework, Foreign Exchange Risk Management Policy and Middle Office Operations Manual. This policy framework serves to provide guidance on the all market risk management aspects including effective monitoring of treasury operations, setting risk limiting thresholds on treasury operations and managing potential impacts stemming from market dynamics. The policies are reviewed and updated regularly by the Board in view of changing dynamics in the operating landscape.
• Risk Limits
The Board, supported by the ALCO, is responsible for setting risk limits for treasury and investment related activities which are likely to give rise to market risk. Accordingly, the Board sets limits for variables such as foreign currency open position limits, counterparty limits, stop loss limits and dealer limits, portfolio limits, foreign exchange gap limits and monitors performance on a regular basis. The limits, are also regularly reviewed and updated by the IIRMD (with input from the ALCO) in line with market developments.
• Risk Monitoring
A range of key indicators pertaining to market risk is monitored regularly by the IIRMD; these include interest margins and funding requirements in line with the Bank’s growth aspirations. Interest rate risk is monitored through tools such as Value at Risk (VaR), Price Value for Basis Point (PVBP), duration, gap analysis, stress testing, and sensitivity analysis. Exchange rate risk is monitored through VaR, open position limits and net open positions.
Market Risk Performance in 2019
Interest Rate Risk
The Bank’s exposure to Interest Rate Risk (IRR) arises from its lending portfolio, trading securities and deposit liabilities, the values of which fluctuate in interest rate volatilities and credit spreads.
Interest Rate Risk Management
As a Bank, IRR is a considerable risk exposure to the Bank and it is managed through a comprehensive policy framework which clearly sets out prudential limits, interest gaps PVBP and VaR. Sensitivity analysis of assets and
liabilities are managed by the Treasury unit in time buckets and monitored by the IIRMD, in order to assess the duration gap and exposure to IRR. We are also cognisant of the potential implications of changing economic indicators on the Bank’s performance and capital which is assessed through regular stress testing on the banking and trading book.
Strengthening our market risk management framework
• Revised the limit management framework and enhanced the limit monitoring mechanism
• Conducted training programmes and developed a questionnaire to staff through e-learning portal
• Strengthened monitoring through widening the scope of market risk indicators
• Widened the scope of the stress testing mechanism to include a broader range of variables
• Enhanced reporting components in the daily and monthly risk reports
• Fully compliant with market conduct and practices for treasury operations of Licensed Banks in Sri Lanka.
Risk Management

About this Report / Performance Highlights 2019 / Chairman’s Message / General Manager’s Review / Organisational Overview / Strategic Report / Performance and Outlook / Stakeholder Value Creation / Financial Reports / Compliance Annexes / Supplementary Information
55
During the year all interest rate risk indicators were maintained within the defined parameters. Meanwhile, the Bank’s NIM widened marginally to 3.2% from 2.9% the year before reflecting smart repricing decisions and expansion in high-yielding segments.
Foreign Exchange RiskForeign exchange (FOREX) risk is the potential impact to earnings and/or capital stemming from adverse fluctuations in exchange rates.
Foreign Exchange Risk Management
FOREX transactions follow stringent internal policy guidelines and frameworks and external regulatory guidelines including approval mechanisms and limits set by CBSL. Internally a comprehensive limit structure, defining VaR limits prescribed by the IIRMD are in place to manage the foreign exchange risk of trading transactions. We also maintain volume limits on open positions for individual currency exposures and the aggregate exposure. The Bank also conducts VaR calculations and stress testing on the portfolios subject to forex risk.
0
100,000
200,000
300,000
400,000
500,000
600,000
700,000
PVBP Tbill PVBP Tbill Limit
PVBP TbillJa
n-19
Feb
-19
Mar
-19
Ap
r-19
May
-19
Jun-
19
Jul-
19
Aug
-19
Sep
-19
Oct
-19
Nov
-19
Dec
-19
LKR
0
200,000
400,000
600,000
800,000
1,000,000
1,200,000
1,400,000
PVBP Tbond PVBP Limit
PVBP Tbond
Jan-
19
Feb
-19
Mar
-19
Ap
r-19
May
-19
Jun-
19
Jul-
19
Aug
-19
Sep
-19
Oct
-19
Nov
-19
Dec
-19
LKR
-15 -10 -5 0 5 10 15 20 25 30
nGAP % nRate sensitive Liabilities nRate sensitive assets
Sensitivity Analysis of Assets and Liabilities
Over 5 Years
4-5 Years
3-4 Years
2-3 Years
1-2 Years
6-12 Months
3-5 Months
1-3 Months
Upto 1 Month
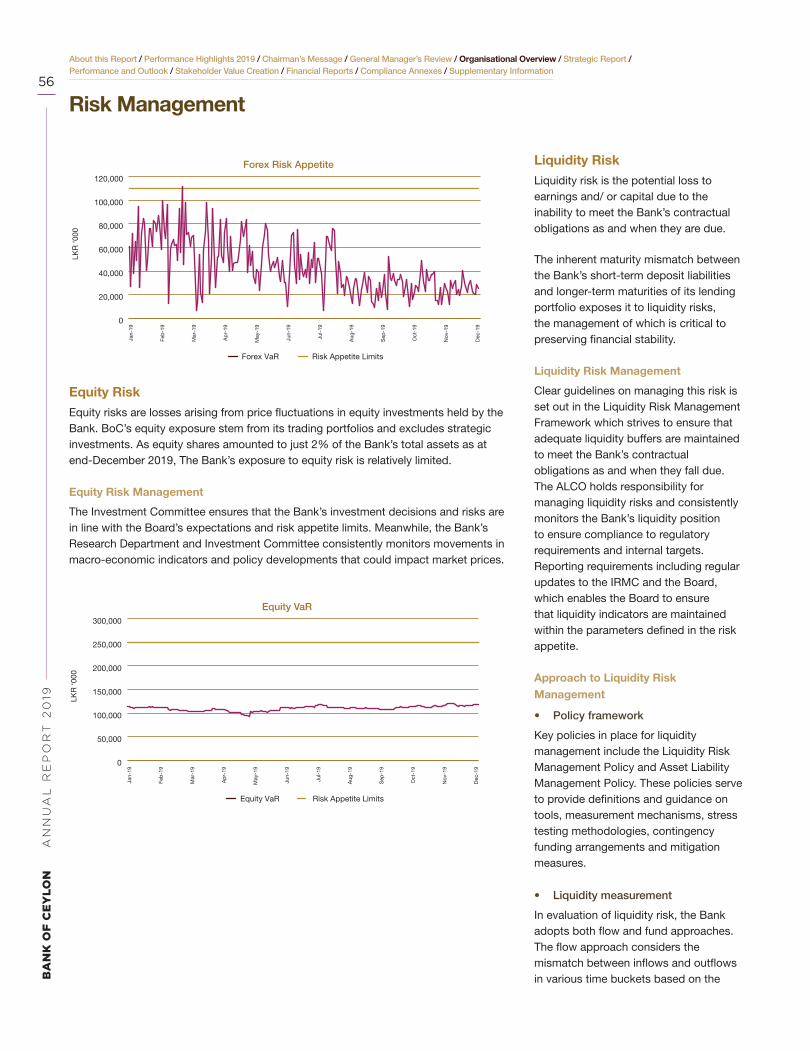
BA
NK
OF
CE
YL
ON
AN
NU
AL
RE
PO
RT
20
19
56
About this Report / Performance Highlights 2019 / Chairman’s Message / General Manager’s Review / Organisational Overview / Strategic Report / Performance and Outlook / Stakeholder Value Creation / Financial Reports / Compliance Annexes / Supplementary Information
Equity RiskEquity risks are losses arising from price fluctuations in equity investments held by the Bank. BoC’s equity exposure stem from its trading portfolios and excludes strategic investments. As equity shares amounted to just 2% of the Bank’s total assets as at end-December 2019, The Bank’s exposure to equity risk is relatively limited.
Equity Risk Management
The Investment Committee ensures that the Bank’s investment decisions and risks are in line with the Board’s expectations and risk appetite limits. Meanwhile, the Bank’s Research Department and Investment Committee consistently monitors movements in macro-economic indicators and policy developments that could impact market prices.
Liquidity RiskLiquidity risk is the potential loss to earnings and/ or capital due to the inability to meet the Bank’s contractual obligations as and when they are due.
The inherent maturity mismatch between the Bank’s short-term deposit liabilities and longer-term maturities of its lending portfolio exposes it to liquidity risks, the management of which is critical to preserving financial stability.
Liquidity Risk Management
Clear guidelines on managing this risk is set out in the Liquidity Risk Management Framework which strives to ensure that adequate liquidity buffers are maintained to meet the Bank’s contractual obligations as and when they fall due. The ALCO holds responsibility for managing liquidity risks and consistently monitors the Bank’s liquidity position to ensure compliance to regulatory requirements and internal targets. Reporting requirements including regular updates to the IRMC and the Board, which enables the Board to ensure that liquidity indicators are maintained within the parameters defined in the risk appetite.
Approach to Liquidity Risk Management
• Policy framework
Key policies in place for liquidity management include the Liquidity Risk Management Policy and Asset Liability Management Policy. These policies serve to provide definitions and guidance on tools, measurement mechanisms, stress testing methodologies, contingency funding arrangements and mitigation measures.
• Liquidity measurement
In evaluation of liquidity risk, the Bank adopts both flow and fund approaches. The flow approach considers the mismatch between inflows and outflows in various time buckets based on the
Risk Management
0
20,000
40,000
60,000
80,000
100,000
120,000
Forex VaR Risk Appetite Limits
Forex Risk Appetite
Jan-
19
Feb
-19
Mar
-19
Ap
r-19
May
-19
Jun-
19
Jul-
19
Aug
-19
Sep
-19
Oct
-19
Nov
-19
Dec
-19
LKR
‘000
0
50,000
100,000
150,000
200,000
250,000
300,000
Equity VaR Risk Appetite Limits
Equity VaR
Jan-
19
Feb
-19
Mar
-19
Ap
r-19
May
-19
Jun-
19
Jul-
19
Aug
-19
Sep
-19
Oct
-19
Nov
-19
Dec
-19
LKR
‘000

About this Report / Performance Highlights 2019 / Chairman’s Message / General Manager’s Review / Organisational Overview / Strategic Report / Performance and Outlook / Stakeholder Value Creation / Financial Reports / Compliance Annexes / Supplementary Information
57
maturity of assets and liabilities, allowing the identification of potential liquidity stresses over time. The fund approach is based on a range of indicators at a specified date, including liquid assets ratio, liquidity coverage ratio, , net stable funding ratio and loans to deposit ratio are the measures used under fund approach.
• Contingency Funding Plan (CFP)
CFP which defines specific triggers and action plans with specific responsibilities is in place to ensure smooth continuity of operations in the event of liquidity stress. The Plan also serves to preserve stakeholder interest and maintain public confidence in the event of unforeseen pressure.
Liquidity Risk Review 2019
The Bank’s liquidity position is supported by a diverse funding profile, strong deposit franchise and an adequate buffer of unencumbered securities. As at end-December 2019, deposits accounted for 84% of the Bank’s total funding followed by borrowings and other liabilities (10%) and shareholders’ funds (6%). Unencumbered securities available for funding amounted to LKR 345.0 billion as at end-December 2019. Meanwhile, all liquidity indicators were maintained comfortably with the parameters and limits defined by the Risk Appetite statement and in compliance with all relevant regulatory requirements.
5
10
15
20
25
30
Liquid Asset Ratio % Risk Appetite % Regulatory Minimum %
Liquid Asset Ratio
Jan-
19
Feb
-19
Mar
-19
Ap
r-19
May
-19
Jun-
19
Jul-
19
Aug
-19
Sep
-19
Oct
-19
Nov
-19
Dec
-19
50.00
70.00
90.00
110.00
130.00
150.00
170.00
Liquidity Coverage Ratio % Risk Appetite % Regulatory Minimum %
Liquidity Coverage Ratio
Jan-
19
Feb
-19
Mar
-19
Ap
r-19
May
-19
Jun-
19
Jul-
19
Aug
-19
Sep
-19
Oct
-19
Nov
-19
Dec
-19
-20 -15 -10 -5 0 5 10 15 20 25 30 35
n Inflow% n Outflow% n Cumulative Gap%
Maturity Analysis of Assets and Liabilities
Over 5 Years
3-5 Years
1-3 Years
9-12 Months
6-9 Months
3-6 Months
2-3 Months
0-1 Months
0
50,000
100,000
150,000
200,000
250,000
300,000
350,000
400,000
Unencumbered Securities
Jan
Feb
Mar
Ap
r
May
Jun
Jul
Aug
Sep Oct
Nov
Dec
n 2019 n 2018
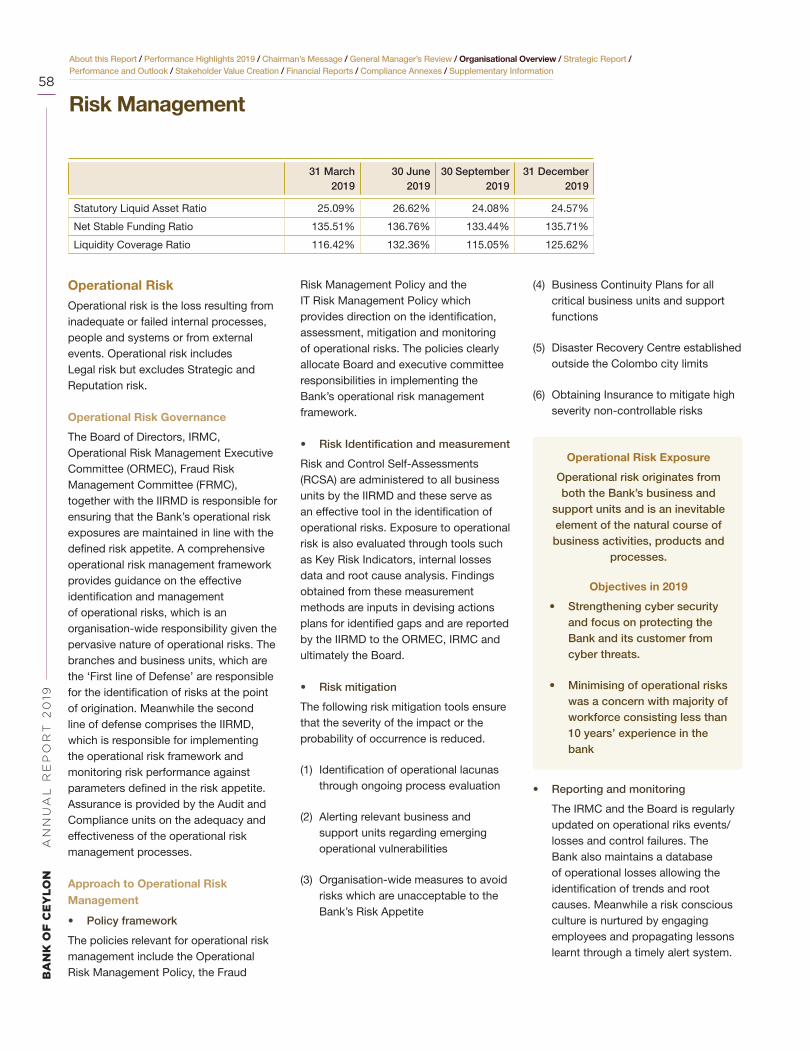
BA
NK
OF
CE
YL
ON
AN
NU
AL
RE
PO
RT
20
19
58
About this Report / Performance Highlights 2019 / Chairman’s Message / General Manager’s Review / Organisational Overview / Strategic Report / Performance and Outlook / Stakeholder Value Creation / Financial Reports / Compliance Annexes / Supplementary Information
31 March 2019
30 June 2019
30 September 2019
31 December 2019
Statutory Liquid Asset Ratio 25.09% 26.62% 24.08% 24.57%
Net Stable Funding Ratio 135.51% 136.76% 133.44% 135.71%
Liquidity Coverage Ratio 116.42% 132.36% 115.05% 125.62%
Operational RiskOperational risk is the loss resulting from inadequate or failed internal processes, people and systems or from external events. Operational risk includes Legal risk but excludes Strategic and Reputation risk.
Operational Risk Governance
The Board of Directors, IRMC, Operational Risk Management Executive Committee (ORMEC), Fraud Risk Management Committee (FRMC), together with the IIRMD is responsible for ensuring that the Bank’s operational risk exposures are maintained in line with the defined risk appetite. A comprehensive operational risk management framework provides guidance on the effective identification and management of operational risks, which is an organisation-wide responsibility given the pervasive nature of operational risks. The branches and business units, which are the ‘First line of Defense’ are responsible for the identification of risks at the point of origination. Meanwhile the second line of defense comprises the IIRMD, which is responsible for implementing the operational risk framework and monitoring risk performance against parameters defined in the risk appetite. Assurance is provided by the Audit and Compliance units on the adequacy and effectiveness of the operational risk management processes.
Approach to Operational Risk Management
• Policy framework
The policies relevant for operational risk management include the Operational Risk Management Policy, the Fraud
Risk Management Policy and the IT Risk Management Policy which provides direction on the identification, assessment, mitigation and monitoring of operational risks. The policies clearly allocate Board and executive committee responsibilities in implementing the Bank’s operational risk management framework.
• Risk Identification and measurement
Risk and Control Self-Assessments (RCSA) are administered to all business units by the IIRMD and these serve as an effective tool in the identification of operational risks. Exposure to operational risk is also evaluated through tools such as Key Risk Indicators, internal losses data and root cause analysis. Findings obtained from these measurement methods are inputs in devising actions plans for identified gaps and are reported by the IIRMD to the ORMEC, IRMC and ultimately the Board.
• Risk mitigation
The following risk mitigation tools ensure that the severity of the impact or the probability of occurrence is reduced.
(1) Identification of operational lacunas through ongoing process evaluation
(2) Alerting relevant business and support units regarding emerging operational vulnerabilities
(3) Organisation-wide measures to avoid risks which are unacceptable to the Bank’s Risk Appetite
(4) Business Continuity Plans for all critical business units and support functions
(5) Disaster Recovery Centre established outside the Colombo city limits
(6) Obtaining Insurance to mitigate high severity non-controllable risks
Operational Risk Exposure
Operational risk originates from both the Bank’s business and
support units and is an inevitable element of the natural course of business activities, products and
processes.
Objectives in 2019
• Strengthening cyber security and focus on protecting the Bank and its customer from cyber threats.
• Minimising of operational risks was a concern with majority of workforce consisting less than 10 years’ experience in the bank
• Reporting and monitoring
The IRMC and the Board is regularly updated on operational riks events/losses and control failures. The Bank also maintains a database of operational losses allowing the identification of trends and root causes. Meanwhile a risk conscious culture is nurtured by engaging employees and propagating lessons learnt through a timely alert system.
Risk Management

About this Report / Performance Highlights 2019 / Chairman’s Message / General Manager’s Review / Organisational Overview / Strategic Report / Performance and Outlook / Stakeholder Value Creation / Financial Reports / Compliance Annexes / Supplementary Information
59
Operational Risk Performance in 2019
The Bank’s operational losses continued to be below the defined internal limits and the most significant operational losses arose from external frauds which primarily represent 47% of total operational losses. Vulnerabilities have been identified through root cause analysis and appropriate strategies have been deployed to address the lacunas during the year. Operational losses (by volume and value) are presented alongside.
38%
65%
15%
15%
47%
20%
Loss Data Analysis
n Internal Frauds
n External Frauds
n Clients, Products & Business Practices
n Execution, Delivery & Process Management
n DAM
2019
2018
Technology and Cyber RisksTechnology risk is the risks associated with the ownership, use, operation, involvement and adoption of IT within the Bank. This includes breakdowns and failures in IT systems, cyber-attacks, technological obsolescence, erosion of competitive position due to falling behind competitors and inadequate infrastructure to support business volumes among others.
With the Bank’s increasing thrust towards digitisation and the rising prevalence of cyber security threats in the landscape, the importance of effectively managing technology risks have become increasingly important. During the year, considerable focus was placed on enhancing the Bank’s cyber security and technology risk management framework with the following progress being made;
• Developed and updated Information Security related Policies, Guidelines, standards and procedures.
• Prepared the Cyber Security Framework for the Bank in alignment with leading Information Security/ Cyber Security standards and frameworks such as ISO 27001, Framework for Improving Critical Infrastructure Cybersecurity issued by National Institute of Standards and Technology, COBIT 5, CIS Critical Security Controls for Effective Cyber Defence.
• A detailed plan has been developed to monitor Information Security Management efforts/ activities which are done by different departments/ units.
• Prepared the Cyber Security Policy for Chennai Branch
• Prepared the Information Security Policy for Seychelles Branch
• Prepared the IT Risk Policy of Seychelles Branch
• Appointment of a dedicated Information Security Management Officer (ISMO) who reports to the Chief Information Security Officer(CISO).
Legal RiskLegal risks are the potential losses to earnings and reputational damage arising from non-compliance with regulatory/statutory provisions, uncertainty due to legal actions or uncertainty in the applicability or interpretation of relevant laws or regulation applicable to the bank.
The Bank’s legal exposures are mitigated through ongoing review of legally binding agreements by the Compliance and Legal functions of the Bank. The Bank’s policy framework, standards and internal procedures ensure the consistent and equitable treatment of all operational aspects, thereby effectively addressing potential legal risks. Periodic assessments are carried out by IIRMD to evaluate the legal risk of the bank.
Compliance RiskCompliance risk is the potential loss in earnings and/ or impact on the Bank’s reputation due to non-compliance with applicable laws, regulations, codes of conduct and standards of good practice.
The dedicated Compliance Officer is responsible for ensuring that the Bank is compliant with all relevant external regulations and internal guidelines. The Compliance Officer reports directly to the Board and his roles and responsibilities are clearly set out in the Board-approved Compliance Policy, which serves to provide guidance on how compliance risks are identified, monitored and managed by the Bank in a systematic and holistic manner.

BA
NK
OF
CE
YL
ON
AN
NU
AL
RE
PO
RT
20
19
60
About this Report / Performance Highlights 2019 / Chairman’s Message / General Manager’s Review / Organisational Overview / Strategic Report / Performance and Outlook / Stakeholder Value Creation / Financial Reports / Compliance Annexes / Supplementary Information
Key responsibilities of the Compliance
function;
• Advise the Board of Directors and Senior Management team on changes to the regulatory landscape and provide recommendations on implementing such changes
• Raise employee awareness on compliance
• Assessment of new products, business practices and/ or relationships for potential compliance risks
• Liaise with the regulator on all compliance related matters
During the year, there were no material instances of non-compliance pertaining to guidelines and/ or any social, economic, environmental regulations.
Strategic Risk Strategic risk is the potential losses arising from the possible flaws in the Bank’s future business plans and the possibilities of strategies being inadequate.
The Bank’s revolving three-year corporate plan clearly sets out its medium term strategic aspirations and is designed with the inputs of the Corporate and Executive Management team. The Board approves the corporate plan subsequent to extensive discussions with the management team. Objectives and action plans are cascaded to all business units and branches and implementation of the plan is monitored against defined targets. Strategic risk is addressed through consistently monitoring developments in the external landscape, ongoing engagement with stakeholders and the organisation-wide assessment of emerging industry dynamics. Comprehensive scorecards
are used to measure, monitor the Bank’s strategic risk exposures, and is included in the annual ICAAP.
Reputational Risk Reputational risks arise from the loss of confidence and negative perception of the Bank which can adversely impact earnings, assets, capital position and/ or brand value.
• During the year the Bank strengthened its Reputational Risk management framework by introducing a circular on the “Mitigation of Brand Reputational Risk” which clearly sets out the guidelines to be followed in incidents involving potential reputational damage.
• BoC is consistently ranked as one of the Sri Lanka’s leading brands and has maintained its position as the leading banking brand in the country for several years.
• Brand attributes of trust and stability
• Established track record of nearly 8 decades
• Numerous awards and accolades (refer page 89)
A comprehensive score card is used to measure and monitor the Bank’s reputational risk and is included in the annual ICAAP.
Capital Management The internationally applicable Basel III capital standards is aimed at strengthening the quality and quantity of capital in Banks, thereby ensuring that Banks are protected against insolvency. The new capital requirements under Basel III guidelines came into effect from 01.07.2017. Further to that, as per the new revisions of the BASEL guidelines, the CBSL has announced the revised capital buffer requirements for banks based on new criteria for determining Domestic Systematically Important Banks (D-SIBs). Accordingly, banks have now been categorised into D-SIBs bucket 1, D-SIBs bucket 2, D - SIBs 3 and non D-SIBs. BoC has been classified as a D-SIBs (Bucket 2) and the capital requirement for the Bank will remain at 10% for Tier I and 14% for Tier II.
As a state-bank, BoC can not access the equity market for capital injections and therefore must rely entirely on internal profit generation and Government injections. During the year, we adopted a strategy of balancing dividend pay-outs with capital retention, resulting in the Bank’s shareholders’ funds increasing by 8% to LKR 142.3 billion during the year. Meanwhile, frequent capital injections by the Government in previous years have also strengthened the Bank’s capital position.
End-December 2019 End-December 2018
Tier I CAR 11.16% 10.31%
Total CAR 15.58% 14.58%
Risk Management
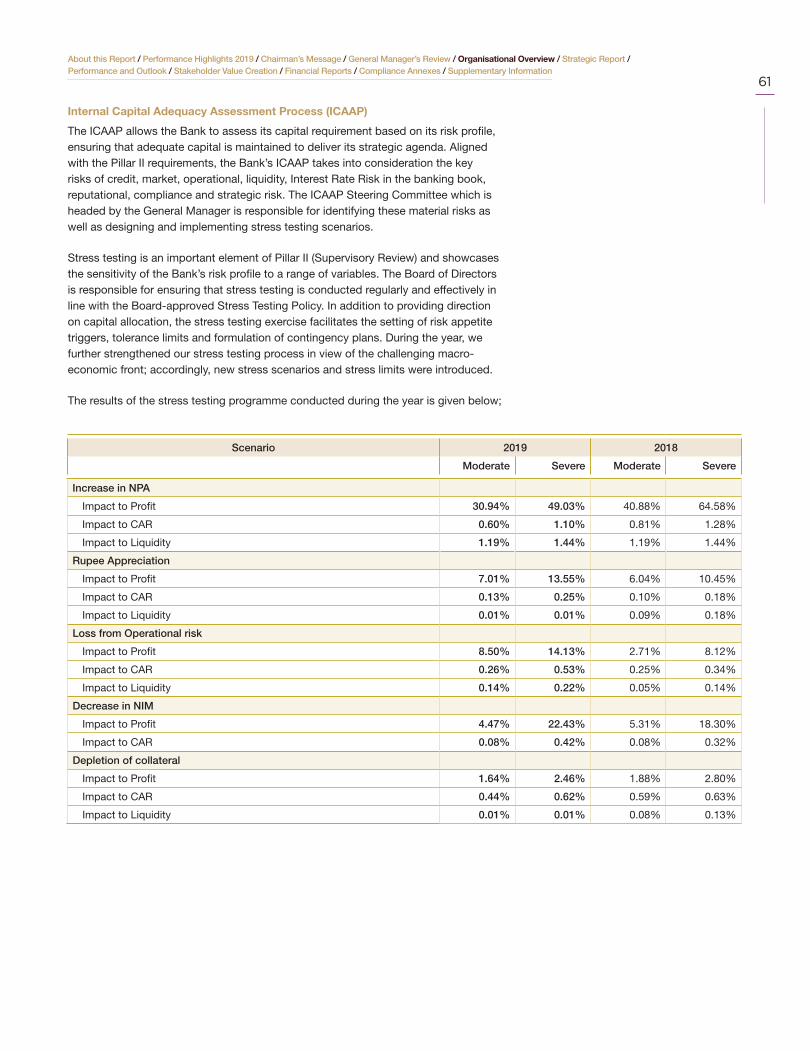
About this Report / Performance Highlights 2019 / Chairman’s Message / General Manager’s Review / Organisational Overview / Strategic Report / Performance and Outlook / Stakeholder Value Creation / Financial Reports / Compliance Annexes / Supplementary Information
61
Internal Capital Adequacy Assessment Process (ICAAP)
The ICAAP allows the Bank to assess its capital requirement based on its risk profile, ensuring that adequate capital is maintained to deliver its strategic agenda. Aligned with the Pillar II requirements, the Bank’s ICAAP takes into consideration the key risks of credit, market, operational, liquidity, Interest Rate Risk in the banking book, reputational, compliance and strategic risk. The ICAAP Steering Committee which is headed by the General Manager is responsible for identifying these material risks as well as designing and implementing stress testing scenarios.
Stress testing is an important element of Pillar II (Supervisory Review) and showcases the sensitivity of the Bank’s risk profile to a range of variables. The Board of Directors is responsible for ensuring that stress testing is conducted regularly and effectively in line with the Board-approved Stress Testing Policy. In addition to providing direction on capital allocation, the stress testing exercise facilitates the setting of risk appetite triggers, tolerance limits and formulation of contingency plans. During the year, we further strengthened our stress testing process in view of the challenging macro-economic front; accordingly, new stress scenarios and stress limits were introduced.
The results of the stress testing programme conducted during the year is given below;
Scenario 2019 2018
Moderate Severe Moderate Severe
Increase in NPA
Impact to Profit 30.94% 49.03% 40.88% 64.58%
Impact to CAR 0.60% 1.10% 0.81% 1.28%
Impact to Liquidity 1.19% 1.44% 1.19% 1.44%
Rupee Appreciation
Impact to Profit 7.01% 13.55% 6.04% 10.45%
Impact to CAR 0.13% 0.25% 0.10% 0.18%
Impact to Liquidity 0.01% 0.01% 0.09% 0.18%
Loss from Operational risk
Impact to Profit 8.50% 14.13% 2.71% 8.12%
Impact to CAR 0.26% 0.53% 0.25% 0.34%
Impact to Liquidity 0.14% 0.22% 0.05% 0.14%
Decrease in NIM
Impact to Profit 4.47% 22.43% 5.31% 18.30%
Impact to CAR 0.08% 0.42% 0.08% 0.32%
Depletion of collateral
Impact to Profit 1.64% 2.46% 1.88% 2.80%
Impact to CAR 0.44% 0.62% 0.59% 0.63%
Impact to Liquidity 0.01% 0.01% 0.08% 0.13%

Promoting digital literacy across the country
50% 66% 38% 15%Digitally Active
Customers
Growth in e-statement Subscribers
Investment in Digital
Infrastructure as a percentage of
CAPEX
YoY increasein Credit Card Subscribers
B-app and Smart online Banking Subscribers
Debit CardSubscribers
Merchant with BoC Smart Pay
395,900 20,0006.8NO. NO.
million
In recent years we have sought to widen our digitally active customer base through convenient and accessible platforms, thereby enhancing digital literacy across our extensive customer base.

About this Report / Performance Highlights 2019 / Chairman’s Message / General Manager’s Review / Organisational Overview / Strategic Report / Performance and Outlook / Stakeholder Value Creation / Financial Reports / Compliance Annexes / Supplementary Information
63
Strategy and Resource AllocationBoC annually engages in a comprehensive and organisation-wide review of its current business and competitive position with the objective of formulating a holistic strategy aimed at effectively responding to increasingly intensifying challenges and competition. This exercise culminated in the clear articulation of the Bank’s current position, where we want to be over the medium to long-term and how we plan to get there. The structural change in the Bank’s 2019 Annual Report aims to clearly reflect this approach and communicate our long-term strategic aspirations and how we intend to achieve them through defined strategies and action plans.
1
2
3Where We are NowThe Bank’s current market and competitive position was assessed through conducting a SWOT analysis which revealed potential threats that could erode the Bank’s competitive composition over the medium-to-long term.
Refer page 64
Where we want to BeStrategic priorities
Excellence in Customer Service
Leading the Digital Adoption
Retaining Market Leadership
Best in Sustainable Banking
Refer page 64
How we Plan to get thereStrategic enablers
Service Care and Customer Tangibility
Credit Culture and Quality
Technology and Cyber Security
Sustainable Business
Brand Building
Human Capacity Building
Our Presence
Good Governance, Ethics and Risk
Process Streamlining and Innovation
Refer page 65 -115
Strategic Report

BA
NK
OF
CE
YL
ON
AN
NU
AL
RE
PO
RT
20
19
64
About this Report / Performance Highlights 2019 / Chairman’s Message / General Manager’s Review / Organisational Overview / Strategic Report / Performance and Outlook / Stakeholder Value Creation / Financial Reports / Compliance Annexes / Supplementary Information
Where we are now
Market leadership63% customer penetration19% of industry assets22% of industry deposits20% of industry loans
Brand strengthNo.1 Banking brand associated with attributes of trust and credibility
Extensive branch reachUnmatched network of 1,880 customer contact points
State-ownershipTrust associated with state-ownership
Multi-generational workforceCombining industry experience with fresh perspectives
Strong balance sheetConsistent asset growth coupled with strong funding profile
International presenceThree overseas branches, one limited service branch and one subsidiary
675 Corresponding relationships
Limited appeal to Gen Z and younger demographics
Challenges in rolling-out new technologies due to size of operations and limited agility
Challenge in integrating Legacy systems
Difficulty in maintaining consistencies in service quality across the network due to extensive spread and size
Growth in customers looking for convenience banking
Increase in financial literacy
Emerging sustainable business practices in addressing social and environmental challenges
Government’s agenda in national development, digital literacy and sustainable finance
Island-wide growth in digital literacy in-line with the CBSL digital Financing road map
Growth in digital infrastructure in the country
Increasing competition from younger, agile banks and fintecs offering stronger digital propositions
Ever evolving Customer sophistication and need for convenient, seamless banking
Unprecedented changes in technology and risk of digital disruption
Challenges in attracting and retaining the right talent
Reduced brand loyalty among customers
Implications of climate change and natural hazards
S O TW
The Bank has identified four clear aspirations which will form the foundation of its competitive edge over the long-term. These objectives have taken into consideration, industry and external trends as well as the internal transformations required to successfully navigate the uncertainties presented by an increasingly challenging and dynamic operating landscape. These four aspirations are symbolic of “Where we want to be” over the long-term, thereby clearly defining the roadmap which would enable BoC to maintain its market leadership position while leveraging on its strengths to create sustainable, shared value.
Excellence in Customer ServiceEnsuring a consistent and superior customer service across all our brick and mortar and virtual platforms
Leading the Digital AdoptionTransforming the experience of both the internal and external customers through adopting cutting-edge technology
Best In Sustainable BankingEffectively address challenges prevalent in the economic, social and environmental sphere to proactive and meaningful solutions
Retaining Market LeadershipLeverage on the Bank’s brand strength and unmatched customer penetration to maintain market leadership position through efficient and effective managementof all assets, liabilities income sources and costs
Where we want to be

About this Report / Performance Highlights 2019 / Chairman’s Message / General Manager’s Review / Organisational Overview / Strategic Report / Performance and Outlook / Stakeholder Value Creation / Financial Reports / Compliance Annexes / Supplementary Information
65
In operation alising the Bank’s strategic agenda, we have identified nine strategic drivers which clearly set out the short, medium and long-term action plans required. The following table provides a high level of overview of these strategic drivers, the resource allocated in 2019 and the trade-offs, we anticipate that will have to be made. The remaining sections of this Report is structured to provide more detail on the progress we made in actioning each of these drivers.
How we plan to get there
Strategic Driver Initiatives/ progress made in 2019
Resources allocated
Capital trade-offs
Service Care and Customer Tangibility
Refer page 68 - 70
• Launch of four new products targeting specific market segments
• Consorted efforts on improving the soft skills of front office staff
• Research to identify the customer perception on Bank’s service quality
• Customer education/ financial literacy programmes for 17,740 customers
65 training programmes conducted with 6,959 total participations on customer service and soft skill development
Our intellectual capital will be strengthened as we nurture a culture of customer service and care across the organisation.
LKR 18.5 million investment in customer engagement
Credit Culture and Quality
Refer page 71 - 73
• Strengthened internal collection/recovery mechanisms through adopting automated/ digital solutions such as recovery workflows and introducing SMS alert facilities to both customers and employees
• Special training programmes for employees on Credit appraisal and management and Recovering.
• Recovery clinics and special Recovery campaigns
• Redesign existing SME loan products to better address customer needs
98 programmes conducted with5,010 participations on Credit management, evaluation and appraisal via 98 programmes
Over the short-term rising impairments have had an impact on the Bank’s financial performance; however, our efforts to work with our customers and offer them flexible payment options during these challenging times has augured well for strengthening customer relationships. Meanwhile, ongoing investment in enhancing employee credit appraisal and management skills are likely to strengthen the Bank’s intellectual capital.
Ongoing engagement with customers in partnering with them through challenging times
Technology and Cyber Security
Refer page 74 - 77
• Launch of QR code based mobile - payment app-BoC Smart pay
• Launch Hana EZ app in Collaboration with KEB Hana Bank for Sri Lankan migrant workers in South korea
• Investments in strengthening the Bank’s IT and Security infrastructure
• Corporate banking module for internet and mobile banking platforms - Smart online Banking Corporate module
• Increased migration of customers to e-statements and digital platforms
LKR 1,697.9 million investment in technology and digital infrastructure development.
Ongoing investment in technology and digital infrastructure will accrue significant long-term benefits in enhancing customer experiences and driving productivity improvements. On the other hand, human capital can be utilised for value-adding activities such as new business generation and strengthening customer relationships.
Continuous innovations on launching new products

BA
NK
OF
CE
YL
ON
AN
NU
AL
RE
PO
RT
20
19
66
About this Report / Performance Highlights 2019 / Chairman’s Message / General Manager’s Review / Organisational Overview / Strategic Report / Performance and Outlook / Stakeholder Value Creation / Financial Reports / Compliance Annexes / Supplementary Information
How we plan to get there
Strategic Driver Initiatives/ progress made in 2019
Resources allocated
Capital trade-offs
Sustainable Business
Refer page 78 - 86
• Contribution to national development through tax payments, supporting national infrastructure projects, promoting entrepreneurship and driving financial inclusion
• Investments in solar power generation and green buildings
• Refined the Bank’s CSR agenda to drive strategic and impactful initiatives mainly focused on child development and education and environmental conservation
Tax payments during the year amounting to LKR 17.1 billion
We see significant benefits in integrating the Bank’s sustainability agenda to its business strategy. Despite having a short-term adverse impact on financial capital, investments in solar and green buildings will have a positive long-term impact on reducing the Bank’s ecological footprint and carbon footprint. Ongoing investments in CSR initiatives will strengthen the Bank’s community relationships and ultimately enhance its brand value, resulting increase in Intellectual Capital
LKR 77.8 billion disbursed to the SME and micro-financing sector via scheme loans
Investment in CSR initiatives amounting toLKR 67.9 million
Brand Building
Refer page 87 - 89
• Investments in digital engagement to appeal to younger demographics
• Review and revision of the Brand policy
• Efforts to standardise the brand perception across all local and international customer touch points
• Investments on Brand surveys
LKR 748.3 million investment in brand building initiatives
Our branding initiatives are targeted at leveraging on existing brand strength while refreshing and evolving the brand to appeal to a younger demographics, thereby expand the Bank’s target market. Over the long-term this is expected to add to our intellectual capital and support business growth.
Human Capacity Building
Refer page 90 - 94
• Concerted efforts on up-skilling of employees to suit new level of banking
• Continuous training to newly recruits
• Ongoing investment in training and development with focus on continuous professional development
• Cordial industrial relations during the year
• Increase employee awareness on work-life balance
LKR 233.3 million investment in training and development
Over the long-term increasing investment in automation and digitisation will lead to a change in the required skill profile of employees. In order to address this transformation, the Bank will be required to make ongoing investments in strengthening a specific set of skills, particularly related to IT and data management.
47 Average hours of training per employer

About this Report / Performance Highlights 2019 / Chairman’s Message / General Manager’s Review / Organisational Overview / Strategic Report / Performance and Outlook / Stakeholder Value Creation / Financial Reports / Compliance Annexes / Supplementary Information
67
Strategic Driver Initiatives/ progress made in 2019
Resources allocated
Capital trade-offs
Our Presence
Refer page 95 - 96
• Continued expansion of our virtual channels
• Further expansion of the brick and mortar network through the addition of 159 new customer contact points
• Relocation of 22 No. of branches for better accessibility
• Support to customers in migrating to digital channels through customer assistance and awareness
LKR 1,697.9 million investments in furthering our digital footprint
Further expansion of the Bank’s physical and digital footprint will enable deeper customer penetration, allowing the Bank to enhance its social and relationship capital through acquiring new customers. Digital self-service channels will also support better customer experiences, enabling BoC to sharpen its edge in an intensely competitive market space, where digital offerings are playing an increasingly important role.
144 CRMs and CDMs added to network
Process Streamlining and Innovation
Refer page 99 - 115
• Seven workflow solutions introduced during the year
• Availed digital signature pads to 47 branches to drive increased automation
• Ongoing investments in automation and technology resulting in improvement in turnaround times
LKR 49.0 million investment in workflow automation and DMS in 2019
Productivity and efficiency improvements will support the Bank’s long-term profitability through sustained reductions in the cost to income ratio. On the other hand, as reliance on human capital for repetitive processes gradually decline, employees can be directed towards more value adding activities such as business generation.
Seven new workflows automated during the year
Good Governance Ethics and Risk
Refer page 97 - 98
• Appointment of new Board of Directors and comprehensive induction programme carried out
• Board engagement with the management in setting strategy
• Reviewed and revised key policies
• Employee training on anti-corruption and bribery
4,819 No.of employees trained during the year on internal control and compliance via classroom training
8,058 employees trained on compliance via distance education
Strong and robust governance practices support the sustainable creation of shared value, positively impacting key capitals such intellectual capital, financial capital and social and relationship capital over the long-term.

BA
NK
OF
CE
YL
ON
AN
NU
AL
RE
PO
RT
20
19
68
About this Report / Performance Highlights 2019 / Chairman’s Message / General Manager’s Review / Organisational Overview / Strategic Report / Performance and Outlook / Stakeholder Value Creation / Financial Reports / Compliance Annexes / Supplementary Information
1 Service Care and Customer TangibilityCustomers are at the heart of everything we do and increasing customer sophistication and competition has compelled us to rethink and enhance our value proposition to customers through offering innovative products and superior customer service.
Initiatives in 2019• Launch four new products targeting
specific market segments
• Customer Satisfaction Survey conducted by the Bank’s Research Unit
• Customer education/ financial literacy programmes for 17,740 customers
Products and Services
Page 69
Customer Experience
Page 69
Responsible Banking Practices
Page 70
Customer Education
Page 70
Capital Impacts/ Value Created
Enhance customer relationships
Strengthen tacit knowledge base through nurturing a service culture
Enhanced process efficiencies through DMS workflow automation
LKR 18.5 million investment in customer engagement
0
10
20
30
40
50
60
70
FD openingprocess
Debit cardissuingprocess
Corporateprior approval
process
Process Efficiencies
8 4.5
5 510 60
n 2018n 2019
Tim
e (m
inut
es)
FinancialCapital
IntellectualCapital
IntellectualCapital
Social andRelationshipCapital
0
10
20
30
40
50
60
70
2017 2018 2019
Customer Penetration
60 62 63
n Customer Penetration ratio (%)
How We Performed

About this Report / Performance Highlights 2019 / Chairman’s Message / General Manager’s Review / Organisational Overview / Strategic Report / Performance and Outlook / Stakeholder Value Creation / Financial Reports / Compliance Annexes / Supplementary Information
69
Our Customers
63%Customer Penetration
13.7millionCustomer Relationships
Customers by Gender
51% 49%
Products and ServicesOur base of over 13.7 million customers represent diverse demographic profiles, industry sectors and geographies. Our product proposition caters to the diverse needs of our large customer base through a wide array of investment, transactional and lending products. We continue to invest in understanding customer requirements through proactive customer engagement and designing solutions to cater to emerging customer needs.
Purpose Individuals SMEs Corporates Government
institutions
Invest and save
excess funds
Time deposits, other investment products and debentures
Savings accounts
Transact with and
manage funds
Current accounts for daily transactions
Cash management solutions
Lending solutions
Personal loans
Home loans
Education Loan
Overdrafts and Leasing facilities
Scheme loan
Commercial loans including Project loans
Term loans and Trade finance
Syndicate funding
Payment solutions Debit/ Credit and
Travel Cards
Mobile banking
Online banking facilities
International
services
Inward and outward remittances
Correspondent banking and Trade services
New products launched/ refined and relaunched in 2019 included,
• Smart Saver - Personal foreign currency savings, offering multi-currency solutions for the first time in the industry
• 'Sansada' special account for Associations and Clubs
• Smart Lady-Special investment plan for ladies
• QR based mobile payment solution BoC Smart pay app
Customer ExperienceCohesive efforts are underway to provide a consistent customer
experience across our extensive network of customer touch points. Time taken to perform over the counter transactions at Branches are monitored allowing the identification of process bottlenecks and remedial action taken to improve turnaround times. Strategic focus on implementing Document Management System (DMS) and workflow automation have led to significant improvements in turnaround times, positively impacting the customer experience.
0.0
0.5
1.0
1.5
2.0
2.5
3.0
3.5
Customers by Region
3.3
1.6
1.6
1.0
0.9
1.3
1.2 1.31.
5
No.
of c
usto
mer
s (m
illio
n)
Wes
tern
Sou
ther
n
Cen
tral
Not
hern
Eas
tern
Nor
th C
entr
al
Nor
th W
este
rn
Sab
arag
amuw
a
Uva

BA
NK
OF
CE
YL
ON
AN
NU
AL
RE
PO
RT
20
19
70
About this Report / Performance Highlights 2019 / Chairman’s Message / General Manager’s Review / Organisational Overview / Strategic Report / Performance and Outlook / Stakeholder Value Creation / Financial Reports / Compliance Annexes / Supplementary Information
Process Efficiencies Obtained via DMS and workflow Automation
Manual Process Automated Process
Recovery monitoring module - overdrafts 7 days 1 day
FD opening process 8 minutes 4 - 5 minutes
Account transfer process 5 days 3 days
Debit card issuance 10 minutes 5 minutes
Covering approval process 30 minutes 5 minutes
Corporate prior approval process 60 minutes 5 minutes
Single view solution 15 minutes less than a minute
Responsible Banking PracticesAs a state-owned, Domestic Systemically Important Bank which controls more than 19% of the Banking sector assets, we are cognisant of the role we play in maintaining public confidence in the financial system. To this end, the Bank is deeply committed to engaging in responsible and sustainable banking practices. BoC adopts the CBSL Customer Charter which clearly defines customer obligations and standards for fair banking practices. Relevant information such as interest rates, maturity periods and other terms and conditions are clearly communicated to customers in the language of their preference. During the year there were no incidences of non-compliance to regulations/ voluntary codes pertaining to marketing communications and breach a customer privacy and loss of customer data.
Customer EducationAs a Bank with a strong rural presence, we are aware of the role we can play in nurturing financial
discipline and literacy in the communities we operate in. Our business verticals
conducted several ongoing customer education programmes and progress made during the year is as follows;
Customer Awareness Programmes
Programme name and details Target group No. of participants
SME Customer Awareness Programmes
- By BoC
- in collaboration with Ceylon Chamber of Commerce
Micro, Small and Medium Entrepreneurs (both customers and non-customers of BoC)
946
Programme to strengthen the SME sector
344
Financial Literacy Programmes Low income earning individuals 1,450
Awareness campaign for migrant employees
185 campaigns targeting migrant workers, their families and intended migrant workers
15,000
WayForward
Product rationalisation and re-launch to appeal the customer sentiments
New products targeting e-commerce transactions
Ongoing efforts to offer consistent customer experience across touch points
Efforts to improve internal and external Branch architecture to improve customer convenience
Special drive for digital adoption to reduce floor level customer rush
1 Service Care and Customer Tangibility
The quality of the customer experience and overall customer satisfaction is tracked through regular customer surveys conducted by the Bank’s Research Unit. Findings of these engagements are key in formulating our customer service strategy.
- Attending quickly for change requests by customer
- Delivering an efficient and effective service within the expected time
- Time taken to provide the service- Attractiveness of marketing
materials
- Helping customers at peak hours
- Physical appearance of the Branches
- Parking facilities at Branches
Customer satisfaction survey results of Western province customers 2019.

About this Report / Performance Highlights 2019 / Chairman’s Message / General Manager’s Review / Organisational Overview / Strategic Report / Performance and Outlook / Stakeholder Value Creation / Financial Reports / Compliance Annexes / Supplementary Information
71
2 Credit Culture and Quality
The moderation in economic conditions in 2019 led to an industry-wide deterioration in portfolio quality, compelling the Bank to take proactive action to strengthen its collection and monitoring mechanisms.
Initiatives in 2019• Strengthened internal collection/
recovery mechanisms through adopting automated/ digital solutions such as recovery workflows and SMS alerts to branches/ customers
• Established project financing unit
• 5,010 participations for training provided on credit appraisal and management
• Introduce stringent follow up process for recovery (Recovery diary)
Credit Management
Page 72Credit Governance
Page 72
Credit Awareness
Page 72
Recoveries
Page 73
Enhance employee credit related skills through targeted training
Nurturing a credit conscious culture
Adverse impact on financial capital stemming from rising impairments
Strengthen customer relationships through offering guidance, flexible repayment options
How We Performed
• 3,785 participations for training on Recovery
• Recovery clinics and special recovery campaigns conducted on each province
• New business opportunities in trade finance
- Conformation adding service for third party LCs
- Stand by LC arrangement with international banks
0
300
600
900
1,200
1,500
1,800
2015 2016 2017 2018 2019
Portfolio Growth vs Portfolio Quality
12.8
0
1
2
3
4
5
6
4.34.8
2.9
2.9
3.6
869
1,04
7
1,22
0
1,51
0
1,64
913
.4
n Laons and advances Gross NPL ratio (%)
LKR
billi
on
Gro
ss N
PL
ratio
(%)
0
1
2
3
4
5
6
Variation of PortfolioQuality within the Year
4.7
5.3 5.4
4.8
Gross NPL ratio (%)
Mar
-19
Jun-
19
Sep
-19
Dec
-19
Capital Impacts/Value Created
FinancialCapital
HumanCapital
IntellectualCapital
Social andRelationshipCapital

BA
NK
OF
CE
YL
ON
AN
NU
AL
RE
PO
RT
20
19
72
About this Report / Performance Highlights 2019 / Chairman’s Message / General Manager’s Review / Organisational Overview / Strategic Report / Performance and Outlook / Stakeholder Value Creation / Financial Reports / Compliance Annexes / Supplementary Information
Portfolio Quality The industry witnessed a broad-based deterioration in portfolio quality, with the average gross NPL ratio increasing to 4.8% in December 2019, from 3.6% the previous year. Cash flow stresses were evident across key economic sectors including tourism, agriculture and construction.
In this backdrop, BoC performed better than its industry peers to record a gross NPL ratio of 4.8% as at end of year 2019.
4.8%Gross NPL ratio
The Bank has built LKR 99.0 billion impairment provision reserve in compliance with SLFRS 09 - expected credit loss method.
Impairment reserve coverage as a percentage of Gross Loan is 6%
2 Credit Culture and Quality
Credit GovernanceClearly defined governance structure ensure the effective segregation of responsibilities for credit appraisal, collections, review and monitoring. Processes, tools and mechanisms are defined through policies and procedure manuals ensuring the effectiveness of the collection and recovery mechanisms.
A dedicated Credit Committee (at Executive level) is responsible for formulating, reviewing and revising policies and procedures for granting credit facilities. The Committee also monitors portfolio exposures, concentration risks and portfolio quality indicators on a regular basis. The Bank’s Credit Management is supported by a suite of comprehensive policies, clearly defined authority limits and procedures.
Credit Management
Following the Easter Sunday attacks the Government introduced a moratorium for Tourism Sector which was badly affected. The Bank spent considerable amount of time and resources in helping its customers during the difficult time.
Dedicated Relationship Managers engage proactively with all corporate customers and during the year focus was placed on providing advisory services and guidance to support customers through challenging times. Measures adopted included proactive monitoring,
regular customer visits, restructuring of facilities, awareness programmes and workshops, knowledge sharing with exporters/ importers and advisory role on cash flow management.
However, this did not allow the Bank to deviate from its strategic direction towards achieving efficient credit approval process via increase digitisation and developing skilled Credit Officers through special and focused training. Also, two workflow automations went live during the year for covering approval and corporate prior approval processes by significantly reducing operational times of those.
The Corporate segment also identified potential customers in booming sectors in the economy such as ship and boat manufacturing, wellness tourism, electrical equipment manufacturing etc. and started working closely with the emerging businesses in these segments.
Credit AwarenessOrganisation-wide measures were taken to enhance employee credit appraisal and management skills and nurture a risk-conscious culture across the Bank.
We also made considerable investments in upskilling the credit appraisal and credit management skills of our employees through several targeted training programmes held both at Head Office and provincial level;
Upgrading Skills on Credit Management and Recoveries
Programme objective and Details No. of programme
No. of participations
Training on lending 92 4,966
Special training programme on credit 01 06
Overseas training programme on credit 04 09
Elements of advance credit appraisal 01 29
Programme on collection and recovery 51 3,780
Special programme on recovery 02 05
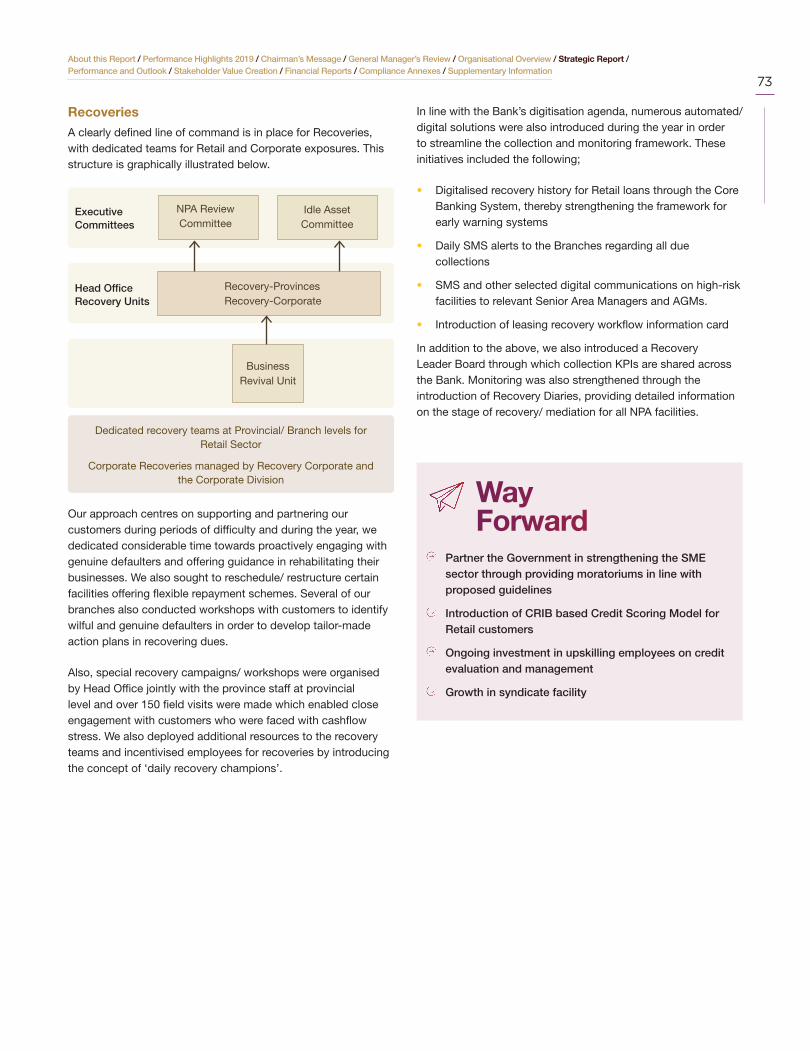
About this Report / Performance Highlights 2019 / Chairman’s Message / General Manager’s Review / Organisational Overview / Strategic Report / Performance and Outlook / Stakeholder Value Creation / Financial Reports / Compliance Annexes / Supplementary Information
73
RecoveriesA clearly defined line of command is in place for Recoveries, with dedicated teams for Retail and Corporate exposures. This structure is graphically illustrated below.
Head OfficeRecovery Units
Recovery-ProvincesRecovery-Corporate
Dedicated recovery teams at Provincial/ Branch levels for Retail Sector
Corporate Recoveries managed by Recovery Corporate and the Corporate Division
Business Revival Unit
Idle AssetCommittee
NPA Review Committee
Executive Committees
Our approach centres on supporting and partnering our customers during periods of difficulty and during the year, we dedicated considerable time towards proactively engaging with genuine defaulters and offering guidance in rehabilitating their businesses. We also sought to reschedule/ restructure certain facilities offering flexible repayment schemes. Several of our branches also conducted workshops with customers to identify wilful and genuine defaulters in order to develop tailor-made action plans in recovering dues.
Also, special recovery campaigns/ workshops were organised by Head Office jointly with the province staff at provincial level and over 150 field visits were made which enabled close engagement with customers who were faced with cashflow stress. We also deployed additional resources to the recovery teams and incentivised employees for recoveries by introducing the concept of ‘daily recovery champions’.
WayForward
Partner the Government in strengthening the SME sector through providing moratoriums in line with proposed guidelines
Introduction of CRIB based Credit Scoring Model for Retail customers
Ongoing investment in upskilling employees on credit evaluation and management
Growth in syndicate facility
In line with the Bank’s digitisation agenda, numerous automated/ digital solutions were also introduced during the year in order to streamline the collection and monitoring framework. These initiatives included the following;
• Digitalised recovery history for Retail loans through the Core Banking System, thereby strengthening the framework for early warning systems
• Daily SMS alerts to the Branches regarding all due collections
• SMS and other selected digital communications on high-risk facilities to relevant Senior Area Managers and AGMs.
• Introduction of leasing recovery workflow information card
In addition to the above, we also introduced a Recovery Leader Board through which collection KPIs are shared across the Bank. Monitoring was also strengthened through the introduction of Recovery Diaries, providing detailed information on the stage of recovery/ mediation for all NPA facilities.

BA
NK
OF
CE
YL
ON
AN
NU
AL
RE
PO
RT
20
19
74
About this Report / Performance Highlights 2019 / Chairman’s Message / General Manager’s Review / Organisational Overview / Strategic Report / Performance and Outlook / Stakeholder Value Creation / Financial Reports / Compliance Annexes / Supplementary Information
3 Technology and Cyber Security
Our goal is to transform the customer experience through embracing emerging technologies which enable automation, increase efficiencies deep data analytics and seamless banking.
Initiatives in 2019• Launch of QR code based mobile-
payment app, BoC Smart Pay
• Corporate banking module under new internet and mobile banking platform
• RPA introduce to hold debit card on customer request
• Commenced establishment of a state-of-the-art data centre
IT Governance and Strategy
Page 75
Seamless banking
Page 75
IT Infrastructure
Page 76IT Security
Page 77
LKR 1,697.9 million investments in digital infrastructure
Enhance customer experience
Process efficiencies and productivity improvements
Expansion of IT system required to introduce virtual channels
• Strengthened the IT Security infrastructure
• Introduce privilege access management solution and Mobile Device Management (MDM) Solution
• Upgrade endpoints of Branch network
How We Performed
143% Growth in smart online banking subscribers
66% Growth in e-statement subscribers
137% Growth in smart pass book subscribers
Capital Impacts/ Value Created
FinancialCapital
ManufacturedCapital
IntellectualCapital
Social andRelationshipCapital
0
10,000
20,000
30,000
40,000
50,000
60,000
70,000
80,000
2017 2018 2019
Growth in Digital Transactions
70,1
95
0
500
1,000
1,500
2,000
2,500
1,913
2,373
2,075
71,6
40
78,2
93
n Debit card transactions Credit card transactions
No.
000
No.
000

About this Report / Performance Highlights 2019 / Chairman’s Message / General Manager’s Review / Organisational Overview / Strategic Report / Performance and Outlook / Stakeholder Value Creation / Financial Reports / Compliance Annexes / Supplementary Information
75
IT Governance and StrategyDigital transformation is central to the Bank’s long-term strategy and our agenda is driven through decisive leadership, timely investments and organisational culture change. At Board level, the Information and Communication Technology Committee has oversight responsibility for the Bank’s digital strategy and relevant policies while formulating and implementation is driven through the IT Department and Product and Banking Development Division.
Our long-term digital strategy is aligned to the Government of Sri Lanka’s National Digital Policy and the Digital Road Map launched by Central Bank of Sri Lanka. Key elements of our digital transformation are as follows;
Delivery ChannelsOffering accessible channels which allow customers to transact with the Bank at their convenience
AutomationAutomating
workflows through RPA technology
to drive increased resource efficiency
and accuracy
Seamless BankingIntegrated solutions which facilitate a seamless experience across delivery platforms
Analytics and Data EnrichmentsData analytics and
enrichmentsJ to facilitate better
decision making and effective risk
management
Digital InteractionTransforming customer engagements through digital interactions
Paperless Banking
Reduce paper consumption and improve process
turnaround times through Document Management System (DMS)
Responsive Banking Smart Banking
Seamless BankingDigital propositions offered by banks are emerging as a key source of competitive advantage and BoC has continued to make inroads in enhancing its digital offering to customers. Our digitally active customer base increased by 16% to 6.8 million during the year. During the year also we made significant progress by introducing QR based BoC smart pay payment app and further developing our mobile app, card proposition and other self-service platforms as summarised below.
Growth in digitaly active customers
16%YOY
Average daily transaction volumes
50%Digitally activecustomers
244,525ATM/ CDM/ CRM transactions:
214,502Debit card transactions:
6,501Credit card transactions:
22,870Smart Online Banking and B app transactions:
243BOC Smart pay:

BA
NK
OF
CE
YL
ON
AN
NU
AL
RE
PO
RT
20
19
76
About this Report / Performance Highlights 2019 / Chairman’s Message / General Manager’s Review / Organisational Overview / Strategic Report / Performance and Outlook / Stakeholder Value Creation / Financial Reports / Compliance Annexes / Supplementary Information
New digital products/ features added during the year
3 Technology and Cyber Security
QR code based mobile payment app - BoC Smart Pay
BoC introduced a QR code based mobile payment app ‘BoC Smart Pay’ catering for low value transactions and bill payments. This initiative is aligned with the CBSL’s long-term goal of digitalising low value payments and reducing the use of physical cash.
BoC Smart Pay: 65,000 customers and 20,000 merchants
Card proposition
§ Customer migration
§ Introduced e-commerce enabled debit cards
Credit card subscribers 117,750 - YoY 15% increase
Debit card subscribers 6.8 million - YoY 51% increase
Software upgrades
§ Commenced implementation of a new Trade Finance software
§ Development of new financial reporting system
Smart Passbook
The Smart Passbook is a digital value addition providing access to transactions and balance history on a real time basis through smart mobile devices.
In 2019, modifications were made to launch this facility for our Overseas Branches as well.
Customers: 375,096 (137%)
Corporate proposition
In 2019, the Bank implemented the corporate banking module of the internet and mobile banking platforms.
Partnering the eco - system
Investments in setting up an Internet Payment Gateway with Government institutions.
Refer page 95 for further information on our digital delivery channels
Refer page 75 for further information on our digital interactions
IT InfrastructureInvestments in digital infrastructure have dominated the Bank’s capital expenditure in recent years; in 2019 such investments accounted for 38% (or LKR 1,697.9 million) of annual capex. Key areas of IT investment during the year included,
• State-of-the-art Data Centre: Establishment of a new tier III data centre commenced during the year and plan to complete in 2020
• Enhanced the CRM network with the addition of 143 new CRMs during the year.
• Backup communication links for Overseas Branches provided to Male and Chennai Branches with the objective of improving availability and band with.
• Consolidated Data Backup System to facilitate regular backups for an array of systems.
• Upgrade endpoints of branch network with 1,000 personal computers replaced in 2019.
• Enhance Disaster Recovery Facilities for critical systems including card application and inward remittance systems etc.
• Dual links for all Branches
B-app and smart online Banking: 395,900 subscribers (143%)
B-app and Smart Online Banking
During the year enhanced security features were added to these platforms.

About this Report / Performance Highlights 2019 / Chairman’s Message / General Manager’s Review / Organisational Overview / Strategic Report / Performance and Outlook / Stakeholder Value Creation / Financial Reports / Compliance Annexes / Supplementary Information
77
IT SecurityThe Bank’s increasing thrust towards digitisation have led to a parallel increase in the exposure to related IT vulnerabilities. As a financial institution we have access to confidential customer data and continually seek to minimise exposure to cyber and other IT risks through comprehensive policies, upgrading infrastructure and strengthening network security among others. The effectiveness of our IT security infrastructure and approach to managing IT risks is regularly evaluated through vulnerability assessments, penetration testing and disaster recovery drills.
Key initiatives taken in 2019 to enhance
IT Security include the following;
• Completion of the Security Operations Centre (SOC): The Bank’s SOC aims to detect, analyse, and respond to cyber security incidents. Upon discovery, any issues are addressed in partnership with the Bank’s IT Security team.
• Data Loss Prevention Solution (DLP): DLP software products use business rules to classify and protect confidential and critical information so that unauthorised end users cannot accidentally or maliciously share data whose disclosure could put the organisation at risk. During the year we commenced the procurement process to acquire a DLP solution with data classification.
• Advance Threat Protection (ATP) for servers and end points: Advanced Threat Protection aims to defend against sophisticated malware or hacking-based attacks targeting sensitive data. The solution monitors critical activity and enforces configurations to assess risk and maintain system integrity. It also features built-in file-integrity monitoring, device control, and memory protection to block unauthorised change and ability of application white listing to execute only authorised software.
• Vulnerability assessment and Penetration test conducted by an independent third party
• Internal vulnerability assessments conducted by the BoC IT Security team four times a year
• IT infrastructure security review for Overseas Branches conducted for the Chennai Branch during the year
In addition to the above, the Bank has introduced secure authentication for card payments, Mobile Device Management solutions and privilege access management. During the year there were no major vulnerabilities, external threats and/ or substantiated complaints regarding breaches of customer privacy and loss of customer data.
WayForward
As Sri Lanka’s largest financial institution, we believe we have an important role to play in supporting the aspirations of the country’s National Digital Policy and the CBSL Digital Road Map. As such, in addition to the Bank’s business strategy, our future investments in IT will be aligned to the key pillars set out by the Digital Road Map as listed below;
Smart Money
Facilitate utility bill payments through dynamic QR code solutionsLink to the common POS switch and QR code systemNFC enabled ATM network
SmartTransportation
Electronic transport card for public transport/ parking
In addition to the above, key areas of focus for 2020 includes the update of the Windows Operating System, further enhancing digital solutions to customers, particularly through expanding the digital delivery channels and strengthening the IT security infrastructure.
0
500
1,000
1,500
2,000
2017 2018 2019
Capital Expenditure inDigital Infrastructure
1,69
3
4245
38
0
15
30
45
60
1,96
3
1,69
8
n Total capex Percentage of Capex in digital infrastructure (%)
LKR
milli
on

BA
NK
OF
CE
YL
ON
AN
NU
AL
RE
PO
RT
20
19
78
About this Report / Performance Highlights 2019 / Chairman’s Message / General Manager’s Review / Organisational Overview / Strategic Report / Performance and Outlook / Stakeholder Value Creation / Financial Reports / Compliance Annexes / Supplementary Information
4 Sustainable Business
With social and environmental challenges becoming increasingly pervasive, we have come to realise the significance of the role we can and should play in addressing income inequalities, impacts of climate change and other emerging issues. The Bank’s cohesive and strategic approach to Sustainable Business enables us to contribute to the achievement of the SDGs while creating long-term value for our stakeholders.
Initiatives in 2019• LKR 17.1 billion tax payment to the
Government along with substantial funding disbursed towards national infrastructure development
• LR 77.8 billion disbursed to the SME and micro-financing sectors via scheme loans
• LKR 70.8 million investment in solar projects of the Bank
• Refined the Bank’s CSR agenda to drive strategic and impactful initiatives focused mainly on education, environmental conservation and good health and wellbeing
• Achieved full compliance to social and environmental regulations and standards
Sustainability Governance
Page 79
BoC's approach to Sustainability
Page 79
Social Sustainability
Page 82Environmental Sustainability
Page 83
Securing funding via DFls to lend towards economically, socially and environmentally sustainable initiatives
Contributing towards island-wide socio-economic empowerment
Investment in Strategic CSR initiatives
Climate action through lending to renewable energy
How We Performed
Capital Impacts/ Value Created
FinancialCapital
NaturalCapital
Social andRelationshipCapital
Social andRelationshipCapital
83%
7%
7%3%
Scope wise breakdown ofGHG Emission 2019
n On site energy
n Fugititive emission
n Bank own vehicle
n Purchase electricity

About this Report / Performance Highlights 2019 / Chairman’s Message / General Manager’s Review / Organisational Overview / Strategic Report / Performance and Outlook / Stakeholder Value Creation / Financial Reports / Compliance Annexes / Supplementary Information
79
BoC’s approach to SustainabilityBoC adopts a strategic and systematic approach in embedding its sustainability objectives to its business strategy and daily operations. The Bank’s approach to Sustainability is clearly outlined in a Board-approved Sustainability Policy, which is reviewed annually. As one of Sri Lanka’s most impactful organisations, the Bank is cognisant of the role it can play in propagating sustainability across geographies and communities. Our policy is centred on the tenet that “Sustainability is a Lifestyle” and focuses on the three main dimensions of economic, environmental and social sustainability.
Precautionary Principle: While the Bank has not formally adopted the Precautionary Principle, environmental and social factors are given due consideration when conducting feasibility studies and appraising investments. The Bank has started implementing ESMS policy guidelines in its credit evaluation.
Key objectives of the Sustainability
Policy are as follows;
• Integrate sustainability into key business decisions and initiatives
• Uplifting society’s most needed segments
• Financial inclusion
• Promote ethical finance
• Promote green economic growth
• Maintain healthy supplier relationships and responsible supplier contracts
Refer web.boc.lk for further information
Sustainability framework at BoC
CorporateValues
Stakeholder Engagement
Policy coverage
DisclosureManagement
and Governance
Impacts, Risks and
Opportunities
Economic
� Driving financial inclusion
� Contribution to Government
� Partner in national development projects
Social
Strategic CSR
Philanthropy
Employee relations
Environmental
� Manage carbon footprint
� Propergating environmental literacy
� Promoting renewable energy
� Conservation related CSR initiatives
Operating philosophy of the Bank including communication and relevance of values
Stakeholder identification
Stakeholder interaction
Stakeholder feedback
Response
Identifying impacts
Assessment of risks and opportunities
Monitoring and review
Sustainability Policy
HR policy
Communication policy
Clearly defined governance structures and procedures
External frameworks
Track sustainability performance
Global reporting frameworks for sustainability reporting
External assurance
Sustainability GovernanceWhile the Board provides oversight on all Sustainability-related matters, responsibility for developing the policies lies with the Sustainability Committee, which is chaired by the General Manager. The Committee is represented by DGMs of the key business verticals and support functions including Chief Financial Officer, Chief Risk Officer and Chief Marketing Officer among others.
The mandate of the Sustainability Committee includes,
• Develop and timely revisions of Sustainability Policy• Evaluate, promote and approve sustainability initiatives in line with the
Sustainability Policy• Regularly monitoring the progress of the sustainability projects• Integrate sustainability considerations into the Bank’s overall strategy and daily
operations
Board of Directors
Sustainability Committee
Sustainability Unit
General Manager/ CEO, Chief Financial Officer, Chief Risk Officer, DGM - Finance and Planning, DGM-Corporate
and Offshore Banking, DGM-Product and Banking Development, DGM-Sales and Channel Management,
DGM-Support Services, DGM- Human Resources, DGM-Retail Banking, Chief Marketing Officer
Secretary to the committee: AGM-Budget, Strategic Planning and MIS

BA
NK
OF
CE
YL
ON
AN
NU
AL
RE
PO
RT
20
19
80
About this Report / Performance Highlights 2019 / Chairman’s Message / General Manager’s Review / Organisational Overview / Strategic Report / Performance and Outlook / Stakeholder Value Creation / Financial Reports / Compliance Annexes / Supplementary Information
The Bank’s Sustainability Unit is responsible for operationalising and co-ordinating all sustainability initiatives, initiated by the Bank as its own projects. The Unit also engages in sustainability reporting aspects and actively engages with internal and external stakeholders in operationalising the Bank’s sustainability agenda.
Refer web.boc.lk for further information
4 Sustainable Business
As a single entity, the Bank is one of the largest contributors to national revenue and its value creation to the Government takes the form of income tax, financial VAT, NBT, Debt Repayment Levy (DRL) as well as dividend payments. In 2019 total value creation to Government amounted to LKR. 18.1 billion
As a key lender to the Government, we continue to finance large scale
infrastructure projects with long gestation periods undertaken by the Government of Sri Lanka. Also we equally fund for private sector for their large scale development projects
The Bank supports the Government’s funding requirements through investments in Government securities of Sri Lankan Government. In 2019 total Government security investments amounted to LKR 571.3 billion or 24% of its total assets.
Economic Sustainability
Economic Contribution
As Bankers to the Nation, BoC’s growth strategy is closely aligned to that of the country’s development agenda and it is an unmatched contributor to the country’s socio-economic progress. The Bank’s strategy and long-term goals are therefore formulated with due consideration given to the broader economic benefits stemming from its operations; these extend beyond financial return to encompass several socio-economic priorities; BoC’s contribution to the country’s economic development is summarised below.
Contribution toGovernment Revenue
Partnering NationalDevelopment
Investments inGovernment Securities
0
5
10
15
20
25
30
35
2015 20172016
LKR
bill
ion
2018 2019
Value Creation to the Government
nTaxes on Financial services nIncome tax nDivident payment
4.8
106.
3
6.6
6.5
17.3
7.2
8.9
12.3
9.6
12.4
4.8
117
0.3
0
100
200
300
400
500
600
2015 20172016
LKR
bill
ion
2018 2019
Investment in GovernmentSecurities - Five year summary
nTreasury bill nTreasury BondsnOthers
33.4
222.
622
0.1
28.8
220.
117
7.4
114.
020
7.4
200.
7
90.9
249.
221
1.3
97.2
266.
020
8.1
LKR 28.3 billion for road development projects
LKR 2.1 billion for power generation projects
LKR 24.0 billion for transport sector
LKR 37.6 billion for tourism sector

About this Report / Performance Highlights 2019 / Chairman’s Message / General Manager’s Review / Organisational Overview / Strategic Report / Performance and Outlook / Stakeholder Value Creation / Financial Reports / Compliance Annexes / Supplementary Information
81
The Bank is a Participatory Financial Institution (PFI) in 33 credit schemes aimed towards developing micro, small and medium entrepreneurs. In 2019, BoC disbursed LKR 77.8 billion via scheme loans to the micro and SME sectors of which LKR 3,475.2 million was channelled to the Northern and Eastern provinces.
We seek to position the Bank as Sri Lanka’s Local International Bank through widening our footprint in regional economies and strengthening our international relationships.
DevelopingEntrepreneurship
Sri Lanka’s LocalInternational Bank
Agriculture and Agro processing
Animal husbandry
Aqua culture
Renewable energy
Others
LKR 77.8 billion disbursed to the SME Sector via scheme loans
51,164 loans disbursed during the year 2019 for SMEs via scheme loans
3Foreign
branches
LKR 524.7 billionRemittances facilitated
Foreign currency
24%
675Correspondent relationships
Driving Financial Inclusion
Promoting financial inclusion through providing
access to affordable funding is central to the Bank’s economic objectives. Financial inclusion is facilitated through the Bank’s extensive network of customer contact points, micro-financing facilities targeted at the country’s most underserved segments and ongoing investments in financial literacy and capacity building programmes. The progress made during the year is summarised below;
§ Customer contact points in economically disadvantaged areas
The Bank’s network extends to the most rural areas in the country, enabling it to support the the country’s hitherto unbanked segments through lending and investment solutions. Meanwhile, the Branch on Wheels concept features a mobile banking unit which allows rural customers to perform a range of banking transactions without visiting a branch. As at end-December 2019, the Bank operated 159 branches and 412 contact points in economically disadvantaged areas and 11 Branch on Wheels serving marginalised communities.
§ Disbursements under development loan schemes and other credit schemes
BoC is a PFI in over 33 credit schemes which channel funds to underserved segments of society. These include; but not limited to schemes catering to SMEs that have previously not borrowed from a bank (SMELoC), women-led SMEs, agriculture, fishery and dairy sector SMEs and entities outside the Western Province. During the year, the Bank disbursed LKR 20.0 billion through over 33 funding schemes, benefitting a base of over 36,276 individuals, acting as PFI for those schemes
New development loan schemes in 2019
• City Ride: loan scheme for private bus owners and transport providers of export companies
• Rekawarana: for day care centres and elders’ homes
• Mini-taxi electric three wheeler scheme
• Special credit packages for the tourism industry
§ Micro-finance lending
The Bank has partnered with several Government institutions and other
agencies in channelling funds to the country’s micro enterprise sector through credit schemes. The 'Mithuru' micro-financing programme is the Bank’s own initiative, through which Mithuru groups and societies are formed for mutually guaranteed lending. Funds are disbursed primarily for entrepreneurial ventures and are aimed towards communities which otherwise do not have access to formal funding. The Bank also supports these enterprises through facilitating market linkages to sell their products through organising ‘Mithuru pola’ markets.
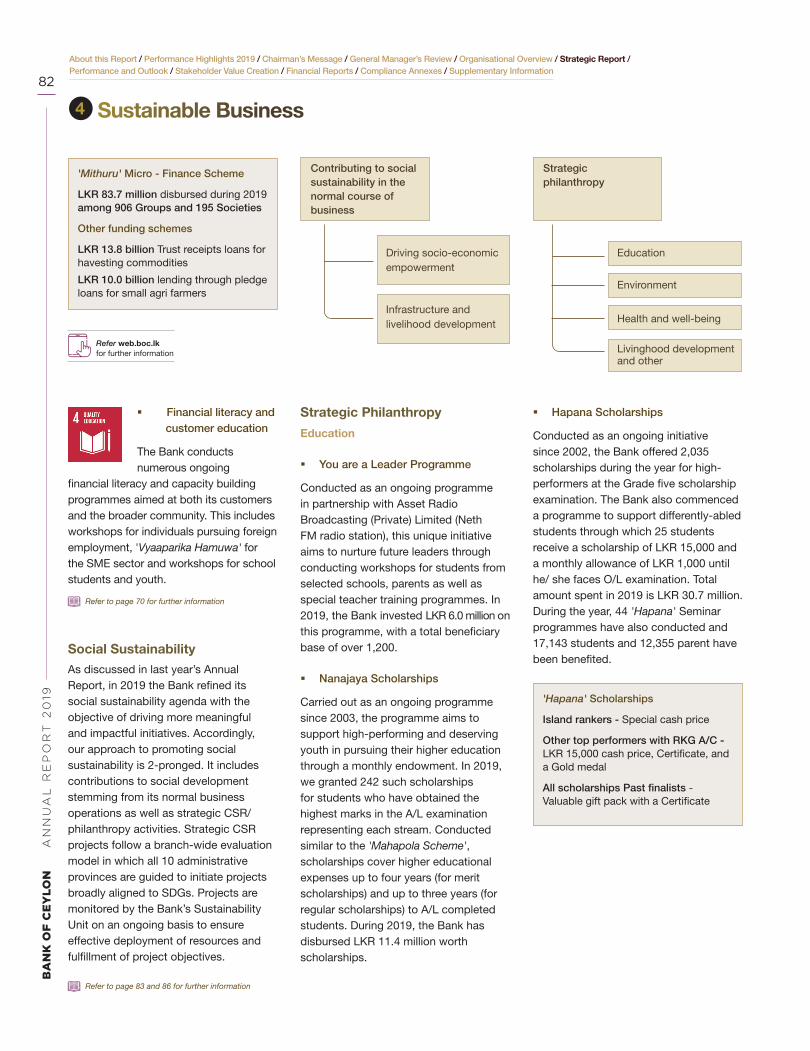
BA
NK
OF
CE
YL
ON
AN
NU
AL
RE
PO
RT
20
19
82
About this Report / Performance Highlights 2019 / Chairman’s Message / General Manager’s Review / Organisational Overview / Strategic Report / Performance and Outlook / Stakeholder Value Creation / Financial Reports / Compliance Annexes / Supplementary Information
'Mithuru' Micro - Finance Scheme
LKR 83.7 million disbursed during 2019 among 906 Groups and 195 Societies
Other funding schemes
LKR 13.8 billion Trust receipts loans for havesting commodities
LKR 10.0 billion lending through pledge loans for small agri farmers
Refer web.boc.lk for further information
§ Financial literacy and customer education
The Bank conducts numerous ongoing
financial literacy and capacity building programmes aimed at both its customers and the broader community. This includes workshops for individuals pursuing foreign employment, 'Vyaaparika Hamuwa' for the SME sector and workshops for school students and youth.
Refer to page 70 for further information
Social SustainabilityAs discussed in last year’s Annual Report, in 2019 the Bank refined its social sustainability agenda with the objective of driving more meaningful and impactful initiatives. Accordingly, our approach to promoting social sustainability is 2-pronged. It includes contributions to social development stemming from its normal business operations as well as strategic CSR/philanthropy activities. Strategic CSR projects follow a branch-wide evaluation model in which all 10 administrative provinces are guided to initiate projects broadly aligned to SDGs. Projects are monitored by the Bank’s Sustainability Unit on an ongoing basis to ensure effective deployment of resources and fulfillment of project objectives.
Refer to page 83 and 86 for further information
Strategic Philanthropy
Education
§ You are a Leader Programme
Conducted as an ongoing programme in partnership with Asset Radio Broadcasting (Private) Limited (Neth FM radio station), this unique initiative aims to nurture future leaders through conducting workshops for students from selected schools, parents as well as special teacher training programmes. In 2019, the Bank invested LKR 6.0 million on this programme, with a total beneficiary base of over 1,200.
§ Nanajaya Scholarships
Carried out as an ongoing programme since 2003, the programme aims to support high-performing and deserving youth in pursuing their higher education through a monthly endowment. In 2019, we granted 242 such scholarships for students who have obtained the highest marks in the A/L examination representing each stream. Conducted similar to the 'Mahapola Scheme', scholarships cover higher educational expenses up to four years (for merit scholarships) and up to three years (for regular scholarships) to A/L completed students. During 2019, the Bank has disbursed LKR 11.4 million worth scholarships.
§ Hapana Scholarships
Conducted as an ongoing initiative since 2002, the Bank offered 2,035 scholarships during the year for high-performers at the Grade five scholarship examination. The Bank also commenced a programme to support differently-abled students through which 25 students receive a scholarship of LKR 15,000 and a monthly allowance of LKR 1,000 until he/ she faces O/L examination. Total amount spent in 2019 is LKR 30.7 million. During the year, 44 'Hapana' Seminar programmes have also conducted and 17,143 students and 12,355 parent have been benefited.
4 Sustainable Business
Contributing to social sustainability in the normal course of business
Strategic philanthropy
Driving socio-economic empowerment
Education
Infrastructure and livelihood development
Environment
Health and well-being
Livinghood developmentand other
'Hapana' Scholarships
Island rankers - Special cash price
Other top performers with RKG A/C - LKR 15,000 cash price, Certificate, and a Gold medal
All scholarships Past finalists - Valuable gift pack with a Certificate

About this Report / Performance Highlights 2019 / Chairman’s Message / General Manager’s Review / Organisational Overview / Strategic Report / Performance and Outlook / Stakeholder Value Creation / Financial Reports / Compliance Annexes / Supplementary Information
83
Health andWellbeing
To prevent spreading of Chronic KidneyDisease (CKD)Water purification plants - Jaffna/ Galporuyaya
Commitment to road safetyBoC Yalu Para
Partnerships for SynergiesOur Supply Chain: Our network of 1,282 suppliers
include, stationary suppliers to Head Office and Branches, software and hardware suppliers as well as utility and other capital item providers. All efforts are made to procure from local parties whenever possible. Approximately, 19% of our suppliers represent micro-enterprises, and our partnerships with them have contributed towards expanding their businesses, leading to socio-economic empowerment. During the year, around LKR 10.7 billion payments have been made to suppliers and no incident was found in relation to child or forced labour and incidents of loss of association of collective bargaining and right to freedom during the year.
77%
4%
19%
Suppliers Benefited During 2019
n Local individuals/ propritorships/ partnerships
n Companies registered outside Sri Lanka
n Locally registered companies
In propagating our sustainability agenda along our value chain, we conduct supplier spot audits to ensure compliance to basic environmental and social standards. During the year, six such supplier audits were conducted.
Participation in industry forums: Membership in associations:
• Asia Pacific Rural and Agricultural Credit Association (APRACA)
• Association of Compliance Officers of Banks, Sri Lanka
• Association of Banking sector Risk Professionals, Sri Lanka
• Bar Association of Sri Lanka
• Bio Diversity Sri Lanka
• Institute of Bankers Sri Lanka
• International Chamber of Commerce, Sri Lanka
• Sri Lanka Banks Association (Guarantee) Limited
• The National chamber of Commerce, Sri Lanka
• The Ceylon Chamber of Commerce
• The Finance Ombudsman of Sri Lanka (Guarantee) limited
Environmental Sustainability
Our ApproachThe Bank’s approach to managing its natural capital and contributing towards long-term environmental sustainability is clearly set out in its Sustainability Policy. Our approach centres on minimising the direct environmental impacts of our operations while contributing towards the sustainable use of natural resources through responsible lending practices and supplier evaluations. Areas of focus include;
• ‘Green Banking’ – minimising the ecological footprint and carbon footprint of our operations
• Promoting environmental literacy
• Promoting renewable energy among customers
• Philanthropic CSR activities supporting environmental conservation
The Bank has also obtained the ISO 14064 - 1 certification in year 2018, the first state Bank to do so, demonstrating its commitment towards GHG emission management. Compliance with environmental laws and regulations are assessed through the support services division. There were no incidents of regulatory non-compliance with environmental laws during the year.
- Reverse osmosis based water purification plants installed in Trial Cancer Hospital, Jaffna and Community Center at Galporuyaya, Giridurukotte in order to provide purified drinking water to communities suffering from CKD
- At Galporuyaya total of 115,000 L of water has distributed so far.
- Trial hospital – approximately 250 beneficiaries per day
Refer web.boc.lk for further information
Banking partner of the Little Hearts Project
- Official Banking Partners to the ‘Little Heart’ projects
- Staff of Bank of Ceylon donated LKR 7.0 million to the Little Hearts Fund
- Aggressive campaign lunched via island wide Branches to encourage public to donate to ‘Little Hearts’

BA
NK
OF
CE
YL
ON
AN
NU
AL
RE
PO
RT
20
19
84
About this Report / Performance Highlights 2019 / Chairman’s Message / General Manager’s Review / Organisational Overview / Strategic Report / Performance and Outlook / Stakeholder Value Creation / Financial Reports / Compliance Annexes / Supplementary Information
Engaging Communities in conservation
Sustainable Lending
InternalOperations
Complianceand Standards
• Green lending• Environmental screening
• Energy and climate consciousness• Waste management• Water efficiency
• ISO 14064 - 1 certification• Sustainability Policy• Sustainable Development Goals• GRI Standards on Sustainability Reporting
Energy and Climate Consciousness
The Bank’s direct energy consumption is significant given its extensive branch reach. Our energy sources are purchased electricity, fuel and renewable energy generated through our solar powered branches. Our long-term objective is to reduce dependence on fossil fuel-based energy sources through increasing reliance on renewable sources and driving energy efficiency through and instilling energy conscious behaviour among employees.
At Head Office, energy managers have been assigned to each floor who hold responsibility for minimising unnecessary wastage. Notices throughout the Bank on reducing water and energy usage serves as a reminder to employees. Conventional lighting in the Bank’s Head Office is gradually being converted to energy-efficient LED lighting with motion sensors. The Bank continued with its green building concept and the solar conversion project during the year which aims to enhance the energy efficiency of its operations.
Renewable Energy Generation
In 2015, the Bank launched an ambitious project to convert its Branches to solar power and since then has made steady progress on reducing its dependence on fossil fuels. Commencing with the Tissamaharama and
Kilinochchi Branches, we have since then progressed to converting 41 branches to solar power by end-December 2019 with another 10 in the pipeline. Progress made on this project in 2019 is as follows;
4 Sustainable Business
Energy usage - 2019
Unit 2019* 2018* Change
Electricity consumed Mwh 24,328 21,135 3,193
Fuel consumed Liter 696,559 732,101 (35,542)
Renewable sources Mwh 2,370 885 1,485
Green House Gas (GHG) Emission - 2019
Unit 2019* 2018* Change
Direct (scope 1) GHG emissions (Gas, Fuel Oil)
tCO2e 2,974 2,902 2%
Indirect (scope 2) GHG emissions (Electricity, Stream)
tCO2e 14,220 10,354 37%
GHG emission intensity ratio
tCO2e/ Total employee
1.7 1.5 20%
CO2 emission reduced as a direct results of specific reduction initiative solar power usage
tCO2e 1,385 757 83%
* Calculated based on estimated and extrapolated data on last years assessment. Also please note that energy and emission are only reported for Sri Lankan operations.

About this Report / Performance Highlights 2019 / Chairman’s Message / General Manager’s Review / Organisational Overview / Strategic Report / Performance and Outlook / Stakeholder Value Creation / Financial Reports / Compliance Annexes / Supplementary Information
85
41Solar powered
branches
10Branches in the pipeline
Power generation
2.4 million kWhof renewable energy
1,855 kWh supplied to national grid
10% electricity requirement fulfilled
InvestmentsLKR 70.8 million
In 2019
LKR 288.0 millionInvestment to date
Green Buildings
Two of our Branches have been awarded the prestigious GREENS rating by the Green Building Council of Sri Lanka. The Trincomalee Branch was awarded the GREENS Platinum rating in 2018 and the Kekirawa Branch was awarded the
GREENS Gold rating in 2017. The Bank currently has three - Branches constructed based on the guidelines of the Green Building Concept with 12 more Branches are in the pipeline.
Carbon Footprint
The implications of climate change are increasingly pervasive across the globe,
with natural disasters and erratic weather conditions having wide ranging impacts across value chains, communities and industry sectors. For BoC, the implications stem primarily from the impact on its lending portfolio, particularly sectors such as Agriculture and Tourism to which it has significant exposure. Although we are yet to quantify these impacts, we are increasingly cognisant of the heightened likelihood and impact of this risk factor. As such, we are committed to consistently reducing the carbon footprint of our internal operations and are driving organisation-wide efforts to achieve this objective. Year 2018 the Bank was able to successfully verify its third-party quantified organisational carbon footprint though an accredited independent verifier in accordance with the ISO 14064-1 Standards for quantification and reporting of Green House Gas (GHG) emission and removals. BoC remains the only state Bank in the country to have obtained this globally recognised sustainability credential. This year due to unfortunate situation arising as a result of the COVID-19 lockdown in the country the Bank was not able to finalise its independent verification of GHG data and therefore, GHG emission was based on estimated/ extrapolated data from the previous year assessment (values to be verified against the ISO 14064-1 Standards)
Waste Management
Used paper and e-waste are the main types of waste generated by the Bank’s
operations. Saving paper is encouraged throughout the organisation and used paper is recycled through registered recyclers. E-waste is also disposed responsibly through third party recyclers approved by the Central Environmental Authority. During the year the Bank has recycled 19,768 Kgs of waste papers.
Meanwhile the Bank’s digitisation strategy and resultant customer thrust towards digital channels have contributed towards a reduction in its paper consumption. BoC DIGI centers were also expanded up to three during the year. Many automation initiatives and internal process efficiencies carried out during the year have also resulted in a significant reduction in paper use.
Refer to page 98 for further information
Sustainable Lending Practices
Our reach and size places us in a position to significantly impact the environment through our lending practices. This includes direct lending for environmentally friendly projects and the inclusion of environmental considerations as part of our credit appraisal criteria. The Bank offered dedicated credit products for the installation of solar panels, developing environmentally friendly packing materials
using biodegradable products, waste-to energy projects, wind power projects and other renewable energy projects. During the year, total lending towards renewable energy projects amounted to LKR 1,507.7 million. We also seek to propagate environmentally friendly business practices among our clients by encouraging sustainable practices such as energy conservation, green businesses, waste management and recycling, and during the year LKR 67.5 million funding has disbursed among SME customers via scheme loans
for this purpose.
Progress made on the Bank’s green lending initiatives during the year are as follows;
Lending category Value (LKR million)
Renewable energy 1,507.7
Facilities granted for process improvements in driving reduction in environmental footprint and other green business
67.5
Loan schemes operated during 2019 for 'Green Financing'
1. E-Friends -II 2. RSPGLOC Project3. Green loans4. Rivi Bala Savi5. Special Credit scheme for solar power systems and other loans

BA
NK
OF
CE
YL
ON
AN
NU
AL
RE
PO
RT
20
19
86
About this Report / Performance Highlights 2019 / Chairman’s Message / General Manager’s Review / Organisational Overview / Strategic Report / Performance and Outlook / Stakeholder Value Creation / Financial Reports / Compliance Annexes / Supplementary Information
4 Sustainable Business
Environmental and Social Screening
The Bank introduced a comprehensive
Environmental and Social Management
system in 2018, and since then it has
been screening all development lending
via ADB special credit line based on
ESMS guidelines. Training has been
conducted for Branch Managers and
Credit Officers on the ESMS and the
Bank is in the process of implementing
ESMS for its entire loan portfolio.
Progress made during the year is listed
alongside; As at 31 December 2019, 681
credit officers have been trained for the
ESMS evaluation based.
681 Officers trained on ESMS criteria
115facilities screened
LKR 673.5 milliondisbursed after screening for ESMS
Engaging communities in Environmental Conservation
Schools/ UDA/ RecyclersDigradable Waste management project
Green Net Project
Twin Tree Project
Kumbuk Arana Project
WayForward
Continued efforts on partnering the country’s economic development in line with our economic sustainability pillar
Further investments in green buildings and solar energy generation
Continued focus on propagating environmental sustainability through our lending practices
Expand environmental conservation to a larger audience through strategic CSR initiative
Ongoing investments in strategic CSR initiatives with a view to driving meaningful and impactful change
Funded to establish degradable waste Management plants in;
- Minuwangoda President College- Kelaniya Darmaloka Vidyalaya- Wattala St. Annes College
Total of 7,740 native trees to the area have been planted by parents marking their child birth. All trees were sponsored by BoC. North Western Provincial Health Officers have also joined hands with BoC for this project.
10,000 trees have been planted with the objective of connecting the Southern Province with tree tops once these trees grow up. 1,200 students from 273 schools participated for this project.
2,600 ‘Kumbuk’ trees have been planted alone the river basing of the Kalu ganga. 1,650 children and 1,300 public have partnered with the Bank in planting these trees.
Funded 3R waste management project alone with waste collection center for,
- Anula vidyalaya, Colombo- Kaluthara Balika vidyalaya, Kaluthara
Schools/ Municipal Councils/ Recyclers3R concept based waste Management project

About this Report / Performance Highlights 2019 / Chairman’s Message / General Manager’s Review / Organisational Overview / Strategic Report / Performance and Outlook / Stakeholder Value Creation / Financial Reports / Compliance Annexes / Supplementary Information
87
5 Brand Building
As one of Sri Lanka’s most trusted brands, the BoC brand is one of our most valuable assets, contributing towards market penetration and customer retention. In recent years, we have understood the need to revive and evolve our brand for which concerted efforts are now underway.
Initiatives in 2019• Investments in digital engagements
to appeal to younger demographics
• Review and revision of the Marketing and Brand policy
Strength of our Brand
Page 88
Branding Initiatives
Page 88
Brand Guidelines and Perception
Page 88
Awards and Accolades
Page 89
LKR 748.3 million investment in brand building
Appeal to new customer segments by enhancing brand perception
• Initial efforts to standardise the brand perception across all local and international customer touch points
• Engaged the Research Unit in conducting a brand perception study
How We Performed
Ranked the No.1 brand in the banking sector
Ranked 2nd most valuable brand in the country
increase in brandvalue in 2019
First Bank to cross
LKR 50 billionbrand value
21%
Capital Impacts/ Value Created
FinancialCapital
Social andRelationshipCapital
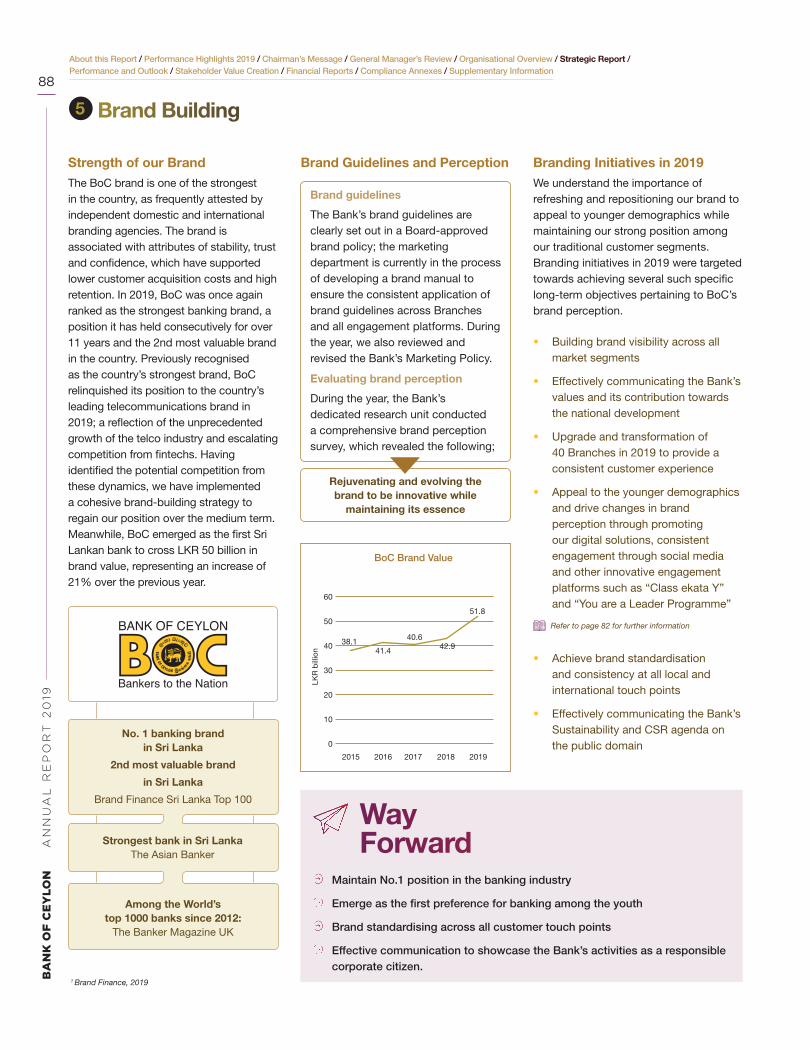
BA
NK
OF
CE
YL
ON
AN
NU
AL
RE
PO
RT
20
19
88
About this Report / Performance Highlights 2019 / Chairman’s Message / General Manager’s Review / Organisational Overview / Strategic Report / Performance and Outlook / Stakeholder Value Creation / Financial Reports / Compliance Annexes / Supplementary Information
Strength of our BrandThe BoC brand is one of the strongest in the country, as frequently attested by independent domestic and international branding agencies. The brand is associated with attributes of stability, trust and confidence, which have supported lower customer acquisition costs and high retention. In 2019, BoC was once again ranked as the strongest banking brand, a position it has held consecutively for over 11 years and the 2nd most valuable brand in the country. Previously recognised as the country’s strongest brand, BoC relinquished its position to the country’s leading telecommunications brand in 2019; a reflection of the unprecedented growth of the telco industry and escalating competition from fintechs. Having identified the potential competition from these dynamics, we have implemented a cohesive brand-building strategy to regain our position over the medium term. Meanwhile, BoC emerged as the first Sri Lankan bank to cross LKR 50 billion in brand value, representing an increase of 21% over the previous year.
No. 1 banking brand in Sri Lanka
2nd most valuable brand
in Sri Lanka
Brand Finance Sri Lanka Top 100
Strongest bank in Sri LankaThe Asian Banker
Among the World’s top 1000 banks since 2012:
The Banker Magazine UK
1 Brand Finance, 2019
Branding Initiatives in 2019We understand the importance of refreshing and repositioning our brand to appeal to younger demographics while maintaining our strong position among our traditional customer segments. Branding initiatives in 2019 were targeted towards achieving several such specific long-term objectives pertaining to BoC’s brand perception.
• Building brand visibility across all market segments
• Effectively communicating the Bank’s values and its contribution towards the national development
• Upgrade and transformation of 40 Branches in 2019 to provide a consistent customer experience
• Appeal to the younger demographics and drive changes in brand perception through promoting our digital solutions, consistent engagement through social media and other innovative engagement platforms such as “Class ekata Y” and “You are a Leader Programme”
Refer to page 82 for further information
• Achieve brand standardisation and consistency at all local and international touch points
• Effectively communicating the Bank’s Sustainability and CSR agenda on the public domain0
10
20
30
40
50
60
2015 20172016 20192018
BoC Brand Value
38.1 40.6
41.4 42.9
LKR
bill
ion
51.8
WayForward
Maintain No.1 position in the banking industry
Emerge as the first preference for banking among the youth
Brand standardising across all customer touch points
Effective communication to showcase the Bank’s activities as a responsible corporate citizen.
5 Brand Building
Brand guidelines
The Bank’s brand guidelines are clearly set out in a Board-approved brand policy; the marketing department is currently in the process of developing a brand manual to ensure the consistent application of brand guidelines across Branches and all engagement platforms. During the year, we also reviewed and revised the Bank’s Marketing Policy.
Evaluating brand perception
During the year, the Bank’s dedicated research unit conducted a comprehensive brand perception survey, which revealed the following;
Rejuvenating and evolving the brand to be innovative while
maintaining its essence
Brand Guidelines and Perception

About this Report / Performance Highlights 2019 / Chairman’s Message / General Manager’s Review / Organisational Overview / Strategic Report / Performance and Outlook / Stakeholder Value Creation / Financial Reports / Compliance Annexes / Supplementary Information
89
Awards and Accolades
No. 1 Banking Brand in Sri Lanka
Human Resources Awards
Annual Report Awards
Technnovation Awards 2019
Sustainability
Excellence in Performance
Most valuable Banking Brand in Sri Lanka
2019 - Brand Finance
Top 1000 Banks in the World - The Banker
Magazine (UK)
Most admired companies of Sri Lanka - 2019, International
Chamber of Commerce Sri Lanka
The Asia's Best Employer Brand - Employer Branding Institute - India
Gold Award - State Banks Annual Reports Awards
2019 CA Sri Lanka
Gold Best Acquire for US
Dollar Online payments
Silver Best Bank for
Retail payments
Merit Best Common ATM
Acquirer (A)
Silver Most Popular Electronic
Payment Products (B App)
Top Ten Best Corporate Citizen - Best Corporate Citizen
Sustainability Awards - 2019
Gold 33rd ARC Awards,
Written Text:Banks International
Bronze 33rd ARC Awards,
Financial Data:Banks International
Certificate of Merit - CMA Excellences in Integrated Reporting Awards 2019
Winner Public Sector Banking Institutions
SAFA Best Presented Annual Report Awards - 2019
Sri Lanka Best Employer Brand - Employer Branding Institute - India
Best Green Excellence - Energy Asia's Green Future
Leaders Awards 2019
Best Green Excellence - Energy
Sri Lanka Green Future Leaders
Awards 2019
Leadership in Environmental
Sustainability - Green Building Council of
Sri Lanka
Outstanding Green commitment Award - 2019 Green Building Council of
Sri Lanka
Best Green Excellence - Solar
Asia's Green Future Leaders Awards 2019
Best HR Organisation to Work for - Global HR Excellence
Award for Excellence in Training - Sri Lanka Best Employer Brand -
Employer Branding Institute - India

BA
NK
OF
CE
YL
ON
AN
NU
AL
RE
PO
RT
20
19
90
About this Report / Performance Highlights 2019 / Chairman’s Message / General Manager’s Review / Organisational Overview / Strategic Report / Performance and Outlook / Stakeholder Value Creation / Financial Reports / Compliance Annexes / Supplementary Information
6 Human Capacity Building
“Today’s knowledge is tomorrow’s business” was the underlying motto guiding our efforts in enhancing our employee value proposition through ongoing focus on building capacity and creating a conducive work environment for all 8,503 of our employees.
Initiatives in 2019• Concerted efforts to drive attitudinal
change among employees to serve customers better
• Ongoing investment in training and development with focus on continuous professional development, upskilling and reskilling
Talent Attraction
Page 91
Diversity and Inclusion
Page 92
A Skilled Workforce
Page 93
Industrial Relations
Page 92
Total value created to employees 18.4 billion
Nurtured organisational capital through LKR 233.3 million investment in training
Facilitating better customer experiences through continuous improvement in knowledge and skills of our human capital
How We Performed
• Cordial industrial relations during the year
• Raising employee awareness on work-life balance
0
2,000
4,000
6,000
8,000
10,000
0
5
10
15
20
2017 2018 2019
Value per Employee
7,58
7
8,72
4
8,50
3
n Total no of permanent employees Value per employees
17.017.4 18.4
LKR
billi
on
No.
Capital Impacts/ Value Created
FinancialCapital
IntellectualCapital
Social andRelationshipCapital
0
100,000
200,000
300,000
400,000
500,000
600,000
2017 2018 2019
Total Training Hours
279,
274
398,
18952
3,37
8
Hou
rs

About this Report / Performance Highlights 2019 / Chairman’s Message / General Manager’s Review / Organisational Overview / Strategic Report / Performance and Outlook / Stakeholder Value Creation / Financial Reports / Compliance Annexes / Supplementary Information
91
Managing our TeamA dedicated HR Policy Committee chaired by the General Manager is responsible for formulating and recommending policies for Board approval through the Human Resource and Remuneration Subcommittee, which assists the Board in providing oversight into all HR related aspects. HR strategy driven and implemented by the HR department is developed in line with the Bank’s Corporate Plan which is approved by the Board.
BoC’s approach to managing its talent is clearly articulated through comprehensive policies that covers all
aspects relating to human resources. The Bank complies with the Shop and Office Employees Act in terms of labour practice and decent work and all employee agreements and contracts are inclusive of human rights considerations. At BoC, all employees are treated equally in recruitment, promotions and reward schemes.
Preferred Employer
The BoC Team of 8,503 employees is the catalyst in driving the Bank’s strategic agenda and facilitating the customer
Attraction
Recruitment policy Salary and non-salary benefit schemes
Retention
Training and developmentReward and recognition
Promotion and career advancementPerformance management
Administration
HR policyCommunication
Code of ethics and employee handbookEmployee welfare schemesEmployee disciplinary code
Key HR Policies and Codes
Talent attraction
Movements in team profile12 new employeesin 2019
Recruits by Region
No. Rate
Western 08 67%
Southern - -
Sabaragamuwa - -
Uva 02 17%
North Western 01 8%
Central - -
North Central - -
Eastern - -
Northern 01 8%
experience. A strong reputation for employee development, opportunities for career progression and a conducive work environment has enabled the Bank to emerge as one of the sector’s most preferred employers.
Refer page 89 for HR Awards
As the country’s leading financial sector brand and a state-owned organisation, the Bank is in a strong position to attract employees. Entry level positions at BoC such as Trainee Staff Assistants and Management Trainees attract an overwhelming number of applicants whenever vacancies are advertised.
The Bank’s recruitment process is well structured and transparent. Staff requirements at divisional level are recommended by the HR Policy Committee to the Board of Directors for approval. Approved vacancies are advertised to the public through newspapers in all three languages and on the Bank’s website. The selection process for candidates includes a written examination and an interview with an interview panel determined by the General Manager. Successful candidates, for any new vacancy including promoties undergo a comprehensive induction programme.
Recruitments were limited in 2019, as the Bank filled many vacant positions in the previous year. Profile of new recruits is presented alongside.
Compensation and Benefits
An attractive compensation plan is offered by the Bank that includes gross salary, employer provident and trust fund contributions, medical assistance schemes, pension scheme, widow, widower and orphanage fund (eligibility criteria apply), discretionary bonus and incentives. The Bank contributes 12% and 3% to BoC Provident Fund and ETF respectively. Also, all permanent employees are eligible to non-contributory pension scheme. Employees also qualify for housing loans, vehicle loans, computer loans, solar power loans, investment loans and unified general loans at concessionary rates, education assistance and professional subscription re-imbursements (eligibility criteria apply). Compensation which includes salary and non-salary benefits
Recruitment by Age and Gender
Below 30 30-50
Recruitment by age 10 2
Female Male
Recruitment by gender 10 2
83%
17%
Recruitments by Age
n Below 30 years n 30-50 years
Recruits by Gender
n Male n Female
83%
17%

BA
NK
OF
CE
YL
ON
AN
NU
AL
RE
PO
RT
20
19
92
About this Report / Performance Highlights 2019 / Chairman’s Message / General Manager’s Review / Organisational Overview / Strategic Report / Performance and Outlook / Stakeholder Value Creation / Financial Reports / Compliance Annexes / Supplementary Information
is based on collective agreements with trade unions which are negotiated every three years.
Employee Engagement
A year-round activity calendar consisting of sports, cultural and religious activities are conducted to drive employee motivation and nurture a sense of camaraderie.
BoC Annual Inter-Provincial sports meet 2019
Special Events Conducted by the Welfare Department during the year
• NIC issued under mobile service - 700 participants
• 80th anniversary blood donation campaign at Head Office-200 participants
• Lecture on Psychological impact of digital technology on children’s cognition - 350 participants
• Awareness programmes on first aid - 300 participants
• Medical camp for cancer detection and prevention for female employees - 51 participants
• Lecture on common problems with Mobile Phones and Solutions by Telecommunication Regulatory Commissioner - 250 participants
Industrial Relations
All permanent employee at BoC are covered by collective agreements with 99% belonging to one of six trade unions. BoC provides accredited
6 Human Capacity Building
employee representation of the trade unions facilities, funding and other infrastructure for trade union activities with seven employees released for full time trade union work. We maintain cordial and co-operative relationships with trade union representatives, ensuring that only significant issues are raised to the Bank’s Management. There were no work disruptions due to trade union activities during the year.
Notice of six months is provided to employees prior to implementation of any significant operational changes that could affect them. The notice period and provisions for consultation and negotiation are specified in the relevant collective agreements.
Diversity and Inclusion
As an equal opportunity employer BoC does not have any from of
discriminate on any grounds (gender, age or ethnicity) when recruiting, promoting or determining remuneration. With one of the highest female representation, 60%, in the financial services industry, BoC offers a conducive work environment for women. We have a high return-to work after parental leave ratio and have taken measures to ensure mothers with infants are deployed to the nearest branch. The ratio of basic salary between women and men continued to remain 1:1. No any from of discrimination reported during the year.
A quota of up to 1% for differently abled employees is mandated by our recruitment policy. To bridge language barriers among our workforce, Sinhalese/Tamil classes were conducted for employees during the year.
A Safe Workplace
The Bank’s work environment does not give rise to major health and safety risks, however priority is given to employee wellness and safety. Collective
Comprehensive medical cover
In-house doctor, nurse and pharmacy at Head Office
Annual fire drills
Gymnasium, yoga and aerobics facilities
Training and security for employees performing duties at the vulnerable areas of the Bank
Gender Parity at BoC
Policy/ governance framework supporting gender parity
Equal opportunity policy
Disciplinary procedure
Welfare Society for Women
Grievance handling policy
agreements cover health and safety topics that include employee entitlements under the medical assistance scheme. The Bank’s health and safety goals are delivered as follows;

About this Report / Performance Highlights 2019 / Chairman’s Message / General Manager’s Review / Organisational Overview / Strategic Report / Performance and Outlook / Stakeholder Value Creation / Financial Reports / Compliance Annexes / Supplementary Information
93
Parental Leave 2019
Female
Employees:
Entitled to parental leave 5,142
Took parental leave 515
Returned to work after leave 515
Number of employees still employed after 12 months of their return to work after parental leave
380
Return to work rate of employees taking parental leave
100%
Retention rate of employees taking parental leave
91%
Gender representation by department
Male Department Female
10 Risk Division 14
71 Finance and Planning Division
72
80 IT Division 43
135 Product and Banking Development Division
139
Promotions by Gender
508 313
Promoting work-life balance: A key area of focus in 2019 was the propagation of a healthy work-life balance among our employees, with a view to creating, a more satisfied and motivated workforce. Several professional counsellors and medical doctors were invited to conduct lectures for employees to raise their awareness on work-life balance, while an opportunity was also given for employees to air their personal grievances to the counsellors.
A Skilled Workforce
BoC has a dedicated training centre located at Maharagama with seven
Faculty Members and 115 Associate Faculty Members. Internal specialists from the Bank and external resource persons are engaged to conduct training to employees on an ongoing basis. While the Bank utilises its in-house facilities
for most of its training needs, staff are also sent for specialised local and foreign external training programmes. We also conducted training via e-learning specially on risk, compliance and BCP awareness. Employee life-long learning is supported through providing opportunities for Toastmaster/ Speech craft programmes as well as management development and leadership programmes across different levels.
In addition to ongoing training programmes, the following were conducted
during the year;
Training Programme No of training
Hours
No of Participations
In-house training 325,513 42,034
External – local 28,632 3,579
External – foreign 44,044 223
e-learning - 23,925
Average Training Hours
Male Female
Corporate Management 45 32
Executive Management 29 22
Senior Management (CM/ SM/ BM/ AM) 4 6
Executives (AM/ EC/ JEO) 7 18
Banking Trainees and other 2 3
Training Outcomes
Investment in training: LKR 233.3 million
Total training hours: 398,189 hrs
Average training hours per employee: 46.8
Employee Value/ Productivity
0 5 10 15 20 25 30
Revenue peremployee
Value addedper employee
Net profitper employee
28.125.3
2.42.7
17.418.4
n2019 n2018
Performance Management and Succession Planning
A structured performance management system is in place ensuring equitable treatment for all employees in determining increments and promotions. KPIs are cascaded from the Bank’s corporate strategy and 100% of permanent employees go through performance appraisals twice a year.
Career progression is guided by a transparent and clearly communicated
promotions policy. Employees are eligible to apply for a promotion once they have completed the required service in the current position. During the year, 821 employees were promoted while all vacancies were filled internally except for entry level positions. Written succession plans for Key Management Personnel (AGMs/ DGMs) was carried out in 2018 and expanded to include the Branch staff in 2019. The success of BoC’s development of its employees is demonstrated through 100% of all

BA
NK
OF
CE
YL
ON
AN
NU
AL
RE
PO
RT
20
19
94
About this Report / Performance Highlights 2019 / Chairman’s Message / General Manager’s Review / Organisational Overview / Strategic Report / Performance and Outlook / Stakeholder Value Creation / Financial Reports / Compliance Annexes / Supplementary Information
6 Human Capacity Building
positions being filled through internal promotions or transfers except for two positions in Corporate Management. External recruitments are carried out only for entry level positions or specialist roles for which career bankers may not be special trained/ developed.
The Bank recognises the outstanding Branches/ employees via BoC Spirit awards and Century Score Card method. High performing Branches/ employees receive cash and non-cash benefits.
Talent Retention
The Bank’s employee turnover rates have been consistently low over the years and was 0.8% in 2019. This is a testament to our employee value proposition characterised by significant investment in training and development, cordial trade union relations, succession planning and employee engagement initiatives. Turnover by Region
No. Rate (%)
Western 39 1.0
Southern 4 0.5
Sabaragamuwa 4 0.7
Uva 6 1.3
North Western 4 0.6
Central 2 0.3
North Central 2 0.3
Eastern 2 0.4
Northern 5 0.9
WayForward
Driving attitudinal change through engagement and training programmes to facilitate better performance and an improved customer experience
Increased use of digitisation and technology in driving our training and development agenda
Focus on upskilling employees to suit new era of Banking
Focus on increasing employee productivity
24%
76%
Employee Turnover by Gender
n Female n Male
37%63%
Employee Turnover by Age
n Less than 30 n 30-50
Turnover by Age and Gender
Below 30 30 - 50
Turnover by age 43 25
Female Male
Turnover by gender 52 16

About this Report / Performance Highlights 2019 / Chairman’s Message / General Manager’s Review / Organisational Overview / Strategic Report / Performance and Outlook / Stakeholder Value Creation / Financial Reports / Compliance Annexes / Supplementary Information
95
7 Our Presence
The Bank’s market presence is fortified by its extensive physical reach of 1,870 customer contact points across the island as well as a growing network of virtual channels including online and mobile banking and BoC smart pay app.
Initiatives in 2019• Continued expansion of our digital
footprint with the addition of 143 CRMs and 67 Smart Zones across the island
• Further expansion of the brick and mortar network through the addition of 159 customer contact points
Physical Presence
Page 96Digital Presence
Page 96
Virtual Presence
Page 96DrivingDigital Literacy
Page 96
How We Performed
• 22 branch relocations for better access
• Ongoing support to customers in migrating to digital and virtual channels through training/ awareness programmes LKR 2,505.5 million in
expanding physical infrastructure
LKR 1,697.9 million in expanding digital infrastructure
159 contact points added
Increased customer convenience and accessibility
Additions to the network in 201914 Branches and Limited Service Branches
05 Branch on wheels
143 CRMs
01 CDMs
15 Bill payment kiosks
67 Smart Zones
0
500
1,000
1,500
2,000
2017 2018 2019
Distribution of Customer Contact Points
472
1,11
0
507
1,20
7
538
1,33
2
n Contact points in the western provincen Contact points outside the western province
Capital Impacts/ Value Created
FinancialCapital
FinancialCapital
ManufacturedCapital
Social andRelationshipCapital

BA
NK
OF
CE
YL
ON
AN
NU
AL
RE
PO
RT
20
19
96
About this Report / Performance Highlights 2019 / Chairman’s Message / General Manager’s Review / Organisational Overview / Strategic Report / Performance and Outlook / Stakeholder Value Creation / Financial Reports / Compliance Annexes / Supplementary Information
Physical PresenceWith one of the most extensive banking networks in the country BoC provides access to its services through 1,880 direct customer contact points that enables the Bank to penetrate 63% of Sri Lankans. During the year we added six branches and 144 CDMs and CRMs to our network. The concept of Branch on wheels has also proved to be popular and we have expanded by having one for each province. The Bank also has a presence in 5,487 schools across the island. During the year the Bank also further strengthened its international presence by opening an extension office of the Male Branch in Hulumale.
Refer to page 81 for information on how our physical presence helps drive our financial inclusion agenda
Refer to page 22 for a full list of branch locations
Digital Presence
Digital footprint
Added in
2019
Total as at
end-2019
ATMs - 772
CDMs 01 164
CRMs 143 261
Bill payment kiosks
15 64
DIGI centers 3 4
1,265
Digital contact points
From the perspective of overall strategy, the Bank’s channel strategy will focus more on digital and virtual platforms,
while consolidating its brick and mortar model. With customers increasingly demanding ubiquitous channels and increased connectivity driving demand for self-service platforms, we are cognisant that banks which are unable to respond to these dynamics will see an erosion of competitive edge over time. To capture and retain the ‘digital’, millennial customers BoC continues to leverage technology to build omni-channels, thereby improving accessibility and
convenience. In 2019, the Bank invested LKR 1,697.9 million in strengthening its digital reach - particularly expanding Smart Zones which consist of ATMs, CDMs, CRMs and bill payment kiosks. These zones have allowed customers to perform a range of transactions instantly without queuing in Branches. We continue to see accelerated adoption of self-service channels among our customers; in 2019 total percentage of digitally active customers of the Bank accounted for 50% of the Bank’s total customers compared to 34% the year before.
Virtual Presence
BoC’s virtual platforms constitute BoC Smart pay app, Smart online banking and B-app and these platform allows
24 x 7 x 365 day banking to our valuable customers irrespective of their place of stay and provide greater convenience to them in their day to day banking services.
Enhancing Digital Literacy
BoC continues to command the largest
digital banking footprint in the country and has played a vital role in enhancing digital adoption in the country’s peripheries. The Smart Zone concept has been a key driver of enhancing digital literacy across the island, with nearly 255 (73%) BoC Smart Zones located outside the Western Province. The Bank has also appointed dedicated personnel at Branches to assist customers in using the self-service channels.
Province No. of BoC Smart Zones
Computer literacy rate (%)*
2019Western 96 43.4Southern 49 29.5North Western 34 29.3Central 35 28.6Sabaragamuwa 24 25.2Uva 23 20.8North Central 37 20.7Northern 36 19.6Eastern 17 16.0
*Source: Department of Census and Statistics, Sri Lanka
Way Forward Align with the Government’s National Digital policy and Digital Road Map from
CBSL in propagating technology - enabled banking across the island
Further expansion of the digital footprint
Increase investment in developing and promoting virtual channels
Widen the overseas presence
7 Our PresenceInvestment in Physical Infrastructure LKR 2,505.5 million
Three BoC branches per 100,000 persons
Five BoC ATM/ CRM machines per 100,000 persons
63% Customer Penetration in Sri Lanka
131 contact points in economically underprivileged areas
Our Presence
581 branches including three in overseas locations
11 Branches on wheels
14 Regional Loan Centres
15 SME Centres
1,197 CDMs, CRM and ATMs
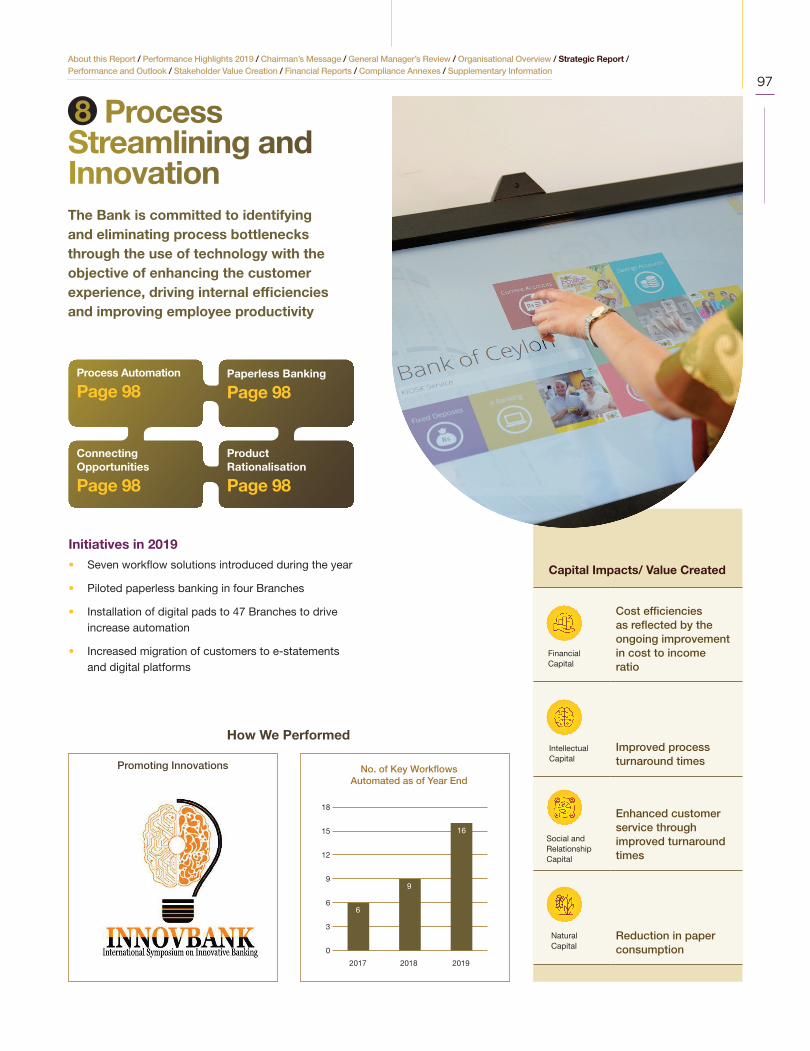
About this Report / Performance Highlights 2019 / Chairman’s Message / General Manager’s Review / Organisational Overview / Strategic Report / Performance and Outlook / Stakeholder Value Creation / Financial Reports / Compliance Annexes / Supplementary Information
97
8 Process Streamlining and InnovationThe Bank is committed to identifying and eliminating process bottlenecks through the use of technology with the objective of enhancing the customer experience, driving internal efficiencies and improving employee productivity
Initiatives in 2019• Seven workflow solutions introduced during the year
• Piloted paperless banking in four Branches
• Installation of digital pads to 47 Branches to drive increase automation
• Increased migration of customers to e-statements and digital platforms
Process Automation
Page 98Paperless Banking
Page 98
Product Rationalisation
Page 98
Connecting Opportunities
Page 98
Cost efficiencies as reflected by the ongoing improvement in cost to income ratio
Improved process turnaround times
Enhanced customer service through improved turnaround times
Reduction in paper consumption
How We Performed
0
3
6
9
12
15
18
2017 2018 2019
No. of Key WorkflowsAutomated as of Year End
6
9
16
Capital Impacts/ Value Created
FinancialCapital
Social andRelationshipCapital
IntellectualCapital
NaturalCapital
Promoting Innovations

BA
NK
OF
CE
YL
ON
AN
NU
AL
RE
PO
RT
20
19
98
About this Report / Performance Highlights 2019 / Chairman’s Message / General Manager’s Review / Organisational Overview / Strategic Report / Performance and Outlook / Stakeholder Value Creation / Financial Reports / Compliance Annexes / Supplementary Information
Process AutomationThe Bank continued to invest in automating repetitive, time-consuming, manual processes using Robotic Process Automation (RPA) technology. In 2019, seven workflows were introduced bringing the total to 16 which includes Overdraft Recovery, creation of fixed deposits, issuance of debit cards and covering approval.
Meanwhile, digital pads have been given to 47 Branches enabling the digital onboarding of customers with the digital signature stored in the core banking system. Given the high volume of daily transactions processed by the Bank, the full - roll out of this technology is expected to generate significant benefits in terms of driving efficiencies and reducing paper consumption.
Paperless BankingIn addition to driving process efficiencies and enhancing customer experience, the Bank’s increasing thrust towards digitalisation and automation is also aimed at reducing its overall paper consumption. Since BoC commenced the implementation of Document Management Systems (DMS) in 108,941 A4 sheets has been saved primarily through online loan applications, account opening and workflows of debit card issuing.
In 2019, BoC also piloted a comprehensive paperless banking programme in four of its Branches. This involved the complete automation of account opening, central auditing, temporary and permanent overdraft functions and introduction of slipless transactions among others. Our medium to long-term objective is to expand this programme across the branch network driving an 80% reduction in paper consumption.
Other initiatives in place for reducing
paper consumption include the
following;
• Migration of customers to e-statements - achieved 66% growth in 2019
• Migration of customers to digital platforms - 16% increase in digitally active customer base
WayForward
Further investments in work flow solutions including workflows for permanent overdraft facilities and credit card application process
Introduce palm top solutions - particularly for agency banking
Partner the Government in the implementation of the e-KYC system
Migrate the loan collection module to a DMS system
Document Management Systems (DMS)
1.1 million CASA account opened during the year
244,445 Fixed Deposits opened during the year
546,944 customers on boarded during the year
Process efficiencies
Personal loan approval time reduced by 95%
Home loan and business loan approval time reduced by 14%
Corporate prior approval processing time reduced by 92%
CASA account opening time reduce by 40%
Debit card issuing time reduced by 50%
• Driving reductions in cheque usage by moving 90% of bulk cheque payments to standing orders. This is also in line with the Central Bank’s long-term objective of reducing cheque usage in the country.
Connecting Opportunities“The INNOVBANK Symposium”
In a unique, first-of-its-kind initiative, BoC unveiled the ‘Innovative Banking’ symposium in November 2019 under the theme ‘Innovative Banking in a Smart World.’ The symposium seeks to bring together thought leadership on banking innovation through inviting novel thinkers and Fintech innovators to present research papers, concept papers and proposals on emerging new technologies. Key categories include, Fintech Solutions in Banking, Business Process Re-engineering in Banking, Innovative Financial Products and Services, Artificial Intelligence and MIS and Big Data among others.
Product RationalisationThe Bank also consider research feedback on its product and services, and continuously work on review and upgrade on their products and services for better customer experience. Accordingly, product re-launch and upgrade with new products frills takes place across the year. During the year BoC Smart online and mobile banking platforms were upgraded with new service features.
8 Process Streamlining and Innovation
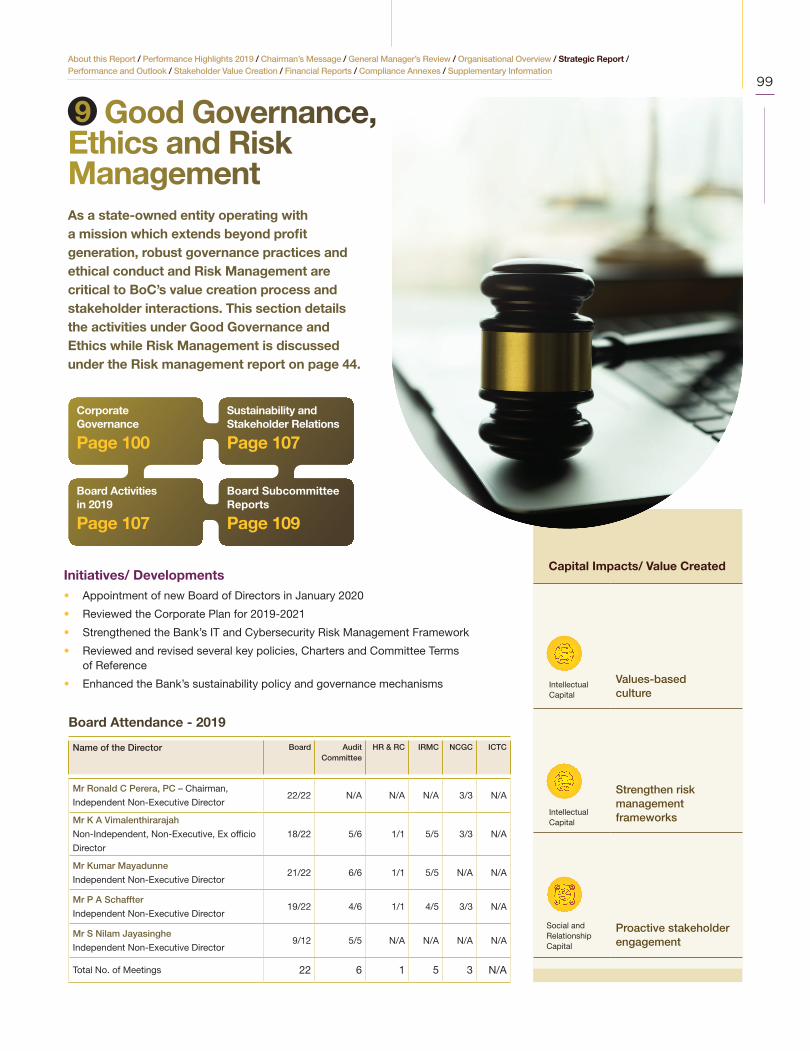
About this Report / Performance Highlights 2019 / Chairman’s Message / General Manager’s Review / Organisational Overview / Strategic Report / Performance and Outlook / Stakeholder Value Creation / Financial Reports / Compliance Annexes / Supplementary Information
99
9 Good Governance, Ethics and Risk ManagementAs a state-owned entity operating with a mission which extends beyond profit generation, robust governance practices and ethical conduct and Risk Management are critical to BoC’s value creation process and stakeholder interactions. This section details the activities under Good Governance and Ethics while Risk Management is discussed under the Risk management report on page 44.
Initiatives/ Developments • Appointment of new Board of Directors in January 2020
• Reviewed the Corporate Plan for 2019-2021
• Strengthened the Bank’s IT and Cybersecurity Risk Management Framework
• Reviewed and revised several key policies, Charters and Committee Terms of Reference
• Enhanced the Bank’s sustainability policy and governance mechanisms
CorporateGovernance
Page 100
Board Activitiesin 2019
Page 107
Sustainability and Stakeholder Relations
Page 107
Board Subcommittee Reports
Page 109
Values-based culture
Strengthen risk management frameworks
Proactive stakeholder engagement
Capital Impacts/ Value Created
IntellectualCapital
IntellectualCapital
Social andRelationshipCapital
Board Attendance - 2019
Name of the Director Board Audit Committee
HR & RC IRMC NCGC ICTC
Mr Ronald C Perera, PC – Chairman,
Independent Non-Executive Director22/22 N/A N/A N/A 3/3 N/A
Mr K A Vimalenthirarajah
Non-Independent, Non-Executive, Ex officio
Director
18/22 5/6 1/1 5/5 3/3 N/A
Mr Kumar Mayadunne
Independent Non-Executive Director21/22 6/6 1/1 5/5 N/A N/A
Mr P A Schaffter
Independent Non-Executive Director19/22 4/6 1/1 4/5 3/3 N/A
Mr S Nilam Jayasinghe
Independent Non-Executive Director9/12 5/5 N/A N/A N/A N/A
Total No. of Meetings 22 6 1 5 3 N/A

BA
NK
OF
CE
YL
ON
AN
NU
AL
RE
PO
RT
20
19
100
About this Report / Performance Highlights 2019 / Chairman’s Message / General Manager’s Review / Organisational Overview / Strategic Report / Performance and Outlook / Stakeholder Value Creation / Financial Reports / Compliance Annexes / Supplementary Information
Corporate Governance
Chairman’s Message
In ensuring the creation of long-term stakeholder value and consistent contribution to the national economy, the Bank’s operations are underpinned on a solid foundation of robust corporate governance practices, which begins with the Board of Directors and extends to every employee. Our corporate governance framework drives competent leadership and judicious empowerment while ensuring accountability and propagation of a strong culture across the organisation.
Board Changes
A new Board was appointed in January 2020, with Directors combining a diverse range of public and private sector experience, industry insights and skills (Refer Board profiles on page 25 of this Report). All appointed Directors underwent a comprehensive and structured induction process, enabling familiarisation with the strategy and operations of the Bank. As a relatively young and vibrant Board, we are keen
to facilitate the Bank’s creation of long-term value while capitalising on the opportunities presented by a dynamic operating landscape including developments in technology, increasing consumer sophistication and rising disposable incomes.
Compliance
This Report sets out our approach to governance in practice and how the Board in office in 2019, worked and discharged its duties during the year. It also demonstrates the status of compliance with the corporate governance regulations under the Banking Act Direction No 11 of 2007 for Licensed Commercial Banks issued by CBSL. The Bank has also voluntarily adopted the revised Code of Best Practice on Corporate Governance issued jointly by the Securities and Exchange Commission of Sri Lanka and the Institute of Chartered Accountants of Sri Lanka in December 2017.
The Board of Directors are guided by a Code of Business Conduct and Ethics for Directors while employee practices are governed by a separate Employee Code of Ethics, on which annual declarations of compliance are obtained.
I hereby confirm that I am not aware of any material violations of any of the provisions set out in the Bank’s Code of Ethics by Key Management Personnel.
Way forward 2020
As Sri Lanka’s leading financial intermediary, the Board firmly believes that BoC has a pivotal role to play in supporting the country’s anticipated economic revival. As such, we are committed to fostering rural economic empowerment and equitable wealth distribution while supporting the country’s SME sector and the Bank’s strategy and activities will be directed towards the achievement of these objectives.
Kanchana RatwatteChairman
24 March 2020
Approach to Corporate Governance
Governance Framework
BoC’s Governance Framework has been carefully designed to address the varying needs of the Bank’s diverse stakeholders, particularly given its status as a state-owned systemically important bank. The framework aims to address potential trade-offs between long-term and short-term outcomes while ensuring an appropriate balance of power and accountability across the Bank. Extending beyond mere compliance, the Bank views corporate governance as an enabler which leads to greater transparency, accountability, robust risk management and effective leadership. The framework is built on the following external and internal steering instruments;
External Instruments
• Bank of Ceylon Ordinance No.53 of 1938 (referred to as “Ordinance”) and its amendments
• Banking Act No.30 of 1988 and its amendments
• Banking Act Direction No.11 of 2007 on Corporate Governance for Licensed Commercial Banks
• Circulars applicable to the Bank issued by the Government
• Continuing listing requirements of the Colombo Stock Exchange
• Code of Best Practice on Corporate Governance issued by the Institute of Chartered Accountants of Sri Lanka in December 2017
Internal Instruments
• Board Charter
• Subcommittee charters
• Codes of conduct and ethics
• Comprehensive policies and procedures
• Subsidiary Management Charter
• Customer Charter
Internal Mechanisms
• Stakeholder engagement
• HR and People management
• Strategic and corporate planning
• Risk Management
• IT and Cyber Security Governance
9 Good Governance, Ethics and Risk Management

About this Report / Performance Highlights 2019 / Chairman’s Message / General Manager’s Review / Organisational Overview / Strategic Report / Performance and Outlook / Stakeholder Value Creation / Financial Reports / Compliance Annexes / Supplementary Information
101
Governance Structure
The consistent application of the Bank’s governance aspirations is ensured through a well-defined governance structure comprising multi-level governance bodies, specific roles and responsibilities and clear reporting lines. The Board of Directors serves as the highest governing authority and is empowered to delegate the oversight responsibilities of specific functions to Subcommittees as it thinks appropriate. Day-to-day management of the Bank has been delegated to the management team led by the General Manager. The Governance Structure is graphically illustrated below;
Shareholder(The Government of Sri Lanka)
General Manager
Executive Committees
Auditor General
Board Secretariat
Internal Audit
Risk Management
Compliance
Corporate Management and theExecutive Management Team
Bo
ard
Sub
com
mitt
ees
Audit Committee
IntegratedRisk
Management Committee
Human Resources and Remuneration
Committee
Nomination and
Corporate Governance Committee
Information Technology
andCommunication
Committee
Board of Directors
Appointment flow
Reporting flow
Board Subcommittees
The Board Subcommittees operate within a defined mandate as outlined in the Committee Charters. The Committee chairpersons are responsible for the effective functioning of the committees and to report and make recommendations to the Board on the respective activities.
Executive Committees
The management of the day-to-day operations have been delegated to the Corporate Management team led by the General Manager. Several executive level committees have been established with specific responsibilities and clearly defined mandates.

BA
NK
OF
CE
YL
ON
AN
NU
AL
RE
PO
RT
20
19
102
About this Report / Performance Highlights 2019 / Chairman’s Message / General Manager’s Review / Organisational Overview / Strategic Report / Performance and Outlook / Stakeholder Value Creation / Financial Reports / Compliance Annexes / Supplementary Information
Subcommittee Mandate
BOARD SUBCOMMITTEES
Audit Committee Reviews the Bank’s financial reporting process including internal controls, internal and external audit (Refer Audit Committee Report on page 109)
Integrated Risk Management Committee
Oversight responsibility for all areas of risk management including credit, market, operational, liquidity, cyber/IT and strategic risks and ensures compliance with the entirety of the risk management policy framework and compliance with laws and regulations. (Refer IRMC Committee Report on page 111)
Human Resources and Remuneration Committee
Responsible for Remuneration policy, setting objectives and evaluating performance of Key Management Personnel (KMP) and determining the Bank’s HR policy. (Refer HR and Remuneration Committee Report on page 113)
Nomination and Corporate Governance Committee
Responsible for implementing procedures to select/ appoint key management persons and evaluating their sustainability, review code of ethics and improve corporate governance practices. (Refer Nomination and Corporate Governance Committee Report on page 114)
Information and Communication Technology Committee
Oversight responsibility for IT products, services, policies, practices and infrastructure. (Refer Information and Communication Technology Committee Report on page 115)
EXECUTIVE COMMITTEES
Assets and Liabilities Management Committee (ALCO)
Reviews the funding strategy, liquidity management, assets mismatch as well as market risk exposures, management of liquidity risk and interest rate risk as primary objectives and manages various financial risks of the Bank.
Branches Division Credit Committee
Provides quality and quick service to the customers by expediting the requests of high net-worth customers and streamlining the credit administration process while managing credit risk.
Business Continuity Coordinating Committee
Managing and coordinating all aspects of the Business Continuity Management process.
Business Continuity Implementation Committee
Effective implementation of the Bank’s Business Continuity Plan.
Business Continuity Management Alternative Committee (BCMAC)
Serves temporarily, immediately after any disaster, until the other Business Continuity Management Committees are established.
Committee Dealing with Forged Cheques and Fraud
Makes recommendations to respective authorities for writing off unrecoverable balances on forged cheques and frauds after considering all possible ways of recovering the same.
Corporate Information Security Committee
Provides direction and support for the Bank’s information security initiatives, including ensuring the application of processes specified in the Information Security Policy (ISP), review and communication of information security plans, conduct investigations of security breaches and drive the Bank’s information security.
Corporate Management Committee
The highest management level committee of the Bank which is responsible for making vital operational decisions which do not fall under the purview of the other management committees. It also reviews the Bank’s entire performance, with a view to formulating strategies and issuing directions to manage deviations.
Corporate Strategic Review Committee
Assist the management to streamline the process of planning, implementing and monitoring of corporate strategies of the Bank
Credit Committee Reviews and approves large ticket size credit proposals. And maximise risk adjusted rate of return by maintaining credit risk exposures within acceptable parameters
Damage Assessment and Restoration Committee (DARC)
Assesses damage to Bank Property and Restoration.
HR Policy Committee Implementation of the Board’s human resource policies and making recommendations to Board of Directors where necessary
Idle Asset Committee Monitors the process of disposal of properties vested in the Bank as per the Ordinance, Debt Recovery Act and internal instruction circulars.
9 Good Governance, Ethics and Risk Management

About this Report / Performance Highlights 2019 / Chairman’s Message / General Manager’s Review / Organisational Overview / Strategic Report / Performance and Outlook / Stakeholder Value Creation / Financial Reports / Compliance Annexes / Supplementary Information
103
EXECUTIVE COMMITTEES
Internal Capital Adequacy Assessment Process Steering Committee
Responsible for the development and implementation of the ICAAP process across the Bank.
Investment Committee Responsible for investment decisions including long-term strategic investments, short-term investments and disposal decisions. (excluding investments in equity of subsidiaries and Government securities)
Committee for Investment in Government Securities
Assist the management in the discharge of its statutory duties and its oversight responsibilities in relation to investments in Government securities.
IT Steering Committee Implementation of the Bank’s IT strategy including approving project plans, monitoring project progress and drive teams for implementation.
Marketing Committee Plans appropriate marketing strategies with a view to championing novel marketing concepts, planning and executing CSR programmes and creating an effective communication platform to build the Bank’s image.
Non-performing Assets Review Committee (NPAC)
Reviews stressed loans and advances and recommends risk mitigation strategies and recovery mechanisms.
Operational Risk Management Executive Committee
Responsible for all operational risk management matters of the Bank and facilitates the addressing of cross-functional risk issues.
Reward and Recognition Policy Committee (RRPC)
Recognising and rewarding high-performing employees for their contribution to the Bank.
Scholarship Programme Selection Committee (Review Committee)
Select appropriate/ suitable and required overseas programmes for the Bank.
Scholarships Committee Select training programmes and seminars/ workshops, visits and nominate suitable participants for overseas training opportunities.
Sustainability Committee Implementation of the Bank’s Sustainability Strategy including coordinating sustainability initiatives.
Technical and Operational Committee
Assists in taking appropriate measures to mitigate losses that may arise due to disruptions to operate
Effective Leadership
Board of Directors
The Board composition is clearly set out in the Ordinance and relevant amendments, which states that the Board can have up to six (6) Non-Executive Directors. Directors are appointed by the relevant Minister to whom state banks are assigned and a representative of the Ministry in charge of the subject of Finance holds an Ex officio position on the Board. Independence of Directors is assessed based on the criteria set out in the Banking Act Direction No.11 of 2007 on Corporate Governance. A new Board was appointed in January 2020, following changes in the political landscape and as at the date of sign-off of this Report, the Board comprised of five Directors.
Please refer to page 25 for profiles of Directors.
Board Composition
Directors possess a combination of diverse skills and industry experience, representing both the public and private sectors. This enhances the depth of discussions, enabling a constructive dialogue with the management team and contributing towards the effectiveness of decision making. There is sufficient financial acumen on the Board, with three out of the five Directors currently holding memberships in professional accountancy bodies. The Board is also relatively young in its age representation, with three Directors below the age of 50 years.
Board Responsibilities
The Board of Directors serves as the custodian of the Group’s corporate governance framework and holds ultimate responsibility for the sustainable creation of value. Board responsibilities and powers are clearly outlined in the
Skill Composition
Corporate leadership 3
Finance and economics 3
Public administration 3
Digital and IT 2
Legal 1
80%
20%
Gender Representation at Board Level
n Male n Female

BA
NK
OF
CE
YL
ON
AN
NU
AL
RE
PO
RT
20
19
104
About this Report / Performance Highlights 2019 / Chairman’s Message / General Manager’s Review / Organisational Overview / Strategic Report / Performance and Outlook / Stakeholder Value Creation / Financial Reports / Compliance Annexes / Supplementary Information
Board Charter and includes setting strategic direction, establishing robust governance and risk management practices, ensuring regulatory compliance, safeguarding the Bank’s reputation and presenting a balanced and fair assessment of the Bank’s financial performance and position. The Board Charter is reviewed regularly and revised to ensure relevance to strategic aspirations and value creation.
Segregation of Duties
Appropriate balance of power is ensured through clarity in roles and effective segregation of responsibilities. The role of Chairman is separate from that of the Chief Executive Officer (referred to as the General Manager); the Chairman is a non-executive Director and provides leadership to the Board while the General Manager provides executive leadership and does not hold a Board position.
The major role/ responsibilities of the Chairman and General Manager are given below;
80%
20%
Age Representation at Board Level
n 40-55 years n 55-65 years
Chairman
Leading the Board and ensuring its effectiveness
Facilitating effective participation of all Board members
Maintaining effective communication with the shareholder, the Government of Sri Lanka
Ensuring that adequate information is available to all Directors
Setting the ethical tone at the top
General Manager
Execution of the strategic agenda set out in the Bank’s corporate plan in line with the financial and non-financial targets set by the Board
Monitoring and reporting the Bank’s performance to the Board
Ensuring that the Bank operates within the approved risk appetite
Board Appointments and Succession
As a state-owned bank, appointments to the Board are made by the Government of Sri Lanka through the Minister responsible for state banks. The Central Bank of Sri Lanka approves the appointments made if the required criteria for fitness and proprietary are met. Director resignations and removals are also referred to the same Minister while the Central Bank of Sri Lanka and the Colombo Stock Exchange are kept duly informed of any such changes to the Board.
Board Induction
Upon joining the Board, Directors are provided a structured induction and comprehensive information pertaining to the Bank’s governance framework and operations among others. The General Manager conducts a comprehensive presentation detailing the Bank’s history, business model, organisational structure, business verticals and support functions. One-on-one meetings and departmental visits are scheduled as may be necessary to familiarise Directors to the Bank’s operations. The comprehensive induction pack provided to Directors includes the following information:
• Overview of the Bank - including profile, vision and mission, ethics and corporate values, core areas of operation, information on the branch network and details on subsidiaries and associates
• Details on the governance framework including governance and organisational structures, responsibilities of the Board and Subcommittees among others.
• Regulatory framework including relationships with the regulators and line ministry, and Government audit requirements
• Details of the Corporate Management team, management committees and delegated authority limits
• Board support framework including access to the Board Secretariat, board
procedures etc.
Board Training and Access to Information
All directors have access to complete and timely information which supports the effective discharge of their responsibilities. In line with the Policy for Directors’ Access to Independent Professional Advice, Directors are also given the opportunity for external expert input at the Bank’s expense. In 2019, Directors underwent a training on Conflict of Interest. An electronic board paper system is used to provide access to board papers and relevant information is circulated via this system allowing adequate time for Directors to prepare for the meetings. Meanwhile, the Management Team may be invited to Board meetings as and when required, to provide any input to facilitate decision making.
Company Secretary
The Bank’s Secretary to the Board/ Secretary, Bank of Ceylon, Ms Janaki Senanayake Siriwardane has been appointed as prescribed by requirements of the Banking Act and relevant amendments. The Company Secretary plays a key role in implementing the Bank’s Corporate Governance framework and ensuring that Board procedures are followed in line with applicable laws, rules and regulations. The Secretary regularly reviews the Bank’s governance framework in view of emerging best practices, regulatory changes and stakeholder interests. All Directors have access to the advice and services of the Secretary to the Board.
9 Good Governance, Ethics and Risk Management

About this Report / Performance Highlights 2019 / Chairman’s Message / General Manager’s Review / Organisational Overview / Strategic Report / Performance and Outlook / Stakeholder Value Creation / Financial Reports / Compliance Annexes / Supplementary Information
105
Board Contribution in 2019
Monitoring Performance
• Regular performance updates including monthly financial performance of the Bank and quarterly updates on subsidiary performance
• Recommendations and feedback from Subcommittees
• Funding, capital and liquidity plans
Guidance on Strategy
• Constructively challenge the management at Strategy session and mid-year Corporate Plan review
Risk Oversight
• Approval of risk appetite and monitoring risk dashboards on an ongoing basis
• Strengthen the Bank’s cybersecurity and digital resilience
• Monitoring risk profile of subsidiaries
• Approval and review of policy framework
Values-based Culture
• Setting the right tone at the top
• Oversight on corporate culture
Sustainability and Stakeholder Relations
• Reviewed and updated the Bank’s Sustainability Policy
• Maintained strong relationships with all stakeholders
Monitoring Performance
Regular updates are provided to the Board of Directors ensuring that performance is maintained in line with the Bank’s strategic aspirations and long-term objectives. Updates provided to the Board include monthly financial statements, reports on performance and stability, performance against strategic objectives, recommendations and highlights from Subcommittee meetings as well as quarterly subsidiary performance updates.
Oversight over Subsidiaries
The Bank’s Subsidiary Management Charter ensures the consistent application of sound governance and risk management practices across the Bank’s ten direct and indirect subsidiaries. Regular performance updates and risk dashboards are presented to the parent entity to evaluate potential losses/risks stemming from subsidiaries and recommend corrective action. The Board reviews the subsidiary risk dashboards
on a periodic basis, ensuring that the risk profiles are maintained within the defined parameters. BoC’s Compliance Officer is also responsible for overseeing the compliance of the subsidiaries. Bank representatives also typically hold at least one Board position in the subsidiary boards, ensuring that the parent entity’s interests are preserved.
Setting Strategy
The Strategic Plan is formulated by the Management Team in line with the Board’s strategic aspirations. Board provides their input at Strategic Planning session held in an off-site location, which is held with the participation of all Directors and representatives of the Management Team. The Board constructively challenges the ideas put forward by the Management Team, facilitating in-depth discussions and more effective decision making. The Board also attended the mid-year Strategic Plan review for 2019.
Risk Oversight and Control
The Board provides oversight for the Bank’s risk management and internal control frameworks and is responsible for formulating a solid foundation of policy frameworks. Policies are reviewed at least annually and updated to ensure relevance to emerging dynamics and internal changes. Key changes to the Group’s policy framework during the year are listed alongside.
Policies Introduced/ Revised in 2019
• Revisions to the Board Charter and Subcommittee TORs
• Revisions to the Subsidiary Management Charter
• Revisions to the Sustainability Policy

BA
NK
OF
CE
YL
ON
AN
NU
AL
RE
PO
RT
20
19
106
About this Report / Performance Highlights 2019 / Chairman’s Message / General Manager’s Review / Organisational Overview / Strategic Report / Performance and Outlook / Stakeholder Value Creation / Financial Reports / Compliance Annexes / Supplementary Information
9 Good Governance, Ethics and Risk Management
Corporate Governance Policy: During the year the Bank initiated the formulation of the Corporate Governance Policy, clearly detailing the Governance Structure, Responsibilities of the Board of Directors, Meetings and relevant procedures. Code of Business Conduct and Ethics for Directors, Board Evaluation and Management of the Bank’s subsidiaries among others; the policy is in the finalisation stage and approvals are in the pipeline.
Risk Management: The Board also holds apex responsibility for safeguarding the Bank’s assets through effective risk management. The Board is supported by the Integrated Risk Management Committee (IRMC) and Audit Committee in the discharge of its risk management and internal control responsibilities respectively. The scope of both committees is clearly outlined in the respective committee charters and are in line with the requirements of the Code of Best Practice on Corporate Governance and Directions on Corporate Governance issued by CBSL.
The Bank’s risk management framework is built on the internationally recognised three lines of defense model, ensuring the effective segregation of duties in risk identification, measurement, monitoring and management.
The Board approves the Bank’s risk appetite and regularly assess the principal risks facing the Bank. Risk appetite dashboards and performance against these defined parameters are reviewed regularly at the IRMC meetings to ensure that the Board is satisfied with the Bank’s risk profile and mitigating tools in place to effectively address these risks. (Please refer to page 44 - Risk Management Review and page 112 - IRMC Report for further information)
Digital Resilience
BoC has embraced advances in digital technology to drive internal efficiencies in operations, enhance competitiveness and transform the customer experience.
While this is likely to strengthen the Bank’s competitive position over time it has also exposed the Bank to a potential increase in digital and cyber security risks, underscoring the need to effectively manage such risk exposures. During the year, considerable focus was placed on enhancing the Bank’s cyber security and technology risk management framework:-
• Addition of cybersecurity as an item on the Board meeting agenda.
• Developed and updated Information security related Policies, Guidelines, Standards and Procedures.
• Prepared the Cyber Security Framework for the Bank in alignment with leading Information Security/ Cyber Security Standards.
• A detailed plan has been developed to monitor Information Security Management efforts/ activities which are done by different departments/ units.
• Appointment of a dedicated Information Security Management Officer (ISMO) who reports to the Chief Information Security Officer (CISO).
Refer to page 59 for further information
Building a values-based Aulture
The Board sets the right tone at the top and plays a pivotal role in propagating a values-based culture which underscores integrity and transparency. As a Bank whose mission extends beyond profit generation to encompass social and public interest objectives, creation of a values-based culture is a vital element in nurturing and reinforcing relationships with stakeholders. The following frameworks facilitate the propagation of such as a culture and provides a strong foundation for employees to conduct themselves in a responsible and ethical manner.
Corporate Values
• Being customer centric
• Respecting all forms of diversity
• Committing towards high level of ethics, governance and professionalism
• Focusing towards agility and innovation
• Being accountable for all our actions
Directors' Code of Business Conduct and Ethics: The Board is bound by this Code of Ethics and are required to submit an annual confirmation on their compliance with the provision of the code. The Code aims to propagate a strong culture of integrity, transparency and anti-corruption while encouraging Directors to act in the best interest of the Bank.
Employee Code of Ethics: Applicable to all employees, this clearly sets out the Bank’s expectations in dealing with internal and external stakeholders, behaviour, bribery and corruption.
A Board-approved Whistleblowing policy encourages employees or non-employees to report complaints pertaining to suspected theft/ fraud, corruption, misuse of Bank’s assets or any other actions that are considered unethical or illegal. Complaints are directed and overseen by the Chief Internal Auditor while complaints made against employees of the DGM grade or above are submitted to the Chairman of the Audit Committee.
The Bank takes a zero-tolerance approach to Bribery and Corruption and is committed to acting professionally, fairly and with integrity in all its business dealings and relationships wherever the Bank operates and implementing and enforcing effective systems to counter bribery. The Bank's policy with regards to Anti-Corruption and Bribery is clealry communicated to all employees during the induction programmes and reinforced through regular training and awareness sessions.
Code of Business
Conduct and Ethics
Anti-corruption
Whistleblowing Policy
About this Report / Performance Highlights 2019 / Chairman’s Message / General Manager’s Review / Organisational Overview / Strategic Report / Performance and Outlook / Stakeholder Value Creation / Financial Reports / Compliance Annexes / Supplementary Information
107
Sustainability and Stakeholder Relations
Sustainability at BoC
The Bank’s approach to Sustainability is clearly outlined in a Board-approved Sustainability Policy which was further strengthened during the year under review. Our policy is centred on the tenet that “Sustainability is a Lifestyle” and focuses on the three main dimensions of economic, environmental and social sustainability and United Nation - Sustainable Development Goals are integrated to our sustainability framework. The Board provides oversight on all Sustainability-related matters while responsibility for implementing the policy lies with a Sustainability Committee, which is chaired by the General Manager. The Bank takes the Precautionary approach into account when evaluating major investments; accordingly, social and environmental factors are given due consideration when conducting investment appraisals. The Bank also have voluntary signed up for the Sustainable Banking principles launched by the Sri Lanka Banks Association.
Refer to page 79 for further information
Key aspects of our Sustainability Policy
Integrate sustainability into key business decisions and initiatives
Uplifting society’s most needed segments
Financial inclusion
Ethical finance
Stakeholder Interaction
The Bank’s Communication Policy provides guidance on maintaining effective and relevant communication with internal and external stakeholders, nurturing open and sustainable relationships. The Policy is reviewed by the Nomination and Corporate Governance Committee. Platforms through which the Bank maintains communication with its stakeholders is briefly outlined below while further detail is provided on page 128 of this Report.
Shareholder Employees Customers
Engagement with the Government (our sole shareholder) is facilitated through the permanent representative on the Board as the Ex officio Director appointed from the Ministry in charge of the subject of Finance. The Annual Report is presented to the Parliament through the relevant Ministry.
The Bank maintains an open-door policy with all employees while engagement is also facilitated through cordial relations with trade unions, multi-level staff meetings, grievance handling mechanisms and a year-round calendar of cultural, entertainment and sporting events.
Engagement with customers is maintained through branches, Relationship Managers and multi facet digital channels while customer satisfaction surveys are also conducted on a regular basis.
Contribution to the Industry Dialogue: The Bank continues to play an active role in industry associations and forums, contributing its insights towards creating a conducive operating environment and resolving challenges. Key associations in which the Bank and/ or its employees holds membership are given below;
• Asia Pacific Rural and Agricultural Credit Association
• Association of Banking Sector Risk Professionals, Sri Lanka
• Institute of Bankers of Sri Lanka
• International Chamber of Commerce Sri Lanka
• The National Chamber of Commerce, Sri Lanka
• Sri Lanka Banks Association (Guarantee) Limited
• The Ceylon Chamber of Commerce
• Bio Diversity Sri Lanka
• The Financial Ombudsman of Sri Lanka (Guarantee) Limited
• Association of Compliance Officers of Banks, Sri Lanka
• Bar Association of Sri Lanka
• Association of Board and Company Secretaries of Banks in Sri Lanka
Activities in 2019
Board Meetings
The Board convened 22 times in 2019. The Secretary, BoC/ Secretary to the Board ensures that all procedures are duly followed in setting meeting agendas, circulating information, conducting Board meetings and maintaining minutes. Efforts are made to ensure that the Board dedicates adequate time to consider matters critical to the Bank such as corporate planning, risk management, compliance and governance matters. Key processes carried out to ensure the effectiveness of Board meetings are as follows :

BA
NK
OF
CE
YL
ON
AN
NU
AL
RE
PO
RT
20
19
108
About this Report / Performance Highlights 2019 / Chairman’s Message / General Manager’s Review / Organisational Overview / Strategic Report / Performance and Outlook / Stakeholder Value Creation / Financial Reports / Compliance Annexes / Supplementary Information
Fixed Remuneration Variable Remuneration Other non-cash benefits
Base salary and other fixed components- determined on role and employee grade
Incentive bonus Post-employment benefits
Loans under special schemes
Credit cards
Post-meeting
Calendar is set for Board meetings and Subcommittee meetings and notice is given to Directors through an Annual Calendar.
Start of the year
Board papers are prepared and electronically circulated to Directors through a secure portal at least 7 days prior to the meeting. This ensures sufficient time to review matters which are to be discussed and seek additional clarifications if required.
Board paper compilation
and circulation
• Board meetings have certain standard items amongst which are performance updates, risk dashboards and recommendations from Subcommittees.
• Members of the Management Teams are invited to Board/ Subcommittee meetings to provide additional clarification if required.
Board Meeting
• The Secretary BoC/ Secretary to the Board prepares the minutes and circulates among Directors through a secure e-Solution within 10 days of the meeting.
• Draft minutes are circulated to the Senior Management Team the day following the meeting.
• Minutes are adopted at the subsequent Board meeting.
• Follow up action is taken on outstanding matters.
• The Secretary, BoC/ Secretary to the Board sets the agenda under the authority delegated by the Chairman.
• Directors are free to submit proposals to the agenda for discussion at Board meetings.
• Matters arising from internal/ external developments may be added to the agenda.
Agenda
Assessing Board Effectiveness
The Bank has a structured process for assessing Board effectiveness through a self-appraisal mechanism. Each Director is required to complete a performance evaluation form, subsequent to which responses are aggregated and presented to the Board. Subcommittees also carry out a similar evaluation. Given the changes to the Board during the reviewed period, assessments were not conducted in 2019.
Appraisal of the General Manager:
The Board evaluates the performance of the General Manager (GM) and KMP annually, based on the financial and non-financial targets outlined in the Corporate Plan. The Nominations and Corporate Governance Subcommittee
supports the Board in this endeavour. The criteria are agreed with the GM/ KMP at the beginning of the year, ensuring clarity in the Board’s expectations. The appraisal takes into consideration dynamics in the operating landscape as well as feedback received from the appraisee.
Director and Executive Remuneration
The Bank’s Remuneration Philosophy reflects its broader commitments to its stakeholders and strives to reward sustainable performance on a long-term basis.
Directors’ remuneration is determined by the Directors’ Remuneration Policy which reflects the particulars of the circulars and letters issued by the Government of Sri Lanka and the provisions of the Ordinance and its amendments. No Director is involved in determining his/ her remuneration.
Remuneration for GM and KMP is based on the Board-approved Remuneration Policy for Key Management Personnel. Compensation practices emphasise achievement of agreed deliverables with the aim of nurturing a performance-driven culture. The Board HR & RC makes recommendations to the Board on the GM/ KMP remuneration, based on which the Board approves and provides feedback to the relevant Minister who grants final approval in accordance with the provisions of the Ordinance and its amendments. The remuneration of the GM and KMP are reviewed every three years.
Remuneration Structure
BoC’s reward structures are designed to offer fair and competitive remuneration. Due consideration is given to achieving the optimal mix between fixed and variable pay depending on the role and responsibilities. Key elements of the Bank’s remuneration composition are given below;
Please refer to page 188 for details on Director Remuneration, page 370 for KMP Remuneration and page 113 for the Report of the Board HRRC.
9 Good Governance, Ethics and Risk Management

About this Report / Performance Highlights 2019 / Chairman’s Message / General Manager’s Review / Organisational Overview / Strategic Report / Performance and Outlook / Stakeholder Value Creation / Financial Reports / Compliance Annexes / Supplementary Information
109
Board Subcommittee ReportsAudit Committee Report
Committee Composition during 2019
From 1 April 2019 to 1 July 2019
(1) Mr Kumar Mayadunne
Chairman/ Independent Non-Executive Director
(2) Mr K A Vimalenthirarajah
Member/ Non-Executive Ex officio Director
(3) Mr P A Schaffter
Member/ Independent Non-Executive Director
From 2 July 2019 to 27 November 2019
(1) Mr S Nilam Jayasinghe
Chairman/ Independent Non-Executive Director
(2) Mr K A Vimalenthirarajah
Member/ Non-Executive Ex officio Director
(3) Mr Kumar Mayadunne
Member/ Independent Non-Executive Director
(4) Mr P A Schaffter
Member/ Independent Non-Executive Director
New Committee for 2020
Pursuant to the reconstitution of the Board in January 2020, the following Directors were appointed to the Audit Committee w.e.f. 21 January 2020:
(1) Mr Lalith P Withana
Chairman/ Independent Non-Executive Director
(2) Ms Visakha Amarasekere*
Member/ Non-Executive Ex officio Director
(3) Mr G Harsha Wijayawardhana
Member/ Independent Non-Executive Director
(4) Mr Hasitha Premaratne
Member/ Independent Non-Executive Director
Secretary to the Committee
The Secretary, Bank of Ceylon/Secretary to the Board who is an Attorney-at-Law and a Deputy General Manager, functions as the Secretary to the Committee.
Regular Participants
• Chief Internal Auditor
• Chief Risk Officer
• Compliance Officer
• Assistant General Manager (Province/Branch and Credit Audit)
• Assistant General Manager (Investigations)
• Assistant General Manager (Information Systems Audit)
• Assistant General Manager (Risk Management)
• Internal Auditor
• IT Risk Officer
• Representatives of the Auditor General (the External Auditor of the Bank)
Attend upon invitation.
• General Manager
• Chief Financial Officer
• Deputy General Manager (Finance and Planning)
• Any other member of Corporate or Executive Management/ Any other Staff Member
Meetings held in 2019: 06
(Attendance given on page 99 of this Report)
Quorum: Two members or majority of the members whichever is higher
Role of Committee
Audit Committee Charter
The Terms of Reference of the Audit Committee are governed by the Audit Committee Charter, approved and adopted by the Board.
The Committee also ensures that the scope and coverage of its functions addresses the requirements of the Banking Act Direction No. 11 of 2007 on “Corporate Governance for Licensed Commercial Banks in Sri Lanka” and its subsequent amendments issued by the Central Bank of Sri Lanka.
Principal Focus
The Audit Committee primarily focuses on assisting the Board in fulfilling its duties by providing an independent and objective review of the Bank’s financial reporting process.
Medium of Reporting
The proceedings of the Audit Committee meetings are tabled and ratified at the Board meetings, where all key issues, concerns, actions taken, outcomes achieved or pending, and follow-up initiated, are clarified, discussed and Board approval obtained thereof.
Areas of focus and activities in 2019
Financial Reporting
• Reviewed the monthly, quarterly and annual unaudited/audited Financial Statements to ensure that they are prepared and published in accordance with the requirements prescribed by the supervisory and regulatory authorities and applicable Accounting Standards.
Regulatory Compliance
• Reviewed compliance with mandatory banking and other statutory requirements.
• Reviewed the progress of action taken in relation to the findings of the statutory examinations carried out by regulators.
Internal Controls
• Reviewed the adequacy and effectiveness of the internal control mechanism of the Bank in line with Section 3(8) (ii)(b) of the Banking Act Direction No.11 of 2007 through the Internal Control Matrix updated for 2018.
• On a regular basis and when specific events or cases warranted, conducted root cause analysis and made improvements to the systems, procedures and internal controls.
Internal Audit
• Reviewed the independence, objectivity, and performance of the internal audit function as well as the adequacy of the Department’s resources.
• Approved the Internal Audit Plan and reviewed the effectiveness of the implementation of the Plan throughout the year.
• Reviewed significant internal audit findings and management’s responses thereto, with a view to taking timely corrective action.
• Monitored the progress of the initiatives taken by the Internal Audit Department to improve Internal Control Monitoring Process. i.e. Cluster Internal Control Officer System, Internal Audit Rating Leader Board System, Desktop Message Publishing System and Island-wide Internal Control Awareness Programmes.
• Monitored the compliance with the Banking Act Direction no. 11 of 2007 on Corporate Governance issued by Central Bank of Sri Lanka on Internal Audit Charter and Audit Committee Charter.
External Audit
• The external audit of the Bank is carried out by the Auditor General in terms of the Constitution of the country. The Committee ensured that the external audit is carried out effectively and independently and maintained a continuous rapport with the representatives of the Auditor General in relation to the audit approach and procedure.
The Committee wishes to record an appreciation for the past Chairmen and the members of the Audit Committee who functioned in year 2019 for the valuable service that has been rendered by them.

BA
NK
OF
CE
YL
ON
AN
NU
AL
RE
PO
RT
20
19
110
About this Report / Performance Highlights 2019 / Chairman’s Message / General Manager’s Review / Organisational Overview / Strategic Report / Performance and Outlook / Stakeholder Value Creation / Financial Reports / Compliance Annexes / Supplementary Information
Board Subcommittee Reports
Way Forward
The Audit Committee will foster a positive and effective internal control environment by committing to achieve the objectives set out in the Audit Committee Charter during 2020 and beyond.
Conclusion
The Committee wishes to draw attention to the fact that none of the members currently serving on the Committee were present during the period covered by this report, i.e., the year ended 31 December 2019. The report, therefore, is based on records, the authenticity of which has been verified and established beyond doubt. The present Committee, therefore, is completely convinced that this report is accurate and free of material misstatements.
On behalf of the Audit Committee.
Lalith P Withana
Chairman,Audit Committee
24 March 2020
*Note:
• Mr A C M Fernando Independent Non-Executive Director was appointed to this Committee as a member w.e.f. 24 April 2020.
• Mr R M P Rathnayake who is the new Ex officio Director on the Board was appointed to this Committee as a member on 12 May 2020 in place of Ms Visakha Amarasekere, who ceased to be the Ex offico Director.
• Accordingly, the current Audit Committee comprises of Mr Lalith P Withana (Chairman), Mr R M P Rathnayake, Mr G Harsha Wijayawardhana, Mr Hasitha Premaratne and Mr A C M Fernando.
Audit Committee Report

About this Report / Performance Highlights 2019 / Chairman’s Message / General Manager’s Review / Organisational Overview / Strategic Report / Performance and Outlook / Stakeholder Value Creation / Financial Reports / Compliance Annexes / Supplementary Information
111
Board Subcommittee ReportsIntegrated Risk Management Committee Report
Committee Composition during 2019
From 19 March 2019 to 27 November 2019
(1) Mr Kumar Mayadunne
Chairman/ Independent Non-Executive Director
(2) Mr K A Vimalenthirarajah
Member/ Non-Independent Non-Executive Ex officio Director
(3) Mr P A Schaffter
Member/ Independent Non-Executive Director
New Committee for 2020
Pursuant to the reconstitution of the Board in January 2020, the following Directors were appointed to the Integrated Risk Management Committee w.e.f. 21 January 2020:
(1) Mr Hasitha Premaratne
Chairman/ Independent Non-Executive Director
(2) Ms Visakha Amarasekere*
Member/ Non-Independent Non-Executive Ex officio Director
(3) Mr G Harsha Wijayawardhana
Member/ Independent Non-Executive Director
(4) Mr Lalith P Withana
Member/ Independent Non-Executive Director
Secretary to the Committee
The Secretary, Bank of Ceylon/Secretary to the Board who is an Attorney-at-Law and a Deputy General Manager, functions as the Secretary to the Committee.
Regular Participants
• General Manager
• Chief Risk Officer
• Compliance Officer
Attend upon invitation
• Any other members of the Board/ Corporate Management/ Any other Staff Member
Meetings held in 2019: 05
(Attendance given on page 99 of this Report)
Quorum: 02 members
Role of Committee
The main role and responsibility: To assist the Board in fulfilling its oversight responsibilities for all aspects of risk management. In this connection the Committee focuses on and reviews credit, market, liquidity, operational and strategic risks through appropriate risk indicators and management information.
Reviewing and/or recommending the following which are identified in the Charter of the Integrated Risk Management Committee:
• Policies, programmes and Management Committee Charters relating to risk management and compliance.
• Risk limits and policies that establish appetite for credit, market, liquidity, operational and other risks, as recommended by the Chief Risk Officer.
• Adequacy and effectiveness of all Management Level Committees to address specific risks and to manage those risks within quantitative and qualitative risk limits as specified by the Committee.
• Risk management reports on the risk profile of the Bank, as well as current market and regulatory risks and actions undertaken to identify, measure, monitor and control such risks.
• Corrective action to mitigate the effects of specific risks in case such risks are beyond the prudent levels decided by the Committee on the basis of the Bank’s policies and regulatory and supervisory requirements.
• Adequacy and effectiveness of risk identification, measurement, monitoring and mitigation relating to credit, market, liquidity, operational and compliance risks.
Integrated Risk Management Committee
Charter
The Terms of Reference of the Integrated Risk Management Committee are governed by the Integrated Risk Management Committee, approved and adopted by the Board.
The Committee also ensures that the scope and coverage of its functions addresses the requirements of the Banking Act Direction No. 11 of 2007 on “Corporate Governance for Licensed Commercial Banks in Sri Lanka” and its subsequent amendments issued by
the Central Bank of Sri Lanka.
Principal Focus
To assist the Board in fulfilling its oversight responsibilities for all aspects of risk management. In this connection the Committee focuses on and reviews credit, market, liquidity, operational and strategic risks through appropriate risk indicators and management information.
Medium of Reporting
The proceedings of the Integrated Risk Management Committee meetings are tabled and ratified at the Board meetings and Board approval obtained thereof.
Areas of focus and activities in 2019
• Reviewed and/or recommended the following policies/manual based on which the risk profile of the Bank is assessed:
� Internal Capital Adequacy Assessment Process Policy
� Group Risk Management Policy
� Integrated Risk Management Policy
� Credit Risk Rating Policy
� Credit Risk Management Policy
� Market Risk Management Policy
� Operational Risk Management Policy
� Fraud Risk Management Policy
� Loan Review Mechanism Policy (LRM) of the Bank
� Foreign Exchange Risk Management Policy
� Limit Management Framework for year 2019
� Middle Office Operations Manual
� IT Risk Management Policy
� Information Security Policy
� Stress Testing Policy
� Revised Credit Portfolio Risk Management Policy
� Reviewed and revised the Integrated Risk Management Committee Charter.
� Recommended the adoption of revised Terms of References of the Fraud Risk Management Committee.
� Recommended the adoption of the following policies in respect of Bank’s overseas operations
� Country Risk Management Policy of Chennai Branch.
� Capital and Liquidity Management Policy for Maldives operations.
� Policy for Record retention for the Bank of Ceylon Maldives operations.
� Reviewed Compliance Policy of Maldives Branch.
� Reviewed Policy on prevention of Money Laundering and Combating Terrorist Financing of Maldives Branch.
� Risk Assessment Policy of Seychelles Branch.
� Customer Acceptance/On Boarding Policy of Seychelles Branch.
� Record Management Policy of Seychelles Branch.
� Transaction Monitoring Policy of Seychelles Branch.
� Reviewed Policy on Anti- Money Laundering (AML) and Combating Terrorist Financing (CFT) of Seychelles Branch.

BA
NK
OF
CE
YL
ON
AN
NU
AL
RE
PO
RT
20
19
112
About this Report / Performance Highlights 2019 / Chairman’s Message / General Manager’s Review / Organisational Overview / Strategic Report / Performance and Outlook / Stakeholder Value Creation / Financial Reports / Compliance Annexes / Supplementary Information
Board Subcommittee Reports
• Recommended the Criteria for rating based lending of the Bank.
• The Independent Integrated Risk Management Division of the Bank assessed the risks of the Bank on a monthly basis and summary reports were submitted before the Committee. The Committee reviewed them and submitted its recommendation to the Board immediately through minutes of the meeting and specific recommendations.
• Risk Appetite and Limit Setting for 2019 was established.
• Monitored quantitative and qualitative risks which have gone beyond the limits and made the necessary recommendations.
• Recommended the adoption of the Internal Capital Adequacy Assessment Process (ICAAP) for the year 2019.
• Reviewed the comprehensive Compliance Reports submitted by the Compliance Officer.
• Improved the Risk Management Dash Board to support the subsidiaries to manage the risk functions better.
• Evaluated and monitored subsidiary Risk Management Dash Boards and made the necessary recommendations to overcome various risks faced by the subsidiaries.
• Monitored Key Risk Indicators in the Branch network, critical businesses and support divisions.
• Reviewed stress testing results on a quarterly basis.
• Special emphasis was placed on IT Risk and associated Cyber Security Risk and initiated and followed-up on various measures to safeguard the Bank from Cyber-attacks. (such as the IT Security Network Infrastructure of the Bank, the Enterprise Immune System etc.)
• Reviewed the Policy on Prevention of Money Laundering and Combating Financing Terrorism.
• Reviewed the Compliance Policy of the Bank.
• Recommended the adoption of the Business Continuity Management Policy and the Business Continuity Plan of the Bank.
• Monitored the maintenance of the minimum Capital Adequacy Ratio as per Basel III guidelines.
• Adoption of the risk management frameworks for Chennai Branch, Seychelles Branch and Male’ Branch.
• Monitored the Risk Aggregation report of the Bank on a quarterly basis.
• Reviewed the decisions of the Committee dealing with Forged Cheques and Frauds on a quarterly basis
The Committee wishes to record an appreciation for the Chairman and the members of the Integrated Risk Management Committee who functioned in year 2019 for the valuable services that has been rendered by them.
Way Forward
In the year 2020, the Integrated Risk Management Committee will assist the Board in fulfilling its oversight responsibilities for all aspects of risk management. The Committee will focus on and review risks such as credit, market, liquidity, operational and strategic risks through appropriate risk indicators and management information.
Also the Committee will establish risk limits and policies that establish appetite for credit, market, liquidity, operational and other risks, as recommended by the Chief Risk Officer.
Conclusion
Acting collectively, the members of the Integrated Risk Management Committee in 2019 has evaluated its performance for effectiveness and efficiency.
The Committee continually reviews the various risks encountered by the bank and strives to promote a robust risk governance framework, a well-developed and explicit risk management policy covering determination of risk appetite, application of up –to-date methodologies for measuring financial risks, developing in-house expertise and ensuring that risk reporting accurately communicates risk exposures and results of stress tests or scenario analyses, data analytics and peer bank analysis.
The Committee is cognisant of the fact that it needs to be vigilant and attuned to its risk combat strategy with the advancement of technology, increased vulnerability with macroeconomic shocks and volatility, and industrywide frauds and Cyber-crimes beginning to pose greater threats.
*Note:
• Mr R M P Rathnayake, the new Ex officio Director on the Board was appointed to this Committee as a member on 12 May 2020 in place of Ms Visakha Amarasekere, who ceased to be the Ex officio Director on the Board.
• Accordingly, the current Integrated Risk Management Committee comprises of Mr Hasitha Premaratne (Chairman), Mr R M P Rathnayake Ex officio Director, Mr G Harsha Wijayawardhana and Mr Lalith P Withana.
Increasing awareness among staff over the need for managing risks, ensuring compliance and training staff are important components of this approach. The Committee is of the view that the Bank is on the right path towards meeting the challenges of Risk Management and compliance safeguarding the interests of Bank’s stakeholders.
The Committee wishes to draw attention to the fact that none of the members currently serving on the Committee were present during the period covered by this report, i.e., the year ended 31 December 2019. The report, therefore, is based on records, the authenticity of which has been verified and established beyond doubt. The present Committee, is of the view that this report is accurate and free of material misstatements.
On behalf of the Integrated Risk Management Committee
Hasitha Premaratne
Chairman,Integrated Risk Management Committee
24 March 2020
Integrated Risk Management Committee Report

About this Report / Performance Highlights 2019 / Chairman’s Message / General Manager’s Review / Organisational Overview / Strategic Report / Performance and Outlook / Stakeholder Value Creation / Financial Reports / Compliance Annexes / Supplementary Information
113
Human Resources and Remuneration Committee Report
Committee Composition during 2019
The members of the Committee, during the year under review, were as follows:
From 19 March 2019 to 27 November 2019
(1) Mr K A Vimalenthirarajah
Chairman/ Non-Independent Non-Executive Ex officio Director
(2) Mr Kumar Mayadunne
Member/ Independent Non-Executive Director
(3) Mr P A Schaffter
Member/ Independent Non-Executive Director
New Committee for 2020
Pursuant to the reconstitution of the Board in January 2020, the following Directors were appointed to the Human Resources and Remuneration Committee w.e.f. 21 January 2020:
(1) Mr Kanchana Ratwatte
Chairman/ Independent Non-Executive Director
(2) Ms Visakha Amarasekere
Member/ Non Independent Non-Executive Ex officio Director*
(3) Mr Hasitha Premaratne
Member/ Independent Non-Executive Director
Secretary to the Committee
The Secretary, Bank of Ceylon/ Secretary to the Board who is an Attorney-at-Law and a Deputy General Manager, functions as the Secretary to the Committee.
Attend upon invitation
• General Manager
• Deputy General Manager (Human Resources)
• Any other member of Corporate or Executive Management
Meetings held in 2019: 1
(Attendance given on page 99 of this Report)
Quorum: 02 members
Role of Committee
Terms of Reference of the Committee
The main responsibilities of the Committee, which are mainly based on the Banking Act Direction No. 11 of 2007 on Corporate Governance for Licensed Commercial Banks in Sri Lanka issued by the Central Bank of Sri Lanka and incorporated into the Committee Charter, are as follows:
• Determining the Remuneration Policy (salaries, allowances and other financial payments) relating to Key Management Personnel (KMP) of the Bank.
• Setting goals and targets for the General Manager (GM) and KMP.
• Evaluating the performance of the GM
and KMP against the set targets and goals periodically and determining the basis for revising remuneration, benefits and other payments of performance based incentives.
• Reviewing staff matters referred to it by the Board.
• Determining the Human Resource Policy and Organisational Structure of the Bank.
Principle focus
• This Committee focuses on assisting the Board in the Human Resource matters primarily on the evaluation of the KMPs.
Medium of Reporting
• The proceedings of the Committee meetings are tabled and ratified at Board meetings and approval of the Board is thus obtained for implementation of the recommendations made by the Committee.
Areas of focus and activities in 2019
• Carried out the performance evaluation of the Key Management Personnel (KMP) including the General Manager for the year ended 2018 based on the targets set at the commencement of the year in line with the Corporate Plan.
(Due to changes to the Board composition the evaluations for 2019 could not be carried out through this committee. However, the performance was reviewed by the Board against the set targets at the time of preparation of the Corporate Plan for 2020-2022.)
• Reviewed and revised the Remuneration Policy for the Chairman and Directors.
(In the case of Bank of Ceylon, the remuneration of Directors is determined in accordance with the circulars and instructions issued by the Government of Sri Lanka, the sole shareholder of the Bank. The provisions in the Bank of Ceylon Ordinance No. 53 of 1938 and its amendments, are also taken into consideration in this regard. The Remuneration Policy is prepared, based on the above, which is reviewed as and when new regulations are issued by the Government. The details of the remuneration given to Directors, are disclosed in the Annual Report on a yearly basis.)
*Note:
• Mr A C M Fernando Independent Non-Executive Director was appointed to this Committee as a member w.e.f. 24 April 2020.
• Mr R M P Rathnayake new Ex officio Director on the Board was appointed to this Committee as a member on 12 May 2020 in place of Ms Visakha Amarasekere, who ceased to the Ex officio Director on the Board.
• Accordingly, the current Human Resources and Remuneration Committee comprises of Mr Kanchana Ratwatte (Chairman), Mr R M P Rathnayake Ex officio Director, Mr Hasitha Premaratne and Mr A C M Fernando.
• Reviewed the Committee Charter.
• The concerns raised by the Central Bank of Sri Lanka in their Statutory Examination Report coming under the purview of this Committee were reviewed and necessary follow up action was taken.
(Remuneration of KMP are revised once in three years and next revision is in 2021 and accordingly this was not discussed.)
The Committee wishes to record an appreciation for the Chairman and the members of the Human Resource and Remuneration Committee who functioned in year 2019 for the valuable services rendered by them.
Way Forward
The Committee will continue to encourage the use of best practices in Human Resource in the Bank.
Conclusion
The Committee wishes to draw attention to the fact that none of the members currently serving on the Committee were present during the period covered by this report, i.e., the year ended 31 December 2019. The report, therefore, is based on records, the authenticity of which has been verified and established beyond doubt. The present Committee, therefore, is completely convinced that this report is accurate and free of material misstatements.
On behalf of the Human Resources and Remuneration Committee
Kanchana Ratwatte
Chairman,
Human Resources and Remuneration Committee
24 March 2020
Board Subcommittee Reports
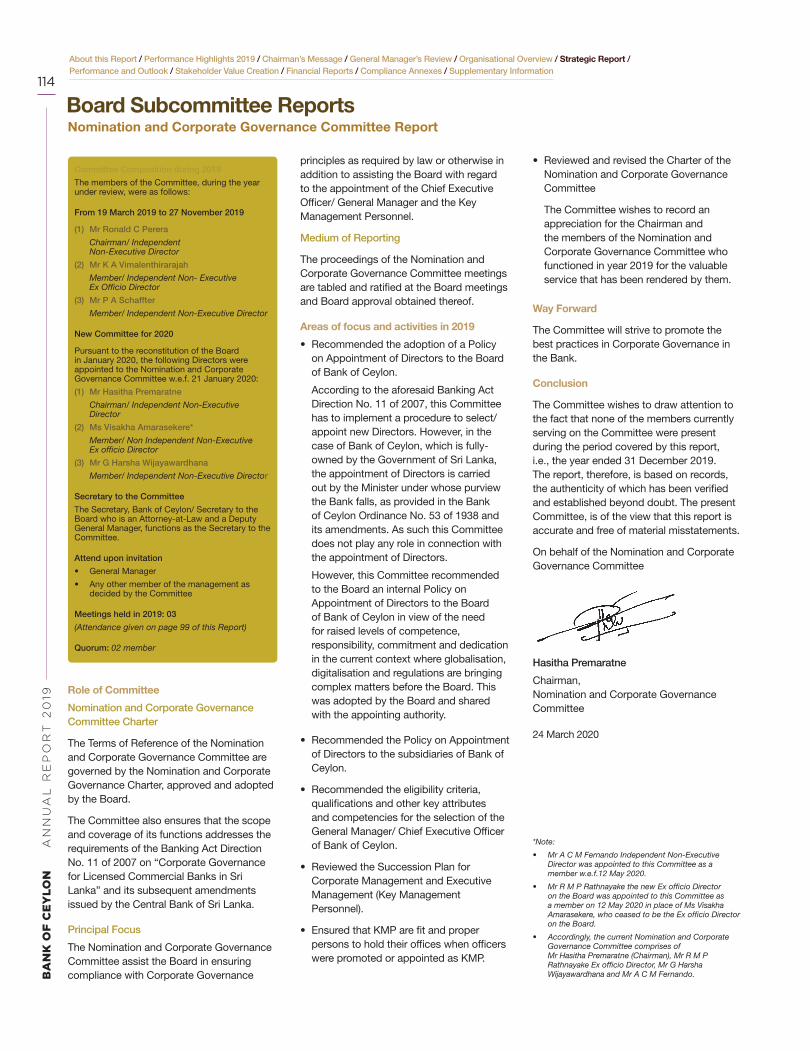
BA
NK
OF
CE
YL
ON
AN
NU
AL
RE
PO
RT
20
19
114
About this Report / Performance Highlights 2019 / Chairman’s Message / General Manager’s Review / Organisational Overview / Strategic Report / Performance and Outlook / Stakeholder Value Creation / Financial Reports / Compliance Annexes / Supplementary Information
Board Subcommittee ReportsNomination and Corporate Governance Committee Report
Committee Composition during 2019
The members of the Committee, during the year under review, were as follows:
From 19 March 2019 to 27 November 2019
(1) Mr Ronald C Perera
Chairman/ Independent Non-Executive Director
(2) Mr K A Vimalenthirarajah
Member/ Independent Non- Executive Ex Officio Director
(3) Mr P A Schaffter
Member/ Independent Non-Executive Director
New Committee for 2020
Pursuant to the reconstitution of the Board in January 2020, the following Directors were appointed to the Nomination and Corporate Governance Committee w.e.f. 21 January 2020:
(1) Mr Hasitha Premaratne
Chairman/ Independent Non-Executive Director
(2) Ms Visakha Amarasekere*
Member/ Non Independent Non-Executive Ex officio Director
(3) Mr G Harsha Wijayawardhana
Member/ Independent Non-Executive Director
Secretary to the Committee
The Secretary, Bank of Ceylon/ Secretary to the Board who is an Attorney-at-Law and a Deputy General Manager, functions as the Secretary to the Committee.
Attend upon invitation
• General Manager
• Any other member of the management as decided by the Committee
Meetings held in 2019: 03
(Attendance given on page 99 of this Report)
Quorum: 02 member
Role of Committee
Nomination and Corporate Governance Committee Charter
The Terms of Reference of the Nomination and Corporate Governance Committee are governed by the Nomination and Corporate Governance Charter, approved and adopted by the Board.
The Committee also ensures that the scope and coverage of its functions addresses the requirements of the Banking Act Direction No. 11 of 2007 on “Corporate Governance for Licensed Commercial Banks in Sri Lanka” and its subsequent amendments issued by the Central Bank of Sri Lanka.
Principal Focus
The Nomination and Corporate Governance Committee assist the Board in ensuring compliance with Corporate Governance
principles as required by law or otherwise in addition to assisting the Board with regard to the appointment of the Chief Executive Officer/ General Manager and the Key Management Personnel.
Medium of Reporting
The proceedings of the Nomination and Corporate Governance Committee meetings are tabled and ratified at the Board meetings and Board approval obtained thereof.
Areas of focus and activities in 2019
• Recommended the adoption of a Policy on Appointment of Directors to the Board of Bank of Ceylon.
According to the aforesaid Banking Act Direction No. 11 of 2007, this Committee has to implement a procedure to select/ appoint new Directors. However, in the case of Bank of Ceylon, which is fully- owned by the Government of Sri Lanka, the appointment of Directors is carried out by the Minister under whose purview the Bank falls, as provided in the Bank of Ceylon Ordinance No. 53 of 1938 and its amendments. As such this Committee does not play any role in connection with the appointment of Directors.
However, this Committee recommended to the Board an internal Policy on Appointment of Directors to the Board of Bank of Ceylon in view of the need for raised levels of competence, responsibility, commitment and dedication in the current context where globalisation, digitalisation and regulations are bringing complex matters before the Board. This was adopted by the Board and shared with the appointing authority.
• Recommended the Policy on Appointment of Directors to the subsidiaries of Bank of Ceylon.
• Recommended the eligibility criteria, qualifications and other key attributes and competencies for the selection of the General Manager/ Chief Executive Officer of Bank of Ceylon.
• Reviewed the Succession Plan for Corporate Management and Executive Management (Key Management Personnel).
• Ensured that KMP are fit and proper persons to hold their offices when officers were promoted or appointed as KMP.
• Reviewed and revised the Charter of the Nomination and Corporate Governance Committee
The Committee wishes to record an appreciation for the Chairman and the members of the Nomination and Corporate Governance Committee who functioned in year 2019 for the valuable service that has been rendered by them.
Way Forward
The Committee will strive to promote the best practices in Corporate Governance in the Bank.
Conclusion
The Committee wishes to draw attention to the fact that none of the members currently serving on the Committee were present during the period covered by this report, i.e., the year ended 31 December 2019. The report, therefore, is based on records, the authenticity of which has been verified and established beyond doubt. The present Committee, is of the view that this report is accurate and free of material misstatements.
On behalf of the Nomination and Corporate Governance Committee
Hasitha Premaratne
Chairman,Nomination and Corporate Governance Committee
24 March 2020
*Note:
• Mr A C M Fernando Independent Non-Executive Director was appointed to this Committee as a member w.e.f.12 May 2020.
• Mr R M P Rathnayake the new Ex officio Director on the Board was appointed to this Committee as a member on 12 May 2020 in place of Ms Visakha Amarasekere, who ceased to be the Ex officio Director on the Board.
• Accordingly, the current Nomination and Corporate Governance Committee comprises of Mr Hasitha Premaratne (Chairman), Mr R M P Rathnayake Ex officio Director, Mr G Harsha Wijayawardhana and Mr A C M Fernando.

About this Report / Performance Highlights 2019 / Chairman’s Message / General Manager’s Review / Organisational Overview / Strategic Report / Performance and Outlook / Stakeholder Value Creation / Financial Reports / Compliance Annexes / Supplementary Information
115
Information and Communication Technology Committee Report
Board Subcommittee Reports
Committee Composition during 2019
The members of the Committee, during the year under review, were as follows:
From 01 April 2019 to 27 November 2019
(1) Mr P A Schaffter
Chairman/ Independent Non-Executive Director
(2) Mr Kumar Mayadunne
Member/ Independent Non- Executive Director
(3) Mr K A Vimalenthirarajah
Member/ Non Independent Non- Executive Ex officio Director
New Committee for 2020
Pursuant to the reconstitution of the Board in January 2020, the following Directors were appointed to the Information and Communication Technology Committee w.e.f. 21 January 2020:
(1) Mr G Harsha Wijayawardhana Chairman/ Independent Non-Executive Director
(2) Mr Lalith P Withana Member/ Independent Non-Executive Director
(3) Mr Hasitha Premaratne Member/ Independent Non-Executive Director
Secretary to the Committee
The Secretary, Bank of Ceylon/Secretary to the Board who is an Attorney-at-Law and a Deputy General Manager, functions as the Secretary to the Committee.
Regular participants
• General Manager
• Head of Information Technology
• Deputy General Manager (Product and Banking Development)
• Chief Risk Officer
Attend upon invitation
• Assistant General Managers attached to IT Division
• Assistant General Manager (Product Development & Business Process Re-Engineering Project)
• Any other member of the Board, the Corporate Management and Staff Member as decided by the Committee
Attend as an Observer
• Chief Internal Auditor
Quorum: 02 members
Role of Committee
Information and Communication Technology
(ICT) Committee Charter
The Terms of Reference of the ICT Committee are governed by the ICT Committee Charter, approved and adopted by the Board.
Principal Focus
The primary purpose of this Committee is to assist the Board of the Bank in fulfilling their oversight responsibilities with respect to the existence, operation and effectiveness of the IT products and services, policies, practices and IT infrastructure employed by the Bank to manage various types of IT products and services including major technology investments. It is to ensure that the Bank has a robust infrastructure and capabilities in place at all times, follows best practice and maintains alignment with Bank’s Corporate Plan by analysing emerging trends in
technology.
Medium of Reporting
The proceedings of the ICT Committee meetings are tabled and ratified at the Board meetings and Board approval obtained thereof.
Areas of focus and activities in 2019
In the year 2019, the Committee did not meet and all the matters coming under the purview of this Committee were directly taken up for discussion by the Board, pending the appointment of the full Board.
However, in the year 2020 with the reconstitution of the full Board the Committee met twice and will function as per the terms of reference of the Committee.
Way forward
The Committee will extend its maximum support in ensuring that the Information and Communication Technology infrastructure is resilent during this challenging time and in reshaping the Bank post Covid-19.
Conclusion
The Committee wishes to draw attention to the fact that none of the members currently serving on the Committee were present during the period covered by this report, i.e., the year ended 31 December 2019.
On behalf of the Information and Communication Technology Committee
G Harsha Wijayawardhana
Chairman,Information and Communication Technology Committee
24 March 2020

Driving entrepreneurship and financial inclusion
64%Private
Sector Loans
67%Loans for
Commercial activities
77%Local currency
Lending
46%Term loans
on loan book
17,740 5,100 293No. No. No.
No. of customer engaged in educational and financial literacy programmes
Employees trained duringthe year on credit appraisal and management No. of loan products
We promote regional economic activity, employment and socio-economic empowerment through providing access to affordable funding for start-ups, micro-entrepreneurs and SMEs.

About this Report / Performance Highlights 2019 / Chairman’s Message / General Manager’s Review / Organisational Overview / Strategic Report / Performance and Outlook / Stakeholder Value Creation / Financial Reports / Compliance Annexes / Supplementary Information
117
Performance and OutlookEconomic and Industry Environment
Operating Environment
Global EconomyGlobal economic growth was subdued in 2019, expanding by an estimated 2.9%. Trade policy uncertainty, geopolitical tensions and idiosyncratic stress in key emerging market economies weighed on global economic activity, especially in manufacturing and trade. New challenges were posed with intensifying social unrest in several countries and climate related disasters.
On the positive side, market sentiment was given a boost due to tentative signs of manufacturing activity and global trade bottoming out in the fourth quarter of 2019, broad-based shifts
towards accommodative monetary policy, favorable news on US-China trade negotiations and diminished fears of a no-deal Brexit.
1IMF, World Economic Outlook, January 2020
The global growth outlook is projected for a modest pickup in 2020 at 3.3% and 2021 at 3.4%. This forecast considers a subdued growth forecast for several underperforming and stressed emerging market and developing economies including India, Brazil, Mexico, Russia and Turkey. On the other hand, the forecast also factors in healthy emerging market economies maintaining their robust performance, expectations that the effects of substantial monetary easing that took place in 2019 will continue in 2020 and a pickup in trade growth that reflects recovery in domestic demand and investment.
Prominent downside risks include the economic impacts of the COVID-19 virus, which are yet to fully materialise, rising geopolitical tensions - notably between the US and Iran, intensifying social unrest, further worsening of relations between the US and its trading partners and deepening of economic frictions between other countries. These factors if realized, could lead to rapidly deteriorating sentiment causing global growth to fall below projected numbers.
Sri Lankan EconomyThe Sri Lankan economy experienced numerous challenges in 2019, with the spillover effects of the Easter Sunday attacks together with global dynamics resulting in economic growth rate estimates for the year, slowing to 2.3%. A synopsis of how the Sri Lankan economy performed in 2019 and the direction of key macro-economic variables is given below.
The Central Bank implemented the following measures/ guidelines during the year relating to the banking sector.
• A Monetary Law Act order was issued imposing maximum interest rates that can be offered or paid by licensed banks on SLR deposits (April 2019-September 2019)
• Regulatory requirements to identify Small and Medium Enterprises (SMEs) for the purpose of capital and liquidity requirements under Basel III framework
• A moratorium granted to the tourism sector in respect of outstanding performing credit facilities as at 18 April 2019
• Aligning the Capital Adequacy Ratio (CAR) under Basel III with SLFRS 9 to ensure the consistency of capital and risk weighted assets computation in terms of the Banking Act on capital requirements under Basel III
• Directions on market conduct and treasury operations including market conduct and ethical practices, confidentiality requirements, procedure for recording of deal conversations, risk management principles, professionalism and knowledge level and sanctions on non-compliance with the Directions
• All licensed banks were required in September 2019 to reduce interest rates of rupee denominated loans and advances by target dates
Highlights: Banking Industry
0
2
4
6
8
2016 2017 2018 2019
GDP Growth
3.6
2.9 3.
3
3.4
4.5
3.7 4.
4 4.6
6.4
5.6 5.8 5.9
n Global (%)n Emerging Market and Developing Economies (%) n Emerging and developing Asia (%)

BA
NK
OF
CE
YL
ON
AN
NU
AL
RE
PO
RT
20
19
118
About this Report / Performance Highlights 2019 / Chairman’s Message / General Manager’s Review / Organisational Overview / Strategic Report / Performance and Outlook / Stakeholder Value Creation / Financial Reports / Compliance Annexes / Supplementary Information
The economy continued its sluggish growth in 2019, recording an estimated real GDP growth of just 2.3% The Services sub-sector expanded by a relatively slower 2.3% during the same period, reflecting downturns in the country’s tourism and related sectors as well as wholesale and retail trade, following the Easter Sunday attacks in April 2019; the financial services sub-sector, however, recorded a slightly higher growth of 2.0% in 2019, compared to previous years. The Agriculture sector recorded a growth of 0.6%, buoyed by favorable weather The Industries sub-sector grew by 2.7% driven by construction, mining and quarrying.
Following the significant depreciation of the rupee in 2018, the exchange rate showed greater stability in 2019. The Sri Lankan Rupee appreciated by 4.5% prior to the Easter Sunday attacks, supported by a significant contraction in the trade deficit and an increase of financial flows. In the immediate aftermath of the Easter Sunday attacks the exchange rate experienced some pressure, resulting in the Sri Lankan Rupee appreciating by 0.6% during the year to end at LKR 181.63.
The trade deficit contracted by 23% in 2019 due to reduction of import expenditure by 10.1% as a result of policy measures and export growth of 1.0%. Meanwhile the overall balance of payments recorded a surplus of $800 million upto September 2019 compared to a deficit of $1,103 million in 2018, supported by the issuance of international sovereign bonds during the year.
Economic Growth
External Sector
0
3,000
6,000
9,000
12,000
15,000
0
2
4
6
8
2015 2016 2017 2018 2019
GDP Growth
10,9
51
11,9
96
14,3
36
15,0
16
13,3
28
LKR
bill
ion
5.04.5
3.63.3
2.3
n GDP Current Market Price Real DGP Growth (%)
Source: National Account estimates of Sri Lanka 4th Quarter 2019 and the year 2019: Department of Census and Statistic
Source: Central Bank of Sri Lanka 2019 – up to 30th November Source: Central Bank of Sri Lanka
58%
28%
7%
7%
GDP by Economic Activity
n Agriculture
n Taxes less subsidies
n Industry
n Services
-2,000
-1,000
0
1,000
2,000
3,000
4,000
2015 2016 2017 2018 2019
Exports, Imports and the Trade Balance
1,43
1
1,50
1
1,73
2
1,95
3
2,57
2
2,79
4 3,19
9
3,24
2
(1,1
41)
(1,2
94)
(1,4
66)
(1,2
88)
1,93
43,
607
(1,6
73)
LKR
bill
ion
n Exports n Imports n Trade Balance
0
50
100
150
200
Jan'
19
Feb
'19
Mar
'19
Ap
r'19
May
'19
Jun'
19
Jul'1
9
Aug
'19
Sep
'19
Oct
'19
Nov
'19
Dec
'19
LKR/ USD Exchange Rates - 2019
LKR
/ U
SD
179.
88
179.
80
176.
13
175.
46
176.
41
176.
54
176.
24
180.
72
181.
93
181.
60
180.
43
181.
63
Economic and Industry Environment

About this Report / Performance Highlights 2019 / Chairman’s Message / General Manager’s Review / Organisational Overview / Strategic Report / Performance and Outlook / Stakeholder Value Creation / Financial Reports / Compliance Annexes / Supplementary Information
119
The Central Bank adopted a relatively accommodative monetary policy in 2019, with a view to stimulating economic activity. Accordingly, Central Bank reduced the SRR applicable on rupee deposits of commercial banks by 100 basis points in March 2019. Further in May 2019 and August 2019, policy rates were reduced by 100 basis points with a view to reducing market interest rates and thereby boost credit flows to the private sector. Despite these measures, credit growth remained lackluster for most part of the year. As market deposit/ lending rates remained relatively high, the Central Bank imposed deposit rate caps in April 2019 (removed in September 2019) and lending rate caps in September 2019, which eventually led to a gradual decline in market interest rates towards the latter part of the year.
Fiscal operations in 2019 deteriorated in the first seven months due to lower than expected Government revenue and a rise in Government expenditure, resulting in an expansion of the budget deficit, a turnaround in the primary balance, and a rise in outstanding Government debt. In 2019, the primary deficit was 0.8% of estimated GDP compared to a surplus 0.6% during the same period in the previous year, the budget deficit declined to 4.9% (upto September 2019) of estimated GDP compared to a deficit of 5.3% in 2018 and the Government’s revenue mobilisation declined to 9.1% (upto September 2019) of estimated GDP from 13.3% recorded in 2018. The lackluster revenue performance was the result of impact of Easter Sunday attacks and implication of some policy measures and inconsistencies.
Interest Rates
Source: Central Bank of Sri Lanka Source: Central Bank of Sri Lanka
-1500
-750
0
750
1,500
2,250
3,000
2015 2016 2017 20192018
Government Fiscal Operations
1,46
1
1,69
4
1,84
0
1,93
2
2,29
0
2,33
4
2,57
3
2,69
3
(830
)
(640
)
(733
)
(761
)
2,35
73,
042
(685
)
LKR
bill
ion
n Revenue n Expenditure n Overall Budget Deficit
AWDR
AWPR
Credit growth to Private Sector
2019 8.20%
2018 8.81%
2019 9.74%
2018 12.09%
2019 4.3%
2018 15.9%

BA
NK
OF
CE
YL
ON
AN
NU
AL
RE
PO
RT
20
19
120
About this Report / Performance Highlights 2019 / Chairman’s Message / General Manager’s Review / Organisational Overview / Strategic Report / Performance and Outlook / Stakeholder Value Creation / Financial Reports / Compliance Annexes / Supplementary Information
Industry Environment The banking sector recorded a moderate performance in 2019 in an environment of subdued economic activities and muted investor sentiment. Growth in total assets reduced significantly, credit growth decelerated, non-performing loans increased to high levels and profitability decreased. However, the sector complied with enhanced capital requirements under BASEL III and maintained most indicators well above minimum regulatory requirements.
AssetsTotal assets of the banking sector grew by 6% in 2019 compared to 15% in 2018. The increase was mainly contributed by way of investments as loans and advances moderated. The asset base was primarily funded through deposits (LKR 9.2 trillion) and borrowings (LKR 1.7 trillion).
Credit
Lower demand for credit resulted in a credit growth of 6% as at end 2019. This was a significant reduction from the y-o-y credit growth of 20% at the end of 2018. Lending to the private sector decelerated in 2019 and growth was driven by lending to the Government and State-Owned enterprises. Credit given to construction, financial and tourism sectors declined. Considering the real interest rates on deposits and lending products prevailed in the economy,with a view of strengthen and expedite monitory policy transmission through the financial system two regulations were issued relating to market interest rate on deposits and lending.
Funding
Asset growth in the banking sector was dominated by deposit funding that accounted for 73% of the total liabilities. Deposit growth consisted primarily of LKR deposits. A cap on deposit interest rates was imposed in April 2019 which was subsequently withdrawn in September 2019, aimed at reducing
the cost of funds of banks and enabling reduction of lending rates. A notable decrease in growth in demand deposits with a shift to term deposits and short term savings was observed during this period. The CASA ratio declined to 31% at end 2019 compared to 32% of the previous year.
Portfolio Quality
Although there was a deterioration of asset quality NPAs remained manageable. NPAs rose across all sectors with significant increases in the agricultural sector due to drought conditions that prevailed in the first quarter and the tourism sector due to the impact of the Easter Sunday attacks. The NPA ratio increased to 4.7% at end 2019 from 3.4% at end 2018.
Capitalisation
The banking sector remained adequately capitalised during year 2019 with a common equity ratio of 13.0% and total capital adequacy ratio of 16.5% well above the requirements of BASEL III. The central Bank introduced a new framework for dealing with Domestic Systematically Important Banks (D-SIBs) effective from 20 December 2019, which is in line with International standards.
Profitability
Subdued business activities, decreased lending, deterioration of asset quality and increased taxes resulted in a decline of profits in 2019. Profit after tax in 2019 decreased by 12% compared to 2018. Return on Assets (ROA) and Return on Equity (ROE) was 1.4% and 10.3% respectively (2018: 1.8% and 13.2%).
0
3,000
6,000
9,000
12,000
15,000
0
50
100
150
200
250
20158,
077
8168
81
150
220
9,04
7
10,2
92 11,7
94
12,5
23
7,92
3
7,54
2
6,31
9
5,43
9
4,62
0
2,36
8
2,29
1
2,51
7
2,69
7
3,02
7
2016 2017 2018 2019
LKR
bill
ion
LKR
bill
ion
n Assets n Net Loans and Advances n Investments Net Non Performing Advances
Asset Growth in the Banking Sector
0
200
400
600
800
1,000
1,200
1,400
0
50
100
150
200
250
2015 2016 2017 2018 2019
LKR
bill
ion
LKR
bill
ion
n Interest Income n Interest Expenses Profit before tax Profit after tax
Profitability of the Banking Sector
591 757
325
453
631
780
711
972 1,
109 1,
209
97
116
138126
111
140
165
194 195
172
Economic and Industry Environment

About this Report / Performance Highlights 2019 / Chairman’s Message / General Manager’s Review / Organisational Overview / Strategic Report / Performance and Outlook / Stakeholder Value Creation / Financial Reports / Compliance Annexes / Supplementary Information
121
Financial Review
The Bank delivered asset and liability growth, while preserving the Balance sheet strength in challenging market conditions. Performance during the year attests to the soundness and resilience of the Bank’s strategy and its long-term approach to value creation as it sought to balance the sometimes-conflicting needs of its diverse stakeholders.
Navigating Uncertainty in a Complex Operating LandscapeThe industry landscape in 2019 presented numerous challenges for the Banking sector; a sharp deceleration in credit growth following the April attacks and regulator-imposed caps on interest rates coupled with a broad-based increase in impairments directly impacted the Sector’s growth and profitability. Meanwhile, increased capital requirements in line with the BASEL III guidelines and Impairment as per SLFRS 09-inserted further pressure on the sector, which grappled to raise capital amidst subdued equity and debt market conditions.
Moderation in Income GrowthAgainst this backdrop, BoC performed commendably to record an Income growth of 8% to LKR 239.1 billion in 2019, supported by a healthy increase in both Net Interest Income (NII) and Net Fee and Commission income. Other Operating Income recorded a decline during the year. At consolidated level, the Group’s total income also increased by 8% to reach LKR 248.7 billion, with the Bank contributing 96% to the Group.
• NII: The Bank’s Interest Income
expanded by 13% during the year
driven by loan growth of 9%. This
reflects a sharp slowdown from the
previous year which saw loan growth of
24%. Interest income generated from
loans and advances accounted for 77%
of Bank’s interest income followed by
income on debt and other instruments.
Interest expenses increased by 12%
driven by a 13% expansion in customer
deposits, as the interest rate cap on
deposits led to an influx of funds to
larger banks such as BoC. Overall, the
Bank recorded a 15% growth in NII to
LKR 75.1 billion while at a consolidated
level NII growth was 14%. Meanwhile,
the Bank’s Net Interest Margin (NIM)
widened marginally to 3.2% from
3.1% the year before reflecting smart
repricing decisions and expansion in
high-yielding segments.
• Non-interest-income: Non-Interest
Income comprises primarily of net fee
and commission income, trading gains
and other operating income; it declined
by 31% to LKR 16.2 billion during the
year mainly due to a normalisation
of exchange gains generated on the
Bank’s foreign currency balances in
2018. Net fee and commission income
increased by 13% to LKR 12.1 billion,
driven by growth in credit and debit
card related income 19% and retail
banking services 21% among others.
• Total operating income: The growth
in total operating income moderated to
3% in 2019 (2018: 20%) mainly due to
the decline in other income. Fund and
non-fund based sources contributed
a respective 82% and 18% to total
operating income during the year and
the Bank’s total operating income
amounted to LKR 91.3 billion.
Preserving Portfolio QualityThe Bank’s impairment charges on loans and advances increased by 27% to LKR 18.2 billion, in line with the industry-wide deterioration in portfolio quality as key industry sectors faced liquidity pressures. However, the Bank performed relatively well in comparison to the industry, which
0
20.0
40.0
60.0
80.0
100.0
0
0.5
1.0
1.5
2.0
2.5
3.0
3.5
2016 2017 2018 2019
Trends in NII
54
3.3 3.2
3.13.2
19 16 23 19
58
66 75
n Non interest incomen Net interest income Net Interest Margin (%)
LKR
bill
ion
13%
4%1%
82%
n Net Interest Incomen Net fee and commission incomen Other operating incomen Gains from trading and financial investments
Composition of Total Operating Income

BA
NK
OF
CE
YL
ON
AN
NU
AL
RE
PO
RT
20
19
122
About this Report / Performance Highlights 2019 / Chairman’s Message / General Manager’s Review / Organisational Overview / Strategic Report / Performance and Outlook / Stakeholder Value Creation / Financial Reports / Compliance Annexes / Supplementary Information
Financial Review
saw impairments increasing by 48% during the year. This reflects the Bank’s proactive measures to strengthen its monitoring and recovery mechanisms as well as consistent engagement with customers in offering flexible payment solutions. The Bank’s gross NPL ratio for the period (computed as per CBSL requirements) increased to 4.8%, from 3.6% in 2018 and more or less in line with the industry average.
Efficient Expense ManagementThe increase in operating expenses was slightly increased by 5% during the year. Personnel expenses account for the largest portion of the Bank’s operating expenses and increased by 6% during the year to LKR 18.4 billion. Other expenses recorded a decline of 8% to LKR 10.4 billion mainly due to the reclassification of rental expenses on operating leases in line with the implementation of SLFRS 16. The Bank’s cost-to-income ratio of 37% continues to be significantly lower than the industry average of 52.7%, reflecting its scale efficiencies as well as the Bank’s strategic focus on driving process efficiencies through automation and increased productivity.
Contributions to Tax RevenueBoC is a significant contributor to the Government’s tax revenue and total tax expenses for the year amounted to LKR 17.1 billion. Taxes consists of VAT and NBT on financial services, Debt Repayment Levy (DRL) and income tax. DRL which was introduced on 1 October 2018 was applicable for full year of 2019 and the Bank contributed LKR 3.6 billion as DRL for the year. Meanwhile income tax payments for the year recorded a decline to LKR 6.6 billion (from LKR 12.4 billion the previous year) due to tax relief given to interest income generated from investment in Sri Lanka Development Bonds. Accordingly, the Bank’s effective income tax rate also declined to 22% from 37% the year before.
Resilient Profit PerformanceThe challenging operating conditions during the year led to a decline in profitability, with operating profit and pre-tax profit decreasing by a respective 7% and 11% during the year. Profit-after-tax however, recorded an increase of 10% to LKR 23.1 billion due to the reduction in income tax charge for the year (explained above). At a consolidated level, the Group’s profit for the year increased by 13% to LKR 23.7 billion during the year under review. The Bank’s Return on Assets declined to 1.3% from 1.6% the year before, remaining more or less in line with the industry average of 1.4% for the year.
Healthy Balance SheetThe Bank continued to record balance sheet growth, although asset expansion slowed to 6% during the year, compared to 16% recorded in 2018. Accordingly, the Bank’s total assets amounted to LKR 2,415.1 billion as at end-December 2019. Meanwhile, the Group’s assets also recorded an increase of 6% to LKR 2,462.5 billion during the year. Key factors driving the Bank’s asset profile during the year were-
• Loans and advances: BoC’s loan portfolio grew by 9% to LKR 1,648.8 billion during the year, as we pursued selective growth opportunities in Retail, SME and development lending.(Please refer to Business line reviews from page 124 to 126 for more detailed information). In terms of products, growth was driven primarily by term loans (21%), pawning (19%), credit cards (16%) and housing loans (13%). Lending to the Government sector accounts for around 36% of the loan book and these lendings are primarily for infrastructure development projects and state - owned enterprises; these facilities are included in the Retail and Corporate segments.
0
5.0
10.0
15.0
20.0
25.0
30.0
0.0
0.2
0.4
0.6
0.8
1.0
1.2
1.4
1.6
1.8
2.0
2016 2017 2018 2019
Profitability
25
1.9 1.7
1.6
21 21 23
n Profit attributable to shareholders ROAA (%)
LKR
mill
ion
1.3
0
5.0
10.0
15.0
20.0
25.0
30.0
35.0
0
10
20
30
40
50
2016 2017 2018 2019
Cost Management
30
43
38 37
27 31 32
n Operating Expenses Cost to Income ratio (%)
LKR
bill
ion
36
0
500.0
1,000.0
1,500.0
2,000.0
2,500.0
2016 2017 2018 2019
1,66
9
1,95
2
2,28
5
2,41
5
n Assets
LKR
bill
ion
Assets
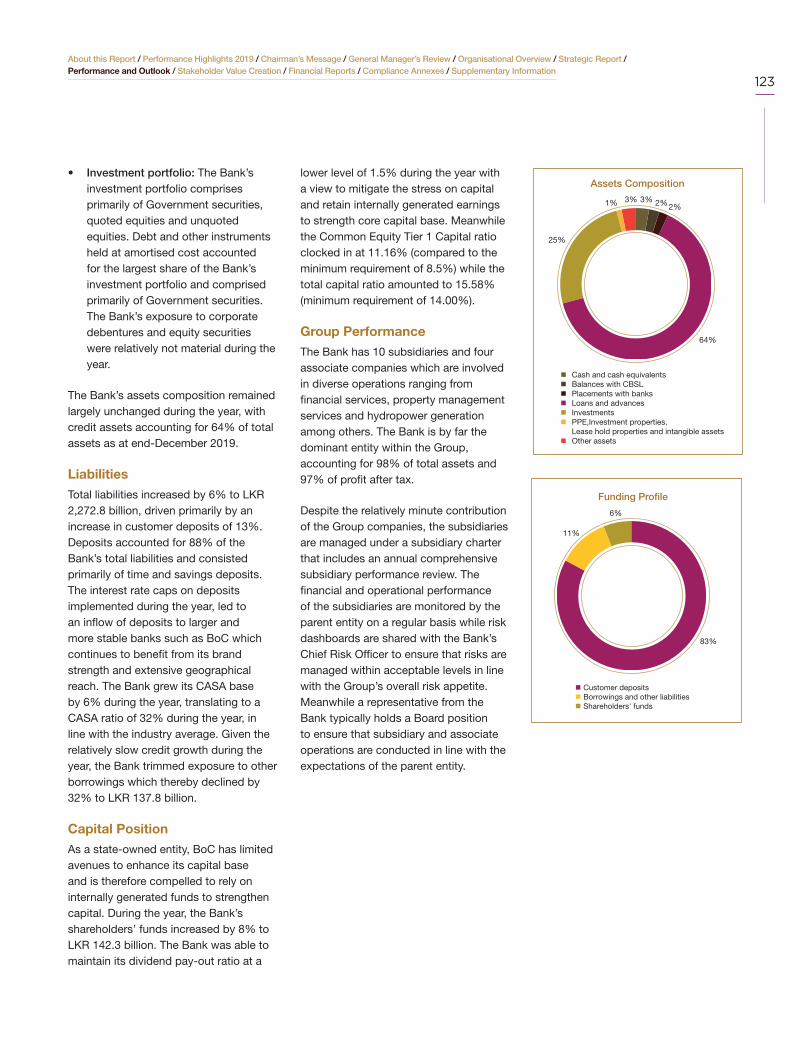
About this Report / Performance Highlights 2019 / Chairman’s Message / General Manager’s Review / Organisational Overview / Strategic Report / Performance and Outlook / Stakeholder Value Creation / Financial Reports / Compliance Annexes / Supplementary Information
123
• Investment portfolio: The Bank’s investment portfolio comprises primarily of Government securities, quoted equities and unquoted equities. Debt and other instruments held at amortised cost accounted for the largest share of the Bank’s investment portfolio and comprised primarily of Government securities. The Bank’s exposure to corporate debentures and equity securities were relatively not material during the year.
The Bank’s assets composition remained largely unchanged during the year, with credit assets accounting for 64% of total assets as at end-December 2019.
Liabilities Total liabilities increased by 6% to LKR 2,272.8 billion, driven primarily by an increase in customer deposits of 13%. Deposits accounted for 88% of the Bank’s total liabilities and consisted primarily of time and savings deposits. The interest rate caps on deposits implemented during the year, led to an inflow of deposits to larger and more stable banks such as BoC which continues to benefit from its brand strength and extensive geographical reach. The Bank grew its CASA base by 6% during the year, translating to a CASA ratio of 32% during the year, in line with the industry average. Given the relatively slow credit growth during the year, the Bank trimmed exposure to other borrowings which thereby declined by 32% to LKR 137.8 billion.
Capital PositionAs a state-owned entity, BoC has limited avenues to enhance its capital base and is therefore compelled to rely on internally generated funds to strengthen capital. During the year, the Bank’s shareholders’ funds increased by 8% to LKR 142.3 billion. The Bank was able to maintain its dividend pay-out ratio at a
lower level of 1.5% during the year with a view to mitigate the stress on capital and retain internally generated earnings to strength core capital base. Meanwhile the Common Equity Tier 1 Capital ratio clocked in at 11.16% (compared to the minimum requirement of 8.5%) while the total capital ratio amounted to 15.58% (minimum requirement of 14.00%).
Group PerformanceThe Bank has 10 subsidiaries and four associate companies which are involved in diverse operations ranging from financial services, property management services and hydropower generation among others. The Bank is by far the dominant entity within the Group, accounting for 98% of total assets and 97% of profit after tax.
Despite the relatively minute contribution of the Group companies, the subsidiaries are managed under a subsidiary charter that includes an annual comprehensive subsidiary performance review. The financial and operational performance of the subsidiaries are monitored by the parent entity on a regular basis while risk dashboards are shared with the Bank’s Chief Risk Officer to ensure that risks are managed within acceptable levels in line with the Group’s overall risk appetite. Meanwhile a representative from the Bank typically holds a Board position to ensure that subsidiary and associate operations are conducted in line with the expectations of the parent entity.
3%1% 3% 2%2%
64%
25%
n Cash and cash equivalentsn Balances with CBSLn Placements with banksn Loans and advancesn Investmentsn PPE,Investment properties, Lease hold properties and intangible assetsn Other assets
Assets Composition
11%
6%
83%
n Customer depositsn Borrowings and other liabilitiesn Shareholders' funds
Funding Profile
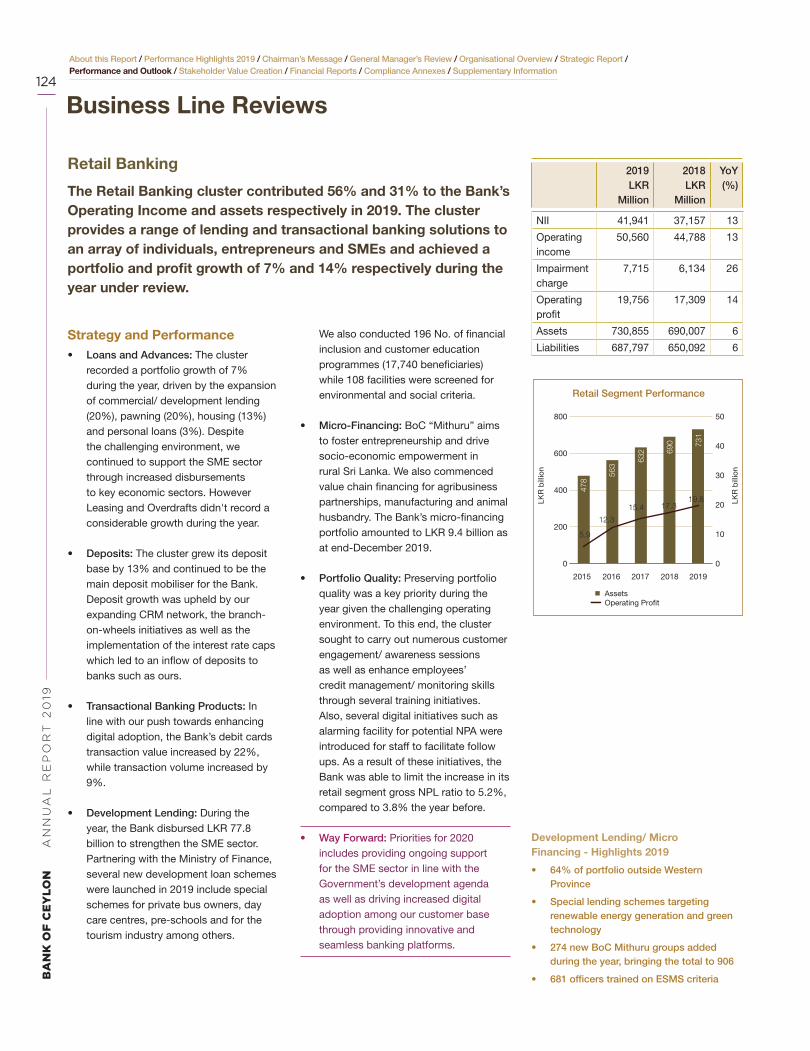
BA
NK
OF
CE
YL
ON
AN
NU
AL
RE
PO
RT
20
19
124
About this Report / Performance Highlights 2019 / Chairman’s Message / General Manager’s Review / Organisational Overview / Strategic Report / Performance and Outlook / Stakeholder Value Creation / Financial Reports / Compliance Annexes / Supplementary Information
Business Line Reviews
Retail Banking
The Retail Banking cluster contributed 56% and 31% to the Bank’s Operating Income and assets respectively in 2019. The cluster provides a range of lending and transactional banking solutions to an array of individuals, entrepreneurs and SMEs and achieved a portfolio and profit growth of 7% and 14% respectively during the year under review.
Strategy and Performance• Loans and Advances: The cluster
recorded a portfolio growth of 7% during the year, driven by the expansion of commercial/ development lending (20%), pawning (20%), housing (13%) and personal loans (3%). Despite the challenging environment, we continued to support the SME sector through increased disbursements to key economic sectors. However Leasing and Overdrafts didn't record a considerable growth during the year.
• Deposits: The cluster grew its deposit base by 13% and continued to be the main deposit mobiliser for the Bank. Deposit growth was upheld by our expanding CRM network, the branch-on-wheels initiatives as well as the implementation of the interest rate caps which led to an inflow of deposits to banks such as ours.
• Transactional Banking Products: In line with our push towards enhancing digital adoption, the Bank’s debit cards transaction value increased by 22%, while transaction volume increased by 9%.
• Development Lending: During the year, the Bank disbursed LKR 77.8 billion to strengthen the SME sector. Partnering with the Ministry of Finance, several new development loan schemes were launched in 2019 include special schemes for private bus owners, day care centres, pre-schools and for the tourism industry among others.
We also conducted 196 No. of financial inclusion and customer education programmes (17,740 beneficiaries) while 108 facilities were screened for environmental and social criteria.
• Micro-Financing: BoC “Mithuru” aims to foster entrepreneurship and drive socio-economic empowerment in rural Sri Lanka. We also commenced value chain financing for agribusiness partnerships, manufacturing and animal husbandry. The Bank’s micro-financing portfolio amounted to LKR 9.4 billion as at end-December 2019.
• Portfolio Quality: Preserving portfolio quality was a key priority during the year given the challenging operating environment. To this end, the cluster sought to carry out numerous customer engagement/ awareness sessions as well as enhance employees’ credit management/ monitoring skills through several training initiatives. Also, several digital initiatives such as alarming facility for potential NPA were introduced for staff to facilitate follow ups. As a result of these initiatives, the Bank was able to limit the increase in its retail segment gross NPL ratio to 5.2%, compared to 3.8% the year before.
• Way Forward: Priorities for 2020 includes providing ongoing support for the SME sector in line with the Government’s development agenda as well as driving increased digital adoption among our customer base through providing innovative and seamless banking platforms.
2019LKR
Million
2018LKR
Million
YoY (%)
NII 41,941 37,157 13
Operating income
50,560 44,788 13
Impairment charge
7,715 6,134 26
Operating profit
19,756 17,309 14
Assets 730,855 690,007 6
Liabilities 687,797 650,092 6
Development Lending/ Micro Financing - Highlights 2019
• 64% of portfolio outside Western Province
• Special lending schemes targeting renewable energy generation and green technology
• 274 new BoC Mithuru groups added during the year, bringing the total to 906
• 681 officers trained on ESMS criteria
0
200
400
600
800
0
10
20
30
40
50
2015 2016 2017 2018 2019
Retail Segment Performance
478
5.9
12.3
17.319.8
563
632 69
0 731
n Assets Operating Profit
LKR
bill
ion
LKR
bill
ion
15.4

About this Report / Performance Highlights 2019 / Chairman’s Message / General Manager’s Review / Organisational Overview / Strategic Report / Performance and Outlook / Stakeholder Value Creation / Financial Reports / Compliance Annexes / Supplementary Information
125
2019LKR
million
2018LKR
million
YoY (%)
NII 23,664 17,325 37
Operating income
27,075 25,329 7
Impairment charge
10,053 8,231 22
Operating profit
12,203 12,491 (2)
Assets 881,920 833,652 6
Liabilities 829,963 785,428 6
The cluster provides financing solutions to the Government, large-scale projects, state-owned enterprises and the large private sector entities, conglomarates and blue chips, playing a vital role in stimulating economic activity. It contributed 30% to the Bank’s operating income and 37% to assets as at end-December 2019.
Strategy and Performance• Overall performance: The Corporate
and Offshore Banking cluster delivered a resilient performance in 2019, supported by portfolio growth of over 10% and NII expansion of 37%. Understandably, impairment charges of loans and advances increased by 22% affecting profitability, while overall profit for the year recorded a decline of only 2%.
• Private sector lending: Lending to private sector clients grew by 12% to LKR 310.8 billion, which accounted for 36% of the cluster’s total portfolio. This was supported by new customer acquisition as well as deeper relationships with existing customers. We maintained a high level of customer engagement, conducting four felicitation ceremonies with the participation of over 650 customers.
• Project lending: As a key lender to the Government, the Bank directly contributes to national infrastructure development projects including renewable energy, highway construction and irrigation projects among others. lending to the Government and SoEs grew by 8% to LKR 542.8 billion in 2019, accounting for 64% of the cluster’s total portfolio.
• Portfolio quality: As the industry witnessed a broad-based influx of NPLs the cluster sought to preserve credit quality through proactive cashflow management, recovery camps, ongoing customer engagement and offering facility restructuring and rescheduling. In addition, we also conducted special corporate credit training programmes for cluster employees.
• Trade finance: This division plays a vital role in facilitating imports and exports and provides consultancy/ advisory services to the Government, corporate clients and industry associations. The division has built a strong reputation and benefits from a large network of correspondent relationships. In 2019, the division started to implement a new Trade Finance System to enhance the efficiency of all operations. It also conducted numerous awareness/training sessions for stakeholders, pursued new opportunities, and conducted several marketing/promotional campaigns. Trade finance short term loans increased by 11% to LKR 60.1 billion during the year.
• Offshore banking: In 2019 the Bank further strengthened its position in syndicated lending by financing USD 524 million worth of projects.
• Way forward: The cluster will continue to support the Government and state-owned enterprises, while strengthening relationships in the private sector thereby improving the risk return dynamics of its loan portfolio. Further focus will be kept on cash flow monitoring as a possible solution for enhancing the portfolio quality and increasing digital adoption among corporate clients.
Corporate and Offshore Banking
0
200.0
400.0
600.0
800.0
1,000.0
0
3.0
6.0
9.0
12.0
15.0
2015 2016 2017 2018 2019
Corporate Segment Performance
430
4.6
9.2
11.0
12.512.2
506
602
834
882
n Assets Operating Profit
LKR
bill
ion
LKR
bill
ion
18%
8%
7%45%
13%
7%
2%
n Govt Overdrafts (DST)
n Overdrafts
n Export & Imports Bills
n Trade Finance-Short Term Loans
n Govt Loans (FCBU $ Loans)
n Loans to CPC
n Loans Others
Composition of Corporate Loan Portfolio

BA
NK
OF
CE
YL
ON
AN
NU
AL
RE
PO
RT
20
19
126
About this Report / Performance Highlights 2019 / Chairman’s Message / General Manager’s Review / Organisational Overview / Strategic Report / Performance and Outlook / Stakeholder Value Creation / Financial Reports / Compliance Annexes / Supplementary Information
International, Treasury, Investment and Overseas Operations
Strategy and Performance• Overall performance: The adverse
market conditions during the year had a direct impact on the Division’s profitability and resulted in its total operating income and profit for the year declining by a respective 28% and 36% during the year. Despite these conditions, the Division adopted a long-term view to value creation, focusing on strengthening its digital infrastructure and widening its reach.
• Treasury: The Unit plays a pivotal role in managing the Bank’s liquidity levels, consistently monitoring asset liability maturity mismatches, optimising the NIM and managing the investment portfolio. Key achievements in 2019 included implementation of a new system for ALM, automation of several processes including approval of special rates for FDs and reinvestment of Treasury Bills and the introduction of longer-tenured foreign currency FDs at attractive rates. Effective management of the investment portfolio enabled the Unit to generate capital gains of LKR 282 million on the G-sec portfolio.
• International Division: The Division successfully maintained its position as the market leader in remittances, accounting for a share of 42% in 2019. We also strengthened our presence to new geographies, which are mostly untapped markets such as Japan, Israel, Oman and Saudi Arabia. A key
achievement in 2019 was the launch of the Hana EZ mobile app in South Korea, in partnership with the KEB Hana Bank. Other technological developments include the completion of 18 new API integrations and commencement of the upgrade of the Smart Remit System. The Division also formed four new correspondent relationships during the year and conducted 185 awareness campaigns for migrant workers and their families, which provided direct benefits to 15,000 amount of people.
• Investment Banking: Market conditions were subdued during the year and the Investment Banking Unit placed emphasis on strengthening customer relationships to increase penetration in structuring/ managing corporate debt and equity issuances. During the year Investment Banking Unit issued unlisted tier II capital eligible debentures of LKR 9.2 billion in order to ease the tier II capital base of the Bank.
• Overseas: The Bank further widened its geographical reach during the year with the establishment of an extension office in Maldives, in Hulumale island. All overseas branches are profitable, and the Division contributed LKR 7.7 billion to the Bank’s earnings in 2019. Key areas of focus include, enhancing the customer experience through digitisation, strengthening credit risk management frameworks and enhancing the digital infrastructure.
• Way forward: Global market conditions are likely to be depressed and volatile in 2020 given the world-wide implications of the COVID-19 pandemic, therefore the responsibility of theTreasury in managing the Bank funds in best possible ways, investing in secured investments and helping the business to normalise in short to medium term will be immense. While performing those utmost duty, we will continue to focus.
2019LKR
million
2018LKR
million
YoY (%)
NII 9,340 10,913 (14)
Operating income
12,747 17,777 (28)
Impairment charge
445 387 15
Operating profit
8,228 12,909 (36)
Assets 668,242 643,024 4
Liabilities 628,874 605,827 4
0
200
400
600
800
0
5
10
15
20
25
2015 2016 2017 2018 2019
Internation, Treasury, Investment andOverseas Branch Performance
600
13.8
21.4
12.9
8.2
520
622
643
668
n Assets Operating Profit
LKR
bill
ion
LKR
bill
ion
10.4
The International Division engages in foreign currency related transactions while the Treasury Unit manages the Bank’s liquidity position, asset-liability positions while mitigating exposure to market risk. The cluster contributed 14% to the Bank’s operating income for the year in 2019. The investment division handles all financial investments of the Bank.

About this Report / Performance Highlights 2019 / Chairman’s Message / General Manager’s Review / Organisational Overview / Strategic Report / Performance and Outlook / Stakeholder Value Creation / Financial Reports / Compliance Annexes / Supplementary Information
127
The outbreak of the COVID-19 pandemic has led to unprecedented economic and social challenges, the exact extent of which is difficult to ascertain at this juncture. The Bank is operating in strict adherence to safety and social distancing guidelines prescribed by the Government, with relevant employees given the opportunity to work remotely. As an essential service provider and Sri Lanka’s largest bank, we are committed to supporting the facilitation of economic activity and money circulation and many of our branches have remained open to the public, with adequate measures being implemented to ensure the safety of our employees and customers.
Way Forward
Given the anticipated economic fallout of the pandemic, we are committed to, the Government’s agenda in facilitating the recovery of local businesses and individuals through providing debt moratoriums, restructuring facilities and concessionary funding. While our short to medium term strategy will be refined to adapt to emerging marketing conditions, the Bank’s long-term strategy will remain largely unchanged as we pursue excellence in customer service, strive to lead the digital adoption, retain market leadership and propagate sustainable banking solutions.

BA
NK
OF
CE
YL
ON
AN
NU
AL
RE
PO
RT
20
19
128
About this Report / Performance Highlights 2019 / Chairman’s Message / General Manager’s Review / Organisational Overview / Strategic Report / Performance and Outlook / Stakeholder Value Creation / Financial Reports / Compliance Annexes / Supplementary Information
Stakeholder EngagementThe Bank impacts a diverse universe of stakeholders and its size, depth and reach renders it critical to proactively identify and respond to their varying needs. The Bank selects and engages with the stakeholders who are likely to be most impacted by its decisions and who in turn have the most significant impact on its value creation. Engagement is facilitated through numerous formal and informal platforms and the feedback thus obtained forms a vital input in our corporate planning process.
How we engage:
• Engagement through branch managers and relationship managers (ongoing)
• Customer Satisfaction surveys (periodic)
• Customer hotline-1975 (ongoing)
• Marketing, advertising and promotions (ongoing)
• Financial literacy programmes (ongoing)
• Whistle Blowing policy
How we engage:
• One to one meetings with large investors (periodic)
• Investor presentations and roadshows (periodic)
• Engagement through market intermediaries (ongoing)
• Annual Report and other regulatory publications
How we engage:
• Maintaining confidence within the finance sector
• Fulfilling the funding needs of the GOSL
• Alignment of National development agenda to Bank’s strategy
• Stronger Governance and Risk Management Practices
• Falitating Financial inclusion
Key topics and concerns
• Ease of transaction
• Accessibility and convenience
• Customer care and service quality
• Providing access to finance
• Transparent pricing
• Inclusive communication
Key topics and concerns
• Returns commensurate with the risks assumed
• Clarity in terms, conditions and Covenances
• Transparent and timely reporting on the Bank’s performance and outlook
Key topics and concerns
• Meeting on matters relating to performance and compliance (Periodic)
• Annual Report (Annually)
• Regulatory and compliance reporting (Periodic)
• Industry forums and meetings (frequently)
• Financial publications (quarterly)Cus
tomers
Gov
ernm
ent
and
reg
ulat
ors
Investors
Communities
Sup
pliers
Employees
Why we engage with
stakeholders
Stakeholder Value Creation
Support growthaspiration
Preserving brans
Identify needs
Nurture relationships

About this Report / Performance Highlights 2019 / Chairman’s Message / General Manager’s Review / Organisational Overview / Strategic Report / Performance and Outlook / Stakeholder Value Creation / Financial Reports / Compliance Annexes / Supplementary Information
129
How we engage:
• Employee engagement surveys (periodic)
• Trade union engagement (ongoing)
• Open door culture (ongoing)
• Multi-level staff meetings (ongoing)
• Grievance handling mechanism (ongoing)
• Work life balance initiatives (ongoing)
• Performance Management System (PMS)
Key topics and concerns
• Contribution towards community development projects
• Responsible business practices
• Financial inclusion and empowerment
• Employment generation
How we engage:
• Written communication (ongoing)
• Regular meetings (ongoing)
• Bidding process (periodic)
• Quarterly publications on Financial statements and the Annual Reports
Key topics and concerns
• Opportunities for career and skill development
• Freedom of association
• Equal opportunity in remuneration and promotion
• Performance - oriented organizational culture
• A Safe working environment
• Retirement Benefits
How we engage:
• Engagement through branches (ongoing)
• CSR activities and sponsorships (ongoing)
• Press releases and media campaigns (ongoing)
Key topics and concerns
• Ease of transacting and transparent pricing, terms and conditions
• Timely payments
• Secure and predictable demand
• Press notices
• Supply chain audits
Cus
tomers
Gov
ernm
ent
and
reg
ulat
ors
Investors
Communities
Sup
pliers
Employees

BA
NK
OF
CE
YL
ON
AN
NU
AL
RE
PO
RT
20
19
130
About this Report / Performance Highlights 2019 / Chairman’s Message / General Manager’s Review / Organisational Overview / Strategic Report / Performance and Outlook / Stakeholder Value Creation / Financial Reports / Compliance Annexes / Supplementary Information
Stakeholder Value
CustomersDelivering Value to our
customers in 2019
• Total net disbursements to customers amounted to LKR 138,227 million during the year, an increase of 9% compared to 2018
• Interest paid on deposits increased by 13% to LKR 126.7 billion
Customer centric solutions
(1) Launch of QR code based mobile payment app - BoC Smart Pay
(2) Launch of four new products targeting specific customer segments
(3) Process improvements resulting in significant improvements in turnaround time
Customer education
(1) SME Customer Awareness programme
(2) Financial literacy programmes
(3) Awareness campaigns for migrant workers
Business Partners and CommunitiesDelivering Value to Business partners and
Communities in 2019
• Investment of LKR 18.5 million in customer engagement
• Key CSR projects for the year
(1) Education You are a Leader Programme, Nanajaya Scholarships, Hapana Scholarships
(2) Health and Wellbeing Water Purification Plants, BoC Yalu Para, Official Banking partner of the Little Hearts Project
• Proactive engagement with +500 suppliers
• Six supplier audits conducted in 2019 to ensure social and environmental compliance
Government Delivering Value to the
Government in 2019
• Total tax contribution of LKR 17.1 billion, an decrease of 22% compared to 2018
Partnering national development projects
(1) Road development projects: LKR 28.3 billion
(2) Power generation projects: LKR 1.5 billion
(3) Water generation and irrigation projects: LKR 24.0 billion
(4) Tourism projects: LKR 37.6 billion
• Disbursements of LKR 77.8 billion to the micro - and SME sectors of the economy.
• LKR 517.3 billion investments in Government securities
Driving financial inclusion
(1) Customer contact points in economically disadvantaged areas
(2) Disbursements under development loan schemes
(3) Micro-finance lending
(4) Driving financial literacy and customer education
EmployeesDelivering Value to our
Employees in 2019
• Total payments to employees increased by 6% to LKR 18.4 billion during the year.
Training and Development
LKR 233.3 million investment in training with focus on,
(1) Continuous Professional Development
(2) Service-oriented training for front-line staff
(3) Basic banking training for banking assistants
• Ongoing and proactive engagement through numerous formal and informal platforms
• Promoting work life balance through awareness sessions
Career progression
• Promotions: 821
• 99% positions filled through internal promotions
Stakeholder Value Creation
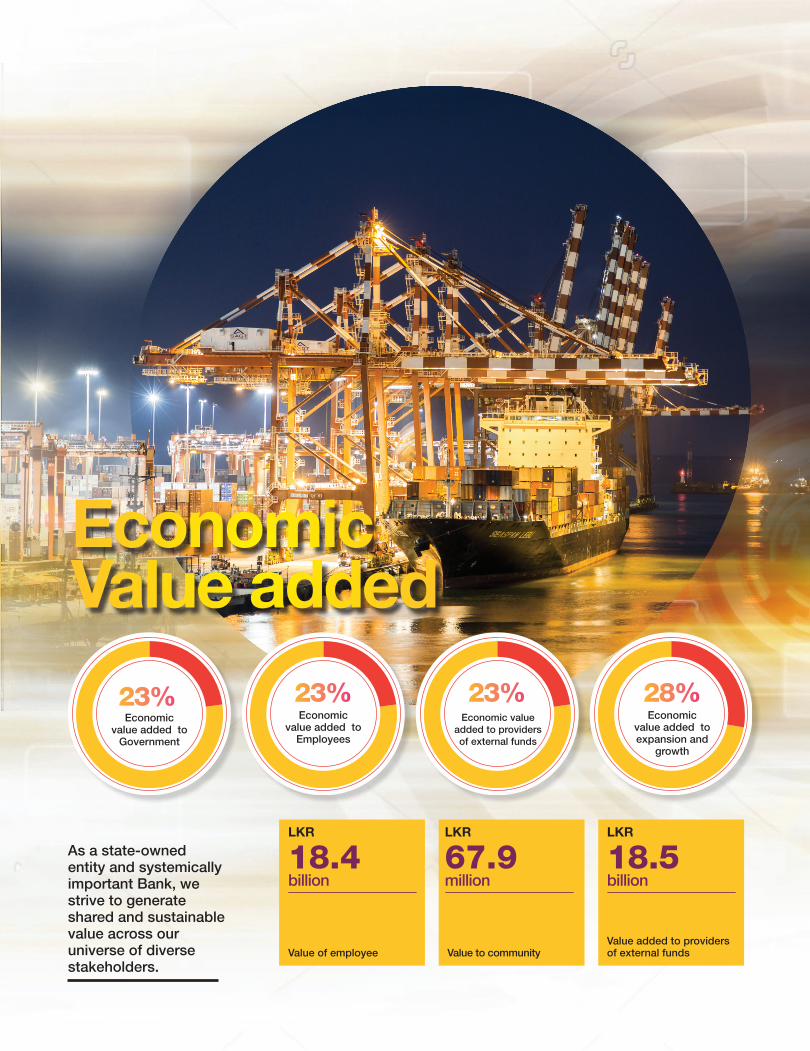
Economic Value added
23%Economic
value added to Government
23%Economic
value added to Employees
23% 28%
18.518.4 67.9LKRLKR LKR
Value of employee Value to communityValue added to providers of external funds
billionbillion million
Economic valueadded to providersof external funds
Economic value added to expansion and
growth
As a state-owned entity and systemically important Bank, we strive to generate shared and sustainable value across our universe of diverse stakeholders.

Annual Report of the Directors on the State of
Affairs of Bank of Ceylon 133
Directors’ Interest in Contracts 139
Directors’ Statement on Internal Control
Over Financial Reporting 142
Independent Assurance Report 144
Directors’ Responsibility for Financial Reporting 145
Report of the Auditor General 146
Statement of Profit or Loss 150
Statement of Comprehensive Income 151
Statement of Financial Position 152
Statement of Changes In Equity 154
Statement of Cash Flows 158
Notes to the Financial Statements 160
Financial Reports

About this Report / Performance Highlights 2019 / Chairman’s Message / General Manager’s Review / Organisational Overview / Strategic Report / Performance and Outlook / Stakeholder Value Creation / Financial Reports / Compliance Annexes / Supplementary Information
133
Annual Report of the Directors on the State of Affairs of Bank of Ceylon1. General
The Board of Directors of Bank of
Ceylon take pleasure in presenting
their report on the affairs of the Bank
together with the Audited Consolidated
Financial Statements for the year ended
31 December 2019 of the Bank and
the Group and the Auditor General’s
Report on those Financial Statements,
conforming to the requirements of the
Bank of Ceylon Ordinance No. 53 of
1938 and Banking Act No. 30 of 1988
and amendments thereto. The Report
also includes certain disclosures laid
down by the Colombo Stock Exchange
Listing Rules and certain disclosures
required to be made under the Banking
Act Direction No. 11 of 2007 on
Corporate Governance for licensed
commercial banks issued by the Central
Bank of Sri Lanka and subsequent
amendments thereto. The Directors
reviewed and approved the Financial
Statements on 24 March 2020.
Bank of Ceylon is a licensed commercial
bank under the Banking Act No. 30 of
1988 and amendments thereto and was
duly incorporated on 1 August 1939
under Bank of Ceylon Ordinance No. 53
of 1938. The Bank is wholly owned by the
Government of Sri Lanka. The unsecured
subordinated redeemable debentures
issued by the Bank are listed on the
Colombo Stock Exchange.
2. Review of the Business
2.1 Principal Activities of the Bank
The principal activities of the Bank
during the year were personal banking,
corporate banking, development
banking, off-shore banking, trade
financing, lease financing, primary
dealing, investment banking and
treasury operations, correspondence
banking and money remittances, islamic
banking, bancassurance, pawning,
credit card facilities, foreign currency
operations and other financial services.
2.2 Subsidiaries and Associates
The principal activities of subsidiaries and
associates are given under Notes to the
Financial Statements on page 160 and
161. There were no significant changes
in the nature of the principal activities
of the Bank and the Group during the
year under review, other than changes
mentioned under Accounting Policies.
2.3 Changes to the Group Structure
During the year, the structure of the
Group has not undergone any change
and, notes to the Financial Statements
No. 30 and 31 on pages from 236 to 243
of this Annual Report give details about
the Group.
2.4 Vision, Mission and Corporate Conduct
The Bank’s Vision and Mission are given
on page 04 of this Annual Report. The
Bank maintains high ethical standards
in its activities whilst pursuing the
objectives stated under ‘Vision’,
‘Mission’ and ‘Value Statements’.
2.5 Review of the Year’s Performance
The Chairman’s Message on pages
12 and 13 deals with the year’s
performance of the Bank/ Group and on
the Sri Lankan economy. The General
Manager’s Review on pages 14 to
19 provides a detailed description of
the operations of the Bank during the
year under review. The section titled
“Financial Review” on pages 121 to
123 provides a detailed analysis of
business operations of the Bank. These
reports that provide a fair review of the
Bank’s affairs form an integral part of the
Annual Report.
2.6 Branch Expansion
The Bank extended its services through
the addition of four new branches and
10 limited service branches during the
period under review. In addition, the
Bank expanded its network by 1 CDM,
143 CRMs, 5 Mobile Banking Units
(Branch on Wheel) during the year
across the island, bringing out the total
direct customer contact points to 1,881.
This number does not include peer
banks’ ATMs through which customers
of Bank of Ceylon can transact and
School “Sansada” and Mobile saving
units. No. of School “Sansada” and
Mobile School Savings Units added
during the year accounted to, 114 and
362 respectively.
2.7 Corporate Donations
The Bank has not granted donations
for the year 2019 but the Bank has
contributed LKR 68.0 million to facilitate
Corporate Social Responsibility (CSR)
activities during the period under review.
2.8 Directors’ Responsibilities for Financial Reporting
The Directors are responsible for the
preparation of Financial Statements that
will reflect a true and fair view of the
state of affairs. The Directors are of the
view that these Financial Statements
have been prepared in conformity
with the requirements of the Sri Lanka
Accounting Standards, Banking Act No.
30 of 1988 and its amendments, Bank of
Ceylon Ordinance No. 53 of 1938 and its
amendments and the Listing Rules of the
Colombo Stock Exchange. In the case
of subsidiaries, the Financial Statements
are prepared also in accordance with
the provisions of the Companies Act No.
07 of 2007. The Statement of Directors’

BA
NK
OF
CE
YL
ON
AN
NU
AL
RE
PO
RT
20
19
134
About this Report / Performance Highlights 2019 / Chairman’s Message / General Manager’s Review / Organisational Overview / Strategic Report / Performance and Outlook / Stakeholder Value Creation / Financial Reports / Compliance Annexes / Supplementary Information
Responsibility for Financial Reporting is
given on page 145 of this Annual Report
and forms an integral part of this Report
of the Directors.
2.9 Auditor’s Report
The Auditor General is the Auditor
of Bank of Ceylon in terms of the
provisions of Article 154 of the
Constitution of the Democratic Socialist
Republic of Sri Lanka.
Report of the Auditor General on the
Financial Statements of the Bank and
the Consolidated Financial Statements
of the Bank and its subsidiaries as at
31 December 2019 is given on pages
146 to 149 of this Annual Report.
2.10 Accounting Policies
The Group and the Bank prepared their
Financial Statements in accordance
with Sri Lanka Accounting Standards
(LKASs) and Sri Lanka Financial
Reporting Standards (SLFRSs).
The accounting policies adopted in the
preparation of Financial Statements are
given on pages 160 to 338. The Bank
successfully adopts Sri Lanka Financial
Reporting Standard (SLFRS) 09: Financial
Instruments since year 2019 onwards and
during this year the Bank has complied
with new SLFRS 16 - “Leases” which
came in to effect from
1 January 2019.
3. Planned Developments
An overview of the developments
planned by the Bank for the future is
presented in the Chairman’s Message
on pages 12 and 13 and General
Manager’s Review on pages 14 to 19 of
this Annual Report.
4. Total Income
The total income of the Group for the year 2019 was LKR 248,692 million as against
LKR 229,351 million in the previous year. The Bank’s total income accounted for
96.2% (2018 – 96.4%) of the total income of the Group. The main income of the Group
is interest income, which comprises 91.4% (2018 - 88.0%) of the total income.
5. Dividends and Reserves
5.1 Profit and Appropriations
The Bank has recorded a profit before tax of LKR 29,685 million in 2019 reflecting a
decrease of 11.2%, compared to LKR 33,416 million recorded for the previous year.
After deducting LKR 6,587 million (2018 – LKR 12,413 million) for income tax, the profit
after tax (PAT) for the year 2019 amounted to LKR 23,098 million, which is a 10.0%
increase compared to LKR 21,003 million PAT reported in 2018.
Tax expense has reduced by 46.9% compared to the previous year mainly due to
exemption on interest income earned from Sri Lanka Development Bond investment
for income tax purpose.
Details of the profit relating to the Bank and the Group are given in the table below:
Bank Group
For the year ended 31 December 2019 2018 2019 2018
LKR million LKR million LKR million LKR million
Profit for the year after payment of all expenses, providing for depreciation, amortisation, impairment on loans and other losses, contingencies and before taxes 40,206 43,004 41,478 43,770
Taxes on financial services (10,521) (9,588) (10,851) (9,818)
Share of profits/ (losses) of associatecompanies net of tax - - 48 9
Profit before income tax 29,685 33,416 30,675 33,961
Income tax expense (6,587) (12,413) (6,928) (12,922)
Profit for the year 23,098 21,003 23,747 21,039
Other comprehensive income for theyear, net of tax (12,639) (1,651) (12,047) (1,368)
Total comprehensive income for the year 10,459 19,351 11,700 19,671
Appropriations
Transfers to permanent reserve fund (493) (2,463) (493) (2,463)
Dividends (346) (4,846) (346) (4,846)
Annual Report of the Directors on the State of Affairs of Bank of Ceylon

About this Report / Performance Highlights 2019 / Chairman’s Message / General Manager’s Review / Organisational Overview / Strategic Report / Performance and Outlook / Stakeholder Value Creation / Financial Reports / Compliance Annexes / Supplementary Information
135
The profit before tax of the Group also decreased from LKR 33,961 million to LKR
30,676 million, a decrease of 9.7% in comparison to the previous year. After deducting
LKR 6,928 million for income tax (2018 – LKR 12,922 million) the profit after tax for the
year of the Group is LKR 23,747 million in (2018 – LKR 21,039 million.)
5.2 Dividends
The Bank pays dividends to its sole shareholder the Government of Sri Lanka, as per
the Dividend Policy of the Bank in consultation with the Government, prudently based
on profits after deduction of tax, loan loss provision and any such portion for reserves.
Accordingly, a sum of LKR 346 million has been paid out by the Bank as dividends for
the year 2019 (2018 – LKR 4,846 million).
5.3 Reserves
The total reserves of the Group stood at LKR 128,212 million as at 31 December 2019
(2018 – LKR 117,174 million). The Group reserves consist of the following:
Group
For the year ended 31 December 2019 2018
LKR million LKR million
Permanent reserve fund 13,383 12,890
Revaluation reserve 19,288 18,747
Free reserve 367 367
Exchange translation reserve 3,102 3,157
FVTOCI reserve 2,572 2,474
Statutory reserve 359 359
Retained earnings 89,141 79,180
Total 128,212 117,174
6. Property, Plant and EquipmentThe total capital expenditure incurred by the Group on the addition of Property, Plant and Equipment, right of use assets and intangible assets during the year amounted to LKR 4,770 million (2018 – LKR 4,360 million) the details of which are given in Notes 33 to 35 of Financial Statements on pages 246 to 265 of this Annual Report.
7. Value of Freehold PropertiesThe value of freehold properties owned by the Group as at 31 December 2019 is included in Note 33 of the Financial Statements at LKR 22,223 million (2018 – LKR 21,655 million).
8. Stated Capital and Shareholding
8.1 Stated Capital
The total issued and fully paid up capital of the Bank as at 31 December 2019 was LKR 25,000 million (2018 – LKR 20,000 million).
During the year 2018, the Bank received LKR 5,000 million from the Government of Sri Lanka, the second phase of the total amount of LKR 10,000 million allocated to the Bank under National Budget 2018. This allocation was reported under capital pending allotment as at 31 December 2018, during the year 2019 the Bank issued five million ordinary shares at LKR 1,000 each to the Government of Sri Lanka and thereby transferred the capital pending allotment to the share capital during the year 2019.
8.2 Shareholding
The Government of Sri Lanka is the sole shareholder of the Bank.
9. Issue of Subordinated DebenturesThe Group issued unlisted unsecured subordinated redeemable debentures with non-viability write-down features, amounting to LKR 9,210 million during the year ended 31 December 2019 (2018 – LKR 12,000 million). The proceeds of these debentures were utilised to expand the Bank’s loan book in the ordinary course of business. This would enable the Bank to achieve the following, on allotment:
• Increase the Tier 2 capital of the Bank in order to enhance the Capital Adequacy Ratio and Single Borrower Limit to facilitate expansion of the loan book.
• Minimise and manage the gap exposure in the Bank’s assets and liability portfolios.
• Strengthen the Bank’s liquidity position and to increase the asset base.
The details of debentures outstanding as at the date of Statement of Financial Position are given in Note 48 of the Financial Statements on pages 285 to 287.
10. Share InformationThe basic earnings per share and net assets value per share of the Group were LKR 987 (2018 - LKR 1,129) and LKR 6,128 (2018 - LKR 7,109) respectively, for the year under review.
11. Corporate Sustainability and ResponsibilityThe programmes carried out under Corporate Sustainability and Responsibility (CSR) are detailed on pages 78 to 86 under the section titled ‘Sustainable Business.
12. DirectorsDetails of Directors who held the office during the year 2019 and Directors who

BA
NK
OF
CE
YL
ON
AN
NU
AL
RE
PO
RT
20
19
136
About this Report / Performance Highlights 2019 / Chairman’s Message / General Manager’s Review / Organisational Overview / Strategic Report / Performance and Outlook / Stakeholder Value Creation / Financial Reports / Compliance Annexes / Supplementary Information
are holding the office as of the sign-off date of this Annual Report is given in the table below. As at year end date, viz 31 December 2019 there was no Board due to the change of Government that took place (The Government being the major shareholder, appoints the Directors through the Ministry in charge of the Bank). However, a Board was appointed during January 2020 and as of the Annual Report sign-off date, the number of Directors holding office is five (5).
During the year 2019 the Board consisted of the following members-
12.1 List of Directors
Mr Ronald C Perera, PC Independent Non-Executive Director/ Chairman(Ceased to be a Director w.e.f. 26 November 2019)
Mr K A VimalenthirarajahNon-Executive Ex-officio Director (Ceased to be a Director w.e.f. 10 January 2020)
Mr Kumar MayadunneIndependent Non-Executive Director (Ceased to be a Director w.e.f. 27 November 2019)
Mr P A SchaffterIndependent Non-Executive Director (Ceased to be a Director w.e.f. 27 November 2019)
Mr S Nilam JayasingheIndependent Non-Executive Director (Ceased to be a Director w.e.f. 27 November 2019)
Mr Kanchana Ratwatte Independent Non-Executive Director/Chairman(Appointed w.e.f. 02 January 2020)
Ms Visakha AmarasekereNon-Executive Ex-Officio Director(Appointed w.e.f. 11 January 2020)
Mr Lalith P WithanaIndependent Non-Executive Director(Appointed w.e.f. 14 January 2020)
Mr G Harsha WijayawardhanaIndependent Non-Executive Director(Appointed w.e.f. 14 January 2020)
Mr Hasitha PremaratneIndependent Non-Executive Director(Appointed w.e.f. 14 January 2020)
Name of the Director Executive/Non-Executive Status
Status of Independence
Mr Kanchana Ratwatte Non-Executive Independent
Ms Visakha Amarasekere Non-Executive Ex-officio Non-Independent
Mr Lalith P Withana Non-Executive Independent
Mr G Harsha Wijayawardhana Non-Executive Independent
Mr Hasitha Premaratne Non-Executive Independent
The Directors are classified as
Independent Directors on the basis
given in Banking Act Direction No. 11
of 2007 on Corporate Governance for
licensed commercial banks issued by
the Central Bank of Sri Lanka.
12.2 Board Subcommittees
The Board has formed five
subcommittees complying with the
aforesaid Banking Act Direction No. 11
of 2007 to ensure oversight control over
affairs of the Bank. During the previous
year a new Board subcommittee named
“Information and Communication
Technology Committee” was formed
to oversee the information technology
aspect of the Bank. The subcommittee
composition is given under
Subcommittee Reports on pages 109 to
115 of this Annual Report.
12.3 Directors’ Meetings
Attendance of Directors at Board and
subcommittee meetings are given on
page 99 of this Annual Report.
12.4 Directors’ Interests in Contracts
Directors’ interests in contracts with the
Bank, both direct and indirect are given
on pages 139 to 141. These interests
have been declared at meetings of the
Board of Directors. Except for the
contracts given therein the Directors do
not have any direct or indirect interest in
other contracts or proposed contracts
with the Bank.
12.5 Directors’ Interests in Debentures Issued by the Bank/ Group
There were no debentures registered in
the name of any Director.
12.6 Directors’ Allowances/ Fees
The allowances/ fees payable to the
Board of Directors are made in terms
of the provisions/ contents in the
Public Enterprises Circular No. PED
3/2015 dated 17 June 2015, issued by
the Department of Public Enterprises
of the Ministry of Finance and Bank
of Ceylon Ordinance No. 53 of 1938
and its amendments. The Directors’
remuneration in respect of the Group
Annual Report of the Directors on the State of Affairs of Bank of Ceylon

About this Report / Performance Highlights 2019 / Chairman’s Message / General Manager’s Review / Organisational Overview / Strategic Report / Performance and Outlook / Stakeholder Value Creation / Financial Reports / Compliance Annexes / Supplementary Information
137
and the Bank for the financial year
ended 31 December 2019 are given in
Note 16 on page 188.
13. Risk Management and System of Internal Controls
13.1 Risk Management
The Board of Directors assumes overall
responsibility for managing risks. The
specific measures taken by the Bank
in mitigating the risks are detailed on
pages 44 to 61 of this Annual Report.
13.2 Internal Control
The Board of Directors has ensured
the implementation of an effective
and comprehensive system of internal
controls in the Bank through the Audit
Committee. The Audit Committee helps
the Board of Directors to discharge their
fiduciary responsibilities. The Report of
the Chairman of the Audit Committee
is contained on pages 109 to 110 of
this Annual Report. The Directors are
satisfied with the effectiveness of the
system of internal controls during the
year under review and up to the date
of the Annual Report and the Financial
Statements.
The Board has issued a statement
on the internal control mechanism of
the Bank as per Direction No. 3 (8)
(ii) (b) of Banking Act Direction No. 11
of 2007 on Corporate Governance for
licensed commercial banks. The above
report is given on pages 142 and 143
of this Annual Report. The Board has
confirmed that the financial reporting
system has been designed to provide
reasonable assurance regarding the
reliability of financial reporting and that
the preparation of Financial Statements
for external reporting purposes has
been done in accordance with relevant
accounting principles and regulatory
requirements.
The Board has obtained an Assurance
Report from the Auditor General on
Directors’ Statement on Internal Control
and it is given on page 144 of this Annual
Report.
14. Corporate Governance
The Board of Directors is committed
towards maintaining an effective
corporate governance structure and
process. The financial, operational and
compliance functions of the Bank are
directed and controlled effectively within
corporate governance practices. These
procedures and practices that are in
conformity with Corporate Governance
Directions issued by the Central Bank of
Sri Lanka under Banking Act Direction
No. 11 of 2007 and the Code of Best
Practice on Corporate Governance
issued by the Institute of Chartered
Accountants of Sri Lanka, are described
in the section titled “Corporate
Governance” appearing on pages 100
to 108 of this Annual Report. The Board
has obtained a report from the Auditor
General on the compliance with the
provisions of the above mentioned
Direction No. 11 of 2007.
15. Human Resources
One of the most valuable assets of the
Bank is its employees and it is important
for the Bank to develop them. Several
measures were taken to strengthen
the much valued human capital in
order to optimise their contribution
towards the achievement of corporate
objectives. The Bank’s human resource
management policies and practices are
detailed in the section titled “Human
capacity building” on pages 90 to 94 of
this Report.
16. Compliance with Laws and Regulations
The Directors, to the best of their
knowledge and belief confirm that the
Group has not engaged in any activities
contravening the laws and regulations.
Details of the Bank’s compliance with
laws and regulations are given on pages
339 to 390 under the section titled
“Compliance Annexes” which forms an
integral part of this Report.
17. Outstanding Litigation
In the opinion of the Directors and as
confirmed by the Bank’s lawyers the
litigation currently pending against the
Bank will not have a material impact on
the reported financial results or future
operations of the Bank.
18. Statutory Payments
The Board confirms that all statutory
payments due to the Government and in
relation to employees have been made
on time.
19. Environmental Protection
The Bank has not engaged in any
activity, which has caused detriment to
the environment. Further, precautions
taken to protect the environment are
given in the section titled “Environmental
Sustainability” on pages 83 to 86.
20. Post-Balance Sheet Events
The Directors are of the view that no
material events have arisen in the
interval between the end of the financial
year and the date of this Report
that would require adjustments or
disclosures.

BA
NK
OF
CE
YL
ON
AN
NU
AL
RE
PO
RT
20
19
138
About this Report / Performance Highlights 2019 / Chairman’s Message / General Manager’s Review / Organisational Overview / Strategic Report / Performance and Outlook / Stakeholder Value Creation / Financial Reports / Compliance Annexes / Supplementary Information
21. Going Concern
The Directors are confident that the
resources of the Bank are adequate to
continue its operations. Therefore, it
has applied the going concern basis in
preparing the Financial Statements.
By order of the Board,
Janaki Senanayake Siriwardane
Secretary
Bank of Ceylon/ Secretary to the Board
24 March 2020
Colombo.
Note: The following changes were made
to the Board of Bank of Ceylon after the
Financial Statement sign-off date-
1. Mr A C M Fernando was appointed
to the Board w.e.f 21 April 2020
2. Mr R M P Rathnayake was
appointed to the Board w.e.f 28
April 2020 in place of Ms Visakha
Amarasekere
Janaki Senanayake Siriwardane
Secretary
Bank of Ceylon/ Secretary to the Board
06 May 2020
Colombo.
Annual Report of the Directors on the State of Affairs of Bank of Ceylon

About this Report / Performance Highlights 2019 / Chairman’s Message / General Manager’s Review / Organisational Overview / Strategic Report / Performance and Outlook / Stakeholder Value Creation / Financial Reports / Compliance Annexes / Supplementary Information
139
Directors’ Interest in ContractsRelated party disclosures as required by the Sri Lanka Accounting Standard - LKAS 24 - "Related Party Disclosures" are detailed in Note 59 to the Financial Statements on pages 300 to 305.
In addition, the transactions that have been carried out in the ordinary course of business in an arm's length basis with entities where the Chaiman or a Director
of the Bank is the Chaiman or a Director of such entities, are detailed below:
As at the year end date, 31 December 2019, there was no Board. However, the Board of Directors was appointed during January 2020 and for the better disclosure purpose, Directors' interest in contracts are disclosed as follows;
- for the Directors who held the office during the year 2019, interest in contracts have been shown as of the year end 2019.
- for the current Directors, interest in contracts have been shown as of sign-off date of these Financial Statements.
Company Relationship Nature of Transactions Limit Balance/ Amount
outstanding
Balance/ Amount outstanding as at
31.12.2018
’000 ’000 ** ’000
Directors’ Interest In Contracts - Current Board
Mr Kanchana Ratwatte
(Mr Kanchana Ratwatte appointed as the Chairman of Bank of Ceylon w.e.f. 2 January 2020)(**Exposure as at 24 March 2020)
First Guardian Equities Director Current accounts 10,265
EW Information Systems Ltd Director Savings accounts 10
Loans 224,581
Letter of Credit 10,462
Toppan Forms (Colombo) Ltd Director Overdrafts 40,000 40,443
Loans 68,865
Trust receipt 40,000 8,144
Letter of guarantee 30,000 8,941
Shipping guarantee 10,895
Ms Visakha Amarasekere
(Ms Visakha Amarasekere as a Director of Bank of Ceylon w.e.f. 11 January 2020)
(**Exposure as at 24 March 2020)
Ceylon Fertilizer Corporation Director Current accounts 841
Time Deposits 1,155,786
Letter of Credit 288
Acceptance 306,262
Mr G Harsha Wijayawardhana
(Mr G Harsha Wijayawardhana appointed as a Director w.e.f. 14 January 2020) (**Exposure as at 24 March 2020)
LK Domain Registry Founding Director Current accounts 245 122
Time Deposits 60,000 70,000
Mr Hasitha Premaratne
(Mr Hasitha Premaratne appointed as a Director w.e.f. 14 January 2020)
(**Exposure as at 24 March 2020)
Brandix Apparel Limited Director Current accounts Overdrafts
10,000
266,896
Current accounts USD 56
Overdrafts USD 3,350 *10,460
* LKR equivalent amount
Note: Currencies not specifically mentioned are in LKR

BA
NK
OF
CE
YL
ON
AN
NU
AL
RE
PO
RT
20
19
140
About this Report / Performance Highlights 2019 / Chairman’s Message / General Manager’s Review / Organisational Overview / Strategic Report / Performance and Outlook / Stakeholder Value Creation / Financial Reports / Compliance Annexes / Supplementary Information
Company Relationship Nature of Transactions Limit Balance/ Amount
outstanding
Balance/ Amount outstanding as at
31.12.2018
’000 ’000 ** ’000
Overdrafts USD 3,350 USD 979 *182,988 Time Deposits USD 12,000
*2,244,000 Letter of guarantee 3,856 Brandix Apparel Solutions Ltd Director Current accounts 27,254 Overdrafts USD 891 *166,537 Kuruwita Textile Mills Limited Director Current accounts 318 Ocean Lanka (Private) Limited Alternate Director Savings accounts USD 145 *27,148
Current accounts Overdrafts 15,000
50,196
Current accounts USD 2 *281 Time Deposits USD 7,346 *1,373,747 Teejay Lanka Prints (Private) Limited Director Current accounts 18 Current accounts USD 28 *5,232
Overdrafts USD 1,000Teejay Lanka PLC Director Savings accounts 27,279
Current accountsOverdrafts 1,000
29,177
Current accounts USD 256
Overdrafts USD 1,750 *47,882
Time Deposits 5,567 Directors’ Interest In Contracts - Previous Boards Mr Ronald C Perera PC (Mr Ronald C Perera resigned during 2018 and re-appointed as the Chairman of Bank of Ceylon w.e.f. 12 February 2019 and resigned w.e.f. 26 November 2019) (**Exposure as at 31 December 2019) Bank of Ceylon (UK) Limited Chairman Current accounts 17 Nostro accounts USD 1,170 USD 602 *212,517 *110,015 GBP 753 GBP 66 *179,592 *15,303 EURO 349 EURO 687 *71,156 *143,578 Placements USD 8,000 USD 8,000 *1,453,072 *1,461,999 GBP 129,000 GBP 127,900 *30,761,108 *29,665,393 EURO 750 EURO 1,000 *152,750 *208,993
Directors’ Interest in Contracts
* LKR equivalent amount
Note: Currencies not specifically mentioned are in LKR

About this Report / Performance Highlights 2019 / Chairman’s Message / General Manager’s Review / Organisational Overview / Strategic Report / Performance and Outlook / Stakeholder Value Creation / Financial Reports / Compliance Annexes / Supplementary Information
141
Company Relationship Nature of Transactions Limit Balance/ Amount
outstanding
Balance/ Amount outstanding as at
31.12.2018
’000 ’000 ** ’000
Hotels Colombo (1963) Limited Acting Chairman Current accounts 4,931 5,338
Overdrafts 7,500 Time Deposits 175,456 166,896
Other receivables 146,487 81,126
Mr P A Schaffter
(Mr P A Schaffter appointed as a Director of Bank of Ceylon w.e.f. 26 February 2019 and resigned w.e.f. 27 November 2019)
(**Exposure as at 31 December 2019)
Janashakthi Insurance PLC Chairman Current accounts 12,441 12
Janashakthi PLC Director Current accounts 4,250 4,544
Loans 81,984 107,604
Orient Finance PLC Director Overdrafts 50,000 38,745 10,941
Loans 483,778 794,222
Pan Nippon Development (Private) Ltd Director Current accounts - 47
Dunamis Capital PLC Director Current accounts 346
Loans 750,000
First Capital Holidings PLC Director Current accounts 298
Loans 175,000
Mr K A Vimalenthirarajah
(Mr K A Vimalenthirarajah appointed as a Director of Bank of Ceylon w.e.f. 27 February 2019 and resigned w.e.f. 11 January 2020)
(**Exposure as at 31 December 2019)
Ceylon Petroleum Corporation Director Savings accounts 2,351,017
Current accounts 765
Loans 148,398,030
Sri Lanka Insurance Corporation Director Savings accounts 743,163
Current accounts 173,967
Overdrafts 7,221
Time Deposits 755,474
Letter of Credit 7,154
SAARC Development Fund Director Savings accounts USD 4
*755
Time Deposits USD 187,551
*34,065,609
Board of Investment of Sri Lanka Director Savings accounts 15,748
Current accounts 236,145
* LKR equivalent amount
Note: Currencies not specifically mentioned are in LKR

BA
NK
OF
CE
YL
ON
AN
NU
AL
RE
PO
RT
20
19
142
About this Report / Performance Highlights 2019 / Chairman’s Message / General Manager’s Review / Organisational Overview / Strategic Report / Performance and Outlook / Stakeholder Value Creation / Financial Reports / Compliance Annexes / Supplementary Information
Directors’ Statement on InternalControl Over Financial ReportingResponsibility
In line with the Banking Act Direction
No. 11 of 2007, section 3(8)(ii)(b), the
Board of Directors presents this report
on Internal Control over Financial
Reporting.
The Board of Directors (“Board”) is
responsible for the adequacy and
effectiveness of the internal control
mechanism in place at Bank of Ceylon,
(“the Bank”). In considering such
adequacy and effectiveness, the Board
recognizes that the business of banking
requires reward to be balanced with risk
on a managed basis and as such the
internal control systems are primarily
designed with a view to highlighting any
deviations from the limits and indicators
which comprise the risk appetite of the
Bank. In this light, the system of internal
controls can only provide reasonable,
but not absolute assurance, against
material misstatement of financial
information and records or against
financial losses or fraud.
The Board has established an ongoing
process for identifying, evaluating and
managing the significant risks faced
by the Bank and this process includes
enhancing the system of internal
control over financial reporting as and
when there are changes to business
environment or regulatory guidelines.
The process is regularly reviewed by
the Board and is in accordance with the
guidance for Directors of banks on the
Directors’ Statement on Internal Control
issued by the Institute of Chartered
Accountants of Sri Lanka. The Board
has assessed the internal control over
financial reporting taking into account
principles for the assessment of
internal control system as given in that
guidance.
The Board is of the view that the
system of internal controls over
financial reporting in place is sound
and adequate to provide reasonable
assurance regarding the reliability
of financial reporting, and that the
preparation of Financial Statements
for external purposes is in accordance
with relevant accounting principles and
regulatory requirements.
The management assists the Board
in the implementation of the Board’s
policies and procedures on risk and
control by identifying and assessing the
risks faced, and in the design, operation
and monitoring of suitable internal
controls to mitigate and control these
risks.
Key features of the process adopted in reviewing the design and effectiveness of the internal control system over financial reporting
The key processes that have been
established in reviewing the adequacy
and integrity of the system of internal
controls with respect to financial
reporting include the following:
• Various committees are established
by the Board to assist the Board in
ensuring the effectiveness of bank’s
daily operations and that the Bank’s
operations are in accordance with
the corporate objectives, strategies
and the annual budget as well as
the policies and business directions
that have been approved.
• The Internal Audit Division of the
Bank checks for compliance with
policies and procedures and the
effectiveness of the internal control
systems on an ongoing basis using
samples and rotational procedures
and highlights significant findings
in respect of any non-compliance.
Audits are carried out on all units
and branches, the frequency of
which is determined by the level
of risk assessed, to provide an
independent and objective report.
The annual audit plan is reviewed
and approved by the Board Audit
Committee. Findings of the Internal
Audit Division are submitted to the
Board Audit Committee for review at
their periodic meetings.
• The Board Audit Committee of
the Bank reviews internal control
issues identified by the Internal
Audit Division, the external auditors,
regulatory authorities and the
management, and evaluates the
adequacy and effectiveness of
the risk management and internal
control systems. They also review
the internal audit functions with
particular emphasis on the scope
of audits and quality of the same.
All minutes of the Board Audit
Committee meetings are forwarded
to the Board. Further details of the
activities undertaken by the Audit
Committee of the Bank are set out
in the Audit Committee Report on
pages 109 to 110.
• In assessing the internal control
system over financial reporting,
identified officers of the Bank
collated all procedures and controls
that are connected with significant
accounts and disclosures of the
Financial Statements of the Bank.
These in turn were observed and
checked by the Internal Audit
Division for suitability of design and
effectiveness on an ongoing basis.
The assessment did not include
subsidiaries of the Bank.

About this Report / Performance Highlights 2019 / Chairman’s Message / General Manager’s Review / Organisational Overview / Strategic Report / Performance and Outlook / Stakeholder Value Creation / Financial Reports / Compliance Annexes / Supplementary Information
143
• The Bank adopted the new Sri
Lanka Accounting Standards
comprising LKAS and SLFRS
in 2012. The processes and
procedures initially applied
to adopt the aforementioned
accounting standards were further
strengthened during the subsequent
years based on the feedback
received from internal and external
auditors, regulators and the Board
Audit Committee.
• With effect from 1 January 2018,
the Bank adopted the Sri Lanka
Accounting Standard – SLFRS
9 - “Financial Instruments”. The
processes required to comply
with the requirements of SLFRS
9 - “Financial Instruments” were
introduced and implemented
with the support of an external
consultant.
• The Bank is in the process of
implementing an automated
financial reporting process in order
to comply with the requirements
of recognition, measurement,
classification and disclosure of
the financial instruments more
effectively and efficiently and to
facilitate the “Financial Statement
Closure” process. The automated
solution enables the calculation of
impairment provisions under SLFRS
9 - “Financial Instruments” and
facilitates the fulfilling of internal and
external reporting requirements.
• The Bank adopted the Sri Lanka
Accounting Standard – SLFRS 16 -
“Leases” with effect from
1 January 2019. The Board has
taken necessary steps to implement
the requirements of the standard
and these have been embedded to
the existing control environment.
• A steering committee composing
of various disciplines of the
Bank monitors and coordinates
the transition process relating
to accounting standards and
implementation of the automated
financial reporting solution.
• The Bank is continuously monitoring
and updating procedures inter-alia
relating to impairment of loans and
advances of the Bank and foreign
branches, Financial Statement
disclosures, risk management,
related party transactions and
all other significant banking
activities based on the changing
regulatory and market conditions.
The requirements under SLFRSs/
LKASs have been communicated to
the relevant stakeholders including
the Board and senior management
through training and awareness
sessions.
• The comments made by the
external auditors in connection
with internal control system over
financial reporting in previous
years were reviewed during the
year and appropriate steps have
been taken to rectify them. The
recommendations made by
the external auditors in 2019 in
connection with the internal control
system over financial reporting will
be addressed in the future.
Confirmation
Based on the above processes, the
Board confirms that the financial
reporting system of the Bank has been
designed to provide a reasonable
assurance regarding the reliability of
financial reporting and the preparation
of Financial Statements for external
purposes and has been done in
accordance with Sri Lanka Accounting
Standards and regulatory requirements
of Central Bank of Sri Lanka.
By order of the Board
Chairman - Audit Committee
Chairman
Director
Colombo, Sri Lanka
24 March 2020

BA
NK
OF
CE
YL
ON
AN
NU
AL
RE
PO
RT
20
19
144
About this Report / Performance Highlights 2019 / Chairman’s Message / General Manager’s Review / Organisational Overview / Strategic Report / Performance and Outlook / Stakeholder Value Creation / Financial Reports / Compliance Annexes / Supplementary Information
Independent Assurance Report
Assurance Report of the Auditor General to the Board of Directors on the Directors’ Statement on Internal Control of Bank of Ceylon
IntroductionThis report is to provide assurance on the Directors’ Statement on Internal Control over Financial Reporting (“Statement”) of Bank of Ceylon included in the annual report for the year ended 31 December 2019.
Management’s ResponsibilityManagement is responsible for the preparation and presentation of the Statement in accordance with the “Guidance for Directors of Banks on the Directors’ Statement on Internal Control” issued in compliance with the Section 3(8) (ii) (b) of the Banking Act Direction No. 11 of 2007, by the Institute of Chartered Accountants of Sri Lanka.
My Responsibility and Compliance with SLSAE 3050 (Revised)My responsibility is to assess whether the Statement is both supported by the documentation prepared by or for directors and appropriately reflects the process the directors have adopted in reviewing the design and effectiveness of the internal control of the Bank of Ceylon.
I conducted this engagement in accordance with Sri Lanka Standard on Assurance Engagements (SLSAE) 3050 (Revised), Assurance Report for Banks on Directors’ Statement on Internal Control, issued by the institute of Chartered Accountants of Sri Lanka.
This Standard required that I plan and perform procedures to obtain limited assurance about whether Management has prepared, in all material aspects, the Statement on Internal Control.
For the purpose of this engagement, I am not responsible for updating or reissuing any reports, nor have I, in the course of this engagement, performed an audit or review of the financial information.
Summary of Work PerformedI conducted my engagement to assess whether the Statement is supported by the documentation prepared by or for Directors; and appropriately reflected the process the Directors have adopted in reviewing the system of internal control over financial reporting of the Bank.
The procedures performed were limited primarily to inquiries of Bank personnel and the existence of documentation on a sample basis that supported the process adopted by the Board of Directors.
SLSAE 3050 (Revised) does not require me to consider whether the Statement covers all risk and controls, or to form an opinion on the effectiveness of the Bank’s risk and control procedures. SLSAE 3050 (Revised) also does not require me to consider whether the processes described to deal with material internal control aspects of any significant problems disclosed in the annual report will, in fact, remedy the problems.
The procedures selected depend on my judgement, having regard to my understanding of the nature of the Bank, the event or transaction in respect of which the Statement has been prepared.
I believe that the evidence I have obtained is sufficient and appropriate to provide a basis for my conclusion.
ConclusionBased on the procedures performed, nothing has come to my attention that causes me to believe that the Statement included in the Annual Report is inconsistent with my understanding of the process the Board of Directors has adopted in the review of the design and effectiveness of internal control system over the financial reporting of the Bank.
W P C WickramarathneAuditor General
The Chairman
Bank of Ceylon

About this Report / Performance Highlights 2019 / Chairman’s Message / General Manager’s Review / Organisational Overview / Strategic Report / Performance and Outlook / Stakeholder Value Creation / Financial Reports / Compliance Annexes / Supplementary Information
145
Directors’ Responsibility forFinancial ReportingDirectors’ Responsibility for Financial ReportingThis Statement by the Board of Directors is made especially to distinguish the respective responsibilities of the Directors and Auditors in relation to financial reporting. The responsibility of Directors in relation to financial reporting of the Bank of Ceylon and the Group is set out in the following statement.
Financial StatementsIn terms of the provisions of Bank of Ceylon Ordinance No. 53 of 1938 and its amendments read with the Banking Act No. 30 of 1988 and its amendments and Directions, the Directors of the Bank are responsible for ensuring that the Bank maintains proper books of accounts, which disclose with reasonable accuracy at any time, the financial position of the Bank and prepares proper Financial Statements for each financial year, giving a true and fair view of the state of affairs of the Bank.
The Directors affirm that in preparing the Financial Statements for the year 2019 presented in this Annual Report, the most appropriate accounting policies have been used and applied consistently supported by judgments and estimates that are reasonable and prudent. Material departures, if any, have been disclosed and explained.
The Financial Statements for the year 2019 presented in this Annual Report, are in conformity with the requirements of the Bank of Ceylon Ordinance No. 53 of 1938 and its amendments, Banking Act No. 30 of 1988 and its amendments and Directions issued under it, the Sri Lanka Accounting Standards and other regulatory requirements. These Financial Statements reflect a true and fair view of the state of affairs of the Bank of Ceylon and the Group as at 31 December 2019.
Going ConcernThe Directors are of the view that the Bank and the Group have adequate
resources to continue in business in the foreseeable future. Accordingly, they have continued to adopt the going concern basis in preparing the Financial Statements.
Internal Controls, Risk Management and ComplianceThe Directors are also responsible for the system of internal financial controls and risk management and place considerable importance on maintaining a strong control environment to protect and safeguard the Bank’s assets and prevent fraud and mismanagement.
Whilst inherent and residual risks cannot be completely eliminated, the Bank endeavors to minimise them by ensuring that appropriate infrastructure, controls, systems and ethical behavior are applied and practiced within predetermined procedures and limits/ boundaries.
A report by the Directors on the Bank’s internal control mechanism, confirming that the financial reporting system has been designed to provide reasonable assurance regarding the reliability of financial reporting, is given on page 142 and 143 of this Annual Report.
The Directors and Management have put in place, risk management policies and guidelines. Management committees have been established to monitor and manage material risks. Arrangements are in place to ensure that reports on risk are submitted to the Integrated Risk Management Committee on a quarterly basis for discussion. Compliance with applicable laws, regulations, rules, directives and guidelines are monitored by the Independent Integrated Risk Management Division and reported to the Board.
The Audit Committee and Integrated Risk Management Committee, on an ongoing basis, have acted to strengthen the effectiveness of internal controls and risk management procedures. The reports of
the Audit Committee and Integrated Risk Management Committee are included on pages 109 to 112 of this Annual Report.
Audit ReportPursuant to provisions of Article 154 of the Constitution of the Democratic Socialist Republic of Sri Lanka, the Auditor General is the Auditor of the Bank and issues the final opinion on the Financial Statements of the Bank. The responsibilities of the Auditor in relation to the Financial Statements are set out in the Report of the Auditor General on pages 146 to 149 of this Annual Report. The Auditor General’s certification on the effectiveness of the Bank’s internal control mechanism is given on page 144 of this Annual Report.
ComplianceThe Directors to the best of their knowledge and belief, are satisfied that all statutory payments, in relation to all relevant regulatory and statutory authorities, which were due and payable by the Bank and its subsidiaries as at the Statement of Financial Position date, have been paid or where relevant provided for.
The Directors are of the view that they have discharged their responsibilities as set out in this statement.
By order of the Board,
Janaki Senanayake Siriwardane Secretary – Bank of Ceylon/Secretary to the Board
24 March 2020Colombo

BA
NK
OF
CE
YL
ON
AN
NU
AL
RE
PO
RT
20
19
146
About this Report / Performance Highlights 2019 / Chairman’s Message / General Manager’s Review / Organisational Overview / Strategic Report / Performance and Outlook / Stakeholder Value Creation / Financial Reports / Compliance Annexes / Supplementary Information
Report of the Auditor General
Report of the Auditor General on the Financial Statements and Other Legal and Regulatory Requirements of the Bank of Ceylon and its subsidiaries for the year ended 31 December 2019 in terms of Section 12 of the National Audit Act, No. 19 of 2018.
1. Financial Statements
1.1 Opinion
The audit of the Financial Statements of the Bank of Ceylon (the "Bank") and the Consolidated Financial Statements of the Bank and its subsidiaries ("Group") for the year ended 31 December 2019 comprising the statement of financial position as at 31 December 2019 and the statement of profit or loss, statement of comprehensive income, statement of changes in equity and statement of cash flow for the year then ended, and notes to the Financial Statements, including a summary of significant accounting policies, was carried out under my direction in pursuance of provisions in Article 154(1) of the Constitution of the Democratic Socialist Republic of Sri Lanka read in conjunction with provisions of the National Audit Act No. 19 of 2018.
The Bank has been exempted from the provisions of Part II of the Finance Act, No. 38 of 1971 by an Order of then Minister of Finance published in the Government Gazette No. 715 of 14 May 1992 by virtue of powers vested in him by Sections 5(1) of the said Finance Act. My report to Parliament in pursuance of provisions in Article 154 (6) of the Constitution will be tabled in due course.
In my opinion, the accompanying Financial Statements of the Bank and the Group give a true and fair view of the financial position of the Bank and the Group as at 31 December 2019, and of their financial performance and their cash flows for the year then ended in accordance with Sri Lanka Accounting Standards.
1.2 Basis for Opinion
I conducted my audit in accordance with Sri Lanka Auditing Standards (SLAuSs). My responsibilities, under those standards are further described in the Auditor's Responsibilities for the Audit of the Financial Statements section of my report. I believe that the audit evidence I have obtained is sufficient and appropriate to provide a basis for my opinion.
1.3 Key Audit Matters
Key Audit Matters are those matters that, in my professional judgment, were of most significance in my audit of the Financial Statements of the Bank and the Consolidated Financial Statements of the Group of the current period. These matters were addressed in the context of my audit of the Financial Statements of the Bank and the Consolidated Financial Statements of the Group as a whole, and in forming my audit opinion thereon, and I do not provide a separate opinion on these matters.
The Chairman
Bank of Ceylon

About this Report / Performance Highlights 2019 / Chairman’s Message / General Manager’s Review / Organisational Overview / Strategic Report / Performance and Outlook / Stakeholder Value Creation / Financial Reports / Compliance Annexes / Supplementary Information
147
Key Audit Matter How my audit addressed the Key Audit Matter
Impairment allowance for loans and advances
My audit considered impairment allowance for loans and
advances as a Key Audit Matter. The materiality of the reported
amounts for loans and advances (and impairment allowance
thereof), involvement of complex calculations and the subjectivity
associated with management's impairment estimation underpinned
my basis for considering it as a Key Audit Matter.
As at 31 December 2019, 64% of its total assets of the Group
consisted of loans and advances amounting to LKR 1,581 billion
(Note 27.1), net of impairment allowance of LKR 102 billion (Note
27.2).
Significant estimates and assumptions used by the management
in such calculations, their sensitivity and the basis for impairment
allowance are disclosed in Notes 4.5.11 and 27.
My audit procedures were designed to obtain sufficient and appropriate evidences to assess the reasonableness of the impairment allowance and included the following, amongst others;
- I evaluated design effectiveness of controls over estimation of impairment of loans and advances, which included assessing the level of oversight, review and approval of impairment policies by the Board Audit Committees and management.
- I test-checked the underlying calculations and data.
- In addition to the above, following focused procedures were performed:
For loans and advances - individually assessed for impairment:
- I assessed the main criteria used by the management for determining whether an impairment event had occurred;
- Where impairment indicators existed, I assessed the reasonableness of management's estimated future recoveries including the expected future cash flows, discount rates and the valuation of collateral held. I also compared the actual recoveries against previously estimated amounts of future recoveries, on a sample basis.
- Where loans and advances granted to customers with a higher risk of credit loss, I assessed the main criteria used by the management for determining whether an impairment event had occurred and the reasonableness of management estimation of such additional impairment.
For loans and advances- collectively assessed for impairment:
- I tested the completeness, relevance and accuracy of the underlying information in loans and advances used in the impairment calculations by agreeing details to the Group's source documents, information in IT systems and re-performing the calculations.
- I also considered reasonableness of macro-economic and other factors used by management in their judgmental overlays for various types of loan portfolios, by comparing them with publicly available data and information sources.
- I assessed the adequacy of the related Financial Statement disclosures as set out in Notes 4.5.11, 14 and 27.

BA
NK
OF
CE
YL
ON
AN
NU
AL
RE
PO
RT
20
19
148
About this Report / Performance Highlights 2019 / Chairman’s Message / General Manager’s Review / Organisational Overview / Strategic Report / Performance and Outlook / Stakeholder Value Creation / Financial Reports / Compliance Annexes / Supplementary Information
Report of the Auditor General
Key Audit Matter How my audit addressed the Key Audit Matter
Preparation of financial statements inclusive of significant
disclosures and related IT systems and Controls
The Bank uses the output of multiple IT systems in its preparation
process of financial statements and key disclosures. The process
of preparing key disclosures involved generation of multiple
system reports, collation, analysis and spread sheet based further
calculation.
The preparation process of financial statements and disclosures
that depends on manual, automated and IT dependent controls
over the said process was considered by me as an area of
significant attention and accordingly I considered this to be a Key
Audit Matter.
My audit procedures included the following, amongst others:
• Understanding and evaluating design effectiveness of the key automated, IT dependent and manual controls implemented by management over generation of multiple system reports and the procedures around collation and analysis of required information on which the significant financial statements disclosures are based.
• Test-checking;
- the reports used to generate significant disclosures for accuracy and completeness;
- source data with those of the reports generated from the related systems;
- calculations made by management;
- reasonableness of categorizations made by management;
• Testing material post-closing adjustments to appropriate supporting evidence
• Assessing if the significant disclosures are being made in line with applicable accounting standards.
1.4 Other information included in the Bank's 2019 Annual Report
Other information consists of the information included in the Bank's 2019 Annual Report, other than the financial statements and our Auditors' Report thereon. Management is responsible for the other information. The Bank's 2019 Annual Report is expected to be made available to us after the date of this Auditors' Report.
Our opinion on the financial statements does not cover the other information and we will not express any form of assurance conclusion thereon.
In connection with our audit of the financial statements, our responsibility is to read the other information identified above when it becomes available and, in doing so, consider whether the other information is materially inconsistent with the financial statements or our
knowledge obtained in the audit or otherwise appears to be materially misstated.
1.5 Responsibilities of Management and Those Charged with Governance for the Financial Statements
Management is responsible for the preparation of Financial Statements that give a true and fair view in accordance with Sri Lanka Accounting Standards, and for such internal control as management determine is necessary to enable the preparation of Financial Statements that are free from material misstatement, whether due to fraud or error.
In preparing the Financial Statements, management is responsible for assessing the Group's ability to continue as a going concern, disclosing, as applicable, matters related to going concern and using the going concern basis of accounting unless management either
intend to liquidate the Group or to cease operations, or has no realistic alternative but to do so.
Those charged with governance are responsible for overseeing the Bank's and the Group's financial reporting process.
As per Section 16(1) of the National Audit Act No. 19 of 2018, the Group is required to maintain proper books and records of all its income, expenditure, assets and liabilities, to enable annual and periodic Financial Statements to be prepared of the Group.
1.6 Auditor's Responsibilities for the Audit of the Financial Statements
My objective is to obtain reasonable assurance about whether the Financial Statements as a whole are free from material misstatement, whether due to fraud or error, and to issue an auditor's report that includes my opinion.

About this Report / Performance Highlights 2019 / Chairman’s Message / General Manager’s Review / Organisational Overview / Strategic Report / Performance and Outlook / Stakeholder Value Creation / Financial Reports / Compliance Annexes / Supplementary Information
149
Reasonable assurance is a high level of assurance, but is not a guarantee that an audit conducted in accordance with Sri Lanka Auditing Standards will always detect a material misstatement when it exists. Misstatements can arise from fraud or error and are considered material if, individually or in the aggregate, they could reasonably be expected to influence the economic decisions of users taken on the basis of these Financial Statements.
As part of an audit in accordance with Sri Lanka Auditing Standards, I exercise professional judgment and maintain professional skepticism throughout the audit. I also:
• Identify and assess the risks of material misstatement of the Financial Statements, whether due to fraud or error, design and perform audit procedures responsive to those risks, and obtain audit evidence that is sufficient and appropriate to provide a basis for my opinion. The risk of not detecting a material misstatement resulting from fraud is higher than for one resulting from error, as fraud may involve collusion, forgery, intentional omissions, misrepresentations, or the override of internal control.
• Obtain an understanding of internal control relevant to the audit in order to design audit procedures that are appropriate in the circumstances, but not for the purpose of expressing an opinion on the effectiveness of the Group's internal control.
• Evaluate the appropriateness of accounting policies used and the reasonableness of accounting estimates and related disclosures made by the management.
• Conclude on the appropriateness of the management's use of the going concern basis of accounting and based on the audit evidence obtained, whether a material
uncertainty exists related to events or conditions that may cast significant doubt on the Group's ability to continue as a going concern. If I conclude that a material uncertainty exists, I am required to draw attention in my auditor's report to the related disclosures in the Financial Statements or, if such disclosures are inadequate, to modify my opinion. My conclusions are based on the audit evidence obtained up to the date of my auditor's report. However, future events or conditions may cause the Group to cease to continue as a going concern.
• Evaluate the overall presentation, structure and content of the Financial Statements, including the disclosures, and whether the Financial Statements represent the underlying transactions and events in a manner that achieves fair presentation.
I communicate with those charged with governance regarding, among other matters, significant audit findings, including any significant deficiencies in internal control that I identify during my audit.
2. Report on Other Legal and Regulatory Requirements
National Audit Act, No. 19 of 2018 includes specific provisions for following requirements.
• I have obtained all the information and explanation that required for the audit and as far as appears from my examination, proper accounting records have been kept by the Bank as per the requirement of section 12 (a) of National Audit Act, No. 19 of 2018.
• The Financial Statements presented is consistent with the preceding year as per the requirement of section 6 (1) (d) (iii) of the National Audit Act, No. 19 of 2018.
• The Financial Statements presented includes all the recommendations made by me in the previous year as per the requirement of section 6 (1) (d) (iv) of the National Audit Act, No. 19 of 2018.
Based on the procedures performed and evidence obtained were limited to matters that are material, nothing has come to my attention;
• to state that any member of the governing body of the Bank has any direct or indirect interest in any contract entered into by the Bank which are out of the normal course of business as per the requirement of section 12 (d) of the National Audit Act, No. 19 of 2018;
• to state that the Bank has not complied with any applicable written law, general and special directions issued by the governing body of the Bank as per the requirement of section 12 (f) of the National Audit Act, No. 19 of 2018;
• to state that the Bank has not performed according to its powers, functions and duties as per the requirement of section 12 (g) of the National Audit Act, No. 19 of 2018;
• to state that the resources of the Bank had not been procured and utilized economically, efficiently and effectively within the time frames and in compliance with the applicable laws as per the requirement of section 12 (h) of the National Audit Act, No. 19 of 2018.
W.P.C. WickramaratneAuditor General

BA
NK
OF
CE
YL
ON
AN
NU
AL
RE
PO
RT
20
19
150
About this Report / Performance Highlights 2019 / Chairman’s Message / General Manager’s Review / Organisational Overview / Strategic Report / Performance and Outlook / Stakeholder Value Creation / Financial Reports / Compliance Annexes / Supplementary Information
Statement of Profit or LossBank Group
For the year ended 31 December Note 2019Restated
2018 Change 2019Restated
2018 Change
LKR ’000 LKR ’000 % LKR ’000 LKR ’000 %
Total income 7
239,116,469
221,020,693 8.2
248,692,003
229,351,138 8.4
Interest income 220,477,174 195,393,970 12.8 227,377,777 201,809,401 12.7
Less : Interest expenses 145,330,696 129,835,996 11.9 149,082,891 133,119,922 12.0
Net interest income 8 75,146,478 65,557,974 14.6 78,294,886 68,689,479 14.0
Fee and commission income 14,569,762 12,917,022 12.8 14,969,583 13,305,501 12.5
Less : Fee and commission expenses 2,472,955 2,246,512 10.1 2,512,206 2,260,623 11.1
Net fee and commission income 9 12,096,807 10,670,510 13.4 12,457,377 11,044,878 12.8
Net gains/ (losses) from trading 10 2,535,301 3,431,822 (26.1) 2,555,256 3,468,191 (26.3)
Net fair value gains/(losses) from financial instruments at fair value through profit or loss 11 321,789 (681,365) 147.2 342,807 (717,194) 147.8
Net gains/(losses) from derecognition of financial assets 12 282,260 152,029 85.7 292,812 153,240 91.1
Net other operating income 13 930,183 9,807,215 (90.5) 3,153,768 11,331,999 (72.2)
Total operating income 91,312,818 88,938,185 2.7 97,096,906 93,970,593 3.3
Less : Impairment charge/ (reversal) for loans and other losses 14 18,597,725 15,040,961 23.6 18,719,243 15,176,472 23.3
Net operating income 72,715,093 73,897,224 (1.6) 78,377,663 78,794,121 (0.5)
Less : Operating expenses
Personnel expenses 15 18,365,029 17,351,465 5.8 20,213,082 19,076,846 6.0
Depreciation and amortisation expenses 3,704,004 2,200,294 68.3 3,775,144 2,813,469 34.2
Other expenses 16 10,440,209 11,341,068 (7.9) 12,911,506 13,133,953 (1.7)
Total operating expenses 32,509,242 30,892,827 5.2 36,899,732 35,024,268 5.4
Operating profit/ (loss) before Taxes on financial services 40,205,851 43,004,397 (6.5) 41,477,931 43,769,853 (5.2)
Less : Taxes on financial services 17.1 10,520,624 9,588,312 9.7 10,850,549 9,818,020 10.5
Operating profit/ (loss) after Taxes on financial services 29,685,227 33,416,085 (11.2) 30,627,382 33,951,833 (9.8)
Share of profits/ (losses) of associate companies, net of tax 18 - - - 48,187 9,269 419.9
Profit/ (loss) before income tax 29,685,227 33,416,085 (11.2) 30,675,569 33,961,102 (9.7)
Less : Income tax expense 17.2 6,587,192 12,413,425 (46.9) 6,928,234 12,922,017 (46.4)
Profit/ (loss) for the year 23,098,035 21,002,660 10.0 23,747,335 21,039,085 12.9
Profit attributable to :
Equity holder of the Bank 23,098,035 21,002,660 10.0 23,452,040 21,056,794 11.4
Non-controlling interest - - - 295,295 (17,709) 1,767.5
Profit/ (loss) for the year 23,098,035 21,002,660 10.0 23,747,335 21,039,085 12.9
Earnings per share and Dividend per share 19
Basic earnings per share (LKR) 971.85 1,126.52 (13.7) 986.74 1,129.42 (12.6)
Diluted earnings per share (LKR) 923.92 986.61 (6.4) 938.08 989.15 (5.2)
Dividend per share (LKR) 14.58 259.95 (94.4) 14.58 259.95 (94.4)
The Notes to the Financial Statements from pages 160 to 338 form an integral part of these Financial Statements.

151
About this Report / Performance Highlights 2019 / Chairman’s Message / General Manager’s Review / Organisational Overview / Strategic Report / Performance and Outlook / Stakeholder Value Creation / Financial Reports / Compliance Annexes / Supplementary Information
Statement of Comprehensive Income Bank Group
For the year ended 31 December 2019Restated
2018 Change 2019Restated
2018 Change
LKR ’000 LKR ’000 % LKR ’000 LKR ’000 %
Profit/ (loss) for the year 23,098,035 21,002,660 10.0 23,747,335 21,039,085 12.9
Items that will be reclassified to the profit or loss
Exchange differences on translation of foreign operations (142,361) 1,110,869 (112.8) (55,239) 1,453,215 (103.8)
Net gains/ (losses) on investments in debt instruments measured at fair value through other comprehensive income 76,949 (271,351) 128.4 79,550 (285,389) 127.9
Net (gains)/ losses on investment in financial assets at fair value through OCI reclassification to profit or loss 231,126 (15,232) 1,617.4 231,126 (15,232) 1,617.4
Deferred tax effect on above (80,282) - - (80,282) - -
Share of other comprehensive income of Associate companies, net of tax - - - (7,078) 3,464 (304.3)
Total items that will be reclassified to the profit or loss 85,432 824,286 (89.6) 168,077 1,156,058 (85.5)
Items that will not be reclassified to profit or loss
Change in fair value on investments in equity instruments designated at fair value through other comprehensive income 54,970 (410,168) (113.4) 14,446 (823,954) (101.8)
Deferred tax effect on above (144,356) (6,711) 2,051.0 (144,356) (6,711) 2,051.0
Gains/ (Losses) of derecognition of investments in equity instruments designated at fair value through other comprehensive income 15,295 - - 15,295 - -
Changes in revaluation surplus/ (deficit) - (337,522) (100.0) 790,887 147,397 436.6
Deferred tax effect on above - 94,506 (100.0) (221,448) (41,271) 436.6
Net actuarial gains/ (losses) on defined benefit plans
(12,666,432) (1,818,864) 596.4 (12,704,271) (1,790,314) 609.6
Deferred tax effect on above 16,379 3,050 437.0 34,000 (9,530) (456.8)
Total items that will not be reclassified to the profit or loss
(12,724,144) (2,475,709) 414.0
(12,215,447) (2,524,383) 383.9
Other comprehensive income for the year, net of tax (12,638,712) (1,651,423) 665.3 (12,047,370) (1,368,325) 780.4
Total comprehensive income for the year 10,459,323 19,351,237 (46.0) 11,699,965 19,670,760 (40.5)
Attributable to:
Equity holder of the Bank 10,459,323 19,351,237 (46.0) 11,382,536 19,691,187 (42.2)
Non-controlling interest - - - 317,429 (20,427) (1,654.0)
Total comprehensive income for the year 10,459,323 19,351,237 (46.0) 11,699,965 19,670,760 (40.5)
The Notes to the Financial Statements from pages 160 to 338 form an integral part of these Financial Statements.

BA
NK
OF
CE
YL
ON
AN
NU
AL
RE
PO
RT
20
19
152
About this Report / Performance Highlights 2019 / Chairman’s Message / General Manager’s Review / Organisational Overview / Strategic Report / Performance and Outlook / Stakeholder Value Creation / Financial Reports / Compliance Annexes / Supplementary Information
Statement of Financial PositionBank Group
As at 31 December Note 2019Restated
2018 Change 2019Restated
2018 Change
LKR ’000 LKR ’000 % LKR ’000 LKR ’000 %
Assets
Cash and cash equivalents 21 64,868,895 78,447,577 (17.3) 64,829,735 78,558,031 (17.5)
Balances with Central Banks 22 54,594,436 65,680,371 (16.9) 54,594,436 65,680,371 (16.9)
Placements with banks 23 44,476,343 40,450,089 10.0 47,911,621 41,681,910 14.9
Securities purchased under resale agreements 24 2,179,449 - - 3,981,886 1,436,068 177.3
Derivative financial instruments 25 132,090 1,205,657 (89.0) 132,090 1,205,657 (89.0)
Financial assets recognised through profit or loss - measured at fair value 26 10,055,415 9,277,298 8.4 11,052,769 9,583,327 15.3
Financial assets at amortised cost
- loans and advances 27 1,549,804,871 1,429,107,181 8.4 1,580,949,025 1,460,618,588 8.2
- debt and other instruments 28 572,747,809 551,839,449 3.8 573,977,330 553,033,150 3.8
Financial assets measured at fair value through OCI 29 14,236,090 16,699,582 (14.8) 17,016,553 19,338,783 (12.0)
Investment in subsidiary companies 30 6,513,048 6,513,048 - - - -
Investment in associate companies 31 92,988 92,988 - 447,035 441,226 1.3
Investment properties 32 2,648,784 2,765,856 (4.2) 117,276 120,182 (2.4)
Property, Plant and Equipment 33 25,579,065 24,178,155 5.8 39,486,380 37,762,509 4.6
Right of Use Assets/ Leasehold properties 34 3,479,937 98,899 3,418.7 2,187,622 130,500 1,576.3
Intangible assets 35 1,127,007 1,238,186 (9.0) 1,361,858 1,456,630 (6.5)
Deferred tax assets 36 - - - 511,936 3,052 16,673.8
Other assets 37 62,580,402 57,236,737 9.3 63,926,060 58,549,569 9.2
Total assets 2,415,116,629 2,284,831,073 5.7 2,462,483,612 2,329,599,553 5.7
Liabilities
Due to banks 38 2,669,407 2,402,468 11.1 2,932,950 2,515,998 16.6
Securities sold under repurchase agreements 39 34,183,210 97,399,359 (64.9) 34,880,507 97,423,302 (64.2)
Derivative financial instruments 40 106,677 509,018 (79.0) 106,677 509,018 (79.0)
Financial liabilities at amortised cost
- due to depositors 41 2,005,211,794 1,770,974,846 13.2 2,025,204,033 1,789,924,369 13.1
- other borrowings 42 137,833,543 201,792,174 (31.7) 145,095,262 207,053,674 (29.9)
Debt securities issued 43 - - - 2,107,810 4,105,681 (48.7)
Current tax liabilities 44 - 3,922,189 (100.0) 138,677 4,039,380 (96.6)
Deferred tax liabilities 36 4,592,021 5,073,526 (9.5) 7,182,866 7,762,214 (7.5)
Insurance provision - Life 45 - - - 511,091 575,625 (11.2)
Insurance provision - Non life 45 - - - 358,504 366,618 (2.2)
Other liabilities 46 34,015,688 19,760,430 72.1 34,758,044 21,970,739 58.2
Subordinated liabilities 48 54,221,552 50,827,239 6.7 54,211,542 50,484,487 7.4
Total liabilities 2,272,833,892 2,152,661,249 5.6 2,307,487,963 2,186,731,105 5.5

153
About this Report / Performance Highlights 2019 / Chairman’s Message / General Manager’s Review / Organisational Overview / Strategic Report / Performance and Outlook / Stakeholder Value Creation / Financial Reports / Compliance Annexes / Supplementary Information
Bank Group
As at 31 December Note 2019Restated
2018 Change 2019Restated
2018 Change
LKR ’000 LKR ’000 % LKR ’000 LKR ’000 %
Equity
Share capital 49 25,000,000 25,000,000 - 25,000,000 25,000,000 -
Permanent reserve fund 50 13,383,000 12,890,000 3.8 13,383,000 12,890,000 3.8
Retained earnings 51 87,689,480 78,061,681 12.3 89,140,565 79,179,548 12.6
Other reserves 52 16,210,257 16,218,143 0.0 25,686,997 25,103,751 2.3
Total equity attributable to equity holder of the Bank 142,282,737 132,169,824 7.7 153,210,562 142,173,299 7.8
Non-controlling interest 53 - - - 1,785,087 695,149 156.8
Total equity 142,282,737 132,169,824 7.7 154,995,649 142,868,448 8.5
Total liabilities and equity 2,415,116,629 2,284,831,073 5.7 2,462,483,612 2,329,599,553 5.7
Contingent liabilities and commitments 55 508,217,961 508,306,808 0.0 516,632,979 513,192,419 0.7
Net assets value per share (LKR) 49 5,691.31 6,608.49 (13.9) 6,128.42 7,108.66 (13.8)
The Notes to the Financial Statements from pages 160 to 338 form an integral part of these Financial Statements.
These Financial Statements give a true and fair view of the state of affairs of Bank of Ceylon and the Group as at 31 December 2019 and its profit for the year then ended.
W P Russel FonsekaChief Financial Officer
The Board of Directors is responsible for the preparation and presentation of these Financial Statements.
Approved and signed for and on behalf of the Board,
Kanchana Ratwatte Lalith P Withana D P K GunasekeraChairman Director Actg. General Manager
24 March 2020 Colombo

BA
NK
OF
CE
YL
ON
AN
NU
AL
RE
PO
RT
20
19
154
About this Report / Performance Highlights 2019 / Chairman’s Message / General Manager’s Review / Organisational Overview / Strategic Report / Performance and Outlook / Stakeholder Value Creation / Financial Reports / Compliance Annexes / Supplementary Information
Statement of Changes In EquityBank
Other reserves
Capital
Share Pending Permanent Available for FVOCI Other Revaluation Retained
Note Capital Allotment Reserve Fund Sale Reserve Reserve Reserves Reserve Earnings Total Equity
LKR '000 LKR '000 LKR '000 LKR '000 LKR '000 LKR '000 LKR '000 LKR '000 LKR '000
Balance as at 1 January 2018 15,000,000 5,000,000 10,427,000 3,718,526 - 1,570,810 11,966,489 63,472,250 111,155,075
Impact of adopting SLFRS 9 as at 1 January 2018 - - - (3,718,526) 2,541,656 - - (9,562,471) (10,739,341)
Deferred tax on transitional adjustment - - - - - - - 3,345,868 3,345,868
Retirement benefit adjustment as at 1 January 2018 - - - - - - - 8,903,395 8,903,395
Restated opening balance as at 1 January 2018 15,000,000 5,000,000 10,427,000 - 2,541,656 1,570,810 11,966,489 66,159,042 112,664,997
Total comprehensive income for the year
Profit for the year - - - - - - - 21,002,660 21,002,660
Other comprehensive income, net of tax - - - - (703,462) 1,110,869 (243,016) (1,815,814) (1,651,423)
Total comprehensive income for the year - - - - (703,462) 1,110,869 (243,016) 19,186,846 19,351,237
Transactions with equity holder, recognised directly in equity
Dividends for 2018 19.3 - - - - - - - (4,846,410) (4,846,410)
Transfers to share capital 49.1 5,000,000 (5,000,000) - - - - - - -
Capital infusion during the year 49.1 - 5,000,000 - - - - - - 5,000,000
Transfers to permanent reserve fund 50 - - 2,463,000 - - - - (2,463,000) -
Revaluation surplus of disposed property - - - - - - (25,203) 25,203 -
Total transactions with equity holder 5,000,000 - 2,463,000 - - - (25,203) (7,284,207) 153,590
Balance as at 31 December 2018 20,000,000 5,000,000 12,890,000 - 1,838,194 2,681,679 11,698,270 78,061,681 132,169,824
Balance as at 1 January 2019 20,000,000 5,000,000 12,890,000 - 1,838,194 2,681,679 11,698,270 78,061,681 132,169,824
Total comprehensive income for the year
Profit for the year - - - - - - - 23,098,035 23,098,035
Other comprehensive income, net of tax - - - - 138,407 (142,361) - (12,634,758) (12,638,712)
Total comprehensive income for the year - - - - 138,407 (142,361) - 10,463,277 10,459,323
Transactions with equity holder, recognised directly in equity
Dividends for 2019 19.3 - - - - - - - (346,410) (346,410)
Transfers to share capital 49.1 5,000,000 (5,000,000) - - - - - - -
Transfers to permanent reserve fund 50 - - 493,000 - - - - (493,000) -
Revaluation surplus of disposed property - - - - - - (3,932) 3,932 -
Total transactions with equity holder 5,000,000 (5,000,000) 493,000 - - - (3,932) (835,478) (346,410)
Balance as at 31 December 2019 25,000,000 - 13,383,000 - 1,976,601 2,539,318 11,694,338 87,689,480 142,282,737
The Notes to the Financial Statements from pages 160 to 338 form an integral part of these Financial Statements.

155
About this Report / Performance Highlights 2019 / Chairman’s Message / General Manager’s Review / Organisational Overview / Strategic Report / Performance and Outlook / Stakeholder Value Creation / Financial Reports / Compliance Annexes / Supplementary Information
Bank
Other reserves
Capital
Share Pending Permanent Available for FVOCI Other Revaluation Retained
Note Capital Allotment Reserve Fund Sale Reserve Reserve Reserves Reserve Earnings Total Equity
LKR '000 LKR '000 LKR '000 LKR '000 LKR '000 LKR '000 LKR '000 LKR '000 LKR '000
Balance as at 1 January 2018 15,000,000 5,000,000 10,427,000 3,718,526 - 1,570,810 11,966,489 63,472,250 111,155,075
Impact of adopting SLFRS 9 as at 1 January 2018 - - - (3,718,526) 2,541,656 - - (9,562,471) (10,739,341)
Deferred tax on transitional adjustment - - - - - - - 3,345,868 3,345,868
Retirement benefit adjustment as at 1 January 2018 - - - - - - - 8,903,395 8,903,395
Restated opening balance as at 1 January 2018 15,000,000 5,000,000 10,427,000 - 2,541,656 1,570,810 11,966,489 66,159,042 112,664,997
Total comprehensive income for the year
Profit for the year - - - - - - - 21,002,660 21,002,660
Other comprehensive income, net of tax - - - - (703,462) 1,110,869 (243,016) (1,815,814) (1,651,423)
Total comprehensive income for the year - - - - (703,462) 1,110,869 (243,016) 19,186,846 19,351,237
Transactions with equity holder, recognised directly in equity
Dividends for 2018 19.3 - - - - - - - (4,846,410) (4,846,410)
Transfers to share capital 49.1 5,000,000 (5,000,000) - - - - - - -
Capital infusion during the year 49.1 - 5,000,000 - - - - - - 5,000,000
Transfers to permanent reserve fund 50 - - 2,463,000 - - - - (2,463,000) -
Revaluation surplus of disposed property - - - - - - (25,203) 25,203 -
Total transactions with equity holder 5,000,000 - 2,463,000 - - - (25,203) (7,284,207) 153,590
Balance as at 31 December 2018 20,000,000 5,000,000 12,890,000 - 1,838,194 2,681,679 11,698,270 78,061,681 132,169,824
Balance as at 1 January 2019 20,000,000 5,000,000 12,890,000 - 1,838,194 2,681,679 11,698,270 78,061,681 132,169,824
Total comprehensive income for the year
Profit for the year - - - - - - - 23,098,035 23,098,035
Other comprehensive income, net of tax - - - - 138,407 (142,361) - (12,634,758) (12,638,712)
Total comprehensive income for the year - - - - 138,407 (142,361) - 10,463,277 10,459,323
Transactions with equity holder, recognised directly in equity
Dividends for 2019 19.3 - - - - - - - (346,410) (346,410)
Transfers to share capital 49.1 5,000,000 (5,000,000) - - - - - - -
Transfers to permanent reserve fund 50 - - 493,000 - - - - (493,000) -
Revaluation surplus of disposed property - - - - - - (3,932) 3,932 -
Total transactions with equity holder 5,000,000 (5,000,000) 493,000 - - - (3,932) (835,478) (346,410)
Balance as at 31 December 2019 25,000,000 - 13,383,000 - 1,976,601 2,539,318 11,694,338 87,689,480 142,282,737
The Notes to the Financial Statements from pages 160 to 338 form an integral part of these Financial Statements.

BA
NK
OF
CE
YL
ON
AN
NU
AL
RE
PO
RT
20
19
156
About this Report / Performance Highlights 2019 / Chairman’s Message / General Manager’s Review / Organisational Overview / Strategic Report / Performance and Outlook / Stakeholder Value Creation / Financial Reports / Compliance Annexes / Supplementary Information
Group
Attributable to equity holder of the Bank
Capital Other reserves
Share Pending Permanent Available for FVOCI Other Revaluation Retained Non Controlling
Note Capital Allotment Reserve Fund Sale Reserve Reserve Reserves Reserve Earnings Interest Total Equity
LKR '000 LKR '000 LKR '000 LKR '000 LKR '000 LKR '000 LKR '000 LKR '000 LKR '000 LKR '000
Balance as at 1 January 2018 15,000,000 5,000,000 10,427,000 4,760,616 - 2,429,373 18,681,265 65,100,871 927,375 122,326,500
Impact of adopting SLFRS 9 as at 1 January 2018 - - - (4,760,616) 3,583,746 - - (10,369,633) (276,422) (11,822,925)
Deferred tax on transitional adjustments - - - - - - - 3,571,637 77,317 3,648,954
Retirement benefit adjustment as at 1 January 2018 - - - - - - - 8,903,395 - 8,903,395
Balance as at 1 January 2018 15,000,000 5,000,000 10,427,000 - 3,583,746 2,429,373 18,681,265 67,206,270 728,270 123,055,924
Total comprehensive income for the year
Profit for the year - - - - - - - 21,056,794 (17,709) 21,039,085
Other comprehensive income, net of tax - - - (1,109,292) 1,453,215 90,647 (1,800,177) (2,718) (1,368,325)
Total comprehensive income for the year - - - - (1,109,292) 1,453,215 90,647 19,256,617 (20,427) 19,670,760
Transactions with equity holders, recognised directly in equity
Dividends for 2018 19.3 - - - - - - - (4,846,410) - (4,846,410)
Subsidiary dividends to non controlling interest - - - - - - - - (12,694) (12,694)
Transfer to share capital 49.1 5,000,000 (5,000,000) - - - - - - - -
Capital infusion during the year 49.1 - 5,000,000 - - - - - - - 5,000,000
Transfers to permanent reserve fund 50 - - 2,463,000 - - - - (2,463,000) - -
Revaluation surplus of disposed property - - - - - - (25,203) 25,203 - -
Reversal of unclaimed dividend - - - - - - - 868 - 868
Total transactions with equity holders 5,000,000 - 2,463,000 - - - (25,203) (7,283,339) (12,694) 141,764
Balance as at 31 December 2018 20,000,000 5,000,000 12,890,000 - 2,474,454 3,882,588 18,746,709 79,179,548 695,149 142,868,448
Balance as at 1 January 2019 20,000,000 5,000,000 12,890,000 - 2,474,454 3,882,588 18,746,709 79,179,548 695,149 142,868,448
Total comprehensive income for the year
Profit for the year - - - - - - - 23,452,040 295,295 23,747,335
Other comprehensive income, net of tax - - - - 97,370 (55,239) 545,047 (12,656,682) 22,134 (12,047,370)
Total comprehensive income for the year - - - - 97,370 (55,239) 545,047 10,795,358 317,429 11,699,965
Transactions with equity holders, recognised directly in equity
Dividends for 2019 19.3 - - - - - - - (346,410) - (346,410)
Subsidiary dividends to non controlling interest - - - - - - - - (18,490) (18,490)
Transfer to share capital 49.1 5,000,000 (5,000,000) - - - - - - - -
Transfers to permanent reserve fund 50 - - 493,000 - - - - (493,000) - -
Revaluation surplus of disposed property - - - - - - (3,932) 3,932 - -
Loss of control of subsidiaries - - - - - - - - 790,999 790,999
Reversal of unclaimed dividend - - - - - - - 1,137 - 1,137
Total transactions with equity holders 5,000,000 (5,000,000) 493,000 - - - (3,932) (834,341) 772,509 427,236
Balance as at 31 December 2019 25,000,000 - 13,383,000 - 2,571,824 3,827,349 19,287,824 89,140,565 1,785,087 154,995,649
The Notes to the Financial Statements from pages 160 to 338 form an integral part of these Financial Statements.
Statement of Changes In Equity

157
About this Report / Performance Highlights 2019 / Chairman’s Message / General Manager’s Review / Organisational Overview / Strategic Report / Performance and Outlook / Stakeholder Value Creation / Financial Reports / Compliance Annexes / Supplementary Information
Group
Attributable to equity holder of the Bank
Capital Other reserves
Share Pending Permanent Available for FVOCI Other Revaluation Retained Non Controlling
Note Capital Allotment Reserve Fund Sale Reserve Reserve Reserves Reserve Earnings Interest Total Equity
LKR '000 LKR '000 LKR '000 LKR '000 LKR '000 LKR '000 LKR '000 LKR '000 LKR '000 LKR '000
Balance as at 1 January 2018 15,000,000 5,000,000 10,427,000 4,760,616 - 2,429,373 18,681,265 65,100,871 927,375 122,326,500
Impact of adopting SLFRS 9 as at 1 January 2018 - - - (4,760,616) 3,583,746 - - (10,369,633) (276,422) (11,822,925)
Deferred tax on transitional adjustments - - - - - - - 3,571,637 77,317 3,648,954
Retirement benefit adjustment as at 1 January 2018 - - - - - - - 8,903,395 - 8,903,395
Balance as at 1 January 2018 15,000,000 5,000,000 10,427,000 - 3,583,746 2,429,373 18,681,265 67,206,270 728,270 123,055,924
Total comprehensive income for the year
Profit for the year - - - - - - - 21,056,794 (17,709) 21,039,085
Other comprehensive income, net of tax - - - (1,109,292) 1,453,215 90,647 (1,800,177) (2,718) (1,368,325)
Total comprehensive income for the year - - - - (1,109,292) 1,453,215 90,647 19,256,617 (20,427) 19,670,760
Transactions with equity holders, recognised directly in equity
Dividends for 2018 19.3 - - - - - - - (4,846,410) - (4,846,410)
Subsidiary dividends to non controlling interest - - - - - - - - (12,694) (12,694)
Transfer to share capital 49.1 5,000,000 (5,000,000) - - - - - - - -
Capital infusion during the year 49.1 - 5,000,000 - - - - - - - 5,000,000
Transfers to permanent reserve fund 50 - - 2,463,000 - - - - (2,463,000) - -
Revaluation surplus of disposed property - - - - - - (25,203) 25,203 - -
Reversal of unclaimed dividend - - - - - - - 868 - 868
Total transactions with equity holders 5,000,000 - 2,463,000 - - - (25,203) (7,283,339) (12,694) 141,764
Balance as at 31 December 2018 20,000,000 5,000,000 12,890,000 - 2,474,454 3,882,588 18,746,709 79,179,548 695,149 142,868,448
Balance as at 1 January 2019 20,000,000 5,000,000 12,890,000 - 2,474,454 3,882,588 18,746,709 79,179,548 695,149 142,868,448
Total comprehensive income for the year
Profit for the year - - - - - - - 23,452,040 295,295 23,747,335
Other comprehensive income, net of tax - - - - 97,370 (55,239) 545,047 (12,656,682) 22,134 (12,047,370)
Total comprehensive income for the year - - - - 97,370 (55,239) 545,047 10,795,358 317,429 11,699,965
Transactions with equity holders, recognised directly in equity
Dividends for 2019 19.3 - - - - - - - (346,410) - (346,410)
Subsidiary dividends to non controlling interest - - - - - - - - (18,490) (18,490)
Transfer to share capital 49.1 5,000,000 (5,000,000) - - - - - - - -
Transfers to permanent reserve fund 50 - - 493,000 - - - - (493,000) - -
Revaluation surplus of disposed property - - - - - - (3,932) 3,932 - -
Loss of control of subsidiaries - - - - - - - - 790,999 790,999
Reversal of unclaimed dividend - - - - - - - 1,137 - 1,137
Total transactions with equity holders 5,000,000 (5,000,000) 493,000 - - - (3,932) (834,341) 772,509 427,236
Balance as at 31 December 2019 25,000,000 - 13,383,000 - 2,571,824 3,827,349 19,287,824 89,140,565 1,785,087 154,995,649
The Notes to the Financial Statements from pages 160 to 338 form an integral part of these Financial Statements.

BA
NK
OF
CE
YL
ON
AN
NU
AL
RE
PO
RT
20
19
158
About this Report / Performance Highlights 2019 / Chairman’s Message / General Manager’s Review / Organisational Overview / Strategic Report / Performance and Outlook / Stakeholder Value Creation / Financial Reports / Compliance Annexes / Supplementary Information
Statement of Cash FlowsBank Group
For the year ended 31 December Note 2019Restated
2018 2019Restated
2018
LKR ’000 LKR ’000 LKR ’000 LKR ’000
Cash flows from operating activities
Profit before income tax 29,685,227 33,416,085 30,675,569 33,961,102
Adjustments for:
Net interest income 8 (75,146,478) (65,557,974) (78,294,886) (68,689,479)
Dividend income on trading securities 10 (96,309) (101,877) (97,092) (113,255)
Dividends from subsidiaries and associates 13 (345,585) (309,685) - -
Share of (profits)/ losses of associate companies, net of tax 18 - - (48,187) (9,269)
Change in operating assets 54.1 (123,777,345) (287,382,119) (126,506,700) (293,021,355)
Change in operating liabilities 54.2 176,310,288 287,120,953 180,103,954 293,183,636
Other non-cash items included in profit before tax 54.3 23,347,090 6,773,377 23,991,568 7,494,037
Other net gains from investing activities 604,049 529,336 635,619 563,954
30,580,937 (25,511,904) 30,459,845 (26,630,629)
Benefit paid from defined benefit plans (8,375,632) (7,614,197) (8,440,117) (7,659,660)
Interest received 154,261,084 133,563,506 161,145,280 140,171,940
Interest paid (129,479,004) (116,192,643) (132,815,732) (118,562,407)
Dividends received 96,309 101,877 97,092 113,255
Net cash from/ (used in) operating activities before income tax 47,083,694 (15,653,361) 50,446,368 (12,567,501)
Income tax paid 44 (10,870,994) (10,136,932) (11,174,355) (10,389,879)
Net cash from/ (used in) operating activities 36,212,700 (25,790,293) 39,272,013 (22,957,380)
Cash flows from investing activities
Net increase in financial assets at amortised cost (21,107,321) (30,883,224) (22,219,557) (29,323,684)
Net (increase)/ decrease in financial assets measured at fair value through OCI 1,923,846 (292,866) 2,755,046 (4,151,530)
Purchase of Property, Plant and Equipment and leasehold properties (3,386,478) (3,399,832) (3,711,782) (3,569,916)
Purchase of intangible assets (317,483) (783,598) (394,389) (790,386)
Proceeds from sale of Property, Plant and Equipment 77,270 101,050 183,306 216,988
Dividends received 659,522 598,053 348,398 325,908
Interest received 47,770,628 46,327,625 48,246,461 46,696,256
Net cash from/ (used in) investing activities 25,619,984 11,667,208 25,207,483 9,403,636

159
About this Report / Performance Highlights 2019 / Chairman’s Message / General Manager’s Review / Organisational Overview / Strategic Report / Performance and Outlook / Stakeholder Value Creation / Financial Reports / Compliance Annexes / Supplementary Information
Bank Group
For the year ended 31 December Note 2019Restated
2018 2019Restated
2018
LKR ’000 LKR ’000 LKR ’000 LKR ’000
Cash flows from financing activities
Net increase/ (decrease) in other borrowings (69,863,965) 24,715,392 (70,338,490) 21,670,556
Proceeds from issue of shares - 5,000,000 - 5,000,000
Proceeds from issue of debentures 9,210,000 12,000,000 9,210,000 12,000,000
Payments on redemption of debentures (6,166,475) (4,090,400) (8,165,598) (5,650,894)
Dividends paid to Equity holders of the Bank (346,410) (4,846,410) (346,410) (4,846,410)
Dividends paid to non-controlling interest - - (18,490) (12,694)
Interest payments on borrowings and debt securities (8,733,722) (12,795,159) (9,188,023) (13,920,739)
Net cash from/ (used in) financing activities (75,900,572) 19,983,423 (78,847,011) 14,239,819
Net increase/ (decrease) in cash and cash equivalents during the year (14,067,888) 5,860,338 (14,367,515) 686,075
Cash and cash equivalents at the beginning of the year 77,591,846 71,731,508 77,588,770 76,902,695
Cash and cash equivalents at the end of the year 63,523,958 77,591,846 63,221,255 77,588,770
Analysis of cash and cash equivalents
Cash and cash equivalents 21 64,868,895 78,447,577 64,829,735 78,558,031
Bank overdrafts 38 (1,344,937) (855,731) (1,608,480) (969,261)
Cash and cash equivalents at the end of the year 63,523,958 77,591,846 63,221,255 77,588,770
The Notes to the Financial Statements from pages 160 to 338 form an integral part of these Financial Statements.

BA
NK
OF
CE
YL
ON
AN
NU
AL
RE
PO
RT
20
19
160
About this Report / Performance Highlights 2019 / Chairman’s Message / General Manager’s Review / Organisational Overview / Strategic Report / Performance and Outlook / Stakeholder Value Creation / Financial Reports / Compliance Annexes / Supplementary Information
1.0 Reporting Entity
1.1 Corporate Information
Bank of Ceylon (“The Bank”) is a Government-owned bank domiciled in Sri Lanka, duly incorporated on 1 August 1939 under the Bank of Ceylon Ordinance No. 53 of 1938. It is a licensed commercial bank established under the Banking Act No. 30 of 1988 and amendments thereto. The Registered Office of the Bank is situated at No. 01, “BOC Square”, Bank of Ceylon Mawatha, Colombo 01, Sri Lanka. The debentures issued by the Bank are listed on the Colombo Stock Exchange. The staff strength of the Bank as at 31 December 2019 was 8,503 (2018 - 8,724).
1.2 Consolidated Financial Statements
The Consolidated Financial Statements are prepared as at and for the year ended 31 December 2019 comprise the Bank (“Parent”), its Subsidiaries (together referred to as the “Group” and individually as “Group Entities”) and the Group’s interests in its Associate companies. The Financial Statements of the companies in the Group have a common financial year which ends on 31 December, except the Associate companies, Transnational Lanka Records Solutions (Private) Limited and Ceybank Asset Management Limited. The Bank is the ultimate parent of the Group.
1.3 Principal Activities
1.3.1 Bank
The principal activities of the Bank during the year were, personal banking, corporate banking, development banking,
off-shore banking, trade financing, lease financing, primary dealing, investment banking and wealth management, treasury operations, correspondent banking and money remittances, Islamic banking, bancassurance, pawning, credit card facilities, foreign currency operations and other financial services.
1.3.2 Subsidiaries
The principal activities of the Subsidiaries of the Bank are as follows:
Name of the Company Principal Business Activities
Property Development PLC Own, maintain and manage, develop and
sustain the utility and value of the Bank of
Ceylon head office building.
Merchant Bank of Sri Lanka &
Finance PLC
Leasing, hire purchase, corporate and
retail credit facilities, corporate advisory
services, capital market operations,
margin trading, micro-financing,
agricultural credit facilities,
real estate, pawning, Islamic finance and
accepting deposits.
BOC Management & Support
Services (Private) Limited
Not in operation and in the process of
liquidation.
BOC Property Development &
Management (Private) Limited
Renting of office space of BOC Merchant
Tower in Colombo 03 and Ceybank
House in Kandy.
BOC Travels (Private) Limited Engages in travel related services.
Hotels Colombo (1963) Limited Provides hotel services.
Ceybank Holiday Homes
(Private) Limited
Managing, operating and maintaining of
travel rests/ hotels/ rest houses/ guest
houses.
MBSL Insurance Company
Limited
Carrying on insurance business, both life
and non-life insurance.
Koladeniya Hydropower (Private)
Limited
Hydropower generation.
Bank of Ceylon (UK) Limited Authorised commercial bank by the
Prudential Regulation Authority and
regulated by the Financial Conduct
Authority in England and Wales, engages
in retail and corporate banking, treasury
operations, correspondent banking
services and trade financing activities.
Notes to the Financial Statements

161
About this Report / Performance Highlights 2019 / Chairman’s Message / General Manager’s Review / Organisational Overview / Strategic Report / Performance and Outlook / Stakeholder Value Creation / Financial Reports / Compliance Annexes / Supplementary Information
1.3.3 Associates
The principal activities of the Associates of the Bank are as follows:
Name of the Company Principal Business Activities
Ceybank Asset Management
Limited
Management of unit trust funds and other
institutional and private portfolios.
Lanka Securities (Private) Limited Registered stock broker, trading in equity
and debt securities, equity debt security
brokering and undertaking placement of
equity and debt securities.
Transnational Lanka Records
Solutions (Private) Limited
Renting buildings and hiring other assets.
Southern Development Financial
Company Limited
Not in operation and in the process of
liquidation.
There were no significant changes in the nature of principal activities of the Bank, Subsidiaries and Associates during the year under review. BOC Management & Support Services (Private) Limited (MSS) has not carried out its core business activities since 2007 and the Board of Directors of the Bank has granted the approval to wind-up the company. Southern Development Financial Company Limited (SDFCL) is also not in operations. The Board of Directors of SDFCL has decided to wind-up the company and it is in the process of liquidation.
2. Directors’ Responsibility for Financial Statements
2.1 Preparation and Presentation of the Financial Statements
The Board of Directors is responsible for the preparation and presentation of the Financial Statements of the Bank and its Subsidiaries and Associates in compliance with the requirements of the Bank of Ceylon Ordinance No. 53 of 1938 and its amendments, Banking Act No. 30 of 1988 and its amendments thereto and Sri Lanka Accounting Standards (SLFRSs and LKASs).
These Financial Statements comprise
• Statement of Profit or Loss
• Statement of Comprehensive Income
• Statement of Financial Position
• Statement of Changes in Equity
• Statement of Cash Flows
• Notes to the Financial Statements
2.2 Approval of Financial Statements
The Financial Statements for the year ended 31 December 2019 were authorised for issue on 24 March 2020 by the Board of Directors.
3. Basis of Preparation
3.1 Statement of Compliance
The Consolidated Financial Statements of the Group and the separate Financial Statements of the Bank have been prepared in accordance with Sri Lanka Accounting Standards comprising of Sri Lanka Financial Reporting Standards (SLFRSs) and Sri Lanka Accounting Standards (LKASs) laid down by the Institute of Chartered Accountants of Sri Lanka (together referred to as SLFRSs in these Financial Statements).
The preparation and presentation of these Financial Statements are in compliance with the requirements of the Bank of Ceylon Ordinance No. 53 of 1938, the Banking Act No. 30 of 1988 and the Companies Act No. 07 of 2007. The Group has prepared Financial Statements which comply with SLFRSs applicable for the year ended 31 December 2019, together with the comparative year data as at and for the year ended 31 December 2018, as described in the accounting policies.
The formats used in the preparation and presentation of the Financial Statements and the disclosures made therein also comply with the specified formats prescribed by the Central Bank of Sri Lanka (CBSL) in the Circular No. 02 of 2019 on “Publication of Annual and Quarterly Financial Statements and Other Disclosures by Licensed Banks”.
3.2 Basis of Measurement
The Financial Statements have been prepared on the basis of historical cost convention and no adjustments have been made

BA
NK
OF
CE
YL
ON
AN
NU
AL
RE
PO
RT
20
19
Notes to the Financial Statements162
About this Report / Performance Highlights 2019 / Chairman’s Message / General Manager’s Review / Organisational Overview / Strategic Report / Performance and Outlook / Stakeholder Value Creation / Financial Reports / Compliance Annexes / Supplementary Information
for inflationary factors which has been applied on a consistent basis, except for the following:
• Derivative financial instruments are measured at fair value (Notes 25 and 40)
• Financial assets recognised through profit or loss - measured at fair value (Note 26)
• Financial assets measured at fair value through OCI (Note 29)
• Owner-occupied freehold land and buildings and buildings on leasehold lands are measured at revalued amount less any subsequent accumulated depreciation and impairment losses (Note 33)
• Defined benefit obligations are actuarially valued and recognised at the present value of the defined benefit obligation less total of the fair value of plan assets (Note 47)
3.3 Presentation of Financial Statements
Items in the Statement of Financial Position of the Bank and the Group are grouped by nature of such item and presented broadly in order of their relative liquidity and maturity pattern. An analysis regarding recovery or settlement within 12 months after the Reporting date (current) and more than 12 months after the Reporting date (non-current) is presented in Note 58 - “Maturity Analysis of Assets and Liabilities”.
3.3.1 Functional and Presentation
Currency
Items included in the Financial Statements are measured and presented in Sri Lankan Rupees (“LKR”) which is the functional currency of the primary economic environment in which the Bank operates.
3.3.2 Accrual Basis of Accounting
The Financial Statements, except for information on Statement of Cash Flows have been prepared following the accrual basis of accounting.
3.3.3 Offsetting
Financial assets and financial liabilities are generally reported gross in the Statement of Financial Position. They are only offset and reported net when, in addition to having an unconditional legally enforceable right to offset the recognised amounts without being contingent on a future event, the parties also intend to settle on a net basis in all of the following circumstances:
• The normal course of business.
• The event of default.
• The event of insolvency or bankruptcy of the Bank/ Group and/or its counterparties.
Income and expenses are not offset in the Statement of Profit or Loss unless required or permitted by any accounting standard or interpretation and as specifically disclosed in the accounting policies of the Group.
3.3.4 Comparative Information
The comparative information is provided in narrative and descriptive nature, if it is relevant to understand the current period’s Financial Statements and reclassified wherever necessary to conform to the current year’s presentation. However, the Group has not restated comparative information for 2018 for Leases within the scope of SLFRS 16- “Leases”. Therefore, the comparative information for 2018 is reported under LKAS 17-
“Leases” and is not comparable to the information presented for 2019.
3.3.5 Materiality and Aggregation
In compliance with LKAS 1 – “Presentation of Financial Statements”, each material class of similar items are presented separately in the Financial Statements. Items of dissimilar nature or functions are presented separately unless they are immaterial.
3.3.6 Rounding
The amounts in the Financial Statements have been rounded-off to the nearest Rupees thousands, except where otherwise indicated as permitted by the LKAS 1- “Presentation of Financial Statements”.
3.3.7 Statement of Cash Flow
The Statement of Cash Flow is prepared by using the “Indirect Method” in accordance with the LKAS 7- “Statement of Cash Flows” whereby the profit is adjusted to derive the cash flows from operating activities. Cash and cash equivalents comprise cash in hand, other short term highly liquid investments with maturity less than seven days from date of acquisition and bank overdrafts.
3.3.8 Use of Significant Accounting
Judgements, Estimates and
Assumptions
The preparation of the Financial Statements requires management to exercise judgements, estimates and assumptions that affect the application of accounting policies and the reported amounts of assets, liabilities, income and expenses. Actual results may differ from

About this Report / Performance Highlights 2019 / Chairman’s Message / General Manager’s Review / Organisational Overview / Strategic Report / Performance and Outlook / Stakeholder Value Creation / Financial Reports / Compliance Annexes / Supplementary Information
163
these estimates. The judgements, estimates and assumptions are based on historical experience and various other factors that are believed to be reasonable under the circumstances and reviewed on an ongoing basis. Revisions to accounting estimates are recognised in the period in which the estimates are revised and/ or in future periods if the revision affects future periods too. In the process of applying the Group’s accounting policies, management has made the following judgements, estimates and assumptions, which have the most significant effect on the amounts recognised in the Financial Statements. The accounting policies which are most sensitive to the use of judgements, estimates and assumptions are specified below.
3.3.8.1 Going Concern
The Management has made an assessment on the Group’s ability to continue as a going concern and is satisfied that it has the resources to continue in business for the foreseeable future. Furthermore, management is not aware of any material uncertainties that may cast significant doubt upon the Group’s ability to continue as a going concern. Therefore, the Financial Statements continue to be prepared on the going concern basis.
3.3.8.2 Commitment and Contingent
Liabilities
All discernible risks are accounted for in determining the amount of all known and measurable liabilities. Contingent liabilities are possible obligations whose existence will be confirmed only
by uncertain future events or present obligations where the transfer of economic benefit is not probable or cannot be reliably measured. Contingent liabilities are not recognised in the Statement of Financial Position but are disclosed unless its considered remote that the Group will be liable to settle the possible obligation.
3.3.8.3 Fair Value of Financial
Instruments
Fair value is the price that would be received to sell an asset or paid to transfer a liability in an orderly transaction between market participants at the measurement date.
Where the classification of a financial asset or liability results in it being measured at fair value, wherever possible, the fair value is determined by reference to the quoted bid or offer price in the most advantageous active market to which the Group has immediate access. An adjustment for credit risk is also incorporated into the fair value as appropriate. Fair value for a net open position that is a financial liability quoted in an active market is the current offer price, and for a financial asset the bid price, multiplied by the number of units of the instrument held or issued.
Where no active market exists for a particular asset or liability, the Group uses a valuation technique that include the use of mathematical models to arrive at the fair value, including the use of transaction prices obtained in recent arm’s length transactions, discounted cash flow analysis, option pricing models and other valuation techniques based on
market conditions and risks existing at Reporting date. In doing so, fair value is estimated using a valuation technique that makes maximum use of observable market inputs and places minimal reliance upon entity-specific inputs.
The best evidence of the fair value of a financial instrument at initial recognition is the transaction price (i.e. the fair value of the consideration given or received) unless the fair value of that instrument is evidenced by comparison with other observable current market transactions in the same instrument (i.e. without modification or repackaging) or based on a valuation technique whose variables include only data from observable markets. When such evidence exists, the Group recognises the difference between the transaction price and the fair value in Profit or Loss on initial recognition (i.e. on day one). The valuations of financial instruments are described comprehensively in Note 61.
3.3.8.4 Impairment Charge for Loans
and Advances
The measurement of impairment charge under SLFRS 9 - “Financial Instruments” requires judgement by management in identification and estimation of the amount and timing of future cash flows when determining an impairment charge for loans and advances.
Accordingly, the Group reviews its individually significant loans and advances at each reporting date to assess whether an impairment charge should be provided in the Statement of Profit or Loss.
BA
NK
OF
CE
YL
ON
AN
NU
AL
RE
PO
RT
20
19
Notes to the Financial Statements164
About this Report / Performance Highlights 2019 / Chairman’s Message / General Manager’s Review / Organisational Overview / Strategic Report / Performance and Outlook / Stakeholder Value Creation / Financial Reports / Compliance Annexes / Supplementary Information
In particular, the Management’s judgement is required in identification and estimation of the amount and timing of future cash flows when determining the impairment loss.
In estimating these cash flows, the Group makes judgements about the borrower’s financial position, the net realisable value of collateral and other related factors. These estimates are based on assumptions about a number of factors and actual results may differ, resulting in future changes to the impairment allowance.
A collective impairment provision is established for the groups of homogeneous loans and advances that are not considered individually significant and groups of loans that are individually significant but that were not found to be individually impaired. A collective assessment of impairment takes into account the data from loan portfolio (such as credit quality, levels of arrears, credit utilization, etc.), concentrations of risk and economic data (including levels of Unemployment, Inflation, GDP growth rate and Country rating) and the Performance of different individual group.
The impairment requirements in SLFRS 9 - “Financial Instruments” are based on an Expected Credit Loss (ECL) model and it is reflected the general pattern of deterioration, or improvement, in the credit quality of financial instruments. The Group calculates ECLs either on a collective or an individual basis. The amount of ECLs recognised as a loss allowance or
provision depends on the extent of credit deterioration since initial recognition and measured under following bases:
• 12-month ECLs (stage 1),
which apply to all items as long as there is no significant deterioration in credit risk.
• Lifetime ECLs (stages 2 and 3),
which apply when a significant increase in credit risk has occurred on an individual or collective basis.
Further, the Group makes additional judgements and estimates with regard to the following under ECL model.
• The Group’s criteria for assessing if there has been a significant increase in credit risk and so impairment for financial assets should be measured on a Lifetime ECL basis.
• Development of ECL models, including various formula and the choice of inputs.
• Determination of association between macro-economic inputs, such as GDP growth, inflation, interest rates, exchange rates and unemployment with the effect on Probability of Default (PDs), Exposure At Default (EAD) and Loss Given Default (LGD).
• Selection of forward-looking macro-economic scenarios and their probability weightings to derive the economic inputs into the ECL model.
As per SLFRS 9 - “Financial Instruments”, the collective provision for groups of homogeneous loans is established using statistical methods or, a formula approach based on historical loss rate experience, using the statistical analysis of historical data on delinquency to estimate the amount of loss. Management applies judgement to ensure that the estimate of loss arrived at, on the basis of historical information is appropriately adjusted to reflect the economic conditions and portfolio factors as at the Reporting date. The loss rates are regularly reviewed against actual loss experience.
It has been the Group’s policy to regularly review its model in the context of actual loss experience and adjust when necessary. The accuracy of the provision depends on the model assumptions and parameters used in determining the impairment. Details of impairment losses on loans and advances are given in Note 14.
3.3.8.5 Impairment of Investment in
Subsidiaries, Other Financial
Assets and Non- Financial
Assets
The Group and the Bank follow the guidance of LKAS 36 – “Impairment of Assets” and SLFRS 9 - “Financial Instruments” in determining whether an investment or a financial asset is impaired. Determination and identification of impairment indicators require the Group and the Bank to evaluate duration and extent to which the fair value of an investment for a financial asset is less than its cost and the financial stability of the near term business outlook of

About this Report / Performance Highlights 2019 / Chairman’s Message / General Manager’s Review / Organisational Overview / Strategic Report / Performance and Outlook / Stakeholder Value Creation / Financial Reports / Compliance Annexes / Supplementary Information
165
the investment or the financial asset, considering the factors such as performance of the sector and industry, technology and operational environmental changes along with future cash flows. This process involves with significant judgement in aforesaid areas.
3.3.8.6 Defined Benefit Obligation
The cost of the defined benefit pension plans and other post- employment benefit plans are determined using an actuarial valuation. An actuarial valuation involves making various assumptions determining the discount rates, expected rates of return on assets, future salary increases, mortality rates and future pension increases. Due to the long-term nature of these plans, such estimates are subject to significant uncertainty.
In determining the appropriate discount rate, the Group considers the interest rates of Sri Lanka Government Bonds with maturities corresponding to the expected duration of the Defined Benefit Obligation. The mortality rate is based on publicly available mortality tables. Future salary increases and pension increases are based on expected future inflation rate and expected future salary increase rates of the Group. All assumptions are reviewed at each Reporting date and assumptions used in the year are given in Note 47.
3.3.8.7 Fair Value of Land and Buildings
The freehold land and buildings and the buildings on leasehold land of the Group are reflected at fair value less accumulated depreciation. The Group engaged independent valuation specialists
to determine fair value of such properties in terms of the SLFRS 13 – “Fair Value Measurement”. The details of valuation of freehold land and buildings and the buildings on leasehold land are given in Note 33.
3.3.8.8 Useful Life of the Property, Plant
and Equipment and Intangible
Assets
The Group reviews the residual values, useful lives and methods of depreciation of Property, Plant and Equipment and intangible assets at each Reporting date. Judgement of the management is exercised in the estimation of these values, rates, methods and hence they are subject to uncertainty. The details of the depreciation methods and rates used for each assets category are given in Note 33.
3.3.8.9 Classification of Investment
Properties
Management is required to use its judgement to determine whether a property qualified as an investment property. A property that is held to earn rentals or for capital appreciation or both and which generates cash flows largely independently of the other assets held by the Group are accounted for as investment properties. On the other hand, properties that are used for operations or for the process of providing services or for administration purposes and which do not directly generate cash flows as stand-alone assets are accounted as Property, Plant and Equipment.
3.3.8.10 Determination of Control Over
Investees
Subsidiaries are entities that are controlled by the Bank, control
is achieved when the Bank is exposed, or has rights to variable returns from its involvement with the invitee and has the ability to affect the returns of those investees through its power over the investee. The Management applies its judgements to determine the Bank controls over its investees.
3.3.8.11 Taxation
The Group is subject to income tax, Value Added Tax (VAT), Nation Building Tax (NBT), Debt Repayment Levy (DRL) and other applicable taxes.
A judgement is required to determine the total provision for current, deferred and other taxes due to the uncertainties that exists with respect to the interpretation of the applicable tax laws at the time of preparing these Financial Statements. The details on the applicable tax rates and other information are given under Notes 4.9, 17 and 36.
The Group is subject to transfer pricing regulations and it is necessitated using management judgement to determine the impact of transfer pricing regulations. Accordingly, critical judgements and estimates were used in applying the regulations in aspects including but not limited to identifying associated undertakings, estimation of the respective arm’s length prices and selection of appropriate pricing mechanism.
The current tax charge is subject to such judgements. Differences between estimated income tax charge and actual payable may arise as a result of variances between Management’s

BA
NK
OF
CE
YL
ON
AN
NU
AL
RE
PO
RT
20
19
Notes to the Financial Statements166
About this Report / Performance Highlights 2019 / Chairman’s Message / General Manager’s Review / Organisational Overview / Strategic Report / Performance and Outlook / Stakeholder Value Creation / Financial Reports / Compliance Annexes / Supplementary Information
interpretation and application of tax regulation.
4. Significant Accounting PoliciesThe significant accounting policies applied by the Bank and the Group in preparation of its Financial Statements are included below and have been consistently applied to all periods presented in the Financial Statements of the Group and the Bank, unless otherwise indicated.
4.1 New/ Amendments to
Accounting Standards Effective
from 1 January 2019
In these Financial Statements, the Group has applied SLFRS 16 - “Leases”, which are effective for the annual Reporting periods beginning on or after 1 January 2019, for the first time. The Group has not early adopted any other standard, interpretation or amendment that has been issued but not effective.
4.1.1 Leases
4.1.1.1 Initial Recognition and
Measurement.
Lessee is required to recognise a right-of-use asset representing its right to use the underlying leased asset and a lease liability representing its obligation to make lease payments in the Statement of Financial Position.
Lessee measures right-of-use assets similarly to other non-financial assets (such as Property, Plant and Equipment) and lease liabilities similarly to other financial liabilities. Consequently, a lessee recognises amortisation of the right-of-use asset and interest on the lease liability.
Assets and liabilities arising from a lease are initially measured on a present value basis. The initial lease asset equals the lease liability in most cases.
At lease commencement, a lessee accounts for two elements:
(a) Right-of-use asset: Initially, a right-of-use asset is measured in the amount of the lease liability and initial direct costs. Then it is adjusted by the lease payments made before or on commencement date, lease incentives received, and any estimate of dismantling and restoration costs.
(b) Lease liability: The lease liability is in fact all payments not paid at the commencement date discounted to present value using the interest rate implicit in the lease or incremental borrowing rate if the implicit rate cannot be determined. These payments may include fixed payments, variable payments, payments under residual value guarantees, purchase price if purchase option will be exercised.
4.1.1.2 Subsequent Measurement
After commencement date, lessee needs to adjust both elements recognised initially. Lessee accretes the lease liability to reflect interest and reduce the liability to reflect lease payments made.
Right-of-Use Asset
Lessee shall measure the right-of-use asset using a cost model and depreciate the asset over
the lease term on a straight-line basis. The resulted depreciation amount is charged to the Statement of Profit or Loss.
Lease liability
Lessee shall recognise an interest on the lease liability and the lease payments are recognised as a reduction of the lease liability. Interest on lease liability is charged to the Statement of Profit or Loss.
Lessee shall re-measure the lease liability upon the occurrence of certain events (e.g. change in the lease term, change in variable rents based on an index or rate), which is generally recognised as an adjustment to the right-of-use asset.
Lessee can apply alternative subsequent measurement bases for the right-of-use asset under certain circumstances in accordance with LKAS 16 - “Property Plant and Equipment” and LKAS 40 - “Investment Property”. Right-of-use assets are subject to impairment testing under LKAS 36 - “Impairment of Assets”, too.
4.2 Basis of Consolidation
The Group’s Financial Statements comprise consolidation of the Financial Statements of the Bank and its Subsidiaries in terms of SLFRS 10 – “Consolidated Financial Statements” and LKAS 27 – “Separate Financial Statements” and the proportionate share of the profit or loss and net assets of its Associates in terms of the Sri Lanka Accounting Standard LKAS 28 – “Investments in Associates and Joint Ventures”.

About this Report / Performance Highlights 2019 / Chairman’s Message / General Manager’s Review / Organisational Overview / Strategic Report / Performance and Outlook / Stakeholder Value Creation / Financial Reports / Compliance Annexes / Supplementary Information
167
The Bank’s Financial Statements comprise the amalgamation of the Financial Statements of the Domestic Banking Unit, the Off-shore Banking Unit and the Overseas Operations of the Bank.
The detailed accounting policies pertaining to the consolidation of Subsidiaries and Associates are given in the Notes 30 and 31.
4.2.1 Business Combinations
The Group determines whether a transaction or other event is a business combination by applying the definition in SLFRS 3 – “Business Combination”, which requires that the assets acquired and liabilities assumed constitute a business. Business combinations are accounted for using the acquisition method. As of the acquisition date, the amount of non-controlling interest is measured either at fair value or at the non-controlling interests’ proportionate share of the acquirer’s identifiable net assets.
Acquisition related cost are costs the acquirer incurs to effect a business combination. Those costs include finder’s fees, advisory, legal, accounting, valuation, other professional consulting fees, general administrative costs including the cost of maintaining an Internal Acquisition Department and cost of registering and issuing debt and equity securities. Acquisition related costs, other than those associated with the issue of debt or equity securities are expensed in the periods in which the costs are incurred and the services are received. The Group elects on a transaction by transaction basis whether to measure non-controlling interests at its fair value or at its proportionate
share of the recognised amount of the identifiable net assets, at the acquisition date. Transaction costs, other than those associated with the issue of debt or equity securities that the Group incurs in connection with a business combination are expensed as incurred.
4.2.2 Loss of Control
When the Group loses control over a Subsidiary, it derecognises the assets and liabilities of the Subsidiary, and any related Non-Controlling Interest (NCI) and other components of equity. Any resulting gain or loss is recognised in Profit or Loss. Any interest retained in the former Subsidiary is measured at fair value when control is lost. Further, the Bank’s share of components previously recognised in Other Comprehensive Income (OCI) is reclassified to Profit or Loss or retained earnings as appropriate. Any surplus or deficit arising on the loss of control is recognised in the Profit or Loss. If the Group retains any interest in the previous Subsidiary, then such interest is measured at fair value at the date that control is lost. Subsequently, it is accounted for as an equity-accounted investee or in accordance with the Group’s accounting policy for financial instruments depending on the level of influence retained.
4.3 Foreign Currency Translations
4.3.1 Foreign Currency Transactions
and Balances
At the initial recognition, transactions in foreign currency are translated into the functional currency of the operation which is Sri Lankan Rupees (LKR) at the spot exchange rate at the date of the transaction. Monetary assets
and liabilities denominated in foreign currency at the Reporting date are retranslated into the functional currency at the spot exchange rate at that date and all differences arising on non-trading activities are taken to “Net other operating income” (Note 13) in the Statement of Profit or Loss.
Non-monetary assets and liabilities that are measured in terms of historical cost in a foreign currency are translated using the exchange rate at the date of the initial recognition. Non-monetary assets and liabilities denominated in foreign currency that are measured at fair value are retranslated into the functional currency at the spot exchange rate including any exchange gain or loss component at the date on which the fair value is determined. Gain or loss on a non-monetary item including exchange component is recognised in Other Comprehensive Income. Forward exchange contracts are valued at the forward market rates ruling on the Reporting date and resulting net unrealised gains or losses are dealt within the Statement of Profit or Loss.
4.3.2 Foreign Operations
The results and financial position of foreign operations, whose functional currencies are not Sri Lankan Rupees, are translated into Sri Lankan Rupees as follows:
The assets and liabilities of foreign operations are translated into Sri Lankan Rupees at spot exchange rate as at the Reporting date. The income and expenses of foreign operations are translated at average rate for the period. Foreign currency

BA
NK
OF
CE
YL
ON
AN
NU
AL
RE
PO
RT
20
19
Notes to the Financial Statements168
About this Report / Performance Highlights 2019 / Chairman’s Message / General Manager’s Review / Organisational Overview / Strategic Report / Performance and Outlook / Stakeholder Value Creation / Financial Reports / Compliance Annexes / Supplementary Information
differences on the translation of foreign operations are recognised in Other Comprehensive Income.
When a foreign operation is disposed of, the relevant amount in the translation reserve is transferred to the Profit or Loss as part of the Profit or loss on disposal in other operating income or other operating expenses.
4.4 Classification of Financial Instruments between Debt and Equity
Classification of financial instruments between debt and equity depends on following characteristics of such instruments:
• Name or labels given to the instruments
• Presence or absence of a fixed maturity date
• Life of the instrument
• Source of payments
• Right to enforce payments
• Rights to participate in Management
• Risk involved in the instruments
• Volatility of cash flows
• Securities given as collaterals
4.5 Financial Assets and Financial Liabilities
4.5.1 Recognition and Derecognition
of Financial Instruments
All financial assets and liabilities are initially recognised on the settlement date, i.e. the date that the Group becomes a party to the contractual provisions of the instrument. This includes; “regular way trades”. Regular way trade means purchases or sales of financial assets that require delivery of assets within the
time frame generally established by regulation or convention in the market place. Loans and receivables are recognised when cash is advanced (or settled) to the borrowers. Financial assets at fair value through profit or loss are recognised initially at fair value. All other financial assets are recognised initially at fair value plus directly attributable transaction costs.
The Group derecognises a financial asset when the contractual cash flows from the asset expire or it transfers its rights to receive contractual cash flows on the financial asset in a transaction in which substantially all the risks and rewards of ownership are transferred. Any interest in transferred financial assets that is created or retained by the Group is recognised as a separate asset or liability.
A financial liability is derecognised when the obligation
under the liability is discharged or cancelled or expired. Where an existing financial liability is replaced by another from the same lender on substantially different terms, or the terms of an existing liability are substantially modified, such an exchange or modification is treated as a derecognition of the original liability and the recognition of a new liability. The difference between the carrying value of the original financial liability and the consideration paid is recognised in the Statement of Profit or Loss.
4.5.2 Classification of Financial Assets and Financial Liabilities
As per SLFRS 9 - “Financial Instruments”, the classification depends on the Group’s business model for managing financial assets and the contractual terms of the financial assets’ cash flows.
The following diagram depicts how the Bank classifies the financial assets.
Derivative Instrument
Debt Instrument
Held for trading
Elected the irrecoverable option
of OCI?
Fair value through other comprehensive income
Fair value through profit or loss
Amortised cost
Held to collect cash flow
Held to collect cash flows
and for sale
Held for trading
Equity Instrument
Yes
Yes
Yes
No
No
Fair value option elected ?
Solely Payments of Principle and Interest (SPPI) ?
No

About this Report / Performance Highlights 2019 / Chairman’s Message / General Manager’s Review / Organisational Overview / Strategic Report / Performance and Outlook / Stakeholder Value Creation / Financial Reports / Compliance Annexes / Supplementary Information
169
4.5.2.1 At the Inception, the Financial
Assets are Classified in One of
the Following Categories:
• Financial assets measured at fair value through profit or loss (Note 4.5.7 and 26)
• Financial assets at amortised cost
- Financial assets at amortised cost - loans and advances (Note 27)
- Financial assets at amortised cost - debt and other instruments (Note 4.5.8 and 28)
• Financial assets measured at fair value through Other Comprehensive Income (Note 4.5.9 and 29)
4.5.2.2 At the Inception, the Financial
Liabilities are Classified in One
of the Following Categories:
• Financial liabilities at amotised cost
- Financial liabilities at amortisd cost – due to depositors (Note 41)
- Financial liabilities at amortised cost - other borrowings and subordinated instruments (Note 42 and 48)
4.5.3 Initial Measurements of Financial
Instruments
Financial assets and liabilities are initially measured at their fair value plus transaction cost, except in the case of financial assets and liabilities recorded at fair value through profit or loss. Transaction cost in relation to financial assets and liabilities at fair value through profit or loss
are dealt with in the Statement of Profit or Loss.
4.5.4 “Day One” Profit or Loss
When the transaction price differs from the fair value of other observable current market transactions in the same instrument or based on a valuation technique whose variables include only data from observable markets, the Group immediately recognises the difference between the transaction price and fair value (a “Day One” Profit or Loss) in the Statement of Profit or Loss. In cases where fair value is determined using data which is not observable, the difference between the transaction price and model value is only recognised in the Statement of Profit or Loss over the life of the instrument.
4.5.5 Business Model Assessment
With effect from 1 January 2018, as per SLFRS 9 - “Financial Instruments”, the Group classifies all of its financial assets based on the business model and makes an assessment of the objective of a business model in which an asset is held at a portfolio level and not assessed on instrument-by- instrument basis because this best reflects the way the business is managed and information is provided to management. The information considered includes:
• The stated policies and objectives for the portfolio and the operation of those policies in practice. In particular, whether management’s strategy focuses on earning contractual interest revenue,
maintaining a particular interest rate profile, matching the duration of the financial assets to the duration of the liabilities that are funding those assets or realising cash flows through the sale of the assets;
• How the performance of the portfolio is evaluated and reported to the Bank’s management;
• The risks that affect the performance of the business model (and the financial assets held within that business model) and how those risks are managed;
• How managers of the business are compensated
– e.g. whether compensation is based on the fair value of the assets managed or the contractual cash flows collected; and
• The frequency, volume and timing of sales in prior periods, the reasons for such sales and its expectations about future sales activity. However, information about sales activity is not considered in isolation, but as part of an overall assessment of how the Bank’s stated objective for managing the financial assets is achieved and how cash flows are realised.
The business model assessment is based on reasonably expected scenarios without taking ‘worst case’ or ‘stress case’ scenarios into account. If cash flows after initial recognition are realised in a way that is different from the Bank’s original expectations,

BA
NK
OF
CE
YL
ON
AN
NU
AL
RE
PO
RT
20
19
Notes to the Financial Statements170
About this Report / Performance Highlights 2019 / Chairman’s Message / General Manager’s Review / Organisational Overview / Strategic Report / Performance and Outlook / Stakeholder Value Creation / Financial Reports / Compliance Annexes / Supplementary Information
the Bank does not change the classification of the remaining financial assets held in that business model, but incorporates such information when assessing newly originated or newly purchased financial assets going forward.
4.5.6 Assessment of whether
Contractual Cash Flow
Characteristics are met the
Solely Payments of Principal and
Interest (SPPI) test
As a second step of assets classification process, the Group assesses the contractual terms of financial assets to identify whether they meet the SPPI test.
For the purposes of this assessment, “principal” is defined as the fair value of the financial asset on initial recognition and may change over the life of the financial asset (for example, if there are repayments of principal or amortisation of the premium/ discount).
“Interest” is defined as consideration for the time value of money and for the credit risk associated with the principal amount outstanding during a particular period of time and for other basic lending risks and costs, as well as profit margin.
In contrast, contractual terms that introduce a more than deminimise exposure to risks or volatility in the contractual cash flows that are unrelated to a basic lending arrangement do not give rise to contractual cash flows that are solely payments of principal and interest on the principal amount outstanding. In such cases, the financial asset is required to be measured at fair value through profit and loss.
In assessing whether the contractual cash flows are solely payments of principal and interest on principal amount outstanding, the Group considers the contractual terms of the instrument. This includes assessing whether the financial asset contains a contractual term that could change the timing or amount of contractual cash flows such that it would not meet this condition. In making the assessment, the Group considers:
• Contingent events that would change the amount and timing of cash flows;
• Leverage features;
• Prepayment and extension terms;
• Terms that limit the Group’s claim to cash flows from specified assets; and
• Features that modify consideration of the time value of money
4.5.7 Financial Assets Measured at
Fair Value through Profit or Loss
Items at fair value through profit or loss comprise:
• Items held for trading purpose;
• Items specifically designated as fair value through profit or loss on initial recognition; and
• Debt instruments with contractual terms that do not terms that do not represent solely payments of principal and interest.
Financial instruments held at fair value through profit or loss are
initially recognised at fair value, with transaction costs recognised in the Statement of Profit or Loss as incurred. Subsequently, they are measured at fair value and any gains or losses are recognised in the Statement of Profit or Loss as they arise.
Where a financial asset is measured at fair value, a credit valuation adjustment is included to reflect the credit worthiness of the counterparty, representing the movement in fair value attributable to changes in credit risk.
4.5.7.1 Financial Instruments Held for
Trading purpose
A financial instrument is classified as held for trading if it is acquired or incurred principally for the purpose of selling or repurchasing in the near term, or forms part of a portfolio of financial instruments that are managed together and for which there is evidence of short-term profit taking, or it is a derivative not in a qualifying hedge relationship.
Trading derivatives and trading securities are classified as held for trading and recognised at fair value in the Statement of Financial Position. Changes in fair value are recognised in “Net gains/ (losses) from trading” (Note 10) and “Net fair value gains/ (losses) from financial instruments at fair value through profit or loss” (Note 11). Interest income from financial instruments held for trading is recorded under net interest income (Note 8) while dividend income is recorded in net gains/ (losses) from trading (Note 10) when the right to payment has been established.

About this Report / Performance Highlights 2019 / Chairman’s Message / General Manager’s Review / Organisational Overview / Strategic Report / Performance and Outlook / Stakeholder Value Creation / Financial Reports / Compliance Annexes / Supplementary Information
171
4.5.7.2 Financial Instruments
Designated and Measured at
Fair Value through Profit or Loss
Upon initial recognition, financial instruments may be designated and measured at fair value through profit or loss. A financial asset may only be designated at fair value through profit or loss if doing so eliminates or significantly reduces measurement or recognition inconsistencies (i.e. eliminates an accounting mismatch) that would otherwise arise from measuring financial assets or liabilities on a different basis.
A financial liability may be designated at fair value through profit or loss if it eliminates or significantly reduces an accounting mismatch or:
• If a host contract contains one or more embedded derivatives; or
• If financial assets and liabilities are both managed and their performance evaluated on a fair value basis in accordance with a documented risk management or investment strategy.
Where a financial liability is designated at fair value through profit or loss, the movement in fair value attributable to changes in the Group’s own credit quality is calculated by determining the changes in credit spreads above observable market interest rates and is presented separately in other comprehensive income.
As of 31 December 2019, there were no any financial liability designated at fair value through profit or loss.
4.5.7.3 Debt instruments with
Contractual Terms that do not
Represent the Solely Payments
of Principal and Interest
Financial debt instruments which are not meet solely payments of principal and interest test will be classified as fair value through profit or loss.
4.5.8 Financial Assets Measured
at Amortised Cost-Debt
Instruments
Investments in debt instruments are measured at amortised cost where they have:
• Contractual terms that give rise to cash flows on specified dates, that represent solely payments of principal and interest on the principal amount outstanding; and
• Are held within a business model whose objective is achieved by holding to collect contractual cash flows.
These debt instruments are initially recognised at fair value plus directly attributable transaction costs and subsequently measured at amortised cost using Effective Interest Rate (EIR). The measurement of credit impairment is based on the three stage expected credit loss model described below in Note 4.5.11 Impairment of financial assets.
4.5.9 Financial Assets Measured
at Fair Value through Other
Comprehensive Income
4.5.9.1 Debt instruments
Investments in debt instruments are measured at fair value through Other Comprehensive Income where they have:
• Contractual terms that give rise to cash flows on specified dates, that represent solely payments of principal and interest on the principal amount outstanding; and
• Are held within a business model whose objective is achieved by both collecting contractual cash flows and selling financial assets.
These debt instruments are initially recognised at fair value plus directly attributable transaction costs and subsequently measured at fair value. Gains and losses arising from changes in fair value are included in Other Comprehensive Income within a separate component of equity. Impairment losses or reversals, interest revenue and foreign exchange gains and losses are recognised in Profit or Loss. Upon disposal, the cumulative gain or loss previously recognised in Other Comprehensive Income is reclassified from Other Comprehensive Income to Profit or Loss.
The measurement of credit impairment is based on the three stage expected credit loss model as applied to financial assets at amortised cost. The expected credit loss model is described below in Note 4.5.11 Impairment of financial assets.
4.5.9.2 Equity Instruments
Investment in equity instruments that are neither held for trading nor contingent consideration recognised by the Group in a business combination to which SLFRS 3- “Business Combinations” applies, are measured at fair value through

BA
NK
OF
CE
YL
ON
AN
NU
AL
RE
PO
RT
20
19
Notes to the Financial Statements172
About this Report / Performance Highlights 2019 / Chairman’s Message / General Manager’s Review / Organisational Overview / Strategic Report / Performance and Outlook / Stakeholder Value Creation / Financial Reports / Compliance Annexes / Supplementary Information
Other Comprehensive Income, where an irrevocable election has been made by management. For portfolios where management does not consider an irrevocable election of adopting fair value through other comprehensive income, by default such investments shall be measured at fair value through profit or loss.
Upon de-recognition, the cumulative gain or loss recognised in Other Comprehensive Income are not transferred to Profit or Loss. However, cumulative gain or loss recognised full derecognition will be transferred from Other Comprehensive Income reserve to retained earnings within the equity. Dividends on such investments are recognised in “Net other operating income” (Note 13) in the Profit or Loss.
4.5.10 Reclassification of Financial
Assets
The Group reclassifies its financial assets when, and only when, the Group changes its business model for managing financial assets. If the Group reclassifies financial assets which were measured at amortised cost, fair value through other comprehensive income or fair value through profit or loss, the Group applies the reclassification prospectively from the reclassification date. The Group does not re-state any previously recognised gains, losses (including impairment losses) or interest.
The table below summaries the treatment of gains and losses on reclassification.
Initial
Measurement
Measurement after
reclassification
Treatment on reclassification
Fair value
through profit
or loss
Amortised cost Fair value at the reclassification date becomes
its new gross carrying amount. The effective
interest rate is calculated on the basis of
that amount. For the purpose of applying the
impairment requirements, the reclassification
date is treated as the date of initial application.
Fair value
through profit
or loss
Fair value
through other
comprehensive
income
The fair value of the financial asset at the
reclassification date becomes its new carrying
amount and the effective interest rate is
determined on the basis of the fair value of the
asset at the reclassification date.
Fair value
through other
comprehensive
income
Amortised cost The cumulative gain or loss previously
recognised in Other Comprehensive Income
is removed from equity and adjusted against
the fair value of the financial asset at the
reclassification date. The effective interest
rate and the measurement of expected credit
losses are not adjusted as a result of the
reclassification.
Fair value
through other
comprehensive
income
Fair value through
profit or loss
The fair value of the financial asset at the
reclassification date becomes its new carrying
amount. The cumulative gain or loss previously
recognised in Other Comprehensive Income is
reclassified from equity to Profit or Loss as a
reclassification adjustment at the reclassification
date.
Amortised cost Fair value through
profit or loss
Any gain or loss arising from a difference
between the previous amortised cost of
the financial asset and fair value at the
reclassification date is recognised in Profit or
Loss.
Amortised cost Fair value
through other
comprehensive
income
Any gain or loss arising from a difference
between the previous amortised cost of
the financial asset and fair value at the
reclassification date is recognised in Other
Comprehensive Income. The effective interest
rate and the measurement of expected credit
losses are not adjusted as a result of the
reclassification.

About this Report / Performance Highlights 2019 / Chairman’s Message / General Manager’s Review / Organisational Overview / Strategic Report / Performance and Outlook / Stakeholder Value Creation / Financial Reports / Compliance Annexes / Supplementary Information
173
4.5.11 Impairment of Financial Assets
The Group applies a three-stage approach in measuring Expected Credit Loss (ECL) for the following categories of financial assets that are not measured at fair value through profit or loss:
• Debt instruments measured at amortised cost and fair value through other comprehensive income;
• Loan commitments; and
• Financial guarantee contracts.
No ECL is recognised on equity investments.
The Group performs an assessment at the end of each Reporting period, of whether a financial instrument’s credit risk has increased significantly since initial recognition, by considering the change in the risk of default occurring over the remaining life of the financial instrument. Based on this process financial assets migrate through the following three stages based on the change in credit risk since initial recognition:
4.5.11.1 Stage 1: 12-months ECL
For exposures where there has not been a significant increase in credit risk since initial recognition and that are not credit impaired upon origination, the portion of the lifetime ECL associated with the probability of default events occurring within the next 12 months is recognised. The Bank determines 12 months ECL from customers whom are not significantly credit deteriorated.
4.5.11.2 Stage 2: Lifetime ECL
For exposures where there has
been a significant increase in credit risk since initial recognition but are not credit impaired, a lifetime ECL (i.e. reflecting the remaining lifetime of the financial asset) is recognised.
4.5.11.3 Stage 3: Lifetime ECL
Exposures are assessed as credit impaired when one or more events that have a detrimental impact on the estimated future cash flows of that asset have occurred. For exposures that have become credit impaired, a lifetime ECL is recognised and interest revenue is calculated by applying the effective interest rate to the amortised cost (net of provision) rather than the gross carrying amount.
4.5.11.4 Calculation of ECL
The Group calculates ECL based on a three probability weighted scenarios to measure the expected cash shortfalls, discounted at an approximation to the Effective Interest Rate (EIR). A cash shortfall is the difference between the cash flows that are due to an entity in accordance with the contract and the cash flows that the entity expects to receive.
The mechanics of the ECL calculations of the Group are outlined below and the key elements are, as follows:
• Probability of Default (PD)
PD is an estimate of the likelihood of default over a given time horizon. A default may only happen at a certain time over the assessed period, if the facility has not been previously recognised and is still in the portfolio. The concept of PDs is further explained in Note 27.
• Exposure At Default (EAD)
EAD is an estimate of the exposure at a future default date, taking into account expected changes in the exposure after the Reporting date, including repayments of principal and interest, whether scheduled by contract or otherwise, expected drawdowns on committed facilities, and accrued interest from missed payments. The EAD is further explained in Note 27.
• Loss Given Default (LGD)
LGD is an estimate of the loss arising in the case where a default occurs at a given time. It is based on the difference between the contractual cash flows due and those that the lender would expect to receive, including from the realisation of any collateral. It is usually expressed as a percentage of the EAD. The LGD is further explained in Note 27.
4.5.11.5 Determining the Stage for
Impairment
At each Reporting date, the Group assesses whether there has been a significant increase in credit risk for exposures since initial recognition by comparing the risk of default occurring over the expected life between the Reporting date and the date of initial recognition. The Group considers reasonable and supportable information that is relevant and available without undue cost or effort for this purpose. This includes quantitative and qualitative information and also, forward-looking analysis.
An exposure will migrate through the ECL stages as asset quality deteriorates. If, in a subsequent

BA
NK
OF
CE
YL
ON
AN
NU
AL
RE
PO
RT
20
19
Notes to the Financial Statements174
About this Report / Performance Highlights 2019 / Chairman’s Message / General Manager’s Review / Organisational Overview / Strategic Report / Performance and Outlook / Stakeholder Value Creation / Financial Reports / Compliance Annexes / Supplementary Information
period, asset quality improves and also reverses any previously assessed significant increase in credit risk since origination, then the provision for doubtful debts reverts from lifetime ECL to 12-months ECL. Exposures that have not deteriorated significantly since origination, or where the deterioration remains within the Group’s investment grade criteria, or which are less than 30 days past due, are considered to have a low credit risk. The impairment provision for these financial assets is based on a 12-months ECL.
The Group assesses whether the credit risk on an exposure has increased significantly on an individual or collective basis.
For the purposes of a collective evaluation of impairment, financial instruments are grouped on the basis of shared credit risk characteristics, taking into account of instrument type, credit risk ratings, collateral type, date of initial recognition, remaining term to maturity, industry, geographical location of the borrower and other relevant factors.
4.5.11.6 Measurement of ECL
ECL is derived from unbiased and probability-weighted estimates of expected loss, and are measured as follows:
• Financial assets that are not credit-impaired at the Reporting date: as the present value of all cash shortfalls over the expected life of the financial asset discounted by the effective interest rate. The cash shortfall is the difference between the cash flows due to the Group in accordance
with the contract and the cash flows that the Group expects to receive.
• Financial assets that are credit-impaired at the Reporting date: as the difference between the gross carrying amount and the present value of estimated future cash flows discounted by the effective interest rate.
• Undrawn loan commitments: as the present value of the difference between the contractual cash flows that are due to the Group if the commitment is drawn down and the cash flows that the Group expects to receive.
• Financial guarantee contracts: as the expected payments to reimburse the holder less any amounts that the Group expects to recover.
ECL is recognised in the Statement of Profit or Loss. In the case of debt instruments measured at fair value through Other Comprehensive Income, the measurement of ECL is based on the three-stage approach as applied to financial assets at amortised cost.
4.6 Impairment of Non- Financial Assets
The Group assesses at each Reporting date whether there is an indication that an asset may be impaired. If any indication exists, or when annual impairment testing for an asset is required, the Bank estimates the asset’s recoverable amount. An asset’s recoverable amount is the higher of an asset’s fair value less costs to sell or its value in use. Where the carrying amount of an asset
exceeds its recoverable amount, the asset is considered impaired and is written down to its recoverable amount. In assessing the value in use, the estimated future cash flows are discounted to their present value using a pre-tax discount rate that reflects current market assessments of the time value of money and the risks specific to the asset. In determining fair value less costs to sell, an appropriate valuation model is used. These calculations are corroborated by valuation multiples, quoted share prices for publicly-traded subsidiaries or other valuable fair value indicators.
4.7 Fiduciary Services
The Group provides fiduciary services to third parties that result in holding of the assets on behalf of its customers. Assets held in fiduciary capacity are not recognised in the Financial Statements, as the Group is not the beneficial owner or does not control such assets.
4.8 Provisions
A provision is recognised as a result of a past event, when the Group has a present (legal or constructive) obligation that can be estimated reliably and it is probable that an outflow of economic benefits will be required to settle the obligation.
The amount recognised is the best estimate of the consideration required to settle the present obligation at the Reporting date, taking into account the risks and uncertainties surrounding the obligation at that date. Where a provision is measured using the cash flows estimated to settle the present obligation, its carrying

About this Report / Performance Highlights 2019 / Chairman’s Message / General Manager’s Review / Organisational Overview / Strategic Report / Performance and Outlook / Stakeholder Value Creation / Financial Reports / Compliance Annexes / Supplementary Information
175
amount is determined based on the present value of those cash flows. A provision for onerous contracts is recognised when the expected benefits to be derived by the Group from a contract are lower than the unavoidable cost of meeting its obligations under the contract. The provision is measured as the present value of the lower of the expected cost of terminating the contract and the expected net cost of continuing with the contract.
4.9 Income Tax Expense and Other Taxes
4.9.1 Income Tax Expense
Income tax expense comprises current and deferred tax. More details are given in Note 17.
4.9.2 Value Added Tax (VAT) on
Financial Services
The base for Value Added Tax computation is arrived by aggregating the accounting profit before income tax and emoluments of employees, which is adjusted for the depreciation computed on prescribed rates. During the year, the Group’s total value addition was subjected to 15% (2018– 15%) VAT as per the Value Added Tax Act No. 14 of 2002 and amendments thereto. Also the Group is following value attributable method to compute VAT on financial services.
4.9.3 Withholding Tax (WHT) on
Dividends
• Withholding tax on dividends distributed by the Bank.
No withholding tax is paid by the Bank, since Bank distributes dividend to its sole shareholder, the Government of Sri Lanka.
• Withholding tax on dividends distributed by the Subsidiaries and Associates.
Dividend distributed out of taxable profit of the Subsidiaries and Associate companies attracts a 14% deduction at source over the year 2019 (10% up to 31 March 2018 and 14% after 1 April 2018).
As per Notice dated 18 February 2020 published by the Department of Inland Revenue, requirement to deduct WHT on dividends has been removed effective 1 January 2020.
4.9.4 Economic Service Charge (ESC)
As per provisions of the Economic Service Charge (ESC) Act No.13 of 2006 and amendments thereafter, ESC is payable at 0.5% on Bank’s liable turnover and is deductible from income tax payable. As per Notice published on 31 December 2019 by the Department of Inland Revenue, ESC was abolished with effect from 1 January 2020.
4.9.5 Crop Insurance Levy (CIL)
As per the provisions of the Finance Act No. 12 of 2013, the CIL was introduced with effect from 1 April 2013 and is payable 1% of the profit after tax to the National Insurance Trust Fund Board.
4.9.6 Nation Building Tax (NBT) on
Financial Services
In accordance with Nation Building Tax (NBT) Act No. 9 of 2009 and subsequent amendments, the Bank calculated and paid NBT on financial services at 2% (2018: 2%) of the value addition usd for the purpose of VAT on financial
services untill 30 November 2019. However NBT on financial sevices is excempeted with effect from 1 December 2019.
4.9.7. Debt Repayment Levy (DRL) on
Financial Services
As per the Finance Act No. 35 of 2018, DRL shall be charged from every financial institution with effect from 1 October 2018. DRL is calculated at the rate of 7% on the value addition attributable to the financial services. As per notice published by the Department of Inland Revenue dated 20 January 2020, DRL was abolished with effect from 1 January 2020.
5. Insurance Business
5.1 Reinsurance
The Group cedes insurance risk in the normal course of business for all of its businesses. Reinsurance assets represent balances due from reinsurance companies. Amounts recoverable from reinsurers are estimated in a manner consistent with the outstanding claims provision or settled claims associated with the reinsurer’s policies and are in accordance with the related reinsurance contract.
Reinsurance assets are reviewed for impairment at each Reporting date or more frequently when an indication of impairment arises during the Reporting year. Impairment occurs when there is objective evidence as a result of an event that occurred after initial recognition of the reinsurance asset that the Group may not receive all outstanding amounts due under the terms of the contract and the event has a reliably measurable impact on the amounts that the Group will

BA
NK
OF
CE
YL
ON
AN
NU
AL
RE
PO
RT
20
19
Notes to the Financial Statements176
About this Report / Performance Highlights 2019 / Chairman’s Message / General Manager’s Review / Organisational Overview / Strategic Report / Performance and Outlook / Stakeholder Value Creation / Financial Reports / Compliance Annexes / Supplementary Information
receive from the reinsurer. The impairment loss is recorded in the Statement of Profit or Loss.
Premiums and claims are presented on a gross basis for reinsurance. Reinsurance assets or liabilities are derecognised when the contractual rights are extinguished or expire or when the contract is transferred to another party.
5.2 Insurance Receivables
Insurance receivables are recognised when due and measured on initial recognition at the fair value of the consideration receivable. The carrying value of insurance receivables is reviewed for impairment whenever events or circumstances indicate that the carrying amount may not be recoverable, with the impairment loss recorded in the Statement of Profit or Loss.
5.3 Deferred Expenses
5.3.1 Deferred Acquisition Costs
(DAC)
The costs of acquiring new businesses including commission, underwriting, marketing and policy issue expenses which vary with and directly related to production of new businesses and/or investment contracts with Discretionary Participation Features (DPF), are deferred to the extent that these costs are recoverable out of future premiums. All other acquisition costs are recognised as an expense when incurred.
Subsequent to initial recognition, DAC for general insurance is amortised over the period on the basis unearned premium is amortised. The reinsurances’ share of deferred acquisition
cost is amortised in the same manner as the underlying assets amortisation is recorded in the Statement of Profit or Loss. Changes in the expected useful life or the expected pattern of consumption of future economic benefits embodied in the assets are accounted for by changing the amortisation period and are treated as a change in an accounting estimate. DAC are derecognised when the related contracts are either expired or cancelled.
5.4 Reinsurance Commissions
Commissions receivable on outwards reinsurance contracts are deferred and amortised over the period of reinsurance.
5.5 Investment Contract Liabilities
Investment contracts are classified between contracts with and without DPF. The accounting policies for investment contract liabilities with DPF are the same as those for life insurance contract liabilities. Investment contract liabilities without DPF are recognised when contracts are entered into and premiums are charged. These liabilities are initially recognised at fair value being the transaction price excluding any transaction costs directly attributable to the issue of the contract. Subsequent to initial recognition, investment contract liabilities are measured at fair value through profit or loss.
Deposits and withdrawals are recorded directly as an adjustment to the liability in the Statement of Financial Position. Fair value adjustments are performed at each Reporting date and are recognised in the Statement of Profit or Loss. Fair
value is determined through the use of prospective discounted cash flow techniques. For unitised contracts, fair value is calculated as the number of units allocated to the policyholder in each unit linked fund multiplied by the unit price of those funds at the Reporting date. The fund assets and fund liabilities used to determine the unit prices at the Reporting date are valued on a basis consistent with their measurement basis in the Statement of Financial Position adjusted to take account of the effect on the liabilities of the deferred tax on unrealised gains on assets in the fund. Non-utilised contracts are subsequently carried at fair value, which is determined by using valuation techniques such as discounted cash flows and stochastic modelling. Models are validated, calibrated and periodically reviewed by an independent qualified person.
The liability is derecognised when the contract expires, is discharged or is cancelled. For a contract that can be cancelled by the policyholder, the fair value cannot be less than the surrender value. When contracts contain both a financial risk component and a significant insurance risk component and the cash flows from the two components are distinct and can be measured reliably, the underlying amounts are unbundled. Any premiums relating to the insurance risk component are accounted for on the same bases as insurance.
5.6 Discretionary Participation Features (DPF)
A DPF is a contractual right that gives holders of these

About this Report / Performance Highlights 2019 / Chairman’s Message / General Manager’s Review / Organisational Overview / Strategic Report / Performance and Outlook / Stakeholder Value Creation / Financial Reports / Compliance Annexes / Supplementary Information
177
contracts the right to receive as a supplement to guaranteed benefits, significant additional benefits which are based on the performance of the assets held within the DPF portfolio. Under the terms of the contract, surpluses in the DPF funds can be distributed to policyholders and shareholders on a 90/10 basis. The Group has the discretion over the amount and timing of the distribution of these surpluses to policyholders. All DPF liabilities including unallocated surpluses, both guaranteed and discretionary, at annually are held within insurance or investment contract liabilities as appropriate.
5.7 Unearned Premium Reserve
Unearned premium reserve represents the portion of the premium written in the year but relating to the unexpired term of coverage. Unearned premiums are calculated on the 1/24th basis.
6. New and Amended Standards and InterpretationsIn these Financial Statements, the Bank has applied SLFRS 16 - “Leases” and Uncertainty Over Income Tax Treatment in LKAS 12 - “Income taxes” for the first time. The nature and effect of the changes as a result of adoption of this new accounting standard are described in Note 6.1 and 6.2.
6.1 SLFRS 16 – “Leases”
SLFRS 16 supersedes LKAS 17 - “Leases”, IFRIC 4 and for periods on or after 1 January 2019. The standard sets out the principles for the recognition, measurement, presentation and disclosure of leases and requires lessees to
recognise most leases on the Statement of Financial Position.
Lessor accounting under SLFRS 16 - “Leases” is substantially unchanged from LKAS 17 - “Leases”. Lessors will continue to classify leases as either operating or finance leases using similar principles as in LKAS 17 - “Leases”. Therefore, SLFRS 16 - “Leases” did not have an impact for leases where the Bank is the lessor.
The Bank adopted SLFRS 16 - “Leases” using the ‘Modified Retrospective Method’ of adoption with the date of initial application of 1 January 2019. Under this method, the standard is applied retrospectively with the cumulative effect of initially applying the standard recognised at the date of initial application. The Bank elected to use the transition practical expedient to not reassess whether a contract is or contains a lease at 1 January 2019. Instead, the Bank applied the standard only to contracts that were previously identified as leases applying LKAS 17 - “Leases” at the date of initial application.
The Bank has entered in to lease contracts in connection with various premises used for day today activities. Before the adoption of SLFRS 16 - “Leases”, the Bank classified each of its leases (as lessee) at the inception date as operating leases.
Upon adoption of SLFRS 16 - “Leases”, the Bank applied a single recognition and measurement approach for all leases except for short-term leases and leases of low-value assets. The standard provides specific transition requirements
and practical expedients, which have been applied by the Bank.
6.1.1 Leases Previously Accounted
for as Operating Leases Under
SLFRS 16 - “Leases”
The Bank recognised right-of-use assets and lease liabilities for those leases previously classified as operating leases, except for short-term leases and leases of low-value assets. The right-of-use assets were recognised based on the amount equal to the lease liabilities, adjusted for any related prepaid and accrued lease payments previously recognised. Lease liabilities were recognised based on the present value of the remaining lease payments, discounted using the incremental borrowing rate at the date of initial application.
The Bank also applied the available practical expedients wherein it:
• Used a single discount rate to a portfolio of leases with reasonably similar characteristics
• Excluded the initial direct costs from the measurement of the right-of-use asset at the date of initial application
• Used hindsight in determining the lease term where the contract contained options to extend or terminate the lease
Based on the above, the impact on transition has been disclosed in Note 34.
6.1.2 Leases (applicable from
1 January 2019)
The Bank assesses at contract inception whether a contract is,
BA
NK
OF
CE
YL
ON
AN
NU
AL
RE
PO
RT
20
19
Notes to the Financial Statements178
About this Report / Performance Highlights 2019 / Chairman’s Message / General Manager’s Review / Organisational Overview / Strategic Report / Performance and Outlook / Stakeholder Value Creation / Financial Reports / Compliance Annexes / Supplementary Information
or contains, a lease. That is, if the contract conveys the right to control the use of an identified asset for a period of time in exchange for consideration as per SLFRS 16 - “Leases” and recognise right of use assets and lease liability.
6.1.3 Right-of-Use Assets
The Bank recognises right-of-use assets at the commencement date of the lease (i.e. the date the underlying asset is available for use). Right-of-use assets are measured at cost, less any accumulated depreciation and impairment losses, and adjusted for any remeasurement of lease liabilities. The cost of right-of-use assets includes the amount of lease liabilities recognised, initial direct costs incurred, and lease payments made at or before the commencement date less any lease incentives received. Right-of-use assets are depreciated on a straight-line basis over the lease term.
The right-of-use assets are presented within Note 34 and are subject to impairment in line with the Bank’s policy for Impairment of non-financial assets.
6.1.4 Lease Liabilities
At the commencement date of the lease, the Bank recognises lease liabilities measured at the present value of lease payments to be made over the lease term. The lease payments include fixed payments (less any lease incentives receivable), variable lease payments that depend on an index or a rate, and amounts expected to be paid under residual value guarantees. The lease payments also include the exercise price of a purchase
option reasonably certain to be exercised by the Bank and payments of penalties for terminating the lease, if the lease term reflects exercising the option to terminate. Variable lease payments that do not depend on an index or a rate are recognised as expenses in the period in which the event or condition that triggers the payment occurs.
Determination of the lease term
for lease contracts with renewal
and termination options (Bank
as a lessee)
The Bank determines the lease term as the non-cancellable term of the lease, together with any periods covered by an option to extend the lease if it is reasonably certain to be exercised, or any periods covered by an option to terminate the lease, if it is reasonably certain not to be exercised.
The Bank has several lease contracts that include extension and termination options. The Bank applies judgement in evaluating whether it is reasonably certain whether or not to exercise the option to renew or terminate the lease. That is, it considers all relevant factors that create an economic incentive for it to exercise either the renewal or termination. After the commencement date, the Bank reassesses the lease term if there is a significant event or change in circumstances that is within its control that affects its ability to exercise or not to exercise the option to renew or to terminate.
6.1.5 Estimating the Incremental
Borrowing Rate
The Bank cannot readily determine the interest rate implicit
in the lease, therefore, it uses its incremental borrowing rate (‘IBR’) to measure lease liabilities. The IBR is the rate of interest that the Bank would have to pay to borrow over a similar term, and with a similar security, the funds necessary to obtain an asset of a similar value to the right-of-use asset in a similar economic environment. The IBR therefore reflects what the Bank ‘would have to pay’, which requires estimation when no observable rates are available or when they need to be adjusted to reflect the terms and conditions of the lease. The Bank estimates the IBR using observable inputs (such as market interest rates) when available and is required to make certain entity-specific adjustments.
6.2 IFRIC Interpretation 23 “Uncertainty Over Income Tax Treatment”
This interpretation clarifies how to apply the recognition and measurement requirements in LKAS 12 - “Income taxes” when there is uncertainty over income tax treatments. In such a circumstance, an entity shall recognise and measure its current or deferred tax asset or liability, applying the requirements in LKAS 12 - “Income taxes” based on taxable profit (tax loss), tax bases, unused tax losses, unused tax credits and tax rates determined applying this Interpretation
IFRIC 23 does not apply to taxes or levies outside the scope of LKAS 12 - “Income taxes” and does not specifically include requirements relating to interest and penalties associated with uncertain tax treatments.

About this Report / Performance Highlights 2019 / Chairman’s Message / General Manager’s Review / Organisational Overview / Strategic Report / Performance and Outlook / Stakeholder Value Creation / Financial Reports / Compliance Annexes / Supplementary Information
179
The interpretation specifically addresses the following
• Whether an entity considers uncertain tax treatments separately - An entity shall determine whether to consider each uncertain tax treatment separately or together with one or more other uncertain tax treatments based on which approach better predicts the resolution of the uncertainty.
• The assumptions an entity makes about the examination of tax treatments by taxation authorities. In assessing whether and how an uncertain tax treatment affects the determination of taxable profit (tax loss), tax bases, unused tax losses, unused tax credits and tax rates, an entity shall assume that a taxation authority will examine amounts it has a right to examine and have full knowledge of all related information when making those examinations.
• How an entity determines taxable profit (tax loss), tax bases, unused tax losses, unused tax credits and tax rates-if an entity concludes it is probable that the taxation authority will accept an uncertain tax treatment, the entity shall determine the taxable profit (tax loss), tax bases, unused tax losses, unused tax credits or tax rates consistently with the tax treatment used or planned to be used in its income tax filings.
• If an entity concludes it is not probable that the taxation authority will accept an
uncertain tax treatment, the entity shall reflect the effect of uncertainty in determining the related taxable profit (tax loss), tax bases, unused tax losses, unused tax credits or tax rates by using either of the following methods, depending on which method the entity expects to better predict the resolution of the uncertainty.
• The most likely amount the single most likely amount in a range of possible outcomes.
• The expected value the sum of the probability-weighted amounts in a range of possible outcomes.
• How an entity considers changes in facts and circumstances - An entity shall reassess a judgment or estimate required by this interpretation if the facts and circumstances on which the judgment or estimate was based change or as a result of new information that affects the judgment or estimate.
• This interpretation is effective for annual reporting periods beginning on or after 1 January 2019. The Bank/ Group have applied IFRIC 23 in the determination of taxable profit (tax loss), tax bases, unused tax losses, unused tax credits or tax rates during the year. The Bank/Group does not have material uncertainties over the application of tax treatments that would require separate disclosures in the Financial Statements.
• The Group has not early adopted any standard, interpretation or amendment
that has been issued but is not yet effective.
6.3 New Accounting Standards Issued But Not Effective as at the Reporting Date
The following Sri Lanka Accounting Standard was issued by the Institute of Chartered Accountants of Sri Lanka which is not effective as of 31 December 2019. Accordingly, this Accounting Standard has not been applied in the preparation of the Financial Statements for the year ended 31 December 2019.
We have identified following Standard where this applies to the Group and further details are set out below:
6.3.1 SLFRS 17 - “Insurance Contracts”
SLFRS 17 - “Insurance Contracts” establishes principles for the recognition, measurement, presentation and disclosure of insurance contracts within the scope of the standard. The objective of SLFRS 17 - “Insurance Contracts” is to ensure that an entity provides relevant information that faithfully represents those contracts. This information gives a basis for users of Financial Statements to assess the effect that insurance contracts have on the entity’s financial position, financial performance and cash flows. SLFRS 17 - “Insurance Contracts” is effective for annual periods beginning on or after 1 January 2021. The Group is assessing the potential impact on its Financial Statements resulting from the application of SLFRS 17- “Insurance Contracts”.

BA
NK
OF
CE
YL
ON
AN
NU
AL
RE
PO
RT
20
19
Notes to the Financial Statements180
About this Report / Performance Highlights 2019 / Chairman’s Message / General Manager’s Review / Organisational Overview / Strategic Report / Performance and Outlook / Stakeholder Value Creation / Financial Reports / Compliance Annexes / Supplementary Information
7 Total Income
Accounting Policy
Revenue is recognised to the extent that it is probable that the economic benefits will flow to the Bank/ Group and the revenue can be reliably measured.
Bank Group
For the year ended 31 December 2019 2018 2019 2018
LKR ’000 LKR ’000 LKR ’000 LKR ’000
Interest income [Note 8.1] 220,477,174 195,393,970 227,377,777 201,809,401
Fee and commission income [Note 9.1] 14,569,762 12,917,022 14,969,583 13,305,501
Net gains/ (losses) from trading [Note 10] 2,535,301 3,431,822 2,555,256 3,468,191
Net fair value gains/(losses) from financial instruments at fair value through profit or loss [Note 11] 321,789 (681,365) 342,807 (717,194)
Net gains/(losses) from derecognition of financial assets [Note 12] 282,260 152,029 292,812 153,240
Net other operating income [Note 13] 930,183 9,807,215 3,153,768 11,331,999
Total income 239,116,469 221,020,693 248,692,003 229,351,138
8 Net Interest Income
Accounting Policy
Interest income and expense are recognised in the Statement of Profit or Loss using the Effective Interest Rate (EIR).
Interest income and expense presented in the Statement of Profit or Loss include interest on;
Financial assets and financial liabilities measured at amortised cost (AC)
Financial assets recognised through profit or loss (FVTPL)
Financial assets measured at fair value through Other Comprehensive Income (FVTOCI)
Effective Interest Rate (EIR)
The ‘EIR’ is the rate that exactly discounts the estimated future cash payments and receipts throughout the expected life of the financial asset or financial liability (or, where appropriate, a shorter period) to the carrying amount of the financial asset or financial liability. When calculating the EIR, the Group estimates future cash flows, considering all contractual terms of the financial instruments.
The calculation of the EIR includes any discount or premium on acquisition of financial instrument, transaction costs and fees paid or received that are an integral part of the EIR. Transaction costs include incremental costs that are directly attributable to the acquisition or issue of a financial asset or financial liability.
For impaired financial assets, adjusted EIR is calculated using estimated future cash flows.

About this Report / Performance Highlights 2019 / Chairman’s Message / General Manager’s Review / Organisational Overview / Strategic Report / Performance and Outlook / Stakeholder Value Creation / Financial Reports / Compliance Annexes / Supplementary Information
181
8.1 Interest Income
Bank Group
For the year ended 31 December 2019 2018 2019 2018
LKR ’000 LKR ’000 LKR ’000 LKR ’000
Cash and cash equivalents 984,150 637,183 1,168,656 729,559
Placements with banks 549,861 735,748 641,499 910,847
Securities purchased under resale agreements 491,036 1,277,297 486,962 1,275,316
Financial assets recognised through profit or loss measured at fair value 294,037 575,655 294,037 575,809
Financial assets at amortised cost
loans and advances 170,572,859 145,549,687 176,725,561 151,330,837
debt and other instruments 46,773,089 45,185,554 47,185,250 45,504,088
Financial assets measured at fair value through OCI 812,142 1,432,846 875,812 1,482,945
Total Interest Income 220,477,174 195,393,970 227,377,777 201,809,401
Interest income on loans and advances includes interest on credit impaired assets LKR 2,187.1 million for the year 2019 (2018 : LKR 1,052.6 million).
8.2 Interest Expenses
Bank Group
For the year ended 31 December 2019 2018 2019 2018
LKR ’000 LKR ’000 LKR ’000 LKR ’000
Due to banks 162,570 113,325 170,339 115,735
Securities sold under repurchase agreements 3,890,110 5,379,122 3,956,887 5,414,844
Financial liabilities at amortised cost
due to depositors 126,713,262 112,056,160 129,191,484 114,352,230
other borrowings 8,451,186 7,132,964 9,223,430 7,673,665
Debt securities issued - - 446,363 531,478
Subordinated liabilities 6,113,568 5,154,425 6,094,388 5,031,970
Total interest expenses 145,330,696 129,835,996 149,082,891 133,119,922
Net interest income 75,146,478 65,557,974 78,294,886 68,689,479
8.3 Net Interest Income from Sri Lanka Government Securities
Bank Group
For the year ended 31 December 2019 2018 2019 2018
LKR ’000 LKR ’000 LKR ’000 LKR ’000
Interest income 36,832,733 35,393,676 37,199,435 35,544,149
Less : Interest expenses 3,890,110 5,379,122 3,956,887 5,414,844
Net interest income from Sri Lanka Government securities 32,942,623 30,014,554 33,242,548 30,129,305

BA
NK
OF
CE
YL
ON
AN
NU
AL
RE
PO
RT
20
19
Notes to the Financial Statements182
About this Report / Performance Highlights 2019 / Chairman’s Message / General Manager’s Review / Organisational Overview / Strategic Report / Performance and Outlook / Stakeholder Value Creation / Financial Reports / Compliance Annexes / Supplementary Information
9 Net Fee and Commission Income
Accounting Policy
Fee and commission income comprises with the fee and commission earned by the group, providing diverse range of services. Those can be divided into following two main categories.
(i) Fee and commission income earned from services that are provided over a certain period of time Fees earned for the provision of services over a period of time are accrued over that period. These fees include commission income and private wealth and asset management fees, custody and other management and advisory fees.
(ii) Fee and commission income from providing transaction services and earned on the execution of a specific act Fees and commission arising from negotiating or participating in the negotiation of a transaction for a third party, such as the arrangement/ participation or negotiation of the acquisition of shares or other securities, or the purchase or sale of businesses, are recognised on completion of the underlying transaction. Fees or components of fees that are linked to a certain performance are recognised after fulfilling the corresponding criteria.
Fees and commission expenses relating to transactions are expensed as the services are received and are recognised on an accrual basis.
9.1 Fee and Commission Income
Bank Group
For the year ended 31 December 2019 2018 2019 2018
LKR ’000 LKR ’000 LKR ’000 LKR ’000
Trade services 1,781,009 1,958,791 1,967,366 2,117,990
Debit and credit cards 4,305,216 3,620,610 4,305,216 3,620,610
Travel and remittances services 1,424,935 1,400,910 1,424,935 1,400,910
Custodial services 61,208 118,866 61,208 118,866
Retail banking services 5,023,688 4,139,373 5,078,683 4,148,506
Guarantees and related services 1,396,682 1,477,438 1,397,939 1,478,440
Other financial services 577,024 201,034 734,236 420,179
Total fee and commission income 14,569,762 12,917,022 14,969,583 13,305,501
9.2 Fee and Commission Expense
Bank Group
For the year ended 31 December 2019 2018 2019 2018
LKR ’000 LKR ’000 LKR ’000 LKR ’000
Debit and credit cards 1,997,621 1,817,643 1,997,621 1,817,643
Travel and remittances services 128,299 97,898 128,299 97,898
Retail banking services 304,893 297,085 306,102 298,616
Guarantees and related services 15,009 10,275 15,009 10,275
Other financial services 27,133 23,611 65,175 36,191
Total fee and commission Expenses 2,472,955 2,246,512 2,512,206 2,260,623
Net fee and commission income 12,096,807 10,670,510 12,457,377 11,044,878

About this Report / Performance Highlights 2019 / Chairman’s Message / General Manager’s Review / Organisational Overview / Strategic Report / Performance and Outlook / Stakeholder Value Creation / Financial Reports / Compliance Annexes / Supplementary Information
183
10 Net Gains/ (Losses) From Trading
Accounting Policy
Net gains/ (losses) from trading comprise foreign exchange gain or losses arising from trading activities, gains or losses arising from changes in fair value of derivative financial instruments, dividend income from trading equities.
Dividend income is recognised when the Group’s right to receive the dividend is established.
Bank Group
For the year ended 31 December 2019 2018 2019 2018
LKR ’000 LKR ’000 LKR ’000 LKR ’000
Foreign exchange
From banks 4,197 4,291 16,441 19,168
From other customers 2,434,795 3,325,654 2,441,723 3,335,768
Equities
Dividend income 96,309 101,877 97,092 113,255
Net gains/ (losses) from trading 2,535,301 3,431,822 2,555,256 3,468,191
11 Net fair Value Gains/(Losses) from Financial Instruments at Fair Value through Profit or Loss
Accounting policy
Net gains/ (losses) on financial assets at fair value through profit or loss include unrealised gains or losses from investment in equities and debt instruments classified as fair value through profit or loss due to changes in fair value of such instruments.
Bank Group
For the year ended 31 December 2019 2018 2019 2018
LKR ’000 LKR ’000 LKR ’000 LKR ’000
Gains/ (Losses) on marked to market valuation of
Fixed income securities 20,247 (10,268) 35,112 (10,268)
Equities 112,717 (226,795) 116,621 (259,736)
Unit Trust 188,825 (444,302) 191,074 (447,190)
Net gains/(losses) on financial assets at fair value through profit or loss 321,789 (681,365) 342,807 (717,194)
12 Net Gains/ (Losses) From Derecognition of Financial AssetsNet Gains/ (Losses) from derecognition of financial assets include profit or loss on sale of debt instruments classified as fair value through profit or loss, amortised cost and fair value through other comprehensive income.
Bank Group
For the year ended 31 December 2019 2018 2019 2018
LKR ’000 LKR ’000 LKR ’000 LKR ’000
Recognised at:
Fair value through profit or loss 70,413 56,612 80,965 57,823
Amortised cost - - - -
Fair value through other comprehensive income 211,847 95,417 211,847 95,417
Net gains/ (losses) from derecognition of financial assets 282,260 152,029 292,812 153,240

BA
NK
OF
CE
YL
ON
AN
NU
AL
RE
PO
RT
20
19
Notes to the Financial Statements184
About this Report / Performance Highlights 2019 / Chairman’s Message / General Manager’s Review / Organisational Overview / Strategic Report / Performance and Outlook / Stakeholder Value Creation / Financial Reports / Compliance Annexes / Supplementary Information
13 Net Other Operating Income
Accounting Policy
Dividend Income
Dividend income is recognised when the Bank’s right to receive the dividend is established.
Gains/ (Losses) from Disposal of Non-Financial Assets
Net gains or losses arising from the disposal of Property, Plant and Equipment and other non current assets including investments in subsidiaries and associates are accounted for in the Statement of Profit or Loss after deducting the carrying amount of such assets and the related selling expenses from the proceeds on disposal.
Foreign Exchange Income
Foreign currency positions are revalued at each Reporting date. Gains/ (Losses) arising from changes in fair value are included in the Statement of Profit or Loss in the period in which they arise.
Rental Income
Rental income is recognised on an accrual basis. This includes rent recovered from the Bank's premises, quarters, safety lockers, and lease rent recovered form branch premises etc.
Service Income
Service income is recognised on an accrual basis and includes income earned through documentation charges recovered from loans and leases, CRIB charges, legal fees, correspondent banking services charges and automated cheque clearing etc.
Gross Insurance Premium
Gross recurring premiums on life and investment contracts with Discretionary Participation Features (DPF) are recognised as revenue when receivable from the policyholder. For single premium business, revenue is recognised on the date on which the policy is effective.
Gross general insurance written premiums comprise the total premiums receivable for the whole period of cover provided by contracts entered into during the accounting period and are recognised on the date on which the policy commences.
Bank Group
For the year ended 31 December 2019 2018 2019 2018
LKR ’000 LKR ’000 LKR ’000 LKR ’000
Dividend income from financial assets measured at fair value through OCI 313,937 284,383 348,398 321,923
Dividend income from subsidiaries and associates 345,585 309,685 - -
Dividend income from units in unit trust - 3,985 - 3,985
Gains/ (Losses) on revaluation of foreign exchange (401,604) 7,622,372 (401,604) 7,622,372
Gains/ (Losses) on sale of Property, Plant and Equipment 63,171 31,014 63,761 121,350
Gains/ (Losses) on sale of foreclosed properties 60,109 73,605 60,109 73,605
Rental income 234,219 234,590 286,581 302,487
Service income - - 249,902 233,705
Profit from sale of gold bullion 8,421 8,951 8,421 8,951
Miscellaneous income 95,364 1,014,141 2,142,322 2,322,159
Gross insurance premium - - 184,897 96,973
Net income from Islamic banking [Note 13.1] 210,981 224,489 210,981 224,489
Net other operating income 930,183 9,807,215 3,153,768 11,331,999

About this Report / Performance Highlights 2019 / Chairman’s Message / General Manager’s Review / Organisational Overview / Strategic Report / Performance and Outlook / Stakeholder Value Creation / Financial Reports / Compliance Annexes / Supplementary Information
185
13.1 Net Income from Islamic Banking
Bank/ Group
For the year ended 31 December 2019 2018
LKR ’000 LKR ’000
Income from Islamic banking operations 368,577 393,818
Less : Profit paid to investors 157,596 169,329
Net income from Islamic banking 210,981 224,489
14 Impairment Charge/ (Reversal) for Loans and Other Losses
Accounting Policy
The Bank and Group recognise the changes in the impairment provisions for financial instruments, which are assessed as per Sri Lanka Financial Reporting Standard - SLFRS 9 - “Financial Instruments”. Details are given under Financial assets at amortised cost - loans and advances (Note 27). Further, the Bank/ Group recognises an impairment loss when the carrying amount of a non financial asset exceeds the estimated recoverable amount of that asset as per Sri Lanka Accounting Standard - LKAS 36 - “Impairment of Assets”.
The table below shows the provision made during the year on identified Expected Credit Losses (ECL) on financial instruments for the year recorded in the Statement of Profit or Loss.
Bank Group
For the year ended 31 December 2019 2019
Stage 1 Stage 2 Stage 3 Total Stage 1 Stage 2 Stage 3 Total
LKR ’000 LKR ’000 LKR ’000 LKR ’000 LKR ’000 LKR ’000 LKR ’000 LKR ’000
Cash and cash equivalents 6,424 - - 6,424 6,430 - - 6,430
Placements with banks 17,548 - - 17,548 17,871 - - 17,871
Financial assets measured at
amortised cost - loans and advances (3,135,377) 45,356 21,274,717 18,184,696 (3,268,464) (31,134) 21,574,416 18,274,818
Financial assets measured at
amortised cost - debt instruments 389,057 - - 389,057 420,124 - - 420,124
Total Credit loss expense (2,722,348) 45,356 21,274,717 18,597,725 (2,824,039) (31,134) 21,574,416 18,719,243
Bank Group
For the year ended 31 December 2018 2018
Stage 1 Stage 2 Stage 3 Total Stage 1 Stage 2 Stage 3 Total
LKR ’000 LKR ’000 LKR ’000 LKR ’000 LKR ’000 LKR ’000 LKR ’000 LKR ’000
Cash and cash equivalents (3,793) - - (3,793) (3,795) - - (3,795)
Placements with banks 22,720 - - 22,720 22,452 - - 22,452
Financial assets measured at
amortised cost - loans and advances 2,010,203 (2,123,633) 14,377,860 14,264,430 2,038,648 (2,116,443) 14,476,548 14,398,753
Financial assets measured at
amortised cost - debt instruments 731,392 - 26,212 757,604 732,850 - 26,212 759,062
Total Credit loss expense 2,760,522 (2,123,633) 14,404,072 15,040,961 2,790,155 (2,116,443) 14,502,760 15,176,472

BA
NK
OF
CE
YL
ON
AN
NU
AL
RE
PO
RT
20
19
Notes to the Financial Statements186
About this Report / Performance Highlights 2019 / Chairman’s Message / General Manager’s Review / Organisational Overview / Strategic Report / Performance and Outlook / Stakeholder Value Creation / Financial Reports / Compliance Annexes / Supplementary Information
15 Personnel Expenses
Accounting Policy
Personnel expenses include staff emoluments, contribution to defined contribution/ benefit plans and other related expenses. Short term employee benefit obligations are measured on an undiscounted basis and are expensed as the related service is provided. A liability is recognised for the amount expected to be paid under short term cash bonus, if the Group has a present legal or constructive obligation to pay this amount as a result of past service provided by the employee and the obligation can be estimated reliably.
Employees are eligible for contribution to defined contribution/ benefit plans in accordance with the respective internal and external statutes and regulations.
Defined benefit plan contributions and provisions for accumulated leave are recognised in the Statement of Profit or Loss based on actuarial valuations carried out in accordance with Sri Lanka Accounting Standard - LKAS 19 on “Employee Benefits”.
Bank Group
For the year ended 31 December 2019 2018 2019 2018
LKR ’000 LKR ’000 LKR ’000 LKR ’000
Staff emoluments 16,204,133 15,153,102 17,608,278 16,593,168
Contributions to defined contribution plans [Note 15.1] 1,323,889 1,293,232 1,467,500 1,432,572
Contributions to defined benefit plans [Note 15.2] (244,156) (132,434) (125,914) (24,931)
Other personnel expenses 1,081,163 1,037,565 1,263,218 1,076,037
Total personnel expenses 18,365,029 17,351,465 20,213,082 19,076,846
15.1 Contributions to Defined Contribution Plans
A Defined Contribution Plan (DCP) is a post-employment benefit plan under which an entity pays fixed contributions into a separate entity and will have no legal or constructive obligation to pay further amounts. Obligations for contributions to defined contribution plans are recognised as an expense in the Statement of Profit or Loss when they are due in respect of service rendered before the end of the Reporting period. Prepaid contributions are recognised as an asset to the extent that a cash refund or a reduction in future payments is available. Contributions to a DCP that is due more than 12 months after the end of the Reporting period in which the employees render the service are discounted to their present value at the Reporting date.
Bank of Ceylon Provident Fund
All employees of the Bank are members of the “Bank of Ceylon Provident Fund” to which the Bank contributes 12% of employees' monthly gross salary while employees contribute 8%. This fund is an approved fund, which is independently administered.
Employees’ Provident Fund
The subsidiaries and their employees (other than Bank of Ceylon and its employees) contribute 12% (15% by Property Development PLC and Hotel Colombo Limited) and 8% (10% by Property Development PLC’s and Hotel Colombo Limited's employees) respectively on monthly gross salary of each employee to Employees’ Provident Fund, in terms of the Employees’ Provident Fund Act No. 15 of 1958 and subsequent amendments thereto. The respective fund is managed by the Central Bank of Sri Lanka.
Employees’ Trust Fund
All employees of the Bank and its subsidiaries are members of the Employees’ Trust Fund to which the Bank and the Group contributes 3% of the employee’s monthly gross salary, in terms of Employees’ Trust Fund Act No.46 of 1980.

About this Report / Performance Highlights 2019 / Chairman’s Message / General Manager’s Review / Organisational Overview / Strategic Report / Performance and Outlook / Stakeholder Value Creation / Financial Reports / Compliance Annexes / Supplementary Information
187
Bank Group
For the year ended 31 December 2019 2018 2019 2018
LKR ’000 LKR ’000 LKR ’000 LKR ’000
Employers' contribution to:
Bank of Ceylon/Employees' Provident Fund 1,060,906 1,036,063 1,176,229 1,148,216
Employees' Trust Fund 262,983 257,169 291,271 284,356
Total contributions to defined contribution plans 1,323,889 1,293,232 1,467,500 1,432,572
15.2 Contributions to Defined Benefit Plans
A Defined Benefit Plan (DBP) is a post-employment benefit plan other than a DCP. The Group’s net obligation in respect of DBP is calculated separately for each plan by estimating the amount of future benefit that employees have earned in return for their service in the current and prior periods and discounting that benefit to determine its present value and then deducting the fair value of any plan assets. The discount rate is the yield at the Reporting date on long-term treasury bond rate for discount rates actually used that have maturity dates approximating the terms of the Group’s obligations. The calculation is performed by a qualified actuary using the Projected Unit Credit method.
The Group recognises all actuarial gains and losses arising from DBP in the OCI and the expenses related to DBP under personnel expenses in the Statement of Profit or Loss. Details of defined benefit plans are given in “Employee retirement benefit plans” (Note 47).
Bank Group
For the year ended 31 December 2019 2018 2019 2018
LKR ’000 LKR ’000 LKR ’000 LKR ’000
Net expenses recognised in the profit or loss
Bank of Ceylon Pension Trust Fund [Note 47.1] 711,713 539,185 711,713 539,185
Bank of Ceylon Widows'/ Widowers' and Orphans' Pension Fund [Note 47.2] (1,274,952) (955,403) (1,274,952) (955,403)
Terminal gratuity [Note 47.3] 66,517 47,536 133,491 107,503
Bank of Ceylon Pension Fund - 2014 [Note 47.4] 193,561 188,251 193,561 188,251
Provision for encashment of medical leave 59,005 47,997 59,005 47,997
Pension fund - Bank of Ceylon (UK) Limited - - 51,268 47,536
Total contributions to defined benefit plans (244,156) (132,434) (125,914) (24,931)
16 Other Expenses
Accounting Policy
Other expenses have been recognised in the Statement of Profit or Loss as they are incurred in the period to which they relate. All expenditure incurred in the operation of the business and in maintaining the capital assets in a state of efficiency has been charged to revenue in arriving at the Group’s profit for the year. Provisions in respect of other expenses are recognised when the Group has a present obligation (legal or constructive) as a result of a past event, it is probable that an outflow of resources emboding economic benefits will be required to settle the obligation and a reliable estimate can be made of the amount of the obligation.

BA
NK
OF
CE
YL
ON
AN
NU
AL
RE
PO
RT
20
19
Notes to the Financial Statements188
About this Report / Performance Highlights 2019 / Chairman’s Message / General Manager’s Review / Organisational Overview / Strategic Report / Performance and Outlook / Stakeholder Value Creation / Financial Reports / Compliance Annexes / Supplementary Information
Deposit Insurance Premium
As per the Sri Lanka Deposit Insurance and Liqudity Support Scheme introduced under the Banking Act Direction No.05 of 2010, the Bank is required to make quarterly payments of 0.1% or 0.125% on the eligible deposit liabilities, from 1 October 2010. The premium rate depends on the Capital Adequacy Ratio (CAR) of the immediate preceeding Audited Financial Statements.
Reinsurance Premium, Claims and Other Benefits
Gross benefits and claims for life insurance contracts and for investment contracts with Discretionary Participation Features (DPF) include the cost of all claims arising during the year including internal and external claims handling costs that are directly related to the processing and settlement of claims and policyholder bonuses declared on DPF contracts, as well as changes in the gross valuation of insurance and investment contract liabilities with DPF. Death claims and surrenders are recorded on the basis of notifications received. Maturities and annuity payments are recorded when due. Interim payments and surrenders are accounted at the time of settlement.
General insurance include all claims occurring during the year, whether reported or not, related internal and external claims handling costs that are directly related to the processing and settlement of claims, a reduction for the value of salvage and other recoveries, and any adjustments to claims outstanding from previous years.
Claims expenses and liabilities for outstanding claims are recognised in respect of direct and inward reinsurance business. The liability covers claims reported but not yet paid, Incurred But Not Reported (IBNR) claims and the anticipated direct and indirect costs of settling those claims. Claims outstanding are assessed by review of individual claim files and estimating changes in the ultimate cost of settling claims. The provision in respect of IBNR is actuarially valued on an annual basis to ensure a more realistic estimation of the future liability based on past experience and trends.
While the Directors consider that the provision for claims is fairly stated on the basis of information currently available, the ultimate liability will vary as a result of subsequent information and events. This may result in adjustment to the amounts provided. Such amounts are reflected in the Financial Statements for that period. The methods used and the estimates made are reviewed regularly.
Reinsurance claims are recognised when the related gross insurance claim is recognised according to the terms of the relevant contract.
Bank Group
For the year ended 31 December 2019 2018 2019 2018
LKR ’000 LKR ’000 LKR ’000 LKR ’000
Directors' emoluments 4,713 4,700 12,339 72,380
Auditors' remuneration
Audit fees 16,253 21,657 42,163 40,264
Non-audit fees - - 866 774
Deposit insurance premium 1,672,955 1,482,361 1,704,381 1,511,220
Professional and legal expenses 132,322 179,349 237,064 256,187
Net revaluation loss on buildings - - 15,988 10,515
Fixed assets maintenance expenses 3,685,515 4,862,972 3,189,155 4,022,345
Fair value adjustment on gold in hand - (317,972) - (317,972)
Reinsurance premium, claims and other benefits - - 145,015 247,424
Office administration and establishment expenses* 4,928,451 5,108,001 7,564,535 7,290,816
Total other expenses 10,440,209 11,341,068 12,911,506 13,133,953
* Rental expesnes paid for operating leases were reported in 2018 under office administration and establishment expenses, with the implementation of Sri Lanka Financial Reporting Standard (SLFRS) 16 “Leases” from 1 January 2019, rental expenses pertaining to year 2019 have been reported as per Sri Lanka Financial Reporting Standard - SLFRS 16 “Leases” and disclosed in Other Liabilities (Note 46).

About this Report / Performance Highlights 2019 / Chairman’s Message / General Manager’s Review / Organisational Overview / Strategic Report / Performance and Outlook / Stakeholder Value Creation / Financial Reports / Compliance Annexes / Supplementary Information
189
17 Taxes
17.1 Taxes on Financial Services
Taxes on financial services includes Value Added Tax (VAT), Nation Building Tax (NBT) and Debt Repayment Levy (DRL) calculated based on the value addition made on financial services.
Bank Group
For the year ended 31 December 2019 2018 2019 2018
LKR ’000 LKR ’000 LKR ’000 LKR ’000
Value Added Tax 6,146,875 7,254,211 6,340,851 7,429,191
Nation Building Tax 731,281 967,206 753,870 994,534
Debt Repayment Levy 3,642,468 1,366,895 3,755,828 1,394,295
Total taxes on financial services 10,520,624 9,588,312 10,850,549 9,818,020
17.2 Income Tax Expense
Current tax and deferred tax are recognised in the Statement of Profit or Loss except to the extent that it relates to items recognised directly in Equity or in Other Comprehensive Income (OCI).
Current Taxation
Current tax is the expected tax payable or receivable on the taxable income or loss for the year, using tax rates enacted or substantively enacted at the Reporting date and any adjustment to tax payable in respect of previous years. The amount of current tax receivable or payable is the best estimate of the tax amount expected to be paid or received that reflects uncertainty related to income taxes if any.
Accordingly, provision for taxation is made on the basis of the accounting profit for the year, as adjusted for taxation purposes, in accordance with the provisions of the Inland Revenue Act No. 10 of 2006 and amendments thereto up to 31 March 2018 and with effect from 1 April 2018 Inland Revenue Act No. 24 of 2017.
Provision for taxation on the overseas operations is made on the basis of the accounting profit for the year, as adjusted for taxation purposes, in accordance with the provisions of the relevant laws and regulations in those countries, using the tax rates enacted or substantively enacted as at the Reporting date.
Deferred Taxation
Details are given in Note 36.
Following details are provided as required by the Sri Lanka Accounting Standard – LKAS 12 on “Income Taxes”.
17.2.1 Components of Income Tax Expense
Bank Group
For the year ended 31 December 2019 2018 2019 2018
LKR ’000 LKR ’000 LKR ’000 LKR ’000
Current tax expense
Income tax on profits for the year 8,036,222 8,626,425 8,384,633 8,858,379
Adjustments in respect of prior years (759,266) 1,097,090 43,919 1,329,632
Deferred tax expense
Charge/ (Reversal) of defferred tax expense [Note 36] (689,764) 2,689,910 (1,500,318) 2,734,006
Income tax expense for the year 6,587,192 12,413,425 6,928,234 12,922,017

BA
NK
OF
CE
YL
ON
AN
NU
AL
RE
PO
RT
20
19
Notes to the Financial Statements190
About this Report / Performance Highlights 2019 / Chairman’s Message / General Manager’s Review / Organisational Overview / Strategic Report / Performance and Outlook / Stakeholder Value Creation / Financial Reports / Compliance Annexes / Supplementary Information
17.2.2 Reconciliation of Accounting Profit and Income Tax Expense
Bank Group
For the year ended 31 December 2019 2018 2019 2018
LKR ’000 LKR ’000 LKR ’000 LKR ’000
Accounting profit before income tax 29,685,227 33,416,085 30,675,569 33,961,102
Add : Dividend income from subsidiaries and associates - - 345,585 309,685
29,685,227 33,416,085 31,021,154 34,270,787
Add : Disallowable expenses 29,077,534 23,587,122 29,697,265 24,899,840
58,762,761 57,003,207 60,718,419 59,170,627
Less: Allowable expenses 19,216,232 14,134,254 19,995,650 15,593,182
Less: Tax exempt income 11,304,111 12,395,215 11,304,111 12,413,645
Taxable income 28,242,418 30,473,738 29,418,658 31,163,800
Current tax at rate of 28% (2018- 28%) 7,907,877 8,532,648 8,237,224 8,725,864
Effect of different tax rates in the Group - - 7,647 858
Effect of different tax rates in other countries 128,345 93,777 128,346 93,778
10% withholding tax on inter company dividends - - 11,416 37,879
Adjustment in respect of prior years (759,266) 1,097,090 43,919 1,329,632
Charge/ (Reversal) of deferred tax [Note 36] (689,764) 2,689,910 (1,500,318) 2,734,006
Income tax expense for the year 6,587,192 12,413,425 6,928,234 12,922,017
The effective income tax rate (%) 22.2 38.9 22.6 39.8
As per the Notice published by the Department of Inland Revenue on 18 February 2020, interest income earned from Sri Lanka Development Bond (SLDB) has been exempted from income tax with effect from 1 April 2018. Accordingly, the over provision made on account of income tax liability in 2018 was reversed to the income statement of the current year, while, income tax liability for the year ended 31 December 2019 too was calculated by considering the interest income from SLDB as an exempt source of income.
17.2.3 The Tax Liabilities of resident companies are computed at the standard rate of 28% (2018 : 28%) except following Bank
operations and companies which enjoy full or partial exemptions and concessions.
For the year ended 31 December 2019 2018
%
From01.04.2018
%
Up to 31.03.2018
%
Tax rates applicable on local operations
BOC Travels (Private) Limited 28.0 28.0 12.0
Hotels Colombo (1963) Limited* 14.0 14.0 12.0
Ceybank Holiday Homes (Private) Limited. 12.0 28.0 12.0
Koladeniya Hydropower (Private) Limited** 20.0 10.0 10.0

About this Report / Performance Highlights 2019 / Chairman’s Message / General Manager’s Review / Organisational Overview / Strategic Report / Performance and Outlook / Stakeholder Value Creation / Financial Reports / Compliance Annexes / Supplementary Information
191
For the year ended 31 December 2019 2018
% %
Tax rates applicable on foreign operations
Banking operations in Male 25.0 25.0
Banking operations in Chennai 40.0 43.0
Banking operation in Seychelles
Up to SCR 1,000,000 25.0 25.0
Balance 33.3 33.3
Bank of Ceylon (UK) Limited 19.0 20.0
* Investment income of the Hotels Colombo (1963) Limited and Koladeniya Hydropower (Private) Limited is subject to 28%.
** In accordance with the agreement with the Board of Investment of Sri Lanka (BOI), Koladeniya Hydropower (Private) Limited is entitled to a tax exemption period of five years from the year in which the company commences to make profits or not later than two years from the date of commencement of commercial operations, whichever is earlier as may be specified in a certificate issued by the the Board of Investment. The tax holiday ended on 31 December 2016. After the tax exemption period, the company will be liable to tax on its trading profit at a concessionary rate of 10% for 2 years and at 20% thereafter.
18 Share of profits/ (losses) of Associate Companies, Net of TaxThe aggregate of the Group’s share of profit or losses of associates is shown in the Statement of Profit or Loss under the equity method of accounting.
Group
For the year ended 31 December 2019 2018
LKR ’000 LKR ’000
Ceybank Asset Management Limited 22,863 4,920
Lanka Securities (Private) Limited (11,169) (14,602)
Transnational Lanka Records Solutions (Private) Limited 36,493 18,951
Total share of profits/ (losses) of associate companies, net of tax 48,187 9,269

BA
NK
OF
CE
YL
ON
AN
NU
AL
RE
PO
RT
20
19
Notes to the Financial Statements192
About this Report / Performance Highlights 2019 / Chairman’s Message / General Manager’s Review / Organisational Overview / Strategic Report / Performance and Outlook / Stakeholder Value Creation / Financial Reports / Compliance Annexes / Supplementary Information
19 Earnings Per Share and Dividend Per Share
19.1 Basic Earnings Per Share
In accordance with the Sri Lanka Accounting Standard - LKAS 33 “Earnings Per Share”, basic earnings per share is calculated by dividing the profit or loss attributable to ordinary shareholders of the Bank (the numerator) by the weighted average number of ordinary shares in issue (the denominator) during the year.
Bank Group
For the year ended 31 December 2019 2018 2019 2018
Profit attributable to ordinary shareholder of the Bank (LKR ’000) 23,098,035 21,002,660 23,452,040 21,056,794
Weighted average number of ordinary shares in issue [Note 19.1.1] 23,767,123 18,643,836 23,767,123 18,643,836
Basic earnings per share (LKR) 971.85 1,126.52 986.74 1,129.42
19.1.1 Weighted Average Number of Ordinary Shares in Issue
Bank Group
For the year ended 31 December 2019 2018 2019 2018
Number of ordinary shares in issue as at 1 January 20,000,000 15,000,000 20,000,000 15,000,000
Weighted average number of ordinary shares issued during the year 3,767,123 3,643,836 3,767,123 3,643,836
Weighted average number of ordinary shares in issue as at 31 December 23,767,123 18,643,836 23,767,123 18,643,836
19.2 Diluted Earnings Per Share
Diluted earnings per share is calculated by dividing the profit or loss attributable to ordinary shareholder of the Bank (the numerator) by the weighted average number of ordinary shares in issue during the year after adjusting for effect of all dilutive potential ordinary shares (the denominator).
Bank Group
For the year ended 31 December 2019 2018 2019 2018
Profit attributable to ordinary shareholders of the Bank (LKR ’000) 23,098,035 21,002,660 23,452,040 21,056,794
Weighted average number of ordinary shares after adjusting for dilution [Note 19.2.1] 25,000,000 21,287,672 25,000,000 21,287,672
Diluted earnings per share (LKR) 923.92 986.61 938.08 989.15

About this Report / Performance Highlights 2019 / Chairman’s Message / General Manager’s Review / Organisational Overview / Strategic Report / Performance and Outlook / Stakeholder Value Creation / Financial Reports / Compliance Annexes / Supplementary Information
193
19.2.1 Weighted Average Number of Ordinary Shares After Adjusting for Dilution
Bank Group
For the year ended 31 December 2019 2018 2019 2018
Weighted average number of ordinary shares in issue [Note 19.1.1] 23,767,123 18,643,836 23,767,123 18,643,836
Weighted average number of potential ordinary shares under pending allotment during the year 1,232,877 2,643,836 1,232,877 2,643,836
Weighted average number of ordinary shares after adjusting for dilution 25,000,000 21,287,672 25,000,000 21,287,672
19.3 Dividend Per ShareDividend per share is calculated by dividing the total dividend allocated to shareholder (the numerator) by the weighted average number of ordinary shares in issue (the denominator) during the year.
Bank Group
For the year ended 31 December 2019 2018 2019 2018
Total dividend allocated to shareholder during the year (LKR ’000) 346,410 4,846,410 346,410 4,846,410
Weighted average number of ordinary shares in issue [Note 19.1.1] 23,767,123 18,643,836 23,767,123 18,643,836
Dividend per share (LKR) 14.58 259.95 14.58 259.95
20 Analysis of Financial Instruments by Measurement BasisAll financial assets and liabilities are measured under the following headings as per the SLFRS 9 - “Financial Instruments”
20.1 Bank
As at 31 December 2019
Fair value through profit
or loss
Fair valuethrough OCI
Amortised cost
Total
LKR ’000 LKR ’000 LKR ’000 LKR ’000
Financial assets
Cash and cash equivalents - - 64,868,895 64,868,895
Balances with Central Banks - - 54,594,436 54,594,436
Placements with banks - - 44,476,343 44,476,343
Securities purchased under resale agreements - - 2,179,449 2,179,449
Derivative financial instruments 132,090 - - 132,090
Loans and advances - - 1,549,804,871 1,549,804,871
Debt instruments 7,459,270 9,669,618 572,747,809 589,876,697
Equity Instruments 2,596,145 4,566,472 - 7,162,617
Total financial assets 10,187,505 14,236,090 2,288,671,803 2,313,095,398
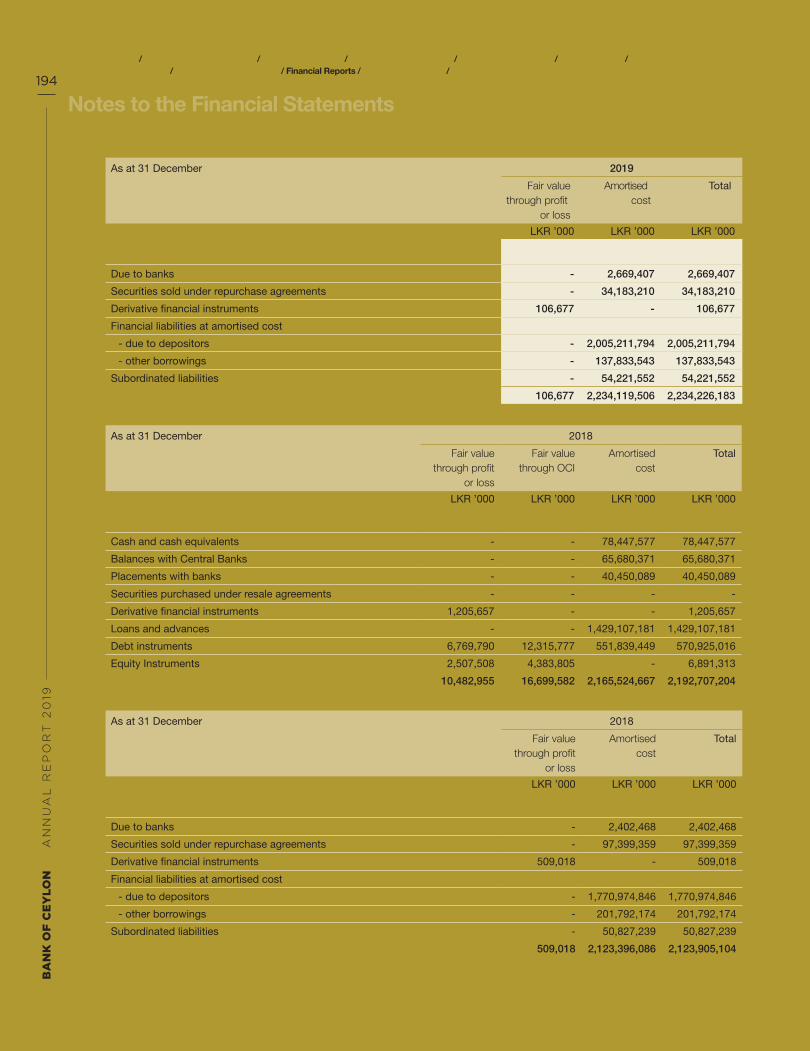
BA
NK
OF
CE
YL
ON
AN
NU
AL
RE
PO
RT
20
19
Notes to the Financial Statements194
About this Report / Performance Highlights 2019 / Chairman’s Message / General Manager’s Review / Organisational Overview / Strategic Report / Performance and Outlook / Stakeholder Value Creation / Financial Reports / Compliance Annexes / Supplementary Information
As at 31 December 2019
Fair value through profit
or loss
Amortised cost
Total
LKR ’000 LKR ’000 LKR ’000
Financial liabilities
Due to banks - 2,669,407 2,669,407
Securities sold under repurchase agreements - 34,183,210 34,183,210
Derivative financial instruments 106,677 - 106,677
Financial liabilities at amortised cost
- due to depositors - 2,005,211,794 2,005,211,794
- other borrowings - 137,833,543 137,833,543
Subordinated liabilities - 54,221,552 54,221,552
Total financial liabilities 106,677 2,234,119,506 2,234,226,183
As at 31 December 2018
Fair value through profit
or loss
Fair valuethrough OCI
Amortised cost
Total
LKR ’000 LKR ’000 LKR ’000 LKR ’000
Financial assets
Cash and cash equivalents - - 78,447,577 78,447,577
Balances with Central Banks - - 65,680,371 65,680,371
Placements with banks - - 40,450,089 40,450,089
Securities purchased under resale agreements - - - -
Derivative financial instruments 1,205,657 - - 1,205,657
Loans and advances - - 1,429,107,181 1,429,107,181
Debt instruments 6,769,790 12,315,777 551,839,449 570,925,016
Equity Instruments 2,507,508 4,383,805 - 6,891,313
Total financial assets 10,482,955 16,699,582 2,165,524,667 2,192,707,204
As at 31 December 2018
Fair valuethrough profit
or loss
Amortisedcost
Total
LKR ’000 LKR ’000 LKR ’000
Financial liabilities
Due to banks - 2,402,468 2,402,468
Securities sold under repurchase agreements - 97,399,359 97,399,359
Derivative financial instruments 509,018 - 509,018
Financial liabilities at amortised cost
- due to depositors - 1,770,974,846 1,770,974,846
- other borrowings - 201,792,174 201,792,174
Subordinated liabilities - 50,827,239 50,827,239
Total financial liabilities 509,018 2,123,396,086 2,123,905,104
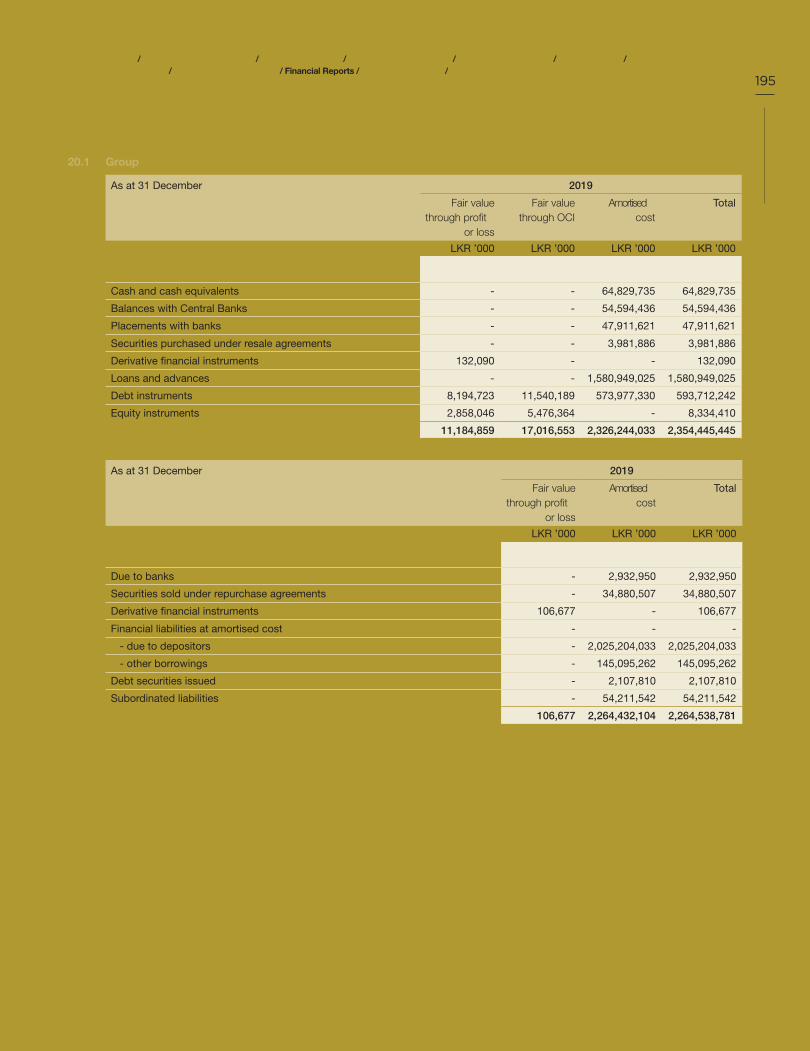
About this Report / Performance Highlights 2019 / Chairman’s Message / General Manager’s Review / Organisational Overview / Strategic Report / Performance and Outlook / Stakeholder Value Creation / Financial Reports / Compliance Annexes / Supplementary Information
195
20.1 Group
As at 31 December 2019
Fair value through profit
or loss
Fair valuethrough OCI
Amortised cost
Total
LKR ’000 LKR ’000 LKR ’000 LKR ’000
Financial assets
Cash and cash equivalents - - 64,829,735 64,829,735
Balances with Central Banks - - 54,594,436 54,594,436
Placements with banks - - 47,911,621 47,911,621
Securities purchased under resale agreements - - 3,981,886 3,981,886
Derivative financial instruments 132,090 - - 132,090
Loans and advances - - 1,580,949,025 1,580,949,025
Debt instruments 8,194,723 11,540,189 573,977,330 593,712,242
Equity instruments 2,858,046 5,476,364 - 8,334,410
Total financial assets 11,184,859 17,016,553 2,326,244,033 2,354,445,445
As at 31 December 2019
Fair value through profit
or loss
Amortised cost
Total
LKR ’000 LKR ’000 LKR ’000
Financial liabilities
Due to banks - 2,932,950 2,932,950
Securities sold under repurchase agreements - 34,880,507 34,880,507
Derivative financial instruments 106,677 - 106,677
Financial liabilities at amortised cost - - -
- due to depositors - 2,025,204,033 2,025,204,033
- other borrowings - 145,095,262 145,095,262
Debt securities issued - 2,107,810 2,107,810
Subordinated liabilities - 54,211,542 54,211,542
Total financial liabilities 106,677 2,264,432,104 2,264,538,781

BA
NK
OF
CE
YL
ON
AN
NU
AL
RE
PO
RT
20
19
Notes to the Financial Statements196
About this Report / Performance Highlights 2019 / Chairman’s Message / General Manager’s Review / Organisational Overview / Strategic Report / Performance and Outlook / Stakeholder Value Creation / Financial Reports / Compliance Annexes / Supplementary Information
As at 31 December 2018
Fair value through profit
or loss
Fair valuethrough OCI
Amortised
cost
Total
LKR ’000 LKR ’000 LKR ’000 LKR ’000
Financial assets
Cash and cash equivalents - - 78,558,031 78,558,031
Balances with Central Banks - - 65,680,371 65,680,371
Placements with banks - - 41,681,910 41,681,910
Securities purchased under resale agreements - - 1,436,068 1,436,068
Derivative financial instruments 1,205,657 - - 1,205,657
Loans and advances - - 1,460,618,588 1,460,618,588
Debt instruments 6,802,836 14,000,999 553,033,150 573,836,985
Equity instruments 2,780,491 5,337,784 - 8,118,275
Total financial assets 10,788,984 19,338,783 2,201,008,118 2,231,135,885
As at 31 December 2018
Fair value through profit
or loss
Amortisedcost
Total
LKR ’000 LKR ’000 LKR ’000
Financial liabilities
Due to banks - 2,515,998 2,515,998
Securities sold under repurchase agreements - 97,423,302 97,423,302
Derivative financial instruments 509,018 - 509,018
Financial liabilities at amortised cost
- due to depositors - 1,789,924,369 1,789,924,369
- other borrowings - 207,053,674 207,053,674
Debt securities issued - 4,105,681 4,105,681
Subordinated liabilities - 50,484,487 50,484,487
Total financial liabilities 509,018 2,151,507,511 2,152,016,529

About this Report / Performance Highlights 2019 / Chairman’s Message / General Manager’s Review / Organisational Overview / Strategic Report / Performance and Outlook / Stakeholder Value Creation / Financial Reports / Compliance Annexes / Supplementary Information
197
21 Cash and Cash Equivalents
Accounting Policy
Cash and cash equivalents include local and foreign currency notes and coins in hand, unrestricted balances held with central banks, balances with other banks and highly liquid financial assets with original maturities of less than seven days, which are subject to insignificant risk of changes in their fair value and are used by the Group to manage its short-term commitments. Cash and cash equivalents are carried at amortised cost. The losses arising from impairment are recognised in “Impairment charge/ (reversal) for loans and other losses” (Note 14) in the Statement of Profit or Loss.
There were no cash and cash equivalents held by the Group that were not available for use by the Group.
Bank Group
As at 31 December 2019 2018 2019 2018
LKR ’000 LKR ’000 LKR ’000 LKR ’000
Local currency in hand 43,871,910 35,957,753 44,042,654 36,143,018
Foreign currency in hand 2,660,722 2,425,261 2,673,027 2,432,289
Balances with banks 14,581,681 12,137,568 14,358,252 12,286,500
Money at call and short notice 3,768,118 27,934,107 3,769,353 27,703,345
Gross cash and cash equivalents 64,882,431 78,454,689 64,843,286 78,565,152
Less: Accumulated impairment [Note 21.2] 13,536 7,112 13,551 7,121
Net cash and cash equivalents 64,868,895 78,447,577 64,829,735 78,558,031
21.1 Analysis of Cash and Cash Equivalents Based on Exposure to Credit Risk
Bank
As at 31 December 2019 2018
Stage 1 Stage 2 Stage 3 Total Total
LKR ’000 LKR ’000 LKR ’000 LKR ’000 LKR ’000
Balances with banks 14,581,681 - - 14,581,681 12,137,568
Money at call and short notice 3,768,118 - - 3,768,118 27,934,107
18,349,799 - - 18,349,799 40,071,675
Less: Accumulated impairment 13,536 - - 13,536 7,112
18,336,263 - - 18,336,263 40,064,563
Group
As at 31 December 2019 2018
Stage 1 Stage 2 Stage 3 Total Total
LKR ’000 LKR ’000 LKR ’000 LKR ’000 LKR ’000
Balances with banks 14,358,252 - - 14,358,252 12,286,500
Money at call and short notice 3,769,353 - - 3,769,353 27,703,345
18,127,605 - - 18,127,605 39,989,845
Less: Accumulated impairment 13,551 - - 13,551 7,121
18,114,054 - - 18,114,054 39,982,724

BA
NK
OF
CE
YL
ON
AN
NU
AL
RE
PO
RT
20
19
Notes to the Financial Statements198
About this Report / Performance Highlights 2019 / Chairman’s Message / General Manager’s Review / Organisational Overview / Strategic Report / Performance and Outlook / Stakeholder Value Creation / Financial Reports / Compliance Annexes / Supplementary Information
21.2 Movement of Impairment During the Period
Bank Group
2019 2018 2019 2018
LKR ’000 LKR ’000 LKR ’000 LKR ’000
Stage 1
Operning balance as at 1 January 7,112 10,905 7,121 10,916
Charge/ (Revesal) during the year 6,424 (3,793) 6,430 (3,795)
Closing balance as at 31 December 13,536 7,112 13,551 7,121
Bank Group
2019 2018 2019 2018
LKR ’000 LKR ’000 LKR ’000 LKR ’000
Total
Operning balance as at 1 January 7,112 10,905 7,121 10,916
Charge/ (Revesal) during the year 6,424 (3,793) 6,430 (3,795)
Closing balance as at 31 December 13,536 7,112 13,551 7,121
22 Balances with Central Banks
Accounting Policy
Balances with Central Banks are carried at amortised cost in the Statement of Financial Position
Bank Group
As at 31 December 2019 2018 2019 2018
LKR ’000 LKR ’000 LKR ’000 LKR ’000
Statutory balances with central banks
Central bank of Sri Lanka 48,334,353 59,405,543 48,334,353 59,405,543
Other Central Banks 6,260,083 6,274,828 6,260,083 6,274,828
Total balances with central banks 54,594,436 65,680,371 54,594,436 65,680,371
22.1 Central Bank of Sri Lanka (CBSL)
In terms of the provisions of Section 93 of the Monetary Law Act No. 58 of 1949, the Bank is required to maintain a cash reserve with Central Bank of Sri Lanka. The minimum cash reserve requirement as of 31 December 2019 was 5% (2018 : 6%) of Sri Lankan Rupee deposit liabilities. There is no reserve requirement for foreign currency deposit liabilities maintained by domestic branches and the deposit liabilities of the Off-shore Banking Division in Sri Lanka (2018 : Nil).
22.2 Reserve Bank of India (RBI)
In terms of the provisions of Section 42 (1) of the Reserve Bank of India (RBI) Act No. 02 of 1934, the branch in Chennai is required to maintain a cash reserve with RBI. The minimum cash reserve as of 31 December 2019 was 4% on its demand and term deposit liabilities. (2018 : 4%)
22.3 Maldives Monetary Authority (MMA)
In terms of the provisions of section 25 of the Maldives Banks Act No. 24 of 2010, it is required to maintain a reserve deposit based on 10% of the branch's deposits and liabilities to the public in the Maldives in Maldivian Rufiyaa and United States Dollar seperately. (2018 : 10%)

About this Report / Performance Highlights 2019 / Chairman’s Message / General Manager’s Review / Organisational Overview / Strategic Report / Performance and Outlook / Stakeholder Value Creation / Financial Reports / Compliance Annexes / Supplementary Information
199
22.4 Central Bank of Seychelles (CBS)
In terms of the provisions of the section 2 of the Central Bank of the the Seychelles Act 2004, the branch in Seychelles is required to maintain a reserve of 13% based on the branch's deposits liabilities. (2018 : 13%).
23 Placements with banks
Accounting Policy
“Placements with banks” include balances with other banks with original maturities of more than seven days which are non-derivative financial assets with fixed or determinable payments that are not quoted in an active market, other than:
- Those that intends to sell immediately or in the near term and those that the Bank, upon initial recognition, designates as at fair value through profit or loss
- Those that upon initial recognition, designates as fair value through other comprehensive income
- Those for which may not recover substantially all of its initial investment, other than due to credit deterioration
Placements with banks are initially measured at fair value. After initial measurement, they are subsequently measured at amortised cost using the Effective Interest Rate (EIR), less allowance for impairment. Interest income from placements with banks is included in “Interest income” (Note 8.1) in the Statement of Profit or Loss. The losses arising from impairment are recognised in “Impairment charge/ (reversal) for loans and other losses” (Note 14) in the Statement of Profit or Loss. Certain placements with banks are written off when they are determined to be uncollectible.
Bank Group
As at 31 December 2019 2018 2019 2018
LKR ’000 LKR ’000 LKR ’000 LKR ’000
Placements within Sri Lanka 182,660 1,108,583 1,660,163 1,781,548
Placements outside Sri Lanka 44,334,539 39,364,814 46,292,715 39,923,748
Gross placements with banks 44,517,199 40,473,397 47,952,878 41,705,296
Less: Accumulated impairment 40,856 23,308 41,257 23,386
Net placements with banks 44,476,343 40,450,089 47,911,621 41,681,910
23.1 Analysis of Placements with Banks Based on Exposure to Credit Risk
Bank
As at 31 December 2019 2018
Stage 1 Stage 2 Stage 3 Total Total
LKR ’000 LKR ’000 LKR ’000 LKR ’000 LKR ’000
Placements within Sri Lanka 182,660 - - 182,660 1,108,583
Placements outside Sri Lanka 44,334,539 - - 44,334,539 39,364,814
44,517,199 - - 44,517,199 40,473,397
Less: Accumulated impairment 40,856 - - 40,856 23,308
44,476,343 - - 44,476,343 40,450,089

BA
NK
OF
CE
YL
ON
AN
NU
AL
RE
PO
RT
20
19
Notes to the Financial Statements200
About this Report / Performance Highlights 2019 / Chairman’s Message / General Manager’s Review / Organisational Overview / Strategic Report / Performance and Outlook / Stakeholder Value Creation / Financial Reports / Compliance Annexes / Supplementary Information
Group
As at 31 December 2019 2018
Stage 1 Stage 2 Stage 3 Total Total
LKR ’000 LKR ’000 LKR ’000 LKR ’000
Placements within Sri Lanka 1,660,163 - - 1,660,163 1,781,548
Placements outside Sri Lanka 46,292,715 - - 46,292,715 39,923,748
47,952,878 - - 47,952,878 41,705,296
Less: Accumulated impairment 41,257 - - 41,257 23,386
47,911,621 - - 47,911,621 41,681,910
23.2 Movement in Impairment During the Year
Bank Group
As at 31 December 2019 2018 2019 2018
LKR ’000 LKR ’000 LKR ’000 LKR ’000
Stage 1
Opening balance as at 1 January 23,308 588 23,386 934
Charge/ (Reversal) during the year 17,548 22,720 17,871 22,452
Closing Balance as at 31 December 40,856 23,308 41,257 23,386
Bank Group
As at 31 December 2019 2018 2019 2018
LKR ’000 LKR ’000 LKR ’000 LKR ’000
Total
Opening balance as at 1 January 23,308 588 23,386 934
Charge/ (Reversal) during the year 17,548 22,720 17,871 22,452
Closing Balance as at 31 December 40,856 23,308 41,257 23,386

About this Report / Performance Highlights 2019 / Chairman’s Message / General Manager’s Review / Organisational Overview / Strategic Report / Performance and Outlook / Stakeholder Value Creation / Financial Reports / Compliance Annexes / Supplementary Information
201
24 Securities Purchased Under Resale Agreements
Accounting Policy
Securities purchased under resale agreements (Reverse Repos) are purchase of securities with the agreement to sell them at a higher price at a specific future date.The consideration paid and accrued interest (measured by using the EIR) are recorded in the Statement of Financial Position, reflecting the transaction’s economic substance as an advance granted by the Group. The difference between the purchase price and resale price is recognised as “Interest income” (Note 8.1) and is amortised over the life of the agreement.
Bank Group
As at 31 December 2019 2018 2019 2018
LKR ’000 LKR ’000 LKR ’000 LKR ’000
With Banks 2,179,449 - 2,805,597 143,398
With other Customers - - 1,176,289 1,292,670
Total securities purchased under resale agreements 2,179,449 - 3,981,886 1,436,068
25 Derivative Financial Instruments
Accounting Policy
Derivatives are financial instruments that derive their value in response to changes in interest rates, financial instrument prices, commodity prices, foreign exchange rates, credit risk, indices etc. Derivative financial instruments include contracts which are entered by the Bank that are not designated as hedging instruments in hedge relationships as per the Sri Lanka Accounting Standard –SLFRS 9 on “Financial Instruments”. Derivatives are categorised as trading unless they are designated as hedging instruments. All derivatives are initially recognised and subsequently measured at fair value, with all revaluation gains or losses recognised in the Statement of Profit or Loss under “Net gains/ (losses) from trading” (Note 10). Derivatives are recorded at fair value and carried as assets when their fair value is positive and as liabilities when their fair value is negative. Fair value is determined using the forward market rates ruling on the Reporting date.
Bank Group
As at 31 December 2019 2018 2019 2018
LKR ’000 LKR ’000 LKR ’000 LKR ’000
Foreign currency derivatives
Forward exchange contracts 7,977 28,897 7,977 28,897
Currency SWAPs 124,113 1,176,760 124,113 1,176,760
Total derivative financial instruments 132,090 1,205,657 132,090 1,205,657
26 Financial Assets Recognised through Profit or Loss
Accounting Policy
Financial instruments are classified as financial assets measured at fair value through profit or loss if they have been acquired principally for the purpose of selling or repurchasing in the near term or holds as a part of a portfolio that is managed together for short term profit or position taking. Further as per SLFRS 9, financial assets recognised through profit or loss includes all financial assets other than those classified under FVTOCI and amortised cost.

BA
NK
OF
CE
YL
ON
AN
NU
AL
RE
PO
RT
20
19
Notes to the Financial Statements202
About this Report / Performance Highlights 2019 / Chairman’s Message / General Manager’s Review / Organisational Overview / Strategic Report / Performance and Outlook / Stakeholder Value Creation / Financial Reports / Compliance Annexes / Supplementary Information
All financial assets under this category are initially and subsequently measured at fair value. Upon initial recognition, transaction cost are directly attributable to the acquisition are recognised in the Statement of Profit or Loss. Changes in fair value are recognised in “Net fair value gains/ (losses) from financial instruments at fair value through profit or loss” (Note 11) and dividend are recognised in “Net gains/ (losses) from trading” (Note 10). Interest income is recorded in “Interest income” (Note 8.1) according to the terms of the contract.
Bank Group
As at 31 December 2019 2018 2019 2018
LKR ’000 LKR ’000 LKR ’000 LKR ’000
Measured at fair value
Sri Lanka Government Securities
Treasury bills 4,636,846 3,533,195 4,636,846 3,533,195
Treasury bonds 29,806 632,810 721,341 632,810
Quoted equities [Note 26.2] 2,596,152 2,507,508 2,858,056 2,780,491
Quoted Debt Securities [Note 26.3] - - 1,600 1,715
Units in unit trusts [Note 26.4] 2,792,611 2,603,785 2,834,926 2,635,116
Total financial assets recognised through profit or loss 10,055,415 9,277,298 11,052,769 9,583,327
26.1 By Currency
Bank Group
As at 31 December 2019 2018 2019 2018
LKR ’000 LKR ’000 LKR ’000 LKR ’000
Sri Lankan Rupee 10,055,415 9,277,298 11,052,769 9,583,327
Total 10,055,415 9,277,298 11,052,769 9,583,327

About this Report / Performance Highlights 2019 / Chairman’s Message / General Manager’s Review / Organisational Overview / Strategic Report / Performance and Outlook / Stakeholder Value Creation / Financial Reports / Compliance Annexes / Supplementary Information
203
26.2 Quoted Equities
26.2.1 Sector Wise Composition of Quoted Equities
As at 31 December 2019 2018
Cost of investment
Market Value
Sector wise composition of market value
Cost of investment
Market Value
Sector wise composition of market value
LKR ’000 LKR ’000 % LKR ’000 LKR ’000 %
Bank [Note 26.2.2]
Banks, Finance and Insurance 14,167 10,741 0.3 13,982 13,152 0.5
Beverage, Food and Tobacco 443,337 458,659 17.7 443,337 515,638 20.6
Chemical and Pharmaceuticals 261,945 121,449 4.7 261,945 82,403 3.3
Construction and Engineering 201,955 55,653 2.1 205,814 52,192 2.1
Diversified Holdings 1,286,911 879,729 33.9 1,301,219 846,374 33.8
Footwear and Textiles 23,894 23,168 0.9 23,668 12,713 0.5
Health Care 30,545 18,615 0.7 30,545 18,804 0.7
Hotels and Travels 719,581 276,992 10.7 719,579 280,829 11.2
Investment Trusts 173,391 65,868 2.5 168,781 48,921 2.0
Land and Property 24,786 15,325 0.6 24,815 15,804 0.6
Manufacturing 623,765 332,571 12.8 647,413 301,685 12.0
Motors 148,095 58,446 2.3 148,098 67,662 2.7
Oil Palms 83,965 27,441 1.1 83,965 24,460 1.0
Plantations 142,014 54,907 2.1 142,052 51,714 2.1
Power and Energy 220,305 103,825 4.0 213,036 92,994 3.7
Services 22,759 12,260 0.5 22,759 13,136 0.5
Stores and Supplies 21,923 10,837 0.4 21,923 10,840 0.4
Telecommunications 7,496 6,827 0.3 7,496 5,008 0.2
Trading 142,914 62,839 2.4 142,914 53,179 2.1
Total 4,593,748 2,596,152 100.0 4,623,341 2,507,508 100.0
Group [Note 26.2.3]
Banks, Finance and Insurance 168,096 117,256 4.1 161,708 121,513 4.4
Beverage, Food and Tobacco 470,507 470,963 16.5 482,259 538,583 19.4
Chemical and Pharmaceuticals 264,167 123,686 4.3 265,958 85,016 3.1
Construction and Engineering 211,696 60,108 2.1 215,351 55,906 2.0
Diversified Holdings 1,318,675 903,771 31.6 1,334,509 870,513 31.3
Footwear and Textiles 23,894 23,168 0.8 32,812 18,905 0.7
Health Care 32,982 20,873 0.7 31,045 19,160 0.7
Hotels and Travels 785,875 312,433 10.9 784,857 319,023 11.5
Investment Trusts 190,649 79,481 2.8 185,811 59,903 2.1
Land and Property 35,148 22,037 0.8 29,944 19,839 0.7
Manufacturing 665,881 362,515 12.7 696,607 337,142 12.1
Motors 149,282 59,549 2.1 148,098 67,662 2.4
Oil Palms 83,965 27,441 1.0 83,965 24,460 0.9
Plantations 145,413 57,467 2.0 144,478 53,341 1.9
Power and Energy 230,026 114,795 4.0 222,425 101,460 3.6
Services 24,731 13,809 0.5 24,015 13,888 0.5
Stores and Supplies 21,923 10,837 0.4 21,923 10,840 0.4
Telecommunications 7,496 6,827 0.2 8,246 5,766 0.2
Trading 151,255 71,040 2.5 148,251 57,571 2.1
Total 4,981,661 2,858,056 100.0 5,022,262 2,780,491 100.0

BA
NK
OF
CE
YL
ON
AN
NU
AL
RE
PO
RT
20
19
Notes to the Financial Statements204
About this Report / Performance Highlights 2019 / Chairman’s Message / General Manager’s Review / Organisational Overview / Strategic Report / Performance and Outlook / Stakeholder Value Creation / Financial Reports / Compliance Annexes / Supplementary Information
26.2.2 Quoted Equities- Bank
Bank
As at 31 December 2019 2018
No. of
ordinary
shares
Cost of
investment
Market
price per
share
Market
value
No. of
ordinary
shares
Cost of
investment
Market
price per
share
Market
value
LKR ’000 LKR LKR ’000 LKR ’000 LKR LKR ’000
Banks, Finance and Insurance
Hatton National Bank PLC 62,374 14,167 172.20 10,741 61,459 13,982 214.00 13,152
14,167 10,741 13,982 13,152
Beverage, Food and Tobacco
Bairaha Farms PLC 119,942 31,789 112.00 13,434 119,942 31,789 124.70 14,957
Cargills (Ceylon) PLC 1,484,120 267,267 193.00 286,435 1,484,120 267,267 200.00 296,824
Ceylon Tobacco Company PLC 143,177 137,100 1,100.30 157,538 143,177 137,100 1,415.00 202,595
HVA Foods PLC 20,000 905 3.90 78 20,000 905 4.40 88
Lucky Lanka Milk Processing
PLC - Voting 1,000,000 6,000 1.10 1,100 1,000,000 6,000 1.10 1,100
Lucky Lanka Milk Processing
PLC - Non voting 91,900 276 0.80 74 91,900 276 0.80 74
443,337 458,659 443,337 515,638
Chemical and Pharmaceuticals
Chemanex PLC 100,000 16,685 58.50 5,850 100,000 16,685 49.50 4,950
CIC Holdings PLC - Voting 770,657 124,284 60.00 46,239 770,657 124,284 39.60 30,518
CIC Holdings PLC - Non voting 416,189 40,011 47.60 19,811 416,189 40,011 30.00 12,486
Haycarb PLC 251,067 48,262 190.00 47,703 251,067 48,262 130.00 32,639
Lankem Ceylon PLC 72,400 32,703 25.50 1,846 72,400 32,703 25.00 1,810
261,945 121,449 261,945 82,403
Construction and Engineering
Access Engineering PLC - - - - 162,000 3,859 14.10 2,284
Colombo Dockyard PLC 897,625 201,955 62.00 55,653 897,622 201,955 55.60 49,908
201,955 55,653 205,814 52,192
Diversified Holdings
Aitken Spence PLC 2,596,230 360,512 46.50 120,725 2,596,230 360,512 47.80 124,100
Browns Capital PLC - - - - 200,000 991 3.50 700
Browns Investments PLC - - - - 3,073,412 13,317 1.90 5,839
Carson Cumberbatch PLC 313,352 141,328 190.00 59,537 313,352 141,328 170.20 53,333
Expolanka Holdings PLC 1,716,193 15,964 5.10 8,753 1,716,193 15,964 4.00 6,865
Hayleys PLC 68,097 21,556 174.90 11,910 68,097 21,556 187.00 12,734
John Keells Holdings PLC 3,299,657 575,620 167.60 553,023 3,299,637 575,620 159.70 526,952
Richard Pieris and Company PLC 6,889,225 90,662 11.80 81,293 6,889,225 90,662 10.50 72,337
The Colombo Fort Land &
Building PLC 149,500 10,307 13.40 2,003 149,500 10,307 15.00 2,243
Vallibel One PLC 2,427,704 70,962 17.50 42,485 2,427,704 70,962 17.00 41,271
1,286,911 879,729 1,301,219 846,374

About this Report / Performance Highlights 2019 / Chairman’s Message / General Manager’s Review / Organisational Overview / Strategic Report / Performance and Outlook / Stakeholder Value Creation / Financial Reports / Compliance Annexes / Supplementary Information
205
Bank
As at 31 December 2019 2018
No. of
ordinary
shares
Cost of
investment
Market
price per
share
Market
value
No. of
ordinary
shares
Cost of
investment
Market
price per
share
Market
value
LKR ’000 LKR LKR ’000 LKR ’000 LKR LKR ’000
Footwear and Textiles
Hayleys Fabric PLC 971,398 14,569 17.90 17,388 774,098 14,343 9.10 7,044
ODEL PLC 222,295 9,325 26.00 5,780 222,295 9,325 25.50 5,669
23,894 23,168 23,668 12,713
Health Care
Singhe Hospitals PLC 4,000,000 10,000 1.50 6,000 4,000,000 10,000 1.40 5,600
The Lanka Hospital Corporation PLC 309,949 20,545 40.70 12,615 309,949 20,545 42.60 13,204
30,545 18,615 30,545 18,804
Hotels and Travels
Aitken Spence Hotel Holdings PLC 2,547,422 232,670 27.10 69,035 2,547,422 232,670 27.00 68,780
Amaya Leisure PLC 593,120 53,020 36.70 21,768 593,110 53,019 40.00 23,724
Asian Hotels & Properties PLC 2,367,741 225,781 40.50 95,894 2,367,741 225,781 42.90 101,576
Citrus Leisure PLC 100,000 10,112 12.10 1,210 100,000 10,112 4.80 480
Eden Hotel Lanka PLC 775,550 41,864 18.40 14,270 775,550 41,864 13.50 10,470
Galadari Hotels (Lanka) PLC 37,280 566 9.10 339 37,280 566 6.90 257
Jetwing Symphony PLC 179,627 2,694 11.30 2,030 179,627 2,694 12.00 2,156
John Keells Hotels PLC 893,487 14,553 11.60 10,364 893,487 14,553 7.80 6,969
Marawila Resorts PLC 100,000 782 2.00 200 100,000 782 1.80 180
Tal Lanka Hotels PLC 447,400 30,043 14.40 6,443 447,400 30,043 13.00 5,816
Tangerine Beach Hotels PLC 50,000 5,056 40.00 2,000 50,000 5,056 36.40 1,820
The Fortress Resorts PLC 1,461,100 50,506 11.80 17,241 1,461,100 50,506 9.10 13,296
The Kingsbury PLC 224,170 3,527 13.10 2,937 224,166 3,526 15.20 3,407
Trans Asia Hotels PLC 477,200 48,407 69.70 33,261 477,200 48,407 87.80 41,898
719,581 276,992 719,579 280,829
Investment Trusts
Ambeon Holdings PLC 385,000 23,271 12.90 4,967 385,000 23,271 11.10 4,274
Ceylon Guardian Investment Trust PLC 107,847 32,747 91.30 9,846 107,847 32,747 66.10 7,129
Ceylon Investment PLC 446,206 73,124 51.50 22,980 446,203 73,124 39.00 17,402
Renuka Holdings PLC 1,454,654 44,249 19.30 28,075 1,211,821 39,639 16.60 20,116
173,391 65,868 168,781 48,921
Land and Property
Overseas Realty (Ceylon) PLC 957,794 24,786 16.00 15,325 957,792 24,815 16.50 15,804
24,786 15,325 24,815 15,804

BA
NK
OF
CE
YL
ON
AN
NU
AL
RE
PO
RT
20
19
Notes to the Financial Statements206
About this Report / Performance Highlights 2019 / Chairman’s Message / General Manager’s Review / Organisational Overview / Strategic Report / Performance and Outlook / Stakeholder Value Creation / Financial Reports / Compliance Annexes / Supplementary Information
Bank
As at 31 December 2019 2018
No. of
ordinary
shares
Cost of
investment
Market
price per
share
Market
value
No. of
ordinary
shares
Cost of
investment
Market
price per
share
Market
value
LKR ’000 LKR LKR ’000 LKR ’000 LKR LKR ’000
Manufacturing
Abans Electricals PLC 196,303 26,807 95.70 18,786 196,303 26,807 57.70 11,327
ACL Cables PLC 362,363 16,217 57.50 20,836 1,005,246 45,924 37.00 37,194
ACME Printing & Packaging PLC 1,078,700 35,020 4.90 5,286 1,078,700 35,020 4.20 4,531
Central Industries PLC - - - - 62,560 2,575 28.10 1,758
Ceylon Grain Elevators PLC 612,498 60,754 68.50 41,956 612,498 60,754 59.50 36,444
Chevron Lubricants Lanka PLC 979,440 165,861 74.90 73,360 837,966 154,550 72.80 61,004
Kelani Tyres PLC 1,016,213 75,060 49.60 50,404 1,016,213 75,060 35.90 36,482
Lanka Cement PLC 7,265,828 63,576 2.50 18,165 7,265,828 63,576 2.50 18,165
Lanka Tiles PLC 1,023,200 134,249 76.70 78,479 973,200 130,512 73.10 71,141
Orient Garments PLC 82,150 2,568 7.00 575 82,150 2,568 7.00 575
Piramal Glass Ceylon PLC 3,288,600 32,322 4.50 14,799 3,288,600 32,322 3.80 12,497
Royal Ceramics Lanka PLC - - - - 1,399 165 74.60 104
Sierra Cables PLC 329,525 1,090 3.30 1,087 329,525 1,090 2.10 692
Swisstek (Ceylon) PLC 170,956 10,241 51.70 8,838 161,929 11,283 41.00 6,639
Tokyo Cement Company (Lanka)
PLC - Voting - - - - 36,669 1,807 25.20 924
Tokyo Cement Company (Lanka)
PLC - Non voting - - - - 96,000 3,400 23.00 2,208
623,765 332,571 647,413 301,685
Motors
C M Holdings PLC 50,857 17,422 79.00 4,018 50,857 17,422 45.00 2,289
Diesel & Motor Engineering PLC 77,935 84,511 320.00 24,939 77,935 84,514 343.50 26,771
Sathosa Motors PLC 13,195 5,111 303.70 4,007 13,195 5,111 534.50 7,053
United Motors Lanka PLC 404,478 41,051 63.00 25,482 404,478 41,051 78.00 31,549
148,095 58,446 148,098 67,662
Oil Palms
Bukit Darah PLC 119,257 83,965 230.10 27,441 119,257 83,965 205.10 24,460
83,965 27,441 83,965 24,460
Plantations
Agalawatte Plantations PLC 45,600 4,608 15.10 689 45,600 4,608 14.00 638
Balangoda Plantations PLC 30,000 2,184 12.00 360 30,000 2,184 12.70 381
Horana Plantations PLC 513,000 43,752 21.90 11,235 513,000 43,752 15.00 7,695
Kahawatte Plantations PLC 756,484 30,600 36.50 27,612 757,436 30,638 39.90 30,222
Kegalle Plantations PLC 50,600 13,703 59.50 3,011 50,600 13,703 55.00 2,783
Kotagala Plantations PLC 729,997 34,709 7.20 5,256 729,997 34,709 6.70 4,891
Namunukula Plantations PLC 80,000 12,458 84.30 6,744 80,000 12,458 63.80 5,104
142,014 54,907 142,052 51,714
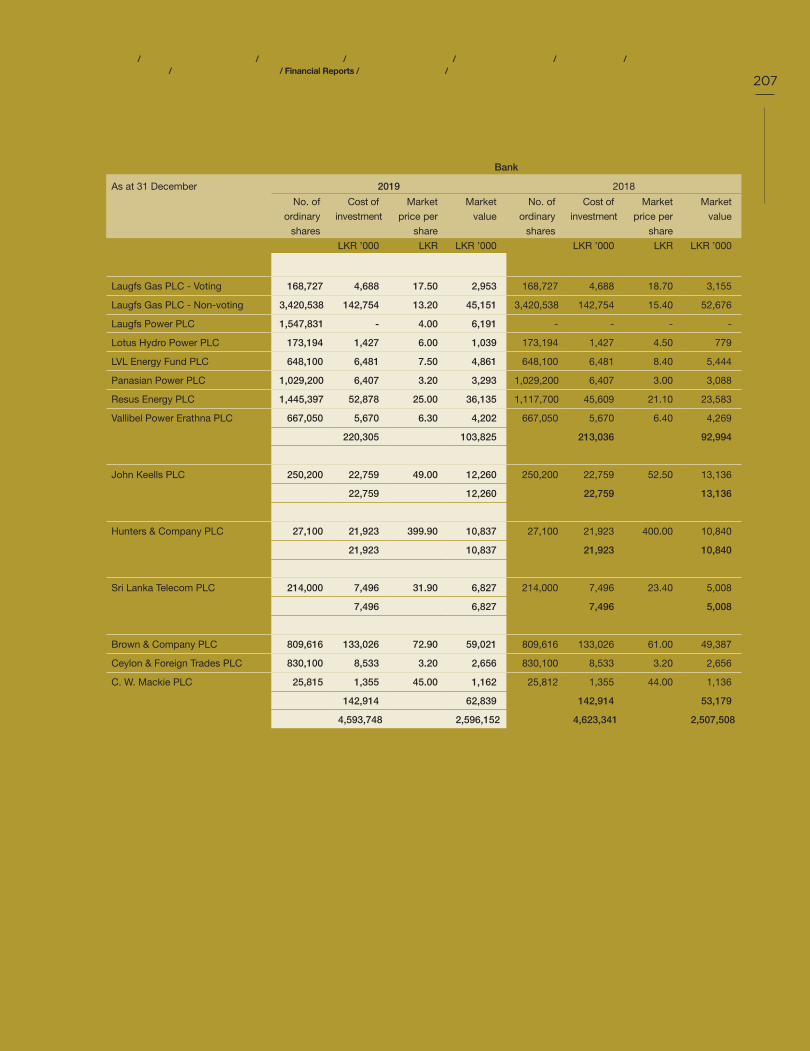
About this Report / Performance Highlights 2019 / Chairman’s Message / General Manager’s Review / Organisational Overview / Strategic Report / Performance and Outlook / Stakeholder Value Creation / Financial Reports / Compliance Annexes / Supplementary Information
207
Bank
As at 31 December 2019 2018
No. of
ordinary
shares
Cost of
investment
Market
price per
share
Market
value
No. of
ordinary
shares
Cost of
investment
Market
price per
share
Market
value
LKR ’000 LKR LKR ’000 LKR ’000 LKR LKR ’000
Power and Energy
Laugfs Gas PLC - Voting 168,727 4,688 17.50 2,953 168,727 4,688 18.70 3,155
Laugfs Gas PLC - Non-voting 3,420,538 142,754 13.20 45,151 3,420,538 142,754 15.40 52,676
Laugfs Power PLC 1,547,831 - 4.00 6,191 - - - -
Lotus Hydro Power PLC 173,194 1,427 6.00 1,039 173,194 1,427 4.50 779
LVL Energy Fund PLC 648,100 6,481 7.50 4,861 648,100 6,481 8.40 5,444
Panasian Power PLC 1,029,200 6,407 3.20 3,293 1,029,200 6,407 3.00 3,088
Resus Energy PLC 1,445,397 52,878 25.00 36,135 1,117,700 45,609 21.10 23,583
Vallibel Power Erathna PLC 667,050 5,670 6.30 4,202 667,050 5,670 6.40 4,269
220,305 103,825 213,036 92,994
Services
John Keells PLC 250,200 22,759 49.00 12,260 250,200 22,759 52.50 13,136
22,759 12,260 22,759 13,136
Stores and Supplies
Hunters & Company PLC 27,100 21,923 399.90 10,837 27,100 21,923 400.00 10,840
21,923 10,837 21,923 10,840
Telecommunications
Sri Lanka Telecom PLC 214,000 7,496 31.90 6,827 214,000 7,496 23.40 5,008
7,496 6,827 7,496 5,008
Trading
Brown & Company PLC 809,616 133,026 72.90 59,021 809,616 133,026 61.00 49,387
Ceylon & Foreign Trades PLC 830,100 8,533 3.20 2,656 830,100 8,533 3.20 2,656
C. W. Mackie PLC 25,815 1,355 45.00 1,162 25,812 1,355 44.00 1,136
142,914 62,839 142,914 53,179
Total quoted equities 4,593,748 2,596,152 4,623,341 2,507,508

BA
NK
OF
CE
YL
ON
AN
NU
AL
RE
PO
RT
20
19
Notes to the Financial Statements208
About this Report / Performance Highlights 2019 / Chairman’s Message / General Manager’s Review / Organisational Overview / Strategic Report / Performance and Outlook / Stakeholder Value Creation / Financial Reports / Compliance Annexes / Supplementary Information
26.2.3 Quoted Equities - Group
Group
As at 31 December 2019 2018
No. of
ordinary
shares
Cost of
investment
Market
price per
share
Market
value
No. of
ordinary
shares
Cost of
investment
Market
price per
share
Market
value
LKR ’000 LKR LKR ’000 LKR ’000 LKR LKR ’000
Banks, Finance and Insurance
Alliance Finance Company PLC 5,000 280 51.40 257 - - - -
Arpico Insurance PLC 10,000 200 19.20 192 8,900 165 18.30 163
Asia Asset Finance PLC 113,928 1,623 8.80 1,003 1,139,289 1,623 0.90 1,025
Central Finance Company PLC 51,483 6,291 104.00 5,354 50,970 6,291 88.70 4,521
Citizens Development Business Finance PLC - Non-voting 9,543 824 67.50 644 9,233 824 70.00 646
Commercial Bank of Ceylon PLC - Voting 15,241 1,759 95.00 1,448 15,000 1,759 115.00 1,725
Commercial Bank of Ceylon PLC - Non-voting 54,194 5,410 83.00 4,498 53,179 5,410 95.00 5,052
Commercial Credit and Finance PLC 22,500 1,498 29.50 664 22,500 1,498 28.50 641
DFCC Bank PLC 120,000 24,535 91.90 11,028 120,000 24,993 93.00 11,160
First Capital Holdings PLC 37,500 1,953 40.40 1,515 25,000 775 28.80 720
Hatton National Bank PLC - Voting 62,374 14,167 172.20 10,741 61,459 13,982 214.00 13,152
Hatton National Bank PLC - Non-voting 10,191 1,820 135.50 1,381 10,000 1,820 168.50 1,685
Janashakthi Insurance Company PLC 135,000 4,467 32.50 4,388 35,000 1,043 30.00 1,050
Lanka Orix Leasing Company PLC - - - - 32,500 3,431 89.90 2,922
LOLC Finance PLC 225,101 849 3.90 878 200,000 775 3.40 680
LB Finance PLC - - - - 12,500 1,645 123.00 1,538
Multi Finance PLC - - - - 20,000 280 13.90 278
National Development Bank PLC 104,798 19,255 100.00 10,480 99,374 18,797 106.80 10,613
Nations Trust Bank PLC 209,949 19,546 80.00 16,796 205,492 19,546 89.20 18,330
Orient Finance PLC 175,000 2,466 11.90 2,083 80,000 1,191 15.50 1,240
Pan Asia Banking Corporation PLC 80,000 1,341 12.80 1,024 80,000 1,341 14.80 1,184
People`s Merchant Finance PLC - - - - 2,500 27 11.40 29
Sanasa Development Bank PLC 93,368 9,258 63.90 5,966 93,368 9,258 75.00 7,003
Seylan Bank PLC - Voting 192,917 16,028 52.50 10,128 141,233 13,846 78.00 11,016
Seylan Bank PLC - Non-voting 496,240 20,949 33.80 16,773 354,984 17,834 44.50 15,797
Softlogic Capital PLC 225,000 1,240 5.50 1,238 - - - -

About this Report / Performance Highlights 2019 / Chairman’s Message / General Manager’s Review / Organisational Overview / Strategic Report / Performance and Outlook / Stakeholder Value Creation / Financial Reports / Compliance Annexes / Supplementary Information
209
Group
As at 31 December 2019 2018
No. of
ordinary
shares
Cost of
investment
Market
price per
share
Market
value
No. of
ordinary
shares
Cost of
investment
Market
price per
share
Market
value
LKR ’000 LKR LKR ’000 LKR ’000 LKR LKR ’000
Softlogic Finance PLC 67,215 3,532 16.70 1,122 67,215 3,532 26.60 1,788
Sinhaputhra Finance PLC 150,000 1,076 6.70 1,005 5,000 45 8.80 44
The Finance Company PLC - Non-voting 200,000 973 - - 200,000 1,000 1.10 220
Union Bank of Colombo PLC 500,000 6,756 13.30 6,650 662,828 8,977 11.00 7,291
168,096 117,256 161,708 121,513
Beverage, Food and Tobacco
Bairaha Farms PLC 144,942 35,751 112.00 16,234 144,942 35,752 124.70 18,074
Cargills (Ceylon) PLC 1,485,775 267,594 193.00 286,755 1,495,784 269,569 200.00 299,157
Ceylon Tobacco Company PLC 143,177 137,100 1,100.30 157,538 143,177 137,100 1,415.00 202,595
Distilleries Company of Sri Lanka PLC 55,000 1,048 18.51 1,018 55,000 1,048 16.10 886
HVA Foods PLC 20,000 905 3.90 78 36,850 988 4.40 162
Keells Food Products PLC 39,058 6,240 122.51 4,785 39,058 6,240 134.00 5,234
Lion Brewery Ceylon PLC - - - - 7,999 4,574 570.00 4,559
Lucky Lanka Milk Processing PLC - Voting
3,514,546 20,958 1.10 3,866
3,514,546 20,958 1.10 3,866
Lucky Lanka Milk Processing PLC - Non-voting 91,900 276 0.80 74 91,900 276 0.80 74
Renuka Agri Foods PLC - - - - 1,697,738 5,266 2.10 3,565
Renuka Foods PLC 50,000 635 12.30 615 29,535 488 13.90 411
470,507 470,963 482,259 538,583
Chemicals and Pharmaceuticals
Chemanex PLC 100,000 16,685 58.50 5,850 100,000 16,685 49.50 4,950
CIC Holdings PLC - Voting 770,657 124,284 60.00 46,239 798,657 125,814 39.60 31,627
CIC Holdings PLC - Non-voting 463,189 42,233 47.60 22,048 466,333 42,494 30.00 13,990
Haycarb PLC 251,067 48,262 190.00 47,703 251,067 48,262 130.00 32,639
Lankem Ceylon PLC 72,400 32,703 25.50 1,846 72,400 32,703 25.00 1,810
264,167 123,686 265,958 85,016
Construction and Engineering
Access Engineering PLC - - - - 196,950 4,445 14.10 2,777
Colombo Dockyard PLC 897,622 201,955 62.00 55,653 902,622 202,255 55.60 50,186
Lankem Developments PLC 575,000 2,990 3.50 2,013 275,000 1,900 4.10 1,128
MTD Walkers PLC 165,000 6,751 14.80 2,442 165,000 6,751 11.00 1,815
211,696 60,108 215,351 55,906

BA
NK
OF
CE
YL
ON
AN
NU
AL
RE
PO
RT
20
19
Notes to the Financial Statements210
About this Report / Performance Highlights 2019 / Chairman’s Message / General Manager’s Review / Organisational Overview / Strategic Report / Performance and Outlook / Stakeholder Value Creation / Financial Reports / Compliance Annexes / Supplementary Information
Group
As at 31 December 2019 2018
No. of
ordinary
shares
Cost of
investment
Market
price per
share
Market
value
No. of
ordinary
shares
Cost of
investment
Market
price per
share
Market
value
LKR ’000 LKR LKR ’000 LKR ’000 LKR LKR ’000
Diversified Holdings
Aitken Spence PLC 2,706,230 371,623 46.50 125,840 2,706,230 371,623 47.80 129,358
Browns Capital PLC - - - - 200,000 991 3.50 700
Browns Investments PLC - - - - 4,373,412 17,322 1.90 8,309
Carson Cumberbatch PLC 313,352 141,328 190.00 59,537 313,352 141,328 170.20 53,333
Dunamis Capital PLC 21,390 1,060 46.61 997 - - - -
Expolanka Holdings PLC 1,716,193 15,964 5.10 8,753 2,441,193 19,512 4.00 9,765
Hayleys PLC 68,097 21,556 174.90 11,910 68,097 21,556 187.00 12,734
Hemas Holdings PLC 30,000 2,537 80.00 2,400 12,500 1,176 88.80 1,110
John Keells Holdings PLC 3,321,028 578,964 167.60 556,604 3,331,028 580,499 159.70 531,965
Melstacorp PLC 22,756 1,140 43.51 990 7,756 465 50.30 390
Richard Pieris and Company PLC 6,889,225 90,662 11.80 81,293 6,919,225 90,975 10.50 72,652
Softlogic Holdings PLC 350,000 5,763 15.90 5,565 50,000 1,030 21.50 1,075
Sunshine Holdings PLC 65,211 3,756 47.00 3,065 60,712 3,531 53.80 3,266
Taprobane Holdings PLC 250,000 1,283 5.00 1,250 250,000 1,283 4.00 1,000
The Colombo Fort Land & Building PLC 230,000 12,077 13.40 3,082 194,299 11,531 15.00 2,914
Vallibel One PLC 2,427,704 70,962 17.50 42,485 2,467,189 71,687 17.00 41,942
1,318,675 903,771 1,334,509 870,513
Footwear and Textiles
Hayleys Fabric PLC 971,398 14,569 17.90 17,388 1,454,506 23,487 9.10 13,236
ODEL PLC 222,295 9,325 26.00 5,780 222,295 9,325 25.50 5,669
23,894 23,168 32,812 18,905
Health Care
Ceylon Hospitals PLC 5,000 500 78.00 390 5,000 500 71.10 356
Nawaloka Hospitals PLC 44,000 467 10.09 444 - - - -
Singhe Hospital PLC 4,000,000 10,000 1.50 6,000 4,000,000 10,000 1.40 5,600
The Lanka Hospital Corporation PLC 344,949 22,015 40.70 14,039 309,949 20,545 42.60 13,204
32,982 20,873 31,045 19,160
Hotels and Travels
Aitken Spence Hotel Holdings PLC 2,610,641 238,449 27.10 70,748 2,610,641 238,463 27.00 70,487
Amaya Leisure PLC 609,553 53,918 36.70 22,371 593,110 53,019 40.00 23,724
Asian Hotels & Properties PLC 2,382,741 226,443 40.50 96,501 2,375,782 226,206 42.90 101,921
Beruwala Resorts PLC - - - - 200,000 180 0.70 140
Citrus Leisure PLC 100,000 10,112 12.10 1,210 100,000 10,112 4.80 480
Eden Hotel Lanka PLC 804,265 45,541 18.40 14,798 890,888 45,184 13.50 12,027

About this Report / Performance Highlights 2019 / Chairman’s Message / General Manager’s Review / Organisational Overview / Strategic Report / Performance and Outlook / Stakeholder Value Creation / Financial Reports / Compliance Annexes / Supplementary Information
211
Group
As at 31 December 2019 2018
No. of
ordinary
shares
Cost of
investment
Market
price per
share
Market
value
No. of
ordinary
shares
Cost of
investment
Market
price per
share
Market
value
LKR ’000 LKR LKR ’000 LKR ’000 LKR LKR ’000
Galadari Hotels (Lanka) PLC 37,280 566 9.10 339 37,280 566 6.90 257
Jetwing Symphony PLC 179,627 2,694 11.30 2,030 179,627 2,694 12.00 2,156
John Keells Hotels PLC 1,118,487 17,108 11.60 12,974 1,093,487 16,888 7.80 8,529
Marawila Resorts PLC 100,000 782 2.00 200 100,000 782 1.80 180
Palm Garden Hotels PLC 147,472 10,890 27.10 3,996 147,472 10,928 21.40 3,156
Tal Lanka Hotels PLC 447,400 30,043 14.40 6,443 447,400 30,043 13.00 5,816
Tangerine Beach Hotels PLC 50,000 5,056 40.00 2,000 50,000 5,056 36.40 1,820
The Fortress Resorts PLC 1,461,100 50,506 11.80 17,241 1,461,100 50,506 9.10 13,296
The Kingsbury PLC 2,161,893 45,360 13.10 28,321 2,161,893 45,359 15.20 32,861
Trans Asia Hotels PLC 477,200 48,407 69.70 33,261 477,200 48,407 87.80 41,898
Waskaduwa Beach Resort PLC - - - - 110,000 464 2.50 275
785,875 312,433 784,857 319,023
Investment Trusts
Ambeon Holdings PLC 385,000 23,271 12.90 4,967 1,085,000 32,634 11.10 12,044
Ceylon Guardian Investment Trust PLC 107,847 32,747 91.30 9,846 107,847 32,747 66.10 7,129
Ceylon Investment PLC 511,930 79,535 51.50 26,364 511,930 79,535 39.00 19,965
Guardian Capital Partners PLC 18,472 1,006 29.99 554 18,472 1,006 24.00 443
Lanka Realty Invesments PLC 750,000 9,841 12.90 9,675 10,000 250 20.60 206
Renuka Holdings PLC 1,454,654 44,249 19.30 28,075 1,211,821 39,639 16.60 20,116
190,649 79,481 185,811 59,903
Land and Property
Cargo Boat Development Company PLC 9,984 899 53.49 534 9,984 899 73.00 729
City Housing & Real Estate CO. PLC 38,435 190 3.59 138 35,935 178 4.90 176
Colombo Land & Development Company PLC 2,700 96 25.93 70 2,700 96 15.00 41
Commercial Development Company PLC 4,649 451 79.16 368 4,649 451 70.10 326
East West Properties PLC 304,020 5,446 8.40 2,554 45,000 768 13.00 585
Kelsey Developments PLC - - - - 2,000 70 30.40 61
Overseas Realty (Ceylon) PLC 957,792 24,815 16.00 15,325 957,792 24,815 16.50 15,804
Property Development PLC 8,547 1,057 140.28 1,199 8,532 1,057 119.20 1,017
Seylan Developments PLC 160,750 2,194 11.50 1,849 100,000 1,610 11.00 1,100
35,148 22,037 29,944 19,839

BA
NK
OF
CE
YL
ON
AN
NU
AL
RE
PO
RT
20
19
Notes to the Financial Statements212
About this Report / Performance Highlights 2019 / Chairman’s Message / General Manager’s Review / Organisational Overview / Strategic Report / Performance and Outlook / Stakeholder Value Creation / Financial Reports / Compliance Annexes / Supplementary Information
Group
As at 31 December 2019 2018
No. of
ordinary
shares
Cost of
investment
Market
price per
share
Market
value
No. of
ordinary
shares
Cost of
investment
Market
price per
share
Market
value
LKR ’000 LKR LKR ’000 LKR ’000 LKR LKR ’000
Manufacturing
Abans Electricals PLC 201,303 27,308 95.70 19,265 202,720 27,449 57.70 11,697
ACL Cables PLC 362,363 16,217 57.50 20,836 1,065,246 45,924 37.00 39,414
ACME Printing & Packaging PLC 1,078,700 35,020 4.90 5,286 1,078,700 35,020 4.20 4,531
Alufab PLC 60,000 1,660 13.80 828 60,000 1,660 16.50 990
Alumex PLC 130,000 2,031 14.80 1,924 80,000 1,386 13.50 1,080
BPPL Holding PLC 100,000 1,205 12.20 1,220 - - - -
Central Industries PLC - - - - 62,560 2,575 28.10 1,758
Ceylon Grain Elevators PLC 637,508 62,445 68.50 43,669 672,498 64,940 59.50 40,014
Chevron Lubricants Lanka PLC 1,016,940 169,692 74.90 76,169 875,394 158,380 72.80 63,729
Dankotuwa Porcelain PLC - - - - 9,100 64 6.50 59
Dipped Products PLC 16,380 1,431 84.00 1,376 - - - -
Hayleys Fibre PLC 1,931 183 92.00 178 - - - -
Kelani Tyres PLC 1,131,213 84,083 49.60 56,108 1,131,213 84,083 35.90 40,611
Lanka Cement PLC 7,265,828 63,576 2.50 18,165 7,265,828 63,576 2.50 18,165
Lanka Tiles PLC 1,023,200 134,249 76.70 78,479 973,200 130,512 73.10 71,141
Lanka Walltiles PLC 14,659 1,048 72.50 1,063 - - - -
Orient Garments PLC 82,150 2,568 7.00 575 82,150 2,568 7.00 575
Pelwatte Sugar Industries PLC 68,400 2,925 - - - - - -
Piramal Glass Ceylon PLC 3,288,600 32,322 4.50 14,799 3,288,600 32,322 3.80 12,497
Richard Pieris Exports PLC - - - - 2,000 470 214.90 430
Royal Ceramics Lanka PLC 87,000 10,557 88.50 7,700 88,399 10,722 74.60 6,595
Sierra Cables PLC 1,829,525 7,120 3.30 6,037 1,719,525 7,247 2.10 3,611
Swisstek (Ceylon) PLC 170,956 10,241 51.70 8,838 176,674 11,924 41.00 7,244
Teejay Lanka PLC - - - - 250,000 8,343 32.50 8,125
Tokyo Cement Company (Lanka) PLC - Voting
- - - - 36,669 1,807 25.20 924
Tokyo Cement Company (Lanka) PLC - Non voting
- - - - 171,833 5,635 23.00 3,952
665,881 362,515 696,607 337,142

About this Report / Performance Highlights 2019 / Chairman’s Message / General Manager’s Review / Organisational Overview / Strategic Report / Performance and Outlook / Stakeholder Value Creation / Financial Reports / Compliance Annexes / Supplementary Information
213
Group
As at 31 December 2019 2018
No. of
ordinary
shares
Cost of
investment
Market
price per
share
Market
value
No. of
ordinary
shares
Cost of
investment
Market
price per
share
Market
value
LKR ’000 LKR LKR ’000 LKR ’000 LKR LKR ’000
Motors
C M Holdings PLC 50,857 17,422 79.00 4,018 50,857 17,422 45.00 2,289
Diesel & Motor Engineering PLC 77,935 84,514 320.00 24,939 77,935 84,514 343.50 26,771
Sathosa Motors PLC 13,195 5,111 303.70 4,007 13,195 5,111 534.50 7,053
United Motors Lanka PLC 421,978 42,235 63.00 26,585 404,478 41,051 78.00 31,549
149,282 59,549 148,098 67,662
Oil Palms
Bukit Darah PLC 119,257 83,965 230.10 27,441 119,257 83,965 205.10 24,460
83,965 27,441 83,965 24,460
Plantations
Agalawatte Plantations PLC 45,600 4,608 15.10 689 45,600 4,608 14.00 638
Balangoda Plantations PLC 30,000 2,184 12.00 360 30,000 2,184 12.70 381
Elpitiya Plantations PLC 60,000 1,704 18.90 1,134 50,000 1,496 19.80 990
Hatton Plantation PLC 50,000 425 6.90 345 - - - -
Horana Plantations PLC 513,000 43,752 21.90 11,235 513,000 43,752 15.00 7,695
Kahawatte Plantations PLC 756,484 30,600 36.50 27,612 757,436 30,638 39.90 30,222
Kegalle Plantations PLC 50,600 13,703 59.50 3,011 50,600 13,703 55.00 2,783
Kotagala Plantations PLC 729,997 34,709 7.20 5,256 729,997 34,709 6.70 4,891
Malwatte Valley Plantations PLC - Voting 64,429 353 4.00 258 64,634 353 4.10 265
Malwatte Valley Plantations PLC - Non Voting 50,000 340 6.20 310 - - - -
Namunukula Plantations PLC 80,000 12,458 84.30 6,744 80,000 12,458 63.80 5,104
Watawala Plantations PLC 19,725 577 26.01 513 19,498 577 19.10 372
145,413 57,467 144,478 53,341
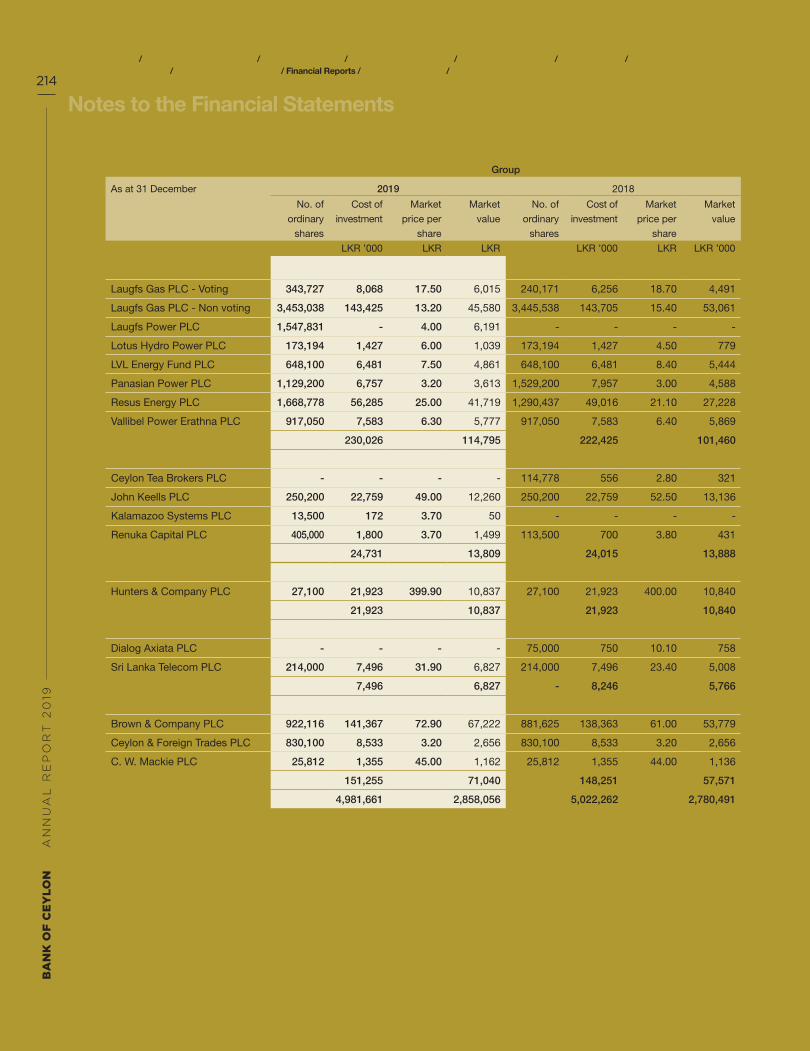
BA
NK
OF
CE
YL
ON
AN
NU
AL
RE
PO
RT
20
19
Notes to the Financial Statements214
About this Report / Performance Highlights 2019 / Chairman’s Message / General Manager’s Review / Organisational Overview / Strategic Report / Performance and Outlook / Stakeholder Value Creation / Financial Reports / Compliance Annexes / Supplementary Information
Group
As at 31 December 2019 2018
No. of
ordinary
shares
Cost of
investment
Market
price per
share
Market
value
No. of
ordinary
shares
Cost of
investment
Market
price per
share
Market
value
LKR ’000 LKR LKR LKR ’000 LKR LKR ’000
Power and Energy
Laugfs Gas PLC - Voting 343,727 8,068 17.50 6,015 240,171 6,256 18.70 4,491
Laugfs Gas PLC - Non voting 3,453,038 143,425 13.20 45,580 3,445,538 143,705 15.40 53,061
Laugfs Power PLC 1,547,831 - 4.00 6,191 - - - -
Lotus Hydro Power PLC 173,194 1,427 6.00 1,039 173,194 1,427 4.50 779
LVL Energy Fund PLC 648,100 6,481 7.50 4,861 648,100 6,481 8.40 5,444
Panasian Power PLC 1,129,200 6,757 3.20 3,613 1,529,200 7,957 3.00 4,588
Resus Energy PLC 1,668,778 56,285 25.00 41,719 1,290,437 49,016 21.10 27,228
Vallibel Power Erathna PLC 917,050 7,583 6.30 5,777 917,050 7,583 6.40 5,869
230,026 114,795 222,425 101,460
Services
Ceylon Tea Brokers PLC - - - - 114,778 556 2.80 321
John Keells PLC 250,200 22,759 49.00 12,260 250,200 22,759 52.50 13,136
Kalamazoo Systems PLC 13,500 172 3.70 50 - - - -
Renuka Capital PLC 405,000 1,800 3.70 1,499 113,500 700 3.80 431
24,731 13,809 24,015 13,888
Stores and Supplies
Hunters & Company PLC 27,100 21,923 399.90 10,837 27,100 21,923 400.00 10,840
21,923 10,837 21,923 10,840
Telecommunications
Dialog Axiata PLC - - - - 75,000 750 10.10 758
Sri Lanka Telecom PLC 214,000 7,496 31.90 6,827 214,000 7,496 23.40 5,008
7,496 6,827 - 8,246 5,766
Trading
Brown & Company PLC 922,116 141,367 72.90 67,222 881,625 138,363 61.00 53,779
Ceylon & Foreign Trades PLC 830,100 8,533 3.20 2,656 830,100 8,533 3.20 2,656
C. W. Mackie PLC 25,812 1,355 45.00 1,162 25,812 1,355 44.00 1,136
151,255 71,040 148,251 57,571
Total quoted equities 4,981,661 2,858,056 5,022,262 2,780,491

About this Report / Performance Highlights 2019 / Chairman’s Message / General Manager’s Review / Organisational Overview / Strategic Report / Performance and Outlook / Stakeholder Value Creation / Financial Reports / Compliance Annexes / Supplementary Information
215
26.3 Quoted Debt Securities
Group
As at 31 December 2019 2018
No. of
Debentures
Cost of
investment
Market
Price per
Debentures
Market
value
No. of
Debentures
Cost of
investment
Market
price per
Debentures
Market
value
LKR ’000 LKR LKR ’000 LKR ’000 LKR LKR ’000
Listed Debentures
Hatton National Bank PLC 17,500 1,600 91.40 1,600 17,500 1,600 98.00 1,715
Total quoted debt securities 1,600 1,600 1,600 1,715
26.4 Units in Unit Trusts
As at 31 December 2019 2018
No. of units Cost of investment
Market Value
No. of units Cost of investment
Market Value
LKR ’000 LKR ’000 LKR ’000 LKR ’000
Bank
Ceybank Unit Trust 111,307,627 1,738,215 2,321,877 111,307,627 1,738,215 2,159,368
Ceybank Century Growth Fund 7,539,256 132,952 470,676 7,539,256 132,952 444,364
Ceybank Surekum Gilt Edged Fund 4,921 50 58 4,921 50 53
Total units in unit trusts 1,871,217 2,792,611 1,871,217 2,603,785
Group
Ceybank Unit Trust 111,307,627 1,738,215 2,321,877 111,307,627 1,738,215 2,159,368
Ceybank Century Growth Fund 7,539,256 132,952 470,676 7,539,256 132,952 444,364
Ceybank Surekum Gilt Edged Fund 4,921 50 58 4,921 50 53
Comtrust Money Market Fund 163,821 1,500 1,654 163,821 1,500 1,225
First Capital Asset Management Limited 25,932 29,350 40,661 25,932 29,350 30,106
Total units in unit trusts 1,902,067 2,834,926 1,902,067 2,635,116

BA
NK
OF
CE
YL
ON
AN
NU
AL
RE
PO
RT
20
19
Notes to the Financial Statements216
About this Report / Performance Highlights 2019 / Chairman’s Message / General Manager’s Review / Organisational Overview / Strategic Report / Performance and Outlook / Stakeholder Value Creation / Financial Reports / Compliance Annexes / Supplementary Information
27 Financial Assets at Amortised Cost - Loans and Advances
Accounting Policy
“Loans and advances” include non-derivative financial assets with fixed or determinable payments that are not quoted in an active market, other than:
- Those that the Bank intends to sell immediately or in the near term and those that the Bank, upon initial recognition, designates as at fair value through profit or loss
- Those that the Bank, upon initial recognition, designates as fair value through OCI
- Those for which the Bank may not recover substantially all of its initial investment, other than due to credit deterioration
“Loans and advances” are initially measured at fair value and subsequently measured at amortised cost using the Effective Interest Rate (EIR), less allowance for impairment. Amortised cost is calculated by taking into account any discount or premium on acquisition and fees and costs that are an integral part of the EIR. The amortisation is included in “Interest income” (Note 8.1) in the Statement of Profit or Loss. The losses arising from impairment are recognised in “Impairment charge/(reversal) for loans and other losses” (Note 14) in the Statement of Profit or Loss.
Write-off of Loans and Advances
Loans together with the associated allowance are written off when there is no realistic prospect of future recovery and all collateral has been realised . If a write-off is later recovered, the recovery is recognised in the “Net Other operating income” (Note 13).
Collateral Valuation
The Group seeks to use collateral, where possible, to mitigate its risks on financial assets. The collateral comes in various forms such as cash, gold, securities, letters of credit/ guarantees, real estate, inventories, other non-financial assets and credit enhancements such as netting arrangements. The fair value of collateral is generally assessed, at a minimum, at inception and based on the guidelines issued by Central Bank of Sri Lanka, there on.
Non-financial collaterals, including immovable and movables, are valued based on data provided by the independent professional valuers and Audited Financial Statements.
Collaterals Repossessed
The Group’s policy is to dispose of repossessed properties (Foreclosed properties) in an orderly fashion. The proceeds are used to reduce or repay the outstanding claim. In general, the Group does not occupy repossessed properties for business use.
Renegotiated Loans (Restructured or Rescheduled)
Where possible, the Group seeks to renegotiate loans rather than take possession of collateral. This may involve extending the payment arrangements and agreement of new loan conditions. Once the terms have been renegotiated, any impairment is measured using the original EIR as calculated before the modification of terms. The management continously reviews renegotiated loans to ensure that all criteria are met and that future payments are likely to occur. The loans continue to be subject to an individual or collective impairment assessment, calculated using the loan’s original EIR. Further the Bank may consider modifications for original terms and conditions to retain customer, support customer or/ and expansions.
Expected Credit Loss (ECL)
The Bank's impairment provisioning method has fundamentaly changed due to the adoption of SLFRS 9 by replacing LKAS 39 incurred loss approach with forward looking expected loss approach as mentioned in Note 4.5.11 to this Financial Statements. Accordingly, the Bank has recorded an expected credit loss allowance for all loans and other debt financial

About this Report / Performance Highlights 2019 / Chairman’s Message / General Manager’s Review / Organisational Overview / Strategic Report / Performance and Outlook / Stakeholder Value Creation / Financial Reports / Compliance Annexes / Supplementary Information
217
assets except which are held at FVPL, together with loan commitments and financial guarantee contracts which are commonly referred to as “financial instruments”.
The ECL allowance is based on the credit losses expected to arise over the life of the asset, the Lifetime Expected Credit Loss (LTECL) as outlined in Notes 4.5.11.2 and 4.5.11.3, if there has been no significant increase in credit risk since origination, in which case, the allowance is based on the 12 months’ expected credit loss (12mECL) as outlined in Note 4.5.11.1 to the Financial Statements. The Bank’s policies for determining whether there has been a significant increase in credit risk are set out in this note.
Both LTECLs and 12mECLs are calculated either on an individual basis or on collective basis, depending on the nature and size of the underlying portfolio of financial instruments. The Bank’s policy for grouping financial instruments measured on a collective basis is explained in Note 4.5.11.5.
The Bank has established a policy to perform an assessment, at the end of each Reporting period, of whether a financial instrument’s credit risk has increased significantly since initial recognition, by considering the change in the risk of default occurring over the remaining life of the financial instrument.
Based on the above process, the Bank grouped its loans into Stage 1, Stage 2, Stage 3 as described in Note 4.5.11.1 to 4.5.11.3 to this Financial Statements.
For financial assets in respect of which the Bank has no reasonable expectations of recovering either the entire outstanding amount, or a proportion thereof, the gross carrying amount of the financial asset is reduced.
The componenets of the ECL calculation is outlined under Note 4.5.11.4 to this Financial Statements and when estimating the ECLs, the Bank considers three economic scenarios (base case, best case and worst case). Each of these scenarios are associated with different loss rates.
For all products the Bank considers the maximum period over which the credit losses are determined is the contractual life of a financial instrument.
Impairment losses and reversals are accounted for and disclosed separately from modification losses or gains that are accounted for as an adjustment of the financial asset’s gross carrying value.
The methodology of the ECL are summarised below:
Stage 1 The 12mECL is calculated as the portion of LTECLs that represent the ECLs that result from default events on a financial instrument that are possible within the 12 months after the Reporting date. The Bank calculates the 12mECL allowance based on the expectation of a default occurring in the 12 months following the Reporting date. These expected 12-month default probabilities are applied to a forecast EAD and multiplied by the expected LGD and discounted by an approximation to the original EIR.
Stage 2 When a loan has shown a significant increase in credit risk since origination, the Bank records an allowance for the LTECLs. The mechanics are similar to those explained above, including the use of multiple scenarios, but PDs and LGDs are based over the lifetime of the facility. The expected cash shortfalls are discounted by an approximation to the original EIR.
Stage 3 For loans considered credit-impaired, the Bank recognises LTECLs. The method is similar to that of Stage 2, but PD is considered as 100%.

BA
NK
OF
CE
YL
ON
AN
NU
AL
RE
PO
RT
20
19
Notes to the Financial Statements218
About this Report / Performance Highlights 2019 / Chairman’s Message / General Manager’s Review / Organisational Overview / Strategic Report / Performance and Outlook / Stakeholder Value Creation / Financial Reports / Compliance Annexes / Supplementary Information
Loan Commitments and Letters of Credit
When estimating LTECLs for undrawn loan commitments, the Bank estimates the expected portion of the loan commitment that will be drawn down over its expected life. The ECL is then based on the present value of the expected shortfalls in cash flows if the loan is drawn down, based on a probability-weighting of the three scenarios. The expected cash shortfalls are discounted at an approximation to the expected EIR on the loan. For credit cards and revolving facilities, that include both a loan and an undrawn commitment, ECLs are calculated and presented together with the loan, loan commitments, letters of credit, guarantees and acceptances.
Financial Guarantee Contracts
The Bank's liability under each guarantee is measured at the higher of the amount initially recognised less cumulative amortisation recognised in the statement of profit or loss, and the ECL provision. For this purpose, the Bank estimates ECLs based on the present value of the expected payments to reimburse the holder for a credit loss that it incurs. The shortfalls are discounted by the risk adjusted interest rate relevant to the exposure. The calculation is made using a probability-weighting of the three scenarios.
Revolving Facilities
The Bank’s product offering includes a variety of corporate and retail overdraft and credit card facilities, in which the Bank has the right to cancel and/or reduce the facilities with one day’s notice. The Bank does not limit its exposure to credit losses to the contractual notice period, but, instead calculates ECL over a period that reflects the Bank’s expectations of the customer behaviour, its likelihood of default and the Bank’s future risk mitigation procedures, which could include reducing or cancelling the facilities.
The ongoing assessment of whether a significant increase in credit risk has occurred for revolving facilities is similar to other lending products. This is based on shifts in the customer’s delinquency.
The calculation of ECLs, including the estimation of the expected period of exposure and discount rate is made on an individual basis for individually significant loans and on a collective basis for other loans. The collective assessments are made separately for portfolios of facilities with similar homogeneous characteristics.
Forward Looking Information
In its ECL models, the Bank relies on a broad range of forward looking information as economic inputs, such as:
- GDP growth
- Interest rate
- Inflation
- Exchange rate
- Unemployment rates
- Average LTV
- Government policies, status of the industry and impact of regulatory changes etc.
Impairment Assessment
Definition of Default and Upgrade
The Bank considers a financial instrument defaulted and therefore assessed in Stage 3 (as credit-impaired) for ECL calculations in all cases when the borrower becomes 90 days past due on its contractual payments or the credit facility/ customer is classified as a non-performing advance in accordance with CBSL directions.
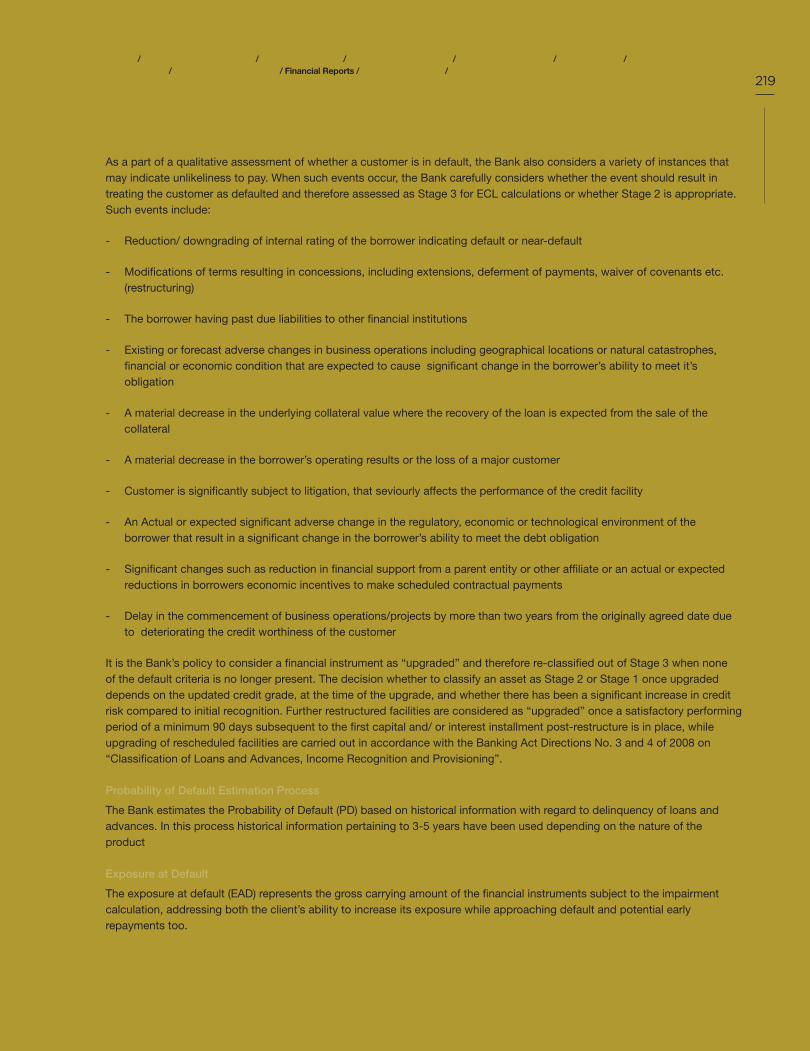
About this Report / Performance Highlights 2019 / Chairman’s Message / General Manager’s Review / Organisational Overview / Strategic Report / Performance and Outlook / Stakeholder Value Creation / Financial Reports / Compliance Annexes / Supplementary Information
219
As a part of a qualitative assessment of whether a customer is in default, the Bank also considers a variety of instances that may indicate unlikeliness to pay. When such events occur, the Bank carefully considers whether the event should result in treating the customer as defaulted and therefore assessed as Stage 3 for ECL calculations or whether Stage 2 is appropriate. Such events include:
- Reduction/ downgrading of internal rating of the borrower indicating default or near-default
- Modifications of terms resulting in concessions, including extensions, deferment of payments, waiver of covenants etc.(restructuring)
- The borrower having past due liabilities to other financial institutions
- Existing or forecast adverse changes in business operations including geographical locations or natural catastrophes, financial or economic condition that are expected to cause significant change in the borrower’s ability to meet it’s obligation
- A material decrease in the underlying collateral value where the recovery of the loan is expected from the sale of the collateral
- A material decrease in the borrower’s operating results or the loss of a major customer
- Customer is significantly subject to litigation, that seviourly affects the performance of the credit facility
- An Actual or expected significant adverse change in the regulatory, economic or technological environment of the borrower that result in a significant change in the borrower’s ability to meet the debt obligation
- Significant changes such as reduction in financial support from a parent entity or other affiliate or an actual or expected reductions in borrowers economic incentives to make scheduled contractual payments
- Delay in the commencement of business operations/projects by more than two years from the originally agreed date due to deteriorating the credit worthiness of the customer
It is the Bank’s policy to consider a financial instrument as “upgraded” and therefore re-classified out of Stage 3 when none of the default criteria is no longer present. The decision whether to classify an asset as Stage 2 or Stage 1 once upgraded depends on the updated credit grade, at the time of the upgrade, and whether there has been a significant increase in credit risk compared to initial recognition. Further restructured facilities are considered as “upgraded” once a satisfactory performing period of a minimum 90 days subsequent to the first capital and/ or interest installment post-restructure is in place, while upgrading of rescheduled facilities are carried out in accordance with the Banking Act Directions No. 3 and 4 of 2008 on “Classification of Loans and Advances, Income Recognition and Provisioning”.
Probability of Default Estimation Process
The Bank estimates the Probability of Default (PD) based on historical information with regard to delinquency of loans and advances. In this process historical information pertaining to 3-5 years have been used depending on the nature of the product
Exposure at Default
The exposure at default (EAD) represents the gross carrying amount of the financial instruments subject to the impairment calculation, addressing both the client’s ability to increase its exposure while approaching default and potential early repayments too.

BA
NK
OF
CE
YL
ON
AN
NU
AL
RE
PO
RT
20
19
Notes to the Financial Statements220
About this Report / Performance Highlights 2019 / Chairman’s Message / General Manager’s Review / Organisational Overview / Strategic Report / Performance and Outlook / Stakeholder Value Creation / Financial Reports / Compliance Annexes / Supplementary Information
To calculate the EAD for a Stage 1 loan facilities, the Bank assesses the possible default events within 12 months in the calculation of the 12mECL. For Stage 2, Stage 3 and Purchased or Originated Credit Impaires (POCI) financial assets, the exposure at default is considered for events over the lifetime of the instruments.
The Bank determines EADs by modelling the range of possible exposure outcomes at various points in time. PDs are then assigned to the EAD so derived.
Loss Given Default
The Bank segments its lending portfolio into homogeneous portfolios, based on key characteristics that are relevant to the estimation of future cash flows. The loss given default is estimated based on historically collected loss data.
Increase in Credit Risk
The Bank continuously monitors all assets subject to ECLs. In order to determine whether an instrument or a portfolio of instruments is subject to 12mECL or LTECL, the Bank assesses whether there has been a significant increase in credit risk since initial recognition. The Bank considers an exposure to have significantly increased in credit risk when the borrower becomes 30 days past due from the contractual due date.
The Bank also applies a secondary qualitative method for triggering a significant increase in credit risk for an asset, such as moving a customer/facility to the watch list, or reschedulement or restructure. Regardless of the change in credit grades, if contractual payments are more than 30 days past due, the credit risk is deemed to have increased significantly since initial recognition.
When estimating ECLs on a collective basis for a group of similar assets, the Bank applies the same principles for assessing whether there has been a significant increase in credit risk since initial recognition.
Grouping Financial Assets Measured on an Individual Basis/ Collective Basis
ECLs are calculated either on a collective or an individual basis, depends on the following factors.
The Bank calculates ECL on an individual basis for corporate and SME exposures identified as individually significant loans and investments in debt securities. All other exposures other than the above together with individually significant exposures not attracting an ISL provision are assessed for ECL on a collective basis. The Bank groups these exposures into smaller homogeneous portfolios, based on product type sector and customer segment.

About this Report / Performance Highlights 2019 / Chairman’s Message / General Manager’s Review / Organisational Overview / Strategic Report / Performance and Outlook / Stakeholder Value Creation / Financial Reports / Compliance Annexes / Supplementary Information
221
27.1 Financial Assets at Amortised Cost - Loans and Advances
Bank Group
As at 31 December 2019 2018 2019 2018
LKR ’000 LKR ’000 LKR ’000 LKR ’000
Gross loans and advances
1,648,760,589
1,510,534,078
1,682,589,120
1,544,355,486
Stage 1 1,380,927,013 1,294,790,735 1,396,100,809 1,319,427,641
Stage 2 101,146,342 78,528,007 106,780,647 82,329,469
Stage 3 166,687,234 137,215,336 179,707,664 142,598,376
Less : Accumulated impairment 98,955,718 81,426,897 101,640,095 83,736,898
Stage 1 [Note 27.2] 6,954,029 10,091,396 7,087,327 10,437,278
Stage 2 [Note 27.2] 9,530,117 10,140,798 9,646,175 10,383,179
Stage 3 [Note 27.2] 82,471,572 61,194,703 84,906,593 62,916,441
Net loans and advances 1,549,804,871 1,429,107,181 1,580,949,025 1,460,618,588
27.1.1 Analysis of Gross Loans and Advances - by Product
Bank
As at 31 December 2019 2018
Local currency loans
Foreign currency
loans
Total Local currency loans
Foreign currency
loans
Total
LKR ’000 LKR ’000 LKR ’000 LKR ’000 LKR ’000 LKR ’000
Term loans 452,776,469 312,849,314 765,625,783 332,813,980 299,677,694 632,491,674
Loans under schemes 76,944,532 - 76,944,532 68,916,645 - 68,916,645
Housing loans 76,065,512 376,549 76,442,061 67,516,430 259,951 67,776,381
Trade finance 61,494,354 34,715,177 96,209,531 53,171,938 37,391,521 90,563,459
Personal loans 214,236,288 - 214,236,288 207,143,891 - 207,143,891
Overdrafts 237,239,577 33,887,024 271,126,601 269,901,138 26,993,663 296,894,801
Credit cards 5,037,574 - 5,037,574 4,345,178 - 4,345,178
Lease rental receivables [Note 27.4] 39,233,313 237,828 39,471,141 47,746,892 215,693 47,962,585
Pawning 69,089,836 - 69,089,836 57,873,578 - 57,873,578
Foreclosed properties 1,523,199 4,487 1,527,686 1,283,378 625,879 1,909,257
Staff loans 20,701,770 14,506 20,716,276 16,774,028 12,426 16,786,454
Other 9,618,713 2,714,567 12,333,280 14,831,527 3,038,648 17,870,175
1,263,961,137 384,799,452 1,648,760,589 1,142,318,603 368,215,475 1,510,534,078

BA
NK
OF
CE
YL
ON
AN
NU
AL
RE
PO
RT
20
19
Notes to the Financial Statements222
About this Report / Performance Highlights 2019 / Chairman’s Message / General Manager’s Review / Organisational Overview / Strategic Report / Performance and Outlook / Stakeholder Value Creation / Financial Reports / Compliance Annexes / Supplementary Information
Group
As at 31 December 2019 2018
Local currency loans
Foreign currency
loans
Total Local currency loans
Foreign currency
loans
Total
LKR ’000 LKR ’000 LKR ’000 LKR ’000 LKR ’000 LKR ’000
Term loans 459,252,616 314,743,458 773,996,074 337,897,738 302,527,377 640,425,115
Loans under schemes 77,930,003 - 77,930,003 69,873,066 - 69,873,066
Housing loans 77,960,039 376,549 78,336,588 68,751,323 259,951 69,011,274
Trade finance 61,719,233 35,120,389 96,839,622 53,342,440 37,391,521 90,733,961
Personal loans 215,814,602 - 215,814,602 211,868,476 - 211,868,476
Overdrafts 237,161,078 34,875,569 272,036,647 269,522,956 27,088,774 296,611,730
Credit cards 5,037,574 - 5,037,574 4,345,178 - 4,345,178
Lease rental receivables [Note 27.4] 56,081,004 237,828 56,318,832 65,073,155 215,693 65,288,848
Pawning 70,703,614 - 70,703,614 59,349,689 - 59,349,689
Foreclosed properties 1,523,199 4,487 1,527,686 1,283,378 625,879 1,909,257
Staff loans 21,690,284 24,314 21,714,598 17,047,122 21,595 17,068,717
Other 9,618,713 2,714,567 12,333,280 14,831,527 3,038,648 17,870,175
1,294,491,959 388,097,161 1,682,589,120 1,173,186,048 371,169,438 1,544,355,486
27.1.2 Analysis of gross loans and advances - by currency
Bank Group
As at 31 December 2019 2018 2019 2018
LKR ’000 LKR ’000 LKR ’000 LKR ’000
Sri Lankan Rupees
1,263,961,137
1,142,318,603
1,294,491,959
1,173,186,048
United States Dollar 362,383,222 349,705,155 362,252,540 349,705,155
Great Britain Pound 321,229 487,348 3,749,621 3,441,311
Maldevian Rufiyaa 9,059,543 7,885,935 9,059,543 7,885,935
Euro 710,662 619,114 710,661 619,114
Indian Rupee 9,995,210 8,219,428 9,995,210 8,219,428
Seychellois Rupee 2,324,856 1,229,463 2,324,856 1,229,463
Other 4,730 69,032 4,730 69,032
Gross Total 1,648,760,589 1,510,534,078 1,682,589,120 1,544,355,486
27.2 Movement in Provision for Impairment during the year
Bank Group
2019 2018 2019 2018
LKR ’000 LKR ’000 LKR ’000 LKR ’000
Movement in Stage 1 Impairment
Opening balance as at 1 January 10,091,396 8,033,120 10,437,278 8,350,557
Charge/ (Reversal) during the year (3,135,377) 2,010,203 (3,268,464) 2,038,648
Amount recovered/ reversal during the year - - - -
Exchange rate variance on foreign currency impairment (1,990) 48,073 (1,990) 48,073
Amount written-off during the year - - - -
Other movements - - (79,497) -
Closing balance as at 31 December 6,954,029 10,091,396 7,087,327 10,437,278

About this Report / Performance Highlights 2019 / Chairman’s Message / General Manager’s Review / Organisational Overview / Strategic Report / Performance and Outlook / Stakeholder Value Creation / Financial Reports / Compliance Annexes / Supplementary Information
223
Bank Group
2019 2018 2019 2018
LKR ’000 LKR ’000 LKR ’000 LKR ’000
Movement in Stage 2 Impairment
Opening balance as at 1 January 10,140,798 11,950,472 10,383,179 12,185,663
Charge/ (Reversal) during the year 45,356 (2,123,633) (31,134) (2,116,443)
Amount recovered/ reversal during the year - - - -
Exchange rate variance on foreign currency impairment 7,009 310,827 7,009 310,827
Amount written-off during the year (93,842) - (93,842) -
Other movements (569,204) 3,132 (619,037) 3,132
Closing balance as at 31 December 9,530,117 10,140,798 9,646,175 10,383,179
Bank Group
2019 2018 2019 2018
LKR ’000 LKR ’000 LKR ’000 LKR ’000
Movement in Stage 3 Impairment
Opening balance as at 1 January 61,194,703 46,458,951 62,916,441 48,304,169
Charge/ (Reversal) during the year 27,304,614 18,844,621 27,604,313 18,943,309
Amount recovered during the year (6,029,897) (4,466,761) (6,029,897) (4,466,761)
Exchange rate variance on foreign currency impairment 2,152 323,523 2,152 323,523
Amount written-off during the year - (35,064) - (35,064)
Other movements - 69,433 413,584 (152,735)
Closing balance as at 31 December 82,471,572 61,194,703 84,906,593 62,916,441
Bank Group
2019 2018 2019 2018
LKR ’000 LKR ’000 LKR ’000 LKR ’000
Movement in Total Impairment
Opening balance as at 1 January 81,426,897 66,442,543 83,736,898 68,840,389
Charge/ (Reversal) during the year 24,214,593 18,731,191 24,304,715 18,865,514
Amount recovered during the year (6,029,897) (4,466,761) (6,029,897) (4,466,761)
Exchange rate variance on foreign currency impairment 7,171 682,423 7,171 682,423
Amount written-off during the year (93,842) (35,064) (93,842) (35,064)
Other movements (569,204) 72,565 (284,950) (149,603)
Closing balance as at 31 December 98,955,718 81,426,897 101,640,095 83,736,898
27.3 Sensitivity Factors Used to Calculate Impairement Provision
As at 31 December 2019 Sensitivity Sensitivity Effect on Impairment Provisions
LKR ’000
Change in Loss Given Default (LGD) 1% 3,308,449
-1% (3,308,449)
Change in Economic Factor Adjustment (EFA)Worst case degrades by 5% 266,811
Worst case upgrades by 5% (117,321)
Change in deemed closed periodAdvanced by one year 1,087,073
Deferred by one year (691,047)

BA
NK
OF
CE
YL
ON
AN
NU
AL
RE
PO
RT
20
19
Notes to the Financial Statements224
About this Report / Performance Highlights 2019 / Chairman’s Message / General Manager’s Review / Organisational Overview / Strategic Report / Performance and Outlook / Stakeholder Value Creation / Financial Reports / Compliance Annexes / Supplementary Information
27.4 Lease Rentals Receivable
Accounting Policy
Assets leased to customers, which transfer substantially all the risks and rewards associated with ownership, other than legal title, are classified as finance leases. Amounts receivable under finance leases are classified as lease and hire purchase receivables and presented within loans and receivables to customers in the Statement of Financial Position, after deduction of unearned lease income and the impairment for rentals doubtful of recovery. Lease receivables are collectively assessed for impairment to the Financial Statements.
Bank Group
As at 31 December 2019 2018 2019 2018
LKR ’000 LKR ’000 LKR ’000 LKR ’000
Gross lease rentals receivable
Less than one year 19,515,078 24,184,301 19,515,078 24,184,301
One to five years 28,107,784 33,098,757 48,183,942 54,871,750
More than five years 217,022 398,055 217,022 398,055
Total lease rental receivables 47,839,884 57,681,113 67,916,042 79,454,106
Less : Unearned finance income 8,368,743 9,718,528 11,597,210 14,165,258
Gross lease rentals receivable 39,471,141 47,962,585 56,318,832 65,288,848
Less : Provision for impairment losses 951,025 643,537 2,205,989 1,522,041
Net lease rentals receivable 38,520,116 47,319,048 54,112,843 63,766,807
28 Financial Assets at Amortised Cost - Debt and Other Instruments
Accounting Policy
Financial assets measured at amortised cost - debt instruments are initially measured at fair value. After initial measurement, subsequently measured at amortised cost using the Effective Interest Rate (EIR) less impairment. Amortised cost is calculated by taking into account any discount or premium on acquisition and fees that are an integral part of the EIR. The amortisation is included in “Interest income” (Note 8.1) in the Statement of Profit or Loss. The losses arising from impairment of such investments are recognised in the Statement of Profit or Loss under “ Impairment charge/ (reversal) for loans and other losses” (Note 14).
Bank Group
As at 31 December 2019 2018 2019 2018
LKR ’000 LKR ’000 LKR ’000 LKR ’000
Government securities
Treasury bills 86,244,210 82,811,177 86,259,781 82,827,270
Treasury bonds 264,122,853 242,438,336 264,124,367 242,600,418
Sri Lanka soverign bonds 27,554,926 7,098,782 27,760,406 7,627,488
Sri Lanka Development Bonds [Note 28.4] 171,518,741 195,282,304 171,882,799 195,282,304
Governement of Sri Lanka Restructuring Bonds [Note 28.5] 8,968,474 8,968,474 8,968,474 8,968,474
Debentures [Note 28.6] 6,157,124 7,491,679 6,157,124 7,367,880
Trust certificates [Note 28.7] 338,826 676,557 338,826 676,557
Government securities - Other countries 10,016,586 8,857,014 10,016,586 8,857,014
Corporate bonds - - 596,692 547,710
Other Investments - - 79,607 65,142
Gross financial assets at amortised cost - debt and other instruments 574,921,740 553,624,323 576,184,662 554,820,257
Less: Accumulated impairment [Note 28.3] 2,173,931 1,784,874 2,207,332 1,787,107
Net financial assets at amortised cost - debt and other instruments 572,747,809 551,839,449 573,977,330 553,033,150

About this Report / Performance Highlights 2019 / Chairman’s Message / General Manager’s Review / Organisational Overview / Strategic Report / Performance and Outlook / Stakeholder Value Creation / Financial Reports / Compliance Annexes / Supplementary Information
225
28.1 By Currency
Bank Group
As at 31 December 2019 2018 2019 2018
LKR ’000 LKR ’000 LKR ’000 LKR ’000
Sri Lankan Rupee 365,831,487 342,386,223 365,848,572 342,460,599
United States Dollar 199,073,667 202,381,086 199,643,205 202,909,792
Great Britain Pound - - 676,299 612,852
Maldivian Rufiyaa 10,016,586 8,857,014 10,016,586 8,837,014
Total 574,921,740 553,624,323 576,184,662 554,820,257
28.2 Analysis of Financial Assets at Amortised Cost - Debt and Other Instruments based on Exposure to Credit Risk
Bank
As at 31 December 2019 2018
Stage 1 Stage 2 Stage 3 Total Total
LKR ’000 LKR ’000 LKR ’000 LKR ’000 LKR ’000
Sri Lanka soverign bonds 27,554,926 - - 27,554,926 7,098,782
Sri Lanka Development Bonds 171,518,741 - - 171,518,741 195,282,304
Debentures 6,130,912 - 26,212 6,157,124 7,491,679
Trust certificates 338,826 - - 338,826 676,557
Government securities - Other countries 10,016,586 - - 10,016,586 8,857,014
215,559,991 - 26,212 215,586,203 219,406,336
Less: Accumulated impairment 2,147,719 - 26,212 2,173,931 1,784,874
Total 213,412,272 - - 213,412,272 217,621,462
Group
As at 31 December 2019 2018
Stage 1 Stage 2 Stage 3 Total TotalLKR ’000 LKR ’000 LKR ’000 LKR ’000 LKR ’000
Sri Lanka soverign bonds 27,760,406 - - 27,760,406 7,627,488
Sri Lanka Development Bonds 171,882,799 - - 171,882,799 195,282,304
Debentures 6,130,912 - 26,212 6, 157,124 7,367,880
Trust certificates 338,826 - - 338,826 676,557
Government securities - Other countries 10,016,586 - - 10,016,586 8,857,014
Corporate bonds 596,692 - - 596,692 547,710
Other investments 79,607 - - 79,607 65,142
216,805,828 - 26,212 216,832,040 220,424,095
Less: Accumulated impairment 2,181,120 - 26,212 2,207,332 1,787,107
Total 214,624,708 - - 214,624,708 218,636,988

BA
NK
OF
CE
YL
ON
AN
NU
AL
RE
PO
RT
20
19
Notes to the Financial Statements226
About this Report / Performance Highlights 2019 / Chairman’s Message / General Manager’s Review / Organisational Overview / Strategic Report / Performance and Outlook / Stakeholder Value Creation / Financial Reports / Compliance Annexes / Supplementary Information
28.3 Movement in Impairment During the Year
Bank Group
2019 2018 2019 2018
LKR ’000 LKR ’000 LKR ’000 LKR ’000
Stage 1
Openning balance as at 1 January 1,758,662 1,038,872 1,760,895 1,039,648
Charge/(Reversal) during the year 389,057 731,392 420,224 732,850
Exchange rate adjustments and other movements - (11,602) 1 (11,603)
Closing Balance as at 31 December 2,147,719 1,758,662 2,181,120 1,760,895
Bank Group
2019 2018 2019 2018
LKR ’000 LKR ’000 LKR ’000 LKR ’000
Stage 3
Openning balance as at 1 January 26,212 - 26,212 -
Charge/(Reversal) during the year - 26,212 - 26,212
Closing Balance as at 31 December 26,212 26,212 26,212 26,212
Bank Group
2019 2018 2019 2018
LKR ’000 LKR ’000 LKR ’000 LKR ’000
Total
Openning balance as at 1 January 1,784,874 1,038,872 1,787,107 1,039,648
Charge/(Reversal) during the year 389,057 757,604 420,224 759,062
Exchange rate adjustments and other movements - (11,602) 1 (11,603)
Closing Balance as at 31 December 2,173,931 1,784,874 2,207,332 1,787,107

About this Report / Performance Highlights 2019 / Chairman’s Message / General Manager’s Review / Organisational Overview / Strategic Report / Performance and Outlook / Stakeholder Value Creation / Financial Reports / Compliance Annexes / Supplementary Information
227
28.4 Sri Lanka Development Bonds (US Dollar bonds)
Bank
As at 31 December 2019 2018
Date ofmaturity
Cost of investment
Amortised cost
Cost of investment
Amortised cost
LKR ’000 LKR ’000 LKR ’000 LKR ’000
Fixed Rate
Sri Lanka Development Bonds - Fixed Rate 5.25% 01.05.2021 126,015,853 127,127,121 126,790,053 127,908,229
Sri Lanka Development Bonds - Fixed Rate 5.70% 01.05.2022 908,170 916,859 913,750 922,492
Sri Lanka Development Bonds - Fixed Rate 5.75% 01.05.2022 908,170 916,934 913,750 922,568
Sri Lanka Development Bonds - Fixed Rate 5.80% 01.05.2022 908,170 917,010 913,750 922,644
Sri Lanka Development Bonds - Fixed Rate 5.85% 01.05.2022 908,170 917,085 913,750 922,720
Sri Lanka Development Bonds - Fixed Rate 5.90% 01.05.2022 908,170 917,161 913,750 922,796
Sri Lanka Development Bonds - Fixed Rate 5.75% 01.05.2023 908,170 916,934 913,750 922,568
Floating Rate
6 months LIBOR plus 325 basis points 30.01.2019 - - 4,568,748 4,682,037
6 months LIBOR plus 335 basis points 30.01.2019 - - 4,568,747 4,683,995
6 months LIBOR plus 345 basis points 30.01.2019 - - 4,568,748 4,685,953
6 months LIBOR plus 330 basis points 17.03.2019 - - 5,482,497 5,576,639
6 months LIBOR plus 335 basis points 17.03.2019 - - 5,482,497 5,577,436
6 months LIBOR plus 340 basis points 17.03.2019 - - 4,875,767 4,960,909
6 months LIBOR plus 370 basis points 17.03.2020 4,540,850 4,617,232 4,568,748 4,652,513
6 months LIBOR plus 375 basis points 17.03.2020 5,449,020 5,541,472 5,482,497 5,583,813
6 months LIBOR plus 380 basis points 17.03.2020 908,170 923,711 913,750 930,768
6 months LIBOR plus 360 basis points 01.04.2020 4,540,850 4,606,102 4,568,748 4,640,590
6 months LIBOR plus 370 basis points 01.04.2020 4,540,850 4,607,246 4,568,748 4,641,740
6 months LIBOR plus 340 basis points 30.07.2020 1,816,340 1,860,074 - -
6 months LIBOR plus 365 basis points 30.07.2020 908,170 931,010 - -
6 months LIBOR plus 390 basis points 30.07.2020 908,170 931,983 - -
6 months LIBOR plus 415 basis points 30.07.2020 908,170 932,956 - -
6 months LIBOR plus 430 basis points 30.07.2020 908,170 933,539 - -
6 months LIBOR plus 440 basis points 30.07.2020 1,816,340 1,867,857 - -
6 months LIBOR plus 350 basis points 22.01.2022 908,170 931,464 913,750 938,642
6 months LIBOR plus 355 basis points 22.01.2022 908,170 931,669 913,750 938,849
6 months LIBOR plus 365 basis points 22.01.2022 908,170 932,079 913,750 939,261
6 months LIBOR plus 375 basis points 22.01.2022 908,170 932,489 913,750 939,673
6 months LIBOR plus 380 basis points 16.03.2022 908,170 923,874 913,750 930,930
6 months LIBOR plus 385 basis points 16.03.2022 908,170 924,007 913,750 931,064
6 months LIBOR plus 385 basis points 17.03.2022 1,816,340 1,847,686 1,827,491 1,861,802
6 months LIBOR plus 370 basis points 22.01.2023 908,170 932,284 913,750 939,467
6 months LIBOR plus 375 basis points 22.01.2023 908,170 932,489 913,750 939,674
6 months LIBOR plus 390 basis points 16.03.2023 908,170 924,140 913,750 931,199
6 months LIBOR plus 395 basis points 16.03.2023 908,170 924,274 913,750 931,333
Total Sri Lanka Development Bonds 169,608,013 171,518,741 192,887,039 195,282,304
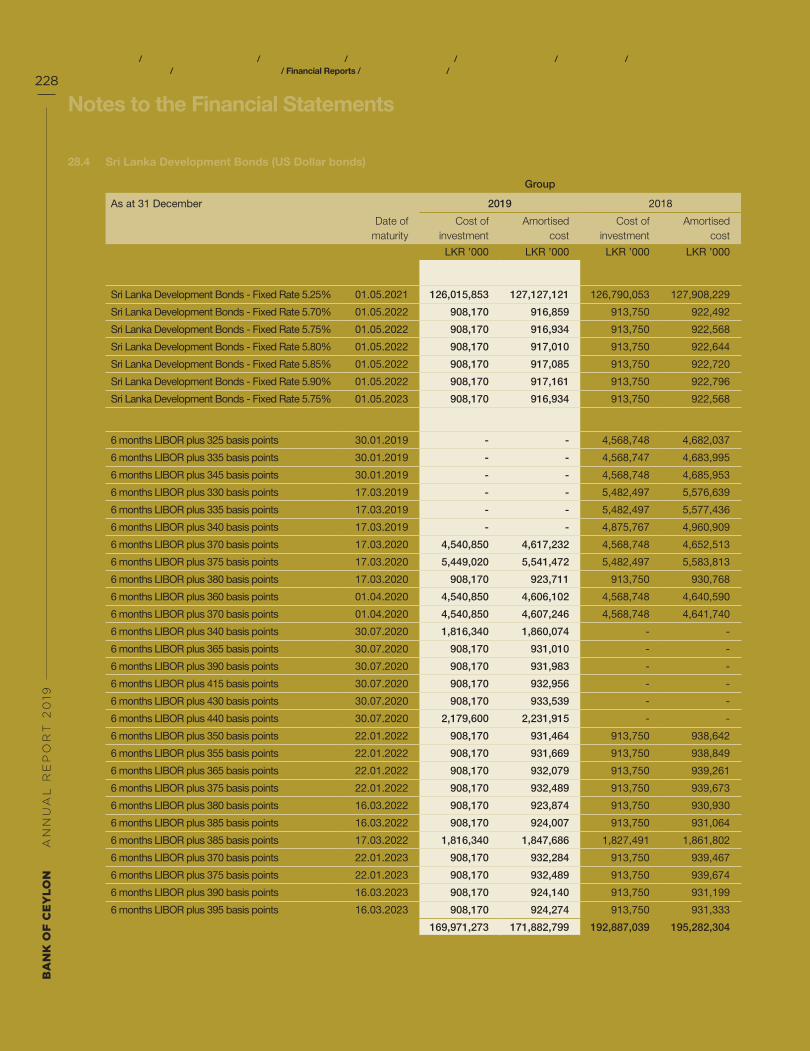
BA
NK
OF
CE
YL
ON
AN
NU
AL
RE
PO
RT
20
19
Notes to the Financial Statements228
About this Report / Performance Highlights 2019 / Chairman’s Message / General Manager’s Review / Organisational Overview / Strategic Report / Performance and Outlook / Stakeholder Value Creation / Financial Reports / Compliance Annexes / Supplementary Information
28.4 Sri Lanka Development Bonds (US Dollar bonds)
Group
As at 31 December 2019 2018
Date ofmaturity
Cost of investment
Amortised cost
Cost of investment
Amortised cost
LKR ’000 LKR ’000 LKR ’000 LKR ’000
Fixed Rate
Sri Lanka Development Bonds - Fixed Rate 5.25% 01.05.2021 126,015,853 127,127,121 126,790,053 127,908,229
Sri Lanka Development Bonds - Fixed Rate 5.70% 01.05.2022 908,170 916,859 913,750 922,492
Sri Lanka Development Bonds - Fixed Rate 5.75% 01.05.2022 908,170 916,934 913,750 922,568
Sri Lanka Development Bonds - Fixed Rate 5.80% 01.05.2022 908,170 917,010 913,750 922,644
Sri Lanka Development Bonds - Fixed Rate 5.85% 01.05.2022 908,170 917,085 913,750 922,720
Sri Lanka Development Bonds - Fixed Rate 5.90% 01.05.2022 908,170 917,161 913,750 922,796
Sri Lanka Development Bonds - Fixed Rate 5.75% 01.05.2023 908,170 916,934 913,750 922,568
Floating Rate
6 months LIBOR plus 325 basis points 30.01.2019 - - 4,568,748 4,682,037
6 months LIBOR plus 335 basis points 30.01.2019 - - 4,568,747 4,683,995
6 months LIBOR plus 345 basis points 30.01.2019 - - 4,568,748 4,685,953
6 months LIBOR plus 330 basis points 17.03.2019 - - 5,482,497 5,576,639
6 months LIBOR plus 335 basis points 17.03.2019 - - 5,482,497 5,577,436
6 months LIBOR plus 340 basis points 17.03.2019 - - 4,875,767 4,960,909
6 months LIBOR plus 370 basis points 17.03.2020 4,540,850 4,617,232 4,568,748 4,652,513
6 months LIBOR plus 375 basis points 17.03.2020 5,449,020 5,541,472 5,482,497 5,583,813
6 months LIBOR plus 380 basis points 17.03.2020 908,170 923,711 913,750 930,768
6 months LIBOR plus 360 basis points 01.04.2020 4,540,850 4,606,102 4,568,748 4,640,590
6 months LIBOR plus 370 basis points 01.04.2020 4,540,850 4,607,246 4,568,748 4,641,740
6 months LIBOR plus 340 basis points 30.07.2020 1,816,340 1,860,074 - -
6 months LIBOR plus 365 basis points 30.07.2020 908,170 931,010 - -
6 months LIBOR plus 390 basis points 30.07.2020 908,170 931,983 - -
6 months LIBOR plus 415 basis points 30.07.2020 908,170 932,956 - -
6 months LIBOR plus 430 basis points 30.07.2020 908,170 933,539 - -
6 months LIBOR plus 440 basis points 30.07.2020 2,179,600 2,231,915 - -
6 months LIBOR plus 350 basis points 22.01.2022 908,170 931,464 913,750 938,642
6 months LIBOR plus 355 basis points 22.01.2022 908,170 931,669 913,750 938,849
6 months LIBOR plus 365 basis points 22.01.2022 908,170 932,079 913,750 939,261
6 months LIBOR plus 375 basis points 22.01.2022 908,170 932,489 913,750 939,673
6 months LIBOR plus 380 basis points 16.03.2022 908,170 923,874 913,750 930,930
6 months LIBOR plus 385 basis points 16.03.2022 908,170 924,007 913,750 931,064
6 months LIBOR plus 385 basis points 17.03.2022 1,816,340 1,847,686 1,827,491 1,861,802
6 months LIBOR plus 370 basis points 22.01.2023 908,170 932,284 913,750 939,467
6 months LIBOR plus 375 basis points 22.01.2023 908,170 932,489 913,750 939,674
6 months LIBOR plus 390 basis points 16.03.2023 908,170 924,140 913,750 931,199
6 months LIBOR plus 395 basis points 16.03.2023 908,170 924,274 913,750 931,333
Total Sri Lanka Development Bonds 169,971,273 171,882,799 192,887,039 195,282,304

About this Report / Performance Highlights 2019 / Chairman’s Message / General Manager’s Review / Organisational Overview / Strategic Report / Performance and Outlook / Stakeholder Value Creation / Financial Reports / Compliance Annexes / Supplementary Information
229
28.5 Government of Sri Lanka Restructuring Bonds
Bank/ Group
As at 31 December 2019 2018
Rate % Date of IssueDate of
maturity Cost of
investment Amortised
cost Cost of
investment Amortised
cost
LKR ’000 LKR ’000 LKR ’000 LKR ’000
For recapitalisation purpose 12.00 24.03.1993 24.03.2023 4,780,000 5,015,714 4,780,000 5,015,714
For settlement of loans 12.00 24.03.1993 24.03.2023 3,767,000 3,952,760 3,767,000 3,952,760
Total Government of Sri Lanka Restructuring Bonds 8,547,000 8,968,474 8,547,000 8,968,474
28.6 Debentures
Bank
As at 31 December 2019 2018
Date of
maturity
Coupon
rate %
No. of
debentures
Cost of
investment
Amortised
cost
No. of
Debentures
Cost of
investment
Amortised
cost
LKR ’000 LKR ’000 LKR ’000 LKR ’000
Access Engineering PLC 18.11.2020 10.25 2,000,000 200,000 202,368 2,000,000 200,000 202,369
Citizen Development Business Finance PLC 03.06.2021 12.75 500,000 50,000 50,486 500,000 50,000 50,483
Citizen Development Business Finance PLC 27.03.2023 14.20 2,000,000 200,000 221,156 2,000,000 200,000 221,284
Commercial Bank of Ceylon PLC 08.03.2021 10.75 1,000,000 100,000 103,325 1,000,000 100,000 103,326
Commercial Bank of Ceylon PLC 27.10.2021 12.00 779,600 77,960 79,523 779,600 77,960 79,579
Commercial Credit and Finance PLC 01.06.2020 10.50 530,519 53,052 53,319 530,519 53,052 54,454
Commercial Credit and Finance PLC 10.12.2020 10.40 3,665,600 366,560 368,700 3,665,600 366,560 368,702
Commercial Leasing & Finance PLC 21.07.2020 9.75 750,000 75,000 82,373 750,000 75,000 82,336
DFCC Bank PLC 18.03.2019 10.63 - - - 2,500,000 250,000 270,733
DFCC Bank PLC 10.06.2020 9.40 332,100 33,210 34,920 332,100 33,210 34,913
DFCC Bank PLC 09.11.2021 12.15 1,892,800 189,280 192,388 1,892,800 189,280 192,388
DFCC Bank PLC 29.03.2025 13.00 2,250,000 225,000 246,741 2,250,000 225,000 246,866
First Capital Treasuries PLC 05.02.2020 9.50 500,000 50,000 54,726 500,000 50,000 54,726
Hatton National Bank PLC 28.03.2021 11.25 1,000,000 100,000 108,428 1,000,000 100,000 108,455
Hatton National Bank PLC 01.11.2023 13.00 193,300 19,330 19,722 193,300 19,330 19,722
Hayleys PLC 31.05.2019 12.35 - - - 1,000,000 100,000 101,297
Hayleys PLC 31.07.2023 12.50 2,500,000 250,000 263,119 2,500,000 250,000 263,026
Hayleys PLC 26.08.2024 12.93 1,000,000 100,000 104,456 - - -
Hayleys PLC 26.08.2024 13.00 311,500 31,150 32,545 - - -
Hayleys PLC 26.08.2024 13.00 1,500,000 150,000 151,353 - - -
HDFC Bank of Sri Lanka 20.11.2020 10.50 2,000,000 200,000 202,308 2,000,000 200,000 202,307
Hemas Holdings PLC 29.04.2019 11.00 - - - 173,500 17,350 17,828
Kotagala Plantations PLC 26.05.2019 14.50 - - - 165,975 16,598 17,816
Kotagala Plantations PLC 26.05.2020 14.75 165,975 16,598 17,837 165,975 16,598 17,834
Kotagala Plantations PLC 26.05.2021 15.00 165,975 16,598 17,856 165,975 16,598 17,853

BA
NK
OF
CE
YL
ON
AN
NU
AL
RE
PO
RT
20
19
Notes to the Financial Statements230
About this Report / Performance Highlights 2019 / Chairman’s Message / General Manager’s Review / Organisational Overview / Strategic Report / Performance and Outlook / Stakeholder Value Creation / Financial Reports / Compliance Annexes / Supplementary Information
Bank
As at 31 December 2019 2018
Date of
maturity
Coupon
rate %
No. of
debentures
Cost of
investment
Amortised
cost
No. of
Debentures
Cost of
investment
Amortised
cost
LKR ’000 LKR ’000 LKR ’000 LKR ’000
Lanka Orix Leasing Company PLC 24.11.2019 9.00 - - - 1,000,000 100,000 102,264
Lanka Orix Leasing Company PLC 30.07.2022 13.00 2,500,000 250,000 263,679 2,500,000 250,000 263,621
LB Finance PLC 11.12.2022 12.75 2,500,000 250,000 251,654 2,500,000 250,000 251,761
Merchant Bank of Sri Lanka & Finance PLC 12.11.2019 9.00 - - - 1,135,200 113,520 123,799
MTD Walkers PLC 30.09.2019 11.75 254,784 25,478 29,766 254,784 25,477 26,212
National Development Bank PLC 24.06.2020 9.40 534,500 53,450 58,517 534,500 53,450 58,492
Nawaloka Hospitals PLC 30.09.2019 14.15 - - - 1,000,000 100,000 106,227
Orient Finance PLC 26.12.2019 9.05 - - - 500,000 50,000 52,414
Pan Asia Banking Corporation PLC 29.09.2019 10.00 - - - 486,112 48,611 49,827
People's Leasing & Finance PLC 12.11.2019 9.60 - - - 945,000 94,500 95,672
People's Leasing & Finance PLC 16.11.2021 12.60 2,000,000 200,000 203,027 2,000,000 200,000 203,028
People's Leasing & Finance PLC 18.04.2023 12.80 2,500,000 250,000 272,114 2,500,000 250,000 272,037
Regional Development Bank 29.01.2020 9.00 4,250,000 425,000 463,107 4,250,000 425,000 463,107
Sampath Bank PLC 14.12.2019 8.25 - - - 1,000,000 100,000 108,276
Sampath Bank PLC 18.11.2020 9.90 898,400 89,840 90,872 898,400 89,840 90,876
Sampath Bank PLC 10.06.2021 12.75 1,500,000 150,000 160,398 1,500,000 150,000 160,400
Sampath Bank PLC 21.12.2022 12.50 2,270,000 227,000 227,239 2,270,000 227,000 242,232
Sampath Bank PLC 20.03.2023 12.50 2,500,000 250,000 258,702 2,500,000 250,000 258,703
Sanasa Development Bank PLC 31.12.2020 10.00 1,500,000 150,000 157,530 1,500,000 150,000 157,864
Sanasa Development Bank PLC 31.12.2020 10.30 1,500,000 150,000 157,755 1,500,000 150,000 157,635
Senkadagala Finance PLC 10.11.2019 13.25 - - - 320,000 32,000 32,578
Seylan Bank PLC 22.12.2019 8.60 - - - 1,500,000 150,000 150,270
Seylan Bank PLC 15.07.2021 13.00 451,600 45,160 47,870 451,600 45,160 47,870
Seylan Bank PLC 29.03.2023 12.85 2,500,000 250,000 258,053 2,500,000 250,000 258,133
Singer Finance PLC 06.04.2020 12.00 1,000,000 100,000 102,783 1,000,000 100,000 102,784
Singer (Sri Lanka) PLC 14.03.2019 10.50 - - - 2,500,000 250,000 257,699
Singer (Sri Lanka) PLC 17.06.2020 9.95 309,300 30,930 34,035 309,300 30,930 34,022
Siyapatha Finance PLC 20.09.2019 13.00 - - - 1,000,000 100,000 103,472
Softlogic Finance PLC 29.08.2019 10.00 - - - 190,900 19,090 19,572
Sri Lanka Telecom PLC 19.04.2028 12.75 5,000,000 500,000 512,374 5,000,000 500,000 512,535
Total debentures 5,900,596 6,157,124 7,161,114 7,491,679

About this Report / Performance Highlights 2019 / Chairman’s Message / General Manager’s Review / Organisational Overview / Strategic Report / Performance and Outlook / Stakeholder Value Creation / Financial Reports / Compliance Annexes / Supplementary Information
231
28.6 Debentures
Group
As at 31 December 2019 2018
Date of
maturity
Coupon
rate %
No of
debentures
Cost of
investment
Amortised
cost
No of
debentures
Cost of
investment
Amortised
cost
LKR ’000 LKR ’000 LKR ’000 LKR ’000
Access Engineering PLC 18.11.2020 10.25 2,000,000 200,000 202,368 2,000,000 200,000 202,369
Citizen Development Business Finance PLC 03.06.2021 12.75 500,000 50,000 50,486 500,000 50,000 50,483
Citizen Development Business Finance PLC 27.03.2023 14.20 2,000,000 200,000 221,156 2,000,000 200,000 221,284
Commercial Bank of Ceylon PLC 08.03.2021 10.75 1,000,000 100,000 103,325 1,000,000 100,000 103,326
Commercial Bank of Ceylon PLC 27.10.2021 12.00 779,600 77,960 79,523 779,600 77,960 79,579
Commercial Credit and Finance PLC 01.06.2020 10.50 530,519 53,052 53,319 530,519 53,052 54,454
Commercial Credit and Finance PLC 10.12.2020 10.40 3,665,600 366,560 368,700 3,665,600 366,560 368,702
Commercial Leasing & Finance PLC 21.07.2020 9.75 750,000 75,000 82,373 750,000 75,000 82,336
DFCC Bank PLC 18.03.2019 10.63 - - - 2,500,000 250,000 270,733
DFCC Bank PLC 10.06.2020 9.40 332,100 33,210 34,920 332,100 33,210 34,913
DFCC Bank PLC 09.11.2021 12.15 1,892,800 189,280 192,388 1,892,800 189,280 192,388
DFCC Bank PLC 29.03.2025 13.00 2,250,000 225,000 246,741 2,250,000 225,000 246,866
First Capital Treasuries PLC 05.02.2020 9.50 500,000 50,000 54,726 500,000 50,000 54,726
Hatton National Bank PLC 28.03.2021 11.25 1,000,000 100,000 108,428 1,000,000 100,000 108,455
Hatton National Bank PLC 01.11.2023 13.00 193,300 19,330 19,722 193,300 19,330 19,722
Hayleys PLC 31.05.2019 12.35 - - - 1,000,000 100,000 101,297
Hayleys PLC 31.07.2023 12.50 2,500,000 250,000 263,119 2,500,000 250,000 263,026
Hayleys PLC 26.08.2024 12.93 1,000,000 100,000 104,456 - - -
Hayleys PLC 26.08.2024 13.00 1,811,500 181,150 183,898 - - -
HDFC Bank of Sri Lanka 20.11.2020 10.50 2,000,000 200,000 202,308 2,000,000 200,000 202,307
Hemas Holdings PLC 29.04.2019 11.00 - - - 173,500 17,350 17,828
Kotagala Plantations PLC 26.05.2019 14.50 - - - 165,975 16,598 17,816
Kotagala Plantations PLC 26.05.2020 14.75 165,975 16,598 17,837 165,975 16,598 17,834
Kotagala Plantations PLC 26.05.2021 15.00 165,975 16,598 17,856 165,975 16,598 17,853
Lanka Orix Leasing Company PLC 24.11.2019 9.00 - - - 1,000,000 100,000 102,264
Lanka Orix Leasing Company PLC 30.07.2022 13.00 2,500,000 250,000 263,679 2,500,000 250,000 263,621
LB Finance PLC 11.12.2022 12.75 2,500,000 250,000 251,654 2,500,000 250,000 251,761
MTD Walkers PLC 30.09.2019 11.75 254,784 25,478 29,766 254,784 25,487 26,212
National Development Bank PLC 24.06.2020 9.40 534,500 53,450 58,517 534,500 53,450 58,492
Nawaloka Hospitals PLC 30.09.2019 14.15 - - - 1,000,000 100,000 106,227
Orient Finance PLC 26.12.2019 9.05 - - - 500,000 50,000 52,414
Pan Asia Banking Corporation PLC 29.09.2019 10.00 - - - 486,112 48,611 49,827
People's Leasing & Finance PLC 12.11.2019 9.60 - - - 945,000 94,500 95,672

BA
NK
OF
CE
YL
ON
AN
NU
AL
RE
PO
RT
20
19
Notes to the Financial Statements232
About this Report / Performance Highlights 2019 / Chairman’s Message / General Manager’s Review / Organisational Overview / Strategic Report / Performance and Outlook / Stakeholder Value Creation / Financial Reports / Compliance Annexes / Supplementary Information
Group
As at 31 December 2019 2018
Date of
maturity
Coupon
rate %
No of
debentures
Cost of
investment
Amortised
cost
No of
debentures
Cost of
investment
Amortised
cost
LKR ’000 LKR ’000 LKR ’000 LKR ’000
People's Leasing & Finance PLC 16.11.2021 12.60 2,000,000 200,000 203,027 2,000,000 200,000 203,028
People's Leasing & Finance PLC 18.04.2023 12.80 2,500,000 250,000 272,114 2,500,000 250,000 272,037
Regional Development Bank 29.01.2020 9.00 4,250,000 425,000 463,107 4,250,000 425,000 463,107
Sampath Bank PLC 14.12.2019 8.25 - - - 1,000,000 100,000 108,276
Sampath Bank PLC 18.11.2020 9.90 898,400 89,840 90,872 898,400 89,840 90,876
Sampath Bank PLC 10.06.2021 12.75 1,500,000 150,000 160,398 1,500,000 150,000 160,400
Sampath Bank PLC 21.12.2022 12.50 2,270,000 227,000 227,239 2,270,000 227,000 242,232
Sampath Bank PLC 20.03.2023 12.50 2,500,000 250,000 258,702 2,500,000 250,000 258,703
Sanasa Development Bank PLC 31.12.2020 10.00 1,500,000 150,000 157,530 1,500,000 150,000 157,864
Sanasa Development Bank PLC 31.12.2020 10.30 1,500,000 150,000 157,755 1,500,000 150,000 157,635
Senkadagala Finance PLC 10.11.2019 12.50 - - - 320,000 32,000 32,578
Seylan Bank PLC 22.12.2019 8.60 - - - 1,500,000 150,000 150,270
Seylan Bank PLC 15.07.2021 13.00 451,600 45,160 47,870 451,600 45,160 47,870
Seylan Bank PLC 29.03.2023 12.85 2,500,000 250,000 258,053 2,500,000 250,000 258,133
Singer Finance PLC 06.04.2020 12.00 1,000,000 100,000 102,783 1,000,000 100,000 102,784
Singer (Sri Lanka) PLC 14.03.2019 10.50 - - - 2,500,000 250,000 257,699
Singer (Sri Lanka) PLC 17.06.2020 9.95 309,300 30,930 34,035 309,300 30,930 34,022
Siyapatha Finance PLC 20.09.2019 13.00 - - - 1,000,000 100,000 103,472
Softlogic Finance PLC 29.08.2019 10.00 - - - 190,900 19,090 19,572
Sri Lanka Telecom PLC 19.04.2028 12.75 5,000,000 500,000 512,374 5,000,000 500,000 512,535
Total debentures 5,900,596 6,157,124 7,047,604 7,367,880
28.7 Trust Certificates
Bank/ Group
As at 31 December 2019 2018
Cost of investment
Amortised cost
Cost of investment
Amortised cost
LKR ’000 LKR ’000 LKR ’000 LKR ’000
LOLC Finance PLC - - 147,334 186,257
Citizen Development Bank 176,588 208,103 285,000 296,874
Softlogic Finance PLC 110,500 130,723 188,500 193,426
Total trust certificates 287,088 338,826 620,834 676,557

About this Report / Performance Highlights 2019 / Chairman’s Message / General Manager’s Review / Organisational Overview / Strategic Report / Performance and Outlook / Stakeholder Value Creation / Financial Reports / Compliance Annexes / Supplementary Information
233
29 Financial Assets Measured at Fair Value Through OCIFinancial assets measured at fair value through OCI include equity instruments which are elected fair value through OCI option at the initial recognition and debt instruments which contractual terms that give rise to cash flows on specified dates, that represent solely payments of principal and interest on the principal amount outstanding; and are held within a business model whose objective is achieved by both collecting contractual cash flows and selling financial assets.
All Financial assets measured at fair value through OCI are initially and subsequently measured at fair value. Unrealised gains and losses are recognised directly in equity in the “OCI reserve” through Other Comprehensive Income. When the debt instrument under FVTOCI is disposed off, the cumulative gain or loss previously recognised in OCI reserve is recognised in the Statement of Profit or Loss and reflected in “Net gains/(losses) from derecognition of financial assets”. When the equity instrument under FVTOCI is disposed off, the cumulative gain or loss previously recognised in OCI reserve is not recognised in the Statement of Profit or Loss. Interest earned whilst holding financial assets measured at fair value through OCI is reported as “Interest income” (Note 8.1). Dividends earned whilst holding financial assets measured at fair value through OCI are recognised in the Statement of Profit or Loss under in “Net Other Operating Income” (Note 13) when the right of the payment has been established.
Bank Group
As at 31 December 2019 2018 2019 2018
LKR ’000 LKR ’000 LKR ’000 LKR ’000
Government Securities in Sri Lanka
Treasury bills 6,343,043 4,550,469 7,891,144 5,718,800
Treasury bonds 1,881,395 6,178,278 2,203,866 6,695,169
Government Securities In other countries 1,445,693 1,587,030 1,445,693 1,587,030
Quoted equities [Note 29.2] 2,808,684 3,142,087 3,676,774 4,050,702
Unquoted Equities [Note 29.3] 1,757,275 1,241,718 1,799,076 1,287,082
Total finanacial assets measured at FVTOCI 14,236,090 16,699,582 17,016,553 19,338,783
29.1 By Currency
Bank Group
As at 31 December 2019 2018 2019 2018
LKR ’000 LKR ’000 LKR ’000 LKR ’000
Sri Lankan Rupee 11,262,429 14,100,141 14,042,892 16,739,342
United States Dollar 1,527,968 1,012,411 1,527,968 1,012,411
Indian Rupee 1,445,693 1,587,030 1,445,693 1,587,030
Total 14,236,090 16,699,582 17,016,553 19,338,783

BA
NK
OF
CE
YL
ON
AN
NU
AL
RE
PO
RT
20
19
Notes to the Financial Statements234
About this Report / Performance Highlights 2019 / Chairman’s Message / General Manager’s Review / Organisational Overview / Strategic Report / Performance and Outlook / Stakeholder Value Creation / Financial Reports / Compliance Annexes / Supplementary Information
29.2 Quoted Equities
Bank
As at 31 December 2019 2018
No. ofOrdinary
Shares
Cost of investment
Market Value
No. ofOrdinary
Shares
Cost of investment
Market Value
LKR ’000 LKR ’000 LKR ’000 LKR ’000
National Development Bank PLC 18,548,111 969,285 1,854,810 17,587,570 867,596 1,878,385
People's Leasing & Finance PLC 11,800,434 211,090 211,228 11,453,600 206,165 186,694
Seylan Bank PLC 14,145,629 547,486 742,646 13,507,800 523,736 1,077,008
Total quoted equites 1,727,861 2,808,684 1,597,497 3,142,087
Group
As at 31 December 2019 2018
No. ofOrdinary
Shares
Cost of investment
Market Value
No. ofOrdinary
Shares
Cost of investment
Market Value
LKR ’000 LKR ’000 LKR ’000 LKR ’000
National Development Bank PLC 18,548,111 969,285 1,854,810 17,587,570 867,556 1,878,385
People's Leasing & Finance PLC 11,800,434 211,090 211,228 11,453,600 206,165 186,694
Seylan Bank PLC 14,145,629 547,486 742,646 13,807,800 523,736 1,077,008
The Lanka Hospital Corporation PLC 21,329,000 213,290 868,090 21,329,000 213,290 908,615
Total quoted equites 1,941,151 3,676,774 1,810,747 4,050,702
29.3 Unquoted Equities
Bank
As at 31 December 2019 2018
No. ofOrdinary
Shares
Cost of investment
Market Value
No. ofOrdinary
Shares
Cost of investment
Market Value
LKR ’000 LKR ’000 LKR ’000 LKR ’000
Credit Information Bureau of Sri Lanka 46,800 43,132 43,132 46,800 43,132 43,132
Fitch Ratings Lanka Limited 62,500 625 625 62,500 625 625
LankaClear (Private) Limited 2,100,000 21,000 21,000 2,100,000 21,000 21,000
Lanka Financial Services Bureau Limited 225,000 2,250 2,250 225,000 2,250 2,250
Magpek Exports Limited - - - 300,000 4,355 -
MasterCard Incorporated 17,200 - 932,826 17,200 - 591,946
Regional Development Bank 16,448,448 162,300 162,300 16,448,448 162,300 162,300
Visa Inc. 17,438 - 595,142 17,438 - 420,465
229,307 1,757,275 233,662 1,241,718
Fair value adjustment 1,527,968 1,012,411
Provision for impairment [Note 29.4] - (4,355)
Total unquoted equities 1,757,275 1,757,275 1,241,718 1,241,718

About this Report / Performance Highlights 2019 / Chairman’s Message / General Manager’s Review / Organisational Overview / Strategic Report / Performance and Outlook / Stakeholder Value Creation / Financial Reports / Compliance Annexes / Supplementary Information
235
Group
As at 31 December 2019 2018
No ofOrdinary
Shares
Cost of investment
Market Value
No ofOrdinary
Shares
Cost of investment
Market Value
LKR ’000 LKR ’000 LKR ’000 LKR ’000
Ceylinco Investment Company Limited 500,000 5,000 - 500,000 5,000 -
Credit Information Bureau of Sri Lanka 47,340 43,185 43,185 47,340 43,185 43,185
Fitch Ratings Lanka Limited 62,500 625 625 62,500 625 625
LankaClear (Private) Limited 2,100,000 21,000 21,000 2,100,000 21,000 21,000
Lanka Financial Services Bureau Limited 225,000 2,250 2,250 225,000 2,250 2,250
LVL Energy Fund (Private) Limited 2,500,000 20,000 19,125 2,500,000 20,000 21,420
Magpek Export Limited - - - 300,000 4,355 -
MasterCard Incorporated 17,200 - 932,826 17,200 - 591,946
Mega Containers Limited 1,000,000 10,000 21,781 1,000,000 10,000 22,601
Regional Development Bank 16,448,448 162,300 162,300 16,448,448 162,300 162,300
Ranwan Industries (Private) Limited 165,790 3,600 - 165,790 3,600 -
San Michele Limited 50,000 500 - 50,000 500 -
UB Finance Company Limited 2,506,562 17,546 842 2,506,562 17,546 1,290
Visa Inc. 17,438 - 595,142 17,438 - 420,465
286,006 1,799,076 290,361 1,287,082
Fair value adjustment 1,538,874 1,026,432
Provision for impairment [Note 29.4] (25,804) (29,711)
Total unquoted equities 1,799,076 1,799,076 1,287,082 1,287,082
29.4 Movement in Impairment During the Year
Bank Group
2019 2018 2019 2018
LKR ’000 LKR ’000 LKR ’000 LKR ’000
Stage 1
Opening balance as at 1 January 4,355 4,355 29,711 29,794
Charge/ (Reversal) during the year - - 448 (83)
Writte - off during the year (4,355) - (4,355) -
Closing balance at 31 December - 4,355 25,804 29,711
Bank Group
2019 2018 2019 2018
LKR ’000 LKR ’000 LKR ’000 LKR ’000
Total
Opening balance as at 1 January 4,355 4,355 29,711 29,794
Charge/ (Reversal) during the year - - 448 (83)
Writte - off during the year (4,355) - (4,355) -
Closing balance at 31 December - 4,355 25,804 29,711

BA
NK
OF
CE
YL
ON
AN
NU
AL
RE
PO
RT
20
19
Notes to the Financial Statements236
About this Report / Performance Highlights 2019 / Chairman’s Message / General Manager’s Review / Organisational Overview / Strategic Report / Performance and Outlook / Stakeholder Value Creation / Financial Reports / Compliance Annexes / Supplementary Information
30 Investment in Subsidiary Companies
Accounting Policy
Subsidiaries are entities that are controlled by the Bank. Control is achieved when the Bank is exposed, or has rights, to variable returns from its involvement with the investee and has the ability to affect the returns of those investees through its power over the investee. Specifically, the Bank controls an investee if, and only if, the Bank has:
- power over the investee
- exposure or rights to variable returns from its involvement with the investee
- the ability to use its power over the investee to affect its returns
The Financial Statements of subsidiaries are included in the Consolidated Financial Statements from the date that control commences until the date that control ceases. The Bank reassesses whether it has control if there are changes to one or more of the elements of control. A change in the ownership interest of a subsidiary, without loss of control, is accounted for as an equity transaction. If the Group loses control over a subsidiary, it derecognises the related assets (including goodwill), liabilities, Non-Controlling Interest (NCI) and other components of equity, while any resultant gain or loss is recognised in Profit or Loss. Any investment retained is recognised at fair value at the date of loss of control.
The Consolidated Financial Statements are prepared for the common financial year end of 31 December and have been prepared using uniform accounting policies for like transactions and other events in similar circumstances.
All intra group balances, income and expenses (except for foreign currency translation gains or losses) arising from intra group transactions are eliminated on consolidation. Unrealized gains and losses resulting from transactions between the Group and its associates are also eliminated on consolidation to the extent of the Group’s interests in the associates. Unrealised losses are eliminated in the same way as unrealised gains, but only to the extent that there is no evidence of impairment.
There are no significant restrictions on the ability of subsidiaries to transfer funds to the parent in the form of cash dividends or to repay loans and advances. All Subsidiaries of the Bank have been incorporated in Sri Lanka except for Bank of Ceylon (UK) Limited, which is incorporated in the United Kingdom. A list of the Bank’s Subsidiaries is given in Note 30.5 to the Financial Statements.
Bank
As at 31 December 2019 2018
LKR ’000 LKR ’000
Investment in quoted subsidiaries [Note 30.3] 3,114,952 3,114,952
Investment in unquoted subsidiaries [Note 30.4] 3,798,096 3,798,096
Total investment in subsidiaries 6,913,048 6,913,048
Less : Provision for impairment of investment in subsidiaries [Note 30.2] 400,000 400,000
Carrying value of investment in subsidiary companies 6,513,048 6,513,048

About this Report / Performance Highlights 2019 / Chairman’s Message / General Manager’s Review / Organisational Overview / Strategic Report / Performance and Outlook / Stakeholder Value Creation / Financial Reports / Compliance Annexes / Supplementary Information
237
30.1 Movement in Investment in Subsidiary Companies
2019 2018
LKR ’000 LKR ’000
Balance as at 1 January 6,913,048 6,913,048
Increase/ (Decrease) in investments - -
Balance as at 31 December 6,913,048 6,913,048
30.2 Provision for Impairment of Investment in Subsidiaries *
2019 2018
LKR ’000 LKR ’000
Balance as at 1 January 400,000 400,000
Impairment charge/ (reversal ) during the year - -
Balance as at 31 December 400,000 400,000
* The Bank has made the provision of impairment for investment of Bank of Ceylon (UK) Limited.
30.3 Investment in Quoted Subsidiaries
Bank
As at 31 December 2019 2018
Cost Market Value Cost Market ValueLKR ’000 LKR ’000 LKR ’000 LKR ’000
Property Development PLC (63,064,957 Ordinary shares ) 860,270 8,848,013 860,270 7,517,343
Merchant Bank of Sri Lanka & Finance PLC (123,562,267 Ordinary shares ) 2,254,682 1,186,198 2,254,682 1,186,198
Total investment in quoted subsidiaries 3,114,952 10,034,211 3,114,952 8,703,541
30.4 Investment in Unquoted Subsidiaries
Bank
As at 31 December 2019 2018
Cost Directors' Valuation
Cost Directors' Valuation
LKR ’000 LKR ’000 LKR ’000 LKR ’000
BOC Management & Support Services (Private) Limited 1,000 1,000 1,000 1,000
(99,996 Ordinary shares)
BOC Property Development & Management (Private) Limited (100,999,998 Ordinary shares) 1,010,000 1,010,000 1,010,000 1,010,000
BOC Travels (Private) Limited (250,004 Ordinary shares) 2,500 2,500 2,500 2,500
Bank of Ceylon (UK) Limited (15,000,000 Ordinary shares) 2,683,859 2,283,859 2,683,859 2,283,859
Hotels Colombo (1963) Limited (10,073,667 Ordinary shares ) 100,737 100,737 100,737 100,737
Total investment in unquoted subsidiaries 3,798,096 3,398,096 3,798,096 3,398,096

BA
NK
OF
CE
YL
ON
AN
NU
AL
RE
PO
RT
20
19
Notes to the Financial Statements238
About this Report / Performance Highlights 2019 / Chairman’s Message / General Manager’s Review / Organisational Overview / Strategic Report / Performance and Outlook / Stakeholder Value Creation / Financial Reports / Compliance Annexes / Supplementary Information
30.5 Information Relating to Subsidiaries of the Bank
Ownership interest held by the Bank
As at 31 December 2019 2018
% %
Quoted subsidiaries
Property Development PLC (PDL) 95.55 95.55
Merchant Bank of Sri Lanka & Finance PLC (MBSL) 74.49 74.49
Unquoted subsidiaries
BOC Management & Support Services (Private) Limited (MSS)*** 100.00 100.00
BOC Property Development & Management (Private) Limited (PDML) 100.00 100.00
BOC Travels (Private) Limited (TRAVELS) 100.00 100.00
Hotels Colombo (1963) Limited (HCL) 99.99 99.99
Ceybank Holiday Homes (Private) Limited (HH) * 100.00 100.00
MBSL Insurance Company Limited (MBSL INS)** 40.08 62.66
Koladeniya Hydropower (Private) Limited (KHP)* 95.55 95.55
Bank of Ceylon (UK) Limited (BOC UK) 100.00 100.00
* Ceybank Holiday Homes (Private) Limited, MBSL Insurance Company Limited and Koladeniya Hydropower (Private) Limited are indirect subsidiaries of tha Bank.
** MBSL's holding in MBSL INS diluted from 84.12% to 53.8%. Accordingly indirect holding of the Bank reduce from 62.66% to 40.08%
*** Not in operation and in the process of liquidation.
30.6 Non-Controlling Interest (NCI) of Subsidiaries
2019
PDL MBSL MBSL INS KHP HCL
Equity interest held by the NCI (%) 4.45 25.51 59.92 4.45 0.01
Profit/ (Loss) allocated during the year (LKR ’000) 30,472 45,228 (17,583) 2,089 (5)
Accumulated balance of NCI as at 31 December (LKR ’000) 236,321 659,561 869,291 19,906 9
Dividends paid to NCI (LKR ’000) 11,014 - - 7,484 -
2018
PDL MBSL MBSL INS KHP HCL
Equity interest held by the NCI (%) 4.45 25.51 37.34 4.45 0.01
Profit/ (Loss) allocated during the year (LKR ’000) 22,152 39,895 (67,383) 1,763 (3)
Accumulated balance of NCI as at 31 December (LKR ’000) 165,212 561,889 (57,265) 25,299 14
Dividends paid to NCI (LKR ’000) 10,280 - - 2,414 -

About this Report / Performance Highlights 2019 / Chairman’s Message / General Manager’s Review / Organisational Overview / Strategic Report / Performance and Outlook / Stakeholder Value Creation / Financial Reports / Compliance Annexes / Supplementary Information
239
30.7 Summarised Financial Information of Subsidiaries
For the year ended 31 December 2019
PDL MBSL MSS PDML TRAVELS
LKR ’000 LKR ’000 LKR ’000 LKR ’000 LKR ’000
Statement of Profit or Loss
Total income 1,290,747 6,823,574 - 450,320 1,299,813
Profit/ (Loss) after tax 696,007 177,296 - 219,320 30,935
Other comprehensive income (43,689) (11,145) - (43) -
Total comprehensive income 652,318 166,151 - 219,277 30,935
Statement of Financial Position
Total assets 4,443,630 37,176,614 1,470 1,927,136 373,328
Total liabilities 706,556 34,486,359 470 98,551 99,137
Net assets 3,737,074 2,690,255 1,000 1,828,585 274,191
Dividends paid 247,500 - - 111,100 4,500
Statement of Cash Flows
Operating cash flows 268,626 2,827,670 - 131,188 8,925
Investing cash flows (179,236) (2,074,271) - (11,818) 282
Financing cash flows (246,334) (514,038) - (110,299) (5,930)
Net increase/ (decrease) in cash and cash equivalents (156,944) 239,561 - 9,071 3,277
For the year ended 31 December 2018
PDL MBSL MSS PDML TRAVELS
LKR ’000 LKR ’000 LKR ’000 LKR ’000 LKR ’000
Statement of Profit or Loss
Total income 1,040,710 6,549,905 - 400,337 1,231,265
Profit/ (Loss) after tax 497,794 156,390 - 190,033 30,253
Other comprehensive income (414,054) 882 - (44) -
Total comprehensive income 83,740 157,272 - 189,989 30,253
Statement of Financial Position
Total assets 3,900,467 35,638,974 1,470 1,814,305 347,618
Total liabilities 569,348 33,331,466 472 91,614 91,569
Net assets 3,331,119 2,307,508 998 1,722,691 256,049
Dividends paid 231,000 - - 101,000 4,500
Statement of Cash Flows
Operating cash flows 264,817 (3,835,271) - 144,728 (15,390)
Investing cash flows 106,789 1,878,702 - (35,423) 1,622
Financing cash flows (229,114) 1,445,713 - (101,000) (6,733)
Net increase/ (decrease) in cash and cash equivalents 142,492 (510,856) - 8,305 (20,501)

BA
NK
OF
CE
YL
ON
AN
NU
AL
RE
PO
RT
20
19
Notes to the Financial Statements240
About this Report / Performance Highlights 2019 / Chairman’s Message / General Manager’s Review / Organisational Overview / Strategic Report / Performance and Outlook / Stakeholder Value Creation / Financial Reports / Compliance Annexes / Supplementary Information
For the year ended 31 December 2019
HCL HH MBSL INS KHP BoC UK
LKR ’000 LKR ’000 LKR ’000 LKR ’000 LKR ’000
Statement of Profit or Loss
Total income 221,252 122,719 378,097 107,123 740,866
Profit/ (Loss) after tax (54,037) (3,449) (47,090) 46,951 25,192
Other comprehensive income - - 4,220 17 54,302
Total comprehensive income (54,037) (3,449) (42,870) 46,968 79,494
Statement of Financial Position
Total assets 317,610 34,482 3,027,663 474,336 40,222,495
Total liabilities 214,451 37,691 1,485,360 156,976 37,040,575
Net assets 103,159 (3,209) 1,542,303 317,360 3,181,920
Dividends paid - - - 168,175 -
Statement of Cash Flows
Operating cash flows (53,453) (2,613) 7,086 36,162 40,820
Investing cash flows 12,916 (895) (1,284,562) 106,248 (10,272)
Financing cash flows 44,456 (137) 1,200,000 (59,675) -
Net increase/ (decrease) in cash and cash equivalents 3,919 (3,371) (77,476) 82,735 30,548
For the year ended 31 December 2018
HCL HH MBSL INS KHP BoC UK
LKR ’000 LKR ’000 LKR ’000 LKR ’000 LKR ’000
Statement of Profit or Loss
Total income 207,064 72,538 207,731 115,920 599,206
Profit/ (Loss) after tax (31,087) (1,651) (180,459) 39,610 18,433
Other comprehensive income 1,289 - (3) 77 342,346
Total comprehensive income (29,798) (1,651) (180,462) 39,687 360,779
Statement of Financial Position
Total assets 297,083 36,878 1,278,366 486,288 36,707,727
Total liabilities 152,284 35,817 1,431,728 47,721 33,605,300
Net assets 144,799 1,061 (153,362) 438,567 3,102,427
Dividends paid 4,332 - - 54,250 -
Statement of Cash Flows
Operating cash flows (17,234) 2,223 28,320 44,203 29,910
Investing cash flows (6,962) (591) 12,907 4,496 (4,869)
Financing cash flows (1,300) - - (54,250) -
Net increase/ (decrease) in cash and cash equivalents (25,496) 1,632 41,227 5,551 25,041

About this Report / Performance Highlights 2019 / Chairman’s Message / General Manager’s Review / Organisational Overview / Strategic Report / Performance and Outlook / Stakeholder Value Creation / Financial Reports / Compliance Annexes / Supplementary Information
241
31 Investment in Associate CompaniesAssociates are those entities in which the Bank has significant influence, but not control, over the financial and operating policies. Investments in associate entities are accounted for using the equity method (equity-accounted investees) and are recognised initially at cost. The cost of the investment includes transaction costs.
The Consolidated Financial Statements include the Bank’s share of the profit or loss and other comprehensive income, after adjustments to align the accounting policies with those of the Group, from the date that significant influence commences until the date that significant influence ceases.
When the Bank’s share of losses exceeds its interest in an equity accounted investee, the carrying amount of that interest, including any long term investments, is reported at nil and the recognition of further losses is discontinued except to the extent that the Group has an obligation or has made payments on behalf of the investee. If the associate subsequently reports profits, the Bank resumes recognising its share of those profits only after its share of the profits equals the share of losses not recognised.
A list of the Bank’s associates is shown in Note 31.4 to the Financial Statements.
The Bank discontinues the use of the Equity Method from the date that it ceases to have significant influence over an associate and accounts for such investments in accordance with the Sri Lanka Accounting Standard – SLFRS 9 on ‘Financial Instruments’.
Upon loss of significant influence over the associate, the Bank measures and recognises any retained investment at its fair value. Any difference between the carrying amount of the associate upon loss of significant influence and the fair value of the retained investment and proceeds from disposal is recognised in profit or loss.
31.1 Unquoted Associates
Bank Group
As at 31 December 2019 2018 2019 2018
Cost Directors'
valuation
Cost Directors'
Cost
Equity
value Directors'
valuation
Equity
value Directors'
valuation
LKR ’000 LKR ’000 LKR ’000 LKR ’000 LKR ’000 LKR ’000 LKR ’000 LKR ’000
Ceybank Asset Management Limited (1,240,002 ordinary shares ) 31,048 31,048 31,048 31,048 233,951 233,951 224,367 224,367
Lanka Securities (Private) Limited (3,594,857 Ordinary shares ) 41,940 41,940 41,940 41,940 109,901 109,901 119,885 119,885
Southern Development Financial Company Limited (2,500,001 ordinary shares) 25,000 - 25,000 - - - - -
Transnational Lanka Records Solutions (Private) Limited (2,000,000 ordinary shares ) 20,000 20,000 20,000 20,000 103,183 103,183 96,974 96,974
Total investment in unquoted associates 117,988 92,988 117,988 92,988 447,035 447,035 441,226 441,226
Provision for impairment of investments in associates (Note 31.3) (25,000) (25,000) - - -
Net investment in unquoted associates 92,988 92,988 92,988 92,988 447,035 447,035 441,226 441,226

BA
NK
OF
CE
YL
ON
AN
NU
AL
RE
PO
RT
20
19
Notes to the Financial Statements242
About this Report / Performance Highlights 2019 / Chairman’s Message / General Manager’s Review / Organisational Overview / Strategic Report / Performance and Outlook / Stakeholder Value Creation / Financial Reports / Compliance Annexes / Supplementary Information
31.2 Movement in Investment in Associate Companies
Bank Group
Cost Equity value
2019 2018 2019 2018
LKR ’000 LKR ’000 LKR ’000 LKR ’000
Balance as at 1 January 117,988 117,988 441,226 446,793
Share of profit/ (loss), net of tax - - 48,187 9,269
Share of other comprehensive income, net of tax - - (7,078) 3,464
Share of dividends - - (35,300) (18,300)
Balance as at 31 December 117,988 117,988 447,035 441,226
31.3 Movement in Provision for Impairment of Investment in Associate Companies
Bank
2019 2018
LKR ’000 LKR ’000
Balance as at 1 January 25,000 25,000
Impairment charge/ (reversal) during the year - -
Balance as at 31 December 25,000 25,000
31.4 Share Holding Structure of Associate Companies
Equity interest % Shareholding structure
Name of the Company 2019 2018 Name Holding %
Ceybank Asset Management Limited (CAML) 43.36 43.36 Bank of Ceylon 43.36
Sri Lanka Insurance Corporation 26.57
Unit Trust of India 17.48
Carson Cumberbatch PLC 12.59
Lanka Securities (Private) Limited (LSL) 41.60 41.60 First Capital Securities Corporation Limited 51.00
Merchant Bank of Sri Lanka & Finance PLC 29.00
Bank of Ceylon 20.00
(Bank of Ceylon indirectly hold 21.6%)
Transnational Lanka Records Solutions (Private) Limited (TLRS)
24.69 24.69 Transnational (Pte) Ltd - Singapore 62.96
Bank of Ceylon 24.69
Seylan Bank PLC 12.35
Southern Development Financial Company Limited (SDFC) *
41.67 41.67 Bank of Ceylon 41.67
People's Bank 41.67
Southern Development Authority of Sri Lanka 16.66
* SDFC is not in operation and in the process of liquidation.

About this Report / Performance Highlights 2019 / Chairman’s Message / General Manager’s Review / Organisational Overview / Strategic Report / Performance and Outlook / Stakeholder Value Creation / Financial Reports / Compliance Annexes / Supplementary Information
243
31.5 Summarised Financial Information of Associates
For the year ended 31 December 2019
CAML LSL TLRSLKR ’000 LKR ’000 LKR ’000
Statement of Profit or Loss
Total income 110,390 85,073 138,689
Profit/ (Loss) before tax 20,678 (26,902) 110,434
Profit/ (Loss) after tax 14,409 (26,901) 102,846
Other comprehensive income (16,324) - -
Total comprehensive income (1,915) (26,901) 102,846
Statement of Financial Position
Current assets 323,357 357,793 61,267
Total assets 578,627 363,932 643,300
Current liabilities 12,331 102,954 23,041
Total liabilities 39,072 99,747 190,375
Net assets 539,555 264,185 452,925
Dividends paid 21,450 - 40,500
Dividends received to the Bank (net) 8,089 - 26,000
For the year ended 31 December 2018
CAML LSL TLRSLKR ’000 LKR ’000 LKR ’000
Statement of Profit or Loss
Total income 132,829 84,394 83,723
Profit/ (Loss) before tax 38,456 (30,618) 112,512
Profit/ (Loss) after tax 27,600 (30,618) 84,549
Other comprehensive income (8,819) - -
Total comprehensive income 18,781 (30,618) 84,549
Statement of Financial Position
Current assets 307,709 343,056 69,236
Total assets 556,755 349,875 605,079
Current liabilities 14,490 62,242 5,891
Total liabilities 39,302 61,690 212,315
Net assets 517,453 288,185 392,764
Dividends paid 21,450 - 40,500
Dividends received to the Bank (net) 8,004 - 9,000

BA
NK
OF
CE
YL
ON
AN
NU
AL
RE
PO
RT
20
19
Notes to the Financial Statements244
About this Report / Performance Highlights 2019 / Chairman’s Message / General Manager’s Review / Organisational Overview / Strategic Report / Performance and Outlook / Stakeholder Value Creation / Financial Reports / Compliance Annexes / Supplementary Information
32 Investment Properties
Accounting Policy
Recognition
Investment property is property held either to earn rental income or for capital appreciation or for both, but not for sale in the ordinary course of business, use in the production or supply of goods or services or for administrative purposes.
Measurement
Investment property is accounted for under Cost Model in the Financial Statements. Accordingly, after initial recognition as an asset, the property is carried at its cost, less accumulated depreciation and impairment losses.
If any property is reclassified to investment property due to changes in its use, fair value of such property at the date of reclassification becomes its cost for subsequent accounting.
Depreciation
Depreciation is provided on a straight-line basis over the estimated life of the class of asset from the date of purchase up to the date of disposal. Provision for depreciation is made over the period of 20 years at the rate of 5% per annum using the straight-line method for buildings classified as investment property. Land is not depreciated under normal circumstances.
Derecognition
Investment properties are derecognised when they are disposed of, or permanently withdrawn from use since no future economic benefits are expected. Transfers are made to and from investment property only when there is a change in use. When the use of a property changes such that it is reclassified as Property, Plant and Equipment, its fair value at the date of reclassification becomes its cost for subsequent accounting.
Bank Group
2019 2018 2019 2018
LKR ’000 LKR ’000 LKR ’000 LKR ’000
Cost
Balance as at 1 January 3,000,000 3,000,000 148,409 149,094
Disposals during the year - - - (685)
Transfers from Property, Plant and Equipment - - - -
Balance as at 31 December 3,000,000 3,000,000 148,409 148,409
Less : Accumulated depreciation
Balance as at 1 January 234,144 117,072 28,227 25,321
Charge for the year 117,072 117,072 2,906 2,906
Disposal/ Transfer - - - -
Balance as at 31 December 351,216 234,144 31,133 28,227
Net investment properties 2,648,784 2,765,856 117,276 120,182
32.1 Unobservable Inputs Considered in Measuring Fair Value
Significant unobservable inputs Range of estimates for unobservable inputs Sensitivity of fair value to unobservable inputs
Estimated value per perch LKR 12.0 million - LKR 16.0 million Positive correlated sensitivity

About this Report / Performance Highlights 2019 / Chairman’s Message / General Manager’s Review / Organisational Overview / Strategic Report / Performance and Outlook / Stakeholder Value Creation / Financial Reports / Compliance Annexes / Supplementary Information
245
32.2 Investment Properties Held By the Bank and Group
32.2.1 Bank
As at 31 December Extent
of Land
2019 2018
Building Cost Fair value
TotalCost
Total
Fair value
TotalLand Building Total
(sq.ft) (Perches) LKR ’000 LKR ’000 LKR ’000 LKR ’000 LKR ’000 LKR ’000
York street building, No.02, York Street, Colombo 01 261,610 181.85 2,414,640 585,360 3,000,000 3,000,000 3,000,000 3,000,000
Total 2,414,640 585,360 3,000,000 3,000,000 3,000,000 3,000,000
32.2.2. Group
As at 31 December Extent
of Land
2019 2018
Building Cost Fair value
TotalCost
Total
Fair value
TotalLand Building Total
(sq.ft) (Perches) LKR ’000 LKR ’000 LKR ’000 LKR ’000 LKR ’000 LKR ’000
Nos. 64 and 66, Nonagama Road, Pallegama, Embilipitiya - 16.61 1,751 - 1,751 30,000 1,751 30,000
No. 385/1, Kotte Road, Pittakotte 2,896 19.01 2,958 1,730 4,688 53,000 4,688 5,298
No. 116/4,116/7,116/26, 116/27, 116/29 1st Cross Street, Colombo 01 - 12.35 1,249 - 1,249 5,000 1,249 2,602
No. 102 and 104, Dam Street, Colombo 12 20,368 50.70 17,970 11,989 29,959 188,000 29,959 233,000
Kumbuththukuliya watte, Bangadeniya Road, Puttalam - 320.00 600 - 600 55,000 600 3,400
Mirissawelawatta hena; Thekkawatta, Dambadeniya. - 188.00 162 - 162 2,000 162 600
No. 50/21, Old Kesbawa Road, Raththanapitiya, Boralesgamuwa 54,826 364.35 65,604 44,396 110,000 200,191 110,000 298,015
Total 90,294 58,115 148,409 533,191 148,409 572,915
Note : The fair value of the investment properties as at 31 December 2019 was based on market valuations carried out in the year 2013, 2014, 2016 and 2019 by Mr D N Dhammika Baranage [RICS (UK), DIV AIS (SL)] and Mr H A W Perera [B Sc Estate Management and Valuation (Special)], Mr Samantha Kumara Madawan Arachchi [B Sc Estate Management and Valuation (Special), City Planning (JP), Dip(UPM)NI, AIREV] and Mr. A G Gunarathne [B.Sc. Estate Mgt & Valuation, F.I.V (Sri Lanka)], Mr L G T Thungasiri [(AIV) F.I.V (Sri Lanka), Dip. in Valuation (SLTC)], who are independent valuers not connected with the companies. The directors have reviewed values of the investment properties as at 31 December 2019 and concluded that there was no impairment.
BA
NK
OF
CE
YL
ON
AN
NU
AL
RE
PO
RT
20
19
Notes to the Financial Statements246
About this Report / Performance Highlights 2019 / Chairman’s Message / General Manager’s Review / Organisational Overview / Strategic Report / Performance and Outlook / Stakeholder Value Creation / Financial Reports / Compliance Annexes / Supplementary Information
33 Property, Plant and Equipment
Recognition
Property, Plant and Equipment (PPE) are recognised if it is probable that future economic benefits associated with the assets will flow to the Group and the cost of the asset can be reliably measured.
Measurement
Cost of Property, Plant and Equipment includes expenditures that are directly attributable to the acquisition of the asset. The cost of self-constructed assets includes the cost of materials and direct labour, any other costs directly attributable to bringing the assets to a working condition for their intended use, the costs of dismantling and removing the items and restoring the site on which they are located. Purchased software that is integral to the functionality of the related equipment is capitalised as part of that equipment.
Items of Property, Plant and Equipment are measured at cost less accumulated depreciation and accumulated impairment losses. Revaluation model is applied for entire class of freehold land and buildings and buildings on leasehold lands. The Market participant’s ability to generate economic benefits by using the asset in its highest and best use or by selling it to another market participant that would use the asset in its highest and best use are taken into account in measuring the fair value.
Properties that carried at revaluation amount being their fair value at the date of revaluation, less any subsequent accumulated depreciation and subsequent accumulated impairment losses. Freehold land and building of the Group are revalued every three to five years or more frequently if the fair values are substantially different from their carrying amounts to ensure that the carrying amounts do not differ from the fair values at the Reporting date. Any surplus arising on revaluation of an asset is accumulated under the Revaluation Reserve in Equity through Other Comprehensive Income. However, if there is any revaluation deficit of the same asset previously recognised on profit or loss, revaluation surplus is recognised on Profit or Loss to the extent it reverse such deficit. Any deficit arising on revaluation of a assets is recognised on Profit or Loss and such deficit is recognised in Other Comprehensive Income to the extend of any credit balance existing in the revaluation reserve in respect of that asset.
Accumulated depreciation as at revaluation date is eliminated against the gross carrying amount of assets and the net amount restated to the revalued amount of the assets. Where the carrying value of the Property, Plant and Equipment are reviewed for impairment, when an event or changes in circumstances indicate that the carrying value may not be recoverable.
When parts of an item of Property, Plant and Equipment have different useful lives, they are accounted for as separate items (major components) of Property, Plant and Equipment.
Subsequent Costs
The cost of replacing a part of an item of PPE is recognised in the carrying amount of the item if it is probable that the future economic benefits embodied within the part will flow to the Group and its cost can be measured reliably. The costs of the day to day servicing of Property, Plant and Equipment are recognised in the Statement of Profit or Loss in “Other expenses” (Note 16) as incurred.
Capital Work in Progress
Capital work in progress is stated at cost. These are expenses of a capital nature directly incurred in the construction of buildings, awaiting capitalisation.
Borrowing Costs
Borrowing costs directly attributable to the acquisition, construction or production of an asset that necessarily takes a substantial period of time to get ready for its intended use or sale are capitalised as part of the cost of the asset. All other borrowing costs are expensed in the period in which they occur. Borrowing costs consist of interest and other costs that the Bank incurs in connection with the borrowing of funds.

About this Report / Performance Highlights 2019 / Chairman’s Message / General Manager’s Review / Organisational Overview / Strategic Report / Performance and Outlook / Stakeholder Value Creation / Financial Reports / Compliance Annexes / Supplementary Information
247
Depreciation
Depreciation is recognised in Statement of Profit or Loss on a straight line basis over the estimated useful lives of each part of an item of Property, Plant and Equipment since this method most closely reflects the expected pattern of consumption of the future economic benefits embodied in the asset. Leased assets under finance leases are depreciated over the shorter of the lease term and their useful lives. Land is not depreciated. Further, cost of expansion and major renovations on the building are depreciated over the remaining useful lives of the original buildings.
Provisioning for depreciation of PPE is made on pro rata basis
The Group’s estimated useful lives for the current and comparative periods are as follows:
Freehold buildings 40 - 60 years
Office equipment 08 years
Furniture and fittings 08 years
Computer equipment 05 years
Motor vehicles 04 years
Power plant 20 years
Depreciation methods, useful lives and residual values are reassessed at each financial year end and adjusted if appropriate.
Useful Life and Residual Values
Residual value is the amount that Group could receive for an asset at the Reporting date if the asset was already at the age and in the condition that it will be in when the Group expects to dispose it.
The residual and useful life of an asset are reviewed at least at each Reporting date, changes in the residual value and useful life are accounted for prospectively as a change in an accounting estimate only if the residual value is material.
Derecognition
The carrying amount of an item of Property, Plant and Equipment is derecognised on disposal, replacement or when no future economic benefits are expected from its use. The gain or loss arising from the derecognition of an item of Property, Plant and Equipment is included in the “Net other operating income” (Note 13) “Other expenses” (Note 16) in the Statement of Profit or Loss in the year the item is derecognised.
Reclassification as Investment Property
When the use of property changes such that is reclassified as investment property, its fair value at the date of reclassification becomes its cost for subsequent accounting. Any gain arising on re-measurement is recognised in the Statement of Profit or Loss to the extent that it reverses a previous impairment loss on the specific property, with any remaining gain recognised in Other Comprehensive Income and presented in revaluation reserve in equity. Any loss is recognised immediately in the Statement of Profit or Loss.

BA
NK
OF
CE
YL
ON
AN
NU
AL
RE
PO
RT
20
19
Notes to the Financial Statements248
About this Report / Performance Highlights 2019 / Chairman’s Message / General Manager’s Review / Organisational Overview / Strategic Report / Performance and Outlook / Stakeholder Value Creation / Financial Reports / Compliance Annexes / Supplementary Information
33.1 Bank
Freehold
land
Freehold
building
Buildings
on
leasehold
land
Equipment
[Note
33.12.1]
Motor
vehicles
Leasehold
motor
vehicles
Capital
work in
progress
2019
Total
2018
Total
LKR ’000 LKR ’000 LKR ’000 LKR ’000 LKR ’000 LKR ’000 LKR ’000 LKR ’000 LKR ’000
Cost or valuation
As at 1 January 12,967,284 3,380,769 2,455,874 14,528,740 1,702,075 43,317 242,740 35,320,799 32,651,197
Additions during the year
Acquisitions 642,463 103,354 48,335 1,920,301 106,453 - 550,444 3,371,350 3,399,832
Capitalisations - 156,338 44,586 13,517 - - (214,441) - -
Changes in revaluation
surplus/ (deficit) - - - - - - - - (337,522)
Transfer of accumulated
depreciation on asset
revaluation - - - - - - - - -
Disposals during the year - (4,800) - (252,848) (101,480) (5,769) - (364,897) (425,507)
Impairment to profit/ loss - - - - - - - - -
Exchange rate adjustments - - - (4,313) (233) - - (4,546) 31,239
Transfers/ adjustments - (59,692) 59,692 (3,433) - - (80,520) (83,953) 1,560
As at 31 December 13,609,747 3,575,969 2,608,487 16,201,964 1,706,815 37,548 498,223 38,238,753 35,320,799
Accumulated depreciation
As at 1 January - 130,224 215,111 9,594,443 1,159,549 43,317 - 11,142,644 9,605,083
Charge for the year - 110,630 78,205 1,431,308 252,063 - - 1,872,206 1,700,038
Transfer of accumulated
depreciation on assets
revaluation - - - - - - - - -
Disposals during the year - (1,950) - (249,364) (93,715) (5,769) - (350,798) (355,471)
Exchange rate adjustments - - - (4,022) (207) - - (4,229) 26,184
Transfers/ adjustments - (108) 108 (135) - - - (135) 166,810
As at 31 December - 238,796 293,424 10,772,230 1,317,690 37,548 - 12,659,688 11,142,644
Net book value as at
31 December 2019 13,609,747 3,337,173 2,315,063 5,429,734 389,125 - 498,223
25,579,065 -
Net book value as at
31 December 2018
12,967,284 3,250,545 2,240,763 4,934,297 542,526 - 242,740 -
24,178,155

About this Report / Performance Highlights 2019 / Chairman’s Message / General Manager’s Review / Organisational Overview / Strategic Report / Performance and Outlook / Stakeholder Value Creation / Financial Reports / Compliance Annexes / Supplementary Information
249
33.2 Group
Freehold
land
Freehold
building
Buildings
on
leasehold
land
Equipment
[Note
33.12.2]
Motor
vehicles
Leasehold
motor
vehicles
Capital
work in
progress
2019
Total
2018
Total
LKR ’000 LKR ’000 LKR ’000 LKR ’000 LKR ’000 LKR ’000 LKR ’000 LKR ’000 LKR ’000
Cost or valuation
As at 1 January 15,878,365 6,465,075 10,379,114 16,062,997 1,865,478 66,693 320,622 51,038,344 48,076,083
Additions during the year
Acquisitions 642,463 105,033 148,957 2,032,055 151,309 - 631,965 3,711,782 3,569,916
Capitalisations - 156,338 44,586 13,517 - - (214,441) - -
Changes in revaluation
surplus/ (deficit) - 7,217 767,682 - - - - 774,899 136,882
Transfer of accumulated
depreciation on asset
revaluation - (30,718) (330,559) - - - - (361,277) -
Disposals during the year - (7,742) - (269,381) (110,861) (5,769) (100,949) (494,702) (517,961)
Impairment to profit/ loss - - - - - - - - -
Exchange rate
adjustments 9,562 9,891 - (2,487) (233) - - 16,733 115,537
Transfers/ adjustments - (59,692) 59,521 (3,213) - - (80,520) (83,904) (342,113)
As at 31 December 16,530,390 6,645,402 11,069,301 17,833,488 1,905,693 60,924 556,677 54,601,875 51,038,344
Accumulated depreciation
As at 1 January - 688,316 742,667 10,541,384 1,251,260 52,208 - 13,275,835 11,467,164
Charge for the year - 294,891 450,887 1,553,373 271,437 5,486 - 2,576,074 2,376,170
Transfer of accumulated
depreciation on asset
revalution - (30,718) (330,559) - - - - (361,277) -
Disposals during the year - (1,950) - (264,342) (103,096) (5,769) - (375,157) (422,323)
Exchange rate
adjustments - 2,271 - (1,900) (207) - - 164 33,476
Transfers/ adjustments - (108) 108 (144) 789 (789) - (144) (178,652)
As at 31 December - 952,702 863,103 11,828,371 1,420,183 51,136 - 15,115,495 13,275,835
Net book value as at
31 December 2019 16,530,390 5,692,700 10,206,198 6,005,117 485,510 9,788 556,677 39,486,380 -
Net book value as at
31 December 2018 15,878,365 5,776,759 9,636,447 5,521,613 614,218 14,485 320,622 - 37,762,509

BA
NK
OF
CE
YL
ON
AN
NU
AL
RE
PO
RT
20
19
Notes to the Financial Statements250
About this Report / Performance Highlights 2019 / Chairman’s Message / General Manager’s Review / Organisational Overview / Strategic Report / Performance and Outlook / Stakeholder Value Creation / Financial Reports / Compliance Annexes / Supplementary Information
33.3 Title Restriction on Property, Plant and Equipment
There were no restrictions that existed in the title of the Property, Plant and Equipment of the Bank and the Group as at the Reporting date.
33.4 Property, Plant and Equipment Pledged as Security for Liabilities
No freehold Property, Plant and Equipment have been pledged as security for any liability.
33.5 Compensation from Third Parties for Items of Property, Plant and Equipment
There were no compensation received/ receivable from third parties for items of Property, Plant and Equipment which were impaired or given up.
33.6 Fully Depreciated Property, Plant & Equipment
The initial cost of fully depreciated Property, Plant and Equipment which are still in use are as follows :
Bank Group
As at 31 December 2019 2018 2019 2018
LKR ’000 LKR ’000 LKR ’000 LKR ’000
Motor vehicles 818,935 801,143 827,502 854,026
Computer equipments 3,663,338 3,025,018 3,665,481 3,253,241
Equipment, furniture, and fittings 1,641,669 1,473,627 1,671,293 1,654,837
Buildings on leasehold lands 35,655 28,079 35,655 28,079
Plant and machinery 1,275,012 1,182,280 1,275,386 1,182,556
Total 7,434,609 6,510,147 7,475,317 6,972,739
33.7 Temporarily Idle Property, Plant and Equipment
There were no temporarily idle Property, Plant and Equipment as at the Reporting date.
33.8 Property, Plant and Equipment Retired from Active Use
The Group held no Property, Plant and Equipment retired from active use and which were not classified as held for sale in accordance with SLFRS 5 -“Non-current assets held for sale and discontinued operations”.
33.9 Freehold Properties
The carrying value of freehold properties, that would have been recognised in the Financial Statements, if they were carried at cost less accumulated depreciation is as follows:
33.9.1 Bank
As at 31 December 2019 2018
Cost Accumulateddepreciation
Net book value
Cost Accumulateddepreciation
Net book value
LKR ’000 LKR ’000 LKR ’000 LKR ’000 LKR ’000 LKR ’000
Land 2,014,740 - 2,014,740 1,372,277 - 1,372,277
Building 1,954,066 (664,833) 1,289,233 1,694,375 (574,675) 1,119,700
Total 3,968,806 (664,833) 3,303,973 3,066,652 (574,675) 2,491,977
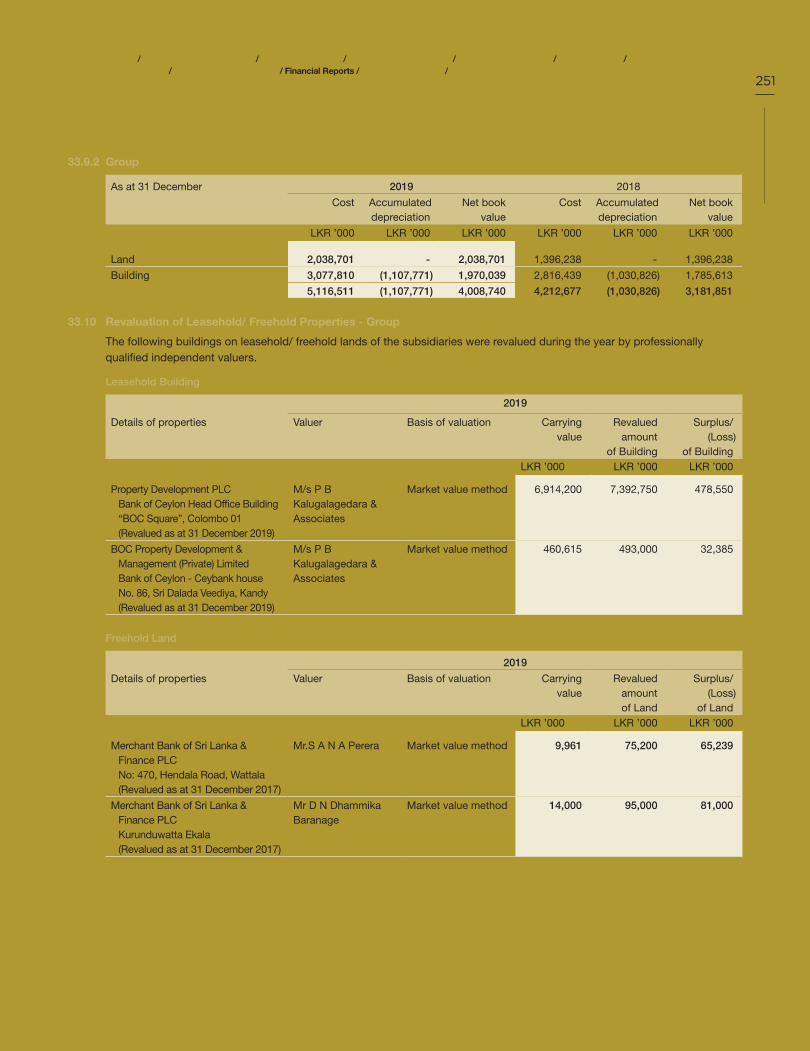
About this Report / Performance Highlights 2019 / Chairman’s Message / General Manager’s Review / Organisational Overview / Strategic Report / Performance and Outlook / Stakeholder Value Creation / Financial Reports / Compliance Annexes / Supplementary Information
251
33.9.2 Group
As at 31 December 2019 2018
Cost Accumulateddepreciation
Net book value
Cost Accumulateddepreciation
Net book value
LKR ’000 LKR ’000 LKR ’000 LKR ’000 LKR ’000 LKR ’000
Land 2,038,701 - 2,038,701 1,396,238 - 1,396,238
Building 3,077,810 (1,107,771) 1,970,039 2,816,439 (1,030,826) 1,785,613
Total 5,116,511 (1,107,771) 4,008,740 4,212,677 (1,030,826) 3,181,851
33.10 Revaluation of Leasehold/ Freehold Properties - Group
The following buildings on leasehold/ freehold lands of the subsidiaries were revalued during the year by professionally qualified independent valuers.
Leasehold Building
2019
Details of properties Valuer Basis of valuation Carryingvalue
Revalued amount
of Building
Surplus/(Loss)
of BuildingLKR ’000 LKR ’000 LKR ’000
Property Development PLCBank of Ceylon Head Office Building “BOC Square”, Colombo 01 (Revalued as at 31 December 2019)
M/s P B Kalugalagedara & Associates
Market value method 6,914,200 7,392,750 478,550
BOC Property Development & Management (Private) Limited Bank of Ceylon - Ceybank house No. 86, Sri Dalada Veediya, Kandy (Revalued as at 31 December 2019)
M/s P B Kalugalagedara & Associates
Market value method 460,615 493,000 32,385
Freehold Land
2019
Details of properties Valuer Basis of valuation Carryingvalue
Revalued amountof Land
Surplus/(Loss)
of LandLKR ’000 LKR ’000 LKR ’000
Merchant Bank of Sri Lanka &Finance PLC No: 470, Hendala Road, Wattala (Revalued as at 31 December 2017)
Mr.S A N A Perera Market value method 9,961 75,200 65,239
Merchant Bank of Sri Lanka &Finance PLC Kurunduwatta Ekala (Revalued as at 31 December 2017)
Mr D N Dhammika Baranage
Market value method 14,000 95,000 81,000

BA
NK
OF
CE
YL
ON
AN
NU
AL
RE
PO
RT
20
19
Notes to the Financial Statements252
About this Report / Performance Highlights 2019 / Chairman’s Message / General Manager’s Review / Organisational Overview / Strategic Report / Performance and Outlook / Stakeholder Value Creation / Financial Reports / Compliance Annexes / Supplementary Information
Freehold Building
2019
Details of properties Valuer Basis of valuation Carryingvalue
Revalued amount
of Building
Surplus/(Loss)
of BuildingLKR ’000 LKR ’000 LKR ’000
BOC Property Development &Management (Private) Limited Bank of Ceylon - Merchant Tower St. Micheal's Road, Colombo 03 (Revalued as at 31 December 2019)
M/s P B Kalugalagedara & Associates
Market value method 1,946,500 1,898,678 (47,822)
Merchant Bank of Sri Lanka &Finance PLC No: 470, Hendala Road, Wattala (Revalued as at 31 December 2017)
Mr S A N A Perera Market value method 1,190 4,200 3,010
33.11 Unobservable Inputs Considered in Measuring Fair Value
The following table depicts information about significant unobservable inputs used in measuring fair value of the assets categorised under Level 3 of the fair value hierarchy.
33.11.1 Bank
2019
Type of asset Fair valueas at
31.12.2019
Valuation technique Significantunobservableinputs
Range of estimates for unobservableinputs
Sensitivity of fair value to unobservableinputs
LKR ’000
Freehold land 13,609,747 Market comparable method
Estimated cost per perch
LKR 24,500 - LKR 14,493,000
Positively correlated sensitivity
Freehold buildings 3,337,173 Market comparable method
Estimated cost per square feet
LKR 400 - LKR 55,400
Positively correlated sensitivity
Buildings on leasehold lands 2,315,063 Rental value basis Estimated rental value per square feet
LKR 110 - LKR 11,250
Positively correlated sensitivity
Expected market rental growth p.a
5% Positively correlated sensitivity
Anticipated maintenance cost
40% Positively correlated sensitivity
Discount rate 5.50% Negatively correlated sensitivity

About this Report / Performance Highlights 2019 / Chairman’s Message / General Manager’s Review / Organisational Overview / Strategic Report / Performance and Outlook / Stakeholder Value Creation / Financial Reports / Compliance Annexes / Supplementary Information
253
33.11.2 Group
2019
Type of asset Fair valueas at
31.12.2019
Valuation technique Significantunobservableinputs
Range of estimates for unobservableinputs
Sensitivity of fair value to unobservableinputs
LKR ’000
Freehold land 16,530,390 Market comparable method
Estimated cost per perch
LKR 24,500 - LKR 14,493,000
Positively correlated sensitivity
Freehold buildings 5,692,700 Market comparable method
Estimated cost per square feet
LKR 400 - LKR 55,400
Positively correlated sensitivity
Buildings on leasehold lands 10,206,198 Rental value basis Estimated rental value per square feet
LKR 110 - LKR 6,426
Positively correlated sensitivity
Expected market rental growth p.a
5% Positively correlated sensitivity
Anticipated maintenance cost
40% Positively correlated sensitivity
Discount rate 5.5%-8.0% Negatively correlated sensitivity
33.12 Equipment
33.12.1 Bank
Computer Equipment
Furniture and
Fittings
Office Equipment
2019 Total
2018 Total
LKR ’000 LKR ’000 LKR ’000 LKR ’000 LKR ’000
Cost
Balance as at 1 January 7,613,941 4,091,852 2,822,947 14,528,740 12,845,291
Additions during the year 956,781 715,251 248,269 1,920,301 2,077,458
Capitalisations - 13,517 - 13,517 -
Disposals during the year (109,213) (69,225) (74,410) (252,848) (250,572)
Exchange rate adjustments (3,830) (180) (303) (4,313) 29,178
Transfers/ adjustments (2,534) - (899) (3,433) (172,615)
Balance as at 31 December 8,455,145 4,751,215 2,995,604 16,201,964 14,528,740
Accumulated Depreciation
Balance as at 1 January 5,023,571 2,556,208 2,014,664 9,594,443 8,508,989
Charge for the year 872,356 358,693 200,259 1,431,308 1,308,439
Transfers/ adjustments 226 (449) 88 (135) (2,302)
Disposals during the year (108,423) (67,258) (73,683) (249,364) (245,373)
Exchange rate adjustments (3,722) (220) (80) (4,022) 24,690
Balance as at 31 December 5,784,008 2,846,974 2,141,248 10,772,230 9,594,443
Net book value as at 31 December 2019 2,671,137 1,904,241 854,356 5,429,734 -
Net book value as at 31 December 2018 2,590,370 1,535,644 808,283 - 4,934,297
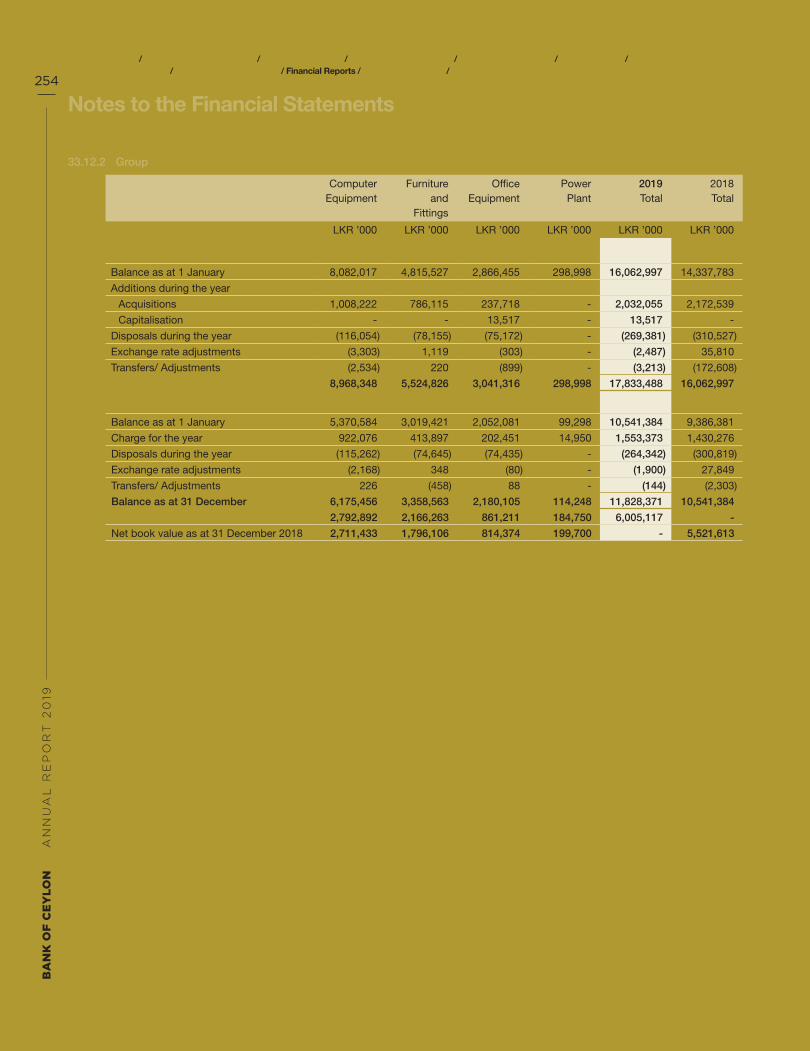
BA
NK
OF
CE
YL
ON
AN
NU
AL
RE
PO
RT
20
19
Notes to the Financial Statements254
About this Report / Performance Highlights 2019 / Chairman’s Message / General Manager’s Review / Organisational Overview / Strategic Report / Performance and Outlook / Stakeholder Value Creation / Financial Reports / Compliance Annexes / Supplementary Information
33.12.2 Group
Computer Equipment
Furniture and
Fittings
Office Equipment
Power Plant
2019 Total
2018 Total
LKR ’000 LKR ’000 LKR ’000 LKR ’000 LKR ’000 LKR ’000
Cost
Balance as at 1 January 8,082,017 4,815,527 2,866,455 298,998 16,062,997 14,337,783
Additions during the year
Acquisitions 1,008,222 786,115 237,718 - 2,032,055 2,172,539
Capitalisation - - 13,517 - 13,517 -
Disposals during the year (116,054) (78,155) (75,172) - (269,381) (310,527)
Exchange rate adjustments (3,303) 1,119 (303) - (2,487) 35,810
Transfers/ Adjustments (2,534) 220 (899) - (3,213) (172,608)
Balance as at 31 December 8,968,348 5,524,826 3,041,316 298,998 17,833,488 16,062,997
Accumulated Depreciation
Balance as at 1 January 5,370,584 3,019,421 2,052,081 99,298 10,541,384 9,386,381
Charge for the year 922,076 413,897 202,451 14,950 1,553,373 1,430,276
Disposals during the year (115,262) (74,645) (74,435) - (264,342) (300,819)
Exchange rate adjustments (2,168) 348 (80) - (1,900) 27,849
Transfers/ Adjustments 226 (458) 88 - (144) (2,303)
Balance as at 31 December 6,175,456 3,358,563 2,180,105 114,248 11,828,371 10,541,384
Net book value as at 31 December 2019 2,792,892 2,166,263 861,211 184,750 6,005,117 -
Net book value as at 31 December 2018 2,711,433 1,796,106 814,374 199,700 - 5,521,613
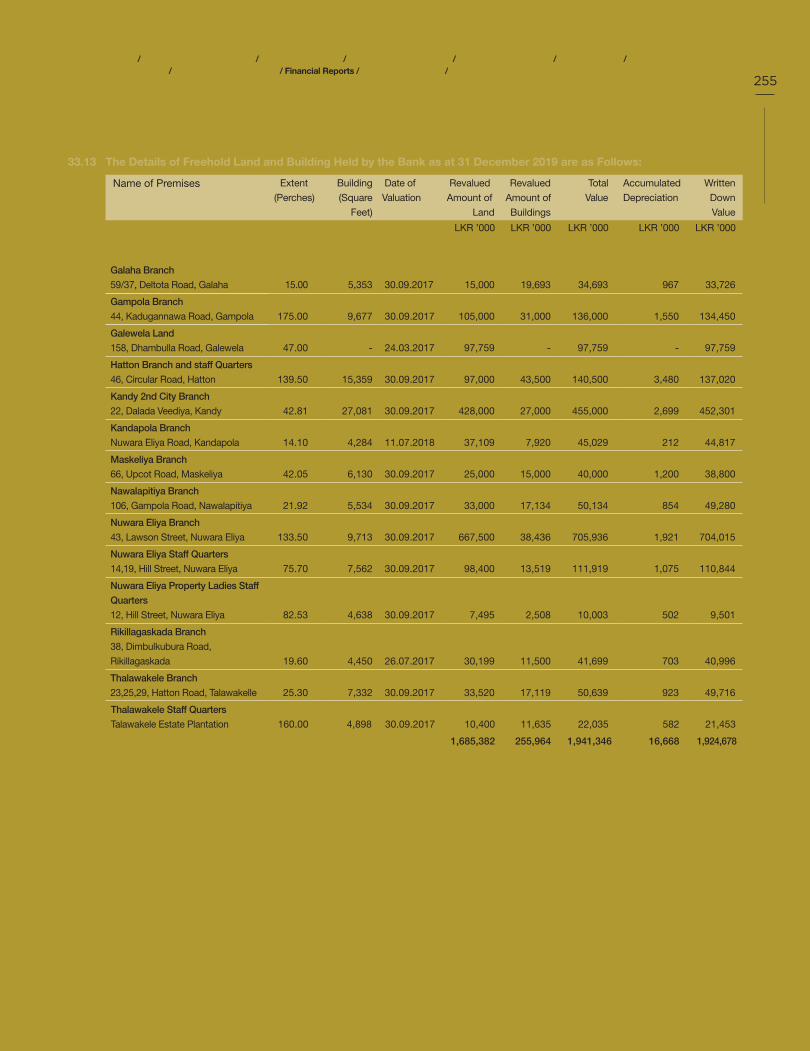
About this Report / Performance Highlights 2019 / Chairman’s Message / General Manager’s Review / Organisational Overview / Strategic Report / Performance and Outlook / Stakeholder Value Creation / Financial Reports / Compliance Annexes / Supplementary Information
255
33.13 The Details of Freehold Land and Building Held by the Bank as at 31 December 2019 are as Follows:
Name of Premises Extent
(Perches)
Building
(Square
Feet)
Date of
Valuation
Revalued
Amount of
Land
Revalued
Amount of
Buildings
Total
Value
Accumulated
Depreciation
Written
Down
Value
LKR ’000 LKR ’000 LKR ’000 LKR ’000 LKR ’000
Central Province
Galaha Branch
59/37, Deltota Road, Galaha 15.00 5,353 30.09.2017 15,000 19,693 34,693 967 33,726
Gampola Branch
44, Kadugannawa Road, Gampola 175.00 9,677 30.09.2017 105,000 31,000 136,000 1,550 134,450
Galewela Land
158, Dhambulla Road, Galewela 47.00 - 24.03.2017 97,759 - 97,759 - 97,759
Hatton Branch and staff Quarters
46, Circular Road, Hatton 139.50 15,359 30.09.2017 97,000 43,500 140,500 3,480 137,020
Kandy 2nd City Branch
22, Dalada Veediya, Kandy 42.81 27,081 30.09.2017 428,000 27,000 455,000 2,699 452,301
Kandapola Branch
Nuwara Eliya Road, Kandapola 14.10 4,284 11.07.2018 37,109 7,920 45,029 212 44,817
Maskeliya Branch
66, Upcot Road, Maskeliya 42.05 6,130 30.09.2017 25,000 15,000 40,000 1,200 38,800
Nawalapitiya Branch
106, Gampola Road, Nawalapitiya 21.92 5,534 30.09.2017 33,000 17,134 50,134 854 49,280
Nuwara Eliya Branch
43, Lawson Street, Nuwara Eliya 133.50 9,713 30.09.2017 667,500 38,436 705,936 1,921 704,015
Nuwara Eliya Staff Quarters
14,19, Hill Street, Nuwara Eliya 75.70 7,562 30.09.2017 98,400 13,519 111,919 1,075 110,844
Nuwara Eliya Property Ladies Staff
Quarters
12, Hill Street, Nuwara Eliya 82.53 4,638 30.09.2017 7,495 2,508 10,003 502 9,501
Rikillagaskada Branch
38, Dimbulkubura Road,
Rikillagaskada 19.60 4,450 26.07.2017 30,199 11,500 41,699 703 40,996
Thalawakele Branch
23,25,29, Hatton Road, Talawakelle 25.30 7,332 30.09.2017 33,520 17,119 50,639 923 49,716
Thalawakele Staff Quarters
Talawakele Estate Plantation 160.00 4,898 30.09.2017 10,400 11,635 22,035 582 21,453
1,685,382 255,964 1,941,346 16,668 1,924,678

BA
NK
OF
CE
YL
ON
AN
NU
AL
RE
PO
RT
20
19
Notes to the Financial Statements256
About this Report / Performance Highlights 2019 / Chairman’s Message / General Manager’s Review / Organisational Overview / Strategic Report / Performance and Outlook / Stakeholder Value Creation / Financial Reports / Compliance Annexes / Supplementary Information
Name of Premises Extent
(Perches)
Building
(Square
Feet)
Date of
Valuation
Revalued
Amount of
Land
Revalued
Amount of
Buildings
Total
Value
Accumulated
Depreciation
Written
Down
Value
LKR ’000 LKR ’000 LKR ’000 LKR ’000 LKR ’000
Eastern Province
Batticaloa Branch
21 & 21 1/1 Govington Road,
Batticaloa 64.85 7,774 30.09.2017 48,500 19,000 67,500 1,086 66,414
Mutur Branch (New)
Ward No 7, Main street, Mutur 71.00 7,566 30.09.2017 15,585 41,600 57,185 2,080 55,105
Pottuvil Branch
Main Street, Pottuvil 10.70 4,077 30.09.2017 17,000 13,000 30,000 650 29,350
Trincomalee Branch
28, Inner Harbour Road, Trincomalee 90.00 10,810 30.09.2017 72,000 25,149 97,149 6,287 90,862
Trincomalee City Branch
09, Main Street, Trincomalee 21.90 - 30.09.2017 35,000 - 35,000 - 35,000
Valachchenai Branch
Main Street, Valachchenai 47.34 6,621 30.09.2017 30,500 14,500 45,000 1,450 43,550
218,585 113,249 331,834 11,553 320,281
Northern Province
Jaffna Area Office & Branch
56, Stanley Road, Jaffna 166.25 21,393 30.11.2014 249,500 37,083 286,583 9,201 277,382
Jaffna 2nd Branch
52, Stanley Road, Jaffna 33.89 12,700 30.10.2018 135,269 52,330 187,599 218 187,381
Karainagar Branch
Post Office View, Karainagar 63.22 5,720 30.11.2014 3,300 5,890 9,190 1,453 7,737
Mannar manager and staff Quarters
52, Pallimunai Road, Grand Bazaar,
Mannar 162.04 7,661 30.11.2014 9,500 9,627 19,127 2,234 16,893
Nelliadi Branch
Thikkam Road, Karaveddy, Nelliady 22.11 2,718 30.11.2014 17,750 34,694 52,444 3,932 48,512
415,319 139,624 554,943 17,038 537,905

About this Report / Performance Highlights 2019 / Chairman’s Message / General Manager’s Review / Organisational Overview / Strategic Report / Performance and Outlook / Stakeholder Value Creation / Financial Reports / Compliance Annexes / Supplementary Information
257
Name of Premises Extent
(Perches)
Building
(Square
Feet)
Date of
Valuation
Revalued
Amount of
Land
Revalued
Amount of
Buildings
Total
Value
Accumulated
Depreciation
Written
Down
Value
LKR ’000 LKR ’000 LKR ’000 LKR ’000 LKR ’000
North Western Province
Alawwa Branch
64, Giriulla Road, Alawwa 30.80 7,011 30.09.2017 46,000 25,624 71,624 1,189 70,435
Bingiriya Land
Wariyapola Road, Bingiriya 40.00 - 02.05.2017 21,199 - 21,199 - 21,199
Chilaw Branch
Radaguru Edmund Peiris Mawatha,
Chilaw 38.25 8,248 30.09.2017 66,000 24,000 90,000 1,200 88,800
Dankotuwa Land
No 88A, Kahatagahawatte,
Negombo Road, Dankotuwa 32.90 - 03.08.2017 49,973 - 49,973 - 49,973
Dummalasooriya Branch
227, Kuliyapitiya - Madampe Road,
Dummalasuriya 41.68 5,611 30.09.2017 30,000 16,000 46,000 1,067 44,933
Kurunegala Province Office AGM's
Quarters & CM Quarters
18, Mihindu mawatha, Kurunegala 225.00 19,437 30.09.2017 560,000 40,000 600,000 2,000 598,000
Kurunegala Super Grade Branch
Commercial Complex, Kurunegala - 12,242 30.09.2017 - 165,883 165,883 6,828 159,055
Kurunegala 2nd City Branch
34, Colombo Road, Kurunegala 46.80 16,677 30.09.2017 234,000 18,617 252,617 4,701 247,916
Madampe Branch
10, Station Road, Madampe 86.10 7,260 30.09.2017 38,000 22,319 60,319 1,021 59,298
Madurankuliya Branch
66 , Colombo Road, Madurankuliya 46.00 6,083 30.09.2017 60,000 36,000 96,000 1,800 94,200
Malsiripura Land
254, Dambulla Road, Malsiripura 46.20 - 06.06.2015 46,799 - 46,799 - 46,799
Marawila Land
85, Negombo Road, Marawila 35.00 - 03.04.2018 48,879 - 48,879 - 48,879
Narammala Branch
139, Negombo Road, Narammala 117.50 7,190 30.09.2017 87,000 39,500 126,500 1,975 124,525
Nattandiya Land
115, Marawila Road, Nattandiya 67.50 - 18.01.2017 47,399 - 47,399 - 47,399
Waikkal Land
Puttalam Road, Thoppuwa, Waikkal 36.00 - 05.03.2017 44,799 - 44,799 - 44,799
Wariyapola Land
Makaduwapitiyewatte,
Vilakatupotha, Wariyapola 40.80 - 26.09.2017 90,699 - 90,699 - 90,699
1,470,747 387,943 1,858,690 21,781 1,836,909

BA
NK
OF
CE
YL
ON
AN
NU
AL
RE
PO
RT
20
19
Notes to the Financial Statements258
About this Report / Performance Highlights 2019 / Chairman’s Message / General Manager’s Review / Organisational Overview / Strategic Report / Performance and Outlook / Stakeholder Value Creation / Financial Reports / Compliance Annexes / Supplementary Information
Name of Premises Extent
(Perches)
Building
(Square
Feet)
Date of
Valuation
Revalued
Amount of
Land
Revalued
Amount of
Buildings
Total
Value
Accumulated
Depreciation
Written
Down
Value
LKR ’000 LKR ’000 LKR ’000 LKR ’000 LKR ’000
Sabaragamuwa Province
Balangoda Branch
137, Main Street, Balangoda 14.50 3,202 30.09.2017 40,000 1,488 41,488 558 40,930
Dehiowita Branch
62 Main Street, Dehiowita 38.60 3,818 30.09.2017 15,180 2,568 17,748 1,027 16,721
Kegalle Branch
110, Colombo Road, Kegalle 120.00 14,680 30.09.2017 146,000 40,047 186,047 2,898 183,149
Ratnapura Branch
6, Dharmapala Mawatha, Ratnapura 99.70 9,808 30.09.2017 82,000 33,575 115,575 1,605 113,970
Rathnapura Land
58, Main Street, Ratnapura 31.69 - 30.09.2017 85,000 - 85,000 - 85,000
368,180 77,678 445,858 6,088 439,770
Southern Province
Ambalangoda Branch
274, Main Street, Ambalangoda 58.00 7,575 30.09.2017 203,000 25,500 228,500 1,275 227,225
Ambalantota Branch
11 Wanduruppa Road, Ambalantota 38.00 5,410 30.09.2017 36,200 15,800 52,000 864 51,136
Ahangama Land
Mathara Road, Ahangama 33.35 - 21.02.2017 20,007 - 20,007 - 20,007
Batapola Branch
BB Hardware, Mahawatta, Batapola 46.80 3,024 27.01.2019 60,012 6,682 66,694 93 66,601
Beliatta Branch
67, Walasmulla Road, Beliatta 53.02 6,200 30.09.2017 59,000 40,500 99,500 2,025 97,475
Galle Province Office
2, Light House Street, Fort, Galle 32.63 14,250 30.09.2017 228,000 25,489 253,489 2,027 251,462
Galle Branch
2, Gamini Road, Galle 31.50 10,800 30.09.2017 236,000 21,000 257,000 1,680 255,320
Galle City Branch
163 & 161, Dewamitta Mawatha,
Kumbalwella 27.14 - 05.03.2019 126,566 - 126,566 - 126,566
Hakmana Branch
Beliatta Road, Hakmana 36.70 3,400 30.09.2017 36,700 8,800 45,500 503 44,997
Imaduwa Branch
Ahangama Road, Imaduwa 83.50 3,300 30.09.2017 58,500 8,725 67,225 496 66,729
Karapitiya Land
105, Hirimbura Cross Road,
Karapitiya, Galle 35.00 - 01.02.2017 62,599 - 62,599 - 62,599
Matara Branch
11, Kumaratunga Mawatha, Matara 104.40 15,905 30.09.2017 261,000 25,332 286,332 10,102 276,230
Matara Bazzar Branch
Gunawardana Mawatha, Matara 49.25 7,105 30.09.2017 123,500 41,500 165,000 2,075 162,925
Nagoda Branch
Nagoda 40.00 2,985 30.09.2017 16,000 12,000 28,000 600 27,400
Ranna Branch
Kahandawa, Ranna 40.00 - 26.10.2018 28,199 - 28,199 - 28,199

About this Report / Performance Highlights 2019 / Chairman’s Message / General Manager’s Review / Organisational Overview / Strategic Report / Performance and Outlook / Stakeholder Value Creation / Financial Reports / Compliance Annexes / Supplementary Information
259
Name of Premises Extent
(Perches)
Building
(Square
Feet)
Date of
Valuation
Revalued
Amount of
Land
Revalued
Amount of
Buildings
Total
Value
Accumulated
Depreciation
Written
Down
Value
LKR ’000 LKR ’000 LKR ’000 LKR ’000 LKR ’000
Tangalle Branch
145/147, Sea Street, Tangalle 21.05 5,370 30.09.2017 26,500 31,500 58,000 1,575 56,425
Weeraketiya Branch
Belliatta Road, Weeraketiya 36.87 4,480 30.09.2017 42,600 25,900 68,500 1,295 67,205
Weligama Branch
239 Main Street, Weligama 97.75 8,110 30.09.2017 73,300 22,915 96,215 1,305 94,910
Walasmulla Land
453, Walasmulla South, Walasmulla 38.00 - 09.12.2016 32,717 - 32,717 - 32,717
1,730,400 311,643 2,042,043 25,915 2,016,128
Uva Province
Badulla Uva Province Office
Bank Road, Badulla 118.75 7,366 30.11.2014 11,750 12,228 23,978 1,330 22,648
Bandarawela Branch
230, Badulla Road, Bandarawela 10.60 7,731 30.09.2017 33,000 15,000 48,000 750 47,250
Ettampitiya Branch
23, Nuwara Eliya Road, Ettampitiya 20.35 3,729 30.09.2017 10,105 9,956 20,061 498 19,563
Haputale Branch (Browns)
20, Station Road, Haputale 158.70 7,361 30.09.2017 36,000 11,000 47,000 880 46,120
Monaragala Branch,
Manager Quarters & staff Quarters
401, Wellawaya Road, Moneragala 160.00 15,000 30.11.2014 50,000 32,870 82,870 3,978 78,892
Siyabalanduwa Branch
Siyabalanduwa 28.00 5,564 01.11.2017 21,699 22,500 44,199 984 43,215
162,554 103,554 266,108 8,420 257,688
Western Province North
Borella Branch
71, Danister de Silva Mawatha,
Borella 48.65 20,173 30.09.2017 357,000 74,000 431,000 3,700 427,300
City Office
41, Bristol Street, Colombo 1 39.50 31,443 30.09.2017 495,000 55,000 550,000 3,667 546,333
Grand Pass Branch
703, Sirimavo Bandaranaike
Mawatha, Grandpass 20.12 6,210 30.09.2017 120,720 24,280 145,000 1,518 143,482
Gampaha Branch
170,Colombo Road, Gampaha 34.06 7,300 30.09.2017 85,000 99,035 184,035 206 183,829
Ganemulla Branch
156, Kirindiwita Road, Ganemulla 43.61 - 26.01.2019 72,645 - 72,645 - 72,645
Ja Ela Branch
19, Negombo Road, Ja-ela 40.64 8,090 30.09.2017 121,920 20,000 141,920 1,600 140,320
Kadawatha Branch
469, Ragama Road, Kadawatha 30.71 6,138 30.09.2017 92,130 17,500 109,630 1,400 108,230
Kiribathgoda Land
Kandy Road, Kiribathgoda 43.70 - 21.06.2018 249,963 - 249,963 - 249,963
Negombo Branch
118, Rajapakse Broadway,
Negombo 97.25 16,760 30.11.2014 171,160 41,915 213,075 8,298 204,777

BA
NK
OF
CE
YL
ON
AN
NU
AL
RE
PO
RT
20
19
Notes to the Financial Statements260
About this Report / Performance Highlights 2019 / Chairman’s Message / General Manager’s Review / Organisational Overview / Strategic Report / Performance and Outlook / Stakeholder Value Creation / Financial Reports / Compliance Annexes / Supplementary Information
Name of Premises Extent
(Perches)
Building
(Square
Feet)
Date of
Valuation
Revalued
Amount of
Land
Revalued
Amount of
Buildings
Total
Value
Accumulated
Depreciation
Written
Down
Value
LKR ’000 LKR ’000 LKR ’000 LKR ’000 LKR ’000
Negombo City
75,77, Main Street, Negombo 10.76 8,355 07.06.2017 46,998 57,000 103,998 3,593 100,405
Pettah Branch
212/63, Gas Work Street, Colombo 11 28.29 25,222 30.09.2017 410,000 48,478 458,478 2,761 455,717
Dematagoda Land
45, 47, Kolonnawa Road, Colombo 38.14 - 30.09.2017 205,000 - 205,000 - 205,000
2,427,536 437,208 2,864,744 26,743 2,838,001
Western Province South
Aluthgama Branch
267, Galle Road, Aluthgama 36.60 7,914 30.09.2017 62,220 26,550 88,770 1,770 87,000
Bambalapitiya Branch
10, Unity Plaza Building, Galle Road,
Colombo 4 - 7,776 30.09.2017 - 204,971 204,971 10,202 194,769
Beruwala Branch
165A, Galle Road, Beruwala 21.50 5,937 30.09.2017 48,375 11,497 59,872 1,533 58,339
Bulathsinhala Branch
40, Horana Road, Athura,
Bulathsinhala 53.85 7,190 30.09.2017 40,388 24,276 64,664 1,918 62,746
Dehiwala Branch
207, Galle Road, Dehiwela 22.00 12,422 30.09.2017 99,000 34,000 133,000 1,943 131,057
Horana Branch
87, Anguruwathota Road, Horana 70.02 10,611 30.09.2017 245,063 33,829 278,892 2,621 276,271
Idama Branch
707, Galle Road, Moratuwa 61.12 8,272 30.09.2017 150,000 15,854 165,854 2,705 163,149
Kalutara Branch
218, Galle Road, Kalutara South,
Kalutara 45.86 11,436 30.09.2017 88,720 34,266 122,986 1,648 121,338
Kottawa Branch
903, Avissawella Road, Kottawa 35.22 - 01.12.2018 219,772 - 219,772 - 219,772
Maharagama Branch & Central
Training Institute
88, Highlevel Road, Maharagama 179.21 82,121 30.09.2017 507,380 187,503 694,883 17,076 677,807
Matugama Branch
72, Agalawatte Road, Matugama 9.50 4,158 30.09.2017 33,250 4,250 37,500 850 36,650
Nugegoda Branch
174, Highlevel Road, Nugegoda, 67.50 45,584 30.09.2017 337,500 582,671 920,171 27,437 892,734
Panadura Branch
4, Super Grade Branch, Susantha
Mawatha, Panadura 80.00 10,509 30.09.2017 140,000 26,811 166,811 1,304 165,507
Panadura City Branch (Land)
17/3D, Jayathilake Mawatha,
Panadura 36.00 - 30.09.2017 36,000 - 36,000 - 36,000

About this Report / Performance Highlights 2019 / Chairman’s Message / General Manager’s Review / Organisational Overview / Strategic Report / Performance and Outlook / Stakeholder Value Creation / Financial Reports / Compliance Annexes / Supplementary Information
261
Name of Premises Extent
(Perches)
Building
(Square
Feet)
Date of
Valuation
Revalued
Amount of
Land
Revalued
Amount of
Buildings
Total
Value
Accumulated
Depreciation
Written
Down
Value
LKR ’000 LKR ’000 LKR ’000 LKR ’000 LKR ’000
Wadduwa Branch
557A, Galle Road, Wadduwa 29.00 - 30.09.2017 40,600 - 40,600 - 40,600
Wellawatte Branch
149, Galle Road, Colombo 6 51.25 15,832 30.09.2017 281,875 39,125 321,000 3,557 317,443
2,330,143 1,225,603 3,555,746 74,564 3,481,182
Holiday Homes & Rests
Badulla Fernham Bungalow &
Property
153, Spring Valley Road, Badulla 222.25 - 30.11.2012 20,000 - 20,000 - 20,000
Bandarawela Holiday Home
Bandarawela 115.00 3,028 30.09.2017 14,400 7,300 21,700 417 21,283
Dickoya Upper Glencarn Bungalow
Dickoya 189.65 8,665 30.09.2017 7,400 23,000 30,400 1,840 28,560
Dickoya lower Glencarn Bungalow
Dickoya 100.00 5,925 30.09.2017 6,000 18,880 24,880 1,505 23,375
Haputale Woodland Bungalow
Haputale 135.00 3,010 30.09.2017 14,862 6,600 21,462 528 20,934
Jaffna Bank Rest
34-34/3, Rasavinthoddam road,
Jaffna 166.25 - 30.11.2014 86,250 - 86,250 - 86,250
Kandy Holiday Home
18/5, Dangolla Road, Getambe 39.00 3,600 07.10.2016 48,999 8,200 57,199 546 56,653
Lindula Ridge Holiday Home
Lindula 175.00 3,010 30.09.2017 4,300 12,130 16,430 503 15,927
Nuwara Eliya Holiday Home
16, Hill Street, Nuwara Eliya 35.27 3,388 30.09.2017 53,000 9,800 62,800 1,307 61,493
Cey Bank Rest Nuwara Eliya
(Phase 1)
12, Hill Street, Nuwara Eliya 67.54 3,820 30.09.2017 91,000 15,000 106,000 750 105,250
346,211 100,910 447,121 7,396 439,725
Others
Colombo 7 - GM's Bangalow
75, Ananda Kumaraswamy
Mawatha, Colombo 7 79.80 6,380 30.09.2017 798,000 40,100 838,100 1,652 836,448
Colombo Darly Road Stores
Browns Building.
481, T B Jayah Mawatha, Colombo 10 151.00 28,777 30.09.2017 1,200,000 27,468 1,227,468 3,350
1,224,118
Colombo World Trade Centre
08, 8-2/1, Bank of Ceylon Mawatha,
Colombo 01 - 6,345 30.09.2017 - 355,025 355,025 17,628 337,397
Walker's & Sons
28 St. Michael's Road, Cololmbo 03 57.00 - 30.09.2017 456,690 - 456,690 - 456,690
2,454,690 422,593 2,877,283 22,630 2,854,653
Grand Total 13,609,747 3,575,969 17,185,716 238,796 16,946,920
BA
NK
OF
CE
YL
ON
AN
NU
AL
RE
PO
RT
20
19
Notes to the Financial Statements262
About this Report / Performance Highlights 2019 / Chairman’s Message / General Manager’s Review / Organisational Overview / Strategic Report / Performance and Outlook / Stakeholder Value Creation / Financial Reports / Compliance Annexes / Supplementary Information
34 Right of Use Assets/ Leasehold Properties
Initial Recognition and Measurement.
Lessee is required to recognise a right-of-use asset representing its right to use the underlying leased asset and a lease liability representing its obligation to make lease payments in the Statement of Financial Position.
Lessee measures right-of-use assets similarly to other non-financial assets (such as Property, Plant and Equipment) and lease liabilities similarly to other financial liabilities. Consequently, a lessee recognises amortisation of the right-of-use asset and interest on the lease liability.
Assets and liabilities arising from a lease are initially measured on a present value basis. The initial lease asset equals the lease liability in most cases.
At lease commencement, a lessee accounts for two elements:
(a) Right-of-use asset: Initially, a right-of-use asset is measured in the amount of the lease liability and initial direct costs. Then it is adjusted by the lease payments made before or on commencement date, lease incentives received, and any estimate of dismantling and restoration costs.
(b) Lease liability: The lease liability is in fact all payments not paid at the commencement date discounted to present value using the interest rate implicit in the lease or incremental borrowing rate if the implicit rate cannot be determined. These payments may include fixed payments, variable payments, payments under residual value guarantees, purchase price if purchase option will be exercised.
Subsequent Measurement
After commencement date, lessee needs to adjust both elements recognised initially. Lessee accretes the lease liability to reflect interest and reduce the liability to reflect lease payments made.
Right-of-Use Asset
Lessee shall measure the right-of-use asset using a cost model and depreciate the asset over the lease term on a straight-line basis. The resulted depreciation amount is charged to the Profit or Loss.
Lease Liability
Lessee shall recognise an interest on the lease liability and the lease payments are recognised as a reduction of the lease liability. Interest on lease liability is charged to the Profit or Loss.
Lessee shall re-measure the lease liability upon the occurrence of certain events (e.g. change in the lease term, change in variable rents based on an index or rate), which is generally recognised as an adjustment to the right-of-use asset.
Lessee can apply alternative subsequent measurement bases for the right-of-use asset under certain circumstances in accordance with LKAS 16: Property, Plant, Equipment, and LKAS 40: Investment Property. Right-of-use assets are subject to impairment testing under LKAS 36: Impairment of Assets, too.
It is the Bank's policy to consider the period of the rent agreement in calculating the present value of the right-of-use asset.

About this Report / Performance Highlights 2019 / Chairman’s Message / General Manager’s Review / Organisational Overview / Strategic Report / Performance and Outlook / Stakeholder Value Creation / Financial Reports / Compliance Annexes / Supplementary Information
263
Bank Group
2019 2018 2019 2018
LKR ’000 LKR ’000 LKR ’000 LKR ’000
Cost
Balance as at 1 January 129,179 129,179 195,412 195,412
Effect of adoption of IFRS 16 as at 1 January 2019 4,546,721 - 2,005,305 -
Additions during the year 118,283 - 664,107 -
Transfers during the year - - - -
Capitalised during the year - - - -
Disposals (352,084) - (16,435) -
Adjustments/ Transfers - - - -
Balance as at 31 December 4,442,099 129,179 2,848,389 195,412
Accumulated Amortisation
Balance as at 1 January 30,280 27,698 64,912 60,972
Amortisation during the year 1,283,966 2,582 612,290 3,940
Disposals during the year (352,084) - (16,435) -
Adjustments/ Transfers - - - -
Balance as at 31 December 962,162 30,280 660,767 64,912
Net book value 3,479,937 98,899 2,187,622 130,500
Net book value of lease hold properties presented as at 31 December 2018 has been transferred to Right of Use Assets with the implementation of SLFRS 16 with effect from 1 January 2019. Prior period amount has not been restated. Leasehold properties represent the leasehold interest in the lands held for own use. The value of buildings situated in the leasehold land is shown seperately under Property, Plant and Equipment. The interest on leasehold land is stated at cost less accumulated amortisation.
34.1 Lease Liability
Carrying amounts of lease liabilities included under Other liabilities (Note 46) and the movement during the year is as follows.
Bank Group
2019 2019
LKR ’000 LKR ’000
Balance as at 1 January 2019 - 20,605
Effect of adoption of SLRS 16 as at 1 January 2019 4,546,721 2,005,305
Restated Balance as at 1 January 2019 4,546,721 2,025,910
Additions 103,155 28,906
Accretion of Interest 356,196 230,196
Payments (1,967,709) (1,137,709)
Balance as at 31 December 3,038,363 1,147,303
34.1.1 Maturity Analysis of Lease Liability
Bank Group
As at 31 December 2019 2019
LKR ’000 LKR ’000
Less than 1 year 1,337,779 505,153
1 to 5 years 1,485,327 560,868
More than 5 years 215,257 81,282
3,038,363 1,147,303

BA
NK
OF
CE
YL
ON
AN
NU
AL
RE
PO
RT
20
19
Notes to the Financial Statements264
About this Report / Performance Highlights 2019 / Chairman’s Message / General Manager’s Review / Organisational Overview / Strategic Report / Performance and Outlook / Stakeholder Value Creation / Financial Reports / Compliance Annexes / Supplementary Information
34.2 Sensitivity Factors Used to Calculate Right of Use Asset/ Lease Liability
Sensitivity SensitivityEffect on
Right of UseAsset
Sensitivity Effect on
Lease Liability
Sensitivity Effect on
Profit Before Tax
LKR ’000 LKR ’000 LKR ’000
Incremental Borrowing Rate +1% (60,671) (53,374) (7,297)-1% 62,748 55,050 7,698
Lease Term Increased by 1 Year 1,409,897 1,472,596 (62,699)
35 Intangible Assets
Accounting Policy
Basis of Recognition
An intangible asset is recognised if it is probable that the future economic benefits that are attributable to the asset will flow to the Group and the cost of the asset can be measured reliably. An intangible asset is initially measured at cost.
Intangible assets represent the value of computer application software and licenses, other than software applied to the operating software system of computers.
Measurement
Intangible assets acquired by the Group are stated at cost less accumulated amortisation and accumulated impairment losses. Subsequent expenditure incurred on intangible assets is capitalised only when it increases the future economic benefits embodied in the specific asset to which it relates. All other expenditure is expensed as incurred.
Amortisation and Impairment
Amortisation is recognised in the Statement of Profit or Loss on a straight line basis over the estimated useful lives of the intangible assets, from the date that it is available for use since this most closely reflects the expected pattern of consumption of the future economic benefits embodied in the asset. The estimated useful life of intangible assets is five years or the best estimate of its useful economic life whichever is lower. The intangible assets with finite lives are reviewed for impairment whenever there is an indication for impairment and recognised as expenses in the Statement of Profit or Loss to the extent that they are no longer probable of being recovered from the expected future benefits. Amortisation methods, useful lives and residual values are reviewed at each Reporting date and adjusted if appropriate.

About this Report / Performance Highlights 2019 / Chairman’s Message / General Manager’s Review / Organisational Overview / Strategic Report / Performance and Outlook / Stakeholder Value Creation / Financial Reports / Compliance Annexes / Supplementary Information
265
Derecognition
Intangible assets are derecognised when it reveals that they will not generate economic benefits or circumstances indicate that the carrying value is impaired.
Gains or losses arising from derecognition of an intangible assets are measured as the difference between the net disposal proceeds and the carrying amount of the assets and are recognised in Statement of Profit or Loss.
Bank Group
2019 2018 2019 2018LKR ’000 LKR ’000 LKR ’000 LKR ’000
CostBalance as at 1 January 3,343,082 3,037,229 3,929,772 3,598,518 Additions during the year 317,483 783,598 394,389 790,386 Derecognised during the year - (477,745) (69,667) (477,745)Exchange rate adjustment - - 4,683 18,613 Adjustments/ Transfers - - (2,319) - Balance as at 31 December 3,660,565 3,343,082 4,256,858 3,929,772
Accumulated amortisationBalance as at 1 January 2,142,441 2,226,499 2,510,687 2,524,082 Amortisation during the year 430,760 406,772 583,874 430,453Derecognised during the year - (477,745) (57,354) (477,745)Exchange rate adjustment - - 5,045 16,330 Adjustments/ Transfers (2,098) (13,085) (109,707) 17,567 Balance as at 31 December 2,571,103 2,142,441 2,932,545 2,510,687 Computer software under development 37,545 37,545 37,545 37,545 Net book value 1,127,007 1,238,186 1,361,858 1,456,630
35.1 Fully Amortised Intangible Assets
The initial cost of fully amortised intangible assets which are still in use are as follows:
Bank Group
As at 31 December 2019 2018 2019 2018LKR ’000 LKR ’000 LKR ’000 LKR ’000
Computer software 1,449,350 1,412,467 1,460,305 1,423,422 1,449,350 1,412,467 1,460,305 1,423,422
36 Deferred Tax (Assets)/ Liabilities Deferred tax is recognised in respect of temporary differences between the carrying amounts of assets and liabilities for financial reporting purposes and the amounts used for taxation purposes. Deferred tax is not recognised for the following temporary differences:
- The initial recognition of goodwill
- The initial recognition of assets or liabilities in a transaction that is not a business combination and that affects neither accounting nor taxable profit or loss
- Differences relating to investments in subsidiaries to the extent that it is probable that they will not reverse in the foreseeable future
Deferred tax is measured at the tax rates that are expected to be applied to the temporary differences when they reverse, based on the laws that have been enacted or substantively enacted by the Reporting date. Deferred tax assets and liabilities are offset if there is a legally enforceable right to offset current tax liabilities against current tax assets and they relate to income taxes levied by the same tax authority on the same taxable entity, or on different tax entities, but they intend to settle current tax liabilities and assets on a net basis or their tax assets and liabilities will be realised simultaneously.

BA
NK
OF
CE
YL
ON
AN
NU
AL
RE
PO
RT
20
19
Notes to the Financial Statements266
About this Report / Performance Highlights 2019 / Chairman’s Message / General Manager’s Review / Organisational Overview / Strategic Report / Performance and Outlook / Stakeholder Value Creation / Financial Reports / Compliance Annexes / Supplementary Information
A deferred tax asset is recognised for unused tax losses, tax credits and deductible temporary differences to the extent that it is probable that future taxable profits will be available against which they can be utilised. Deferred tax assets are reviewed at each Reporting date and are reduced to the extent that it is no longer probable that the related tax benefit will be realised.
The following table shows deferred tax recorded in the Statement of Financial Position and charge/ (reversal) recorded in the income tax expense (Note 17.2).
36.1 Bank
As at 31 December 2019 2018
Deferred Tax
Assets
Deferred Tax
Liabilities
Impact to Retained Earnings
Statement of Profit or
Loss
OtherComprehensive
Income/ Equity
Deferred Tax
Assets
Deferred Tax
Liabilities
Impact to Retained Earnings
Statement of Profit or
Loss
OtherComprehensive
Income/Equity
LKR ’000 LKR ’000 LKR ’000 LKR ’000 LKR ’000 LKR ’000 LKR ’000 LKR ’000 LKR ’000 LKR ’000
Retirement benefits - (103,717) - (12,842) (16,379) - (74,496) - (13,310) (3,050)
Impairment allowance
for loans and advances - - - - - - - - 890,683 -
Revaluation of Property,
Plant and Equipment - 4,474,240 - - - - 4,474,240 - - (94,506)
Investment in financial
instruments - 539,909 - - 224,638 - 315,271 - - 6,711
Temporary difference for
impairment -
(3,585,986) - (123,709) - -
(3,462,277)
(3,345,868) (116,409) -
Other temporary
differences - 3,267,575 - (553,213) - - 3,820,788 - 1,928,946 -
- 4,592,021 - (689,764) 208,259 - 5,073,526 (3,345,868) 2,689,910 (90,845)
36.2 Group
As at 31 December 2019 2018
Deferred Tax
Assets
Deferred Tax
Liabilities
Impact to Retained Earnings
Statement of Profit or
Loss
OtherComprehensive
Income/ Equity
Deferred Tax
Assets
Deferred Tax
Liabilities
Impact to Retained Earnings
Statement of Profit or
Loss
OtherComprehensive
Income/Equity
LKR ’000 LKR ’000 LKR ’000 LKR ’000 LKR ’000 LKR ’000 LKR ’000 LKR ’000 LKR ’000 LKR ’000
Retirement benefits - (190,348) - 2,042 (34,000) (6,088) (152,302) - (101,164) 9,530
Impairment allowance
for loans and
advances - - - - - - - - 890,683 -
Revaluation of
Property, Plant and
Equipment - 7,478,509 - - 221,448 - 7,257,061 - - 41,271
Investment in financial
instruments - 539,909 - - 224,638 - 315,271 - - 6,711
Temporary difference
for impairement - (3,607,500) - 120,708 - -
(3,728,208) (3,648,954) (79,254) -
Other temporary
differences (511,936) 2,962,296 - (1,623,069) - 3,036 4,070,392 - 2,023,741 -
(511,936) 7,182,866 - (1,500,319) 412,086 (3,052) 7,762,214 (3,648,954) 2,734,006 57,512

About this Report / Performance Highlights 2019 / Chairman’s Message / General Manager’s Review / Organisational Overview / Strategic Report / Performance and Outlook / Stakeholder Value Creation / Financial Reports / Compliance Annexes / Supplementary Information
267
37 Other assets
Pre Paid Staff Cost
Staff loans are initially recognised at fair value according to Sri Lanka Accounting Standard SLFRS 9 - “Financial Instruments”. The difference between granted amount and its fair value is treated as pre paid staff cost and amortised over the loan period.
Gold Stock in Hand
The gold inventory is valued at lower of cost or net realisable value. Cost includes all cost of purchase, cost of conversion and other costs incurred in bringing the inventory to its present location and condition. Net realisable value is the estimated selling price in the ordinary course of business less the estimated cost necessary to make the sale.
Employee Benefit Asset
Employee benefit assets represents net retirement benefit assets of Bank of Ceylon widows'/ widowers' and orphans' pension fund and Bank of Ceylon Pension Fund-2014. For more details refer Note 47.
Bank Group
As at 31 December 2019 2018 2019 2018
LKR ’000 LKR ’000 LKR ’000 LKR ’000
Consumable stock in hand 694,815 747,383 740,455 795,588
Prepaid staff cost 15,230,411 13,133,342 15,230,411 13,133,342
Cheques in transit - Local 1,646,526 1,592,004 1,646,526 1,592,004
Cheques in transit - Foreign 21,370 17,948 21,370 17,948
Tax recoverable [Note 44] 1,172,018 - 1,182,389 10,876
Gold bullion and coins in hand 125,714 123,688 125,714 123,688
Gold stock in hand 376 300 376 300
Net Employee benefit asset [Note 47] 13,475,453 13,491,520 13,475,453 13,491,520
Other 30,213,719 28,130,552 31,503,366 29,384,303
Total other assets 62,580,402 57,236,737 63,926,060 58,549,569
38 Due to Banks
Accounting Policy
Due to banks represents credit balances in Nostro Accounts and short- term borrowings from banks. These are initially recognised at fair value. Subsequent to initial recognition, these are measured at their amortised cost using the Effective Interest Rate (EIR) method. Amortised cost is calculated by taking into account any transaction costs that are an integral part of the EIR. The EIR amortisation is included in “Interest expenses” (Note 8.2) in the Statement of Profit or Loss.
Bank Group
As at 31 December 2019 2018 2019 2018
LKR ’000 LKR ’000 LKR ’000 LKR ’000
Deposits from other banks 1,324,470 1,546,737 1,324,470 1,546,737
Bank overdrafts 1,344,937 855,731 1,608,480 969,261
Total due to banks 2,669,407 2,402,468 2,932,950 2,515,998

BA
NK
OF
CE
YL
ON
AN
NU
AL
RE
PO
RT
20
19
Notes to the Financial Statements268
About this Report / Performance Highlights 2019 / Chairman’s Message / General Manager’s Review / Organisational Overview / Strategic Report / Performance and Outlook / Stakeholder Value Creation / Financial Reports / Compliance Annexes / Supplementary Information
39 Securities Sold Under Repurchase Agreements
Accounting Policy
Securities sold under repurchase agreements at a specified future date are not derecognised from the Statement of Financial Position as the Group retains substantially all of the risks and rewards of ownership. The corresponding cash received is recognised in the Statement of Financial Position as an asset with a corresponding obligation to return it, including accrued interest as a liability within “Other borrowings” (Note 42), reflect the transaction’s economic substance as a borrowing to the Group. The difference between the sale and repurchase prices is treated as interest expense and is amortised over the life of agreement using EIR.
Bank Group
As at 31 December 2019 2018 2019 2018
LKR ’000 LKR ’000 LKR ’000 LKR ’000
With Banks 7,333,289 54,017,168 8,030,586 54,041,111
With other Customers 26,849,921 43,382,191 26,849,921 43,382,191
Total Securities sold under repurchase agreements 34,183,210 97,399,359 34,880,507 97,423,302
40 Derivative Financial Instruments
Accounting Policy
Derivative financial instruments include contracts which are entered by the Bank that are not designated as hedging instruments in hedge relationships as per the Sri Lanka Accounting Standard –SLFRS 9 on “Financial Instruments”.
Derivatives are recorded at fair value and carried as liabilities when their fair value is negative. Changes in the fair value of derivatives are included in “Net gains/(losses) from trading” (Note 10) in Statement of Profit or Loss.
Bank Group
As at 31 December 2019 2018 2019 2018
LKR ’000 LKR ’000 LKR ’000 LKR ’000
Foreign Currency Derivatives
Forward exchange contracts 1,070 31,736 1,070 31,736
Currency SWAPs 105,607 477,282 105,607 477,282
Total derivative financial instruments 106,677 509,018 106,677 509,018
41 Financial Liabilities at Amortised Cost - Due to Depositors
Accounting Policy
Financial liabilities at amortised cost - due to depositors include non-interest-bearing deposits, savings deposits, term deposits, deposits payable at call and certificate of deposits, which are initialy recognised at fair value. Subsequent to initial recognition, deposits are measured at their amortised cost using the Effective Interest Rate (EIR) method, except where the Group designates liabilities at fair value through profit or loss. The EIR amortisation is included in “Interest expenses” (Note 8.2) in the Statement of Profit or Loss.

About this Report / Performance Highlights 2019 / Chairman’s Message / General Manager’s Review / Organisational Overview / Strategic Report / Performance and Outlook / Stakeholder Value Creation / Financial Reports / Compliance Annexes / Supplementary Information
269
41.1 By product
Bank Group
As at 31 December 2019 2018 2019 2018
LKR ’000 LKR ’000 LKR ’000 LKR ’000
Local Currency Deposits (LKR)
Demand deposits 103,815,364 110,943,266 103,681,039 110,865,510
Savings deposits 411,614,032 365,545,986 412,461,931 366,430,640
Time deposits 1,000,720,894 870,604,853 1,018,434,307 887,498,448
Other deposits 2,038,367 3,409,352 2,042,887 3,413,872
Total local currency deposits 1,518,188,657 1,350,503,457 1,536,620,164 1,368,208,470
Foreign Currency Deposits (Non LKR)
Demand deposits 29,604,754 26,779,911 30,671,680 27,531,733
Savings deposits 91,337,588 97,655,512 91,720,706 98,041,252
Time deposits 364,794,113 294,842,690 364,904,801 294,949,638
Other deposits 1,286,682 1,193,276 1,286,682 1,193,276
Total foreign currency deposits 487,023,137 420,471,389 488,583,869 421,715,899
Total deposits 2,005,211,794 1,770,974,846 2,025,204,033 1,789,924,369
41.2 By Currency
Bank Group
As at 31 December 2019 2018 2019 2018
LKR ’000 LKR ’000 LKR ’000 LKR ’000
Sri Lankan Rupee (LKR)
1,518,188,657
1,350,503,457
1,536,620,164
1,368,208,470
United States Dollar (USD) 422,581,009 358,314,513 422,596,239 358,326,657
Great Britain Pound (GBP) 33,573,746 32,367,504 35,108,654 33,591,422
Maldivian Rufiyaa (MVR) 7,230,024 5,791,464 7,230,024 5,791,464
Seychellois Rupee (SCR) 1,503,717 1,539,912 1,503,717 1,539,912
Euro (EUR) 8,219,185 8,168,732 8,229,779 8,177,180
Australian Dollar (AUD) 7,501,525 7,482,861 7,501,525 7,482,861
Indian Rupee (INR) 4,625,119 4,812,562 4,625,119 4,812,562
Other 1,788,812 1,993,841 1,788,812 1,993,841
Total deposits 2,005,211,794 1,770,974,846 2,025,204,033 1,789,924,369
Note : The maturity analysis of deposits is given in Note 58.

BA
NK
OF
CE
YL
ON
AN
NU
AL
RE
PO
RT
20
19
Notes to the Financial Statements270
About this Report / Performance Highlights 2019 / Chairman’s Message / General Manager’s Review / Organisational Overview / Strategic Report / Performance and Outlook / Stakeholder Value Creation / Financial Reports / Compliance Annexes / Supplementary Information
42 Financial Liabilities at Amortised Cost - Other Borrowings
Accounting Policy
Financial liabilities at amortised cost - other borrowings represent Standing Lending Facility, Senior notes, Term borrowings from banks in abroad and Sri Lanka, Term borrowings from other financial institutions in Sri Lanka and refinance borrowings which are initially recognised at fair value. Subsequent to initial recognition, these borrowings are measured at their amortised cost, using the Effective Interest Rate (EIR) method. Amortised cost is calculated by taking into account any discount or premium on the issue and costs that are an integral part of the EIR. The EIR amortisation is included in “Interest expenses” (Note 8.2) in the Statement of Profit or Loss.
Bank Group
As at 31 December 2019 2018 2019 2018
LKR ’000 LKR ’000 LKR ’000 LKR ’000
Standing Lending Facility - 10,569,000 - 10,569,000
Call borrowings from banks and other financial institutions in Sri Lanka - 4,751,162 1,797,286 8,937,963
Term borrowings from banks abroad 96,433,248 154,639,903 99,215,953 155,114,428
Term borrowings from banks and other financial institutions in Sri Lanka 36,736,544 27,642,383 39,418,272 28,242,557
Refinance borrowings 4,663,751 4,189,726 4,663,751 4,189,726
Total other borrowings 137,833,543 201,792,174 145,095,262 207,053,674
43 Debt Securities Issued
Accounting Policy
Debt securities issued represent funds borrowed for long-term funding purposes where the substance of the contractual arrangement results in the Group having an obligation either to deliver cash or another financial asset to the holder, or to satisfy the obligation other than by the exchange of a fixed amount of cash or another financial asset for a fixed number of own equity shares. Debt securities are initially recognised at fair value. Subsequent to initial recognition these are measured at their amortised cost using the Effective Interest Rate (EIR) method. Amortised cost is calculated by taking into account any discount or premium on the issue and costs that are an integral part of the EIR. The EIR amortisation is included in “Interest expenses” (Note 8.2) in the Statement of Profit or Loss.
Bank Group
As at 31 December 2019 2018 2019 2018
LKR ’000 LKR ’000 LKR ’000 LKR ’000
Issued by the Bank - - - -
Issued by other subsidiaries - - 2,107,810 4,105,681
Total - - 2,107,810 4,105,681
Note: The maturity analysis of debt securities issued is given in Note 58.

About this Report / Performance Highlights 2019 / Chairman’s Message / General Manager’s Review / Organisational Overview / Strategic Report / Performance and Outlook / Stakeholder Value Creation / Financial Reports / Compliance Annexes / Supplementary Information
271
43.1 Senior Debentures
Bank Group
As at 31 December 2019 2018 2019 2018
LKR ’000 LKR ’000 LKR ’000 LKR ’000
Listed debentures
Unsecured, redeemable debentures of LKR 100 each - - 2,107,810 4,105,681
Total debt securities issued - - 2,107,810 4,105,681
43.2 Movement in Senior Debentures
Bank Group
2019 2018 2019 2018
LKR ’000 LKR ’000 LKR ’000 LKR ’000
Balance as at 1 January - - 4,105,681 5,667,514
Issued during the year - - - -
Redemptions - - (1,999,123) (1,560,494)
Amortisation adjustments - - 1,252 (1,339)
Balance as at 31 December - - 2,107,810 4,105,681
43.3 Senior Debentures
Coupon rate Amount as at 31 December
Bank Group
As at 31 December Notes Interest
payable
frequency
Issue date Maturity
date
2019 2018 2019 2018 2019 2018
% % LKR ’000 LKR ’000 LKR ’000 LKR ’000
Fixed Interest Rate
Unsecured, redeemable debentures (a) Annually 13.11.2014 12.11.2019 9.00 9.00 - - - 868,112
Unsecured, redeemable debentures (a) Annually 13.11.2014 12.11.2019 8.75 8.75 - - - 1,131,011
Unsecured, redeemable debentures (a) Annually 04.05.2017 03.05.2022 15.00 15.00 - - 885,298 884,964
Unsecured, redeemable debentures (a) Semi-annually 04.05.2017 03.05.2022 14.50 14.50 - - 1,221,479 1,220,562
Unsecured, redeemable debentures (a) Semi-annually 04.05.2017 03.05.2022 13.89 13.89 - - 1,033 1,032
Total debt securities issued - - 2,107,810 4,105,681
Notes : (a) Debentures that are listed in Colombo Stock Exchange.

BA
NK
OF
CE
YL
ON
AN
NU
AL
RE
PO
RT
20
19
Notes to the Financial Statements272
About this Report / Performance Highlights 2019 / Chairman’s Message / General Manager’s Review / Organisational Overview / Strategic Report / Performance and Outlook / Stakeholder Value Creation / Financial Reports / Compliance Annexes / Supplementary Information
44 Current Tax Liabilities/ (Assets)
Bank Group
2019 2018 2019 2018
LKR ’000 LKR ’000 LKR ’000 LKR ’000
Opening balance as at 1 January 3,922,189 1,877,342 4,028,504 2,051,020
Current tax expense 9,340,361 9,723,515 9,769,828 9,918,315
Payments during the year (10,870,994) (10,136,932) (11,174,355) (10,389,879)
Adjustments (3,563,574) 2,458,264 (3,667,689) 2,449,048
Closing balance as at 31 December (1,172,018) 3,922,189 (1,043,712) 4,028,504
Current tax assets (1,182,389) (10,876)
Current tax liabilities 138,677 4,039,380
Current Tax Liabilities/ (Assets) (1,043,712) 4,028,504
45 Insurance Contract Liabilities Accounting Policy
Life Insurance Contract Liabilities
These liabilities are measured by using the gross premium valuation method as prescribed by the Regulation of Insurance Industry ACT, No. 43 of 2000. The liability is determined as the discounted value of the expected contractual cash outflows less the discounted value of the expected premiums. Valuation assumptions are derived based on the best estimate experience with a prescribed risk margin to allow for adverse deviations.
At each Reporting date, an assessment is made of whether the recognised life insurance liabilities are adequate, by using a liability adequacy test.
Liability Adequacy Test (LAT)
At each Reporting date, an assessment is made of whether the recognised life insurance liabilities are adequate by using an existing liability adequacy test as laid out under SLFRS 4. The liability value is adjusted to the extent that it is adequate to meet future benefits and expenses.
Any deficiency is recognised in the Statement of Profit or Loss by setting up a provision for liability adequacy.
Non-Life Insurance Contract Liabilities
Non-life insurance contract liabilities are recognised when contracts are entered into and premiums are charged. These liabilities are known as the outstanding claims provision, which are based on the estimated ultimate cost of all claims incurred but not settled at the Reporting date, whether reported or not, together with related claims handling costs and reduction for the expected value of salvage and other recoveries. Delays can be experienced in the notification and settlement of certain types of claims, therefore the ultimate cost of these cannot be known with certainty at the Reporting date. The liability is calculated at the Reporting date using a range of standard actuarial claim projection techniques, based on empirical data and current assumptions that may include a margin for adverse deviation. The liability is not discounted for the time value of money. No provision for equalisation or catastrophe reserves is recognised. The liabilities are derecognised when the contract expires, is discharged or is cancelled.

About this Report / Performance Highlights 2019 / Chairman’s Message / General Manager’s Review / Organisational Overview / Strategic Report / Performance and Outlook / Stakeholder Value Creation / Financial Reports / Compliance Annexes / Supplementary Information
273
Liability Adequacy Test (LAT)
The provision for unearned premiums represents premiums received for risks that have not yet expired. Generally the reserve is released over the term of the contract and is recognised as premium income. At each Reporting date the company reviews its unexpired risk and a liability adequacy test is performed to determine whether there is any overall excess of expected claims and deferred acquisition costs over unearned premiums.
This calculation uses current estimates of future contractual cash flows after taking account of the investment return expected to arise on assets relating to the relevant non-life insurance technical provisions. If these estimates show that the carrying amount of the unearned premiums (less related deferred acquisition costs) is inadequate, the deficiency is recognised in the statement of comprehensive income by setting up a provision for liability adequacy.
45.1 Insurance Provision - Life
Group
2019 2018
LKR ’000 LKR ’000
Opening balance as at 1 January 575,625 547,026
Increase/ (Decrease) in life fund (110,923) (19,736)
Fair value reserve 1,658 1,285
Unclaimed benefits 44,731 47,050
Closing balance as at 31 December 511,091 575,625
45.2 Insurance Provision - Non Life
Group
As at 31 December 2019 2018
LKR ’000 LKR ’000
Provision for reported claims by policy holders 308,044 430,093
Provision for claims on Incurred But Not Reported (IBNR) 5,917 44,064
Outstanding claims provision 313,961 474,157
Provision for unearned premiums 44,543 172
Deferred acquisition - (107,711)
Total insurance provision - Non life 358,504 366,618
46 Other Liabilities
Bank Group
As at 31 December 2019 2018 2019 2018
LKR ’000 LKR ’000 LKR ’000 LKR ’000
Cheques sent on clearing 434,397 524,452 434,397 524,452
Lease creditors
Within 12 months 1,337,779 - 508,228 8,245
Later than 12 months 1,700,584 - 639,075 12,360
Net employee benefit liabilities [Note 47] 15,657,486 5,028,513 16,012,626 5,359,107
Other 14,885,442 14,207,465 17,163,718 16,066,575
Total other liabilities 34,015,688 19,760,430 34,758,044 21,970,739

BA
NK
OF
CE
YL
ON
AN
NU
AL
RE
PO
RT
20
19
Notes to the Financial Statements274
About this Report / Performance Highlights 2019 / Chairman’s Message / General Manager’s Review / Organisational Overview / Strategic Report / Performance and Outlook / Stakeholder Value Creation / Financial Reports / Compliance Annexes / Supplementary Information
47 Employee Retirement Benefit Plans
Accounting Policy
The Bank has the pension schemes established under an Industrial Award which are solely funded by the Bank. There is also a Widows’/Widowers’ and Orphans’ Pension Scheme established by the members who joined the Bank before 1 January 1996.
The assets of these three plans are held independently of the Bank’s assets and administered by Boards of Trustees/ Managers, representing the management and the employees, as provided in the Trust Deed/ Rules of the respective funds.
These funds are subject to annual audits independent to the audit of the Bank, by a firm/s of Chartered Accountants appointed by the members and actuarial valuations are carried out as per the rules governing these funds.
Bank Group
As at 31 December 2019 2018 2019 2018
LKR ’000 LKR ’000 LKR ’000 LKR ’000
Net Employee Benefit Liabilities
Bank of Ceylon Pension Trust Fund [Note 47.1.3] 14,685,437 4,270,747 14,685,437 4,270,747
Provision for terminal gratuity [Note 47.3] 370,415 266,057 725,555 596,651
Provision for encashment of medical leave 601,634 491,709 601,634 491,709
Total net employee benefit liabilities 15,657,486 5,028,513 16,012,626 5,359,107
Net Employee Benefit Assets
Bank of Ceylon Widows'/ Widowers' and Orphans' Pension Fund [Note 47.2.3] 10,452,943 10,727,802 10,452,943 10,727,802
Bank of Ceylon Pension Fund-2014 [Note 47.4] 3,022,510 2,763,718 3,022,510 2,763,718
Total net employee benefit assets 13,475,453 13,491,520 13,475,453 13,491,520
47.1 Bank of Ceylon Pension Trust Fund
The ‘Bank of Ceylon Pension Trust Fund’ is a funded, non contributory, defined retirement benefit plan, operated for the payment of pensions until death of the permanent employees who have completed a minimum of ten years of continuous service with the Bank, at their retirement on reaching the retirement age on or after 55 years or on medical grounds, before reaching retirement age. The pension is computed as a percentage of the last drawn salary excluding certain allowances.
Contributions to the Pension Trust Fund are made monthly, based on the advice of a qualified actuary, currently at 56.8% of gross salary. The Fund is valued by a qualified actuary annually. This fund has been approved by the Government and administrated independently. The subsidiaries and associate companies of the Group do not have pension funds.
An actuarial valuation of the Pension Trust Fund as at 31 December 2019 was carried out by Messrs Actuarial & Management Consultant (Pvt) Limited.
The valuation has been done using the “Projected Unit Credit Method”, which is recommended in the Sri Lanka Accounting Standard -LKAS 19 “Employee Benefits”. The benefit is available to all permanent employees who have joined the Bank prior to 1 January 1996. The results of the actuarial valuation of the Pension Trust Fund is summarised as follows:

About this Report / Performance Highlights 2019 / Chairman’s Message / General Manager’s Review / Organisational Overview / Strategic Report / Performance and Outlook / Stakeholder Value Creation / Financial Reports / Compliance Annexes / Supplementary Information
275
47.1.1 Net Benefit Expense (Recognised Under Personnel Expenses)
Bank/ Group
For the year ended 31 December 2019 2018
LKR ’000 LKR ’000
Current service cost 199,223 261,795
Net interest expenses 512,490 277,390
Net benefit expense 711,713 539,185
47.1.2 Amount Recognised in Other Comprehensive Income
Bank/ Group
For the year ended 31 December 2019 2018
LKR ’000 LKR ’000
Actuarial losses on the defined benefit obligation 6,796,014 3,319,591
Actuarial (gains)/ losses on plan assets 3,489,582 (5,397,253)
Net actuarial (gains)/ losses recognised in other comprehensive income 10,285,596 (2,077,662)
47.1.3 Net Retirement Benefit Liability
Bank/ Group
As at 31 December 2019 2018
LKR ’000 LKR ’000
Fair value of plan assets [Note 47.1.4] 55,185,018 58,455,386
Defined benefit obligation [Note 47.1.5] 69,870,455 62,726,133
Net retirement benefit liability 14,685,437 4,270,747
47.1.4 Changes in Fair Value of Plan Assets
Bank/ Group
2019 2018
LKR ’000 LKR ’000
Opening fair value of plan assets 58,455,386 62,827,692
Expected return 7,014,646 6,911,046
Contribution by employer 582,619 867,830
Benefits paid (7,378,051) (6,753,929)
Actuarial gains/ (losses) (3,489,582) (5,397,253)
Closing fair value of plan assets 55,185,018 58,455,386

BA
NK
OF
CE
YL
ON
AN
NU
AL
RE
PO
RT
20
19
Notes to the Financial Statements276
About this Report / Performance Highlights 2019 / Chairman’s Message / General Manager’s Review / Organisational Overview / Strategic Report / Performance and Outlook / Stakeholder Value Creation / Financial Reports / Compliance Annexes / Supplementary Information
47.1.5 Changes in the Present Value of the Defined Benefit Obligation
Bank/ Group
2019 2018
LKR ’000 LKR ’000
Opening defined benefit obligation 62,726,133 65,349,422
Interest cost 7,527,136 7,188,436
Current service cost 199,223 261,795
Benefits paid (7,378,051) (6,753,929)
Due to change in assumptions 6,312,332 (4,510,296)
Actuarial losses on obligation 483,682 1,190,705
Closing defined benefit obligation 69,870,455 62,726,133
The present value of the Defined Benefit Obligation as of the valuation date with respect to active employees and pensioners are LKR 6,216.2 million ( 2018 : LKR 8,290.7 million) and LKR 63,654.2 million ( 2018 : LKR 54,435.4 million) respectively.
47.1.6 Plan Assets Consist of the Following
Bank/ Group
As at 31 December 2019 2018
LKR ’000 LKR ’000
Fixed deposits 24,446,353 21,859,550
Treasury bonds 5,450,916 6,837,474
Debentures 19,753,122 24,120,556
Investment in shares 5,172,123 5,215,001
Others 362,504 422,805
Total plan assets 55,185,018 58,455,386
47.1.7 Actuarial Assumptions
Bank/ Group
2019 2018
% %
Future salary increment rate 6.5 p.a 6.5 p.a
Increase in future Cost of Living Allowance (COLA) 4.5 p.a 5.5 p.a
Increase in pension in payment (basic) Nill Nil
Discount rate 10.0 p.a 12.0 p.a
Attrition rate Nill Nil
The Bank uses IALM (2006-2008) Ultimate Mortality Table issued by the Institute of Actuaries of India

About this Report / Performance Highlights 2019 / Chairman’s Message / General Manager’s Review / Organisational Overview / Strategic Report / Performance and Outlook / Stakeholder Value Creation / Financial Reports / Compliance Annexes / Supplementary Information
277
Increase/ decrease in the following assumptions will change the present value of defined benefit obligation as illustrated below;
Bank/ Group
0.5% increase 0.5% decrease
LKR ’000 LKR ’000
Discount rate 67,423,566 72,483,655
Salary increment 69,943,983 69,798,599
Cost of Living Allowance 71,380,414 68,450,784
Further, the remaining years of benefit payments are expected to be 7.9 years.
The following payments are expected from the Pension Trust Fund in future years.
Bank/ Group
As at 31 December 2019 2018
LKR ’000 LKR ’000
Within the next 12 months 6,882,922 6,813,882
Between 1 and 5 years 27,079,402 25,271,940
Between 5 and 10 years 17,231,607 15,117,999
Beyond 10 years 18,676,524 15,522,312
Total expected payments 69,870,455 62,726,133
47.2 Bank of Ceylon Widows'/ Widowers' and Orphans' Pension Fund
The Bank is liable for and guarantees the payments to the beneficiaries of the ‘Bank of Ceylon Widows’/ Widowers’ and Orphans’ Pension Fund’ to which the Bank’s employees monthly contribute 8% of their gross salary. The Bank’s liability towards the beneficiaries of the employees arises when an employee who has contributed to the fund for five continuous years dies while in service or on the death of a pensioner where the Bank will be liable to pay Widows’ and Orphans’ Pension to his/ her beneficiaries monthly. The pension to the beneficiaries of an employee who dies while in service is based on the last drawn salary excluding certain allowances.
An actuarial valuation of the Widows'/Widowers' and Orphans' Pension Fund as at 31 December 2019 was carried out by Messrs Actuarial & Management Consultant (Pvt) Limited.
This fund has been approved by the Government and administered independently.
The valuation has been done using the “Projected Unit Credit Method”, which is recommended in the Sri Lanka Accounting Standard -LKAS 19 “Employee Benefits”. The results of the actuarial valuation of the Widows'/Widowers'and Orphans' Pension Fund is summarised as follows:
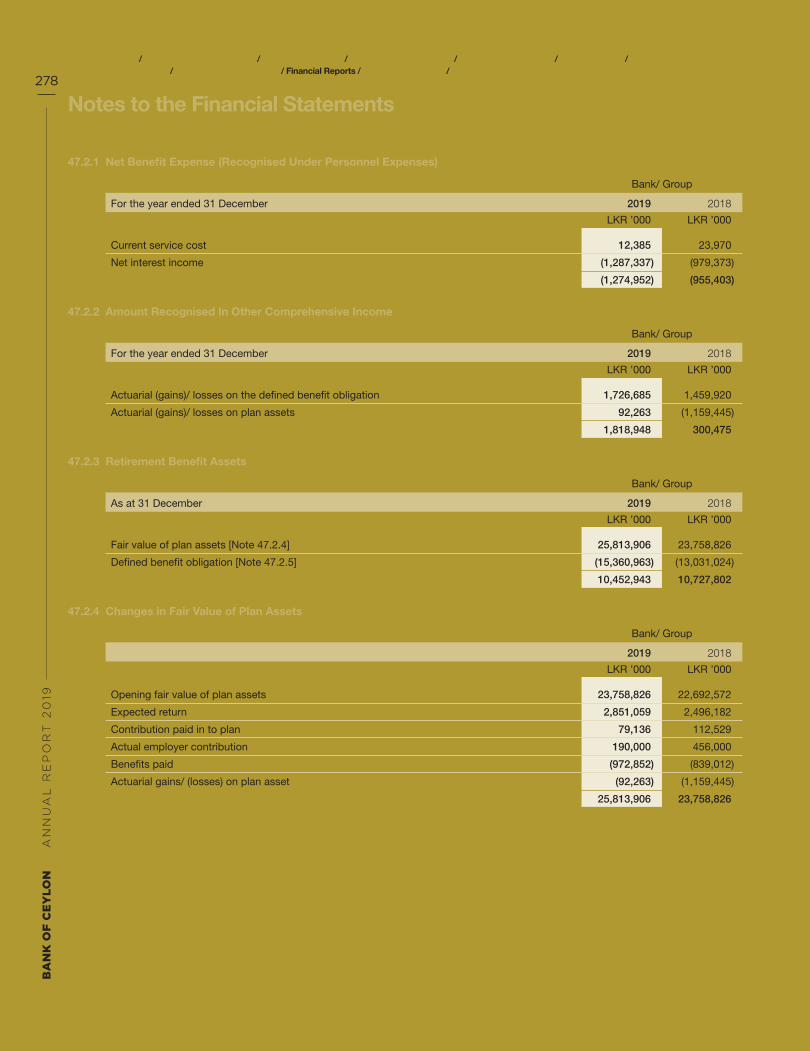
BA
NK
OF
CE
YL
ON
AN
NU
AL
RE
PO
RT
20
19
Notes to the Financial Statements278
About this Report / Performance Highlights 2019 / Chairman’s Message / General Manager’s Review / Organisational Overview / Strategic Report / Performance and Outlook / Stakeholder Value Creation / Financial Reports / Compliance Annexes / Supplementary Information
47.2.1 Net Benefit Expense (Recognised Under Personnel Expenses)
Bank/ Group
For the year ended 31 December 2019 2018
LKR ’000 LKR ’000
Current service cost 12,385 23,970
Net interest income (1,287,337) (979,373)
Net benefit expense (1,274,952) (955,403)
47.2.2 Amount Recognised In Other Comprehensive Income
Bank/ Group
For the year ended 31 December 2019 2018
LKR ’000 LKR ’000
Actuarial (gains)/ losses on the defined benefit obligation 1,726,685 1,459,920
Actuarial (gains)/ losses on plan assets 92,263 (1,159,445)
Actuarial gains/ (losses) on actuarial valuation 1,818,948 300,475
47.2.3 Retirement Benefit Assets
Bank/ Group
As at 31 December 2019 2018
LKR ’000 LKR ’000
Fair value of plan assets [Note 47.2.4] 25,813,906 23,758,826
Defined benefit obligation [Note 47.2.5] (15,360,963) (13,031,024)
Retirement benefit assets 10,452,943 10,727,802
47.2.4 Changes in Fair Value of Plan Assets
Bank/ Group
2019 2018
LKR ’000 LKR ’000
Opening fair value of plan assets 23,758,826 22,692,572
Expected return 2,851,059 2,496,182
Contribution paid in to plan 79,136 112,529
Actual employer contribution 190,000 456,000
Benefits paid (972,852) (839,012)
Actuarial gains/ (losses) on plan asset (92,263) (1,159,445)
Closing fair value of plan assets 25,813,906 23,758,826
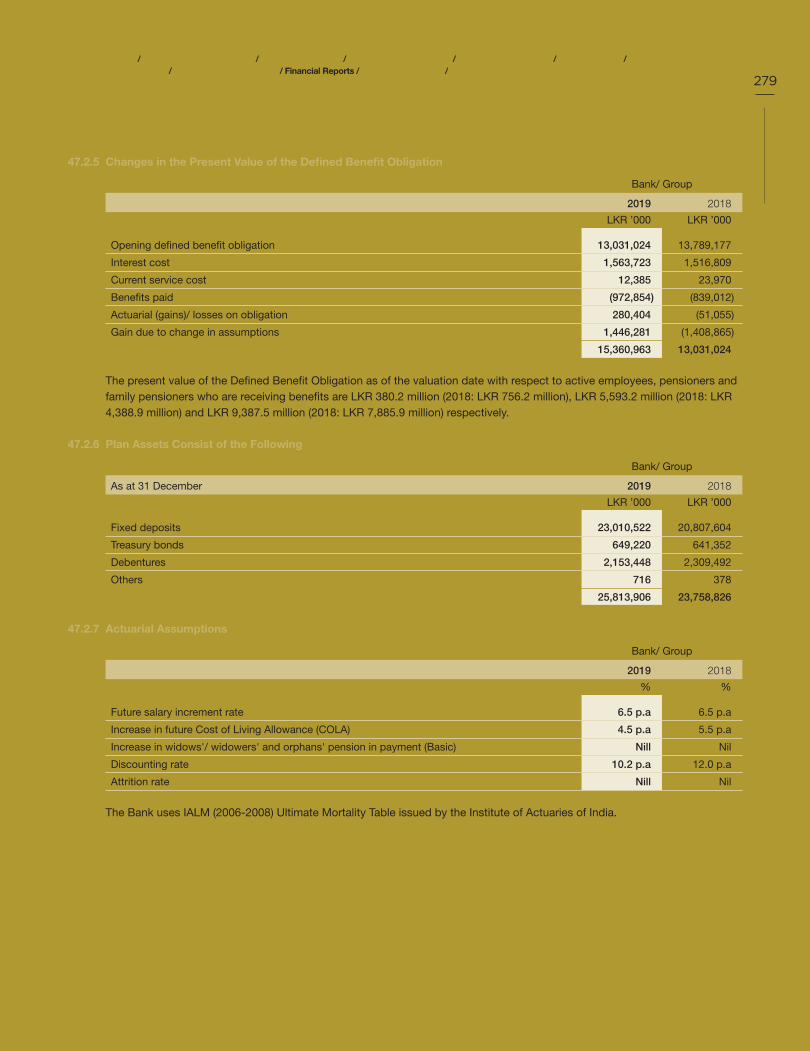
About this Report / Performance Highlights 2019 / Chairman’s Message / General Manager’s Review / Organisational Overview / Strategic Report / Performance and Outlook / Stakeholder Value Creation / Financial Reports / Compliance Annexes / Supplementary Information
279
47.2.5 Changes in the Present Value of the Defined Benefit Obligation
Bank/ Group
2019 2018
LKR ’000 LKR ’000
Opening defined benefit obligation 13,031,024 13,789,177
Interest cost 1,563,723 1,516,809
Current service cost 12,385 23,970
Benefits paid (972,854) (839,012)
Actuarial (gains)/ losses on obligation 280,404 (51,055)
Gain due to change in assumptions 1,446,281 (1,408,865)
Closing defined benefit obligation 15,360,963 13,031,024
The present value of the Defined Benefit Obligation as of the valuation date with respect to active employees, pensioners and family pensioners who are receiving benefits are LKR 380.2 million (2018: LKR 756.2 million), LKR 5,593.2 million (2018: LKR 4,388.9 million) and LKR 9,387.5 million (2018: LKR 7,885.9 million) respectively.
47.2.6 Plan Assets Consist of the Following
Bank/ Group
As at 31 December 2019 2018
LKR ’000 LKR ’000
Fixed deposits 23,010,522 20,807,604
Treasury bonds 649,220 641,352
Debentures 2,153,448 2,309,492
Others 716 378
Total plan assets 25,813,906 23,758,826
47.2.7 Actuarial Assumptions
Bank/ Group
2019 2018
% %
Future salary increment rate 6.5 p.a 6.5 p.a
Increase in future Cost of Living Allowance (COLA) 4.5 p.a 5.5 p.a
Increase in widows'/ widowers' and orphans' pension in payment (Basic) Nill Nil
Discounting rate 10.2 p.a 12.0 p.a
Attrition rate Nill Nil
The Bank uses IALM (2006-2008) Ultimate Mortality Table issued by the Institute of Actuaries of India.
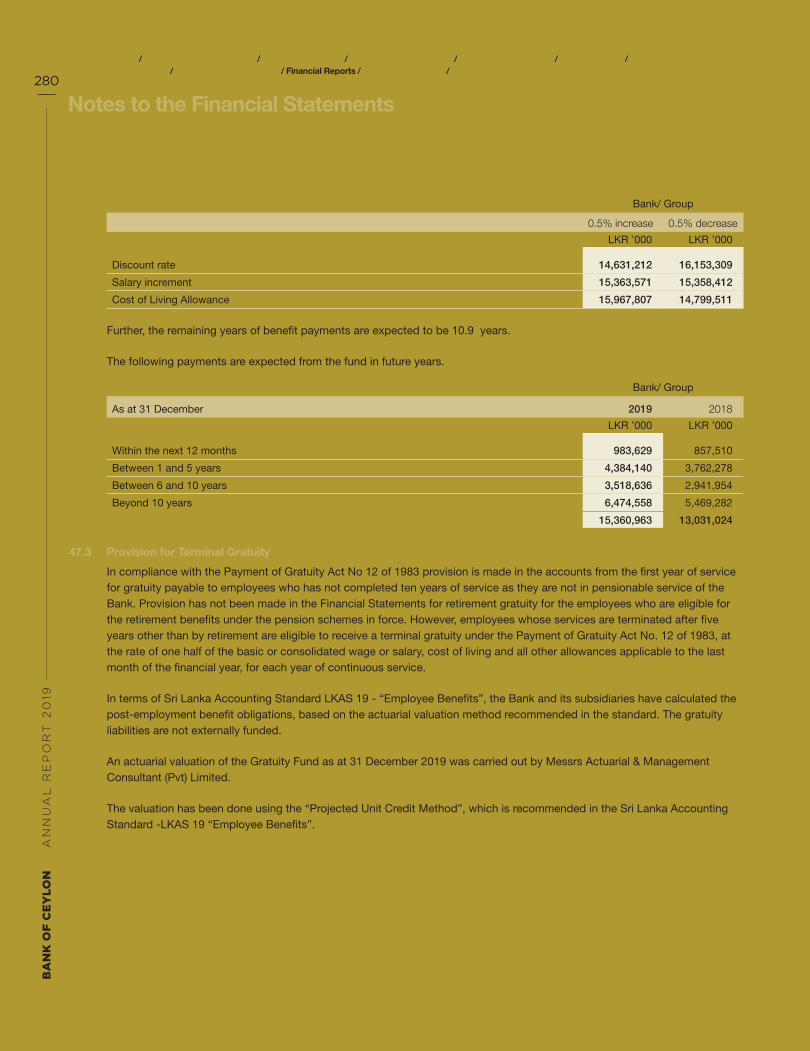
BA
NK
OF
CE
YL
ON
AN
NU
AL
RE
PO
RT
20
19
Notes to the Financial Statements280
About this Report / Performance Highlights 2019 / Chairman’s Message / General Manager’s Review / Organisational Overview / Strategic Report / Performance and Outlook / Stakeholder Value Creation / Financial Reports / Compliance Annexes / Supplementary Information
Increase/ decrease in the following assumptions will have an impact on the present value of defined benefit obligation as illustrated below;
Bank/ Group
0.5% increase 0.5% decrease
LKR ’000 LKR ’000
Discount rate 14,631,212 16,153,309
Salary increment 15,363,571 15,358,412
Cost of Living Allowance 15,967,807 14,799,511
Further, the remaining years of benefit payments are expected to be 10.9 years.
The following payments are expected from the fund in future years.
Bank/ Group
As at 31 December 2019 2018
LKR ’000 LKR ’000
Within the next 12 months 983,629 857,510
Between 1 and 5 years 4,384,140 3,762,278
Between 6 and 10 years 3,518,636 2,941,954
Beyond 10 years 6,474,558 5,469,282
Total expected payments 15,360,963 13,031,024
47.3 Provision for Terminal Gratuity
In compliance with the Payment of Gratuity Act No 12 of 1983 provision is made in the accounts from the first year of service for gratuity payable to employees who has not completed ten years of service as they are not in pensionable service of the Bank. Provision has not been made in the Financial Statements for retirement gratuity for the employees who are eligible for the retirement benefits under the pension schemes in force. However, employees whose services are terminated after five years other than by retirement are eligible to receive a terminal gratuity under the Payment of Gratuity Act No. 12 of 1983, at the rate of one half of the basic or consolidated wage or salary, cost of living and all other allowances applicable to the last month of the financial year, for each year of continuous service.
In terms of Sri Lanka Accounting Standard LKAS 19 - “Employee Benefits”, the Bank and its subsidiaries have calculated the post-employment benefit obligations, based on the actuarial valuation method recommended in the standard. The gratuity liabilities are not externally funded.
An actuarial valuation of the Gratuity Fund as at 31 December 2019 was carried out by Messrs Actuarial & Management Consultant (Pvt) Limited.
The valuation has been done using the “Projected Unit Credit Method”, which is recommended in the Sri Lanka Accounting Standard -LKAS 19 “Employee Benefits”.

About this Report / Performance Highlights 2019 / Chairman’s Message / General Manager’s Review / Organisational Overview / Strategic Report / Performance and Outlook / Stakeholder Value Creation / Financial Reports / Compliance Annexes / Supplementary Information
281
Bank Group
2019 2018 2019 2018
LKR ’000 LKR ’000 LKR ’000 LKR ’000
Balance as at 1 January 266,057 207,627 596,651 549,092
Provision charge/ (reversal) during the year 66,517 47,536 133,491 107,503
Actuarial (gain)/ losses 58,495 28,840 99,478 289
Payment made during the year (20,654) (17,946) (85,139) (63,409)
Adjustment/ transfers - - (18,926) 3,176
Balance as at 31 December 370,415 266,057 725,555 596,651
The principal actuarial assumptions used in the valuation were as follows :
Bank/ Group
2019 2018
% %
Future salary increment rate 6.5 p.a 6.5 p.a
Increase in future Cost of Living Allowance (COLA) 4.5 p.a 5.5 p.a
Discount rate 10.1 p.a 12.0 p.a
The Bank uses IALM (2006-2008) Ultimate Mortality Table issued by the Institute of Actuaries of India. Further, the remaining year of benefit payments are expected to be 11.3 years.
Increase/ decrease in the following assumptions will change the present value of defined benefit obligation as illustrated below:
Bank Group
0.5% increase 0.5% Decrease 0.5% increase 0.5% Decrease
LKR ’000 LKR ’000 LKR ’000 LKR ’000
Discount rate 352,098 390,282 689,676 764,469
Salary increment 385,831 356,126 755,751 697,566

BA
NK
OF
CE
YL
ON
AN
NU
AL
RE
PO
RT
20
19
Notes to the Financial Statements282
About this Report / Performance Highlights 2019 / Chairman’s Message / General Manager’s Review / Organisational Overview / Strategic Report / Performance and Outlook / Stakeholder Value Creation / Financial Reports / Compliance Annexes / Supplementary Information
47.4 Bank of Ceylon Pension Fund - 2014
Under the directions of the Ministry of Finance and Planning, this pension scheme was approved by the Board of Directors of the Bank with effect from 16 December 2014 for the employees recruited to the Bank on or after 01 January 1996. Minimum period of 120 months uninterrupted active service in the Bank at the time of retirement is required to be eligible for any retirement benefit under this pension scheme. Further the beneficiaries under this pension scheme will not be entitled for rights and privileges under the current service gratuity scheme of the Bank except death gratuity payment. Contribution to this pension scheme is made monthly, based on the advice of a qualified actuary, currently at 12% of gross salary. The liability under this pension scheme has been valued by a qualified actuary at the year-end.
An actuarial valuation of this fund as at 31 December 2019 was carried out by M/s Actuarial & Management Consultant (Pvt) Limited.
The valuation has been done using the “Projected Unit Credit Method”, which is recommended in the Sri Lanka Accounting Standard -LKAS 19 “Employee Benefits”. The results of the actuarial valuation of this Pension Fund is summarised as follows:
47.4.1 Net Benefit Expense (Recognised Under Personnel Expenses)
Bank/ Group
For the year ended 31 December 2019 2018
LKR ’000 LKR ’000
Current service cost 525,207 429,293
Net interest (Income)/ expenses (331,646) (241,042)
Net benefit expense 193,561 188,251
47.4.2 Amount Recognised in Other Comprehensive Income
Bank/ Group
For the year ended 31 December 2019 2018
LKR ’000 LKR ’000
Actuarial (gains)/ losses on the defined benefit obligation 193,866 (232,450)
Actuarial (gains)/ losses on plan assets 274,009 311,792
Net actuarial gains/ (losses) recognised in other comprehensive income 467,875 79,342
47.4.3 Retirement Benefit Assets
Bank/ Group
As at 31 December 2019 2018
LKR ’000 LKR ’000
Fair value of plan assets [Note 47.4.4] 8,637,786 7,138,966
Defined benefit obligation [Note 47.4.5] (5,615,276) (4,375,248)
Net retirement benefit assets 3,022,510 2,763,718

About this Report / Performance Highlights 2019 / Chairman’s Message / General Manager’s Review / Organisational Overview / Strategic Report / Performance and Outlook / Stakeholder Value Creation / Financial Reports / Compliance Annexes / Supplementary Information
283
47.4.4 Changes in Fair Value of Plan Assets
Bank/ Group
2019 2018
LKR ’000 LKR ’000
Opening fair value of plan assets 7,138,966 5,429,485
Expected return 856,676 624,391
Actual employer contribution 920,228 776,608
Benefits paid (4,075) (3,310)
Actuarial gains/ (losses) on plan asset (274,009) 311,792
Closing fair value of plan assets 8,637,786 7,138,966
47.4.5 Changes in Present Value of the Defined Benefit Obligation
Bank/ Group
2019 2018
LKR ’000 LKR ’000
Opening defined benefit obligation 4,375,248 3,333,466
Interest cost 525,030 383,349
Current service cost 525,207 429,293
Benefits paid (4,075) (3,310)
Actuarial (gains)/ losses on obligation (688,840) 800,879
(Gains)/ losses due to change in assumptions 882,706 (568,429)
Closing defined benefit obligation 5,615,276 4,375,248
47.4.6 Plan Assets Consist of the Following
Bank/ Group
As at 31 December 2019 2018
LKR ’000 LKR ’000
Treasury bonds - 318,517
Fixed deposits 4,700,007 3,559,898
Debentures 3,936,431 3,260,325
Others 1,348 226
Total plan assets 8,637,786 7,138,966

BA
NK
OF
CE
YL
ON
AN
NU
AL
RE
PO
RT
20
19
Notes to the Financial Statements284
About this Report / Performance Highlights 2019 / Chairman’s Message / General Manager’s Review / Organisational Overview / Strategic Report / Performance and Outlook / Stakeholder Value Creation / Financial Reports / Compliance Annexes / Supplementary Information
47.4.7 Actuarial Assumptions
Bank/ Group
2019 2018
% %
Future salary increment rate 6.5 p.a 6.5 p.a
Increase in future Cost of Living Allowance (COLA) 4.5 p.a 5.5 p.a
Increase in pension in payment (Basic) Nill Nil
Discounting rate 10.7 p.a 12.0 p.a
Attrition rate Nill Nil
The Bank uses IALM (2006-08) Ultimate Mortality Table issued by the Institute of Actuaries of India
Increase/ decrease in the following assumptions will have an impact on the present value of defined benefit obligation as illustrated below;
Bank/ Group
0.5% increase 0.5% decrease
LKR ’000 LKR ’000
Discount rate 4,951,202 6,388,145
Salary increment 6,010,179 5,257,972
Cost of Living Allowance 5,752,441 5,491,503
Further, the remaining years of benefit payments are expected to be 27.1 years.
The following payments are expected from the Pension Fund in future years.
Bank/ Group
As at 31 December 2019 2018
LKR ’000 LKR ’000
Within the next 12 months 5,650 4,142
Between 1 and 5 years 65,150 75,527
Between 6 and 10 years 248,776 243,881
Beyond 10 years 5,295,700 4,051,698
Total expected payments 5,615,276 4,375,248

About this Report / Performance Highlights 2019 / Chairman’s Message / General Manager’s Review / Organisational Overview / Strategic Report / Performance and Outlook / Stakeholder Value Creation / Financial Reports / Compliance Annexes / Supplementary Information
285
48 Subordinated Liabilities
Accounting Policy
Subordinated liabilities include funds borrowed for long term funding purposes which are subordinated to other claims. These are initially recognised at fair value. Subsequent to initial recognition subordinated liabilities are measured at their amortised cost, using the Effective Interest Rate (EIR) method. Amortised cost is calculated by taking into account any discount or premium on the issue and costs that are an integral part of the EIR. The EIR amortisation is included in “Interest expenses” (Note 8.2) in the Statement of Profit or Loss.
Bank Group
As at 31 December 2019 2018 2019 2018
LKR ’000 LKR ’000 LKR ’000 LKR ’000
Listed debentures
Unsecured, subordinated, redeemable debentures of LKR 100 each 22,138,938 28,448,484 22,128,928 28,105,732
Unlisted debentures
Unsecured, subordinated, redeemable debentures of LKR 100 each (private placement)
32,082,614 22,378,755 32,082,614 22,378,755
Total subordinated Liabilities 54,221,552 50,827,239 54,211,542 50,484,487
48.1 The Movement in Subordinated Liabilities
Bank Group
2019 2018 2019 2018
LKR ’000 LKR ’000 LKR ’000 LKR ’000
Balance as at 1 January 50,827,239 42,570,457 50,484,487 42,226,067
Issued during the year 9,210,000 12,000,000 9,210,000 12,000,000
Redemptions (6,166,475) (4,090,400) (5,833,733) (4,090,400)
Amortisation adjustments 350,788 347,182 350,788 348,820
Balance as at 31 December 54,221,552 50,827,239 54,211,542 50,484,487

BA
NK
OF
CE
YL
ON
AN
NU
AL
RE
PO
RT
20
19
Notes to the Financial Statements286
About this Report / Performance Highlights 2019 / Chairman’s Message / General Manager’s Review / Organisational Overview / Strategic Report / Performance and Outlook / Stakeholder Value Creation / Financial Reports / Compliance Annexes / Supplementary Information
48.2 Type of Debentures
Coupon rate Amount as at 31 December
Bank Group
Notes Interest
payable
frequency
Issue date Maturity
date
2019 2018 2019 2018 2019 2018
% % LKR ’000 LKR ’000 LKR ’000 LKR ’000
Fixed Interest Rate
Unsecured, subordinated,
redeemable debentures Annually 25.10.2013 24.10.2021 13.25 13.25 1,226,594 1,226,594 1,226,594 1,226,594
Unsecured, subordinated,
redeemable debentures Annually 25.10.2013 24.10.2022 13.25 13.25 1,227,617 1,227,617 1,227,617 1,227,617
Unsecured, subordinated,
redeemable debentures Annually 25.10.2013 24.10.2023 13.75 13.75 1,638,142 1,638,142 1,638,142 1,638,142
Unsecured, subordinated,
redeemable debentures Annually 22.09.2014 21.09.2019 - 8.00 - 5,234,969 - 5,234,969
Unsecured, subordinated,
redeemable debentures Quarterly 22.09.2014 21.09.2019 - 7.75 - 216,182 - 216,182
Unsecured, subordinated,
redeemable debentures Annually 22.09.2014 21.09.2022 8.25 8.25 1,873,793 1,873,793 1,873,793 1,873,793
Unsecured, subordinated,
redeemable debentures Annually 06.10.2015 05.10.2020 8.25 8.25 293,991 293,991 293,991 293,991
Unsecured, subordinated,
redeemable debentures Quarterly 06.10.2015 05.10.2020 8.00 8.00 12,449 12,449 12,449 12,449
Unsecured, subordinated,
redeemable debentures Annually 06.10.2015 05.10.2023 9.50 9.50 1,205,580 1,205,580 1,205,580 1,205,580
Unsecured, subordinated,
redeemable debentures Annually 29.12.2016 28.12.2021 13.25 13.25 8,003,631 8,003,631 7,993,621 7,993,621
Unsecured, subordinated,
redeemable debentures Annually 29.12.2016 28.12.2024 12.75 12.75 784 784 784 784
Unsecured, subordinated,
redeemable debentures Annually 29.12.2017 28.12.2022 12.50 12.50 5,003,228 5,003,228 5,003,228 5,003,228
Unsecured, subordinated,
redeemable debentures Annually 29.12.2017 28.12.2025 12.75 12.75 5,003,289 5,003,289 5,003,289 5,003,289
Unsecured, subordinated,
redeemable debentures Annually 31.07.2018 30.07.2026 12.00 12.00 7,026,114 7,025,960 7,026,114 7,025,960
Unsecured, subordinated,
redeemable debentures Annually 03.12.2018 02.12.2023 12.00 12.00 5,346,308 5,346,278 5,346,308 5,346,278
Unsecured, subordinated,
redeemable debentures Annually 27.06.2019 26.06.2027 11.75 - 3,175,700 - 3,175,700 -
Unsecured, subordinated,
redeemable debentures Annually 17.07.2019 16.07.2024 11.80 - 1,103,765 - 1,103,765 -
Unsecured, subordinated,
redeemable debentures Annually 18.07.2019 17.07.2024 11.80 - 2,314,479 - 2,314,479 -
Unsecured, subordinated,
redeemable debentures Annually 23.07.2019 22.07.2024 11.80 - 2,626,021 - 2,626,021 -
Unsecured, subordinated,
redeemable debentures Annually 24.07.2019 23.07.2024 11.50 - 419,549 - 419,549 -
Unsecured, subordinated,
redeemable debentures Annually 26.07.2019 25.07.2027 11.75 - 64,162 - 64,162 -
Total fixed interest rate subordinated debentures 47,565,196 43,312,487 47,555,186 43,302,477

About this Report / Performance Highlights 2019 / Chairman’s Message / General Manager’s Review / Organisational Overview / Strategic Report / Performance and Outlook / Stakeholder Value Creation / Financial Reports / Compliance Annexes / Supplementary Information
287
Coupon rate Amount as at 31 December
Bank Group
Notes Interest
payable
frequency
Issue date Maturity
date
2019 2018 2019 2018 2019 2018
% % LKR ’000 LKR ’000 LKR ’000 LKR ’000
Floating Interest Rate
Unsecured, subordinated,
redeemable debentures (a)
Semi
annually 25.10.2013 24.10.2021 8.66 9.52 1,016 1,019 1,016 1,019
(6 months TB rate (gross)
plus 100 basis points)
Unsecured, subordinated,
redeemable debentures (a)
Semi
annually 22.09.2014 21.09.2019 10.29 9.97 - 845,442 - 512,700
(6 months TB rate (gross)
plus 50 basis points)
Unsecured, subordinated,
redeemable debentures (a)
Semi
annually 22.09.2014 21.09.2022 8.25 9.97 31 31 31 31
(6 months TB rate (gross)
plus 50 basis points)
Unsecured, subordinated,
redeemable debentures (a)
Semi
annually 06.10.2015 05.10.2020 8.98 10.72 4,571,357 4,580,255 4,571,357 4,580,255
(6 months TB rate (gross)
plus 125 basis points)
Unsecured, subordinated,
redeemable debentures (a)
Semi
annually 06.10.2015 05.10.2023 8.98 10.72 2,082,911 2,086,964 2,082,911 2,086,964
(6 months TB rate (gross)
plus 125 basis points)
Unsecured, subordinated,
redeemable debentures (a)
Semi
annually 29.12.2016 28.12.2021 9.27 11.24 1,021 1,021 1,021 1,021
(6 months TB rate (gross)
plus 125 basis points)
Unsecured, subordinated,
redeemable debentures (a)
Semi
annually 29.12.2016 28.12.2024 9.27 11.24 20 20 20 20
(6 months TB rate (gross)
plus 125 basis points)
Total floating interest rate
subordinated debentures 6,656,356 7,514,752 6,656,356 7,182,010
Total subordinated
debentures
54,221,552
50,827,239
54,211,542
50,484,487
Notes :Debentures that are listed in the Colombo Stock Exchange. Some of these have been traded in the Colombo Stock Exchange during the year ended 31 December 2019
2014/2023 - ( Highest Price - LKR 102.22, Lowest Price - LKR 102.22, Last Transaction Price - LKR 102.22)2014/2019 - ( Highest Price - LKR 97.31, Lowest Price - LKR 97.30, Last Transaction Price - LKR 97.30)2014/2022 - ( Highest Price - LKR 80.00, Lowest Price - LKR 80.00, Last Transaction Price - LKR 80.00)2015/2020 - ( Highest Price - LKR 98.50, Lowest Price - LKR 97.00, Last Transaction Price - LKR 97.00)2016/2021 - ( Highest Price - LKR 100.34, Lowest Price - LKR 98.20, Last Transaction Price - LKR 100.34)
b) Weighted average 6 months Treasury Bill interest rate before deducting relevant withholding tax at the primary quotations as announced by the Central Bank of Sri Lanka, at the preceding week of the interest resetting date.

BA
NK
OF
CE
YL
ON
AN
NU
AL
RE
PO
RT
20
19
Notes to the Financial Statements288
About this Report / Performance Highlights 2019 / Chairman’s Message / General Manager’s Review / Organisational Overview / Strategic Report / Performance and Outlook / Stakeholder Value Creation / Financial Reports / Compliance Annexes / Supplementary Information
49 Share Capital
49.1 Ordinary Shares
Bank Group
As at 31 December 2019 2018 2019 2018
LKR ’000 LKR ’000 LKR ’000 LKR ’000
Authorised
50,000,000 ordinary shares 50,000,000 50,000,000 50,000,000 50,000,000
Issued and fully paid
Balance as at 1 January [20,000,000 (2018:15,000,000) ordinary shares] 20,000,000 15,000,000 20,000,000 15,000,000
Share issued during the year [5,000,000 ordinary shares] 5,000,000 5,000,000 5,000,000 5,000,000
Balance as at 31 December [25,000,000 (2018: 20,000,000) ordinary shares] 25,000,000 20,000,000 25,000,000 20,000,000
Assigned capital
Capital infusion during the year - 5,000,000 - 5,000,000
Balance as at 31 December 25,000,000 25,000,000 25,000,000 25,000,000
49.2 Net Assets Value Per Share
Bank Group
As at 31 December 2019 2018 2019 2018
Amount used as the Numerator
Total equity attributable to equity holder of the bank (LKR ’000) 142,282,737 132,169,824 153,210,562 142,173,299
Number of ordinary shares used as denominator
Total number of ordinary shares issued 25,000,000 20,000,000 25,000,000 20,000,000
Net asset value per share (LKR) 5,691.31 6,608.49 6,128.42 7,108.66
50 Permanent Reserve Fund
Bank Group
2019 2018 2019 2018
LKR ’000 LKR ’000 LKR ’000 LKR ’000
Balance as at 1 January 12,890,000 10,427,000 12,890,000 10,427,000
Transfers during the year 493,000 2,463,000 493,000 2,463,000
Balance as at 31 December 13,383,000 12,890,000 13,383,000 12,890,000
The permanent reserve fund is maintained as required by Bank of Ceylon Ordinance (Chapter 397) whereby the Bank must, out of net profit after taxation, but before any dividend is declared, transfer to a reserve, a sum equivalent to not less than 20% of such profit, until the reserve is equivalent to 50% of the issued and paid-up capital and thereafter, an appropriate amount determined at 2% per annum in terms of section 20(1) and (2) of the Banking Act No. 30 of 1988 until the reserve is equal to the paid-up capital.
In order to meet the requirement, an amount of LKR 493.0 million was transferred to the permanent reserve during the year 2019. (2018 : LKR 2,463.0 million).
The balance in the permanent reserve fund will be used only for the purposes specified in the Section 20 (2) of the Banking Act No. 30 of 1988.

About this Report / Performance Highlights 2019 / Chairman’s Message / General Manager’s Review / Organisational Overview / Strategic Report / Performance and Outlook / Stakeholder Value Creation / Financial Reports / Compliance Annexes / Supplementary Information
289
51 Retained Earnings
Bank Group
2019 2018 2019 2018
LKR ’000 LKR ’000 LKR ’000 LKR ’000
Balance as at 1 January 78,061,681 63,472,250 79,179,548 65,100,871
Impact of adopting SLFRS 9 as at 1 January 2018 - (9,562,471) - (10,369,633)
Deferred tax on transitional adjustments - 3,345,868 - 3,571,637
Retirement benefit adjustment as at 1 January 2018 - 8,903,395 - 8,903,395
Total comprehensive income for the year 10,463,277 19,186,846 10,795,358 19,256,617
Net transfers between reserves (489,068) (2,437,797) (487,931) (2,436,929)
Dividend (346,410) (4,846,410) (346,410) (4,846,410)
Balance as at 31 December 87,689,480 78,061,681 89,140,565 79,179,548
52 Other Reserves
Bank Group
As at 31 December 2019 2018 2019 2018
LKR ’000 LKR ’000 LKR ’000 LKR ’000
Revaluation reserve [Note 52.1] 11,694,338 11,698,270 19,287,824 18,746,709
Free reserve 169,067 169,067 366,644 366,644
Exchange translation reserve [Note 52.2] 2,370,251 2,512,612 3,101,761 3,157,000
Fair value through OCI reserve [Note 52.3] 1,976,601 1,838,194 2,571,824 2,474,454
Statutory reserve - other [Note 52.4] - - 358,944 358,944
Total other reserves 16,210,257 16,218,143 25,686,997 25,103,751
52.1 Revaluation Reserve
Bank Group
2019 2018 2019 2018
LKR ’000 LKR ’000 LKR ’000 LKR ’000
Balance as at 1 January 11,698,270 11,966,489 18,746,709 18,681,265
Change in revaluation surplus/ (deficit) - (337,522) 790,887 147,397
Deferred tax effect on changes in revaluation surplus/ (deficit) - 94,506 (221,448) (41,271)
Revaluation surplus of desposed property (3,932) (25,203) (3,932) (25,203)
Transferred to non-controlling interest - - (24,392) (15,479)
Balance as at 31 December 11,694,338 11,698,270 19,287,824 18,746,709
The revaluation reserve represents the surpluses arising on the revaluation of freehold properties which are still in use.
According to the Basel III regulatory directives, issued by Central Bank of Sri Lanka, the Bank can consider the revaluation surplus as supplimentary capital in computing capital adequacy ratio, once in every three years.

BA
NK
OF
CE
YL
ON
AN
NU
AL
RE
PO
RT
20
19
Notes to the Financial Statements290
About this Report / Performance Highlights 2019 / Chairman’s Message / General Manager’s Review / Organisational Overview / Strategic Report / Performance and Outlook / Stakeholder Value Creation / Financial Reports / Compliance Annexes / Supplementary Information
52.2 Exchange Translation Reserve
Bank Group
As at 31 December 2019 2018 2019 2018
LKR ’000 LKR ’000 LKR ’000 LKR ’000
Balance as at 1 January 2,512,612 1,401,743 3,157,000 1,703,785
Exchange defferences on tranlations of foriegn operations (142,361) 1,110,869 (55,239) 1,453,215
Balance as at 31 December 2,370,251 2,512,612 3,101,761 3,157,000
This represents the exchange differences arising from translating investments made in the capital and net exchange movement arising on the translation of net equity of Bank of Ceylon (UK) Limited and foreign branches and also exchange differences arising from translation of the results of foreign branches for this year from the average rate to the exchange rate ruling at the year end.
52.3 Fair Value Through OCI Reserve
Bank Group
2019 2018 2019 2018
LKR ’000 LKR ’000 LKR ’000 LKR ’000
Balance as at 1 January 1,838,194 - 2,474,454 -
Impact of adopting SLFRS 9 as at 1 January 2018 - 2,541,656 - 3,583,746
Net gains/ (losses) on investments in debt instruments measured at FVTOCI 76,949 (271,351) 79,550 (285,389)
Deferred tax effect on net gains/ (losses) on investments in debt instruments measured at FVTOCI (80,282) - (80,282) -
Net gains/ (losses) on investments in debt instruments at FVTOCI reclassification to profit or loss 231,126 (15,232) 231,126 (15,232)
Change in fair value on investments in equity instruments designated at FVTOCI 54,970 (410,168) 14,446 (823,954)
Deferred tax effect on changes in fair value on investment in equity instruments designated at FVTOCI (144,356) (6,711) (144,356) (6,711)
Transferred to non-controlling interest - - (3,114) 21,994
Balance as at 31 December 1,976,601 1,838,194 2,571,824 2,474,454
53 Non Controlling Interest
Group
As at 31 December 2019 2018
LKR ’000 LKR ’000
Property Development PLC 236,321 165,212
Merchant Bank of Sri Lanka & Finance PLC 659,561 561,889
MBSL Insurance Company Limited 869,291 (57,265)
Hotels Colombo (1963) Limited 9 14
Koladeniya Hydropower (Private) Limited 19,905 25,299
Total non-controlling interest 1,785,087 695,149

About this Report / Performance Highlights 2019 / Chairman’s Message / General Manager’s Review / Organisational Overview / Strategic Report / Performance and Outlook / Stakeholder Value Creation / Financial Reports / Compliance Annexes / Supplementary Information
291
54 Notes to the Statements of Cash Flows
54.1 Change in Operating Assets
Bank Group
For the year ended 31 December 2019 2018 2019 2018
LKR ’000 LKR ’000 LKR ’000 LKR ’000
Change in deposits with regulatory authorities 11,085,935 3,008,641 11,085,935 3,008,641
Change in loans and advances to customers (121,794,728) (273,084,476) (121,906,952) (274,766,771)
Net increase/ ( decrease) of financial assets designated at fair value through profit or loss (795,451) (2,307,941) (1,486,776) (2,376,696)
Net (increase)/ decrease in securities purchased under resale agreements (6,205,703) (13,927,044) (8,775,529) (17,926,129)
Net (increase)/ decrease in derivative financial instruments 1,073,567 413,166 1,073,567 413,166
Change in other operating assets (7,140,965) (1,484,465) (6,496,945) (1,373,566)
Total (123,777,345) (287,382,119) (126,506,700) (293,021,355)
54.2 Change in Operating Liabilities
Bank Group
For the year ended 31 December 2019 2018 2019 2018
LKR ’000 LKR ’000 LKR ’000 LKR ’000
Net Increase/ (decrease) in deposits from banks (222,267) 455,138 (222,267) 455,138
Net Increase/ (decrease) in deposits from customers 228,719,884 222,717,119 229,762,601 222,506,976
Net increase/ (decrease) in securities sold under repurchase agreements (63,216,149) 52,911,898 (62,542,795) 52,794,616
Net increase/ (decrease) in short term borrowings 5,011,412 (189,627) 7,486,156 1,977,577
Net increase/ (decrease) in derivative financial instruments (402,341) 438,303 (402,341) 438,303
Change in other operating liabilities 6,419,749 10,788,122 6,022,600 15,011,026
Total 176,310,288 287,120,953 180,103,954 293,183,636
54.3 Other Non Cash Items Included in Profit Before Tax
Bank Group
For the year ended 31 December 2019 2018 2019 2018
LKR ’000 LKR ’000 LKR ’000 LKR ’000
Exchange revaluation 401,604 (7,622,372) 401,604 (7,622,372)
Contribution paid to defined benefit plans (250,053) (132,434) (154,976) (70,992)
Impairment charges 18,597,725 15,040,961 18,719,243 15,176,472
Depreciation of investment property 117,072 117,072 2,906 2,906
Depreciation of property, plant and equipment 1,874,304 1,686,954 2,626,836 2,358,603
Amortisation of intangible assets and leasehold properties 1,712,628 396,268 1,145,402 451,960
Accrual for expenses and other non cash items 893,810 (2,713,072) 1,250,553 (2,802,540)
Total 23,347,090 6,773,377 23,991,568 7,494,037

BA
NK
OF
CE
YL
ON
AN
NU
AL
RE
PO
RT
20
19
Notes to the Financial Statements292
About this Report / Performance Highlights 2019 / Chairman’s Message / General Manager’s Review / Organisational Overview / Strategic Report / Performance and Outlook / Stakeholder Value Creation / Financial Reports / Compliance Annexes / Supplementary Information
55 Contingent Liabilities and CommitmentsContingent liabilities are possible obligations whose existence will be confirmed only by uncertain future events or present obligations where the transfer of economic benefit is not probable or cannot be readily measured as defined in the Sri Lanka Accounting Standard – LKAS 37 on ‘Provisions, Contingent Liabilities and Contingent Assets’.
In the normal course of business, the Bank undertakes commitments and incurs contingent liabilities with legal recourse to its customers to accommodate the financial and investment needs of clients, to conduct trading activities and to manage its own exposure to risk. These consist of financial guarantees, letters of credit and other undrawn commitments to lend. Letters of credit and guarantees (including standby letters of credit) commit the Bank to make payments on behalf of customers in the event of a specific act, generally related to the import or export of goods. Guarantees and standby letters of credit carry a similar credit risk to loans. Operating lease commitments of the Bank (as a lessor and as a lessee) and pending legal claims against the Bank also form part of commitments of the Bank.
Contingent liabilities are not recognised in the Statement of Financial Position but are disclosed unless they are remote. These financial instruments generate interest or fees and carries elements of credit risk in excess of those amounts recognised as assets and liabilities in the Statement of Financial Position. However no material losses are anticipated as a result of these transactions.
These commitments and contingencies are quantified below :
Bank Group
As at 31 December 2019 2018 2019 2018
LKR ’000 LKR ’000 LKR ’000 LKR ’000
Contingent liabilities [Note 55.1] 365,924,630 373,074,988 374,033,867 377,523,369
Undrawn and undisbursed facilities [Note 55.2] 130,185,074 121,561,219 130,351,632 121,825,818
Capital commitments [Note 55.3] 9,560,270 11,053,804 9,644,187 11,214,075
Lease commitments [Note 55.4] 2,547,987 2,616,797 2,603,293 2,629,157
Total contingent liabilities and commitments 508,217,961 508,306,808 516,632,979 513,192,419
55.1 Contingent Liabilities
Bank Group
As at 31 December 2019 2018 2019 2018
LKR ’000 LKR ’000 LKR ’000 LKR ’000
Acceptances and documentary credit 215,999,116 225,582,120 216,052,447 225,672,891
Bills for collection 20,291,631 21,553,898 20,291,631 21,553,898
Forward exchange contracts 5,212,914 7,719,075 5,212,914 7,719,075
Guarantees 101,124,860 100,715,102 101,243,188 100,941,300
Other commitments [Note 55.1.1] 23,296,109 17,504,793 31,233,687 21,636,205
Total contingent liabilities 365,924,630 373,074,988 374,033,867 377,523,369
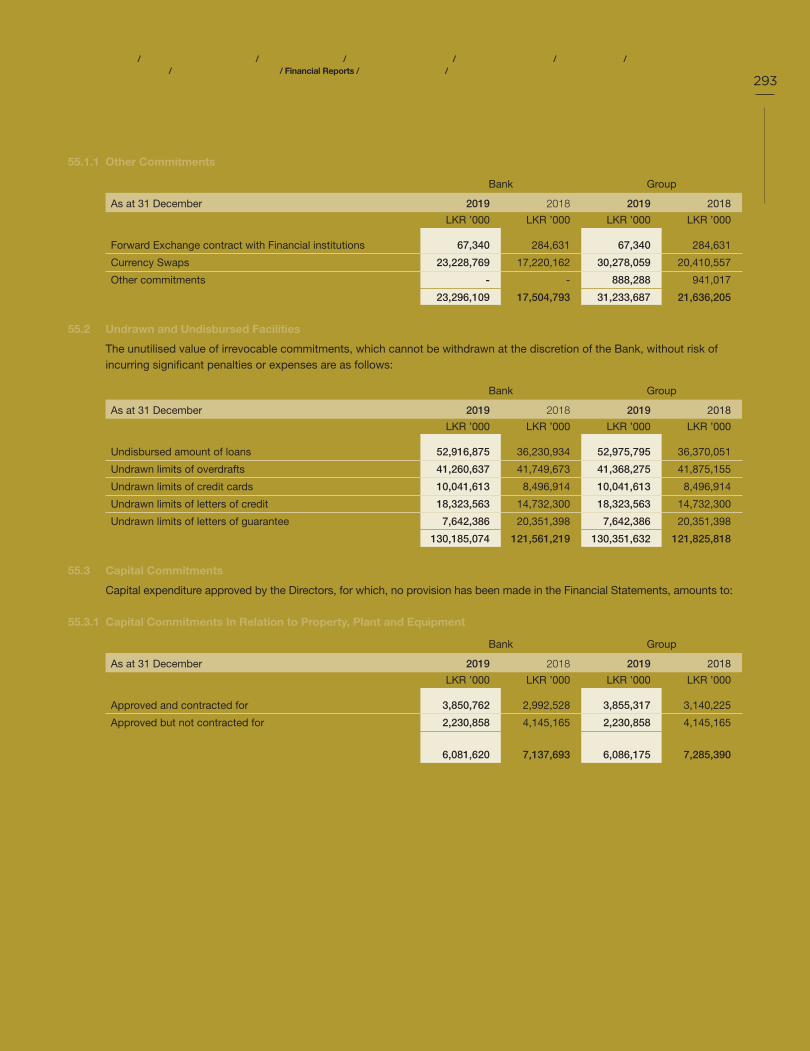
About this Report / Performance Highlights 2019 / Chairman’s Message / General Manager’s Review / Organisational Overview / Strategic Report / Performance and Outlook / Stakeholder Value Creation / Financial Reports / Compliance Annexes / Supplementary Information
293
55.1.1 Other Commitments
Bank Group
As at 31 December 2019 2018 2019 2018
LKR ’000 LKR ’000 LKR ’000 LKR ’000
Forward Exchange contract with Financial institutions 67,340 284,631 67,340 284,631
Currency Swaps 23,228,769 17,220,162 30,278,059 20,410,557
Other commitments - - 888,288 941,017
Total other commitments 23,296,109 17,504,793 31,233,687 21,636,205
55.2 Undrawn and Undisbursed Facilities
The unutilised value of irrevocable commitments, which cannot be withdrawn at the discretion of the Bank, without risk of incurring significant penalties or expenses are as follows:
Bank Group
As at 31 December 2019 2018 2019 2018
LKR ’000 LKR ’000 LKR ’000 LKR ’000
Undisbursed amount of loans 52,916,875 36,230,934 52,975,795 36,370,051
Undrawn limits of overdrafts 41,260,637 41,749,673 41,368,275 41,875,155
Undrawn limits of credit cards 10,041,613 8,496,914 10,041,613 8,496,914
Undrawn limits of letters of credit 18,323,563 14,732,300 18,323,563 14,732,300
Undrawn limits of letters of guarantee 7,642,386 20,351,398 7,642,386 20,351,398
Total undrawn and undisbursed facilities 130,185,074 121,561,219 130,351,632 121,825,818
55.3 Capital Commitments
Capital expenditure approved by the Directors, for which, no provision has been made in the Financial Statements, amounts to:
55.3.1 Capital Commitments In Relation to Property, Plant and Equipment
Bank Group
As at 31 December 2019 2018 2019 2018
LKR ’000 LKR ’000 LKR ’000 LKR ’000
Approved and contracted for 3,850,762 2,992,528 3,855,317 3,140,225
Approved but not contracted for 2,230,858 4,145,165 2,230,858 4,145,165
Total capital commitments in relation to Property Plant and Equipment 6,081,620 7,137,693 6,086,175 7,285,390

BA
NK
OF
CE
YL
ON
AN
NU
AL
RE
PO
RT
20
19
Notes to the Financial Statements294
About this Report / Performance Highlights 2019 / Chairman’s Message / General Manager’s Review / Organisational Overview / Strategic Report / Performance and Outlook / Stakeholder Value Creation / Financial Reports / Compliance Annexes / Supplementary Information
55.3.2 Capital Commitments in Relation to Intangible Assets
Bank Group
As at 31 December 2019 2018 2019 2018
LKR ’000 LKR ’000 LKR ’000 LKR ’000
Approved and contracted for 1,581,428 2,311,147 1,660,790 2,323,721
Approved and not contracted for 1,897,222 1,604,964 1,897,222 1,604,964
Total capital commitments in relation to intangible assets 3,478,650 3,916,111 3,558,012 3,928,685
Total capital commitments 9,560,270 11,053,804 9,644,187 11,214,075
55.4 Lease Commitments
55.4.1 Operating Lease Commitments
Future minimum lease payments under non-cancellable operating leases, where the Bank is the lessee, are as follows;
Bank Group
As at 31 December 2019 2018 2019 2018
LKR ’000 LKR ’000 LKR ’000 LKR ’000
Not later than 1 year 792,650 1,032,633 820,891 1,032,633
Later than 1 year and not later than 5 years 1,200,140 1,283,406 1,222,344 1,283,406
Later than 5 years 555,197 300,758 555,211 300,758
Total operating lease commitments 2,547,987 2,616,797 2,598,446 2,616,797
55.4.2 Finance Lease Commitments
Future minimum lease payments under non-cancellable finance leases, where the Bank is the lessee, are as follows;
Bank Group
As at 31 December 2019 2018 2019 2018
LKR ’000 LKR ’000 LKR ’000 LKR ’000
Not later than 1 year - - 3,184 7,514
Later than 1 year and not later than 5 years - - 1,663 4,846
Later than 5 years - - - -
Total finance lease commitments - - 4,847 12,360
Total lease commitments 2,547,987 2,616,797 2,603,293 2,629,157
Note With the implementation of SLFRS 16 effect from 1 January 2019, the operating lease commitments recognised as lease liability and reported under Other Liabilities (Note 46).

About this Report / Performance Highlights 2019 / Chairman’s Message / General Manager’s Review / Organisational Overview / Strategic Report / Performance and Outlook / Stakeholder Value Creation / Financial Reports / Compliance Annexes / Supplementary Information
295
55.5 Litigation
Litigations are anticipated in the context of business operations due to the nature of the transactions involved. The Bank and the Group's companies are involved in various such legal actions and the controls have been established to deal with such legal claims. There are pending litigations existing as at the end of the Reporting period against the Bank, resulting through normal business operations.
Litigations against the Bank have been assessed in terms of the probability of any claims or damages arising against the Bank, which require provisions to be made in the Financial Statements as per LKAS 37- “Provisions, Contingent Liabilities and Contingent Assets”.
As of 31 December 2019, claims for the legal actions against the Bank approximately amount to LKR 7,032.8 million (2018: LKR 12,414.4 million), nevertheless the Bank has no impact over such claims whatsoever affecting to the business, operations or image of the Bank.
56 Assets Pledged as SecurityThe securities sold under repurchase agreement, debentures and debt securities issued by the Bank and the Group and details of assets pledged by the Bank and the Group, to secure those liabilities are given below:
Bank Group
As at 31 December 2019 2018 2019 2018
LKR ’000 LKR ’000 LKR ’000 LKR ’000
Borrowings ;
Securities sold under repurchase agreements 34,183,210 97,399,359 34,880,507 97,423,302
34,183,210 97,399,359 34,880,507 97,423,302
Secured by ;
Treasury bills 23,609,218 9,619,113 23,609,218 9,619,113
Treasury bonds 14,235,180 92,774,829 14,932,477 92,800,854
Total assets pledged as securities 37,844,398 102,393,942 38,541,695 102,419,967
57 Events After the Reporting DateEvents after the Reporting period are those events, favourable and unfavourable, that occur between the Reporting date and the date the Financial Statements are authorised for issue.
The outbreak and spread of the coronavirus globally since January 2020 has caused disruptions to business and economic activities, and uncertainty to the global economy. Consequent to the diagnosis of COVID -19 virus within Sri Lanka. The Central Bank of Sri Lanka has introduced many extraordinary measures to curb the preassure to the financial industry,stemming from the pandemic situation and the preventive measures taken by the Government of Sri Lanka and the Health Authorities to curtail the spread of the virus. The impact to the Bank due to changes that took place in its normal business practices due to COVID-19 pandemic is also significant. However, the Bank proactively adjusted to the situation very quickly and took all necessary steps to provide the customer services in best possible manner in this pandemic situation.
The Bank is in the process of assessing the impact of COVID -19 and the Moratorium introduced by the Government to protect the economy. However opening of the country for normal activities, outcome created from uncertainties in the global economic conditions, the real impact due to COVID -19 is yet to be estimated.
The Bank will continue to support the measures taken to revive the economy and the safety of its stakeholders by implementing necessary actions and safety measures.

BA
NK
OF
CE
YL
ON
AN
NU
AL
RE
PO
RT
20
19
Notes to the Financial Statements296
About this Report / Performance Highlights 2019 / Chairman’s Message / General Manager’s Review / Organisational Overview / Strategic Report / Performance and Outlook / Stakeholder Value Creation / Financial Reports / Compliance Annexes / Supplementary Information
58 Maturity Analysis of Assets and Liabilities The analysis of total assets and liabilities of the Bank and the Group into relevant maturity groupings based on the remaining
period as at 31 December 2019 in to the contractual maturity date, is given in the table below:
Bank Group
As at 31 December 2019Within
12 monthsAfter
12 monthsTotal Within
12 monthsAfter
12 monthsTotal
LKR ’000 LKR ’000 LKR ’000 LKR ’000 LKR ’000 LKR ’000
Assets
Cash and cash equivalents 64,868,895 - 64,868,895 64,829,735 - 64,829,735
Balances with Central Banks 54,594,436 - 54,594,436 54,594,436 - 54,594,436
Placements with banks 40,296,911 4,179,432 44,476,343 43,624,709 4,286,912 47,911,621
Securities purchased under resale agreements 2,179,449 - 2,179,449 3,981,886 - 3,981,886
Derivative financial instruments 132,090 - 132,090 132,090 - 132,090
Financial assets measured at fair value through profit or loss 4,639,337 5,416,078 10,055,415 5,594,376 5,458,393 11,052,769
Financial assets measured at amortised cost - loans and advances 578,500,777 971,304,094
1,549,804,871 591,646,684 989,302,341
1,580,949,025
Financial assets measured at amortised cost - debt instruments 291,064,805 281,683,004 572,747,809 290,752,515 283,224,815 573,977,330
Financial assets measured at fair value through OCI 6,924,354 7,311,736 14,236,090 8,473,967 8,542,586 17,016,553
Investment in subsidiary companies - 6,513,048 6,513,048 - - -
Investment in associate companies - 92,988 92,988 - 447,035 447,035
Investment properties - 2,648,784 2,648,784 - 117,276 117,276
Property, Plant and Equipment - 25,579,065 25,579,065 - 39,486,380 39,486,380
Right of Use Assets/ Leasehold properties - 3,479,937 3,479,937 - 2,187,622 2,187,622
Intangible assets - 1,127,007 1,127,007 - 1,361,858 1,361,858
Deferred tax assets - - - - 511,936 511,936
Other assets 35,644,359 26,936,043 62,580,402 36,980,941 26,945,119 63,926,060
Total assets 1,078,845,413 1,336,271,216 2,415,116,629 1,100,611,339 1,361,872,273 2,462,483,612
Percentage (%) 44.7% 55.3% 100.0% 44.7% 55.3% 100.0%

About this Report / Performance Highlights 2019 / Chairman’s Message / General Manager’s Review / Organisational Overview / Strategic Report / Performance and Outlook / Stakeholder Value Creation / Financial Reports / Compliance Annexes / Supplementary Information
297
Bank Group
As at 31 December 2019Within
12 monthsAfter
12 monthsTotal Within
12 monthsAfter
12 monthsTotal
LKR ’000 LKR ’000 LKR ’000 LKR ’000 LKR ’000 LKR ’000
Liabilities
Due to banks 2,669,407 - 2,669,407 2,932,950 - 2,932,950
Securities sold under repurchase agreements 34,183,210 - 34,183,210 34,880,507 - 34,880,507
Derivative financial instruments 106,677 - 106,677 106,677 - 106,677
Financial liabilities at amortised cost - due to depositors
1,932,642,258 72,569,536
2,005,211,794
1,945,623,686 79,580,347
2,025,204,033
Financial liabilities at amortised cost - other borrowings 137,833,543 - 137,833,543 111,688,196 33,407,066 145,095,262
Debt securities issued - - - - 2,107,810 2,107,810
Current tax liabilities - - - 138,677 - 138,677
Deferred tax liabilities - 4,592,021 4,592,021 - 7,182,866 7,182,866
Insurance provision - Life - - - 511,091 - 511,091
Insurance provision - Non life - - - 358,504 - 358,504
Other liabilities 18,170,176 15,845,512 34,015,688 17,715,049 17,042,995 34,758,044
Subordinated liabilities 4,877,797 49,343,755 54,221,552 4,877,797 49,333,745 54,211,542
Equity 1,976,602 140,306,135 142,282,737 2,538,143 152,457,506 154,995,649
Total liabilities and Equity 2,132,459,670 282,656,959 2,415,116,629 2,121,371,277 341,112,335 2,462,483,612
Percentage (%) 88.3% 11.7% 100.0% 86.1% 13.9% 100.0%
Net gap (1,053,614,257) 1,053,614,257 - (1,020,759,938) 1,020,759,938 -

BA
NK
OF
CE
YL
ON
AN
NU
AL
RE
PO
RT
20
19
Notes to the Financial Statements298
About this Report / Performance Highlights 2019 / Chairman’s Message / General Manager’s Review / Organisational Overview / Strategic Report / Performance and Outlook / Stakeholder Value Creation / Financial Reports / Compliance Annexes / Supplementary Information
The analysis of total assets and liabilities of the Bank and the Group into relevant maturity groupings based on the remaining period as at 31 December 2018 in to the contractual maturity date, is given in the table below:
Bank Group
As at 31 December 2018 Within12 months
After12 months
Total Within12 months
After12 months
Total
LKR ’000 LKR ’000 LKR ’000 LKR ’000 LKR ’000 LKR ’000
Assets
Cash and cash equivalents 78,447,577 - 78,447,577 78,558,031 - 78,558,031
Balances with Central Banks 65,680,371 - 65,680,371 65,680,371 - 65,680,371
Placements with banks 36,298,153 4,151,936 40,450,089 37,529,974 4,151,936 41,681,910
Securities purchased under resale agreements - - - 1,436,068 - 1,436,068
Derivative financial instruments 1,205,657 - 1,205,657 1,205,657 - 1,205,657
Financial assets measured at fair value through profit or loss 9,277,298 - 9,277,298 9,583,327 - 9,583,327
Financial assets measured at amortised cost - loans and advances 621,542,807 807,564,374
1,429,107,181 627,922,972 832,695,616
1,460,618,588
Financial assets measured at amortised cost - debt instruments 208,601,166 343,238,283 551,839,449 210,852,209 342,180,941 553,033,150
Financial assets measured at fair value through OCI 16,699,582 - 16,699,582 19,338,783 - 19,338,783
Investment in subsidiary companies - 6,513,048 6,513,048 - - -
Investment in associate companies - 92,988 92,988 - 441,226 441,226
Investment properties - 2,765,856 2,765,856 - 120,182 120,182
Property, Plant and Equipment - 24,178,155 24,178,155 - 37,762,509 37,762,509
Leasehold properties - 98,899 98,899 - 130,500 130,500
Intangible assets - 1,238,186 1,238,186 - 1,456,630 1,456,630
Deferred tax assets - - - - 3,052 3,052
Other assets 42,343,470 14,893,267 57,236,737 43,616,694 14,932,875 58,549,569
Total assets 1,080,096,081 1,204,734,992 2,284,831,073 1,095,724,086 1,233,875,467 2,329,599,553
Percentage (%) 47.3% 52.7% 100.0% 47.0% 53.0% 100.0%

About this Report / Performance Highlights 2019 / Chairman’s Message / General Manager’s Review / Organisational Overview / Strategic Report / Performance and Outlook / Stakeholder Value Creation / Financial Reports / Compliance Annexes / Supplementary Information
299
Bank Group
As at 31 December 2018 Within12 months
After12 months
Total Within12 months
After12 months
Total
LKR ’000 LKR ’000 LKR ’000 LKR ’000 LKR ’000 LKR ’000
Liabilities
Due to banks 2,402,468 - 2,402,468 2,515,998 - 2,515,998
Securities sold under repurchase agreements 97,399,359 - 97,399,359 97,423,302 - 97,423,302
Derivative financial instruments 509,018 - 509,018 509,018 - 509,018
Financial liabilities at amortised cost - due to depositors
1,736,922,255 34,052,591
1,770,974,846
1,747,661,855 42,262,514
1,789,924,369
Financial liabilities at amortised cost - other borrowings 201,792,174 - 201,792,174 200,794,306 6,259,368 207,053,674
Debt securities issued - - - 2,789,727 1,315,954 4,105,681
Current tax liabilities 3,922,189 - 3,922,189 4,039,380 - 4,039,380
Deferred tax liabilities - 5,073,526 5,073,526 - 7,762,214 7,762,214
Insurance provision - Life - - - 575,625 - 575,625
Insurance provision - Non life - - - 366,618 - 366,618
Other liabilities 15,235,113 4,525,317 19,760,430 16,768,125 5,202,614 21,970,739
Subordinated liabilities 6,993,714 43,833,525 50,827,239 6,660,972 43,823,515 50,484,487
Equity 1,838,194 130,331,630 132,169,824 13,202,256 129,666,192 142,868,448
Total liabilities and Equity 2,067,014,484 217,816,589 2,284,831,073 2,093,307,182 236,292,371 2,329,599,553
Percentage (%) 90.5% 9.5% 100.0% 89.9% 10.1% 100.0%
Net gap (986,918,403) 986,918,403 - (997,583,096) 997,583,096 -

BA
NK
OF
CE
YL
ON
AN
NU
AL
RE
PO
RT
20
19
Notes to the Financial Statements300
About this Report / Performance Highlights 2019 / Chairman’s Message / General Manager’s Review / Organisational Overview / Strategic Report / Performance and Outlook / Stakeholder Value Creation / Financial Reports / Compliance Annexes / Supplementary Information
59 Related Party DisclosuresThe Bank has entered into transactions with the parties who are defined as related parties in Sri Lanka Accounting Standard - LKAS 24 - “Related Party Disclosures”. i.e. significant investors, Subsidiary and Associate companies, post employment benefit plans for the Bank's employees, Key Management Personnel (KMPs), Close Family Members (CFMs) of KMPs and other related entities. Those transactions include lending activities, acceptance and placements, off-balance sheet transactions and provision of other banking and financial services that are carried out in the ordinary course of business on an arm's length basis at commercial rates, except for the transactions that KMPs have availed under schemes uniformly applicable to all the staff at concessionary rates.
59.1 Parent and the Ultimate Controlling Party
Bank of Ceylon is a Government owned bank.
59.2 Key Management Personnel (KMPs) and their Close Family Members (CFMs)
59.2.1 Compensation to Key Management Personnel (KMPs) and their Close Family Members (CFMs)
As per the Sri Lanka Accounting Standard -LKAS 24 - “Related Party Disclosures”, the KMPs include those who are having authority and responsibility for planning, directing and controlling the activities of the Bank. Accordingly, the Board of Directors and selected key members of the Corporate Management are identified as KMPs who meet the above criteria.
CFMs are defined as family members who may be expected to influence or be influenced by, that KMP in their dealings with the entity, i.e. spouse, children under 18 years of age and dependants of KMPs. Dependant is defined as anyone who depends on the respective KMP for more than 50% of his or her financial needs.
Compensation to KMPs of the Bank
Bank Group
For the year ended 31 December 2019 2018 2019 2018
LKR ’000 LKR ’000 LKR ’000 LKR ’000
Short term employment benefits 23,461 20,749 23,913 21,646
Post employment benefits 6,054 4,867 6,054 4,867
Total 29,515 25,616 29,967 26,513
In addition to the above, the Bank/ Group has also provided non cash benefits to the KMPs in line with the approved benefit plans of the Bank/ Group.
59.2.2 Transactions, Arrangements and Agreements Involving Key Management Personnel (KMPs) and their Close Family
Members (CFMs).
a) Items in Statement of Profit or Loss
KMPs & CFMs
For the year ended 31 December 2019 2018
LKR ’000 LKR ’000
Interest income 368 732
Interest expenses 4,735 3,555

About this Report / Performance Highlights 2019 / Chairman’s Message / General Manager’s Review / Organisational Overview / Strategic Report / Performance and Outlook / Stakeholder Value Creation / Financial Reports / Compliance Annexes / Supplementary Information
301
(b) Items in Statement of Financial Position
KMPs & CFMs
As at 31 December 2019 2018
LKR ’000 LKR ’000
Assets
Loans 3,897 4,462
Credit cards 14 88
3,911 4,550
Liabilities
Due to depositors 26,214 14,347
26,214 14,347
(c ) Off Balance Sheet Items
KMPs & CFMs
As at 31 December 2019 2018
LKR ’000 LKR ’000
Undrawn facilities 736 662
736 662
(d) Average Accommodations/ Due to Depositors Balances
KMPs & CFMs
As at 31 December 2019 2018
LKR ’000 LKR ’000
Loans 3,636 9,693
Due to depositors 49,578 48,281
59.3 Transactions with Group Related Parties
The Group related parties include the Subsidiaries and Associates of the Bank.
59.3.1 Transactions with Subsidiaries and Associate Companies of the Bank
The aggregate amount of income and expenses arising from the transactions during the year and amount due to and due from the relevant related parties and total contract sum of off balance sheet transactions at the year end are summarised below:
(a) Items in Statement of Profit or Loss
Subsidiary Companies Associate Companies
For the year ended 31 December 2019 2018 2019 2018
LKR ’000 LKR ’000 LKR ’000 LKR ’000
Interest income 257,106 192,455 24,652 26,902
Interest expenses 232,227 331,339 18,861 24,334
Other income 392,567 344,756 35,300 18,300
Other expenses 1,064,817 907,613 56,485 37,732

BA
NK
OF
CE
YL
ON
AN
NU
AL
RE
PO
RT
20
19
Notes to the Financial Statements302
About this Report / Performance Highlights 2019 / Chairman’s Message / General Manager’s Review / Organisational Overview / Strategic Report / Performance and Outlook / Stakeholder Value Creation / Financial Reports / Compliance Annexes / Supplementary Information
(b) Items in Statement of Financial Position
Subsidiary Companies Associate Companies
As at 31 December 2019 2018 2019 2018
LKR ’000 LKR ’000 LKR ’000 LKR ’000
Assets
Loans 2,384,660 1,521,365 125,488 175,012
Overdrafts 90,132 423,292 3,958 -
Investments in debts and government securities 17,386 123,789 - -
Placements 32,366,929 31,326,385 - -
Other receivables 803,668 747,290 - -
35,662,775 34,142,121 129,446 175,012
Liabilities
Due to depositors 4,244,340 3,130,848 194,331 272,036
Securities sold under repurchase agreements 236,623 142,952 39,506 26,005
Debentures 10,222 343,036 - -
Other liabilities 16,490 2,933 - -
4,507,675 3,619,769 233,838 298,041
(c ) Off Balance Sheet Items
Subsidiary Companies Associate Companies
As at 31 December 2019 2018 2019 2018
LKR ’000 LKR ’000 LKR ’000 LKR ’000
Guarantees 6,971 5,850 - 114
Undrawn facilities 289,968 202,695 6,042 10,000
296,939 208,545 6,042 10,114
(d) Average Accommodations/ Due to Depositor Balances
Subsidiary Companies Associate Companies
As at 31 December 2019 2018 2019 2018
LKR ’000 LKR ’000 LKR ’000 LKR ’000
Loans 1,761,071 1,080,754 143,125 196,208
Overdrafts 152,749 106,442 18,980 136
Due to depositors 3,640,755 2,833,259 217,637 255,057
59.3.2 Transactions with Subsidiaries and Associate Companies of the Group
In addition to the transactions between the Bank and its Subsidiaries and Associate companies, transactions which were taken place between the Subsidiaries and Associate companies are also included in the section below:
(a) Items in Statement of Profit or Loss
Subsidiary Companies Associate Companies
For the year ended 31 December 2019 2018 2019 2018
LKR ’000 LKR ’000 LKR ’000 LKR ’000
Interest income 310,623 238,339 24,652 29,126
Interest expense 285,744 379,447 18,861 24,334
Other income 665,866 537,948 317,268 484,715
Other expenses 1,338,116 1,566,798 56,485 38,155

About this Report / Performance Highlights 2019 / Chairman’s Message / General Manager’s Review / Organisational Overview / Strategic Report / Performance and Outlook / Stakeholder Value Creation / Financial Reports / Compliance Annexes / Supplementary Information
303
(b) Items in Statement of Financial Position
Subsidiary Companies Associate Companies
As at 31 December 2019 2018 2019 2018
LKR ’000 LKR ’000 LKR ’000 LKR ’000
Assets
Loans 2,643,206 1,810,807 125,488 175,012
Overdrafts 90,132 423,292 3,958 -
Investments in debts and government securities 17,786 123,789 - -
Placements 32,366,929 31,326,385 - -
Other receivables 804,321 749,398 - 15,143
35,922,374 34,443,671 129,446 190,155
Liabilities
Due to depositors 4,502,886 3,193,405 194,331 272,036
Securities sold under repurchase agreements 236,623 142,952 39,506 26,005
Debentures 10,222 343,036 - -
Other liabilities 17,143 247,069 - -
4,766,874 3,926,462 233,838 298,041
(c) Off Balance Sheet Items
Subsidiary Companies Associate Companies
As at 31 December 2019 2018 2019 2018
LKR ’000 LKR ’000 LKR ’000 LKR ’000
Guarantees 6,971 5,850 - 114
Undrawn facilities 289,968 202,695 6,042 10,000
296,939 208,545 6,042 10,114
(d) Average Accommodations/ Due to Depositors Balances
Subsidiary Companies Associate Companies
As at 31 December 2019 2018 2019 2018
LKR ’000 LKR ’000 LKR ’000 LKR ’000
Loans 1,761,071 1,080,754 143,125 196,208
Overdrafts 152,749 106,442 18,980 136
Due to depositors 3,640,755 2,833,259 217,637 255,057
59.4 Transactions with the Significant Investors having Significant Influence Over the Bank and the Post Employment Benefit Plans For Bank's Employees.
Significant investor of the Bank is the Government as it is a state owned entity. The Government refers to the Government of Sri Lanka, Government Corporations, Provincial Councils, Local Government bodies, other Government entities and their subsidiaries.

BA
NK
OF
CE
YL
ON
AN
NU
AL
RE
PO
RT
20
19
Notes to the Financial Statements304
About this Report / Performance Highlights 2019 / Chairman’s Message / General Manager’s Review / Organisational Overview / Strategic Report / Performance and Outlook / Stakeholder Value Creation / Financial Reports / Compliance Annexes / Supplementary Information
Post employment benefit plans are arrangements made by the Bank to provide post employment benefits for its employees.
Transactions and arrangements entered in to by the Bank with the Government and Government controlled entities (significant investor) and post employment benefit plans which are individually significant and for other transactions that are collectively, but not individually significant are as follows:
59.4.1 Transactions which are Collectively Significant
(a) Items in Statement of Profit or Loss
Significant Investor Post Employment Benefit Plans
For the year ended 31 December 2019 2018 2019 2018
LKR ’000 LKR ’000 LKR ’000 LKR ’000
Interest income 96,203,394 85,557,414 1 191
Other income 1,037,170 779,941 2,262 2,684
Interest expenses 24,313,434 19,781,347 7,524,264 7,920,439
Dividends paid 346,410 4,846,410 - -
Contribution made - - 691,228 808,095
(b) Items in Statement of Financial Position
Significant Investor Post Employment Benefit Plans
As at 31 December 2019 2018 2019 2018
LKR ’000 LKR ’000 LKR ’000 LKR ’000
Assets
Loans and advances 710,906,986 562,326,026 - -
Investment in securities and bonds 571,299,788 551,493,826 - -
Investment in equity instruments 4,134,884 2,314,096 - -
1,286,341,658 1,116,133,948 - -
Liabilities
Due to depositors 325,541,751 205,973,794 58,032,070 52,068,600
Securities sold under repurchase agreements 27,377,500 89,458,909 5,001 709,373
Debentures 21,679,286 17,855,880 27,538,561 26,978,890
374,598,537 313,288,583 85,575,632 79,756,863
(c ) Off Balance Sheet Items
Significant Investor
As at 31 December 2019 2018
LKR ’000 LKR ’000
Letters of credit 85,619,571 75,222,871
Bills and acceptances 84,731,854 100,117,751
Guarantees 3,280,252 5,033,214
Forward exchange contracts 2,179,608 9,137,495
175,811,285 189,511,331

About this Report / Performance Highlights 2019 / Chairman’s Message / General Manager’s Review / Organisational Overview / Strategic Report / Performance and Outlook / Stakeholder Value Creation / Financial Reports / Compliance Annexes / Supplementary Information
305
(d) Other transactions
Significant Investor
For the year ended 31 December 2019 2018
LKR ’000 LKR ’000
Gross foreign exchange transactions
- Sales 770,007,243 218,146,217
- Purchases 241,913,592 175,716,180
(e) Average Accommodations/ Due to Depositors Balances
Significant Investor Post Employment Benefit Plans
As at 31 December 2019 2018 2019 2018
LKR ’000 LKR ’000 LKR ’000 LKR ’000
Loans and advances 438,916,016 358,655,760 - -
Due to depositors 281,458,414 194,035,460 50,505,121 48,476,463
Off balance sheet facilities 179,335,686 182,860,088 - -
59.4.2 Transactions which are Individually Significant
The Bank uses internal assessment methodology in order to identify significance of the transactions with the Government and Government related entities. Accordingly, the transactions which have been considered in normal day to day business operations which are carried on normal market conditions are considered as individually significant transactions.
The Government has issued Treasury Guarantees of LKR 292,318 million and Comfort Letters of LKR 38,689 million as of 31 December 2019 against the loan facilities granted to State Owned Enterprises (SOEs).
59.4.3 Transactions with the Significant Investor - Group
Other than the transactions carried out by the Bank and balances held by the Bank with the Government, Subsidiaries of the Group have carried out following transactions with the Government and balances held with the Government as follows:
Significant investor
For the year ended 31 December 2019 2018
LKR ’000 LKR ’000
Investment in securities and bonds 2,577,680 1,863,397
Nostro balance with Central Bank of Sri Lanka 213,982 208,065
Income from investments in securities and bonds 266,748 122,142
Apart from the transactions listed above, the Group carried out transactions with the Government of Sri Lanka and other Government related entities in the form of providing services, investments in shares for trading purpose and other financial service transactions including inter bank placements during the year ended 31 December 2019 on comparable terms, which are applicable to transactions between the Group and its unrelated customers.

BA
NK
OF
CE
YL
ON
AN
NU
AL
RE
PO
RT
20
19
Notes to the Financial Statements306
About this Report / Performance Highlights 2019 / Chairman’s Message / General Manager’s Review / Organisational Overview / Strategic Report / Performance and Outlook / Stakeholder Value Creation / Financial Reports / Compliance Annexes / Supplementary Information
60 Financial Reporting by SegmentSegmental information is presented in respect of Group business distinguishing the component of the Group that is engaged in different business segments or operations within a particular economic environment, which is subject to risk and returns that are different from those of other segments.
60.1 Primary Segment Information - Operating Segments - Group
An operating segment is a component of the Group that engages in business activities, from which it may earn revenues and incur expenses, including revenues and expenses that relating to transactions with any of the Group’s other components, whose operating results are reviewed by the management to make decision about resource allocation to each segment and assess its performance.
The Group comprises the following major business segments:
Retail banking, Corporate banking, International, Treasury and Investments, other non-banking and Group functions.
The management monitors the operating results of its business segments separately for the purpose of making decisions about resources allocation and performance assessment. Segment performance are evaluated based on their operating profits or losses. VAT, NBT and Income tax are managed on a Group basis and are not allocated to operating segments.
Retail banking Corporate banking
International, Treasury and
Investment Group Function Unallocated Total
For the year ended 31 December 2019 2018 2019 2018 2019 2018 2019 2018 2019 2018 2019 2018
LKR ’000 LKR ’000 LKR ’000 LKR ’000 LKR ’000 LKR ’000 LKR ’000 LKR ’000 LKR ’000 LKR ’000 LKR ’000 LKR ’000
Revenue from external customers:
Net interest income 41,940,946 37,156,716 23,664,113 17,324,675 9,339,702 10,912,700 3,001,872 3,131,505 348,253 163,883 78,294,886 68,689,479
Net fee and commission income 6,912,248 5,169,814 3,126,414 3,457,238 1,337,597 1,353,000 360,570 374,367 720,548 690,459 12,457,377 11,044,878
Other income 1,707,141 2,461,470 284,152 4,547,223 2,070,020 5,511,354 3,430,089 2,949,301 (1,146,759) (1,233,112) 6,344,643 14,236,236
Total operating income 50,560,335 44,788,000 27,074,679 25,329,136 12,747,319 17,777,054 6,792,531 6,455,173 (77,958) (378,770) 97,096,906 93,970,593
Impairment (charge)/ reversal for loans and other losses (7,714,890) (6,134,067) (10,053,090) (8,231,451) (444,765) (387,173) 193,355 (156,644) (699,853) (267,137) (18,719,243) (15,176,472)
Other operating expenses (23,089,559) (21,345,036) (4,818,779) (4,606,978) (4,074,497) (4,480,900) (5,245,701) (4,831,923) 328,804 240,569 (36,899,732) (35,024,268)
Total expenses (30,804,449) (27,479,103) (14,871,869) (12,838,429) (4,519,262) (4,868,073) (5,052,346) (4,988,567) (371,049) (26,568) (55,618,975) (50,200,740)
Operating profit before taxes on financil services 19,755,886 17,308,897 12,202,810 12,490,707 8,228,057 12,908,981 1,740,185 1,466,606 (449,007) (405,338) 41,477,931 43,769,853
Taxes on financial services (10,850,549) (9,818,020)
Operating profit after taxes on financil services 30,627,382 33,951,833
Share of profit/ (loss) of associate companies, net of tax 48,187 9,269 48,187 9,269
Profit/ (loss) before income tax 19,755,886 17,308,897 12,202,810 12,490,707 8,228,057 12,908,981 1,788,372 1,475,875 (449,007) (405,338) 30,675,569 33,961,102
Income tax expense (6,928,234) (12,922,017)
Profit for the year 23,747,335 21,039,085
Total assets 730,854,671 690,006,673 881,919,695 833,652,003 668,242,204 643,023,679 88,371,147 80,509,176 93,095,895 82,408,022 2,462,483,612 2,329,599,553
Total liabilities 687,797,536 650,092,099 829,962,806 785,428,028 628,873,782 605,826,913 74,710,198 69,357,319 86,143,641 76,026,746 2,307,487,963 2,186,731,105
Cash flows from/ (used in) operating activities 21,037,202 (12,418,508) 11,869,707 (5,790,249) 4,684,711 (3,647,240) 1,505,712 (1,046,611) 174,681 (54,772) 39,272,013 (22,957,380)
Cash flows from/ (used in) investing activities 13,503,126 5,086,779 7,618,795 2,371,760 3,006,970 1,493,956 966,470 428,705 112,122 22,436 25,207,483 9,403,636
Cash flows from/ (used in) financing activities (23,502,086) 4,233,348 (28,359,882) 5,114,645 (21,488,657) 3,945,097 (2,552,852) 451,649 (2,943,534) 495,080 (78,847,011) 14,239,819
Capital expenditure to non current assets 4,106,171 4,360,302
Depreciation and amortisation expenses 1,120,894 664,477 1,352,578 802,807 1,024,866 619,232 71,140 269,497 205,666 457,456 3,775,144 2,813,469
Being the major customer of the Bank, “Government & State Owned Enterprises (SOEs)” represents 20% of revenue of the bank, (2018 : 17%) and included under Retail and Corporate segments. More details are given in the Note 59 - “Related Party Disclosures”

About this Report / Performance Highlights 2019 / Chairman’s Message / General Manager’s Review / Organisational Overview / Strategic Report / Performance and Outlook / Stakeholder Value Creation / Financial Reports / Compliance Annexes / Supplementary Information
307
Retail banking Corporate banking
International, Treasury and
Investment Group Function Unallocated Total
For the year ended 31 December 2019 2018 2019 2018 2019 2018 2019 2018 2019 2018 2019 2018
LKR ’000 LKR ’000 LKR ’000 LKR ’000 LKR ’000 LKR ’000 LKR ’000 LKR ’000 LKR ’000 LKR ’000 LKR ’000 LKR ’000
Revenue from external customers:
Net interest income 41,940,946 37,156,716 23,664,113 17,324,675 9,339,702 10,912,700 3,001,872 3,131,505 348,253 163,883 78,294,886 68,689,479
Net fee and commission income 6,912,248 5,169,814 3,126,414 3,457,238 1,337,597 1,353,000 360,570 374,367 720,548 690,459 12,457,377 11,044,878
Other income 1,707,141 2,461,470 284,152 4,547,223 2,070,020 5,511,354 3,430,089 2,949,301 (1,146,759) (1,233,112) 6,344,643 14,236,236
Total operating income 50,560,335 44,788,000 27,074,679 25,329,136 12,747,319 17,777,054 6,792,531 6,455,173 (77,958) (378,770) 97,096,906 93,970,593
Impairment (charge)/ reversal for loans and other losses (7,714,890) (6,134,067) (10,053,090) (8,231,451) (444,765) (387,173) 193,355 (156,644) (699,853) (267,137) (18,719,243) (15,176,472)
Other operating expenses (23,089,559) (21,345,036) (4,818,779) (4,606,978) (4,074,497) (4,480,900) (5,245,701) (4,831,923) 328,804 240,569 (36,899,732) (35,024,268)
Total expenses (30,804,449) (27,479,103) (14,871,869) (12,838,429) (4,519,262) (4,868,073) (5,052,346) (4,988,567) (371,049) (26,568) (55,618,975) (50,200,740)
Operating profit before taxes on financil services 19,755,886 17,308,897 12,202,810 12,490,707 8,228,057 12,908,981 1,740,185 1,466,606 (449,007) (405,338) 41,477,931 43,769,853
Taxes on financial services (10,850,549) (9,818,020)
Operating profit after taxes on financil services 30,627,382 33,951,833
Share of profit/ (loss) of associate companies, net of tax 48,187 9,269 48,187 9,269
Profit/ (loss) before income tax 19,755,886 17,308,897 12,202,810 12,490,707 8,228,057 12,908,981 1,788,372 1,475,875 (449,007) (405,338) 30,675,569 33,961,102
Income tax expense (6,928,234) (12,922,017)
Profit for the year 23,747,335 21,039,085
Total assets 730,854,671 690,006,673 881,919,695 833,652,003 668,242,204 643,023,679 88,371,147 80,509,176 93,095,895 82,408,022 2,462,483,612 2,329,599,553
Total liabilities 687,797,536 650,092,099 829,962,806 785,428,028 628,873,782 605,826,913 74,710,198 69,357,319 86,143,641 76,026,746 2,307,487,963 2,186,731,105
Cash flows from/ (used in) operating activities 21,037,202 (12,418,508) 11,869,707 (5,790,249) 4,684,711 (3,647,240) 1,505,712 (1,046,611) 174,681 (54,772) 39,272,013 (22,957,380)
Cash flows from/ (used in) investing activities 13,503,126 5,086,779 7,618,795 2,371,760 3,006,970 1,493,956 966,470 428,705 112,122 22,436 25,207,483 9,403,636
Cash flows from/ (used in) financing activities (23,502,086) 4,233,348 (28,359,882) 5,114,645 (21,488,657) 3,945,097 (2,552,852) 451,649 (2,943,534) 495,080 (78,847,011) 14,239,819
Capital expenditure to non current assets 4,106,171 4,360,302
Depreciation and amortisation expenses 1,120,894 664,477 1,352,578 802,807 1,024,866 619,232 71,140 269,497 205,666 457,456 3,775,144 2,813,469
Being the major customer of the Bank, “Government & State Owned Enterprises (SOEs)” represents 20% of revenue of the bank, (2018 : 17%) and included under Retail and Corporate segments. More details are given in the Note 59 - “Related Party Disclosures”

BA
NK
OF
CE
YL
ON
AN
NU
AL
RE
PO
RT
20
19
Notes to the Financial Statements308
About this Report / Performance Highlights 2019 / Chairman’s Message / General Manager’s Review / Organisational Overview / Strategic Report / Performance and Outlook / Stakeholder Value Creation / Financial Reports / Compliance Annexes / Supplementary Information
60.2 Secondary Segment Information - Geographical Segments
Geographical segments provide products or services within a particular economic environment where risk and returns are different from those of other economic environments.
These segment comprise Domestic Operations, Offshore Banking Division and Overseas Banking Units.
Bank Group
2019 2018 2019 2018
LKR ’000 % LKR ’000 % LKR ’000 % LKR ’000 %
Assets
Domestic Banking Unit 2,147,379,069 88.9 1,975,612,402 86.5 2,154,523,555 87.5 1,983,673,155 85.3
Offshore Banking Division 218,618,929 9.1 259,302,812 11.3 218,618,929 8.9 259,302,812 11.2
Overseas Banking Units 49,118,631 2.0 49,915,859 2.2 89,341,128 3.6 86,623,586 3.5
Total Assets 2,415,116,629 100.0 2,284,831,073 100.0 2,462,483,612 100.0 2,329,599,553 100.0
Total Income
Domestic Banking Unit 203,743,426 85.2 194,098,293 87.8 212,578,093 85.5 201,829,531 88.1
Offshore Banking Division 27,685,601 11.6 21,218,379 9.6 27,685,601 11.1 21,218,379 9.3
Overseas Banking Units 7,687,442 3.2 5,704,021 2.6 8,428,309 3.4 6,303,228 2.6
Total Income 239,116,469 100.0 221,020,693 100.0 248,692,003 100.0 229,351,138 100.0
Profit Before Tax
Domestic Banking Unit 16,977,329 57.2 23,758,143 71.1 17,942,479 58.5 24,284,728 71.5
Offshore Banking Division 6,766,962 22.8 7,110,700 21.3 6,766,962 22.1 7,110,700 20.9
Overseas Banking Units 5,940,936 20.0 2,547,242 7.6 5,966,128 19.4 2,565,674 7.6
Total Profit Before Tax 29,685,227 100.0 33,416,085 100.0 30,675,569 100.0 33,961,102 100.0
Profit After Tax
Domestic Banking Unit 13,720,830 59.4 13,657,359 65.0 14,344,937 60.4 13,675,352 65.0
Offshore Banking Division 4,872,213 21.1 5,119,704 24.4 4,872,213 20.5 5,119,704 24.3
Overseas Banking Units 4,504,992 19.5 2,225,597 10.6 4,530,185 19.1 2,244,029 10.7
Total Profit After Tax 23,098,035 100.0 21,002,660 100.0 23,747,335 100.0 21,039,085 100.0

About this Report / Performance Highlights 2019 / Chairman’s Message / General Manager’s Review / Organisational Overview / Strategic Report / Performance and Outlook / Stakeholder Value Creation / Financial Reports / Compliance Annexes / Supplementary Information
309
61 Fair Values of Assets and Liabilities
Accounting Policy
“Fair value” is the price that would be received to sell an asset or paid to transfer a liability (exit price) in an orderly transaction between market participants at the measurement date in the principal or, in its absence, the most advantageous market to which the Group has access at that date. The fair value of a liability reflects its non-performance risk.
The fair value measurement is based on the presumption that the transaction to sell the asset or transfer the liability takes place either:
- in the principal market for the asset or liability or
- in the absence of a principal market, in the most advantageous market for the asset or liability.
All assets and liabilities for which fair value is measured or disclosed in the Financial Statements are categorised within the fair value hierarchy, described as follows, based on the lowest level input that is significant to the fair value measurement as a whole:
Level 1 - Valuation technique using quoted market price:
Financial instruments with quoted prices for identical instruments in active markets.
Level 2 - Valuation technique using observable inputs:
Financial instruments with quoted prices for similar instruments in active markets or quoted prices for identical or similar instruments in inactive markets and financial instruments valued using models where all significant inputs are observable.
Level 3 - Valuation technique with significant unobservable inputs:
Financial instruments valued using valuation techniques where one or more significant inputs are unobservable.
For all financial instruments where fair values are determined by referring to externally quoted prices or observable pricing inputs to models, independent price determination or validation is obtained. In an inactive market, direct observation of a traded price may not be possible. In these circumstances, the Bank uses alternative market information to validate the financial instrument's fair value, with greater weight given to information that is considered to be more relevant and reliable.
61.1 Assets and Liabilities Measured at Fair Value
Derivative Financial Instruments
All Derivative financial instruments are classified as Held for trading are valued using a valuation technique with market observable and market unobservable inputs. The most frequently applied valuation technique include forward foreign exchange spot and forward premiums.

BA
NK
OF
CE
YL
ON
AN
NU
AL
RE
PO
RT
20
19
Notes to the Financial Statements310
About this Report / Performance Highlights 2019 / Chairman’s Message / General Manager’s Review / Organisational Overview / Strategic Report / Performance and Outlook / Stakeholder Value Creation / Financial Reports / Compliance Annexes / Supplementary Information
Financial Assets Measured at Fair Value Through Profit or Loss
Financial instruments are classified as fair value through profit or loss consists Government securities, Quoted debt securities, Units in units trusts and Quoted equities. Government securities are valued using yield curve published by the Central Bank of Sri Lanka and the Bank uses quoted market prices in the active market for the valuation of quoted equities and quoted debt securities as at the Reporting date.Units in units trusts are valued using management buying price of such asset management company since it is the most relevant exit price of such assets.
Financial Assets Measured at Fair Value Through OCI
Financial investments are classified as fair value through OCI consists Government securities, Quoted equities and Unquoted equities.
- Government securities are valued using yield curve published by the Central Bank of Sri Lanka as at the Reporting date.
- The Bank uses quoted market prices in the active market for the valuation of quoted equities and quoted debt securities as at the Reporting date.
- Unquoted equites are carried at cost except Regional Development Bank investment in shares since it is the most reasonable value available to represents the price of such securities. Fair value of Regional Development Bank derived using an internal management valuation technique which details are given in Note 61.1.3.
Property, Plant and Equipment
Free hold lands and buildings and buildings on leasehold lands are carried at revalued amount less any subsequent accumulated depreciation and impairment losses.

About this Report / Performance Highlights 2019 / Chairman’s Message / General Manager’s Review / Organisational Overview / Strategic Report / Performance and Outlook / Stakeholder Value Creation / Financial Reports / Compliance Annexes / Supplementary Information
311
61.1.1 Assets Measured at Fair Value - Fair Value Hierarchy
Bank Group
As at 31 December 2019 Level 1 Level 2 Level 3 Total Level 1 Level 2 Level 3 Total
LKR ’000 LKR ’000 LKR ’000 LKR ’000 LKR ’000 LKR ’000 LKR ’000 LKR ’000
Financial Assets
Derivative Financial Instruments
Forward exchange contracts - 7,977 - 7,977 - 7,977 - 7,977
Currency SWAPs - - 124,113 124,113 - - 124,113 124,113
- 7,977 124,113 132,090 - 7,977 124,113 132,090
Financial Assets Recognised
Through Profit or Loss Measured
At Fair Value
Treasury bills 4,636,846 - - 4,636,846 4,636,846 - - 4,636,846
Treasury bonds 29,806 - - 29,806 721,341 - - 721,341
Quoted equities 2,596,152 - - 2,596,152 2,858,056 - - 2,858,056
Units in unit trusts - 2,792,611 - 2,792,611 - 2,834,926 - 2,834,926
Other debt securities - - - - 1,600 - - 1,600
7,262,804 2,792,611 - 10,055,415 8,217,843 2,834,926 - 11,052,769
Financial Assets Measured at Fair
Value Through OCI
Quoted Investments
Government securities
Treasury bills 6,343,043 - - 6,343,043 7,891,144 - - 7,891,144
Treasury bonds 1,881,395 - - 1,881,395 2,203,866 - - 2,203,866
Other countries 1,445,693 - - 1,445,693 1,445,693 - - 1,445,693
Equities 2,808,684 - - 2,808,684 3,676,774 - - 3,676,774
Unquoted Investments
Equities - 1,527,968 229,307 1,757,275 - 1,527,968 271,108 1,799,076
12,478,815 1,527,968 229,307 14,236,090 15,217,477 1,527,968 271,108 17,016,553
Total Financial Assets 19,741,619 4,328,556 353,420 24,423,595 23,435,320 4,370,871 395,221 28,201,412
Non Financial Assets
Property, Plant and Equipment - - 19,261,983 19,261,983 - - 32,429,290 32,429,290
Total non Financial Assets - - 19,261,983 19,261,983 - - 32,429,290 32,429,290
Total 19,741,619 4,328,556 19,615,403 43,685,578 23,435,320 4,370,871 32,824,511 60,630,702
Financial Liabilities
Derivative Financial Instruments
Forward exchange contracts - 1,070 - 1,070 - 1,070 - 1,070
Currency SWAPs - - 105,607 105,607 - - 105,607 105,607
Total Financial Liabilities - 1,070 105,607 106,677 - 1,070 105,607 106,677

BA
NK
OF
CE
YL
ON
AN
NU
AL
RE
PO
RT
20
19
Notes to the Financial Statements312
About this Report / Performance Highlights 2019 / Chairman’s Message / General Manager’s Review / Organisational Overview / Strategic Report / Performance and Outlook / Stakeholder Value Creation / Financial Reports / Compliance Annexes / Supplementary Information
61.1.1 Assets Measured at Fair Value - Fair Value Hierarchy
Bank Group
As at 31 December 2018 Level 1 Level 2 Level 3 Total Level 1 Level 2 Level 3 Total
LKR ’000 LKR ’000 LKR ’000 LKR ’000 LKR ’000 LKR ’000 LKR ’000 LKR ’000
Financial Assets
Derivative Financial
Instruments
Forward exchange contracts - 28,897 - 28,897 - 28,897 - 28,897
Currency SWAPs - - 1,176,760 1,176,760 - - 1,176,760 1,176,760
- 28,897 1,176,760 1,205,657 - 28,897 1,176,760 1,205,657
Financial Assets Recognised
through Profit or Loss Measured
at Fair Value
Treasury bills 3,533,195 - - 3,533,195 3,533,195 - - 3,533,195
Treasury bonds 632,810 - - 632,810 632,810 - - 632,810
Quoted equities 2,507,508 - - 2,507,508 2,780,491 - - 2,780,491
Other debt securities - - - - 1,715 - - 1,715
Units in unit trusts - 2,603,785 - 2,603,785 - 2,635,116 - 2,635,116
6,673,513 2,603,785 - 9,277,298 6,948,211 2,635,116 - 9,583,327
Financial Assets Measured
at Fair Value through OCI
Quoted investments
Government securities
Treasury bills 4,550,469 - - 4,550,469 5,718,800 - - 5,718,800
Treasury bonds 6,178,278 - - 6,178,278 6,695,169 - - 6,695,169
Other countries 1,587,030 - - 1,587,030 1,587,030 - - 1,587,030
Equities 3,142,087 - - 3,142,087 4,050,702 - - 4,050,702
Unquoted investments
Equities - 1,012,411 229,307 1,241,718 - 1,012,411 274,671 1,287,082
15,457,864 1,012,411 229,307 16,699,582 18,051,701 1,012,411 274,671 19,338,783
Total Financial Assets 22,131,377 3,645,093 1,406,067 27,182,537 24,999,912 3,676,424 1,451,431 30,127,767
Non financial assets
Property, Plant and Equipment - - 18,458,592 18,458,592 - - 31,291,571 31,291,571
Total Non Financial Assets - - 18,458,592 18,458,592 - - 31,291,571 31,291,571
Total 22,131,377 3,645,093 19,864,659 45,641,129 24,999,912 3,676,424 32,743,002 61,419,338
Financial Liabilities Derivative
Financial Instruments
Forward exchange contracts - 31,736 - 31,736 - 31,736 - 31,736
Currency SWAPs - - 477,282 477,282 - - 477,282 477,282
Total Financial Liabilities - 31,736 477,282 509,018 - 31,736 477,282 509,018

About this Report / Performance Highlights 2019 / Chairman’s Message / General Manager’s Review / Organisational Overview / Strategic Report / Performance and Outlook / Stakeholder Value Creation / Financial Reports / Compliance Annexes / Supplementary Information
313
61.1.2 Movements in Level 3 Assets Measured at Fair Value
The following table shows a reconciliation of the opening and closing amounts of level 3 assets and liabilities which are recorded at fair value.
Bank Group
As at 1
January
2019
Total
Gains/
(Losses)
Recorded
in Profit or
Loss
Total
Gains/
(Losses)
Recorded
in OCI
Purchases
/ (Sales)
and Other
Adjustments
As at 31
December
2019
As at 1
January
2019
Total
Gains/
(Losses)
Recorded
in Profit or
loss
Total
Gains/
(Losses)
Recorded
in OCI
Purchases
/ (Sales)
and Other
Adjustments
As at 31
December
2019
LKR ’000 LKR ’000 LKR ’000 LKR ’000 LKR ’000 LKR ’000 LKR ’000 LKR ’000 LKR ’000 LKR ’000
Financial Assets
Derivative Financial Instruments
Currency SWAPs 1,176,760 - - (1,052,647) 124,113 1,176,760 - - (1,052,647) 124,113
Financial Assets Measured at Fair Value Through OCI
Unquoted Investments
Equities 229,307 - - - 229,307 274,671 (3,563) - - 271,108
Total Level 3 Financial Assets 1,406,067 - - (1,052,647) 353,420 1,451,431 (3,563) - (1,052,647) 395,221
Non Financial Assets
Property, Plant and Equipment 18,458,592 (188,835) 992,226 19,261,983 31,291,572 (745,778) 790,887 1,092,609 32,429,290
Total Level 3 Assets 19,864,659 (188,835) - (60,421) 19,615,403 32,743,003 (749,341) 790,887 39,962 32,824,511
Financial Liabilities
Currency SWAPs 477,282 - - (371,675) 105,607 477,282 - - (409,151) 68,131
Total Level 3 Financial Liabilities 477,282 - - (371,675) 105,607 477,282 - - (409,151) 68,131
Net Level 3 Financial Assets 928,785 - - (680,972) 247,813 974,149 (3,563) - (643,496) 327,090

BA
NK
OF
CE
YL
ON
AN
NU
AL
RE
PO
RT
20
19
Notes to the Financial Statements314
About this Report / Performance Highlights 2019 / Chairman’s Message / General Manager’s Review / Organisational Overview / Strategic Report / Performance and Outlook / Stakeholder Value Creation / Financial Reports / Compliance Annexes / Supplementary Information
61.1.2 Movements in Level 3 Assets Measured at Fair Value
The following table shows a reconciliation of the opening and closing amounts of level 3 assets and liabilities which are recorded at fair value.
Bank Group
As at 1 January
2018
Total Gains/
(Losses) Recorded in Profit or
Loss
Total Gains/
(Losses) Recorded
in OCI
Purchases / (Sales)
and Other Adjustments
As at 31 December
2018
As at 1 January
2018
Total Gains/
(Losses) Recorded in Profit or
Loss
Total Gains/
(Losses) Recorded
in OCI
Purchases / (Sales)
and Other Adjustments
As at 31 December
2018
LKR ’000 LKR ’000 LKR ’000 LKR ’000 LKR ’000 LKR ’000 LKR ’000 LKR ’000 LKR ’000 LKR ’000
Financial Assets
Derivative Financial Instruments
Currency SWAPs 1,614,535 - - (437,775) 1,176,760 1,614,535 - - (437,775) 1,176,760
Financial Assets Measured at Fair Value through OCI
Unquoted Investments
Equities 227,717 - - 1,590 229,307 279,272 - (6,190) 1,589 274,671
Total Level 3 Financial Assets 1,842,252 - - (436,185) 1,406,067 1,893,807 - (6,190) (436,186) 1,451,431
Non Financial Assets
Property, Plant and Equipment 18,030,186 (175,795) (337,522) 941,723 18,458,592 30,852,915 (721,771) 147,397 1,013,030 31,291,571
Total Level 3 Assets 19,872,438 (175,795) (337,522) 505,538 19,864,659 32,746,722 (721,771) 141,207 576,844 32,743,002
Financial Liabilities
Currency SWAPs 68,131 - - 409,151 477,282 68,131 - - 409,151 477,282
Total Level 3 Financial Liabilities 68,131 - - 409,151 477,282 68,131 - - 409,151 477,282
Net Level 3 Financial Assets 1,774,121 - - (845,336) 928,785 1,825,676 - (6,190) (845,337) 974,149

About this Report / Performance Highlights 2019 / Chairman’s Message / General Manager’s Review / Organisational Overview / Strategic Report / Performance and Outlook / Stakeholder Value Creation / Financial Reports / Compliance Annexes / Supplementary Information
315
61.1.3 Unobservable Inputs Used in Measuring Fair Value of Level 3
The table below sets out information about significant unobservable inputs used as at 31 December 2019 in measuring financial instruments categorised as level 3 in the fair value hierarchy.
Type of Financial Instrument Fair value As at 31
December 2019
LKR’000
Valuation Technique
Significant Unobservable Inputs
Range of Estimates (Weighted Average) for Unobservable Inputs
Fair Value Measurement Sensitivity to Unobservable Inputs
Derivative Financial Instruments
Currency SWAPs 124,113 Forward pricing model
Foreign exchange forward rate.
Negative 0.01 to positive 0.01 basis point.
Unfavourable or favourable impact on derivative assets value of LKR 1.2 million respectively.
Discount for counterparty
credit risk.
Financial Assets Measured at Fair Value Through OCI
Unquoted Equity Shares
Regional Development Bank 162,300 Discounted Cash Flow method
Constant Dividend model
Decreased by 5% and increased by 5% for existing cost of capital.
Impact to the fair value will be within negative and positive LKR 8.1 million no significant impact to the investment.
Credit Information Bureau of Sri Lanka
43,132 Value at cost* * Fair value cannot be reliably measured, These are investments in mutual entities that provide transaction processing and transaction services to members on a pricing basis intended to recover the entities operating cost.
Fitch Ratings Lanka Limited 625 Value at cost*
Lanka Clear (Private) Limited 21,000 Value at cost*
Lanka Financial Services Bureau Limited
2,250 Value at cost*
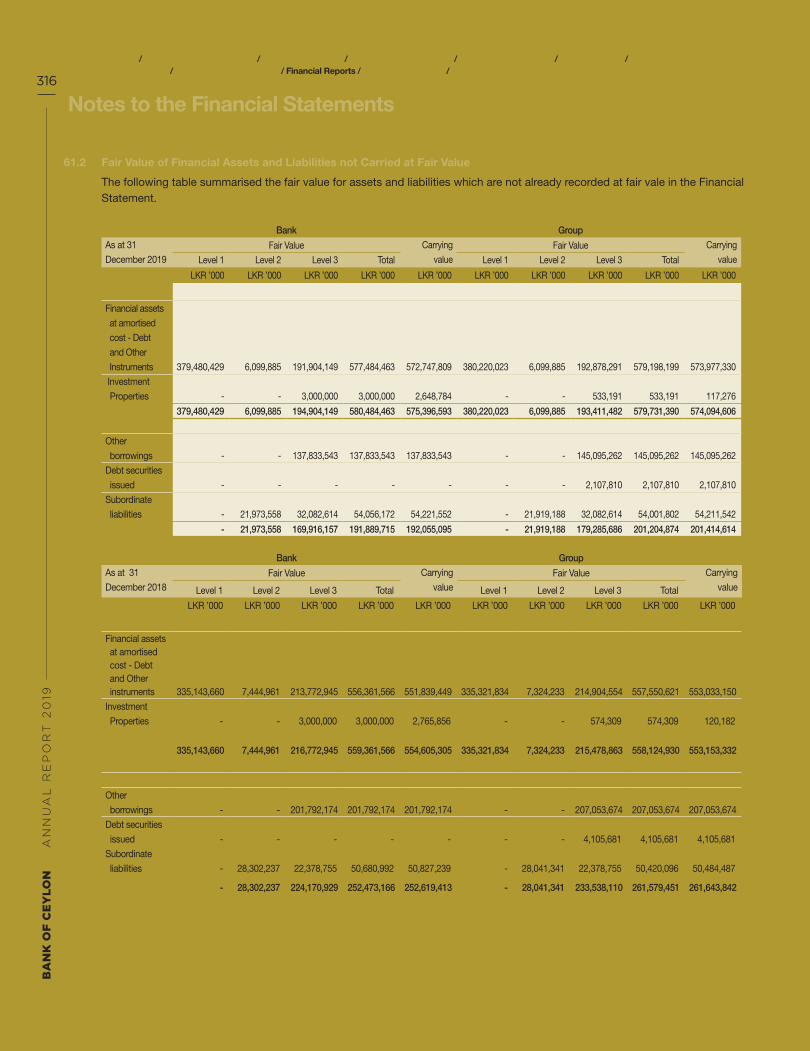
BA
NK
OF
CE
YL
ON
AN
NU
AL
RE
PO
RT
20
19
Notes to the Financial Statements316
About this Report / Performance Highlights 2019 / Chairman’s Message / General Manager’s Review / Organisational Overview / Strategic Report / Performance and Outlook / Stakeholder Value Creation / Financial Reports / Compliance Annexes / Supplementary Information
61.2 Fair Value of Financial Assets and Liabilities not Carried at Fair Value
The following table summarised the fair value for assets and liabilities which are not already recorded at fair vale in the Financial Statement.
Bank Group
As at 31
December 2019Fair Value Carrying
valueFair Value Carrying
valueLevel 1 Level 2 Level 3 Total Level 1 Level 2 Level 3 Total
LKR ’000 LKR ’000 LKR ’000 LKR ’000 LKR ’000 LKR ’000 LKR ’000 LKR ’000 LKR ’000 LKR ’000
Assets
Financial assets
at amortised
cost - Debt
and Other
Instruments 379,480,429 6,099,885 191,904,149 577,484,463 572,747,809 380,220,023 6,099,885 192,878,291 579,198,199 573,977,330
Investment
Properties - - 3,000,000 3,000,000 2,648,784 - - 533,191 533,191 117,276
Total 379,480,429 6,099,885 194,904,149 580,484,463 575,396,593 380,220,023 6,099,885 193,411,482 579,731,390 574,094,606
Liabilities
Other
borrowings - - 137,833,543 137,833,543 137,833,543 - - 145,095,262 145,095,262 145,095,262
Debt securities
issued - - - - - - - 2,107,810 2,107,810 2,107,810
Subordinate
liabilities - 21,973,558 32,082,614 54,056,172 54,221,552 - 21,919,188 32,082,614 54,001,802 54,211,542
Total - 21,973,558 169,916,157 191,889,715 192,055,095 - 21,919,188 179,285,686 201,204,874 201,414,614
Bank Group
As at 31
December 2018Fair Value Carrying
valueFair Value Carrying
valueLevel 1 Level 2 Level 3 Total Level 1 Level 2 Level 3 Total
LKR ’000 LKR ’000 LKR ’000 LKR ’000 LKR ’000 LKR ’000 LKR ’000 LKR ’000 LKR ’000 LKR ’000
Assets
Financial assets at amortised cost - Debt and Other instruments
335,143,660 7,444,961
213,772,945
556,361,566
551,839,449
335,321,834 7,324,233
214,904,554
557,550,621
553,033,150
Investment
Properties - - 3,000,000 3,000,000 2,765,856 - - 574,309 574,309 120,182
Total
335,143,660 7,444,961
216,772,945
559,361,566
554,605,305
335,321,834 7,324,233
215,478,863
558,124,930
553,153,332
Liabilities
Other
borrowings - -
201,792,174
201,792,174
201,792,174 - -
207,053,674
207,053,674
207,053,674
Debt securities
issued - - - - - - - 4,105,681 4,105,681 4,105,681
Subordinate
liabilities - 28,302,237 22,378,755 50,680,992 50,827,239 - 28,041,341 22,378,755 50,420,096 50,484,487
Total - 28,302,237 224,170,929 252,473,166 252,619,413 - 28,041,341 233,538,110 261,579,451 261,643,842

About this Report / Performance Highlights 2019 / Chairman’s Message / General Manager’s Review / Organisational Overview / Strategic Report / Performance and Outlook / Stakeholder Value Creation / Financial Reports / Compliance Annexes / Supplementary Information
317
The following describes the methodologies and assumptions used to determine fair values for those assets and liabilities which are not already recorded at fair value in the Financial Statements.
Financial Assets Measured at Amortised Cost
Financial assets measured at amortised cost comprise Sri Lanka Development Bonds, Government and Corporate debt securities.
Sri Lanka Development Bonds are variable rate instruments which are re-pricing semi-annually. Hence it is assumed that the carrying amounts approximate their fair value. Listed corporate debt securities are valued using quoted market price as of the Reporting date, quoted government debt securities are valued using yield curve published by the Central Bank of Sri Lanka and fair value of unquoted corporate debt securities and Government securities are estimated as the present value of future cash flows expected to be received from such investments calculated based on interest rates at the Reporting date for similar instruments.
Investment Properties
Investment properties are valued by the independent professional valuers and more details are given in Note 32.
Financial Liabilities at Amortised Cost - Other Borrowings
Financial liabilities at amortised cost - other borrowings represent, Term borrowings from banks and other financial institutions in Sri lanka and abroad and Refinance borrowings.
Fair value of term borrowings and refinance borrowings are estimated by the discounting the future cash flows using effective interest rates of similar instruments.
Debt Securities Issued
Fair value of debt securities issued are estimated as the present value of future cash flows expected to be paid from such investments calculated based on interest rates at the Reporting date for similar instruments.
Subordinated Liabilities
Subordinated liabilities are listed in the Colombo Stock Exchange and valued using quoted market price as of the Reporting date.
61.3 Assets and Liabilities for which Fair Value Approximates Carrying Value
For financial assets and liabilities that have a short term maturity, it is assumed that the carrying amounts approximate their fair value. For certain instruments which have contractual maturity of more than one year, the fair value is determined using reasonable basis. Given below is the bases adopted by the Bank in order to establish the fair values of such financial instruments.
Financial Assets at Amortised Cost - Loans and Advances
More than 40% of the total portfolio of loans and advances to customers have a remaining contractual maturity of less than one year and 95% of balance loans are granted at floating rate. Therefore, fair value of loans and advances to customers approximates to their carrying value as at the Reporting date.
Financial Liabilities at Amortised Cost - Due to Depositors
More than 90% of the customer deposits are either repayable on demand or have a remaining contractual maturity of less than one year. Customer deposits with a contractual maturity of more than one year are subject to pre mature upliftment. Amounts paid to customers in the event of pre mature upliftment would not be materially different to its carrying value as at date. Therefore, fair value of customer deposits approximates to their carrying value as at the Reporting date.

BA
NK
OF
CE
YL
ON
AN
NU
AL
RE
PO
RT
20
19
Notes to the Financial Statements318
About this Report / Performance Highlights 2019 / Chairman’s Message / General Manager’s Review / Organisational Overview / Strategic Report / Performance and Outlook / Stakeholder Value Creation / Financial Reports / Compliance Annexes / Supplementary Information
As at 31 December 2019 2018
Carrying Amount Fair Value
Carrying Amount Fair Value
LKR ’000 LKR ’000 LKR ’000 LKR ’000
Bank
Financial Assets
Cash and cash equivalents 64,868,895 64,868,895 78,447,577 78,447,577
Balances with Central Banks 54,594,436 54,594,436 65,680,371 65,680,371
Placements with banks 44,476,343 44,476,343 40,450,089 40,450,089
Securities purchased under resale agreements 2,179,449 2,179,449 - -
Financial assets at amortised cost loans and advances 1,549,804,871 1,549,804,871 1,429,107,181 1,429,107,181
Total Financial Assets 1,715,923,994 1,715,923,994 1,613,685,218 1,613,685,218
Financial Liabilities
Due to banks 2,669,407 2,669,407 2,402,468 2,402,468
Securities sold under repurchase agreements 34,183,210 34,183,210 97,399,359 97,399,359
Due to depositors 2,005,211,794 2,005,211,794 1,770,974,846 1,770,974,846
Total Financial Liabilities 2,042,064,411 2,042,064,411 1,870,776,673 1,870,776,673
Group
Financial Assets
Cash and cash equivalents 64,829,735 64,829,735 78,558,031 78,558,031
Balances with Central Banks 54,594,436 54,594,436 65,680,371 65,680,371
Placements with banks 47,911,621 47,911,621 41,681,910 41,681,910
Securities purchased under resale agreements 3,981,886 3,981,886 1,436,068 1,436,068
Financial assets at amortised cost loans and advances 1,580,949,025 1,580,949,025 1,460,618,588 1,460,618,588
Total Financial Assets 1,752,266,703 1,752,266,703 1,647,974,968 1,647,974,968
Financial Liabilities
Due to banks 2,932,950 2,932,950 2,515,998 2,515,998
Securities sold under repurchase agreements 34,880,507 34,880,507 97,423,302 97,423,302
Due to depositors 2,025,204,033 2,025,204,033 1,789,924,369 1,789,924,369
Total Financial Liabilities 2,063,017,490 2,063,017,490 1,889,863,669 1,889,863,669
61.4 Reclassification of Financial Assets and Financial Liabilities
There have been no reclassifications during 2019.

About this Report / Performance Highlights 2019 / Chairman’s Message / General Manager’s Review / Organisational Overview / Strategic Report / Performance and Outlook / Stakeholder Value Creation / Financial Reports / Compliance Annexes / Supplementary Information
319
62 Restatement Disclosure
For the year ended 31 December 2018 Bank Group
Note Restated As per the Audited
FinancialStatements
in 2018
Restated As per the Audited
FinancialsStatements
in 2018
LKR ’000 LKR ’000 LKR ’000 LKR ’000
Statement of Comprehensive Income
Fee and commission income a 12,917,022 10,699,565 13,305,501 11,088,043
Fee and commission expenses a 2,246,512 2,280,728 2,260,623 2,294,839
Other operating income a 9,807,215 12,135,157 11,331,999 13,659,941
Personnel expenses b 17,351,465 18,875,397 19,076,846 20,600,778
Other expenses a 11,341,068 11,417,336 13,133,953 13,210,221
Profit before income tax 33,416,085 31,892,154 33,961,102 32,437,170
Profit for the year 21,002,660 19,478,729 21,039,085 19,515,153
Re-measurement of post-employment benefit obligations c (1,818,864) (2,119,340) (1,790,314) (2,090,789)
Other comprehensive income for the year, net of tax (1,651,423) (1,951,899) (1,368,325) (1,668,800)
Total comprehensive income for the year 19,351,237 17,526,830 19,670,760 17,846,353
Statement of Financial Position
Other assets b/d 57,236,737 40,560,058 58,549,569 41,872,891
Total assets 2,284,831,073 2,268,154,394 2,329,599,553 2,312,922,875
Financial liabilities at amortised cost - due to depositors d 1,770,974,846 1,765,025,970 1,789,924,369 1,783,975,493
Total liabilities 2,152,661,249 2,146,712,372 2,186,731,105 2,180,782,229
Retained earnings b/e 78,061,681 67,333,879 79,179,548 68,451,746
Total equity 132,169,824 121,442,022 142,868,448 132,140,646
Total liabilities and equity 2,284,831,073 2,268,154,394 2,329,599,553 2,312,922,875
(a) Fee and commission income, fee and commission expense, other operating income and other expenses were reclassified to conform to the current year's presentation.
(b) During the year 2019, the Bank recognised the net surplus in its retirement benefit plan, Widows/Widowers’ and Orphans’ Pension (W/W&OP) Fund in the Bank’s books since the existing arrangements are now in place to support the Bank to recognise any surplus in the fund in the Bank’s books.
Accordingly, personnel expenses reduced by LKR 1.5 billion due to adjustment in contribution made to the W/W&OP fund and Profit Before Tax (PBT) is also increased by the same amount. The respective surplus is recorded under other assets in the Financial Position of the Bank and the net increase in other assets is LKR 10.7 billion.

BA
NK
OF
CE
YL
ON
AN
NU
AL
RE
PO
RT
20
19
Notes to the Financial Statements320
About this Report / Performance Highlights 2019 / Chairman’s Message / General Manager’s Review / Organisational Overview / Strategic Report / Performance and Outlook / Stakeholder Value Creation / Financial Reports / Compliance Annexes / Supplementary Information
(c) Gain of LKR 0.3 billion was recognised under re-measurement of post-employment benefit obligations in the Statement of Other Comprehensive Income due to recognition of surplus in the W/W&OP fund.
(d) Classification change of LKR 5.8 billion carried out between Other Assets and Due to depositors relating to the interest reimbursement due for the Senior Citizen Fixed Deposit interest expenses.
(e) Retained earnings was increased by LKR 10.7 billion due to the recognition of surplus in the W/W&OP fund in the Bank’s books.
During the year 2019, the Bank recognised the net surplus in its retirement benefit plan, W/W&OP fund in the Bank’s books since the existing arrangements are now in place to support the Bank to recognise any surplus in the fund in the Bank’s books in terms of provisions in the LKAS 19: Employee Benefits.
Accordingly, the previous year figures have been restated and the personal cost reduced by LKR1.5 billion due to adjustment in contribution made to the W/W&OP fund and Profit Before Tax (PBT) is also increased by the same amount. The respective surplus is recorded under other assets in the Financial Position of the Bank and the net increase in the other assets is LKR 10.7 billion.
The equity balance as of 1 January 2018 was adjusted for the entire impact as of the beginning of the year 2018. Equity was increased by LKR 8.9 billion accordingly.
The breakdown of the impact of 1 January 2018 is given in more detailed manner in below for further understanding.
As of 01.01.2018 Bank Group
Restated As per the Audited
Financial Statements in
2018
Restated As per the Audited
Financial Statements in
2018
LKR ’000 LKR ’000 LKR ’000 LKR ’000
Equity 112,664,997 103,761,602 123,055,924 114,152,529
Other Assets 46,721,583 37,818,188 47,868,374 38,964,979

About this Report / Performance Highlights 2019 / Chairman’s Message / General Manager’s Review / Organisational Overview / Strategic Report / Performance and Outlook / Stakeholder Value Creation / Financial Reports / Compliance Annexes / Supplementary Information
321
63 Risk Management
63.1 Introduction
63.1.1 Overview
Risk is an inherent component in the Business of Banking. Bank is mainly exposed to following risks from engage in financial transactions:
- Credit Risk
- Market Risk
- Operational Risk
- Liquidity Risk
- IT Risk
Risk Management process is comprised of risk identification, measurement and monitoring subject to risk limits approved by the Board of Directors. Financial risk together with other material risks faced by the bank including strategic, reputational,compliance and legal risks are managed and overseen as a part of the Bank's Corporate Governance and Risk Management Framework. Information presented in this note is about the exposures to risks given above and the processes of measuring and managing such risks.
63.1.2 Group Risk Management
Bank of Ceylon group consist of 10 financial and non financial subsidiaries and 04 associate companies.The principal activities of the group is spread over diverse range. The affairs of subsidiaries & associates do not have significant impact to the risk management due to size of the balance sheet of them .
Albeit the Bank is managing the strategic risk through comprehensive review of group activities on a quarterly basis which are overseen by the IRMC. Bank closely involves in risk and audit affairs of subsidiaries by appointing members of Senior Management of the Bank as members of the Boards of such companies. On special circumstances Internal Auditor of the Bank carries out audits in subsidiaries.
63.1.3 Risk Management Framework
Risk management governance structure of the Bank begins with oversight by the Board of Directors, which assures the performance of overall risk management framework. The Risk Management Policies and Risk Appetite of the Bank establish the strategic direction and a holistic approach to overall risk management of the Bank.
The Bank’s Independent Integrated Risk Management Division (IIRMD) is headed by the Chief Risk Officer (CRO), who directly reports to the Integrated Risk Management Committee (IRMC), which is a sub-committee of the Board. CRO is also a member of management level committees such as Credit Committee, Asset and Liability Management Committee (ALCO), Operational Risk Management Executive Committee (ORMEC), IT Steering Committee, Fraud Risk Management Committee and Non Performing Advances Monitoring Committee, which assist in managing various risks that the Bank is exposed to.
The Internal Audit function of the Bank independently monitors and evaluates the Risk Management function of the Bank and provides their views on Risk Management to the Audit Committee.

BA
NK
OF
CE
YL
ON
AN
NU
AL
RE
PO
RT
20
19
Notes to the Financial Statements322
About this Report / Performance Highlights 2019 / Chairman’s Message / General Manager’s Review / Organisational Overview / Strategic Report / Performance and Outlook / Stakeholder Value Creation / Financial Reports / Compliance Annexes / Supplementary Information
63.1.4 Risk Measurement, Reporting and Mitigation
Risks are measured using various rigorous methods and tools with respect to Credit ,Market ,Operational, IT and Liquidity. Risk Evaluation Models and Measurement Techniques make use of probabilities derived from historical experience, adjusted to reflect the real environment. The Bank also carry out stress testing based on worst-case scenarios which are plausible.
In addition, the Internal Capital Adequacy Assessment Process (ICAAP) sets out the framework for the Bank’s internal capital planning and the process provides an assurance that the Bank has adequate capital to cover all risk types as per the business profile.
As a part of its overall risk management, the Bank uses several mitigation techniques and strategies to reduce the risk. In managing credit risk bank uses comprehensive pre sanctioning and post sanctioning techniques to reduce its credit risks. Collaterals are used to further mitigate losses. Market risk is mitigated using derivative instruments in limited context. Strong internal control mechanism is in place to manage operational risks and insurance is used as an operational risk transfer strategy where necessary.
63.2 Credit Risk
Credit Risk is defined as potential losses arising due to a counterparty to a credit transaction failing to meet his/her obligations in accordance with agreed terms. Credit Risk can take the form of default and concentration.
63.2.1 Management of Credit Risk
Credit Risk Management policy lays down the conditions and guidelines for granting, maintenance, monitoring and management of credit at both the transaction and portfolio levels.Credit risk management function is independent from business divisions and credit decision standards, processes and principles are consistently applied in corporate segment and retail segment. In order to get rid of concentration risk a diversified credit portfolio is maintained by assessing and managing borrower and industry specific concentration against risk appetite.The Bank has a range of strategies and processes to actively mitigate credit risk. The Bank has well established process for approving new credit and for the renewal of existing credit. All the potential credit exposures of the bank are first evaluated by transaction originators using credit risk models who are the risk owners of the credit mechanism. Credit proposals exceeding a certain threshold are independently reviewed by the Chief Risk Officer. Procedures are also in place to identify the credit exposures for which there may be an increased risk of loss at an early stage. In order to reduce potential credit losses and to increase the recovery of obligations credit risk mitigants are applied.Post sanctioning review of large credit exposures is carried out periodically to ensure proper documentation, adherence to the covenants imposed and quality of the loan book. Collateral is used for credit risk mitigation purposes and minimises losses that would otherwise be incurred. Collateral may take various forms depending on the type of borrower, the assets available, the structure and the term of credit obligations. Collateral is subject to regular valuation as prescribed in the relevant governing policies and standards. Pricing mechanism ensures facilities are priced factoring individual rating and availability of collateral.

About this Report / Performance Highlights 2019 / Chairman’s Message / General Manager’s Review / Organisational Overview / Strategic Report / Performance and Outlook / Stakeholder Value Creation / Financial Reports / Compliance Annexes / Supplementary Information
323
63.2.1.1 Calculation of Expected Credit Losses (ECL)
Expected credit loss represents the default events over an expected life time of the financial assets. Expected credit losses are calculated using four main components, i.e. Probability of Default (PD), Loss Given Default (LGD), Economic Factor Adjustment and Exposure at Default (EAD). These parameters are generally derived from internally developed statistical models combined with historical, current and forward-looking customer and macro-economic data.
SLFRS 9 introduces a three stage model for impairment of financial assets that are performing at the stage of origination or purchase. Three stage model for impairment is based on the changes in the credit quality since initial recognition. At initial recognition, financial assets which are not credit impaired are reflected in stage 1. If there is a significant increase in the credit risk, such financial assets are transferred to stage 2. Significant increase in the credit risk is defined using pre-determined credit risk indicators which are stated in the bank’s impairment policy.In case of a default, financial assets are classified as stage 3.
63.2.1.2 Incorporation of Forward-Looking Information
The Bank has established an expert panel who considers a range of relevant forward-looking macro-economic assumptions for the determination of unbiased general industry adjustments and any related specific industry adjustments, that support the calculation of ECLs.
63.2.2 Maximum Exposure to Credit Risk
63.2.2.1 Collateral and Other Credit Enhancements
The Bank obtains different types of collaterals from the counterparties as a credit risk mitigant. The amount and the types of the collateral required depend on credit risk assessment of the counterparty. The acceptability of the collateral and valuation is determined based on the guidelines issued by the regulator and the bank’s policy. The main types of collateral obtained are
- For commercial lending-charges over movable and immovable properties
- For personal lending- mortgages over movable and immovable properties, cash & cash equivalents and gold articles
- For Government & State Owned Enterprises- Government guarantees and letter of comforts
- For reverse repurchase transactions – Government securities
The Bank monitors the market value of collateral and will request additional collateral in accordance with the underlying agreement. It is the Bank’s policy to dispose of repossessed properties in an orderly fashion. The proceeds are used to reduce or repay the outstanding claim. In general, the Bank does not occupy repossessed properties for business use.
The following table shows the maximum exposure to credit risk, total fair value of collaterals, any surplus collaterals and the net exposure to credit risk.

BA
NK
OF
CE
YL
ON
AN
NU
AL
RE
PO
RT
20
19
Notes to the Financial Statements324
About this Report / Performance Highlights 2019 / Chairman’s Message / General Manager’s Review / Organisational Overview / Strategic Report / Performance and Outlook / Stakeholder Value Creation / Financial Reports / Compliance Annexes / Supplementary Information
63.2.2.2 Type of Collateral or Other Credit Enhancements
Fair value of collateral and other credit enhancements held
31 December
2019
Maximum
exposure to
credit risk Cash Gold
GoSL
Securities/
Guarantees Movables
Immovable
Properties Others
Surplus
Collateral Net Collateral Net exposure
LKR ’000 LKR ’000 LKR ’000 LKR ’000 LKR ’000 LKR ’000 LKR ’000 LKR ’000 LKR ’000 LKR ’000
Cash and Cash
equivalents 64,882,431 46,532,632 - - - - - - 46,532,632 18,349,799
Less : Impairment (13,536) - - - - - - - - (13,536)
Balances with
Central Banks 54,594,436 54,594,436 - - - - - - 54,594,436 -
Placements with banks 44,517,199 - - - - - - - - 44,517,199
Less : Impairment (40,856) - - - - - - - - (40,856)
Securities purchased under resale agreements 2,179,449 - - - - - - - - 2,179,449
Derivative financial instruments 132,090 - - - - - - - - 132,090
Financial assets recognised through profit or loss -measured at fair value 10,055,415 - - 4,666,658 - - - - 4,666,658 5,388,757
Financial assets at amortised cost - loans and advances 1,648,760,589 93,487,564 83,941,733 407,344,324 141,014,879 347,547,813 91,845,448 (126,749,137) 1,038,432,624 610,327,965
Less : Impairment (98,955,718) - - - - - - - - (98,955,718)
Financial assets at amortised cost - debt and other instruments 574,921,740 - - 568,425,789 - - - - 568,425,789 6,495,951
Less : Impairment (2,173,931) - - - - - - - - (2,173,931)
Financial assets measured at fair value through OCI 14,236,090 - - 9,669,618 - - - - 9,669,618 4,566,472
Total Financial Assets 2,313,095,398 194,614,632 83,941,733 990,106,389 141,014,879 347,547,813 91,845,448 (126,749,137) 1,722,321,757 590,773,641

About this Report / Performance Highlights 2019 / Chairman’s Message / General Manager’s Review / Organisational Overview / Strategic Report / Performance and Outlook / Stakeholder Value Creation / Financial Reports / Compliance Annexes / Supplementary Information
325
Fair value of collateral and other credit enhancements held
31 December
2018
Maximum
exposure to
credit risk Cash Gold
GoSL
Securities/
Guarantees Movables
Immovable
Properties Others
Surplus
Collateral Net Collateral Net exposure
LKR ’000 LKR ’000 LKR ’000 LKR ’000 LKR ’000 LKR ’000 LKR ’000 LKR ’000 LKR ’000 LKR ’000
Cash and cash
equivalents 78,454,689
38,383,013 - - - - - - 38,383,013
40,071,676Less : Impairment (7,112) - - - - - - - - (7,112)Balances with Central Banks 65,680,371
65,680,371 - - - - - - 65,680,371 -
Placements with banks 40,473,397 - - - - - - - -
40,473,397
Less : Impairment (23,308) - - - - - - - - (23,308)Derivative financial instruments 1,205,657 - - - - - - - - 1,205,657 Financial assets recognised through profit or loss -measured at fair value 9,277,298 - - 4,166,005 - - - - 4,166,005 5,111,293 Financial assets at amortised cost - loans and advances 1,510,534,078
82,885,527
61,523,186
348,318,695
149,613,014
287,858,492
80,344,939
(111,864,107) 898,679,746
611,854,332
Less : Impairment (81,426,897) - - - - - - - - (81,426,897)Financial assets at amortised cost - debt and other instruments 553,624,323 - - 545,456,087 - - - - 545,456,087 8,168,236 Less : Impairment (1,784,874) - - - - - - - -
(1,784,874)
Financial assets measured at fair value through OCI 16,699,582 - - 9,677,543 - - - - 9,677,543 7,022,039 Total Financial Assets 2,192,707,204 186,948,911 61,523,186 907,618,330 149,613,014 287,858,492 80,344,939 (111,864,107) 1,562,042,765 630,664,439

BA
NK
OF
CE
YL
ON
AN
NU
AL
RE
PO
RT
20
19
326
About this Report / Performance Highlights 2019 / Chairman’s Message / General Manager’s Review / Organisational Overview / Strategic Report / Performance and Outlook / Stakeholder Value Creation / Financial Reports / Compliance Annexes / Supplementary Information
Notes to the Financial Statements
63.2.3 Credit Quality by Class of Financial Assets
Based on the credit quality, the financial assets can be classified mainly into three categories i.e. neither past due/ nor impaired, past due but not individually impaired and individually impaired.The Bank has established appropiate limits to maintain concentration risk at an acceptable level.
The table below shows the credit quality by class of asset for all financial assets exposed to credit risk. High grade consist of Assets and advances granted to GOSL and loans and advances granted to corporate borrowers whose internal credit ratings are AAA, AA or A. Standard grade consists of Loans and advances to corporate borrowers whose internal credit ratings are BBB, BB or B. Substandard grade includes corporate borrowers whose credit rating are C or D.
Credit Quality by Class of Financial Assets
As at 31 December 2019
Neither past due/Nor impaired
High grade
(LKR ' 000)
Standard grade
(LKR ' 000)
Sub-standard grade
(LKR ' 000)
Grades not allocated/ Un rated
(LKR ' 000)
Past due but not individually impaired
(LKR ' 000)
Individually
impaired
(LKR ' 000)
Total
(LKR ' 000)
Stage 1 Stage 2 Stage 3 Stage 1 Stage 2 Stage 3 Stage 1 Stage 2 Stage 3 Stage 1 Stage 2 Stage 3 Stage 1 Stage 2 Stage 3 Stage 3
Cash and cash equivalents 61,114,313 - - - - - - - - 3,768,118 - - - - - - 64,882,431
Less : Impairment - - - - - - - - - - - - - - - - (13,536)
Balances with Central Banks 48,334,353 - - - - - - - - 6,260,083 - - - - - - 54,594,436
Placements with banks 182,660 - - - - - - - - 44,334,539 - - - - - - 44,517,199
Less : Impairment - - - - - - - - - - - - - - - - (40,856)
Securities purchased under resale agreements 2,179,449 - - - - - - - - - - - - - - - 2,179,449
Derivative financial instruments 132,090 - - - - - - - - - - - - - - - 132,090
Financial assets recognised through profit or
loss - measured at fair value 4,666,658 - - - - - - - - 5,388,757 - - - - - - 10,055,415
Financial assets at amortised cost - loans and
advances 408,546,716 - - 118,479,448 - - 55,704,691 - - 487,349,752 - - 310,846,406 101,146,342 31,132,849 135,554,385
1,648,760,589
Less : Impairment - - - - - - - - - - - - - - - - (98,955,718)
Financial assets at amortised cost - debt and
other instruments 568,425,789 - - - - - - - - 6,495,951 - - - - - - 574,921,740
Less : Impairment - - - - - - - - - - - - (2,173,931)
Financial assets measured at fair value through
OCI 9,669,618 - - - - - - - - 4,566,472 - - - - - - 14,236,090
Total Financial Assets 1,103,251,646 - - 118,479,448 - - 55,704,691 - - 558,163,672 - - 310,846,406 101,146,342 31,132,849 135,554,385 2,313,095,398
Representation of stage one assets amount to 89% of Bank's total assets and high grade assets to 46% of total assets.
Age analysis of past due (i.e. facilities in arrears of 1 day and above) but not individually impaired loans by class of Financial Assets
Age analysis of past due but not individually
impaired loans
Less than
30 days
31 to 60
days
61 to 89
days
90 to 181
days
181 days
and over Total
(LKR ' 000) (LKR ' 000) (LKR ' 000) (LKR ' 000) (LKR ' 000) (LKR ' 000)
Loans and advances to customers 310,846,406 35,144,463 66,001,879 3,221,318 27,911,531 443,125,597

About this Report / Performance Highlights 2019 / Chairman’s Message / General Manager’s Review / Organisational Overview / Strategic Report / Performance and Outlook / Stakeholder Value Creation / Financial Reports / Compliance Annexes / Supplementary Information
327
Credit Quality by Class of Financial Assets
As at 31 December 2019
Neither past due/Nor impaired
High grade
(LKR ' 000)
Standard grade
(LKR ' 000)
Sub-standard grade
(LKR ' 000)
Grades not allocated/ Un rated
(LKR ' 000)
Past due but not individually impaired
(LKR ' 000)
Individually
impaired
(LKR ' 000)
Total
(LKR ' 000)
Stage 1 Stage 2 Stage 3 Stage 1 Stage 2 Stage 3 Stage 1 Stage 2 Stage 3 Stage 1 Stage 2 Stage 3 Stage 1 Stage 2 Stage 3 Stage 3
Cash and cash equivalents 61,114,313 - - - - - - - - 3,768,118 - - - - - - 64,882,431
Less : Impairment - - - - - - - - - - - - - - - - (13,536)
Balances with Central Banks 48,334,353 - - - - - - - - 6,260,083 - - - - - - 54,594,436
Placements with banks 182,660 - - - - - - - - 44,334,539 - - - - - - 44,517,199
Less : Impairment - - - - - - - - - - - - - - - - (40,856)
Securities purchased under resale agreements 2,179,449 - - - - - - - - - - - - - - - 2,179,449
Derivative financial instruments 132,090 - - - - - - - - - - - - - - - 132,090
Financial assets recognised through profit or
loss - measured at fair value 4,666,658 - - - - - - - - 5,388,757 - - - - - - 10,055,415
Financial assets at amortised cost - loans and
advances 408,546,716 - - 118,479,448 - - 55,704,691 - - 487,349,752 - - 310,846,406 101,146,342 31,132,849 135,554,385
1,648,760,589
Less : Impairment - - - - - - - - - - - - - - - - (98,955,718)
Financial assets at amortised cost - debt and
other instruments 568,425,789 - - - - - - - - 6,495,951 - - - - - - 574,921,740
Less : Impairment - - - - - - - - - - - - (2,173,931)
Financial assets measured at fair value through
OCI 9,669,618 - - - - - - - - 4,566,472 - - - - - - 14,236,090
Total Financial Assets 1,103,251,646 - - 118,479,448 - - 55,704,691 - - 558,163,672 - - 310,846,406 101,146,342 31,132,849 135,554,385 2,313,095,398
Representation of stage one assets amount to 89% of Bank's total assets and high grade assets to 46% of total assets.
Age analysis of past due (i.e. facilities in arrears of 1 day and above) but not individually impaired loans by class of Financial Assets
Age analysis of past due but not individually
impaired loans
Less than
30 days
31 to 60
days
61 to 89
days
90 to 181
days
181 days
and over Total
(LKR ' 000) (LKR ' 000) (LKR ' 000) (LKR ' 000) (LKR ' 000) (LKR ' 000)
Loans and advances to customers 310,846,406 35,144,463 66,001,879 3,221,318 27,911,531 443,125,597

BA
NK
OF
CE
YL
ON
AN
NU
AL
RE
PO
RT
20
19
Notes to the Financial Statements328
About this Report / Performance Highlights 2019 / Chairman’s Message / General Manager’s Review / Organisational Overview / Strategic Report / Performance and Outlook / Stakeholder Value Creation / Financial Reports / Compliance Annexes / Supplementary Information
Credit Quality by Class of Financial Assets
As at 31 December 2018
Neither past due/Nor impaired
High grade
(LKR ' 000)
Standard grade
(LKR ' 000)
Sub-standard grade
(LKR ' 000)
Grades not allocated/ Un rated
(LKR ' 000)
Past due but not individually impaired
(LKR ' 000)
Individually
impaired
(LKR ' 000)
Total
(LKR ' 000)
Stage 1 Stage 2 Stage 3 Stage 1 Stage 2 Stage 3 Stage 1 Stage 2 Stage 3 Stage 1 Stage 2 Stage 3 Stage 1 Stage 2 Stage 3 Stage 3
Cash and cash equivalents 50,520,582 - - - - - - - - 27,934,107 - - - - - - 78,454,689
Less : Impairment - - - - - - - - - - - - - - - - (7,112)
Balances with Central Banks 59,405,543 - - - - - - - - 6,274,828 - - - - - - 65,680,371
Placements with banks 1,108,583 - - - - - - - - 39,364,814 - - - - - - 40,473,397
Less : Impairment - - - - - - - - - - - - - - - - (23,308)
Securities purchased under resale agreements - - - - - - - - - - - - - - - - -
Derivative financial instruments 1,205,657 - - - - - - - - - - - - - - - 1,205,657
Financial assets recognised through profit or
loss - measured at fair value 4,166,005 - - - - - - - - 5,111,293 - - - - - - 9,277,298
Financial assets at amortised cost - loans and
advances 354,752,816 17,566,991 10,473,463 121,895,086 16,809,553 5,562,062 40,292,350 14,288,377 3,627,545 503,223,258 12,578,941 2,947,153 274,627,225 17,284,145 19,401,017 95,204,096
1,510,534,078
Less : Impairment - - - - - - - - - - - - - - - - (81,426,897)
Financial assets at amortised cost - debt and
other instruments 545,456,087 - - - - - - - - 8,168,236 - - - - - - 553,624,323
Less : Impairment - - - - - - - - - - - - (1,784,874)
Financial assets measured at fair value through
OCI 12,315,778 - - - - - - - - 4,383,804 - - - - - - 16,699,582
Total Financial Assets 1,028,931,051 17,566,991 10,473,463 121,895,086 16,809,553 5,562,062 40,292,350 14,288,377 3,627,545 594,460,340 12,578,941 2,947,153 274,627,225 17,284,145 19,401,017 95,204,096 2,192,707,204
Representation of stage one assets amount to 90% of Bank's total assets and high grade assets to 44% of total assets.
Age analysis of past due (i.e. facilities in arrears of 1 day and above) but not individually impaired loans by class of Financial Assets
Age analysis of past due but not individually
impaired loans
Less than
30 days
31 to 60
days
61 to 89
days
90 to 180
days
181 days
and over Total
(LKR ' 000) (LKR ' 000) (LKR ' 000) (LKR ' 000) (LKR ' 000) (LKR ' 000)
Loans and advances to customers 131,628,901 127,257,253 12,542,122 6,555,227 33,328,884 311,312,387

About this Report / Performance Highlights 2019 / Chairman’s Message / General Manager’s Review / Organisational Overview / Strategic Report / Performance and Outlook / Stakeholder Value Creation / Financial Reports / Compliance Annexes / Supplementary Information
329
Credit Quality by Class of Financial Assets
As at 31 December 2018
Neither past due/Nor impaired
High grade
(LKR ' 000)
Standard grade
(LKR ' 000)
Sub-standard grade
(LKR ' 000)
Grades not allocated/ Un rated
(LKR ' 000)
Past due but not individually impaired
(LKR ' 000)
Individually
impaired
(LKR ' 000)
Total
(LKR ' 000)
Stage 1 Stage 2 Stage 3 Stage 1 Stage 2 Stage 3 Stage 1 Stage 2 Stage 3 Stage 1 Stage 2 Stage 3 Stage 1 Stage 2 Stage 3 Stage 3
Cash and cash equivalents 50,520,582 - - - - - - - - 27,934,107 - - - - - - 78,454,689
Less : Impairment - - - - - - - - - - - - - - - - (7,112)
Balances with Central Banks 59,405,543 - - - - - - - - 6,274,828 - - - - - - 65,680,371
Placements with banks 1,108,583 - - - - - - - - 39,364,814 - - - - - - 40,473,397
Less : Impairment - - - - - - - - - - - - - - - - (23,308)
Securities purchased under resale agreements - - - - - - - - - - - - - - - - -
Derivative financial instruments 1,205,657 - - - - - - - - - - - - - - - 1,205,657
Financial assets recognised through profit or
loss - measured at fair value 4,166,005 - - - - - - - - 5,111,293 - - - - - - 9,277,298
Financial assets at amortised cost - loans and
advances 354,752,816 17,566,991 10,473,463 121,895,086 16,809,553 5,562,062 40,292,350 14,288,377 3,627,545 503,223,258 12,578,941 2,947,153 274,627,225 17,284,145 19,401,017 95,204,096
1,510,534,078
Less : Impairment - - - - - - - - - - - - - - - - (81,426,897)
Financial assets at amortised cost - debt and
other instruments 545,456,087 - - - - - - - - 8,168,236 - - - - - - 553,624,323
Less : Impairment - - - - - - - - - - - - (1,784,874)
Financial assets measured at fair value through
OCI 12,315,778 - - - - - - - - 4,383,804 - - - - - - 16,699,582
Total Financial Assets 1,028,931,051 17,566,991 10,473,463 121,895,086 16,809,553 5,562,062 40,292,350 14,288,377 3,627,545 594,460,340 12,578,941 2,947,153 274,627,225 17,284,145 19,401,017 95,204,096 2,192,707,204
Representation of stage one assets amount to 90% of Bank's total assets and high grade assets to 44% of total assets.
Age analysis of past due (i.e. facilities in arrears of 1 day and above) but not individually impaired loans by class of Financial Assets
Age analysis of past due but not individually
impaired loans
Less than
30 days
31 to 60
days
61 to 89
days
90 to 180
days
181 days
and over Total
(LKR ' 000) (LKR ' 000) (LKR ' 000) (LKR ' 000) (LKR ' 000) (LKR ' 000)
Loans and advances to customers 131,628,901 127,257,253 12,542,122 6,555,227 33,328,884 311,312,387

BA
NK
OF
CE
YL
ON
AN
NU
AL
RE
PO
RT
20
19
Notes to the Financial Statements330
About this Report / Performance Highlights 2019 / Chairman’s Message / General Manager’s Review / Organisational Overview / Strategic Report / Performance and Outlook / Stakeholder Value Creation / Financial Reports / Compliance Annexes / Supplementary Information
63.2.4 Analysis of Risk Concentration
Concentration risk in credit portfolios arises due to an uneven distribution of bank loans to individual borrowers, industry ,sector or geographical regions. In managing the concentraion risk the bank uses the Herfindahl-Harischman Index (HHI) as a measurement tool.The Bank has established appropriate limits to maintain concentration risk at an acceptable level.
Country Wise Exposure
The Bank has established branches in three countries i.e. India, Maldives, and Seychelles through which the bank mainly maintains exposures outside Sri Lanka. Bank also has a fully owned subsidiary operating in United Kingdom (UK). All overseas branches are operating with pre-set limits (credit limits as well as country limits) which are approved by the Board of Directors.
Exposures in other countries include placements with banks and nostro account balances with correspondent banks whose risks are managed through Board approved limits.
Country Wise Exposure
31 December 2019 Sri Lanka UK Maldives India USA Seychelles
Other
Countries Total
LKR ’000 LKR ’000 LKR ’000 LKR ’000 LKR ’000 LKR ’000 LKR ’000 LKR ’000
Financial Assets
Cash and cash equivalents 47,626,492 326,525 5,301,008 44,575 7,662,052 42,038 3,866,205 64,868,895 Balances with Central
Banks 48,334,353 - 5,058,839 906,827 - 294,417 - 54,594,436
Placements with banks 182,660 44,293,683 - - - - - 44,476,343 Securities purchased
under resale agreements 2,179,449 - - - - - - 2,179,449 Derivative financial
instruments 132,090 - - - - - - 132,090 Financial assets
recognised through profit
or loss - measured at fair
value 10,055,415 - - - - - - 10,055,415 Financial assets at
amortised cost - loans
and advances
1,513,991,459 - 26,368,023 7,858,634 - 1,586,755 -
1,549,804,871 Financial assets at
amortised cost - debt
and other instruments 562,731,222 - 10,016,587 - - - - 572,747,809 Financial assets measured
at fair value through OCI 12,790,398 - - 1,445,692 - - - 14,236,090
Total financial assets 2,198,023,538 44,620,208 46,744,457 10,255,728 7,662,052 1,923,210 3,866,205 2,313,095,398
Financial Liabilities
Due to banks 1,324,470 19,140 - - 1,198,296 - 127,501 2,669,407 Securities sold under
repurchase agreements 34,183,210 - - - - - - 34,183,210 Derivative financial
instruments 106,677 - - - - - - 106,677 Financial liabilities at
amortised cost - due to
depositors
1,962,131,792 - 35,068,761 5,762,931 - 2,248,310 -
2,005,211,794 Financial liabilities at
amortised cost - other
borrowings 41,400,295 - - 2,747,982 9,146,152 - 84,539,114
137,833,543
Subordinated term debts 54,221,552 - - - - - - 54,221,552
Total financial liabilities 2,093,367,996 19,140 35,068,761 8,510,913 10,344,448 2,248,310 84,666,615 2,234,226,183

About this Report / Performance Highlights 2019 / Chairman’s Message / General Manager’s Review / Organisational Overview / Strategic Report / Performance and Outlook / Stakeholder Value Creation / Financial Reports / Compliance Annexes / Supplementary Information
331
31 December 2018 Sri Lanka UK Maldives India USA Seychelles
Other
Countries Total
LKR ’000 LKR ’000 LKR ’000 LKR ’000 LKR ’000 LKR ’000 LKR ’000 LKR ’000
Financial Assets
Cash and cash equivalents 41,535,889 309,411 8,984,693 91,690 8,393,595 34,515 19,097,784 78,447,577
Balances with Central
Banks 58,989,444 - 5,626,366 752,166 - 312,39 5 - 65,680,371
Placements with banks 1,108,583 39,341,506 - - - - - 40,450,089
Securities purchased
under resale agreements - - - - - - - -
Derivative financial
instruments 1,205,657 - - - - - - 1,205,657
Financial assets
recognised through profit
or loss - measured at fair
value 9,277,298 - - - - - - 9,277,298
Financial assets at
amortised cost - loans
and advances
1,394,444,291 - 25,186,543 7,932,346 - 1,544,001 -
1,429,107,181
Financial assets at
amortised cost - debt
and other instruments 542,982,435 - 8,857,014 - - - - 551,839,449
Financial assets measured
at fair value through OCI 15,112,551 1,587,031 16,699,582
Total financial assets 2,064,656,148 39,650,917 48,654,616 10,363,233 8,393,595 1,890,911 19,097,784 2,192,707,204
Financial Liabilities
Due to banks 1,395,256 - - 1,007,212 - - - 2,402,468
Securities sold under
repurchase agreements 97,399,359 - - - - - - 97,399,359
Derivative financial
instruments 509,018 - - - - - - 509,018
Financial liabilities at
amortised cost - due to
depositors
1,717,499,151 - 39,167,235 6,028,423 - 2,331,161 -
1,765,025,970
Financial liabilities at
amortised cost - other
borrowings 201,792,174 - - - - - - 201,792,174
Debt securities issued - - - - - - -
Subordinated term debts 50,827,239 - - - - - - 50,827,239
Total financial liabilities 2,069,422,197 - 39,167,235 7,035,635 - 2,331,161 - 2,117,956,228

BA
NK
OF
CE
YL
ON
AN
NU
AL
RE
PO
RT
20
19
Notes to the Financial Statements332
About this Report / Performance Highlights 2019 / Chairman’s Message / General Manager’s Review / Organisational Overview / Strategic Report / Performance and Outlook / Stakeholder Value Creation / Financial Reports / Compliance Annexes / Supplementary Information
The Bank's portfolio is well diversified with in the Sector and all exposure were maintained within the set HHI
during the year.
Sector Wise Exposure
31 December 2019
Agricultureand
fisheries
Banking,finance and
insurance
Hotels,travels and
services
Housing,construction
and infrastructure
Manu-facturing
Commercialtrade
Sovereign and direct
Government
Transportationand
logistics
Othercommercial
services
Consumptionand
others Total
LKR ’000 LKR ’000 LKR ’000 LKR ’000 LKR ’000 LKR ’000 LKR ’000 LKR ’000 LKR ’000 LKR ’000 LKR ’000Cash and cash equivalents - 14,581,681 - - - - - - 50,300,750 - 64,882,431 Less : Impairment - - - - - - - - - - (13,536)Balances with Central Banks - - - - - - 48,334,353 - 6,260,083 - 54,594,436 Placements with banks - 44,517,199 - - - - - - - - 44,517,199 Less : Impairment - - - - - - - - - - (40,856)Securities purchased under resale agreements - 2,179,449 - - - - - - - - 2,179,449 Derivative financial instruments - 132,090 - - - - - - - - 132,090 Financial assets recognised through profit or loss - measured at fair value 82,348 2,869,220 295,607 70,978 936,574 166,657 4,666,658 69,284 891,989 6,100 10,055,415 Financial assets at amortised cost - loans and advances 107,883,019 43,571,094 109,579,004 366,709,406 86,179,315 253,904,763 176,755,515* 155,400,432 59,731,824 289,046,217
1,648,760,589
Less : Impairment - - - - - - - - - - (98,955,718)Financial assets at amortised cost - debt and other instruments - 338,826 - - - 6,157,124 568,425,790 - - - 574,921,740 Less : Impairment - - - - - - - - - - (2,173,931)Financial assets measured at fair value through OCI - 2,970,984 - - - 1,595,488 9,669,618 - - - 14,236,090
107,965,367 111,160,543 109,874,611 366,780,384 87,115,889 261,824,032 807,851,934 155,469,716 117,184,646 289,052,317 2,313,095,398
31 December 2018
Agriculture,and
Fisheries
Banking,Finance and
Insurance
Hotels,Travels and
Services
Housing,Construction
and Infrastructure
Manu-facturing
CommercialTrade
Sovereign and Direct
Government
Transportationand
Logistics
OtherCommercial
Services
Consumptionand
Others Total
LKR ’000 LKR ’000 LKR ’000 LKR ’000 LKR ’000 LKR ’000 LKR ’000 LKR ’000 LKR ’000 LKR ’000Cash and cash equivalents - 12,137,568 - - - - - - - 66,317,121 78,454,689
Less : Impairment - - - - - - - - - (7,112)
Balances with Central Banks - - - - - - 65,680,371 - - - 65,680,371
Placements with banks - 40,473,397 - - - - - - - - 40,473,397
Less : Impairment - - - - - - - - - (23,308)
Securities purchased under resale agreements - - - - - - - - - - -
Derivative financial instruments - 1,205,657 - - - - - - - - 1,205,657
Financial assets recognised through profit or loss - measured at fair value 76,174 2,665,858 280,829 67,996 301,685 142,914 4,088,980 67,662 204,381 1,380,819 9,277,298
Financial assets at amortised cost - loans and advances 97,665,643 49,554,107 80,010,561 338,744,805 74,048,479 193,122,916 219,760,013* 140,006,311 48,335,126 269,286,117
1,510,534,078
Less : Impairment - - - - - - - - - - (81,426,897)
Financial assets at amortised cost - debt and other instruments - 676,557 - - - 7,491,679 545,456,087 - - - 553,624,323
Less : Impairment - - - - - - - - - - (1,784,874)
Financial assets measured at fair value through OCI - 3,142,087 - - - 1,241,718 12,315,777 - - - 16,699,582
97,741,817 109,855,231 80,291,390 338,812,801 74,350,164 201,999,227 847,301,228 140,073,973 48,539,507 336,984,057 2,192,707,204
*This excludes exposure to state owned enterprices

About this Report / Performance Highlights 2019 / Chairman’s Message / General Manager’s Review / Organisational Overview / Strategic Report / Performance and Outlook / Stakeholder Value Creation / Financial Reports / Compliance Annexes / Supplementary Information
333
The Bank's portfolio is well diversified with in the Sector and all exposure were maintained within the set HHI
during the year.
Sector Wise Exposure
31 December 2019
Agricultureand
fisheries
Banking,finance and
insurance
Hotels,travels and
services
Housing,construction
and infrastructure
Manu-facturing
Commercialtrade
Sovereign and direct
Government
Transportationand
logistics
Othercommercial
services
Consumptionand
others Total
LKR ’000 LKR ’000 LKR ’000 LKR ’000 LKR ’000 LKR ’000 LKR ’000 LKR ’000 LKR ’000 LKR ’000 LKR ’000Cash and cash equivalents - 14,581,681 - - - - - - 50,300,750 - 64,882,431 Less : Impairment - - - - - - - - - - (13,536)Balances with Central Banks - - - - - - 48,334,353 - 6,260,083 - 54,594,436 Placements with banks - 44,517,199 - - - - - - - - 44,517,199 Less : Impairment - - - - - - - - - - (40,856)Securities purchased under resale agreements - 2,179,449 - - - - - - - - 2,179,449 Derivative financial instruments - 132,090 - - - - - - - - 132,090 Financial assets recognised through profit or loss - measured at fair value 82,348 2,869,220 295,607 70,978 936,574 166,657 4,666,658 69,284 891,989 6,100 10,055,415 Financial assets at amortised cost - loans and advances 107,883,019 43,571,094 109,579,004 366,709,406 86,179,315 253,904,763 176,755,515* 155,400,432 59,731,824 289,046,217
1,648,760,589
Less : Impairment - - - - - - - - - - (98,955,718)Financial assets at amortised cost - debt and other instruments - 338,826 - - - 6,157,124 568,425,790 - - - 574,921,740 Less : Impairment - - - - - - - - - - (2,173,931)Financial assets measured at fair value through OCI - 2,970,984 - - - 1,595,488 9,669,618 - - - 14,236,090
107,965,367 111,160,543 109,874,611 366,780,384 87,115,889 261,824,032 807,851,934 155,469,716 117,184,646 289,052,317 2,313,095,398
31 December 2018
Agriculture,and
Fisheries
Banking,Finance and
Insurance
Hotels,Travels and
Services
Housing,Construction
and Infrastructure
Manu-facturing
CommercialTrade
Sovereign and Direct
Government
Transportationand
Logistics
OtherCommercial
Services
Consumptionand
Others Total
LKR ’000 LKR ’000 LKR ’000 LKR ’000 LKR ’000 LKR ’000 LKR ’000 LKR ’000 LKR ’000 LKR ’000Cash and cash equivalents - 12,137,568 - - - - - - - 66,317,121 78,454,689
Less : Impairment - - - - - - - - - (7,112)
Balances with Central Banks - - - - - - 65,680,371 - - - 65,680,371
Placements with banks - 40,473,397 - - - - - - - - 40,473,397
Less : Impairment - - - - - - - - - (23,308)
Securities purchased under resale agreements - - - - - - - - - - -
Derivative financial instruments - 1,205,657 - - - - - - - - 1,205,657
Financial assets recognised through profit or loss - measured at fair value 76,174 2,665,858 280,829 67,996 301,685 142,914 4,088,980 67,662 204,381 1,380,819 9,277,298
Financial assets at amortised cost - loans and advances 97,665,643 49,554,107 80,010,561 338,744,805 74,048,479 193,122,916 219,760,013* 140,006,311 48,335,126 269,286,117
1,510,534,078
Less : Impairment - - - - - - - - - - (81,426,897)
Financial assets at amortised cost - debt and other instruments - 676,557 - - - 7,491,679 545,456,087 - - - 553,624,323
Less : Impairment - - - - - - - - - - (1,784,874)
Financial assets measured at fair value through OCI - 3,142,087 - - - 1,241,718 12,315,777 - - - 16,699,582
97,741,817 109,855,231 80,291,390 338,812,801 74,350,164 201,999,227 847,301,228 140,073,973 48,539,507 336,984,057 2,192,707,204

BA
NK
OF
CE
YL
ON
AN
NU
AL
RE
PO
RT
20
19
Notes to the Financial Statements334
About this Report / Performance Highlights 2019 / Chairman’s Message / General Manager’s Review / Organisational Overview / Strategic Report / Performance and Outlook / Stakeholder Value Creation / Financial Reports / Compliance Annexes / Supplementary Information
63.2.5 Commitments and Guarantees
The Bank enters into various irrevocable commitments and contingent liabilities to meet the financial needs of customers. They do contain credit/default risk even though these obligations are not recognised in the statement of financial position as on balance sheet assets.
The table below shows the Bank’s maximum credit risk exposure for commitments and guarantees.
Bank
For the year ended 31 December 2019 2018
LKR ’000 LKR ’000
Acceptances and documentary credit 246,241,559 225,582,120
Forward exchange contracts 28,441,683 15,801,742
Guarantees 108,019,959 100,715,102
382,703,201 342,098,964
63.3 Liquidity Risk and Funding Management
The Bank's Liquidity risk management framework is in place to ensure that the payment obligations of the bank are made in a timely manner.
ALCO being the main management committee for managing liquidity and market risk, Bank’s funding plan is reviewed regularly and remedial measures are proposed to rectify any material mis-matches between assets and liabilities.
The table below presents the contractual undiscounted maturity of the bank’s financial liabilities.
31 December 2019 On demandLess than 3
months3 to 12 months 1 to 5 years Over 5 years Total
LKR ’000 LKR ’000 LKR ’000 LKR ’000 LKR ’000 LKR ’000
Due to banks - 2,669,407 - - - 2,669,407
Securities sold under resale agreements - 31,299,229 2,706,175 - - 34,005,404
Derivative financial instruments - 106,677 - - - 106,677
Due to customers 637,696,208 361,602,367 522,362,493 32,312,580 392,719,516 1,946,693,164
Other borrowings - 71,042,646 71,114,040 41,000,160 14,093,829 197,250,675
Total 637,696,208 466,720,326 596,182,708 73,312,740 406,813,345 2,180,725,327

About this Report / Performance Highlights 2019 / Chairman’s Message / General Manager’s Review / Organisational Overview / Strategic Report / Performance and Outlook / Stakeholder Value Creation / Financial Reports / Compliance Annexes / Supplementary Information
335
31 December 2018 On demandLess than 3
months3 to 12 months 1 to 5 years Over 5 years Total
LKR ’000 LKR ’000 LKR ’000 LKR ’000 LKR ’000 LKR ’000
Due to banks - 2,402,468 - - - 2,402,468
Securities sold under repurchase agreements - 99,743,183 7,916,047 - - 107,659,230
Derivative financial instruments - 509,018 - - - 509,018
Due to depositors 602,471,424 351,046,714 406,728,184 19,978,975 333,342,257 1,717,567,554
Other borrowings - 114,522,099 91,859,927 29,451,146 19,095,666 254,928,838
Total 602,471,424 568,223,482 506,504,158 49,430,121 352,437,923 2,079,067,108
63.4 Market Risk
Market risk is the risk that the fair value of the future cash flows of financial instruments will fluctuate due to changes in market variables such as interest rates, foreign exchange rates, equity prices and commodity prices. The Bank classifies exposures into either trading or non-trading portfolios and manages each of these portfolios separately. The market risk for the foreign exchange and equity trading portfolios are managed and monitored based on a Value at Risk (VaR) methodology that reflects the interdependency between risk variables. Interest rate risk of the trading portfolio is managed through Price Value per Basis Point (PVBP) and duration gap analysis.Trading and non trading portfolios are managed and monitored using sensitivity analysis and stress testing.
63.4.1 Currency Risk
Currency Risk is the risk of fluctuation of value of foreign currency denominated financial instruments due to changes in foreign exchange rates. The Bank carries a moderate level of open positions during the year which is within the prescribed limit of Central Bank of Sri Lanka. Profit over foreign currency trading transactions moved downward during the year compared to last year due to year on year rupee appreciation. A detailed limit structure along with VaR limits, counter party limits, country limits,day light limits,over night limits and loss limits prescribed by the IIRMD govern the foreign exchange risk of the bank. Stress testing analysis on foreign exchange is carriedout to measure the impact to profit and CAR during stress situations. Foreign Exchange VaR as at 31 December 2019 is LKR 25.6 million.
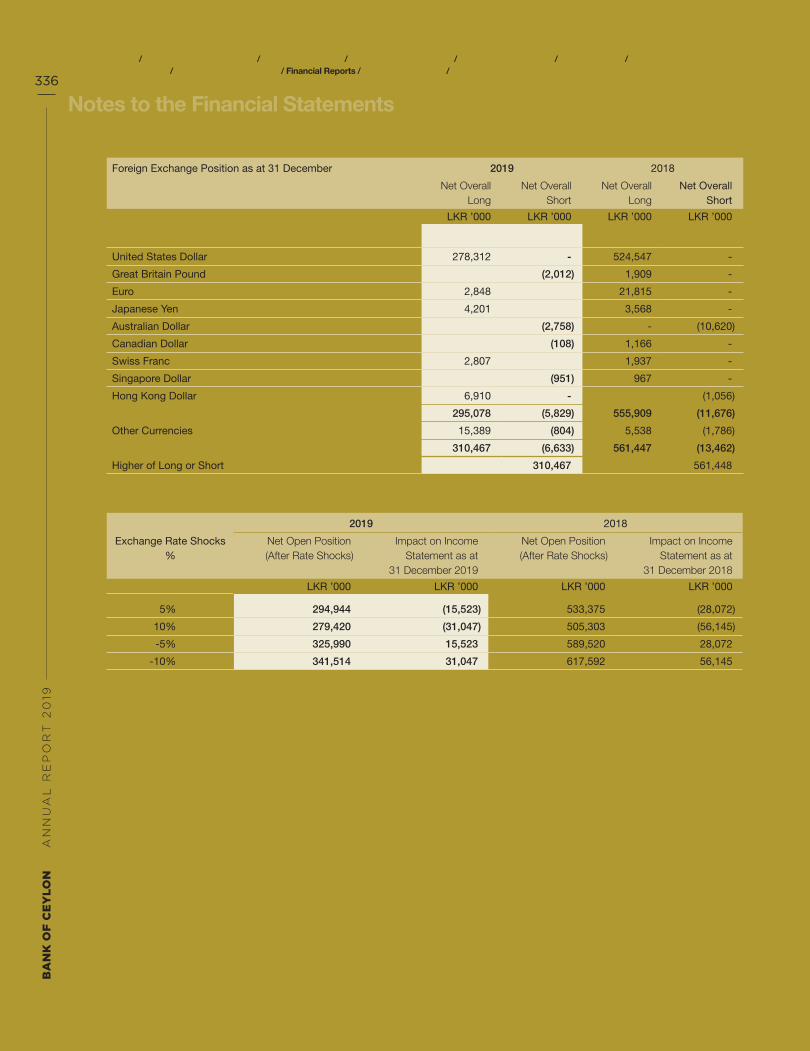
BA
NK
OF
CE
YL
ON
AN
NU
AL
RE
PO
RT
20
19
Notes to the Financial Statements336
About this Report / Performance Highlights 2019 / Chairman’s Message / General Manager’s Review / Organisational Overview / Strategic Report / Performance and Outlook / Stakeholder Value Creation / Financial Reports / Compliance Annexes / Supplementary Information
Foreign Exchange Position as at 31 December 2019 2018
Net Overall Long
Net Overall Short
Net Overall Long
Net Overall Short
LKR ’000 LKR ’000 LKR ’000 LKR ’000
Currency
United States Dollar 278,312 - 524,547 -
Great Britain Pound (2,012) 1,909 -
Euro 2,848 21,815 -
Japanese Yen 4,201 3,568 -
Australian Dollar (2,758) - (10,620)
Canadian Dollar (108) 1,166 -
Swiss Franc 2,807 1,937 -
Singapore Dollar (951) 967 -
Hong Kong Dollar 6,910 - (1,056)
Sub Total 295,078 (5,829) 555,909 (11,676)
Other Currencies 15,389 (804) 5,538 (1,786)
Grand Total 310,467 (6,633) 561,447 (13,462)
Higher of Long or Short 310,467 561,448
Impact on Income Statement due to Exchange Rate Shocks
2019 2018
Exchange Rate Shocks %
Net Open Position (After Rate Shocks)
Impact on Income Statement as at 31 December 2019
Net Open Position(After Rate Shocks)
Impact on Income Statement as at 31 December 2018
LKR ’000 LKR ’000 LKR ’000 LKR ’000
5% 294,944 (15,523) 533,375 (28,072)
10% 279,420 (31,047) 505,303 (56,145)
-5% 325,990 15,523 589,520 28,072
-10% 341,514 31,047 617,592 56,145

About this Report / Performance Highlights 2019 / Chairman’s Message / General Manager’s Review / Organisational Overview / Strategic Report / Performance and Outlook / Stakeholder Value Creation / Financial Reports / Compliance Annexes / Supplementary Information
337
63.4.2 Interest Rate Risk
Interest rate risk is the possibility that the future cash flows or the fair value of financial instruments fluctuate as a result of an unexpected changes in interest rates.
PVBP and Duration analysis are monitored daily basis to assess the impact of interest rate changes on Bank’s trading portfolios of treasury bonds and bills which are rate sensitive instruments.
Bank
For the year ended 31 December 2019 2018
LKR ’000 LKR ’000
PVBP
Investment in TBills 76,823 12,779
Investment in TBonds 133,266 290,243
Duration
Investment in TBills 0.5 Years 0.2 Years
Investment in TBonds 3.8 Years 2.4 Years
Sensitivity analysis of interest sensitive assets and liabilities is carried out to monitor interest rate risk in the banking book by placing those assets and liabilities in pre-determined maturity buckets considering its residual time to maturity and setting and monitoring gap limits and the repricing profile.
2019Upto 1Month
1-3 Months
3-6 Months
6-12Months
1-2 Years
2-3 Years
3-4 Years
4-5 Years
Over 5 Years
Rate sensitive assets 9.1 % 16.3 % 15.2% 11.9% 12.1% 12.1% 4.9% 4.9% 13.5%
Rate sensitive liabilities 9.1 % 16.0 % 12.1% 20.7% 4.1% 4.1% 3.9% 3.9% 26.1%
GAP 0.0 % 0.3% 3.1% (8.9%) 8.0% 8.0% 1.1% 1.1% (12.6%)
2018Upto 1Month
1-3 Months
3-6 Months
6-12Months
1-2 Years
2-3 Years
3-4 Years
4-5 Years
Over 5 Years
Rate sensitive assets 11.9% 15.1% 12.0% 16.3% 9.9% 9.9% 4.9% 4.9% 15.1%
Rate sensitive liabilities 13.6% 18.0% 11.7% 18.0% 3.6% 3.6% 3.6% 3.6% 24.2%
GAP (1.7%) (2.9%) 0.3% (1.7%) 6.3% 6.3% 1.3% 1.3% (9.1%)

BA
NK
OF
CE
YL
ON
AN
NU
AL
RE
PO
RT
20
19
Notes to the Financial Statements338
About this Report / Performance Highlights 2019 / Chairman’s Message / General Manager’s Review / Organisational Overview / Strategic Report / Performance and Outlook / Stakeholder Value Creation / Financial Reports / Compliance Annexes / Supplementary Information
63.4.3 Equity risk
Equity risk is the risk of deteriorating fair value of equity portfolio due to a change in the level of equity indices and individual stocks. Equity risk is monitored by stipulating overall portfolio limits and use of VaR methodology. The equity VaR is LKR 119,435,071 and risk appetite for equity VaR is LKR 250,000,000 for year 2019.
Equity VaR2019
LKR ’0002018
LKR ’000
31 December 119,435 115,030
Highest 120,727 117,494
Lowest 2 81,305
Average 109,844 97,540
63.5 Operational Risk
Operational risk is the risk of loss resulting from inadequate or failed internal processes, people and systems or from external events.Even though the capital allocated for operational risk as per the Basic Indicator Approach (BIA) was significant, the actual operational loss was far below the allocated capital.
63.6 Capital Management
The primary objective of Capital Management is to ensure maintenance of minimum regulatory capital requirement. The Bank ensures that adequate capital has been allocated to achieve strategic objectives and within the Risk Appetite of the Bank.
63.6.1 Capital Adequacy
The capital Adequacy Ratio (CAR) is a measurement of a bank's available capital expressed as a percentage of risk-weighted assets of credit, market and operational aspects of the banking business. It is a measure of financial strength of the Bank which indicates its ability to maintain adequate capital to face with unforeseen scenarios. It is used to protect depositors and promote the stability and efficiency of financial system.
Central Bank of Sri Lanka (CBSL) plays a vital role in defining minimum requirements and monitoring CAR to ensure that banks are not participating in business activities that increase the risk of default and banks have enough capital to sustain operating losses and thereby maintaining confidence in the banking system.
The Bank calculates CAR based on CBSL guide lines stemming from International Convergence of capital Measurement and Capital Standards, Revised framework. IIRMD actively and continuously monitor the CAR, while stressing rigorously for worst possible scenarios. ICAAP factors out all possible risks such as reputation risk, strategic risk, compliance risk, concentration risk, & interest rate risk on banking book.

Compliance Annexes
Compliance with Code of Best Practice on Corporate Governance
2017 Issued By CA Sri Lanka 340
Compliance Requirements as per Banking Act Direction No. 11 of 2007 347
Compliance Requirements Enforced by Colombo Stock Exchange 372
Compliance Requirements Enforced by the Central Bank of Sri Lanka 374
Capital Adequacy 378
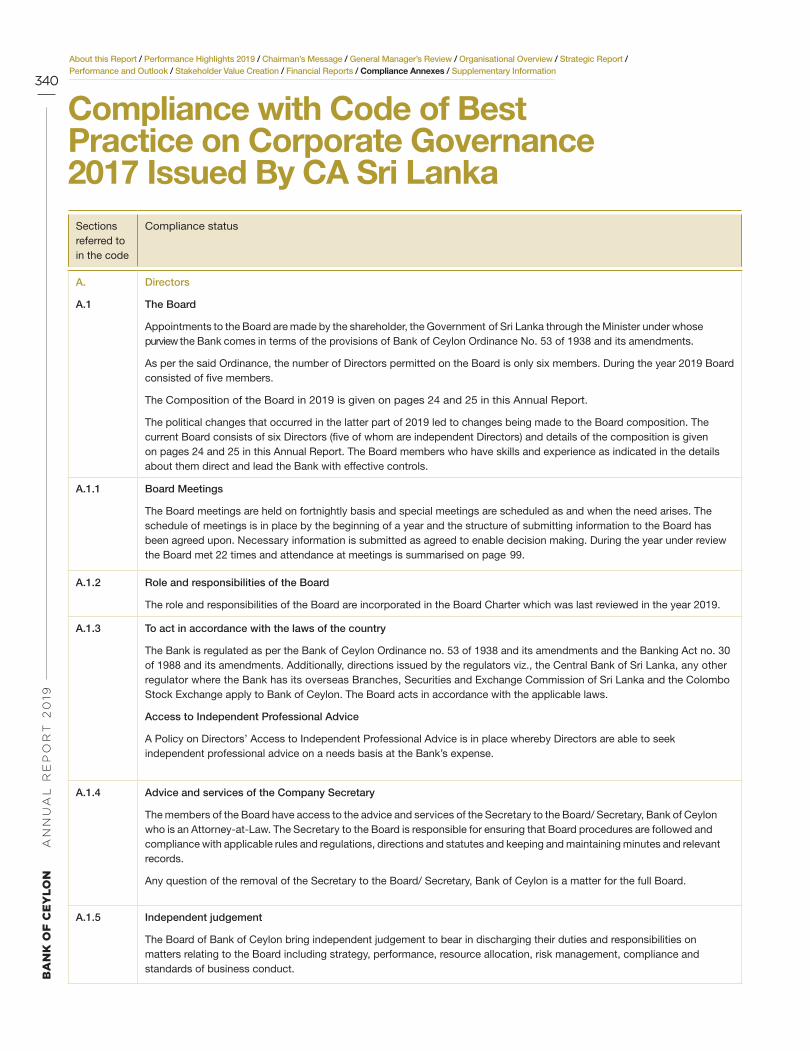
BA
NK
OF
CE
YL
ON
AN
NU
AL
RE
PO
RT
20
19
340
About this Report / Performance Highlights 2019 / Chairman’s Message / General Manager’s Review / Organisational Overview / Strategic Report / Performance and Outlook / Stakeholder Value Creation / Financial Reports / Compliance Annexes / Supplementary Information
Compliance with Code of BestPractice on Corporate Governance2017 Issued By CA Sri Lanka
Sections referred to in the code
Compliance status
A.
A.1
Directors
The Board
Appointments to the Board are made by the shareholder, the Government of Sri Lanka through the Minister under whose purview the Bank comes in terms of the provisions of Bank of Ceylon Ordinance No. 53 of 1938 and its amendments.
As per the said Ordinance, the number of Directors permitted on the Board is only six members. During the year 2019 Board consisted of five members.
The Composition of the Board in 2019 is given on pages 24 and 25 in this Annual Report.
The political changes that occurred in the latter part of 2019 led to changes being made to the Board composition. The current Board consists of six Directors (five of whom are independent Directors) and details of the composition is given on pages 24 and 25 in this Annual Report. The Board members who have skills and experience as indicated in the details about them direct and lead the Bank with effective controls.
A.1.1 Board Meetings
The Board meetings are held on fortnightly basis and special meetings are scheduled as and when the need arises. The schedule of meetings is in place by the beginning of a year and the structure of submitting information to the Board has been agreed upon. Necessary information is submitted as agreed to enable decision making. During the year under review the Board met 22 times and attendance at meetings is summarised on page 99.
A.1.2 Role and responsibilities of the Board
The role and responsibilities of the Board are incorporated in the Board Charter which was last reviewed in the year 2019.
A.1.3 To act in accordance with the laws of the country
The Bank is regulated as per the Bank of Ceylon Ordinance no. 53 of 1938 and its amendments and the Banking Act no. 30 of 1988 and its amendments. Additionally, directions issued by the regulators viz., the Central Bank of Sri Lanka, any other regulator where the Bank has its overseas Branches, Securities and Exchange Commission of Sri Lanka and the Colombo Stock Exchange apply to Bank of Ceylon. The Board acts in accordance with the applicable laws.
Access to Independent Professional Advice
A Policy on Directors’ Access to Independent Professional Advice is in place whereby Directors are able to seek independent professional advice on a needs basis at the Bank’s expense.
A.1.4 Advice and services of the Company Secretary
The members of the Board have access to the advice and services of the Secretary to the Board/ Secretary, Bank of Ceylon who is an Attorney-at-Law. The Secretary to the Board is responsible for ensuring that Board procedures are followed and compliance with applicable rules and regulations, directions and statutes and keeping and maintaining minutes and relevant records.
Any question of the removal of the Secretary to the Board/ Secretary, Bank of Ceylon is a matter for the full Board.
A.1.5 Independent judgement
The Board of Bank of Ceylon bring independent judgement to bear in discharging their duties and responsibilities on matters relating to the Board including strategy, performance, resource allocation, risk management, compliance and standards of business conduct.

About this Report / Performance Highlights 2019 / Chairman’s Message / General Manager’s Review / Organisational Overview / Strategic Report / Performance and Outlook / Stakeholder Value Creation / Financial Reports / Compliance Annexes / Supplementary Information
341
Sections referred to in the code
Compliance status
A.1.6 Dedicating adequate time and effort to matters of the Board and the Bank
The agenda and Board memoranda are circulated among the Board members seven days prior to the meeting through a secure e-Solution enabling them to dedicate sufficient time before a meeting to review Board memoranda and call for additional information and clarification.
A.1.7 Calling of Resolution
The Board members can individually submit proposals to the Board when they feel that they are in the best interests of the Bank and a resolution can be presented to the Board.
A.1.8 Training for Directors
When first appointed to the Board, the Directors undergo an induction programme covering the applicable regulatory requirements, Bank’s history, organisational structure, details of subsidiaries and associates, products and services and Directors’ responsibilities and are provided with a Board Manual incorporating all the above given in e-form through the Bank’s electronic support system. Directors are encouraged to attend relevant training programmes and are apprised of the latest developments in the Bank and external environment by members of the Corporate Management or through external resource personnel.
A.2 Division of responsibilities between the Chairman and Chief Executive Officer (CEO)
The positions of the Chairman and the Chief Executive Officer (referred to as the “General Manager” in the Bank) are held by two separate individuals. The Chairman is a Non –Executive Director. There is a clear division of responsibilities between the Chairman and the General Manager and the Board Charter adopted by the Bank clearly defines these responsibilities.
A.3 Chairman’s Role
The Chairman of Bank of Ceylon provides leadership to the Board, preserves order and facilitates the effective discharge of the Board’s functions. The agenda for Board meetings is prepared by the Secretary, Bank of Ceylon/ Secretary to the Board under the authority delegated by the Chairman based on the memoranda submitted through the General Manager and any other relevant matters proposed by a Director/s. The agenda covers matters relating to strategy, performance, resource allocation, risk management and compliance. Sufficiently detailed information on matters included in the agenda is circulated to Directors seven days prior to the meetings through a secure e-Solution.
All Directors are informed of their duties and responsibilities (which are enshrined in the Board Charter) and the Board Subcommittee structure of the Bank which assists the Board in discharging its responsibilities.
The Board of Bank of Ceylon consists entirely of Non-Executive Directors and they effectively contribute within their respective capabilities, for the benefit of the Bank.
Directors are encouraged to seek information considered necessary to discuss matters on the agenda of meetings and to request inclusion of matters of corporate concern on the agenda.
The views of Directors on issues under consideration are ascertained and a record of such deliberations are reflected in the minutes in detail.
A.4 Financial acumen
The Directors have sufficient financial acumen and knowledge to guide the Bank which they have acquired through the businesses/ professions in which they are involved and from qualifications held.

BA
NK
OF
CE
YL
ON
AN
NU
AL
RE
PO
RT
20
19
342
About this Report / Performance Highlights 2019 / Chairman’s Message / General Manager’s Review / Organisational Overview / Strategic Report / Performance and Outlook / Stakeholder Value Creation / Financial Reports / Compliance Annexes / Supplementary Information
Sections referred to in the code
Compliance status
A.5 Board Balance
The Board of Bank of Ceylon is always comprised of Non-Executive Directors. When Alternate Directors are appointed, it is also ensured that they are Non-Executive.
A.6 Provision of timely information
The agenda and Board memoranda required for a Board/ Subcommittee Meeting are provided to Directors through the available e-Solution seven days in advance of the meeting for them to review the memoranda in advance and come up with questions and discussion points and to request for additional information if necessary.
The members of the Corporate Management are available if the Directors wish to obtain further information or for any clarification. Board meeting minutes are made available to the Directors within 10 days from the meeting.
A.7 Appointments to the Board
Appointments to the Board are made by the Government of Sri Lanka, through the Minister under whose purview the Bank falls. The requisite regulatory requirements relating to appointment of new Directors are complied with.
A.8 Re-appointment
Every Director appointed shall hold office for a period of three years, unless he is removed from office earlier or he vacates his office in terms of the Bank of Ceylon Ordinance no. 53 of 1938 and its amendments. In either case, he is eligible to be reappointed.
Resignation
An appointed Director may resign from his directorship by a letter addressed to the Minister under whose purview the Bank falls and any director who vacates office by ending the term is eligible for re-appointment. If it is due to a special reason, it is indicated in their resignation letter.
A.9 Appraisal of Board and its subcommittees
An annual self-evaluation of its own performance is undertaken by the Board and Board Subcommittees to ensure that Board’s and that of its subcommittees responsibilities are satisfactorily discharged. The collective outcome is reviewed and addressed by the Board. Due to Board changes that took place in latter part of 2019, these evaluations were not carried out in respect of 2019.
A.10 Disclosure of information in respect of Directors in the Annual Report
The following information pertaining to Directors are included in the Annual Report-
Profile of the Directors covering name, qualifications, nature of expertise and whether Executive/ Non Executive indicated on pages 24 to 25*
Related party information indicated on page 300 and 301
Directorships in other companies indicated on pages 25*
Membership of Subcommittees * and the number of Board and Subcommittee meetings attended during the year are indicated on page no 99.
* Summary information of Directors in 2019 are given on page136
Compliance with Code of Best Practice on Corporate Governance 2017 Issued By CA Sri Lanka

About this Report / Performance Highlights 2019 / Chairman’s Message / General Manager’s Review / Organisational Overview / Strategic Report / Performance and Outlook / Stakeholder Value Creation / Financial Reports / Compliance Annexes / Supplementary Information
343
Sections referred to in the code
Compliance status
A.11 Appraisal of the Chief Executive Officer/ General Manager
The performance evaluation of the General Manager is carried out annually based on the targets set at the commencement of the fiscal year in line with Corporate Plan by the Human Resource and Remuneration Committee and the final report is submitted to the Board. At the end of year 2019, due to the changes done to the Board subsequent to political changes, this evaluation was not carried out in the agreed manner, but the performance was informed to the Board in the Corporate Plan launching session in 2020.
B
B .1
Directors’ Remuneration
There is a formal Remuneration Policy in place for the Chairman and Board of Directors (all Non-Executive). The above policy is formulated based on the circulars issued by the Government, the shareholder, from time to time and other applicable legislation.
B.2 The Bank’s Human Resource and Remuneration Committee accordingly has no role in deciding the remuneration of Directors. (It however recommends remuneration of senior executives)
B.3 Disclosure of Remuneration
Statement of Remuneration Policy for the Chairman and the Directors is contained in page 113 of this Annual Report. Details of remuneration paid to the Board as a whole is indicated on page no 188.
The composition of the Human Resource and Remuneration Committee appears on page 113.
C
C.1
Relations with Shareholders
The Government of Sri Lanka being the sole shareholder of the Bank, the Bank’s communication to the shareholder happens in various forms. A Government representative (an officer from the Ministry of Finance) is on the Board, directly representing the shareholder, and the Annual Report is placed before the Parliament of Sri Lanka and is open to question by the Parliament.
C.2 A Board approved Communication Policy is in place.
Major issues and concerns of the shareholder viz. Government of Sri Lanka are discussed during the Board meetings with the participation of the direct Government representative on the Board and elevated to the Ministry or higher levels as may be necessary.
C.3 Further to complying with requirements of the Bank of Ceylon Ordinance No. 53 of 1938, the Banking Act no. 30 of 1988, Securities and Exchange Commission of Sri Lanka Act and their amendments and the Listing Rules of the Colombo Stock Exchange; as applicable, Directors disclose to the relevant Ministry all proposed major and material transactions the Bank wishes to enter into.
There were no transactions which would materially affect the Bank’s performance or net asset base nor related party transactions during the year other than what is disclosed under notes to the financial statements on page 300 and 301.
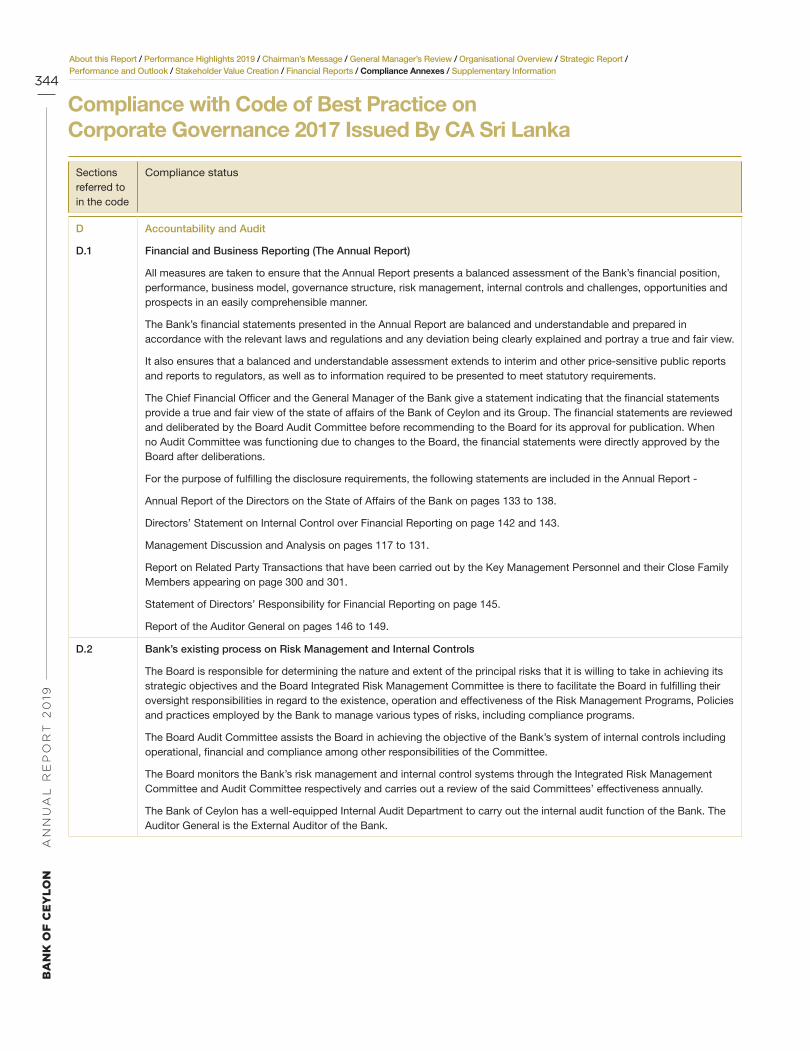
BA
NK
OF
CE
YL
ON
AN
NU
AL
RE
PO
RT
20
19
344
About this Report / Performance Highlights 2019 / Chairman’s Message / General Manager’s Review / Organisational Overview / Strategic Report / Performance and Outlook / Stakeholder Value Creation / Financial Reports / Compliance Annexes / Supplementary Information
Sections referred to in the code
Compliance status
D
D.1
Accountability and Audit
Financial and Business Reporting (The Annual Report)
All measures are taken to ensure that the Annual Report presents a balanced assessment of the Bank’s financial position, performance, business model, governance structure, risk management, internal controls and challenges, opportunities and prospects in an easily comprehensible manner.
The Bank’s financial statements presented in the Annual Report are balanced and understandable and prepared in accordance with the relevant laws and regulations and any deviation being clearly explained and portray a true and fair view.
It also ensures that a balanced and understandable assessment extends to interim and other price-sensitive public reports and reports to regulators, as well as to information required to be presented to meet statutory requirements.
The Chief Financial Officer and the General Manager of the Bank give a statement indicating that the financial statements provide a true and fair view of the state of affairs of the Bank of Ceylon and its Group. The financial statements are reviewed and deliberated by the Board Audit Committee before recommending to the Board for its approval for publication. When no Audit Committee was functioning due to changes to the Board, the financial statements were directly approved by the Board after deliberations.
For the purpose of fulfilling the disclosure requirements, the following statements are included in the Annual Report -
Annual Report of the Directors on the State of Affairs of the Bank on pages 133 to 138.
Directors’ Statement on Internal Control over Financial Reporting on page 142 and 143.
Management Discussion and Analysis on pages 117 to 131.
Report on Related Party Transactions that have been carried out by the Key Management Personnel and their Close Family Members appearing on page 300 and 301.
Statement of Directors’ Responsibility for Financial Reporting on page 145.
Report of the Auditor General on pages 146 to 149.
D.2 Bank’s existing process on Risk Management and Internal Controls
The Board is responsible for determining the nature and extent of the principal risks that it is willing to take in achieving its strategic objectives and the Board Integrated Risk Management Committee is there to facilitate the Board in fulfilling their oversight responsibilities in regard to the existence, operation and effectiveness of the Risk Management Programs, Policies and practices employed by the Bank to manage various types of risks, including compliance programs.
The Board Audit Committee assists the Board in achieving the objective of the Bank’s system of internal controls including operational, financial and compliance among other responsibilities of the Committee.
The Board monitors the Bank’s risk management and internal control systems through the Integrated Risk Management Committee and Audit Committee respectively and carries out a review of the said Committees’ effectiveness annually.
The Bank of Ceylon has a well-equipped Internal Audit Department to carry out the internal audit function of the Bank. The Auditor General is the External Auditor of the Bank.
Compliance with Code of Best Practice on Corporate Governance 2017 Issued By CA Sri Lanka

About this Report / Performance Highlights 2019 / Chairman’s Message / General Manager’s Review / Organisational Overview / Strategic Report / Performance and Outlook / Stakeholder Value Creation / Financial Reports / Compliance Annexes / Supplementary Information
345
Sections referred to in the code
Compliance status
D.3 Audit Committee
The Board Audit Committee comprised exclusively of Non-Executive Directors during the year under review. The Chairmen of the Committee during the year under review were Independent Non- Executive Directors. The Chairmen and the members of the Audit Committee had relevant experience in financial reporting and control.
The Board Audit Committee assists the Bank’s Board in fulfilling its oversight responsibilities.
The Board Audit Committee ensures the carrying out of the reviews of the processes and effectiveness of risk management and internal controls and audit reports are submitted to the Committee. The role and responsibilities of the Audit Committee is disclosed in the Audit Committee Report appearing on pages 109 to 118 of this Annual Report.
The Audit Committee has a written Terms of Reference which clearly defines its role and responsibilities. The activities performed by the Committee during the year under review appears on pages 109 to 110 of this Annual Report.
D.4 Related Party Transactions
The Bank has a Board approved Policy on Related Party Transactions in place covering related parties, their transactions and restrictions on offering non favorable treatment to related parties in order for the Board members to avoid any conflict of interest in this regard.
Report on Related Party Transactions that have been carried out by the Key Management Personnel and their Close Family Members appear on page 300 and 301 of this Annual Report.
D.5 Code of Business Conduct and Ethics
The Bank maintains a Code of Ethics for the employees of the Bank and a separate Code of Business Conduct and Ethics for the Directors and an acknowledgement is obtained for affirmation of compliance with the Codes.
D.6 Corporate Governance Disclosures
The Corporate Governance Report which is appearing on pages 99 and 108 discloses the extent of compliance with the provisions of the Code of Best Practice on Corporate Governance.
F.1 and F.2 Shareholder
The Government of Sri Lanka is the sole shareholder of the Bank.

BA
NK
OF
CE
YL
ON
AN
NU
AL
RE
PO
RT
20
19
346
About this Report / Performance Highlights 2019 / Chairman’s Message / General Manager’s Review / Organisational Overview / Strategic Report / Performance and Outlook / Stakeholder Value Creation / Financial Reports / Compliance Annexes / Supplementary Information
Sections referred to in the code
Compliance status
G Internet of things and Cybersecurity
The Bank has a process in place to identify as to how the Bank’s business model, IT devices within and outside the Bank can connect to the Bank’s network to send and receive information and the consequent cyber security risks that may affect the business.
A Board approved Information Security Policy is in place which provides the management direction and support to ensure protection of the Bank’s information assets.
In addition, the Integrated Risk Management Committee assists the Board in ensuring that the Bank is protected from Cyber Security threats by recommending and following up on vulnerability assessments and reporting to the Board. Processes to identify and manage cyber security risks are included in the Risk Management Report of this Annual Report on page 59.
The Bank has appointed a Chief Information Security Officer, in order to implement the Cyber Security Risk Management Policy.
The Board Information and Communication Technology Committee that was established in 2018 will function fully in 2020 ( this Committee did not meet during the year 2019) to assist the Board of Directors in fulfilling its oversight responsibilities related to information and communication technology and provide appropriate advice and recommendations to facilitate decision making by the Board.
H Environment, Society and Governance (ESG)
ESG related disclosures appears in pages 78 to 86 of this Annual Report.
Compliance with Code of Best Practice on Corporate Governance 2017 Issued By CA Sri Lanka

About this Report / Performance Highlights 2019 / Chairman’s Message / General Manager’s Review / Organisational Overview / Strategic Report / Performance and Outlook / Stakeholder Value Creation / Financial Reports / Compliance Annexes / Supplementary Information
347
Compliance Requirements as PerBanking Act Direction No. 11 of 2007
Section Principle Level of Compliance during the Year 2019
3 (1) The Responsibilities of the Board
3 (1) (i) The Board shall strengthen the safety and soundness of the bank by ensuring the implementation of the following:
a. Approve and oversee the bank’s strategic objectives and corporate values and ensure that these are communicated throughout the bank;
Complied with.
Strategic objectives are formulated and values are reviewed at sessions held at an off- site location with the participation of the Board and the Key Management Personnel. The Board approved Corporate Plan together with the corporate values were communicated to staff up to Branch Manager level at an off-site location where the Corporate Plan was launched and reinforced by the Corporate Management Team. All other levels of staff were informed through regular briefing sessions and at meetings.
The Board approved Corporate Plan for 2020-2022 is in place which was launched at an off-site location. In addition, Corporate values are included in the intranet.
b. Approve the overall business strategy of the bank, including the overall risk policy and risk management procedures and mechanisms with measurable goals, for at least the next three years;
Complied with.
The Bank’s overall Business Strategy is included in the rolling Corporate Plan for a period of three years and the related Action Plan for the same period which was approved by the Board.
The risk appetite, risk management framework and mechanisms have also been approved by the Board in line with the strategic plan. Measurable goals for the Bank as a whole have been set and performance is measured in line with these goals.
c. Identify the principal risks and ensure implementation of appropriate systems to manage the risks prudently;
Complied with.
The Board has appointed a Board Integrated Risk Management Committee tasked with approving the Bank’s Integrated Risk Management Policy, defining the risk appetite, identifying principal risks, setting governance structures and implementing systems to measure, monitor and manage the principal risks.
The Bank has implemented a process where the Board members discuss at length the risks arising out of new strategies and the ways and means to mitigate such risks.
A Board approved Integrated Risk Management Policy covering all areas of major risks is in place.
• The following reports also provide further details in this regard: Risk Management Report on pages 44 to 61.
• Integrated Risk Management Committee Report on page 111 and 112.
d. Approve implementation of a policy of communication with all stakeholders, including depositors, creditors, shareholders and borrowers;
Complied with.
Board has approved and implemented a Communication Policy covering all stakeholders which is reviewed periodically.

BA
NK
OF
CE
YL
ON
AN
NU
AL
RE
PO
RT
20
19
348
About this Report / Performance Highlights 2019 / Chairman’s Message / General Manager’s Review / Organisational Overview / Strategic Report / Performance and Outlook / Stakeholder Value Creation / Financial Reports / Compliance Annexes / Supplementary Information
Section Principle Level of Compliance during the Year 2019
e. Review the adequacy and the integrity of the bank’s internal control systems and management information systems;
Complied with.
The Board Audit Committee which reports to the Board is tasked with reviewing the adequacy and the integrity of the Bank’s internal control system and financial reporting. This Committee reviewed reports from the Internal Audit Department which reports directly to the Audit Committee and from the External Auditors in carrying out this task.
Internal Audit Department is tasked with the responsibility of conducting information systems audits to assess the effectiveness of the Management Information System (MIS). The Board has reviewed the adequacy of the MIS and the Internal Control System.
f. Identify and designate Key Management Personnel; Complied with.
The Bank has identified the General Manager, Senior Deputy General Managers, Deputy General Managers, Assistant General Managers and officers in allied grades as Key Management Personnel (KMP) of the Bank for Corporate Governance purposes.
g. Define the areas of authority and key responsibilities for the Board of Directors themselves and for the Key Management Personnel;
Complied with.
Areas of authority and key responsibilities have been defined for the Directors and Key Management Personnel through the Board Charter and position descriptions respectively.
Board Charter was reviewed in the year 2019.
h. Ensure that there is appropriate oversight of the affairs of the bank by Key Management Personnel, that is consistent with Board policy;
Complied with.
Performance against the Bank’s Corporate Plan is reviewed by the Board based on the Action Plan.
Key Management Personnel make presentations to the Board on matters under their purview and are also called in by the Board as and when needed to explain matters relating to their areas.
i. Periodically assess the effectiveness of the Board Directors’ own governance practices, including:
(i) the selection, nomination and election of Directors and Key Management Personnel;
(ii) the management of conflicts of interests; and
(iii) the determination of weaknesses and implementation of changes where necessary;
Generally, a self-evaluation of the performance of the Board is carried out annually assessing its own governance practices.
However, consequent to Government changes and the resignations of the Board members in November 2019 and appointment of a new Board in beginning of the year 2020, the self-assessment of Board of Directors was not carried out.
This evaluation will be continued in 2020.
A Board approved Conflict of Interest is in place and its compliance is monitored.
j. Ensure that the bank has an appropriate succession plan for Key Management Personnel;
Complied with.
A Board approved Succession Plan for Key Management Personnel (viz. for the Corporate and Executive Management) is in place which was reviewed and revised by the Nomination and Corporate Governance Committee in year 2019 and recommended to the Board.
Compliance Requirements as PerBanking Act Direction No. 11 of 2007

About this Report / Performance Highlights 2019 / Chairman’s Message / General Manager’s Review / Organisational Overview / Strategic Report / Performance and Outlook / Stakeholder Value Creation / Financial Reports / Compliance Annexes / Supplementary Information
349
Section Principle Level of Compliance during the Year 2019
k. Meet regularly, on a needs basis, with the Key Management Personnel to review policies, establish communication lines and monitor progress towards corporate objectives;
Complied with.
Key management Personnel are regularly present or are called in for discussions at the meetings of the Board and its Subcommittees on policy and other matters relating to their areas. Progress towards the corporate objectives are monitored based on the Corporate Plan. Mid-year review of achievements against Corporate Plan 2019/2021 by the Deputy General Managers was conducted at the Bank of Ceylon and an off-site location with the participation of the Board of Directors and Executive Management.
l. Understand the regulatory environment and ensure that the bank maintains an effective relationship with regulators;
Complied with.
On appointment as Directors, they are furnished with all applicable regulatory requirements pertaining to the Bank with the “Board Manual” given in e-form.
They are also briefed about developments in the regulatory environment at Board meetings to ensure that their knowledge is updated regularly to facilitate effective discharge of their responsibilities. Any relevant communication from a regulator is brought to the notice of the Board immediately.
Information pertaining to Compliance reports submitted to the Central Bank of Sri Lanka which includes all returns to regulators are presented to the Board monthly and monitored by the Board. The Board is informed of regulatory requirements pertaining to Chennai, Maldives and Seychelles operations of the Bank.
m. Exercise due diligence in the hiring and oversight of External Auditors.
Complied with.
As provided for in the Constitution of the country, the Auditor General is the External Auditor of the Bank as it is a State-Owned Enterprise.
3 (1) (ii) The Board shall appoint the Chairman and the Chief Executive Officer and define and approve the functions and responsibilities of the Chairman and the Chief Executive Officer in line with Direction 3 (5) of these Directions.
Complied with when read in conjunction with Direction No. 3 (9) (ii).
The Board appoints the Chief Executive Officer referred to as the General Manager in the Bank of Ceylon with the approval of the Minister under whose purview the Bank falls and the Chairman is appointed by the said Minister in terms of the Bank of Ceylon Ordinance No. 53 of 1938 and its amendments.
The Board has also approved their functions and responsibilities maintaining the balance of power between the two roles through the Board Charter which was reviewed in year 2019.
3 (1) (iii) The Board shall meet regularly and Board meetings shall be held at least twelve times a year at approximately monthly intervals. Such regular Board meetings shall normally involve active participation in person of a majority of Directors entitled to be present. Obtaining the Board’s consent through the circulation of written resolutions/ papers shall be avoided as far as possible.
Complied with.
Regular fortnightly Board meetings are held and special meetings are scheduled as and when the need arises. During the year under review the Board met 22 times.
The Bank endeavours to minimise obtaining approval via circular resolutions and it is done only on an exceptional basis and such resolutions are ratified by the Board at the next meeting. During the year 2019, 11 such resolutions have been adopted by circulation.

BA
NK
OF
CE
YL
ON
AN
NU
AL
RE
PO
RT
20
19
350
About this Report / Performance Highlights 2019 / Chairman’s Message / General Manager’s Review / Organisational Overview / Strategic Report / Performance and Outlook / Stakeholder Value Creation / Financial Reports / Compliance Annexes / Supplementary Information
Section Principle Level of Compliance during the Year 2019
3 (1) (iv) The Board shall ensure that arrangements are in place to enable all Directors to include matters and proposals in the agenda for regular Board meetings where such matters and proposals relate to the promotion of business and the management of risks of the bank.
Complied with.
Meetings are scheduled and the Board is informed at the beginning of each calendar year to enable submission of proposals to the agenda for regular Board meetings.
3 (1) (v) The Board procedures shall ensure that notice of at least seven days is given of a regular Board meeting to provide all Directors an opportunity to attend. For all other Board meetings, reasonable notice may be given.
Complied with.
Notice of meetings are given through an Annual Calendar at the beginning of the year. Agenda and Board papers for the Board and Subcommittee meetings are circulated to the Directors seven days prior to the meetings through a secure e-Solution.
Reasonable notice is given before any special meetings and consent of all Directors are obtained prior to scheduling a special meeting.
3 (1) (vi) The Board procedures shall ensure that a Director who has not attended at least two-thirds of the meetings in the period of 12 months immediately preceding or has not attended the immediately preceding three consecutive meetings held, shall cease to be a Director. Participation at the Directors’ meetings through an alternate Director shall, however, be acceptable as attendance.
Complied with.
The Directors are apprised of their attendance in accordance with the Corporate Governance Code. Details of the Directors’ attendance are set out on page 99. Directors’ attendance has been in compliance with this Direction.
3 (1) (vii) The Board shall appoint a Company Secretary who satisfies the provisions of Section 43 of the Banking Act No. 30 of 1988, whose primary responsibilities shall be to handle the secretariat services to the Board and shareholder meetings and to carry out other functions specified in the statutes and other regulations.
Complied with.
The Secretary, Bank of Ceylon/ Secretary to the Board is an Attorney-at-Law, whose credentials/ qualifications are in compliance with the provisions of Section 43 of the Banking Act No. 30 of 1988 and its amendments. She is primarily responsible for handling the secretariat services to the Board and carrying out other functions specified in the statutes and other regulations.
3 (1) (viii) All Directors shall have access to advice and services of the Company Secretary with a view to ensuring that Board procedures and all applicable rules and regulations are followed.
Complied with.
All members of the Board have the opportunity to obtain the advice and services of the Secretary to the Board who is an Attorney-at-Law and who is responsible to the Board for follow-up of Board procedures, compliance with rules and regulations, directions and statutes.
3 (1) (ix) The Company Secretary shall maintain the minutes of Board meetings and such minutes shall be open for inspection at any reasonable time, on reasonable notice by any Director.
Complied with.
The Secretary, Bank of Ceylon/ Secretary to the Board maintains the minutes of the Board meetings and circulates same to all Board members through a secure e-Solution.
The minutes are approved at the subsequent Board meeting. Additionally, the Directors have access to the past Board papers and minutes through the same e-Solution.
Compliance Requirements as PerBanking Act Direction No. 11 of 2007

About this Report / Performance Highlights 2019 / Chairman’s Message / General Manager’s Review / Organisational Overview / Strategic Report / Performance and Outlook / Stakeholder Value Creation / Financial Reports / Compliance Annexes / Supplementary Information
351
Section Principle Level of Compliance during the Year 2019
3 (1) (x) Minutes of Board meetings shall be recorded in sufficient detail so that it is possible to gather from the minutes, as to whether the Board acted with due care and prudence in performing its duties. The minutes shall also serve as a reference for regulatory and supervisory authorities to assess the depth of deliberations at the Board meetings. Therefore, the minutes of a Board meeting shall clearly contain or refer to the following:
a. a summary of data and information used by the Board in its deliberations;
b. the matters considered by the Board;
c. the fact-finding discussions and the issues of contention or dissent which may illustrate whether the Board was carrying out its duties with due care and prudence;
d. the testimonies and confirmations of relevant executives which indicate compliance with the Board’s strategies and policies and adherence to relevant laws and regulations;
e. the Board’s knowledge and understanding of the risks to which the bank is exposed and an overview of the risk management measures adopted; and
f. the decisions and Board resolutions.
Complied with.
Minutes of the meetings are kept covering the given criteria.
3 (1) (xi) There shall be a procedure agreed by the Board to enable Directors, upon reasonable request, to seek independent professional advice in appropriate circumstances, at the bank’s expense. The Board shall resolve to provide separate independent professional advice to Directors to assist the relevant Director or Directors to discharge his/her/their duties to the bank.
Complied with.
A Policy for Directors’ Access to Independent Professional Advice is in place and the Directors are able to obtain independent professional advice when deemed necessary.
3 (1) (xii) Directors shall avoid conflicts of interests, or the appearance of conflicts of interest, in their activities with, and commitments to, other organisations or related parties. If a Director has a conflict of interest in a matter to be considered by the Board, which the Board has determined to be material, the matter should be dealt with at a Board meeting, where Independent Non-Executive Directors [refer to Direction 3 (2) (iv) of these Directions] who have no material interest in the transaction, are present. Further, a Director shall abstain from voting on any Board resolution in relation to which he / she or any of his / her close relation or a concern, in which a Director has substantial interest, is interested and he/she shall not be counted in the quorum for the relevant agenda item at the Board meeting.
Complied with.
The Directors are conscious of their obligation to deal with a situation when there is a conflict of interest in accordance with applicable regulations. A Board approved Policy on Conflict of Interest is in place. As a practice at every Board Meeting, Directors are required to declare any interest in contracts /new appointments to any other Board or Institution. Directors abstain from participating in the discussions, voicing their opinion or approving in situations where there is a conflict of interest.

BA
NK
OF
CE
YL
ON
AN
NU
AL
RE
PO
RT
20
19
352
About this Report / Performance Highlights 2019 / Chairman’s Message / General Manager’s Review / Organisational Overview / Strategic Report / Performance and Outlook / Stakeholder Value Creation / Financial Reports / Compliance Annexes / Supplementary Information
Section Principle Level of Compliance during the Year 2019
3 (1) (xiii) The Board shall have a formal schedule of matters specifically reserved to it for decision to ensure that the Direction and control of the bank is firmly under its authority.
Complied with.
Powers reserved for the Board are included in the Board Charter.
3 (1) (xiv) The Board shall, if it considers that the bank is, or is likely to be, unable to meet its obligations or is about to become insolvent or is about to suspend payments due to depositors and other creditors, forthwith inform the Director of Bank Supervision of the situation of the bank prior to taking any decision or action.
Complied with.
Such a situation has not arisen during the year 2019. Monthly Financial Statements submitted to the Board assures the Board of the Bank’s solvency.
3 (1) (xv) The Board shall ensure that the bank is capitalised at levels as required by the Monetary Board in terms of the Capital Adequacy Ratio and other prudential grounds.
Complied with.
The Board ensures that the Bank is capitalised at levels as required by the Monetary Board in terms of the Capital Adequacy Ratio (CAR) and other prudential grounds. Capital Augmentation Plan is submitted to the Board on quarterly basis.
Calculation of CAR is submitted to the Board with the monthly Financial Statements of the Bank.
3 (1) (xvi) The Board shall publish in the bank’s Annual Report, an Annual Corporate Governance Report setting out the compliance with Direction 3 of these Directions.
Complied with.
These disclosures are part of the Corporate Governance Report in the Bank’s Annual Report.
3 (1) (xvii) The Board shall adopt a scheme of self-assessment to be undertaken by each Director annually, and maintain records of such assessments.
A scheme of self-assessment is adopted. The self-assessment reports of the Board members are maintained by the Secretary, Bank of Ceylon/ Secretary to the Board.
However, in respect of year 2019, this assessment was not carried out as the Board resigned in November 2019 due to the reconstitution of the Board following the government change (presidential election) in the country.
3 (2) The Board’s Composition
3 (2) (i) The number of Directors on the Board shall not be less than 7 and not more than 13.
According to the Bank of Ceylon Ordinance No. 53 of 1938 and its amendments the number of Directors permitted on the Board of Bank of Ceylon is six. In 2019 there were only five Directors on the Board.
Composition of the Board in 2019 and 2020 is given under Direction no. 3(2)(viii) of this compliance report. Details of the present Board and the previous Board are given on page 25 and 136 in this Annual Report.
Amendments proposed to the Bank of Ceylon Ordinance which include the increase of number of Directors to accommodate the requirement of this Direction was submitted to the Government authorities for the approval process.
Compliance Requirements as PerBanking Act Direction No. 11 of 2007

About this Report / Performance Highlights 2019 / Chairman’s Message / General Manager’s Review / Organisational Overview / Strategic Report / Performance and Outlook / Stakeholder Value Creation / Financial Reports / Compliance Annexes / Supplementary Information
353
Section Principle Level of Compliance during the Year 2019
3 (2) (ii) The total period of service of a Director other than a Director who holds the position of Chief Executive Officer shall not exceed nine years, and such period in office shall be inclusive of the total period of service served by such Director up to 1 January 2008.
Complied with.
Directors of Bank of Ceylon have been in office for a period less than nine years.
Details of their appointments are given on page 25 of this Annual Report.
3 (2) (iii) An employee of a bank may be appointed, elected or nominated as a Director of the bank (hereinafter referred to as an “Executive Director”) provided that the number of Executive Directors shall not exceed one-third of the number of Directors of the Board. In such an event, one of the Executive Directors shall be the Chief Executive Officer of the bank.
Complied with.
Bank of Ceylon Ordinance does not provide for Executive Directors in Bank of Ceylon.
3 (2) (iv) The Board shall have at least three Independent Non- Executive Directors or one-third of the total number of Directors, whichever is higher. This sub-direction shall be applicable from 1 January 2010 onwards.
A Non-Executive Director shall not be considered independent if he/she:
a. has direct and indirect shareholdings of more than 1% of the bank;
b. currently has or had during the period of two years immediately preceding his/her appointment as director, any business transactions with the bank as described in Direction No. 3 (7) hereof, exceeding 10% of the regulatory capital of the bank;
c. has been employed by the bank during the two-year period immediately preceding the appointment as Director;
d. has a close relation who is a Director or Chief Executive Officer or a member of Key Management Personnel or a material shareholder of the bank or another bank. For this purpose, a “close relation” shall mean the spouse or a financially dependant child;
Complied with.
Only the Director representing the Ministry of Finance is considered Non-Independent since he represents the shareholder, the Government of Sri Lanka.
They are identified on page 25 with the Profiles of the Directors and also under Direction No. 3 (2) (viii) below.

BA
NK
OF
CE
YL
ON
AN
NU
AL
RE
PO
RT
20
19
354
About this Report / Performance Highlights 2019 / Chairman’s Message / General Manager’s Review / Organisational Overview / Strategic Report / Performance and Outlook / Stakeholder Value Creation / Financial Reports / Compliance Annexes / Supplementary Information
Section Principle Level of Compliance during the Year 2019
e. represents a specific stakeholder of the bank;
f. is an employee or a Director or a material shareholder in a Company or business organisation:
i. which currently has a transaction with the bank as defined in Direction No. 3 (7) of these Directions, exceeding 10% of the regulatory capital of the bank; or
ii. in which any of the other Directors of the bank are employed or are Directors or are material shareholders; or
iii. in which any of the other Directors of the bank have a transaction as defined in Direction No. 3 (7) of these Directions, exceeding 10% of regulatory capital in the bank.
3 (2) (v) In the event an Alternate Director is appointed to represent an Independent Director, the person so appointed shall also meet the criteria that applies to the Independent Director.
Complied with.
No Alternate Director has been appointed to represent any Independent Director.
3 (2) (vi) Non-Executive Directors shall be persons with credible track records and/or have necessary skills and experience to bring an independent judgement to bear on issues of strategy, performance and resources.
Complied with.
Present Directors’ Profiles appearing on page 25 spell out the necessary information.
3 (2) (vii) A meeting of the Board shall not be duly constituted, although the number of Directors required to constitute the quorum at such meeting is present, unless more than one half of the number of Directors present at such meeting are Non-Executive Directors. This sub-direction shall be applicable from 1 January 2010 onwards.
Complied with.
All the Board members of Bank of Ceylon are Non-Executive Directors.
3 (2) (viii) The Independent Non-Executive Directors shall be expressly identified as such in all corporate communications that disclose the names of Directors of the bank. The bank shall disclose the composition of the Board, by category of Directors, including the names of the Chairman, Executive Directors, Non-Executive Directors and Independent Non-Executive Directors in the Annual Corporate Governance Report.
Complied with.
During the year 2019 the Board consisted of the following members:
• Mr Ronald C Perera, PC Independent Non-Executive Director/Chairman (Ceased to be the Chairman/ Director w.e.f. 26 November
2019)
• Mr K A Vimalenthirarajah Non-Independent Non-Executive Ex officio Director (Ceased to be a Director w.e.f. 10 January 2020)
• Mr Kumar Mayadunne Independent Non-Executive Director (Ceased to be a Director w.e.f. 27 November 2019)
Compliance Requirements as PerBanking Act Direction No. 11 of 2007

About this Report / Performance Highlights 2019 / Chairman’s Message / General Manager’s Review / Organisational Overview / Strategic Report / Performance and Outlook / Stakeholder Value Creation / Financial Reports / Compliance Annexes / Supplementary Information
355
Section Principle Level of Compliance during the Year 2019
• Mr P A Shaffter Independent Non-Executive Director (Ceased to be a Director w.e.f. 27 November 2019)
• Mr S Nilam Jayasinghe Independent Non-Executive Director (Ceased to be a Director w.e.f. 27 November 2019)
With the change of the Government in November 2019 the above Directors resigned and a new Board was appointed in 2020 and they are indicated below-
• Mr Kanchana Ratwatte Independent Non-Executive Director/ Chairman (Appointed w.e.f 2 January 2020)
• Ms Visakha Amarasekere Non-Independent Non-Executive Ex officio Director (Appointed w.e.f. 11 January 2020)
• Mr Lalith P Withana Independent Non-Executive Director (Appointed w.e.f 14 January 2020)
• Mr G Harsha Wijayawardhana Independent Non-Executive Director (Appointed w.e.f 14 January 2020)
• Mr Hasitha Premaratne Independent Non-Executive Director (Appointed w.e.f 14 January 2020)
3 (2) (ix) There shall be a formal, considered and transparent procedure for the appointment of new Directors to the Board. There shall also be procedures in place for the orderly succession of appointments to the Board.
Appointments to the Board are made by the shareholder, the Government of Sri Lanka through the Minister under whose purview the Bank falls in terms of the provisions of Bank of Ceylon Ordinance No. 53 of 1938 and its amendments. A Board approved Policy for the Appointment of Directors to the Board of Bank of Ceylon is in place describing the skills, experience, knowledge etc. required to be considered to be appointed to the Board and the appointment process.
3 (2) (x) All Directors appointed to fill a casual vacancy shall be subject to election by shareholders at the first General Meeting after their appointment.
This does not arise since the relevant Minister appoints Directors.
3 (2) (xi) If a Director resigns or is removed from office, the Board shall:
a. announce the Director’s resignation or removal and the reasons for such removal or resignation including but not limited to information relating to the relevant Director’s disagreement with the bank, if any; and
Complied with.
The Government of Sri Lanka, the sole shareholder does the appointments as well as the removals through the Minister under whose purview the Bank falls. Any resignation is also referred to the same Minister. The Central Bank of Sri Lanka and the Colombo Stock Exchange are kept informed of the resignations.
b. issue a statement confirming whether or not there are any matters that need to be brought to the attention of shareholders.
The Shareholder of the Bank is the Government and the changes to the Directorate is carried out by the Government through the subject Minister.

BA
NK
OF
CE
YL
ON
AN
NU
AL
RE
PO
RT
20
19
356
About this Report / Performance Highlights 2019 / Chairman’s Message / General Manager’s Review / Organisational Overview / Strategic Report / Performance and Outlook / Stakeholder Value Creation / Financial Reports / Compliance Annexes / Supplementary Information
Section Principle Level of Compliance during the Year 2019
3 (2) (xii) A Director or an employee of a bank shall not be appointed, elected or nominated as a Director of another bank except where such bank is a subsidiary company or an associate company of the first mentioned bank.
Neither Directors nor employees of Bank of Ceylon are Directors of another Bank, other than for the appointment of a Deputy General Manager to the Pradeshiya Sanwardana Bank as per the requirements of the enabling enactments of this Bank (Pradeshiya Sanwardana Bank Act No. 41 of 2008). Prior to appointment as a Director to the Board of Bank of Ceylon, an affidavit is obtained in accordance with Section 42(1) and 76H of the Banking Act Direction no. 8 of 2019 issued on 19.12.2019 ensuring this position.
3 (3) Criteria to Assess the Fitness and Propriety of Directors
3 (3) (i) The age of a person who serves as Director shall not exceed 70 years.
In this context, the following general exemption shall apply: A Director who has reached the age of 70 years as at 1 January 2008 or who would reach the age of 70 years prior to 31 December 2008 may continue in office for a further maximum period of three years commencing 1 January 2009.
Complied with.
None of the Directors of the Bank are over 70 years of age.
3 (3) (ii) A person shall not hold office as a Director of more than 20 companies / entities / institutions inclusive of subsidiaries or associate companies of the bank.
Complied with.
No Director holds directorships of more than 20 companies/ entities, etc.
3 (3) (iii) A Director or a Chief Executive Officer of a licensed bank operating in Sri Lanka shall not be appointed as a Director or a Chief Executive Officer of another licensed bank operating in Sri Lanka before the expiry of a period of 6 months from the date of cessation of his/her office at the licensed bank in Sri Lanka. Any variation thereto in exceptional situations such as where expertise of retiring bankers may be required when reconstituting Boards of licensed banks which need restructuring, shall be subject to the prior approval of the Monetary Board. In this regard, licensed banks shall ensure to adhere to the requirement of the cooling-off period when appointing Directors or Chief Executive Officer. If a Director is appointed to the licensed bank by an appointing authority violating these Directions, the licensed bank shall take steps to prevent such appointee from exercising any powers or enjoying any privileges or against this direction Complied with.
Complied with.
This situation has not arisen during the year under review.
3 (4) Management Functions Delegated by the Board
3 (4) (i) The Directors shall carefully study and clearly understand the delegation arrangements in place.
Complied with.
The Board periodically reviews and approves the delegation arrangements in place and ensures that the extent of delegation addresses the needs of the Bank whilst enabling the Board to discharge their functions effectively.
The provisions in the governing Ordinance are considered in this process.
3 (4) (ii) The Board shall not delegate any matters to a Board Committee, Chief Executive Officer, Executive Directors or Key Management Personnel, to an extent that such delegation would significantly hinder or reduce the ability of the Board as a whole to discharge its functions.
3 (4) (iii) The Board shall review the delegation processes in place on a periodic basis to ensure that they remain relevant to the needs of the bank.
Compliance Requirements as PerBanking Act Direction No. 11 of 2007

About this Report / Performance Highlights 2019 / Chairman’s Message / General Manager’s Review / Organisational Overview / Strategic Report / Performance and Outlook / Stakeholder Value Creation / Financial Reports / Compliance Annexes / Supplementary Information
357
Section Principle Level of Compliance during the Year 2019
3 (5) The Chairman and Chief Executive Officer
3 (5) (i) The roles of Chairman and Chief Executive Officer shall be separate and shall not be performed by the same individual.
Complied with.
The positions of the Chairman and the Chief Executive Officer referred to as the General Manager in Bank of Ceylon are held by two different individuals.
A Board Charter is in place defining the responsibilities of the Chairman and the General Manager.
3 (5) (ii) The Chairman shall be a Non-Executive Director and preferably an Independent Director as well. In the case where the Chairman is not an Independent Director, the Board shall designate an Independent Director as the Senior Director with suitably documented Terms of Reference to ensure a greater independent element. The designation of the Senior Director shall be disclosed in the bank’s Annual Report.
Complied with.
The Chairman of Bank of Ceylon is an Independent Non-Executive Director and as such the need to appoint a Senior Independent Director does not arise.
3 (5) (iii) The Board shall disclose in its Corporate Governance Report, which shall be an integral part of its Annual Report, the identity of the Chairman and the Chief Executive Officer and the nature of any relationship [including financial, business, family or other material/ relevant relationship(s)], if any, between the Chairman and the Chief Executive Officer and the relationships among members of the Board.
Complied with.
The identity of the Chairman and the General Manager are disclosed in the Annual Report on page 25 and 28. There are many references to these roles throughout.
There were no material, financial, business or family relationships between the Chairman, General Manager and other members of the Board who were functioning in 2019 and also in the current Board.
3 (5) (iv) The Chairman shall: (a) provide leadership to the Board; (b) ensure that the Board works effectively and discharges its responsibilities; and (c) ensure that all key and appropriate issues are discussed by the Board in a timely manner.
Complied with.
3 (5) (v) The Chairman shall be primarily responsible for drawing up and approving the agenda for each Board meeting, taking into account where appropriate, any matters proposed by the other Directors for inclusion in the agenda. The Chairman may delegate the drawing up of the agenda to the Company Secretary.
Complied with.
The Secretary, Bank of Ceylon/ Secretary to the Board draws up the agenda under the authority delegated by the Chairman based on the memoranda submitted through the General Manager and any other relevant items proposed by any Board member.
3 (5) (vi) The Chairman shall ensure that all Directors are properly briefed on issues arising at Board meetings and also ensure that Directors receive adequate information in a timely manner.
Complied with.
The Chairman ensures that the Board is adequately briefed. The following procedures are in place to ensure this:
• Board papers are circulated seven days prior to the Board meetings through a secured electronic link.
• Relevant members of the management team are on standby for any explanations and clarifications.
• Management information is provided in agreed formats on a regular basis to enable Directors to assess the performance and stability of the Bank.
• Directors are able to seek independent professional advice on needs basis at the Bank's expense.

BA
NK
OF
CE
YL
ON
AN
NU
AL
RE
PO
RT
20
19
358
About this Report / Performance Highlights 2019 / Chairman’s Message / General Manager’s Review / Organisational Overview / Strategic Report / Performance and Outlook / Stakeholder Value Creation / Financial Reports / Compliance Annexes / Supplementary Information
Section Principle Level of Compliance during the Year 2019
3 (5) (vii) The Chairman shall encourage all Directors to make a full and active contribution to the Board’s affairs and take the lead to ensure that the Board acts in the best interests of the bank.
Complied with.
3 (5) (viii) The Chairman shall facilitate the effective contribution of Non-Executive Directors in particular and ensure constructive relations between Executive and Non-Executive Directors.
Complied with.
The entire Board consists of Non-Executive Directors.
3 (5) (ix) The Chairman, shall not engage in activities involving direct supervision of Key Management Personnel or any other executive duties whatsoever.
Complied with.
Chairman is an Independent Non-Executive Director and does not get involved in the direct supervision of Key Management Personnel or any other executive duties.
3 (5) (x) The Chairman shall ensure that appropriate steps are taken to maintain effective communication with shareholders and that the views of shareholders are communicated to the Board.
Complied with.
Effective communication is maintained with the Government of Sri Lanka who is the sole shareholder. The Ex Officio Director acts as the channel between the Board and the shareholder.
3 (5) (xi) Chief Executive Officer shall function as the apex executive-in-charge of the day-to-day management of the bank’s operations and business.
Complied with.
The day-to-day operations of the Bank is the responsibility of the General Manager. The Board Charter specifically refers to such authority of the General Manager.
3 (6) Board Appointed Committees
3 (6 ) (i) Each bank shall have at least four Board committees as set out in Directions 3 (6) (ii), 3 (6) (iii), 3 (6) (iv) and 3 (6) (v) of these Directions. Each committee shall report directly to the Board. All committees shall appoint a Secretary to arrange the meetings and maintain minutes, records, etc., under the supervision of the Chairman of the committee. The Board shall present a report of the performance on each committee, on their duties and roles at the Annual General Meeting.
Complied with.
Four Subcommittees of the Board (viz. Audit, Human Resources and Remuneration, Nomination and Corporate Governance and Integrated Risk Management have been established as required under this Direction which are reporting directly to the Board. In addition another Subcommittee, viz.Information and Communication Technology (ICT) Committee is in place .
The Terms of Reference for each Subcommittee is in place and are reviewed annually/.
The Secretary, Bank of Ceylon/ Secretary to the Board serves as Secretary to all Subcommittees and maintains minutes etc. with oversight by the respective Chairpersons.
The reports of the Subcommittees are included in this Annual Report.
Audit Committee on pages 109 to 110.
Integrated Risk Management Committee on pages 111 to 112.
Human Resources and Remuneration Committee on page 113
Nomination and Corporate Governance Committee on page 114
Information and Communication Technology Committee on page 115.
The Government being the sole shareholder, the Annual Report of the Bank is submitted to the Parliament of Sri Lanka and to the Ministry in charge of the Bank.
Compliance Requirements as PerBanking Act Direction No. 11 of 2007

About this Report / Performance Highlights 2019 / Chairman’s Message / General Manager’s Review / Organisational Overview / Strategic Report / Performance and Outlook / Stakeholder Value Creation / Financial Reports / Compliance Annexes / Supplementary Information
359
Section Principle Level of Compliance during the Year 2019
3 (6) (ii) The following rules shall apply in relation to the Audit Committee:
a. The Chairman of the Committee shall be an Independent Non-Executive Director who possesses qualifications and experience in accountancy and / or audit.
During the year 2019, Mr Kumar Mayadunne, an Independent Non Executive Director, who was a senior banker was appointed as the Chairman of the Audit Committee for an interim period.
Subsequently, Mr S Nilam Jayasinghe, an Independent Non-Executive Director who had required qualifications and experience was appointed as the Chairman of the Audit Committee w.e.f 2 July 2019.
The present Audit Committee is also chaired by an Independent Non-Executive Director who has the required qualifications and experience.
b. All members of the Committee shall be Non- Executive Directors.
Complied with.
All Directors of the Bank are Non-Executive.
c. The Committee shall make recommendations on matters in connection with:
(i) the appointment of the External Auditor for audit services to be provided in compliance with the relevant statutes;
(ii) the implementation of the Central Bank Guidelines issued to Auditors from time to time;
(iii) the application of the relevant accounting standards; and
(iv) the service period, audit fee and any resignation or dismissal of the Auditor; provided that the engagement of the Audit partner shall not exceed five years, and that the particular Audit partner is not re-engaged for the audit before the expiry of three years from the date of the completion of the previous term.
Complied with.
In accordance with the Terms of Reference, the Audit Committee makes the following recommendations among many others:
• The implementation of the Central Bank Guidelines issued to Auditors from time to time.
• The application of the relevant accounting standards
Since the Auditor General is the External Auditor of the Bank, the Committee has no role to play in the engagement of the External Auditor.
d. The Committee shall review and monitor the External Auditor’s independence and objectivity and the effectiveness of the audit processes in accordance with applicable standards and best practices
The Bank’s Auditor being the Auditor General, his independence and effectiveness is guaranteed under the Constitution of Sri Lanka.

BA
NK
OF
CE
YL
ON
AN
NU
AL
RE
PO
RT
20
19
360
About this Report / Performance Highlights 2019 / Chairman’s Message / General Manager’s Review / Organisational Overview / Strategic Report / Performance and Outlook / Stakeholder Value Creation / Financial Reports / Compliance Annexes / Supplementary Information
Section Principle Level of Compliance during the Year 2019
e. The Committee shall develop and implement a policy on the engagement of an External Auditor to provide non-audit services that are permitted under the relevant statutes, regulations, requirements and guidelines. In doing so, the Committee shall ensure that the provision by an External Auditor of non- audit services does not impair the External Auditor’s independence or objectivity. When assessing the External Auditor’s independence or objectivity in relation to the provision of non-audit services, the Committee shall consider:
(i) whether the skills and experience of the audit firm make it a suitable provider of the non-audit services;
(ii) whether there are safeguards in place to ensure that there is no threat to the objectivity and/ or independence in the conduct of the audit resulting from the provision of such services by the External Auditor; and
(iii) whether the nature of the non-audit services, the related fee levels and the fee levels individually and in aggregate relative to the audit firm, pose any threat to the objectivity and/or independence of the External Auditor.
This does not arise since the Auditor General is the Auditor of the Bank.
However, the Committee ensures that provision by an audit firm (if appointed by the Auditor General to assist him in the audit of the Bank) of non-audit services does not impair that firm’s independence or objectivity. For the audit of the year 2019 no such firm has been appointed.
f. The Committee shall, before the audit commences, discuss and finalise with the External Auditors the nature and scope of the audit, including:
(i) an assessment of the bank’s compliance with the relevant Directions in relation to corporate governance and the management’s internal controls over financial reporting;
(ii) the preparation of Financial Statements for external purposes in accordance with relevant accounting principles and reporting obligations; and
(iii) the coordination between firms where more than one audit firm is involved.
The scope and the extent of audit is determined by the Auditor General.
Compliance Requirements as PerBanking Act Direction No. 11 of 2007

About this Report / Performance Highlights 2019 / Chairman’s Message / General Manager’s Review / Organisational Overview / Strategic Report / Performance and Outlook / Stakeholder Value Creation / Financial Reports / Compliance Annexes / Supplementary Information
361
Section Principle Level of Compliance during the Year 2019
g. The Committee shall review the financial information of the bank, in order to monitor the integrity of the Financial Statements of the bank, its Annual Report, accounts and quarterly reports prepared for disclosure, and the significant financial reporting judgements contained therein. In reviewing the bank’s Annual Report and accounts and quarterly reports before submission to the Board, the Committee shall focus particularly on:
(i) major judgmental areas;
(ii) any changes in accounting policies and practices;
(iii) significant adjustments arising from the audit;
(iv) the going concern assumption; and
(v) the compliance with relevant accounting standards and other legal requirements.
Complied with.
There is a continuing process carried out in reviewing monthly, quarterly and annual financials of the Bank by the Committee and recommendations are made to the Board.
h. The Committee shall discuss issues, problems and reservations arising from the interim and final audits, and any matters the Auditor may wish to discuss including those matters that may need to be discussed in the absence of Key Management Personnel, if necessary.
Complied with.
The Committee discusses issues, problems and reservations arising from the interim and final audits. The representative of the Auditor General was present at the Committee meetings throughout. With regard to 2019 audit, the committee offered a closed door meeting to the representative of the Auditor General.
i. The Committee shall review the External Auditor’s Management Letter and the management’s response thereto.
Complied with.
j. The Committee shall take the following steps with regard to the internal audit function of the bank:
(i) Review the adequacy of the scope, functions and resources of the Internal Audit Department, and satisfy itself that the Department has the necessary authority to carry out its work;
(ii) Review the internal audit programme and results of the internal audit process and, where necessary, ensure that appropriate actions are taken on the recommendations of the Internal Audit Department;
Complied with.
The Audit Committee reviews and makes necessary recommendations with regard to the adequacy of the scope, functions and resources of the Internal Audit Department. In this regard a Time bound Audit Plan for 2019 which includes scope, function and the existing/required cadre position of the Internal Audit department was considered by the Committee.
Complied with.
The Committee reviews the internal audit programme and results of the internal audit procedures and ensures that appropriate actions are taken for improvements.

BA
NK
OF
CE
YL
ON
AN
NU
AL
RE
PO
RT
20
19
362
About this Report / Performance Highlights 2019 / Chairman’s Message / General Manager’s Review / Organisational Overview / Strategic Report / Performance and Outlook / Stakeholder Value Creation / Financial Reports / Compliance Annexes / Supplementary Information
Section Principle Level of Compliance during the Year 2019
(iii) Review any appraisal or assessment of the performance of the head and senior staff members of the Internal Audit Department;
Not Complied with.
Performance appraisal of Chief Internal Auditor and the work process and results of the internal audit function are generally evaluated by the Audit Committee. Performance evaluation of senior staff is carried out according to the Board approved evaluation process by the Chief Internal Auditor and is tabled before the Audit Committee. This year in view of Board changes at the latter part of 2019, the evaluations that is generally carried out were not carried out in respect of year 2019.
iv) Recommend any appointment or termination of the head, senior staff members and outsourced service providers to the internal audit function;
Complied with.
(v) Ensure that the Committee is appraised of resignations of senior staff members of the Internal Audit Department including the Chief Internal Auditor and any outsourced service providers, and to provide an opportunity to the resigning senior staff members and outsourced service providers to submit reasons for resigning;
Complied with.
Such a situation has not arisen during the year
(vi) Ensure that the internal audit function is independent of the activities it audits and that it is performed with impartiality, proficiency and due professional care.
Complied with.
According to the organisation structure of the Bank, the Chief Internal Auditor reports directly to the Board through the Audit Committee and he is independent of any operations of the Bank.
k. The Committee shall consider the major findings of internal investigations and management’s responses thereto.
Complied with.
The Audit Committee has reviewed the major findings of internal investigations and management responses thereto.
l. The Chief Finance Officer, the Chief Internal Auditor and a representative of the External Auditors may normally attend meetings. Other Board members and the Chief Executive Officer may also attend meetings upon the invitation of the Committee.
However, at least twice a year, the Committee shall meet with the External Auditors without the Executive Directors being present.
Complied with.
The Chief Financial Officer, Chief Internal Auditor, Chief Risk Officer and Compliance Officer and the representative of the Auditor General participate at the Committee meetings. The General Manager also attended the meetings on the invitation of the Committee. The members of the management are invited for any explanations, if necessary.
A closed door meeting was offered to the Auditor General’s representative in respect of the audit for the year 2019.
m. The Committee shall have:
(i) explicit authority to investigate into any matter within its terms of reference;
(ii) the resources which it needs to do so;
(iii) full access to information; and
(iv) authority to obtain external professional advice and to invite outsiders with relevant experience to attend, if necessary.
Complied with.
Compliance Requirements as PerBanking Act Direction No. 11 of 2007

About this Report / Performance Highlights 2019 / Chairman’s Message / General Manager’s Review / Organisational Overview / Strategic Report / Performance and Outlook / Stakeholder Value Creation / Financial Reports / Compliance Annexes / Supplementary Information
363
Section Principle Level of Compliance during the Year 2019
n. The Committee shall meet regularly, with due notice of issues to be discussed and shall record its conclusions in discharging its duties and responsibilities.
Complied with.
The Audit Committee scheduled regular meetings. Additional meetings were convened when required.
The Committee met six times during the year. The members of the Committee are served with due notice of issues to be discussed and the conclusions in discharging its duties and responsibilities are recorded in the minutes of the meetings maintained by the Secretary to the Board/ Secretary, Bank of Ceylon.
o. The Board shall disclose in an informative way,
(i) details of the activities of the Audit Committee;
(ii) the number of Audit Committee meetings held in the year; and
(iii) details of attendance of each individual Director at such meetings.
Complied with.
Activities of the Committee are reported in Audit Committee Report on pages 109 to 110.
The Committee met six times during the year 2019 and details of attendance are given on page 99.
p. The Secretary of the Committee (who may be the Company Secretary or the Head of the Internal Audit function) shall record and keep detailed minutes of the Committee meetings.
Complied with.
Minutes are maintained by the Secretary to the Board/Secretary, Bank of Ceylon who is also the Secretary to the Committee.
q. The Committee shall review arrangements by which employees of the bank may, in confidence, raise concerns about possible improprieties in financial reporting, internal control or other matters. Accordingly, the Committee shall ensure that proper arrangements are in place for the fair and independent investigation of such matters and for appropriate follow-up action and to act as the key representative body for overseeing the bank’s relations with the External Auditor.
Complied with.
A Board approved Whistle-Blowing Policy is in place which covers these aspects and significant findings are reported to the Audit Committee for appropriate follow-up action.
The Audit Committee is the key representative body for overseeing the Bank’s relations with the External Auditor viz the Auditor General in the case of Bank of Ceylon.
3 (6) (iii) The following rules shall apply in relation to the Human Resources and Remuneration Committee:
a. The Committee shall determine the remuneration policy (salaries, allowances and other financial payments) relating to Directors, Chief Executive Officer (CEO) and Key Management Personnel of the bank.
Complied with.
The Remuneration for Directors is according to the circulars/ letters issued by the Government of Sri Lanka through the relevant Ministry and the Bank of Ceylon Ordinance No. 53 of 1938 and its amendments. The Bank has adopted a Remuneration Policy based on the said circulars/ Letters and the Ordinance which was revised during the year 2019.
The Board approved Remuneration Policy for the Key Management Personnel is in place. The Committee makes recommendations of the remuneration of the GM and KMPs once in three years and submit to the Board and finally obtains approval of the Minister under whose purview the Bank falls.
b. The Committee shall set goals and targets for the Directors, CEO and the Key Management Personnel.
Complied with. In respect of KPMs with the participation of the full Board.
Goals and targets for KMPs are documented and detailed in the Action Plan prepared based on the Corporate Plan of the Bank. The General Manager is responsible for the implementation of the Corporate Plan through Key Management Personnel (KMPs). Directors are Non-Executive Directors and as such specific goals are not set for them

BA
NK
OF
CE
YL
ON
AN
NU
AL
RE
PO
RT
20
19
364
About this Report / Performance Highlights 2019 / Chairman’s Message / General Manager’s Review / Organisational Overview / Strategic Report / Performance and Outlook / Stakeholder Value Creation / Financial Reports / Compliance Annexes / Supplementary Information
Section Principle Level of Compliance during the Year 2019
c. The Committee shall evaluate the performance of the CEO and Key Management Personnel against the set targets and goals periodically and determine the basis for revising remuneration, benefits and other payments of performance-based incentives.
Performance as at year end 2018 was evaluated in 2019. Mid year review against the targets set for each Deputy General Manager for 2019 was carried out at the Bank of Ceylon and an offsite location with the participation of the Board of Directors.
However, in view of changes to the Board that took place during the latter part of year 2019, evaluations for General Manager and Deputy General Managers were not carried out as is usually done. Performance of the Assistant General Managers were evaluated through the evaluation carried out on them by the respective Deputy General Managers.
However, an evaluation on the targets and goals set, were carried out to the current Board in launching the rolling Corporate Plan for 2019 to 2021 by the Board.
d. The CEO shall be present at all meetings of the Committee, except when matters relating to the CEO are being discussed.
Complied with
3 (6) (iv) The following rules shall apply in relation to the Nomination Committee:
The Bank has established a Nomination and Corporate Governance Committee. In addition to the duties of the Nomination Committee given under this Direction, certain other duties pertaining to upholding the applicable Corporate Governance Principles are included under the Terms of Reference of this Committee. The Charter for the Committee was reviewed during the year 2019.
a. The Committee shall implement a procedure to select/ appoint new Directors, CEO and Key Management Personnel.
Complied with.
The Directors are appointed by the Minister under whose purview the Bank falls. A Policy on appointment of Directors has been shared with the line Ministry. The General Manager is appointed by the Board with the approval of the said Minister. There is a Board approved general procedure/scheme for the appointment of the KMP.
b. The Committee shall consider and recommend (or not recommend) the re-election of current Directors, taking into account the performance and contribution made by the Director concerned towards the overall discharge of the Board’s responsibilities.
Does not arise since the Directors are appointed by the relevant Minister.
c. The Committee shall set the criteria such as qualifications, experience and key attributes required for eligibility to be considered for appointment or promotion to the post of CEO and the key management positions.
Complied with.
The General Manager is appointed based on the Bank’s accepted procedure with the approval of the Board of Directors and the relevant Minister as specified in the Bank of Ceylon Ordinance No. 53 of 1938 and its amendments.
The Board approved promotion schemes stipulate the attributes required to be eligible to be selected or promoted to the other key management positions.
Compliance Requirements as PerBanking Act Direction No. 11 of 2007
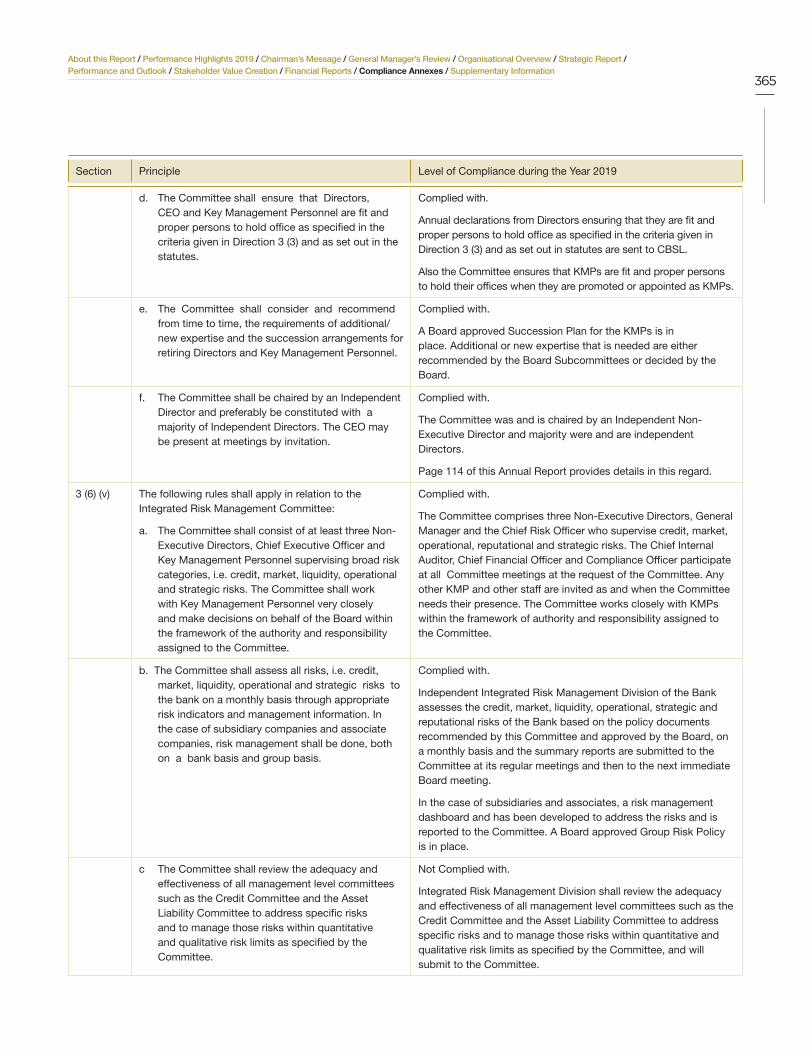
About this Report / Performance Highlights 2019 / Chairman’s Message / General Manager’s Review / Organisational Overview / Strategic Report / Performance and Outlook / Stakeholder Value Creation / Financial Reports / Compliance Annexes / Supplementary Information
365
Section Principle Level of Compliance during the Year 2019
d. The Committee shall ensure that Directors, CEO and Key Management Personnel are fit and proper persons to hold office as specified in the criteria given in Direction 3 (3) and as set out in the statutes.
Complied with.
Annual declarations from Directors ensuring that they are fit and proper persons to hold office as specified in the criteria given in Direction 3 (3) and as set out in statutes are sent to CBSL.
Also the Committee ensures that KMPs are fit and proper persons to hold their offices when they are promoted or appointed as KMPs.
e. The Committee shall consider and recommend from time to time, the requirements of additional/ new expertise and the succession arrangements for retiring Directors and Key Management Personnel.
Complied with.
A Board approved Succession Plan for the KMPs is in place. Additional or new expertise that is needed are either recommended by the Board Subcommittees or decided by the Board.
f. The Committee shall be chaired by an Independent Director and preferably be constituted with a majority of Independent Directors. The CEO may be present at meetings by invitation.
Complied with.
The Committee was and is chaired by an Independent Non-Executive Director and majority were and are independent Directors.
Page 114 of this Annual Report provides details in this regard.
3 (6) (v) The following rules shall apply in relation to the Integrated Risk Management Committee:
a. The Committee shall consist of at least three Non- Executive Directors, Chief Executive Officer and Key Management Personnel supervising broad risk categories, i.e. credit, market, liquidity, operational and strategic risks. The Committee shall work with Key Management Personnel very closely and make decisions on behalf of the Board within the framework of the authority and responsibility assigned to the Committee.
Complied with.
The Committee comprises three Non-Executive Directors, General Manager and the Chief Risk Officer who supervise credit, market, operational, reputational and strategic risks. The Chief Internal Auditor, Chief Financial Officer and Compliance Officer participate at all Committee meetings at the request of the Committee. Any other KMP and other staff are invited as and when the Committee needs their presence. The Committee works closely with KMPs within the framework of authority and responsibility assigned to the Committee.
b. The Committee shall assess all risks, i.e. credit, market, liquidity, operational and strategic risks to the bank on a monthly basis through appropriate risk indicators and management information. In the case of subsidiary companies and associate companies, risk management shall be done, both on a bank basis and group basis.
Complied with.
Independent Integrated Risk Management Division of the Bank assesses the credit, market, liquidity, operational, strategic and reputational risks of the Bank based on the policy documents recommended by this Committee and approved by the Board, on a monthly basis and the summary reports are submitted to the Committee at its regular meetings and then to the next immediate Board meeting.
In the case of subsidiaries and associates, a risk management dashboard and has been developed to address the risks and is reported to the Committee. A Board approved Group Risk Policy is in place.
c The Committee shall review the adequacy and effectiveness of all management level committees such as the Credit Committee and the Asset Liability Committee to address specific risks and to manage those risks within quantitative and qualitative risk limits as specified by the Committee.
Not Complied with.
Integrated Risk Management Division shall review the adequacy and effectiveness of all management level committees such as the Credit Committee and the Asset Liability Committee to address specific risks and to manage those risks within quantitative and qualitative risk limits as specified by the Committee, and will submit to the Committee.

BA
NK
OF
CE
YL
ON
AN
NU
AL
RE
PO
RT
20
19
366
About this Report / Performance Highlights 2019 / Chairman’s Message / General Manager’s Review / Organisational Overview / Strategic Report / Performance and Outlook / Stakeholder Value Creation / Financial Reports / Compliance Annexes / Supplementary Information
Section Principle Level of Compliance during the Year 2019
d. The Committee shall take prompt corrective action to mitigate the effects of specific risks in the case such risks are at levels beyond the prudent levels decided by the Committee on the basis of the bank’s policies and regulatory and supervisory requirements.
Complied with.
Specific quantitative and qualitative risks which go beyond the limits are monitored by the Chief Risk Officer and reported directly to the Committee based on the severity of the issues involved.
e. The Committee shall meet at least quarterly to assess all aspects of risk management including updated business continuity plans.
Complied with.
During the year, the Committee has had five meetings. Details of meetings and attendance are given on page 99.
f. The Committee shall take appropriate actions against the officers responsible for failure to identify specific risks and take prompt corrective actions as recommended by the Committee, and/or as directed by the Director of Bank Supervision.
Complied with.
Formal documented disciplinary action procedure is in place in the Bank.
g. The Committee shall submit a risk assessment report within a week of each meeting to the Board seeking the Board’s views, concurrence and/or specific directions.
Complied with.
The minutes of the meetings are submitted to the Board meeting immediately following the Committee meeting together with the recommendations and Risk Management Reports.
h. The Committee shall establish a compliance function to assess the bank’s compliance with laws, regulations, regulatory guidelines, internal controls and approved policies on all areas of business operations. A dedicated Compliance Officer selected from Key Management Personnel shall carry out the compliance function and report to the Committee periodically.
Complied with.
The Bank has established a separate compliance function to assess the Bank’s compliance with laws, regulations, regulatory guidelines, internal controls and approved policies on all areas of business operations. This function is headed by a dedicated Compliance Officer/Deputy General Manager and he submits quarterly Compliance Reports to the Committee and monthly Compliance Reports to the Board.
The Compliance function also assesses the Bank’s compliance with Internal Controls and approved policies on all areas of business operations.
3 (7) Related Party Transactions
3 (7) (i) The Board shall take necessary steps to avoid any conflicts of interest that may arise from any transaction of the bank with any person, and particularly with the following
categories of persons shall be considered as “related parties” for the purposes of this Direction:
a. Any of the bank’s subsidiary companies;
b. Any of the bank’s associate companies;
c. Any of the Directors of the bank;
d. Any of the bank’s Key Management Personnel;
e. A close relation of any of the bank’s Directors or Key Management Personnel;
f. A shareholder owning a material interest in the bank;
Complied with.
A Policy on Related Party Disclosures is in place which was reviewed in beginning of year 2020 covering related parties, their transactions, and restrictions on offering more favourable treatment to related parties in order for the Board members to avoid any Conflict of Interest in this regard.
Directors who have related party transactions are individually requested to declare their transactions. Transactions are monitored through an automated system.
Compliance Requirements as PerBanking Act Direction No. 11 of 2007
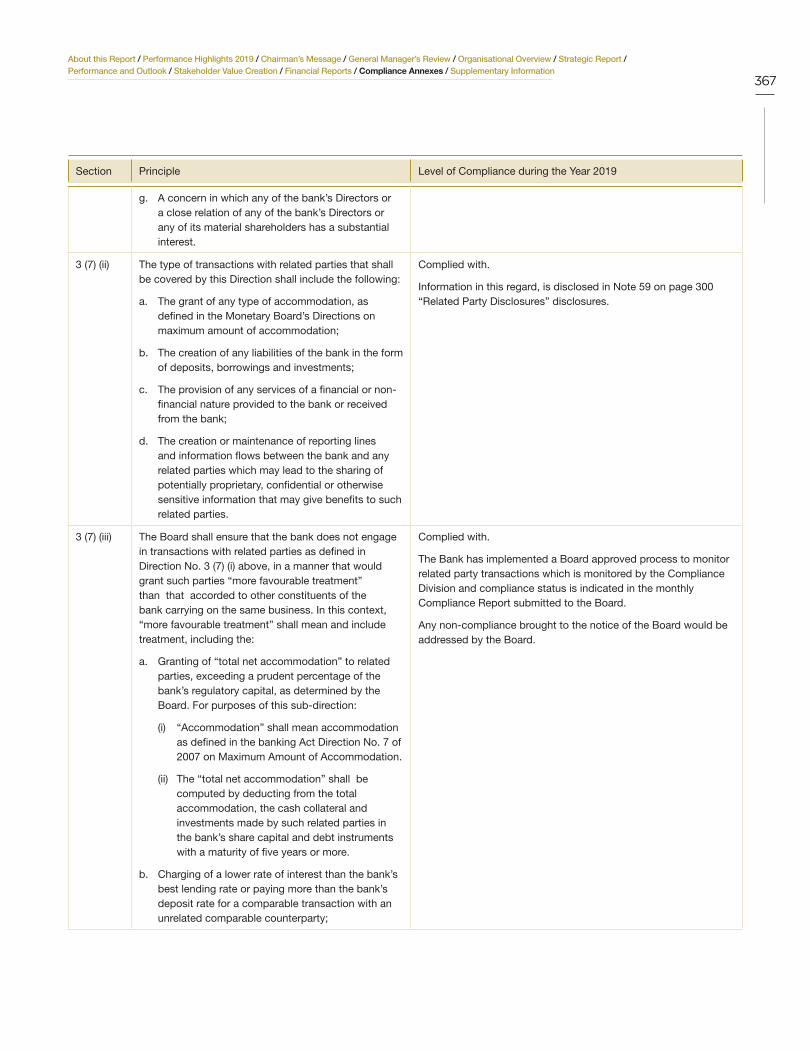
About this Report / Performance Highlights 2019 / Chairman’s Message / General Manager’s Review / Organisational Overview / Strategic Report / Performance and Outlook / Stakeholder Value Creation / Financial Reports / Compliance Annexes / Supplementary Information
367
Section Principle Level of Compliance during the Year 2019
g. A concern in which any of the bank’s Directors or a close relation of any of the bank’s Directors or any of its material shareholders has a substantial interest.
3 (7) (ii) The type of transactions with related parties that shall be covered by this Direction shall include the following:
a. The grant of any type of accommodation, as defined in the Monetary Board’s Directions on maximum amount of accommodation;
b. The creation of any liabilities of the bank in the form of deposits, borrowings and investments;
c. The provision of any services of a financial or non- financial nature provided to the bank or received from the bank;
d. The creation or maintenance of reporting lines and information flows between the bank and any related parties which may lead to the sharing of potentially proprietary, confidential or otherwise sensitive information that may give benefits to such related parties.
Complied with.
Information in this regard, is disclosed in Note 59 on page 300 “Related Party Disclosures” disclosures.
3 (7) (iii) The Board shall ensure that the bank does not engage in transactions with related parties as defined in Direction No. 3 (7) (i) above, in a manner that would grant such parties “more favourable treatment” than that accorded to other constituents of the bank carrying on the same business. In this context, “more favourable treatment” shall mean and include treatment, including the:
a. Granting of “total net accommodation” to related parties, exceeding a prudent percentage of the bank’s regulatory capital, as determined by the Board. For purposes of this sub-direction:
(i) “Accommodation” shall mean accommodation as defined in the banking Act Direction No. 7 of 2007 on Maximum Amount of Accommodation.
(ii) The “total net accommodation” shall be computed by deducting from the total accommodation, the cash collateral and investments made by such related parties in the bank’s share capital and debt instruments with a maturity of five years or more.
b. Charging of a lower rate of interest than the bank’s best lending rate or paying more than the bank’s deposit rate for a comparable transaction with an unrelated comparable counterparty;
Complied with.
The Bank has implemented a Board approved process to monitor related party transactions which is monitored by the Compliance Division and compliance status is indicated in the monthly Compliance Report submitted to the Board.
Any non-compliance brought to the notice of the Board would be addressed by the Board.
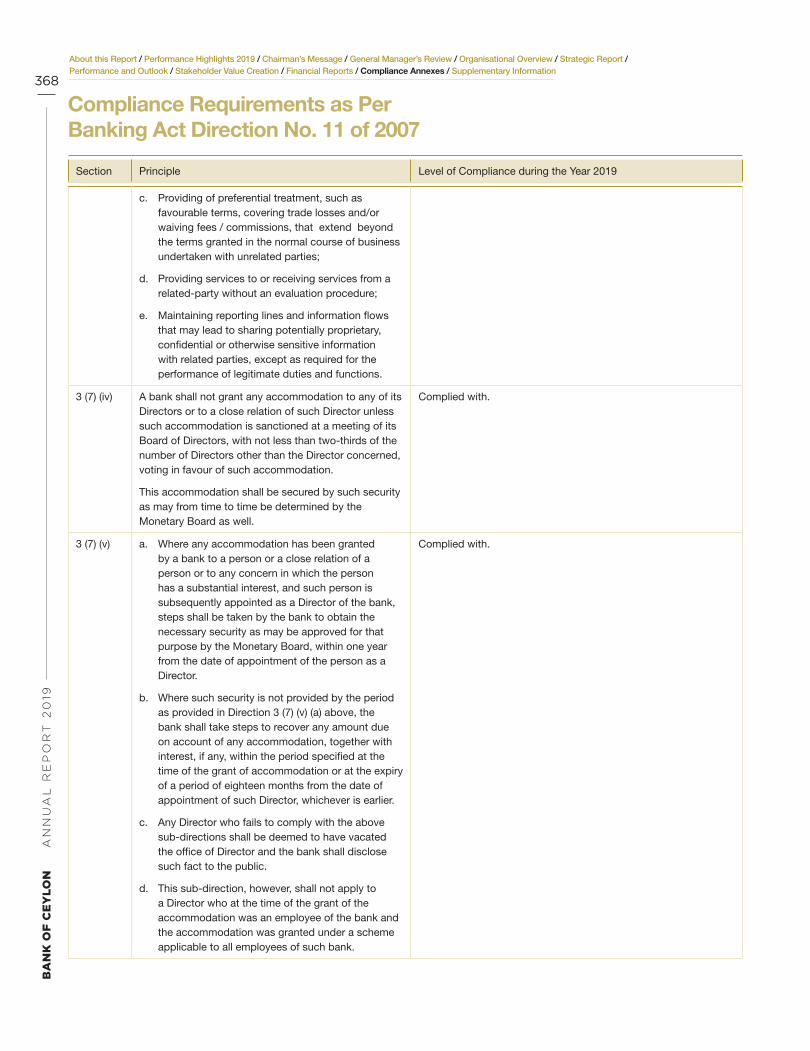
BA
NK
OF
CE
YL
ON
AN
NU
AL
RE
PO
RT
20
19
368
About this Report / Performance Highlights 2019 / Chairman’s Message / General Manager’s Review / Organisational Overview / Strategic Report / Performance and Outlook / Stakeholder Value Creation / Financial Reports / Compliance Annexes / Supplementary Information
Section Principle Level of Compliance during the Year 2019
c. Providing of preferential treatment, such as favourable terms, covering trade losses and/or waiving fees / commissions, that extend beyond the terms granted in the normal course of business undertaken with unrelated parties;
d. Providing services to or receiving services from a related-party without an evaluation procedure;
e. Maintaining reporting lines and information flows that may lead to sharing potentially proprietary, confidential or otherwise sensitive information with related parties, except as required for the performance of legitimate duties and functions.
3 (7) (iv) A bank shall not grant any accommodation to any of its Directors or to a close relation of such Director unless such accommodation is sanctioned at a meeting of its Board of Directors, with not less than two-thirds of the number of Directors other than the Director concerned, voting in favour of such accommodation.
This accommodation shall be secured by such security as may from time to time be determined by the Monetary Board as well.
Complied with.
3 (7) (v) a. Where any accommodation has been granted by a bank to a person or a close relation of a person or to any concern in which the person has a substantial interest, and such person is subsequently appointed as a Director of the bank, steps shall be taken by the bank to obtain the necessary security as may be approved for that purpose by the Monetary Board, within one year from the date of appointment of the person as a Director.
b. Where such security is not provided by the period as provided in Direction 3 (7) (v) (a) above, the bank shall take steps to recover any amount due on account of any accommodation, together with interest, if any, within the period specified at the time of the grant of accommodation or at the expiry of a period of eighteen months from the date of appointment of such Director, whichever is earlier.
c. Any Director who fails to comply with the above sub-directions shall be deemed to have vacated the office of Director and the bank shall disclose such fact to the public.
d. This sub-direction, however, shall not apply to a Director who at the time of the grant of the accommodation was an employee of the bank and the accommodation was granted under a scheme applicable to all employees of such bank.
Complied with.
Compliance Requirements as PerBanking Act Direction No. 11 of 2007

About this Report / Performance Highlights 2019 / Chairman’s Message / General Manager’s Review / Organisational Overview / Strategic Report / Performance and Outlook / Stakeholder Value Creation / Financial Reports / Compliance Annexes / Supplementary Information
369
Section Principle Level of Compliance during the Year 2019
3 (7) (vi) A bank shall not grant any accommodation or “more favourable treatment” relating to the waiver of fees and/ or commissions to any employee or a close relation of such employee or to any concern in which the employee or close relation has a substantial interest other than on the basis of a scheme applicable to the employees of such bank or when secured by security as may be approved by the Monetary Board in respect of accommodation granted as per Direction 3 (7) (v) above.
Complied with.
No favourable treatment/ accommodation is provided to any employee of the Bank on more favourable terms unless under general staff loan schemes applicable to all employees of the Bank. Circular instructions have been issued in this regard. Close relations of Bank employees are also not given any favourable treatment/recommendation.
3 (7) (vii) No accommodation granted by a bank under direction 3(7)(v) and 3(7)(vi) above, nor any part of such accommodation, nor any interest due thereon shall be remitted without the prior approval of the Monitory Board and any remission without such approval shall be void and of no effect.
Complied with.
Such a situation has not arisen during the year 2019.
3 (8) Disclosure
3 (8) (i) The Board shall ensure that:
a. annual Audited Financial Statements and quarterly Financial Statements are prepared and published in accordance with the formats prescribed by the supervisory and regulatory authorities and applicable accounting standards; and that
b. such statements are published in the newspapers in an abridged form, in Sinhala, Tamil and English.
Complied with.
3 (8) (ii) The Board shall ensure that the following minimum disclosures are made in the Annual Report:
a. A statement to the effect that the Annual Audited Financial Statements have been prepared in line with applicable accounting standards and regulatory requirements, inclusive of specific disclosures.
Complied with.
Disclosed in the “Annual Report of the Directors on the State of Affairs of the Bank” on pages 133 to 138 and Directors’ Responsibility for Financial Reporting on page 145.
b. A report by the Board on the bank’s internal control mechanism that confirms that the financial reporting system has been designed to provide reasonable assurance regarding the reliability of financial reporting, and that the preparation of Financial Statements for external purposes has been done in accordance with relevant accounting principles and regulatory requirements.
Complied with.
Disclosed in the “Directors’ Statement on Internal Control” on page 142 and 143 of this Annual Report and Directors’ Responsibility for Financial Reporting on page 145.
c. The Assurance Report issued by the Auditors under “Sri Lanka Standard on Assurance Engagements SLSAE 3050 – Assurance Reports for banks on Directors’ Statements on Internal Control”.
Complied with.
The Bank has obtained a Certificate on the Effectiveness of Internal Control over Financial Reporting from the Auditor General which is published on page 144 of this Annual Report.
d. Details of Directors including names, fitness and propriety, transactions with the bank and the total of fees / remuneration paid by the bank.
Complied with.
Details of Directors are given on page 25.
Transactions with the Bank during the year under review amounts to; Interest Income (LKR 2,000.00), Interest Expense (LKR 3.3 million), Deposits as at 31 December 2019 (LKR 1.9 million).
Remuneration paid by the Bank are given in Note 16 to the Financial Statements on page 188.
e. Total net accommodation as defined in 3 (7) (iii) granted to each category of related parties. The net accommodation granted to each category of related parties shall also be disclosed as a percentage of the bank’s regulatory capital.
Complied with.
“Total net accommodation” granted to each category of related parties during the year 2019 as a percentage of the Bank’s regulatory capital is given below:
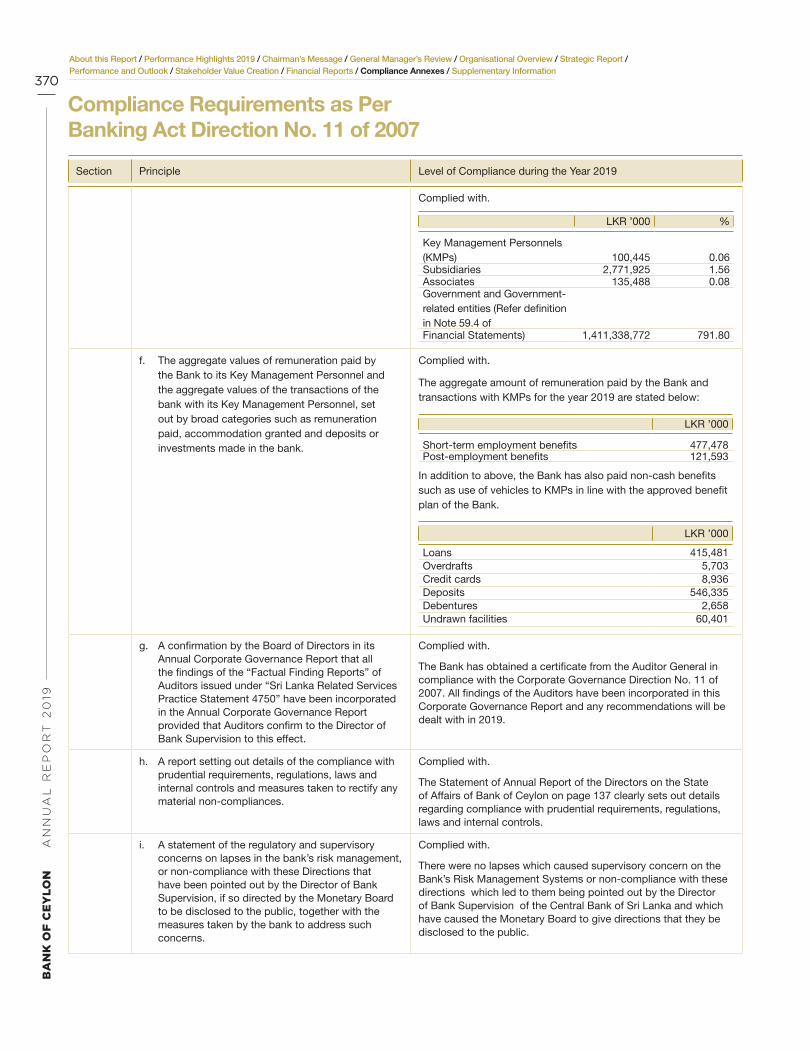
BA
NK
OF
CE
YL
ON
AN
NU
AL
RE
PO
RT
20
19
370
About this Report / Performance Highlights 2019 / Chairman’s Message / General Manager’s Review / Organisational Overview / Strategic Report / Performance and Outlook / Stakeholder Value Creation / Financial Reports / Compliance Annexes / Supplementary Information
Section Principle Level of Compliance during the Year 2019
Complied with.
LKR ’000 %
Key Management Personnels (KMPs) 100,445 0.06Subsidiaries 2,771,925 1.56Associates 135,488 0.08Government and Government-related entities (Refer definition in Note 59.4 ofFinancial Statements) 1,411,338,772 791.80
f. The aggregate values of remuneration paid by the Bank to its Key Management Personnel and the aggregate values of the transactions of the bank with its Key Management Personnel, set out by broad categories such as remuneration paid, accommodation granted and deposits or investments made in the bank.
Complied with.
The aggregate amount of remuneration paid by the Bank and transactions with KMPs for the year 2019 are stated below:
LKR ’000
Short-term employment benefits 477,478Post-employment benefits 121,593
In addition to above, the Bank has also paid non-cash benefits such as use of vehicles to KMPs in line with the approved benefit plan of the Bank.
LKR ’000
Loans 415,481Overdrafts 5,703Credit cards 8,936Deposits 546,335Debentures 2,658Undrawn facilities 60,401
g. A confirmation by the Board of Directors in its Annual Corporate Governance Report that all the findings of the “Factual Finding Reports” of Auditors issued under “Sri Lanka Related Services Practice Statement 4750” have been incorporated in the Annual Corporate Governance Report provided that Auditors confirm to the Director of Bank Supervision to this effect.
Complied with.
The Bank has obtained a certificate from the Auditor General in compliance with the Corporate Governance Direction No. 11 of 2007. All findings of the Auditors have been incorporated in this Corporate Governance Report and any recommendations will be dealt with in 2019.
h. A report setting out details of the compliance with prudential requirements, regulations, laws and internal controls and measures taken to rectify any material non-compliances.
Complied with.
The Statement of Annual Report of the Directors on the State of Affairs of Bank of Ceylon on page 137 clearly sets out details regarding compliance with prudential requirements, regulations, laws and internal controls.
i. A statement of the regulatory and supervisory concerns on lapses in the bank’s risk management, or non-compliance with these Directions that have been pointed out by the Director of Bank Supervision, if so directed by the Monetary Board to be disclosed to the public, together with the measures taken by the bank to address such concerns.
Complied with.
There were no lapses which caused supervisory concern on the Bank’s Risk Management Systems or non-compliance with these directions which led to them being pointed out by the Director of Bank Supervision of the Central Bank of Sri Lanka and which have caused the Monetary Board to give directions that they be disclosed to the public.
Compliance Requirements as PerBanking Act Direction No. 11 of 2007

About this Report / Performance Highlights 2019 / Chairman’s Message / General Manager’s Review / Organisational Overview / Strategic Report / Performance and Outlook / Stakeholder Value Creation / Financial Reports / Compliance Annexes / Supplementary Information
371
Section Principle Level of Compliance during the Year 2019
3 (9) (i) Transitional and Other General Provisions Compliance with this Direction shall commence from 1 January 2008 onwards and all licensed commercial banks shall fully comply with the provisions of this Direction by or before 1 January 2009 except where extended compliance dates have been specifically provided for in this Direction.
Complied with.
3 (9) (ii) In respect of the banks that have been incorporated by specific statutes in Sri Lanka, the Boards as specified in such statutes shall continue to function in terms of the provisions of the respective statutes, provided they take steps to comply with all provisions of this Direction that are not inconsistent with the provisions of the respective statutes.
Complied with.
Bank of Ceylon has taken all possible measures to comply with all applicable provisions of this Direction that are not inconsistent with the provisions of Bank of Ceylon Ordinance No. 53 of 1938 and its amendments, the enabling enactment.
Any instances of non-compliance and where Bank of Ceylon has continued to function in terms of the provisions of the statutes applicable to it has been specifically mentioned above against the relevant sections.
3 (9) (iii) This Direction shall apply to the branches of the foreign banks operating in Sri Lanka to the extent that it is not inconsistent with the regulations and laws applicable in such bank’s country of incorporation. The branch of a foreign bank shall also publish its parent bank’s Annual Corporate Governance Report together with its Annual Report and accounts of the branch operations in Sri Lanka.
Not applicable.
3 (9) (iv) In the event of a conflict between any of the provisions of this Direction and the Articles of Association (or Internal Rules) pertaining to any bank, the provisions of this Direction shall prevail. However, if the Articles of Association of an individual bank set a more stringent standard than that specified in this Direction, such provisions in the Articles of Association may be followed.
Not applicable.
3 (9) (v) If for any reason such as ill health or any incapacity as provided in the Banking Act, the Monetary Board considers that exemptions referred to in Directions 3 (2) (ii) B, 3 (3) (i) A and 3 (3) (ii) A should not be availed of, such ground may be notified to the person by the Monetary Board, and after a hearing, the Monetary Board may limit the period of exemption.
Not applicable.
Note: The following changes were made to the Board of Bank of Ceylon after the financial statement sign -off date-
• Appointment of Mr A C M Fernando Independent Non-Executive Director (w.e.f 21 April 2020)
• Appointment of Mr R M P Rathnayake Non Independent Non-Executive
Ex officio Director (w.e.f. 28 April 2020 in place of Ms
Visakha Amarasekere)

BA
NK
OF
CE
YL
ON
AN
NU
AL
RE
PO
RT
20
19
372
About this Report / Performance Highlights 2019 / Chairman’s Message / General Manager’s Review / Organisational Overview / Strategic Report / Performance and Outlook / Stakeholder Value Creation / Financial Reports / Compliance Annexes / Supplementary Information
Compliance Requirements Enforcedby Colombo Stock ExchangeCompliance to the Listing Rules on contents of Annual Report, which were applicable to the Bank for the year ended 31 December 2019 enforced by the Colombo Stock Exchange, are summarised below:
Rule No. Requirement Period Date Submitted
7.4 a (i) The Interim Financial Statements prepared on quarterly basis, approved by the Board of Directors to be submitted to CSE within 45 days from respective quarter ends for the first three quarters and within two months at the end of 4th quarter.
Quarter 1 ended 31 March 2019 15 May 2019
Quarter 2 ended 30 June 2019 15 August 2019
Quarter 3 ended 30 September 2019 14 November 2019
Quarter 4 ended 31 December 2019 28 February 2020
Rule No. Requirement Compliance
7.4 b (i) Comply with LKAS 34 and disclose Group and Bank separately.
Complied with.
7.4 b (ii) Disclose the additional notes and ratios as per Listing Rules.
Complied with.
7.4 b (iii) Be signed by two Directors. Complied with.
7.4 b (iv) State whether the Financial Statements are audited or not. Complied with.
7.5 a Annual Report to be submitted to CSE within five months from the closure of financial year.
The Audited Financial Statements for the year ended 31 December 2019 was submitted on 27 March 2020.
Annual Report for the year 2019 will be submitted before the deadline.
Rule No. Disclosure Requirement Reference/ Comments Page No
7.6 (i) Names of persons who during the financial year were Directors of the entity.
Annual Report of the Board of Directors on the State of Affairs of Bank of Ceylon
136
7.6 (ii) Principal activities of the entity and its subsidiaries during the year and any changes therein.
Annual Report of the Board of Directors on the State of Affairs of Bank of CeylonNotes to the Financial Statements
133
160
7.6 (iii) The names and the number of shares held by the 20 largest holders of voting and non-voting shares and the percentage of such shares held.
Government of Sri Lanka is the sole shareholder of Bank of Ceylon.
403, 406
7.6 (iv) The public holding percentage. Not applicable.
7.6 (v) A statement of each Director’s holding and Chief Executive Officer’s holding in shares of the entity at the beginning and end of each financial year.
Not applicable.
7.6 (vi) Information pertaining to material foreseeable risk factors of the entity.
Risk Management Report 44 - 61
7.6 (vii) Details of material issues pertaining to employees and industrial relations of the entity.
No material issues occurred during the year under review.
7.6 (viii) Extents,locations,valuations and the number of buildings of the entity’s land holdings and investment properties.
Notes 32 and 33 to the Financial Statements 244 - 261
7.6 (ix) Number of shares representing the entity’s stated capital. Note 49.1 to the Financial Statements 288
7.6 (x) A distribution schedule of the number of holders in each class of equity securities and percentage of their total holdings.
Spplymenatary Information 391
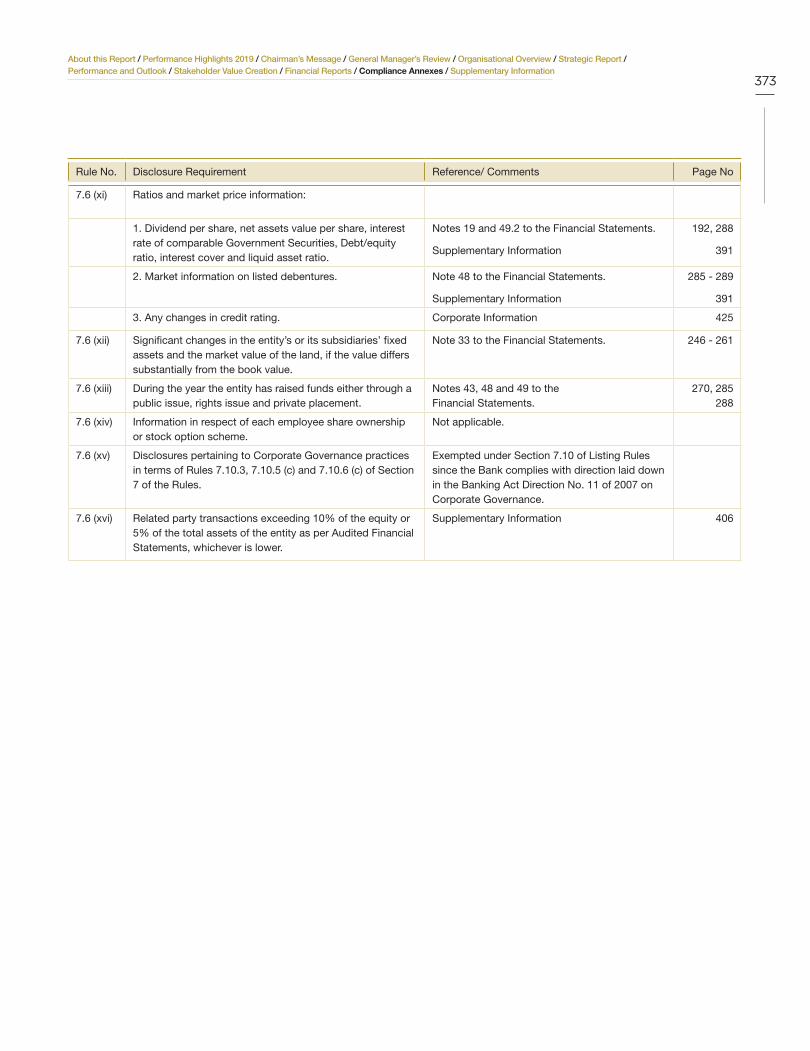
About this Report / Performance Highlights 2019 / Chairman’s Message / General Manager’s Review / Organisational Overview / Strategic Report / Performance and Outlook / Stakeholder Value Creation / Financial Reports / Compliance Annexes / Supplementary Information
373
Rule No. Disclosure Requirement Reference/ Comments Page No
7.6 (xi) Ratios and market price information:
1. Dividend per share, net assets value per share, interest rate of comparable Government Securities, Debt/equity ratio, interest cover and liquid asset ratio.
Notes 19 and 49.2 to the Financial Statements.
Supplementary Information
192, 288
391
2. Market information on listed debentures. Note 48 to the Financial Statements.
Supplementary Information
285 - 289
391
3. Any changes in credit rating. Corporate Information 425
7.6 (xii) Significant changes in the entity’s or its subsidiaries’ fixed assets and the market value of the land, if the value differs substantially from the book value.
Note 33 to the Financial Statements. 246 - 261
7.6 (xiii) During the year the entity has raised funds either through a public issue, rights issue and private placement.
Notes 43, 48 and 49 to the Financial Statements.
270, 285288
7.6 (xiv) Information in respect of each employee share ownership or stock option scheme.
Not applicable.
7.6 (xv) Disclosures pertaining to Corporate Governance practices in terms of Rules 7.10.3, 7.10.5 (c) and 7.10.6 (c) of Section 7 of the Rules.
Exempted under Section 7.10 of Listing Rules since the Bank complies with direction laid down in the Banking Act Direction No. 11 of 2007 on Corporate Governance.
7.6 (xvi) Related party transactions exceeding 10% of the equity or 5% of the total assets of the entity as per Audited Financial Statements, whichever is lower.
Supplementary Information 406

BA
NK
OF
CE
YL
ON
AN
NU
AL
RE
PO
RT
20
19
374
About this Report / Performance Highlights 2019 / Chairman’s Message / General Manager’s Review / Organisational Overview / Strategic Report / Performance and Outlook / Stakeholder Value Creation / Financial Reports / Compliance Annexes / Supplementary Information
Compliance Requirements Enforced by the Central Bank of Sri Lanka
Circular No. Requirement Period Date Published in Sinhala, Tamil
and English Newspapers
02/04/003/0401/001
30 September 2005
The publication should be made
within two months from
the end of each quarter, at least
once in an English, Sinhala and
Tamil newspaper.
Quarter 1 ended 31 March 2019
Quarter 2 ended 30 June 2019
Quarter 3 ended 30 September
2019
31 May 2019
30 August 2019
29 November 2019
02/04/003/0401/001
21 February 2006
If the Bank publishes its
Audited Financial Statements
within three months from the
end of the financial year, the
requirement to publish the
Financial Statements for the 4th
quarter in terms of the circular
dated 30 September 2005
would not be mandatory.
Quarter 4 ended 31 December
2019
(Audited)
30 March 2020
Compliance to other disclosure requirements on Annual Financial Statements, which were applicable to licensed commercial banks are summarised below:1. Information About the Significance of Financial Instruments for Financial Position and Performance
1.1 Statement of Financial Position
1.0.1 Disclosures on categories of financial assets and financial liabilities Note 20 to the Financial Statements
1.1.2 Other disclosures
(i) Special disclosures about financial assets and financial liabilities designated to be measured at fair value through profit or loss, including disclosures about credit risk and market risk, changes in fair value attributable to these risks and the methods of measurement
Note 4.5, 26 and 63 to the Financial Statements
(ii) Reclassifications of financial instruments from one category to another Note 61.4 to the Financial Statements
(iii) Information about financial assets pledged as collateral and about financial or non-financial assets held as collateral
Note 56 the Financial Statements
(iv) Reconciliation of the allowance account for credit losses by class of financial assets
Note 27.1 and 27.2 to the Financial Statements
(v) Information about compound financial instruments with multiple embedded derivatives
None
(vi) Breaches of terms of loan agreements None1.2 Statement of Comprehensive Income1.2.1 Disclosures on items of income, expense, gains and losses Note 7 to 17 to the Financial Statements
1.2.2 Other disclosures(i) Total interest income and total interest expense for those financial instruments
that are not measured at fair value through profit and lossNote 8 to the Financial Statements
(ii) Fee income and expense Note 9 to the Financial Statements(iii) Amount of impairment losses by class of financial assets Note 14 to the Financial Statements(iv) Interest income on impaired financial assets Note 8.1 to the Financial Statements
1.3 Other disclosures1.3.1 Accounting policies for financial instruments Note 4.1.1, 21, to 29, 38 to 43 and 48 to the Financial
Statements1.3.2 Information on financial liabilities designated at FVTPL None1.3.3 Investments in equity instruments designated at FVOCI
(i) Details of equity instruments that have been designated as at FVOCI and the reasons for the designation.
Note 29 to the Financial Statements

About this Report / Performance Highlights 2019 / Chairman’s Message / General Manager’s Review / Organisational Overview / Strategic Report / Performance and Outlook / Stakeholder Value Creation / Financial Reports / Compliance Annexes / Supplementary Information
375
(i) Fair value of each investment at the reporting date Note 29.2 and 29.3 to the Financial Statements(i) Comparable carrying amounts Note 29 to the Financial Statements(ii) Description of how fair value was determined Note 61 to the Financial Statements
(iii) Dividends recognised during the period, separately for investments derecognised during the reporting period and those held at the reporting date.
Note 13 to the Financial Statements
(iv) Transfer cumulative gain or loss within equity during the period and the reasons for those transfers
Note 12 to the Financial Statements
(v) If investments in equity instruments measured at FVOCL are derecognised during the reporting period,
None
- Reasons for disposing of the investments- Fair value of the investments at the date of derecognition- The cumulative gain or loss on disposal
1.3.4 Reclassification of financial assets
(i) For all reclassifications of financial assets in the current or previous reporting period
- Date of reclassification- Detailed explanation of the change in the business model and a qualitative
description of its effect on the financial statements- The amount reclassified into and out of each category
None
(ii) For reclassifications from FVTPL to amortised cost of FVOCI
- The effective interest rate (EIR) determined on the date of reclassification- the interest revenue recognised
None
(iii) For reclassifications from FVOCI to amortised cost, or from FVTPL to amortised cost or FVOCI
- The fair value of the financial assets at the reporting date- The fair value gain or loss that would have been recognised in profit or
loss or OCI during the reporting period if the financial assets had not been reclassified.
None
1.3.5 Information on hedge accounting None
1.3.6 Information about the fair values of each class of financial asset and financial liability, along with:(i) Comparable carrying amounts Note 61 to the Financial Statements
(ii) Description of how fair value was determined Note 61 to the Financial Statements
(iii) The level of inputs used in determining fair value Note 61 to the Financial Statements
(iv) a. Reconciliations of movements between levels of fair value measurement hierarchy
b. additional disclosures for financial instruments that fair value is determined using level 3 inputs
None
Note 61.1.3 to the Financial Statements
(v) Information if fair value cannot be reliably measured None
2. Information About The Nature And Extent Of Risks Arising From Financial Instruments
2.1 Qualitative disclosures
2.1.1 Risk exposures for each type of financial instrument Risk Report and Note 63 to the Financial Statements
2.1.2 Management’s objectives, policies, and processes for managing those risks. Risk Report
2.1.3 Changes from the prior period Risk Report
2.2 Quantitative disclosures
2.2.1 Summary of quantitative data about exposure to each risk at the reporting date Note 63 to the Financial Statements
2.2.2 Disclosures about credit risk, liquidity risk, market risk, operational risk, interest rate risk and how these risks are managed
Note 63 to the Financial Statements
(i) Credit Risk Note 63.2 to the Financial Statements
(a) Maximum amount of exposure (before deducting the value of collateral), description of collateral, information about credit quality of financial assets that are neither past due nor impaired and information about credit quality of financial assets
Note 63.2.1 to the Financial Statements

BA
NK
OF
CE
YL
ON
AN
NU
AL
RE
PO
RT
20
19
376
About this Report / Performance Highlights 2019 / Chairman’s Message / General Manager’s Review / Organisational Overview / Strategic Report / Performance and Outlook / Stakeholder Value Creation / Financial Reports / Compliance Annexes / Supplementary Information
Compliance Requirements Enforced by the Central Bank of Sri Lanka
(b)For financial assets that are past due or impaired, disclosures on age, factors considered in determining as impaired and the description of collateral on each class of financial asset
Note 63.2.1 to the Financial Statements
(c)Information about collateral or other credit enhancements obtained or called
Note 63.2.1 to the Financial Statements
d) Credit risk management practices - CRM practices and how they relate to the recognition and measurement ECL, including the methods, assumptions, and information used to measure ECL
- Quantitative and qualitative information to evaluate the amounts in the Financial Statements arising from ECL, including changes and the reasons for those changes
- How the Bank determines whether the credit risk of financial instruments has increased significantly since initial recognition
- The Bank’s definitions of default for different financial instruments, including the reasons for selecting those definitions
- How instruments are grouped if ECL are measured on a collective basis- How the bank determines that financial assets are credit – impaired- The Bank’s write – off policy, including the indicators that there is no
reasonable expectation of recovery- How the modification requirements have been applied
Note 27 and 63 to the Financial Statements
(e) ECL calculations
- Basis of the inputs, assumptions and the estimation techniques used when estimating ECL
- How forward – looking information has been incorporated into the determination of ECL including the use of macroeconomic information.
- Changes in estimation techniques or significant assumptions made during the reporting period
Note 27 to the Financial Statements
(f) Amounts arising from ECL
- Reconciliation for each class of financial instruments of the opening balance to the closing balance of the impairment loss allowance
Note 21,23,27,28 to the Financial Statements
(g) Collateral
- Bank’s maximum exposure to credit risk at the reporting date- Description of collateral held as security and other credit enhancements
Note 63.2.1 to the Financial Statements
(h) Written – off assets
- Contractual amount outstanding of financial assets written off during the reporting period that are still subject to enforcement activity.
Note 27 to the Financial Statements
i) Pillar III disclosures of the Banking Act Directions No 1 of 2016 on Capital requirements under Basel III for licensed banks
Capital Adequacy in Compliance annexes
(ii) Liquidity Risk
(a) A maturity analysis of financial liabilities Note 58 to the Financial Statements
(b) Description of approach to risk management Risk Report and Note 63.3 to the Financial Statements
(c) Pillar III disclosures of the Banking Act Direction No. 1 of 2016 on Capital requirements under Basel III for Licensed Banks
Capital Adequacy in Compliance annexes
(iii) Market Risk
(a) A sensitivity analysis of each type of market risk to which the entity is exposed
Note 63.4 to the Financial Statements
b) Additional information, if the sensitivity analysis is not representative of the Bank’s risk exposure
Note 63.4 to the Financial Statements
(c) Pillar III disclosures of the Banking Act Directions No. 1 of 2016 on Capital requirements under Basel III for Licensed Banks
Capital Adequacy in Compliance annexes

About this Report / Performance Highlights 2019 / Chairman’s Message / General Manager’s Review / Organisational Overview / Strategic Report / Performance and Outlook / Stakeholder Value Creation / Financial Reports / Compliance Annexes / Supplementary Information
377
(iv) Operational Risk
Pillar III disclosures of the Banking Act Direction No. 1 of 2016 on Capital requirements under Basel III for Licensed Banks
Capital Adequacy in Compliance annexes
(v) Equity risk in the banking book
(a) Qualitative disclosures
- Differentiation between holdings on which capital gains are expected and those taken under other objectives including for relationship and strategic reasons
Note 26 and 29 to the Financial Statements
- Discussion of important policies covering the valuation and accounting of equity holdings in the banking book
-Note 26 and 29 to the Financial Statements
(b) Quantitative disclosures
· Value disclosed in the statement of financial position of investments, as well as the fair value of those investments; for quoted securities, a comparison to publicly quoted share values where the share price is materially different from fair value
Note 26.2, 29.2 and 29.3 to the Financial Statements
· The types and nature of investments Note 26 and 29 to the Financial Statements
· The cumulative realised gains / (losses) arising from sales and liquidations in the reporting period
Note 12 to the Financial Statements
(vi) Interest rate risk in the banking book
a) Qualitative disclosures
Nature of interest rate risk in the banking book (IRRBB) and key assumptions
Note 63.4.2 to the Financial Statements
(b) Quantitative disclosures
The increase / (decline) in earnings or economic value (or relevant measure used by management) for upward and downward rate shocks according to management’s method for measuring IRRBB, broken down by currency (as relevant)
Note 63.4.1 to the Financial Statements
1.1.3 Information on concentrations of risk Note 63.2.2 to the Financial Statements
3. Other Disclosures
3.1 Capital
1.1.1 Capital structure Note 49 to the Financial Statements
3.2 Qualitative disclosures
Summary information on the terms and conditions of the main features of all capital instruments, especially in the case of innovative, complex or hybrid capital instruments
Debt - Note 48 to the Financial Statements Equity – 49
3.3 Quantitative disclosures
3.3 Quantitative disclosures
· Paid-up share capital / common stock Capital Adequacy in Compliance Annexes
· Reserves Capital Adequacy in Compliance Annexes
· Non-controlling interests in the equity of subsidiaries Capital Adequacy in Compliance Annexes
· Innovative instruments None
· Other capital instruments None
· Deductions from Tier I capital Capital Adequacy in Compliance Annexes
(b) The total amount of Tier 2 and Tier 3 capital Capital Adequacy in Compliance Annexes
(c) Other deductions from capital Capital Adequacy in Compliance Annexes
(d) Total eligible capital Capital Adequacy in Compliance Annexes
3.4 Capital adequacy
(i) Qualitative disclosures
A summary discussion of the bank’s approach to assessing the adequacy of its capital or support current and future activities
Risk Report and Note 63.6 to the Financial Statements
(ii) Quantitative disclosures
(a) Capital requirements for credit risk, market risk and operational risk Capital Adequacy in Compliance Annexes
(b) Total and Tier 1 capital ratio Capital Adequacy in Compliance Annexes

BA
NK
OF
CE
YL
ON
AN
NU
AL
RE
PO
RT
20
19
378
About this Report / Performance Highlights 2019 / Chairman’s Message / General Manager’s Review / Organisational Overview / Strategic Report / Performance and Outlook / Stakeholder Value Creation / Financial Reports / Compliance Annexes / Supplementary Information
Capital AdequacyBasel III Regulatory RequirementsBasel III is a global regulatory framework on bank capital adequacy, stress testing, and market liquidity risk. This third installment of the Basel Accords was developed in response to the deficiencies in financial regulation revealed by the financial crisis of 2007–08. It is intended to strengthen bank capital requirements by increasing bank liquidity and decreasing bank leverage.
The Basel III standard have been strengthened the requirements from the Basel II standard on bank's minimum capital ratios. In addition, it introduces requirements on liquid asset holdings and funding stability, thereby seeking to mitigate the risk of a run on the bank.
The new guidelines require, banks and financial institutions to hold more capital and higher quality of capital than under Basel II rules. The new Leverage Ratio introduces a non-risk based measure to supplement the risk-based minimum capital requirements. The new liquidity ratios ensure that adequate funding is maintained in case there are other severe banking crises.
Main Features of the Basel III• Capital Conservation Buffer - An additional layer of common equity that, when
breached, restricts payouts of earnings to help protect the minimum common equity requirement.
• Countercyclical Capital Buffer, which places restrictions on participation by banks in system-wide credit booms with the aim of reducing their losses in credit bursts.
• Additional capital requirement for domestic systemically important banks (D-SIBs), this framework attempt to identify the banks whose failure has a larger impact on the financial system due to size, interconnectedness, lack of substitutability and complexity and requires maintaining higher loss absorbency. According to the Central bank of Sri Lanka, four banks in Sri Lanka have been identified as D-SIBs in the banking sector including BoC.
• Leverage ratio – a minimum amount of loss-absorbing capital, relative to all of a bank’s assets and off-balance sheet exposures regardless of risk weighting. Leverage ratio have been implemented in Sri Lanka from 01.01.2019, with minimum Leverage Ratio of 3% need to be maintained by all the licensed banks.
• Liquidity requirements - a minimum liquidity ratio, the liquidity coverage ratio (LCR), intended to provide enough cash to cover funding needs over a 30-day period of stress; and a longer-term ratio, the net stable funding ratio (NSFR), intended to address maturity mismatches over the entire balance sheet.
The implementation of the Basel III minimum capital requirements across the banking sector in Sri Lanka, under the direction No 01 of 2016 is now fully effective from the 01.01.2019.
Basel III capital requirements for Bank of Ceylon from 01.01.2019 as follows.
Components of Capital 01.01.2019
Common Equity Tier 1 4.50%
Capital Conservation
Buffer
2.50%
Surcharge on Domestic
Systematically Important
banks(D-SIBs)
1.50%
Additional Tier 1 Capital 1.50%
Total Tier 1 Capital 10.00%
Minimum Total Capital
Ratio + Capital
Conservation Buffer
+Capital surcharge on
D-SIBs
14.00%
Pillar I
EnhancedMinimumCapitalandLiquidityRequirements
Pillar II
EnhancedSupervisoryReview Process for Firm-wide RiskManagement andCapital Planning
Pillar III
Enhanced RiskDisclosure andMarket Discipline
Basel III

About this Report / Performance Highlights 2019 / Chairman’s Message / General Manager’s Review / Organisational Overview / Strategic Report / Performance and Outlook / Stakeholder Value Creation / Financial Reports / Compliance Annexes / Supplementary Information
379
CBSL issued their first consultation paper for Basel III implementation in April 2015. The supervisory objectives of the CBSL is to promote safety and soundness in the financial system and maintain an appropriate level of capital in the system, enhance competitive equality, constitute a more comprehensive approach to addressing risks, and focus more on internationally active banks such as BoC. Bank of Ceylon commenced its preparation towards Basel III by implementing well formulate strategic policies. By enhancing
capital base & applying risk mitigating techniques, Bank able to maintain the ratio well above the regulatory requirements as of 31 December 2019. Internally generated funds and issuance of Basel III complied subordinated Debentures during the year has aggrandize Bank’s capital base, enabled the bank to meet the enhanced capital adequacy requirements under the Basel III which is fully, effective from 1 of January 2019.
Basel III Disclosure Requirements
Key Regulatory Ratios- Capital and Liquidity
31.12.2019
Item Bank Group
Basel III
Regulatory Capital (LKR’000)
Common Equity Tier 1 127,675,095 135,727,486
Tier 1 Capital 127,675,095 135,727,486
Total Capital 178,243,760 187,530,766
Regulatory Capital Ratios (%)
Common Equity Tier 1 Capital Ratio (%) (Minimum Requirement- 8.50%) 11.16 11.38
Tier 1 Capital Ratio (%) (Minimum Requirement- 10.00%) 11.16 11.38
Total Capital Ratio (%) (Minimum Requirement- 14.00%) 15.58 15.72
Leverage Ratio (%) (Minimum Requirement- 3.00%) 4.97 5.18
31.12.2019
Item Bank Group
Regulatory Liquidity
Statutory Liquid Assests - Domestic (LKR ’000) 547,432,530 478,549,997
Statutory Liquid Assests - FCBU (USD ’000) 717,216 835,941
Statutory Liquid Assests Ratio (Minimum Requirement- 20%)
Domestic Banking Unit (%) 24.57 24.47
Off -Shore Banking Unit (%) 58.32 60.20
Liquidity Coverage Ratio (%) - Rupee (Minimum Requirement 2019 - 100%) 188.19 143.51
LIquidity Coverage Ratio (%) - All Currency (Minimum Requirement 2019 -100%) 125.62 114.99
Net Stable Funding Ratio (%) (Minimum Requirement - 100%) 135.71 N/A

BA
NK
OF
CE
YL
ON
AN
NU
AL
RE
PO
RT
20
19
380
About this Report / Performance Highlights 2019 / Chairman’s Message / General Manager’s Review / Organisational Overview / Strategic Report / Performance and Outlook / Stakeholder Value Creation / Financial Reports / Compliance Annexes / Supplementary Information
Basel III Computation of Capital Ratios -31.12.2019
Item Bank Group
LKR’000 LKR’000
Common Equity Tier 1 ( CET 1) Capital after Adjustments 127,675,095 135,727,486
Common Equity Tier 1 ( CET 1) Capital 133,494,497 139,057,810
Equity Capital ( Stated Capital) / Assigned Capital 25,000,000 25,000,000
Reserve Fund 13,383,000 13,383,000
Published Retained Earnings/(Accumulated Retained Losses) 91,386,218 95,304,367
Published Accumulated other Comprehensive Income(OCI) 1,185,961 1,543,094
General and other Disclosed Reserves 2,539,318 3,827,349
Unpublished current year's profit/(losses) and gains reflected in OCI - -
Ordinary shares issued by consoloidated banking and financial subsidaries held by third parties -
Total Adjustments to CET 1 Capital 5,819,401 3,330,324
Goodwill(net) - -
Intangible Assests (net) 1,089,462 1,324,313
Revaluation losses of property, plant and equipment 180,879 180,879
Deferred tax assets (net) 158,820 670,756
Investments in the capital of banking and financial institutions where the bank does not own more than 10 per cent of the issued ordinary share capital of the entity 588,967 576,767
Significant investments in the capital of financial institutions where the bank owns more than 10 per cent of the issued ordinary share capital of the entity 3,223,664 -
Shortfall of capital in financial subsidiaries 577,609 577,609
Additional Tier 1 (AT I) capital after adjustment - -
Additional Tier 1 (AT I) capital - -
Qualifying Additional Tier 1 Capital Instruments - -
Instruments issued by Consolidated Banking and Financial Subsidiaries of the Bank and held by Third Parties - -
Total Adjustments to AT 1 Capital - -
Investment in Own Shares - -
others ( specify)
Tier 2 Capital after Adjustments 50,568,664 51,803,280
Tier 2 Capital 52,239,788 53,439,788
Qualifying Tier 2 Capital Instruments 35,202,921 36,402,921
Revaluation Gains 6,556,298 6,556,298
General Provisions 10,480,570 10,480,570
Instruments issued by Consolidated Banking and Financial Subsidiaries of the Bank and held by Third Parties - -
Total Adjustment to Tier 2 1,671,124 1,636,508
Investment in Own Shares -
Investments in the capital of financial institutions and where the bank does not own more than 10 per cent of the issued capital carrying voting rights of the issuing entity 1,671,124 1,636,508
Significant investments in the capital of banking and financial institutions where the bank own more than 10 per cent of the issued ordinary share capital of the entity - -
CET I Capital 127,675,095 135,727,486
Total Tier 1 Capital 127,675,095 135,727,486
Total Capital 178,243,760 187,530,766
Capital Adequacy

About this Report / Performance Highlights 2019 / Chairman’s Message / General Manager’s Review / Organisational Overview / Strategic Report / Performance and Outlook / Stakeholder Value Creation / Financial Reports / Compliance Annexes / Supplementary Information
381
Basel III Computation of Capital Ratios - 31.12.2019
Item Bank Group
LKR’000 LKR’000
Total Risk Weighted Assets (RWA) 1,144,411,823 1,193,055,936
RWAs for Credit Risk 1,051,215,112 1,089,492,911 RWAs for Market Risk 6,635,871 6,635,871 RWAs for Operational Risk 86,560,840 96,927,153 CET I Capital Ratio (including Capital Conservation Buffer, Countercyclical Capital Buffer & Surcharge on D-SIBs) (%) 11.16 11.38of which :Capital Conservation Buffer (%) 2.50 2.50of which :Countercyclical Buffer (%) N/A N/Aof which:Capital Surcharge on D- SIBs (%) 1.50 1.50Total Tier 1 Capital Ratio (%) 11.16 11.38Total Capital Ratio (including Capital Conservation Buffer, Countercyclical Capital Buffer & Surchanrge on D- SIBs) ( %) 15.58 15.72of which : Capital Conservation Buffer (%) 2.50 2.50of which: Countercyclical Buffer (%) N/A N/Aof which:Capital Surcharge on D- SIBs (%) 1.50 1.50
Computation of Leverage Ratio as at 31.12.2019
Item Bank Group
LKR’000 LKR’000
Tier 1 Capital 127,675,095 135,727,486
Total Exposures 2,569,823,296 2,619,193,506 On-Balance Sheet Items (Excluding Derivatives and Securities Financing Transactions, but including Collateral 2,384,064,643 2,431,300,993 Derivative Exposures 516,926 516,926 Securities Financing Transaction Exposures 37,622,915 39,756,775 Other Off- Balance Sheet Exposures 147,618,813 147,618,813 Basel III Leverage Ratio (%) (Tier 1 Capital/Total Excposure) 4.97 5.18
Main Features of Regulatory Capital Instruments
Description of the Capital Instrument
Issuer Bank of Ceylon Bank of Ceylon Bank of Ceylon Bank of Ceylon Bank of Ceylon
Unique Identifier LK0357D20462 LK0357D20439 LK0357D20454 LK0357D20470 LK0357D22542
Governing Laws of the InstrumentLaws of
Sri LankaLaws of
Sri LankaLaws of
Sri LankaLaws of
Sri LankaLaws of
Sri Lanka
Original Date of Issuance 25-Oct-13 25-Oct-13 25-Oct-13 25-Oct-13 22-Sep-14
Par Value of Instrument -LKR 100 100 100 100 100
Issued quantity ( No of Debentures) 11,990,000 10,000 12,000,000 16,000,000 18,334,950
Issued Quantity (LKR’000) 1,199,000 1,000 1,200,000 1,600,000 1,833,495
Perpetual or Dated
Original Maturity Date, if Applicable 24-Oct-21 24-Oct-21 24-Oct-22 24-Oct-23 21-Sep-22
Amount Recognised in Regulatory Capital (in LKR’000 as at the Reporting Date) 479,600 400 720,000 1,280,000 1,008,422
Accounting Classification (equity/Liability) Liability Liability Liability Liability Liability
Coupons/Dividends
Fixed or Floating Dividend/Coupon FIXED FLOATING FIXED FIXED FIXED
Coupon Rate and any Related Index % 13.25 12.99 13.25 13.25 8.25
Non-Cumulative or Cumulative Non-Cumulative Non-Cumulative Non-Cumulative Non-Cumulative Non-Cumulative
Convertible or Non-Convertible Non Convertible Non Convertible Non Convertible Non Convertible Non Convertible

BA
NK
OF
CE
YL
ON
AN
NU
AL
RE
PO
RT
20
19
382
About this Report / Performance Highlights 2019 / Chairman’s Message / General Manager’s Review / Organisational Overview / Strategic Report / Performance and Outlook / Stakeholder Value Creation / Financial Reports / Compliance Annexes / Supplementary Information
Main Features of Regulatory Capital Instruments
Issuer Bank of Ceylon Bank of Ceylon Bank of Ceylon Bank of Ceylon Bank of Ceylon
Unique Identifier LK0357D22559 LK0357D23201 LK0357D23185 LK0357D23193 LK0357D23177
Governing Laws of the InstrumentLaws of
Sri LankaLaws of
Sri LankaLaws of
Sri LankaLaws of
Sri LankaLaws of
Sri Lanka
Original Date of Issuance 22-Sep-14 6-Oct-15 6-Oct-15 6-Oct-15 6-Oct-15
Par Value of Instrument -LKR 100 100 100 100 100
Issued quantity ( No of Debentures) 300 2,885,900 122,200 44,783,860 11,802,560
Issued Quantity (LKR’000) 30 288,590 12,220 4,478,386 1,180,256
Perpetual or Dated
Original Maturity Date, if Applicable 21-Sep-22 5-Oct-20 5-Oct-20 5-Oct-20 5-Oct-23
Amount Recognised in Regulatory Capital (in LKR’000 as at the Reporting Date) 17 57,718 2,444 895,677 885,192
Accounting Classification (equity/Liability) Liability Liability Liability Liability Liability
Coupons/Dividends
Fixed or Floating Dividend/Coupon FLOATING FIXED FIXED FLOATING FIXED
Coupon Rate and any Related Index % 10.43 8.25 8.00 13.05 9.50
Non-Cumulative or Cumulative Non-Cumulative Non-Cumulative Non-Cumulative Non-Cumulative Non-Cumulative
Convertible or Non-Convertible Non Convertible Non Convertible Non Convertible Non Convertible Non Convertible
Main Features of Regulatory Capital Instruments
Issuer Bank of Ceylon Bank of Ceylon Bank of Ceylon Bank of Ceylon Bank of Ceylon
Unique Identifier LK0357D23219 LK0357D23763 LK0357D23797 LK0357D23771 LK0357D23789
Governing Laws of the InstrumentLaws of
Sri LankaLaws of
Sri LankaLaws of
Sri LankaLaws of
Sri LankaLaws of
Sri Lanka
Original Date of Issuance 6-Oct-15 29-Dec-16 29-Dec-16 29-Dec-16 29-Dec-16
Par Value of Instrument -LKR 100 100 100 100 100
Issued quantity ( No of Debentures) 20,405,480 79,981,764 10,200 7,836 200
Issued Quantity (LKR’000) 2,040,548 7,998,176 1,020 784 20
Perpetual or Dated
Original Maturity Date, if Applicable 5-Oct-23 28-Dec-21 28-Dec-21 28-Dec-24 28-Dec-24
Amount Recognised in Regulatory Capital (in LKR’000 as at the Reporting Date) 1,530,411 3,199,271 408 784 20
Accounting Classification (equity/Liability) Liability Liability Liability Liability Liability
Coupons/Dividends
Fixed or Floating Dividend/Coupon FLOATING FIXED FLOATING FIXED FLOATING
Coupon Rate and any Related Index % 13.05 13.25 12.68 12.75 12.68
Non-Cumulative or Cumulative Non-Cumulative Non-Cumulative Non-Cumulative Non-Cumulative Non-Cumulative
Convertible or Non-Convertible Non Convertible Non Convertible Non Convertible Non Convertible Non Convertible
Capital Adequacy

About this Report / Performance Highlights 2019 / Chairman’s Message / General Manager’s Review / Organisational Overview / Strategic Report / Performance and Outlook / Stakeholder Value Creation / Financial Reports / Compliance Annexes / Supplementary Information
383
Issuer Bank of Ceylon Bank of Ceylon Bank of Ceylon Bank of Ceylon Bank of Ceylon
Governing Laws of the InstrumentLaws of
Sri LankaLaws of
Sri LankaLaws of
Sri LankaLaws of
Sri LankaLaws of
Sri Lanka
Original Date of Issuance 29-Dec-17 29-Dec-17 31-Jul-18 3-Dec-18 27-Jun-19
Par Value of Instrument - LKR 100 100 100 100 100
Issued quantity ( No of Debentures) 50,000,000 10,000,000 67,000,000 53,000,000 30,000,000
Issued Quantity (LKR’000) 5,000,000 1,000,000 6,700,000 5,300,000 3,000,000
Perpetual or Dated
Original Maturity Date, if Applicable 28-Dec-25 28-Dec-22 30-Jul-26 2-Dec-23 26-Jun-24
Amount Recognised in Regulatory Capital (in LKR’000 as at the Reporting Date) 5,000,000 600,000 6,700,000 4,240,000 2,700,000
Accounting Classification (equity/Liability) Liability Liability Liability Liability Liability
Coupons/Dividends
Fixed or Floating Dividend/Coupon FIXED FIXED FIXED FIXED FIXED
Coupon Rate and any Related Index % 12.75 12.50 12.00 12.00 11.75
Non-Cumulative or Cumulative Non-Cumulative Non-Cumulative Non-Cumulative Non-Cumulative Non-Cumulative
Convertible or Non-Convertible Non Convertible Non Convertible Non Convertible Non Convertible Non Convertible
Main Features of Regulatory Capital Instruments
Issuer Bank of Ceylon Bank of Ceylon Bank of Ceylon Bank of Ceylon Bank of Ceylon
Governing Laws of the InstrumentLaws of
Sri LankaLaws of
Sri Lanka Laws of
Sri Lanka Laws of
Sri Lanka Laws of
Sri Lanka
Original Date of Issuance 17-Jul-19 18-Jul-19 23-Jul-19 24-Jul-19 26-Jul-19
Par Value of Instrument -LKR 100 100 100 100 100
Issued quantity ( No of Debentures) 10,488,500 22,000,000 25,000,000 4,000,000 611,500
Issued Quantity (LKR’000) 1,048,850 2,200,000 2,500,000 400,000 61,150
Perpetual or Dated Dated Dated Dated Dated Dated
Original Maturity Date, if Applicable 16-Jul-24 17-Jul-24 22-Jul-24 23-Jul-24 25-Jul-27
Amount Recognised in Regulatory Capital (in LKR’000 as at the Reporting Date) 996,408 2,090,000 2,375,000 380,000 61,150
Accounting Classification (equity/Liability) Liability Liability Liability Liability Liability
Coupons/Dividends
Fixed or Floating Dividend/Coupon FIXED FIXED FIXED FIXED FIXED
Coupon Rate and any Related Index % 11.80 11.80 11.80 11.50 11.75
Non-Cumulative or Cumulative Non-Cumulative Non-Cumulative Non-Cumulative Non-Cumulative Non-Cumulative
Convertible or Non-ConvertibleNon Viability
write downNon Viability
write down Non Viability
write down Non Viability
write down Non Viability
write down

BA
NK
OF
CE
YL
ON
AN
NU
AL
RE
PO
RT
20
19
384
About this Report / Performance Highlights 2019 / Chairman’s Message / General Manager’s Review / Organisational Overview / Strategic Report / Performance and Outlook / Stakeholder Value Creation / Financial Reports / Compliance Annexes / Supplementary Information
Credit Risk Under Standardised Approach
Credit Risk Exposures and Credit Risk Mitigation (CRM) Effects -Bank
Amount (LKR’000) as at 31.12.2019
Asset Class
Exposures before Credit Conversion Factor
(CCF) and CRM
Exposures Post CCF and CRM
RWA and RWA Density (%)
On Balance Sheet
Amount
Off Balance Sheet
Amount
On Balance Sheet
Amount
Off Balance Sheet
Amount RWA RWA
Density (%)
Claims on Central Goverment and CBSL 827,086,112 17,270,595 827,086,112 3,454,119 47,817,419 5.76%
Claims on Foreign Sovereigns and their Central Bank 21,025,325 - 21,025,325 - 19,867,539 94.49%Claims on Public Sector Entities 375,550,829 193,373,793 52,637,440 35,437,508 76,074,947 86.38%Claim on Official Entities and Multilateral Development Banks - - - - - - Claims on Banks Exposures 68,943,366 - 68,943,366 - 52,630,334 76.34%Claims on Financial Institutions 14,285,831 - 14,285,831 - 7,970,991 55.80%Claims on Corporates 295,885,838 136,267,923 263,081,573 35,386,414 285,587,820 95.68%Retail Claims 431,030,414 61,520,801 389,335,062 - 306,441,265 78.71%Claims Secured by Gold 64,552,862 - 64,552,862 - 305,545 0.47%Claims Secured by Residential Property 83,047,046 - 83,047,046 - 53,488,418 64.41%Claims secured by Commercial Real Estate 36,303,077 - 36,303,077 - 36,303,077 100.00%Non- Performing Assets (NPAs) 30,549,350 - 31,158,601 - 31,158,601 100.00%Higher - risk Categories 1,314,877 - 1,314,877 - 3,287,193 250.00%Cash Items and Other Assets 123,402,185 62,493,745 123,402,185 62,493,745 130,281,962 70.08%Total 2,372,977,113 470,926,857 1,976,173,358 136,771,785 1,051,215,112 49.75%
Credit Risk Under Standardised Approach Credit Risk Exposures and Credit Risk Mitigation (CRM) Effects -Group
Amount (LKR’000) as at 31.12.2019
Asset Class
Exposures before Credit Conversion Factor
(CCF) and CRM
Exposures Post CCF and CRM
RWA and RWA Density (%)
On Balance Sheet
Amount
Off Balance Sheet
Amount
On Balance Sheet
Amount
Off Balance Sheet
Amount RWA RWA
Density (%)
Claims on Central Goverment and CBSL 832,666,366 17,270,595 832,666,366 3,454,119 47,817,419 5.72%
Claims on Foreign Sovereigns and their Central Bank 21,025,325 - 21,025,325 - 19,867,539 94.49%Claims on Public Sector Entities 383,643,956 193,373,793 52,637,440 35,437,508 76,074,947 86.38%Claim on Official Entities and Multilateral Development Banks - - - - - - Claims on Banks Exposures 72,425,460 - 72,425,460 - 56,112,428 77.48%Claims on Financial Institutions 14,285,831 - 14,285,831 - 7,970,991 55.80%Claims on Corporates 322,133,836 136,267,923 289,329,571 35,386,414 311,835,818 96.03%Retail Claims 431,030,414 61,520,801 389,335,062 - 306,441,265 78.71%Claims Secured by Gold 64,552,862 - 64,552,862 - 305,545 0.47%Claims Secured by Residential Property 83,047,046 - 83,047,046 - 53,488,418 64.41%Claims secured by Commercial Real Estate 36,303,077 - 36,303,077 - 36,303,077 100.00%Non- Performing Assets (NPAs) 30,549,350 - 31,158,601 - 31,158,601 100.00%Higher - risk Categories 162,300 - 162,300 - 405,750 250.00%Cash Items and Other Assets 134,792,175 62,493,745 134,792,175 62,493,745 141,711,112 71.83%Total 2,426,618,000 470,926,857 2,021,721,117 136,771,785 1,089,492,911 50.47%
Capital Adequacy

About this Report / Performance Highlights 2019 / Chairman’s Message / General Manager’s Review / Organisational Overview / Strategic Report / Performance and Outlook / Stakeholder Value Creation / Financial Reports / Compliance Annexes / Supplementary Information
385
Credit Risk under Standardised Approach : Exposures by Asset Classes and Risk Weights - Bank
Amount (LKR’000)as at 31.12.2019 (Post CCF & CRM)
0% 20% 50% 60% 75% 100% 150% >150%
Total Credit
Exposures
Amount
Claims on Central
Government and
Central Bank of
Sri Lanka 588,793,134 238,292,978 827,086,112
Claims on Foreign
Sovereigns and
their Central Bank 2,315,572 18,709,753 21,025,325
Claims on public
Sector Entities 15,000,000 37,637,440 52,637,440
Claims on
Official Entities
and Multilateral
Development
Banks -
Claims on Banks
Exposures 20,208,641 292,238 48,442,487 68,943,366
Claims on
Financial
Institutions 887,500 11,209,680 2,188,651 14,285,831
Claims on
Corporates 11,941,152 4,628,627 245,952,528 559,266 263,081,573
Retail Claims 673,305 330,497,902 58,163,855 389,335,062
Claims Secured
by Gold 63,025,138 1,527,725 64,552,862
Claims Secured
by Commercial
Residential
Property 59,117,257 23,929,790 83,047,046
Claims secured by
Commercial Real
Estate 36,303,077 36,303,077
Non- Performing
Assests(NPAs) - 31,158,602 (0) 31,158,601
Higher -risk
Categories 1,314,877 1,314,877
Cash Item and
Other Assests 46,658,722 11,194,058 65,549,406 123,402,185
Total 698,476,994 299,052,053 77,563,374 673,305 330,497,902 568,035,588 559,266 1,314,877 1,976,173,358
Risk Weight
Asset Classes

BA
NK
OF
CE
YL
ON
AN
NU
AL
RE
PO
RT
20
19
386
About this Report / Performance Highlights 2019 / Chairman’s Message / General Manager’s Review / Organisational Overview / Strategic Report / Performance and Outlook / Stakeholder Value Creation / Financial Reports / Compliance Annexes / Supplementary Information
Credit Risk under Standardised Approach : Exposures by Asset Classes and Risk Weights - Group
Amount (LKR’000)as at 31.12.2019 (Post CCF & CRM)
0% 20% 50% 60% 75% 100% 150% >150%
Total Credit
Exposures
Amount
Claims on Central Government and Central Bank of Sri Lanka
594,373,388
238,292,978
832,666,366
Claims on Foreign Sovereigns and their Central Bank 2,315,572 18,709,753 21,025,325
Claims on public Sector Entities 15,000,000 37,637,440 52,637,440
Claims on Official Entities and Multilateral Development Banks -
Claims on Banks Exposures 20,208,641 292,238 51,924,581 72,425,460
Claims on Financial Institutions 887,500 11,209,680 2,188,651 14,285,831
Claims on Corporates 11,941,152 4,628,627
272,200,526 559,266
289,329,571
Retail Claims 673,305 330,497,902 58,163,855
389,335,062
Claims Secured by Gold 63,025,138 1,527,725 64,552,862
Claims Secured by Commercial Residential Property 59,117,257 23,929,790 83,047,046
Claims secured by Commercial Real Estate 36,303,077 36,303,077
Non- Performing Assests(NPAs) 31,158,602 (0) 31,158,601
Higher -risk Categories 162,300 162,300
Cash Item and Other Assests 46,619,562 11,194,058 76,978,555
134,792,174
Total 704,018,088 299,052,053 77,563,374 673,305 330,497,902 609,194,829 559,266 162,300 2,021,721,116
Risk Weight
Asset Classes
Capital Adequacy

About this Report / Performance Highlights 2019 / Chairman’s Message / General Manager’s Review / Organisational Overview / Strategic Report / Performance and Outlook / Stakeholder Value Creation / Financial Reports / Compliance Annexes / Supplementary Information
387
Market Risk Under Standardised Measurement Method
31.12.2019
Item Bank Group
LKR’000 LKR’000
(a) Capital Charge for Interest Rate Risk 171,648 171,648
General Interest Rate Risk 171,648 171,648
(i) Net Long or Short Position 171,648 171,648
(ii) Horizontal Disallowance - -
(iii) Vertical Disallowance - -
(iv) Options - -
Specific Interest Rate Risk - -
(b) Capital Charge for Equity 696,256 696,256
(i) General Equity Risk 363,460 363,460
(ii) Specific Equity Risk 332,796 332,796
(c) Capital Charge for Foreign Exchange & Gold 61,118 61,118
Total Capital Charge for Market Risk [(a)+(b)+(c)] 929,022 929,022
Total Risk Weighted Amount for Market Risk 6,635,871 6,635,871
Operational Risk under Basic Indicator Approach - Bank
Gross Income (LKR’000)as at 31.12.2019
Business Lines
Capital Charge Factor
Fixed
Factor 1st Year 2nd Year 3rd Year
The Basic Indicator Approach 15% 68,808,549 85,490,210 88,071,593
Capital Charges for Operational Risk(LKR’000) 12,118,518
Risk Weighted Amount for Operational Risk(LKR’000) 86,560,843
Operational Risk under Basic Indicator Approach - Group
Gross Income (LKR’000)as at 31.12.2019
Business Lines
Capital Charge Factor
Fixed
Factor 1st Year 2nd Year 3rd Year
The Basic Indicator Approach 15% 80,756,706 96,341,700 94,297,623
Capital Charges for Operational Risk(LKR’000) 13,569,801
Risk Weighted Amount for Operational Risk(LKR’000) 96,927,150

BA
NK
OF
CE
YL
ON
AN
NU
AL
RE
PO
RT
20
19
388
About this Report / Performance Highlights 2019 / Chairman’s Message / General Manager’s Review / Organisational Overview / Strategic Report / Performance and Outlook / Stakeholder Value Creation / Financial Reports / Compliance Annexes / Supplementary Information
Differences between Accounting and Regulatory Scopes and mapping of Financial Statement categories with Regulatory Risk Categories - Bank only.
Amount ( LKR’000) as at 31.12.2019
a b c d e
Item
Carrying Values
Reported in Published Financial
Statement
Carrying Values under
Scope of Regulatory Reporting
Subject to Credit Risk Framework
Subject to Market Risk Framework
Not subject to Capital
Requirements or Subject to Deducation from Capital
Assets 2,415,116,629 2,425,218,523 2,418,354,397 9,098,774 6,732,037
Cash and Cash Equivalents 64,868,895 63,015,224 63,015,224 126,090 -
Balances With Central Bank 54,594,436 58,532,301 58,532,301 - -
Placements with Banks 44,476,343 45,166,260 45,166,260 - -
Securities Purchased under resale agreements 2,179,449 2,179,000 2,179,000 - -
Derivative Financial Instruments 132,090 132,090 - - -
Financial assets recognized through profit or loss measured at fair value 10,055,415 8,369,905 8,359,164 8,972,684 10,741
Financial assets at amortized cost - - - -
Loans and advances 1,549,804,871 1,583,352,660 1,583,352,660 - -
Debt and other instruments 572,747,809 561,648,424 559,977,300 - 1,671,124
Financial assests - measured at fair value through other comprehensive income / Available for sale 14,236,090 14,417,308 13,839,082 - 578,226
Investments in Subsidiaries 6,513,048 6,488,048 3,264,384 - 3,223,664
investments in Associates 92,988 117,988 117,988 -
Investment Properties 2,648,784 2,648,784 2,648,784 - -
Property,plant and Equipment 25,579,065 25,727,695 25,727,695 - -
Right of Use Asset 3,479,937
Intangible Assets 1,127,007 1,089,462 - 1,089,462
Deferred Tax Assets 158,820 - - 158,820
Other Assets 62,580,402 52,174,555 52,174,555 - -
On Balance Sheet Liabilities 2,272,833,892 2,273,357,776 - - -
Due to banks 2,669,407 3,751,785 - - -
Securities Sold under resale agreements 34,183,210 34,005,403 - - -
Derivative Financial Instruments 106,677 - - -
Financial Liabilities at amortised cost - - - - -
- Due to Depositors 2,005,211,794 1,957,022,980 - - -
- Other Borrowings 137,833,543 133,315,794 - - -
Debt Securities Issued - - - - -
Current Tax Liabilities 30,899,820 - - -
Deferred Tax Liabilities 4,592,022 - - - -
Other Provisions - - - - -
Other Liabilities 34,015,688 61,318,468 - - -
Subordinated Term Debts 54,221,552 53,043,525 - - -
Capital Adequacy

About this Report / Performance Highlights 2019 / Chairman’s Message / General Manager’s Review / Organisational Overview / Strategic Report / Performance and Outlook / Stakeholder Value Creation / Financial Reports / Compliance Annexes / Supplementary Information
389
Amount ( LKR’000) as at 31.12.2019
a b c d e
Item
Carrying Values
Reported in Published Financial
Statement
Carrying Values under
Scope of Regulatory Reporting
Subject to Credit Risk Framework
Subject to Market Risk Framework
Not subject to Capital
Requirements or Subject to Deducation from Capital
Off-Balance Sheet Liabilities 508,217,961 491,427,328 - - -
Guarantees 72,825,976 72,688,274 72,688,274 - -
Performance Bonds 28,436,586 28,436,586 28,436,586 - -
Letters of Credit 118,292,304 118,292,304 118,292,304 - -
Other Contingent Items 97,706,812 97,706,812 97,706,812 - -
Undrawn Loan Commitment 48,756,752 48,756,752 48,756,752 - -
Other Commitments 142,199,531 125,546,600 125,546,600 - -
Shareholder's Equity 25,000,000 25,000,000 - - -
Equity Capital (Stated Capital)/Assigned Capital
of which Amount Eligible for CET 1 25,000,000 25,000,000 - - -
of which Amount Eligible FOR AT1 - - - - -
Permanent Reserve Fund 13,383,000 12,890,000
OCI Reserves 1,976,601 - - - -
Retained Earnings 87,689,480 99,475,973 - - -
Other Reserves 14,233,656 14,494,774 - - -
Total Shareholder's Equity 142,282,737 151,860,747 - - -
Total On -Balance Sheet Liabilities & Equity Capital and Reserves 2,415,116,629 2,425,218,523 - - -
Explanations of Differences between Accounting and Regulatory Exposure Amounts
Difference arises due to fair value adjustments, impairment under expected loss model on financial instruments and the classification adjustments between line items of the financial position under SLFRSs.
Derivative Financial InstrumentsDerivatives are financial instruments that derive their value in response to changes in interest rates, financial instrument prices, commodity prices, foreign exchange rates, credit risk, indices etc.
Derivative financial instruments are measured at fair value using forward pricing models in Published Financial Statement and more details are given in Note 25 and Note 40 in this Report.
Loans and Advances to Customers
Allowance for Impairment
Time-based provisions under Central Bank guidelines have been netted off from the amortised cost when arriving loans and advances to the customers under regulatory reporting, however as per SLFRS 9 “impairment under expected loss model” have been netted off from amortised cost when arriving loans and advances to the customers under reporting purposes. More details are given under Note 27.
Day One DifferenceWhen the transaction price differs from the fair value of other observable current market transactions in the same instrument, Bank recognises fair value of such transactions as per SLFRS 9. More details are given in Note 4.5.4. However, Bank recognises cost of such transactions under regulatory reporting.
Financial assets – FVTOCIFinancial assets FVTOCI are measured at fair value under published Financial Statements and carried at cost for regulatory reporting purposes. The details of financial investments – FVTOCI and the fair valuation of these instruments are disclosed in Note 29 and Note 61 respectively. The following disclosures are included in Note 63 on Risk Management on page 321 to 338.
(i) Summary discussions on adequacy/ meeting current and future capital requirement.
(ii) Bank risk management approach.
(iii) Risk management related to key risk exposure.

BA
NK
OF
CE
YL
ON
AN
NU
AL
RE
PO
RT
20
19
390
About this Report / Performance Highlights 2019 / Chairman’s Message / General Manager’s Review / Organisational Overview / Strategic Report / Performance and Outlook / Stakeholder Value Creation / Financial Reports / Compliance Annexes / Supplementary Information
Capital Adequacy
D-SIB Assessment Exercise LKRGroup
Size Indicator
Section 1 - Total Exposures
Total exposures measure 2,619,193,506
Interconnectedness Indicators
Section 2 - Intra-Financial System Assets
a. Funds deposited with or lent to other financial institutions (including unused portion of committed lines extended)
(i) Funds deposited 7,810
(ii) Lending 14,786
b. Holdings of securities issued by other financial institutions 14,210
c. Net positive current exposure of securities financing transactions (SFTs) with other financial institutions 253
d. Over-the-counter (OTC) derivatives with other financial institutions that have a net positive mark to market value 131
Intra-financial system assets
Section 3 - Intra-Financial System Liabilities
a. Funds deposited by or borrowed from other financial institutions (including unused portion of committed lines obtained)
(i) Funds deposited 18,814
(ii) Borrowings 132,747
b. Net negative current exposure of securities financing transactions with other financial institutions -
c. Over-the-counter derivatives with other financial institutions that have a net negative mark to market value 20,081
Intra-financial system liabilities
Section 4 - Securities Outstanding
Securities outstanding 53,043
Substitutability/Financial Institution Infrastructure Indicators
Section 5 - Payments made in the reporting year (excluding intragroup payments)
Payments activity 12,119,716
Section 6 - Assets Under Custody
Assets under custody 382,439
Section 7 - Underwritten Transactions in Debt and Equity Markets
Underwriting activity -
Section 8 - Trading Volume
Trading volume 12,330
Complexity indicators
Section 9 - Notional Amount of Over-the-Counter (OTC) Derivatives
OTC derivatives 23,020
Section 10 - Level 2 Assets
Level 2 assets 3,842
Section 11 - Trading and available for sale (AFS) securities
Trading and AFS securities 14,777
Section 12 - Cross-Jurisdictional Liabilities
Foreign Liabilities (excluding derivatives and intragroup liabilities)
Cross-jurisdictional liabilities 247,208
Section 13 - Cross-Jurisdictional Claims
Foreign claims (excluding derivatives and intragroup liabilities)
Cross-jurisdictional claims 11,942

GRI Index 392
Independent Assurance Report - Sustainability 395
Statement of Profit or Loss in USD 397
Statement of Comprehensive Income in USD 398
Statement of Financial Position in USD 399
Quarterly Performance 400
Share and Debenture Information 403
Ten Year Statistical Summary – Bank 405
Subsidiaries and Associates 407
Correspondent Banks by Country 410
Exchange Companies by Country 416
Glossary of Financial/ Banking Terms 418
Corporate Offices and Overseas Branches 423
Corporate Information 425
Supplementary Information

BA
NK
OF
CE
YL
ON
AN
NU
AL
RE
PO
RT
20
19
392
About this Report / Performance Highlights 2019 / Chairman’s Message / General Manager’s Review / Organisational Overview / Strategic Report / Performance and Outlook / Stakeholder Value Creation / Financial Reports / Compliance Annexes / Supplementary Information
GRI Index
GRI Standard Disclosure Location/ Explanation Page number
GRI 101: Foundation 2016 (does not include any disclosures)
General Disclosures
GRI 102: General Disclosures 2016
102-1 Name of Organisation About this Report 5
102-2 Activities, brands, products and services Strategic Report 69
102-3 Location of headquarters Corporate Information 425
102-4 Location of operations Organisational Overview 22
102-5 Ownership and legal form Corporate Information, Financial Reports 300, 425
102-6 Markets served Organisational Overview, Strategic Report 22, 69, 70, 96
102-7 Scale of the organisation Performance Highlights 2019 8 - 10
102-8 Information on employees and other workers Organisational Overview 38
102-9 Supply chain Performance Highlights, Strategic Report 9, 83
102-10 Significant changes to the organisation and supply chain
About this Report 5
102-11 Precautionary principle Strategic Report 107
102-12 External initiatives About this Report 6
102-13 Membership of associations Strategic Report 83
102-14 Statement from senior decision maker Chairman’s Message 12 - 13
102-16 Values, principles, norms and standards of behaviour
Bankers to the Nation, Strategic Report 4, 106
102-18 Governance Structure Strategic Report 79, 101
102-40 List of stakeholder groups Value Creation 128 - 130
102-41 Collective bargaining agreements Strategic Report 92
102-42 Identifying and selecting stakeholders Value Creation 128
102-43 Approach to stakeholder engagement Value Creation 128 - 130
102-44 Key topics and concerns raised Stakeholder Value Creation 128 - 130
102-45 Entities included in the consolidated financial statements
Financial Report 160
102-46 Defining report content and topic boundary About this Report, Organisational Overview
5, 42 - 43
102-47 Material topics Organisational Overview 42
102-48 Restatement of information About this Report, Financial Report 5, 319
102-49 Changes in reporting Organisational Overview 43
102-50 Reporting period About this Report 5
102-51 Date of most recent report About this Report 5
102-52 Reporting cycle About this Report 5
102-53 Contact point for questions regarding Report About this Report 6
102-54 Claims of reporting in accordance with GRI Standards
About this Report 5
102-55 GRI context index Supplementary Information 392 - 394
102-56 External assurance About this Report, Financial Report 6, 395 - 396

About this Report / Performance Highlights 2019 / Chairman’s Message / General Manager’s Review / Organisational Overview / Strategic Report / Performance and Outlook / Stakeholder Value Creation / Financial Reports / Compliance Annexes / Supplementary Information
393
GRI Standard Disclosure Location/ Explanation Page number
103 Management Approach
GRI 103: Management Approach
103-1 Explanation of material topics and its boundaries
Organisational Overview 42 - 43
103-2 The Management Approach and its components
Strategic Report 64 - 6768 - 108
103-3 Evaluation of the Management Approach Strategic Report 64 - 67, 68 - 108
200 Economic Performance
GRI 201: Economic Performance 2016
201-1 Direct economic value generated and distributed
Organisational Overview 37
201-2 Financial implications and other risks and opportunities due climate change
Organisational Overview, Strategic Report
41, 85
201-3 Defined benefit plan obligations and other retirement plans
Financial Report, Strategic Report 91, 274
GRI 202: Market Presence 2016
202-2: Proportion of senior management hired from local community
Strategic Report 38
GRI 203: Indirect Economic Impacts 2016
203-2: Significant indirect economic impacts Strategic Report 80 - 81
GRI 204: Procurement practices 2016
204-1 Proportion of spending on local suppliers Strategic Report 9
GRI 205: Anti-corruption
205-2 Communication and training related to anti- corruption policies and procedures
Strategic Report 106
300 Environmental Performance
GRI 302: Energy 2016 302-1 Energy consumption within the organisation Strategic Report 84
302-4 Reduction of energy consumption Strategic Report 84
GRI 305 Emissions: 2016
305-1 Direct (scope 1) Greenhouse Gas (GHG) emissions
Strategic Report 84
305-2 Energy Indirect (scope 2) Greenhouse Gas (GHG) emissions
Strategic Report 84
305-4 GHG emission intensity Strategic Report 84
GRI 307: Environmental Compliance
307-1 Non-compliance with environmental laws and regulations
Strategic Report 60
400 Social Performance
GRI 401: Employment 2016
401-1 New Employee hires and employee turnover Strategic Report 91, 94
401-2 Benefits provided to full time employees that are not provided to temporary or part-time employees
Strategic Report 91
401-3 Parental leave Strategic Report 93
GRI 402: Labour Management Relations 2016
402-1 Minimum notice periods regarding operational changes
Strategic Report 92
403: Occupational health and safety 2016
403-4 Health and safety topics covered in formal agreements with trade unions
Strategic Report 92
GRI 404: Training and education
404-1 Average hours of training per year per employee
Strategic Report 93

BA
NK
OF
CE
YL
ON
AN
NU
AL
RE
PO
RT
20
19
394
About this Report / Performance Highlights 2019 / Chairman’s Message / General Manager’s Review / Organisational Overview / Strategic Report / Performance and Outlook / Stakeholder Value Creation / Financial Reports / Compliance Annexes / Supplementary Information
GRI Standard Disclosure Location/ Explanation Page number
404-2 Programmes for upgrading skills and transition assistance programmes
Strategic Report 93
404-3 Percentage of employees receiving regular performance and career development reviews
Strategic Report 93 - 94
GRI 405: Diversity and equal opportunity 2016
405-2 Ratio of basic salary and remuneration of women to men
Strategic Report 92
GRI 406: Non Discrimination
406-1 incidents of discrimination and corrective actions taken
Strategic Report 92
GRI 407 Freedom of Association and Collection Bargaining
407-1 Operations and suppliers in which the right to freedom of association and collective bargaining may be at risk
Strategic Report 83
GRI 408: Child Labour 408-1 Operations and suppliers at significant risk for incidents of child labour
Strategic Report 83
GRI 409: Forced or Compulsory labour
409-1 Operations and suppliers at significant risk for incidents of forced or compulsory labour
Strategic Report 83
GRI 413: Local communities 2016
413-1 Operations with local community engagement, impact assessments and development programmes
Strategic Report 82, 86, 92
GRI 417: Marketing and labelling
417-1 Requirements for product and service labelling Strategic Report 70
417-3 Incidents of non-compliance concerning marketing communications
Strategic Report 70
GRI 418: Customer Privacy 2016
418-1 Total number of substantiated complaints regarding breaches of customer privacy and losses of customer data
Strategic Report 70
GRI 419: Socio Economic Compliance
419-1 Non - Compliance with laws and regulations in the social and economic era
Organisational Overview 60
GRI Index

About this Report / Performance Highlights 2019 / Chairman’s Message / General Manager’s Review / Organisational Overview / Strategic Report / Performance and Outlook / Stakeholder Value Creation / Financial Reports / Compliance Annexes / Supplementary Information
395
Independent Assurance Report - Sustainability
Independent Assurance Report to Bank of Ceylon on the Sustainability Reporting Criteria Presented in the Integrated Annual Report- 2019
Introduction and scope of the engagementThe management of Bank of Ceylon (“the Bank”) engaged us to provide an independent assurance on the following elements of the sustainability reporting criteria presented in the annual report- 2019 (“the Report”).
• Reasonable assurance on the information on financial performance as specified on page 37 of the Report.
• Limited assurance on other information presented in the Report, prepared in accordance with the requirements of the Global Reporting Initiative GRI Standards: ‘In accordance’ – Core guidelines.
Basis of our work and level of assurance We performed our procedures to provide limited assurance in accordance with Sri Lanka Standard on Assurance Engagements (SLSAE 3000): ‘Assurance Engagements Other than Audits or Reviews of Historical Financial Information’, issued by the Institute of Chartered Accountants of Sri Lanka (“CASL”).
The evaluation criteria used for this limited assurance engagement are based on the Sustainability Reporting
Guidelines (“GRI Guidelines”) and related information in particular, the requirements to achieve GRI Standards ‘In accordance’ - Core guideline publication, publicly available at GRI’s global website at “www.globalreporting.org”.
Our engagement provides limited assurance as well as reasonable assurance. A limited assurance engagement is substantially less in scope than a reasonable assurance engagement conducted in accordance with SLSAE-3000 and consequently does not enable to obtain assurance that we would become aware of all significant matters that might be identified in a reasonable assurance engagement. Accordingly, we do not express an opinion providing reasonable assurance.
Management of the Bank’s responsibility for the ReportThe management of the Bank is responsible for the preparation of the self-declaration, the information and statements contained within the Report, and for maintaining adequate records and internal controls that are designed to support the sustainability reporting process in line with the GRI Sustainability Reporting Guidelines.
Ernst & Young’s responsibilityOur responsibility is to express a conclusion as to whether we have become aware of any matter that causes us to believe that the Report is not prepared in accordance with the
requirements of the Global Reporting Initiative, GRI Standards: ‘In accordance’ - Core guidelines. This report is made solely to the Bank in accordance with our engagement letter dated 17 February 2020. We disclaim any assumption of responsibility for any reliance on this report to any person other than the Bank or for any purpose other than that for which it was prepared. In conducting our engagement, we have complied with the independence requirements of the Code for Ethics for Professional Accountants issued by the CASL.
Key assurance procedures We planned and performed our procedures to obtain the information and explanations considered necessary to provide sufficient evidence to support our limited assurance conclusions. Key assurance procedures included:
• Interviewing relevant the Bank’s personnel to understand the process for collection, analysis, aggregation and presentation of data.
• Reviewing and validation of the information contained in the Report.
• Checking the calculations performed by the Bank on a sample basis through recalculation.
• Reconciling and agreeing the data on financial performance are properly derived from the Bank’s audited financial statements for the year ended 31 December 2019.

BA
NK
OF
CE
YL
ON
AN
NU
AL
RE
PO
RT
20
19
396
About this Report / Performance Highlights 2019 / Chairman’s Message / General Manager’s Review / Organisational Overview / Strategic Report / Performance and Outlook / Stakeholder Value Creation / Financial Reports / Compliance Annexes / Supplementary Information
• Comparison of the content of the Report against the criteria for a Global Reporting Initiative, GRI Standards: ‘In accordance’ – Core guidelines.
Our procedures did not include testing electronic systems used to collect and aggregate the information.
Limitations and considerationsEnvironmental and social performance data are subject to inherent limitations given their nature and the methods used for determining, calculating and estimating such data.
ConclusionBased on the procedures performed, as described above, we conclude that;
• The information on financial performance as specified on page 37 of the Report are properly derived from the audited financial statements of the Bank for the year ended 31 December 2019.
• Nothing has come to our attention that causes us to believe that other information presented in the Report are not fairly presented, in all material respects, in accordance with the Bank’s sustainability practices and policies some of which are derived from Sustainability Reporting Guideline, GRI Standards- ‘In accordance’ Core.
Ernst & YoungChartered Accountants
24 March 2020Colombo
Independent Assurance Report

About this Report / Performance Highlights 2019 / Chairman’s Message / General Manager’s Review / Organisational Overview / Strategic Report / Performance and Outlook / Stakeholder Value Creation / Financial Reports / Compliance Annexes / Supplementary Information
397
Bank Group
For the year ended 31 December 2019Restated
2018 2019Restated
2018
USD ’000 USD ’000 USD ’000 USD ’000
Total income 1,316,474 1,209,416 1,369,193 1,255,000
Interest income 1,213,854 1,069,188 1,251,846 1,104,293
Less : Interest expenses 800,129 710,457 820,787 728,427
Net interest income 413,725 358,731 431,059 375,866
Fee and commission income 80,215 70,682 82,416 72,807
Less : Fee and commission expenses 13,615 12,293 13,831 12,370
Net fee and commission income 66,600 58,389 68,585 60,437
Net gains/ (losses) from trading 13,958 18,779 14,068 18,978
Net fair value gains/ (losses) from financial instruments at fair value through profit or loss 1,772 (3,728) 1,887 (3,924)
Net gains/ (losses) from derecognition of financial assets 1,554 832 1,612 839
Net other operating income 5,121 53,664 17,364 62,007
Total operating income 502,730 486,667 534,575 514,203
Less : Impairment charge/ (reversal) for loans and other losses 102,391 82,304 103,060 83,045
Net operating income 400,339 404,363 431,515 431,158
Less : Operating expenses
Personnel expenses 101,110 94,947 111,285 104,388
Depreciation and amortisation expenses 20,393 12,040 20,784 15,395
Other expenses 57,480 62,057 71,085 71,868
Total operating expenses 178,983 169,044 203,154 191,651
Operating profit/ (loss) before Taxes on financial services 221,356 235,319 228,361 239,507
Less : Taxes on financial services 57,922 52,467 59,739 53,724
Operating profit/ (loss) after Taxes on financial services 163,434 182,852 168,622 185,783
Share of profits/ (losses) of associate companies, net of tax - - 265 51
Profit/ (loss) before income tax 163,434 182,852 168,887 185,834
Less : Income tax expense 36,266 67,926 38,144 70,709
Profit/ (loss) for the year 127,168 114,926 130,743 115,125
Profit attributable to :
Equity holder of the Bank 127,168 114,926 129,117 115,222
Non-controlling interest - - 1,626 (97)
Profit for the year 127,168 114,926 130,743 115,125
Earnings per share and Dividend per share
Basic earnings per share (USD) 5.35 6.16 5.43 6.18
Diluted earnings per share (USD) 5.09 5.40 5.16 5.41
Dividend per share (USD) 0.08 1.42 0.08 1.42
Exchange rate of 1 USD was LKR 181.6340 as at 31 December 2019. (LKR 182.7499 as at 31 December 2018)
The Statement of Profit or Loss given in this page does not form part of the Audited Financial Statements and it is solely for the convenience of the shareholders, investors, bankers and other interested parties of the Financial Statements of the Bank.
Statement of Profit or Loss in USD

BA
NK
OF
CE
YL
ON
AN
NU
AL
RE
PO
RT
20
19
398
About this Report / Performance Highlights 2019 / Chairman’s Message / General Manager’s Review / Organisational Overview / Strategic Report / Performance and Outlook / Stakeholder Value Creation / Financial Reports / Compliance Annexes / Supplementary Information
Bank Group
For the year ended 31 December 2019Restated
2018 2019Restated
2018
USD ’000 USD ’000 USD ’000 USD ’000
Profit for the year 127,168 114,926 130,743 115,125
Items that will be reclassified to the profit or loss
Exchange differences on translation of foreign operations (784) 6,079 (304) 7,952
Net gains/ (losses) on investments in debt instruments measured
at fair value through other comprehensive income 424 (1,486) 438 (1,562)
Net (gains)/ losses on investment in financial assets at fair value through OCI
reclassification to profit or loss 1,272 (83) 1,272 (83)
Deferred tax effect on above (442) - (442) -
Share of other comprehensive income of Associate companies, net of tax - - (39) 19
Total items that will be reclassified to the profit or loss 470 4,510 925 6,326
Items that will not be reclassified to profit or loss
Change in fair value on investments in equity instruments
designated at fair value through other comprehensive income 303 (2,244) 80 (4,509)
Deferred tax effect on above (795) (37) (795) (37)
Gain/ (Loss) of derecognition of investments in equity instruments
designated at fair value through other comprehensive income 84 - 84 -
Changes in revaluation surplus/ (deficit) - (1,847) 4,354 807
Deferred tax effect on above - 517 (1,219) (226)
Net actuarial gains/ (losses) on defined benefit plans (69,736) (9,953) (69,944) (9,797)
Deferred tax effect on above 91 17 187 (51)
Total items that will not be reclassified to the profit or loss (70,053) (13,547) (67,253) (13,813)
Other comprehensive income for the year, net of tax (69,583) (9,037) (66,328) (7,487)
Total comprehensive income for the year 57,585 105,889 64,415 107,638
Attributable to:
Equity holder of the Bank 57,585 105,889 62,667 107,750
Non-controlling interest - - 1,748 (112)
Total comprehensive income for the year 57,585 105,889 64,415 107,638
Exchange rate of 1 USD was LKR 181.6340 as at 31 December 2019. (LKR 182.7499 as at 31 December 2018)
The Statement of Comprehensive Income given in this page does not form part of the Audited Financial Statements and it is solely for the convenience of the shareholders, investors, bankers and other interested parties of the Financial Statements of the Bank.
Statement of Comprehensive Income in USD

About this Report / Performance Highlights 2019 / Chairman’s Message / General Manager’s Review / Organisational Overview / Strategic Report / Performance and Outlook / Stakeholder Value Creation / Financial Reports / Compliance Annexes / Supplementary Information
399
Bank Group
As at 31 December 2019Restated
2018 2019Restated
2018
USD ’000 USD ’000 USD ’000 USD ’000AssetsCash and cash equivalents 357,141 429,262 356,925 429,866 Balances with Central Banks 300,574 359,400 300,574 359,400 Placements with banks 244,868 221,341 263,781 228,082 Securities purchased under resale agreements 11,999 - 21,923 7,858 Derivative financial instruments 727 6,597 727 6,597 Financial assets recognised through profit or loss - measured at fair value 55,361 50,765 60,852 52,440 Financial assets at amortised cost 8,532,570 7,820,017 8,704,037 7,992,445
Loans and advancesDebt and other instruments 3,153,307 3,019,643 3,160,076 3,026,175
Financial assets measured at fair value through OCI 78,378 91,379 93,686 105,821 Investment in subsidiary companies 35,858 35,639 - - Investment in associate companies 512 509 2,461 2,414 Investment properties 14,583 15,135 646 658 Property, Plant and Equipment 140,828 132,302 217,395 206,635 Right of Use Assets/ Leasehold properties 19,159 541 12,044 714 Intangible assets 6,205 6,775 7,498 7,971 Deferred tax assets - - 2,819 17 Other assets 344,541 313,197 351,950 320,381 Total assets 13,296,611 12,502,502 13,557,394 12,747,474
LiabilitiesDue to banks 14,697 13,146 16,148 13,767 Securities sold under repurchase agreements 188,198 532,965 192,037 533,096 Derivative financial instruments 587 2,785 587 2,785 Financial liabilities at amortised cost
Due to depositors 11,039,848 9,690,702 11,149,917 9,794,393 Other borrowings 758,853 1,104,199 798,833 1,132,989
Debt securities issued - - 11,605 22,466 Current tax liabilities - 21,462 763 22,103 Deferred tax liabilities 25,282 27,762 39,546 42,475 Insurance provision - Life - - 2,814 3,150 Insurance provision - Non life - - 1,974 2,006 Other liabilities 187,276 108,128 191,363 120,223 Subordinated liabilities 298,521 278,125 298,466 276,250 Total liabilities 12,513,262 11,779,274 12,704,053 11,965,703
Equity Share capital 137,639 136,799 137,639 136,799 Permanent reserve fund 73,681 70,534 73,681 70,534 Retained earnings 482,782 427,150 490,771 433,267 Other reserves 89,247 88,745 141,422 137,367 Total equity attributable to equity holder of the Bank 783,349 723,228 843,513 777,967 Non-controlling interest - - 9,828 3,804 Total equity 783,349 723,228 853,341 781,771 Total liabilities and equity 13,296,611 12,502,502 13,557,394 12,747,474 Contingent liabilities and commitments 2,798,033 2,781,434 2,844,363 2,808,168 Net assets value per share (USD) 31.33 36.16 33.74 38.90
Exchange rate of 1 USD was LKR 181.6340 as at 31 December 2019. (LKR 182.7499 as at 31 December 2018)
The Statement of Financial Position given in this page does not form part of the Audited Financial Statements and it is solely for the convenience of the shareholders, investors, bankers and other interested parties of the Financial Statements of the Bank.
Statement of Financial Position in USD

BA
NK
OF
CE
YL
ON
AN
NU
AL
RE
PO
RT
20
19
400
About this Report / Performance Highlights 2019 / Chairman’s Message / General Manager’s Review / Organisational Overview / Strategic Report / Performance and Outlook / Stakeholder Value Creation / Financial Reports / Compliance Annexes / Supplementary Information
Quarterly PerformanceSummary of the Statement of Profir or Loss
2019 201831-Mar 30-Jun 30-Sep 31-Dec 31-Mar 30-Jun 30-Sep 31-Dec
LKR Million LKR Million LKR Million LKR Million LKR Million LKR Million LKR Million LKR Million
Bank
Net interest income 18,407 20,049 19,066 17,625 14,350 15,133 17,558 18,515
Non interest income 2,266 4,137 6,685 5,551 4,731 4,506 6,541 9,624
Non interest expense (8,444) (9,238) (9,046) (8,254) (8,130) (8,926) (9,392) (6,691)
Impairment (charge)/ reversal for loans and other
losses (3,589) (6,808) (4,217) (3,572) (2,218) (5,023) (4,084) (3,112)
Operating profit before Taxes on Financial
Services 8,640 8,140 12,488 11,350 8,733 5,690 10,623 18,336
Taxes on financial services (2,205) (2,774) (2,930) (2,611) (1,947) (1,424) (2,001) (4,215)
Profit before income tax 6,435 5,366 9,558 8,739 6,786 4,266 8,622 14,121
Income tax expense (2,219) (2,633) (2,855) 1,121 (2,017) (2,020) (3,328) (5,048)
Profit after income tax 4,216 2,733 6,703 9,860 4,769 2,246 5,294 9,072
Other comprehensive income (442) (69) 370 (12,129) (11) (40) (140) (1,475)
Total comprehensive income 3,774 2,664 7,073 (2,269) 4,758 2,206 5,154 7,598
Group
Net interest income 19,106 20,707 19,911 18,571 15,129 15,888 18,352 19,321
Non interest income 2,891 4,374 7,890 6,159 5,478 4,543 7,166 10,131
Non interest expense (9,627) (9,585) (10,811) (9,389) (9,360) (9,703) (10,607) (7,615)
Impairment (charge)/ reversal for loans and other
losses (3,682) (6,850) (4,283) (3,904) (2,451) (5,152) (4,177) (2,795)
Operating profit before Taxes on Financial
Services 8,688 8,646 12,707 11,437 8,796 5,576 10,734 19,042
Taxes on financial services (2,217) (2,849) (3,042) (2,743) (1,976) (1,454) (2,051) (4,337)
Operating profit after Taxes on Financial
Services 6,471 5,797 9,665 8,694 6,820 4,122 8,683 14,705
Share of profit/ (losses) of associate
companies,net of tax 0.2 20 7 22 1 17 (1) (7)
Profit before income tax 6,471 5,817 9,672 8,716 6,821 4,139 8,682 14,698
Income tax expense (2,292) (2,717) (2,925) 1,006 (2,059) (2,100) (3,414) (5,349)
Profit after income tax 4,179 3,100 6,747 9,722 4,762 2,039 5,268 9,349
Other comprehensive income (449) (61) 221 (11,552) 135 (181) (268) (545)
Total comprehensive income 3,730 3,039 6,968 (1,830) 4,897 1,858 5,000 8,804

About this Report / Performance Highlights 2019 / Chairman’s Message / General Manager’s Review / Organisational Overview / Strategic Report / Performance and Outlook / Stakeholder Value Creation / Financial Reports / Compliance Annexes / Supplementary Information
401
Summary of the Statement of Financial Position
2019 201831-Mar 30-Jun 30-Sep 31-Dec 31-Mar 30-Jun 30-Sep 31-Dec
LKR Million LKR Million LKR Million LKR Million LKR Million LKR Million LKR Million LKR Million
Bank
AssetsInvestments 601,829 606,219 603,006 650,301 638,963 579,952 566,730 624,872 Loans and advances to customers 1,396,787 1,409,513 1,445,357 1,549,805 1,186,473 1,208,724 1,294,017 1,429,107 Property, Plant and Equipment 25,373 26,297 28,301 30,186 24,596 24,910 24,917 25,515 Other assets 183,030 191,317 226,871 184,825 197,789 173,088 214,014 205,337 Total assets 2,207,019 2,233,346 2,303,535 2,415,117 2,047,821 1,986,674 2,099,678 2,284,831
Liabilities and EquityDue to customers 1,770,802 1,819,931 1,879,709 2,005,212 1,624,851 1,617,378 1,648,255 1,770,975 Debt securities and borrowed funds 281,450 255,557 258,457 226,238 278,006 228,411 298,165 350,018 Other liabilities 29,725 30,152 30,763 41,384 29,224 24,299 29,958 31,668 Equity 125,042 127,706 134,606 142,283 115,740 116,586 123,300 132,170 Total liabilities and equity 2,207,019 2,233,346 2,303,535 2,415,117 2,047,821 1,986,674 2,099,678 2,284,831
GroupAssetsInvestments 603,159 611,297 606,267 654,387 635,535 576,634 563,110 625,514 Loans and advances to customers 1,429,923 1,442,312 1,477,009 1,580,949 1,217,390 1,240,103 1,326,943 1,460,619 Property, Plant and Equipment 39,019 39,845 40,735 43,036 38,360 38,472 38,363 39,350 Other assets 182,453 190,687 226,327 184,112 201,383 180,765 216,670 204,117 Total assets 2,254,554 2,284,141 2,350,338 2,462,484 2,092,668 2,035,974 2,145,086 2,329,600
Liabilities and EquityDue to customers 1,791,528 1,839,691 1,899,422 2,025,204 1,642,764 1,636,818 1,668,414 1,789,924 Debt securities and borrowed funds 291,446 268,291 269,761 236,295 286,515 239,045 306,953 359,067 Other liabilities 35,883 36,639 34,841 45,989 36,338 32,839 35,827 37,741 Equity 135,023 137,854 144,612 153,211 126,163 126,448 133,060 142,173 Non controlling interest 674 1,666 1,702 1,785 888 824 832 695 Total liabilities and equity 2,254,554 2,284,141 2,350,338 2,462,484 2,092,668 2,035,974 2,145,086 2,329,600

BA
NK
OF
CE
YL
ON
AN
NU
AL
RE
PO
RT
20
19
402
About this Report / Performance Highlights 2019 / Chairman’s Message / General Manager’s Review / Organisational Overview / Strategic Report / Performance and Outlook / Stakeholder Value Creation / Financial Reports / Compliance Annexes / Supplementary Information
Summary of the Statement of Financial Position
2019 201831-Mar 30-Jun 30-Sep 31-Dec 31-Mar 30-Jun 30-Sep 31-Dec
LKR Million LKR Million LKR Million LKR Million LKR Million LKR Million LKR Million LKR Million
Bank
Profitability
Interest margin (%) 3.3 3.4 3.4 3.2 2.9 3.0 3.1 3.1Return on average assets (before tax) (%) 1.2 1.1 1.3 1.3 1.4 1.2 1.3 1.6Return on average equity (after tax) (%) 13.7 11.2 14.2 16.8 16.8 13.5 14.8 17.3
Investor InformationInterest cover (times) 2.3 2.2 2.5 2.6 2.6 2.4 2.6 2.8Net assets value per share (LKR) 5,002 5,108 5,384 5,691 7,716 5,829 6,165 6,608
Capital Adequacy RatioCore capital adequacy ratio, (%) (Tier I) 10.2 10.7 10.3 11.2 9.8 9.9 10.0 10.3Total capital adequacy ratio, (%) (Tier I + II) 14.2 15.5 15.3 15.6 13.7 13.7 14.0 14.6
Assets Quality Gross non - performing advances ratio (%) 4.7 5.3 5.4 4.8 3.8 4.5 4.5 3.6(Net of interest in suspense)Net non - performing advances ratio (%) 1.9 2.4 2.3 1.8 1.3 2.0 1.7 1.0 (Net of interest in suspense and provisions)
Regulatory LiquidityStatutory liquid assets ratio - Domestic banking unit (%) 25.1 26.6 24.1 24.6 30.4 26.1 23.8 24.5 - Off shore banking unit (%) 57.8 47.9 54.9 58.3 22.9 51.9 61.7 60.2
GroupProfitabilityInterest margin (%) 3.4 3.5 3.4 3.3 3.0 3.1 3.2 3.1Return on average assets (before tax) (%) 1.1 1.1 1.3 1.3 1.3 1.2 1.3 1.6Return on average equity (after tax) (%) 12.5 10.7 13.4 16.0 15.3 11.9 13.3 15.9
Investor InformationNet assets value per share (LKR) 5,401 5,514 5,784 6,128 8,411 6,322 6,653 7,109
Capital Adequacy RatioCore capital adequacy ratio, (%) (Tier I) 10.3 10.7 10.1 11.4 10.0 10.1 9.9 10.4Total capital adequacy ratio, (%) (Tier I +II) 14.2 15.3 14.8 15.7 13.8 13.8 13.8 14.6
Quarterly Performance

About this Report / Performance Highlights 2019 / Chairman’s Message / General Manager’s Review / Organisational Overview / Strategic Report / Performance and Outlook / Stakeholder Value Creation / Financial Reports / Compliance Annexes / Supplementary Information
403
Share and Debenture InformationShare Information
As at 31 December 2019 2018
Shareholder No. of ordinary shares Holding % No. of ordinary shares Holding %
Government of Sri Lanka 25,000,000 100 25,000,000* 100
* This includes 5,000,000 numbers of shares in pending allotment.
Debenture InformationThe Bank has issued the following debt securities which are listed on Colombo Stock Exchange (CSE)
Unsecured, Subordinated, Redeemable Type Interest Payable Interest Rate (per annum)
Debentures Frequency
(par value LKR 100)
October 2013/2023 series D Annually 13.25%
E Semi annually 6 months TB rate (gross) plus 100 basis points
F Annually 13.25%
H Annually 13.75%
September 2014/2022 series D Annually 8.25%
E Semi annually 6 months TB ( gross ) rate plus 50 basis points
October 2015/2023 series A Annually 8.25%
B Quarterly 8.00%
C Semi annually 6 months TB ( gross ) rate plus 125 basis points
D Annually 9.50%
E Semi annually 6 months TB ( gross ) rate plus 125 basis points
December 2016/2024 series A Annually 13.25%
B Semi annually 6 months TB ( gross ) rate plus 125 basis points
C Annually 12.75%
D Semi annually 6 months TB ( gross ) rate plus 125 basis points

BA
NK
OF
CE
YL
ON
AN
NU
AL
RE
PO
RT
20
19
404
About this Report / Performance Highlights 2019 / Chairman’s Message / General Manager’s Review / Organisational Overview / Strategic Report / Performance and Outlook / Stakeholder Value Creation / Financial Reports / Compliance Annexes / Supplementary Information
Trading Information on Listed DebentureThe debentures that have been traded during the year ended 2019 and 2018 are as follows.
2019 2018
Highest Lowest
Last
traded
Interest
yield *
Yield to
maturity Highest Lowest
Last traded
Interest yield *
Yield to
maturity
LKR LKR LKR % * % LKR LKR LKR % * %
BoC Debentures 2013/2023 , Unsecured, subordinated, redeemable, 10 years, fixed rate (13.75%) 102.22 102.22 102.22 13.00 13.04 N/T N/T N/T N/T N/T BoC Debentures 2014/2022, Unsecured, subordinated, redeemable, 5 years, fixed rate (8.0%) 97.31 97.3 97.3 12.5 12.67 N/T N/T N/T N/T N/T BoC Debentures 2014/2022, Unsecured, subordinated, redeemable, 8 years, fixed rate (8.25%) 80 80 80 16.56 16.06 N/T N/T N/T N/T N/T BoC Debentures 2015/2023, Unsecured, subordinated, redeemable, 5 years, floating rate 06 months TB rate (Gross) plus 125 basis points 98.5 97 97 13.08 13.24 97 94 97 11.7 11.05BoC Debentures 2016/2024, Unsecured, subordinated, redeemable, 5 years, fixed rate (13.25%) 100.34 98.2 100.34 13.02 13.10 N/T N/T N/T N/T N/T
* As the date of last trade done.
N/T - Not Traded
Share and Debenture Information
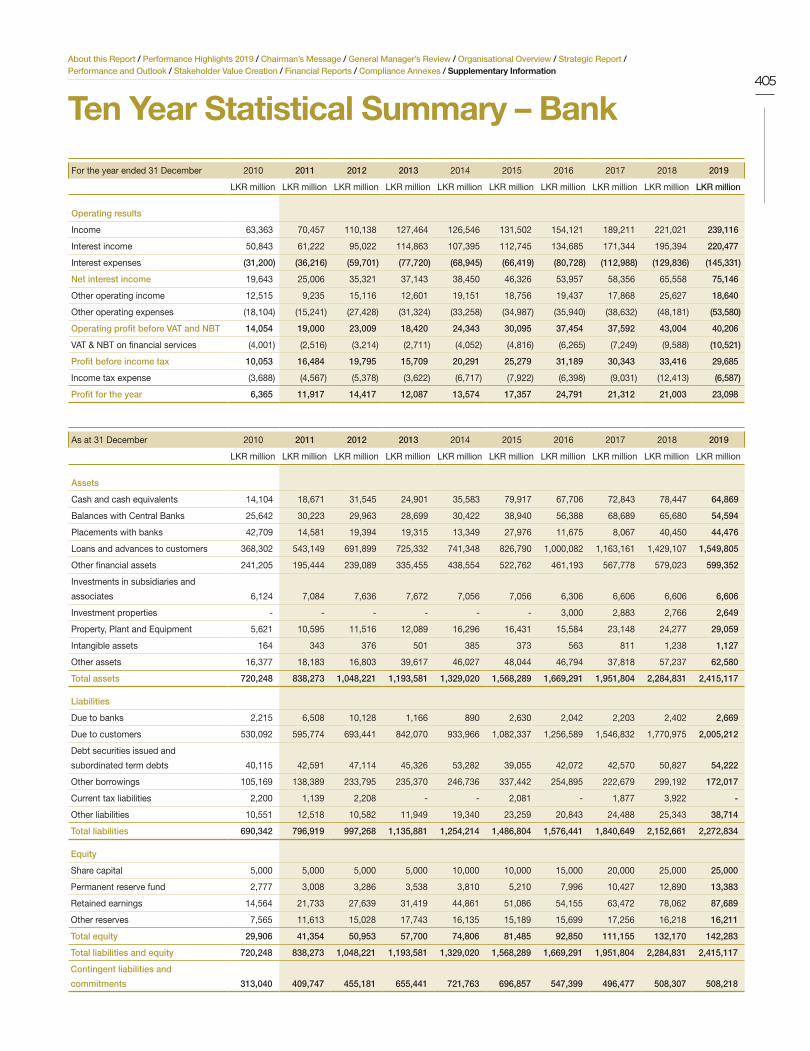
About this Report / Performance Highlights 2019 / Chairman’s Message / General Manager’s Review / Organisational Overview / Strategic Report / Performance and Outlook / Stakeholder Value Creation / Financial Reports / Compliance Annexes / Supplementary Information
405
For the year ended 31 December 2010 2011 2012 2013 2014 2015 2016 2017 2018 2019
LKR million LKR million LKR million LKR million LKR million LKR million LKR million LKR million LKR million LKR million
Operating results
Income 63,363 70,457 110,138 127,464 126,546 131,502 154,121 189,211 221,021 239,116
Interest income 50,843 61,222 95,022 114,863 107,395 112,745 134,685 171,344 195,394 220,477
Interest expenses (31,200) (36,216) (59,701) (77,720) (68,945) (66,419) (80,728) (112,988) (129,836) (145,331)
Net interest income 19,643 25,006 35,321 37,143 38,450 46,326 53,957 58,356 65,558 75,146
Other operating income 12,515 9,235 15,116 12,601 19,151 18,756 19,437 17,868 25,627 18,640
Other operating expenses (18,104) (15,241) (27,428) (31,324) (33,258) (34,987) (35,940) (38,632) (48,181) (53,580)
Operating profit before VAT and NBT 14,054 19,000 23,009 18,420 24,343 30,095 37,454 37,592 43,004 40,206
VAT & NBT on financial services (4,001) (2,516) (3,214) (2,711) (4,052) (4,816) (6,265) (7,249) (9,588) (10,521)
Profit before income tax 10,053 16,484 19,795 15,709 20,291 25,279 31,189 30,343 33,416 29,685
Income tax expense (3,688) (4,567) (5,378) (3,622) (6,717) (7,922) (6,398) (9,031) (12,413) (6,587)
Profit for the year 6,365 11,917 14,417 12,087 13,574 17,357 24,791 21,312 21,003 23,098
As at 31 December 2010 2011 2012 2013 2014 2015 2016 2017 2018 2019
LKR million LKR million LKR million LKR million LKR million LKR million LKR million LKR million LKR million LKR million
Assets
Cash and cash equivalents 14,104 18,671 31,545 24,901 35,583 79,917 67,706 72,843 78,447 64,869
Balances with Central Banks 25,642 30,223 29,963 28,699 30,422 38,940 56,388 68,689 65,680 54,594
Placements with banks 42,709 14,581 19,394 19,315 13,349 27,976 11,675 8,067 40,450 44,476
Loans and advances to customers 368,302 543,149 691,899 725,332 741,348 826,790 1,000,082 1,163,161 1,429,107 1,549,805
Other financial assets 241,205 195,444 239,089 335,455 438,554 522,762 461,193 567,778 579,023 599,352
Investments in subsidiaries and
associates 6,124 7,084 7,636 7,672 7,056 7,056 6,306 6,606 6,606 6,606
Investment properties - - - - - - 3,000 2,883 2,766 2,649
Property, Plant and Equipment 5,621 10,595 11,516 12,089 16,296 16,431 15,584 23,148 24,277 29,059
Intangible assets 164 343 376 501 385 373 563 811 1,238 1,127
Other assets 16,377 18,183 16,803 39,617 46,027 48,044 46,794 37,818 57,237 62,580
Total assets 720,248 838,273 1,048,221 1,193,581 1,329,020 1,568,289 1,669,291 1,951,804 2,284,831 2,415,117
Liabilities
Due to banks 2,215 6,508 10,128 1,166 890 2,630 2,042 2,203 2,402 2,669
Due to customers 530,092 595,774 693,441 842,070 933,966 1,082,337 1,256,589 1,546,832 1,770,975 2,005,212
Debt securities issued and
subordinated term debts 40,115 42,591 47,114 45,326 53,282 39,055 42,072 42,570 50,827 54,222
Other borrowings 105,169 138,389 233,795 235,370 246,736 337,442 254,895 222,679 299,192 172,017
Current tax liabilities 2,200 1,139 2,208 - - 2,081 - 1,877 3,922 -
Other liabilities 10,551 12,518 10,582 11,949 19,340 23,259 20,843 24,488 25,343 38,714
Total liabilities 690,342 796,919 997,268 1,135,881 1,254,214 1,486,804 1,576,441 1,840,649 2,152,661 2,272,834
Equity
Share capital 5,000 5,000 5,000 5,000 10,000 10,000 15,000 20,000 25,000 25,000
Permanent reserve fund 2,777 3,008 3,286 3,538 3,810 5,210 7,996 10,427 12,890 13,383
Retained earnings 14,564 21,733 27,639 31,419 44,861 51,086 54,155 63,472 78,062 87,689
Other reserves 7,565 11,613 15,028 17,743 16,135 15,189 15,699 17,256 16,218 16,211
Total equity 29,906 41,354 50,953 57,700 74,806 81,485 92,850 111,155 132,170 142,283
Total liabilities and equity 720,248 838,273 1,048,221 1,193,581 1,329,020 1,568,289 1,669,291 1,951,804 2,284,831 2,415,117
Contingent liabilities and
commitments 313,040 409,747 455,181 655,441 721,763 696,857 547,399 496,477 508,307 508,218
Ten Year Statistical Summary – Bank

BA
NK
OF
CE
YL
ON
AN
NU
AL
RE
PO
RT
20
19
406
About this Report / Performance Highlights 2019 / Chairman’s Message / General Manager’s Review / Organisational Overview / Strategic Report / Performance and Outlook / Stakeholder Value Creation / Financial Reports / Compliance Annexes / Supplementary Information
As at 31 December 2010 2011 2012 2013 2014 2015 2016 2017 2018 2019
LKR million LKR million LKR million LKR million LKR million LKR million LKR million LKR million LKR million LKR million
Ratios
Return on average assets (%) 1.6 2.1 2.1 1.4 1.6 1.7 1.9 1.7 1.6 1.3
Return on average equity (%) 24.0 33.5 31.2 22.2 20.5 22.2 28.4 20.9 17.3 16.8
Income growth (%) (0.2) 11.2 56.3 15.7 (0.7) 3.9 17.2 22.8 16.8 8.2
Capital adequacy ratio (%) **
- Tier I 10.3 7.8 8.3 8.4 9.5 9.1 8.7 10.8 10.3 11.2
- Tier I + Tier II 13.7 10.9 11.5 12.1 13.6 13.1 12.3 14.6 14.6 15.6
Capital funds to liabilities including 3.1 3.4 3.5 3.2 3.8 3.7 4.4 4.8 5.0 5.1
contingent liabilities (%)
Liquidity ratio - domestic (%) 28.7 23.4 21.8 27.7 30.8 28.2 21.6 27.2 24.5 24.60
Cost to income ratio (%) 53.7 51.1 42.7 49.1 44.0 44.7 43.0 38.4 38.1 37.3
Other information
Number of employees 8,204 8,115 7,790 8,883 8,577 7,980 7,569 7,587 8,724 8,503
Number of branches 309 318 324 567 573 578 580 578 577 581
Number of ATMs 352 404 451 523 540 549 678 764 776 772
Number of advances (’000) 2,261 2,837 3,363 3,193 2,384 2,146 2,122 2,226 2,606 2,715
Number of deposits (’000) 9,321 10,179 10,955 11,606 12,311 12,322 12,706 13,254 13,421 14,480
Cash flow from operating activities 10,271 (42,348) (19,271) 47,051 72,987 127,503 (21,346) 135,039 (25,790) 36,202
Cash flow from investing activities (59,418) 6,924 (52,965) (51,351) (27,222) (101,988) 83,642 (56,384) 11,667 25,631
Cash flow from financing activities 46,554 12,476 89,640 (4,377) (29,519) 17,982 (73,927) (73,822) 19,983 (75,901)
Capital expenditure on purchase of (1,168) (1,905) (1,483) (1,682) (1,743) (1,332) (2,053) (3,081) (3,400) (3,386)
* Highlighted information is based on LKASs/ SLFRSs.
** 2017, 2018 and 2019 figures are as per Basel III guidelines issued by the Central Bank of Sri Lanka.
Disclosure in terms of Section 7.6 (xvi) of the Listing Rules of the Colombo Stock Exchange on related party transactions exceeding 10% of the equity or 5% of the total assets of the Bank The Bank did not carry out any transactions exceeding 10% of the equity or 5% of the total assets of the Bank, whichever is lower, with the related parties given in Note 59 to the Financial Statements, except for the transactions engaged with the Government of Sri Lanka and Government related entities.
The Government of Sri Lanka, who holds 100% shareholding in Bank of Ceylon and Government related entities, carry out transactions with the Bank, in the ordinary course of business and the aggregate monetary value of these transactions exceeded the threshold given in Section 7.6
(xvi) of the Listing Rules of Colombo Stock Exchange.
These transactions include:
1. Overdraft facility granted to the Deputy Secretary to the Treasury
2. Foreign currency loans granted to the Government of Sri Lanka and State-Owned Enterprises
3. Investment in Sri Lanka Development Bonds and Restructuring Bonds issued by the Government of Sri Lanka
4. Extending of trade finance credit and other related services to facilitate import transactions of the Government of Sri Lanka and State-Owned Enterprises
5. Deposits made by the Government and Government related entities with the Bank
Most of these transactions are considered as recurrent nature transactions and the outstanding balances as at reporting date during the year 2019 are given in Note 59.4 to the Financial Statements.
Ten Year Statistical Summary – Bank

About this Report / Performance Highlights 2019 / Chairman’s Message / General Manager’s Review / Organisational Overview / Strategic Report / Performance and Outlook / Stakeholder Value Creation / Financial Reports / Compliance Annexes / Supplementary Information
407
Subsidiaries and Associates
Subsidiary Companies Directors
Property Development PLC
19th Floor,
BoC Head Office Building,
“BOC Square”,
No. 01, Bank of Ceylon Mawatha,
Colombo 01.
Tel : 011 2544328
Fax : 011 2544329
e-mail : [email protected]
Mr D M P R K BandaraNon-Executive Independent Director/ Chairman
Mr W T L WeeratneNon-Executive Independent Director
Representation from Directors Management of BoC
Mr W P Russel FonsekaNon-Executive Non-Independent Director
Alternate
Mr D N L Fernando(To Mr W P Russel Fonseka)
Merchant Bank of Sri Lanka &
Finance PLC
BoC Merchant Tower,
No. 28, St. Michael’s Road,
Colombo 03.
Tel : 011 4711711
: 011 2565636
Fax : 011 2565666
e-mail : [email protected]
Website : www.mbslbank.com
Dr Sujeewa LokuhewaNon- Executive, Non-Independent / Chairman
Mr Sunil Nayanasiri DayaratneNon-Executive, Independent Director
Mr S P ArsakularatneNon-Executive, Independent Director
Representation from Directors Management of BoC
Mr K B S BandaraNon-Executive, Non-Independent Director
Mr W P Russel FonsekaNon-Executive, Non-Independent Director
Mr C AmarasingheNon-Executive, Non-Independent Director
Mr D N L Fernando
Non-Executive, Non-Independent Director
Alternate
Mr M P Ruwan Kumara(To Mr W P Russel Fonseka)
Mr J A Jayashantha(To Mr K B S Bandara)
Subsidiary Companies Directors
BOC Management & Support
Services (Private) Limited
BoC Head Office Building,
“BOC Square”,
No. 01, Bank of Ceylon Mawatha,
Colombo 01.
Tel : 011 2432680
Mr K B S BandaraNon-Executive Director/ Chairman
Mr D P K Gunasekara
Non-Executive Director
Mr S T K Hewage
Non-Executive Director
BOC Property Development &
Management (Private) Limited
10th Floor,
BoC Merchant Tower,
No. 28, St. Michael’s Road,
Colombo 03.
Tel : 011 2301911
Fax : 011 2370606
e-mail : [email protected]
Representation from Directors Management of BoC
Mr K B S BandaraNon- Executive Director
Alternate
Mr C Amarasinghe(To Mr K B S Bandara)
BOC Travels (Private) Limited
1st Floor,
BoC Super Grade Branch Building,
Baseline Road,
Colombo 08.
Tel : 011 2688154-8
Fax : 011 2688175
e-mail : [email protected]
Website : www.boctravels.com
Mr K H WilfredNon-Executive Director/ Chairman
Mrs F A Rezani AzizNon-Executive Director
Mr P DheerasingheNon-Executive Director
Mr Romel WijewardenaNon-Executive Director
Representation from Directors Management of BoC
Mr K B S BandaraNon-Executive Director
Mr S T K HewageNon-Executive Director
Alternate
Mr E M Jayaratne(To Mr K B S Bandara)

BA
NK
OF
CE
YL
ON
AN
NU
AL
RE
PO
RT
20
19
408
About this Report / Performance Highlights 2019 / Chairman’s Message / General Manager’s Review / Organisational Overview / Strategic Report / Performance and Outlook / Stakeholder Value Creation / Financial Reports / Compliance Annexes / Supplementary Information
Subsidiary Companies Directors
Hotels Colombo (1963) Limited
No. 02, York Street, Colombo 01.
Tel : 011 2320320
011 5221100
Fax : 011 2447640
e-mail : [email protected]
Website : www.grandoriental.com
Mr J C Ratwatte
Non-Executive Director Minority representative
Representation from Directors Management of BoC
Mr K E D Sumanasiri
Non- Executive Director
Ceybank Holiday Homes
(Private) Limited
12th Floor,
BoC Head Office Building,
“BOC Square”,
No. 01, Bank of Ceylon Mawatha,
Colombo 01.
Tel : 011 2447845
: 011 2204103-4
Fax : 011 2447845
e-mail : [email protected]
Website : www.ceybankholidayhomes.com
Mr K B S BandaraNon- Executive Director/ Chairman
Mr K E D Sumanasiri
Non- Executive Director
Mr M P Ruwan Kumara
Non- Executive Director
Mr G K G M BandaraNon- Executive Director
MBSL Insurance Company
Limited
No. 122, Kew Road, Colombo 02.
Tel : 011 2304500
Fax : 011 2300499
e-mail : [email protected]
Website : www.mbslinsurance.lk
Dr Sujeewa LokuhewaNon-Executive/ Non-Independent Director/ Chairman
Mr W L A FernandoExecutive Non-Independent Managing Director
Mr P I KandanaarachchiNon-Executive/ Non-Independent Director
Mr G M J A R GamalathNon-Executive/ Non-Independent Director
Mr H A S SamaraweeraNon-Executive/ Non-Independent Director
Mr T D D K GunawardhanaNon-Executive/ Non-Independent Director
Mr W S R FernandoNon-Executive/ Non-Independent Director
Subsidiary Companies Directors
Koladeniya Hydropower
(Private) Limited
19th Floor,
BoC Head Office Building,
“BOC Square”,
No. 01, Bank of Ceylon Mawatha,
Colombo 01.
Tel : 011 2544328
Fax : 011 2544329
e-mail : [email protected]
Representation from Directors Management of BoC
Mr D M L B DassanayakeNon-Executive Director
Mr K E D SumanasiriNon-Executive Director
Bank of Ceylon (UK) Limited
No: 1, Devonshire Square,
London EC2M 4WD,
United Kingdom.
Tel : +44 207 3771 888
Fax : +44 207 3775 430
e-mail : [email protected]
Website : www.bankofceylon.co.uk
Mr W D R SwanneyActing Chairman/ Non- Executive Independent Director
Mr K B S BandaraNon-Executive Director
Mr R EnglandNon-Executive Independent Director
Mr M D C Nilantha Chief Executive Officer/ Executive Director
Subsidiaries and Associates

About this Report / Performance Highlights 2019 / Chairman’s Message / General Manager’s Review / Organisational Overview / Strategic Report / Performance and Outlook / Stakeholder Value Creation / Financial Reports / Compliance Annexes / Supplementary Information
409
Associate Companies Directors
Lanka Securities (Private) Limited
No. 228/1, Galle Road,
Colombo 04.
Tel : 011 4706757
Fax : 011 4706767
e-mail : [email protected]
Website : www.lankasecurities.com
Ms Aamna TaseerNon-Executive Director/ Chairman
Mr Mian Ehsan Ul-HaqNon-Executive Director
Mr Shehryar Ali TaseerNon-Executive Director
Mr K U D GamageExecutive Director
Representative from MBSL
Mr G M J A R GamalathNon-Executive Director
Representation from BOC
Mr D P K GunasekaraNon-Executive Director
Alternate
Mr Imran Hafeez(To Ms Aamna Taseer)
Mr Shehryar Ali Taseer(To Mr Mian Ehsan UI-Haq)
Ms Sherbano Taseer(Mr Shehryar Ali Taseer)
Transnational Lanka Records
Solutions (Private) Limited
No. 55/60,
Vauxhall Lane,
Colombo 02.
Tel : 011 7574574
Fax : 011 4514588
e-mail : [email protected]
Website : www.transnational-grp.com
Mr Daron Kuan Wye LiewNon-Executive Director
Ms Daphne M H LiewNon-Executive Director
Mr Jonathan Liew Chin YewNon-Executive Director
Mrs P C DodanwelaNon-Executive Director
Representation from BoC
Mr W P Russel FonsekaNon-Executive Director
Mr W W P SuranimalaNon-Executive Director
Associate Companies Directors
Ceybank Asset
Management Limited
No. 85, York Street,
Colombo 01.
Tel : 011 7602002
Fax : 011 2327203
e-mail : [email protected]
Website : www.ceybank.com
Mr P S C PelpolaNon-Executive Director/ Chairman
Ms V GovindanNon- Executive Director
Mr Chithrananda SathkumaraCEO/ Executive Director
Mr R D M U M M BandaraNon-Executive Director
Representation from BOC
Mr K B S BandaraNon-Executive Director
Mr D P K GunasekaraNon-Executive Director
Alternate
Mr M P Ruwan Kumara(To Mr K B S Bandara)

BA
NK
OF
CE
YL
ON
AN
NU
AL
RE
PO
RT
20
19
410
About this Report / Performance Highlights 2019 / Chairman’s Message / General Manager’s Review / Organisational Overview / Strategic Report / Performance and Outlook / Stakeholder Value Creation / Financial Reports / Compliance Annexes / Supplementary Information
Correspondent Banks By CountryArgentina
1. Banco Credicoop Cooperativo Ltd
2. Banco De Galicia Y Buenas Aires SA
(Former Banco Finansur SA)
Armenia
3. Ardshin Bank( Former
Ardshininvestment Bank JSC)
Australia
4. Australia & New Zealand Banking
Group Ltd
5. HSBC Bank Australia Ltd
6. National Australia Bank Limited
7. Westpec Banking Corporation
Austria
8. Allgemeine Sparkasse Oberosterreich
9. BKS Bank AG
10. Erste Bank DER Oesterreichischen
Sparkassen AG
11. ERSTE Group Bank AG
12. Oberbank AG
13. Raiffeisen Bank International AG
14. Raiffeisenlandesbank Oberosterreich
Aktiengesellschaft
15. Salzburger Landes - Hypothekenbank
AG
16. UNI Credit Bank Austria (Former Bank
Austria Creditanstalt AG)
17. Volksbank Wien-Baden AG
(Osterreichische Volksbanken AG-
Name changed as above)
18. Vorarlberger Landes- und
Hypothekenbank Aktiengesellschaft
Bahrain
19. Ahli United BANK
20. Albaraka Islamic BANK BSC
21. Bahrain Islamic BANK BSC
22. ARAB Banking Corporation BSC
23. BBK (Formerly Bank of Bahrain &
Kuwait BSC)
24. National Bank of Bahrain
25. The Arab Investment Company SAA
Bangladesh
26. Agrani Bank
27. Bangladesh Krishi Bank
28. BASIC Bank Limited (Banladesh Small
Industries & Commerce Bank Ltd)
29. Dutch-Bangla Bank Ltd
30. Janata Bank
31. Prime Bank Ltd
32. Sonali Bank
33. The Premier Bank Limited
34. Uttara Bank
Belarus
35. Belarus Bank (Formerly Minskcomplex
Bank)
36. Belvnesheconombank
Belgium
37. Banca Monte Paschi, Belgio
38. Byblos Bank Europe S A
39. Deutsche Bank SA/NV
40. BNP Paribas Fortis SA/NA (Former
Fortis Bank NV / SA)
41. ING Belgium SA/NV (Formerly Bank
Brussels Lambert)
42. KBC Bank NV
43. KBC Bank NV (Former Antwerpse
Diamant Bank NV)
Botswana
44. Barclays Bank of Botswana Ltd
Brazil
45. Banco ABC Brasil SA
46. Banco Do Brazil
47. Banco Fibra SA
48. Banco Industriel e Commercial SA
(Bicbanco)
Bulgaria
49. Central Cooperative Bank
50. Investbank PLC
51. Municipal Bank PLC
52. Raiffeisenbank (Bulgaria) EAD
53. Texim Bank
54. Unicredit Bulbank AD (Formerly
Bulbank AD)
55. United Bulgarian Bank AD
Cambodia
56. ACLEDA Bank PLC
Canada
57. Bank of Montreal
58. Bank of Nova Scotia
59. Canadian Imperial Bank of Commerce
60. HSBC Bank Canada (Formerly Credit
Lyonnais Canada)
61. Royal Bank of Canada
62. Toronto Dominion Bank
Chile
63. Corpbanca
China
64. Bank of Changsha
65. Bank of China Limited
66. Bank of Communications Co. Ltd.
67. Bank of Hangzhou Co Ltd
68. Bank of Jiangsu Co. Ltd.
69. Bank of Jiujiang Co. Ltd
70. Bank of Nanjing
71. Bank of Shaoxing Co. Ltd
72. Bank of Xian Co. Ltd.
73. Changshu Rural Commercial Bank
74. China Construction Bank
75. China Development Bank Corporation
76. China Everbright Bank
77. Evergrowing Bank
78. Export Import Bank of China
79. Zhejiang Nanxun Rural Cooperative
Bank
80. Zhejiang Xiaoshan Rural Cooperative
Bank
Colombia
81. Banco Popular
Croatia
82. Zagrebacka Banka DD
Cyprus
83. Alpha Bank Cyprus Limited
84. Bank of Cyprus Public Company Ltd
(Cyprus Popular Bank Public Co.Ltd
merged with the above on 06.06.2014).
85. Hellenic Bank Public Company Limited
86. National Bank Of Greece (Cyprus) Ltd
Czech Republic
87. Ceska Sporitelna AS
88. Ceskoslovenska Obchodni Banka AS
89. Komercni Banka A S
90. Moneta Money Bank A.S. (Name
Changed w.e.f. 06.05.2016) (Former
Name - GE Money Bank AS )
91. Raiffeisen Bank
92. Unicredit Bank Czech Republic AS
Denmark
93. ALS Skiern Bank
94. Danske Bank A/S
95. Nordea Bank Denmark AS
96. Rinkjobing Landbobank
97. Skjern Bank
98. Sydbank A/S
99. Vestjysk Bank

About this Report / Performance Highlights 2019 / Chairman’s Message / General Manager’s Review / Organisational Overview / Strategic Report / Performance and Outlook / Stakeholder Value Creation / Financial Reports / Compliance Annexes / Supplementary Information
411
Ecuador
100. Banca International Produbanco
Egypt
101. Arab International Bank
102. Bank of Alexandria (Alexbank)
103. Central Bank of Egypt
104. Egyptian Saudi Finance Bank (Name
changed into AI Baraka Bank Egypt
w.e.f. 01.04.2010)
105. Faisal Islamic Bank of Egypt Sae
106. National Bank of Egypt
107. Suez Canal Bank SAE
Estonia
108. SEB Pank
Ethiopia
109. Commercial Bank of Ethiopia
Fiji
110. Bank of South Pacific Ltd (Former
National Bank of Fiji)
111. Westpac Banking Corporation
Finland
112. Aktia Bank PLC
113. Danske Bank A/S (Former Sampo Bank
PLC)
114. Nordea Bank Finland PLC
115. OKO Osuuspankkien Keskuspankki
OYJ
116. OP Corporate Bank PLC (Name
Changed w.e.f. 04.04.2016) (Former
Name - Pohjola Bank PLC)
France
117. AL Khaliji France S A
118. Bank of India (Paris Branch)
119. Banque BIA
120. Banque D'Escompte
121. Banque Federative Du Credit Mutuel
122. Banque Palatine
123. CIC Lyonnaise De Banque
124. Credit Du Nord
125. Credit Industrial Del’ Quest
126. Credit Lyonnais
127. HSBC France
128. Natixis (Formerly Natexis Banque
Populaires)
129. Societe Generale
130. Union De Banques Arabes ET
Francaises (UBAF)
131. VTB Bank (France) S A (Formerly
Banque Commerciale Pour L’Europe Du
Nordeurobank)
Georgia
132. JSC Bank of Georgia (Former Bank of
Georgia)
Germany
133. Berliner Volksbank EG
134. BNorddeutsche Landesbank
Girozentrale (Former BHF Bank
Aktiengeselschaft)
135. Bremer Landesbank
136. Commerzbank AG - (Dusseldorf)
137. Commerzbank AG - (Frankfurt)
138. Degussa Bank
139. Deutsche Bank AG
140. DB Privat- und Firmenkundenbank
AG (Deutsche Bank 24 AG) (Former
Deutsche Bundesbank)
141. DZ Bank AG Deutsche Zentral
Genossenschaftsbank (New Name
w.e.f. 01.08.2016) (Former Name - DZ
Bank AG)
142. Frankfurter Volksbank EG
143. Hamburger Sparkasse AG
144. HSBC Trinkaus & Burkhardt KGA
145. Joh. Berenberg Gossler & Co. KG
(Former Berenberg Bank)
146. Kreissparkasse Esslingen- Nurtingen
147. Kreissparkasse Goppingen
148. Kreissparkasse Heilbronn
149. Landesbank Baden- Wurttemberg
150. Landesbank Berlin AG (Merger
of Bankgesel-lschaft BerlinAG &
Landesbank Berlin AG)
151. Landesbank Hessen Thuringen
Girozentrale
152. Landesbank Baden-Württemberg
(Former LRP Landesbank Rheinland
PFALZ)
153. M.M. Warburg & CO (AG & Co) KGaA
(Former Bankhaus Carlf Plump & Co.)
154. Nordeutsche Landesbank Girozentrale
155. Oldenburgische Landesbank AG
156. Oldenburgische Landesbank AG
(Former Bankhaus Neelmeyer AG)
157. Sparkasse Bielefeld
158. Sparkasse Dortmund
159. Sparkasse Herford
160. Sparkasse Pforzheim Calw
161. Stadtsparkasse Dusseldorf
162. Stadtsparkasse Monchengladbach
163. Stadtsparkasse Wuppertal
164. Standard Chartered Bank (Frankfurt)
165. Unicredit Bank AG (Bayerische Hypo-
Und Vereinsbank AG)
Greece
166. Agroindustrijsko-Komercijalna Banka
AIK Banka Ad Beograd (Former ALPHA
Bank)
167. Eurobank Ergasias SA
168. National Bank of Greece
169. Piraeus Bank
Hong Kong
170. Cathay Bank
171. Chong Hing Bank Limited (Formerly Liu
Chong Hing Bank Ltd)
172. DBS Bank (Hong Kong) Ltd
173. Hang Seng Bank Ltd
174. Hongkong & Shanghai Banking
Corporation
175. Industrial and Commercial Bank of
China (Asia) Ltd
176. OCBC Wing Hang Bank Ltd (Name
changed as above w.e.f.29.09.2014)
177. Oversea - Chinese Banking Corporation
178. Shanghi Commercial Bank Ltd
Hungary
179. Magyar Takarekszovetkezeti Bank ZRT
(Former Bank of Hungarian Savings)
Cooperatives Co Ltd
180. Budapest Bank NYRT (Former
Budapest Credit Development Bank RT)
181. CIB Bank ZRT(Former Central-
European Int'l Bank Ltd (CIC Bank))
182. ERST Bank Hungary NYRT
183. Kereskedelmi ES Hitelbank (K and H
Bank NYRT)
184. Magyar Nemzeti Bank
185. Raiffeisen Bank ZRT
India
186. Allahabad Bank
187. Andhra Bank
188. Axis Bank
189. Bank of Baroda
190. Bank of India (Mumbai)
191. Bank of Maharashtra
192. Canara Bank
193. Central Bank of India
194. Corporation Bank
195. Development Credit Bank Ltd

BA
NK
OF
CE
YL
ON
AN
NU
AL
RE
PO
RT
20
19
412
About this Report / Performance Highlights 2019 / Chairman’s Message / General Manager’s Review / Organisational Overview / Strategic Report / Performance and Outlook / Stakeholder Value Creation / Financial Reports / Compliance Annexes / Supplementary Information
Correspondent Banks By Country
196. HDFC Bank
197. ICICI Bank Ltd
198. IDBI Bank Ltd
199. Indian Bank
200. Indian Overseas Bank
201. Indusind Bank Ltd
202. Jammu & Kashmir Bank Ltd
203. Karur Vysya Bank
204. Punjab & Sind Bank Ltd
205. Punjab National Bank
206. RBL Bank Ltd
207. Saraswat - Cooperative Bank Ltd
208. State Bank of India
209. State Bank of Hyderabad
210. State Bank of Travancore
211. Tamilnad Mercantile Bank Ltd
212. UCO Bank
213. Union Bank of India
214. United Bank of India
215. Yes Bank
Indonesia
216. PT Bank Maybank Indonesia TBK (Bank
Artha Graha)
217. Bank International Indonesia
218. Bank Mega
219. PT Bank Bukopin
220. PT Bank Central Asia TBK
221. Indonesia Eximbank (PT Bank Ekspor
Indonesia)
222. PT Bank Mandiri (Persero)
223. PT Bank Negara Indonesia TBK
224. PT Bank Pan Indonesia TBK (Panin
Bank)
225. PT Bank Permata TBK
Israel
226. Bank Hapoalim BM
227. Bank Leumi Le Israel BM
228. Bank of Palestine
229. Israel Discount Bank
230. Mercantile Discount Bank Ltd
231. Mizrahi Tefahot Bank Ltd
232. Union Bank of Israel Ltd
Italy
233. Banca Popolare DI Cividale SCPA
234. Banca DI Credito Cooperativo DI ALBA
235. Banca Di imola Spa
236. Banca Monte DEI Paschi Di Siena
237. Banca Nazional Del Lavoro Spa
(Merged into BNP Paribas)
238. Banco Popolare Soc. Coop (Banc
Popolare Di Verona E Novara Scrl)
(Including Creito Bergamasco
spa,Banca PopolareDi Novara Spa)
Verona
239. Banca Popolare - Volksbank (Banca
Popolare Dell Alto Adige)
240. Banca Popolare Dell Emilia Romagna
241. Banca Popolare DI Milano
242. Banca Popolare DI Ravenna SPA
243. Banca Popolare DI Sondrio
244. Banca Ubae Spa
245. Banca Valsabbina SCPA
246. Banco DI Desio E Della Brianza Spa
247. Credit Agricole Italia Spa (Former
Cariparma Spa )
248. Cassa DI Risparmio DI Bolzano Spa
249. Credito Valtellinese Società per Azioni
(Former Credito Valtellinese)
250. Deutsche Bank SPA
251. Hypo Alpe - Adria - Bank Spa
252. Intesa Sanpaolo SPA (Formerly Banca
Intesa SpA)
253. IW Bank SPA (UBI Banca Private
Investment merged into IW Bank SPA)
Bbrand Name IW Bank SPA Private
Investments SPA ( w.e.f. 25.05.2015)
254. Unipol Banca SPA
255. Unipol Banca SPA (Former UGF Banca)
256. Unicredit Bank AG (Unicredito Italiano
SPA)
257. Union De Banche Italian SPA (Former
Banca Etruria Soc Coop)
Japan
258. 77 Bank Ltd
259. Australia & New Zealand Banking
Group Ltd
260. Bank of Kyoto
261. MUFG Bank (Former Bank of Tokyo-
Mitsubishi UFJ Ltd)
262. Bank of Yokohama Ltd
263. Chiba Kogyo Bank Ltd
264. Chukyo Bank Ltd
265. Gunma Bank Limited
266. Higashi - Nippon Bank
267. Hokuriku Bank Ltd
268. Kansai Mirai Bank(Kinki Osaka Bank
Ltd merged with Kansai Urban Banking
Corperation renamed as Kansai Mirai
Bank)
269. Kiyo Bank Ltd
270. Minato Bank Ltd (Formerly Midori Bank
Ltd)
271. Mizuho Bank Ltd
272. Nishi Nippon City Bank Ltd
273. Okazaki Shinkim Bank
274. Osaka City Shinking Bank
275. Resona Bank Limited
276. Saitama Resona Bank Ltd
277. SETO Shinkin Bank
278. Shiga Bank Ltd
279. Shinkin Central Bank
280. Standard Chartered Bank
281. Sugamo Shinkin Bank
282. Sumitomo Mitsui Banking Corporation
283. The Asahi Shinkin Bank
284. The Ashikaga Bank Ltd
285. The Hokkaido Bank Limited
286. The Shikoku Bank Ltd
287. The Shizuoka Bank Ltd
288. The Yokohama Shinkin Bank
289. Tokushima Bank Ltd
290. Tomato Bank Ltd
291. Yamagata Bank Ltd
292. Yamanashi Chuo Bank Ltd
Jordan
293. Arab Bank PLC
294. Arab Jordan Investment Bank
295. Bank Al Etihad
296. Bank Audi Sal - Audi Saradar Group
297. Bank of Jordan PLC
298. Cairo Amman Bank
299. Housing Bank For Trade & Finance
300. Investbank (formely jordan Investment &
Finance Bank (JIF Bank)
301. Islamic International Arab Bank Ltd
302. Jordan Ahli Bank PLC w.e.f. 12/11/2006
(Formerly Jordan National Bank)
303. Jordan Commercial Bank (Formerly
Jordan Gulf Bank)
304. Jordan Dubai Islamic Bank
305. Jordan Kuwait Bank
Kazakstan
306. JSC Bank Centercredit
Kenya
307. Barclays Bank of Kenya Ltd
Korea
308. Citibank Korea INC (Formerly Koram
Bank)
309. Kookmin Bank

About this Report / Performance Highlights 2019 / Chairman’s Message / General Manager’s Review / Organisational Overview / Strategic Report / Performance and Outlook / Stakeholder Value Creation / Financial Reports / Compliance Annexes / Supplementary Information
413
310. Korea Development Bank
311. KEB Hana Bank (Merged between Hana
Bank & Kores Exchange Bank)
312. Kyongnam Bank
313. Pusan Bank
314. The Kwangju Bank Ltd
315. Woori Bank
Kuwait
316. Burgan Bank SAK
317. Commercial Bank of Kuwait SAKP
318. Gulf Bank KSCP
319. Kuwait International Bank
320. National Bank of Kuwait SAKP
Latvia
321. AS Reverta (Former Parex Bank)
322. Rietumu Bank
323. SEB Banka
Lebanon
324. Arab Bank PLC (Lebanon Branches
Centre) Beirut
325. Bank Audi SAL - Audi Saradar Group
326. Bank Bemo SAL
327. Bankmed SAL
328. Bank of Beirut SAL
329. Banque Libano Francaise
330. BBAC SAL (Formerly Bank of Beirut &
the Arab CountriesSAL)
331. BLC Bank SAL (Formerly Banque
Libanaise Pour Le Commerce SAL)
332. BLOM Bank SAL
333. Byblos Bank SAL
334. Credit Libanais SAL
335. First National Bank SAL
336. Fransbank SAL
337. IBL Bank
338. Jamal Trust Bank SAL
339. MEAB Bank (Middle East & Africian
Bank SAL)
340. Societe Generale Banque AU Liban
SAL (Lebanese Canadian Bank S.A.L
merged with Societe Generale Banque
Au Liban SAL)
341. BSL Bank SAL (Former Societe
Nouvelle De La Banque ) De Syrie Et Du
Liban Sal
Libya
342. National Commercial Bank SAL
Lithuania
343. UKIO Bank AS
Madagascar
344. Bank of Africa - Madagascar
345. Banque Centrale De Madagascar
Malaysia
346. Bank Islam Malaysia Berhad
347. CIMB Bank Berhad (Formerly
Bumiputra Commerce Bank Berhad)
348. Hong Leong Bank (Former EON)
349. Malayan Banking Berhad (Maybank)
350. OCBC (Malaysia) Berhad
351. Oversea - Chinese Banking Corporation
Ltd (Kuala Lumpur)
352. Public Bank Berhad
353. RHB Bank Berhad
354. United Overseas Bank (Malaysia)
Berhad
Maldives
355. Bank of Maldives PLC
356. Habib Bank Limited
Malta
357. FIM Bank PLC Ltd
Mauritius
358. SBM Bank (Former State Bank of
Mauritius Ltd)
359. The Mauritius Commercial Bank Ltd
Mexico
360. Banco Nacional De Mexico SA
361. BBVA Bancomer SA
Mongolia
362. Trade & Development Bank of Mongolia
Morocco
363. Credit Du Marco SA
Mozambique
364. Banco International De Mocambique
S A R L
Namibia
365. Bank Windhoek Ltd
Nepal
366. Himalanyan Bank Ltd
367. Nepal Credit Commercial Bank
368. Standared Chartered Bank Nepal Ltd
Netherlands
369. RBS Hollandsche NV (Former
Hollandsche Bank - Unie NV)
370. ING Bank NV
371. Cooperatieve Rabobank UA (Name
Changed w.e.f. 01.01.2016) (Former
Name Rabobank Nederland)
372. Yapi Ve Kredi Bankasi AS
New Zealand
373. ANZ Bank National Bank Ltd
374. ANZ Bank SA Newzealand Limited
(Former ANZ Bank National Bank Ltd)
375. WESTPAC BANKING CORPORATION
Norway
376. DNB NOR Bank ASA (Formerly Den
Norske Bank NA)
377. Nordea Bank Norge AS
378. Spare Bank 1 Ostlandet (Sparebanken
Hedmark Merged with Bank 1 Oslo
Akershus)
379. Sparebanken More
380. Sparebanken Nord Norge
Oman
381. Sohar International Bank SAOG
(Former Bank Sohar Saog)
382. Bankmuscat SAOG
383. National Bank of Oman SAOG
Pakistan
384. Allied Bank of Pakistan
385. Askaribank Limited (Formerly Askari
Commercial Bank Ltd)
386. Summit Bank Ltd (Atlas Bank Merged
to Summit Bank)
387. Bank AL Habib Ltd
388. Bank of Panjab
389. Dawood Islamic Bank Ltd
390. Dubai Islamic Bank Pakistand Ltd
391. Faysal Bank Ltd
392. Habib Bank Limited
393. Habib Metropolitian Bank Ltd
394. MCB Bank Ltd (Formerely Muslim
Commercial Bank)
395. Meezan Bank Ltd
396. Summit Bank (Former Mybank Ltd)
397. National Bank of Pakistan
398. Soneri Bank Ltd
399. Standared Chartered Bank (Pakistan)
Ltd
400. United Bank Limited
Papua New Guinea
401. Westpac Banking Corporation (Westpac
Bank PNG Ltd)
Paraguay
402. Banco Amambay S A

BA
NK
OF
CE
YL
ON
AN
NU
AL
RE
PO
RT
20
19
414
About this Report / Performance Highlights 2019 / Chairman’s Message / General Manager’s Review / Organisational Overview / Strategic Report / Performance and Outlook / Stakeholder Value Creation / Financial Reports / Compliance Annexes / Supplementary Information
Correspondent Banks By Country
Peru
403. Banco De Credito DEL Peru
Philippines
404. Metropolitian Bank & Trust Co
Poland
405. Bank Handlowy Warszawa SA
406. Bank Millennium SA
407. Bank Pekao SA
408. Santander Bank Polska SA (Kredyt
Bank SA)
409. PKO Bank Polski SA (New name)
(Powszechna Kasa Oszczednosci Bank
Polski SA) (Former Name Nordea Bank
Polska SA)
410. BNP Paribas Bank Polska SA wef
29.03.2019 former Raiffeisen Bank
Polska SA
Portugal
411. Banco BPI SA
412. Banco BIC Portugues SA(Former BNP -
Banco Portugues De Negocios SA)
413. Caixa Economica Montepio Geral
Caixa Economica Bancaria SA (Former
Finibanco SA)
Qatar
414. Barwa Bank
415. Doha Bank
416. Qatar International Islamic Bank
417. Qatar Islamic Bank SAQ
Romania
418. Banca Commerciala Romana SA
419. Banca Transilvania
420. BRD - Groupe Societe Generale S A
421. Unicredit Bank, SA (New Name .w.e.f
18.08.2015) (Former Unicredit Tiriac Bank)
422. Patria Bank SA
Russia
423. B and N Bank (Public Joint - Stock
Compay) (M D M Bank - Name
Changed as above w.e.f. 18.11.2016)
424. International Moscow Bank (New Name
Joint Stock Company Uni Credit Bank)
425. Khanty - Mansiysk BANK Otkritie
(PJSC) - New Name - w.e.f. 22.08.2016
Bank Otkritie Financial Corporation -
(JSC) (Otkritie FC Bank )
(Former-Nomos-Bank (Novaya
Moskva)"
426. Sberbank
427. Vnesheconombank
428. VTB Bank (PJSC) (Public Joint Stock
Company) (Formerly JSC VTB Bank -
Bank for Foreign Trade (Vneshtorgbank)
Saudi Arabia
429. Al Rajhi Bank (Formerly Al Rajhi
Banking & Investment Corporation)
430. Arab National Bank
431. Bank Al Bilad - Riyadh
432. Bank Al Jazira - Jeddah
433. Banque Saudi Fransi - Riyadh
434. National Commercial Bank Limited - Jeddah
435. Riyad Bank - Riyadh
436. Samba Financial Group - Riyadh
437. Saudi British Bank (merged with
Alawwal Bank wef 16.06.2019)
Scotland
438. Royal Bank of Scotland International
Limited
Seychelles
439. Seychelles International Mercantile
Banking (NOUVOBNQ)
Singapore
440. ABN AMRO
441. Bank of India (Singapore)
442. DBS Bank Ltd
443. Dexia Banque Internationale A
Luxembourge
444. Indian Bank
445. Oversea - Chinese Banking Corporation
Ltd
446. Skandinaviska Enskilda Banken AB
447. State Bank of India
448. The B Ank of East Asia Ltd
449. UCO BANK
450. Union De Banques Arabes ET
Francaises (UBAF)
451. United Overseas Bank Ltd
Slovakia
452. Ceskoslovenska Obchodni Banka AS
453. Postova Bank AS
454. Slovenska Sporitelna A S
455. TARTA Bank AS
456. Unicredit Bank Slovakia AS
457. Vseobecna Uverova Bank AS
Slovenia
458. Abanka DD
459. Gorenjska Banka
460. Nova Kreditna Banka Maribor D D
Solomon Islands
461. Bank of South Pacific Ltd (Former
National Bank Of Solomon Islands)
South Africa
462. ABSA Bank Ltd
463. Firstrand Bank Ltd
464. Nedcor Bank Ltd (NED Bank)
465. Standard Bank of South Africa Ltd
466. The Standard Chartered Bank of South
Africa, Johannesburg
Spain
467. Banco Bilbao Vizcaya Argentaria
468. Banco De Europa SA
469. Banco De Sabadell S.A.
470. Caixa Bank (Banco De Valencia Merged
with Caixa)
471. Banco Intercontinential Espanol
(Bankinter)
472. Banco Santander SA (Former Banco
Pastor SA)
473. Banco Santander Central Hispano
474. Fundación Bancaria Caixa d'Estalvis
i Pensions de Barcelona 'la Caixa'
(Former Caja De Ahorrosy Pensiones
De) Barcelona La Caixa
475. Bankia SA (Former Caja Madrid)
Sweden
476. Nordea Bank Abp (Nordbanken AB
(PUBL) merged to above in 2018)
477. SEB Merchant Banking
478. Skandinaviska Enskilda Banken AB
(PUBL)
479. Svenska Handelsbanken AG (PUBL)
480. Swed Bank
Switzerland
481. Banque Cantonale De Geneve
482. Banque Cantonale Vandoise
483. Banque De Commerce Et De
Placements
484. BNP Paribas (Suisse) SA
485. EFG Bank AG (Former BSI SA)
486. CA Indosuez (Switzerland) SA (Former
Credit Agricole (Sussie) SA)
487. Faisal Private Bank (Switzerland) SA
488. Habib Bank AG Zurich

About this Report / Performance Highlights 2019 / Chairman’s Message / General Manager’s Review / Organisational Overview / Strategic Report / Performance and Outlook / Stakeholder Value Creation / Financial Reports / Compliance Annexes / Supplementary Information
415
489. Luzerner Kantonal Bank AG
490. UBS Switzerland AG
491. Zurcher Kantonalbank
Taiwan
492. Bank of Taiwan
493. E-Sun Commercial Bank Ltd
494. First Commercial Bank
495. HUA NAN Commercial Bank
496. Mega International Commercial Bank
497. Shanghi Commercial & Savings Bank Ltd
498. Thaiwan Shin Kong Commercial Bank
Ltd (Former Shin Kong Bank)
499. Taipei Fubon Commercial Bank
500. Taiwan Cooperative Bank
501. Union Bank of Taiwan
Thailand
502. Bangkok Bank Public Company Ltd
503. Bank of Ayudhya Public Company Ltd
504. Export Import Bank of Thailand
505. Kasikornabank Public Company Ltd
(Formerly Thai Farmers Bank)
506. Krung Thai Bank Public Company
Limited
507. Thanachart Bank Public Limited
(Former Siam City Bank Public
Company Ltd)
508. Siam Commercial Bank PCL
509. Standard Chartered Bank (Thai) Public
Company Ltd
510. United Overseas Bank (Thai) Public Co Ltd
Tunisia
511. Banque Nationale Agricole
512. Attijari Bank
513. Societe Tunisienne De Banque
Turkey
514. AK Bank TAS
515. Anadolu Bank
516. Arab Turkish Bank
517. Burgan Bank (Former Euro Tekfen AS)
518. ING Bank AS
519. Kuvoyt Turk Kurk Katilim Bankasi AS
520. Tekstil Bankasi AS
521. Turk Economi Bankasi
522. Turkiye Finance Katilinu Bankasi AS
523. Turkiye Halk Bankasi AS
524. Turkiye is Bankasi AS
525. Turkiye Vakiflar Bankasi TAO
526. Turkland Bank - T Bank
527. Yapi VE Kredi Bankasi AS
UAE
528. Abu Dhabi Commercial Bank
529. Abu Dhabi Islamic Bank
530. Arab Bank for Investment & Foreign
rade
531. Commercial Bank International PLC
532. Commercial Bank of Dubai PSC
533. Dubai Islamic Bank PLC
534. Emirates NBD PJSC
535. First Abu Dhabi Bank
536. Mashreqbank PSC
537. Emirates Islamic Bank PJSC (Former
Middle East Bank)
538. First Abu Dhabi Bank PJSC (Former
National Bank of Abu Dhabi)
539. National Bank of Fujirah
540. Noor Bank
541. United Arab Bank
Uganda
542. Barclays Bank of Uganda Ltd
UK
543. AIB Group (Formerly Allied Irish Bank)
544. Barclays Bank PLC
545. Gulf International Bank (UK) Limited
546. HBL Lanka UK Ltd (Former Habibsons
Bank Ltd)
547. HSBC Bank PLC
548. Lloyds TSB Bank PLC
549. National Westminster Bank PLC (Metro)
550. Standard Chartered Bank
Ukraine
551. Ukreximbank (State Export- Import
Bank of Ukrain)
552. First Ukrainian International Bank -
PJSC
553. OTP Bank - Public Joint Stock
Company
554. PJSC ‘Alfa - Bank’ 713 Prominvest
Bank
555. Industrial Invest Bank (Former
Prominvest Bank)
Uruguay
556. The Banco De La Republic Oriental Del
Uruguay
USA
557. Bank of America NA
558. Bank of New York Mellon (The Bank of
NewYork) (Merged with Mellon Bank
21.07.08)
559. Branch Banking & Trust Co
560. CITIBANK NA
561. Cobank ACB
562. Commerce Bank NA
563. Deutsche Bank Trust Company
Americas
564. First Hawiian Bank
565. French American Banking CORP
566. Habib American Bank
567. HSBC Bank USA
568. Huntington National Bank
569. Israel Discount Bank of New York
570. JP Morgan Chase Bank (Metro)
571. PNC Bank NA
572. Silicon Valley Bank
573. Santander Bank National Association
(Former Sovereign Bank)
574. Standard Chartered Bank
575. Sun Trust Bank Ltd
576. UMB Bank NA
577. MUFG Union Bank National Association
(Former Union Bank of California Na)
578. US Bank NA
579. Wells Fargo Bank NA (Wachovia Bank
NA merged with Wells Fargo)
Vietnam
580. Bank for Foreign Trade of Vietnam
581. Commercial Bank for Bank for
Investment & Development of Vietnam

BA
NK
OF
CE
YL
ON
AN
NU
AL
RE
PO
RT
20
19
416
About this Report / Performance Highlights 2019 / Chairman’s Message / General Manager’s Review / Organisational Overview / Strategic Report / Performance and Outlook / Stakeholder Value Creation / Financial Reports / Compliance Annexes / Supplementary Information
Exchange Companies By Country
Australia
1 Cash Plus Forex Pty Ltd
2 Kapruka (Pty) Ltd
3 Serendib Financial Pty Ltd
4 PFG Forex
Bahrian
5 Bahrain Financing Company
6 Ezremit Ltd (BFC Bank)
7 National Finance & Exchange Co WLL
8 Zenj Exchange
9 Zenj Exchange Company WLL
(Turbo Cash)
Cyprus
10 GS Cash Line
France
11 Tempo - France
Greece
12 International Express Remittance
International Money Transfer
Mediation Co.
Israel
13 Tifco Logistics & Trade Ltd
14 Global Remit Currency Services
Italy
15 National Exchange Company SRL
16 Valutrans Spa (METRO)
Japan
17 Japan Remit Finance Co. Ltd
18 Unidos Co. Ltd (Kyodai Remittance)
Jordan
19 Alawaneh Exchange Co
20 Shift Financial Services Ltd
Kuwait
21 Aman Exchange Co. WLL
22 Al Mulla International Exchange Co
WLL
23 Al Muzaini Exchange Co Ksc
(Closed)
24 Bahrain Exchange Co WLL
25 Citiy International Exchange Co
WLL
26 Dollarco Exchange Co Ltd
27 Etemadco Exchange Co WLL
28 Joyalukkas Exchange Co. WLL
29 Kuwait Asian International
Exchange Co WLL
30 Kuwait Bahrain International Ex.
31 Kuwait India International Ex.co
32 National Exchange Co WLL
33 National Money Exchange Co WLL
34 Oman Exchange Co Ltd
35 Al Nada International Exchange
(Former Security Exchange Co
WLL)
36 Uae Exchange Centre WLL
Lebanon
37 Services Exchange Co (Imad Al
Hariri Trading Co & Partners -
Seco)
38 Srour Exchange
Malaysia
39 Merchantrade Asia Sdn Bhd
Oman
40 Lulu Exchange Co. LLC (Asia
Express Exchange)
41 Gulf Overseas Exchange Co. LLC
42 Hamdan Exchange
43 Joyalukkas Exchange (Majan
Exchange LLC)
44 Modern Exchange Co. LLC
45 Musandam Exchange
46 Mustafa Sultan Exchange Co. LLC
47 Unimoni Exchange LLC (Oman &
Uae Exchange Centre Co. LLC)
48 Oman International Exchange LLC
49 Oman United Exchange Co. LLC
50 Purshottam Kanji Exchange Co.
LLC
Qatar
51 AL Dar For Exchange Works
52 AL Fardan Exchange Co. WLL
53 AL Mana Exchange WLL
54 AL Sadd Exchange
55 AL Zaman Exchange WLL
56 AL-Mirqab Exchange Co.
57 Arabian Exchange Company WLL
58 City Exchange Co.WLL
59 Eastern Exchange Est
60 Gulf Exchange Company
61 Habib Qatar International Exch.ltd
62 Islamic Exchange
63 National Exchange Co WLL
(Formerly Al Shaibei Exchange Co)
Singapore
64 Hbz International Exchange Co
(Metro) (Singapore) Pvt Ltd
65 Mustafa Foreign Exchange (Metro)
Switzerland
66 Motherhouse Gmbh (Metro)
UAE
67 AL Ahalia Money Exchange Bureau-
Abu Dhabi
68 AL Ansari Exchange Est- Abu Dhabi
69 AL Fardan Exchange- Abu Dhabi
70 Al Mona Exchange Co LLC- Dubai
71 AL Rostamani International
Exchange (Formerly Thomas Cook
Al Rostamani Exch. Co.)-Dubai
72 Delma Exchange - Abu Dhabi
73 Emirates India International
Exchange Company - Dubai

About this Report / Performance Highlights 2019 / Chairman’s Message / General Manager’s Review / Organisational Overview / Strategic Report / Performance and Outlook / Stakeholder Value Creation / Financial Reports / Compliance Annexes / Supplementary Information
417
74 Index Exchange Co LLC - Abu Dhabi
75 Joyalukkas Exchange - Dubai
76 Lari Exchange Establishment - Abu
Dhabi
77 Lulu International Exchange LLC -
Abu Dhabi
78 National Exchange Co - Abu Dhabi
79 Orient Exchange Co. LLC - Dubai
80 Redha AL-Ansari Exchange Est -
Dubai
81 UAE Exchange Centre - Abu Dhabi
82 Wall Street Exchange Centre -
Dubai
83 Xpress Money Services Limited -
Abu Dhabi
UK
84 An Express Ltd
85 Global Exchange Ltd)
86 INTL FC Stone Ltd (IFL)
87 NEC Money Transfer Limited
88 SGC Corporation (Former Sigue
Global Services Ltd) (Metro) (Former
Coinstar)
89 Worldremit(Metro)
USA
90 Moneygram
91 Prabhu Group INC
92 RIA Financial Services (Continental
Exchange Solutions Inc)
93 Trans-Fast Remittance LLC
94 Western Union

BA
NK
OF
CE
YL
ON
AN
NU
AL
RE
PO
RT
20
19
418
About this Report / Performance Highlights 2019 / Chairman’s Message / General Manager’s Review / Organisational Overview / Strategic Report / Performance and Outlook / Stakeholder Value Creation / Financial Reports / Compliance Annexes / Supplementary Information
Glossary of Financial/ Banking TermsAAcceptancesPromise to pay created when the drawee of a time draft stamps or writes the word “accepted” above his signature and a designated payment date.
Accounting PoliciesThe specific principles, bases, conventions, rules and practices adopted by an entity in preparing and presenting Financial Statements.
Accrual BasisTo recognise the effects of transactions and other events as they occur, without waiting for the receipt or payment of related cash or its equivalent.
Actuarial AssumptionsAn entity’s unbiased and mutually compatible best estimates of the demographic and financial variables that will determine the ultimate cost of providing post-employment benefits.
Actuarial Gains and LossesActuarial gains and losses comprise the effects of differences between the previous actuarial assumptions and what has actually occurred and the effects of changes in actuarial assumptions.
Actuarial Present Value of Promised Retirement BenefitsThe present value of the expected payments by a retirement benefit plan to existing and past employees, attributable to the service already rendered.
Actuarial ValuationFund value determined by computing its normal cost, actuarial accrued liability, actuarial value of its assets, and other relevant costs and values.
AmortisationThe systematic allocation of the depreciable amount of an asset over its useful life. In the case of an intangible asset or goodwill, the term “amortisation” is generally used
instead of “depreciation”. Both terms have the same meaning.
Amortised CostThe amount at which a financial asset or liability is measured at initial recognition, minus any repayment of principal, minus any reduction for impairment or uncollectibility, and plus or minus the cumulative amortisation using the effective interest method of the difference between that initial amount and maturity amount.
Anti-Money Laundering (AML)A set of procedures, laws or regulations designed to prevent money laundering. Money laundering is an activity which aims to disguise the ownership of money that has an illegal origin such as trading of drugs, organised crimes, fraud and terrorism.
Associate CompanyA company other than a subsidiary in which a holding company has a participating interest and exercises a significant influence over its operating and financial policies.
Attrition RateA measure of how many employees leave over a certain period of time.
Average Weighted Deposit Rate (AWDR) AWDR is calculated by the Central Bank of Sri Lanka monthly on the weighted average of all outstanding interest bearing deposits of commercial banks and the corresponding interest rates.
Average Weighted Prime Lending Rate (AWPLR)AWPLR is calculated by the Central Bank of Sri Lanka weekly based on commercial banks lending rates offered to their prime customers during the week.
BBASEL IIIThe Basel Committee on Banking Supervision (BCBS) issued the BASEL III rules text, which presents the details of strengthened global regulatory standards on bank capital adequacy and liquidity.
Basis PointsA unit that is equal to 1/100th of 1%. Often used in quotation of spreads between interest rates or to change in yield in securities.
Bills of ExchangeA signed, written unconditional order addressed by one person (the drawer) directing another person (the drawee) to pay a specified sum of money to the order of a third person (the payee). The terms bills of exchange and drafts are often used interchangeably.
CCapital Adequacy Ratio (CAR)The ratio between capital and risk-weighted assets, as defined under the framework of risk-based capital standards developed by the Bank for International Settlements (BIS) and as modified to suit local requirements by Central Bank of Sri Lanka.
Cash EquivalentsInvestments / assets that are readily convertible to cash, subject only to an insignificant risk of change in their value.
Collectively-Assessed Loan Impairment ProvisionsImpairment assessment which carried out on a collective basis for homogeneous groups of loans that are not considered individually significant, in order to cover losses that has been incurred but has not yet been identified at the Reporting date.

About this Report / Performance Highlights 2019 / Chairman’s Message / General Manager’s Review / Organisational Overview / Strategic Report / Performance and Outlook / Stakeholder Value Creation / Financial Reports / Compliance Annexes / Supplementary Information
419
Compound Annual Growth Rate (CAGR) The year over year growth rate over a specified period of time.
Common Equity Tier 1 (CET 1)Common Equity Tier 1 (CET 1) is a component of Tier 1 capital that consists mostly of Stated Capital. It is a capital measure that was introduced as a precautionary measure to protect the economy from a financial crisis.
Contractual MaturityContractual maturity refers to the final payment date of a loan or other financial instrument,at which point all the remaining outstanding principal will be repaid and interest is due to be paid.
Corporate GovernanceThe process by which corporations are directed and controlled. It is concerned with the rights and responsibilities among stakeholders used to determine and control the strategic directions and performance of the corporation.
Correspondent Banks A bank in a foreign country that offers banking facilities to the customers of a bank in another country.
Cost/ Income RatioOperating expenses excluding impairment charge for loans and other losses, as a percentage of total operating income.
Country RiskThe credit risk associated with lending to borrowers within a particular country, sometimes taken to include sovereign risk.
Credit RiskThe risk of loss due to non-payment of a loan or other line of credit (either the principal or interest or both), by the borrower or a counterparty.
Credit RatingsAn evaluation of a corporate’s ability to repay its obligations or the likelihood of not defaulting carried out by an independent rating agency.
DDealing SecuritiesSecurities acquired and held with the intention of reselling them in the short term.
Debt Equity RatioLong-term borrowings divided by shareholder’s equity.
Deferred TaxationSum set aside for tax in the Financial Statements that will become payable/receivable in a financial year other than the current financial year. It arises because of temporary differences between tax rules and accounting conventions.
Defined Benefit PlansRetirement benefit plans under which amounts to be paid as retirement benefits are determined by reference to a formula usually based on employees’ earning history, tenure of service and age.
DerivativesA financial instrument, the price of which has a strong relationship with an underlying commodity, currency variable or financial instrument.
Documentary Letters of Credit (LC)Written undertakings by a bank on behalf of its customers (typically an importer), authorising a third party (e.g. an exporter) to draw drafts on the Bank up to a stipulated amount under specific terms and conditions. Such undertakings are established for the purpose of facilitating international trade.
Domestic Systemically Important Banks (D-SIBs)Systemically Important Banks (SIBs) are perceived as banks that are “Too Big To Fail”.
D-SIBs are critical for the uninterrupted availability of essential banking services to the country’s real economy even during crisis. The CBSL has designated Licenced Commercial Banks with total assets equal to or greater than LKR 500 billion as D-SIBs.
EEquity MethodA method of accounting whereby the investment is initially recorded at cost and adjusted thereafter for the post-acquisition change in the investor’s share of net assets of the invested. The Statement of profit or loss reflects the investor’s share of the results of operations of the invested.
Events After the Reporting DateEvents after the Reporting date are those events, both favourable and unfavourable, that occur between the Reporting date and the date when the financial statements are authorised for issue.
Exchange Company / HouseAn overseas location where the Bank’s representatives provide banking services as a promotional tool.
FFair ValueThe price that would be required to sell an asset or paid to transfer a liability in an orderly transaction between market participants at the measurement date.
Finance LeaseLeases which transfer risks and rewards of ownership. Title may or may not eventually be transferred.

BA
NK
OF
CE
YL
ON
AN
NU
AL
RE
PO
RT
20
19
420
About this Report / Performance Highlights 2019 / Chairman’s Message / General Manager’s Review / Organisational Overview / Strategic Report / Performance and Outlook / Stakeholder Value Creation / Financial Reports / Compliance Annexes / Supplementary Information
Financing ActivitiesActivities that result in changes in the size and composition of the equity capital and borrowings of the entity.
Financial InstrumentsFinancial instrument is any contract that gives rise to financial asset of one entity and a financial liability or equity instrument of another entity.
Financial Assets Measured at Amortised CostA financial asset is measured at amortised cost if the asset is held within a business model whose objective is to hold assets to collect contractual cash flows and the contractual terms of the financial asset give rise on specified dates to cash flows that are solely payments of principal and interest on the principal amount outstanding.
Financial Assets Measured at Fair Value through Other Comprehensive Income (FVOCI)FVOCI include debt and equity instruments measured at fair value through other comprehensive income. A debt instrument is measured at FVOCI, if it is held within a business model whose objective is achieved by both collecting contractual cash flows and selling financial assets and the contractual terms of the financial asset give rise on specified dates to cash flows that are solely payments of principal and interest on the principal amount outstanding.
Equity investments may be irrevocably classified as FVOCI when they meet the definition of Equity under LKAS 32 Financial Instruments: Presentation, and are not held for trading.
Financial Assets Measured at Fair Value through Profit or Loss (FVTPL)All financial assets other than those classified at Amortised Cost or FVOCI are classified as measured at FVTPL. These are held for trading or managed and their
performance is evaluated on a fair value basis as they are neither held to collect contractual cash flows nor held both to collect contractual cash flows and to sell financial assets.
Foreclosed PropertiesProperties acquired in full or partial settlement of debts, which will be held with the intention of resale at the earliest opportunity.
Foreign Exchange IncomeThe gain recorded when assets or liabilities denominated in foreign currencies are translated into Sri Lankan Rupees on the Reporting date at prevailing rates which differ from those rates in force at inception or on the previous Reporting date. Foreign exchange income also arises from trading in foreign currencies.
Forward Exchange ContractsAgreements between two parties to exchange one currency for another at a future date at a rate agreed upon today.
GGlobal Reporting Initiatives (GRI)GRI is a leading organisation in the sustainability field. GRI promotes the use of sustainability reporting as a way for organisations to become more sustainable and contribute to sustainable development.
Gross Domestic Product (GDP)The value of all goods and services produced domestically in an economy during a specified period, usually a year. Nominal GDP, adjusted for inflation, gives GDP in real terms.
GuaranteesPrimarily represent irrevocable assurances that a bank will make payments in the event that its customer is unable to perform its financial obligations to third parties. Certain other guarantees represent non-financial undertakings such as bid and performance bonds.
HHistorical Cost ConventionRecording transactions at the actual value received or paid.
IImpairmentThis occurs when recoverable amount of an asset is less than its carrying amount.
Individually Significant Loan Impairment ProvisionsImpairment measured individually for loans that are individually significant to the Group.
Intangible AssetAn identifiable non-monetary asset without physical substance held for use in the production or supply of goods or services, for rental to others, or for administrative purposes.
Interest MarginNet interest income as a percentage of average interest earning assets.
Interest SpreadRepresents the difference between the average interest rate earned on interest earning assets and the average interest rate incurred on interest bearing liabilities.
Investment SecuritiesSecurities acquired and held for yield or capital growth purposes and usually held to maturity.
KKey Management Personnel (KMP)Those persons having authority and responsibility for planning, directing and controlling the activities of the entity, directly or indirectly.
Key Performance Indicators (KPI)KPIs are quantifiable measures that a company users to gauge its performance over time.
Glossary of Financial/ Banking Terms

About this Report / Performance Highlights 2019 / Chairman’s Message / General Manager’s Review / Organisational Overview / Strategic Report / Performance and Outlook / Stakeholder Value Creation / Financial Reports / Compliance Annexes / Supplementary Information
421
LLiquid AssetsAssets that are held in cash or in a form that can be converted to cash readily, such as deposits with other banks, bills of exchange, treasury bills.
Liquid Assets RatioLiquid assets expressed as a percentage of total liabilities other than shareholders’ funds.
Liquidity Coverage Ratio – LCRRefers to highly liquid assets held by Banks to meet short-term obligations. The ratio represents a generic stress scenario that aims to anticipate market-wide shocks.
Loss Given Default (LGD)LGD is the percentage of an exposure that a lender expects to lose in the event of default.
MMark to MarketThe practice of periodically revaluing marketable securities to their current market value.
MaterialityThe relative significance of a transaction or an event the omission or misstatement of which could influence the economic decisions of users of financial statements.
Minority InterestThat portion of the profit or loss and net assets of a subsidiary attributable to equity interests that are not owned, directly or indirectly through Subsidiaries, by the Parent.
Mortality RateA measure of the number of deaths in some population, scaled to the size of that population, per unit time.
NNet Asset Value Per ShareShareholders’ equity divided by the number of ordinary shares in issue.
Net Interest IncomeThe difference between what the Bank earns as interest on assets such as loans and securities and what it pays as interest on liabilities such as deposits, refinance funds and interbank borrowings.
Net Realisable ValueThe estimated selling price in the ordinary course of business, less the estimated costs of completion and the estimated costs necessary to make the sale.
Net Stable Funding Ratio (NSFR)NSFR measures the amount of long-term, stable sources of funding employed by a bank relative to the liquidity profiles of the assets funded and the potential for contingent calls on funding liquidity arising from off-balance sheet commitments and obligations.
Nostro AccountA nostro account is a bank account held in a foreign country by a domestic bank, denominated in the currency of that country.
OOff-Balance Sheet TransactionsTransactions not recognised as assets or liabilities in the Statement of Financial Position but which give rise to contingencies and commitments.
Operating ActivitiesThe principal revenue producing activities of an entity and other activities that are not investing or financing activities.
PPlan Assets of an Employee Benefit PlanAssets held by a long-term employee benefit fund.
Price Value Per Basic Point (PVBP)Estimated change in the value of portfolio due to one basic point change in interest rate.
Primary Dealer Special Risk ReserveReserve maintained in order to strengthen capital base further with development of capital market.
Probability of Default (PD)PD is a financial term describing the likelihood of a default over a particular time horizon. It provides an estimate of the likelihood that a borrower will be unable to meet its debt obligations.
Projected Unit Credit MethodAn actuarial valuation method that sees each period of service as giving rise to an additional unit of benefit entitlement and measures each unit separately to build up the final obligation.
Property, Plant and Equipment (PPE)Tangible assets that:
(a) are held for use in the production or supply of goods or services, for rental to others, or for administrative purposes; and
(b) are expected to be used during more than one period.
PrudenceInclusion of a degree of caution in the exercise of judgement needed in making the estimates required under conditions of uncertainty such that assets or income are not overstated and liabilities or expenses are not understated.

BA
NK
OF
CE
YL
ON
AN
NU
AL
RE
PO
RT
20
19
422
About this Report / Performance Highlights 2019 / Chairman’s Message / General Manager’s Review / Organisational Overview / Strategic Report / Performance and Outlook / Stakeholder Value Creation / Financial Reports / Compliance Annexes / Supplementary Information
RRedemptionRepayment of principal monies.
Related PartiesTwo parties where one controls the other or exercise significant influence in financial and operating decisions, directly or indirectly.
Repurchase AgreementContracts relating to securities sold to creditors (who lend money for funding purposes), with the intention of buying them back at a set price on a specified future date.
Return On Average Assets (ROAA)Profit before tax expressed as a percentage of average total assets. Used along with ROAE, as a measure of profitability and as a basis of intra industry performance comparison.
Return On Average Equity (ROAE)Profit after tax less preferred share dividends, if any, expressed as a percentage of average ordinary shareholders’ equity.
Revenue ReservesReserves set aside for future distribution and investment.
Right of Use Assets An asset which bears the lessee’s right to
use that throughout the lease term.
Risk-Weighted AssetsOn-balance sheet assets and the credit equivalent of off-balance sheet assets multiplied by the relevant risk weighting factors.
SSecurities Purchased Under Resale Agreement The purchase of securities under an agreement to resell at a given price on a specific future date.
Shareholders’ EquityShareholders’ equity consists of issued and fully paid ordinary share capital plus capital and revenue reserves.
Significant InfluenceSignificant influence is the power to participate in the financial and operating policy decisions of an investee but is not controlled or jointly controlled over those policies.
SolvencyThe availability of cash over the long term to meet financial commitments as they fall due.
Subordinated DebentureThe claims of the debenture holders shall in the event of winding up, rank after all the claims of the secured and unsecured creditors and any preferential claims under any statutes, but in priority to and over claims and rights of the shareholders.
SwapsThe simultaneous purchase and sale of foreign exchange or securities, with the purchase executed at once and the sale back to the same party. Carried out on an agreed upon price to be completed at a specified future date. Swaps include interest rate swaps, currency swaps and credit swaps.
Syndicated LoanA large loan by a group of banks to a large multinational firm or government. Syndicated loans allow the participating banks to maintain diversification by not lending too much to a single borrower.
TTier 1 CapitalConsists of the sum total of paid up ordinary shares, non-cumulative, non-redeemable preference shares, share premium, statutory reserve fund, published retained profits, general and other reserves, less intangible assets and other deductions.
Tier 2 CapitalConsists of the sum total of revaluation reserves, general provisions, hybrid capital instruments and approved subordinated debentures.
Total CapitalThe sum of Tier 1 and Tier 2 capital.
UUnit TrustAn undertaking formed to invest in securities under the terms of a trust deed.
UnsecuredRepayment of the principal and interest not being secured by any specific asset.
VValue at Risk (VaR)Estimated maximum loss that the Bank may incur in a given horizon at 99% confidence level.
Vostro AccountA local currency current account maintained with a bank by another bank.
Glossary of Financial/ Banking Terms

About this Report / Performance Highlights 2019 / Chairman’s Message / General Manager’s Review / Organisational Overview / Strategic Report / Performance and Outlook / Stakeholder Value Creation / Financial Reports / Compliance Annexes / Supplementary Information
423
Corporate Offices and Overseas BranchesCorporate Offices
BoC Card Centre
Issuing and managing VISA and Master
branded Credit Cards. Franchising and
servicing merchants using point of
sales machines
Level - 1, West Tower,
World Trade Centre, Echelon Square,
Colombo 1, Sri Lanka.
Tel : +94 11 2325088, 2325095,
2541935, 2205620
2205621, 2205650
Fax : +94 11 2325092, 2395807
Email : [email protected], [email protected]
Branch Code : 731
BoC Premier Centre
Dedicated Centre for Private Banking
No. 21, Sir Ernest De Silva Mawatha,
Colombo 7, Sri Lanka.
Tel : +94 11 2694282 - 86
Fax : +94 11 2694280
Email : [email protected]
Branch Code : 788
Correspondent Banking Unit
Gateway to global banking and financial
relationships
9th Floor,
Bank of Ceylon Head Office,
“BOC Square”,
No. 1, Bank of Ceylon Mawatha,
Colombo 1, Sri Lanka.
Tel : +94 11 2445791
Fax : +94 11 2445791
Email : [email protected]/ [email protected]/
Branch Code : 087
Credit Support Department
Issuing of local and International
Guarantees and documentation of credit
facilities
3rd Floor,
Bank of Ceylon Head Office,
“BOC Square”,
No. 1, Bank of Ceylon Mawatha,
Colombo 1, Sri Lanka.
Tel : +94 11 2541943
Fax : +94 11 2446820
Email : [email protected]
Branch Code : 660
Dealing Room
Providing money market and foreign
exchange related services
7th Floor,
Bank of Ceylon Head Office,
“BOC Square”,
No. 1, Bank of Ceylon Mawatha,
Colombo 1, Sri Lanka.
Tel : +94 11 2445785-7, 2395814
Fax : +94 11 2445788
Email : [email protected]
Branch Code : 760
Electronic Banking Unit
Management of ATM Card operations,
facilitator for Internet and Mobile banking
21st Floor,
Bank of Ceylon Head Office,
“BOC Square”,
No. 1, Bank of Ceylon Mawatha,
Colombo 1, Sri Lanka.
Tel : +94 11 2204650, 2204674
Fax : +94 11 2447569
Email : [email protected], [email protected]
Branch Code : 777
Ceybank Gold Shop
Supplier of precious gold to the nation
Ground Floor,
Bank of Ceylon Head Office,
“BOC Square”,
No. 1, Bank of Ceylon Mawatha,
Colombo 1, Sri Lanka.
Tel : +94 11 2345420
Fax : +94 11 2345420
Email : [email protected]
Branch Code : 087
Inward Remittances Department
Facilitator in processing inward
remittances to Sri Lanka
8th Floor,
Bank of Ceylon Head Office,
“BOC Square”,
No. 1, Bank of Ceylon Mawatha,
Colombo 1, Sri Lanka.
Tel : +94 11 243956, 2541933
Fax : +94 11 2344845
Email : [email protected]
Branch Code : 087
Islamic Banking Unit
Brand house for all Islamic Banking
products and services
25th Floor,
Bank of Ceylon Head Office,
“BOC Square”,
No. 1, Bank of Ceylon Mawatha,
Colombo 1, Sri Lanka.
Tel : +94 11 2205030, 2445811
Fax : +94 11 2205036
Email : [email protected]
Branch Code : 776
Primary Dealer Unit
Buying and selling of Government
Securities
7th Floor,
Bank of Ceylon Head Office,
“BOC Square”,
No. 1, Bank of Ceylon Mawatha,
Colombo 1, Sri Lanka.
Tel : +94 11 2448830, 2203607
Fax : +94 11 2448207
Email : [email protected]
Branch Code : 760

BA
NK
OF
CE
YL
ON
AN
NU
AL
RE
PO
RT
20
19
424
About this Report / Performance Highlights 2019 / Chairman’s Message / General Manager’s Review / Organisational Overview / Strategic Report / Performance and Outlook / Stakeholder Value Creation / Financial Reports / Compliance Annexes / Supplementary Information
Trade Promotion Department
Service provider for migrant employee
community
7th Floor,
Bank of Ceylon Head Office,
“BOC Square”,
No. 1, Bank of Ceylon Mawatha,
Colombo 1, Sri Lanka.
Tel : +94 11 2447831, 2203626
Fax : +94 11 2346841
Email : [email protected]
Branch Code : 087
Trade Services Department
Providing trade finance facilities and
services
2nd Floor,
Bank of Ceylon Head Office,
“BOC Square”,
No. 1, Bank of Ceylon Mawatha,
Colombo 1, Sri Lanka.
Tel : +94 11 2394310, 2203310
Fax : +94 11 2542170
Email : [email protected]
Branch Code : 660
Overseas Branches
Malé Branch
“Aage” No. 12, Boduthakurufaanu Magu,
Henveiru, Male. 20094,
Republic of Maldives.
Tel : +960 3323045, 3020500
Email : [email protected]
SWIFT code : BCEYMVMV
Branch code : 632
Hulhumale Branch
Teak Unit 1,
Amin Avenue, Hulhumale,
Repuplic of Maldives
Tel : +960 3350921, 3350923
Fax : +960 3350924
Chennai Branch
No. 20/21, Casa Major Road,
New No. 2 (Old No. 11), Zerat Garden,
2nd Lane, Egmore, Chennai 600 008,
India.
Tel : +91 44 2819 0972/73/75
3951 9913
Email : [email protected]
SWIFT code : BCEYIN5M
Branch code : 758
Seychelles Branch
Oliaji Trade Center, Fransis Rachel Street,
P.O. Box 1599, Victoria, Mahe,
Republic of Seychelles.
Tel : +248 461 1880, 461 1889
Email : [email protected]
SWIFT code : BCEYSCSC
Branch code : 807
Corporate Offices and Overseas Branches
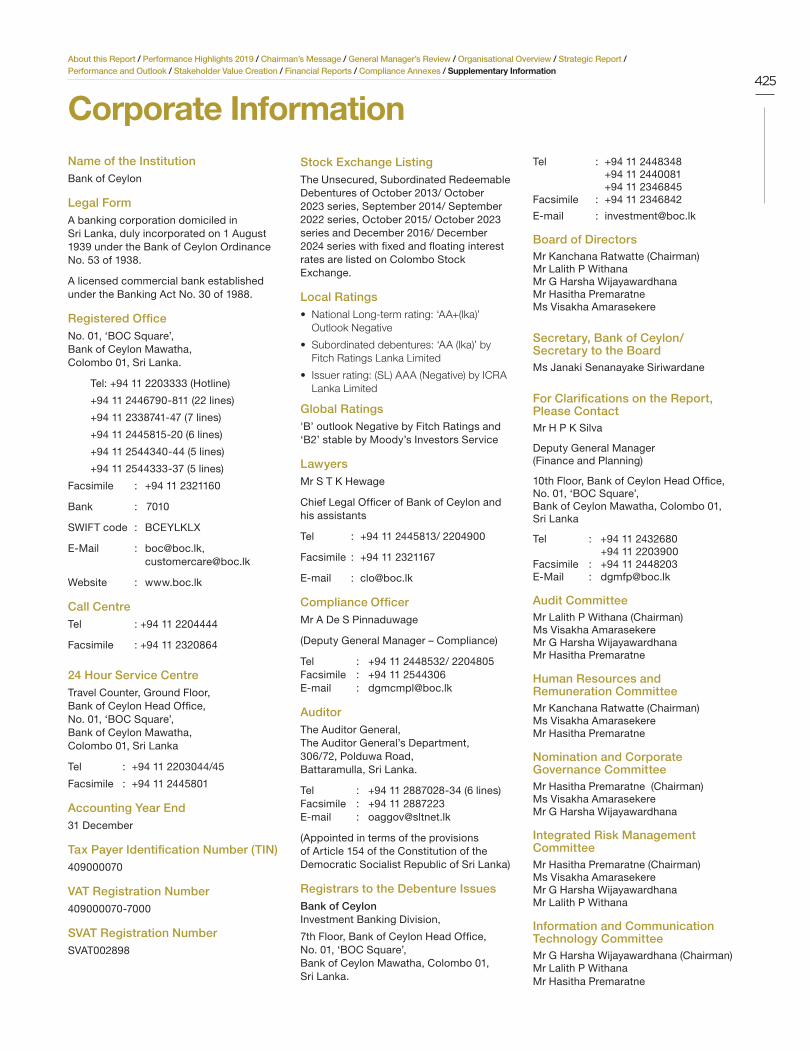
About this Report / Performance Highlights 2019 / Chairman’s Message / General Manager’s Review / Organisational Overview / Strategic Report / Performance and Outlook / Stakeholder Value Creation / Financial Reports / Compliance Annexes / Supplementary Information
425
Corporate InformationName of the InstitutionBank of Ceylon
Legal FormA banking corporation domiciled in Sri Lanka, duly incorporated on 1 August 1939 under the Bank of Ceylon Ordinance No. 53 of 1938.
A licensed commercial bank established under the Banking Act No. 30 of 1988.
Registered OfficeNo. 01, ‘BOC Square’, Bank of Ceylon Mawatha, Colombo 01, Sri Lanka.
Tel: +94 11 2203333 (Hotline)
+94 11 2446790-811 (22 lines)
+94 11 2338741-47 (7 lines)
+94 11 2445815-20 (6 lines)
+94 11 2544340-44 (5 lines)
+94 11 2544333-37 (5 lines)
Facsimile : +94 11 2321160
Bank : 7010
SWIFT code : BCEYLKLX
E-Mail : [email protected], [email protected]
Website : www.boc.lk
Call CentreTel : +94 11 2204444
Facsimile : +94 11 2320864
24 Hour Service CentreTravel Counter, Ground Floor,Bank of Ceylon Head Office,No. 01, ‘BOC Square’, Bank of Ceylon Mawatha, Colombo 01, Sri Lanka
Tel : +94 11 2203044/45
Facsimile : +94 11 2445801
Accounting Year End31 December
Tax Payer Identification Number (TIN)409000070
VAT Registration Number409000070-7000
SVAT Registration NumberSVAT002898
Stock Exchange ListingThe Unsecured, Subordinated Redeemable Debentures of October 2013/ October 2023 series, September 2014/ September 2022 series, October 2015/ October 2023 series and December 2016/ December 2024 series with fixed and floating interest rates are listed on Colombo Stock Exchange.
Local Ratings• National Long-term rating: ‘AA+(lka)’
Outlook Negative
• Subordinated debentures: ‘AA (lka)’ by Fitch Ratings Lanka Limited
• Issuer rating: (SL) AAA (Negative) by ICRA Lanka Limited
Global Ratings'B’ outlook Negative by Fitch Ratings and ‘B2’ stable by Moody’s Investors Service
LawyersMr S T K Hewage
Chief Legal Officer of Bank of Ceylon and his assistants
Tel : +94 11 2445813/ 2204900
Facsimile : +94 11 2321167
E-mail : [email protected]
Compliance OfficerMr A De S Pinnaduwage
(Deputy General Manager – Compliance)
Tel : +94 11 2448532/ 2204805Facsimile : +94 11 2544306E-mail : [email protected]
AuditorThe Auditor General,The Auditor General’s Department, 306/72, Polduwa Road,Battaramulla, Sri Lanka.
Tel : +94 11 2887028-34 (6 lines)Facsimile : +94 11 2887223E-mail : [email protected]
(Appointed in terms of the provisions of Article 154 of the Constitution of the Democratic Socialist Republic of Sri Lanka)
Registrars to the Debenture IssuesBank of CeylonInvestment Banking Division,
7th Floor, Bank of Ceylon Head Office,No. 01, ‘BOC Square’, Bank of Ceylon Mawatha, Colombo 01, Sri Lanka.
Tel : +94 11 2448348 +94 11 2440081 +94 11 2346845Facsimile : +94 11 2346842
E-mail : [email protected]
Board of DirectorsMr Kanchana Ratwatte (Chairman) Mr Lalith P WithanaMr G Harsha WijayawardhanaMr Hasitha PremaratneMs Visakha Amarasekere
Secretary, Bank of Ceylon/ Secretary to the BoardMs Janaki Senanayake Siriwardane
For Clarifications on the Report, Please ContactMr H P K Silva
Deputy General Manager (Finance and Planning)
10th Floor, Bank of Ceylon Head Office, No. 01, ‘BOC Square’, Bank of Ceylon Mawatha, Colombo 01, Sri Lanka
Tel : +94 11 2432680 +94 11 2203900Facsimile : +94 11 2448203 E-Mail : [email protected]
Audit CommitteeMr Lalith P Withana (Chairman)Ms Visakha AmarasekereMr G Harsha WijayawardhanaMr Hasitha Premaratne
Human Resources and Remuneration CommitteeMr Kanchana Ratwatte (Chairman) Ms Visakha AmarasekereMr Hasitha Premaratne
Nomination and Corporate Governance CommitteeMr Hasitha Premaratne (Chairman)Ms Visakha AmarasekereMr G Harsha Wijayawardhana
Integrated Risk Management CommitteeMr Hasitha Premaratne (Chairman) Ms Visakha AmarasekereMr G Harsha WijayawardhanaMr Lalith P Withana
Information and Communication Technology CommitteeMr G Harsha Wijayawardhana (Chairman)Mr Lalith P WithanaMr Hasitha Premaratne

Notes


Bank of Ceylon,No. 01, “BOC Square”,Bank of Ceylon Mawatha,Colombo 01Sri Lanka
BANK OF CEYLONANNUAL REPORT 2019
ALeagueourown
of
AN
NU
AL R
EP
OR
T 2019